Alibaba Group Announces March Quarter and Full Fiscal Year ...
Upload
khangminh22Category
view
1download
0
For more information, please contact: Dave Erskine, Corporate PR 905-882-2600 ext. 8477 or [email protected]
ATI Reports Results for Second Quarter of Fiscal 2006
Record revenues of $672 million
MARKHAM, ON – March 30, 2006 – ATI Technologies Inc. (TSX: ATY, NASDAQ: ATYT) today announced financial results for the second quarter of fiscal 2006 ended February 28, 2006. Revenues1 for the second quarter were $672 million, a new company record and a 14% increase relative to the first quarter of fiscal 2006. Gross margin percentage was 28.2%. Net income according to GAAP for the quarter was $34.1 million ($0.13 per diluted share). Non-GAAP adjusted net income2 for the quarter was $44.8 million ($0.17 per diluted share). “In the second quarter, ATI delivered compelling products that continue to redefine the leading edge of our markets,” said David Orton, President and CEO, ATI Technologies Inc. “Our Crossfire chipsets, Radeon graphic processors (GPUs), Imageon handheld media processors and state-of-the-art XilleonTM high-definition television chips all delivered top-to-bottom solutions for ATI's customers. With strong customer momentum and product leadership, we are well positioned for continued growth in the PC and digital consumer markets.” Recent Highlights
• Launched the RadeonTM X1900 XTX and CrossFireTM Xpress 3200, reinforcing ATI’s performance leadership in GPUs and chipsets.
• Announced and shipped the MobilityTM Radeon® X1600, X1400 and X1300, leadership 90 nanometer mobile graphics solutions that offer the best visual quality to notebooks at every price point.
• Shipped nearly 25 million Imageon® processors for the handheld market, and introduced the Imageon 2380 and 2388 processors and a complete DVB-H solution for the emerging mobile TV market.
• Acquired certain assets and employees from Shanghai-based Macrosynergy Technology Co., Ltd., an alliance company of XGI Technology Inc., further positioning ATI for international growth opportunities in key markets.
• Renewed normal course issuer bid (share buyback program) to commence on March 30, 2006. 1 All dollar amounts are in U.S. dollars unless otherwise noted. All per share amounts are stated on a diluted basis unless otherwise noted. ATI Technologies Inc. reports under Canadian generally accepted accounting principles (GAAP). 2 Adjusted net income excludes the after-tax impact of stock-option expense, as well as certain charges, recoveries, gains and other items. Adjusted net income does not have any standardized meaning prescribed by GAAP and therefore is unlikely to be comparable to similar measures presented by other issuers. For an explanation of the items excluded and a reconciliation of adjusted net income to net income determined in accordance with GAAP, please see “Non-GAAP Financial Measurements and Reconciliation” included in this release.
ATI TECHNOLOGIES INC. 1 Commerce Valley Drive East Telephone: (905) 882-2600 Markham, Ontario Canada Facsimile: (905) 882-2620 L3T 7X6 www.ati.com

ATI Reports Fiscal 2006 Second Quarter Results
2
Q3 Outlook Revenues for the third quarter of fiscal 2006 are expected to be between $640 million and $680 million. Gross margin percentage is expected to improve to approximately 30.0%. Operating expenses, excluding stock option expense, amortization of intangible assets and other charges, are expected to be between $155 million and $160 million. The foregoing outlook contains forward-looking statements about ATI’s financial condition and results. Reference should be made to the “Important Information Regarding Forward-looking Statements” set out in the MD&A section of this release. Non-GAAP Financial Measurements and Reconciliation In addition to the GAAP results provided in this release, we have provided certain non-GAAP adjusted net income financial measurements that present net income and diluted net income per share on a basis excluding the after-tax impact of stock-option expense, as well as certain charges, recoveries, gains and other items. Details of these excluded items are presented in the table below, which reconciles the GAAP results to non-GAAP financial measurements described in this release. These non-GAAP financial measurements do not have any standardized meaning prescribed by GAAP and are therefore unlikely to be comparable to similar measurements presented by other issuers. These non-GAAP measures are provided as a supplement, and should not be considered an alternative to measurements required by accounting principles generally accepted in Canada. Management believes that the presentation of adjusted net income financial measurements provides useful additional information to management and investors regarding the financial and operating performance of our core business operations. These non-GAAP financial measurements are part of the financial and other metrics used by management for purposes of our operating plans and employee incentive programs.
ATI Technologies Inc. ADJUSTED (NON-GAAP) VS. GAAP RESULTS
(in thousands, except per share data) Three Months Ended Feb. 28
Six Months Ended Feb. 28
2006 2005 2006 2005 Net income as reported under GAAP Per share, diluted
$34,143 0.13
$57,193 0.22
$41,769 0.16
$120,896 0.47
Adjustments: Add: Stock option expense3 Add: Amortization of intangible assets4 Add: Other charges5
Deduct: Tax recovery for stock option expense Deduct: Tax recovery for intangibles Deduct: Tax recovery for other charges Deduct: Gain on investment
8,713 2,251 895
(1,181)
- (62)
-
8,603 1,389 278
(997) (131) (25)
(880)
17,521 5,449 9,773
(2,275)
- (692)
-
16,652 2,633 660
(1,397) (263) (58)
(880)
Adjusted net income
$44,759 $65,430 $71,545 $138,243
Diluted weighted average shares outstanding
258,158 259,743 257,363 258,830
Adjusted net income per share, diluted
$0.17 $0.25 $0.28 $0.53
3 In accordance with Canadian GAAP, beginning with the first quarter of fiscal 2005, ATI began expensing compensation costs associated with stock options granted to employees after September 1, 2002. See Note 13(i) to the unaudited interim consolidated financial statements. 4 See Note 3 to the unaudited interim consolidated financial statements. 5 Includes charges related to regulatory and litigation matters. See Note 8 to the unaudited interim consolidated financial statements.

ATI Reports Fiscal 2006 Second Quarter Results
3
MANAGEMENT’S DISCUSSION AND ANALYSIS OF INTERIM FINANCIAL RESULTS This is management’s discussion and analysis of financial condition and the results of operations (MD&A) that comments on ATI’s operations, financial condition and cash flows for the three and six months ended February 28, 2006 compared to the three and six months ended February 28, 2005. This MD&A should be read in conjunction with the attached unaudited interim consolidated financial statements for the period ended February 28, 2006, the annual MD&A contained in the 2005 Annual Report and the audited consolidated financial statements for the year ended August 31, 2005. In this MD&A, ATI, we, us and our refer to ATI Technologies Inc. and its subsidiaries. Important Information Regarding Forward-looking Statements Forward-looking statements look into the future and provide an opinion as to the effect of certain events and trends on the business. Forward-looking statements may include words such as “plans,” “intends,” “anticipates,” “should,” “estimates,” “expects,” “believes,” “indicates,” “targeting,” “suggests” and similar expressions. This MD&A and other sections of this release (in particular, the section entitled “Outlook”) contain forward-looking statements about ATI’s objectives, strategies, financial condition and results, as well as statements with respect to our beliefs, expectations, anticipations, estimates and intentions. These forward-looking statements are based on current expectations and various factors and assumptions. Accordingly, these statements entail various risks and uncertainties. The material factors and assumptions that were applied in making the forward-looking statements in this release include, but are not limited to: the expected rate of growth of the PC and Consumer markets; the expected mix of discrete and integrated chipsets that will be sold in the PC market; our expected market share across various customers and product segments; our expected future design wins both in the PC and Consumer markets; our expected product and production costs; the timely introduction of our new products and our competitors’ new products for the PC and Consumer markets; the expected product specific average selling price of our products and our competitors’ products; our overall competitive position and competitiveness of our current and future products; the relative mix of desktop and notebook chipsets; changes in the rate of exchange of Canadian currency to U.S. dollars, changes to our overall product mix, potential supply constraints and disruptions for components incorporated into our products and those of our customers; and unexpected variances in the cost or availability of materials, especially silicon wafer, memory, printed circuit boards and packaging costs. It is important to note that:
• Unless otherwise indicated, forward-looking statements in this release describe our expectations as of March 30, 2006.
• We caution readers not to place undue reliance on these statements as our actual results may differ materially from our expectations if known and unknown risks or uncertainties affect our business, or if our estimates or assumptions prove inaccurate. Therefore, we cannot provide any assurance that forward-looking statements will materialize.
• We assume no obligation to update or revise any forward-looking statement, whether as a result of new information, future events or any other reason.
Material factors that could cause our actual results to differ materially from the forward-looking statements in this release include, but are not limited to: unexpected variations in market growth and demand for new GPU products and technologies; potential constraints on our ability to develop, launch and ramp new products on a timely basis; manufacturing considerations, competition, industry cycles and seasonality; dependence on third-parties for manufacturing; critical industry transitions; and other risks detailed in our regulatory filings. Additional information concerning risks and uncertainties affecting our business and other factors that could cause our financial results to fluctuate is contained in our filings with Canadian and U.S. securities regulatory authorities. Please see Item 3.12 “Narrative Description of the Business – Risks and Uncertainties” in our 2005 Annual Information Form and the Risks and Uncertainties section of our

ATI Reports Fiscal 2006 Second Quarter Results
4
annual MD&A on page 30 of our 2005 Annual Report filed on SEDAR at www.sedar.com. Our Form 40-F and other filings we make with the U.S. Securities and Exchange Commission are available on EDGAR at www.sec.gov.
RESULTS OF OPERATIONS
Revenues Consolidated revenues for the second quarter of fiscal 2006 increased $64 million or 11% to a record $672 million as compared to the second quarter last year. The PC and Consumer segments accounted for 80% and 20%, respectively, of consolidated revenues in the second quarter. PC Segment PC revenues declined 2% year-over-year to $539.9 million, resulting primarily from reduced volumes of desktop discrete products to add-in-board (AIB) and retail customers. Sales of desktop discrete products increased 10% on a sequential basis following the recent introduction of a new family of desktop discrete products which has significantly improved our competitive position in this segment. Sales of notebook discrete solutions were also lower year-over-year as a result of the increased use of integrated graphics in notebook platforms. The decline in revenues from discrete PC products was partially offset by strong sales growth in desktop and notebook integrated products, which collectively increased by more than 450% from the second quarter of fiscal 2005. Continued market penetration and significant OEM design wins for the Radeon Xpress 200 series for Intel and AMD platforms led to the increase. Consumer Segment Consumer revenue grew 127% year-over-year to $132.5 million in the second quarter of fiscal 2006. Handheld unit shipments increased more than 250% while revenue increased approximately 200% on increased sales of Imageon processors to major manufacturers of handheld devices. Digital television (DTV) unit shipments more than doubled while revenues increased approximately 75% on higher product sales to DTV manufacturers and strong design win momentum on integrated and LCD platforms. Royalties and non-recurring engineering revenue related to our game console business increased nearly 50% and continued to represent less than 3% of consolidated revenues. Revenues for the first six months of fiscal 2006 Revenues for the first six months of fiscal 2006 grew 3% to $1.26 billion from $1.22 billion in the same period last year. The PC segment accounted for $1.01 billion or 80% of consolidated revenues while Consumer represented $257 million or 20% of consolidated revenues. The increase in consolidated revenues was driven by strong sales growth in chipsets and consumer digital products, offset by a decline in PC discrete products.

ATI Reports Fiscal 2006 Second Quarter Results
5
Gross Margin Gross margin percentage was 28.2% for the second quarter of fiscal 2006 as compared with 34.2% in the same period last year and 28.7% in the first quarter of fiscal 2006. Year-to-date gross margin percentage was 28.4% as compared with 34.1% for the first half of fiscal 2005. Gross margin percentage for the quarter and year-to-date reflect a decline in desktop discrete margins resulting from a repositioning and write-down of certain products in the fourth quarter of fiscal 2005. As a result, certain products continued to be sold in the first half of fiscal 2006 at significantly reduced margins. In addition, gross margin was also impacted by strong sales of lower-margin integrated chipsets, which comprised approximately one-quarter of consolidated revenues in the second quarter and first half of fiscal 2006, as compared with about 5% for the same periods last year. A larger proportion of higher-margin Consumer revenue helped to offset some of the overall gross margin decline. Operating Expenses Total operating expenses, excluding the amortization of intangible assets, stock-based compensation and other charges, increased 7% year-over-year and 13% on a year-to-date basis. Selling and marketing expenses were approximately flat year-over-year at $37 million in the second quarter of fiscal 2006. On a year-to-date basis, selling and marketing expenses rose 7% due to increases in sales and marketing personnel, as well as advertising and marketing-related activities to drive brand and product awareness. Research and development (R&D) expenses of $81.8 million were 5% higher than the comparable period in fiscal 2005. For the first six months of fiscal 2006, R&D expenses rose 11% relative to the same period a year ago. The increase was the result of continued investments across both the PC and Consumer segments to support product and technology development, and was primarily driven by increases in technical staff, including the acquisition of professionals from Terayon Communication Systems, Inc. and CuTe Solutions Private Limited in 2005. Administrative expenses were up $4.5 million or 29% to $20.3 million in the quarter and rose 33% for the first six months of fiscal 2006. The increases were related to investment in the supply chain organization, headcount related expenses and increased professional and consulting fees related to regulatory compliance and litigation. On a combined basis, selling and marketing, R&D and administrative expenses declined nearly 2% relative to the first quarter of fiscal 2006 due to a focus on cost controls and generally lower prototyping costs, license fees, travel and advertising and promotional expenses.

ATI Reports Fiscal 2006 Second Quarter Results
6
Stock-based Compensation In accordance with Canadian GAAP, beginning with the first quarter of fiscal 2005, ATI began expensing compensation costs associated with stock options granted to employees after September 1, 2002. Stock option expense for the second quarter was $8.7 million compared to $8.6 million for the same period last year. Total stock-based compensation includes the costs associated with stock options, restricted share units and deferred share units. Stock-based compensation costs were $11.3 million in the quarter as compared with $12.3 million in the previous quarter and $10.3 million in the second quarter of fiscal 2005. Interest and Other Income Interest and other income was $6.8 million in the second quarter of fiscal 2006 as compared with $4.5 million in the second quarter of fiscal 2005. For the first six months of fiscal 2006, interest and other income was $13.0 million, as compared with $6.7 million for the same period in 2005. The increases are attributable to higher rates of return on cash, cash equivalents and short-term investments, an increase in investments in short term investments, as well as a favorable impact on foreign exchange. Net Income Net income calculated in accordance with Canadian GAAP was $34.1 million ($0.13 per diluted share), as compared with net income of $57.2 million ($0.22 per diluted share) in the same period last year. The decline relative to last year is primarily due to lower gross margins and higher expenses year-over-year, described previously in this MD&A. Year-to-date, net income in accordance with Canadian GAAP decreased to $41.8 million or $0.16 per share from $120.9 million or $0.47 per share for the first half of fiscal 2005. The decrease was largely the result of the factors listed above. Liquidity and Financial Resources Inventory of $428 million at the end of the quarter increased from $348 million at August 31, 2005. The increase partially reflects a change in our procurement model. In order to minimize the impact of industry supply constraints, we have begun to directly purchase and take inventory of certain components known as substrates. Inventory also grew as a result of chipsets which could not be shipped prior to quarter-end due to a temporary supply shortage of southbridges, as well as the ramping of new desktop and notebook discrete programs to meet anticipated demand. Days of inventory at quarter end were approximately 72 days based on the previous quarter’s sales. Accounts receivable at quarter end was $419 million as compared with $386 million at August 31, 2005. Accounts payable of $403 million was up from $363 million at August 31, 2005. Both accounts receivable and accounts payable are in line with current revenue levels. Cash flow from operations was negative $8.6 million in the quarter as compared with $28.1 million in the first quarter of fiscal 2006 and $41.3 million in the second quarter of fiscal 2005. Cash position (cash, cash equivalents and short-term investments) at quarter end was $607 million, up from $587 million at August 31, 2005. At February 28, 2006, we had working capital of $723 million as compared to $660 million at August 31, 2005.

ATI Reports Fiscal 2006 Second Quarter Results
7
Normal Course Issuer Bid On March 23, 2006, the Board of Directors authorized the renewal of the Company’s Normal Course Issuer Bid (NCIB). Under the NCIB, we may purchase up to 25,100,000 ATI common shares, representing approximately 10% of ATI’s “public float” as of March 15, 2006, as calculated in accordance with TSX rules and policies. ATI will cancel any shares purchased under this NCIB. Within the past 12 months, 2,408,100 shares were repurchased for cancellation pursuant to a normal course issuer bid commenced on March 30, 2005. Corporate Developments
On March 6, 2006, we announced the acquisition of certain assets and employees from Shanghai-based Macrosynergy Technology Co., Ltd., an alliance company of XGI Technology Inc. (“XGI”), a developer of multimedia graphics products. We also acquired certain employees from XGI’s Santa Clara, California location. The acquisition has increased ATI’s presence in China, an important technology and manufacturing market. As a result of the transaction, ATI has added approximately 100 new employees in Shanghai and Santa Clara.
Outstanding Share Data At February 28, 2006, there were 253,473,516 common shares of ATI outstanding. There were 258,158,100 shares outstanding on a weighted average diluted basis. Claims and Proceedings For a description of legal claims and proceedings affecting our business and operations, please see Note 15 to the attached unaudited interim consolidated financial statements. ACCOUNTING POLICIES Our unaudited interim consolidated financial statements are prepared in accordance with Canadian GAAP. The key estimates and assumptions that management has made and their impact on the amounts reported in the unaudited interim consolidated financial statements and notes thereto remain substantially unchanged from those described in our 2005 Annual MD&A. See Note 1 to the unaudited interim consolidated financial statements for more information about the accounting policies used to prepare our financial statements. Conference Call Information
ATI Technologies Inc. will host a conference call today at 8:30 AM (EST) to discuss its financial results for its fiscal 2006 second quarter ended February 28, 2006. To participate in the conference call, please dial 416-641-6105 ten minutes before the scheduled start of the call. No password is required. A live webcast of the call will be available at http://ir.ati.com/phoenix.zhtml?c=105421&p=irol-quarterlyresults under the Quarterly Results section, Q2 2006. Replays of the conference call will be available through April 6, 2006 by calling 416-695-5800. The passcode is 3176779. A web cast replay will be available at the web site noted above.

ATI Reports Fiscal 2006 Second Quarter Results
8
About ATI Technologies ATI Technologies Inc. is a world leader in the design and manufacture of innovative 3D graphics, PC platform technologies and digital media silicon solutions. An industry pioneer since 1985, ATI is the world's foremost graphics processor unit (GPU) provider and is dedicated to deliver leading-edge performance solutions for the full range of PC and Mac desktop and notebook platforms, workstation, set-top and digital television, game console and handheld device markets. With fiscal 2005 revenues of US $2.22 billion, ATI has more than 3,400 employees in the Americas, Europe and Asia. ATI common shares trade on NASDAQ (ATYT) and the Toronto Stock Exchange (ATY).
Copyright 2006 ATI Technologies Inc. All rights reserved. ATI and ATI product and product feature names are trademarks and/or registered trademarks of ATI Technologies Inc. All other company and product names are trademarks and/or registered trademarks of their respective owners. Features, pricing, availability and specifications are subject to change without notice.
For media or industry analyst support, visit our Web site at http://www.ati.com
Other ATI Contacts: Derek Baker, Manager, Porter Novelli Canada, at (416) 422-7158 or [email protected] For investor relations support, please contact: Zev Korman, Manager, Investor Relations, ATI Technologies Inc., at (905) 882-2600, ext. 3670 or [email protected]
- 30 –
-FINANCIAL STATEMENTS ATTACHED-

9
SUPPLEMENTARY FINANCIAL INFORMATION The table below shows selected financial information for the eight most recently completed quarters.
ATI TECHNOLOGIES INC.
CONSOLIDATED STATEMENTS OF OPERATIONS FOR EIGHT QUARTERS
(Thousands of US dollars, except per share amounts)
Q2 2006 Q1 2006 Q4 2005 Q3 2005 Q2 2005 Q1 2005 Q4 2004 Q3 2004
Revenues $672,362 $590,703 $470,227 $ 530,235 $ 608,188 $ 613,859 $ 572,218 $ 491,457
Cost of revenues 482,994 420,966 427,882 375,806 399,885 405,009 379,836 318,918
Gross margin 189,368 169,737 42,345 154,429 208,303 208,850 192,382 172,539
Expenses
Selling and marketing 36,580 37,506 39,131 37,744 36,352 33,125 29,244 31,243
Research and development 81,835 86,103 87,669 88,508 77,726 73,114 75,865 65,539
Administrative 20,333 17,578 17,326 16,013 15,793 12,676 11,517 12,166
Amortization of intangible assets 2,251 3,198 3,240 3,046 1,389 1,244 1,486 1,546
Stock-based compensation 11,338 12,338 11,222 10,395 10,329 10,558 1,691 2,315
Other charges (recoveries) 895 8,878 497 1,351 278 382 155 (454)
153,232 165,601 159,085 157,057 141,867 131,099 119,958 112,355
Income (loss) from operations 36,136 4,136 (116,740) (2,628) 66,436 77,751 72,424 60,184
Interest and other income, net 6,750 6,297 4,341 3,914 4,504 2,176 2,815 33
Interest expense (508) (513) (515) (525) (537) (519) (499) (513)
Income (loss) before income taxes 42,378 9,920 (112,914) 761 70,403 79,408 74,740 59,704
Income taxes (recoveries) 8,235 2,294 (9,392) 1,206 13,210 15,705 13,584 11,085
Net income (loss) $34,143 $7,626 $ (103,522) $ (445) $ 57,193 $ 63,703 $ 61,156 $ 48,619
Net income (loss) per share
Basic $0.14 $ 0.03 $ (0.41)
$ 0.00 $ 0.23 $ 0.26 $ 0.25 $ 0.20
Diluted $0.13 $ 0.03 $ (0.41)
$ 0.00 $ 0.22 $ 0.25 $ 0.24 $ 0.19
Weighted average number of shares (000's)
Basic 252,332 250,771 251,045 251,602 251,046 249,027 247,699 245,960
Diluted 258,158 256,568 251,045 251,602 259,743 257,917 258,198 256,650
Outstanding number of shares at the end
of the period (000's) 253,474 251,700 251,473 252,845 252,258 251,324 249,287 247,886

10
ATI TECHNOLOGIES INC. CONSOLIDATED STATEMENTS OF OPERATIONS AND RETAINED EARNINGS (Unaudited)
(Thousands of US dollars, except per share amounts) Three months ended Six months ended February 28 February 28 February 28 February 28 2006 2005 2006 2005
Revenues $ 672,362 100.0% $ 608,188 100.0% $ 1,263,065 100.0% $ 1,222,047 100.0%
Cost of revenues 482,994 71.8% 399,885 65.8% 903,960 71.6% 804,894 65.9%
Gross margin 189,368 28.2% 208,303 34.2% 359,105 28.4% 417,153 34.1%
Operating expenses
Selling and marketing 36,580 5.5% 36,352 6.0% 74,086 5.8% 69,477 5.7%
Research and development 81,835 12.2% 77,726 12.8% 167,938 13.3% 150,840 12.3%
Administrative 20,333 3.0% 15,793 2.6% 37,911 3.0% 28,469 2.3%
Amortization of intangible assets (Note 3) 2,251 0.3% 1,389 0.2% 5,449 0.4% 2,633 0.2%
Stock-based compensation (Note 13) 11,338 1.7% 10,329 1.7% 23,676 1.9% 20,887 1.7%Other charges (Note 8) 895 0.1% 278 - 9,773 0.8% 660 0.1%
153,232 22.8% 141,867 23.3% 318,833 25.2% 272,966 22.3%
Income from operations 36,136 5.4% 66,436 10.9% 40,272 3.2% 144,187 11.8%
Interest and other income, net 6,750 1.0% 4,504 0.8% 13,047 1.0% 6,680 0.6%
Interest expense (508) (0.1%) (537) (0.1%) (1,021) (0.1%) (1,056) (0.1%)
Income before income taxes 42,378 6.3% 70,403 11.6% 52,298 4.1% 149,811 12.3%
Income taxes 8,235 1.2% 13,210 2.2% 10,529 0.8% 28,915 2.4%Net income $ 34,143 5.1% $ 57,193 9.4% $ 41,769 3.3% $ 120,896 9.9%
Retained earnings, beginning of period 296,387 358,685 293,370 294,982
Repurchase of common shares (Note 6) - - (4,609) -
Retained earnings, end of period $ 330,530 $ 415,878 $ 330,530 $ 415,878
Net income per share (Note 9) Basic $ 0.14 $ 0.23 $ 0.17 $ 0.48
Diluted 0.13 0.22 0.16 0.47
Weighted average number of shares (000’s)
Basic 252,332 251,046 251,551 250,036
Diluted 258,158 259,743 257,363 258,830Outstanding number of shares at the end of
the period (000’s) 253,474 252,258 253,474 252,258
See accompanying notes to unaudited interim consolidated financial statements. These financial statements should be read in conjunction with the Company’s most recent annual consolidated financial statements, as at and for year ended August 31, 2005.

11
ATI TECHNOLOGIES INC. CONSOLIDATED BALANCE SHEETS (Unaudited) (Thousands of US dollars) February 28 August 31 2006 2005 Assets
Current assets: Cash and cash equivalents $ 210,417 $ 223,277 Short-term investments 396,608 363,370 Accounts receivable 418,559 386,264 Inventories 427,582 348,209
Prepayments and sundry receivables 23,049 24,463 Future income tax assets 4,866 5,348 Total current assets 1,481,081 1,350,931
Capital assets 113,771 112,875 Intangible assets (Note 3) 12,182 17,631 Goodwill (Note 3) 185,379 190,095 Long-term investments 291 291 Tax credits recoverable 78,560 59,080 Future income tax assets 19,306 12,588 Total Assets $ 1,890,570 $1,743,491
Liabilities and Shareholders’ Equity Current liabilities: Accounts payable $ 403,276 $ 362,926 Accrued liabilities 336,762 302,028 Deferred revenue 15,622 24,576 Current portion of long-term debt (Note 5) 1,983 1,852
Future income tax liabilities 75 - Total current liabilities 757,718 691,382
Long-term debt (Note 5) 29,150 29,110 Future income tax liabilities 8,738 8,861 Total liabilities 795,606 729,353 Shareholders’ equity: Share capital (Note 6) 688,526 665,566 Treasury stock (Note 13) (7,840) (14,867) Contributed surplus 75,474 61,795 Retained earnings 330,530 293,370 Currency translation adjustment 8,274 8,274 Total shareholders’ equity 1,094,964 1,014,138 Total Liabilities and Shareholders’ Equity $ 1,890,570 $ 1,743,491
Commitments and contingencies (Notes 10 and 15)
Guarantee (Note 7)
See accompanying notes to unaudited interim consolidated financial statements. These financial statements should be read in conjunction with the Company’s most recent annual consolidated financial statements, as at and for year ended August 31, 2005.

12
ATI TECHNOLOGIES INC. CONSOLIDATED STATEMENTS OF CASH FLOWS (Unaudited)
(Thousands of US dollars) Three months ended Six months ended February 28 February 28 February 28 February 28 2006 2005 2006 2005
Cash provided by (used in):
Operating activities:
Net income $ 34,143 $ 57,193 $ 41,769 $ 120,896 Items which do not involve cash: Future income taxes 8 694 (782) 320 Stock-based compensation 11,162 10,306 22,567 20,010 Depreciation and amortization 9,238 6,666 19,228 12,604 Loss on investment - (880) - (880) Unrealized foreign exchange loss (gain) 428 (935) 990 1,687 Changes in non-cash operating working capital: Accounts receivable (50,965) (10,982) (32,295) (44,402) Inventories (96,805) (75,818) (79,373) (112,523) Prepayments and sundry receivables (4,316) 11,498 1,414 (1,793) Accounts payable 101,616 29,303 40,350 50,090 Accrued liabilities (1,506) 13,956 35,048 40,261 Deferred revenue (5,780) (3,370) (8,954) (3,967) Tax credits recoverable (5,805) 3,649 (20,495) 25,874 (8,582) 41,280 19,467 108,177 Financing activities: Principal payment on long-term debt (451) (421) (891) (813) Issuance of common shares 17,074 8,312 22,412 22,430 Repurchase of common shares (Note 6) - - (5,693) - Proceeds from sale of treasury stock - - - 9 16,623 7,891 15,828 21,626 Investing activities: Purchase of short-term investments (107,012) (172,750) (233,171) (243,826) Maturity and proceeds from sales of short-term investments 60,248 89,902 199,895 147,527
Additions to capital assets (9,109) (13,432) (14,675) (19,655) Proceeds from gain on investment - 880 - 880 Acquisitions, net of cash acquired (1) (4,470) (314) (7,558) (55,874) (99,870) (48,265) (122,632) Foreign exchange gain (loss) on cash held in foreign currency 133 (132) 110 247
Increase (decrease) in cash and cash equivalents (47,700) (50,831) (12,860) 7,418 Cash and cash equivalents – beginning of period 258,117 417,857 223,277 359,608 Cash and cash equivalents – end of period 210,417 367,026 210,417 367,026 Short-term investments 396,608 285,607 396,608 285,607 Cash position – end of period $ 607,025 $ 652,633 $ 607,025 $ 652,633
Supplemental cash flow information (Note 11) See accompanying notes to unaudited interim consolidated financial statements. These financial statements should be read in conjunction with the Company’s most recent annual consolidated financial statements, as at and for year ended August 31, 2005.

13
ATI TECHNOLOGIES INC. NOTES TO CONSOLIDATED FINANCIAL STATEMENTS February 28, 2006 (Unaudited)
The principal business activities of ATI Technologies Inc. (the “Company”) are the design, manufacture and sale of innovative 3D graphics and digital media silicon solutions. The Company markets its products to original equipment manufacturers, system builders, distributors and retailers primarily in North America, Europe and the Asia-Pacific region.
1. SIGNIFICANT ACCOUNTING POLICIES
The accompanying unaudited interim consolidated financial statements are prepared in accordance with Canadian generally accepted accounting principles for interim financial statements. Certain information and note disclosures normally included in the annual financial statements prepared in accordance with Canadian generally accepted accounting principles have been condensed or excluded. As a result, these unaudited interim consolidated financial statements do not contain all disclosures required to be included in the annual financial statements and should be read in conjunction with the most recent audited annual consolidated financial statements and notes thereto for the year ended August 31, 2005. These unaudited interim consolidated financial statements are prepared following accounting policies consistent with the Company’s audited annual consolidated financial statements and notes thereto for the year ended August 31, 2005. The financial information included herein reflects all adjustments (consisting only of normal recurring adjustments), which, in the opinion of management, are necessary for a fair presentation of the results for the interim periods presented. The results of operations for the three months and six months ended February 28, 2006 are not necessarily indicative of the results to be expected for the full year.
2. FINANCIAL INSTRUMENTS
The Company enters into forward foreign exchange contracts (“Forwards”) to hedge its foreign currency exposure on expenses incurred for its Canadian operations. The Forwards obligate the Company to sell US dollars for Canadian dollars in the future at predetermined exchange rates and are matched with anticipated future operating expenses in Canada. The Forwards do not subject the Company to risk from exchange rate movements because gains and losses on such contracts offset losses and gains on exposures being hedged. The counterparties to the Forwards are multinational commercial banks and, therefore, the credit risk of counterparty non-performance is low. As at February 28, 2006, the Company had $52.0 million Canadian dollars outstanding in Forwards that mature in the next three months at an average exchange rate of 1.1675. All of the Forwards have become favourable to the Company since their inception and have a fair value of $1.3 million as at February 28, 2006.

14
ATI TECHNOLOGIES INC. NOTES TO CONSOLIDATED FINANCIAL STATEMENTS February 28, 2006 (Unaudited)
3. INTANGIBLE ASSETS AND GOODWILL The net book values of intangible assets and goodwill at February 28, 2006 and August 31, 2005 are as follows:
(Thousands of US dollars)
Cost Accumulated
amortization Net book
value Net book value
February 28, 2006 August 31, 2005
Core technology $ 38,226 $ 26,591 $ 11,635 $ 15,188
Other 9,298 8,751 547 2,443
Total intangible assets $ 47,524 $ 35,342 $ 12,182 $ 17,631
Goodwill $ 372,052 $ 186,673 $ 185,379 $ 190,095
Amortization expense related to intangible assets amounted to $2.2 million and $5.4 million for the three months and six months ended February 28, 2006 respectively (2005 - $1.4 million and $2.6 million). During the second quarter of fiscal 2006, the Company considered it more likely than not that it would be able to realize the future income tax asset acquired in the business combination with Nxtwave Communications Inc. (“Nxtwave”). The future income tax asset was previously not recognized as an identifiable asset at the time of the acquisition. Accordingly, the Company adjusted the $4.7 million goodwill acquired in the above-mentioned business combination to zero reflecting the realization of the tax benefit on Nxtwave’s pre-acquisition losses. 4. CREDIT FACILITIES
The Company maintains committed operating and overdraft credit facilities aggregating $21.0 million with a single financial institution. There are no borrowings outstanding under these facilities.
5. LONG-TERM DEBT
(Thousands of US dollars)
Interest
rate February 28
2006 August 31
2005
Obligation under capital lease (i) 6.31% $ 19,305 $ 19,077
Mortgage payable (ii) 6.96% 11,828 11,885
31,133 30,962
Less : Current portion 1,983 1,852
Long-term portion $ 29,150 $ 29,110
(i) Obligation under capital lease
The Company’s obligation under capital lease represents the lease on a building facility occupied by the Company in Markham, Ontario. The capital lease is denominated in Canadian dollars. As at February 28, 2006, the remaining amount outstanding on the capital lease was $19.3 million (Cdn. $ 22.2 million).

15
ATI TECHNOLOGIES INC. NOTES TO CONSOLIDATED FINANCIAL STATEMENTS February 28, 2006 (Unaudited) 5. LONG-TERM DEBT (CONTINUED)
(ii) Mortgage payable
On September 10, 2002, Commerce Valley Realty Holding Inc. (“CVRH”), a joint venture in which the Company has a 50 per cent ownership interest, entered into a mortgage agreement with a lender to finance a building facility. The Company’s proportionate share of the mortgage as at February 28, 2006 amounted to $11.8 million (Cdn. $13.6 million). The mortgage has a repayment term of 12 years and is denominated in Canadian dollars.
6. NORMAL COURSE ISSUER BID
In March 2005, the Board of Directors authorized a share repurchase program of up to 24.7 million common shares through a normal course issuer bid (“NCIB”). A total of 2 million shares were repurchased and cancelled in fiscal 2005 for a total consideration of $23.9 million. During the first six months of fiscal 2006, the Company repurchased and cancelled a total of 408,100 shares for a total consideration of $5.7 million. On March 23, 2006, the Board of Directors authorized the renewal of the Company's NCIB for up to 25.1 million common shares. If considered advisable, shares may be repurchased from time to time on the open market through March 29, 2007 at prevailing market prices. The timing and amount of purchases, if any, will be dependent upon the availability and alternative uses of capital, market conditions and other factors
7. GUARANTEE
The Company and other owners of CVRH have jointly and severally provided a guarantee for the mortgage payment of a building facility occupied by the Company. In the event that CVRH is unable to meet the underlying mortgage payment to the lender, the Company and other owners of CVRH will be jointly and severally responsible under this guarantee. In addition, the Company posted a letter of credit in the amount of $2.6 million (Cdn. $3.0 million) in favour of CVRH. CVRH has assigned this letter of credit to the exclusive benefit of the lender as additional security of the mortgage. The letter of credit has a term of 5 years and will expire on November 5, 2007. In the event of a lease default by the Company, the proceeds of the letter of credit will be paid to the lender.
16
ATI TECHNOLOGIES INC. NOTES TO CONSOLIDATED FINANCIAL STATEMENTS February 28, 2006 (Unaudited)
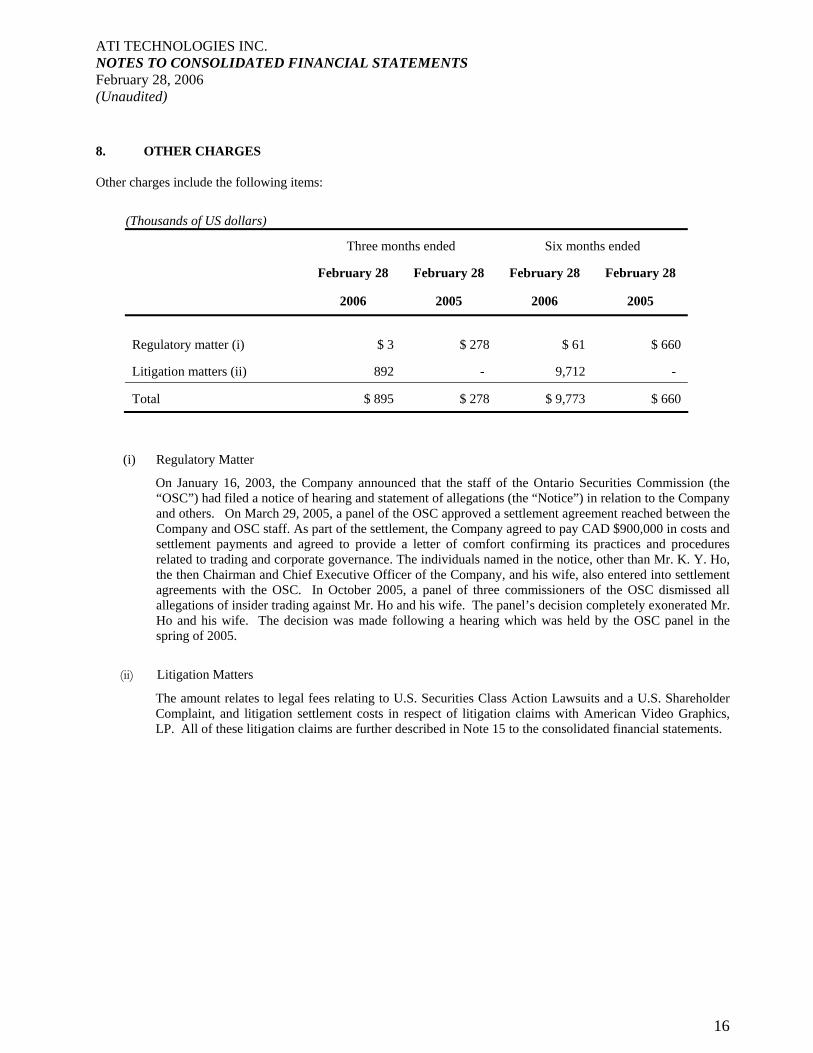
8. OTHER CHARGES
Other charges include the following items:
(Thousands of US dollars)
Three months ended Six months ended
February 28 February 28 February 28 February 28
2006 2005 2006 2005
Regulatory matter (i) $ 3 $ 278 $ 61 $ 660
Litigation matters (ii) 892 - 9,712 -
Total $ 895 $ 278 $ 9,773 $ 660
(i) Regulatory Matter
On January 16, 2003, the Company announced that the staff of the Ontario Securities Commission (the “OSC”) had filed a notice of hearing and statement of allegations (the “Notice”) in relation to the Company and others. On March 29, 2005, a panel of the OSC approved a settlement agreement reached between the Company and OSC staff. As part of the settlement, the Company agreed to pay CAD $900,000 in costs and settlement payments and agreed to provide a letter of comfort confirming its practices and procedures related to trading and corporate governance. The individuals named in the notice, other than Mr. K. Y. Ho, the then Chairman and Chief Executive Officer of the Company, and his wife, also entered into settlement agreements with the OSC. In October 2005, a panel of three commissioners of the OSC dismissed all allegations of insider trading against Mr. Ho and his wife. The panel’s decision completely exonerated Mr. Ho and his wife. The decision was made following a hearing which was held by the OSC panel in the spring of 2005.
(ii) Litigation Matters
The amount relates to legal fees relating to U.S. Securities Class Action Lawsuits and a U.S. Shareholder Complaint, and litigation settlement costs in respect of litigation claims with American Video Graphics, LP. All of these litigation claims are further described in Note 15 to the consolidated financial statements.

17
ATI TECHNOLOGIES INC. NOTES TO CONSOLIDATED FINANCIAL STATEMENTS February 28, 2006 (Unaudited)
9. NET INCOME PER SHARE The following table presents a reconciliation of the numerators and denominators used in the calculations of the basic and diluted net income per share:
(Thousands of US dollars, except per share amounts) Three months ended Six months ended
February 28 February 28 February 28 February 28
2006 2005 2006 2005
Net income $ 34,143 $ 57,193 $ 41,769 $ 120,896 Weighted average number of common shares outstanding (000’s):
Basic 252,332 251,046 251,551 250,036
Effect of dilutive securities 5,826 8,697 5,812 8,794
Diluted 258,158 259,743 257,363 258,830
Net income per share
Basic $ 0.14 $ 0.23 $ 0.17 $ 0.48
Diluted 0.13 0.22 0.16 0.47 At February 28, 2006, options to purchase 11,213,406 common shares (February 28, 2005 – 3,407,828) were outstanding but were not included in the calculation of diluted net income per share because to do so would have been anti-dilutive.
10. COMMITMENTS
As at February 28, 2006, the Company was committed to the following minimum payments related to office premises, license and royalty agreements, building under capital lease payments, mortgage payments and non-cancellable inventory purchases:
(Thousands of U. S. dollars)
Total Remaining of 2006 2007 2008 2009 2010 Thereafter
Commitments related to office premises, license and royalty agreements $ 106,698 $ 17,855 $ 34,928 $ 29,132 $ 10,742 $ 6,414 $ 7,627
Commitment related to capital lease 27,191 1,075 2,242 2,368 2,368 2,368 16,770
Commitment related to mortgage 15,764 901 1,801 1,801 1,802 1,802 7,657
Commitments related to non-cancellable inventory purchases 281,734 281,734 - - - - -
Total commitments $ 431,387 $ 301,565 $ 38,971 $ 33,301 $ 14,912 $ 10,584 $ 32,054

18
ATI TECHNOLOGIES INC. NOTES TO CONSOLIDATED FINANCIAL STATEMENTS February 28, 2006 (Unaudited)
11. SUPPLEMENTAL CASH FLOW INFORMATION
(Thousands of US dollars)
Three months ended Six months ended
February 28 February 28 February 28 February 28
2006 2005 2006 2005
Cash paid for:
Interest $ 482 $ 512 $ 966 $ 1,001
Income taxes 1,066 163 2,641 413
Interest received $ 5,135 $ 3,419 $ 8,898 $ 5,334
12. SEGMENTED INFORMATION
The Company designs and manufactures innovative 3D graphics and digital media silicon solutions. The Company operates in two reportable segments: Personal Computer (“PC”) and Consumer. The PC segment includes all 3D graphics, video, and multimedia products which are developed for use in desktop and notebook personal computers. The Consumer segment includes products used in cell phones, PDA’s, DTV’s and set-top boxes. The Consumer segment also includes royalties and contract engineering services derived from cell phone and game console products. The Company’s management evaluates segment performance based on revenue and on operating income (loss) which is calculated as income (loss) from operations before taxes, excluding expenses related to stock-based compensation, amortization of intangible assets, and other charges. The Company does not identify or allocate total assets by reportable segment. In addition, there are no inter-segment revenues. The accounting polices for all operating segments are the same as those described in the summary of significant accounting policies in the Company’s most recent annual audited financial statements for the year ended August 31, 2005.

19
ATI TECHNOLOGIES INC. NOTES TO CONSOLIDATED FINANCIAL STATEMENTS February 28, 2006 (Unaudited) 12. SEGMENTED INFORMATION (CONTINUED)
The following tables present the revenues and operating income (loss) of the two reportable segments for the three months and six months ended February 28, 2006 and 2005.
(Thousands of US dollars)
Consolidated PC Consumer Three months ended Three months ended Three months ended
February 28 February 28 February 28
2006 2005 2006 2005 2006 2005
Revenues $ 672,362 $ 608,188 $ 539,858 $ 549,861 $ 132,504 $ 58,327
Operating income (loss) 50,620 78,432 20,648 81,235 29,972 (2,803)
(Thousands of US dollars)
Consolidated PC Consumer Six months ended Six months ended Six months ended February 28 February 28 February 28
2006 2005 2006 2005 2006 2005
Revenues $ 1,263,065 $ 1,222,047 $ 1,005,756 $ 1,068,178 $ 257,309 $ 153,869
Operating income 79,170 168,367 19,937 147,807 59,233 20,560
The following table reconciles total operating income for reportable segments to income from operations as reported in the consolidated statements of operations and retained earnings:
(Thousands of US dollars)
Three months ended Six months ended
February 28 February 28 February 28 February 28
2006 2005 2006 2005
Total operating income for reportable segments $ 50,620 $ 78,432 $ 79,170 $ 168,367
Unallocated amounts:
Amortization of intangible assets (2,251) (1,389) (5,449) (2,633)
Stock-based compensation expense (11,338) (10,329) (23,676) (20,887)
Other charges (895) (278) (9,773) (660)
Income from operations in consolidated statements of operations and retained earnings $ 36,136 $ 66,436 $ 40,272 $ 144,187

20
ATI TECHNOLOGIES INC. NOTES TO CONSOLIDATED FINANCIAL STATEMENTS February 28, 2006 (Unaudited)
12. SEGMENTED INFORMATION (CONTINUED)
The following tables provide revenues by geographic area, as well as capital assets, intangible assets and goodwill by geographic area. The breakdown in revenues by geographic area in the following table is based on customer and royalty payer location, whereas the breakdown in capital assets, intangible assets and goodwill is based on physical location.
(Thousands of US dollars)
Three months ended Six months ended
February 28 February 28 February 28 February 28
2006 2005 2006 2005
Revenues:
Canada $ 6,086 $ 3,975 $ 10,436 $ 8,306
United States 73,658 65,138 138,421 144,939
Europe 18,955 27,227 34,202 48,345
Asia-Pacific 573,663 511,848 1,080,006 1,020,457
Consolidated revenues $ 672,362 $ 608,188 $ 1,263,065 $ 1,222,047
(Thousands of US dollars)
February 28 August 31
2006 2005
Capital assets, intangible assets and goodwill:
Canada $ 95,025 $ 98,602
United States 207,549 212,348
Europe 233 231
Asia-Pacific 8,525 9,420
Consolidated capital assets, intangible assets and goodwill
$ 311,332 $ 320,601
For the three months and six months ended February 28, 2006, one customer accounted for 13% and 13% respectively and another customer accounted for 10% and 11% respectively of the Company’s consolidated revenues (2005 – one customer accounted for 14% and 13%, and another customer accounted for 11% and 11%). At February 28, 2006, none of the Company’s customers accounted for 10% or more of its consolidated accounts receivable (August 31, 2005 – one customer accounted for 12%).

21
ATI TECHNOLOGIES INC. NOTES TO CONSOLIDATED FINANCIAL STATEMENTS February 28, 2006 (Unaudited)
13. STOCK-BASED COMPENSATION
(i) Stock options
The weighted average estimated fair values at the date of grant for the stock options granted within the three months and six months ended February 28, 2006 were $7.84 and $7.04 per share (2005 - $9.44 and $9.30). The “fair value” of each option granted was estimated on the date of the grant using the Black-Scholes option pricing model with the following weighted average assumptions:
Three months ended Six months ended
February 28 February 28 February 28 February 28
2006 2005 2006 2005
Risk-free interest rate 4.3% 3.6% 3.8% 3.6%
Dividend yield 0.0% 0.0% 0.0% 0.0%
Volatility factor of the expected market price of the Company’s common shares 53.8% 65.5% 55.1% 65.5%
Expected life of the options 4.1 years 4.1 years 4.0 years 4.1 years
The estimated fair value of the stock options is amortized to expense over the options’ vesting period and the related expense for the three months and six months ended February 28, 2006 amounted to $8.7 million and $17.5 million respectively (2005 - $8.6 million and $16.6 million). The stock option expense by functional area is as follows:
(Thousands of US dollars)
Three months ended Six months ended
February 28 February 28 February 28 February 28
2006 2005 2006 2005
Cost of revenues $ 389 $ 472 $ 804 $ 926
Selling and marketing 1,575 1,675 3,243 3,270
Research and development 5,252 5,096 10,535 9,910
Administrative 1,497 1,360 2,939 2,546
Total $ 8,713 $ 8,603 $17,521 $ 16,652

22
ATI TECHNOLOGIES INC. NOTES TO CONSOLIDATED FINANCIAL STATEMENTS February 28, 2006 (Unaudited)
13. STOCK-BASED COMPENSATION (CONTINUED)
(ii) Restricted share units
The Company has adopted three plans to grant restricted share units (“RSUs”) to certain employees and directors as part of its overall stock-based compensation plan. Under the terms of the plans, RSUs vest in accordance with terms determined by the Board of Directors, which terms may include certain performance criteria. Funds advanced by the Company to the trustee to purchase the Company’s common shares in the open market are classified as treasury stock and presented as a reduction of shareholders’ equity in the Company’s consolidated balance sheet. During the three months and six months ended February 28, 2006, 5,839 and 495,142 RSUs vested and were settled by delivery of common shares of the Company to the participants or by cash equivalent to its market value on the vesting date (2005 – nil and 503,903).
During the three months and six months ended February 28, 2006, the numbers of RSUs granted were 11,000 and 46,600, and the numbers of RSUs forfeited were 36,241 and 56,877. As at February 28, 2006, there were 1,626,099 RSUs awarded and outstanding (August 31, 2005 – 2,131,518).
RSU expense by functional areas incurred for the three months and six months ended February 28, 2006 and 2005 is summarized in the following table:
(Thousands of US dollars)
Three months ended Six months ended
February 28 February 28 February 28 February 28
2006 2005 2006 2005
Cost of revenues $ 83 $ 120 ($ 350) $ 653
Selling and marketing 371 219 845 602
Research and development 1,777 1,164 4,156 1,910
Administrative 290 204 778 483
Total $ 2,521 $ 1,707 $ 5,429 $ 3,648
(iii) Deferred share units
The Company has established a plan to grant deferred share units (“DSUs”) to its non-management directors. As at February 28, 2006, there were 132,707 DSUs outstanding of which 129,322 were vested (August 31, 2005 – 132,707 and 109,009).
The expenses for the three months and six months ended February 28, 2006 relating to DSUs granted to the directors for services rendered were $0.1 million and $0.7 million (2005 – $19,000 and $0.6 million).

23
ATI TECHNOLOGIES INC. NOTES TO CONSOLIDATED FINANCIAL STATEMENTS February 28, 2006 (Unaudited)
14. U.S. GAAP
The following table reconciles the net income as reported on the consolidated statements of operations and retained earnings prepared in accordance with Canadian GAAP to the consolidated net income that would have been reported had the consolidated financial statements been prepared in accordance with U.S. GAAP:
(Thousands of US dollars, except per share amounts)
Three months ended Six months ended
February 28 February 28 February 28 February 28
2006 2005 2006 2005
Net income in accordance with Canadian GAAP $ 34,143 $ 57,193 $ 41,769 $120,896
Tax effect of stock options (3,206) (742) (4,987) (3,095)
Expenses related to stock options (i) (700) 7,606 (1,428) 15,255
Stock-compensation recoveries expenses (ii), (iii) - (1,301) - (8,113)
Amortization difference on stock-based compensation (73) - 121 -
Other 28 28 56 56
Net income in accordance with U.S. GAAP $ 30,192 $ 62,784 $ 35,531 $ 124,999
Net income per share:
Basic $ 0.12 $ 0.25 $ 0.14 $ 0.50
Diluted 0.12 $ 0.24 0.14 $ 0.48
Weighted average number of shares (000’s):
Basic 252,332 251,046 251,551 250,036
Diluted 258,203 259,743 257,290 258,830

24
ATI TECHNOLOGIES INC. NOTES TO CONSOLIDATED FINANCIAL STATEMENTS February 28, 2006 (Unaudited) 14. U.S. GAAP (CONTINUED)
(i) Under Canadian GAAP, effective September 1, 2004, the Company adopted the fair value method of recognizing stock-based compensation. For U.S. GAAP purposes, prior to September 1, 2005, the Company accounted for its stock options under the provisions of the Accounting Principles Board Opinion No. 25, “Accounting for Stock Issued to Employees” and related interpretations. Accordingly, the Company recognized stock-based compensation expense based on intrinsic value under U.S. GAAP prior to fiscal 2006. Effective September 1, 2005, the Company adopted the fair value recognition provisions of SFAS 123(R), Share-Based Payment, using the modified-prospective transition method. Under this transition method, compensation cost recognized in the three months and six months ended February 28, 2006 includes the following: (a) compensation expense related to any stock-based payments granted prior to, but not yet vested as of August 31, 2005, and (b) compensation expense for any stock-based payments granted subsequent to August 31, 2005, based on the grant-date fair value estimated in accordance with the provisions of SFAS 123(R). Operating results for prior periods have not been restated.
The Company estimates the fair value of the options at the grant date using the Black-Scholes-Merton closed-form option pricing model and amortizes that value to expense over the options’ vesting periods. The Company treats grants with graded vesting as a series of awards. The weighted-average estimated fair values at the date of grant for the stock options granted within the three months and six months ended February 28, 2006 were $7.84 and $7.04 per share respectively (2005 – $9.44 and $9.30). The weighted-average assumptions used to determine the fair value, with respect to risk-free interest rate, dividend yield, volatility factor and expected life, are the same as those under the Canadian GAAP (Note 13(i)).
Had the Company adopted the fair value based method for accounting for stock-based compensation in all periods presented, the Company’s net income and net income per share under U.S. GAAP would have been reported as the pro forma amounts indicated below:
(Thousands of US dollars, except per share amounts)
Three months ended Six months ended
February 28, 2005 February 28, 2005
Net income for the period
As reported $ 62,784 $ 124,999
Pro forma adjustment for Stock-based compensation (8,295) (11,390)
$ 54,489 $ 113,609
Basic net income per share
As reported $ 0.25 $ 0.50
Pro forma $ 0.22 $ 0.45
Diluted net income per share
As reported $ 0.24 $ 0.48
Pro forma $ 0.21 $ 0.44
(ii) Under U.S. GAAP, options granted after January 18, 2001 with an exercise price denominated in a currency other than the currency of the primary economic environment of either the employer or the employee, should be accounted for under the variable accounting method. Under Canadian GAAP, there is no equivalent requirement. There were no such options granted after February 28, 2002.

25
ATI TECHNOLOGIES INC. NOTES TO CONSOLIDATED FINANCIAL STATEMENTS February 28, 2006 (Unaudited)
14. U.S. GAAP (CONTINUED)
(iii) Under U.S. GAAP, the intrinsic value of the stock options issued under an incentive plan entered into in July 2002 is calculated as the increase in the Company’s stock price between the grant date and the date on which all the conditions of the specified business arrangement were determined to have been met. The compensation expense is recognized over the vesting period of the options. Under Canadian GAAP, there is no equivalent requirement.
15. LITIGATION
(i) American Video Graphics, LP
In August 2004, American Video Graphics LP (“AVG”) filed a series of lawsuits in the US District Court for the Eastern District of Texas. The lawsuits allege infringement of several patents by various PC manufacturers, game console manufacturers and game publishers resulting from graphics and graphics processing functionality. Reconfiguration of these suits resulted in a total of six suits. Of these six suits, there are two suits pending against the entire group of PC manufacturers (the “PC Makers Suits”) and two suits pending against the entire group of game console manufacturers (the “Game Console Suits”).
The Company voluntarily intervened in the PC Makers Suits and the Game Console Suits. Two other suppliers of graphics processors also intervened; Intel Corporation (“Intel”) voluntarily intervened in the PC Makers Suits and Nvidia Corporation (“Nvidia”) voluntarily intervened in the PC Makers Suits and Game Console Suits (Company, Intel and Nvidia collectively referred to as the “Intervenors”).
In January 2006, a definitive settlement agreement was approved by the court and entered into by substantially all of the parties (defendants and Intervenors) involved in the PC Makers Suits and Game Console Suits and AVG (two parties, unrelated to the Company, are not part of the definitive agreement and, consequently, claims relating solely to these two entities did survive). As part of the settlement agreement, the Company agreed to make a settlement payment of approximately $8.6 million to AVG. In exchange for the settlement payment from the Company and a confidential sum of monies payable to AVG by the defendants and other Intervenors, the settlement provides, in part, (i) all pending claims and suits will be dismissed with prejudice against the settling defendants and Intervenors, (ii) a license to the entirety of the AVG patent portfolio (which includes, but is not limited to, the patents in the suits) has been granted to the Company and customers and users of all the Company’s products, and (iii) a full and complete waiver of any claim for indemnification that any defendant or Intervenor may have had against any other settling party. Additionally, AVG is entitled to pursue further action against those parties not involved in these suits involving products that do not incorporate graphics processors from the Intervenors (e.g., non-Intervenor graphics processor suppliers).
(ii) U.S. Securities Class Action Lawsuits
In August and September 2005, five class action lawsuits were filed in the United States District Court for the Eastern District of Pennsylvania against the Company and certain of its directors and officers on behalf of shareholders who purchased the Company’s common shares between October 7, 2004 and on or about June 23, 2005. The claims allege that the Company and certain of its directors and officers violated U.S. securities laws by failing to disclose material facts and making statements that contained misrepresentations about its business and future outlook. It is alleged that as a result of the failure to disclose material facts and the alleged misrepresentations, the Company’s stock traded at artificially inflated prices until the stock price dropped on the news of its third quarter results in June of 2005. The claims further allege that, while in possession of material undisclosed information, certain directors and officers sold a portion of their common shares at inflated prices. Currently, two plaintiffs have filed separate motions with the court seeking to be appointed as "lead plaintiff" and to have their choice of counsel approved. The court has yet to decide those motions and thus lead plaintiff or lead plaintiff’s counsel has not yet been selected.

26
ATI TECHNOLOGIES INC. NOTES TO CONSOLIDATED FINANCIAL STATEMENTS February 28, 2006 (Unaudited)
15. LITIGATION (CONTINUED)
(iii) U.S. Shareholder Complaint In August 2005, a shareholder derivative complaint was filed in the Superior Court of the State of California for the County of Santa Clara by an alleged shareholder purporting to act on behalf of the Company. The defendants to the complaint include certain members of the board of directors and certain officers, and the Company itself as nominal defendant. The complaint alleges violations of California law, including breaches of fiduciary duties, abuse of control, gross mismanagement, waste of corporate assets, unjust enrichment and violation of California Corporations Code sections regarding insider trading, during the period between October 2004 and June 2005, based on allegations of inaccurate disclosures and improper trading activity, which allegations are essentially identical to the allegations in the securities class actions noted above. In January 2006, the plaintiff filed an amended complaint that contained the same claims and allegations. The Company and certain directors and officers then responded with motions to dismiss the claims based on the requirements of Canadian law and the inconvenience of the California forum. On February 24, 2006, the court entered an order dismissing six of the seven causes of action with prejudice, which resulted in dismissal of seven of the nine individual defendants. Accordingly, one claim remains in this case, against two defendants for alleged violation of the California insider trading statute. On March 13, 2006, the Company filed a motion to dismiss the outstanding cause of action on the grounds that plaintiff has failed to satisfy the presuit demand pleading requirements under California law. This motion is currently scheduled to be heard by the court on April 27, 2006. This litigation is still at a preliminary stage. The Company currently believes the amount of ultimate liability, if any, with respect to the class action lawsuits and the shareholder complaint will not materially affect its financial position, results of operations, or liquidity. The Company and the named directors and officers intend to defend themselves vigorously. However, the ultimate outcome of any litigation is uncertain and should any of these actions or proceedings against the Company be successful, the Company may be subject to significant damages awards which could have a material adverse effect on its financial condition.
16. SUBSEQUENT EVENT
On March 6, 2006, the Company announced the acquisition of certain assets and employees of Shanghai-based Macrosynergy Technology Co., Ltd. (“Macrosynergy”), an alliance company of XGI Technology Inc. (“XGI”) , as well as certain employees working out of XGI’s Santa Clara, California location for cash consideration of $6.2 million of which $5.6 million has been paid. Macrosynergy specializes in the research and design of multimedia add-in boards for personal computers.
Copyright © 2022 FDOKUMEN