Association of vitamin D deficiency with incidence of type 2 diabetes in high-risk Asian subjects
8
QUERIES -ajcn048496q [AQ1] Will reprints be available? [AQ2] Please confirm or correct the insertion of “(plus/minus)SD” in two places in the abstract. [AQ3] Can GAD be expanded here? [AQ4] Is “,10.0 ng/mL (75 nmol/L)” correct here? Is there a category for 25(OH)D concentration 10–15 ng/mL? [AQ5] Ref 27: provide the date accessed.
-
Upload
independent -
Category
Documents
-
view
0 -
download
0
Transcript of Association of vitamin D deficiency with incidence of type 2 diabetes in high-risk Asian subjects

QUERIES -ajcn048496q[AQ1] Will reprints be available?
[AQ2] Please confirm or correct the insertion of “(plus/minus)SD” in two places in the abstract.
[AQ3] Can GAD be expanded here?
[AQ4] Is “,10.0 ng/mL (75 nmol/L)” correct here? Is there a category for 25(OH)D concentration 10–15 ng/mL?
[AQ5] Ref 27: provide the date accessed.
Admini
설명선
[AQ1] Will reprints be available? => Yes. [AQ2] Please confirm or correct the insertion of “(plus/minus)SD” in two places in the abstract. => Yes, it is correct. [AQ3] Can GAD be expanded here? => glutamic acid decarboxylase (GAD) [AQ4] Is “,10.0 ng/mL (75 nmol/L)” correct here? Is there a category for 25(OH)D concentration 10 -15 ng/mL? => It should be "< 15.0 ng/mL (37.5 nmol/L)". [AQ5] Ref 27: provide the date accessed. => 15-NOV-2012

Association of vitamin D deficiency with incidence of type 2 diabetes inhigh-risk Asian subjects1–4
Soo Lim, Min Joo Kim, Sung Hee Choi, Chan Soo Shin, Kyong Soo Park, Hak Chul Jang, Liana K Billings,and James B Meigs
ABSTRACTBackground: Recent studies suggest an association between 25-hydroxyvitamin D [25(OH)D] and type 2 diabetes (T2D) risk. How-ever, prospective studies investigating the relation between vitaminD inadequacy and incidence of T2D incorporating obesity and dy-namic measures of insulin resistance (IR) and pancreatic b cellfunction are limited.Objective: We tested the hypothesis that baseline 25(OH)D is as-sociated with the incidence of T2D in high-risk subjects for up to 5y of follow-up, independently of obesity, baseline IR, and b cellfunction.Design: We recruited 1080 nondiabetic½AQ2� Korean subjects [mean(6SD) age: 49.5 6 11.4 y] based on the presence of one or morerisk factors for T2D, including obesity, hypertension, dyslipidemia,and/or family history of T2D. We measured anthropometric andbiochemical indicators, HOMA2-IR, and the insulinogenic index(IGI; calculated as change in insulin at 30 min/change in glucoseat 30 min) from a 75-g oral-glucose-tolerance test.Results: Of the participants, 10.5% had a serum 25(OH)D defi-ciency (,10 ng/mL), 51.6% had an insufficiency (10.0–19.9 ng/mL), and 38.0% had a sufficiency ($20 ng/mL), and the incidenceof T2D at 32.3 6 15.6 mo (6SD) declined accordingly: 15.9%,10.2%, and 5.4%, respectively (P , 0.001). After adjustment forage, sex, blood pressure, lifestyles, family history, season, parathy-roid hormone, and high-sensitivity C-reactive protein, the partici-pants with 25(OH)D deficiency had an increased risk of T2Dindependently of BMI, HOMA2-IR, and IGI; the HRs were 2.06for 25(OH)D 10–19.9 ng/mL compared with $20 ng/mL (95% CI:1.22, 3.49) and 3.23 for 25(OH)D ,10 ng/mL compared with $20ng/mL (95% CI: 1.66, 6.30).Conclusion: The current prospective study suggests that vitamin Dmetabolism may play a role in T2D pathogenesis independently ofknown risk factors. This trial was registered at clinicaltrials.gov asNCT01508481. Am J Clin Nutr 2013;97:1–7.
INTRODUCTION
Cross-sectional studies have shown that 25-hydroxyvitamin D[25(OH)D]5 concentration, a commonly used marker for vitaminD status, is lower in individuals with type 2 diabetes (T2D) andimpaired glucose tolerance than in those with normal glucosetolerance (1, 2). Prospective studies have shown a significantinverse association between baseline serum 25(OH)D and in-cident diabetes (3–11). In some studies, the association persistedafter adjustment for T2D risk factors such as obesity, fasting
glucose, and hypertension (3, 5, 6, 9, 11), whereas in otherstudies the association was attenuated or disappeared after ad-justment for other T2D risk factors, such as BMI (7, 8, 10).
The mechanisms whereby low 25(OH)D concentrations in-crease T2D risk are not well understood. Cross-sectional studieshave reported associations of 25(OH)D with insulin resistance(12, 13) and b cell function (14, 15), whereas others have notfound an association (16, 17). The aforementioned prospectivestudies did not adjust for specific glycemic measures of insulinsecretion or insulin sensitivity. A few prospective studies to datehave shown an association between baseline 25(OH)D and fu-ture insulin resistance as measured on the basis of the HOMA-IR (4, 11, 18) and fasting insulin concentration (4). A most re-cent study by Kayaniyil et al (18), who examined the in-sulinogenic index (IGI) adjusted for insulin resistance, foundthat higher baseline 25(OH)D predicted better b cell functionand decreased progression to T2D; however, this associationwas not significant after adjustment for BMI. Thus, the influenceof vitamin D on diabetes risk after the effects of insulin secre-
1 From Internal Medicine, Seoul National University College of Medicine
and Seoul National University Bundang Hospital, Seongnam, Korea (SL,
MJK, SHC, and HCJ); Internal Medicine Seoul National University College
of Medicine, Seoul, Korea (CSS and KSP); and Diabetes Research Center
(LKB), General Medicine Division (SL and JBM), Department of Medicine,
Massachusetts General Hospital and Harvard Medical School, Boston, MA.2 SL and MJK contributed equally to this study.3 Supported by the National Research Foundation grant funded by the
Korean government (2006-2005410), Seoul National University Bundang
Hospital, and Seoul Research & Business Development program, Republic
of Korea (10526). JBM was supported by the National Institute for Diabetes
and Digestive and Kidney Diseases (NIDDK) K24 DK080140. LKB was
supported by the Endocrine Society’s Lilly Endocrine Scholar’s Award, NIH
Loan Repayment Award, NIDDK 1 L30 DK089944-01, and a Distinguished
Clinical Scientist Award to David Altshuler from the Doris Duke Charitable
Foundation.4 Address correspondence to ½AQ1�HC Jang, Department of Internal Medicine,
Seoul National University College of Medicine and Seoul National Univer-
sity Bundang Hospital, 300, Gumi-dong, Bundang-gu, Seongnam, Korea
463-707. E-mail: [email protected] Abbreviations used: Hb A1c, glycated hemoglobin; hsCRP, high-sensitiv-
ity C-reactive protein; IGI, insulinogenic index; iPTH, intact parathyroid
hormone; OGTT, oral-glucose-tolerance test; SNUBH, Seoul National Uni-
versity Bundang Hospital; T2D, type 2 diabetes; 25(OH)D, 25-hydroxyvita-
min D.
Received July 31, 2012. Accepted for publication December 3, 2012.
doi: 10.3945/ajcn.112.048496.
Am J Clin Nutr 2013;97:1–7. Printed in USA. � 2013 American Society for Nutrition 1
tion, insulin sensitivity, and overall adiposity are accounted foris not clearly understood.
Few studies have examined the association in high-risk pop-ulations, in whom preventive interventions are most likely to betargeted (7, 18). Asian populations are of special interest becausevitamin D deficiency is common and the diabetes burden isincreasing (19, 20). In this prospective study, we aimed to in-vestigate the association between 25(OH)D status and T2D in-cidence, independent of obesity and specific baseline measures ofinsulin resistance and b cell function, in 1080 nondiabetic Ko-rean subjects at high risk of diabetes development.
SUBJECTS AND METHODS
Study population
More than 10,000 people underwent a routine physical checkat our institution, the Seoul National University Bundang Hos-pital (SNUBH), Seongnam, Korea, in 2006. Of them, we con-secutively included 1487 men and women aged 30–69 y who hadcardiometabolic risk factors and gave their informed consent tothe Biomarkers on Glucose Metabolism and CardiovascularRisk study. The study participants in this study were from allover South Korea: the approximate geographic coordinates ofSouth Korea are 338 to 388 North and 1248 to 1318 East. Thegoal of the Biomarkers on Glucose Metabolism and Cardio-vascular Risk Study was to investigate associations betweenbiomarkers and incidence rates of T2D in subjects at high risk ofT2D.
After 257 participants with T2D diagnosed on the basis ofglycated hemoglobin (Hb A1c) $6.5% were excluded, non-diabetic participants with one or more risk factors for diabetes—including overweight [defined as a BMI (in kg/m2) $ 25; 55.0%of all recruited participants], hypertension [defined on the basisof the Joint National Committee 7 report (21) as $140 (systolicblood pressure)/90 (diastolic blood pressure) mm Hg or the useof antihypertensive medications; 19.5% of all recruited partici-pants], dyslipidemia [defined by high triglycerides (.150 mg/dL) or low HDL cholesterol (,40 mg/dL in men and ,50 mg/dL in women) or lipid-lowering-medication use; 21.1% of allrecruited participants], a family history of diabetes (6.8% of allrecruited participants), and/or prediabetes (defined as Hb A1c
ranging from 6.0 to 6.4%; 2.1% of all recruited participants)—were included. At baseline and follow-up, we used Hb A1c in-stead of fasting plasma glucose or postprandial 2-h glucose todiagnosis diabetes, because the variability of Hb A1c is less thanthat of fasting plasma glucose or 2-h plasma glucose (22).
In this cohort, 14.2% of participants were taking antihyper-tensive medications: 89 (8.2%) were taking calcium channelblockers, 59 (5.5%) angiotensin-converting enzyme inhibitors orangiotensin II receptor blockers, 28 (2.6%) b-blockers, 24(2.2%) diuretics, and 6 (0.6%) other drugs. For lipid control,10.9% of participants were taking lipid-lowering medications:97 (9.0%) were taking statins, 19 (1.8%) fibrates, 3 (0.3%) ni-acin, 4 (0.4%) omega-3 (n23) fatty acids, and 2 (0.2%) othermedications. Totals of 4.9% and 0.7% of participants weretaking more than one antihypertensive medication (n = 53) orlipid-lowering medication (n = 8), respectively; 8.4% of par-ticipants (n = 91) were taking both antihypertensive and lipid-lowering medications.
In addition, 150 participants were excluded because they weretaking vitamin D supplements. Finally, 1080 participants wereenrolled at baseline. Participants were assessed at 6-mo intervalsfor up to 5 y (from 1 January 2007 to 31 December 2011) tocollect data on development of T2D and fasting plasma glucose,Hb A1c, and lipid concentrations. Use of vitamin D supplementswas also checked at every 6-mo visit. This study was approvedby the SNUBH’s institutional review board. Written informedconsent was obtained from every participant.
Primary endpoint
The primary endpoint was the development of T2D, which wasdefined as Hb A1c $6.5% based on one of the American Di-abetes Association’s diagnosis criteria for diabetes (22). Hb A1c
was measured with a Bio-Rad Variant II Turbo HPLC analyzerin SNUBH—a National Glycohemoglobin StandardizationProgram level II-certified laboratory. We excluded 5 participantswith type 1 diabetes by measuring GAD ½AQ3�antibody (.1 unit/mL)for cases who had typical symptoms, including extreme thirst,increased hunger, frequent urination, and unexplained weightloss and fatigue with sudden onset.
25(OH)D Concentration as a primary exposure
To assess vitamin D status (23), serum 25(OH)Dwas measuredby using Diels-Alder derivatization and ultraperformance liquidchromatography–tandem mass spectrometry (Waters)—a goldstandard for evaluating 25(OH)D concentration (24). Total 25(OH)D was summed from 25(OH)D2 and 25(OH)D3. Calibra-tion with standard reference material 972 from the NationalInstitute of Standards and Technology was done, and the intra-assay and interassay CVs were 4.0% and 7.7% at 29.0 ng/mL,respectively. We also recorded dates of 25(OH)D measurementand categorized them into 4 seasons: spring (MarchzMay),summer (JunezAugust), fall (SeptemberzNovember), andwinter (DecemberzFebruary). In the current study, 20 ng/mL25(OH)D was used as a cutoff for vitamin D sufficiency ac-cording to the recommendation from the WHO and more re-cently the Institute of Medicine (25, 26).
Confounding clinical and biochemical exposures
Height, body weight, waist circumference, and BMI weremeasured by using standard methods. Blood pressure measure-ments were made after participants were seated for 10 min.Measurements were made twice, with a 5-min rest period be-tween measurements, and the mean value of measurements wasused.
Smoking status was divided into 3 categories: current smokers(if the subjects smoked currently for $1 y), nonsmokers (if thesubjects never smoked), and ex-smokers (if the subjects hadquit). Alcohol intake was assessed by questioning patients abouthow often they usually drank beer, spirits, sake, or wine duringthe most recent 12 mo, quantified according to the followingcategories: 1) almost every day, 2) 3–4 d/wk, 3) once or twicea week, 4) once or twice a month, or 5) never in the past year.Patients were also asked how much they usually drank ona drinking day (reported in mL). Alcohol intake (in g alcohol/wk) was determined by multiplying the weekly intake of eachalcoholic beverage by its ethanol content (beer 5%, spirits 40%,
2 LIM ET AL
sake 12%, and wine 12%), which was categorized into 3 cate-gories: abstinent (,20.0 g/wk), mild to moderate (20.0–199.9 g/wk), or heavy ($200 g/wk) drinker.
Participants’ involvement in leisure and sport activities (eg,walking, jogging, running, aerobics, dancing, yoga, cycling,hiking, climbing, skating, swimming, table tennis, badminton,tennis, basketball, soccer, and golf) were surveyed for physicalactivity, which was classified into 3 categories: none, irregular(1–2 times/wk), and regular ($3 times/wk) exercise or used asa continuous variable. One bout of exercise was defined as ex-ercising for $30 min.
In a 12-h fasting state, a 75-g oral-glucose-tolerance test(OGTT) was done at baseline. Fasting and postglucose load at 30min and 2-h glucose and fasting and postglucose load at 30 mininsulin concentrations were measured. Plasma glucose concen-trations were measured with a Hitachi 747 chemistry analyzer,and plasma insulin concentrations were measured by radioim-munoassay (Linco). The fasting concentrations of triglyceridesand HDL were measured by using the Hitachi 747 chemistryanalyzer. High-sensitivity C-reactive protein (hsCRP) concen-trations were measured by immunonephelometry (Dade Behr-ing). Circulating concentrations of intact parathyroid hormone(iPTH) were measured by using an electrochemiluminescenceimmunoassay on the Modular Analytics E170 platform (Roche).
Mediating physiologic exposures
To evaluate insulin resistance, HOMA2-IR was calculatedfrom fasting glucose and insulin concentrations as reportedpreviously (27). Pancreatic b cell function was evaluated bytaking the IGI, which was calculated by the ratio of 30-mininsulin minus fasting insulin to 30-min glucose minus fastingglucose (Dinsulin30/Dglucose30) (28) and has been validatedagainst the gold standard measures of insulin secretion (first-phase insulin secretion on intravenous glucose tolerance testing)(29).
Statistical analysis
All data are presented as means 6 SDs and were analyzed byusing SPSS Windows version 17.0 (SPSS Inc). Triglyceride andhsCRP concentrations were normalized by logarithmic trans-formation. The differences in continuous variables between 25(OH)D classifications were tested by using ANOVA followed byTukey’s multiple-comparison test. Categorical variables werecompared by the linear-by-linear association analysis. Correla-tions between variables were analyzed by using Pearson corre-lation. The HRs of 25(OH)D on T2D risk were determined byusing the Cox proportional hazard models, with T2D incidenceas the dependent variable. The following variables were in-cluded as independent variables in model 1: age, sex, systolicblood pressure, physical activity, family history of T2D, smok-ing status, alcohol consumption, antihypertensive medicationuse, lipid-lowering-medication use, season at 25(OH)D mea-surement, Hb A1c, log-transformed triglycerides, HDL choles-terol, iPTH, and log-transformed hsCRP. In model 2, BMI wasadditionally adjusted for. In model 3, HOMA2-IR and IGI wereadditionally adjusted to the model 2. Significance was defined as2-sided P , 0.05.
RESULTS
Comparison of variables at baseline according to 25(OH)Dcategories
The current study participants were aged 49.5 6 11.4 y, and46.2% were men. The concentration of 25(OH)D was 19.6 69.3 ng/mL. The 25(OH)D concentrations measured in winterwere similar to those measured in other seasons: 19.1 6 8.4 ng/mL in winter, 19.4 6 9.1 ng/mL in spring, 20.0 6 9.9 ng/mL insummer, and 20.1 6 9.9 ng/mL in fall.
In Table 1, the clinical characteristics and biochemical vari-ables are compared according to 25(OH)D categories:$20.0 ng/mL (50 nmol/L; sufficient) compared with 10.0–19.9 ng/mL(25z50 nmol/L; insufficient) compared with ,10.0 ng/mL (25nmol/L; deficient). These cutoff values were suggested by theWHO and Institute of Medicine (25, 26). No significant differ-ences in Hb A1c and fasting glucose and insulin concentrationsobtained during the OGTT were found between the 3 groups.Postglucose load 30-min insulin concentrations were higher inparticipants with 25(OH)D sufficiency than in those with 25(OH)D insufficiency or deficiency. The participants in the 25(OH)D sufficient group had a higher IGI and a lower HOMA2-IR than did those in the 25(OH)D-insufficient or -deficientgroups.
The correlation analysis showed that the serum 25(OH)Dconcentration correlated negatively with fasting and postload 30-min insulin concentrations, HOMA2-IR, iPTH, and hsCRP andpositively with serum calcium and IGI (all P , 0.05) (seeSupplementary Table 1 under “Supplemental data” in the onlineissue).
Primary outcome: incidence of T2D
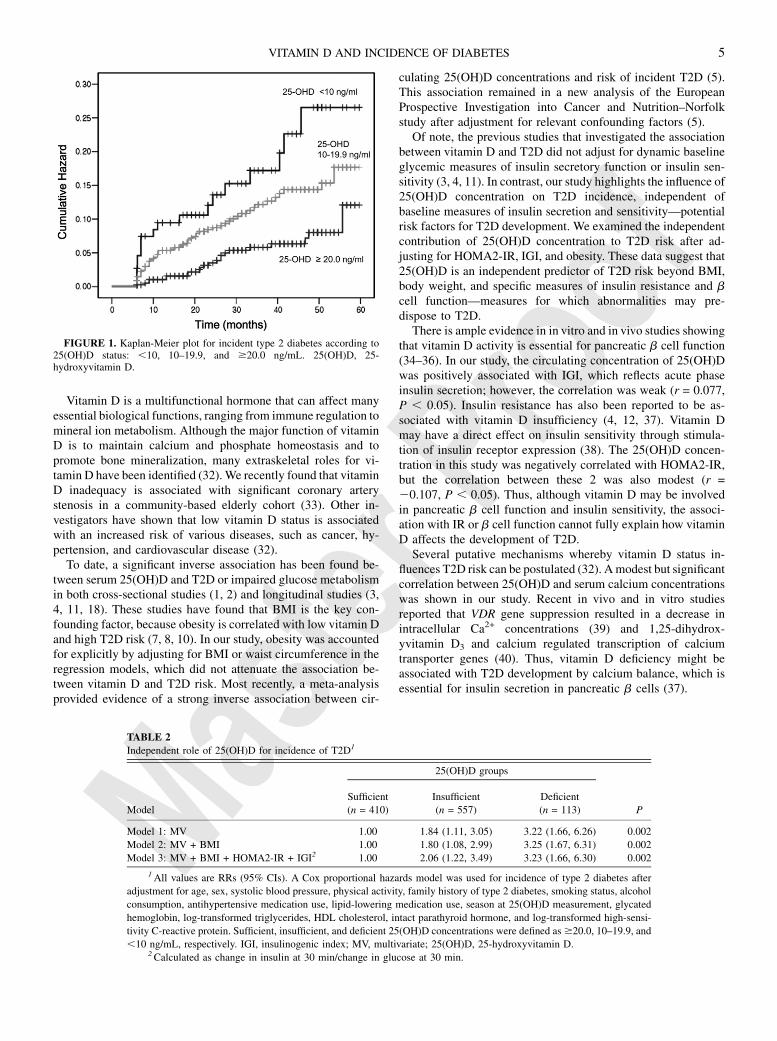
Of the 1080 participants, 97 (9.0%) developed T2D over 32.36 15.6 mo of observation. The incidence rates of T2D, definedas Hb A1c $ 6.5%, were 15.9%, 10.2%, and 5.4% in the 25(OH)D-deficient, -insufficient, and -sufficient groups, respectively (P, 0.01). Kaplan-Meier analysis showed a higher probability ofdeveloping T2D in participants in the 25(OH)D-deficient groupthan in those in the 25(OH)D-insufficient or 25(OH)D-sufficientgroup (P , 0.01) (Figure 1).
Using the Cox proportional hazard model, we further in-vestigated the independent role of 25(OH)D concentration inT2D development during the 5-y follow-up period (Table 2). Nosubject died before T2D development. In model 1, participantswith 25(OH)D insufficiency and deficiency had a higher in-cidence of T2D than did those with 25(OH)D sufficiency: theHRs were 1.85 and 3.40, respectively. In model 2, in which BMIwas additionally adjusted for, the significant associations be-tween 25(OH)D concentration and incidence of T2D weremaintained: HRs for the 25(OH)D-insufficient and -deficientgroups were 1.81 and 3.42, respectively. When waist circum-ference was adjusted instead of BMI, because waist circumfer-ence is known to better reflect visceral obesity, the significantassociations between 25(OH)D concentration and incidence ofT2D were maintained. In model 3, we further adjusted forHOMA2-IR and IGI and found the association between 25(OH)D concentration and incidence of T2D independently of these 2important risk factors for T2D. In all models, baseline Hb A1c
concentration was the strongest significant predictor for
VITAMIN D AND INCIDENCE OF DIABETES 3

incidence of T2D. Current smoking status, high BMI, HOMA2-IR, and IGI were also significantly associated with the incidenceof T2D (P value: 0.001–0.033).
On the basis of the 75-g OGTT result at baseline, 48.7% and20.5% of participants in this study were classified as IFG (fastingglucose concentration = 100–125 mg/dL) and IGT (postload 2-hglucose concentration = 140–199 mg/dL), respectively. Whenthe interaction term IFG/IGT 3 25(OH)D category was in-cluded in the final Cox proportional hazards model, this in-teraction term had no statistically significant role in thedevelopment of T2D. When hazard models were performedseparately in men and women, the HRs were slightly increased,except in men in the 25(OH)D-insufficient group (see Supple-mentary Table 2 under “Supplemental data” in the online issue).
When 25(OH)D $30.0 ng/mL (75 nmol/L), 15.0–29.9 ng/mL(37.5z75 nmol/L), and ,10.0 ng/mL (75 nmol/L) were½AQ4� usedfor vitamin D sufficiency, insufficiency, and deficiency, re-spectively, on the basis of previous studies (30, 31), the HRs forthe 25(OH)D-insufficient and -deficient groups compared withthe 25(OH)D-sufficient group were 2.17 and 3.02, respectively
(see Supplementary Table 3 under “Supplemental data” in theonline issue).
When quartiles of 25(OH)D concentrations were used insteadof current 25(OH)D categories, a similar but attenuated trend wasfound between 25(OH)D status and incidence of T2D (HR oflowest quartile compared with highest quartile: 2.41; 95% CI:1.21, 5.75). The fact that the highest-quartile 25(OH)D group(24.5–60.4 ng/mL) overlapped with our defined 25(OH)D-in-sufficient group may explain the slightly attenuated findings.When 56 participants who had taken vitamin D supplements for.3 mo during the follow-up period were excluded in the hazardmodels, similar results were obtained.
DISCUSSION
In this study of an Asian population at high risk of T2D, weshowed that the participants with 25(OH)D deficiency had anincidence of T2D development 3.4 times that in those withsufficient levels, even after adjustment for obesity, dynamicmeasure of insulin resistance and pancreatic b cell function, andother known risk factors for T2D.
TABLE 1
Comparison of anthropometric and biochemical variables according to sufficient, insufficient, or deficient 25(OH)D
concentrations1
25(OH)D status
Sufficient (n = 410) Insufficient (n = 557) Deficient (n = 113)
25(OH)D (ng/mL) 29.2 6 7.92 14.9 6 2.7 8.2 6 1.3
Age (y) 49.5 6 10.9 49.5 6 11.5 49.2 6 13.0
Men (%)3 56.6 43.3 23.0
BMI (kg/m2) 25.0 6 3.4 25.3 6 3.5 25.0 6 3.7
Waist circumference (cm) 88.1 6 9.3 88.5 6 9.5 88.8 6 9.8
SBP (mm Hg) 127.2 6 14.1 128.0 6 15.5 128.8 6 16.8
DBP (mm Hg) 78.7 6 10.5 78.7 6 11.2 78.4 6 12.5
Calcium (mg/dL) 9.1 6 0.6 9.1 6 0.5 9.0 6 0.5
Fasting glucose (mg/dL) 104.8 6 15.3 105.0 6 15.3 105.9 6 16.2
Postload 30-min glucose (mg/dL) 208.5 6 57.8 214.1 6 49.3 242.7 6 70.1
Postload 2-h glucose (mg/dL) 149.1 6 26.5 152.1 6 28.2 152.2 6 28.7
Fasting insulin (mIU/mL) 9.8 6 3.6 10.6 6 4.6 11.2 6 4.6
Postload 30-min insulin (mIU/mL) 37.4 6 14.0*,y 32.4 6 15.1 30.3 6 15.2
Hb A1c (%) 5.8 6 0.4 5.8 6 0.4 5.9 6 0.4
Insulinogenic index4 0.29 6 0.18*,y 0.26 6 0.20y 0.20 6 0.15
HOMA2-IR5 1.3 6 0.5*,y 1.4 6 0.6y 1.5 6 0.6
Triglycerides (mg/dL)5 154.8 6 105.1 148.3 6 104.2 146.4 6 96.5
HDL cholesterol (mg/dL) 55.6 6 13.3 55.3 6 13.9 54.3 6 12.6
hsCRP (mg/dL)5 0.19 6 0.85*,y 0.46 6 1.16 0.52 6 1.42
iPTH (pg/mL) 28.7 6 13.6*,y 35.4 6 14.2y 44.2 6 25.0
Physical activity (bout/wk) 3.6 6 1.9*,y 2.6 6 2.1 1.9 6 1.5
Family history of diabetes (%)3 27.8 28.2 25.7
Current smoker (%)3 13.4 14.9 14.2
Heavy drinker (%)3 9.5 12.6 9.7
Regular exercise (%)3 25.1 19.4 18.6
1 Sufficient, insufficient, and deficient 25(OH)D concentrations were defined as $20.0, 10–19.9, and ,10 ng/mL,
respectively. *Significantly different from insufficient, P , 0.05 (ANOVA followed by Tukey’s multiple-comparison test).ySignificantly different from deficient, P , 0.05 (ANOVA followed by Tukey’s multiple-comparison test). DBP, diastolic
blood pressure; Hb A1c, glycated hemoglobin; hsCRP, high-sensitivity C-reactive protein; iPTH, intact parathyroid hor-
mone; SBP, systolic blood pressure; 25(OH)D, 25-hydroxyvitamin D.2Mean 6 SD (all such values).3Comparison between 25(OH)D groups was performed by linear-by-linear association.4Calculated as change in insulin at 30 min/change in glucose at 30 min.5Log-transformed values were used for comparison.
4 LIM ET AL
Vitamin D is a multifunctional hormone that can affect manyessential biological functions, ranging from immune regulation tomineral ion metabolism. Although the major function of vitaminD is to maintain calcium and phosphate homeostasis and topromote bone mineralization, many extraskeletal roles for vi-tamin D have been identified (32). We recently found that vitaminD inadequacy is associated with significant coronary arterystenosis in a community-based elderly cohort (33). Other in-vestigators have shown that low vitamin D status is associatedwith an increased risk of various diseases, such as cancer, hy-pertension, and cardiovascular disease (32).
To date, a significant inverse association has been found be-tween serum 25(OH)D and T2D or impaired glucose metabolismin both cross-sectional studies (1, 2) and longitudinal studies (3,4, 11, 18). These studies have found that BMI is the key con-founding factor, because obesity is correlated with low vitamin Dand high T2D risk (7, 8, 10). In our study, obesity was accountedfor explicitly by adjusting for BMI or waist circumference in theregression models, which did not attenuate the association be-tween vitamin D and T2D risk. Most recently, a meta-analysisprovided evidence of a strong inverse association between cir-
culating 25(OH)D concentrations and risk of incident T2D (5).This association remained in a new analysis of the EuropeanProspective Investigation into Cancer and Nutrition–Norfolkstudy after adjustment for relevant confounding factors (5).
Of note, the previous studies that investigated the associationbetween vitamin D and T2D did not adjust for dynamic baselineglycemic measures of insulin secretory function or insulin sen-sitivity (3, 4, 11). In contrast, our study highlights the influence of25(OH)D concentration on T2D incidence, independent ofbaseline measures of insulin secretion and sensitivity—potentialrisk factors for T2D development. We examined the independentcontribution of 25(OH)D concentration to T2D risk after ad-justing for HOMA2-IR, IGI, and obesity. These data suggest that25(OH)D is an independent predictor of T2D risk beyond BMI,body weight, and specific measures of insulin resistance and bcell function—measures for which abnormalities may pre-dispose to T2D.
There is ample evidence in in vitro and in vivo studies showingthat vitamin D activity is essential for pancreatic b cell function(34–36). In our study, the circulating concentration of 25(OH)Dwas positively associated with IGI, which reflects acute phaseinsulin secretion; however, the correlation was weak (r = 0.077,P , 0.05). Insulin resistance has also been reported to be as-sociated with vitamin D insufficiency (4, 12, 37). Vitamin Dmay have a direct effect on insulin sensitivity through stimula-tion of insulin receptor expression (38). The 25(OH)D concen-tration in this study was negatively correlated with HOMA2-IR,but the correlation between these 2 was also modest (r =20.107, P , 0.05). Thus, although vitamin D may be involvedin pancreatic b cell function and insulin sensitivity, the associ-ation with IR or b cell function cannot fully explain how vitaminD affects the development of T2D.
Several putative mechanisms whereby vitamin D status in-fluences T2D risk can be postulated (32). Amodest but significantcorrelation between 25(OH)D and serum calcium concentrationswas shown in our study. Recent in vivo and in vitro studiesreported that VDR gene suppression resulted in a decrease inintracellular Ca2+ concentrations (39) and 1,25-dihydrox-yvitamin D3 and calcium regulated transcription of calciumtransporter genes (40). Thus, vitamin D deficiency might beassociated with T2D development by calcium balance, which isessential for insulin secretion in pancreatic b cells (37).
FIGURE 1. Kaplan-Meier plot for incident type 2 diabetes according to25(OH)D status: ,10, 10–19.9, and $20.0 ng/mL. 25(OH)D, 25-hydroxyvitamin D.
TABLE 2
Independent role of 25(OH)D for incidence of T2D1
25(OH)D groups
Model
Sufficient
(n = 410)
Insufficient
(n = 557)
Deficient
(n = 113) P
Model 1: MV 1.00 1.84 (1.11, 3.05) 3.22 (1.66, 6.26) 0.002
Model 2: MV + BMI 1.00 1.80 (1.08, 2.99) 3.25 (1.67, 6.31) 0.002
Model 3: MV + BMI + HOMA2-IR + IGI2 1.00 2.06 (1.22, 3.49) 3.23 (1.66, 6.30) 0.002
1All values are RRs (95% CIs). A Cox proportional hazards model was used for incidence of type 2 diabetes after
adjustment for age, sex, systolic blood pressure, physical activity, family history of type 2 diabetes, smoking status, alcohol
consumption, antihypertensive medication use, lipid-lowering medication use, season at 25(OH)D measurement, glycated
hemoglobin, log-transformed triglycerides, HDL cholesterol, intact parathyroid hormone, and log-transformed high-sensi-
tivity C-reactive protein. Sufficient, insufficient, and deficient 25(OH)D concentrations were defined as$20.0, 10–19.9, and
,10 ng/mL, respectively. IGI, insulinogenic index; MV, multivariate; 25(OH)D, 25-hydroxyvitamin D.2Calculated as change in insulin at 30 min/change in glucose at 30 min.
VITAMIN D AND INCIDENCE OF DIABETES 5
The concentration of 25(OH)D was negatively correlated withhsCRP in the current study. A study in humans showed that theserum 25(OH)D status was inversely related to the tumor necrosisfactor-a concentration (41). Another experimental study sug-gested that a low 25(OH)D concentration influences the activityor expression of macrophages and lymphocytes (42). These datasuggest a close link between 25(OH)D concentration and in-flammatory process and could suggest a potential mechanism bywhich vitamin D may be involved in T2D development.
In the current study, we used 20 ng/mL 25(OH)D as a cutoff forvitamin D sufficiency because the WHO and, more recently, theInstitute of Medicine have suggested the use of 20 ng/mL as anadequate cutoff value (25, 26). Recent studies have adopted thisvalue more (43, 44). Indeed, a recent study found that 20 ng/mL25(OH)D was associated with an increased risk of relevantclinical diseases, including hip fracture, myocardial infarction,and death (45).
This study had several strengths. First, we assessed IGI,a dynamic estimate of first-phase insulin secretion, which hasbeen validated from healthy subjects to diverse phenotypes (46,47). Second, the serum 25(OH)D concentration was measured byultraperformance liquid chromatography–tandem mass spec-trometry, which was calibrated at the National Institute ofStandards and Technology. Third, the iPTH concentration,which is important but not commonly measured, was adjusted.Inadequate vitamin D usually leads to increased iPTH, which inturn is inversely associated with insulin sensitivity (48). Last,this study was performed in high-risk subjects of Asian eth-nicity. Most previous studies were done in healthy subjects (6,8–11), and the study subjects consisted of predominantly whitepopulations. Indeed, vitamin D insufficiency was 62% (85%when 30 ng/mL was used as the cutoff) in the current study,similar to that in other Asian countries, which indicated that upto 70% of the general population had vitamin D insufficiency,defined as 30 ng/mL 25(OH)D (19). This may represent a publichealth problem, considering the numerous complications anddiseases associated with vitamin D deficiency (49).
Our study also had limitations. Although a sophisticatedfunction to assess b cell function, such as IGI, was used, the goldstandard technique (ie, a clamp study) was not used. We had nodata on b cell function or insulin resistance at follow-up. Dataon sun exposure time, use of sunscreen, and dietary habits werenot captured. Last, there was a possibility of unmeasured con-founding underlying the association between vitamin D anddiabetes, which precluded conclusions about causality.
In conclusion, our data illustrate an independent associationbetween 25(OH)D and T2D incidence in the prospective study ofthe relation between vitamin D status, T2D, and dynamic gly-cemic traits. Evaluation of vitamin D deficiency and its potentialhealth effects is particularly important because 25(OH)D con-centrations are lower than recommended in many countrieswhose diabetes burden is also highly prevalent (20, 49).
Although vitamin D deficiency is increasing, screening andtreating the condition is relatively simple and inexpensive. Ad-ditional interventional trials are needed to assess whether in-creasing vitamin D concentrations through vitamin D–fortifieddiets or supplementation may prevent or mitigate the conse-quences of vitamin D deficiency on T2D risk.
The authors’ responsibilities were as follows—SL: guarantor of this work,
had full access to all the data, and takes full responsibility for the integrity of
data and the accuracy of data analysis; SL, MJK, and HCJ: conducted the
data research, contributed to the discussion, and wrote, reviewed, and edited
the manuscript; and SHC, CSS, KSP, LKB, and JBM: reviewed and edited
the manuscript and contributed to the discussion. None of the authors de-
clared a conflict of interest. The sponsors played no part in the study design;
the collection, analysis, or interpretation of the data; the writing of the re-
port; or the decision to submit the manuscript for publication.
REFERENCES1. Isaia G, Giorgino R, Adami S. High prevalence of hypovitaminosis D
in female type 2 diabetic population. Diabetes Care 2001;24:1496.2. Targher G, Bertolini L, Padovani R, Zenari L, Scala L, Cigolini M,
Arcaro G. Serum 25-hydroxyvitamin D3 concentrations and carotidartery intima-media thickness among type 2 diabetic patients. ClinEndocrinol (Oxf) 2006;65:593–7.
3. Deleskog A, Hilding A, Brismar K, Hamsten A, Efendic S, OstensonCG. Low serum 25-hydroxyvitamin D level predicts progression totype 2 diabetes in individuals with prediabetes but not with normalglucose tolerance. Diabetologia 2012;55:1668–78.
4. Forouhi NG, Luan J, Cooper A, Boucher BJ, Wareham NJ. Baselineserum 25-hydroxy vitamin d is predictive of future glycemic status andinsulin resistance: the Medical Research Council Ely Prospective Study1990-2000. Diabetes 2008;57:2619–25.
5. Forouhi NG, Ye Z, Rickard AP, Khaw KT, Luben R, Langenberg C,Wareham NJ. Circulating 25-hydroxyvitamin D concentration and therisk of type 2 diabetes: results from the European Prospective In-vestigation into Cancer (EPIC)-Norfolk cohort and updated meta-analysis of prospective studies. Diabetologia 2012;55:2173–82.
6. Liu E, Meigs JB, Pittas AG, Economos CD, McKeown NM, Booth SL,Jacques PF. Predicted 25-hydroxyvitamin D score and incident type 2diabetes in the Framingham Offspring Study. Am J Clin Nutr 2010;91:1627–33.
7. Pittas AG, Nelson J, Mitri J, Hillmann W, Garganta C, Nathan DM,Dawson-Hughes B. Plasma 25-hydroxyvitamin D and progression todiabetes in patients at risk for diabetes: an ancillary analysis in theDiabetes Prevention Program. Diabetes Care 2012;35:565–73.
8. Mattila C, Knekt P, Mannisto S, Rissanen H, Laaksonen MA, Mon-tonen J, Reunanen A. Serum 25-hydroxyvitamin D concentration andsubsequent risk of type 2 diabetes. Diabetes Care 2007;30:2569–70.
9. Knekt P, Laaksonen M, Mattila C, Harkanen T, Marniemi J, HeliovaaraM, Rissanen H, Montonen J, Reunanen A. Serum vitamin D andsubsequent occurrence of type 2 diabetes. Epidemiology 2008;19:666–71.
10. Grimnes G, Emaus N, Joakimsen RM, Figenschau Y, Jenssen T,Njolstad I, Schirmer H, Jorde R. Baseline serum 25-hydroxyvitamin Dconcentrations in the Tromso Study 1994-95 and risk of developingtype 2 diabetes mellitus during 11 years of follow-up. Diabet Med2010;27:1107–15.
11. Gagnon C, Lu ZX, Magliano DJ, Dunstan DW, Shaw JE, Zimmet PZ,Sikaris K, Grantham N, Ebeling PR, Daly RM. Serum 25-hydrox-yvitamin D, calcium intake, and risk of type 2 diabetes after 5 years:results from a national, population-based prospective study (the Aus-tralian Diabetes, Obesity and Lifestyle study). Diabetes Care 2011;34:1133–8.
12. Chiu KC, Chu A, Go VL, Saad MF. Hypovitaminosis D is associatedwith insulin resistance and beta cell dysfunction. Am J Clin Nutr 2004;79:820–5.
13. Scragg R, Sowers M, Bell C. Serum 25-hydroxyvitamin D, diabetes,and ethnicity in the Third National Health and Nutrition ExaminationSurvey. Diabetes Care 2004;27:2813–8.
14. Wu T, Willett WC, Giovannucci E. Plasma C-peptide is inversely as-sociated with calcium intake in women and with plasma 25-hydroxyvitamin D in men. J Nutr 2009;139:547–54.
15. Kayaniyil S, Vieth R, Retnakaran R, Knight JA, Qi Y, Gerstein HC,Perkins BA, Harris SB, Zinman B, Hanley AJ. Association of vitaminD with insulin resistance and beta-cell dysfunction in subjects at riskfor type 2 diabetes. Diabetes Care 2010;33:1379–81.
16. Del Gobbo LC, Song Y, Dannenbaum DA, Dewailly E, Egeland GM.Serum 25-hydroxyvitamin D is not associated with insulin resistance orbeta cell function in Canadian Cree. J Nutr 2011;141:290–5.
6 LIM ET AL

17. Gulseth HL, Gjelstad IM, Tierney AC, Lovegrove JA, Defoort C, BlaakEE, Lopez-Miranda J, Kiec-Wilk B, Riserus U, Roche HM, et al. Se-rum vitamin D concentration does not predict insulin action or secre-tion in European subjects with the metabolic syndrome. Diabetes Care2010;33:923–5. (Published aerratum appears in Diabetes Care 2010;33:2725.)
18. Kayaniyil S, Retnakaran R, Harris SB, Vieth R, Knight JA, GersteinHC, Perkins BA, Zinman B, Hanley AJ. Prospective associations ofvitamin D with beta-cell function and glycemia: the PROspectiveMetabolism and ISlet cell Evaluation (PROMISE) cohort study. Di-abetes 2011;60:2947–53.
19. Lim SK, Kung AW, Sompongse S, Soontrapa S, Tsai KS. Vitamin Dinadequacy in postmenopausal women in Eastern Asia. Curr Med ResOpin 2008;24:99–106.
20. Giovannucci E. Can vitamin D reduce total mortality? Arch Intern Med2007;167:1709–10.
21. Chobanian AV, Bakris GL, Black HR, Cushman WC, Green LA, IzzoJL Jr, Jones DW, Materson BJ, Oparil S, Wright JT Jr, et al. TheSeventh Report of the Joint National Committee on Prevention, De-tection, Evaluation, and Treatment of High Blood Pressure: the JNC 7report. JAMA 2003;289:2560–72.
22. American Diabetes Association. Standards of medical care in diabetes–2012. Diabetes Care 2012;35(suppl 1):S11–63.
23. Holick MF. Vitamin D deficiency. N Engl J Med 2007;357:266–81.24. Holick MF. 25-OH-vitamin D assays. J Clin Endocrinol Metab 2005;
90:3128–9.25. WHO Scientific Group on the Prevention and Management of Osteo-
porosis. Prevention and management of osteoporosis: report of a WHOscientific group. Geneva, Switzerland: WHO, 2003.
26. Institute of Medicin). Dietary reference intakes for calcium and vita-min D. Washington, DC: The National Academies Press, 2011.
27. The Oxford Centre for Diabetes. Endocrinology & Metabolism. Di-abetes Trial Unit. HOMA Calculator. 2012. Available from: http://www.dtu.ox.ac.uk½AQ5� / (cited nnn).
28. Wareham NJ, Phillips DI, Byrne CD, Hales CN. The 30 minute insulinincremental response in an oral glucose tolerance test as a measure ofinsulin secretion. Diabet Med 1995;12:931.
29. Stumvoll M, Mitrakou A, Pimenta W, Jenssen T, Yki-Jarvinen H, VanHT, Renn W, Gerich J. Use of the oral glucose tolerance test to assessinsulin release and insulin sensitivity. Diabetes Care 2000;23:295–301.
30. Kestenbaum B, Katz R, de Boer I, Hoofnagle A, Sarnak MJ, ShlipakMG, Jenny NS, Siscovick DS. Vitamin D, parathyroid hormone, andcardiovascular events among older adults. J Am Coll Cardiol 2011;58:1433–41.
31. Michos ED, Reis JP, Post WS, Lutsey PL, Gottesman RF, Mosley TH,Sharrett AR, Melamed ML. 25-Hydroxyvitamin D deficiency is asso-ciated with fatal stroke among whites but not blacks: the NHANES-IIIlinked mortality files. Nutrition 2012;28:367–71.
32. Rosen CJ, Adams JS, Bikle DD, Black DM, Demay MB, Manson JE,Murad MH, Kovacs CS. The nonskeletal effects of vitamin d: an en-docrine society scientific statement. Endocr Rev 2012;33:456–92.
33. Lim S, Shin H, Kim MJ, Ahn HY, Kang SM, Yoon JW, Choi SH, KimKW, Song JH, Choi SI, et al. Vitamin D inadequacy is associated withsignificant coronary artery stenosis in a community-based elderly co-hort: the Korean Longitudinal Study on Health and Aging. J ClinEndocrinol Metab 2012;97:169–78.
34. Norman AW, Frankel JB, Heldt AM, Grodsky GM. Vitamin D de-ficiency inhibits pancreatic secretion of insulin. Science 1980;209:823–5.
35. Nyomba BL, Auwerx J, Bormans V, Peeters TL, Pelemans W, ReynaertJ, Bouillon R, Vantrappen G, De MP. Pancreatic secretion in man withsubclinical vitamin D deficiency. Diabetologia 1986;29:34–8.
36. Bourlon PM, Faure-Dussert A, Billaudel B. The de novo synthesis ofnumerous proteins is decreased during vitamin D3 deficiency and isgradually restored by 1, 25-dihydroxyvitamin D3 repletion in the isletsof langerhans of rats. J Endocrinol 1999;162:101–9.
37. Pittas AG, Lau J, Hu FB, Dawson-Hughes B. The role of vitamin D andcalcium in type 2 diabetes. A systematic review and meta-analysis. JClin Endocrinol Metab 2007;92:2017–29.
38. Tai K, Need AG, Horowitz M, Chapman IM. Vitamin D, glucose, in-sulin, and insulin sensitivity. Nutrition 2008;24:279–85.
39. Xi Q, Wang S, Ye Z, Liu J, Yu X, Zhu Z, Su S, Bai J, Li C. Adenovirus-delivered microRNA targeting the vitamin D receptor reduces in-tracellular Ca(2) concentrations by regulating the expression of Ca(2)-transport proteins in renal epithelial cells. BJU Int 2011;107:1314–9.
40. Ko SH, Lee GS, Vo TT, Jung EM, Choi KC, Cheung KW, Kim JW,Park JG, Oh GT, Jeung EB. Dietary calcium and 1,25-dihydrox-yvitamin D3 regulate transcription of calcium transporter genes incalbindin-D9k knockout mice. J Reprod Dev 2009;55:137–42.
41. Peterson CA, Heffernan ME. Serum tumor necrosis factor-alpha con-centrations are negatively correlated with serum 25(OH)D concentra-tions in healthy women. J Inflamm (Lond) 2008;5:10.
42. Willheim M, Thien R, Schrattbauer K, Bajna E, Holub M, Gruber R,Baier K, Pietschmann P, Reinisch W, Scheiner O, et al. Regulatoryeffects of 1alpha,25-dihydroxyvitamin D3 on the cytokine productionof human peripheral blood lymphocytes. J Clin Endocrinol Metab1999;84:3739–44.
43. Saliba W, Barnett O, Rennert HS, Rennert G. The risk of all-causemortality is inversely related to serum 25(OH)D levels. J Clin Endo-crinol Metab 2012;97:2792–8.
44. Houston DK, Tooze JA, Davis CC, Chaves PH, Hirsch CH, RobbinsJA, Arnold AM, Newman AB, Kritchevsky SB. Serum 25-hydrox-yvitamin D and physical function in older adults: the CardiovascularHealth Study All Stars. J Am Geriatr Soc 2011;59:1793–801.
45. de Boer IH, Levin G, Robinson-Cohen C, Biggs ML, Hoofnagle AN,Siscovick DS, Kestenbaum B. Serum 25-hydroxyvitamin D concen-tration and risk for major clinical disease events in a community-basedpopulation of older adults: a cohort study. Ann Intern Med 2012;156:627–34.
46. Faerch K, Vaag A, Holst JJ, Glumer C, Pedersen O, Borch-Johnsen K.Impaired fasting glycaemia vs impaired glucose tolerance: similarimpairment of pancreatic alpha and beta cell function but differentialroles of incretin hormones and insulin action. Diabetologia 2008;51:853–61.
47. Mari A, Tura A, Pacini G, Kautzky-Willer A, Ferrannini E. Relation-ships between insulin secretion after intravenous and oral glucose ad-ministration in subjects with glucose tolerance ranging from normal toovert diabetes. Diabet Med 2008;25:671–7.
48. Chiu KC, Chuang LM, Lee NP, Ryu JM, McGullam JL, Tsai GP, SaadMF. Insulin sensitivity is inversely correlated with plasma intactparathyroid hormone level. Metabolism 2000;49:1501–5.
49. van Schoor NM, Lips P. Worldwide vitamin D status. Best Pract ResClin Endocrinol Metab 2011;25:671–80.
VITAMIN D AND INCIDENCE OF DIABETES 7