
Les tombes protohistoriques de la bergerie Hermet à Calvisson (Gard)
Upload
independentCategory
view
4download
0
Nat. Hazards Earth Syst. Sci., 10, 793–803, 2010www.nat-hazards-earth-syst-sci.net/10/793/2010/© Author(s) 2010. This work is distributed underthe Creative Commons Attribution 3.0 License.
Natural Hazardsand Earth
System Sciences
Assessment of the susceptibility of roads to flooding based ongeographical information – test in a flash flood prone area(the Gard region, France)
P.-A. Versini1, E. Gaume2, and H. Andrieu2
1Centre de Recerca Aplicada en Hidrometeorologia, Barcelona, Spain2Laboratoire Central des Ponts et Chaussees, Bouguenais, France
Received: 23 March 2009 – Revised: 30 January 2010 – Accepted: 23 March 2010 – Published: 15 April 2010
Abstract. In flash flood prone areas, roads are often the firstassets affected by inundations which make rescue operationsdifficult and represent a major threat to lives: almost half ofthe victims are car passengers trapped by floods. In the pastyears, the Gard region (France) road management serviceshave realized an extensive inventory of the known road sub-mersions that occurred during the last 40 years. This inven-tory provided an unique opportunity to analyse the causes ofroad flooding in an area frequently affected by severe flashfloods. It will be used to develop a road submersion suscep-tibility rating method, representing the first element of a roadwarning system.
This paper presents the results of the analysis of thisdata set. A companion paper will show how the proposedroad susceptibility rating method can be combined with dis-tributed rainfall-runoff simulations to provide accurate roadsubmersion risk maps.
The very low correlation between the various possible ex-planatory factors and the susceptibility to flooding measuredby the number of past observed submersions implied the useof particular statistical analysis methods based on the generalprincipals of the discriminant analysis.
The analysis led to the definition of four susceptibilityclasses for river crossing road sections. Validation tests con-firmed that this classification is robust, at least in the con-sidered area. One major outcome of the analysis is that thesusceptibility to flooding is rather linked to the location of theroad sections than to the size of the river crossing structure(bridge or culvert).
Correspondence to:P.-A. Versini([email protected])
1 Introduction
Road network and traffic monitoring are often major issuesfor flood event managers. Anticipating the state of a roadnetwork during floods can be helpful to prevent traffic us-ing roads at risk and identify the safest access routes to theaffected areas for rescue services. This is particularly truefor flash flood prone areas where a large amount of victimsare passengers trapped in their cars by the rapid rise of wateron inundated roads (Drobot et al., 2007; Ruin et al., 2007;Jonkman, 2005; Jonkman and Kelman, 2005).
An accurate forecast of the location of flooded road sec-tions should be based on both: a reliable estimation of thenatural hazard inducing the inundation (river flood or localsurface runoff magnitude) and also an evaluation of the sus-ceptibility to flooding of each exposed road section. The term“susceptibility” has been preferred to the more general term“vulnerability” which often involves an explicit and quantita-tive evaluation of the consequences of a natural hazard (Dou-glas, 2007; Schuster and Fleming, 1986; Fuchs et al., 2007).The susceptibility describes hereafter the likelihood of a roadsection to be flooded given the natural hazard: the frequencyof flooding of the considered the road section over a long pe-riod of time. A companion paper (Versini et al., 2010) willpresent an approach for the estimation of the flood magni-tude for a large number of catchments over a region and thecombination of this magnitude and of a susceptibility rate tocompute a flood risk index for the road sections. This workis also presented in detail in a research report (Lumbroso etal., 2007) of the FP6 European Research project FLOODsite.This paper focuses specifically on the development and val-idation of the first element of this risk assessment tool: theroad section susceptibility to flooding rating method.
The main scientific question was whether it is possible tohave a prior knowledge of the susceptibility of the roads toflooding on the basis of various sources of data concerning
Published by Copernicus Publications on behalf of the European Geosciences Union.
794 P.-A. Versini et al.: Susceptibility of roads to flooding based on geographical information
27
Figure 1. The Gard Region, the four calibration (black rectangles) and the three validation
areas (red rectangles) and the location of the road inundations reported in the PICH database
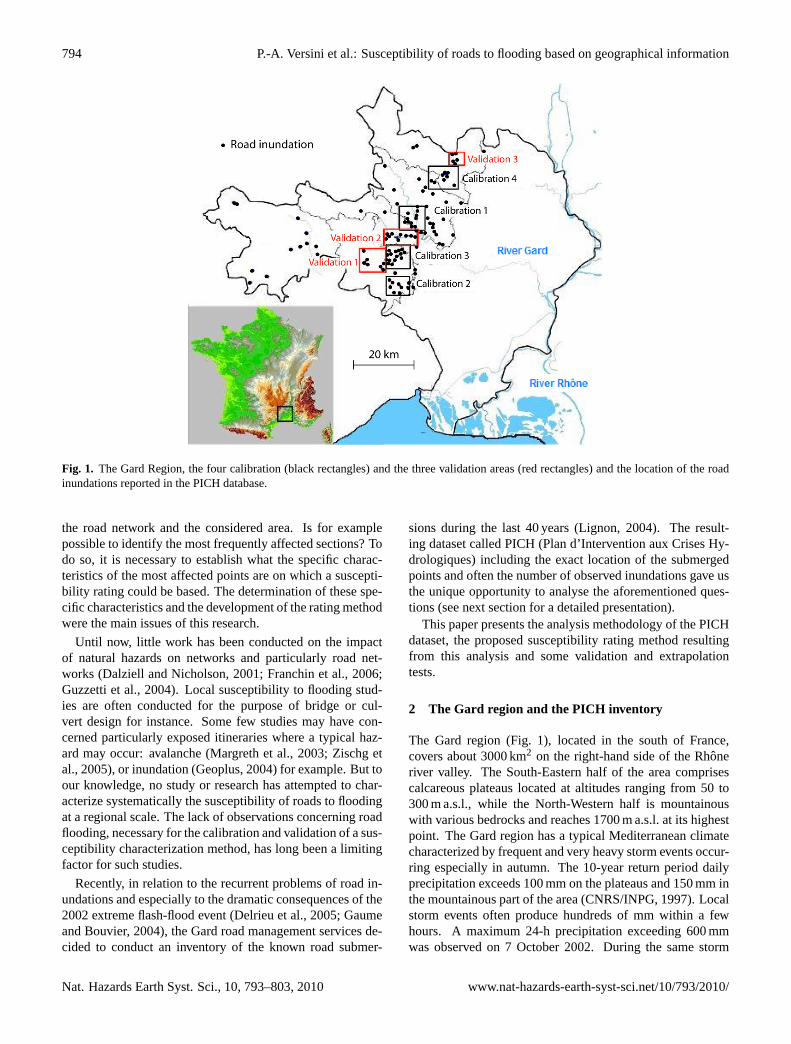
Fig. 1. The Gard Region, the four calibration (black rectangles) and the three validation areas (red rectangles) and the location of the roadinundations reported in the PICH database.
the road network and the considered area. Is for examplepossible to identify the most frequently affected sections? Todo so, it is necessary to establish what the specific charac-teristics of the most affected points are on which a suscepti-bility rating could be based. The determination of these spe-cific characteristics and the development of the rating methodwere the main issues of this research.
Until now, little work has been conducted on the impactof natural hazards on networks and particularly road net-works (Dalziell and Nicholson, 2001; Franchin et al., 2006;Guzzetti et al., 2004). Local susceptibility to flooding stud-ies are often conducted for the purpose of bridge or cul-vert design for instance. Some few studies may have con-cerned particularly exposed itineraries where a typical haz-ard may occur: avalanche (Margreth et al., 2003; Zischg etal., 2005), or inundation (Geoplus, 2004) for example. But toour knowledge, no study or research has attempted to char-acterize systematically the susceptibility of roads to floodingat a regional scale. The lack of observations concerning roadflooding, necessary for the calibration and validation of a sus-ceptibility characterization method, has long been a limitingfactor for such studies.
Recently, in relation to the recurrent problems of road in-undations and especially to the dramatic consequences of the2002 extreme flash-flood event (Delrieu et al., 2005; Gaumeand Bouvier, 2004), the Gard road management services de-cided to conduct an inventory of the known road submer-
sions during the last 40 years (Lignon, 2004). The result-ing dataset called PICH (Plan d’Intervention aux Crises Hy-drologiques) including the exact location of the submergedpoints and often the number of observed inundations gave usthe unique opportunity to analyse the aforementioned ques-tions (see next section for a detailed presentation).
This paper presents the analysis methodology of the PICHdataset, the proposed susceptibility rating method resultingfrom this analysis and some validation and extrapolationtests.
2 The Gard region and the PICH inventory
The Gard region (Fig. 1), located in the south of France,covers about 3000 km2 on the right-hand side of the Rhoneriver valley. The South-Eastern half of the area comprisescalcareous plateaus located at altitudes ranging from 50 to300 m a.s.l., while the North-Western half is mountainouswith various bedrocks and reaches 1700 m a.s.l. at its highestpoint. The Gard region has a typical Mediterranean climatecharacterized by frequent and very heavy storm events occur-ring especially in autumn. The 10-year return period dailyprecipitation exceeds 100 mm on the plateaus and 150 mm inthe mountainous part of the area (CNRS/INPG, 1997). Localstorm events often produce hundreds of mm within a fewhours. A maximum 24-h precipitation exceeding 600 mmwas observed on 7 October 2002. During the same storm
Nat. Hazards Earth Syst. Sci., 10, 793–803, 2010 www.nat-hazards-earth-syst-sci.net/10/793/2010/
P.-A. Versini et al.: Susceptibility of roads to flooding based on geographical information 795
event, a total area of about 3000 km2 received more than300 mm within less than 24 h (Gaume and Bouvierm 2004;Delrieu et al., 2005). This rainfall regime explains that theGard region belongs to the areas in Europe affected by themost frequent and severe flash floods (Gaume et al., 2009).During these floods, roads are often flooded. Significant roadflooding occurs at least once a year on average. The monitor-ing of the road network during flash flood events is thereforea major issue for the rescue services. 40% of the victimsof floods in the Gard during the last 50 years were motorists(Antoine et al., 2001). More recently, about 200 emergencyvehicles were seriously damaged or destroyed by the flowsduring the extreme September 2002 floods (Delrieu et al.,2005; Ruin et al., 2008).
The PICH is an inventory of the road submersions overthe last 40 years. It has been developed by the state ser-vices in charge of the maintenance and management of theroad network (Lignon, 2004). The objective of PICH wasto collate the experience gained by employees of these ser-vices that would be useful for the management of the roadnetwork during flood events. Based on the employees’ ex-perience and memory, this inventory covers the western andcentral part of the region, shown in Fig. 1. This comprisesthe upstream parts of the river catchments. These are the ar-eas that are exposed to flash floods. This part of the regionis still a mainly rural area with an average population densityof 106 people/km2.
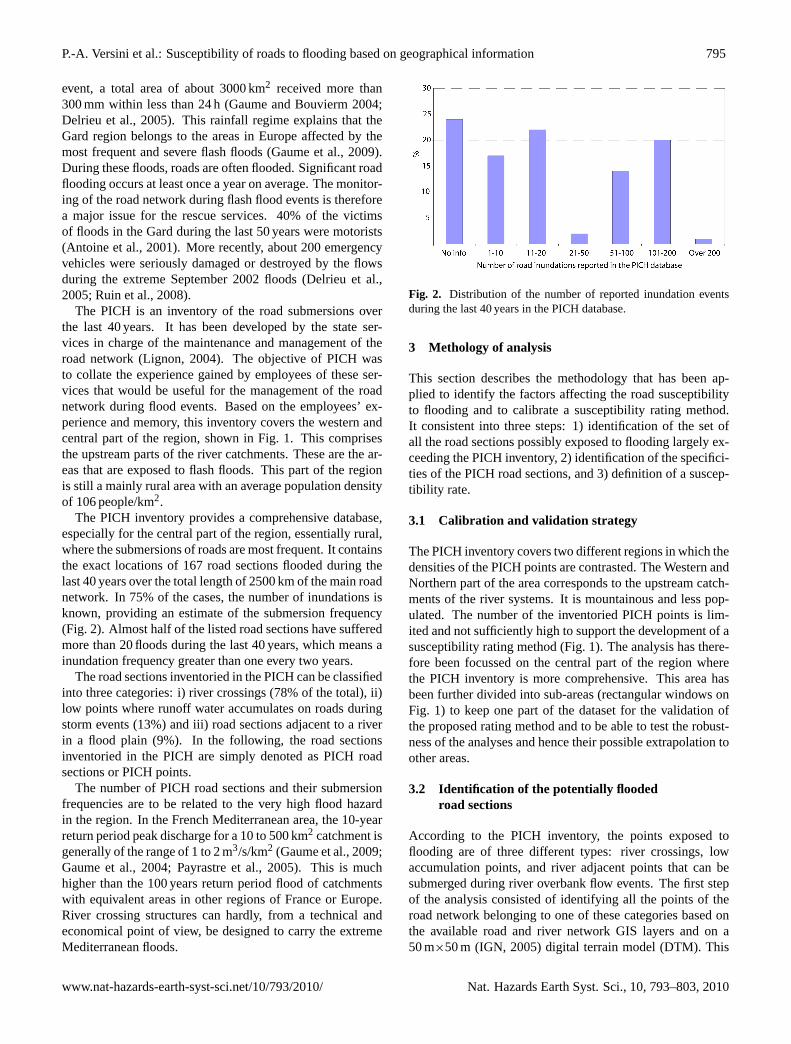
The PICH inventory provides a comprehensive database,especially for the central part of the region, essentially rural,where the submersions of roads are most frequent. It containsthe exact locations of 167 road sections flooded during thelast 40 years over the total length of 2500 km of the main roadnetwork. In 75% of the cases, the number of inundations isknown, providing an estimate of the submersion frequency(Fig. 2). Almost half of the listed road sections have sufferedmore than 20 floods during the last 40 years, which means ainundation frequency greater than one every two years.
The road sections inventoried in the PICH can be classifiedinto three categories: i) river crossings (78% of the total), ii)low points where runoff water accumulates on roads duringstorm events (13%) and iii) road sections adjacent to a riverin a flood plain (9%). In the following, the road sectionsinventoried in the PICH are simply denoted as PICH roadsections or PICH points.
The number of PICH road sections and their submersionfrequencies are to be related to the very high flood hazardin the region. In the French Mediterranean area, the 10-yearreturn period peak discharge for a 10 to 500 km2 catchment isgenerally of the range of 1 to 2 m3/s/km2 (Gaume et al., 2009;Gaume et al., 2004; Payrastre et al., 2005). This is muchhigher than the 100 years return period flood of catchmentswith equivalent areas in other regions of France or Europe.River crossing structures can hardly, from a technical andeconomical point of view, be designed to carry the extremeMediterranean floods.
28
Figure 2. Distribution of the number of reported inundation events during the last 40 years in
the PICH database.
Fig. 2. Distribution of the number of reported inundation eventsduring the last 40 years in the PICH database.
3 Methology of analysis
This section describes the methodology that has been ap-plied to identify the factors affecting the road susceptibilityto flooding and to calibrate a susceptibility rating method.It consistent into three steps: 1) identification of the set ofall the road sections possibly exposed to flooding largely ex-ceeding the PICH inventory, 2) identification of the specifici-ties of the PICH road sections, and 3) definition of a suscep-tibility rate.
3.1 Calibration and validation strategy
The PICH inventory covers two different regions in which thedensities of the PICH points are contrasted. The Western andNorthern part of the area corresponds to the upstream catch-ments of the river systems. It is mountainous and less pop-ulated. The number of the inventoried PICH points is lim-ited and not sufficiently high to support the development of asusceptibility rating method (Fig. 1). The analysis has there-fore been focussed on the central part of the region wherethe PICH inventory is more comprehensive. This area hasbeen further divided into sub-areas (rectangular windows onFig. 1) to keep one part of the dataset for the validation ofthe proposed rating method and to be able to test the robust-ness of the analyses and hence their possible extrapolation toother areas.
3.2 Identification of the potentially floodedroad sections
According to the PICH inventory, the points exposed toflooding are of three different types: river crossings, lowaccumulation points, and river adjacent points that can besubmerged during river overbank flow events. The first stepof the analysis consisted of identifying all the points of theroad network belonging to one of these categories based onthe available road and river network GIS layers and on a50 m×50 m (IGN, 2005) digital terrain model (DTM). This
www.nat-hazards-earth-syst-sci.net/10/793/2010/ Nat. Hazards Earth Syst. Sci., 10, 793–803, 2010
796 P.-A. Versini et al.: Susceptibility of roads to flooding based on geographical information
Table 1. Identification of the potentially flooded pointsin the calibration and validation windows.
Number of Number of Number ofidentified PICH road PICH roadroad sections sectionssections in the iden-
tified set
Section points 293 54 54Low points 158 9 7Bordering points 81 6 1
coarse resolution is generally the only one available overlarge areas. Geographical information was processed us-ing the open source GIS GRASS (Neteler and Mitasova,2004). To facilitate the computation of local characteristics,the DTM has been re-interpolated to a 25 m resolution witha Regularised Spline with Smoothing and Tension method(Mitasova and Mitas, 1993). Steps and flat areas result-ing from the discrete nature of the elevation data were alsosmoothed out. This does not improve the DTM data but facil-itates their processing for the identification of morphologicalfeatures such as valleys and shoulders (Rousseaux, 2006).
All river crossings were identified using existing river androad network GIS layers. Different methods were tested forthe identification of the low accumulation points (formulascombining upstream drainage area and local slope), and ofthe river bordering points (formulas combining their distancefrom the river and the difference in altitude between the roadand the river). Table 1 summarizes the best results obtainedfor the calibration and the validation areas. All the rivercrossings inventoried in the PICH are identified. It is worthnoting that about one fifth of the river crossings in the consid-ered areas are listed in the PICH. Conversely, if we considerthat the PICH inventory is close to comprehensive, 20% ofthe river crossings – the PICH sections – have an inundationempirical return period smaller than 40 years. The numberand the flooding frequency of PICH sections as well as thecontrast with the empirical flooding return period of the othersections – i.e. more than 40 years – are favourable elementsto reveal the specific conditions leading to a high susceptibil-ity to flooding.
As for the low points and river bordering points, their iden-tification appears much more uncertain on the basis of theDTM: the proportion of identified points which do not be-long to the PICH, Non-PICH points, is much larger and it isnot possible to retrieve all the PICH points from the analy-sis of the DTM, especially for the bordering points. In somecases, the susceptibility of the points seems to be linked tovery local settings that are not detectable on the DTM: lowpoint of an embankment or a misconception of a ditch for in-stance. A systematic approach for the identification and the
29
Figure 3. Relation between the flooding frequency and the indicator values in an ideal case
where a regression approach would be useful (a) and the actual situation (b)
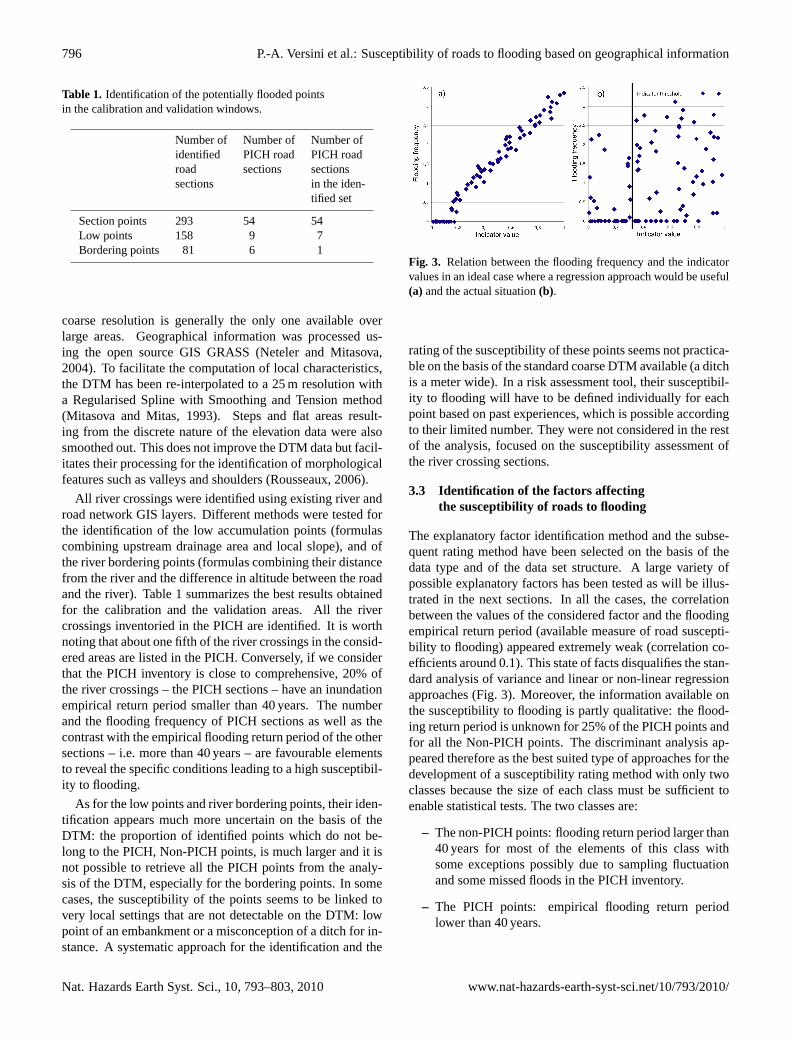
Fig. 3. Relation between the flooding frequency and the indicatorvalues in an ideal case where a regression approach would be useful(a) and the actual situation(b).
rating of the susceptibility of these points seems not practica-ble on the basis of the standard coarse DTM available (a ditchis a meter wide). In a risk assessment tool, their susceptibil-ity to flooding will have to be defined individually for eachpoint based on past experiences, which is possible accordingto their limited number. They were not considered in the restof the analysis, focused on the susceptibility assessment ofthe river crossing sections.
3.3 Identification of the factors affectingthe susceptibility of roads to flooding
The explanatory factor identification method and the subse-quent rating method have been selected on the basis of thedata type and of the data set structure. A large variety ofpossible explanatory factors has been tested as will be illus-trated in the next sections. In all the cases, the correlationbetween the values of the considered factor and the floodingempirical return period (available measure of road suscepti-bility to flooding) appeared extremely weak (correlation co-efficients around 0.1). This state of facts disqualifies the stan-dard analysis of variance and linear or non-linear regressionapproaches (Fig. 3). Moreover, the information available onthe susceptibility to flooding is partly qualitative: the flood-ing return period is unknown for 25% of the PICH points andfor all the Non-PICH points. The discriminant analysis ap-peared therefore as the best suited type of approaches for thedevelopment of a susceptibility rating method with only twoclasses because the size of each class must be sufficient toenable statistical tests. The two classes are:
– The non-PICH points: flooding return period larger than40 years for most of the elements of this class withsome exceptions possibly due to sampling fluctuationand some missed floods in the PICH inventory.
– The PICH points: empirical flooding return periodlower than 40 years.
Nat. Hazards Earth Syst. Sci., 10, 793–803, 2010 www.nat-hazards-earth-syst-sci.net/10/793/2010/

P.-A. Versini et al.: Susceptibility of roads to flooding based on geographical information 797
Table 2. Illustration of the efficiency of a sorting based onthe discharge ratio.
Suscepti- Threshold Selected sub-setbility valuesclass
Selected Selected Selected PICH/PICH Non- total Total
PICH class
1 0.09 20% 2% 11% 90%2 0.34 30% 16% 23% 63%3 0.89 50% 62% 56% 42%4 0% 20% 10% 0%
Table 3. Illustration of the efficiency of a sorting based onthe altitude.
Suscepti- Threshold Selected sub-setbility valuesclass
Selected Selected Selected PICH/PICH Non- total Total
PICH class
1 0.12 20% 6% 12% 70%2 0.28 30% 8% 17% 72%3 0.94 50% 79% 67% 30%4 0% 7% 4% 0%
The first step of the discriminant analysis consists in iden-tifying the factors linked to the susceptibility to flooding(discriminant factors). Their statistical distribution in thePICH class should differ significantly from their statisticaldistribution in the Non-PICH class. A Wilcoxon-Mann-Whitney test has been used to compare these distributions.
In addition to this test, the discriminatory power of thefactors is evaluated through a sorting test and summarized ina table (see Tables 2 to 7). This sorting test prefigures thefinal susceptibility rating method. Threshold values for theconsidered factor are adjusted to define four susceptibilityclasses that are:
– Susceptibility class 1: contains 20% of the PICH pointsand as few as possible Non-PICH points.
– Susceptibility class 2: contains an additional 30% of thePICH points.
– Susceptibility class 3: contains the 50% of the remain-ing PICH points.
– Susceptibility class 4: contains only Non-PICH points.
The proportions of Non-PICH points should be zero forthe first 3 classes if the selected factor enables a perfect dis-crimination between PICH and Non-PICH points; they are
Table 4. The sorting efficiency based on the local slope.
Suscepti- Threshold Selected sub-setbility valuesclass
Selected Selected Selected PICH/PICH Non- total Total
PICH class
1 0.13 20% 9% 14% 60%2 0.33 30% 12% 19% 63%3 0.95 50% 72% 63% 30%4 0% 7% 4% 0%
Table 5. Sorting efficiency based on the upstream watershed area.
Suscepti- Threshold Selected sub-setbility valuesclass
Selected Selected Selected PICH/PICH Non- total Total
PICH class
1 0.12 20% 5% 11% 73%2 0.33 30% 15% 20% 61%3 0.98 50% 82% 69% 30%4 0% 0% 10% 0%
Table 6. Sorting efficiency based on the proposed indicatorcombination.
Suscepti- Con- Thres- Selected sub-setbility nector holdclass values
Selected Selected Selected PICH/PICH Non- total Total
PICH class
1 AND 0.3 20% 2% 8% 100%2 AND 0.57 30% 17% 22% 54%3 OR 0.57 50% 58% 54% 35%4 0% 25% 16% 0%
Table 7. Validation of the susceptibility rating method.
Suscepti- Threshold Selected sub-setbility valuesclass
Selected Selected Selected PICH/PICH Non- total Total
PICH class
1 0.09 14% 14% 5% 61%2 0.34 33% 33% 18% 51%3 0.89 53% 53% 54% 35%4 0% 0% 15% 0%
www.nat-hazards-earth-syst-sci.net/10/793/2010/ Nat. Hazards Earth Syst. Sci., 10, 793–803, 2010

798 P.-A. Versini et al.: Susceptibility of roads to flooding based on geographical information
the same as for the PICH points if no sorting is possible. Theadjustment of the susceptibility rating method will mainlyaim at reducing the proportion of Non-PICH points in thefirst 3 classes of susceptibility.
Two more details are to be given on this phase of the analy-sis. First, the range of values for the various possible discrim-inant factors (altitudes, slopes...) may vary from one area toanother. To be able to compare results obtained in differentcalibration areas and to extrapolate the results to the valida-tion areas, it was necessary to normalize the values of someof the factors in each tested area. The chosen normalized fac-tor or index (Ind) corresponds to a probability of exceedance:
Ind=i −0.5
n+0.5(1)
if PICH point values have a tendency to be among
the lowest values
Ind= 1−i −0.5
n+0.5(2)
if PICH point values appears among the highest values
where i is the rank of the value in the area where all thevalues have been sorted in increasing order andn is the to-tal number of values (potentially flooded road sections) inthe considered area. Note that the normalization method hasbeen adjusted so as to affect the lowest factor values to thePICH points. This normalisation method has been chosen forits robustness especially to extreme values.
The reported flooding frequencies of the PICH points,when available, are not used in the analysis and calibra-tion phase. This information will serve during the validationphase: if the proposed classification method is consistent, thefrequently flooded points must be concentrated in the high-est susceptibility classes. This will be verified at the finalvalidation stage.
3.4 Adjustment of a susceptibility rating method
The discriminatory powers of each individual tested factorproved to be limited. To increase the sorting efficiency, com-binations of factors were tested. The classes can be delim-ited by thresholds corresponding to a linear combination ofthe factor values (Fig. 4a) or by threshold values that shouldbe simultaneously exceeded by the factor values – connector“and” – or exceeded by one factor value at least – connec-tor “or” (see Fig. 4b). According to the structure of the dataset, a non-linear combination based on the logical connectors“and” and “or” appeared to be more suited than the tradi-tional linear combination of the values of the factors to reachthe best classification efficiency. The difference between thetwo approaches is nevertheless limited.
30
(a)
(b)
Figure 4. Illustration of the separation of a data set into four classes based on a combination of
two factors, the coverage of the classes 1 to 4 appear in grey gradation: a) Thresholds limiting
the classes equal to a linear combination of factors and b) combination of thresholds with
connectors “and” (classes 1,2 and 4) and “or” (class 3).
Fig. 4. Illustration of the separation of a data set into four classesbased on a combination of two factors, the coverage of the classes 1to 4 appear in grey gradation:(a) thresholds limiting the classesequal to a linear combination of factors and(b) combination ofthresholds with connectors “and” (classes 1, 2 and 4) and “or”(class 3).
4 Analysis of the susceptibility of road sectionsto flooding
4.1 Susceptibility and design of the rivercrossing structures
It is natural to think that the susceptibility of a road to flood-ing may be linked to the dimensions of the river crossingstructure (bridge or culvert) and more specifically to the ade-quacy between the opening – cross-section – of this structureand the discharges that may be produced by the upstreamwatershed during floods.
The first tested factor aimed at characterizing this ade-quacy. It relies on the comparison of two different dischargevalues:
– The theoretical maximum free surface discharge ca-pacity through the crossing structure Qc that can beestimated using the Manning-Strickler formula (VenTe Chow, 1964) if the shape and dimensions of thestructure’s opening is known:
Qc = K ·Rh32 ·I
12 ·S (3)
K is the roughness coefficient taken constant equal to 50,
Nat. Hazards Earth Syst. Sci., 10, 793–803, 2010 www.nat-hazards-earth-syst-sci.net/10/793/2010/

P.-A. Versini et al.: Susceptibility of roads to flooding based on geographical information 799
Rhis the hydraulic radius,I is the local slope computed usingthe digital terrain model, andS is the cross-sectional area ofthe opening.
– The theoretical 10-year return period discharge for theupstream watershed, based on a well established for-mula adapted to small catchments in France – the Cru-pedix formula (CEMAGREF, 1980) – which has provento be reliable, especially in the considered area (Esti-enne and Roche, 1994):
Qc = K ·Rh32 ·I
12 ·S (4)
where A is the catchment area in km2, Pj10 is 10-yeardaily rainfall in mm, estimated using a local monograph(CNRS/INPG, 1997) andR is a regional parameter equal to1.5 for the Gard Region.
The discharge ratioQ10/Qc has been computed for all theroad sections for which the dimensions of the river cross-ing structures were available. The distribution of these dis-charge ratios for the PICH and Non-PICH datasets is shownin Fig. 5.
The two distributions are significantly different; there is,in particular, a higher proportion of large values of the ratioin the PICH data set. Nevertheless, this ratio is not very dis-criminatory: more than 60% of the PICH sections are char-acterized by a discharge ratio lower than 1 (theoretical returnperiod of flooding larger than 10 years). It is important hereto recall that a large majority of the PICH points have empir-ical flooding return period smaller than 10 years (see Fig. 2).The discharge ratio is poorly correlated with the empiricalflooding return period of the PICH sections (coefficient ofcorrelation equal to 0.05).
The modest performances of this first tested factor can beattributed to the inaccuracy of both computed discharge va-lues and of the resulting ratio. But it is the best that can bedone to characterise the capacity of river crossing structuresbased on commonly available information. The inaccuracyis nevertheless not the only explanation. A detailed analysisof some recently flooded roads – based on field surveys andtechnical reports (GEOPLUS, 2004) – has revealed that thecrossing structure itself is rarely submerged but rather a lowpoint of the road when it crosses a floodplain. Inundationsmay occur even if the river crossing structure is well dimen-sioned as soon as the road has to run across a flood plain.This leads to think that the susceptibility to flooding may aswell be explained by the location of the road sections. A sus-ceptibility rating method based on geographical informationwould have another major advantage. Geographical informa-tion is easily available on a large territory, while the geometryof the river crossing structures is generally only known for alimited number of structures.
31
Figure 5. Distribution of the some discriminant factor values for the PICH and Non-PICH sets
in the four calibration areas
31
Figure 5. Distribution of the some discriminant factor values for the PICH and Non-PICH sets
in the four calibration areas
Fig. 5. Distribution of the some discriminant factor values for thePICH and Non-PICH sets in the four calibration areas.
4.2 Analysis of other possible explanatory factors
A large variety of possible discriminant factors based on ge-ographical information has been analysed:
– local topographical indicators characterising the roadsection including altitude, slope, shape, and topographicwetness index (Beven and Kirkby, 1979),
– characteristics of the upstream catchment includingarea, land use, bed rock type, average altitude, averageslope, and topographic wetness index distribution.
The Institut National de la Recherche Agronomique soil database (INRA, 2000) has been used as source of informationon the soil types and bedrock of the upstream watershed ofeach studied section. The initial complex classification hasbeen simplified into five main categories of bedrocks and as-sociated soils in the Gard Region. The Corine Land Coverdatabase (IFEN, 2000) provided information on land cover.Again, the complex land use classification has been simpli-fied and five classes defined: urban areas, agricultural land,forest, scrub and water bodies. A watershed is characterisedby the proportion of area covered by each bedrock, soil andland use type.
The susceptibility of a road section to flooding did not ap-pear to be significantly linked to the dominant land use typeof its upstream catchment, nor to the soil bedrock types. Asignificant difference between the PICH and Non-PICH dis-tributions according to the Wilcoxon-Mann-Whiley test ap-peared only for three factors: the road altitude, the local slopeand upstream catchment area.
4.2.1 Susceptibility and altitude
The distribution of the normalized altitudes of PICH roadsections in the four calibration regions differs significantlyfrom a uniform distribution. This is shown in Fig. 5. ThePICH road sections appear to be located in the lowest zones.
www.nat-hazards-earth-syst-sci.net/10/793/2010/ Nat. Hazards Earth Syst. Sci., 10, 793–803, 2010

800 P.-A. Versini et al.: Susceptibility of roads to flooding based on geographical information
Around 40% of the PICH road sections lie in the 20% low-est parts of the calibration areas. Table 3 shows the sort-ing efficiency based on the altitude indicator value whichis comparable to the efficiency obtained with the dischargeratio (see Table 2): the sorting efficiency is higher for thehigh susceptibility classes and lower for the low susceptibil-ity classes.
4.2.2 Susceptibility and local slope
The second indicator extracted from the DTM that appearedto be linked to the susceptibility of the road is the local max-imum slope around the considered road section. This slopeindicates if the road section is located on a flat or a steep sur-face. It is therefore partly linked to the altitude. It can alsocharacterize the local runoff: the flow velocities and hencethe through-flow capacity of culverts may increase with thestream’s slope. Figure 5 shows that a large number of thePICH road sections are located in flat areas. Approximately60% of the PICH road sections belong to the 40% of the to-tal set of potentially flooded sections with the lowest slopes.The sorting efficiency based on the local slope (Table 4) isslightly lower than when the altitude is used (Table 3). Still,the two lower susceptibility classes contain almost 80% ofthe Non-PICH sections.
4.2.3 Susceptibility and upstream watershed area
The catchment areas have been sorted in decreasing order sothat the largest areas correspond to the lowest values of thenormalised area indicator. The upstream catchments drain-ing to the PICH road sections are generally larger than thecatchments draining to the Non-PICH road sections. Thisis shown in Fig. 5. Inside the calibration areas, the averagearea of the PICH catchments is 30 km2 whereas a Non-PICHcatchment has an average area of 10 km2.
The sorting out of the PICH road sections based on thevalue of the upstream catchment area indicator is far fromperfect (Table 5) but appears as discriminant as the two pre-vious indicators.
5 Proposal and evaluation of a susceptibilityrating method
The comparison of the PICH and Non-PICH sub-sets revealsthat four indicators are significantly linked to the suscepti-bility of a road section to flooding. The most efficient indi-cator seems to be the ratio between the 10-years peak dis-charge and the design discharge of the structure that crossesthe river. Unfortunately, the geometry of the bridges and cul-verts is only available for a limited number of sections. Asa consequence, this indicator can hardly be generalized overthe whole region without a significant additional data colla-tion effort.
Three indicators calculated from geographical data, avail-able for every road section, display significantly different dis-tributions for PICH and Non-PICH sections: altitude, localslope and area of the upstream catchment. As these indica-tors are only partly correlated, the sorting efficiency of thePICH and Non-PICH points could be improved by combin-ing them.
5.1 Adjustment of the combination inthe calibration areas
According to the normalization presented in Sect. 4, the in-dicators take their values in the range of 0 to 1. For the sakeof simplicity, the three indicators have been combined us-ing simultaneously the same threshold value to remain sim-ple and robust. Using the same methodology previously usedfor each individual indicator, three thresholds delimiting fourclasses of susceptibility were defined based on the propor-tion of PICH sections in each class (20%, 30%, 50%, 0%).The two possible connectors AND and OR for the combi-nation of the indicators have been tested. Figure 6 showsthe cumulative distributions of exceedance of the combina-tions of indicators in the PICH and Non-PICH data sets. Thevertical distance between the two distributions reveals thepower of discrimination of the combination. The connectorAND appears as better suited to define the high susceptibilityclasses while the connector OR has higher performances forthe low susceptibility classes and enables the definition of aclass containing no PICH points. The resulting sorting effi-ciencies are summarized in Table 6 for the four calibrationareas.
The efficiency of the combination of indicators outper-forms the sorting efficiency of any of the previously testedsingle indicators, confirming the complementarity betweenthe selected indicators and the usefulness of their combi-nation. Nevertheless, the indicators and their combinationhave been adjusted on four limited calibration areas. Is itrobust? Will similar sorting efficiencies be obtained on thethree validation areas? Moreover, are the observed floodingfrequencies consistent with the susceptibility classes whichhave only been defined based on the PICH data set mem-bership? This has been tested in the validation phase whichresults are presented hereafter.
5.2 Validation
The indicators combination method has been tested on thethree validation areas (see Fig. 1) of the region. They con-tain 28 PICH sections for a total number of 112 sections.In each area, the following steps were applied: (i) calcula-tion of the indicator values for each road section (i.e. al-titude, local slope and catchment area), (ii) sorting out ofthe values by increasing order and computation of the nor-malised indicator values, (iii) application of the combination
Nat. Hazards Earth Syst. Sci., 10, 793–803, 2010 www.nat-hazards-earth-syst-sci.net/10/793/2010/
P.-A. Versini et al.: Susceptibility of roads to flooding based on geographical information 801
32
Figure 6. Cumulative distributions of the combined index value for the two tested connectors
for the PICH and Non-PICH sets in the four calibration areas
Fig. 6. Cumulative distributions of the combined index value forthe two tested connectors for the PICH and Non-PICH sets in thefour calibration areas.
method as previously described, and (iv) allocation of eachpoint to a susceptibility class. The results are shown in Ta-ble 7.
For the three validation areas, the sorting efficiencies arevery similar to the ones obtained in the calibration areas, ex-cept for the susceptibility class 1 where the sorting efficiencyis lower. This is an extremely satisfactory result. It shouldnevertheless be mentioned that all the validation and calibra-tion areas are located in the central part of the Gard regionand have a similar moderate topography. It is probable thatthe rating method can not be extrapolated without further ad-justments to the western part of the region which is moun-tainous and where the density of PICH points is much lower(see Fig. 1). Nevertheless, the same trends as observed inthe central part of the region seem to be observed its west-ern part: PICH points have a tendency to be concentrated inthe valleys of the main rivers, downstream, where the valleysbecome larger.
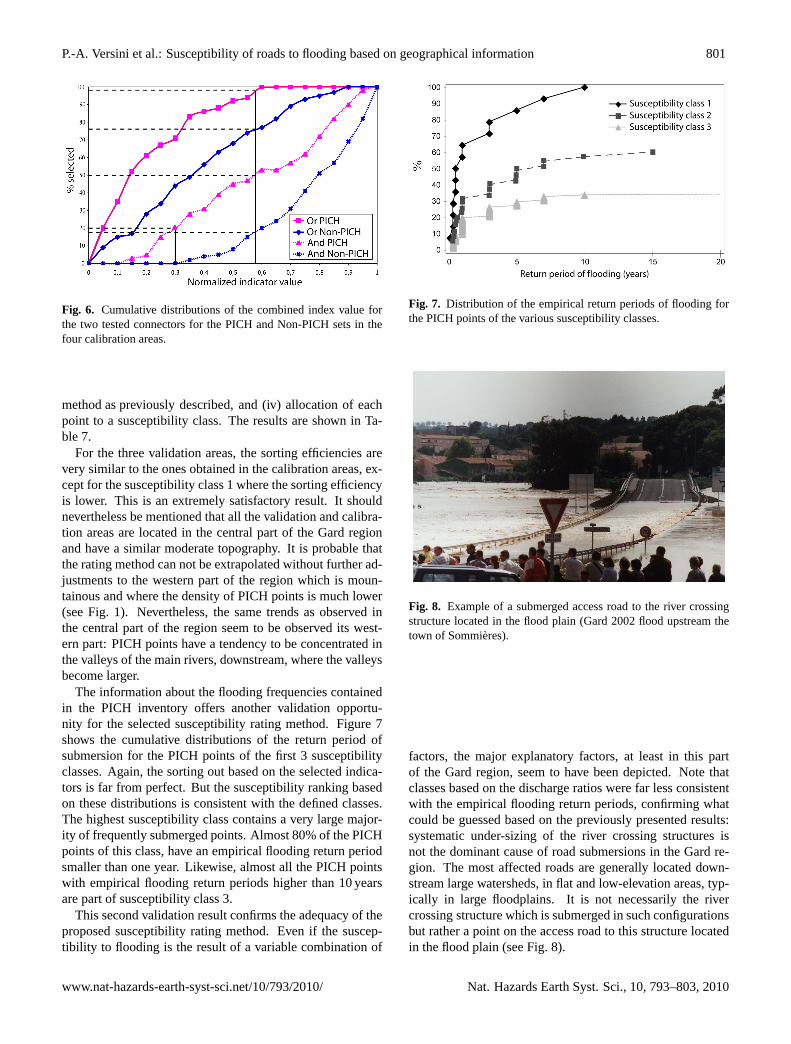
The information about the flooding frequencies containedin the PICH inventory offers another validation opportu-nity for the selected susceptibility rating method. Figure 7shows the cumulative distributions of the return period ofsubmersion for the PICH points of the first 3 susceptibilityclasses. Again, the sorting out based on the selected indica-tors is far from perfect. But the susceptibility ranking basedon these distributions is consistent with the defined classes.The highest susceptibility class contains a very large major-ity of frequently submerged points. Almost 80% of the PICHpoints of this class, have an empirical flooding return periodsmaller than one year. Likewise, almost all the PICH pointswith empirical flooding return periods higher than 10 yearsare part of susceptibility class 3.
This second validation result confirms the adequacy of theproposed susceptibility rating method. Even if the suscep-tibility to flooding is the result of a variable combination of
33
Figure 7. Distribution of the empirical return periods of flooding for the PICH points of the
various susceptibility classes.
Fig. 7. Distribution of the empirical return periods of flooding forthe PICH points of the various susceptibility classes.
34
Figure 8. Example of a submerged access road to the river crossing structure located in the
flood plain (Gard 2002 flood upstream the town of Sommières)
Fig. 8. Example of a submerged access road to the river crossingstructure located in the flood plain (Gard 2002 flood upstream thetown of Sommieres).
factors, the major explanatory factors, at least in this partof the Gard region, seem to have been depicted. Note thatclasses based on the discharge ratios were far less consistentwith the empirical flooding return periods, confirming whatcould be guessed based on the previously presented results:systematic under-sizing of the river crossing structures isnot the dominant cause of road submersions in the Gard re-gion. The most affected roads are generally located down-stream large watersheds, in flat and low-elevation areas, typ-ically in large floodplains. It is not necessarily the rivercrossing structure which is submerged in such configurationsbut rather a point on the access road to this structure locatedin the flood plain (see Fig. 8).
www.nat-hazards-earth-syst-sci.net/10/793/2010/ Nat. Hazards Earth Syst. Sci., 10, 793–803, 2010

802 P.-A. Versini et al.: Susceptibility of roads to flooding based on geographical information
6 Conclusions
The PICH inventory realized in parts of the Gard regionin France gave a unique opportunity to analyse the causesof road submersions in an area frequently affected by flashfloods and to develop a road submersion susceptibility ratingmethod, first element of a road warning system.
According to the low correlation coefficients between theobserved flooding frequencies and the tested possible ex-planatory factors (indicators) and to the structure of the dataset, specific analyses methods, based on the general princi-pals of the discriminant analysis, had to be adapted. From amethodological point of view, the obtained results illustratethat information can be extracted from a data set even in suchan unfavourable case.
Despite the various sources of uncertainties and the vari-ability of local situations, the analyses revealed some generaltrends:
1. The size of the river crossing structures is far from beingthe only factor affecting the susceptibility of roads toflooding.
2. Frequently submerged road sections have a general ten-dency to be located downstream large watersheds, in flatand low-elevation areas, typically in large floodplains.
3. Additional data (field surveys and technical reports)indicate that it is not necessarily the river crossingstructure which is submerged but rather a point on theaccess road to this structure located in the flood plain.
Based on the analysis results, four susceptibility categorieshave been defined for the section points between roads andrivers. Validation tests have shown that this classification isrobust, at least in the same geographical area. It appears alsoconsistent with the observed submersion frequencies: themost frequently submerged points of the road network areeffectively concentrated in the highest susceptibility classes.
Of course the proposed road susceptibility rating methodhas its limits: the rating is limited to the definition of fourclasses and the sorting out of the road points according totheir susceptibility is not perfect. Despites these limits andbeyond the few lessons drawn about road submersions, itcan be of practical use. A companion paper (Versini etal., 2010) will present the coupling between a distributedrainfall-runoff model and this susceptibility rating method toproduce flooding risk maps. This work will show that sus-ceptibility rating is essential to produce effective flood riskmaps and especially to identify the points that are the mostat risk in areas affected by intense rain. It highly contributesto the accuracy of the risk mapping when it is used to detectactually flooded roads.
To conclude, it is important to keep in mind that theobtained results are linked to the study area and to somemethodological choices. The susceptibility of the roads to
flooding may vary between regions with the local geomor-phological patterns and the road construction habits. More-over, the normalized indicator values and hence the definedthresholds are not independent on the extent of the consid-ered areas and on the gradient of values within an area. Thenormalization method will certainly be put in question if theapproach has to be extended. The presented work shows thatit is feasible to define submersion susceptibility rates basedon commonly available geographical data. But, the methodshould not be extrapolated to other regions without a furthercalibration and validation effort.
Acknowledgements.This work has been supported by the Eu-ropean Community’s Sixth Framework Programme through thegrant to the budget of the Integrated Project FLOODsite, ContractGOCE-CT-2004-505420.The authors would like to thank the IGN(Institut Geographique National) institute for providing GIS data.We would also like to thank the INPG of Grenoble and the OHM-CV (Cevennes-Vivarais Hydro-Meteorological Observatory) andespecially Guy Delrieu, Laurent Bonnifait and Brice Boudevillainfor providing historical meteorological data on the Gard region andthe staff of the Direction Departementale de l’Equipement du Gardfor its cooperation.
Edited by: A. GuntherReviewed by: S. Fuchs and two other anonymous referees
References
Antoine, J.-M., Desailly, B., and Gazelle, F.: Les crues meurtrieres,du Roussillon aux Cevennes, Ann. Geogr., 622, 597–623, 2001(in French).
Beven, K. and Kirkby, M.: A physical variable contributing areamodel of catchment hydology, Hydrolog. Sci. Bull., 24(1), 43–69, 1979.
CEMAGREF: Synthese nationale sur les crues des petits bassinsversants, Methode SOCOSE et CRUPEDIX, Technical report,1980.
CNRS/INPG: Atlas experimental des risques de pluies intenses,region Cevennes-Vivarais, Technical report, CNRS, Laboratoired’etude des transferts en hydrologie et Environnement, Grenoble,France, 1997 (in French).
Dalziell, E. and Nicholson, A.: Risk and impact of natural haz-ards on a road network, J. Transp. Eng.-ASCE, 127(2), 159–166,2001.
Delrieu, G., Ducrocq, V., Gaume, E., Nicol, J., Payrastre, O., Yates,E., Kirstetter, P. E., Andrieu, H., Ayral, P. A., Bouvier, C., Cre-utin, J. D., Livet, M., Anquetin, A., Lang, M., Neppel, L., Obled,C., Parent-du-Chatelet, J., Saulnier, G. M., Walpersdorf, A., andWobrock, W.: The catastrophic flash-flood event of 8–9 Septem-ber 2002 in the Gard region, France: a first case study for theCevennes-Vivarais Mediterranean Hydro-meteorological Obser-vatory, J. Hydrometeorol., 6, 34–52, 2005.
Douglas, J.: Physical vulnerability modelling in natural hazard riskassessment, Nat. Hazards Earth Syst. Sci., 7, 283–288, 2007,http://www.nat-hazards-earth-syst-sci.net/7/283/2007/.
Nat. Hazards Earth Syst. Sci., 10, 793–803, 2010 www.nat-hazards-earth-syst-sci.net/10/793/2010/

P.-A. Versini et al.: Susceptibility of roads to flooding based on geographical information 803
Drobot, S. D., Benight, C., and Gruntfest, E. C.: Risk factors fordriving into flooded roads, Environ. Hazards, 7(3), 227–234,doi:10.1016/j.envhaz.2007.07.003, 2007.
Estienne, J. and Roche, P.-A.: Prevention et gestion des dommagesdus aux inondations, la Houille Blanche, 8, 64–76, 1994 (inFrench).
Franchin, P., Lupoi, A., and Pinto, P.-E.: On the role of road net-works in reducing human losses after earthquakes, J. Earthq.Eng., 10(2), 195–206, 2006.
Fuchs, S., Heiss, K., and Hubl, J.: Towards an empirical vulnerabil-ity function for use in debris flow risk assessment, Nat. HazardsEarth Syst. Sci., 7, 495–506, 2007,http://www.nat-hazards-earth-syst-sci.net/7/495/2007/.
Gaume, E., Bain, V., Bernardara, P., Newinger, O., Barbuc,M., Bateman, A., Blaskovicova, L., Bloschl, G., Borga, M.,Dumitrescu, A., Daliakopoulos, I., Garcia, J., Irimescu, A.,Kohnova, S., Koutroulis, A., Marchi, L., Matreata, S., Med-ina, V., Preciso, E., Sempere-Torres, D., Stancalie, G., Szol-gay, J., Tsanis, J., Velasco, D., and Viglione, A.: A colla-tion of data on European flash floods, J. Hydrol., 367, 70–78,doi:10.1016/j.jhydrol.2008.12.028., 2009.
Gaume, E., Livet, M., Desbordes, M., and Villeneuve, J.-P.: Hydro-logic analysis of the Aude, France, flash flood 12 and 13 Novem-ber 1999, J. Hydrol., 286, 135–154, 2004.
Gaume, E. and Bouvier, C.: Analyse hydro-pluviometrique descrues du Gard et du Vidourle des 8 et 9 septembre 2002, LaHouille Blanche, 6, 99–106, 2004 (in French).
GEOPLUS: RD 999 entre Nımes et Le Vigan,etude hydrauliquedes ouvrages de franchissement, 2004. (in French).
Guzzetti, F., Reichenbach, P., and Ghigi, S.: Rockfall hazard andrisk assessment along a transportation corridor in the Nera Val-ley, central Italy, Environ. Manage., 34(2), 191–208, 2004.
IFEN: Base de donnees d’occupation du sol Corine LandCover, available at: http://www.ifen.fr/bases-de-donnees/occupation-des-sols-corine-land-cover.html, 2000.
IGN: BD Carto: Descriptif de livraison, Technical report, 2004 (inFrench).
INRA: Base de donnees sols du Languedoc-Roussillon (BDSol-LR), In: http://sol.ensam.inra.fr/bdsollr/Asp/, 2000 (in French).
Jonkman, S.: Global perspectives on loss of human life caused byfloods, Nat. Hazards, 34, 151–175, 2005.
Jonkman, S. and Kelman, I.: An analysis of causes and circum-stances of flood disaster deaths, Disasters, 29, 75–97, 2005.
Lignon, S.: Mise en place du plan d’intervention aux crises hy-drologiques (PICH)a la DDE du Gard, Ecole des Mines d’Ales,Universite de Montpellier, 2004 (in French).
Lumbroso, D., Gaume, E., Logtmeijer, Ch., Mens, M., and Vander Vat, M.: Evacuation and rescue management, Floodsite Eu-ropean research project, report T17-07-02, Wallingford (GreatBritain), 190 pp., 2007.
Margreth, S., Stoffel, L., and Wilhelm, C.: Winter opening of highalpine pass roads: analysis and case studies from Swiss Alps,Cold Reg. Sci. Technol., 37, 467–482, 2003
Mitasova, H. and Mitas, L.: Interpolation by regularised spline withtension, Math. Geol., 25(6), 641–669, 1993.
Neteler, M. and Mitasova, H.: Open source GIS: a GRASS GISapproach, 2004.
Payrastre, O., Gaume, E., and Andrieu, H.: Use of historical data toassess the occurrence of floods in small watersheds in the FrenchMediterranean area, Adv. Geosci., 2, 313–320, 2005,http://www.adv-geosci.net/2/313/2005/.
Rousseaux, F.: Caracterisation d’erreurs sur un modele numeriquede terrain en fonction de zones morphologiues, Bulletind’information scientifique et technique de l’IGN, 75, 95–100,2006 (in French).
Ruin, I., Creutin, J.-D., Anquetin, S., and Lutoff, C.: Human ex-posure to flash floods – Relation between parameters and hu-man vulnerability during a storm of september 2002 in SouthernFrance, J. Hydrol., 361, 199–213, 2008.
Ruin, I., Gaillard, J.-C., and Lutoff, C.: How to get there? As-sessing motorists’ flash flood risk perception on daily itineraries,Environ. Hazards, 7(8), 235–244, 2007.
Schuster, R. and Fleming, R.: Economic losses and fatalities due tolandslides, Bull. Assoc. Eng. Geol., 23, 11–28, 1986.
Ven Te Techow, C.: Handbook of Applied Hydrology, New-York,McGraw-Hill, 1964.
Versini, P.-A., Gaume, E., and Andrieu, E.: Application of a dis-tributed hydrological model to the design of a road inundationwarning system for flash flood prone areas, Nat. Hazards EarthSyst. Sci., 10, 805–817, 2010,http://www.nat-hazards-earth-syst-sci.net/10/805/2010/.
Zischg, A., Fuchs, S., Keiler, M., and Stotter, J.: Temporal variabil-ity of damage potential on roads as a conceptual contribution to-wards a short-term avalanche risk simulation, Nat. Hazards EarthSyst. Sci., 5, 235–242, 2005,http://www.nat-hazards-earth-syst-sci.net/5/235/2005/.
www.nat-hazards-earth-syst-sci.net/10/793/2010/ Nat. Hazards Earth Syst. Sci., 10, 793–803, 2010
Copyright © 2022 FDOKUMEN


![MONTEIL (M.) 1996 – La ville romaine et wisigothique [Nîmes, Gard].](https://static.fdokumen.com/doc/165x107/63413433671643e7130cf979/monteil-m-1996-la-ville-romaine-et-wisigothique-nimes-gard.jpg)