Utilization of unripe banana peel waste as feedstock for ...

Bioresource Technology 193 (2015) 256–265
Contents lists available at ScienceDirect
Bioresource Technology
journal homepage: www.elsevier .com/locate /bior tech
Assessment of the influence of energy density and feedstock transportdistance on the environmental performance of methane from maizesilages
http://dx.doi.org/10.1016/j.biortech.2015.06.0670960-8524/� 2015 Elsevier Ltd. All rights reserved.
⇑ Corresponding author.E-mail address: [email protected] (J. Bacenetti).
Jacopo Bacenetti a,⇑, Daniela Lovarelli a, Carlo Ingrao b, Caterina Tricase b, Marco Negri a, Marco Fiala a
a Department of Agricultural and Environmental Sciences – Production, Landscape, Agroenergy, Università degli Studi di Milano, via Giovanni Celoria 2, 20133 Milano, Italyb Department of Economics, University of Foggia, Largo Papa Giovanni Paolo II, 1, 71121 Foggia, Italy
h i g h l i g h t s
� The environmental impact of three different maize silages for biogas was evaluated.� Increasing extra-farm transport distance and two transport system were considered.� For small distances (<5 km), the whole plant silage shows the lowest impact.� When distances increase, silages with high energy density become the best solution.
a r t i c l e i n f o
Article history:Received 13 May 2015Received in revised form 12 June 2015Accepted 14 June 2015Available online 18 June 2015
Keywords:BiogasLife Cycle AssessmentAnaerobic digestionBiomass supplyRenewable energy
a b s t r a c t
In Europe, thanks to public subsidy, the production of electricity from anaerobic digestion (AD) of agri-cultural feedstock has considerably grown and several AD plants were built. When AD plants are concen-trated in specific areas (e.g., Northern Italy), increases of feedstock’ prices and transport distances can beobserved. In this context, as regards low-energy density feedstock, the present research was designed toestimate the influence of the related long-distance transport on the environmental performances of thebiogas-to-electricity process. For this purpose the following transport systems were considered: farmtrailers and trucks.
For small distances (<5 km), the whole plant silage shows the lowest impact; however, when distancesincrease, silages with higher energy density (even though characterised by lower methane production perhectare) become more environmentally sustainable. The transport by trucks achieves better environmen-tal performances especially for distances greater than 25 km.
� 2015 Elsevier Ltd. All rights reserved.
1. Introduction
Fossil fuel consumption reduction and Greenhouse Gas (GHG)emission mitigation of are both key issues in the achievement ofenvironmentally sustainable productive systems. In this context,the renewable energy generation can help meet both these ambi-tious targets.
In Europe, the energy policies is increasingly promoting thegeneration of energy from renewable sources (i.e. EU target of27% renewable energy by 2030 and 40% of GHG emission reduc-tion) (European Commission, 2014): biogas produced from agricul-tural biomasses through anaerobic digestion is one of them.Indeed, it has proved to be an interesting solution for energy
generation in rural areas when used locally (Lijó et al., 2014a,b,2015; Ingrao et al., 2015a; Mauky et al., 2015; Morero et al.,2015). Moreover, the anaerobic digestion (AD) allows an efficientmanagement solution for several waste products, such as organicmunicipal solid waste, agricultural (e.g., animal slurry) andagro-food residues (e.g., marc, olive pomace, by-products fromtomato processing, etc.). As an example, Bacenetti et al. (2015b)documented an environmental impact reduction ranging from 3%to 14% for tomato purée when tomato seeds and skins are usedto feed an AD plant whose cogenerated thermal energy is valorisedduring tomato processing. Lijó et al. (2015) and Battini et al. (2014)evaluated the AD as effective mitigation strategies in dairy farms.
Over the years, thanks to public subsidy frameworks, the pro-duction of renewable energy from AD of agricultural feedstockhas considerably grown and several AD plants have been built. Atthe end of 2014 in Germany more than 8000 AD plants were

J. Bacenetti et al. / Bioresource Technology 193 (2015) 256–265 257
running (German Biogas Association, 2015), in Italy about 1250(Negri et al., 2014a), in the United Kingdom 123 (Whiting andAzapagic, 2014). A considerable development of this agro-energytook place also in Sweden, Switzerland and Austria. Most of plantsoperate in co-digestion and, consequently, are fed with energycrops (mainly cereal silages), agricultural by-products (animalsewages) and residues from the agro-industry. For instance, inthe supply chain investigated by Ingrao et al. (2015a) agro-biogasis produced from a feedstock mixture made of animal effluents,maize and triticale silages and tritello, as one of the by-productsfrom durum wheat grain milling.
As a matter of fact, the main feedstock for these AD plants arecereal silages, among which maize one is by far the most used inGermany and Italy. Maize silage has high biomass yield, highmethane production and ease of storage (Negri et al., 2014a). InGermany, about 650.000 hectares were specifically grown for bio-gas production (Dressler et al., 2012). In Italy, 10% of the maize areais dedicated to biogas purposes (approximately 10.000 km2 in the2013 growing season) (Negri et al., 2014a).
Nowadays, in Italy, although the public subsidy framework hasbeen reduced, cereal silages, maize in particular, remain the keyfeedstock for agricultural AD plants. Over the years, the spread ofbiogas plants, often concentrated in specific areas (such as the pro-vinces of Cremona, Lodi and Mantua), resulted in a growth of con-cerns about the increasing amounts of agricultural lands that aretilled to feed digesters. Moreover, several AD plants are concen-trated in specific areas, thus resulting in an increase of biomasses’prices and transport distances. For instance, in the case of ADplants located on farms with little agricultural area, which is notsufficient to guarantee the biomass supply of digesters, the onlyachievable solution is to purchase the feedstock from the market.For the abovementioned reasons, the feedstock is often boughton the market and transported over long distances (Bacenettiet al., 2015c; Lijó et al., 2015). In these cases, even if the economicprofitability can be reached thanks to public subsidies, the environ-mental sustainability of such a solution cannot be taken forgranted. Long-distance transports of big amounts of biomass withhigh water content (and, consequently, low energy density) candeeply affect the environmental performances of thebiogas-to-electricity process (Dressler et al., 2012; Bacenettiet al., 2013, 2015c; Lijó et al., 2014a).
When the feedstock is transported over long distances, a propersolution could be to buy biomasses with high energy density. Thetransport of such biomasses (e.g., silages obtained by a high cut orby the ear only) to the AD plants can be more environmentally sus-tainable than the transport of silage harvested from the whole plant,despite the reduction of biogas producible per unit of area. Asregards maize, silage with a higher energy density than the conven-tional one (produced by harvesting the whole plant) can be pro-duced by harvesting the plant at high cut or only the ear. Whenthe plant is cut at high height (e.g., at 0.75 m), the basal portion, lig-nified and characterised by low biogas production, is left on the soil,while only the easily fermentable biomass is collected. When onlythe ear is harvested, silage with high energy density is produced,since only the plant portion rich in starch and organic matter (easilyfermentable) and with very high biogas production is harvested.
In the last decade, in order to evaluate the environmental per-formances of agricultural processes, Life Cycle Assessment (LCA)has become more and more employed. LCA is a methodology thataims to analyse products, processes or services from an environ-mental perspective [ISO 14040, 2006] (Guinée, 2002; ISO, 2006),providing a useful and valuable tool for agricultural systems eval-uation as well as for biogas process (Patterson et al., 2011; Moreroet al., 2015; Hahn et al., 2015).
LCA has evolved significantly during the past three decades, sobecoming more systematic and robust for both identification and
quantification of the environmental impacts associated with prod-ucts’ life-cycles (Ingrao et al., 2015b).
In this context, the aim of this paper is to analyse the environ-mental performances of methane production from three differentmaize silages characterised by different energy density, consider-ing increasing transport distances. Besides, to highlight the envi-ronmental hotspots of maize silage production, the main purposeof the study is to evaluate the distance beyond which the transportof silages with higher energy density becomes more environmen-tally sustainable in respect to the transport of the traditionalwhole-plant-harvested silage, which allows, however, the highestmethane production per hectare.
2. Methods
2.1. Goal and scope definition
The goal of this study is to assess the environmental impact ofthree maize silages characterised by different energy density con-sidering transport distances. The selected cereal crop is the mostcultivated in Northern Italy and it is the most used to feed ADplants.
The study analyses the following 3 different maize silages thatbelong to FAO Class 600 and 700:
(i) harvest of the whole plant (WP) cut at 10 cm height;(ii) harvest of the plant at a higher cut height (HC) equal to
0.75 m;(iii) harvest of the corn ear only (OE), harvested separately from
the rest of the plant.
For these three silages, the environmental impacts were evalu-ated using the LCA methodology considering increasing extra-farmtransport distances. With regard to biomass transport, two differ-ent solutions were analysed: (i) transport with farm trailers cou-pled with tractors; (ii) transport with trucks.
In more details, the research questions can be summarised asfollows:
(1) What is the environmental impact, expressed in term ofmethane production by anaerobic digestion, of maize silagefrom different plant portions?
(2) What are the main hotspots associated with the productionof the three maize silages analysed?
(3) Beyond which extra-farm distances become more environ-mental sustainable to transport silage with higher energydensity although they show a lower methane productionper hectare?
The outcomes of such an analysis can be helpful for farmers,farmer associations as well as technicians and local politiciansinvolved in the biogas-bioenergy process. In fact, the achievedresults can be useful both for all the agricultural processes in whichmaize silage is a feedstock (e.g., livestock activities, biogas produc-tion by anaerobic digestion) as well as for future studies in whichfeedstock must be transported.
2.2. Functional unit
The functional unit is an important step of any Life CycleAssessment since it provides the reference to which all other datain the assessment are normalised. With LCA’s application to agri-cultural processes, different functional units (FUs) can be selected.In many LCA studies of agricultural production systems, the FU isthe area (e.g., 1 ha). Nevertheless, the mass-based functional unitis prevalent in LCA studies of agricultural systems. However, the

258 J. Bacenetti et al. / Bioresource Technology 193 (2015) 256–265
mass of silage will not be a proper FU because the three maizesilages have different methane production. Therefore, in this study,1 m3 (20 �C and 1 bar) of potential methane production has beenconsidered as FU.
2.3. System boundaries and cropping system description
Maize cultivation was carried out on a farm sited in Lombardy, aregion located in the middle of the Po Valley. The global agricul-tural area of the experimental farm is 62.1 ha and it is cultivatedwith maize hybrids as single crop (32.3 ha), maize hybrids andwinter cereals as double crops (25.5 ha) and ryegrass (4.3 ha).The soil is of medium texture. The average rainfall is 745 mm peryear, with two minima in summer and winter. A good water avail-ability is usual in summer as well, as the area is surrounded bymountains and characterised by efficient irrigation systems suchas lakes, rivers, canals and ditches (Bacenetti et al., 2015a).
As regards cereals cultivation in the Po Valley, the crop cycle ischaracterised by a standardised sequence of field operations, sim-ilar to cultivation practices already analysed in other studies(González-García et al., 2012; Bacenetti et al., 2014; Negri et al.,2014a; Bacenetti and Fusi, 2015; Noya et al., 2015).
For each of the maize hybrids analysed, the life cycle has beenincluded within the system boundaries (cradle-to-farm perspec-tive). Therefore, raw materials extraction (e.g., fossil fuels and min-erals), manufacture (e.g., seeds, fertilisers, and agriculturalmachines), use (diesel fuel consumption and derived combustionand tyre abrasion emissions), maintenance and final disposal ofmachines, and supply of inputs to the farm (e.g., fertilisers and her-bicides) were considered. Given the high level of mechanisation ofthe farm, the indirect environmental burdens of capital goods werealso included.
The cultivation practices are similar for all the three cases (WP,HC, OE) in study and are summarised as follows:
(i) organic fertilisation with 85 t ha�1 of digestate (averagecomposition N = 0.40% P2O5 = 0.08% K2O = 0.31%) carriedout with a slurry spreader coupled with a 90 kW tractor(working time 1.9 h ha�1; diesel consumption 44.6 kg ha�1);
(ii) soil tillage, a 35 cm depth ploughing (190 kW tractor,1.3 h ha�1; diesel consumption 22.8 kg ha�1) and two inter-ventions with rotary harrow (130 kW tractor, 0.9 h ha�1;diesel consumption 23.7 kg ha�1);
(iii) sowing, carried out with a precision drill seeder with thedensity of 60,000 plants ha�1 (20 kg ha�1 of seed) (90 kWtractor, 0.7 h ha�1; diesel consumption 5.7 kg ha�1);
(iv) crop management, which consists of (i) top mineral fertilisa-tion with prilled urea (60 kg ha�1 – 120 kW tractor,0.5 h ha�1; diesel consumption 2.1 kg ha�1), (ii) chemicalweed control with two treatments of Terbuthylazine
Fig. 1. Process schematization with particular reg
(4 kg ha�1) and Alaclor (1 kg ha�1) (80 kW tractor,0.6 h ha�1; diesel consumption 3.1 kg ha�1) and (iii) 5 irriga-tion treatments, the first carried out by means of a travellingsprinkler (600 m3 ha�1) while the remaining ones by surfaceirrigation (800 m3 ha�1 each) (pump coupled with a 80 kWtractor, 1.2 h ha�1; diesel consumption 10.1 kg ha�1);
(v) biomass harvesting at different heights or of the ear only bymeans of forage harvester, this operation involves the cropcutting and chopping (carried out by means of aself-propelled forage harvester 335 kW, 2.2 h ha�1; dieselconsumption 37.5 kg ha�1). For the harvest of the wholeplant no modifications of forager settings are needed,whereas for the harvest of high cut silage the cutting systemis kept at the specific height (0.75 m). For ear silage, in orderto separate the ear from the rest of the plant before the bio-mass chopping, the forager is equipped with a supplemen-tary cornhusker header;
(vi) cornstalks chopping with a cornstalk chopper coupled with atractor (80 kW, 1.5 h ha�1; diesel consumption 9.5 kg ha�1),carried out only where the harvesting was HC and OE.When WP is harvested, no cornstalks chopping is carriedout since the harvesting height is too little;
(vii) transport of the chopped maize, this operation can be carriedout directly with farm trailers used also during the harvest-ing (trailer coupled with tractor goes ahead beside the forageharvester) (90 kW tractor, diesel consumption 6.5 kg ha�1)(Fig. 1 – top) or can be performed with trucks (Fig. 1 – bot-tom). In this second case, the biomass is transported to thefarm with farm trailers (assumed distance 1 km) is unloadon the farm square and subsequently loaded up the trucksby means of tractors equipped with frontal loader (90 kWtractor, 0.05 h t�1; diesel consumption 0.11 kg t�1).Biomass losses (2.5% of the harvested biomass) have beenconsidered for this operation, only occurring for transportwith truck;
(viii) biomass ensilage, this operation involves the pressing of thechopped biomass in a horizontal silo made of concrete; it iscarried out with 2 tractors equipped with frontal loader(tractors 90 kW, 0.05 h t�1; diesel consumption 0.44 kg t�1).After the pressing, the biomass is covered by plastic film andis stored at least for 2 months before being usable as energyfeedstock for the AD plant. During the ensiling, dry matterlosses take place.
2.4. Life Cycle Inventory
Data concerning field operations, ensilage and transport to thefarm were directly measured on farm by means of farmer inter-views and farm surveys. In more details all the information about
ard to the two transport systems considered.

J. Bacenetti et al. / Bioresource Technology 193 (2015) 256–265 259
seeds, fertilisers, pesticides and water use were provided by thefarmer. Diesel fuel consumption was partly measured (by evaluat-ing the volume of fuel used to fill up fuel tanks to the brim) andpartly estimated (for harrowing and top fertilisation) using themodel SE3A (Fiala and Bacenetti, 2012) that considers the powerrequirements of the operative machines and their work capacities.For all the field operations, a proper coupling among tractors andimplements was considered.
Maize yield of fresh matter for FAO Class 600 and 700 was, forWP 80.54 and 83.98 t ha�1 respectively (29.80 and 30.15 t ha�1 ofdry matter, respectively); for HC 45.60 and 60.99 t ha�1, respec-tively (21.50 and 23.60 t ha�1 of dry matter, respectively); andfor OE 22.48 and 20.33 t ha�1, respectively (13.80 and 12.45 t ha�1
of dry matter, respectively). The biomass yields were measured bymeans of the farms’ weighbridge (Negri et al., 2014b). Dry matterlosses during the ensiling greatly depend on ensiling techniques,pressing, type of silos, climatic conditions, etc. With this regards,in accordance with other studies carried out in the same geo-graphic area using the same cereal silage, a dry matter loss equalto 12% has been considered (Borreani and Tabacco, 2014;Bacenetti and Fusi, 2015).
Data about chemical characterisation of the different maizesilages as well as about their methane potential comes from speci-fic laboratory tests (Negri et al., 2014a). In more details, theMethane Potential (m3 of CH4 per ton of digested silage) was eval-uated in Lab-scale unstirred fermenters placed in thermostaticbaths at 40 �C (Negri et al., 2014a). The inoculums were collectedfrom different full scale AD plants. The methane potential produc-tion for WP, HC and OE are reported in Table 1 for the two maizehybrids.
The emissions of N compounds due to fertilisers applicationwere computed according to the model proposed by Brentrupet al. (2000). In more details, emission in air of ammonia andnitrous oxide, and the emission in water of nitrate were evaluatedconsidering soil type, climatic conditions and agricultural manage-ment operations. Ammonia volatilisation from organic fertilisersapplication was assessed considering (i) air temperature, (ii) timebetween the application and the rainfall or the incorporation inthe soil; (iii) infiltration rate according to the fertiliser applicationcircumstances (e.g., presence on crop residues on the soil). NH3
emission from mineral fertiliser application was evaluated takinginto account: (i) the type of fertiliser and in more details its ammo-nium and urea content, (ii) the geographical location of the maizefields and its climatic conditions and soil properties. In moredetails, as regard to the ammonia volatilisation, considering thedigestate dry matter content (5% of fresh matter), spreading onnot compacted soil and on cornstalks chopped, a medium infiltra-tion rate was considered (Brentrup et al., 2000). Furthermore, tak-ing into account: (i) the temperature at the digestate spreadingtime (18 �C), (ii) the timing of soil incorporation (4 h after spread-ing), (iii) rainfall (no rain occur before soil incorporation); the
Table 1Methane production from by harvesting the different plant portions.
Plant portion FAO Class Methanea specificproduction
Methanea globalproduction
dm3 kg�1b m3 ha�1
Whole plant (WP) 600 342.16 10,212700 351.54 10,605
Only ear (OE) 600 576.43 7961700 618.76 7707
Plant cut at 0.75 m (HC) 600 442.75 9523700 414.58 9784
a 20 �C and 1 bar.b Mass fraction of dry matter.
ammonia losses, from application to soil incorporation, are equalto 25% of the applied NH4–N. The emission of nitrous oxide emis-sions were computed considering the emission factor proposed bythe IPCC (IPCC, 2006). Nitrate leaching was evaluated considering(i) nitrogen balance, (ii) field capacity in the effective rooting zone,(iii) rainfall, (iv) drainage water zone. In more details, the nitrogenbalance considers the supply of N coming both from the applica-tion of mineral and organic fertilisers, as well as from the Nreleased from crop residues mineralisation, and the N removalfrom the harvested biomass. Therefore, for what concerns HC andOE, where not the whole biomass is harvested, lower N removalhas been considered.
Phosphate emissions were calculated following Nemecek andKägi (2007). P emissions vary depending on the land use (e.g., ara-ble land or permanent pastures), on the type of fertiliser applied(e.g., organic or mineral and its specific P composition) and onthe type and duration of soil cover (in order to evaluate soil ero-sion). This model, therefore, calculates the leaching of solublephosphate to ground water, the run-off of soluble phosphate tosurface water and the erosion of soil particles containing phospho-rous. Two different phosphorus emissions to water were consid-ered: (i) P leaching to the ground water, assessed using 0.07 kgP ha�1 year�1 as average quantity of P leached to ground waterfor arable land; (ii) run-off to surface water calculated considering0.175 kg P ha�1 year�1 as average quantity of P lost through run-offfor open arable land. P emissions through erosion to surface waterswere not considered due to lack of information about the fractionof the eroded soil that reaches the rivers.
Table 2 summarises the data about fertilisation, nutrientremoval by the crop and nutrient emissions in air and water. Asregard to nutrient removal, it has been accounted considering thefollowing values: 3.75 kg N t1, 4.13 kg N t1 and 8.12 kg N t1 for WPHC and OE respectively (Negri et al., 2014b).
Climatic data for the year 2012, necessary for calculating fer-tilisers emissions, were obtained from the meteorological stationclosest to the farm.
Pesticide derived emissions were also estimated in accordancewith Margni et al. (2002). In more detail, the fraction of active sub-stances entering the soil is assumed to be 85% of the total massapplied quantity, around 5% of the pesticide rate stays on the plantand 10% is emitted into the air. The run-off of the active ingredientsfrom the soil into the water is assumed to be 10% maximum of thepesticide rate (Margni et al., 2002).
According to Frischknecht et al. (2007) the impact of capitalgoods was considered when the maintenance and depreciationcosts of capital equipment form a substantial part of the productprice. Therefore, only the environmental load of capital goods suchas tractors, equipments and trucks have been included while theone related to agricultural buildings and infrastructures wasexcluded.
Background data for the production of seed, diesel fuel, fertilis-ers, pesticides, tractors, equipment and trucks as well as about
Table 2Fertilisation and related emissions for the three maize cultivations.
Parameter Unit WP HC OE
Chopped maize yield fresh matter t ha�1 82.23 53.30 21.41Nitrogen content of biomass kg ha�1 3.75 4.13 8.12Digestate application t ha�1 85 85 85Urea application kg ha�1 60 60 60Nitrate leaching kg ha�1 0.00 86.30 132.60Ammonia volatilisation kg ha�1 54.22 54.22 54.22Dinitrogen oxide kg ha�1 3.64 3.64 3.64Phosphate leaching kg ha�1 0.346 0.346 0.346Phosphate run-off kg ha�1 1.687 1.687 1.687

260 J. Bacenetti et al. / Bioresource Technology 193 (2015) 256–265
transport were obtained from the Ecoinvent Database v.3(Ecoinvent, 2015). With regard to the amount of tractors andimplements, the necessary amounts for each field operation andvalues such as life span, annual working time and working timefor each operation, have been collected at farm and used to modifythe Ecoinvent unit process. Empty returns were considered fortrailers coupled with tractors as well as for trucks; a sensitivityanalysis was done with regard to this aspect (see Section 3.3.1).
Considering that the fields were previously dedicated to maizecultivation for silage and grain purpose with similar cultivationpractices (e.g., organic fertilisation before sowing and mineral topfertilisation), no change in the overall soil carbon content has beenassumed (González-García et al., 2012; Dressler et al., 2012;Bacenetti et al., 2014).
2.5. Life Cycle Impact Assessment (LCIA)
The characterisation factors reported by the ILCD method wereused. The following nine impact potentials were evaluated accord-ing to the selected method: climate change (CC), ozone depletion(OD), particulate matter (PM), photochemical ozone formation(POF), acidification (TA), freshwater eutrophication (FE), terrestrialeutrophication (TE), marine eutrophication (ME) and mineral, fos-sil and renewable resource depletion (MFRD).
3. Results and discussion
3.1. Field operations and ensiling
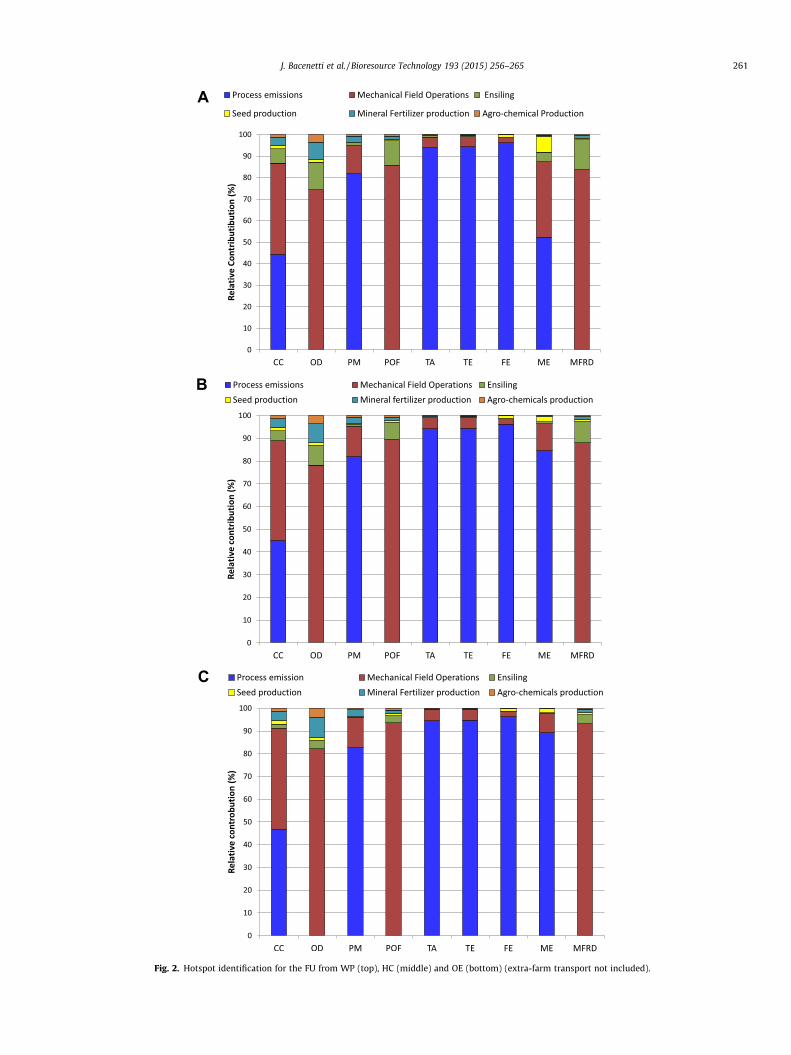
Table 3 reports the environmental impact for the FU consider-ing the silage produced by the different plant portions (WP, HCand OE) without extra farm transport; the process hotspots areshown in Fig. 2.
For all the evaluated impact categories, the methane producedfrom WP and OE shows the lowest and the highest impacts, respec-tively. Respect to WP, the FU impacts from HC and OE are 4–8% and21–33% higher, respectively. The most evident difference is in mar-ine eutrophication, where the environmental impact for HC is 3.3and the one of OE 5.5 times higher than WP.
For all the three case evaluated, the environmental hotspots ofthe cultivation are fertilisers emissions (mainly for TA, TE, FE, MEand PM), diesel fuel emissions (mainly for CC) and diesel fuel pro-duction (mainly for MFRD, OD and POF). The emissions related tofertiliser application (e.g., nitrogen leaching, ammonia volatilisa-tion, phosphorous erosion, etc.) are primarily responsible for TA(with a contribution of 94% for all the three WP, HC and OE), TE(94% for WP, HC and OE), FE (96% for WP, HC and OE), ME (52%,84% and 89% for WP, HC and OE, respectively). Mechanical fieldoperations play an important role for four of the nine evaluatedimpact categories, in particular: CC (44% for all the three WP, HCand OE), OD (74%, 78% and 82% on WP, HC and OE, respectively),
Table 3Environmental impact for 1 m3 of methane produced from the different plant portions (W
Impact category Unit
Climate change kg CO2 eqOzone depletion kg CFC-11 eqParticulate matter kg PM2.5 eqPhotochemical ozone formation kg NMVOC eqAcidification molc H + eqTerrestrial eutrophication molc N eqFreshwater eutrophication kg P eqMarine eutrophication kg N eqMineral, fossil and ren resource depletion kg Sb eq
POF (86%, 89% and 93% for WP, HC and OE, respectively) andMFRD (84%, 88% and 93% for WP, HC and OE, respectively).
With regard to ensiling operation, the impacts are more rele-vant on OD (13%, 8% and 3% for WP, HC and OE, respectively),POF (11%, 7% and 3% for WP, HC and OE, respectively) and MFRD(14%, 9% and 4% for WP, HC and OE, respectively).
Fertiliser production has a low impact on all categories, onlyaffecting more significantly OD (8%, 8% and 9% for WP, HC andOE, respectively). With this regard it should be considered thatmaize is mainly fertilised with organic fertilisers (whose produc-tion has no environmental impact because they are a waste pro-duct of another production system: the biogas production). Seedproduction plays a small role for all the evaluated impact cate-gories (<1.5%) as well as the agro-chemicals production (herbicidesand plant protection products) (<1%) except for OD (3.5%, 3.6% and4.0% for WP, HC and OE, respectively) and for CC (about 1.5% forWP, HC and OE).
3.2. Transport
Table 4 reports the environmental impact for the FU (absolutevalues and variations respect to 0 km of extra-farm transport)when the extra-farm transport is considered; in more detail, a dis-tance of 25 km is considered both for tractors and trucks and one of100 km only for trucks. All the environmental effects show a linearimpact increase at the increase of transport distances; the impactcategories mostly influenced by diesel fuel production and con-sumption (CC, OD, POF and, above all, MFRD) show the highestincreases at distance rise, while other impact categories, mainlyrelated to emissions from fertilisers applications (TA, TE, and FE)show a smaller increase. For all the evaluated impact categoriesthe impact increase due to the transport is higher for the FU pro-duced from WP while is smaller for OE. In more details, for boththe transport systems, except for ME, this increase for 1 m3 ofmethane produced from WP is about 1.5 times the one detectedfor HC and about 3.5–4.0 times the one for OE.
Fig. 3 shows the variation in environmental impact for the FUfor the impact categories mainly affected by the extra-farm trans-port distances.
3.2.1. By tractorsAs regard to the transport with farm trailers coupled with trac-
tors, it is possible to detect the break-even transport distancesbeyond which the transport of maize silage with a higher energydensity (i.e., OE and HC) shows a lower environmental impactrespect to silage from the WP. In more details:
(1) for CC, until 8 km the environmental impact of 1 m3 ofmethane produced from WP silage has the lowest impact,while beyond this distance the FU from HC shows the lowestimpact; when the distance is longer than 18 km, OE resultsmore interesting than WP as well (Fig. 3– top on the left);
P, HC and OE) with an extra-farm transport distance equal to 0 km.
WP HC OE
2.58E�01 2.75E�01 3.28E�011.83E�08 1.93E�08 2.22E�084.70E�04 5.07E�04 6.21E�041.25E�03 1.33E�03 1.54E�031.86E�02 2.00E�02 2.46E�028.28E�02 8.92E�02 1.10E�017.44E�05 8.02E�05 9.67E�051.01E�03 3.33E�03 5.55E�033.20E�06 3.32E�06 3.86E�06
A
B
C
Fig. 2. Hotspot identification for the FU from WP (top), HC (middle) and OE (bottom) (extra-farm transport not included).
J. Bacenetti et al. / Bioresource Technology 193 (2015) 256–265 261

Table 4Environmental impact increase due to the transport for 1 m3 of CH4 produced from the different maize plant portion (PP) (D = variation respect to 0 km of extra-farm transport).
Impact category PP Extra-farm distance Tractor Truck
Extra-farm distance D Extra-farm distance D Extra-farm distance D0 km 25 km % 25 km % 100 km %
CC kg CO2 eq WP 2.58E�01 3.96E�01 53.5% 3.09E�01 19.8% 4.42E�01 71.3%HC 2.75E�01 3.72E�01 35.1% 3.11E�01 13.0% 4.04E�01 46.8%OE 3.28E�01 3.76E�01 14.6% 3.46E�01 5.4% 3.92E�01 19.5%
OD kg CFC-11 eq WP 1.83E�08 3.45E�08 88.7% 2.64E�08 44.2% 4.84E�08 164.3%HC 1.93E�08 3.06E�08 58.7% 2.49E�08 29.3% 4.03E�08 108.8%OE 2.22E�08 2.78E�08 25.3% 2.50E�08 12.6% 3.26E�08 46.9%
PM kg PM2.5 eq WP 4.70E�04 5.52E�04 17.4% 4.87E�04 3.6% 5.25E�04 11.8%HC 5.07E�04 5.64E�04 11.3% 5.19E�04 2.3% 5.46E�04 7.6%OE 6.21E�04 6.49E�04 4.5% 6.26E�04 0.9% 6.40E�04 3.0%
POF kg NMVOC eq WP 1.25E�03 2.40E�03 91.8% 1.53E�03 22.4% 2.19E�03 74.9%HC 1.33E�03 2.13E�03 60.4% 1.53E�03 14.9% 1.99E�03 49.4%OE 1.54E�03 1.93E�03 25.4% 1.63E�03 5.9% 1.86E�03 20.7%
AT molc H + eq WP 1.86E�02 1.96E�02 5.3% 1.88E�02 1.1% 1.94E�02 4.1%HC 2.00E�02 2.07E�02 3.6% 2.02E�02 0.9% 2.06E�02 2.8%OE 2.46E�02 2.49E�02 1.3% 2.47E�02 0.3% 2.49E�02 1.0%
TE molc N eq WP 8.28E�02 8.68E�02 4.8% 8.37E�02 1.1% 8.58E�02 3.6%HC 8.92E�02 9.20E�02 3.2% 8.99E�02 0.7% 9.13E�02 2.4%OE 1.10E�01 1.11E�01 0.9% 1.10E�01 �0.1% 1.11E�01 0.5%
FE kg P eq WP 7.44E�05 7.81E�05 5.0% 7.49E�05 0.7% 7.60E�05 2.1%HC 8.02E�05 8.28E�05 3.2% 8.06E�05 0.5% 8.13E�05 1.4%OE 9.67E�05 9.79E�05 1.3% 9.68E�05 0.1% 9.72E�05 0.5%
ME kg N eq WP 1.01E�03 1.37E�03 36.0% 1.03E�03 1.9% 1.03E�03 1.9%HC 3.33E�03 3.58E�03 7.6% 3.39E�03 1.7% 3.52E�03 5.6%OE 5.55E�03 5.68E�03 2.3% 5.58E�03 0.6% 5.65E�03 1.7%
MFRD kg Sb eq WP 3.20E�06 1.02E�05 218.6% 5.17E�06 61.6% 1.02E�05 218.9%HC 3.32E�06 8.21E�06 147.3% 4.70E�06 41.6% 8.22E�06 147.5%OE 3.86E�06 6.28E�06 62.6% 4.54E�06 17.6% 6.28E�06 62.7%
Fig. 3. Variation of the environmental impact for the impact categories mainly affected by the extra-farm transport for both the considered transport systems (farm trailerscoupled with tractors and trucks).
262 J. Bacenetti et al. / Bioresource Technology 193 (2015) 256–265
Table 5Emissions related to fertilisers application.
Parameter Unit HC OE
Nitrate leaching kg ha�1 1.40 0.10Ammonia volatilisation kg ha�1 36.64 26.67Dinitrogen oxide kg ha�1 2.46 1.80Phosphate leaching kg ha�1 0.300 0.276Phosphate run-off kg ha�1 1.281 1.078
J. Bacenetti et al. / Bioresource Technology 193 (2015) 256–265 263
(2) for OD, methane from HC gets more interesting than fromWP at 3 km extra farm transport distance, while OE getsmore interesting than WP at 7 km; beyond 12 km OE showsbetter results than HC as well (Fig. 3 – top on the right);
(3) for POF, until 3 km WP is the best solution, from 4 km to11 km the FU from HC has the lowest impact, while beyondthis distance methane from OE shows the lowest environ-mental burdens. The break-even distance between WP andOE is 7 km (Fig. 3 – bottom on the left);
(4) for MFRD the break-even distances occur within few km dis-tance: already at 1 km the methane from HC shows a lowerimpact than the one from WP, until 6 km HC is the best solu-tion, and beyond this extra farm distance the FU from OEshows the lowest environmental burdens, with thebreak-even distance between WP and OE equal to 3 km(Fig. 3 – bottom on the right);
(5) for PM, TA, TE, FE and ME, no lines cross each other along theevaluated extra farm transport distance; the methane fromWP always shows the lowest environmental impact.
3.2.2. By trucksWhen the extra farm transport is performed with trucks, for all
the evaluated impact categories, there is a linear increase. Fortransport with trucks, respect to that with trailers and tractors,the lines show a smaller slope and the impact increase is lowerwhen the same extra-farm distance is considered. However, alsofor trucks, the break-even transport distance among the methaneproduced from the different maize feedstock can be identified, indetails:
(i) for what concerns CC the environmental impact of 1 m3 ofmethane transported for distances below 29 km is moreinteresting for WP; beyond this distance, transportingmethane from HC has a lower impact than WP, which alsoresults lower at 57 km for OE instead of WP and beyond80 km for OE instead of HC (Fig. 3 – top on the left);
(ii) for OD, methane from HC has the break-even distance withWP beyond 8 km; OE is better than WP and HC at distanceslonger than 18 km and 25 km, respectively (Fig. 3 – top onthe right);
(iii) for POF impact category, beyond 23 km methane from HCbecomes more interesting than transporting the one fromWP, while beyond 44 km the methane from OE has a lowerimpact than WP and beyond 61 km also lower than HC(Fig. 3 – bottom on the left);
(iv) for MFRD the break-even distance between methane fromHC and from WP results already after 2 km; beyond 10 kmmethane from OE shows lower impacts than WP and beyond18 km lower than HC as well (Fig. 3 – bottom on the right);
(v) for PM, TA, TE, FE and ME, the methane from the three bio-masses lines never cross each other within the evaluatedextra-farm transport distance; the methane from WP alwayshas the lowest environmental impact.
3.3. Discussion
The achieved results about the production of maize silage high-lighted the importance of energy density when the chopped maizeis transported. The methane from OE, although it involves a lowermethane production per hectare, can be the best solution for a lowenvironmental impact when extra-farm transport is performed.When the transport is considered, the specific methane productionand, consequently, the energy density of the feedstock, is a keyaspect able to offset the differences regarding the methane produc-tion per hectare. Respect to the FU, thanks to the different methaneproduction (126.4 m3 t�1 fresh matter, 188.0 m3 t�1 of fresh
matter, 348.7 m3 t�1 of fresh matter) (Negri et al., 2014b), trans-porting OE and HC has an environmental impact considerablylower in respect to WP (-30% and -65% for HC and OE, respectively).For all the evaluated impact categories, when increasingextra-farm transport distances are considered, the environmentalimpact of the FU increases. However, this growth is faster for themethane produced from maize feedstock characterised by lowerenergy density (WP) due to the lower specific methane production.For CC, OD, POF and MFRD, WP achieves the better environmentalperformances only for short distances but, when the distanceincreases, the silages with higher energy density (HC and OE) showlower environmental impact. However, for the impact categoriesaffected by N and P emissions such as AP, TE, ME and FE to harvestthe whole plant stays the most environmentally friendly solutionalso for considerable extra-farm distances (>100 km). The compar-ison between the two transport alternatives shows that, even forsmall extra-farm distances, the use of trucks achieves better envi-ronmental performances respect to the transport by farm trailerscoupled tractors; this is due to the considerably higher environ-mental load associated with the transport by tractors. For distancesgreater than 2–20 km (depending on the impact category), totransport the chopped maize with trucks achieves better environ-mental performances respect to the use of farm trailers, this occurseven if 2.5% of the harvested biomass is lost due to unloading andloading operations. Nevertheless, it must be considered that know-ing the machines that compose the usual farm machinery fleet ofNorth-Italian farms, it is not realistic to assume that farmers, usu-ally equipped with tractors and trailers, resort trucks for transport-ing biomass. Nevertheless, this solution can be interesting only forlong extra-farm transport distances and when a limited number oftrailers and tractors is available in the farm machinery fleet or dur-ing the harvesting.
3.3.1. Sensitivity analysisTo test the robustness of the achieved results, a sensitivity anal-
ysis was carried out. A set of parameters/conditions were changed,and their influence on the environmental impact of the FU wasevaluated. In more detail, to run the sensitivity analysis:
(i) as regard to the methane volume per hectare, the minimumand maximum values recorded in the experimental tests(see Table 1) were considered;
(ii) concerning the extra farm transport, both for trailers cou-pled with tractors and trucks, the load factor for the returntrip (0% in the Baseline Scenario – empty return) wasincreased to 50% considering the possibility to transportother feedstock/goods;
(iii) with regard to the fertilisation, considering that the produc-tion of maize silage from OE is characterised by higher nutri-ent losses (e.g., nitrate leaching) due to a lower nutrientremoval by the crop, the possibility to differently fertilisethe crop according the harvested plant portion has been eval-uated. Respect to the baseline scenario (see Table 2), fertilisa-tion has been reduced to 55 t ha�1 of digestate (keepingconstant the urea application) for HC, and to 40 t ha�1 ofdigestate and 45 kg ha�1 of urea for OE; Table 5 reports theemissions calculated according to these fertilisation schemes.
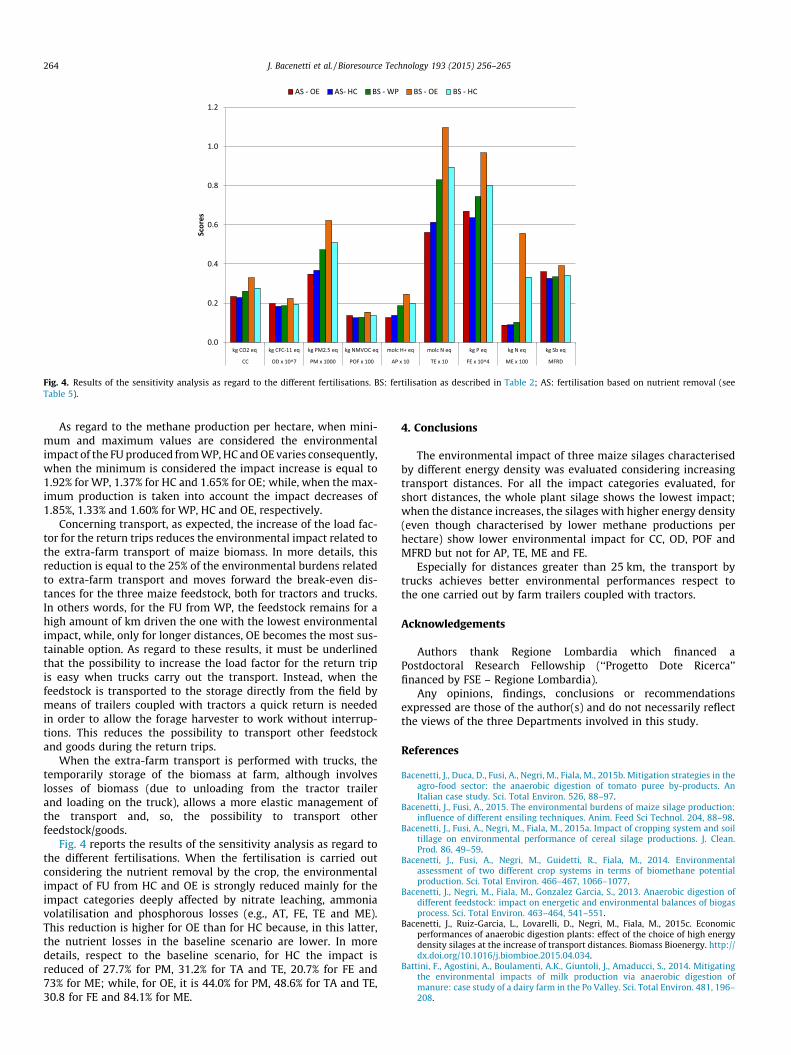
Fig. 4. Results of the sensitivity analysis as regard to the different fertilisations. BS: fertilisation as described in Table 2; AS: fertilisation based on nutrient removal (seeTable 5).
264 J. Bacenetti et al. / Bioresource Technology 193 (2015) 256–265
As regard to the methane production per hectare, when mini-mum and maximum values are considered the environmentalimpact of the FU produced from WP, HC and OE varies consequently,when the minimum is considered the impact increase is equal to1.92% for WP, 1.37% for HC and 1.65% for OE; while, when the max-imum production is taken into account the impact decreases of1.85%, 1.33% and 1.60% for WP, HC and OE, respectively.
Concerning transport, as expected, the increase of the load fac-tor for the return trips reduces the environmental impact related tothe extra-farm transport of maize biomass. In more details, thisreduction is equal to the 25% of the environmental burdens relatedto extra-farm transport and moves forward the break-even dis-tances for the three maize feedstock, both for tractors and trucks.In others words, for the FU from WP, the feedstock remains for ahigh amount of km driven the one with the lowest environmentalimpact, while, only for longer distances, OE becomes the most sus-tainable option. As regard to these results, it must be underlinedthat the possibility to increase the load factor for the return tripis easy when trucks carry out the transport. Instead, when thefeedstock is transported to the storage directly from the field bymeans of trailers coupled with tractors a quick return is neededin order to allow the forage harvester to work without interrup-tions. This reduces the possibility to transport other feedstockand goods during the return trips.
When the extra-farm transport is performed with trucks, thetemporarily storage of the biomass at farm, although involveslosses of biomass (due to unloading from the tractor trailerand loading on the truck), allows a more elastic management ofthe transport and, so, the possibility to transport otherfeedstock/goods.
Fig. 4 reports the results of the sensitivity analysis as regard tothe different fertilisations. When the fertilisation is carried outconsidering the nutrient removal by the crop, the environmentalimpact of FU from HC and OE is strongly reduced mainly for theimpact categories deeply affected by nitrate leaching, ammoniavolatilisation and phosphorous losses (e.g., AT, FE, TE and ME).This reduction is higher for OE than for HC because, in this latter,the nutrient losses in the baseline scenario are lower. In moredetails, respect to the baseline scenario, for HC the impact isreduced of 27.7% for PM, 31.2% for TA and TE, 20.7% for FE and73% for ME; while, for OE, it is 44.0% for PM, 48.6% for TA and TE,30.8 for FE and 84.1% for ME.
4. Conclusions
The environmental impact of three maize silages characterisedby different energy density was evaluated considering increasingtransport distances. For all the impact categories evaluated, forshort distances, the whole plant silage shows the lowest impact;when the distance increases, the silages with higher energy density(even though characterised by lower methane productions perhectare) show lower environmental impact for CC, OD, POF andMFRD but not for AP, TE, ME and FE.
Especially for distances greater than 25 km, the transport bytrucks achieves better environmental performances respect tothe one carried out by farm trailers coupled with tractors.
Acknowledgements
Authors thank Regione Lombardia which financed aPostdoctoral Research Fellowship (‘‘Progetto Dote Ricerca’’financed by FSE – Regione Lombardia).
Any opinions, findings, conclusions or recommendationsexpressed are those of the author(s) and do not necessarily reflectthe views of the three Departments involved in this study.
References
Bacenetti, J., Duca, D., Fusi, A., Negri, M., Fiala, M., 2015b. Mitigation strategies in theagro-food sector: the anaerobic digestion of tomato puree by-products. AnItalian case study. Sci. Total Environ. 526, 88–97.
Bacenetti, J., Fusi, A., 2015. The environmental burdens of maize silage production:influence of different ensiling techniques. Anim. Feed Sci Technol. 204, 88–98.
Bacenetti, J., Fusi, A., Negri, M., Fiala, M., 2015a. Impact of cropping system and soiltillage on environmental performance of cereal silage productions. J. Clean.Prod. 86, 49–59.
Bacenetti, J., Fusi, A., Negri, M., Guidetti, R., Fiala, M., 2014. Environmentalassessment of two different crop systems in terms of biomethane potentialproduction. Sci. Total Environ. 466–467, 1066–1077.
Bacenetti, J., Negri, M., Fiala, M., Gonzalez Garcia, S., 2013. Anaerobic digestion ofdifferent feedstock: impact on energetic and environmental balances of biogasprocess. Sci. Total Environ. 463–464, 541–551.
Bacenetti, J., Ruiz-Garcia, L., Lovarelli, D., Negri, M., Fiala, M., 2015c. Economicperformances of anaerobic digestion plants: effect of the choice of high energydensity silages at the increase of transport distances. Biomass Bioenergy. http://dx.doi.org/10.1016/j.biombioe.2015.04.034.
Battini, F., Agostini, A., Boulamenti, A.K., Giuntoli, J., Amaducci, S., 2014. Mitigatingthe environmental impacts of milk production via anaerobic digestion ofmanure: case study of a dairy farm in the Po Valley. Sci. Total Environ. 481, 196–208.
J. Bacenetti et al. / Bioresource Technology 193 (2015) 256–265 265
Borreani, G., Tabacco, E., 2014. Improving corn silage quality in the top layer of farmbunker silos through the use of a next-generation barrier film with highimpermeability to oxygen. J. Dairy Sci. 97, 2415–2426.
Brentrup, F., Küsters, J., Lammel, J., Kuhlmann, H., 2000. Methods to estimate on-field nitrogen emissions from crop production as an Input to LCA studies in theAgricultural Sector. Int. J. Life Cycle Assess. 5, 349–357.
Dressler, D., Loewen, A., Nelles, M., 2012. Life cycle assessment of the supply and useof bioenergy: impact of regional factors on biogas production. Int. J. Life CycleAssess. 17 (9), 1104–1115.
Ecoinvent Database (www.ecoinvent.org).European Commission, 2014. COM/2014/015 final, A policy framework for climate
and energy in the period from 2020 to 2030, 1–18.Fiala, M., Bacenetti, J., 2012. Model for the economic, energetic and environmental
evaluation in biomass productions. J. Agr. Eng. 42, 26–35.Frischknecht, R., Jungbluth, N., Althaus, H.J., Doka, G., Heck, T., Hellweg, S., Hischier,
R., Nemecek, T., Rebitzer, G., Spielmann, M., Wernet, G., 2007. Overview andMethodology. Ecoinvent report No. 1. Swiss Centre for Life Cycle Inventories,Dübendorf.
German Biogas Association, 2015. Biogas an all-rounder New opportunities forfarming, industry and the environment, 4th fully revised edition, 1–102 (http://www.german-biogas-industry.com).
González-García, S., Bacenetti, J., Negri, M., Fiala, M., Arroja, L., 2012. Comparativeenvironmental performance of three different annual energy crops for biogasproduction in Northern Italy. J. Clean. Prod. 43, 71–83.
Guinée J.B. (Ed.), Handbook on Life Cycle Assessment, Operational Guide to the ISOStandards, 2002, 1–708.
Hahn, H., Hartmann, K., Bühle, L., Wachendorf, M., 2015. Comparative life cycleassessment of biogas plant configurations for a demand oriented biogas supplyfor flexible power generation. Bioresour. Technol. 179, 348–358.
Ingrao, C., Rana, R., Tricase, C., Lombardi, M., 2015a. Application of Carbon Footprintto an agro-biogas supply chain in Southern Italy. Appl. Energy 149, 75–88.
Ingrao, C., Matarazzo, A., Tricase, C., Clasadonte, M.T., Huisingh, D., 2015b. Life CycleAssessment for highlighting environmental hotspots in Sicilian peachproduction systems. J. Clean. Prod. 92, 109–120.
IPCC, Agriculture, Forestry and Other Land Use. In: Eggleston et al., IPCC Guidelinesfor National Greenhouse Gas Inventories, Prepared by the National GreenhouseGas Inventories Programme, 2006.
ISO, 2006. ISO 14040-environmental management – life cycle assessment –principles and framework. ISO, Geneva.
Lijó, L., González-García, S., Bacenetti, J., Fiala, M., Feijoo, G., Lema, J.M., Moreira,M.T., 2014a. Life Cycle Assessment of electricity production in Italy formanaerobic co-digestion of pig slurry and energy crops. Renewable Energy 68,625–635.
Lijó, L., González-García, S., Bacenetti, J., Fiala, M., Feijoo, G., Moreira, M.T., 2014b.Assuring the sustainable production of biogás from anaerobic mono-digestion.J. Clean. Prod. 72, 23–34.
Lijó, L., González-García, S., Bacenetti, J., Negri, M., Fiala, M., Feijoo, G., Moreira, M.T.,2015. Environmental assessment of farm-scaled anaerobic co-digestion forbioenergy production. Waste Manage. 2015. http://dx.doi.org/10.1016/j.wasman.2015.03.043.
Margni, M., Rossier, D., Crettaz, P., Jolliet, O., 2002. Life cycle impact assessment ofpesticides on human health and ecosystems. Agr. Ecosyst. Environ. 93 (1–3),379–392.
Mauky, E., Jacobi, H.F., Liebetrau, J., Nelles, M., 2015. Flexible biogas production fordemand-driven energy supply – feeding strategies and types of substrates.Bioresour. Technol. 178, 262–269.
Morero, B., Rodriguez, M.B., Campanella, E.A., 2015. Environmental impactassessment as a complement of life cycle assessment. Case study: upgradingof biogas. Bioresour. Technol. http://dx.doi.org/10.1016/j.biortech.2015.04.091.
Negri, M., Bacenetti, J., Brambilla, M., Manfredini, A., Cantore, C., Bocchi, S., 2014a.Biomethane production from different crop systems of cereals in Northern Italy.Biomass Bioenergy 63, 321–329.
Negri, M., Bacenetti, J., Manfredini, A., Lovarelli, D., Fiala, M., Maggiore, T.M., Bocchi,S., 2014b. Evaluation of methane production from maize silage by harvest ofdifferent plant portions. Biomass Bioenergy 67, 339–346.
Nemecek T., Kägi T., 2007. Life cycle inventory of agricultural production systems.Ecoinvent report 15. Ecoinvent report, 2007. Swiss Centre for Life CycleInventories, Dübendorf.
Noya, I., Bacenetti, J., Negri, M., Arroja, L., Moreira, M.T., González-García, S., 2015.Comparative environmental profile of cereal cultivation for feed and foodproduction in Lombardy region (Italy). J. Clean. Prod. http://dx.doi.org/10.1016/j.jclepro.2015.03.001.
Patterson, T., Estevens, S., Dinsdale, R., Guwy, A., 2011. Life cycle assessment ofbiogas infrastructure options on a regional scale. Bioresour. Technol. 102 (15),7313–7323.
Whiting, A., Azapagic, A., 2014. Life cycle environmental impacts of generatingelectricity and heat from biogas produced by anaerobic digestion. Energy 70,181–193.
Copyright © 2022 FDOKUMEN