assessment of the damage caused by hurricane keith, 2000
95
Distr. RESTRICTED LC/CAR/G.627 LC/MEX/G.4 30 November 2000 ORIGINAL: ENGLISH BELIZE: ASSESSMENT OF THE DAMAGE CAUSED BY HURRICANE KEITH, 2000 Implications for Economic, Social and Environmental Development _________________________ This document has not undergone formal editing. 00-11
-
Upload
khangminh22 -
Category
Documents
-
view
3 -
download
0
Transcript of assessment of the damage caused by hurricane keith, 2000
Distr.RESTRICTEDLC/CAR/G.627LC/MEX/G.430 November 2000
ORIGINAL: ENGLISH
BELIZE: ASSESSMENT OF THE DAMAGE CAUSEDBY HURRICANE KEITH, 2000
Implications for Economic, Social andEnvironmental Development
_________________________This document has not undergone formal editing.
00-11

iii
Contents
Page
EXECUTIVE SUMMARY .................................................................................... v
PREFACE ..................................................................................................... 1
I. BACKGROUND ...................................................................................... 3
1. The mission ........................................................................................ 82. Description of the phenomenon and its effects .................................... 93. Population affected............................................................................. 154. Emergency actions.............................................................................. 19
II. ASSESSMENT OF THE DAMAGE ........................................................ 24
1. Social sectors ..................................................................................... 242. Damage in productive sectors ............................................................. 333. Infrastructure...................................................................................... 454. Effects on the environment ................................................................. 61
III. MACROECONOMIC EFFECTS.............................................................. 71
1. Summary of damage ........................................................................... 712. The pre-disaster situation.................................................................... 733. Economic forecast and outturn during 2000........................................ 764. Fiscal policy and the central government’s finances............................. 815. Effects on population’s income........................................................... 816. External sector and prices................................................................... 827. Effect on rate of investment ................................................................ 838. Effect on rate of savings ..................................................................... 83
IV. GUIDELINES FOR A REHABILITATION AND RECONSTRUCTIONPROGRAMME ........................................................................................ 84
1. Project generation............................................................................... 852. Rehabilitation stage ............................................................................ 863. Reconstruction stage .......................................................................... 87
Photographic Annex ............................................................................................... 89
v
EXECUTIVE SUMMARY
Following the significant physical damage and economic losses that this country sustained as aresult of Hurricane Keith, a request for this social, environmental and economic impactassessment was submitted to the Economic Commission for Latin America and the Caribbean(ECLAC) by the Prime Minister of Belize, Hon. Said Musa, on 12 October 2000. This appraisalconsiders the consequences of the Hurricane’s passing over the northern half of this country andthe outlying keys (“cayes”) from 30 September to 1 October 2000.
The study undertakes a sector by sector analysis leading to an overall assessment of thedamage; it appraises the macroeconomic and environmental effects and proposes some guidelinesfor rehabilitation and reconstruction programmes. To carry out this task full co-operation wasreceived from national authorities, the Inter American Development Bank (IDB), the InterAmerican Institute for Cooperation on Agriculture (IICA), the United Nations DevelopmentProgramme (UNDP) and other United Nations agencies. Officials and consultants of the PanAmerican Health Organization (PAHO/WHO) and of the United Nations Children’s Fund(UNICEF) joined the mission. This assessment complements the Compilation of Damage andNeeds Assessments, Response and Rehabilitation Plans in connection with Hurricane Keithprepared for the United Nations Disaster Assistance Coordinator (UNDAC) by UNDP, UNICEFand PAHO. The direct and indirect damage has been assessed in accordance with themethodology developed by ECLAC. The results are based on the mission’s estimates; the studyincorporates the information available and evidence collected in interviews and visits to affectedlocations.
It is ECLAC’s and the Government of Belize intention to emphasise the need for areconstruction process that reduces the country’s vulnerability, is compatible with itsdevelopment strategy and can be implemented within the government’s and the private sector’sabsorption capacity. It is estimated that the magnitude of the losses exceeds the country’scapacity to address reconstruction needs on its own, particularly if the aim is also to reduce theimpact of similar events in the future, and therefore international cooperation is consideredessential.
The Belize society and government face the opportunity of undertaking the reconstructionwith renewed values and criteria, embarking on institutional, legal and structural reforms toreduce economic, social and environmental vulnerability. Just as Hurricane Hattie over fortyyears ago transformed Belizeans attitude toward hurricane threats and led to important relocationof public and administrative functions, Keith – following closely the footsteps of Mitch – couldbecome an important instrument for a changed attitude to environmental and risk management.An important aspect of such reforms will be to strengthen the country’s savings, investment andmanagement capacity as part of the reconstruction.
Total damage is estimated at BZ$560.1 million (US$280 million), of which directdamage, estimated at BZ$423.3 million (US$211.6 million) constitutes about 75 per cent. Directdamages were valued at present value or replacement cost at current prices – whichever seemed
vi
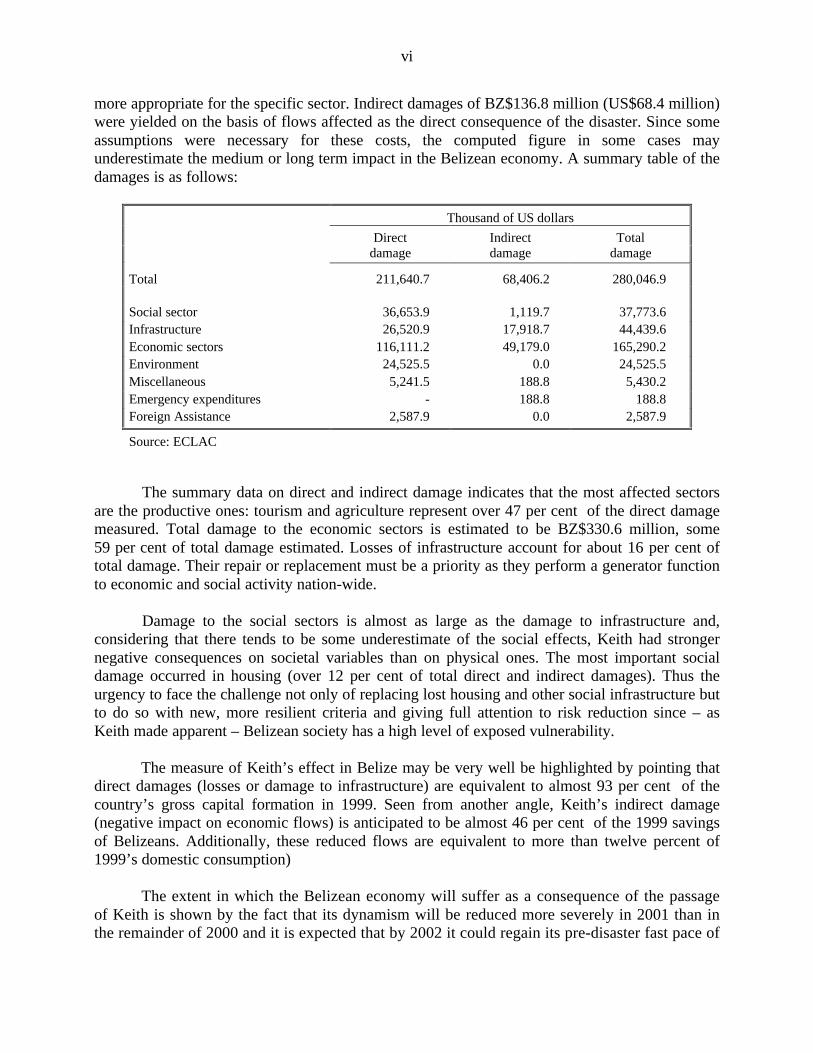
more appropriate for the specific sector. Indirect damages of BZ$136.8 million (US$68.4 million)were yielded on the basis of flows affected as the direct consequence of the disaster. Since someassumptions were necessary for these costs, the computed figure in some cases mayunderestimate the medium or long term impact in the Belizean economy. A summary table of thedamages is as follows:
Thousand of US dollars
Direct Indirect Totaldamage damage damage
Total 211,640.7 68,406.2 280,046.9
Social sector 36,653.9 1,119.7 37,773.6Infrastructure 26,520.9 17,918.7 44,439.6Economic sectors 116,111.2 49,179.0 165,290.2Environment 24,525.5 0.0 24,525.5Miscellaneous 5,241.5 188.8 5,430.2Emergency expenditures - 188.8 188.8Foreign Assistance 2,587.9 0.0 2,587.9
Source: ECLAC
The summary data on direct and indirect damage indicates that the most affected sectorsare the productive ones: tourism and agriculture represent over 47 per cent of the direct damagemeasured. Total damage to the economic sectors is estimated to be BZ$330.6 million, some59 per cent of total damage estimated. Losses of infrastructure account for about 16 per cent oftotal damage. Their repair or replacement must be a priority as they perform a generator functionto economic and social activity nation-wide.
Damage to the social sectors is almost as large as the damage to infrastructure and,considering that there tends to be some underestimate of the social effects, Keith had strongernegative consequences on societal variables than on physical ones. The most important socialdamage occurred in housing (over 12 per cent of total direct and indirect damages). Thus theurgency to face the challenge not only of replacing lost housing and other social infrastructure butto do so with new, more resilient criteria and giving full attention to risk reduction since – asKeith made apparent – Belizean society has a high level of exposed vulnerability.
The measure of Keith’s effect in Belize may be very well be highlighted by pointing thatdirect damages (losses or damage to infrastructure) are equivalent to almost 93 per cent of thecountry’s gross capital formation in 1999. Seen from another angle, Keith’s indirect damage(negative impact on economic flows) is anticipated to be almost 46 per cent of the 1999 savingsof Belizeans. Additionally, these reduced flows are equivalent to more than twelve percent of1999’s domestic consumption)
The extent in which the Belizean economy will suffer as a consequence of the passageof Keith is shown by the fact that its dynamism will be reduced more severely in 2001 than inthe remainder of 2000 and it is expected that by 2002 it could regain its pre-disaster fast pace of

vii
growth. Its impact in 2000 will reduce the estimated rate of growth by one percentage point(from a forecasted 6.9 to only 5.9). This will open a gap between the expected evolution of theeconomy as was being forecasted before Keith and the actual development patch that will ensue– having consequences at least till 2000, as is shown by the following graph:
The hurricane has no doubt set back the government’s poverty alleviation strategy thathad set a target on containment of the Central Government deficit to no more than 2 per cent ofGDP. With the new estimate indicating a fiscal deficit of 3 per cent of GDP, the target of povertyalleviation may have moved somewhat, delaying its achievement. Any alternative strategy thatkeeps the attainment of the poverty alleviation date fixed at the previously targeted date willplace the foreign exchange parity at risk.
Hurricane Keith has impacted macroeconomic performance in a number of ways. Therehas been a fall-off in economic activity as attested to by the loss of property, hours of work, theloss of business and the loss of crops. These have impacted negatively on livelihoods, althoughthe impact has not had an even incidence over the population. As an example, the subsistencefarmers in the Orange Walk district and the lobster fishermen operating on Ambergris Caye who,because of the loss of their crops and fishing gear, respectively, are unable to feed their families,merit some consideration for relief. Export earnings from fishing are expected to decline in 2001.
Exports and export earnings are estimated to have fallen as much damage was sustained inthe tourism areas and in areas that cultivate export crops. Whereas there are no firm figures toquantify the extent of the phenomenon, indications are that the poorer households have beenmore adversely affected in terms of damage and displacement than other income groups in thepopulation. The damage caused by the hurricane will also have implications on the import bill.
0.0
2.0
4.0
6.0
8.0
10.0
12.0
1998 1999 2,000.0 2001 2002
GDP growth, constant (2000) prices (after Keith)
Estimated GDP grouth, constant (2000) prices (withouth Keith)

viii
To the extent that direct damage will have to be repaired by reconstruction of houses and physicalplant for which there is a high import content of materials, possibly of the order of 70 to 85 percent of total cost of materials. On the other hand, to the extent that the damaged properties wereinsured, the settlement of insurance claims will result in capital inflows – a positive aspect of thecountry’s balance of payments. Further, the reconstruction effort will result in increased activityin construction, which, in turn will create conditions for increased demand. The upsurge inconstruction activity may, however, require the importation of labour from adjacent countries.
The loss of tourist visitors, when combined with the estimates of direct and indirectdamages to the sector will impact the balance of payments in the final three months of 2000 andinto 2001. An estimated impact on international trade puts the import figure at BZ$115.3 millionto be spread over the rest of 2000 and 2001.
With well-organized support from friendly donor countries pledging investments instrategic areas and with proper project sequencing, the balance of payments may be able to avoidthe pressure that would otherwise be brought to bear on the exchange rate parity of the country.
As an addendum to the document the mission has prepared a list of project profiles,currently being developed and some already with some degree of advance or development. Thepurpose of these profiles is to provide basic information on their aims, scope, expected results,activities and tasks to be carried out, investment to be made, expected financing, and the specialcharacteristics of each project.
The sectoral composition of the projects identified – in the amount of BZ$211.6 million(or US$105.8) is the following (in percentages):
Projects in social sectors 48.0
Health and sanitation 2.5
Education 1.4
Housing 44.1
Energy, water supply, sanitation andtelecommunications
6.1
Transport subsector 15.8
Productive sectors 24.8
Agriculture 24.3
Tourism 0.5
Environmental management 5.3
Prevention and mitigation 0.0
On occasion an event like Keith – fortunately enough without major losses of lives as hasrecently occurred in other countries – opens the opportunity for a change of policy and a soul-searching effort to avoid preserving or aggravating presently negative trends. Certainly Keithrepresents an economic setback in some aspects but it may be just the kind of reminder needed togive a hard look to ongoing processes that may be rectified.

ix
It will be important – on the basis of this occurrence – to set priorities and consider thetime frame and the necessary changes to design, construction and land use regulations in keepingwith the situation in each country. In any event, reconstruction should be carried out on the basisof a significant qualitative improvement over the previous circumstances.

PREFACE
This study was prepared for the Government of Belize, following the significant physical damageand economic losses that this country sustained as a result of Hurricane Keith, which struck partof the Central American region, Belize and Mexico. A request for this social, environmental andeconomic impact assessment was submitted to the Economic Commission for Latin America andthe Caribbean (ECLAC) by the Prime Minister of Belize, Hon. Said Musa, on 12 October, 2000.This appraisal considers the consequences of the Hurricane’s passing over the northern half ofthis country and the outlying keys (“cayes”) from 30 September to 1 October 2000.
The study undertakes a sector by sector analysis leading to an overall assessment of thedamage; it appraises the macroeconomic and environmental effects and proposes some guidelinesfor rehabilitation and reconstruction programmes. It complements other sector or partialassessments conducted by national and international institutions and financial and bilateralcooperation agencies. It is ECLAC’s and the Government of Belize intention to emphasise theneed for a reconstruction process that reduces the country’s vulnerability, that is compatible withits development strategy and can be implemented within the government’s and the privatesector’s absorption capacity.
National authorities, the Inter-American Development Bank (IDB), the Inter-AmericanInstitute for Cooperation on Agriculture (IICA), the United Nations Development Programme(UNDP) and other United Nations agencies, collaborated in the preparation of the study. Officialsand consultants of the Pan American Health Organization (PAHO/WHO) and of the UnitedNations Children’s Fund (UNICEF) joined the mission. This assessment complements theCompilation of Damage and Needs Assessments, Response and Rehabilitation Plans inconnection with Hurricane Keith prepared for the United Nations Disaster AssistanceCoordinator (UNDAC) by the United Nations Development Programme (UNDP), UNICEF andPAHO.
The direct and indirect damage has been assessed in accordance with the methodologydeveloped by ECLAC. 1 The results are based on the mission’s estimates; the study incorporatesthe information available and evidence collected in interviews and visits to affected locations. Itis estimated that the magnitude of the losses exceeds the country’s capacity to addressreconstruction needs on its own, particularly if the aim is also to reduce the impact of similarevents in the future, and therefore international cooperation is considered essential.
This appraisal is designed to provide the government and the international communitywith guidelines for setting national and regional priorities in rehabilitation and reconstructionprogrammes. An economic approach would be limited, and such programmes should thereforeinclude actions of a more integral nature. Designed not only to face the economic, fiscal andexternal sector implications of the event but to alleviate the suffering of those segments of the
1 ECLAC/IDNDR (1999), Manual for Estimating the Socio-Economic Effects of NaturalDisasters, May.

2
population affected as well as the environmental and vulnerability implications of the event.Questions of improved physical planning, watershed and coastal management, early warning,emergency response and structural preparedness for evacuation and sheltering potentiallyaffected population are seen as important considerations for the reconstruction process. Specialattention and priority should be placed on including sustainability and increased-governancecriteria in making social and productive investments, and on allocating resources to thereinforcement and retrofitting of vulnerable infrastructure, basic lifelines and services as part ofthe reconstruction strategy.
The Belize society and government face the opportunity of undertaking the reconstructionwith renewed values and criteria, embarking on institutional, legal and structural reforms toreduce economic, social and environmental vulnerability. Just as Hurricane Hattie over fortyyears ago transformed Belizeans attitude toward hurricane threats and led to important relocationof public and administrative functions, Keith – following closely the footsteps of Mitch – couldbecome an important instrument for a changed attitude to environmental and risk management.An important aspect of such reforms will be to strengthen the country’s savings, investment andmanagement capacity as part of the reconstruction.

3
I. BACKGROUND
Hurricane Keith evolved very rapidly from an area of disturbed weather that had persisted in thewestern Caribbean during the last week of September. Late in the hurricane season – as happenedin recent years with Georges and Mitch in 1998 and Lenny in 1999 – on the morning of 29September, the fifteenth tropical depression of the Atlantic Basin formed from a weak surfacelow just off the north-eastern coast of Honduras. In a period of barely 24 hours the depressionhad strengthened into a tropical storm and was named Keith, and by noon of 30 September waspoised to strike the coast of the Yucatan Peninsula en Mexico, and or Northern Belize. Followingan apparently erratic pattern, the by now hurricane-level Keith pursued a westward drift andstubbornly battered the outplaying keys (“cayes”) and drenched the low-lying plains of Belize.This caused severe wind damage to the coastal tourist resorts and drenched a vast area ofnorthern Belize with severe flooding that has persisted for over six weeks.
Natural disasters, whether climatic, seismic or volcanic, are frequent in the region. Thescale of human and economic damages caused by natural disasters in Latin America and theCaribbean is staggering by any set of measurements. Some estimates put the affected (directlyand indirectly) population at 150 million over the last 30 years. Between 1972 and 1999 alone thenumber of dead reached 108,000 and the total of those directly affected exceeded 12 million. 2
The total damages covered by the assessments made by ECLAC between 1972 and 1999amounts to more than 50 billion dollars. The true figure for human and material damages is muchgreater because ECLAC has only assessed damages when governments have asked it to, andbecause such assessments only cover a fraction of the disasters faced by the region.
The Caribbean is subject to meteorological (hurricanes, floods and droughts) andgeophysical (earthquakes, landslides, volcanoes) hazards. Depending on the degree ofvulnerability of given States/territories, exposure to hazards may result in natural disasters that, insmall islands and countries such as these, can have devastating economic, social andenvironmental effects. 3
Tropical hurricanes are the most frequent of the natural hazards that affect the region. Thedecade of the nineties was one of contrasts. Landsea 4 reported that the first half of the 1990sdecade saw the least active four-year period in at least fifty years. However, in the second half ofthe decade, the region experienced an upsurge in the incidence of hurricanes. Indeed, Guy
2 See ECLAC/IDB, A Matter Of Development: How To Reduce Vulnerability In The Face OfNatural Disasters, (LC/MEX/L.428),7 March 2000.
3 The regional information and analysis was prepared by Erik Blommestein, ECLACSubregional Headquarters for the Caribbean, October 2000.
4 Landsea, C. W., N. Nicholls, W.M. Gray, L.A. Avila, 1996. Downward trends in thefrequency of intense Atlantic hurricanes during the past five decades. Geophysical Research Letters23:1697-1700; Landsea, Christopher, Roger A. Pielke, Alberto M. Mestas-Núñez and John A. Knaff.1999. Atlantic basin hurricanes: Indices of climatic change. Climate Change, 42: 89-129.

4
Carpenter reported that 1999 saw the highest number of category 4 hurricanes since recordsbegan in 1886. In 1999, Hurricane Irene crossed western Cuba; hurricanes Dennis and Floyd andtropical storm Harvey made landfall in the Bahamas and in the Turks and Caicos Islands; and thenorthern Leeward Islands were exposed to hurricanes Jose and Lenny. Because of its unusualEast to West track hurricane Lenny also caused damages in the Windward Islands.
The increased incidence may indicate that the region is undergoing a new cycle ofheightened hurricane activity. This would follow the period of the 1970s to the middle of the1990s, which was relatively quiet and from the 1920s to the 1960s, which was relatively active.This long-term cycle would be more important in its effects than any expected impacts of climatechange, because its effects could affect development patterns faster and its outcomes wouldspread over at least the next decade. Furthermore, current research seems to indicate that neitherthe frequency nor the intensity of hurricanes will be very much influenced by climate change.
Hurricanes remain the major cause of loss of life due to natural disasters, with a death tollof 1,745 persons during the decade. In the insular Caribbean, the largest loss of life occurred inHaiti, caused by Hurricane Gordon in 1994 and in the Dominican Republic by Hurricane Georgesin 1998. See Table 1.
Table 1
LOSS OF LIFE CAUSED BY NATURAL DISASTERS IN THE INSULAR CARIBBEANAND BELIZE a/
Loss of lifePeriodTotal Floods Windstorms Other
1990-1998 1 966 155 1 745 66
1980-1989 1 640 925 584 131
1970-1979 1 829 265 1 561 3
1964-1969 953 0 953 0
Total 6 388 1 345 4 843 200
Source: EM-DAT: The OFDA/CRED International Database, 5 Université Catholique de Louvain, Brussels, Belgium.a/ For the Guyanas, there are no recorded deaths in the EM-DAT database.
Haiti with 2,598 deaths and the Dominican Republic with 1,862 fatalities over the period1964 to 1998 account for almost 70 per cent of the death toll in the region. This is a reflection ofsocial vulnerability caused by poverty, environmental degradation and in some instancesinsufficient or inadequate mitigation and risk reduction policies. This high degree of vulnerabilitywas highlighted in 1994, when rainfall, associated with, then, tropical storm Gordon, causedfloods and mudslides which resulted in 1,122 fatalities, even though the centre of Gordon did not
5 To be included in the database, at least one the following criteria has to be satisfied: 10 ormore people killed; 100 people reported affected; a call for international assistance or the declaration of astate of emergency.

5
pass over Haiti. The Dominican Republic and Haiti are not alone in this vulnerability, as many ofthe characteristics are shared with other low-income countries or with the poor in higher incomecountries.
Increasingly fatalities caused during the passage of tropical cyclones are not wind relatedbut stem from secondary disasters like flood or landslides and mudslides. This highlights the roleof environmental degradation and policy failures as major factors that account for the loss of life.
If population growth is taken into account, the data show that there has been only a slightreduction in the annual disaster death rate over the last 35 years.
Clearly, even a small disaster, in terms of monetary damages can have major economicimplications in a small country, even when larger countries may be susceptible to a larger numberof disasters. However, during the second half of the decade, the small islands of the NortheasternCaribbean seemed to be particularly vulnerable.
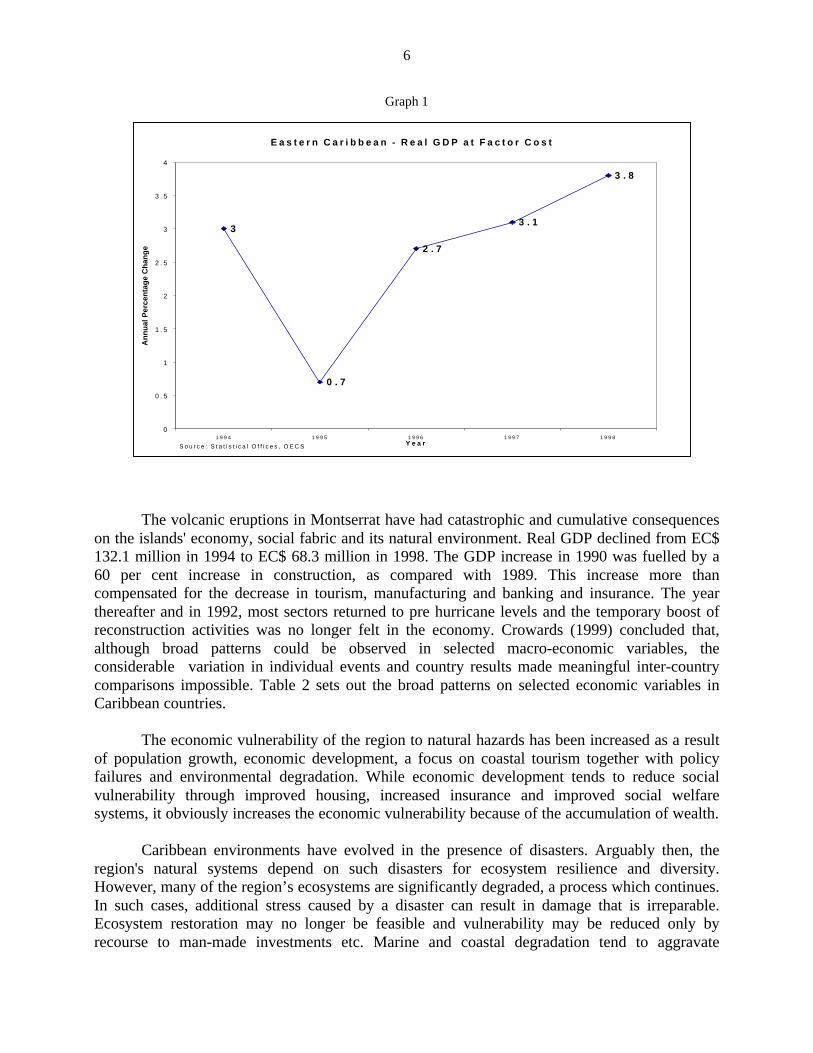
Graph 1 illustrates the impact of the 1995 hurricane season on the economic performanceof the Eastern Caribbean area. During 1995 hurricanes Marilyn and Luis and tropical storm Irishit the Eastern Caribbean. The 1995 storm season caused a drop from 3.0 to 0.7 in the annual rateof growth of real gross domestic product (GDP) in the countries member of the Organization ofEastern Caribbean States (OECS), according to figures from the Eastern Caribbean Central Bank(ECCB). The impact on the individual countries was even more severe with Antigua and Barbudaand Anguilla experiencing a decline in the growth rate to -5.0 and -4.1 respectively. Tourism,agriculture and real estate and housing were the sectors most affected. In Anguilla tourist arrivalsdid not recover until 1997, while by 1999 Sint Maarten had still not recovered.
In a large continental or archipelagic country, the economic impacts on givensectors/areas can either be diluted or offset by robust growth in other areas. For example,Hurricane Floyd was classified as a category 4 hurricane when it struck the Family Islands in theBahamas. Here, the impacts of the extensive damages on Eleuthera and Abaco were counteractedby a strong improvement in tourism in the other islands, notably in Nassau and Paradise Island.Coupled with reinsurance inflows and reconstruction activities, the result was a real economicgrowth of about 5.5 per cent. On the other hand, the IMF noted that the long-term economicimpact of hurricanes Luis and Marilyn in Sint Maarten contributed to the continued economicmalaise, which is facing the Netherlands Antilles.
In the Dominican Republic, hurricane Georges caused an estimated US$ 2.2 billion ineconomic damages in 1998. The sectors most affected were housing, with over 49,000, mostlylow-income houses destroyed, tourism and agriculture. Nevertheless, the high buoyancy whichcharacterized the economy in the second half of the decade, was maintained albeit, at anestimated loss of 1 percentage point of real GDP growth.
6
Graph 1
The volcanic eruptions in Montserrat have had catastrophic and cumulative consequenceson the islands' economy, social fabric and its natural environment. Real GDP declined from EC$132.1 million in 1994 to EC$ 68.3 million in 1998. The GDP increase in 1990 was fuelled by a60 per cent increase in construction, as compared with 1989. This increase more thancompensated for the decrease in tourism, manufacturing and banking and insurance. The yearthereafter and in 1992, most sectors returned to pre hurricane levels and the temporary boost ofreconstruction activities was no longer felt in the economy. Crowards (1999) concluded that,although broad patterns could be observed in selected macro-economic variables, theconsiderable variation in individual events and country results made meaningful inter-countrycomparisons impossible. Table 2 sets out the broad patterns on selected economic variables inCaribbean countries.
The economic vulnerability of the region to natural hazards has been increased as a resultof population growth, economic development, a focus on coastal tourism together with policyfailures and environmental degradation. While economic development tends to reduce socialvulnerability through improved housing, increased insurance and improved social welfaresystems, it obviously increases the economic vulnerability because of the accumulation of wealth.
Caribbean environments have evolved in the presence of disasters. Arguably then, theregion's natural systems depend on such disasters for ecosystem resilience and diversity.However, many of the region’s ecosystems are significantly degraded, a process which continues.In such cases, additional stress caused by a disaster can result in damage that is irreparable.Ecosystem restoration may no longer be feasible and vulnerability may be reduced only byrecourse to man-made investments etc. Marine and coastal degradation tend to aggravate
E a s t e r n C a r i b b e a n - R e a l G D P a t F a c t o r C o s t
3
0 . 7
2 . 7
3 . 1
3 . 8
0
0 . 5
1
1 . 5
2
2 . 5
3
3 . 5
4
1 9 9 4 1 9 9 5 1 9 9 6 1 9 9 7 1 9 9 8Y e a r
An
nu
al P
erce
nta
ge
Ch
ang
e
S o u r c e : S t a t i s t i c a l O f f i c e s , O E C S

7
economic vulnerability through the increased exposure of coastal infrastructure to high energywave action and storm surge because natural barriers such as mangroves, sand dunes or coralreefs have lost much of their protective functions.
Table 2
ECONOMIC IMPACTS FOLLOWING A NATURAL DISASTER
Variable Year of event Year after Subsequent years
GDP Immediate drop in GDPgrowth
Rise in GDP growth fromreconstruction
Slow down in 2nd and 3rdyear as boost subsides
Exports of goods Reduction in rate ofgrowth
Return to previous levels a/ Spillover to next year
Imports of goods Considerable increase inrate of growth
Return to pre-disaster level Further drop, possibly causedby reduced incomes
Tourist arrivals Considerable drop Some recovery Recovery continued
Cruise ship arrivals Considerable drop
External debt Increase in rate ofgrowth
Drop of the rate of increaseto below pre-disaster levels
Source: Crowards, 1999.a/ Depending on crop season, the reduction for agricultural exports, etc. may occur in the year following the disaster.
The cumulative impacts of environmental degradation increase social as well as economicvulnerability. The effect of terrestrial degradation, combined with policy failures, may very wellbe the increased loss of life as was experienced in Hispaniola following Gordon and Georges, orin Puerto Rico, following the floods and landslides in 1985.
Because of the concentration of economic activities in the coastal zone (e.g. tourism) theincreased exposure of coastal infrastructure results in increased economic vulnerability. Forexample, the earlier quoted drop in real GDP growth rates in the Eastern Caribbean following the1995 hurricane season was mostly caused by an 11.3 per cent contraction in the value added forhotels and restaurants. Likewise over 80 per cent of the economic damages in Anguilla followingHurricane Lenny are tourism related and a consequence of cumulative environmentaldegradation.
Responsibility for change pertains to both the public and private sector and largely stemsfrom a corresponding failure to incorporate disaster prevention and mitigation measures. Policyfailures can include the absence of a system whereby pre disaster information can be madeavailable to the public. This was identified as a contributory factor for the high death toll in theDominican Republic following Georges in 1998 and in Puerto Rico following the floods in 1985.
8
Policy failures might also relate to poor or corrupt building and construction practices resultingfrom the non-existence or non-compliance with building standards, or from the lack ofincorporating risk into insurance rates. In view of the existence of high levels of environmentaldegradation and a correspondingly high level of economic vulnerability, the continuing policy ofgranting permission for the construction of hotels and residences in obviously high-riskenvironment is to be construed as an important policy failure.
The extent of the damage caused by Keith to the small economy of Belize – affecting itsmain foreign currency earning activities of tourism and agriculture – and the efforts required forthe recovery point up the need for the country to receive cooperation from the internationalcommunity. Its effects will be felt over the 2000 and 2001 period, affecting the economicoutcome of both years, at least. Some of the reconstruction process will certainly extend beyondthat, as projects will develop over the years and their completion and maturing process may takesome time. This recuperation process involves the creation of a less vulnerable physicaldevelopment strategy and a better preparation in the face of climatic phenomena that cyclicallyaffect the country, that seem to have increasing force and less reliable patters and causeincreasing economic and developmental losses. International funds will be needed to complementnational efforts – both public and private – to carry out the reconstruction programme. Theattached project profiles show the magnitude of the efforts involved and indicate the degree ofurgency and the priorities to be set, with the participation of the international community
1. The mission
The Government of Belize, at the recommendation of the IDB and the World Bank, requestedECLAC’s technical assistance to undertake a comprehensive damage assessment report in theaftermath of Hurricane Keith. After a preparatory mission ECLAC prepared the terms ofreference for the study to be undertaken and convened a team of experts to carry out theevaluation mission. Funded by the Government through the emergency resources received fromIDB, ECLAC completed the rapid evaluation included in this document.
The mission had the full support of the UNDP Resident Coordinator for Belize andreceived the full cooperation of the United Nations agencies and other international and regionalorganisations with offices in Belize. The work was carried out with the full cooperation of thenational authorities and benefited from the preliminary assessments of damages prepared by theNational Emergency Management Organization (NEMO) and the administrative and substantivesupport of the ministries of Economic Development and of Finance. The IDB and PAHORepresentations in Belize provided office space for the mission and the local representatives ofIICA and UNICEF also assisted the mission.
The mission visited Belize from 12 to 22 November 2000. The team included thefollowing ECLAC officials, external consultants and officials of other international organisationswho joined the team:

9
− Ishmael, Len, Director of ECLAC Subregional Headquarters for the Caribbean (Urbanplanning and overall development implications)
− Zapata-Marti, Ricardo, Mission co-ordinator− Andersson, Bernt (PAHO)− Budhram, Dowlat (IICA)− Buescher, Gabriella (UNICEF)− Busby , Lancelot (Macroeconomist)− Ghisolfo, Francisco (Transport, communications and telecommunications and project
formulation)− Gómez, José Javier (Tourism and overall environmental aspects)− Kambon, Asha (Social affairs, including housing)− Mojica, Francisco (Basic Infrastructure and Services)− Osorio, Claudio (PAHO)− Pérez, Jose Miguel (IICA)− Rojas, Ricardo (PAHO)− Smith, David (Beach and coastal environmental assessment)− Tapia, Antonio (Agriculture)
This document contains an independent assessment of the disaster, which sets forth theoverall magnitude of direct and indirect damages and their effects on the behaviour of theeconomy as a whole. It is intended to assist in drawing up proposals for reconstruction prioritiesand needs, one of which should be the explicit incorporation of measures to reduce the country’shigh vulnerability to such disasters and increase Belize’s sustainability for development.
2. Description of the phenomenon and its effects
The hurricane season in the northern hemisphere and the Atlantic Ocean (July to November) hasbeen unusually long for the last three years – since 1998 – and caused enormous and cumulativedevastation, loss of life, and economic, social and environmental damage in the Central Americanand the Caribbean. Data for the nineties appears in Table 3.
a) Storm description
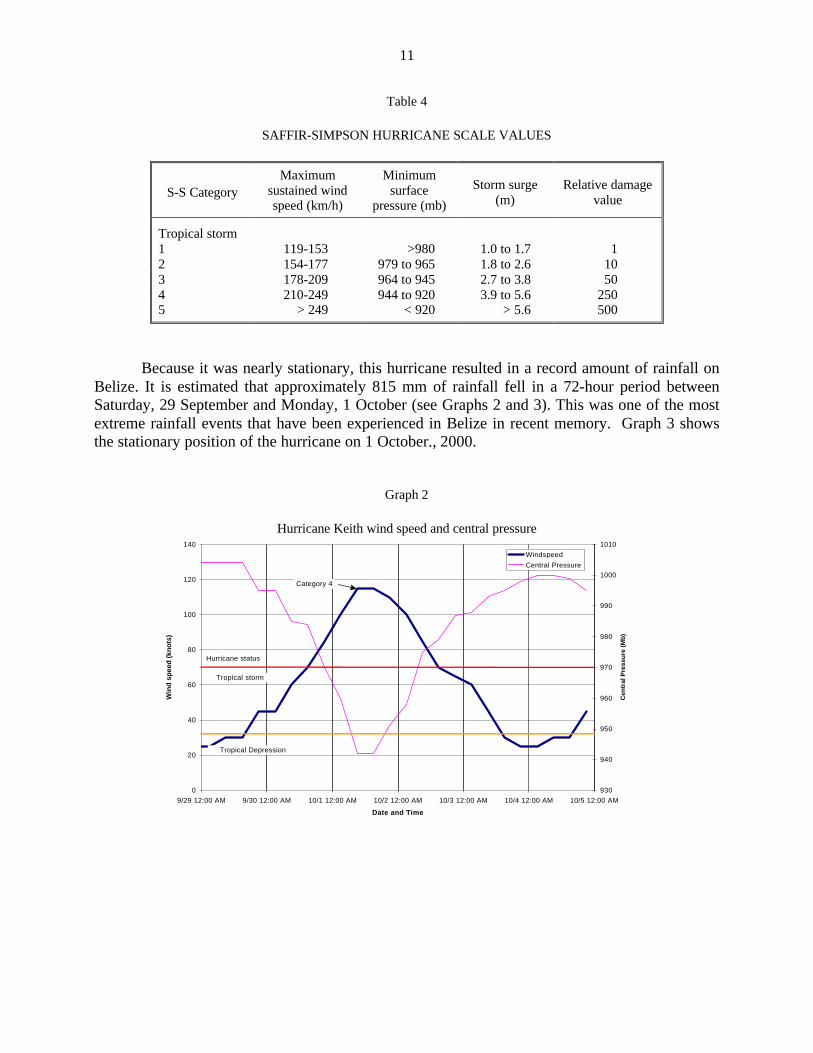
Tropical Storm Keith began to intensify on 29 September 2000. Between Saturday 29 andSunday 1, this system intensified from a tropical storm status to a category 4 hurricane. (Table 4describes the Saffir-Simpson scale used to categorize hurricane’s strength in terms of windforceand energy.) Over this period, central pressures dropped from 1 004 milibars (mb) to 942 mb,with a corresponding increase in sustained wind speed from 25 kilometres (km) to 115 km.During that period also, the hurricane remained almost stationary over the northern part of Belize,with the eye approximately over Ambergris Caye. A key feature of this hurricane was its rapidprogression from a tropical depression to a category 1 hurricane in less than 24 hours and furtherrapid development to a category 4 hurricane in less than an additional 24 hours (see Graph 2).
10
Table 3
MAJOR TROPICAL STORM AND HURRICANES IN THE CARIBBEAN, 1990-1999
Year Classification Name Area Dates
1990 Tropical Storm Arthur Tobago/St. Vincent and the Grenadines 22-27 July
Hurricane Diana Yucatan 3-7 August
Tropical Storm Fran Trinidad 11-14 August
Hurricane Klaus Virgin Islands 2-9 October
1991 Tropical Storm Fabian Cuba 14-15 October
Hurricane Caesar Trinidad and Tobago/NetherlandsAntilles
24-29 July
1992 Hurricane Andrew Bahamas 16-27 August
1993 Tropical Storm Bret Trinidad/ Belize 4-11 August
Tropical Storm Cindy Martinique 14-17 August
1994 Tropical Storm Debby St. Lucia 9-11 September
Tropical Storm Gordon a/ Jamaica/Cuba/Bahamas 8-21 November
1995 Hurricane Erin Bahamas 31 July6 August
Hurricane Iris Leeward Islands 22 August4 September
Hurricane Marilyn Virgin Islands b/ NetherlandsAntilles/LeewardIslands/Dominica/Puerto Rico
12–22 September
Hurricane Luis Leeward Islands c/ Netherlands Antilles 27 August11 September
1996 Hurricane Lili Cuba/ Bahamas 14–27 October
1997 None
1998 Hurricane Georges Leeward Islands/NetherlandsAntilles/Puerto Rico/DominicanRepublic/Haiti/Cuba
15 September1 October
1999 Hurricane Floyd Bahamas 7-17 September
1999 Hurricane Jose Anguilla/Netherlands Antilles/LeewardIslands/British Virgin Islands
17-25 October
Hurricane Lenny Netherlands Antilles/ Virgin Islands 13-27 November
Hurricane Irene Cuba 13-19 October
Hurricane Dennis Bahamas 24 August7 September
Source: United States National Hurricane Centre.a/ Haiti severely affected. Rain/Floods.b/ US and British Virgin Islands.c/ Antigua and Barbuda, St. Barts, St. Maarten, Anguilla.
11
Table 4
SAFFIR-SIMPSON HURRICANE SCALE VALUES
S-S CategoryMaximum
sustained windspeed (km/h)
Minimumsurface
pressure (mb)
Storm surge(m)
Relative damagevalue
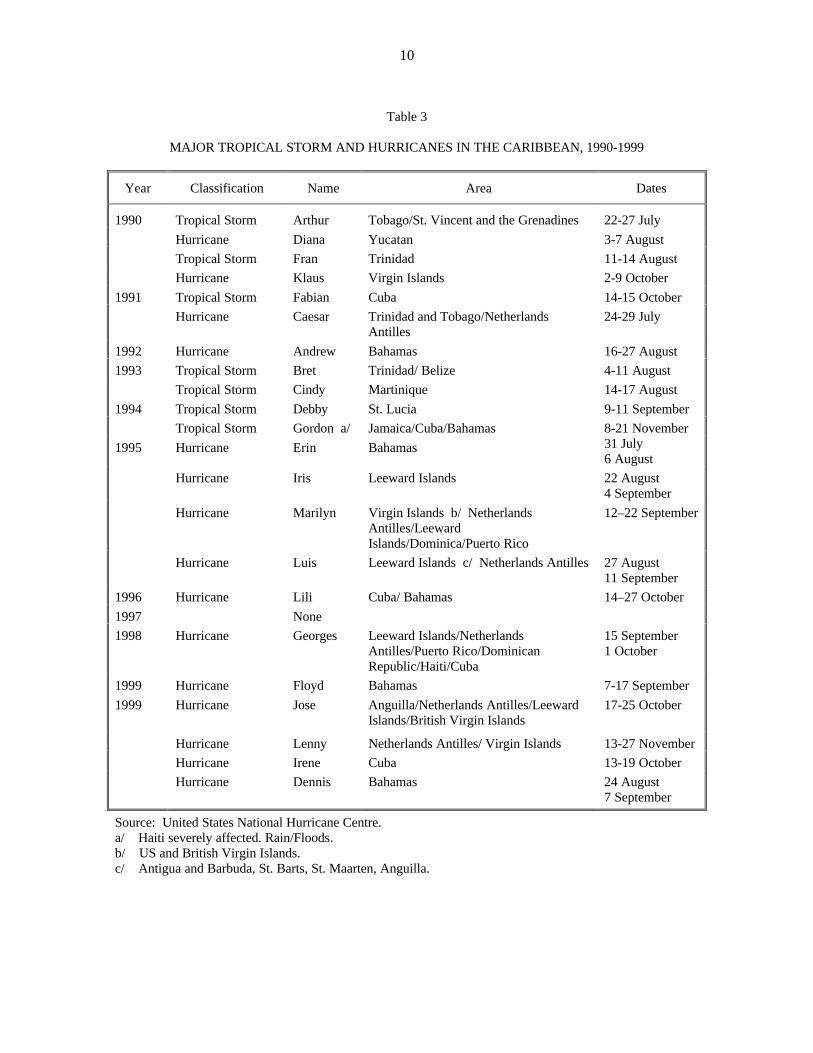
Tropical storm1 119-153 >980 1.0 to 1.7 12 154-177 979 to 965 1.8 to 2.6 103 178-209 964 to 945 2.7 to 3.8 504 210-249 944 to 920 3.9 to 5.6 2505 > 249 < 920 > 5.6 500
Because it was nearly stationary, this hurricane resulted in a record amount of rainfall onBelize. It is estimated that approximately 815 mm of rainfall fell in a 72-hour period betweenSaturday, 29 September and Monday, 1 October (see Graphs 2 and 3). This was one of the mostextreme rainfall events that have been experienced in Belize in recent memory. Graph 3 showsthe stationary position of the hurricane on 1 October., 2000.
Graph 2
Hurricane Keith wind speed and central pressure
0
20
40
60
80
100
120
140
9/29 12:00 AM 9/30 12:00 AM 10/1 12:00 AM 10/2 12:00 AM 10/3 12:00 AM 10/4 12:00 AM 10/5 12:00 AM
Date and Time
Win
d s
pee
d (
kno
ts)
930
940
950
960
970
980
990
1000
1010
Cen
tral
Pre
ssu
re (
Mb
)
Windspeed
Central Pressure
Hurricane status
Tropical storm
Tropical Depression
Category 4

12
Graph 3
THE WESTERN EYEWALL OF HURRICANE KEITH OVERAMBERGRIS CAYE, BELIZE
b) Impacts on cayes and mainland
The impacts of this hurricane varied considerably, depending on the location considered.At the keys (particularly Ambergris Caye and Caye Caulker or Cayo Hicaco), there was extensivedamage from high winds, rainfall and storm surge on the leeward side of these islands. As aresult of this, roofs were removed and extensive damage to property occurred. Because of therapid intensification of this system from a tropical storm to a hurricane, there was limited time tocarry out an effective evacuation from Ambergris Caye to the mainland. Graphs 2 through 5indicates the general areas most severely affected by wind, rain and flooding, in the Belize, Cayoand Orange Walk districts.
On the mainland, the majority of the damage was confined to areas north of Dangriga.Extensive flooding was experienced, with roads being cut off and rivers subsequently floodingtheir banks. Belize City, for example, was cut off from access to or egress from it, as both mainroads leading away from this city were under water. Further north, the road to Orange WalkTown was accessible only to trucks, busses and SUVs, as floodwaters cut off the main roadway.North of this town, there was extensive flooding of areas adjacent to the Rio Hondo, whichresulted in loss of sugar cane crops and some livestock. In general, the damage on the mainlandwas restricted to some wind damage and extensive flood damage and hindrance in low-lyingareas.

13
Table 5
BELIZE: RAINFALL DISTRIBUTION ASSOCIATED WITH HURRICANE KEITH 6
(Millimetres)
StationFridaySep. 29
SaturdaySep. 30
SundayOct. 1
MondayOct. 2
TuesdayOct. 3
Total mm Total ins
PSWGIA 22.4 136.6 472.5 178.4 809.90 32.67LA Milpa FloodedLibertad 54.1 101.1 34.4 0.0 189.6 7.46Towerhill 40.2 63.3 54.0 46.0 203.5 8.01Central Farm 68.2 16.3 44.2 135.6 0.3 264.6 10.41Belmopan 33.6 20.5 88.4 186.2 328.7 12.94Barton Creek 33.3 0.0 11.0 30.0 0.0 74.3 2.92Chaa Creek 27.5 38.6 100.4 0.0 166.5 6.56Baldy Beacon 25.9 La Democracia FloodedBelize Zoo 1.8 34.5 233.5 197.2 1.2 468.2 18.43Hcl3 Melinda 17.0 103.6 47.9 3.2 0.0 171.7 6.56Middlesex 24.5 15.3 124.8 89.4 0.0 254.0 10.00Pomona 114.3 50.0 0.0 164.3 6.47Mayan King 11.0 10.0 47.1 23.0 91.1 3.59Flores Farm Savannah 3.6 11.2 33.2 10.2 3.3 61.5 2.42Bigfalls 3.7 2.3 120.1 13.9 2.0 142.0 5.59Pgagstat 0.2 0.2 17.7 25.8 3.4 47.3 1.87Blue Creek Spanish Lookout 72.2 14.8 37.0 120.1 6.2 250.3 9.85Las Cuevas Rum Point Consejo St Johns College 57.7 33.5 535.9 0 627.1 24.69Gallon Jug1 205.7 8.1Gallon Jug2 208.3 8.2Gallon Jug3 208.3 8.2Gallon Jug4 243.8 9.6
Source: ECLAC, on the basis of official data.
This hurricane clearly highlighted the areas of the country that are presently veryvulnerable to extreme flooding. The lessons learnt from this experience must therefore beincorporated into the planning and decision making process.
6 Period: 9:00 am – 9:00 am, 29/9/2000 – 3/10/2000.

14
Graph 4
LOCATIONS OF MAJOR IMPACT OF HURRICANE KEITH IN BELIZE

15
3. Population affected
Of the four districts that were affected by Hurricane Keith, (Orange Walk, Cayo, Belize District,and Corozal) with a total population of over 125,000, more than 57,400 were affected. Thisrepresents 46 per cent of the inhabitants of these districts and 23 per cent of the nationalpopulation. (See Table 6.) 7 Worst hit were the people who lived on the Cayes, namely Ambergrisand Caye Caulker, as all their inhabitants were affected.
Table 6
BELIZE: ESTIMATED AFFECTED POPULATION DUE TO HURRICANE KEITH a/
As of 11 October 2000
LocationTotal population
as per census2000
Total population asper PHI or key
informant
Affectedpopulation
Total of affected districts 125,535 … 57,403 Belize District 62,729 … 27,308 Caye Caulker 742 1,300 279 San Pedro 4,499 10,000 3,000 Belize City 49,059 N/A 14,717 Rest of Belize District 8,429 9,415 9,303 Orange Walk District 26,244 17,988 14,126 Orange Walk Town 13,483 10,410 2,435 Rest of District 12,761 7,578 11,691 Corozal District 26,748 23,788 11,356 Cayo District 9,814 3,107 4,613
Source: ECLAC on the basis of official data.a/ Utilizing Census 2000 information, except for the islands (Caye Caulker and Ambergris Caye) and villages not listed in the census report.b/ Estimate, 20 per cent of persons living in flooded areas.
More than 5,000 persons were evacuated and 3,279 made homeless. Thirteen thousandpersons were isolated due to the flooding and more than 57 thousand were affected due to theheavy rains and flooding. Ten lost their lives. PAHO/WHO reported that some 72,000 personswere at high risk of health impairment. (See Table 7.) This will aggravate a pre-existing deficit insanitary conditions. Approximately 40 per cent of the urban and 80 per cent of the ruralpopulation did not have access to the public sanitation system before the hurricane.
7 According to the 2000 Census, Belize has a population of 240,204 and has a 2.7 per cent
growth rate. Belize is said to have the highest growth rate in the Caribbean. Fifty two per cent of thepopulation lives in rural areas of the country and approximately 65 per cent of the population is under 25years of age and 40 per cent of the population is under 14 years of age.

16
Table 7
BELIZE: LIVING CONDITIONS OF AFFECTED POPULATION
LocationLiving infloodedareas
Living inflooded
houses a/
Living inshelters
Homeless Displaced IsolatedAt high risk
of healthimpairment
Total of affected districts 62,651 9,370 65 3,279 5,335 13,460 72,092
Belize District 24,029 4,863 3,279 3,279 4,555 35,314
Caye Caulker 279 279 1,300
San Pedro 3,000 3,000 10,000
Belize City 14,717 2,943 14,711
Rest of Belize District 9,303 1,920 0 0 0 4,555 9,303
Orange Walk District 13,673 2,732 65 2,056 7,509 15,536
Orange Walk Town 2435 487 420 2,855
Rest of District 11,393 2,245 65 0 1,636 7,509 12,681
Corozal District 19,126 610 1396 15,419
Cayo District 5,823 1,165 5,823
Source: ECLAC on the basis of official data.a/ Estimates based on number of houses flooded. Assuming and average of 5 inhabitants/household based on census data.
Presumably this will have an undermining effect on the welfare of the most vulnerablehouseholds since in the four districts which were affected by the Hurricane, as many as 20 to 30per cent of the households have been defined as poor. 26 to 40 per cent of the population havebeen defined as living below the poverty line by the 1996 poverty assessment survey. At thenational level, 25 per cent of households and 33 per cent of individuals were found to be poor and9.6 per cent of households and 13.4 per cent of individuals were considered to be extremely pooror indigent. It was noted that their level of expenditure was not enough to enable them to satisfytheir basic food requirements.
Female heads of households comprise anywhere from a low of 25 per cent in Cayo, of thepoor households, to a high of 38.5 per cent in Orange Walk. This percentage is higher than thenational average. Women head Twenty-two percent of households. Cayo was one of the districtsin the country, which had been defined as comprising the second highest indigent population inthe country. Although there is no disaggregated data on the effect of the disaster on the femalepopulation, prevalent social conditions lead to believe that their vulnerability has increased. TheUNDP Human Development Report for 2000, for Belize (soon to be published) notes that thefemale unemployment rate is approximately 20 per cent, which is almost twice the national rate,which stood at 12.8 per cent. The gender unemployment gap widened from 7.5 per cent in 1996to 11.2 per cent in 1999. More than one quarter of the labour force work in the informal sector.Additionally, almost 30 per cent of everborns are to mothers under twenty. A study undertaken

17
on childbearing patterns among the young in Belize notes that 17 per cent of 21-24 year old had“not one or two but three or more children”.
It was reported to the mission that in the case of San Pedro the teenage pregnancy rate isabove the national average. It was also pointed out that the migration factor has been so prevalentover the recent years that nowadays only one out of four of the inhabitants in the island are native“sanpedranos”.
Migration plays an important factor in the demographics of the country. While largenumbers of young educated Belizeans emigrate to the United States and elsewhere, incomingmigrants from neighbouring Central America have been making Belize their home. The UnitedNations High Commissioner for Refugees (UNHCR) estimates that during the past decade some29,000 refugees have migrated to Belize, comprising 14 per cent of the population. At theaftermath of Hurricane Mitch that struck Central America severely in 1998, migration out of themost severely affected areas increased substantially and it is apparent some of that flow reachedBelize. After Keith there seems to be no major migratory effect out of the country. To thecontrary, inasmuch as the reconstruction process might increase the demand for labour force,there could be an attraction effect from neighbouring countries to provide workers to fill thisneed. This will only continue an ongoing process that has defined Belize’s demographic profileover the years.
In Corozal and Orange Walk there is a large dependence on agriculture and fishing. In theBelize District workers are distributed in construction, wholesale/retail and manufacturing andmiscellaneous activities. Tourism is the lifeblood of the Cayes. In the country 52 per cent of thepopulation live in rural areas and approximately 65 per cent of the population is under 25 years ofage and 40 per cent is under 14 years of age.
As mentioned above, low-income groups are among the most affected. Some factors willincrease their risks after Keith. First, the economic activities will experience a temporary setback,particularly in respect of some artisan activities like fishing, lobster capture. Agriculturalsubsistence farmers will require resources to recuperate and employment in the larger farms willbe affected while the flooding persists. This problem will continue for several weeks still sincenatural drainage in the low-lying areas of the flood planes will be very slow given the smallincline to the sea. This also entails that some health risks associated with stagnant waters willpersist for a while. In the cayes the dynamics of the recuperation of the tourism sector hasgenerated a temporary demand for labour force while the momentarily reduced flow of touristshas been compensated – in employment terms – by the self-help and community reconstructionundertaken in the small island communities.
Secondly, due to the characteristics of the cayes and the limited sanitary infrastructure’scoverage of rural areas and the islands, the health risks will persist unless specific actions aretaken. Morbidity (and eventually mortality) levels resulting from this situation could be affectedin the short term. Additionally in the affected areas there is a limited coverage of the waterdistribution network. The floods and silt deposited could affect provision of drinking (or at leastsafe) water supplies from local wells. Given the amount of debris as a result of the hurricane,particularly in the areas affected by wind, a proper waste disposal and garbage handling seem tobe in order. The existing systems are not capable of processing the amount that has resulted since
18
most are open dumps or flow into the neighbouring lagoons with the inevitable consequence ofdecomposition and pollution. The hurricane highlighted the fragility of infrastructure to remedythese deficiencies, which was built in the same high-risk areas. Floods and the rain affected manylatrines and water mains.
Finally, lack information may increase the risks faced by the affected population. Somecommunities have traditional ways of dealing with disasters, based on previous experiences.Since Belize had not suffered a similar event in some years, some local communities wereinadequately prepared to face a situation such as that caused by Keith. 8
a) Vulnerability of women and children
Poverty and environmental deterioration increase the risks stemming from naturaldisasters, and women and children are usually the most affected. The destruction of their homes,worse health conditions and loss of jobs and crops has a direct effect on their living conditions.Children are exposed to higher health risks, which can even lead to death; greater economic risks,as their education might be short by their need to enter the labour market at an early age, andgreater psychosocial risks, since they are highly sensitive to changes in their surroundings.Women face greater challenges in the day-to-day running of their homes, as the task oforganizing family resources becomes all the more difficult. Pregnant and nursing mothers sufferthe effects of their deteriorated environment (particularly affecting their nutrition), which placesthem at great risk of contracting lethal diseases.
According to available data – which does not give gender disaggregated information –almost 5,000 houses were affected, directly causing harming almost 11,300 children through theloss of their houses, being displaced, having their family dislocated, living temporarily in sheltersand interrupting their normal school and play routines. (See Table 8.)
b) Psycho-social trauma rehabilitation
Disasters affect people in different ways, however, the psycho-social impact of ahurricane on the family and especially children often remains invisible in disaster assessmentstudies. Yet, disaster situations may mean loss of loved ones including relatives, friends andneighbours; it may also mean loss of property, furnishings and cherished belongings. Sometimesit means starting over with a new home or business.
Although only ten people died, the emotional effects of material loss and social andfamily disruption may show up immediately or may surface many months later. It is important toremember that a disaster of any size will cause unusual and unwanted stress in those attemptingto reconstruct their lives. In the aftermath of Hurricane Keith, trauma rehabilitation was only
8 At the national level, though, it must be noted the country had recently adopted a new
disaster management plan (revised after the scare caused by Hurricane Mitch). This revised plan came intoforce in April 1999 and strengthens the National Emergency Management Organization (NEMO).

19
conducted on an ad-hoc basis by regular health staff who was mainly focusing on the physicaleffects of the emergency. It was, however, the first time in Belize that trauma was addressed.
Table 8
BELIZE: FAMILIES AND CHILDREN AFFECTED BY HURRICANE KEITH
(Number)
Area Families affectedHouseholdmembers
Adults Children
Total 4,872 22,863 11,566 11,297
Belize Old Northern 326 1,321 594 727
Belize River Valley 155 712 320 392
Belize Central 132 598 270 328
Belize City 1,168 4,762 1,843 2,919
San Pedro 1,145 5,622 3,155 2,467
Caye Caulker 45 231 138 93
Orange Walk 1,085 5,051 2,273 2,778
Corozal 816 4,566 2,973 1,593
Source: ECLAC on the basis of official data.
Dealing with the consequences of the hurricane does not merely involve rebuildingdestroyed social infrastructure, but also stepping up social and productive investment to addressthe vulnerability of low-income groups, so as not to leave them as exposed as they were prior tothe hurricane.
4. Emergency actions
a) Government actions
The Government of Belize declared the Preliminary Phase during the early hours of 30September, and by 9:00 am that day had declared Phase III or Red II, in compliance with theDisaster Management Plan developed in 1999 after Hurricane Keith hit the Central Americanregion. A Hurricane Warning was declared for northern Belize, meanwhile the government ofMexico had posted hurricane warning for the coast of Yucatan from Cabo Catoche to the Borderwith Belize. This became necessary as Keith intensified and kept drifting on a westerly tracktowards Belize’s northern coastal waters. By 6:00 pm minimal tropical storm force winds werealready spreading over northern coastal areas of Belize.

20
Given the rapid development of Hurricane Keith from a tropical depression to a category4 hurricane evacuation orders were not issued to the residents of Belize City nor the two Cayesthat were severely affected. However, on Sunday, 1 October 2000, transportation was madeavailable free of cost to those persons in Belize City who felt insecure in their homes and wishedto seek shelter inland, namely in Belmopan and San Ignacio. Residents of some settlements alongthe coastline of the Corozal District were advised to seek higher ground.
Throughout the approach and passing of the hurricane the NEMO issued reports of thestorm’s progress and advisories to the citizens of Belize. Special concern was expressedregarding the boarding up of their homes, provided information on transportation and shelters,and generally keeping the population abreast of what was happening throughout the country. TheFood and Material Committee estimated initially that it would cost US$820,000 to feed those inneed (19,151 individuals on a declining basis) for the four-month period during which they willnot be able to sustain themselves. Current figures are somewhat larger. Even before the hurricaneemergency advisory was lifter (the “all clear” announcement by the Government) BZ$49,091 hadbeen spent in food supplies. Government has budgeted food provisions for a period extendingfrom 4 to 16 weeks in some areas, which will imply an expenditure of over 1.8 million Belizedollars (see Table 9).
Table 9
BELIZE: COST OF FOOD EMERGENCY
DistrictTotal cost
(Thousands of BZ$)
Population to befed (number)
Total 1,844.6 11,202
Orange Walk (between 4 and 6 weeks, according tolocal conditions)
856.5 5,472
Corozal (3 weeks in average: from 2 to 7 dependingon community needs)
103.5 2,673
Belize (16 weeks in average) 831.9 2,420
Cayo (1-2 weeks in most cases, except for onecommunity that will receive 8 weeks supplies)
45.5 637
Stann Creek 7.4 …
Source: ECLAC, on the basis of official data.a/ At a cost of BZ$ 2.00 per person per day for a period that varies in each district and community according to needs. Rate of exchange is BZ$ 2 per US dollar.
The Ministry of Health (MOH) in collaboration with PAHO/WHO conducted a RapidHealth Assessment in a timely and systematic manner. The information collected was used toguide the decision making process of the MOH in relation to the relief and mitigation phase, andto guide the request for external assistance.

21
Given the evidence on the importance of psycho-social counselling during and after anemergency situation, this is the first time that a proposal was put forth to have a psycho-socialcomponent as part of emergency and rehabilitation efforts in Belize. Table 10 shows nobreakdown between the number of people who visited health services and the number of peopleseen informally by health personnel. Trauma management was also only conducted in Belizedistrict. The type of problems addressed is exemplified in Table 11.
On the other hand, in order to handle the emergency a number of regularly providedcounselling services were interrupted by the hurricane (including family violence casework, childprotective services and community counselling centre). Thus, to the emergency costs indicated inTable 12 should be added the loss of services not provided, which are estimated to totalBZ$57,643.33.
Table 10
BELIZE: PSYCHO-SOCIAL/TRAUMA REHABILITATION IN THE AFTERMATHOF HURRICANE KEITH
Sex Age District Total
Number of personswho visited healthservices
36 women25 men
16-65 years Belize District(Caye Caulker* & San Pedro)
61 adults a/
Number of personsseen due to trauma
No disaggregateddata
Nodisaggregateddata
Number of daysworked on traumamanagement
3 females1 male
- Belize District(Caye Caulker &San Pedro
5 days x 5 staff =25 man days
Source: ECLAC on the basis of official data.a/ Caye Caulker also reported 18 new patients and two new ones seeking psycho-social services, in additionto the ones reported in the table above.
Human relief services provided to affected population by government staff and volunteersduring the emergency in terms of social attention, counselling and others and the contribution ofthe Defence Forces were instrumental in alleviating some of the more traumatic effects andtending to the basic need during the emergency. Table 12 details some of the expenses incurred.

22
Table 11
BELIZE: TYPES OF TRAUMA MANAGEMENT PROGRAMMES CONDUCTED
Group Trauma management counselling(with persons over age 30 in one shelter with a population of 130)
Conflict resolution counselling meetings
Support group meetings for psychiatric, medical and social worker staff
Public service announcements for stress and crisis management
Individual and family counselling; stress management.
Source: ECLAC.
Table 12
BELIZE: EMERGENCY COSTS AFTERHURRICANE KEITH
ServicesCost
(Thousands ofBZ$)
Human and Development Staff 84.3
Social Workers 113.6
Counselling in institutions 33.6
Sub Total Cost 231.5
Belize Defence Force 146.0
Total 377.5
Source: ECLAC, on the basis of official data.
b) International cooperation
The United Nations Disaster Response Team (Belize), chaired by the PAHO/WHOresponded to the emergency in an organised manner according to their disaster plan. The planwas activated by the Chairperson, who is the Country Representative of PAHO/WHO, on Friday,29 September 2000 at 4:00 p.m. during a joint meeting of the three agencies. The UN EmergencyOperation Centre (UNEOC) was established according to the plan at the UN House in Belmopanon Sunday morning. Throughout the passing of the hurricane, the chair of the UN DisasterResponse Committee was in direct contact with NEMO and its committees to get information on

23
national needs. NEMO was informed at an early stage on what type of assistance the UNAgencies could offer and the UN Committee made all initial contacts in preparation to respondquickly at the behest of the Government of Belize. Regular contact was maintained with the UNAgencies’ Headquarters and Regional Offices.
The official request for assistance came from the Government of Belize on Tuesday,3 October 2000. At that time the first meeting of the Foreign Affairs Committee took place andwas attended by representatives of the three UN Agencies in Belize. No assessment of damagesand needs had been conducted at that point. The UNEOC was officially closed on Thursdaymorning, 2 November 2000.
The UN System has coordinated the donation of hundreds of thousands of dollars inemergency supplies to NEMO and non-governmental organizations (NGOs) in Belize. Over 11Situation Reports have been issued by the UN Office for the Coordination of HumanitarianAffairs and by 2 November UNDP, UNICEF and PAHO/WHO had completed a “Compilation ofDamage and Needs Assessments, Response and Rehabilitation Plans in connection withHurricane Keith”.
Total foreign assistance received – as reported by PAHO’s SUMA and the Government ofBelize – amounts to a total of BZ$5,175,734.
The international financial institutions activated their emergency response mechanisms incase of disasters. A World Bank Mission was in the country to assess the road and infrastructuresituation in order to reorient its available resources for Belize and study the possibility ofproviding additional funds. The IDB approved an emergency loan for US$20 million to assistfollowing Hurricane Keith. This was done through the Emergency Reconstruction Facility theBank operates for such purposes.

24
II. ASSESSMENT OF THE DAMAGE
This chapter contains an assessment of the damage caused by Hurricane Keith to the social (housing,education, health), infrastructure (energy, transport and communications, water and sewerage) andproduction sectors (agriculture, fisheries, tourism, industry and services), and to the environment. Theassessment was carried out on the basis of information available during the mission and incorporatesaspects that became known soon afterwards.
Direct damages or effects were assessed, i.e., to physical infrastructure and the country'scapital reserves, and indirect damages or effects, such as lower production of goods and servicesand emergency outlays. Direct damages have been assessed on the basis of capital assets prior tothe disaster; i.e., taking into account depreciation and normal use of capital goods.
In keeping with ECLAC methodology, the loss of crops, either about to be harvested orstored for distribution, is calculated as direct damage, and damages to inventories and productionunder way in the industrial sector are classified as direct costs.
The cost of rebuilding damaged assets has also been calculated where relevant. If the aimwere to return to the situation prior to the hurricane, the value would be the same as the directcost according to this methodology. However, for the purpose of a reconstruction programme, theassessment should also take into account the value of improved replacement, including disasterprevention and mitigation criteria, such as better technology and quality and more resistantstructures. The country now has an opportunity to rebuild on sounder economic, social andenvironmental bases while simultaneously reducing its vulnerability to natural disasters.
The ECLAC mission interviewed representatives of the government, the private sector,international organizations, UNDP and other United Nations agencies, who frequently providedinformation and valuable suggestions for the preparation of this document.
The figures used in this chapter were calculated in local currency and in US dollars, basedon the exchange rate of BZ$2.00 per US dollar.
1. Social sectors
a) Housing
Some 3,000 houses have been so badly damaged by Hurricane Keith that they requirecomplete replacement for families to be able to occupy them once again. This represent a littleless than 10 per cent of the affected area’s housing stock which was estimated in 1994 at 35,355units. Of these the destroyed ones are almost two thousands. The most affected districts wereBelize (namely in San Pedro and Caye Caulker) and Orange Walk. Table 13 indicates thebreakdown by district.

25
Table 13
BELIZE: LOCATION AND NUMBER OF HOUSES AFFECTED BYHURRICANE KEITH
Damaged houses(Cost of damages)
Lost houses(Reconstruction
costs)District Number
Thousands of Belize dollars
Total 1,988 21,725.3 46,735.3
San Pedro 406 10,280.0 12,670.0
Caye Caulker 275 6,625.0 9,625.0
Belize District (other than cayes) 65 2,761.0 3,490.0
Orange Walk 1,212 1,889.3 11,034.3
Cayo District 30 90.0 90.0
Corozal District 0 80.0 80.0
Other a/ … … 9,746.0
Source: ECLAC, on the basis of official data.
a/ Damaged houses in the villages of More Tomorrow, Roaring Creek and Black man Eddy were not yet counted and, thus, not included here.
Many dwellings were either totally destroyed or suffered complete or partial roof damage,particularly in the coastal areas hit by hurricane-force winds. Others suffered damage as a resultof flooding. In all cases there was severe losses in spite of the materials used.
Damages to house in Caye Caulker are expected to have some negative effect on thetourism sector as many of those home offered a tourist service of bed and breakfast. It wasestimated that approximately 238 homes on the Cayes were completely destroyed while 558needed roofs and other repairs.
The repairs and replacement to similar conditions (which appear in Table 14) have a valueof BZ$36 million. To this cost must be added the indirect costs of lost or increased rental costs,some looting that occurred and the replacement of lost furnishings and expenses generated inshelters while the homeless victims remained there.
It was reported than in many cases only the head of the household remained on the islandwhile the rest of the family had left to stay with relatives on the mainland. As mentioned earlier,for the most part, persons preferred not to stay in temporary shelters, but to live with friends andfamily fortunate enough to have homes. Some hotels and property owners opened their doors tothe homeless as well.

26
Table 14
BELIZE: SUMMARY OF EFFECTS ON THE HOUSING SECTOR
Thousands ofBelize dollars
Total 68,620.8
Direct effects: (a = i + ii) 68,460.6
i. Reparation of damaged houses 21,725.3
ii. Replacement of lost houses 46,735.3
Imported component 14,020.6
Indirect effects 160.2
Source: ECLAC, on the basis of official data.
Reports indicated that the repairs to homes on the islands were very slow to commence.Lack of building materials and a plan that provided alternatives for securing financial assistancemay have contributed to this.
It should be noted that the dwellings destroyed completely were generally made of flimsymaterials and very precariously built. This poor quality of housing makes persons morevulnerable to hurricanes. Building codes are not adhered to as poor people build wood andthatched roof structures or wood and zinc roof structures without necessary approval. Timberblockhouses are also common. Many housing settlements are in flood prone or low lying districtsincreasing their vulnerability to the effects of a hurricane. It must be pointed, nevertheless, thatreconstruction with some required improvements to reduce vulnerability is a larger figure, as canbe seen in Table 15.
Table 15
BELIZE: ESTIMATED RECONSTRUCTION COSTS
Thousands ofBelize dollars
Total 106,416.9
Direct effects: (i + ii + iii) 93,470.6
i. Reparation of damaged houses 36,989.3
ii. Replacement of lost houses 46,735.3
iii. Cost of furnishings 9,746.0
Imported component 16,757.1
Secondary effects (relocation) 12,946.3
Source: ECLAC, on the basis of official data.
27
b) Education
Damage to the education sector was considerable. Particularly hard hit were the schoolsthat suffered damage to their roofs and to their structures due to flooding. Schools in BelizeDistrict, particularly the Cayes and Belize City suffered the most damage. Those located inOrange Walk and Cayo District suffered the next highest level of damage. In all some 51 schools,thirty-three at the primary and 18 at the secondary level were damaged both in rural and urbanareas. (See Table 16.)
As a result of the hurricane over 2,000 children were unable to attend school for a periodof at minimum two and a half weeks. The government attempted to get children back in school asquickly as possible. In some instances children were out for as many as four weeks in order toprobably sanitise the facilities, particularly those in the Belize river valley, New River and theRio Hondo which required flushing, cleaning and disinfecting before the classes could resume.This has a sense of urgency since education is critical for Belize as the recent literacy surveypoint to a functional literacy rate of only 42.5 per cent and the 1996 poverty assessment identifiesa clear relationship between poverty and people’s level of education.
The larger amount of total damage corresponds to direct costs; indirect costs were slightlylower (BZ$810,000). Damage to infrastructure centred on semi-destroyed schools. Schools thatwere used as shelters also suffered damage in the vicinity of some BZ$127,000. (See Table 17.)Most were vacated within two weeks of the disaster.
Schools lost newly created computer laboratories, desks, chairs and educational materials,all of which will set back the educational programme of the Ministry of Education which isgeared to improving the quality of education offered to its population.
Three libraries, two located in Belize city, the Leo Bradely Library and the North FrontStreet Library, and one in Belmopan, the Belmopan Library, suffered damage as a result of therains and flooding. The cost of repairs have been estimated at BZ$102,000, to which should beadded furnishings in the amount of BZ$622,125.
Sporting facilities have suffered damage due not only to the hurricane but also as a resultof their having been used as emergency distribution points and temporary deposits for diversematerials (electric cables, poles, etc.). Those most affected were located in Belize City, San Pedroon the Cayes, and in Orange Walk. The damage is estimated at BZ$418,000. (See table 18.)
Table 19 summarises the direct and indirect costs of damages to the education sector.Reconstruction and reinforcement of existing structures in order to reduce vulnerability andexposure to risk associated with climatic phenomena could increase costs considerably. Thisfigure will depend on the Government and communities decisions in respect of the mitigationprocess.

28
Table 16
BELIZE: SCHOOLS DAMAGED BY HURRICANE KEITH
(Thousands of Belize dollars)
District Rural Urban Damages
Total 958.2Belize District 556.9
All Saints School Belize City x 17.0Buttonwood Bay Nazarene Primary School Belize City x 10.3Central Christian Assembly Belize City x 27.3Excelsior High School Belize City x 10.1Fort George Education Center Belize City x 16.6Gwen Lizarraga High School Belize City x 25.1Ladyville Technical High School Belize City x 14.5Lake -1 Community Center Belize City x 7.4Nazarene High School Belize City x 96.3Pallotti High School Belize City x 15.6Queen Square Anglican School Belize City x 5.1St. John's Primary Belize City x 20.1St. John's Vianney Belize City x 1.8St. Joseph School Belize City x 2.5St. Martin de Porres, (BZE) Belize City x 9.1St. Mary's/Queen's Square/ St. John's AnglicanSchools (BZE)
Belize City x 27.7
Wesley College Belize City x 3.0Caye Caulker RC School Caye Caulker x 71.2San Pedro Adventist San Pedro x 67.2San Pedro High School San Pedro x 5.7San Pedro RC School San Pedro x 53.0San Pedro Seventh Day Adventist School San Pedro x 50.3
Corozal and orange walk 185.4Caledonia School Corozal x 0.4Sarteneja Kindergarten Corozal x 1.2Sarteneja School Corozal x 15.0Schools in the Corozal District Corozal x 123.9OW Schools to date Orange Walk x 44.9
Other 215.8Anglican Cathedral College x 34.2Canaan SDA High School x 6.0Center for Employment Training (BZE) x 29.3Edward P. Yorke High School x 3.8Grace Primary School x 90.0Maskall RC x 4.0Sadie Vernon High School x 0.3St. Catherine's Academy x 44.1St. Edmond Champion RC School x 0.4Stella Maris School x 3.7
Source: ECLAC, on the basis of official data.

29
Table 17
BELIZE: SCHOOLS DAMAGED FROM USE OF SHELTERS
District Rural UrbanDamages
(Thousands ofBZ$)
Total schools 127.1
San Pedro Roman Catholic School x 53.0
Fort George Education Centre Belize City x 16.6
Queen Square Anglican School Belize City x 5.1
Salvation Army Belize City x 1.5
St. John's Middle & Upper School Belize City x 20.1
Buena Vista School Corozal x 1.2
Caledonia School Corozal x 0.4
Copper Bank Corozal x 0.2
Corozal Town Health Clinic Corozal x 0.4
Progresso School Corozal x 0.1
Ranchito School Corozal x 3.5
August Pine Ridge Orange Walk x 10.0
Fireburn School Orange Walk x 10.0
San Felipe School Orange Walk x 0.5
San Francisco School Orange Walk x 1.8
Yo Creek RWS Orange Walk x 2.8
Source: ECLAC, on the basis of official data.
Table 18
BELIZE: DAMAGES TO SPORTING FACILITIES
(Thousands of Belize dollars)
District Rural Urban Damages
Sporting Facilities 418.9
MCC Grounds Belize City x 14.4
Roger Stadium Belize City x 32.3
National Sports Council Office Belize City x 3.7
City Center Sporting Facility Belize City x 223.1
National Stadium Belize City x 50.9
San Pedro Town Football Field San Pedro x 9.3
San Pedro Town New Football Field San Pedro x 31.0
San Pedro Town Basketball Court San Pedro x 13.0
San Pedro Town Five A Side Football Court San Pedro x 7.5
Norman Broaster Stadium (Cayo) Cayo x 2.5
People's Stadium (Orange Walk) Orange Walk x 31.3
Source: ECLAC, on the basis of official data.

30
Table 19
BELIZE: SUMMARY OF EFFECTS ON THE EDUCATION SECTOR
Thousands of Belizedollars
Total 3,038.3Direct effects: 2,289.1i. Reparation of schools (without improvement) 958.2ii. Replacement of school materials and furnishings 810.0iii. Damages to libraries 102.0iv. Damages to sport facilities 418.9Imported component a/ 911.5Indirect effects: 749.2i. Cost of teachers during class suspension 622.1ii. Damages for use as shelters 127.1Source: ECLAC, on the basis of official data.a/ Includes computers lost during the disaster.
c) Health sector
i) Health infrastructure. The main damages to the health infrastructure were reportedto the National Hospital (Karl Heusner Memorial Hospital) and the Central Medical Laboratoryand several clinics in Belize City, Belize rural, San Pedro (Ambergris Caye), Corozal and OrangeWalk districts. It is estimated that eleven health centers lost their three-month medical suppliesand basic equipment.
The Karl Heusner Memorial Hospital is the national referral hospital in Belize (119 beds),receiving patients from the City and all the Districts as well as being the Accident andEmergency Centre for Belize City and the rest of the country. Immediately before and duringKeith, some patients were discharged and sent home from the Hospital, and some weretransferred to the District Hospitals in Belmopan and San Ignacio.
The Hospital, therefore, remained functional throughout the storm and this is undoubtedlya tribute to the determination and resilience of the staff as a large amount of water entered thebuildings through the roof, windows and doors and also up through the floor. Fortunately noserious damage was reported to equipment, although the immediate and longer-term effects of thewater seepage on the floor and ceiling tiles will undoubtedly be a problem.
The Central Medical Laboratory and Blood Bank is the only such facility in the country,and its main activity is the analysis of Safe Blood for transfusion. The hurricane affected the SafeBlood supply as all reagents, all blood units stock (50) and 100 per cent of supplies were lost dueto electricity failure (the generator didn’t work) and flooding.
Several pieces of furniture and equipment are malfunctioning or damaged followingHurricane Keith. Some of them are essential such as: the Blood Bank Unit (Refrigerator), the

31
ELISA washer (for HIV, hepatitis and dengue testing) and the autoclave, two large capacitystorage refrigerators (bacteriology and chemistry), the Histo-center and two microscopes from theHistology/Cytology Department.
Minor water damage to ceilings, roofs, floors and workstations was reported on the threefloors due to leaking and flooding, but damages need to be repaired to ensure correct function.
Availability of safe blood for transfusion is a major area of concern, since blood screeningfor HIV, hepatitis B and syphilis cannot be performed presently due to the lack of reagents andequipment. Therefore, the restoration of the Central Medical Laboratory and Blood Bankcapacity for blood safety is an urgent matter.
ii) Epidemiological and environmental health issues. Water supply systems weregreatly affected by Hurricane Keith. The islands and four districts were completely floodedresulting in dumpsites, sewer lagoons and excreta from latrines and septic tanks being washedinto residential areas. This also caused contamination of wells used by the residents for drinkingpurposes. On the basis of available information, approximately 480 water wells were affected,representing a 10 per cent of the total of this kind of facility in the country. In addition, 1,140excreta disposals were destroyed or partially affected by the hurricane, amounting toapproximately 20 per cent.
The poor environmental conditions, poor personal hygiene, together with theunavailability of sufficient safe water also makes food safety a concern, since there is neither aninspection mechanism in place nor equipment to ensure safety standards. Food poisoning caseshave already been reported. Due to the existing epidemiological situation, compounded by theenvironmental conditions and the disruption of public health and primary care services, thepotential for outbreaks is high. Communities living in flooded areas are at particularly high riskof being affected by possible outbreaks or diseases such as dengue fever, typhoid, malaria,cholera, gastroenteritis, leptospirosis, Chagas and hepatitis A, which are already endemic in thecountry. Table 20 indicates the population at risk in the affected districts.
Table 20
BELIZE: POPULATION AT HIGH RISK OF HEALTHIMPAIRMENT
Total 72,092
Belize 35,314
Orange Walk 15,536
Corozal 15,419
Cayo 5,823Source: PAHO/WHO.

32
Table 21 summarises the direct and indirect damages experienced in the health sector.Reconstruction costs and an indication of import components are included.
Table 21
BELIZE: SUMMARY OF DAMAGES TO THE HEALTH SECTOR
(Thousands of Belize dollars)
Damage
Total Direct Indirect
Reconstruction
costs
Imported
components
Total 3,888.0 2,558.0 1,330.0 2,855.0 1,600.0Partial or total destructionof health infrastructure
1,130.0 1,120.0 10.0 2,200.0 a/
Loss equipment andfurnishings
640.0 640.0 1,500.0
Health communityeducation material
70.0 70.0
Extra spending on drugsand medications
524.0 104.0 420.0 5.0 100.0
Vector control-environmental sanitationactivities
674.0 674.0
Increase cost of inpatient,outpatient and medicalcare
123.0 123.0
Epidemiologicalsurveillance
30.0 30.0
Damages in rural watersupply systems (wells, rainwater vats)
157.0 157.0 250.0 a/
Damages in ruralsanitation systems(latrines)
537.0 537.0 400.0
Psycho-socialrehabilitation(consultancy and trainingmaterials)
3.0 3.0
Source: PAHO/WHO different reports: “Preliminary Economic Impacts of Hurricane Keith”, NEMO, Oct. 2000, Situation Analysis of Rural Water Supply & Sanitation in Belize, UNICEF, Ministry of Health, PAHO/WHO, 1995.a/ Includes some minor improvements.

33
2. Damage in productive sectors
This section includes estimates of damage to the agricultural, fisheries, tourism, and otherproductive and services sectors. The extremely severe weather conditions in the wake ofHurricane Keith caused serious disruptions to the country. Some were very brief namely the cutsin basic services that were quickly restored. Others will have more serious implications. Theimpact on tourism is broken into two aspects. Damages to the infrastructure, which will berepaired and replaced promptly, and the number of visitors, which may be adversely affected inthe impending high season. It must be praised that the government and the private sectoroperators have joined efforts in launching a campaign to dispel a false perception that mightaffect them negatively. In the case of agriculture and fisheries the effects will be somewhat morelasting, given the seasonal nature of their production and the persevering negative physicalconditions associated with slowly receding waters and mud deposits. Crops tend to be the mostaffected due to excess water, and crop damage depends on various factors, which are describedbelow.
Apart from losses of infrastructure and capital goods (tractors, combine harvesters, etc.),direct damage in the farming sector includes lost harvests and stored produce. The effect of thehurricane on future farming output is considered indirect damage, whereas in the industrial sector(namely sugar processing, rice husking, citrus concentrate), inventories and goods in processaffected by the hurricane are counted as direct damage.
a) Agriculture, livestock and fisheries sector
As a result of Hurricane Keith, the agriculture sector experienced major losses. Sugar,citrus and rice crops were affected in the districts of Corozal, Orange Walk, Belize and Cayo. TheOrange Walk District was affected the most, accounting for 35 per cent of total estimated losses.It was mainly damages to the sugar cane crop, which is the most important agricultural exportcommodity for the district and the country. The citrus industry – the second most importantexport crop – also experienced major losses in the Cayo District. In Blue Creek, which is themain producing area for rice, only 5 per cent of the crop could be harvested, the rest was lost dueto the flooding.
Major losses in crops and livestock were experienced as a direct result of floods. In someareas water remained without draining for a significant period of time. During this period mostcommodities for national consumption were in production and reaching harvesting time. This hasincreased losses since harvesting could not be carried out in time. This will also affect nationalconsumption and product availability to those who store their crop for home consumption. Riceand beans will have to be imported, in order to attain the necessary food supply for next year.
The livestock sector suffered minimal direct damages compared to total stocks. Majorlosses in this sector were linked to damage to pastures and to secondary effects resulting fromstress and loss of weight in cattle and poultry.
The fisheries sector experienced significant damages especially in the reduction ofexpected catch, due to silt accumulation. Most affected are areas of lobster production. This is
34
expected to also reduce the annual catch for some time (up to three years), with the consequentnegative impact on the income of the majority of fishermen.
The Ministry of Agriculture, Fisheries and Co-operatives (MAFC) reacted immediatelyby preparing a comprehensive and well-organised plan, which involved in providing inputs andother supplies to alleviate the present situation. At the same time an immediate plan of action wasactivated with the assistance of supporting agencies such as IICA, FAO, and the Regional Unitfor Technical Assistance in Central America (RUTA, run by IICA and funded by the WorldBank), to start the recovery of areas affected. Seed distribution, assistance in preparing loanapplications, machinery services were the immediate steps taken by MAFC.
i) Crop Analysis. Sugar Cane: This commodity is a major contributor to the BelizeanEconomy involving approximately 9,000 farmers. Approximately 22 per cent of total expectedproduction was lost mainly due to flooding along the Rio Hondo and New River. It is estimatedthat 24,281 hectares were flooded, production being lost in at least 2,835 hectares. A reduction of15 per cent in yield is expected alongside an increase of transportation cost due to the presentroad situation. Additionally, some replanting will be necessary due to loss of rootstock underextended period of flooding and reworking will also be needed to replace herbicide and fertilizerwashed away and to eradicate new weed seeds most likely to germinate. Being the majorcommodity exported, these losses in production will not only have a significant effect on thesocio-economic standard of the sugar-cane farmer, but will impact the overall economicperformance for the period 2000-2001.
Citrus: Approximately 2,553 hectares of citrus were completely lost in the Cayo, OrangeWalk, Belize and Stann Creek districts. A reduction of 5 per cent in production is estimated forthe remaining planted surface. This will have, added to the decrease in the price of the product, asignificant impact to the citrus farmer and the juice extraction industry as a whole. Lossesresulted as a consequence of the excessive high winds that affected the coastal areas.Additionally, flooding in some areas prevented harvesting; therefore a loss in production wasrecorded. An increase of phytophthora disease is expected, so farmers will have to increaseinvestment to prevent major losses in production.
Papaw (Papaya): A total of over BZ$4.3 million were lost as a result of wind destructionmainly in the Corozal, Orange Walk and Cayo districts. This will decrease expected productionby 15 per cent and impact negatively in the exports of this crop. The recuperation and futureexpansion of papaya plantations could generate major foreign exchange earnings, sinceCARICOM partners appreciate the quality of the Belizean product.
Other export crops: The Government of Belize has initiated a program to identify newcommodities for the export market such as cowpeas, plantains, etc. Some of these crops sufferedmajor losses, totalling approximately, BZ$20 million. Promotion of these commodities in theCARICOM market is a potential area for future investments. It is also socially important becausemost farmers involved are very small in size but capable and ambitious.
Rice: This is a major domestic crop widely cultivated in the Orange Walk, Corozal andBelize districts. Major production is concentrated in the Mennonite Community of Blue Creek (inthe Orange Walk District) where an intensive production system is carried out. Harvesting of rice

35
was about to start when the hurricane hit, flooding about 50 per cent of the rice area, part ofwhich is still flooded after several weeks.
Corn: This is also a very important crop in the northern part of the country and is destinedmainly for the production of cattle, poultry, pigs and sheep feed. Almost 70 per cent of the cornarea was affected (10,994 hectares) with a total cost of BZ$6.9 millions. It is estimated that in thepreparation of feeds, another inputs can be used, in order to avoid imports until the next crop isavailable in October 2001.
Other crops were also damaged, but losses were not of a significant economic importanceas a whole. Soybeans, plantains, beans, vegetables and root crops can be included among theseless severely affected productions.
ii) Livestock. Major damage occurred in grazing lands. An area of 17,627 hectaresremained under water for over 15 days. Most of the area damaged will have to be replanted, andin the meantime the cattle should be moved to other places to be fed until the new pastures willbe ready to be used. The Government is already operating a plan to feed cattle using sugar canethat will not yield sugar since it was blown down by the wind. This cane is to be cut and choppedfor animal consumption. This plan and similar initiatives should be considered forimplementation while grazing lands and pastures recover. In order to reduce the pressure on thediminished feeding capacity, some cattle could be sold and sent to farmers in other areas of thecountry.
Commercial rearing of chickens was not significantly affected by the strong winds thataccompany the hurricane, but some chicken held by small farmers, practically disappeared in themore severely affected areas. It is estimated that almost 40,000 chicken were lost during Keith.
iii) Fisheries. Lobster catching is the mainly affected activity in the fishing industry.Hurricane Keith came in the area in the middle of the fishing season (Jun 15 – Feb 15), withpeaks in the last three months of the year. This not only affected the capture of lobster but alsodamaged the infrastructure and equipment required by the fishermen. Vessels, motors, piers, traps(cages), and in certain cases the fishermen’s dwellings and limited storage facilities weredestroyed.
Furthermore, in certain areas the sedimentation of sand, mud and debris over the fishinggrounds has made it impossible to catch lobsters after the hurricane. The recovery of these areasis vital for fishermen. Unfortunately rehabilitation is constrained to the evolution of sea currentswhich will naturally restore fishing grounds by washing away the silt that was deposited byKeith. This natural process will take some time. Furthermore, water pollution by debris pushedlobsters out of the area: they migrated and fishermen will have to wait until they come back. Inthe meantime they are building and repairing the traps and restoring their infrastructure and gear.The MAFC has been giving these fishermen supplies, such as wood to assist them to recover.
Damage was not reported in shrimp production, most of which is done mainly in pondswhich are located in the outskirts of the most severely hit districts. In the last five years shrimpproduction has increased at a very accelerated rate. Exports grew from BZ$26 million in 1996 to

36
close to BZ$46 million in 1999. This economic activity is expanding and it has a promisingfuture and could partially compensate for the decline in lobster catch.
In addition to crops, animal and fishing resources affected some capital goods, machinery,farm equipment and inputs were damaged or lost during Keith. This includes a substantialamount of in-farm feeder roads. Table 22 summarises the direct and indirect effects on thisimportant sector.
b) Tourism
Damages caused by Keith are particularly harmful to the tourism sector since it is themost important economic activity in the Belizean economy. According to the World TourismOrganization (WTO) in 1996 it represented 14.3 per cent of GDP. It also constitutes the majorexport item of Belize, generating in 1998 revenues of US$88 million and almost doubling thesecond export item (sugar).
Tourism has developed over the last decade as a dynamic sector, which is experiencingrapid growth (see Graph 5 below). Tourist arrivals have almost doubled, tourist infrastructure andtourist activities supply also expanded at a high rate. 9 A most important factor to be consideredis that tourism products are related to Belizean culture and the country’s natural resourcesendowment: tropical rain forest, living cultures, historic buildings and marine life. 10 Regardingcountry of origin, 70 per cent of visitors to Belize are from the United States and Canada and23 per cent from Europe.
In terms of room revenue, 11 the most important areas of the country are Ambergris Caye(43.1 per cent of total room revenues), Belize District (23.6 per cent) and the Cayo District(10.7 per cent). The high season for tourism in Belize is from December to Easter.
i) Damage caused by Hurricane Keith. Direct damages. Sustained winds and stormsurges brought by Hurricane Keith ravaged the northern Cayes of Belize, in particular AmbergrisCaye, Caye Caulker, and Caye Chapel. (See Table 23.) Most of the hotels (62 in Ambergris Cayeand 37 in Caye Caulker) and other tourist infrastructure and assets suffered damage with varyingdegrees of severity. Inland, fewer damages to the tourism sector were reported. An importantMaya archaeological site, the ruins located in the Lamanai Nature Reserve reported damagescaused by strong winds (fallen trees) and flooding. A crevice in the main pyramid structuredamaged the cultural landmark.
9 Between 1990 and 1999 the number of hotels increased from 210 to 390 and the number of
rooms from 2,115 to 3,963. (BTB.)10 In a survey conducted in 1997, marine attractions were rated as the highest motivating factor
for visitors to Belize. (BTB.)11 BTB receives 7 per cent tax based on the sale of hotel rooms.
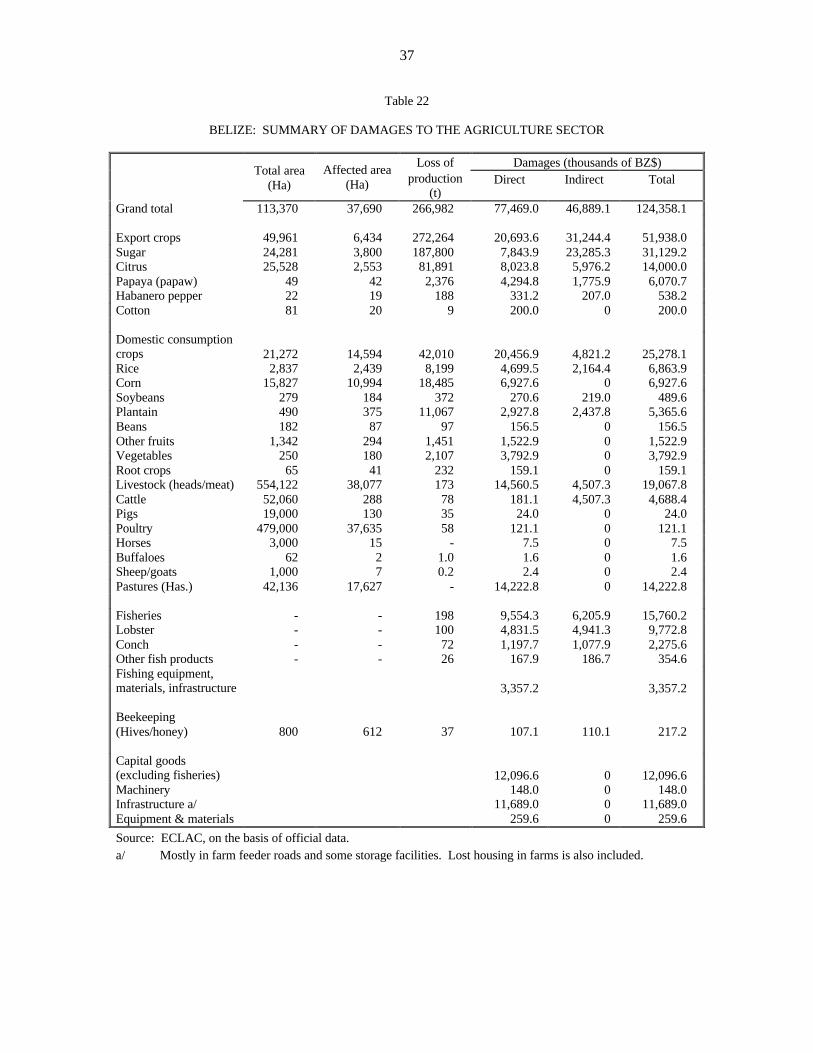
37
Table 22
BELIZE: SUMMARY OF DAMAGES TO THE AGRICULTURE SECTOR
Damages (thousands of BZ$)Total area
(Ha)Affected area
(Ha)
Loss ofproduction
(t)Direct Indirect Total
Grand total 113,370 37,690 266,982 77,469.0 46,889.1 124,358.1
Export crops 49,961 6,434 272,264 20,693.6 31,244.4 51,938.0Sugar 24,281 3,800 187,800 7,843.9 23,285.3 31,129.2Citrus 25,528 2,553 81,891 8,023.8 5,976.2 14,000.0Papaya (papaw) 49 42 2,376 4,294.8 1,775.9 6,070.7Habanero pepper 22 19 188 331.2 207.0 538.2Cotton 81 20 9 200.0 0 200.0
Domestic consumptioncrops 21,272 14,594 42,010 20,456.9 4,821.2 25,278.1Rice 2,837 2,439 8,199 4,699.5 2,164.4 6,863.9Corn 15,827 10,994 18,485 6,927.6 0 6,927.6Soybeans 279 184 372 270.6 219.0 489.6Plantain 490 375 11,067 2,927.8 2,437.8 5,365.6Beans 182 87 97 156.5 0 156.5Other fruits 1,342 294 1,451 1,522.9 0 1,522.9Vegetables 250 180 2,107 3,792.9 0 3,792.9Root crops 65 41 232 159.1 0 159.1Livestock (heads/meat) 554,122 38,077 173 14,560.5 4,507.3 19,067.8Cattle 52,060 288 78 181.1 4,507.3 4,688.4Pigs 19,000 130 35 24.0 0 24.0Poultry 479,000 37,635 58 121.1 0 121.1Horses 3,000 15 - 7.5 0 7.5Buffaloes 62 2 1.0 1.6 0 1.6Sheep/goats 1,000 7 0.2 2.4 0 2.4Pastures (Has.) 42,136 17,627 - 14,222.8 0 14,222.8
Fisheries - - 198 9,554.3 6,205.9 15,760.2Lobster - - 100 4,831.5 4,941.3 9,772.8Conch - - 72 1,197.7 1,077.9 2,275.6Other fish products - - 26 167.9 186.7 354.6Fishing equipment,materials, infrastructure 3,357.2 3,357.2
Beekeeping(Hives/honey) 800 612 37 107.1 110.1 217.2
Capital goods(excluding fisheries) 12,096.6 0 12,096.6Machinery 148.0 0 148.0Infrastructure a/ 11,689.0 0 11,689.0Equipment & materials 259.6 0 259.6
Source: ECLAC, on the basis of official data.a/ Mostly in farm feeder roads and some storage facilities. Lost housing in farms is also included.

38
Graph 5
BELIZE: TOURIST EXPENDITURE, 1998-1999
Source: Belize Tourism Board (BTB).
44.2
58.8
88.9 89.5
119.3
138.5142.7
154.1
177.2 176.0
216.6222.9
0.0
50.0
100.0
150.0
200.0
250.0
1988 1989 1990 1991 1992 1993 1994 1995 1996 1997 1998 1999
Mill
ions
of
Bel
ize
dolla
rs

39
Table 23
BELIZE: DIRECT DAMAGES IN TOURISM
(Ambergris Caye/San Pedro, Caye Caulker, Caye Chapel)
(Thousands of BZ$)
Total 124,094.01. Hotel buildings (including furniture, equipment, damage golf course) a/ 84,000.02. Gift shops a/ 10,000.03. Restaurants a/ 11,800.04. Landscaping b/ 2,560.05. Piers/marinas c/ 1,134.06. Seawalls + backshore d/ 10,400.07. Tourist related boats (140) a/ 4,200.0
Source: ECLAC on the basis of official data.a/ From information provided by the Belize Tourism Board (BTB) and insurance claims.b/ Based on interviews in San Pedro; approximately BZ$2,000 per room (1,278 rooms in both Cayes).c/ Based on dock replacement cost in Mata Chica; BZ$700 per meter; considering 905 of 45 piers in San Pedro and 15 in Caye Caulker damaged and an average 30 m per pier needing reparation.d/ It includes BZ$ 10 million in Caye Chapel for 2,880 m of shoreline and BZ$0.4 million in Caye Caulker at the split (110 m).
The following damages were reported in the northern Cayes:
− Two hotels in Caye Caulker and one in Ambergris Caye were completely destroyed and several suffered structural damages.
− A great share of hotels suffered roof damages, usually leading to interior damages (ceilings and room furniture).
− Damages to equipment (water pumps, water heaters, washing machines, air conditioners)− Landscaping damages: losses of trees and ornamental plants, litter.− Damages to gift shops and restaurants.− Damages to the golf course of Caye Chapel.− Piers partially or totally destroyed.− Seawalls destroyed in Caye Chapel and Caye Caulker.− Property lost by beach erosion (included in environment damage assessment).− Losses of boats mainly devoted to tourism activities.
Indirect damages. Indirect damages attempt to capture those losses for Belizean economy relatedto the drop of tourist arrivals: 12
− Lost occupancy in hotels (Ambergris Caye and Caye Caulker are considered).− Drop in tourist expenditure (including meals & drinks, local transport, entertainment,
shopping and other).− Departure taxes lost.
12 According to BTB there are no losses from cruise ships; neither it has been detected drop in
room rates.

40
Other indirect costs related with tourist sector in the form of additional expenditures arethe following:
− Additional efforts in tourist promotion to counterbalance sensationalised informationof the international media. BTB reacted rapidly to the negative publicity and re-allocatedfunds to increase marketing efforts in response to Keith. A budget of BZ$1.2 million isbeing spend on this extra effort, in addition to the total marketing budget for the biennium2000-2001of BZ$4.6 million.
− Lack of energy supply in the Cayes caused a number of hotels to invest in generatorsto face the tourism high season.
Until October, when Hurricane Keith hit Belize, tourist arrivals through the main airport(Phillip Goldson International) were reaching record numbers. For the first ten months of the yeararrivals were 20 per cent higher than for the same period in 1999.
Graph 6 and Table 24 illustrate the effect of the estimated drop of tourist arrivals after thehurricane. The projected figures are based on the following considerations:
1. If Hurricane Keith would not have occurred, tourist arrivals in the period October 2000to February 2001 would be 20 per cent higher than in the same period of the last year (the sametrend as in the first ten months).
2. BTB considers that Hurricane Mitch affected tourist arrivals to Belize from October1998 to February 1999. It is assumed that the negative publicity is significantly less in the case ofHurricane Keith. The assumption made here is that tourist arrivals will be affected up to January2001.
3. Regarding arrivals projected after Hurricane Keith, the figure of October 2000 hasbeen taken from BTB; in November there is information on the six first days (a projection of thismonth has been based in this information). It is considered that in December tourist arrivals willreach the same figure than in 1999; and that in January 2001 tourist arrivals will be 90 per cent ofthe figure projected without Hurricane Keith.
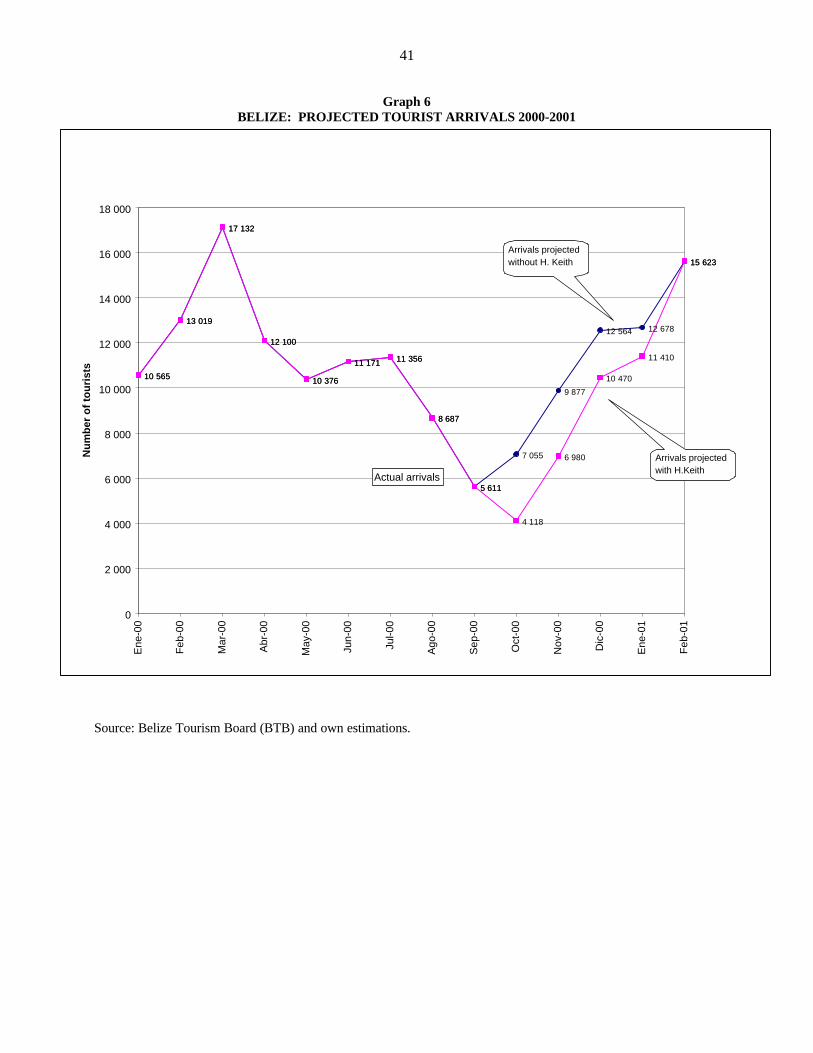
41
Graph 6BELIZE: PROJECTED TOURIST ARRIVALS 2000-2001
Source: Belize Tourism Board (BTB) and own estimations.
10 565
13 019
17 132
12 100
10 376
11 171 11 356
8 687
5 611
7 055
9 877
12 564 12 678
15 623
10 565
13 019
17 132
12 100
10 376
11 171 11 356
8 687
5 611
4 118
6 980
10 470
11 410
15 623
0
2 000
4 000
6 000
8 000
10 000
12 000
14 000
16 000
18 000
Ene
-00
Feb
-00
Mar
-00
Abr
-00
May
-00
Jun-
00
Jul-0
0
Ago
-00
Sep
-00
Oct
-00
Nov
-00
Dic
-00
Ene
-01
Feb
-01
Nu
mb
er o
f to
uri
sts
Actual arrivals
Arrivals projected without H. Keith
Arrivals projected with H.Keith

42
Table 24
BELIZE: PROJECTED DROP IN TOURIST ARRIVALS
Tourist arrivals internationalairport
Drop of tourist arrivals
Month Total Without Keith With Keith By air By land and sea a/
Total 15,027 9,196 5,831
October 2000 4,799 7,055 4,118 b/ 2,937 1,862November 2000 4,734 9,877 6,980 2,897 1,837December 2000 3,422 12,564 10,470 2,094 1,328January 2001 2,072 12,678 11,410 1,268 804February 2001 15,623 15,623
Source: ECLAC.a/ In 1999, tourist arrivals by air represented 61.2 per cent of total tourist arrivals.b/ Actual figure.
Since most of the damages suffered were in Ambergris Caye and Caye Caulker, it hasbeen assumed that tourist arrivals will drop in proportion to the number of beds in each island, 13
that is 74.3 per cent in Ambergris Caye and 25.7 per cent in Caye Caulker. Table 25 summarisesthe estimated indirect damages for the tourism sector.
The estimated drop in visitor arrivals plus the calculations made of direct and indirectdamages in tourism do not only cause a drop in the sector and the national economy’s activity,but also in the balance of payments, where the sector has a significant influence. Table 26summarises all direct and indirect damages as well as of their impact in the external sector.Indirect damages impact international trade mainly as service exports lost. In the case of directdamages many of the reconstruction items (cement, equipment, furniture, engines, zinc roofs,etc.) are imported. The local component of the reconstruction process is basically local wood andlabour.
c) Industry and commerce
The damages caused by Hurricane Keith in industry and trade were less severe than inagriculture and tourism. Manufacturing comprises some 13 percent of GDP while commerceaccounts for about 21 percent.
The manufacture of agro-industrial products will be adversely affected by the losses inagricultural production and by difficulties in transporting produce to the factories. This had beenthe case in the sugar and rice mills and citrus processing plants. In the case of citrus, the effect onthe manufacturing sector has been a loss in the production of concentrate. The 2000 production ofsugar has not been significantly affected adversely, although the next crop and production cycle
13 In Ambergris Caye the average room rate is the highest of the country. According to the
information provided by BTB, due to damages, the available room stock is only 15 per cent duringOctober, 28 per cent during November, 65 per cent during December and 82 per cent in January.
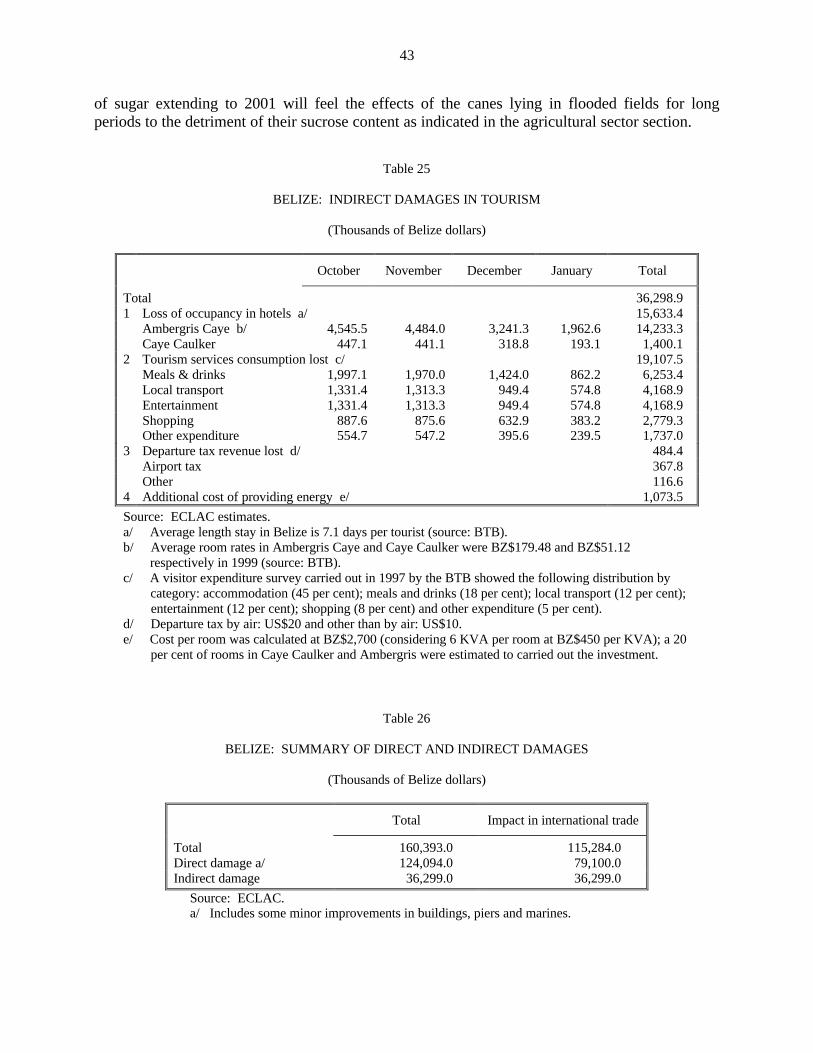
43
of sugar extending to 2001 will feel the effects of the canes lying in flooded fields for longperiods to the detriment of their sucrose content as indicated in the agricultural sector section.
Table 25
BELIZE: INDIRECT DAMAGES IN TOURISM
(Thousands of Belize dollars)
October November December January Total
Total 36,298.91 Loss of occupancy in hotels a/ 15,633.4
Ambergris Caye b/ 4,545.5 4,484.0 3,241.3 1,962.6 14,233.3Caye Caulker 447.1 441.1 318.8 193.1 1,400.1
2 Tourism services consumption lost c/ 19,107.5Meals & drinks 1,997.1 1,970.0 1,424.0 862.2 6,253.4Local transport 1,331.4 1,313.3 949.4 574.8 4,168.9Entertainment 1,331.4 1,313.3 949.4 574.8 4,168.9Shopping 887.6 875.6 632.9 383.2 2,779.3Other expenditure 554.7 547.2 395.6 239.5 1,737.0
3 Departure tax revenue lost d/ 484.4Airport tax 367.8Other 116.6
4 Additional cost of providing energy e/ 1,073.5
Source: ECLAC estimates.a/ Average length stay in Belize is 7.1 days per tourist (source: BTB).b/ Average room rates in Ambergris Caye and Caye Caulker were BZ$179.48 and BZ$51.12 respectively in 1999 (source: BTB).c/ A visitor expenditure survey carried out in 1997 by the BTB showed the following distribution by category: accommodation (45 per cent); meals and drinks (18 per cent); local transport (12 per cent); entertainment (12 per cent); shopping (8 per cent) and other expenditure (5 per cent).d/ Departure tax by air: US$20 and other than by air: US$10.e/ Cost per room was calculated at BZ$2,700 (considering 6 KVA per room at BZ$450 per KVA); a 20 per cent of rooms in Caye Caulker and Ambergris were estimated to carried out the investment.
Table 26
BELIZE: SUMMARY OF DIRECT AND INDIRECT DAMAGES
(Thousands of Belize dollars)
Total Impact in international trade
Total 160,393.0 115,284.0Direct damage a/ 124,094.0 79,100.0Indirect damage 36,299.0 36,299.0
Source: ECLAC.a/ Includes some minor improvements in buildings, piers and marines.

44
Activities in the Corozal Free zone suffered minimal negative impact. Minor dislocationsin production led to indirect damage resulting from loss of business for a period of three days.There were damages to the timber-processing sector in the Orange Walk District, affectinginventory, machinery and some buildings. More importantly, the agroindustrial sector will sufferlosses derived from crop production damages. Additionally, commercial activities – mostly inthe two main Cayes Caulker and Ambergris – suffered not only a drop in their normal business,but losses in stock and inventory, as reported by insurance claims. See Tables 27 and 28.
Table 27
BELIZE: SUMMARY OF DAMAGES IN INDUSTRY AND COMMERCE
(Thousands of BZ$)
Total damage Direct Indirect
Impact oninternational
trade
Total industry 45,829.6 30,659.6 15,170.0 41,165.0 Free trade zone 128.0 60.0 68.0 50.0 Timber processing 3,205.0 2,925.0 280.0 -Agroindustry commerce 41,115.0 26,293.0 14,822.0 41,115.0(loss of stock and inventory 1,381.6 1,381.6 - -
Source: ECLAC.

45
3. Infrastructure
a) Transport
Total direct damages in the transport sector are summarised in Table 28. It encompassesdamages to roads, ports, vehicles, airports and all means of transportation, including losses ofaircraft and vessels. How these figures were calculated is detailed in this section, where thedifferent components are analysed.
Table 28
BELIZE: TRANSPORT DIRECT COST OF DAMAGE
(Belize dollars)
Sub sectorTotal
damages
Totalreconstruction
costsLabour National Foreign
Total 46,735,790 32,726,357 5,028,785 14,321,253 13,376,319
Infrastructure (public sector) 43,550,790 28,901,357 4,991,285 14,313,753 9,596,319
Roads network 23,154,392 25,804,990 4,273,806 12,938,160 8,593,024
Airports 75,000 115,000 66,000 27,500 21,500
Ports 516,747 678,857 190,977 196,838 291,042
Villages and town streets andurban infrastructure
19,804,651 2,302,510 460,502 1,151,255 690,753
Equipment (private operators &owners)
3,185,000 3,825,000 37,500 7,500 3,780,000
Vehicles (buses) a/ 150,000 150,000 30,000 7,500 112,500
Aircraft 2,395,000 2,875,000 7,500 0 2,867,500
Vessels b/ 640,000 800,000 0 0 800,000
Source: ECLAC, on the basis of official data.a/ Ministry of Works (MOWTC&BI).b/ Vessels rescued by the Port Authority only.
One of the persistent effects of hurricane Keith – more than the wind force and theseverity of the rainfall – is the passive flooding. As the inland area effected by the storm ismainly flat, low terrain, with a very small gradient towards the sea, water remained on the groundand rivers persisted in above normal levels for a long time. This not only affected agriculturalland and cattle pastures, but very significantly also caused a breakdown in communications bythe interruption of many highways, secondary and feeder roads for an extended period. In factwater was deposited in Belize’s flood plains during the storm at much above normal levels than
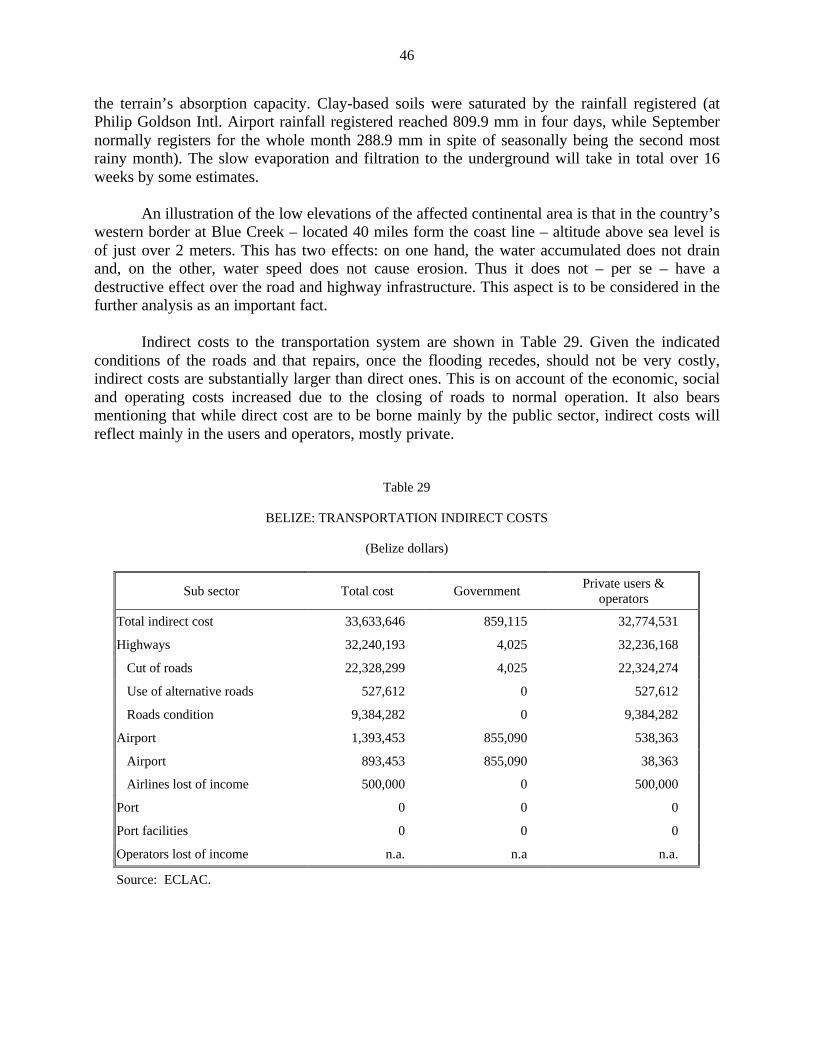
46
the terrain’s absorption capacity. Clay-based soils were saturated by the rainfall registered (atPhilip Goldson Intl. Airport rainfall registered reached 809.9 mm in four days, while Septembernormally registers for the whole month 288.9 mm in spite of seasonally being the second mostrainy month). The slow evaporation and filtration to the underground will take in total over 16weeks by some estimates.
An illustration of the low elevations of the affected continental area is that in the country’swestern border at Blue Creek – located 40 miles form the coast line – altitude above sea level isof just over 2 meters. This has two effects: on one hand, the water accumulated does not drainand, on the other, water speed does not cause erosion. Thus it does not – per se – have adestructive effect over the road and highway infrastructure. This aspect is to be considered in thefurther analysis as an important fact.
Indirect costs to the transportation system are shown in Table 29. Given the indicatedconditions of the roads and that repairs, once the flooding recedes, should not be very costly,indirect costs are substantially larger than direct ones. This is on account of the economic, socialand operating costs increased due to the closing of roads to normal operation. It also bearsmentioning that while direct cost are to be borne mainly by the public sector, indirect costs willreflect mainly in the users and operators, mostly private.
Table 29
BELIZE: TRANSPORTATION INDIRECT COSTS
(Belize dollars)
Sub sector Total cost GovernmentPrivate users &
operators
Total indirect cost 33,633,646 859,115 32,774,531
Highways 32,240,193 4,025 32,236,168
Cut of roads 22,328,299 4,025 22,324,274
Use of alternative roads 527,612 0 527,612
Roads condition 9,384,282 0 9,384,282
Airport 1,393,453 855,090 538,363
Airport 893,453 855,090 38,363
Airlines lost of income 500,000 0 500,000
Port 0 0 0
Port facilities 0 0 0
Operators lost of income n.a. n.a n.a.
Source: ECLAC.
47
i) Main highways direct damage. The storm affected the Western Highway and theNorthern Highway. The Western Highway was affected by flooding in the initial section close toBelize City due to the Sibun river overflowing. The road was underwater for a number of daysand due to the continuous passage of vehicles erosion loosened the pavement surface and affectedthe base course. Culverts overflow and blockage contributed to the slow dispersion of the waters.Most of the damage was done by heavy traffic passing over the soaked structure of the road.Additionally, at Roaring Creek Bridge, close to Belmopan, in the Belmopan-San Ignacio section,a major cut occurred due to the river’s overflow, causing the road to remain under the water levelfor a number of days.
The Northern Highway was affected by flooding in the initial section close to Belize Cityand was under also. A similar situation was observed at Carmelita Toll, the New Riveroverflowed and the highway was under water for some days. Culverts collapsed in many placesalong the lane buy no more damages were reported even the storm passed in the same directionalong all the road in its rout to the Gulf. Less damage affected some culverts in the HummingbirdHighway was also reported and included in the account.
The total direct cost of damage in these main highways is shown in Table 30.Reconstruction estimated cost of BZ$2.8 million as shown in the same table. A breakdown inlabour needs and national and foreign components is also included.
With regard to the secondary network (public feeder roads, as different from in-farmfeeders that are accounted for in the agricultural sector), of a total of 1,515.8 miles of such roads,740 of them were affected. Most damage occurred in culverts and fill erosion, with a total directcost of damage of BZ$20.7 million, as shown in Table 31.
Two bridges collapsed in low standard feeder roads. Estimated damage and reconstructioncosts appear in Table 32. Fortunately they were located in an area where many alternatives maybe used if necessary.

48
Table 30
BELIZE: DIRECT DAMAGE TO MAIN HIGHWAYS a/
(Belize dollars)
Road N° Road nameLengthmiles Activity Unit Quantity
Unit pricedamage
Unit pricereconstruc-
tion
Value ofdamage
Value ofreconstruc-
tionLabour National Foreign
Total 219.4 1,676,274 2,801,704 519,167 818,608 1,463,929
AR1 73.7 Fill yd3 1,995 30 30 59,850 59,850 8,978 32,918 17,955
Culvert foot 5,000 94 134 469,000 670,000 234,500 134,000 301,500
Base Course yd3 404 38 75 15,162 30,324 3,032 12,130 15,162
Shoulder Rep. mile 3.0 11,730 58,650 35,190 175,950 21,114 105,570 49,266
WesternHighway
STD yd2 12,000 12 24 144,000 288,000 14,400 57,600 216,000
AR2 90.9 Fill yd3 11,970 30 30 359,100 359,100 53,865 197,505 107,730
Culvert foot 1,200 94 134 112,560 160,800 56,280 32,160 72,360
Base Course yd3 2,426 15 75 36,389 181,944 63,680 36,389 81,875
Shoulder Rep. mile 3.0 29,325 58,650 87,975 175,950 17,595 70,380 87,975
NorthernHighway
STD yd2 27,667 12 24 332,004 664,008 33,200 132,802 498,006
AR3 54.8 Fill yd3 0 30 30 0 0 0 0 0
Culvert foot 267 94 134 25,045 35,778 12,522 7,156 16,100
Base Course yd3 0 15 75 0 0 0 0 0
Shoulder Rep. mile 0 29,325 58,650 0 0 0 0 0
HummingbirdHighway
STD yd2 0 12 24 0 0 0 0 0
Source: ECLAC, based on data from the Ministry of Works (MOWTC&BI).
a/ Unit prices considered for the different activities were calculated by they specialist. Supplies such as culvert pipes, cement, equipment and fuelhave to be imported, and were applied to calculate the reconstruction value. To determine the destruction value, a percentage of the total value wasapplied, depending of the activity. For filling 100 per cent was applied, as earthmovings does not loose value along the service of a route; 70 percent for culverts and bridges; 50 per cent for base course and STD and 20 per cent for shoulders.
Table 31
BELIZE: DIRECT COST OF DAMAGE TOFEEDER ROADS
(Belize dollars)
Lengthmiles
Totaldestruction
Totalreconstruction
Labour National Foreign
Total feeder affected roadsand estimated cost 740.0 20,709,617 21,152,786 3,468,364 11,117,002 6,567,420
Source: ECLAC, based on data from the MWTC&BI
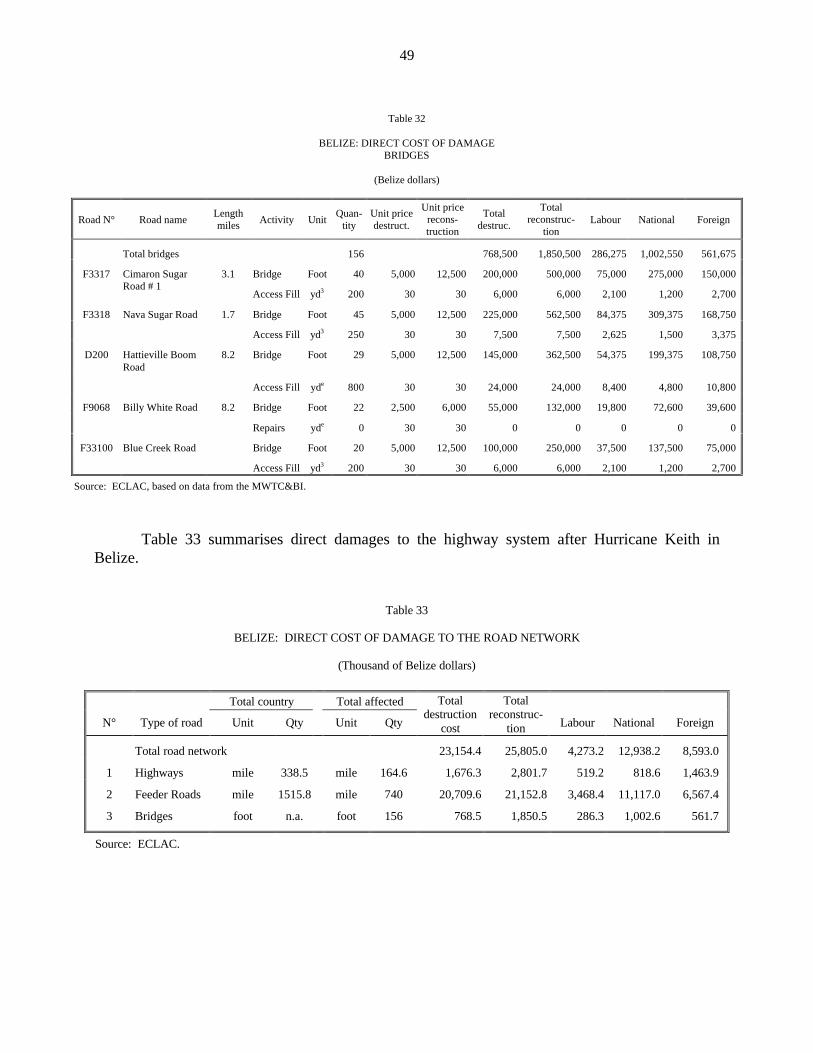
49
Table 32
BELIZE: DIRECT COST OF DAMAGEBRIDGES
(Belize dollars)
Road N° Road nameLengthmiles Activity Unit
Quan-tity
Unit pricedestruct.
Unit pricerecons-truction
Totaldestruc.
Totalreconstruc-
tionLabour National Foreign
Total bridges 156 768,500 1,850,500 286,275 1,002,550 561,675
F3317 3.1 Bridge Foot 40 5,000 12,500 200,000 500,000 75,000 275,000 150,000Cimaron SugarRoad # 1
Access Fill yd3 200 30 30 6,000 6,000 2,100 1,200 2,700
F3318 1.7 Bridge Foot 45 5,000 12,500 225,000 562,500 84,375 309,375 168,750Nava Sugar Road
Access Fill yd3 250 30 30 7,500 7,500 2,625 1,500 3,375
D200 Hattieville BoomRoad
8.2 Bridge Foot 29 5,000 12,500 145,000 362,500 54,375 199,375 108,750
Access Fill yde 800 30 30 24,000 24,000 8,400 4,800 10,800
F9068 Billy White Road 8.2 Bridge Foot 22 2,500 6,000 55,000 132,000 19,800 72,600 39,600
Repairs yde 0 30 30 0 0 0 0 0
F33100 Blue Creek Road Bridge Foot 20 5,000 12,500 100,000 250,000 37,500 137,500 75,000
Access Fill yd3 200 30 30 6,000 6,000 2,100 1,200 2,700
Source: ECLAC, based on data from the MWTC&BI.
Table 33 summarises direct damages to the highway system after Hurricane Keith inBelize.
Table 33
BELIZE: DIRECT COST OF DAMAGE TO THE ROAD NETWORK
(Thousand of Belize dollars)
Total country Total affected
N° Type of road Unit Qty Unit Qty
Totaldestruction
cost
Totalreconstruc-
tion Labour National Foreign
Total road network 23,154.4 25,805.0 4,273.2 12,938.2 8,593.0
1 Highways mile 338.5 mile 164.6 1,676.3 2,801.7 519.2 818.6 1,463.9
2 Feeder Roads mile 1515.8 mile 740 20,709.6 21,152.8 3,468.4 11,117.0 6,567.4
3 Bridges foot n.a. foot 156 768.5 1,850.5 286.3 1,002.6 561.7
Source: ECLAC.
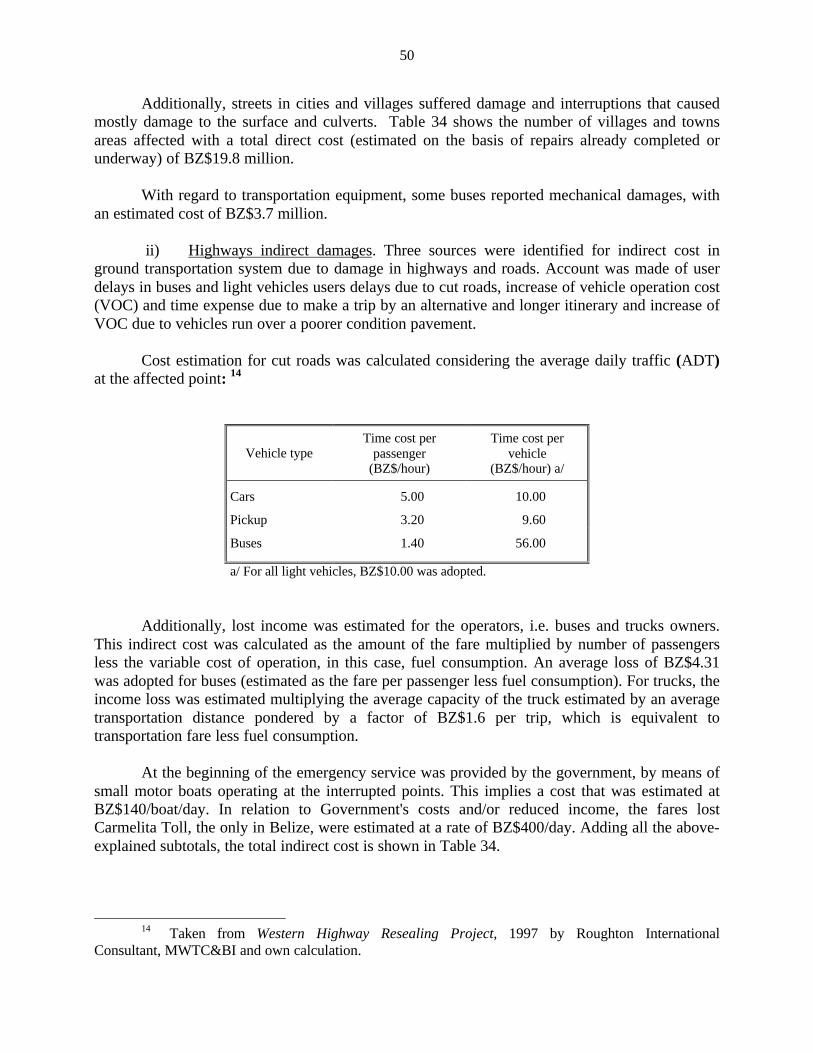
50
Additionally, streets in cities and villages suffered damage and interruptions that causedmostly damage to the surface and culverts. Table 34 shows the number of villages and townsareas affected with a total direct cost (estimated on the basis of repairs already completed orunderway) of BZ$19.8 million.
With regard to transportation equipment, some buses reported mechanical damages, withan estimated cost of BZ$3.7 million.
ii) Highways indirect damages. Three sources were identified for indirect cost inground transportation system due to damage in highways and roads. Account was made of userdelays in buses and light vehicles users delays due to cut roads, increase of vehicle operation cost(VOC) and time expense due to make a trip by an alternative and longer itinerary and increase ofVOC due to vehicles run over a poorer condition pavement.
Cost estimation for cut roads was calculated considering the average daily traffic (ADT)at the affected point: 14
Vehicle typeTime cost per
passenger(BZ$/hour)
Time cost pervehicle
(BZ$/hour) a/
Cars 5.00 10.00
Pickup 3.20 9.60
Buses 1.40 56.00
a/ For all light vehicles, BZ$10.00 was adopted.
Additionally, lost income was estimated for the operators, i.e. buses and trucks owners.This indirect cost was calculated as the amount of the fare multiplied by number of passengersless the variable cost of operation, in this case, fuel consumption. An average loss of BZ$4.31was adopted for buses (estimated as the fare per passenger less fuel consumption). For trucks, theincome loss was estimated multiplying the average capacity of the truck estimated by an averagetransportation distance pondered by a factor of BZ$1.6 per trip, which is equivalent totransportation fare less fuel consumption.
At the beginning of the emergency service was provided by the government, by means ofsmall motor boats operating at the interrupted points. This implies a cost that was estimated atBZ$140/boat/day. In relation to Government's costs and/or reduced income, the fares lostCarmelita Toll, the only in Belize, were estimated at a rate of BZ$400/day. Adding all the above-explained subtotals, the total indirect cost is shown in Table 34.
14 Taken from Western Highway Resealing Project, 1997 by Roughton International
Consultant, MWTC&BI and own calculation.

51
Table 34
BELIZE: DAMAGES TO STREETS
Villages affected(No.)
Miles Total rep.(BZ$)
Total 95 1,074 2,259,551Corozal 20 226 454,916Orange Walk 25 283 469,945Belize 18 203 448,904Belmopan 10 113 424,858Cayo 22 249 460,928
Towns affected (acres)
Total 19,941 657 17,545,100Corozal 1,920 63 1,600,000Orange Walk 4,480 148 2,400,000Belize City 8,640 285 9,860,000Belmopan 1,331 44 480,000San Ignacio 1,305 43 880,000Santa Elena 768 25 530,000Benque Viejo 512 17 350,000San Pedro 640 21 1,140,000Caye Caulker 345 11 305,100
Source: ECLAC, on the basis of data from the MOW.
It bears emphasising that the Northern Highway, which shows the highest indirect cost isthe most important route of the country. The Orange Walk and Corozal Districts that it serves areimportant sugar, cattle and other agriculture products areas and connects the Belizean-Mexicanborder where important trade is hold. On the other hand, an important traffic is observed betweenBelmopan, the Capital City and San Ignacio, where most of the government employees live, thus,the main impact in indirect cost is here at this point. Calculation of indirect cost was donedetermining the vehicle operating cost (VOC) and time expense by the comparison of both by thecurrent rout and the alternative. 15 Another factor of indirect cost was estimated by thecomparison of the VOC in the former condition of the road surface and the condition resultedafter the damage, for the period of time that is expected to be in the poorer condition before
15 Only one case was identified and is referred to the Burrel Boom Village. Current rout is 18
miles between Burrell Boom and Belize City, the mainly destination to be considered, by the NorthernHighway while alternative is 36 miles, by the Western Highway.

52
reconstruction. 16 The affected length for the Western Road was estimated in 12 miles, while thesame length for the Northern Road was 25 miles. For feeder roads, 740 miles were considered.Increase of time cost was not considered significant for this case.
Table 35
BELIZE: INDIRECT COSTS DUE OF ROAD INTERRUPTION
(Belize dollars)
Road N°Place of
interruptionADT
Boatssupply
Tolllost
Number ofdays
Total indirectcosts (thousands)
Total 3,625 400 22,328,299
AR1 Roaring Creek 2,494 725 0 3 1,290,174
AR2 Carmelita 3,694 725 400 7 12,954,609
D253 Crooked Tree 180 725 0 Undetermined 566,468
D250 Maskall 500 290 0 7 1,253,157
D362 Orange Walk 774 290 0 7 2,504,421
D334 San Felipe 500 290 0 7 1,253,157
D332 San Antonio 500 290 0 7 1,253,157
F3029 San Roman 500 290 0 7 1,253,157
Source: ECLAC
iii) Airports direct damages. The only airport that permits jetliners operation is thePhilip Goldson (PG) International Airport located in Belize City. Other national airports feedlocal services and commute tourism. Of these the one with more commercial traffic is the SanPedro Airport at Ambergris Cay, which has a paved runway and has an intensive daily service ofsmall aircraft. Of similar traffic is the Municipal Airfield of Belize where San Pedro servicedeparts, (unpaved runway).
The PG International Airport reported few damages in buildings and equipment while SanPedro Airport reported some damages, which did not interfere with the provision of services onceweather allowed for it. Such is the collapsing of part of the fence surrounding the field andinstallations. The value of these damages was estimated in BZ$75,000. Reconstruction of thefence in San Pedro is urgent because it is a safety hazard as the airstrip is in the midst of the city.
16 Surface condition is characterized by the IRI, then an IRI = 3 was considered for the former
condition and an IRI = 6 for the poorer condition. VOCs were determined by using the HDM III (HighwayDesign and Maintenance Model). This case is applied to the Northern and Western Highway, in thosesections near Belize City where the STD wearing coarse was lost. It was applied to the public feeder roadsaffected by the storm, this mean a poorer gravel surface condition. The ADT for both highways wasobtained from the Traffic Census, March 2000, MWTC&BI and an average of 500 was assumed for thefeeder roads.

53
The value for installations and equipment at PG International Airport was valued too. Alsoconsidered are damages to aircraft affecting both commercial and private small planes. (SeeTable 36.)
Table 36
BELIZE: DIRECT DAMAGE TO AIR TRANSPORTATION
(Belize dollars)
Damagecosts
Repair costs Labour National Foreign
Philip Goldson International Airport 15,000 15,000 6,000 7,500 1,500
San Pedro Airport 60,000 100,000 60,000 20,000 20,000
Subtotal airports 75,000 115,000 66,000 27,500 21,500
Sub total aircraft for public transportation 1,095,000 1,575,000 7,500 0 1,567,500
Sub total private aircraft 1,300,000 1,300,000 0 0 1,300,000
Total aircraft 2,395,000 2,875,000 7,500 0 2,867,500
Source: Director of Civil Aviation, Tropic Air and own estimates.
iv) Indirect cost of airports. Two sources of indirect cost of damages were considered:passenger delays since the airport was closed for three days (with an estimated cost ofBZ$855,090) and the loss of revenue of the local air services (valued at BZ$38,363).
v) Ports direct cost of damages. The most important damage at the Belize City Port isa breakwater under construction. Also reported were minor damages in lighthouses around thecayes:
Description of damage Damage Repairs orreconstruction
Labour National Foreign
516,747 678,857 190,977 196,838 291,042
Breakwater under construction inBelize City Port
151,417 151,417 52,996 30,283 68,138
Equipment and vessels 26,002 32,503 - - 32,503
Installations 19,865 33,109 13,244 16,555 3,311
Navigation buoys 70,512 88,140 - - 88,140
Light, warehouse & installation 98,950 123,688 24,738 - 98,950
Miscellanies damage a/ 150,000 250,000 100,000 150,000 -
a/ A lump sum estimation was placed for the small private piers wooden maid wide spread around the cays.

54
vi) Ports indirect cost of damages. The port was closed for three days but no indirectcost was assumed since the pier was in idle time. Loss of revenue of water taxis should also beconsidered, since their regular service was restarted quickly. The brief interruption wascompensated by the increased traffic in the days immediately after the hurricane as more than theregular amount of trips were made on account of visits to the damaged areas, relatives visits andtransportation of light cargo for the emergency.
There are no reliable figures of vessels lost; although the Port Authority recovered fourprivate vessels which were completely destroyed, but there is no valuation of the numerous littleleisure and transport boats destroyed in the cayes. 17
b) Telecommunications
Telecommunications services suffered damages all over the country, however the mostimportant failures are concentrated in San Pedro and Caye Caulker’s village. In many localitiesfailures were due not only to rain, flood and wind, but also to lightning storm and power failures.The total estimated cost of the damages on the telecommunication systems is show in Table 40.
In Belize City also some lines fell down while in Belize-Rural, power failure caused mostof the service’s interruption. Flooding caused a manual shutdown of the exchange in Ladyvilleand in Mile 32-Cell site, two racks and two batteries were lost. Damage in Orange Walk City wasminor, as in Blue Creek and Sartaneja. In many instances, emergency generator sets were used toprovide energy to restore the service.
In San Pedro the devastation caused by the hurricane damaged the BTL 18 infrastructure,affecting all the services provided by them, which include, local, long distance, international,data, paging, Internet, and mobile communication. The damages primarily were due to thecollapse of a 37.5-m self-supporting tower, provoked by intensive wind. The rain and floodaffected the Exchange and Transmission equipment, while, rain, wind and flood also affected theoverhead network and distribution point cases. Additionally many ancillary equipments, such as,payphones, key systems, private automatic branch exchange, Wireless Local Loop, etc. alsosuffered intensive damage.
Temporary, BTL is using a BEL tower to support their telecommunication antennas andthen to restore at least partially, the telecommunication services in San Pedro. The damaged self-supporting tower must be replaced as well as the external network and most of the electronicequipment, which was irreversible damaged by rain and flood.
In Caye Caulker the devastation caused by the hurricane damaged the BTL infrastructure,affecting all the services provided by BTL, which include, local, long distance, international,data, paging, internet, and mobile communication. The rain and flood affected the Exchange and
17 Fishing boats are accounted for in the fisheries valuation.18 Belize Telecommunication Limited (BTL). A state owner company, which is in charge to
provide local, long distance, international, data, paging, internet and mobile communication to the wholecountry.

55
Transmission equipment, while rain, wind and flood also affected the overhead network anddistribution point cases. Additionally many ancillary equipment, such as payphones, key systems,etc. were damaged. The damaged external network must be replaced as well as the electronicequipment, which was irreversible damaged by rain and flood The replacement cost, forexchange, transmission, power and data equipment and customer lines, including someimprovement to reduce vulnerability, as is also shown in Table 37.
Table 37
REPUBLIC OF BELIZE : ASSESSMENT OF DAMAGES ON TELECOMMUNICATION
(Thousands of Belize dollars)
Total Direct Indirect a/ c/ Reconstruction b/ Foreign currency c/
Total 2,422.4 1,536.0 886.4 4,850.0 3,637.5
CityCaye Caulker 614.4 614.4 - 1,940.0 1,455.0San Pedro 921.6 921.6 - 2,910.0 2,182.5Sales (Global) 886.4 886.4
Source: BTL and own calculations.a/ Indirect cost includes only the loss of profit from October to December 2000 and technical assistance received from CANTO.b/ BTL consider to improve the communication networks, switching the actual over head lines to an underground network in both cities.c/ BTL have an insurance policy which cover interruption business losses and equipment.
c) Energy
i) Electricity. The passage of Hurricane Keith resulted in excessive rainfall in thenorth and wind affecting mainly the eastern part of the country. The electrical system wasaffected as a whole, but in particular the transmission and distribution lines suffered cuts and lossof poles. Some damages affected the generating system. The most affected area is tooconcentrated in the island of San Pedro, Caye Caulker´s village and in Belize City. Interruptionsin the service occurred during the storm, affecting approximately 22,000 customers. The totalestimated cost of the damages on the electrical system is show in Table 38.
The total generation capacity was severely affected only in San Pedro and Caye Caulker.Only minor damages affected Belize City. The total demand affected (3.7 MW) represents 7 percent of the total national installed supply. San Pedro is fed through a submarine line of 34.5 kVinterconnected to the Interconnected National System (INS). The power station in the island(2 MW) is a back up station, while the Caye Caulker power station (0.965 MW) is the onlysource for its inhabitants. The INS did not break down during and after the storm and submarinecable did not suffer any damage.
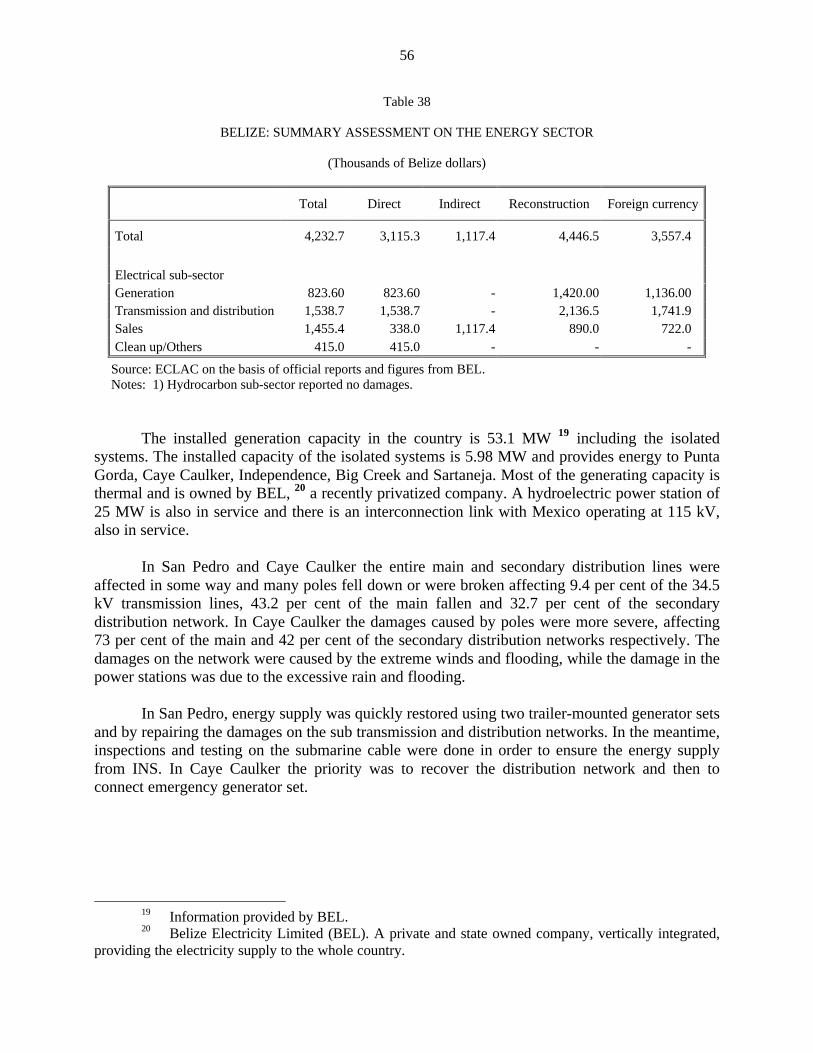
56
Table 38
BELIZE: SUMMARY ASSESSMENT ON THE ENERGY SECTOR
(Thousands of Belize dollars)
Total Direct Indirect Reconstruction Foreign currency
Total 4,232.7 3,115.3 1,117.4 4,446.5 3,557.4
Electrical sub-sectorGeneration 823.60 823.60 - 1,420.00 1,136.00Transmission and distribution 1,538.7 1,538.7 - 2,136.5 1,741.9Sales 1,455.4 338.0 1,117.4 890.0 722.0Clean up/Others 415.0 415.0 - - -
Source: ECLAC on the basis of official reports and figures from BEL.Notes: 1) Hydrocarbon sub-sector reported no damages.
The installed generation capacity in the country is 53.1 MW 19 including the isolatedsystems. The installed capacity of the isolated systems is 5.98 MW and provides energy to PuntaGorda, Caye Caulker, Independence, Big Creek and Sartaneja. Most of the generating capacity isthermal and is owned by BEL, 20 a recently privatized company. A hydroelectric power station of25 MW is also in service and there is an interconnection link with Mexico operating at 115 kV,also in service.
In San Pedro and Caye Caulker the entire main and secondary distribution lines wereaffected in some way and many poles fell down or were broken affecting 9.4 per cent of the 34.5kV transmission lines, 43.2 per cent of the main fallen and 32.7 per cent of the secondarydistribution network. In Caye Caulker the damages caused by poles were more severe, affecting73 per cent of the main and 42 per cent of the secondary distribution networks respectively. Thedamages on the network were caused by the extreme winds and flooding, while the damage in thepower stations was due to the excessive rain and flooding.
In San Pedro, energy supply was quickly restored using two trailer-mounted generator setsand by repairing the damages on the sub transmission and distribution networks. In the meantime,inspections and testing on the submarine cable were done in order to ensure the energy supplyfrom INS. In Caye Caulker the priority was to recover the distribution network and then toconnect emergency generator set.
19 Information provided by BEL.20 Belize Electricity Limited (BEL). A private and state owned company, vertically integrated,
providing the electricity supply to the whole country.

57
Graph 7
BELIZE: ELECTRIC SYSTEM
Source: BEL.Note: This map does not ratify national and international boundaries. The only purpose is to show the
locations of the electric infrastructure.
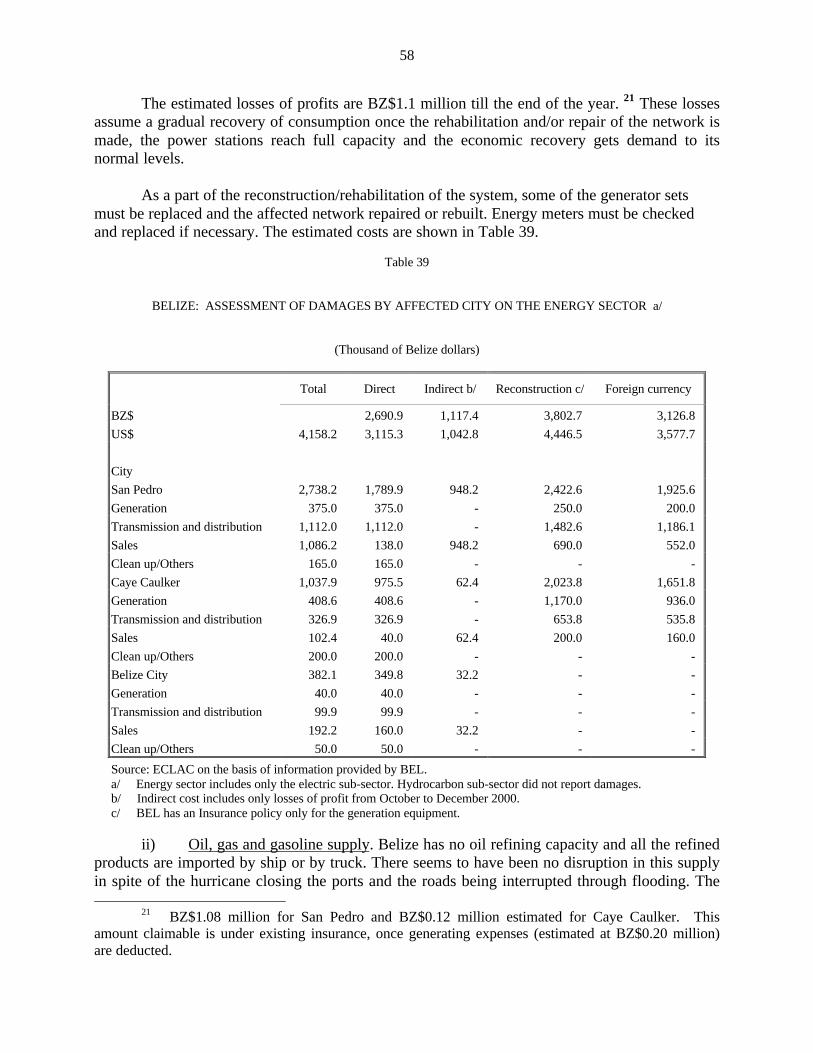
58
The estimated losses of profits are BZ$1.1 million till the end of the year. 21 These lossesassume a gradual recovery of consumption once the rehabilitation and/or repair of the network ismade, the power stations reach full capacity and the economic recovery gets demand to itsnormal levels.
As a part of the reconstruction/rehabilitation of the system, some of the generator setsmust be replaced and the affected network repaired or rebuilt. Energy meters must be checkedand replaced if necessary. The estimated costs are shown in Table 39.
Table 39
BELIZE: ASSESSMENT OF DAMAGES BY AFFECTED CITY ON THE ENERGY SECTOR a/
(Thousand of Belize dollars)
Total Direct Indirect b/ Reconstruction c/ Foreign currency
BZ$ 2,690.9 1,117.4 3,802.7 3,126.8
US$ 4,158.2 3,115.3 1,042.8 4,446.5 3,577.7
City
San Pedro 2,738.2 1,789.9 948.2 2,422.6 1,925.6
Generation 375.0 375.0 - 250.0 200.0
Transmission and distribution 1,112.0 1,112.0 - 1,482.6 1,186.1
Sales 1,086.2 138.0 948.2 690.0 552.0
Clean up/Others 165.0 165.0 - - -
Caye Caulker 1,037.9 975.5 62.4 2,023.8 1,651.8
Generation 408.6 408.6 - 1,170.0 936.0
Transmission and distribution 326.9 326.9 - 653.8 535.8
Sales 102.4 40.0 62.4 200.0 160.0
Clean up/Others 200.0 200.0 - - -
Belize City 382.1 349.8 32.2 - -
Generation 40.0 40.0 - - -
Transmission and distribution 99.9 99.9 - - -
Sales 192.2 160.0 32.2 - -
Clean up/Others 50.0 50.0 - - -
Source: ECLAC on the basis of information provided by BEL.a/ Energy sector includes only the electric sub-sector. Hydrocarbon sub-sector did not report damages.b/ Indirect cost includes only losses of profit from October to December 2000.c/ BEL has an Insurance policy only for the generation equipment.
ii) Oil, gas and gasoline supply. Belize has no oil refining capacity and all the refinedproducts are imported by ship or by truck. There seems to have been no disruption in this supplyin spite of the hurricane closing the ports and the roads being interrupted through flooding. The
21 BZ$1.08 million for San Pedro and BZ$0.12 million estimated for Caye Caulker. Thisamount claimable is under existing insurance, once generating expenses (estimated at BZ$0.20 million)are deducted.

59
storage capacity was not affected, and gas stations reported no damages or losses. The onlydamage reported is two storage tanks located at Caye Caulker power station; however thisdamage has been included in the total damages corresponding to that power station in theelectrical sector.
d) Water and sanitation
The Belize Water and Sewerage Authority (WASA) is responsible for all urban watersupplies in the country and for the only three sewerage systems in the country – in Belize City,Belmopan and San Pedro, Ambergris Caye. However, many rural communities independentlyoperate their own water system with technical support from WASA. 22
Most damage to drinking water and sewerage systems is in the localities worst affected bythe hurricane. One of the greatest challenges posed by the emergency was in reaching areas at theend of near-impassable roads. The short-term aims of the institutions involved were to re-establish damaged drinking water and sewerage systems, and to carry out health and educationactions to prevent and reduce the risk of epidemics in affected areas. In the medium term, actionsshould focus on the total reconstruction and upgrading the now damaged systems. The totalestimated cost of the damages on water and sewerage system is show in Table 39.
In Corozal Town the damages were concentrated on the overhead storage tank, pumpingstation and cover material for the main transmission lines. In San Pedro Town the damagesaffected the secondary distribution lines and sewer collection system. In Orange Walk Town, theintensive wind collapsed an overhead storage tank and flood affected the electrical system of thepumping station and main distribution lines.
In Belize City, damages were due to flood affecting the transmission lines and seweragesystem. Belmopan and other five cities and town reported small damages on the distribution linesas a consequence of flooding.
Before the hurricane passed, some attempt was made at prevention measures were taken.In Corozal Town and Orange Walk City, the storage tanks were filled in order to prevent somewater scarcity after the emergency. Unfortunately this measure was not successful because thewater weight and intensive winds caused such stress on the structures that they collapsed in bothtowns. In San Ignacio/Santa Elena a ground storage tank also failed due to ground saturation andground shifting causing by the rain. All of those three tanks had more than 20 years in operationand must now be replaced. The new tanks ought to be designed whit some improvement in orderto reduce vulnerability.
In San Pedro, local and national authorities decided to fill the water storage tank and tostop the energy supply before the hurricane passed in order to avoid major problems. After thehurricane passed, it was not possible to get energy from any source, nor the local power station,nor the submarine cable. Water was then brought from other sources while an accelerated processbegan to repair works to recovery the energy supply.
22 The Water and Sewerage Authority (WASA) is a state-owned enterprise.

60
The indirect cost due to income losses was estimated over the base of the number ofinhabitants living in the affected cities and towns, the time the water supply was interrupted, andthe percentage of the damaged systems. The indirect estimated cost does not include the costassociated to transportation, chemical treatment, emergency power supply, etc. The totalestimated indirect value is show in Table 40.
According with a WASA 23 report dated on October 2000, the company produced anestimated 2,284 million US gallons of water in 1999, of which 1,181 million US gallons wassold. This figure reflects a very high rate of losses on the mains and secondary distribution lines(as much as 48.3 per cent of the average water production), which could be associated to lack ofmaintenance, non-paying connections and the age of the utility’s network of supply. There are noreported additional losses after the hurricane, but if the losses are the same or higher, this figurereflect an already very difficult economical situation for the company.
It is worth noting that only three cities in the country have sewerage systems (Belize City,Belmopan and San Pedro). Lack of this basic service represent a potential health problem notonly for those that don’t have access to it but – in extreme circumstances like the one caused byKeith – will jeopardise the existing facilities capacity to cope and increase the vulnerability of thepopulation at risk. This is certainly an area where mitigation seems to have a high degree ofurgency for the inhabitants who have not this service.
Table 40
BELIZE: ASSESSMENT OF DAMAGES ON DRINKING WATER ANDSANITATION NETWORKS a/
City Total Direct Indirect b/ Reconstruction c/, d/ Foreign currency
Total 1,854.7 1,654.7 200.0 3,403.7 2,866.5
Belize 1,489.6 1,489.6 - - -Belmopan c/ 39.7 39.7 - 269.9 202.9
Orange Walk Town d/ 140.4 140.4 - 1,371.1 1,165.4
Corozal Town d/ 265.1 265.1 - 1,371.1 1,165.4
San Ignacio/Sta. Elena e/ 15.1 15.1 - 391.6 332.8
San Pedro 635.6 635.6 - - -Sales (global) f/ 200.0 200.0
Others f/ 51.3 51.3 - - -
Source: ECLAC on the basis of WASA’s data.a/ Only three cities have sewer collection systems.b/ Indirect cost associated to water transportation, increase of chemical treatment, emergency power supply, etc were
not provided.c/ Reconstruction include a new back up well, three genset and powerhouse for all of those three.d/ The new storage tanks include some improvement in order to reduce vulnerability.e/ Include only estimated loss of profit.f/ Others include some small cities with minor damages.
23 Water and Sewerage Authority (WASA). is the state owner company, which is in charge for
the water supply and sewerage systems to the whole country.

61
4. Effects on the environment
Besides destroying or harmfully affecting human life, as Keith influenced natural assets and theirproductivity. It will affect the ability to provide or sustain environmental services and,additionally, it will increase the costs of enjoyment of services.
There is little doubt that natural disasters and the environment are linked. Environmentaldegradation intensifies disasters, thereby increasing the potential for secondary disasters. Therecent ECLAC assessments 24 of the damages caused by Hurricane Mitch in Central Americaconclude that the already severe effects of the rains were aggravated by man’s previous actions,such as deforestation, inappropriate land use, and settlements on hillsides or on riverbanks andlakeshores. Similarly, most of the damage by Hurricane Lenny in Anguilla was aggravated by thelocation of tourism infrastructure within a high-risk zone adjacent to the shoreline.
Recognition of the causal links is an important step towards mitigation of the negativeconsequences of disasters, but needs to be followed by a more detailed understanding of theunderlying process and, eventually, a quantification of the impacts and an assessment of thesubsequent economic implications. In fact, failure to account for the impact of disasters onenvironmental systems may seriously undermine the reliability of ex ante cost-benefit tests, or thereliability of post-disaster damage estimates.
a) Belize environment
Within the Meso-American region, Belize displays one of the most significant habitatdiversity (see box 1), with such habitats ranging from coral reef, mangroves and coastal lagoonsto savannahs, rainforest and pine forests. 25 Belize’s coastal plains and marine zone (the area thatwas most impacted by Hurricane Keith) contain a wide diversity of ecosystems that are rich inplant and marine resources. This coastal area is a complex system comprising the 220-km barrierreef (one of the most significant ecosystems in the world, see box), three atolls, sea-grass beds,dense mangrove forest and numerous coral islands. Presently about 45.9 per cent of its territoryis set aside in protected areas for the preservation and protection of highly important natural andcultural features. Marine reserves represent about 150,000 hectares (6.9 per cent of marine area).
24 ECLAC (1999 and 2000).25 Central Statistics Office; Ministry of Finance, Belize (2000).
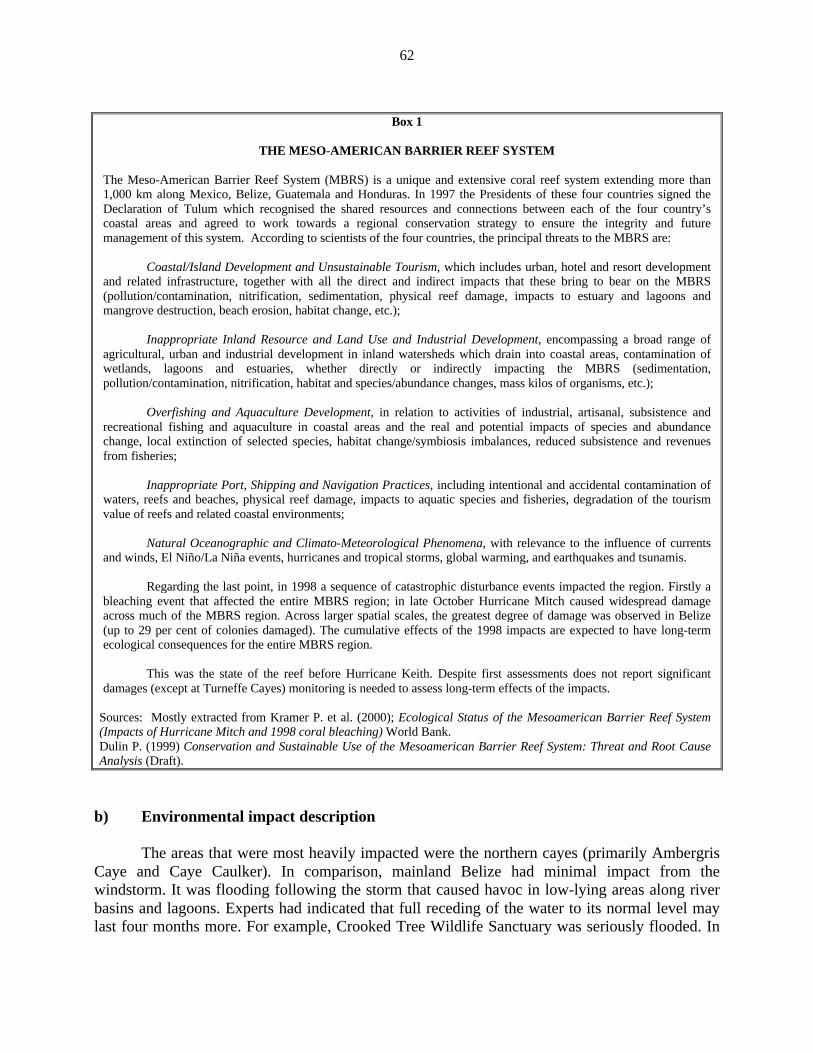
62
Box 1
THE MESO-AMERICAN BARRIER REEF SYSTEM
The Meso-American Barrier Reef System (MBRS) is a unique and extensive coral reef system extending more than1,000 km along Mexico, Belize, Guatemala and Honduras. In 1997 the Presidents of these four countries signed theDeclaration of Tulum which recognised the shared resources and connections between each of the four country’scoastal areas and agreed to work towards a regional conservation strategy to ensure the integrity and futuremanagement of this system. According to scientists of the four countries, the principal threats to the MBRS are:
Coastal/Island Development and Unsustainable Tourism, which includes urban, hotel and resort developmentand related infrastructure, together with all the direct and indirect impacts that these bring to bear on the MBRS(pollution/contamination, nitrification, sedimentation, physical reef damage, impacts to estuary and lagoons andmangrove destruction, beach erosion, habitat change, etc.);
Inappropriate Inland Resource and Land Use and Industrial Development, encompassing a broad range ofagricultural, urban and industrial development in inland watersheds which drain into coastal areas, contamination ofwetlands, lagoons and estuaries, whether directly or indirectly impacting the MBRS (sedimentation,pollution/contamination, nitrification, habitat and species/abundance changes, mass kilos of organisms, etc.);
Overfishing and Aquaculture Development, in relation to activities of industrial, artisanal, subsistence andrecreational fishing and aquaculture in coastal areas and the real and potential impacts of species and abundancechange, local extinction of selected species, habitat change/symbiosis imbalances, reduced subsistence and revenuesfrom fisheries;
Inappropriate Port, Shipping and Navigation Practices, including intentional and accidental contamination ofwaters, reefs and beaches, physical reef damage, impacts to aquatic species and fisheries, degradation of the tourismvalue of reefs and related coastal environments;
Natural Oceanographic and Climato-Meteorological Phenomena, with relevance to the influence of currentsand winds, El Niño/La Niña events, hurricanes and tropical storms, global warming, and earthquakes and tsunamis.
Regarding the last point, in 1998 a sequence of catastrophic disturbance events impacted the region. Firstly ableaching event that affected the entire MBRS region; in late October Hurricane Mitch caused widespread damageacross much of the MBRS region. Across larger spatial scales, the greatest degree of damage was observed in Belize(up to 29 per cent of colonies damaged). The cumulative effects of the 1998 impacts are expected to have long-termecological consequences for the entire MBRS region.
This was the state of the reef before Hurricane Keith. Despite first assessments does not report significantdamages (except at Turneffe Cayes) monitoring is needed to assess long-term effects of the impacts.
Sources: Mostly extracted from Kramer P. et al. (2000); Ecological Status of the Mesoamerican Barrier Reef System(Impacts of Hurricane Mitch and 1998 coral bleaching) World Bank.Dulin P. (1999) Conservation and Sustainable Use of the Mesoamerican Barrier Reef System: Threat and Root CauseAnalysis (Draft).
b) Environmental impact description
The areas that were most heavily impacted were the northern cayes (primarily AmbergrisCaye and Caye Caulker). In comparison, mainland Belize had minimal impact from thewindstorm. It was flooding following the storm that caused havoc in low-lying areas along riverbasins and lagoons. Experts had indicated that full receding of the water to its normal level maylast four months more. For example, Crooked Tree Wildlife Sanctuary was seriously flooded. In

63
certain sections it appeared that the Belize River and the Sibun River had joined and become onebody of water.
Graph 7 summarises the environmental impacts and the environmental goods and servicesinvolved.
The following description of the environmental impacts has been made mainly from theEnvironment Committee of the NEMO and from observations of the ECLAC team. It is apreliminary assessment that demands a more in depth assessment (especially in relation to coralreef damages).
Coastal erosion
§ Caye Chapel was severely impacted on its western coast as evidenced by the collapsing ofalmost its entire seawall. Specifically, the plastic sheet pile wall that has been used along theentire western length of this shoreline was destroyed. With this wall gone, the beach wasseverely eroded and the either carried offshore or up onto the golf course in the lee of theseawall. Observations made along this shoreline indicated that in some areas along thiswestern coast, the shore had been eroded approximately 10-15 metres landward of theseawall. A total length of affected shoreline is estimated to be 2,800 metres.
§ In Caye Caulker the greatest erosion occurred at the “Split”, which had almost doubled inwidth, and had been deepened. In particular, the water depth is reported to have increasedfrom 5 m to 8 m, while the width of this feature appeared to have been more than doubled.Inspection of aerial photographs taken both before and after hurricane Keith indicated thatthere was significant damage to the plastic sheet pile wall, which previously lined thesouthern bank of the “Split”. A total shoreline loss of more than 11,000 m2 has beenestimated.
§ At Ambergris Caye, shoreline erosion was limited to the south-eastern coastline, where watercame overland from the west, and eroded the shoreline over a distance of approximately 300-500 m. This occurred at an area where the lagoon came inland, the width of the Caye wasdiminished and the buffering effect of the mangroves was reduced. A total affected area ofapproximately 600-1000 m2 was estimated.
Damage to reef, mangrove and seagrass bed ecosystems
§ The entire waterbody within the Reef Lagoon from Robinson Point to North Ambergris Cayewas extremely turbid during and immediately following the hurricane. This turbidity wasobserved to extend beyond the Belize Barrier Reef (BBR), some 30 to 50 meters eastward.The impacts of this tremendous amount of silt on the sections of the BBR will need to beassessed in order to determine its immediate, medium and long-term impacts. 26 It is likelythat sections of the BBR may suffer long-term damage from the smothering effect of the siltplume. The Coastal Zone Management Authority and Institute carried out an assessment of
26 Diving operators observed mechanical damages in the coral reefs of Turneffe Cayes. Despitevisibility is not being at 100 per cent, damages in other areas were reported as not being significant.
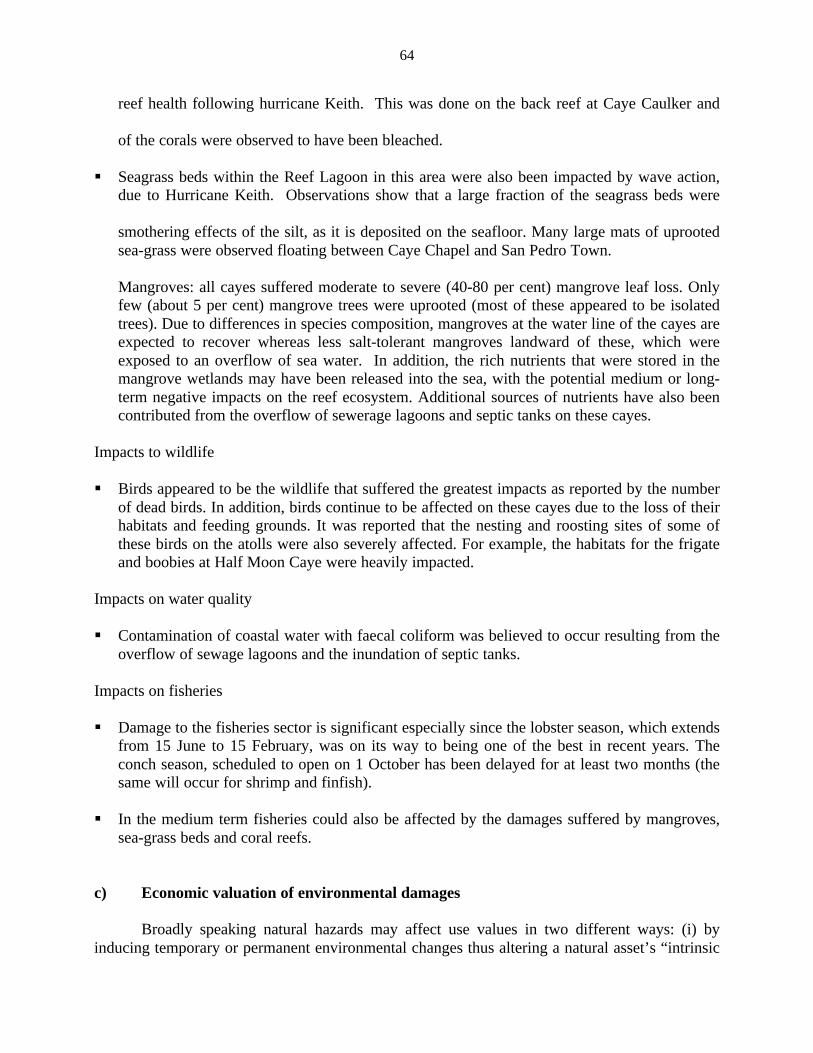
64
reef health following hurricane Keith. This was done on the back reef at Caye Caulker and
of the corals were observed to have been bleached.
§ Seagrass beds within the Reef Lagoon in this area were also been impacted by wave action,due to Hurricane Keith. Observations show that a large fraction of the seagrass beds were
smothering effects of the silt, as it is deposited on the seafloor. Many large mats of uprootedsea-grass were observed floating between Caye Chapel and San Pedro Town.
Mangroves: all cayes suffered moderate to severe (40-80 per cent) mangrove leaf loss. Onlyfew (about 5 per cent) mangrove trees were uprooted (most of these appeared to be isolatedtrees). Due to differences in species composition, mangroves at the water line of the cayes areexpected to recover whereas less salt-tolerant mangroves landward of these, which wereexposed to an overflow of sea water. In addition, the rich nutrients that were stored in themangrove wetlands may have been released into the sea, with the potential medium or long-term negative impacts on the reef ecosystem. Additional sources of nutrients have also beencontributed from the overflow of sewerage lagoons and septic tanks on these cayes.
Impacts to wildlife
§ Birds appeared to be the wildlife that suffered the greatest impacts as reported by the numberof dead birds. In addition, birds continue to be affected on these cayes due to the loss of theirhabitats and feeding grounds. It was reported that the nesting and roosting sites of some ofthese birds on the atolls were also severely affected. For example, the habitats for the frigateand boobies at Half Moon Caye were heavily impacted.
Impacts on water quality
§ Contamination of coastal water with faecal coliform was believed to occur resulting from theoverflow of sewage lagoons and the inundation of septic tanks.
Impacts on fisheries
§ Damage to the fisheries sector is significant especially since the lobster season, which extendsfrom 15 June to 15 February, was on its way to being one of the best in recent years. Theconch season, scheduled to open on 1 October has been delayed for at least two months (thesame will occur for shrimp and finfish).
§ In the medium term fisheries could also be affected by the damages suffered by mangroves,sea-grass beds and coral reefs.
c) Economic valuation of environmental damages
Broadly speaking natural hazards may affect use values in two different ways: (i) byinducing temporary or permanent environmental changes thus altering a natural asset’s “intrinsic

65
productivity”; (ii) by altering people’s ability to use the environment (the economic costs people
environmental changes include soil erosion, losses of natural habitats, forest fires, etc. Thesecond type of impacts arise from man-made capital’s partial or total disruption which may
water-distribution networks or water-treatment facilities would harmfully affect water resources’use values (loss of agricultural or industrial production; increased health risks; increased
ECLAC’s definition of direct damage the direct environmental damage
flows of capital. As a proxy of the welfare cost, the capital’s restoration costmeasure of damage, provided the analyst believes that the cost incurred in restoring the asset toits original state is not greater than the benefits the damaged/destroyed assets provide.
take into account the changes in the flows of marketable goods andservices attributable to the disruption of physical assets, which occur until the assets’
taken into account that (i) the restoration of a natural asset’s original productivity may betechnically unfeasible; (ii) many environmental goods and services are not exchanged in normal
phase may last longer than the average time required to restore man-made capital.
In the case of hurricane Keith, resulted in environmentalchanges (loss of birds’ habitats, beach erosion, changes in water quality, and damages to
recreation (tourism) and fisheries are impacted from (i) environmental changes described aboveand (ii) disruption of physical infrastructure such as buildings damages, boats and fishing gear,
indirect damages and most of them have been already
double counting only direct damages will be considered (see Table 41). 27
Valuation of the environmental services of coral reefs (Ruitenheek and Cartier, 1999)have been done for Montego Bay in Jamaica as a part of a World Bank project. Values range from
encompass recreation (linked to tourism), fisheries habitat, coastal protection, maintenance of biodiversityand source of sand for beaches and dunes. In the case of Belize Barrier Reef, a value of US$200,000 per
Caulker) and a plain area of 75 m (53 hectares). As several environmental services were alreadyconsidered (recreation, fisheries) in different sectors, a percentage of 20 per cent of the value has been

66

67
Table 41
ENVIRONMENTAL DAMAGE ASSESSMENT
Direct damages (Thousand BZ$)
Total 49,051
Property loss by beach erosion a/ Damage to mangroves b/
Beaches clean up (Caye Caulker and Ambergris Caye) Damages to infrastructure of Lamanai (archaeological site) d/
3,24040,000
1,060500
Source: ECLAC on the basis of different sources.a/ In San Pedro, 8 lots ( 2 2 Caye x differences in room rates.
provide a good buffer against storm wave action. An area of 5,000 acres is estimated to be sufferedCayes. Of them, a replanting programme for 500 acres at most vulnerable sites
US$80,000 per acre. Applying this factor and assuming that approximately 50 per cent of the
regeneration of mangroves on the acre to BZ$8,821. The first task is to assess natural recovery capacity of mangroves and compare it
studied, in considering financing requirements. As indicated above, restoration cost only can be used
its original state is not greater than the benefits the damaged/destroyed assets provide. Taking into
this project have not been made yet, this figure must be taken with care.Ruitenheek and
done for per hectare up to as much as US$500,000 per hectare. Environmental services considered
biodiversity and source of sand for beaches and dunes. In the case of Belize Barrier Reef, a value of
Ambergris Caye services were already considered (recreation, fisheries) in different sectors, a percentage of 20 per
biodiversity maintenance and
d/ Preliminary estimation.
d) Tourism and environment
Environmental damage assessment highlights the linkages between tourism and theenvironment. Most of the environmental services lost by Hurricane Keith are related to recreationand tourism. Belize is a country that is well positioned in the market of tourism based on naturalresources endowment. As a first condition in order for Belize to continue attracting tourist,environment must be preserved. In addition, environmental reputation and environmentalperformance of the country are of growing importance to increase competitiveness.
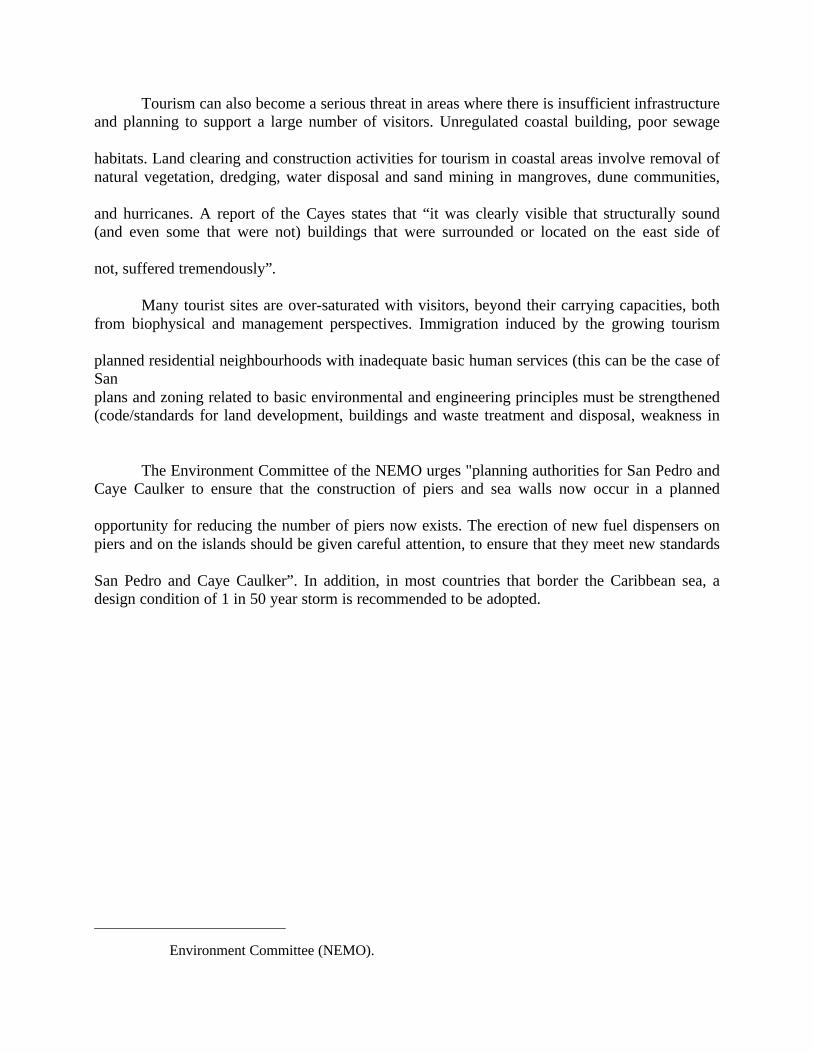
Tourism can also become a serious threat in areas where there is insufficient infrastructureand planning to support a large number of visitors. Unregulated coastal building, poor sewage
habitats. Land clearing and construction activities for tourism in coastal areas involve removal ofnatural vegetation, dredging, water disposal and sand mining in mangroves, dune communities,
and hurricanes. A report of the Cayes states that “it was clearly visible that structurally sound(and even some that were not) buildings that were surrounded or located on the east side of
not, suffered tremendously”.
Many tourist sites are over-saturated with visitors, beyond their carrying capacities, bothfrom biophysical and management perspectives. Immigration induced by the growing tourism
planned residential neighbourhoods with inadequate basic human services (this can be the case ofSan plans and zoning related to basic environmental and engineering principles must be strengthened(code/standards for land development, buildings and waste treatment and disposal, weakness in
The Environment Committee of the NEMO urges "planning authorities for San Pedro andCaye Caulker to ensure that the construction of piers and sea walls now occur in a planned
opportunity for reducing the number of piers now exists. The erection of new fuel dispensers onpiers and on the islands should be given careful attention, to ensure that they meet new standards
San Pedro and Caye Caulker”. In addition, in most countries that border the Caribbean sea, adesign condition of 1 in 50 year storm is recommended to be adopted.
Environment Committee (NEMO).

69
Graph 8
ENVIRONMENTAL DAMAGE ECONOMIC ASSESSMENT SCHEME
HURRICANE KEITH
ENVIRONMENTAL CHANGESIMPACTS UPON PHYSICALINFRASTRUCTURE
Damage totouristinfrastructure- Buildings- Piers- Boats- Protection
Loss ofboats andfishing gear
Overflow ofsewerlagoons andinundation ofseptic tanks
HEALTH EFFECTS
DAMAGES TOFISHING SECTOR
DAMAGES TOTOURISM BUSINESS
INDIRECT DAMAGEValuation of environmentalservices lost included in thedamage assessment of:§ Tourism sector§ Fisheries§ Water sanitation
Loss of water quality
Birds habitat destruction
Damages to seagrass beds
Damages to mangroves
Beach erosion
DAMAGES§ Mangroves§ Beach clean-up§ Beach erosion§ Coral reef
NO ESTIMATION OFDIRECT DAMAGES

70
Besides improvement of regulations and enforcement there is also scope for the initiativesof the private sector and civil society leading a more sustainable tourism. These include, forexample, promotion of best practices and ISO 14000 standards and involvement of localcommunities in tourist activities.
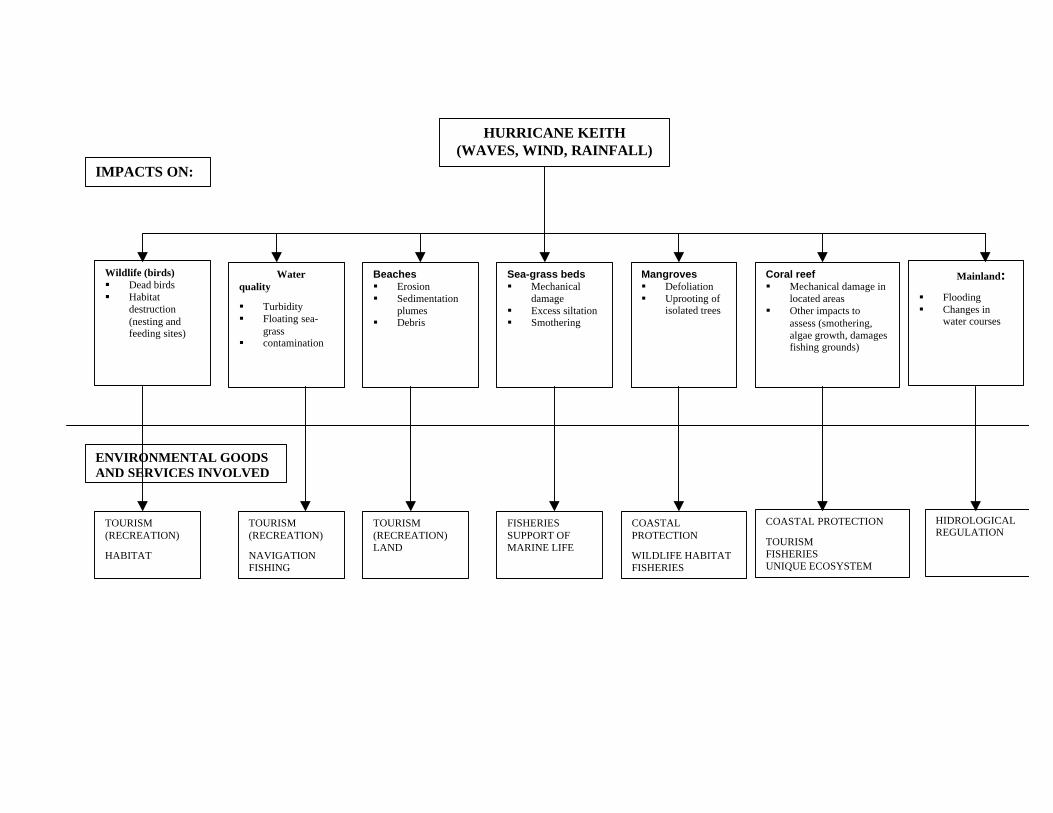
HURRICANE KEITH(WAVES, WIND, RAINFALL)
Wildlife (birds)§ Dead birds§ Habitat
destruction(nesting andfeeding sites)
Waterquality
§ Turbidity§ Floating sea-
grass§ contamination
Beaches§ Erosion§ Sedimentation
plumes§ Debris
Sea-grass beds§ Mechanical
damage§ Excess siltation§ Smothering
Mangroves§ Defoliation§ Uprooting of
isolated trees
Coral reef§ Mechanical damage in
located areas§ Other impacts to
assess (smothering,algae growth, damagesfishing grounds)
Mainland:§ Flooding§ Changes in
water courses
IMPACTS ON:
TOURISM(RECREATION)
HABITAT
TOURISM(RECREATION)
NAVIGATIONFISHING
TOURISM(RECREATION)LAND
FISHERIESSUPPORT OFMARINE LIFE
COASTALPROTECTION
WILDLIFE HABITATFISHERIES
COASTAL PROTECTION
TOURISMFISHERIESUNIQUE ECOSYSTEM
HIDROLOGICALREGULATION
ENVIRONMENTAL GOODSAND SERVICES INVOLVED
71
III. MACROECONOMIC EFFECTS
1. Summary of damage
The totals of direct and indirect damage assessments of the several sectors are presented inTable 42. Total damage is estimated at BZ$560.1 million (US$280 million), of which directdamage, estimated at BZ$423.3 million (US$211.6 million) constitutes about 75 per cent. Directdamages were valued at present value or replacement cost at current prices — whichever seemedmore appropriate for the specific sector. Indirect damages of BZ$136.8 million (US$68.4million) were yielded on the basis of flows affected as the direct consequence of the disaster.Since some assumptions were necessary for these costs, the computed figure in some cases mayunderestimate the medium or long term impact in the Belizean economy.
The summary data on direct and indirect damage indicates that the most affected sectorsare the productive ones: tourism and agriculture represent over 47 per cent of the direct damagemeasured. Total damage to the economic sectors is estimated to be BZ$330.6 million, some59 per cent of total damage estimated. Losses of infrastructure account for about 16 per cent oftotal damage. Their repair or replacement must be a priority as they perform a generator functionto economic and social activity nation-wide.
Damage to the social sectors is almost as large as the damage to infrastructure and,considering that there tends to be some underestimate of the social effects, Keith had strongernegative consequences on societal variables than on physical ones. The most important socialdamage occurred in housing (over 12 per cent of total direct and indirect damages). Thus theurgency to face the challenge not only of replacing lost housing and other social infrastructure butto do so with new, more resilient criteria and giving full attention to risk reduction since — asKeith made apparent — Belizean society has a high level of exposed vulnerability.
It is clear that damage to housing, infrastructure and tourism must be repaired withurgency. A seriatim approach to repairs will not produce a satisfactory solution. Governmentshould facilitate a broad front approach to rectifying damage in these areas in order to rehabilitatehouseholds (people), the tourism industry and the agricultural and agroindustrial activities, tokeep economic activity alive. At the same time economic activity will generate income and leadto a recovery in the economy. Damage to the airport and harbour was relatively low.
In the table that follows a number of ratios are presented to complete the appreciation ofthe damage. The ratios compare damage with GDP, exports, imports, gross capital formation,domestic savings and consumption:
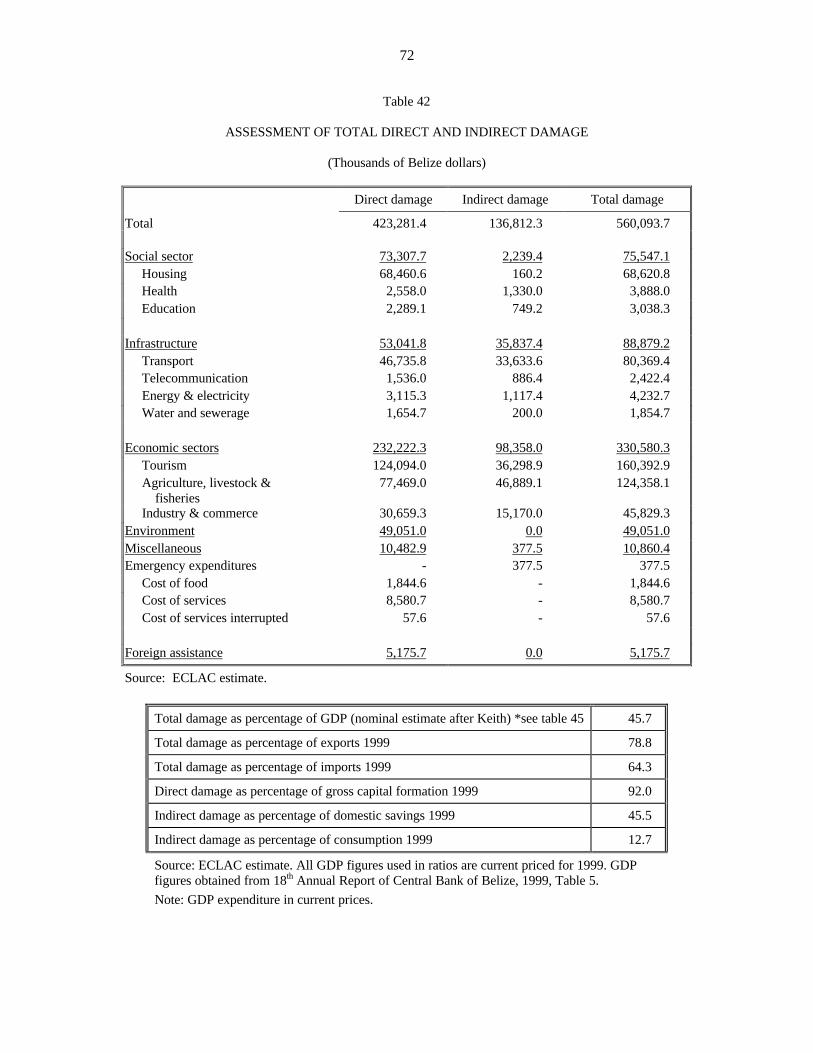
72
Table 42
ASSESSMENT OF TOTAL DIRECT AND INDIRECT DAMAGE
(Thousands of Belize dollars)
Direct damage Indirect damage Total damage
Total 423,281.4 136,812.3 560,093.7
Social sector 73,307.7 2,239.4 75,547.1 Housing 68,460.6 160.2 68,620.8 Health 2,558.0 1,330.0 3,888.0 Education 2,289.1 749.2 3,038.3
Infrastructure 53,041.8 35,837.4 88,879.2 Transport 46,735.8 33,633.6 80,369.4 Telecommunication 1,536.0 886.4 2,422.4 Energy & electricity 3,115.3 1,117.4 4,232.7 Water and sewerage 1,654.7 200.0 1,854.7
Economic sectors 232,222.3 98,358.0 330,580.3 Tourism 124,094.0 36,298.9 160,392.9 Agriculture, livestock & fisheries
77,469.0 46,889.1 124,358.1
Industry & commerce 30,659.3 15,170.0 45,829.3Environment 49,051.0 0.0 49,051.0Miscellaneous 10,482.9 377.5 10,860.4Emergency expenditures - 377.5 377.5 Cost of food 1,844.6 - 1,844.6 Cost of services 8,580.7 - 8,580.7 Cost of services interrupted 57.6 - 57.6
Foreign assistance 5,175.7 0.0 5,175.7
Source: ECLAC estimate.
Total damage as percentage of GDP (nominal estimate after Keith) *see table 45 45.7
Total damage as percentage of exports 1999 78.8
Total damage as percentage of imports 1999 64.3
Direct damage as percentage of gross capital formation 1999 92.0
Indirect damage as percentage of domestic savings 1999 45.5
Indirect damage as percentage of consumption 1999 12.7
Source: ECLAC estimate. All GDP figures used in ratios are current priced for 1999. GDPfigures obtained from 18th Annual Report of Central Bank of Belize, 1999, Table 5.
Note: GDP expenditure in current prices.

73
The measure of Keith’s effect in Belize may be very well be highlighted by pointing thatdirect damages (losses or damage to infrastructure) are equivalent to almost 93 per cent of thecountry’s gross capital formation in 1999. Seen from another angle, Keith’s indirect damage(negative impact on economic flows) is anticipated to be almost 46 per cent of the 1999 savingsof Belizeans. Additionally, these reduced flows are equivalent to more than 12 per cent of 1999’sdomestic consumption).
2. The pre-disaster situation
a) Overview 29
The Belizean economy was facing a second year of rapid growth for 2000, after itsrecuperation of 1999. During the second quarter of 2000, total exports were estimated atBZ$116.5 million — a 27 per cent increase over the total of the corresponding quarter of 1999.Contributing to this performance were bananas and citrus juices. Gross imports increased by18.2 per cent to a figure of BZ$223.6 million over the same comparison period as purchases fromabroad of chemicals, manufactured goods and capital equipment impacted the import bill.Although no change in the Consumer Price Index was recorded during the second quarter, theannualized rate of inflation was 0.9 percent, reflecting the opposing effects of rising fuel andgeneral import prices and the reduction of import duties to 20 per cent on more than one thousanditems.
Arrivals of stay-over tourists increased by 19.6 per cent in the second quarter to 47,233 aslarge numbers of arrivals from North America indicated success in the country’s marketingthrust. At the end of the first ten months of 2000, tourist arrivals had increased by 20 per centover those of the corresponding period in 1999.
The net foreign assets of the banking system grew by BZ$39.4 million as the net foreignassets of the commercial banks increased by BZ$40.4 million while those of the Central Bankcontracted by BZ$1 million. Net domestic credit contracted by BZ$24.3 million as net credit toCentral Government decreased by BZ$32.2 million, while credit to the private sector increasedby BZ$7.9 million. Central Government’s domestic debt rose by BZ$2.1 million to BZ$160.7million. An expansion of BZ$2.6 million in its overdraft facility with the Central Bankoutweighed amortization payments of BZ$0.5 million. The public sector external debt increasedby $89 million as disbursements of BZ$101.6 million outweighed amortization payments ofBZ$11.2 million. The broad money supply (M2) increased by BZ$41.3 million to BZ$907.4million with M1 and M3 growing by BZ$9.8 million and BZ$31.5 million, respectively. Table 43shows the evolution of Belize main economic indicators.
29 The present description of main aspects of the Belizean economy was prepared from the
second quarter analysis of the Central Bank of Belize with updates so far as the information availableoutside of published tables could allow. The projections that are addressed later in the chapter have madeuse of assumptions that are stated.

74
Government policy continued to be focused on poverty reduction. Social issues such as thefollowing received attention:
§ Life expectancy at birth§ Literary rate§ Primary and secondary school enrollment§ Access to safe water§ Immunization rates.
Table 43
MAIN INDICATORS OF PERFORMANCE
(Millions of Belize dollars)
Item 1997 19981999
Provisional Jan-Jun 1999Jan-Jun
2000
International trade Domestic exports 317.9 310.5 337.0 183.2 240.3 Re-exports 34.8 31.6 32.6 22.1 13.5 Total exports 352.7 342.1 369.6 205.3 253.8 Gross imports 572.4 590.3 734.7 367.7 462.8 Trade balance -219.7 -248.3 -365.1 -162.4 -209.0Main domestic exports Sugar 91.9 89.0 82.0 57.5 60.2 Bananas 52.2 49.4 54.5 20.4 28.7 Citrus 48.1 43.1 54.9 56.6 101.1Deliveries of sugar cane(long tons)
… … … 1,059,434a/
1,095,308a/
Sugar processed (long tons) … … … 107398 a/ 119590 a/Cane/sugar ratio … … … 9.81 a/ 9.13 a/Marine products (exports) 35.6 43.5 55.6 11.6 12.3 Lobster tails 14.9 14.8 16.4 4.1 5.7 Shrimp 15.4 24.5 36.1 6.0 4.4 Conch 3.7 3.4 2.6 1.3 1.6
Source: Central Statistical Office & Central Bank Statistical Digest 1999.• Dec-June 1998/1999 and 1999/2000.
Gross Domestic Product. Although no quarterly estimates of GDP are yet compiled by theStatistical Office or the Central Bank, indicators available suggest that the economy performedwell along the projected path up to the time of the hurricane and in some sectors surpassed theexpectations for 2000. An estimate puts the GDP at current factor cost to year-end 2000 atBZ$1,231,000, reflecting a 6.6 per cent increase over 1999.
Production. The pre-Keith panorama for the main products of the economy was mixed. Detailsfor particular activities are as follows:
Sugar and Molasses. Heavy rains and high mud content in the sugar cane resulted in deliveriesto a total of 448,393 tonnes in the second quarter of 2000, some 7.6 per cent below the deliveries

75
in the corresponding period a year earlier. In contrast, sugar production decreased less steeply by2.9 per cent to 49,479 tonnes because of improvements in the quality of the cane and in factoryefficiency. A lower volume of molasses produced reflected improved factory efficiency as moresugar was extracted from the canes, leaving a lower molasses residual production. Sugar revenuesincreased in the first half of the year and were expected to continue to increase up to the time ofthe hurricane. Indeed, revenues increased by 31.2 per cent in the period January to June 2000 toBZ$240.3 million over the BZ$183.2 million recorded over the corresponding period in 1999.
Citrus products. Citrus deliveries during the second quarter of 2000 increased by 72.6 per centover the deliveries of the corresponding period in 1999 as young groves came into fullproduction. Sales of citrus juices for export increased by 77.7 per cent in volume and by morethan 100 per cent in value when compared with the second quarter of 1999. Sales of orangeconcentrate more than doubled to 1.1 million gallons (4.2 million litres) with a value ofBZ$17 million, most of which was sold in the United States where prices were more favourable.
Marine Products. During the second quarter of 2000, sales of marine products stood at 700thousand pounds and carried a value of BZ$5.1 million. This represented increases of 73.1 percent and 17.7 per cent in volume and value, respectively when compared with sales in the secondquarter of 1999. Lobster exports increased by 10 per cent while conch exports grew by 86.3 percent in volume and an 86.5 per cent in value. Farmed shrimp exports contracted by 9.3 per cent involume and 8.8 per cent in value as one of the farms was taken out of production.
Bananas. Production of bananas was boosted as total acreage under the fruit was expanded by300 acres. A new marketing agreement has a price mechanism that encourages the shipment ofthe majority of bananas during the February to September period as a higher price is beingoffered during this period. The volume and value of bananas exported increased by 40 per cent inthe first half of 2000.
Tourism. In the first half of 2000, stay-over tourist arrivals increased by 14.8 per cent to 102,927when compared with arrivals in the corresponding period in 1999. Air arrivals increased by over25 per cent from the half-year figure of 1999. Cruise ship arrivals increased from 18,245 in thefirst half of 1999 to 47,765 over a similar period in 2000. The economy was set for an increase of6 to 7 per cent in 2000 from tourism. Indications are that the tourism industry may end the yearwith a 4 per cent increase in value added.
Money supply. As at June 2000, the money supply (M2) stood at BZ$907.4 million, reflectingan increase of 4.8 per cent in the second quarter and an increase of 8 per cent over the six-monthperiod, driven substantial inflows derived from foreign loans. The narrow money supply to Junestood at BZ$280.9 million. Quasi-money grew by 7.1 per cent with savings and time depositsincreasing by 17.9 per cent and 3.3 per cent, respectively.
International Trade and Payments. The trade deficit increased by BZ$9.6 million in the secondquarter of 2000 over the deficit figure of BZ$97.5 million observed in the corresponding quarter of1999 as the import bill continued to exceed the value of exports. Imports of materials primarily forconstruction projects accounted for a large part of the increase in imports. By mid-year 2000, thetrade deficit stood at BZ$209 million, up from a deficit figure of BZ$164.4 million at half year 1999.

76
The value of domestic exports increased in the second quarter as banana exports increased invalue by 50.4 per cent, attributable to a higher export volume. Sugar revenues increased as a largerproportion of sales went to the EU market. In the first half of 2000, the price of imported fuel morethan doubled as the price of crude oil rose from between US$10 and US$14 per barrel in 1999 to overUS$28 per barrel in 2000.
Table 44
FACTORS RESPONSIBLE FOR MONEY SUPPLY MOVEMENTS
(Millions of Belize dollars)
Changes duringPosition as at
June 2000Mar 2000 –
Jun 2000Mar 1999 –
Jun 1999Dec 1999 –Jun 2000
Net foreign assets 276.7 39.4 38.5 91.7 Central Bank 191.4 -1.0 44.9 51.2 Commercial banks 85.3 40.4 -6.4 40.5
Net domestic credit 804.8 -24.3 1.1 30.4 Central Government (net) 85.6 -32.2 -0.7 -31.9 Other public sector 57.2 0.0 -9.7 49.7 Private sector 662.0 7.9 11.5 12.6
Central bank foreign liabilities (long-term)
91.0 19.4 -0.6 66.4
Other items (net) 83.1 -45.6 31.4 -11.5
Money supply (M2) 907.4 41.3 8.8 67.2
Money supply (M1) 280.9 9.8 10.7 25.8 Currency with the public 86.8 2.3 -1.1 2.6 Demand deposits 194.1 7.5 11.8 23.2
Quasi-money 626.5 31.5 -1.9 41.4 Savings deposits 177.9 16.2 -0.3 27.0 Time deposits * 448.6 15.3 -1.6 14.4
* Includes Non-Residents’ Foreign Currency Time Deposits of BZ$34.6 million.
3. Economic forecast and outturn during 2000
The Belizean economy will suffer as a consequence of the passage of Keith. Its dynamism will bereduced more severely in 2001 than in the remainder of 2000 and it is expected that by 2002 itcould regain its pre-disaster fast pace of growth. Its impact in 2000, though, is not negligiblesince it will reduce the estimated rate of growth by one percentage point (from a forecasted 6.9 toonly 5.9 (at current prices, see table 45).

77
Table 45
GROSS DOMESTIC PRODUCT, BY INDUSTRIAL ORIGIN, AT FACTOR COST
(Current prices) (Thousands of Belize dollars)
1998 19992000
(Pre Keith) a/
2000(Post Keith)
a/ 2001 a/ 2002 a/
GDP (nominal) 1,051,233 1,154,889 1,234,801 1,223,262 1,289,814 1,400,543
I. Primary activities 207,041 224,688 251,965 233,774 240,341 269,713 1.1 Agriculture 150,024 155,090 168,651 156,300 154,210 170,028 Sugarcane 33,138 33,224 32,848 31,300 26,000 27,100 Citrus 15,996 16,660 19,326 20,000 22,800 25,992 Banana 32,776 34,828 40,053 38,000 43,700 50,255 Other cops 45,420 47,274 52,946 49,000 45,000 49,500 Livestock 22,694 23,104 23,478 18,000 16,710 17,181 1.2 Forestry & logging 17,010 20,329 21,167 20,000 20,986 22,583 1.3 Fishing 33,801 42,062 54,681 50,474 58,046 69,655 1.4 Mining 6,206 7,207 7,466 7,000 7,100 7,448
II. Secondary activities 235,316 253,110 271,088 277,148 299,676 329,738 2.1 Manufacturing 139,827 148,603 151,016 155,200 154,100 160,218 Sugar 27,155 26,286 25,421 24,200 19,500 21,000 Citrus 9,431 12,543 14,174 20,000 22,600 25,538 Other manufacturing 103,241 109,774 111,421 111,000 112,000 113,680 2.2 Electricity & water 35,894 31,391 32,333 29,821 30,418 31,330 2.3 Construction 59,595 73,116 87,739 92,126 115,158 138,189
III. Service 653,117 722,562 758,489 759,080 797,581 850,121 3.1 Trade, rests., hotels 199,103 243,475 258,084 256,866 272,278 299,506 3.2 Transport & communications 109,388 121,942 125,600 125,112 128,866 135,309 3.3 Finance & insurance 73,170 76,095 81,802 81,802 87,937 94,533 3.4 Real estate & bus service 69,787 73,276 78,772 78,772 84,680 91,031 3.5 Public administration 133,608 136,758 141,178 142,174 147,268 150,128 3.6 Communications & other services 68,061 71,016 73,053 74,354 76,553 79,614
IV. Imputed bank service 44,240 45,471 46,741 46,740 47,784 49,028 charges [deduct] Per capita GDP ($) 4,417 4,753 4,881 4,835 4,951 5,216 Annual per cent change in GDP 1.1 9.9 6.9 5.9 5.4 8.6
Source: ECLAC, on the basis of data from the Central Bank of Belize.a/ Estimates for 2000 and projections for 2001 and 2002 were made available by the Central Bank.
One relevant observation is that the production and other indicators used, linked to therelationships established between sectoral performances have indicated a performance beyondwhat had been projected for 2000 in some instances. It has further been observed that the large

78
establishments that suffered significant physical damage and loss of business were insured. Some60 percent of claims have or are being settled before the end of the year. The inflow of thosefunds will have effects on the balance of payments. Specific sector impacts are seen to be thefollowing:
§ The agricultural sector would suffer moderately in terms of loss of foreign exchange. Moreloss would have been sustained in subsistence agriculture. Overall, value added in theagricultural sector would fall short of the projected figure for 2000 by 7.7 per cent. Theshortfall in the primary sector is expected to be of the order of 7.9 per cent below theprojection for 2000.
§ Loss of income in electricity and water might well be outweighed by value added outturns inexcess of the 2000 projections as sugar and citrus manufacturing performed better thanexpected in 2000.
§ The manufacturing sector which includes the processing of sugar and the extraction of citrusconcentrate, is estimated to have performed some 4.7 per cent above the projected figure for2000. The mission estimates that there was a 1.1 per cent improvement in the secondaryactivities categorisation over the projected figure for 2000.
The revised estimate based on the revised figures supplied by the Central Bank of Belize wasa GDP figure of BZ$1,223.3 million. Table 46 shows its evolution in constant (2000) prices. Asindicated, the annual growth rates in both current and constant prices shows a decline in rate ofgrowth of GDP in 2000, followed by further decline in 2001, with a resumption of an increasedrate of growth in 2002.
Table 47 and Graph 7 summarize the GDP evolution, estimates and forecasts for the1998-2002 period — in US dollar terms — as a means of illustrating the economic growth gapthat was caused by Hurricane Keith.

79
Table 46
GROSS DOMESTIC PRODUCT, BY INDUSTRIAL ORIGIN, AT FACTOR COST
(Constant 2000 prices) (Thousands of Belize dollars)
1998 19992000 (PreKeith) a/
2000 (PostKeith) a/ 2001 a/ 2002 a/
GDP (real) 1,097,612 1,165,242 1,234,801 1,223,262 1,253,490 1,336,331
I. Primary activities 202,451 225,752 251,965 233,774 234,604 259,568 1.1 Agriculture 146,920 157,819 168,651 156,300 148,628 159,537 Sugarcane 32,805 33,671 32,848 31,300 25,156 25,630 Citrus 15,016 17,163 19,326 20,000 21,716 23,837 Banana 32,531 34,947 40,053 38,000 42,698 48,462 Other Crops 45,695 47,788 52,946 49,000 43,648 47,045 Livestock 21,379 23,366 23,478 18,000 16,201 16,315 1.2 Forestry & logging 22,035 20,520 21,167 20,000 20,384 21,524 1.3 Fishing 32,056 42,744 54,681 50,474 56,013 65,534 1.4 Mining 6,830 7,289 7,466 7,000 6,884 7,072
II. Secondary activities 249,301 255,929 271,088 277,148 290,642 313,365 2.1 Manufacturing 143,484 150,502 151,016 155,200 149,196 151,723 Sugar … … 25,421 … … … Citrus … … 14,174 … … … Other manufacturing … … 111,421 … … … 2.2 Electricity & water 43,322 31,594 32,333 29,821 29,631 30,031 2.3 Construction 62,495 73,832 87,739 92,126 111,815 131,611
III. Service 699,886 729,434 758,489 759,080 774,685 810,179 3.1 Trade, rests., hotels 234,801 245,745 258,084 256,866 264,496 285,509 3.2 Transport & communications 114,843 123,704 125,600 125,112 124,565 127,730 3.3 Finance & insurance 73,208 76,679 81,802 81,802 85,562 90,403 3.4 Real estate & bus service 70,370 73,888 78,772 78,772 82,337 86,939 3.5 Public administration 136,716 137,579 141,178 142,174 143,524 144,037 3.6 Communications & other services 69,948 71,840 73,053 74,354 74,200 75,561
IV. Imputed bank service 43,796 45,873 46,741 46,740 46,441 46,780 Charges [deduct] Per capita GDP ($) 4,612 4,795 4,881 4,835 4,812 4,977 Annual per cent growth in GDP 1.5 6.2 6.0 5.0 2.5 6.6 Implicit deflactor 95.8 99.1 100 100 102.9 104.8
Source: ECLAC, on the basis of data from the Central Bank of Belize.a/ Estimates for 2000 and projections for 2001 and 2002 were made available by the Central Bank.
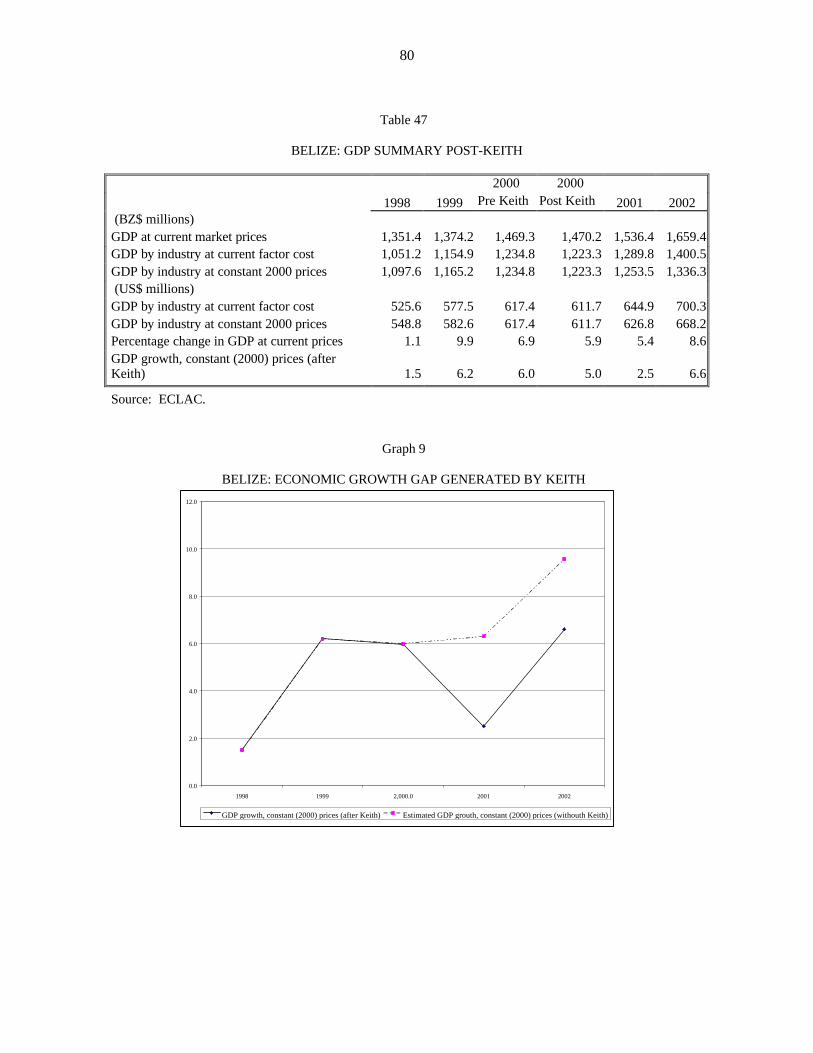
80
Table 47
BELIZE: GDP SUMMARY POST-KEITH
2000 2000
1998 1999 Pre Keith Post Keith 2001 2002 (BZ$ millions)GDP at current market prices 1,351.4 1,374.2 1,469.3 1,470.2 1,536.4 1,659.4GDP by industry at current factor cost 1,051.2 1,154.9 1,234.8 1,223.3 1,289.8 1,400.5GDP by industry at constant 2000 prices 1,097.6 1,165.2 1,234.8 1,223.3 1,253.5 1,336.3 (US$ millions)GDP by industry at current factor cost 525.6 577.5 617.4 611.7 644.9 700.3GDP by industry at constant 2000 prices 548.8 582.6 617.4 611.7 626.8 668.2Percentage change in GDP at current prices 1.1 9.9 6.9 5.9 5.4 8.6GDP growth, constant (2000) prices (afterKeith) 1.5 6.2 6.0 5.0 2.5 6.6
Source: ECLAC.
Graph 9
BELIZE: ECONOMIC GROWTH GAP GENERATED BY KEITH
0.0
2.0
4.0
6.0
8.0
10.0
12.0
1998 1999 2,000.0 2001 2002
GDP growth, constant (2000) prices (after Keith) Estimated GDP grouth, constant (2000) prices (withouth Keith)

81
4. Fiscal policy and the central government's finances 30
For fiscal year 1999-2000, the Central Government had budgeted a fiscal deficit of approximately1.3 per cent of GDP. This reflected a conscious attempt to manage the fiscal deficit, through allof the main determinants of the fiscal balance, namely the tax regime that had been recentlymodified and through restraint in current expenditure through the introduction of public sectorreforms. The divestment policy of government was expected to result in capital revenues thatwould help reduce the overall deficit. The recurrent surplus was expected to decline from 0.4percent of GDP to 0.2 per cent, while the operating balance was programmed to swing from adeficit of 1.8 per cent of GDP to a surplus of 0.9 per cent.
At the end of June 2000, the fiscal account appeared headed for a better performance thanpreviously budgeted. The fiscal deficit appeared to suggest an end of year position of 0.6 per centof GDP, but that was before the hurricane. The tax revenue had performed weaker than had beenexpected and led to a decline. The estimate of tax revenue is estimated to have dropped from 21per cent of GDP to 19.2 per cent of GDP. Tax revenues will decline in response to a temporaryslowing down in tourist arrivals as reconstruction takes place in tourist areas.
The Government of Belize has switched its debt management strategy to a search forforeign concessional financing amounting to 3 per cent of GDP, and 0.8 per cent of GDP fromforeign commercial sources.
Re-estimation of the fiscal deficit is being done at the time of writing. Latest preliminarycalculations show that fiscal revenues have increased substantially through the modality ofdivestment. Indications are that the fiscal deficit, which in November 2000 stands at 3 per cent ofGDP, will by the end of the first quarter of 2001 be slightly positive.
5. Effects on population’s income
Hurricane Keith’s devastation of the remote and rural areas was perhaps in relative terms moretragic than the damage done to the tourism plant and basic services which could be measured interms of dollars and which for the most part was insured. Most of the flooding associated with thehurricane occurred in districts such as Orange Walk and Cayo, two of the poorest areas. Theobservation was made that there is a significant percentage of female-headed households (25 percent to 38.5 per cent) in these areas. The conditions of high female unemployment, a high female-headed household ratio to total households in those districts and a high fertility rate, especiallyamong the female population under the age of 25 years, make for the perpetuation of the viciouscircle of poverty and misery. The teenage pregnancy rate in San Pedro is above the nationalaverage. There may be a strong correlation between poverty of the type that exists in some areasand the prevalence of communicable diseases.
The main concern of Government on the economic plane is the alleviation of poverty.Data coming out of the Caribbean Development Bank, ECLAC and OAS indicate that about 33
30 This section draws heavily from an IDB document entitled BELIZE, Assessment on the
sustainability of the Fiscal and External Accounts, written by Jaime Jaramillo-Vallejo. December 1999.
82
per cent of Belize’s population has an annual income of less than US$645 and thus lives belowthe poverty line. In rural areas, the figure has been estimated to be as high as 42.5 per cent of thepopulation. Given the constant influx of refugees from neighbouring countries, there results anirresistible tendency towards an increase in the numbers of people below the poverty line. Theincidence of poverty in rural and remote districts and among vulnerable groups is also reinforced.A quick estimate indicates that the average income lost among the affected population in theseareas was of the order of BZ$458 per person.
The hurricane has no doubt set back the government’s poverty alleviation strategy thathad set a target on containment of the Central Government deficit to no more than 2 per cent ofGDP. With the new estimate indicating a fiscal deficit of 3 per cent of GDP, the target of povertyalleviation may have moved somewhat, delaying its achievement. Any alternative strategy thatkeeps the attainment of the poverty alleviation date fixed at the previously targeted date willplace the foreign exchange parity at risk.
6. External sector and prices
Hurricane Keith has impacted macroeconomic performance in a number of ways. There has beena fall-off in economic activity as attested to by the loss of property, hours of work, the loss ofbusiness and the loss of crops. These have impacted negatively on livelihoods, although theimpact has not had an even incidence over the population. As an example, the subsistencefarmers in the Orange Walk district and the lobster fishermen operating on Ambergris Caye who,because of the loss of their crops and fishing gear, respectively, are unable to feed their families,merit some consideration for relief. Export earnings from fishing are expected to decline in 2001.Exports and export earnings are estimated to have fallen as much damage was sustained in thetourism areas and in areas that cultivate export crops. Whereas there are no firm figures toquantify the extent of the phenomenon, indications are that the poorer households have beenmore adversely affected in terms of damage and displacement than other income groups in thepopulation.
The loss of crops due to flooding has impacted negatively the supply of food to thedomestic economy. A temporary increase in prices is expected to ensue, as the marketmechanism will determine the distribution of the food. In addition, shortfalls in domestic supplywill have to be imported, putting some pressure on the current account of the balance ofpayments.
The damage caused by the hurricane will have implications on the import bill. To theextent that direct damage will have to be repaired by reconstruction of houses and physical plantfor which there is a high import content of materials, possibly of the order of 70 to 85 per cent oftotal cost of materials. To the extent that the damaged properties were insured, the settlement ofinsurance claims will result in capital inflows – a positive aspect of the country’s balance ofpayments. Further, the reconstruction effort will result in increased activity in construction,which, in turn will create conditions for increased demand. The upsurge in construction activitymay, however, require the importation of labour from adjacent countries.
83
The loss of tourist visitors, when combined with the estimates of direct and indirectdamages to the sector will impact the balance of payments in the final three months of 2000 andinto 2001. An estimated impact on international trade puts the import figure at BZ$115.3 millionto be spread over the rest of 2000 and 2001.
With well-organized support from friendly donor countries pledging investments instrategic areas and with proper project sequencing, the balance of payments may be able to avoidthe pressure that would otherwise be brought to bear on the exchange rate parity of the country.
7. Effect on rate of investment
Statistics from the Central Statistical Office and the Central Bank put the current-priced grosscapital expenditure figure for 1999 at BZ$459.9 million, representing some 33.5 per cent of GDPin current prices for 1999. The net addition to capital formation in 2000 did not appear to havebeen significant, allowing the analyst to work with the 1999 figure as a guide to 2000. Thedamage caused by Hurricane Keith resulted in net disinvestment, as a significant portion of thetourist plant was damaged and was taken out of service. To the extent that the investment wascovered by insurance, in most cases reconstruction will take place. In the short run, the lowerlevel of capital stock has led to lower returns on capital. This means that whereas the economicprojections for the post-2000 years were predicated on the retention of the 1999 capital stock andadditions, in fact production and return on investment declined. There are signs thatreconstruction, hopefully with mitigation, will take place in 2001. There are also signs thatproductive capacity in the economy will not have operated at optimum level in 2001 because ofthe replacement of damaged capital. Existing plant and machinery will either have to be workedbeyond specifications or would not be able to respond adequately to demand. The economy willthen most likely operate with a resource gap throughout 2001. It is reasonable to expect areplacement of fixed capital investment by the end of the year. It is important, however, that therate of addition to investment should be matched by a capacity to absorb the investment. If thisdoes not happen, at the stage of construction, migrant workers in the construction sector and later,skilled workers in the relevant industrial or service activities will have to be contracted to servicethe industry. Investment should be accompanied by a programme for upgrading the skills ofBelizeans to take the jobs that will be created by the investment.
8. Effect on rate of savings
Total domestic savings for 1999 have been used as the proxy in the absence of a figure for 2000.The figure stood at BZ$300.1 million. Given the problems of damage to property, some of whichwas not insured or in the case of many households, with a deductible that may be higher than thedamage, the savings rate is expected to have fallen in 2000 as a result of the hurricane. Thisfigure will continue to be reduced throughout 2001 as the economy seeks to recover from thedamage caused by Hurricane Keith in October 2000. The rate of investment is therefore expectedto moderate from the 1999 performance.

84
IV. GUIDELINES FOR A REHABILITATION ANDRECONSTRUCTION PROGRAMME
Although different emphasis is required in each country depending the type of damage and thevulnerability existing prior to the disaster, the devastating consequences of hurricane Keith inBelize call for the adoption of new rehabilitation and reconstruction criteria to reduce thecountry’s vulnerability. If anything Keith was a timely reminder that Belize is exposed todamages given its fragile ecosystems and geographical characteristics and location. Moreover,since the present development growth is predicated on activities that rely heavily on theenvironment, its sustainability and preservation – as are tourism and agriculture – the basis forfuture growth depend on the adoption of a rational management of risk.
Poverty factors and unequal distribution both of resources and income aggravate thecountry’s structural vulnerability and it will only be through a combined effort of government,local authorities, private sector entrepreneurs and society at large that a new approach todevelopment can take place. Physical fragility, health risks, environmental hazards, incomedifferential and social dynamics all combine to determine a country’s development pattern.
On occasion an event like Keith – fortunately enough without major losses of lives as hasrecently occurred in other countries-opens the opportunity for a change of policy and a soul –searching effort to avoid preserving or aggravating presently negative trends. Certainly Keithrepresents an economic setback in some aspects but it may be just the kind of reminder needed togive a hard look to ongoing processes that may be rectified.
It will be important – on the basis of this occurrence – to set priorities and consider thetime frame and the necessary changes to design, construction and land use regulations in keepingwith the situation in each country. In any event, reconstruction should be carried out on the basisof a significant qualitative improvement over the previous circumstances. Another fundamentalfactor regarding the viability of any reconstruction process is a country's internal capacity toconduct the process and programme it so that national capacity is not exceeded. Each countrymust decide on the time frame and priority of its actions and strike a balance between the urgenttask of replacing what has been lost and its capacity to accomplish such works.
Once the emergency phase is over, rehabilitation and reconstruction programmes must beestablished in order to restore the facilities, assets and services damaged or destroyed by thedevastating effects of the hurricane in each country. The content, priorities and scope of suchprogrammes must necessarily be a national, sovereign decision of each country and respond asmuch to the magnitude of the damages as to a country's pre-existing conditions and economic andsocial policy criteria. Its foreign debt commitments and stabilisation policies must also be takeninto account on determining the content, scope and scheduling of the programmes.
On addressing this topic, it is important to compile and analyse extensive background dataso as to draw up investment and management programmes that will make optimum use ofavailable resources while following the country's economic and social development objectives.

85
One factor to be borne in mind at this stage is that, given Belize’s inception in the CentralAmerican isthmus, reconstruction cannot be carried out by the country on its own; it requiresinternational cooperation. This section was included in this report to provide an idea of theinvestment projects deemed pertinent for repair and reconstruction. Some are merely profiles atthis stage while others are more developed and still others are already funded. The list of projectsneither replaces nor runs counter to the proposals submitted by national authorities to theAdvisory Group. It is intended to assist in identifying needs and portraying the priorities that bothinternational players, national actors and the specialists that took part in the evaluation wouldwish to see highlighted. In the final analysis any strategy must rest on strengthening the basis forsustained, less vulnerable development with growth. Thus any proposed mixture of componentsto reduce vulnerability to natural disasters must be compatible with sound economic policies andthe necessary structural reforms that will in the short and long term allow more effective, andcompetitive integration into a globalise world. Specially in the case of small developingeconomies like Belize – not unlike its SIDS counterparts in CARICOM or its Central Americanneighbours – vulnerability and risk management has a double track meaning. On the one handfacing its physical, environmental and climatic challenges ; and in the other strengthening itsresilience and capacity to respond to external shocks associated with financial crises or the worldmarkets.
Consequently, this part of the evaluation is not intended on focusing on a national strategywhich, as stated above, must be devised by the country in adequate consultation with thosecommunities more severely exposed to disasters and risks. Its purpose is to develop the guidingprinciples behind the generation of projects and the basic guidelines to be followed on preparingrehabilitation and reconstruction plans and programmes. We believe this could be of assistance tonational authorities on defining their strategy, which should be devised on the basis ofconsensus-reaching with society, particularly civil society, economic players, academic andnon-governmental organisations and local authorities, among others.
1. Project generation
The main aims of the proposed projects are to attend to victims of the disaster, rebuild andimprove destroyed and damaged assets, re-establish productive and export processes, and ingeneral help to reactivate the process of economic and social development.
The initiatives presented here are a sample of investment project profiles, currently beingdeveloped to provide basic information on their aims, scope, expected results, activities and tasksto be carried out, investment to be made, expected financing, and the special characteristics ofeach project. These profiles are compiled in addendum 1 to this document.
Each profile should subsequently be analysed in depth in order to draw up definitiveprojects and prioritise them so as to design repair and reconstruction programmes. This will makeit possible firstly to improve the living conditions of disaster victims and recover the material andeconomic losses stemming from hurricane Keith's devastating effects; secondly to enhance thedesign standards in use prior to the disaster, and thirdly to carry out works and establishmechanisms to control and mitigate the enormous damage caused by the hurrican’s wind andrains.

86
To carry out the projects efficiently – once they have been definitively assessed andranked – it will be essential to develop execution programmes so as to bring resources into linewith needs. It would first be advisable to draw up a rehabilitation programme part of which isalready under way to deal with the emergency situations facing disaster victims, followed by areconstruction programme to overcome economic and social adversities, restore and improveinfrastructure and production facilities, and prevent or reduce the effects of similar events.
2. Rehabilitation stage
This initial phase is focused on normalising the living conditions of victims – while alsoreactivating the economy – by meeting their vital needs and delivering basic services. Thevictims' food, health care and employment needs must take priority, and should be metexpeditiously through the following actions:
a) Provision of food.
b) Provision of potable water.
c) Medical attention to those at risk.
d) Control and improve the prevention of diseases, particularly contagious diseases.
e) Housing repair.
f) Establishment of improved sanitation services.
g) Generation of productive jobs.
h) Provisional repair of access roads to affected areas.
i) Supply of seeds and basic inputs to affected small and medium-scale farmers andfishers, along with financial support and soft loans.
j) Repair of different types of infrastructure.
The suggested rehabilitation programme should be implemented as swiftly as possible,partly to meet vital and basic needs that are an ethical imperative, and partly due to the need tocontrol and check the spread of diseases and epidemics in order to prevent hardships frombecoming more acute. It is important to remember that the rainy season begins in April, so therehabilitation programme must be concluded by that time.
Timely implementation of the above actions will bring the victims' living conditions backto relative normality and help to reactivate the country's economy.

87
3. Reconstruction stage
This is the most crucial stage in economic and social terms, since it will lead to the fullre-establishment of normal living conditions and the country's economic and social developmentmomentum prior to hurricane Mitch.
This phase will bring about the implementation of specific projects – duly assessed,ranked, and coordinated – in line with available resources, i.e., fully programmed and providedfor in the reconstruction programme, which should be worked out as soon as possible.
The main aim of the reconstruction stage and the projects thereof is to effectivelyovercome the direct and indirect problems stemming from the hurricane, althoughhurricane-prevention infrastructure and management deficiencies and flaws will also have to beaddressed. For instance, the effects of the hurricane showed that a number of structures wereunsafe and that other types of infrastructure, such as roads, bridges, hospitals, potable watersystems, schools, etc. were inappropriately located; there is also an absence of watershed,infrastructure and environmental management schemes, and a lack of natural disaster preventionand control facilities – particularly for floods – to manage and mitigate their after-effects.
Moreover, on designing the reconstruction programme it will be important to take intoaccount macroeconomic principles so as to prevent the undesirable consequences of overlyambitious reconstruction programmes. These include inflation, divergences in the exchange rateor in the supply and demand of certain resources such as labour and building materials, orundesired, disorderly migration.