Assessment of Mechanical Concrete Properties: An Overview
18
International Journal of Modern Research in Engineering and Technology (IJMRET) www.ijmret.org Volume 6 Issue 2 ǁ September 2021. www.ijmret.org ISSN: 2456-5628 Page 19 Assessment of Mechanical Concrete Properties: An Overview Najlaa Zaidan Kazem 1* , Mohammed Mosleh Salman 2 and Husain Khalaf Jarallah 3 1, 2, 3) Al-Mustansiriyah University, College of Engineering, Civil Engineering Department, Baghdad, Iraq Abstract: In recent years, there has been covering or affecting a large area to enhance and improving the concrete mechanical properties by adopting different ways. These improvements adopted by many researchers that tested different concrete types with and without additives materials. Conventional, high strength, high performance, reactive powder, modified reactive powder and ultra-high performance concrete are the main types of concrete that used in the buildings and infrastructures construction by selecting best concrete type to reduce the cross sectional of structural elements that lead to less weight and smaller sizes. In the current study, reviewed different concrete type with corresponding tests that adopted to investigated, evaluate and assessment the mechanical properties such as compressive, modulus of rupture and tensile strength in addition to modulus of elasticity by destructive and nondestructive tests are provided based on the reviewed literature. According to that, the best-recommended properties of different concrete types are summarized and discussed. Keywords: Compressive strength, Modulus of rupture, Tensile Strength; Modulus of elasticity of concrete, Concrete type, Steel fiber, Destructive and nondestructive concrete tests. I. Introduction All concrete structural members mostly used steel reinforcements along with concrete to resists tension stress that developed in tension zone of concrete member due to applied loadings. The developments of concrete mechanical properties over the past years has led to the production of different concrete types have higher mechanical properties such as high strength concrete, high performance concrete, moderate reactive powder concrete and reactive powder concrete that named as ultra-high performance concrete. two tests methodologies that adopted by researchers to evaluate the behavior of concrete strength such as destructive and nondestructive tests. Aim and significant of research The aim and significant of present study are to review the assessments of mechanical properties of different concrete types by adopted destructive and nondestructive tests. The mechanical properties that founded by other researchers are evaluates, discusses and giving recommendations. Reviewed tests and studied Kausay and Simon, 2019 [1], investigated the acceptance of concrete compressive strength that designed based on the mix design for concrete members. Roles for evaluated and acceptance or rejection of compressive strength were presented and discussed. The time period of concrete tests was longer three months but not more than one year. All specimen’s tests were calculating the standard deviation for at least 15 tested specimens as follow: 1
-
Upload
khangminh22 -
Category
Documents
-
view
1 -
download
0
Transcript of Assessment of Mechanical Concrete Properties: An Overview

International Journal of Modern Research in Engineering and Technology (IJMRET)
www.ijmret.org Volume 6 Issue 2 ǁ September 2021.
w w w . i j m r e t . o r g I S S N : 2 4 5 6 - 5 6 2 8
Page 19
Assessment of Mechanical Concrete Properties: An
Overview Najlaa Zaidan Kazem
1*, Mohammed Mosleh Salman
2 and Husain Khalaf
Jarallah3
1, 2, 3) Al-Mustansiriyah University, College of Engineering, Civil Engineering Department, Baghdad, Iraq
Abstract: In recent years, there has been covering or affecting a large area to enhance and improving the
concrete mechanical properties by adopting different ways. These improvements adopted by many researchers
that tested different concrete types with and without additives materials. Conventional, high strength, high
performance, reactive powder, modified reactive powder and ultra-high performance concrete are the main
types of concrete that used in the buildings and infrastructures construction by selecting best concrete type to
reduce the cross sectional of structural elements that lead to less weight and smaller sizes. In the current study,
reviewed different concrete type with corresponding tests that adopted to investigated, evaluate and assessment
the mechanical properties such as compressive, modulus of rupture and tensile strength in addition to modulus
of elasticity by destructive and nondestructive tests are provided based on the reviewed literature. According to
that, the best-recommended properties of different concrete types are summarized and discussed.
Keywords: Compressive strength, Modulus of rupture, Tensile Strength; Modulus of elasticity of concrete,
Concrete type, Steel fiber, Destructive and nondestructive concrete tests.
I. Introduction
All concrete structural members mostly used steel reinforcements along with concrete to resists tension stress
that developed in tension zone of concrete member due to applied loadings. The developments of concrete
mechanical properties over the past years has led to the production of different concrete types have higher
mechanical properties such as high strength concrete, high performance concrete, moderate reactive powder
concrete and reactive powder concrete that named as ultra-high performance concrete. two tests methodologies
that adopted by researchers to evaluate the behavior of concrete strength such as destructive and nondestructive
tests.
Aim and significant of research
The aim and significant of present study are to review the assessments of mechanical properties of different
concrete types by adopted destructive and nondestructive tests. The mechanical properties that founded by other
researchers are evaluates, discusses and giving recommendations.
Reviewed tests and studied
Kausay and Simon, 2019 [1], investigated the acceptance of concrete compressive strength that designed based
on the mix design for concrete members. Roles for evaluated and acceptance or rejection of compressive
strength were presented and discussed. The time period of concrete tests was longer three months but not more
than one year. All specimen’s tests were calculating the standard deviation for at least 15 tested specimens as
follow:
1

International Journal of Modern Research in Engineering and Technology (IJMRET)
www.ijmret.org Volume 6 Issue 2 ǁ September 2021.
w w w . i j m r e t . o r g I S S N : 2 4 5 6 - 5 6 2 8
Page 20
In which n ≥ 35, fci and fcm, test is the compressive and mean compressive strength of tested specimens. The
authors recommended that in case of normal concrete with strength class ≤ C50/60 is 3 MPa and in case of high
strength concrete with class ≥ C55/67 is 5 MPa. To apply this phenomena, the recommended number of samples
that must be adopted one sample for 25 m3. The acceptance compressive strength must be satisfying the
following formula:
fcm, test fcm fck1.48 2
Where, fck characteristic compressive strength and σ is the standard deviation according to the calculations of
initial production of test results at least 35 samples. Obtained results from study concluded that the reliability of
the conformity was important for evaluation of the compressive strength.
Tijani et al., 2019 [2], investigated the influence of aggregate size on the concrete mechanical properties. Three
dimensional applied loading was used to evaluated the impact of size aggregate of confined concrete as shown
in Figure 1.
a b
a c d
Figure 1: Setup specimen procedure (a) Uniaxial loading, (b) Biaxial loading, (c) Adjustment of plate and (d)
Three dimensional setup [2]

International Journal of Modern Research in Engineering and Technology (IJMRET)
www.ijmret.org Volume 6 Issue 2 ǁ September 2021.
w w w . i j m r e t . o r g I S S N : 2 4 5 6 - 5 6 2 8
Page 21
Cube mold was used to examined the stress-strain behavior of the tested specimens under the effects of static
loading and the test results were compared with the specimens that was unconfined. The concrete cube
dimensions of 150x150x150 mm while the aggregate sixe are 5, 10 and 20 mm. two different mixture were
adopted that lists in Table 1.
Table 1: Specimen mixtures
Mix ID Specific weight (kg/m3) Water/cement ratio
Cement Fine Coarse water
aggregate aggregate
A 395 800 850 256.75 0.65
B 275 900 920 233.75 0.85
The FRP bars that adopted to confined some specimens with different ply such as 0.5, 1 and 2 ply. FRP
properties with modulus of elasticity 245 GPa, thickness of 0.165 mm. Obtained test results of the specimens in
case of unconfined and confined subjected to uniform and non-uniform lateral confinement showed that the
main failure of the specimens was longitudinal splitting was obvious on the axial loading surface. Mode of
failure in case of condiment by FRP was shear sliding. Based on test results, the confinement efficiency
increased with increased aggregate size.
Gomaa et al, 2020 [3], pointed out on the mechanical properties of alkali activated concrete by adopted alkali
activators such as Sodium hydroxide and sodium silicate in which the specimens were cured at 70 Co for one
day. Traditional concrete with compressive strength 34.5 MPa was adopted as reference. Different tests were
adopted to evaluated the compressive strength, splitting tensile strength and modulus of rupture tested at
different ages as 1, 7 and 28 days. Compressive strengths of the alkali activated concrete tested results for 1 day
lie in the range of 25.1-37.8 MPa rely on the calcium content of the fly ash and the corresponding surface area.
These values represented 88-99% of the compressive strength of conventional concrete that tested at 28 days.
Splitting tensile strength and modulus of rupture tested specimens showed that the values 1.9-2.9 MPa for alkali
activated concrete while for conventional concrete ranged 2.4-3.1 MPa. Modulus of rupture ranged 3.2-4.5 MPa
and 4-4.5 MPa for alkali activated and conventional concrete respectively. Based on the compared test results
concluded that the alkali activated concrete can be adopted in applications where rapid strength gain is required.
Basa et al., 2020 [4], explored the mechanical properties of of new concrete by replaced fine aggreagte by
sustaiable material such as fly ash. Different tests were adopted to evaluate the presence of fly ash in the
concrete mixture such as compressive strength, flexural strength and splitting tensile strength in which for all
concrete mixes, the silica fume was added as binder material. The designed cune strength was 38.25 MPa by
used 438 kg of cement, 610 kg fine aggregate, 1206 kg coarse aggrgate and 197 liter of water for 1 cubic meter.
Different percentages of fly ash from fine aggrgate such as 10m 20m 30m 40m 50 and 100% by weight. The
specimens were cured at different ages as 7, 28 and 56 days. Compressive strength foubded by tested cube with
150 mm inside, splitting tensile strength tested by cylinder with 100 mm diameter and 200

International Journal of Modern Research in Engineering and Technology (IJMRET)
www.ijmret.org Volume 6 Issue 2 ǁ September 2021.
w w w . i j m r e t . o r g I S S N : 2 4 5 6 - 5 6 2 8
Page 22
mm height, flexural strength obtained by tested prism with 500x100x100 mm. test results indicated that with
natural fine aggregate 90%, fly ash 10% and silica fume 20% that gave 52, 69 and 75 MPa, splitting tensile
strength gave 5, 6.2 and 5.9 MPa, flexural strength gave 4.3, 5.4 and 7 MPa at 7, 28 and 56 cured days
respectively.
Tiwari et al., 2019 [5], evaluated the concrete pavement by used using Ekosoil in the concrete mixture to
enhance the concrete workability and concrete mechanical properties such as compressive strength and modulus
of rupture as flexural strength by adopted different percentages of Ekosoil. The Ekosoil was classified as
producted fermented from organic materials. Water to cement ratio for all mixed concrete but differe in Ekosoil
percentages such as 1, 2 and 3% by volume. All concrete specimens cured inside water and then tested at 28
days. Slump test was carried out to investigat the concrete workability, also the ultra-sonic velocity was
calculated by recorded the time interval rquired to travel the pulse from one sie to the other and then divided the
distance to the interval time to find out the velocity. Based on test results, the slump increased as the percentages
of Ekosoil increased in which the slump for reference was 27 mm that increased to 28, 31 and 34 mm for 1, 2
and 3% presences of Ekosoil respectively. The presence of Ekosoil decreased the compressive strength and
increased in Ekosoil percentages lead to reduced in compressive strengths for all cured ages as compared with
reference specimen. Decred in compressive strength was (53.36, 51.52 and 51.77%) in case of Ekosoil with 3%
tested at 7, 14 and 28 days respectively as compared with reference specimens. The flexural strength was 4.62
MPa that represents 8.62 and 15.23% lower than reference specimens in case of 3% Ekosoil. Concluded by test
results and by observed, the compressive and flexural strength of concrete contained of Ekosoil there was a
slight increased in case of 1 to 2% addited of Ekosoil and decrease in the values from 2-3% but the results
indicated that there are less than as compared with reference specimens.
Amen et al., 2016 [6], investigated the concrete properties by nondestractive test used hammar and ultrasonic
velocity tests. Total of 150 cunes were casted with compressive strength ranged 3-55 MPa and theen tested by
hammar and ultrasonic test and then crusheds. The recorded tests data were adopted to draived an emperical
equation that descibed the relationship between ultrasonic velocity, hammar rebound number and compressive
strength. The peosed equation suggested as follow:
C (R,V )0.0002781 R3.198
0.0001426 V 7.333
3
in which, C is the compressive strength, R is the rebound number and V is the ultrasonic velocity. Test and
analysis results indicated that the rebound number by used hammer test gaves reliable results than ultrasonic
velocity test to estinated the compressive strength.
Mulik et al., 2019 [7], assessmented the concrete quility by nondestractive tests such as rebound hammerand and
impact energy. Test results were compared with previous tests by other

International Journal of Modern Research in Engineering and Technology (IJMRET)
www.ijmret.org Volume 6 Issue 2 ǁ September 2021.
w w w . i j m r e t . o r g I S S N : 2 4 5 6 - 5 6 2 8
Page 23
researchers from literature and with practicle results collected from existing structures showed that the adopted
two tested methodolgies gave the accuracy of the estimations of the in site compressive strength.
Nwidi 2019 [8], suggested a relationship of compressive strength of normal concrete as a function of ultrasonic
velocity as nondestracive cube test. Different parameters were adopted in the tested specimens such as water to
cement ratio, aggregate size and concrete mix. Three different proposal were suggested based on the regrasion
analysis of tested results. The concrete mix that adopted as 1:1.5:3, 1:2:4 and 1:3:6 with aggregate size as 10-20
mm and water to cement ratio of 0.6-0.6. the proposed models as follow:
f
c
5.76e0.0004V 4
f
c
0.000044 V 1.6807
5
fc0.0117V18.693 6
All suggested models wereverfied with test results that showed close.
Koespiadi et al, 2018 [9], investygated the quility of concrete that used in foundations as precast concrete. mix
design of the precast concrete trapezoidal model was 1:2:3 in which the precast model reinforced by 6 mm bar
dianeter and the models classified as A and B that differ in presence of stiffnerss at base or without stiffneress,
the model shown in Figure 2
Figure 2: Precast design models A and B [9]
Test results showed that the foundation type A gave stronger resustance capacity and quality of the concrete
than the design B.
Haavisto et al., 2020 [10], evaluated the compressive strength of concrete by core test. Total of 650 specimens
with different core dimensions such as 50x50, 80x80, 100x100 and 150x300 mm were tested under same cured
conditions and drilled from casted cylimders as shown in Figure 3. Also, s with side dimensions 100 and 150
mm, cylinder whave diameter and hight 150 and 300 mm respectively. Four different concrete type were
adopted with slump range as 130/70, 180/180,

International Journal of Modern Research in Engineering and Technology (IJMRET)
www.ijmret.org Volume 6 Issue 2 ǁ September 2021.
w w w . i j m r e t . o r g I S S N : 2 4 5 6 - 5 6 2 8
Page 24
180/200 and 180/160. Compressive strength of tested specimens ranged between 43.7-72.7 MPa and density
2310-2390 kg/m3. Test results showed that the compressive strength depended on the specimen size and
concrete mix.
Figure 3: Core samples [10]
Al-Ghamdi, 2020 [11], assessed the concrete quality by adopted tested mechanism and estimated the failure
concrete type. Different main factors were considered classified as the contributed to the buildings that made
from concrete such as used poor and not quality materials, the inaccurate machines test and wrongs in mixing
methodology. The investigated of the reasons that adopted in the study indicated that the compressive strength
of concrete were tested by old machine. The case studied that adopted as concrete building showed that there
were some structural members failed due to low compressive strength of these members because of inaccurate
mixing procedure of concrete in addition to the poor in quality of mixed materials.
Zhou et al., 2019 [12], studied the influence and impacts of coal gangue content as coarse aggregate on the
concrete mechanical properties. Two types of coal gangue were adopted as 25, 50, 75 and 100% partial replaced
of coarse aggregate such as spontaneous (S) or rock gangue (R). the specimens that tested have dimensions as
100x100x100 mm cube, and prismatic specimens of 100x100x300 mm and 100x100x400 mm in which all
specimens were tested at 28 days. Obtained test results showed that the failure modes for all percentages
replacements are same and the compressive and flexural strength decreased as compared with the reference
specimen.
Buller et al., 2019 [13], presented the relationship between cubic and cylinder tests in case of recycled
aggregate. Total of 200 specimens were casted with 50% replacement of aggregate as recycled aggregate gat it
from demolished concrete. The mix design for all samples was 1:2:4 with water to cement ratio 0.54 was
adopted. All samples were tested after 28 cured days in which by test results the obtained factor was 0.7 to
convert the compressive strength of concrete from cube to cylinder.
Mishra et al., 2007 [14], studied the ability to produce a desired and intended result standard division of
compressive concrete strength. Mix design to produced 32 samples to reach 30 MPa as compressive strength by
used ordinary Partaken cement. The main goal was to find out the standard division to obtained the best water to
cement ratio. Trail assumed standard division was 5 MPa for

International Journal of Modern Research in Engineering and Technology (IJMRET)
www.ijmret.org Volume 6 Issue 2 ǁ September 2021.
w w w . i j m r e t . o r g I S S N : 2 4 5 6 - 5 6 2 8
Page 25
compressive strength and at the end of the tested specimens, the standard division was founded to be 2.43 MPa
that lead to conclude that the best water to cement ratio was 0.4723.
Rao and Ibrahim, 2017 [15], investigated the influence of replaced sand by quarry and fly ash as fine aggregate.
The self-compacted concrete was adopted with concrete grade 40 MPa in which the fine aggregate was replaced
by 35% quarry dust powder with size of 600-300 micron. Four different mix design were used with different
water to cement such as 0.54, 0.609, 0.7308 and 0.9135 for mix1, mix2, mix3 and mix4 respectively. the
specimens were casted by cube mold with size of 150x150x150 and cylinder with 150 mm in diameter and 300
mm in high. Obtained test results gave the average compressive strength of 58.03MPa, and standard deviation as
7.485MPa for mix1, mix 2 the compressive strength of 55.4 MPa and standard deviation 7.41 MPa, mix 3 gave
compressive strength of 52.58 MPa, and standard deviation as 2.52 MPa, mix 4 indicated that the compressive
strength of 45.74 MPa, and standard deviation as 3.08 MPa.
Neville, 1960 [16], studied the relationship between the mean compressive strength and the standard dedication
of concrete. concrete mix design with compressive strength 3000 lb/in2, water to cement ratio was 0.71, with
assumed standard dilation 600 lb/in2, so that the required compressive strength based on these data was 4400
3000 lb/in2 and water to cement ratio 0.57. concluded by the study that the value of the compressive strength at
the time of tested specimen.
Neville, 1957 [17], studied the influence of cube tested size on the standard deviation and on mean compressive
strength of concrete. Recommended the maximum size of aggregate for mass concrete ranged 3-6 inches, so that
it require a special mold cube or cylinder for test as compressive strength larger than the usual molds so that it
not necessary to remove the large aggregate size because in standard mold, the mold, size of aggregate is ¾
inch. Suggested that in case of maximum aggregate size 3 inch, the mixed rock ratio limited to 1:8.5-1:12by
weight and water to cement ratio is 0.52-0.58 with 10 inches’ cube gave compressive strength same as 6-inch
mold with rock ratio ranged 3-1.5-inch removal bit 12-20% lower than cube 6 inches.
Ramadoss, 2012 [18], suggested a model to evaluated the toughness and of strength high performance fiber
reinforced concrete HPFC. The model evaluated different concrete properties such as compressive strength,
splitting tensile strength flexural strength and toughness in addition to the ratio of steel fiber. Different
parameters were considered such as mix design and percentages of steel fiber as 0, 0.5, 1 and 1.5%. the adapted
steel fiber with aspect ratio 80 in which the mix designed with different water to cement ratio such as 0.25, 0.3,
0.35 and 0.4 depend on the percentages of steel fiber, silica fume content and super stabilizer. Compressive
strength of samples was tested based on ASTM C 39-05 [19] with 150 mm diameter cylinder while the splitting
strength test and flexural test based on ASTM C 496-1990 [20] used 150 mm diameter and 300 mm height of
cylinder and ASTM C 78-1994 [21] used 100×100×500 mm prisms for flexural and splitting tests respectively.
The proposed models as follow:
compressive strength35562.4 x114.979 x2 7.853 x319.211x4
14.81x5308.847 x6 3.7253 x76.1708 x8 7
Modulus of rupture30.0628 x10.00354 x20.01592 x350.1074 x60.011944 x8 8
Splitting tensile strength12.0588 x10.00103 x20.01763 x5 0.02101x8 9
in which x1, x2, x3......x8 are the independent variable, the proposed models were validated with experimental
results and the absolute variations are 1.09, 2.36, and 3.36% for compressive strength, flexural strength and

International Journal of Modern Research in Engineering and Technology (IJMRET)
www.ijmret.org Volume 6 Issue 2 ǁ September 2021.
w w w . i j m r e t . o r g I S S N : 2 4 5 6 - 5 6 2 8
Page 26
splitting tensile strengths, respectively.
Hong et al., 2020 [22], evaluated the concrete structural conditions by nondestructive test by ultrasonic pulse
velocity tests. The main function of nondestructive test was estimated the compressive strength of the structural
members by ultrasonic test based on the age of structure. Total of 123 specimens were tested based on the
compressive strength such as 24, 30 and 40 MPa tested at 16, 20, 24, 48, 72, 120, 168, 360 and 672 hours. The
calculated of the average ultrasonic velocity based on to the age of concrete by adapted ASTM C597 [23] and
ACI 228-2R [24] while the compressive strength was based on KS F 2405 [25]. The correlation between the two
test methods as ultrasonic pulse velocity and compressive strength was applied and analyzed the test results.
Suggested the equation to find out the compressive strength that related to ultrasonic pulse velocity. The
proposed equation as follow:
PulseVelocity832.75ln ( f ' )844.9 10
c
Wang and Jiang, 2015 [26], evaluated of concrete quality and the methodology that adopted to control and the
reliability analysis of concrete tests. Different nondestructive methods were adapted such as ultrasonic pulse
velocity and rebound hammer. Rogation analysis was used to find out the relationship between the two methods
and the concrete compressive strength that tested in situ for structural members. Suggested method to evaluate
the collapse failure of structural member by determined the reliability index of the structure. Recommended for
engineering designer was in many practical applications constraints on maximum displacements must be
enforced in order to guarantee an appropriate use of the construction.
Ammad et al., 2018 [27], assessment the mechanical concrete properties in case of low strength by destructive
and nondestructive methods. Core and compressive strength tests as destructive methods while ultrasonic pulse
velocity and hammer tests as nondestructive tests were adapted to investigated the concrete have low strength.
Low concrete compressive strength in the range of 1500-1700 psi was evaluated. Different mix design was
considered such as 1:2:3, 1:1.5:2.5 and 1:1.5:3, as cement: fine aggregate: coarse aggregate respectively. The
basis mix design for comparison was 1:1.5:3 that tested after 14 cured days. Obtained test results indicated that
the hammer gave higher values while core test founded mostly accurate values. Hammer tests gave around 30%
higher as compared with standard results.
Arioz et al., 2008 [28], investigated the compressive strength of normal weight concrete by core test. Beams
with dimensions of 250x300x650 mm and cubes with 150 mm as side length were prepared and casted and then
after cured up to 90 days by adapted different concentrations of sodium sulphate solutions while the samples as
cubes was under the effect of frost at different ages. Different core samples were considered such as 94, 69, 46
mm as diameter with length to diameter ratio as ranged 0.75-2 that drilled from beams while in case of drilled
core from cube was 69 mm in diameter. Different water to cement ratio such as 0.6, 0.54, 0.47, 0.44 and 0.4
were considered. According to experimental investigation results the type of aggregate, diameter and length to
diameter ratio of the tested core affect the compressive strength of cores, concentration of sulphate impacts on
the strength of concrete even when the time period of exposure was very short.
Soutsos et al., 2009 [29], pointed out on tests of scale reinforced concrete frame building. Statistical analysis of
test results was tacked into account and then after make interpolation to find out the uncertainties that existed of
concrete strength. Methodology of the assessment the test results based on the BS EN 13791-2007 [30] that deal
with the procedure of how to find the compressive strength in situ. Test results showed that the use of standard
statistical procedures that considered different parameters such as quality control, number of tests and the
required confidence level in the predictions gave best methodology to find out the compressive strength of
concrete.
Kirchhof et al., 2015 [31], evaluated the residual compressive strength of ordinary concrete after the specimens
was exposure to high temperature used nondestructive test by ultrasonic pulse velocity tests. Different mix

International Journal of Modern Research in Engineering and Technology (IJMRET)
www.ijmret.org Volume 6 Issue 2 ǁ September 2021.
w w w . i j m r e t . o r g I S S N : 2 4 5 6 - 5 6 2 8
Page 27
design was adapted with water to cement ratio of 0.25, 0.3 and 0.5 and the cylinder samples were subjected to
temperature in the ranged of 200-600 Co. Test results showed that the adopted ultrasonic pulse velocity test gave
accurate and can be trustworthy analysis to predict the concrete compressive strength under the effect of high
temperature.
Olusola et al., 2012 [32], investigated the influence of batching method on the concrete properties for both fresh
as slump test and hardening concrete as compressive strength. different mix design was adapted such as 1:1:2,
1:1½:3 as rich mix, 1:2:4 as ordinary mix, 1:3:6, 1:4:8 as nonstructural mix with water to cement ratios ranged
as0.35-0.95 in which all samples are cured in water up to 28 days. The results showed that a higher
workability’s for concrete batched by mass as compared with concrete batched by volume for all water to
cement ratios. Noted that the workability was increased as increased in water to cement ratios in both
methodologies. Compressive strength results indicated that in case of 1:1:2 and 1:1.5:3 concrete mix batched by
mass gave 20 and 6% strength increases respectively over the concrete batched by volume. In case of concrete
mix 1:2:4 had 14 % increase while non-structural mixes 1:3:6 and 1:4:8 gave 8% and 6% increases respectively.
Kabashi et al., 2015 [33], evaluated the compressive strength of concrete structural member in situ.
Nondestructive tests were adapted to examined the compressive strength of concrete such as rebound hammer
based on EN12504-2 [34], ultrasonic pulse velocity based on EN 12504-4 [35]and Core test based on EN12504-
1 [36]. Different structural elements were considered such as slab, beam, column and wall that tested in situ in
which all concrete members with structural building. Concluded based on the investigation, more than one
method to evaluate the concrete strength lead to more promising of the concrete in construction.
Ju et al., 2017 [37], assessment the compressive strength by ultrasonic pulse velocity in addition to hammer test
and core tests for high strength concrete. different compressive strength was considered such as 40, 60 and 100
MPa with different core diameter as 30, 50 and 100 mm in which for each compressive strength there is
ultrasonic pulse velocity test. Regression analysis for tested data to develop an equation that represent the
relationship between compressive strength and nondestructive magnitude. According to the 61 samples that
tested to find out the compressive strengths of core specimens, a correction factor was investigated to estimate
the relationship between core test and compressive strength. Test results showed that the compressive strength
of a concrete core samples decreases when the core diameter reduces.
Nepomuceno and Bernardo, 2019 [38], assessment the structural concrete members that casted by self-weight
concrete ny nondestructive methods. Different test methodologies were adapted such as ultrasonic pulse
velocity, rebound hammer, pull-out and the concrete maturity tests. The samples tested at different ages such as
1, 2, 3, 7, 14, 28, and 94 days. Test results showed that the compressive strength ranged 45-97 MPa.
Correlations and regression analysis were established to find out the relationship between the nondestructive test
and concrete compressive strength by adopted 95% confidence limits computed. Test results indicated good
correlations.
Michałek, 2019 [39], investigated the variation of compressive strength in concrete layers when placed as more
than one layer. Core sample from 350 mm slab thickness was tested by ultrasonic and find out the compressive
strength to check out the variation in compressive strength in layers. Test results showed that there was no
different in compressive strength between the layers and should be not taking into account from engineering
designer.
Bora, [40], studied the criteria that depended for acceptance of concrete according to compressive strength.
Different tests were studied to find out the concrete compressive strength such as core, cube, ultrasonic pulse
velocity and hammer. The acceptance criteria for destructive test as cube was accepted as average of three
samples and the individual variation should not greater than ±15%, core test shall be at least 85% from the
tested cube and the ultrasonic pulse velocity have variation ±20% by compressive strength.

International Journal of Modern Research in Engineering and Technology (IJMRET)
www.ijmret.org Volume 6 Issue 2 ǁ September 2021.
w w w . i j m r e t . o r g I S S N : 2 4 5 6 - 5 6 2 8
Page 28
Standard codes and specifications
Many codes considered the specifications of testing of concrete samples such as compressive strength,
flexural strength, splitting tensile strength and in additional to nondestructive tests like ultrasonic pulse velocity
and hammer test.
ASTM Standard C 39 – 05 [19] explained and discussed the standard test method for compressive
strength of cylindrical and drilled cores in which is limited to concrete having a unit weight in excess of 800
kg/m3 to evaluating the concrete how strong. The standard cylinder with diameter 150 mm and height 300 mm
was adopted and the breaking load after 28 days curing of the sample divided by the surface area of the cylinder
gave the compressive strength of concrete in which the compressive strength must be within 15-55 MPa. Test
results can be adopted as a basis for concrete quality control, mixing, and placing The maximum difference of
individual diameter of a cylinder sample from other diameter of the same cylinder not greater than 2 %. The
type of fracture evaluating based on Figure 4.
Figure 4: Types of fracture [19]
ASTM Standard C 496–90 [20], gave details how to find out the splitting tensile strength of concrete. the
cylinder sample of concrete with 150x300 mm as diameter and height was considered. Calculation of the
splitting tensile strength by applied as follows:
T
2 P
11
d l
In which, T is the splitting tensile strength (MPa), P is the maximum applied load indicated by the testing
machine (N), l is the length of sample (mm) and d is the diameter of sample (mm). Based on this specification,
the coefficient of variation was 5 % for sample dimensions of cylinder 152x305 mm with test results (average
have same property) of 2.8 MPa, the differ not greater than 14 %.
ASTM C 78–94 [21], this standard test method explained the determination of the flexural strength of concrete
by the use of a simple beam with third-point loading in which the sample is prism with symbols dimensions as
Lxbxd and the modulus of rupture calculations as follows:
R
P L
12
b d 2
Where, R is the modulus of rupture (MPa), P is the maximum applied load indicated by the testing machine (N),
L is the span length (mm), b is the average width of specimen (mm) at the fracture and d is the average depth of
specimen (mm) at the fracture. The standard division for flexural test up to 5.5 MPa for good concrete quality
and the standard division over 0.7 MPa indicate there is problem in test or the sample in dry condition that lead
to reduce strength.

International Journal of Modern Research in Engineering and Technology (IJMRET)
www.ijmret.org Volume 6 Issue 2 ǁ September 2021.
w w w . i j m r e t . o r g I S S N : 2 4 5 6 - 5 6 2 8
Page 29
ASTM C 597 – 16 [23], determined the ultrasonic pulse velocity of in a concrete mass is related to its elastic
properties and density according to the following relationship: as follows:
V
13 E(1)
(1)(12)
where, E is the dynamic modulus of elasticity, μ is the Poisson’s ratio and ρ is the density. When the span path
that required for test ranged between 0.3-6 m, the test results of velocity within difference of 2%.
ACI 228-2R [24], this code adopting to find out the hardened concrete properties and to assessment evaluate the
condition of concrete that including the methodology for each sample test.
BS EN 13791: 2007 [30], this specification related to evaluation of concrete compressive strength in situ in
which the minimum number of samples is one core per location. The compressive strength of core has length
and diameter 100 mm same as compressive strength of cube with 150
mm in side that treated under same conditions. In case of core with length in the range of 100-150 mm with
length to diameter ratio equal to 2 give compressive strength equivalent to 150 mm diameter and 300 mm in
length of cylinder. In case of core diameter in the range of 50-150 mm with other length to diameter ratio, the
shall be assessment based on the factor conversions. The assessment the compressive strength in situ based on
the lower value of:
fck , is fm (n), isk2 . S 14
fck , is f is, lowest4 15
In which, fck, is is the characteristic compressive strength in situ, fm(n),is is the mean compressive strength in
situ, fis, lowest is the lowest compressive strength in situ, S is the standard deviation of test results or 2 MPa
whichever highest value, k2 equal to 1.48.
BS EN 12504-2:2012 [34], adopting this specification for testing concrete in structures. Non-destructive testing
to determination of rebound number in which this method can be used to assessing the uniformity of concrete in
situ. If more than 20 % of all the readings differ from the median by more than 6 units, the entire set of readings
shall be discarded.
BS EN 12504-4:2004 [35], can be adopting for testing concrete by ultrasonic pulse velocity. The arrangement is
shown in Figure 5 in which T is the transmitter and R receiver transducer respectively.
Figure 4: Transducer positions [35]
International Journal of Modern Research in Engineering and Technology (IJMRET)
www.ijmret.org Volume 6 Issue 2 ǁ September 2021.
w w w . i j m r e t . o r g I S S N : 2 4 5 6 - 5 6 2 8
Page 30
The pulse velocity calculated as follow:
V
L
16
T
Where, V is the pulse velocity, L is the path length and T is the time that the pulse requires to transverse the path
length., the velocity expressed in km/sec.
BS EN 12504-1:2019 [36], for testing concrete in structures, cored specimens taking, examining and testing in
compression. Length to diameter ratio for core sample in case of the test results compared with cylinder or cube
2 or 1 respectively.
Based on ACI-318-2019 [41] that classified the concrete compressive strength as the important parameter for
evaluating the concrete members that effect on the design. The arithmetic average of three tested samples shall
be greater or equal to the specified compressive strength, in additions, in case of specified compressive strength
less or equal to 35 MPa, the samples fall below this required strength should be not greater than by 3.5 MPa,
wgen the required compressive strength less than 35 MPa, the fall sample should be not more than 10% of
specified strength. ACI-318-2011 [42] specified the required average compressive strength by adopted samples
as cylinder 150 diameter by 300 mm height as follows:
Specified compressive strength fc’ ≤ 35 MPa
Where, fcr’ is the required average compressive strength (MPa), Ss is the sample standard deviation that
calculated based on the at least 30 consecutive tests or two groups of consecutive tests totaling at least 30 tests
(same as equation (1).
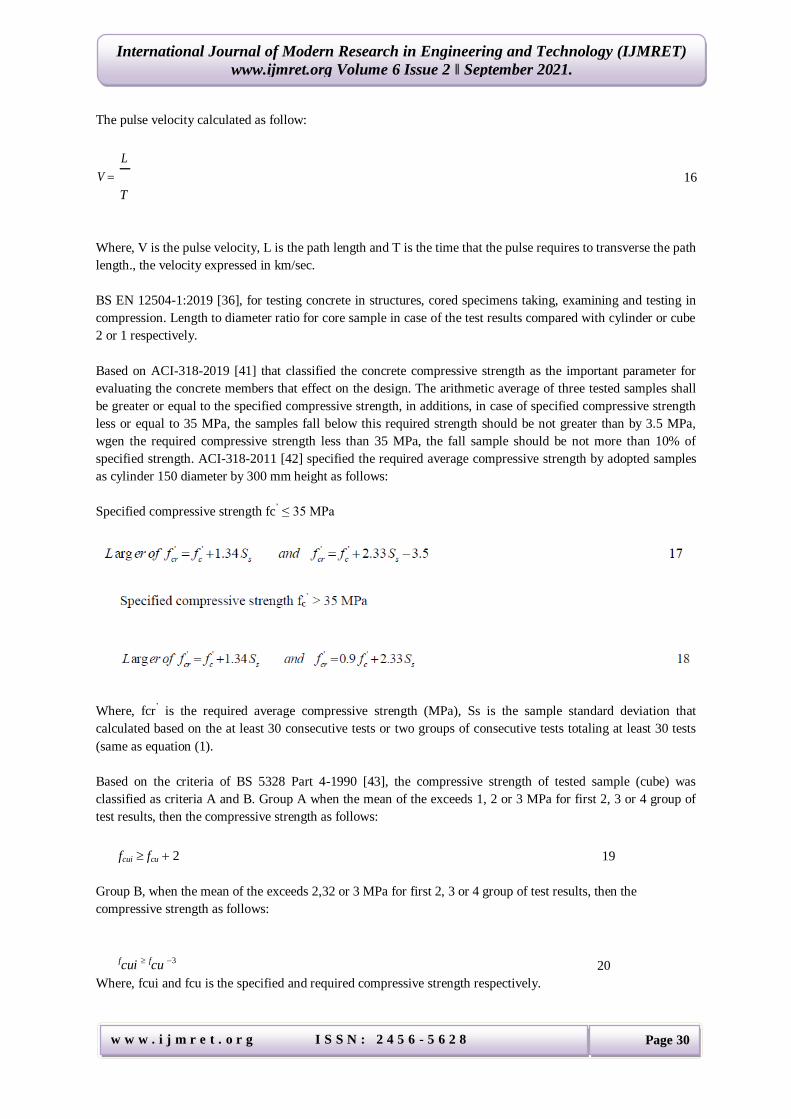
Based on the criteria of BS 5328 Part 4-1990 [43], the compressive strength of tested sample (cube) was
classified as criteria A and B. Group A when the mean of the exceeds 1, 2 or 3 MPa for first 2, 3 or 4 group of
test results, then the compressive strength as follows:
fcui fcu 2 19
Group B, when the mean of the exceeds 2,32 or 3 MPa for first 2, 3 or 4 group of test results, then the
compressive strength as follows:
fcui fcu3 20
Where, fcui and fcu is the specified and required compressive strength respectively.

International Journal of Modern Research in Engineering and Technology (IJMRET)
www.ijmret.org Volume 6 Issue 2 ǁ September 2021.
w w w . i j m r e t . o r g I S S N : 2 4 5 6 - 5 6 2 8
Page 31
According to BS EN 206-1: 2013 [44], the criteria for compressive strength divided as criteria 1 and 2. Criteria
1 based on the mean of n test results of compressive strength fcm individual criteria
2 based on the individual test results fci. The two criteria list in Table 2:
Table 2: Criteria for compressive strength [44]
Number n of test results Criteria 1 Criteria 2
fcm fci
1 Not applicable ≥ fck – 4
2 to 4 ≥ fck + 1 ≥ fck - 4
5 to 6 ≥ fck + 2 ≥ fck - 4
fck is the characteristic compressive strength.
Based on IS 516:1959 [45], the compressive strength of cube with dimensions of 150x150x150
mm that tested at 28 days 95% of tested cubes should not have a value less than this value. Shown in Figure 5.
Figure 5: Normal Distribution curve on test specimens for determining compressive strength [45]
Iraq building code 1-1987 [46], the quality of concrete that measure as compressive strength in which the
average of four consecutive strength tests, the compressive characteristic compressive strength shall exceed at
least 3 MPa in addition to no individual compressive strength results by more than 3 MPa. The Iraq specification
relies on BS and ASTM that deals with same subject that is mean the compressive strength and other concrete
mechanical properties of concrete.
Egyptian code of practice, ECP 203-2018 [47], specified the minimum requirements of compressive strength for
cub with dimensions of 150x150x150 mm that using in structural reinforce concrete members 20 MPa and
should be not greater than 60 MPa.
Based on PCA [48], the design compressive strength f’cr must be greater than the specified strength f’c in whci
the standard deviation must be greater than 30 consecutive strength tests have similar materials and conditions.
In case of the samples less than 30 but more than 15 tests, the standard deviation multiply by modification factor
that lists in Table 3 as follows:

International Journal of Modern Research in Engineering and Technology (IJMRET)
www.ijmret.org Volume 6 Issue 2 ǁ September 2021.
w w w . i j m r e t . o r g I S S N : 2 4 5 6 - 5 6 2 8
Page 32
Table 3: modification factor [48]
Number of Tests Modification Factor
15 1.16
20 1.08
25 1.03
>30 1.00
In case of the tests less than 15, Table 4 lists the formula to calculate the compressive strength as follows:
Table 4: Required strength [48]
Specified Strength (MPa) Required Average Strength (MPa)
< 21 f’c +7.0
21-35 f’c +8.5
35 1.1 f’c +5.0
The normal distribution with standard deviation shown in Figure 6 that represents the specified and average
design strength limit.
Figure 6: Normal distribution and standard deviation of the specified and average design strength limit [48]
BS (1881): Part 203 (BS, 1881, 1986) [49], described the time required for pulse to travel through concrete to
find out the velocity. The ultrasonic pulse velocity can be adopting to evaluation of concrete quality based on
test results so that the pulse velocity is a function of uniformity, incidence, internal flaws, cracks and
segregation. Table 5 lists the concrete quality according to pulse velocity.

International Journal of Modern Research in Engineering and Technology (IJMRET)
www.ijmret.org Volume 6 Issue 2 ǁ September 2021.
w w w . i j m r e t . o r g I S S N : 2 4 5 6 - 5 6 2 8
Page 33
Table 5: Concrete quality [49]
Concrete quality Pulse velocity (km/sec)
Excellent > 4.5
Good 3.5-4.5
Medium 3.0-3.5
Poor < 3
According to ACI-214R-11 [50], the required compressive strength f’cr as a function of specified compressive
strength f’c as follow:
where s is the sample standard deviation and z is the constant multiplayer that depend on the number of tests.
The equation to determine the minimum required strength lists in Table 6.
Table 6: Equations to determine minimum required average strength [50]
Criterion 1 Criterion 2 Criterion 3 Criterion 4
Maximum percent of Maximum percent of Maximum percent of Maximum percent of
individual tests < fc moving average of n individual tests < ( fc ′ individual tests < (k%
consecutive tests < fc – k) of fc ′)
fcr′ = fc ′ + zs fcr′ = fc ′ + (zs/ n0.5) fcr′ = ( fc ′ – k) + zs fcr′ = kfc ′ + zs
The Probabilities associated with values of z lists in Table 7 Table 7: Probabilities associated with
values of z [50]
Percenta 40 50 60 68.27 70 80*
90 95 95.4 98*
99 99.73
ges of 5
tests
within ±
zσ
Chances 3 in 10 2.5 in 2 in 10 1 in 1.5 in 1 in 1 in 1 in 1 in 1 in 1 in 1 in
of falling (30%) 10 (20%) 6.3 10 10 20 40 44 100 200 744
below fc′ (25%) (15.9 (15%) (10% (5%) (2.5 (2.3 (1%)* (0.5%) (0.13
– zσ %) )* %) %) %)
z 0.52 0.67 0.84 1.00 1.04 1.28* 1.65 1.96 2.00 2.53* 2.58 3.00
* Commonly used values.

International Journal of Modern Research in Engineering and Technology (IJMRET)
www.ijmret.org Volume 6 Issue 2 ǁ September 2021.
w w w . i j m r e t . o r g I S S N : 2 4 5 6 - 5 6 2 8
Page 34
Conclusions
This study reviewed on the assessment methodologies tests of concrete samples as destructive and
nondestructive, the following conclusions can be drawn from this study:
The reliability of the conformity very important for compressive strength assessment.
Undestractive test as hammer test gaves reliable results as compared with ultrasonic velocity test.
The compressive strength mainaly rely on concrete mix.
Some structural members failed due to low compressive strength of these members because of
inaccurate mixing procedure of concrete in addition to the poor in quality of mixed materials.
The hammer test gave higher values as compared with distractible compression test while core test
founded mostly accurate values.
Length to diameter ratio of the tested core effect on the compressive strength of cores.
Ultrasonic pulse velocity test gave accurate and can be trustworthy analysis to predict the concrete
compressive strength under the effect of high temperature.
The investigation, more than one method to evaluate the concrete strength lead to more promising of
the concrete in construction.
No different in compressive strength between the layers and should be not taking into account from
engineering designer.
References
[1.] Kausay and Simon, “Acceptance of concrete compressive strength”, Research gate, July 2019, pp. 1-19. [2.] Tijani, Wu and Lim, “Aggregate size effects and general static loading response on mechanical behavior of passively
confined concrete”, Construction and Building Materials 205, 2019, pp. 61–72. [3.] Gomaa, Sargon, Kashosi, Gheni, and ElGawady, “Mechanical Properties of High Early Strength Class C Fly Ash-
Based Alkali Activated Concrete”, Transportation Research Record Journal of the Transportation Research Board, March 2020, pp.430-443.
[4.] Basa, Pradhan and Parhi, “Mechanical Properties of Concrete with Sintered Fly Ash Aggregate as Substitute of
Natural Fine Aggregate”, Bidyadhar Basa et al 2020 IOP Conf. Ser.: Mater. Sci. Eng. 970 012013, pp. 1-7. [5.] Tiwari, Shrivastava, Singh3 and Kishan, “Evaluation of Strength Characteristics of Pavement Quality Concrete
Mixes using Ekosoil”, International Research Journal of Engineering and Technology (IRJET), Volume: 06 Issue: 01
| Jan 2019, pp.1746-1751. [6.] Amen, Abdulmajeed and Hassan,”comparative analysis of the rebound hammer & ultrasonic pulse velocity in testing
concrete with multi – variation equation”, International Review of Civil Engineering (I.RE.C.E.), Vol. 7, n. 6 (2016), pp. 1-7.
[7.] Mulik, Deo, Dhumal and Ghaywat, “Concrete Quality Assessment by Using Non-Destructive Test”,
International Research Journal of Engineering and Technology (IRJET), Volume: 06 Issue: 03 | Mar 2019, pp.
5202-5204. [8.] Nwidi, “Modeling of compressive strength of concrete using pulse velocity values from a non-destructive testing of
concrete”, Journal of Civil Engineering and Construction Technology, 12 March, 2019, pp.13-19.

International Journal of Modern Research in Engineering and Technology (IJMRET)
www.ijmret.org Volume 6 Issue 2 ǁ September 2021.
w w w . i j m r e t . o r g I S S N : 2 4 5 6 - 5 6 2 8
Page 35
[9.] Koespiadi et al, “The Concrete Quality Testing for Trapezoidal Model of the Prefabricated Foundation”, International
Journal of Engineering & Technology, 7 (3.25) (2018), pp. 311-315. [10.] Haavisto, Husso and Laaksonen, “Compressive strength of core specimens drilled from concrete test cylinders”,
TECHNICAL PAPER Fib WILEY, 24 September 2020, pp.1-13. [11.] Al-Ghamdi, “An Assessment of Quality Compliance Using Concrete TestMechanism: A Case Study with a
Construction Company in Saudi Arabia”, Journal of Global Scientific Research (ISSN: 2523-9376) 3 (2020), pp.429-433.
[12.] Zhou, Dou, Zhang, Zhang and Zhang, “Effects of the variety and content of coal gangue coarse aggregate on the
mechanical properties of concrete”, Construction and Building Materials 220, 2019, pp. 386–395.
[13.] Buller, Oad and Memon, “Relationship between Cubical and Cylindrical Compressive Strength of Recycled
Aggregate Concrete”, IJIRMPS Volume 7, Issue 2, 2019, pp.14-19. [14.] Mishra, Kenna-o, Sonam, Pamtheid and Taram, “Efficacy of Established Standard Deviation on M30 Grade
Concrete”, International Journal of Innovative Research in Science, Engineering and Technology, Vol. 4, Issue 1, January 2015, pp.19127-19134.
[15.] Rao, Ibrahim, “The standard deviation in cube strength results of self-compacting concrete of m40 grade using quarry dust as fine aggregate and fly ash powder as filler”, International Journal of Civil Engineering and Technology, Volume 8, Issue 10, October 2017, pp.1695–1703.
[16.] Neville, “The relation between standard deviation and mean strength of concrete test cubes”, Magazine of Concrete
Research: Vol. 12, No. 34: March 1960, pp.44-49. [17.] Neville, “The influence of size of concrete test cubes on mean strength and standard deviation”, Magazine of
Concrete Research: March 1957, pp.52-55. [18.] Ramadoss, “Modeling for the evaluation of strength and toughness of high-performance fiber reinforced concrete”,
Journal of Engineering Science and Technology Vol. 7, No. 3 (2012), pp. 280 – 291. [19.] ASTM Standard C 39 – 05, “Standard Test Method for Compressive Strength of Cylindrical Concrete Specimens”. [20.] ASTM Standard C 496–90, “Test Method for Splitting Tensile Strength of Cylindrical Concrete Specimens,” Annual
Book of ASTM Standards, ASTM International, West Conshohocken, PA, 1990.
[21.] ASTM Standard C 78–94, “Test Method for Flexural Strength of Concrete Using Simple Beam with Third-Point
Loading” Annual Book of ASTM Standards, ASTM International,West Conshohocken, PA, 1994.
[22.] Hong, Yoon, Kim, Lee, Kim and Lee, “Evaluation of Condition of Concrete Structures Using Ultrasonic Pulse Velocity Method”, Appl. Sci., January 2020, PP.13-19.
[23.] ASTM C597 – 16, “Standard Test Method for Pulse Velocity Through Concrete”
[24.] ACI 228-2R, “Nondestructive Test Methods for Evaluation of Concrete in Structures”.
[25.] KS F 2405-2010, “Standard test method for compressive strength of concrete”.
[26.] Wang and Jiang, “Quality Control and Evaluation Methods of Concrete Engineering and Its Reliability Analysis”,
The Open Civil Engineering Journal, 2015, 9, PP.639-643.
[27.] Ammad, Rehman, Saad and Abbas, “Assessment of low strength concrete with destructive & nondestructive testing method's”, 3rd International Conference on Emerging Trends in Engineering, Management and Sciences October 2018, pp.393-402.
[28.] Arioz, Tuncan, Ramyar, Karasu, Tuncan and Kilinc, “Determination of Concrete Strength by Core Test; Effects of Sodium Sulphate and Frost Action”, 8th International Congress on Advances in Civil Engineering, September 2008, pp.77-89.
[29.] Soutsos, Bungey, Long and Tickell, “Interpretation of in-situ concrete strength test results”, NDTCE’09, Non-Destructive Testing in Civil Engineering Nantes, France, June 30th – July 3rd, 2009, pp.1-6.
[30.] BS EN 13791: 2007 “Assessment of in-situ compressive strength in structures and precast concrete components”, ISBN 978-0-580-50271-2, BSI, London, 2007, p. 29.

International Journal of Modern Research in Engineering and Technology (IJMRET)
www.ijmret.org Volume 6 Issue 2 ǁ September 2021.
w w w . i j m r e t . o r g I S S N : 2 4 5 6 - 5 6 2 8
Page 36
[31.] Kirchhof, Lorenzi and Silva filho, “Assessment of Concrete Residual Strength at High Temperatures using Ultrasonic Pulse Velocity”, Vol.20 No.7 (July 2015) - The e-Journal of Nondestructive Testing - ISSN 1435-4934, pp.1-9.
[32.] Olusola, Babafemi, Umoh and Olawuyi, “Effect of batching methods on the fresh and hardened properties of concrete”, IJRRAS 13 (3), December 2012, pp.773-779.
[33.] Kabashi, Krasniqi and Dautaj, “Evaluation the Compressive Strength in Concrete Structures Using the In-situ Test
Methods”, Journal of Civil Engineering and Environmental Sciences, 2015, pp. 1-5.
[34.] BS EN 12504-2:2012, Testing concrete in structures. Non-destructive testing. Determination of rebound number
[35.] BS EN 12504-4:2004, Testing concrete. Determination of ultrasonic pulse velocity
[36.] BS EN 12504-1:2019, Testing concrete in structures. Cored specimens. Taking, examining and testing in compression
[37.] Ju, Park and Oh, “Estimation of Compressive Strength of High Strength Concrete Using Non-Destructive Technique and Concrete Core Strength”, Appl. Sci. 2017, pp.2-16.
[38.] Nepomuceno and Bernardo, “Evaluation of Self-Compacting Concrete Strength with Non-Destructive Tests for Concrete Structures”, Applied sciences, 2019, pp. 1-18.
[39.] Michałek, “Variation in Compressive Strength of Concrete across Thickness of Placed Layer”, Materials 2019, pp.2-
14.
[40.] Bora, “Tests and Acceptance Criteria for Concrete Based on Compressive Strength”, National Technical Seminar on Innovation in Infrastructure Technology for Sustainable Development, Project Delivery and Management, pp.133-141.
[41.] ACI 318-2019, “Building Code Requirements for Structural Concrete and Commentary:
[42.] ACI 318-2011, “Building Code Requirements for Structural Concrete and Commentary:
[43.] BS 5328 Part 4-1990. Specification for the procedures to be used in sampling, testing and assessing compliance of concrete.
[44.] BS EN 206-1: 2013, Concrete - Specification, performance, production and conformity (incorporating corrigendum May 2014)
[45.] IS 516:1959 Methods of Tests for Strength of Concrete (Eighteenth revision). Reaffirmed-May 2013/
[46.] Code 1-1987, Iraq building code requirements for reinforced concrete.
[47.] Egyptian code of practice, ECP 203-2018 for concrete construction.
[48.] Portland Cement Association PCA, concrete technology and codes.
[49.] BS 1881: Part 203, 1986. Recommendations for Measurement of Velocity of Ultrasonic Pulses in Concrete. British
Standards Institution, London.
[50.] ACI-214R-11, Guide to Evaluation of Strength Test Results of Concrete.