Sulfur-associated polioencephalomalacia in cattle grazing plants in the Family Brassicaceae

1919Rev. Biol. Trop. (Int. J. Trop. Biol. ISSN-0034-7744) Vol. 61 (4): 1919-1934, December 2013
Assessment of genetic diversity in Brassica juncea (Brassicaceae) genotypes using phenotypic differences and SSR markers
Vinu V.1, Naveen Singh1, Sujata Vasudev1, Devendra Kumar Yadava1, Sushil Kumar2, Sugandh Naresh1, Sripad Ramachandra Bhat2 & Kumble Vinod Prabhu1
1. Division of Genetics, Indian Agricultural Research Institute, New Delhi-110 012; [email protected], [email protected], [email protected], [email protected], [email protected], [email protected] 2. NRC on Plant Biotechnology, IARI Campus, New Delhi-110 012; [email protected], [email protected]
Received 12-XI-2012. Corrected 20-VI-2013. Accepted 22-VII-2013.
Abstract: Evaluación de la diversidad genética en genotipos de Brassica juncea (Brassicaceae) utilizando diferencias fenotípicas y marcadores SSR. Brassica mustard species represent one of the most important oilseed crops in India, nevertheless, their genetic diversity is barely known. A better understanding on this topic is essential for the proper utilization of genotypes in breeding programmes. We evaluated the genetic diversity among 44 Indian mustard (Brassica juncea) genotypes including varieties/purelines from different agro-climatic zones of India and few exotic genotypes (Australia, Poland and China). For this, we used A and B genome spe-cific SSR markers and phenotypic data on 12 yield and yield contributing traits. Out of the 143 primers tested, 134 reported polymorphism and a total of 355 alleles were amplified. Dendrograms based on Jaccard’s similar-ity coefficients and Manhattan dissimilarity coefficients were generated based on an average linkage algorithm (UPGMA) using marker data and phenotypic data. Genotypes were grouped into four clusters based on genetic distances. Both the clustering patterns based on Jaccard’s similarity and Manhattan dissimilarity coefficients, independently, discriminated the genotypes effectively as per their pedigree and origin. PCoA revealed that, the grouping of genotypes based on SSR marker data is more convincing than phenotypic data, however, the correlation between phenotypic and genetic distance matrices was observed to be very low (r=0.11). Hence, for diversity studies reliability on molecular markers is worth proving and SSR markers are the stronger tools than quantitative traits in discriminating B. juncea genotypes. Rev. Biol. Trop. 61 (4): 1919-1934. Epub 2013 December 01.
Key words: Brassica juncea, genetic diversity, quantitative traits, SSR markers.
Brassica species, commonly called as rapeseed-mustard, are the third most important oilseed crops of the world after soybean and palm. China, India, Canada, Japan and Ger-many are the major rapeseed-mustard growing countries. These are the second most impor-tant oilseed crops of India, next to soybean. India is one of the largest rapeseed-mustard growing country occupying first position with 20.23% area and second position with 11.7% share to the global production (USDA, 2012). Four oleiferous Brassica species viz. Brassica juncea, B. napus, B. rapa and B. carinata are
cultivated in about 6.39 million hectares area and produce 7.41 million tons in India (Kumar, Kumar & Kandpal, 2012). B. juncea (2n=36, AABB genome), an allopolyploid commonly called as Indian mustard, contributes more than 80% to the total rapeseed-mustard production in the country and is an important component in the oilseed sector. It is known to be more drought tolerant and shattering resistant than B. napus and B. rapa, therefore, has an enor-mous cultivation potential in semi-arid areas. With the increasing population and improving life standards, per capita oil consumption has

1920 Rev. Biol. Trop. (Int. J. Trop. Biol. ISSN-0034-7744) Vol. 61 (4): 1919-1934, December 2013
increased tremendously. To meet out the pres-ent oil requirements, there is an urgent need to increase the yield potential of B. juncea through genetic interventions.
The maximum utilization of any species for breeding and its adaptation to different environments depend on the level of genetic diversity it holds. Genetic distance among par-ents may be attributed to their differences for number of genes and their functional relations in a given environment (Nei, 1976). Evaluation of genetic divergence and relatedness among breeding materials has significant implications for the improvement of crop plants. Knowl-edge on genetic diversity in B. juncea could help breeders and geneticists to understand the structure of germplasm, predict which combi-nations would produce the best offsprings (Hu et al., 2007), and facilitate to widen the genetic basis of breeding material for selection (Qi, Yang & Zhang, 2008).
Genetic diversity among individuals or populations can be determined using morpho-logical, biochemical and molecular approaches (Mohammadi & Prasanna, 2003). Assessment of genetic diversity in B. juncea using pheno-typic characters has previously been done by many researchers (Gupta, Sekhon & Satija, 1991; Vaishnava, Sachan & Tewari, 2006; Alie, Singh, Tariq & Sharma, 2009; Singh, Arya, Chandra, Niwas & Salisbury, 2010). Isozyme loci have been used as markers in a number of genetic studies including genetic diversity in B. juncea (Kumar & Gupta, 1985; Arunacha-lam, Prabhu & Sujata, 1996). However, these parameters are influenced by environmental factors and the developmental stage of the plant. In B. juncea various marker systems have been used for assessing the genetic diver-sity. There is increasing number of reports where molecular markers like Restriction Frag-ment Length Polymorphism, (RFLP; Song, Osborn & Williams, 1988; Diers & Osborn, 1994; Hallden, Nilsson, Rading & Sall, 1994; Das Santos, Nienhuis, Skroch, Tivang & Slo-cum, 1994), Random Amplified Polymorphic DNAs, (RAPDs; Ghosh, Haque, Parvin, Akhter & Rahim, 2009; Yildirim, Yildirim, Ercisli,
Agar & Karlidag, 2010; Khan et al., 2011), Amplified Fragment Length Polymorphism, (AFLP; Sun, Zhao, Song & Chen, 2001; Guo, Zhou, Ma & Cao, 2002; Zhao et al., 2005) and microsatellites or Simple Sequence Repeats (SSRs; Abbas, Farhatullah, Marwat, Khan & Munir, 2009; Wang et al., 2009; Redden, Vardy, Edwards, Raman & Batley, 2009) have been used to study genome organization, varietal differences and diversity analysis in Brassicas. SSRs are co-dominant, highly polymorphic PCR-based markers and are expected to be very powerful in cultivar discrimination. The fairly saturated linkage map for this class of marker is available in public domains (Panjabi et al., 2008).
Among various markers available for genetic analysis in plants, molecular mark-ers are more efficient, precise and reliable in discriminating closely related species and cultivars (Mishra et al., 2011), even then, many breeding groups emphasize in morphological traits than molecular markers (Hu et al., 2007). Therefore, the present study was undertaken to estimate the genetic diversity of 44 B. juncea genotypes of diverse geographic origin and explore potential to evaluate the relationship of these genotypes based on quantitative trait data and microsatellite markers. It would be interesting to see relative efficiency of these two approaches in discriminating genotypes of B. juncea. Genetic distances will further help in identifying genetically diverse genotypes, which then can be utilized in creating valuable selectable variation.
MATERIALS AND METHODS
Plant material: Forty four B. juncea genotypes, including varieties/purelines from different agro-climatic zones of India and four genotypes of exotic origin (Australia, Poland and China) were taken for this study (Appendix 1).
Phenotypic evaluation: The present study was carried out at the Division of Genetics, Indian Agricultural Research Institute, New

1921Rev. Biol. Trop. (Int. J. Trop. Biol. ISSN-0034-7744) Vol. 61 (4): 1919-1934, December 2013
Delhi under normal field condition during winter 2010-11. Geographically, the experi-mental farm of IARI, New Delhi is situated at the altitude of 228.61m above mean sea level (28°38’23” N - 77°09’27” E). The area has a semi-arid, sub-tropical climate having mean precipitation of about 700mm most of which is received in rainy season spreading from July to September. Alluvial soils (Typic Ustochrept) which are slightly alkaline (8.25pH) with clay loam texture and low organic matter was supplemented with 60kg of nitrogen (in two splits), 40kg of phosphorus, 20kg of potash and 40kg of sulphur per hectare to raise a healthy crop. In the pre-irrigated well cultivated field with pulverised soil, sowing was done with the help of hand plough and the depth of sowing was kept at 1.5-2cm. All the 44 genotypes were grown in the field in randomized block design with three replications. Each genotype was planted in a four-row plot of three meter length with a spacing of 30x10cm (Row x Plant). The crop was given three irrigations, first at veg-etative stage, second at flower initiation, and third at seed development. The observations were recorded on 12 morphological traits viz., plant height (cm), days to maturity, point to first branch (cm), number of siliquae on main shoot, number of primary branches, number of secondary branches, main shoot length (cm), point to first siliqua (cm), siliqua length (cm), number of seeds per siliqua, seed yield per plant (g) and 1 000 seed weight (g) using stan-dard methods. The data were recorded on five random but competitive plants except for days to maturity, where it was taken on plot basis.
Molecular marker evaluation: DNA from 44 genotypes was isolated from young leaves using CTAB (Cetyl Trimethyl Ammo-nium Bromide) method as described by Murray & Thompson (1980), later modified by Doyle & Doyle (1990). After purification, DNA was quantified by analysing on 0.8% agarose gel with Hind III-cut λ DNA as standard. The con-centration of DNA in individual sample was determined based on the intensity of the bands in the λ DNA ladder. Finally it was diluted
to 20ng/µL for PCR analysis. Microsatellite markers (SSR), 143 in number, spanning A and B genome were used to study DNA polymor-phism (Appendix 2). These primers are known to express polymorphism among B. juncea genotypes. The amplification reaction was car-ried out in 10μL reaction volume containing 10X Taq buffer, 1mM MgCl2, 10mM dNTPs, 200pmole primers, one unit Taq DNA poly-merase and 20ng template DNA. PCR ampli-fication was programmed for 35 cycles after an initial denaturation cycle for five minutes at 94°C. Each cycle consisted of a denaturation step at 94°C for one minute, an annealing step at 58°C for one minute, and an extension step at 72°C for two minutes, following by extension cycle for seven minutes at 72°C in the final cycle. The amplified fragments were resolved on 2% agarose gel. Bands were scored as zero for absence and one for presence in each genotype.
Genetic distances based on phenotypic data: The phenotypic data recorded on 12 yield and yield related traits were subjected to analysis of variance (ANOVA). Using same phenotypic data, Manhattan dissimilarity coef-ficients (MD; Sokal & Michener, 1958) were calculated by pair-wise comparisons of vari-eties by using NTSYS-pc 2.02 programme (Rohlf, 1998). Based on an average linkage algorithm (UPGMA, unweighted pair group method with an arithmetic average), clustering of genotypes was done. To depict the similar-ity or dissimilarity among groups or individ-ual genotypes Principal Coordinate Analysis (PCoA; Gower, 1966) was done using DARwin 6.0 programme.
Genetic distances based on SSR analy-sis: Utilizing binary data generated by SSR primers Jaccard’s similarity coefficients (Jac-card, 1908) were calculated between genotypic pairs using NTSYS-pc 2.02 programme (Rohlf, 1998). From the similarity coefficients matrix, thus generated, the dissimilarity coefficients (JD; Genetic distances=1-similarity coefficient) were calculated. The dissimilarity coefficient

1922 Rev. Biol. Trop. (Int. J. Trop. Biol. ISSN-0034-7744) Vol. 61 (4): 1919-1934, December 2013
matrices were again subjected to PCoA to explore and establish similarity or dissimilarity among groups or individual genotypes.
Correlation between phenotypic and molecular genetic distance matrices: Simple correlation was calculated between the Jacca-rd’s and Manhattan genetic distances matrices.
RESULTS
Phenotypic analysis: In the field evalua-tion trial during winter 2010-11, a total of 44 genotypes were evaluated in RBD. The analy-sis of variance for 12 yield and yield contribut-ing traits revealed that, the genotypes taken for this investigation had significant genetic variation (Table 1). Plant height, point to first branch, number of secondary branches, point to first siliqua and number of siliquae on main shoot showed wider range for trait values. The most important agronomic trait, seed yield per plant showed a range from 5.90g to 15.59g.
Using the mean values of the 12 quantita-tive traits, Manhattan dissimilarity coefficients (MD) were calculated by pair-wise compari-sons of varieties by using NTSYS-pc 2.02 pro-gramme. Manhattan dissimilarity coefficients ranged from 0.07-0.47 with an average of 0.23.
The UPGMA based dendrogram scattered the genotypes in four different clusters (Fig. 1). The first cluster comprised of 25 genotypes from seven states of India. Pedigree analysis of these 25 genotypes revealed that Varuna and Pusa Bold, two most popular and widely adapt-ed cultivars, or their derivatives are involved in development of these genotypes. The geno-types of this cluster are characterised by good seed yield, tall plant height and medium matu-rity ranging from 120 to 145 days.
The second cluster had 11 genotypes devel-oped from HAU Hisar (Haryana), IARI New Delhi, CSAUA&T Kanpur (Uttar Pradesh), ZARS Morena (Madhya Pradesh), RAU Srig-anganar (Rajasthan) and PAU Ludhiana (Pun-jab). These genotypes are good seed yielders, late maturing (>140 days), possessing small seed size and tall to very tall plant stature. Seven genotypes fell in cluster III of which four are having exotic origin, one is a resyn-thesized B. juncea and another was developed using one of the B. juncea mutant. These genotypes are characterized by small to very small seed size and low to medium seed yields. The fourth cluster included only one genotype viz., IC 355399A which has a peculiar sili-qua orientation in bunches that puts it into a separate category.
TABLE 1Mean sum of squares, mean performance and range of 12 phenotypic traits recorded on 44 Indian mustard genotypes
Source Replications Genotypes ESS SEM CD 5% Mean Ranged.f. 2 42 86Plant height 35.17* 1056.05* 78.38 6.26 29.5 211.58 171.30-253.83Days to maturity 2.93 224.00* 0.43 0.46 2.18 141.12 112.00-161.00Point to first branch 654.21* 1306.01* 82.61 6.43 30.28 62.46 21.67-108.50No. of primary branches/plant 1.21 5.44* 0.81 0.63 2.99 5.78 3.67-9.67Secondary branches/plant 2.7 64.96* 10.01 2.24 10.54 12.9 5.33-35.33Main shoot length 159.64* 640.45* 87.55 6.62 31.18 74.58 14.00-106.50Point to first siliqua 35.32* 27.96* 11.16 2.36 11.13 7.39 2.33-21.00No. of siliquae on main shoot 37.01* 211.49* 38.6 4.39 20.7 48.29 31.67-75.67Siliqua length 0.22 0.72* 0.06 0.17 0.81 3.51 1.78-4.45No. of seeds /siliqua 0.45 4.53* 1.35 0.82 3.88 13.31 10.13-15.70Seed yield /plant 1.38 20.08* 5.52 1.66 7.83 11.96 5.90-15.591000 seed weight 0.02 2.57* 0.05 0.16 0.77 4.73 3.02-6.18
*significant at the 0.05 probability level.

1923Rev. Biol. Trop. (Int. J. Trop. Biol. ISSN-0034-7744) Vol. 61 (4): 1919-1934, December 2013
Fig.
1. D
endr
ogra
m b
ased
on
Man
hatta
n di
ssim
ilarit
y co
effic
ient
s de
mon
stra
ting
asso
ciat
ion
amon
g 44
gen
otyp
es o
f B. j
unce
a.
Varu
naPu
sa M
usta
rd 2
7RG
N 48
GM
1GM
2PB
R 97
TM 2
2JM
1
TM 4
CS 5
4Pu
sa Ja
ikisa
nVa
sund
hra
NRCD
R 02
Rohi
niPu
sa V
ijay
Pusa
Bol
d Pu
sa Ja
gann
ath
Laxm
i Pu
sa Ta
rak
Pusa
Bah
ar
RH 3
0 Ar
aval
i BP
R 54
1-4
NPJ 1
28
BPR
543-
2 RH
819
Pu
sa K
arish
ma
Vard
an
Kran
ti Sw
arn
Jyot
i RG
N 73
JM 2
Pusa
Mus
tard
21
RL 1
359
PBR
91
RLM
619
Pu
sa A
garn
i Pu
sa M
ahak
BEC
144
EC 5
9731
8 He
era
EC 5
9732
5EC
399
299
IC35
5399
AIVIIIIII
0.07
0.
14
0.21
0.
27
0.34
Man
hatt
an D
issi
mila
rity
Coe�
cien
t

1924 Rev. Biol. Trop. (Int. J. Trop. Biol. ISSN-0034-7744) Vol. 61 (4): 1919-1934, December 2013
SSR marker analysis: Among the 143 SSR primers used for polymorphism study, a total of 134 SSR were detected polymorphic with 355 amplified alleles. The average number of alleles per primer varied from one to six, while the size of the fragments ranged from 200bp to 400bp. The average percentage of polymorphism for each primer ranged from 4.34 to 37.5 per cent. Jaccard’s similarity coef-ficients based on SSR data ranged from 0.38 to 0.83 with an average of 0.58.
The UPGMA based dendrogram represent-ing genetic similarity among different acces-sions grouped the 44 genotypes into four clusters at 40% genetic distance (Fig. 2). First cluster comprised of nine varieties of which eight were developed at IARI, New Delhi. In six of these varieties, except two early maturing varieties Pusa Agrani and Pusa Tarak, Varuna is involved as one of the parents directly or through the ancestry. The ninth one, Varuna, is a very old selection from Varanasi (Uttar Pradesh) during seventies.
The cluster II had 11 genotypes which included two varieties viz., RH30 and Laxmi are from Haryana state and related by ancestry. Three double zero genotypes viz., EC 597325, EC 597318 and Heera falls adjacent to each other in this cluster. Genotypes viz., Rohini, GM 1, RGN 73 and JM 1 have Varuna as their immediate or distant ancestor, whereas, RLM 619 and JM 2 are mutants.
Sixteen genotypes fall in cluster III in which four are from Haryana, three each from Punjab and Rajasthan, two each from U.P. and Maharashtra, one from Gujarat state. The remaining genotype EC 399299 is of exotic origin, having good adaptation to the Indian conditions.
Cluster IV comprised of eight genotypes, which include bunchy type, appressed type, exotic material, somaclone and heat tolerant genotypes. These eight genotypes belong to four breeding programmes. The quality vari-eties viz., Pusa Karishma and Pusa Mustard 21, developed from IARI, New Delhi fall in cluster IV as these have been bred by using the exotic quality zero erucic acid lines ZEM-1
and ZEM-2. Another IARI bred variety Pusa Jaikisan, a somaclone variant from Varuna developed through tissue culture, also falls in the cluster IV, far away from majority of other IARI bred varieties as expected.
Principal Coordinate Analysis: To visu-alize the similarity or dissimilarity among groups or individual genotypes Principal Coordinate Analysis (PCoA) was done using DARwin 6.0 programme (Fig. 3). The PCoA analysis further confirmed the positions and grouping of genotypes. PCoA based on genetic distance matrix of phenotypic data (Fig. 3A) showed scattering of ‘Pusa’ varieties in two right hand side quadrants. The single zero cul-tivars viz., Pusa Mustard 21 and Pusa Karishma were placed in one quarter. In comparison to the grouping done by phenotypic data, the grouping of genotypes based on SSR marker data is observed to be more informative and convincing (Fig. 3B). All the IARI developed ‘Pusa’ varieties were clustered in one quadrant. The varieties viz., Pusa Karishma and Pusa Mustard 21, specifically developed for bet-ter oil quality (low erucic acid) were grouped together in other quadrant. Double zero geno-types viz., EC 597318, EC 597325 and Heera though are placed in different quadrants, in this case, but their position is much closer to each other. The PCoA based on molecular data is better in differentiating related genotypes of common origin and parentage.
Correlation between phenotypic and molecular genetic distance matrices: Sim-ple correlation between phenotypic variation, estimated by Manhattan distances using all morphological characters and SSR marker based distance matrices was low (r=0.11) and non significant. Thus, indicating that the two methods were independent in assessing genetic diversity.
DISCUSSION
The assessment of genetic diversity is not only important for crop improvement efforts

1925Rev. Biol. Trop. (Int. J. Trop. Biol. ISSN-0034-7744) Vol. 61 (4): 1919-1934, December 2013
Fig.
2. D
endr
ogra
m s
how
ing
Jacc
ard’
s di
ssim
ilarit
y pr
oduc
ed u
sing
UPG
MA
clu
ster
ana
lysi
s de
mon
stra
ting
asso
ciat
ion
amon
g 44
gen
otyp
es o
f B. j
unce
a.Varu
na,
Pusa
Jaga
nnat
h,
Pusa
Aga
rni,
Pusa
Bol
d,Pu
sa M
ahak
,Pu
sa V
ijay,
Pusa
Tar
ak,
Pusa
Bah
ar,
Pusa
Mus
tard
27
RH 3
0 La
xmi
EC 5
9732
5 H
eera
EC 5
9731
8JM
1
GM
1
JM 2
RGN
73
RLM
619
Rohi
niVa
rdan
Swar
n Jy
oti
Vasu
ndhr
aA
rava
li RH
819
RL 1
359
PBR
91PB
R 97
NRC
DR
02Kr
anti
RGN
48
GM
2
EC 3
9929
9TM
22
TM 4
CS
54
Pusa
Mus
tard
21
Pusa
Kar
ishm
a BE
C 14
4 Pu
sa Ja
ikis
an
BPR
541-
4BP
R 54
3-2
IC 3
5539
9AN
PJ 1
28
0.50
0.
58
0.67
0.
75
0.83
Jacc
ard’
s Si
mila
rity
Coe�
cien
t
IVIIIIII

1926 Rev. Biol. Trop. (Int. J. Trop. Biol. ISSN-0034-7744) Vol. 61 (4): 1919-1934, December 2013
Fig. 3. Principal Coordinates Analysis using A. genetic distance matrix based on yield and yield contributing traits and B. SSR marker based similarity coefficient matrix of 44 B. juncea genotypes.
-0.6
-0.5
-0.4
-0.3
-0.2
-0.1
0.1
0.2
0.3
0.4
0.5
0.6
0.7
0.8
0.9
-0.16 -0.14 -0.12 -0.10 -0.8 -0.6 -0.4 -0.2 0.2 0.4 0.6 0.8 0.10
Factorial Analysis: Axes 1/2
RL1359
RH819PusaMustard27
RLM619PBR91Swarnjyoti
JM2 RGN73
TM4Kranti
PusaJaikisan
IC355399AEC597318
EC597325
EC597318
RGN73PBR97
Vardan
BEC144 Heera
PusaJagannath
Laxmi AravaliRH80
PusaBold
PusaBaharCS54 NRCDR2
NPJ128PusaVijay
PusaTarak
BPRS43-2BPRS541-4JM1
VasundhraVaruna
TM22
RGN48
GM2
GM1
PusaMustard21
PusaAgarni
PusaMehak
EC399299
EC597325
0.25
0.20
0.15
0.10
0.05
-0.05
-0.10
-0.15
-0.20
-0.25 -0.20 -0.15 -0.10 -0.5 -0.5 -0.10 0.15 0.20 0.25
Factorial Analysis: Axes 1/2
RL1359
RH819
PusaMustard21PusaKrishna
PusaMustard27
RLM619 TM4
CS54
Kranti
IC355399A
RGN73
PBR97
Vardan
Rohini
Aravali
PusaBold
NRCDR2
NPJ128
PusajaiKisanPusaJagannath
PusaVijayPusaTarak
PusaMehak
PusaArgani
BPRS541-4
IM2
TM22
RGN48
GM2
GM1
EC399299
BPRS43-2
Vasundhra
JM1Heera
Varuna BEC144Swarnjyoti
RH30
Laxmi
PusaBahar

1927Rev. Biol. Trop. (Int. J. Trop. Biol. ISSN-0034-7744) Vol. 61 (4): 1919-1934, December 2013
but also for efficient management and protec-tion of germplasm resources. But these esti-mates of genetic diversity can be biased by the choice of data (Phenotypic and molecular marker). Therefore, in present study both types of data have been used to measure unbiased diversity estimation.
The material taken for this study exhibit significant genetic variation for all the 12 yield and yield contributing traits. Inclusion of four exotic collections from Poland, Australia and China along with Indian genotypes, developed from different national breeding programmes located in different regions of the country, contributed significantly to this variation. Such significant genetic variation has also been reported by Vaishnava et al. (2006), Alie et al. (2009), Singh et al. (2010) and Yadava, Sapra, Sujata, Dass & Prabhu (2009) on metric traits in B. juncea.
Manhattan dissimilarity coefficients delin-eated 44 genotypes into four clusters in this study and differentiated these genotypes pre-dominantly based on their maturity, seed yield, seed size and plant height. This method was also used by Sheikh, Banga, Banga and Najeeb (2011) to estimate genetic diversity among 24 stable introgressed progenies of B. carinata developed through interspecific hybridization between B. napus x B. carinata and B. juncea x B. carinata.
The genetic diversity study in B. juncea has been previously carried out using isozyme markers (Kumar & Gupta, 1985), morpho-logical traits (Gupta et al., 1991; Pradhan, Sodhi, Mukhopadhyay & Pental, 1993) and molecular markers (Huangfu, Song & Qiang, 2009). SSRs, being a potential marker system not much used in research and breeding of B. juncea. Limited work considering SSR mark-ers has been reported in B. juncea (Hopkins et al., 2006).
The molecular marker analysis by using 143 SSR markers successfully differentiated 44 B. juncea genotypes into four different groups. Out of the nine genotypes falling in cluster I, six were having Varuna or its derivatives as one of the parent. Similar results were reported
by Jain, Bhatia, Banga, Prakash & Lakshmi-kumaran (1994) and Srivastava, Gupta, Pental & Pradhan (2001). All the three double zero genotypes viz., EC 597325, EC 597318 and Heera falls in cluster II. Mutants and soma-clonal variants were delineated into cluster IV. This shows the effectiveness of SSR markers in identifying the close pedigree relationship in breeding material. A similar result regarding effectiveness of SSR markers in monitoring genetic diversity for yield component traits as well as quality traits have also been reported by Plieske & Struss (2001) and Charters, Robert-son, Wilkinson & Ramsay (1996), respectively. Similar types of studies using SSR markers have also been done in B. napus (Uzunova & Ecke, 1999; Batley et al., 2003; Hopkins et al., 2006). In addition to microsatellite markers, other marker systems were also used by vari-ous researchers for genetic diversity studies in Brassica spp. Malode, Shingnapure, Wagh-mare & Sutar (2010) analyzed 20 genotypes of Brassica spp. including exotic, Indian and mutants using RAPD primers and grouped the genotypes into four clusters. Similar findings have also been observed in our study with SSR markers. In the present study, a good propor-tion of polymorphic markers was detected that would be useful in identification of inter-specific hybrids as well as monitoring of genes introgression to desirable genetic backgrounds.
In comparison to PCoA based grouping done by phenotypic data, the grouping of geno-types based on SSR marker data is more infor-mative and convincing. All the IARI developed ‘Pusa’ varieties were clustered in one quadrant. The varieties specifically developed for bet-ter oil quality (low erucic acid) were grouped together in other quadrant because one of the parents of these single zero varieties has exotic origin. The genetic information based on molecular data enables the accurate grouping of genotypes sharing common lineage or geno-types developed for specific objectives. Wang et al. (2009) also used PCoA to delineate and visualise 405 individuals and 48 varieties of B. napus into four cluster.

1928 Rev. Biol. Trop. (Int. J. Trop. Biol. ISSN-0034-7744) Vol. 61 (4): 1919-1934, December 2013
The low correlation between genetic dis-tances calculated from the two approaches could be due to the fact that DNA markers reports genetic variation also in non coding regions which hardly have an effect on pheno-type. On the other hand, quantitative traits are influenced by environmental factors and their phenotype is a product of genotype x envi-ronment interaction. Plants may be morpho-logically similar, but this does not necessarily imply genetic similarity, since different genetic bases can result in similar phenotypic expres-sion (Khan, von Witzke-Ehbrecht, Maass & Becker, 2009). A large portion of variation detected by molecular markers is non-adaptive and is, therefore, not subject to either natural or artificial selection as compared with pheno-typic characters, which in addition to selection pressure are influenced by the environment (Vieira et al., 2007). It can be concluded that SSR markers, which are free from environ-mental influences, are the stronger tools than quantitative trait data in discriminating B. juncea genotypes based on pedigree and ori-gin. Information on genetic distances based on microsatellite markers shall be preferred in creating selectable genetic variation using genotypes which are genetically apart.
ACKNOWLEDGMENTS
Senior author is thankful to Indian Agri-cultural Research Institute, New Delhi for pro-viding her financial assistance in the form of fellowship and for giving best of knowledge and resources for conducting this research required for partial fulfilment of M.Sc. in Genetics.
RESUMEN
Las especies de mostaza del género Brassica repre-sentan uno de los cultivos de semillas oleaginosas más importantes en India, sin embargo, su diversidad genética es poco conocida. Para la utilización de genotipos en programas de cultivos resulta esencial un mayor conoci-miento sobre este tema. Debido a ello, se evaluó la diver-sidad genética entre 44 genotipos de mostaza de la India (Brassica juncea) incluyendo variedades y líneas puras de diferentes zonas agro-climáticas de la India y algunos
genotipos exóticos (Australia, Polonia y China). Para ello, se utilizaron marcadores SSR específicos del genoma A y B y datos fenotípicos del rendimiento de 12 cosechas y sus características. De los 143 ‘primers’ evaluados, 134 reportaron polimorfismo y un total de 355 alelos fueron amplificados. Se generaron dendrogramas a partir de los coeficientes de similitud de Jaccard y de disimilitud Man-hattan, basados en un algoritmo de vinculación promedio (UPGMA). Se utilizaron datos de marcadores genéticos y datos fenotípicos. Los genotipos se agruparon en cuatro grupos basados en las distancias genéticas. Ambos patrones de agrupamiento, tanto los basados en los coeficientes de similitud de Jaccard como los basados en los de disimilitud Manhattan, separaron independientemente los genotipos por su genealogía y origen, de una manera efectiva. El PCoA reveló que la agrupación de genotipos basada en datos de marcadores SSR, es más convincente que los datos fenotípicos, sin embargo, se observó que la correlación entre las matrices de distancia fenotípica y genética resultó muy baja (r=0.11). Por lo tanto, para estudios de diversidad basados en marcadores moleculares es necesario realizar más pruebas. Los marcadores SSR constituyen herramien-tas más eficientes para discriminar entre genotipos de B. juncea, que las características cuantitativas.
Palabras clave: Brassica juncea, diversidad genética, características cuantitativas, marcadores SSR.
REFERENCES
Abbas, S. J., Farhatullah, Marwat, K. B., Khan, I. A. & Munir, I. (2009). Molecular analysis of genetic diver-sity in Brassica species. Pakistan Journal of Botany, 41, 167-176.
Alie, F. A., Singh, T., Tariq & Sharma, P. K. (2009). Gene-tic diversity analysis in Indian mustard [Brassica juncea (l.) czern & coss]. Progressive Agriculture-An International Journal, 9, 50-53.
Arunachalam, V., Prabhu, K. V. & Sujata, V. (1996). Effi-ciency of isozyme markers in genetic differentiation of Brassica. In 2nd International Rapeseed Congress. New Delhi, India.
Batley, A. J., Vecchies, A. A., Mogg, B. R., Bond, B. J., Cogan, N. A., Hopkins, C. A., Gororo, N. C., Mar-croft, C. S., Forster, A. J., Spangenberg, A. G. & Edwards, A. D. (2003). A study of genetic diversity among Brassica napus and Brassica juncea germ-plasm collections using Simple Sequence Repeat (SSR) Molecular Markers. 13th Australian Research Assembly on Brassicas-Conference Proceedings.
Charters, Y. M., Robertson, A., Wilkinson, M. J. & Ramsay, G. (1996). PCR analysis of oilseed rape cultivars (Brassica napus L. Oleifera) using 5-anchored Sim-ple Sequence Repeat (SSR) primers. Theoretical and Applied Genetics, 92, 442-447.

1929Rev. Biol. Trop. (Int. J. Trop. Biol. ISSN-0034-7744) Vol. 61 (4): 1919-1934, December 2013
Das Santos, J. B., Nienhuis, J., Skroch, P., Tivang, J. & Slo-cum, M. K. (1994). Comparison of RAPD and RFLP genetic markers in determining genetic similarity among Brassica oleracea L. genotype. Theoretical and Applied Genetics, 87, 909-915.
Diers, B. W. & Osborn, T. C. (1994). Genetic diversity of oilseed Brassica napus germplasm based on Restric-tion Fragment Length Polymorphisms. Theoretical and Applied Genetics, 88, 662-668.
Doyle, J. J. & Doyle, J. L. (1990). Isolation of Plant DNA from fresh tissue. Focus, 12, 13-15.
Ghosh, K. K., Haque, M. E., Parvin, S., Akhter, F. &
Rahim, M. M. (2009). Genetic diversity analysis in Brassica varieties through RAPD Markers. Bangla-desh Journal of Agriculture Research, 34, 493-503.
Gower, J. C. (1966). Some distance properties of latent root and vector methods used in multivariate analysis. Biometrika, 63, 315-28.
Gupta, V. P., Sekhon, M. S. & Satija, D. R. (1991). Studies on genetic diversity, heterosis and combining ability in Indian mustard [Brassica juncea L. (Czern and Coss)]. Indian Journal of Genetics, 51, 448-453.Guo, J. X., Zhou, N. Y., Ma, R. & Cao, M. Q. (2002). Genetic diversity in Brassica rapa revealed by AFLP molecular marker. Journal of Agricultural Biotechno-logy, 10, 138-143.
Hallden, C., Nilsson, N. O., Rading, I. M. & Sall, T. (1994). Evaluation of RFLP and RAPD markers in a compa-rison of Brassica napus breeding lines. Theoretical and Applied Genetics, 88, 123-128.
Hopkins, C., Mogg, R., Gororo, N., Salisbury, P., Burton, W., Love, C., Spangenberg, G., Edwards, D. & Batley, J. (2006). An assessment of genetic diversity within and between Brassica napus and Brassica jun-cea lines from International Germplasm Collections. Proc. Joint Meeting 14th Crucifer Genetics Workshop 115 & 4th ISHS Symposium on Brassicas. Acta Hor-ticulture, 706, 115-119.
Hu, S., Yu, C., Zhao, H., Sun, G., Zhao, S., Vyvadilova, M. & Kucera, V. (2007) Genetic diversity of Brassica napus L. Germplasm from China and Europe asses-sed by some agronomically important characters. Euphytica, 154, 9-16.
Huangfu, C., Song, X. & Qiang, S. G. (2009). ISSR varia-tion within and among wild Brassica juncea popula-tions: implication forherbicide resistance evolution. Genetic Resources and Crop Evolution, 56, 913-24.
Jain, A., Bhatia, S., Banga, S. S., Prakash, S. & Lakshmiku-maran, M. (1994). Potential use of random amplified polymorphic DNA (RAPD) technique to study the genetic diversity in Indian mustard (Brassica juncea) and its relationship to heterosis. Theoritical and Applied Genetetics, 88, 116-122.
Jaccard, P. (1908). Nouvelles researches sur la distribution florale. Bulletin de la Societe Vaudoise des Sciences Naturelles, 44, 223-270.
Khan, M. A., von Witzke-Ehbrecht, S., Maass, B. L. & Becker, H. C. (2009). Relationships among different geographical groups, agromorphology, fatty acid composition and RAPD marker diversity in safflower (Carthamus tinctorius). Genetic Resources and Crop Evolution, 56, 19-30.
Khan, W. M., Munir, I., Farhatullah, Arif, M., Iqbal, A., Ali, I., Ahmad, D., Ahmad, M., Mian, A., Bakht, J., Inamullah & Swati, Z. A. (2011). Assessment of genetic diversity of Brassica juncea germplasm using Randomly Amplified Polymorphic DNA (RAPD) markers. African Journal of Biotechnology, 10, 3654-3658.
Kumar, R. & Gupta, V. P. (1985). Isozyme studies in Indian mustard (Brassica juncea L.). Theoretical and Applied Genetics, 69, 1-4.
Kumar, A., Kumar, V. & Kandpal, B. K. (2012). Production barriers and technological options for sustainable production of rapeseed mustard in India. Souviner 1st National Brassica Conference on Production barriers and technological options in oilseed Brassica orga-nized by Society for Rapeseed Mustard Research, Bharatpur, India.
Malode, S. N., Shingnapure, S. M., Waghmare, V. N. & Sutar, S. (2010). Genetic diversity analysis of some exotic, Indian and mutant Brassica sp. through RAPD markers. African Journal of Biotechnology, 9, 3981-3987.
Mishra, M. K., Suresh, N., Bhat, A. M., Suryaprakash, N., Kumar, S. S., Kumar, A. & Jayarama. (2011). Genetic molecular analysis of Coffea arabica (Rubiaceae) hybrids using SRAP markers. Revista de Biología Tropical, 59, 607-617.
Mohammadi, S. A. & Prasanna, B. M. (2003). Analysis of genetic diversity in crop plants salient statistical tools and considerations. Review & Interpretation. Crop Science, 43, 1235-1248.
Murray, M. G. & Thompson, W. F. (1980). Rapid isolation of high molecular weight plant DNA. Nucleic Acids Research, 8, 4321-4326.
Nei, M. (1976). Analysis of gene diversity in subdivided populations. Proceedings of the National Academy of Sciences USA, 70, 3321-3323.
Panjabi, P., Jagannath, A., Bisht, N. C., Padmaja, K. L., Sharma, S., Gupta, V., Pradhan, A. K. & Pental, D. (2008). Comparative mapping of Brassica juncea and Arabidopsis thaliana using Intron Polymorphism (IP) markers: Homoeologous relationships, diversi-fication and evolution of the A, B and C Brassica genomes. BMC Genomics, 9, 113-118.

1930 Rev. Biol. Trop. (Int. J. Trop. Biol. ISSN-0034-7744) Vol. 61 (4): 1919-1934, December 2013
Plieske, J. & Struss, D. (2001). Microsatellite markers for genome analysis in Brassica. I. Development in Brassica napus and abundance in Brassicaceae spe-cies. Theoretical and Applied Genetics, 102, 689-694.
Pradhan, A. K., Sodhi, Y. S., Mukhopadhyay, A. & Pental, D. (1993). Heterosis breeding in Indian mustard. Analysis of component characters contributing to heterosis for yield. Euphytica, 69, 219-229.
Qi, X., Yang, J. & Zhang, M. (2008) AFLP-based genetic diversity assessment among Chinese vegetable mus-tards (Brassica juncea (L.) Czern.) Genetic Resour-ces and Crop Evoluation, 55, 705-711.
Redden, R., Vardy, M., Edwards, D., Raman, H. & Batley, J. (2009). Genetic and morphological diversity in the Brassicas and wild relatives. In 16th Australian Research Assembly on Brassicas. Ballarat, Victoria.
Rohlf, F. J. (1998). NTSYS-pc Numerical taxonomy and multivariate analysis system, version 2.02. New York: Exeter Publication.
Sheikh, F. A., Banga, S., Banga, S. S. & Najeeb, S. (2011). Development of Ethiopian mustard (Brassica cari-nata) with broad genetic base through interspecific hybridization with elite lines of Brassica napus and Brassica juncea. Journal of Agricultural Biotechno-logy and Sustantainable Development, 3, 77-84.
Singh, D., Arya, R. K., Chandra, N., Niwas, R. & Salisbury, P. (2010). Genetic diversity studies in relation to seed yield and its component traits in Indian mustard (Brassica juncea L. Czern & Coss.). Journal of Oil-seeds Brassica, 1, 19-22.
Sokal, R. R. & Michener, C. D. (1958). A statistical method for evaluating systematic relationships. The Universi-ty of Kansas Science Bulletin, 38, 1409-1438.
Song, K. M., Osborn, T. C. & Williams, P. H. (1988). Bras-sica taxonomy based on nuclear Restriction Fragment Length Polymorphisms (RFLPs). Theoretical and Applied Genetics, 76, 593-600.
Srivastava, A., Gupta, V., Pental, D. & Pradhan, A. K. (2001) AFLP-based genetic diversity assessment amongst agronomically important natural and some newly synthesized lines of Brassica juncea. Theoreti-cal and Applied Genetics, 102, 193-199.
Sun, D. L., Zhao, Q. C., Song, W. Q. & Chen, R. Y. (2001). Relationships analysis of Chinese cabbage species by AFLP. Acta Horticulture Sinica, 28, 331-335.
USDA. (2012). United States Department of Agriculture. Retrieved from www.usda.gov/oce/forum/
Uzunova, M. I. & Ecke, W. (1999). Abundance, poly-morphism and genetic mapping of microsatellites in oilseed rape (B. napus L.). Plant Breeding, 118, 323-326.
Vaishnava, A., Sachan, J. N. & Tewari, S. K. (2006). Genetic divergence for important quantitative traits in Indian mustard (Brassica juncea (L.) Czern and Coss). Agricultural Science Digest, 26, 269-272.
Vieira, E., Carvalho, F., Bertan, I., Kopp, M., Zimmer, P., Benin, G., da Silva, J., Hartwig, I., Malone, G. & de Oliviera, A. (2007). Association between genetic dis-tances in wheat (Triticum aestivum L.) as estimated by AFLP and morphological markers. Genetics and Molecular Biology, 30, 392-399.
Wang, J., Kaur, S., Cogan, N. O. I., Dobrowolski, M. P., Salisbury, P. A., Burton, W. A., Baillie, R., Hand, M., Hopkins, C., Forster, J. W., Smith, K. F. & Span-genberg, G. (2009). Assessment of genetic diversity in Australian canola (Brassica napus L.) cultivars using SSR markers. Crop and Pasture Science, 60, 1193-1201.
Yadava, D. K., Sapra, R. L., Sujata, V., Dass, B. & Prabhu, K. V. (2009). Selection of high diversity with a mini-mal set of accessions from Indian mustard {Brassica juncea (L.) Czern & Coss.} germplasm collection. Indian Journal of Agricultural Sciences, 79, 552-554.
Yildirim, E., Yildirim, N., Ercisli, S., Agar, G. & Karli-dag, H. (2010). Genetic relationships among turnip (Brassica rapa var. rapa) genotypes. Genetics and Molecular Research, 9, 987-993.
Zhao, J. J., Wang, X. W., Deng, B., Lou, P., Wu, L., Sun, R. F., Xu, Z. Y., Vromans, J., Koornneef, M. & Bonne-ma, G. (2005). Genetic relationships within Brassica rapa as inferred from AFLP fingerprints. Theoretical and Applied Genetics, 110, 1301-1314.
1931Rev. Biol. Trop. (Int. J. Trop. Biol. ISSN-0034-7744) Vol. 61 (4): 1919-1934, December 2013
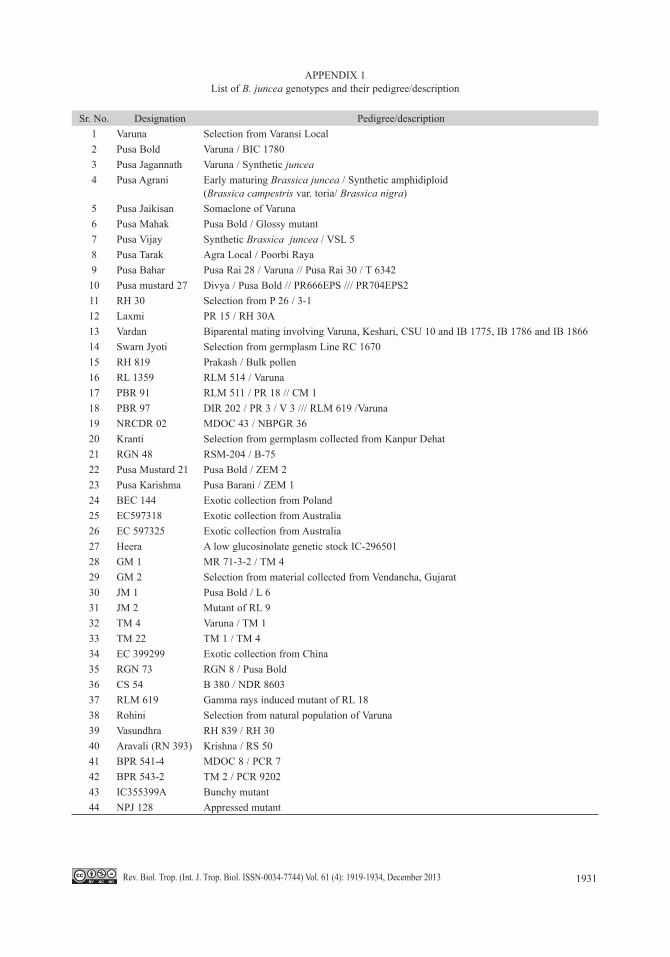
APPENDIX 1List of B. juncea genotypes and their pedigree/description
Sr. No. Designation Pedigree/description1 Varuna Selection from Varansi Local2 Pusa Bold Varuna / BIC 17803 Pusa Jagannath Varuna / Synthetic juncea4 Pusa Agrani Early maturing Brassica juncea / Synthetic amphidiploid
(Brassica campestris var. toria/ Brassica nigra)5 Pusa Jaikisan Somaclone of Varuna6 Pusa Mahak Pusa Bold / Glossy mutant7 Pusa Vijay Synthetic Brassica juncea / VSL 58 Pusa Tarak Agra Local / Poorbi Raya9 Pusa Bahar Pusa Rai 28 / Varuna // Pusa Rai 30 / T 634210 Pusa mustard 27 Divya / Pusa Bold // PR666EPS /// PR704EPS211 RH 30 Selection from P 26 / 3-112 Laxmi PR 15 / RH 30A13 Vardan Biparental mating involving Varuna, Keshari, CSU 10 and IB 1775, IB 1786 and IB 186614 Swarn Jyoti Selection from germplasm Line RC 167015 RH 819 Prakash / Bulk pollen16 RL 1359 RLM 514 / Varuna17 PBR 91 RLM 511 / PR 18 // CM 118 PBR 97 DIR 202 / PR 3 / V 3 /// RLM 619 /Varuna19 NRCDR 02 MDOC 43 / NBPGR 3620 Kranti Selection from germplasm collected from Kanpur Dehat21 RGN 48 RSM-204 / B-7522 Pusa Mustard 21 Pusa Bold / ZEM 223 Pusa Karishma Pusa Barani / ZEM 124 BEC 144 Exotic collection from Poland25 EC597318 Exotic collection from Australia26 EC 597325 Exotic collection from Australia27 Heera A low glucosinolate genetic stock IC-29650128 GM 1 MR 71-3-2 / TM 429 GM 2 Selection from material collected from Vendancha, Gujarat30 JM 1 Pusa Bold / L 631 JM 2 Mutant of RL 932 TM 4 Varuna / TM 133 TM 22 TM 1 / TM 434 EC 399299 Exotic collection from China35 RGN 73 RGN 8 / Pusa Bold36 CS 54 B 380 / NDR 860337 RLM 619 Gamma rays induced mutant of RL 1838 Rohini Selection from natural population of Varuna39 Vasundhra RH 839 / RH 3040 Aravali (RN 393) Krishna / RS 5041 BPR 541-4 MDOC 8 / PCR 742 BPR 543-2 TM 2 / PCR 920243 IC355399A Bunchy mutant44 NPJ 128 Appressed mutant

1932 Rev. Biol. Trop. (Int. J. Trop. Biol. ISSN-0034-7744) Vol. 61 (4): 1919-1934, December 2013
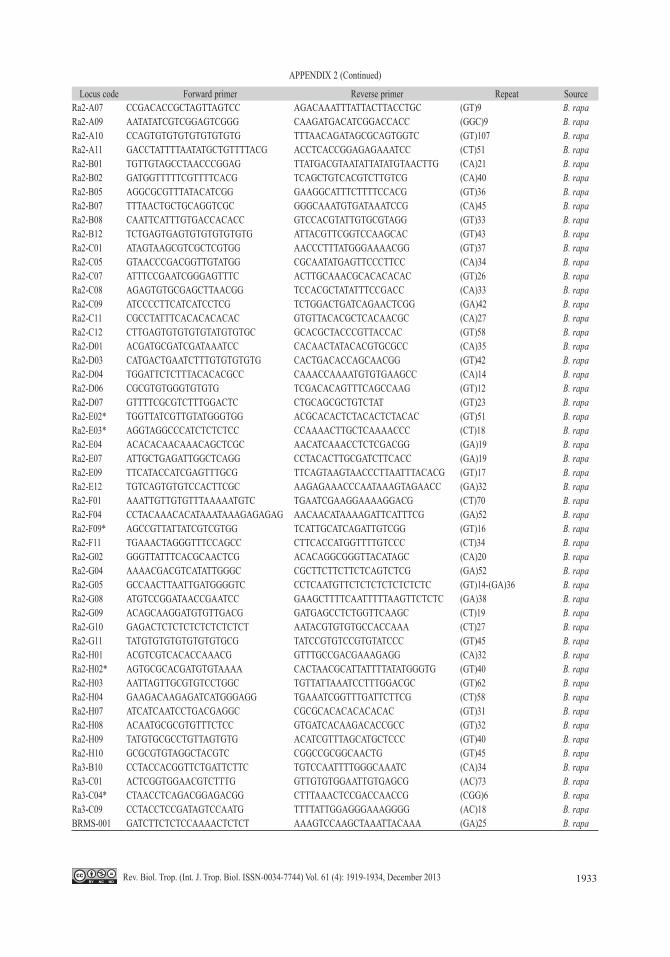
APPENDIX 2List of SSR primers used in polymorphism study
Locus code Forward primer Reverse primer Repeat SourceNa10-A08 CATGGTTAAAACAATGGCCC CAAGAAACACCATCATTTCTCA (CT)21 B. napusNa10-A09 TCTTGAGCAAAGAAACTTGG CAAACTGAGCCATACACAAAGG (GA)26 B. napusNa10-B01 CAAGTGTCTGCTAGGTGGGG TCGATCGAAGAAACCAGACC (GA)46 B. napusNa10-B04 GCGTCGAGAGAGATCGAGAG CTCACCGTCACTGCTTCATC (GA)40 B. napusNa10-B07 GCCTTAGATTAGATGGTCGCC ACTTCAGCTCCGATTTGCC (CT)29 B. napusNa10-B08* AGAGAAAAACACTTCCCGCC GTGAGCTTTGCGAAACACG (CT)38 B. napusNa10-B10 GTCGGGTTTGAGTGAGTTGG CATCGCAGATCCTTCTCTCC (GGC\/A\/T)18 B. napusNa10-B11 TTTAACAACAACCGTCACGC CTCCTCCTCCATCAATCTGC (CT)28 B. napusNa10-C01 TTTTGTCCCACTGGGTTTTC GGAAACTAGGGTTTTCCCTTC (GA)19 B. napusNa10-C03 TTGGGTGTCTTTGTTACCCC ACCGAGAAGACTGATACGGG (CT)52 B. napusNa10-C06* TGGATGAAAGCATCAACGAG ATCAATCAACACAAGCTGCG (GA)58 B. napusNa10-C08 GTTTGGTTCAGAGGCAGAGG CTATCGCTGCAGAAGAAGGG (CT)18 B. napusNa10-D03 ATGATTTGCCTTGAAATGCC GATGAAACAATAACCTGAGACACAC (GT)11 B. napusNa10-D07 CTACTTTGATGGACACTTGCC TCTGAAGTTGATTAGTCGGTCC (CA)11-(TA)5 B. napusNa10-D08 TCCATTCATTAAAATCGGCG TTCTGATCCCTTTCTCTCCC GA B. napusNa10-D09 AAGAACGTCAAGATCCTCTGC ACCACCACGGTAGTAGAGCG (GT)11 B. napusNa10-D11 GAGACATAGATGAGTGAATCTGGC CATTAGTTGTGGACGGTCGG (GA)27 B. napusNa10-E02 TCGCGCATGTAATCAAAATC TGTGACGCATCCGATCATAC (GA)24 B. napusNa10-E08 TCGGGGTTTGTTGTGAGG GAGGAGGATGCTAAGAGTGAGC (GA)42 B. napusNa10-F01 ACCCCTGTGCAGACTCTTAT GGAATCGCATAGGAGAGCAA (GT)15-(GA)70 B. napusNa10-F06 CTCTTCGGTTCGATCCTCG TTTTTAACAGGAACGGTGGC (CCG)6 B. napusNa12-A01 GCATGCTCTTGATGAACGAA GCTTCAACCTCTCAATCGCT (CT)34 B. napusNa12-B09 ACGGAAGATCAAACAGCTCC TGAGCGACCCATTCTTTAGG (GGC)6 B. napusNa12-E06A TTGGGTTGACTACTCGGTCC CCGTTGATTTGGCTAAGACC (CT)23 B. napusNa14-D07 GCATAACGTCAGCGTCAAAC CTGCGGGACACATAACTTTG (CCG)3 B. napusNi1-A04 TCCTCCTACTTTGATACTTGC ACGTCAAATACTTCACTGCC (CT)25 B. nigraNi2-A07 GGAACCCAACAAGTGAGTCC AGAGCTTGAGACACATAACACC (T)10-(GA)32 B. nigraNi2-A12* ACGATGGGTTCTTCTTGTCG CAAGAAACTTTCGAGGAACCC (CT)20 B. nigraNi2-B01 AAGGAGATTGTTTTTGGGGC AAGACTAATAAACACACGGCG GT B. nigraNi2-C01 GAGTATGAGAGATGGGAATCCG GACTGAGCAGCTTGGAGACC (GA)9 B. nigraNi2-C06 CACTGGGATACAAGCCCTTC ACAATTTGAAGTACAAAACTCTC (GA)60 B. nigraNi2-C12 ACATTCTTGGATCTTGATTCG AAAGGTCAAGTCCTTCCTTCG (GA)43 B. nigraNi2-D07 ACCAAAGCTGATCTCCAACC ACTCTTCGAATTCTTTTCC (A)11 B. nigraNi2-E10 ACTGCTTCAGCACGACCC CACATGTAAACTCTCCCACAGG (CT)24 B. nigraNi2-E12 TTATCTGCTTGTCTTGGGGC AAGGAAATCGTCTCACTTGG (CT)53 B. nigraNi2-F02 TGCAACGAAAAAGGATCAGC TGCTAATTGAGCAATAGTGATTCC (CT)2 B. nigraNi2-F11* AAAGGGTTTCAATTTCACGC GGGAAACATACTCACCACGC (GA)22 B. nigraNi2-G08 TCGACCAACAGAGAATGAAGAG TTTCCCCATGAACACATTTC (GT)10-(GA)26 B. nigraNi2-H06 CATCAGATCCGACGAAATCC TCCTTTGGACTGTGAAAAACG (CT)17 B. nigraNi3-G04B ATACTCGGGATAGGTGTGCG CATGTGGCAATCCTACATTTAC (AG)18 B. nigraNi3-H07 GCTGTGATTTTAGTGCACCG AGCCGTTGATGGAATTTTTG (CA)11-(TA)5 B. nigraNi4-A02 AGGACCACTGGGATACAAGC ATTTGGAGCTGCGTACTTCG (GA)31 B. nigraNi4-A03 ACACAGAAACATCAAACATACC GGACCGGTTTTATTTGTTCG (CT)50 B. nigraNi4-A04 ATGTGGTCTTTCCCAGTTGC CATCCTCTGCTTTAGTGGGC (GA)30-(GAA)16 B. nigraNi4-C06 CAGAGGCGAAAACGAGAGAG TTTATAGACTTCCCGTGGGC (GA)20 B. nigraNi4-E08 GATTTTGAGGAAGCGGAGG CAAAGCACTGAGAGAGAGAGAGAG (CT)47 B. nigraRa2-A01 TTCAAAGGATAAGGGCATCG TCTTCTTCTTTTGTTGTCTTCCG (GA)19 B. rapaRa2-A02 AACCTCCGACGTGTGTGTG TCATCACCACCATCACCATC (GT)36 B. rapaRa2-A04 AAAAACTCCTCTTCAACG CCCAAAGTTAGGTTTTAATGTAATCTC (GA)58 B. rapaRa2-A05 GCTAGTTTACGCGGCGG AAACGACATCGGCAAAGAAG (GGC)6 B. rapaRa2-A06 CATTATGTATGTATGTGTGTGTGTGTG TCTTGGTTGACTTCATAAACGG (GT)47 B. rapa
1933Rev. Biol. Trop. (Int. J. Trop. Biol. ISSN-0034-7744) Vol. 61 (4): 1919-1934, December 2013
APPENDIX 2 (Continued)
Locus code Forward primer Reverse primer Repeat SourceRa2-A07 CCGACACCGCTAGTTAGTCC AGACAAATTTATTACTTACCTGC (GT)9 B. rapaRa2-A09 AATATATCGTCGGAGTCGGG CAAGATGACATCGGACCACC (GGC)9 B. rapaRa2-A10 CCAGTGTGTGTGTGTGTGTG TTTAACAGATAGCGCAGTGGTC (GT)107 B. rapaRa2-A11 GACCTATTTTAATATGCTGTTTTACG ACCTCACCGGAGAGAAATCC (CT)51 B. rapaRa2-B01 TGTTGTAGCCTAACCCGGAG TTATGACGTAATATTATATGTAACTTG (CA)21 B. rapaRa2-B02 GATGGTTTTTCGTTTTCACG TCAGCTGTCACGTCTTGTCG (CA)40 B. rapaRa2-B05 AGGCGCGTTTATACATCGG GAAGGCATTTCTTTTCCACG (GT)36 B. rapaRa2-B07 TTTAACTGCTGCAGGTCGC GGGCAAATGTGATAAATCCG (CA)45 B. rapaRa2-B08 CAATTCATTTGTGACCACACC GTCCACGTATTGTGCGTAGG (GT)33 B. rapaRa2-B12 TCTGAGTGAGTGTGTGTGTGTG ATTACGTTCGGTCCAAGCAC (GT)43 B. rapaRa2-C01 ATAGTAAGCGTCGCTCGTGG AACCCTTTATGGGAAAACGG (GT)37 B. rapaRa2-C05 GTAACCCGACGGTTGTATGG CGCAATATGAGTTCCCTTCC (CA)34 B. rapaRa2-C07 ATTTCCGAATCGGGAGTTTC ACTTGCAAACGCACACACAC (GT)26 B. rapaRa2-C08 AGAGTGTGCGAGCTTAACGG TCCACGCTATATTTCCGACC (CA)33 B. rapaRa2-C09 ATCCCCTTCATCATCCTCG TCTGGACTGATCAGAACTCGG (GA)42 B. rapaRa2-C11 CGCCTATTTCACACACACAC GTGTTACACGCTCACAACGC (CA)27 B. rapaRa2-C12 CTTGAGTGTGTGTGTATGTGTGC GCACGCTACCCGTTACCAC (GT)58 B. rapaRa2-D01 ACGATGCGATCGATAAATCC CACAACTATACACGTGCGCC (CA)35 B. rapaRa2-D03 CATGACTGAATCTTTGTGTGTGTG CACTGACACCAGCAACGG (GT)42 B. rapaRa2-D04 TGGATTCTCTTTACACACGCC CAAACCAAAATGTGTGAAGCC (CA)14 B. rapaRa2-D06 CGCGTGTGGGTGTGTG TCGACACAGTTTCAGCCAAG (GT)12 B. rapaRa2-D07 GTTTTCGCGTCTTTGGACTC CTGCAGCGCTGTCTAT (GT)23 B. rapaRa2-E02* TGGTTATCGTTGTATGGGTGG ACGCACACTCTACACTCTACAC (GT)51 B. rapaRa2-E03* AGGTAGGCCCATCTCTCTCC CCAAAACTTGCTCAAAACCC (CT)18 B. rapaRa2-E04 ACACACAACAAACAGCTCGC AACATCAAACCTCTCGACGG (GA)19 B. rapaRa2-E07 ATTGCTGAGATTGGCTCAGG CCTACACTTGCGATCTTCACC (GA)19 B. rapaRa2-E09 TTCATACCATCGAGTTTGCG TTCAGTAAGTAACCCTTAATTTACACG (GT)17 B. rapaRa2-E12 TGTCAGTGTGTCCACTTCGC AAGAGAAACCCAATAAAGTAGAACC (GA)32 B. rapaRa2-F01 AAATTGTTGTGTTTAAAAATGTC TGAATCGAAGGAAAAGGACG (CT)70 B. rapaRa2-F04 CCTACAAACACATAAATAAAGAGAGAG AACAACATAAAAGATTCATTTCG (GA)52 B. rapaRa2-F09* AGCCGTTATTATCGTCGTGG TCATTGCATCAGATTGTCGG (GT)16 B. rapaRa2-F11 TGAAACTAGGGTTTCCAGCC CTTCACCATGGTTTTGTCCC (CT)34 B. rapaRa2-G02 GGGTTATTTCACGCAACTCG ACACAGGCGGGTTACATAGC (CA)20 B. rapaRa2-G04 AAAACGACGTCATATTGGGC CGCTTCTTCTTCTCAGTCTCG (GA)52 B. rapaRa2-G05 GCCAACTTAATTGATGGGGTC CCTCAATGTTCTCTCTCTCTCTCTC (GT)14-(GA)36 B. rapaRa2-G08 ATGTCCGGATAACCGAATCC GAAGCTTTTCAATTTTTAAGTTCTCTC (GA)38 B. rapaRa2-G09 ACAGCAAGGATGTGTTGACG GATGAGCCTCTGGTTCAAGC (CT)19 B. rapaRa2-G10 GAGACTCTCTCTCTCTCTCTCT AATACGTGTGTGCCACCAAA (CT)27 B. rapaRa2-G11 TATGTGTGTGTGTGTGTGCG TATCCGTGTCCGTGTATCCC (GT)45 B. rapaRa2-H01 ACGTCGTCACACCAAACG GTTTGCCGACGAAAGAGG (CA)32 B. rapaRa2-H02* AGTGCGCACGATGTGTAAAA CACTAACGCATTATTTTATATGGGTG (GT)40 B. rapaRa2-H03 AATTAGTTGCGTGTCCTGGC TGTTATTAAATCCTTTGGACGC (GT)62 B. rapaRa2-H04 GAAGACAAGAGATCATGGGAGG TGAAATCGGTTTGATTCTTCG (CT)58 B. rapaRa2-H07 ATCATCAATCCTGACGAGGC CGCGCACACACACACAC (GT)31 B. rapaRa2-H08 ACAATGCGCGTGTTTCTCC GTGATCACAAGACACCGCC (GT)32 B. rapaRa2-H09 TATGTGCGCCTGTTAGTGTG ACATCGTTTAGCATGCTCCC (GT)40 B. rapaRa2-H10 GCGCGTGTAGGCTACGTC CGGCCGCGGCAACTG (GT)45 B. rapaRa3-B10 CCTACCACGGTTCTGATTCTTC TGTCCAATTTTGGGCAAATC (CA)34 B. rapaRa3-C01 ACTCGGTGGAACGTCTTTG GTTGTGTGGAATTGTGAGCG (AC)73 B. rapaRa3-C04* CTAACCTCAGACGGAGACGG CTTTAAACTCCGACCAACCG (CGG)6 B. rapaRa3-C09 CCTACCTCCGATAGTCCAATG TTTTATTGGAGGGAAAGGGG (AC)18 B. rapaBRMS-001 GATCTTCTCTCCAAAACTCTCT AAAGTCCAAGCTAAATTACAAA (GA)25 B. rapa

1934 Rev. Biol. Trop. (Int. J. Trop. Biol. ISSN-0034-7744) Vol. 61 (4): 1919-1934, December 2013
APPENDIX 2 (Continued)
Locus code Forward primer Reverse primer Repeat SourceBRMS-049 ACGAATTGAATTGGACAGAG CAGATGGGAGTCAAGTCAAC (CT)26 B. rapaBRMS-003 GAACGCGCAACAACAAATAGTG CGCGTCACAATCGTAGAGAATC (CT)19 B. rapaBRMS-011 CCGTAAGGAATATTGAGGCA TTCCCAATTCTCAAACGGTA (GA)18 B. rapaBRMS-014 TCGCCAATAGAACCCAAAACTT CATCTCCATTGCTGCATCTGCT (TC)15 B. rapaBRMS-015 TCCCGTATCAATGGCGTAACAG CGATGCTGACATTATTGTGGCG (TG)4,(GA)20 B. rapaBRMS-016 GGAAAGGGAAGCTTCATATC CTGGAAAGCATACACTTTGG (TC)20 B. rapaBRMS-017 TGAATTGAAAGGCATAAGCA CAGCCTCCACCACTTATTCT (CA)33 B. rapaBRMS-024 GATCAAATAACGAACGGAGAGA GAGCCAAGAAAGGACCTAAGAT (GA)24 B. rapaBRMS-034 TCGGATTTGCATGTTCCTGACT CCGATACACAACCAGCCAACTC (GA)18 B. rapaBRMS-040 TGCCTCCTCTCATTTTTTCTCC TGACCGAGAGGTTCACAAGTAA (GA)49(GT)4 B. rapaBRMS-048 AACTTTGCTTCCACTGATTTTT TTGCTTAACGCTAAATCCATAT (TC)21 B. rapaBRMS-050 GATCAAGGCTACGGAGAGAGAG CGTGACGCTAGAGTAATCGAGT (AAT)4(TC)19(TTC)3 B. rapaBRMS-056 TATCGGTACTGATTCGCTCTTCAAC ATCGGTTGTTATTTGAGAGCAGATT (GA)13 B. rapaBRMS-088 TATCGGTACTGATTCGCTCTTCAAC ATCGGTTGTTATTTGAGAGCAGATT unknown B. rapaBN12A GCCGTTCTAGGGTTTGTGGGA GAGGAAGTGAGAGCGGGAAATCA unknown B. napusBN38A TGGTAACTGGTAACCGACGAAAATC ACGCTGTCTTCAGGTCCCACTC (TG)11 B. napusBRMS-006 TGGTGGCTTGAGATTAGTTC ACTCGAAGCCTAATGAAAAG (GA)34 B. rapaNa10-F07 ACAAACAAAGCCTCCCAACC TCACACAACTTGTTCAATCTTGC (GA)18 B. napusNa10-F08 AAACTTGCTTTCGAGGATGG AAACCAGTTGACTCCATCGG (GCC)5 B. napusNa12-F09 TTGCACACATACCAGATGCC ACTCGAAGAGAAGATAAGGTC (GA)48 B. napusNa10-F10 TATGTGTGTGTGTGTGTGCG TCCGTTTGATTGGGTCTCTC (GT)45 B. napusNa12-F11 CCTCACATCGTCTTCTTCATCC TCACATCAGTCCATGGTTCC (CT)20 B. napusNa12-F12 CGTTCTCACCTCCGATAAGC TCCGATGTAGAATCAGCAGC (CCG)7 B. napusNi2- B06 CTAAGTCCCCATTTATGC ACAGATCTAATGCGCTTGGG (GA)28 B. nigraNi 2-B09 ACGGAAGATCATACAGCACT TGAGCGACCCATACTATAGA (GGC)6 B. nigraNi4-B06 GGTAAGAAAATGTCTGCGCC TTGCTGCAACTTCTCATTCG (GT)9 B. nigraRa1-A04 GTTTTCCAAATTATCCCCCG TTCCCATGGTTTCTAGAGGG (CT)41 B. rapaRa1-F03 AACTCGCTTTTACCGTCGTC CAAGACGTGGAGCTGAAGTG (TCC\/GCC)18 B. rapaRa1-F09 AAAACGGATAAACGTCACCG GAACAGTCTTACACCCGATTTAG (GT)31 B. rapaRa1-G07 ATCGACATCGAACGAAAAGC TCACCCTCTACCTCCACCAC (TG)17 B. rapaRa1-H08 GTCGATGATCACGGAAGAGG CTTGACAGCTACGGTTTGTCC (AGG\/CGG)8 B. rapaRa1-H11 CGCTAATGTGTGGTGGATTG ACCGGAGCGGTTTACATAAC (GT)61 B. rapaRa2-B09 ACATTATACGAATCCTTGTCCC GTCATGACATTTCGCGAGG (CCG)7 B. rapaRa2-C03 AGACCGGTGTCATCATTATTATC CCTCTCTGCAGAACTGCTCC (TTA)6 B. rapaRa2-E01 TCTATATTAACGCGCGACGG GCACACACACACTCAAACCC (GT)32 B. rapaRa2-E11 GGAGCCAGGAGAGAAGAAGG CCCAAAACTTCCAAGAAAAGC (CT)24 B. rapaRa2-G03 ACTTGTAATGCACTCGCACG TGGAGATTATTCCGCTGTCC (GT)44 B. rapaRa2-H06 GAATTCAGAGGTATCTACACGGC TAACAAAGACCCTGCGTTCC (CA)35 B. rapaRa2-H11 ACATGGAGCTTCTCCTTTCG GCGTGCACACACACACAC (GT)34 B. rapaRa2-H12 ACAGACGCACACAGACGC ACAAATACCGGAGCATCGTC (CG)8-(CA)47 B. rapa
*monomorphic primers
Copyright © 2022 FDOKUMEN