Comparative mapping of Brassica juncea and Arabidopsis thaliana using Intron Polymorphism (IP)...
19
BioMed Central Page 1 of 19 (page number not for citation purposes) BMC Genomics Open Access Research article Comparative mapping of Brassica juncea and Arabidopsis thaliana using Intron Polymorphism (IP) markers: homoeologous relationships, diversification and evolution of the A, B and C Brassica genomes Priya Panjabi 1 , Arun Jagannath †1 , Naveen C Bisht †1,3 , K Lakshmi Padmaja †2 , Sarita Sharma †2 , Vibha Gupta 1 , Akshay K Pradhan 1,2 and Deepak Pental* 1,2 Address: 1 Centre for Genetic Manipulation of Crop Plants, University of Delhi South Campus, Benito Juarez Road, New Delhi 110021, India, 2 Department of Genetics, University of Delhi South Campus, Benito Juarez Road, New Delhi 110021, India and 3 National Institute for Plant Genome Research, Aruna Asaf Ali Marg, New Delhi 110067, India Email: Priya Panjabi - [email protected]; Arun Jagannath - [email protected]; Naveen C Bisht - [email protected]; K Lakshmi Padmaja - [email protected]; Sarita Sharma - [email protected]; Vibha Gupta - [email protected]; Akshay K Pradhan - [email protected]; Deepak Pental* - [email protected] * Corresponding author †Equal contributors Abstract Background: Extensive mapping efforts are currently underway for the establishment of comparative genomics between the model plant, Arabidopsis thaliana and various Brassica species. Most of these studies have deployed RFLP markers, the use of which is a laborious and time-consuming process. We therefore tested the efficacy of PCR-based Intron Polymorphism (IP) markers to analyze genome-wide synteny between the oilseed crop, Brassica juncea (AABB genome) and A. thaliana and analyzed the arrangement of 24 (previously described) genomic block segments in the A, B and C Brassica genomes to study the evolutionary events contributing to karyotype variations in the three diploid Brassica genomes. Results: IP markers were highly efficient and generated easily discernable polymorphisms on agarose gels. Comparative analysis of the segmental organization of the A and B genomes of B. juncea (present study) with the A and B genomes of B. napus and B. nigra respectively (described earlier), revealed a high degree of colinearity suggesting minimal macro-level changes after polyploidization. The ancestral block arrangements that remained unaltered during evolution and the karyotype rearrangements that originated in the Oleracea lineage after its divergence from Rapa lineage were identified. Genomic rearrangements leading to the gain or loss of one chromosome each between the A-B and A-C lineages were deciphered. Complete homoeology in terms of block organization was found between three linkage groups (LG) each for the A-B and A-C genomes. Based on the homoeology shared between the A, B and C genomes, a new nomenclature for the B genome LGs was assigned to establish uniformity in the international Brassica LG nomenclature code. Conclusion: IP markers were highly effective in generating comparative relationships between Arabidopsis and various Brassica species. Comparative genomics between the three Brassica lineages established the major rearrangements, translocations and fusions pivotal to karyotype diversification between the A, B and C genomes of Brassica species. The inter-relationships established between the Brassica lineages vis-à-vis Arabidopsis would facilitate the identification and isolation of candidate genes contributing to traits of agronomic value in crop Brassicas and the development of unified tools for Brassica genomics. Published: 3 March 2008 BMC Genomics 2008, 9:113 doi:10.1186/1471-2164-9-113 Received: 27 November 2007 Accepted: 3 March 2008 This article is available from: http://www.biomedcentral.com/1471-2164/9/113 © 2008 Panjabi et al; licensee BioMed Central Ltd. This is an Open Access article distributed under the terms of the Creative Commons Attribution License (http://creativecommons.org/licenses/by/2.0 ), which permits unrestricted use, distribution, and reproduction in any medium, provided the original work is properly cited.
-
Upload
independent -
Category
Documents
-
view
0 -
download
0
Transcript of Comparative mapping of Brassica juncea and Arabidopsis thaliana using Intron Polymorphism (IP)...

BioMed CentralBMC Genomics
ss
Open AcceResearch articleComparative mapping of Brassica juncea and Arabidopsis thaliana using Intron Polymorphism (IP) markers: homoeologous relationships, diversification and evolution of the A, B and C Brassica genomesPriya Panjabi1, Arun Jagannath†1, Naveen C Bisht†1,3, K Lakshmi Padmaja†2, Sarita Sharma†2, Vibha Gupta1, Akshay K Pradhan1,2 and Deepak Pental*1,2Address: 1Centre for Genetic Manipulation of Crop Plants, University of Delhi South Campus, Benito Juarez Road, New Delhi 110021, India, 2Department of Genetics, University of Delhi South Campus, Benito Juarez Road, New Delhi 110021, India and 3National Institute for Plant Genome Research, Aruna Asaf Ali Marg, New Delhi 110067, India
Email: Priya Panjabi - [email protected]; Arun Jagannath - [email protected]; Naveen C Bisht - [email protected]; K Lakshmi Padmaja - [email protected]; Sarita Sharma - [email protected]; Vibha Gupta - [email protected]; Akshay K Pradhan - [email protected]; Deepak Pental* - [email protected]
* Corresponding author †Equal contributors
AbstractBackground: Extensive mapping efforts are currently underway for the establishment of comparative genomicsbetween the model plant, Arabidopsis thaliana and various Brassica species. Most of these studies have deployed RFLPmarkers, the use of which is a laborious and time-consuming process. We therefore tested the efficacy of PCR-basedIntron Polymorphism (IP) markers to analyze genome-wide synteny between the oilseed crop, Brassica juncea (AABBgenome) and A. thaliana and analyzed the arrangement of 24 (previously described) genomic block segments in the A, Band C Brassica genomes to study the evolutionary events contributing to karyotype variations in the three diploidBrassica genomes.
Results: IP markers were highly efficient and generated easily discernable polymorphisms on agarose gels. Comparativeanalysis of the segmental organization of the A and B genomes of B. juncea (present study) with the A and B genomes ofB. napus and B. nigra respectively (described earlier), revealed a high degree of colinearity suggesting minimal macro-levelchanges after polyploidization. The ancestral block arrangements that remained unaltered during evolution and thekaryotype rearrangements that originated in the Oleracea lineage after its divergence from Rapa lineage were identified.Genomic rearrangements leading to the gain or loss of one chromosome each between the A-B and A-C lineages weredeciphered. Complete homoeology in terms of block organization was found between three linkage groups (LG) eachfor the A-B and A-C genomes. Based on the homoeology shared between the A, B and C genomes, a new nomenclaturefor the B genome LGs was assigned to establish uniformity in the international Brassica LG nomenclature code.
Conclusion: IP markers were highly effective in generating comparative relationships between Arabidopsis and variousBrassica species. Comparative genomics between the three Brassica lineages established the major rearrangements,translocations and fusions pivotal to karyotype diversification between the A, B and C genomes of Brassica species. Theinter-relationships established between the Brassica lineages vis-à-vis Arabidopsis would facilitate the identification andisolation of candidate genes contributing to traits of agronomic value in crop Brassicas and the development of unifiedtools for Brassica genomics.
Published: 3 March 2008
BMC Genomics 2008, 9:113 doi:10.1186/1471-2164-9-113
Received: 27 November 2007Accepted: 3 March 2008
This article is available from: http://www.biomedcentral.com/1471-2164/9/113
© 2008 Panjabi et al; licensee BioMed Central Ltd. This is an Open Access article distributed under the terms of the Creative Commons Attribution License (http://creativecommons.org/licenses/by/2.0), which permits unrestricted use, distribution, and reproduction in any medium, provided the original work is properly cited.
Page 1 of 19(page number not for citation purposes)

BMC Genomics 2008, 9:113 http://www.biomedcentral.com/1471-2164/9/113
BackgroundExtensive genome sequencing and genetic mapping stud-ies have been performed on members of the Brassicaceaefamily which contains the most widely studied model spe-cies, Arabidopsis thaliana (At) and many economicallyimportant vegetable and oilseed crops belonging to thegenus Brassica. An avowed goal of structural and func-tional genomics of At is to develop improved strategies forprecision breeding of crop plants related to the model spe-cies. Since the genome size of Brassica species (529–696Mb for the diploids and 1068–1284 Mb for the poly-ploids) [1] is much larger than that of At (125 Mb), thereis a high probability that novel gene interactions haveevolved in the Brassicas through the processes of sub-functionalization and/or neo-functionalization of para-logs [2-4]. Comparative mapping between At and Brassicaspecies, coupled with the base knowledge of mutation-based functional analysis in At and QTL mapping in cropBrassicas, could greatly contribute towards a better under-standing of the genetic architecture for the conserved aswell as the evolved traits of agronomic value in the Brassi-caceae.
The three diploid Brassica species, B. rapa (n = 10, AA), B.nigra (n = 8, BB) and B. oleracea (n = 9, CC) and the twoallopolyploids, B. napus (AACC) and B. juncea (AABB),have been subjected to extensive genetic mapping usingmolecular markers to identify loci associated with variousqualitative and quantitative traits of agronomic interest[5-12]. Some of the mapped quantitative traits like podsize, pod number, pod density, seed size, seed number perpod and oil content are of great importance in improvingthe yield of the oilseed Brassica species [11,13,14].
Recent attempts to develop a unified comparative genom-ics system in the Brassicaceae has recognized the existenceof 24 conserved genomic blocks [15] which is an exten-sion of 21 syntenic blocks identified in B. napus in an ear-lier study [16]. Comparative mapping studies betweenmembers of family Brassicaceae [16-20], At and Arabidop-sis lyrata [21], At and Capsella rubella [22] and the identifi-cation of an ancestral karyotype (AK) [23] have alsostimulated interest in the evolutionary processes involvedin the diversification of different lineages in the Brassi-caceae and variations in chromosome number of differentspecies vis-à-vis their ploidy status. Most of the earlierstudies on comparative mapping in Brassica species[16,18-20,24] have relied on the use of RFLP markers.However, the deployment of RFLP markers in large segre-gating populations is a rather cumbersome and laboriousprocess. In recent years, several studies have highlightedthe immense potential of polymorphisms in intronsequences for the development of markers for geneticmapping [25-27].
In the present study, we have successfully used PCR-basedIntron Polymorphism (IP) markers for the developmentof a comparative map between B. juncea, related Brassicaspecies (B. napus and B. nigra) and At. We also analyzedthe segmental structure of the A and B genomes of B. jun-cea in terms of the 24 genomic blocks (A-X) proposed ear-lier [15]. We compared colinearity of the B. juncea and Atgenomes and also analyzed synteny between the A, B andC genomes of the Brassica species. Additionally, homoeol-ogous linkage groups of the three genomes were identi-fied. On the basis of homoeology among the threegenomes, we propose a re-designation of the B genomelinkage groups assigned earlier for B. nigra [18] and B. jun-cea [11]. The comparative map between B. juncea and Atdeveloped in this study, in conjunction with the extensiveinformation available from functional genomics studiesof the At genome, will greatly facilitate the identificationof candidate genes and novel gene interactions responsi-ble for the domestication and evolution of the yield influ-encing traits in B. juncea and other crop Brassicas.
ResultsComparative map of B. juncea and Arabidopsis thaliana (At) using Intron Polymorphism (IP) markersSingle copy genes from Arabidopsis (At) [28], physicallylocated at an approximate distance of 100–200 kb, wereused to design PCR primers spanning intronic sequences.In cases where large genomic regions were devoid of sin-gle copy genes, primers were designed from multiple copygenes. Primers for PCR amplification were designed fromexon sequences which showed strong nucleotide conser-vation between At and the corresponding EST or GSSsequences described for any Brassica species [29].
Of the 1180 primer pairs thus designed, 383 (32%)showed polymorphism between the B. juncea lines, Heeraand Varuna, parents of the DH mapping population usedin this study and in the earlier mapping studies on B. jun-cea [11,30]. Genotyping using the 383 polymorphicprimer pairs (for primer sequences see Additional file 1)generated 486 loci in B. juncea of which 67% were scoredas co-dominant markers and the remaining 33% werescored as dominant markers. These 486 loci were incorpo-rated into the framework map developed by Pradhan et al.[30]. Additionally 34 RFLP markers placed earlier on theB. juncea map [11] were assigned corresponding At loci bysubjecting the available sequence data to NCBI BLASTNsearch and identifying the most significant BLASTN hit asthe source At gene. A linkage map of B. juncea consistingof 533 At loci (486 IP, 34 RFLP and 13 gene markers) andcovering a total genetic length of 1992.2 cM is shown inFigure 1, 2, 3, 4, 5. The ten A genome linkage groups (LGs)of the B. juncea map were designated A1–A10 and corre-spond to the N1–N10 linkage groups of B. napus [16]. Theremaining eight B genome LGs were designated B1–B8
Page 2 of 19(page number not for citation purposes)

BMC Genomics 2008, 9:113 http://www.biomedcentral.com/1471-2164/9/113
Page 3 of 19(page number not for citation purposes)
Genetic map of B. juncea showing three linkage groups of the A genome (A1, A2 and A3)Figure 1Genetic map of B. juncea showing three linkage groups of the A genome (A1, A2 and A3). The corresponding nomenclature fol-lowed earlier in B. juncea (J1–J3) [11] and B. napus (N1–N3) [16] is given in parentheses. Each genetic locus bears the name of the At (A. thaliana) gene and the colour code of the At chromosome from which it is derived. At loci in italics represent the RFLP probes mapped earlier [11]. Loci marked with an asterisk (*) are derived from multicopy At genes [28]. Loci in black rep-resent markers of the framework map [11]. The organization of the B. juncea LGs based on the genomic blocks identified by Schranz et al. [15]has been represented on the left of each linkage group. The genomic blocks have been coloured differently based on the five At chromosomes from which they originate. Single copy At loci from different blocks mapped as unique insertions are shown in lower case on the right of each genomic block.
A2 (J2/N2)
p58m71h1540.0
At5g05920b2.4
At5g08280a6.9At5g08660*7.7At5g1164010.3
At5g1229012.2
At5g13190a12.9
At5g16260 p65m47v155v15.2
At1g6706020.6At5g1915023.4e46t65h72327.2At5g5765530.0
At4g26840*b At5g5392032.8
At5g5298034.5
p62t78v278v36.7At1g67170*b38.2At1g6755040.2At1g68310*c41.7
At1g69390 At1g7035044.2
At1g72890* At1g72740*
At1g72380a45.7
p48t94v336vAt1g7309046.5At1g73030*47.2At1g74640a48.5
At4g0283053.3
At4g02425b54.6
At4g12600*55.1
At4g11790c55.8At4g14570c56.6At5g4703057.5
At2g01640 ec2c1258.4
At2g0140059.1
p80m48v27066.6
At5g27740*b p33t83h17175.3GE-R183.0e34m43h33587.6At5g6352088.2
At5g6197090.6
K
E
Q
X
R
W
d
VO/P
A1(J1/N1)
At4g39350*a0.0
At4g39010* At4g38470*2.9
At4g396903.7
At4g375106.4At4g37280*a7.1ec4f110.3
e62m33v76512.7
At4g34140b21.6
At2g24765*b31.0
e45t66v71433.9
p53m33v16737.6
At4g31720b42.1
p87m38v91161.7At4g23100b65.6e62t75v282h70.5
At2g38090*71.8
At1g5452073.9
At4g1684074.5
At4g15730*75.9At3g51610 At4g15520a
At4g1579077.4
At3g48540bAt1g58220*b
At1g57680b79.8
At3g44880* ec5a180.5
At3g2224084.7At5g45310 At3g2032086.4At3g1676089.5
At3g44735a92.1
e47t74v450h93.7
e42m32h125h99.9
At2g23930*b104.6At3g11150105.3At3g08690*a109.0At3g05280*a111.4
p65m32v312h115.0
At3g02420a117.7
At3g01060118.7wg1h4b120.2e44m50h360128.5At3g07950130.7
e46m59h255134.4
M,N
U
T
F
c
v
d
At C1
At C2
At C3
At C4
At C5
At5g06240b0.0e34m62h2909.2
At5g1523018.5
R7126.2
At3g46180* At1g55860*b30.3A1 At2g36930a35.9At2g31490b41.1At2g36530*b At2g3630543.3
At2g39910 At2g40765c44.9
At2g4278048.1
p40m82v93549.4
At2g45690a At1g14620b50.6At2g25740*a53.6At2g26590b At2g26990*54.1
At2g2339054.9
At5g5032055.8
At2g23090b58.7
e62m32h17060.0At4g02980 GA-R163.9At4g01897a65.6
p33m32h332At3g04460
At3g03960*69.9
At3g0495070.8
wg7a1177.9At3g10572b79.6At3g15120*84.4
At3g16640* At2g34050
At3g17300a At3g15190c85.2
At3g2140087.9
p45m43v25090.6At3g54670*b93.3At2g05990 At5g35320
At2g0575595.1
At2g12462* At2g1404596.0
At2g12400*97.7
GE-R4100.5
At1g74640b102.4At3g52300 At3g51800*
At3g51260*c At4g15520b104.8
At4g17900*a At4g16060b
At4g16400b107.3
At4g23100a At4g19490
At4g21400*109.4
At4g20150b At4g18400110.3At4g21105111.5
At4g24440114.6
At4g17050a115.2
At4g28830 At4g28025119.6
At4g30790b At2g19110*122.0At4g35000* At4g36960*b
At4g35530 At4g35905
At2g14860* At4g30310
p61m57v318
123.0
At4g26240b125.1
At4g00585b128.4e32t70v718130.5
A3 (J3/N3)
G-H
R
J
I
O
F
N
T
U
s
j
a
w
e

BMC Genomics 2008, 9:113 http://www.biomedcentral.com/1471-2164/9/113
Page 4 of 19(page number not for citation purposes)
Genetic map of B. juncea showing five linkage groups of the A genome (A4, A5, A6, A7 and A8)Figure 2Genetic map of B. juncea showing five linkage groups of the A genome (A4, A5, A6, A7 and A8). The corresponding nomencla-ture followed earlier in B. juncea (J4–J8) [11] and B. napus (N4–N8) [16] is given in parentheses. Each genetic locus bears the name of the At (A. thaliana) gene and the colour code of the At chromosome from which it is derived. At loci in italics repre-sent the RFLP probes mapped earlier [11]. Loci marked with an asterisk (*) are derived from multicopy At genes [28]. Loci in black represent markers of the framework map [11]. The organization of the B. juncea LGs based on the genomic blocks iden-tified by Schranz et al. [15] has been represented on the left of each linkage group. The genomic blocks have been coloured dif-ferently based on the five At chromosomes from which they originate. Single copy At loci from different blocks mapped as unique insertions are shown in lower case on the right of each genomic block.
N
S
I
J
e
T
At3g63420*b0.0At3g546502.6p62m59h197 At3g58500*aAt3g55440*b
5.4
At4g13940*bAt5g374807.1At5g376308.0At5g378508.8At2g21150 At5g4156011.6At2g22000aAt5g36880*13.1At2g2264014.1At2g24765*a16.7At2g25737* p53m47h28518.3At2g28880*b23.7e47m43h330 At1g6998026.9At2g31490a31.0At2g07440*bAt2g3252033.8e31m58v10137.9At2g3579040.7GE-R341.6At2g36530*c43.4At2g37040*44.5At2g37150*45.0
At2g40765bAt2g40690*54.6At2g4204057.2
p63t78v40062.8wg1h4a63.6
At2g4452075.7
A4 (J4/N4) A5 (J5/N5)
At2g463900.0wg6d7a1.4
At2g44970 p48t94h42013.1
e43m59h9923.6At2g3020028.1At2g3041028.8At2g29980*a31.0
e34m62v157At5g36230*34.0At1g31812a35.3At1g36380 At1g36980
At3g21865At1g02410bAt1g51740b At1g35460*
36.4
At1g55860*a40.2At4g14570a40.8e48m32h24445.0At3g1631049.0e62m35h19055.4At3g12120*a56.4
At2g23930*a63.6
At3g0992568.6At3g09220*70.9p32t77h31072.9
e50t66v47086.4
e35t63v24093.6
F
J
B/Cf
t
At1g49340*a0.0
At1g51740a e39m55h2154.3At1g505758.0At1g50030*8.9
e58t75h177At1g4858014.3
At1g12840a24.2At5g16680*27.4At1g1223030.5
At1g16900*35.4At1g1768037.1
At1g19850*42.9
At5g22030*48.4At5g23610* At5g2409049.3At5g27740*a50.6
At3g27340 e34m50h330At3g2710060.0
At3g26370*62.4
At2g0387067.4R81At2g02760*69.7At2g01850*71.0At2g0135074.9
At5g47040*81.4At5g45610 e31m60v40084.0
e47t70h124v90.9
A6 (J6/N6)
A
C
Q
L
K
V
B
A7 (J7/N7)
At2g15430b*0.0
At2g19560At2g184101.2
At2g180401.7
At2g16860 At2g19450b2.3At2g06510*At2g18900*3.5At2g04235At3g24800
At3g243155.6
At1g23440*12.7
At1g21090 e39m32h15314.1
At3g50230*17.8At2g27730At2g2749020.3At2g28880*a p40m82h17423.6
At3g53190*a wg2a1131.6At3g55005*c34.8
At3g5629035.5
At1g79950*41.7At1g79040 e44m50h40043.5
p62t78v21150.7At1g67170*a53.6
At1g68310*a55.7
p53m42h15361.9
ec5a673.5
E
N
I
B
H
G f
f
At4g31720a0.0At1g29580* p65t90v2587.1At1g502408.8At1g35680* At4g33380At1g31812b At1g31910
9.7
At4g1651011.4At4g15802 At4g14570b12.1At4g17900*b At4g15510At4g16400a At4g15910b
12.8
At4g0493015.6At4g34520*a17.2e32t66h14217.8At4g3146020.3At4g26840*a At4g2820024.5At4g25140*a26.8e48m34h18229.0At1g28560b34.3At4g38570* At1g28530b35.1At1g2431039.9p62m39v12440.5At1g25540* At1g14610*
At1g26850*43.8
At1g23180a44.8At1g19630* At1g18340a48.7At1g1806049.4At1g11880b56.6e39t74h76059.1At1g1124060.6At1g03180b67.8p48t87v29569.8
A8 (J8/N8)
A
B
U
T
B/C
u
At C1
At C2
At C3
At C4
At C5

BMC Genomics 2008, 9:113 http://www.biomedcentral.com/1471-2164/9/113
Page 5 of 19(page number not for citation purposes)
Genetic map of B. juncea showing two linkage groups of the A genome (A9 and A10)Figure 3Genetic map of B. juncea showing two linkage groups of the A genome (A9 and A10). The corresponding nomenclature fol-lowed earlier in B. juncea (J9 and J10) [11] and B. napus (N9 and N10) [16] is given in parentheses. Each genetic locus bears the name of the At (A. thaliana) gene and the colour code of the At chromosome from which it is derived. At loci in italics repre-sent the RFLP probes mapped earlier [11]. Loci marked with an asterisk (*) are derived from multicopy At genes [28]. Loci in black represent markers of the framework map [11]. The organization of the B. juncea LGs based on the genomic blocks iden-tified by Schranz et al. [15] has been represented on the left of each linkage group. The genomic blocks have been coloured dif-ferently based on the five At chromosomes from which they originate. Single copy At loci from different blocks mapped as unique insertions are shown in lower case on the right of each genomic block.
GSl-odd0.0
GA-R28.4
At4g0258010.8
At4g03150a11.4
At5g27560 At2g07440*a17.2At5g24490a21.3e34m43h36023.9e31m60h44029.4
At5g6390530.1
At5g67590 e58m44v20237.8
At2g14170*a42.7At2g14170*b At2g14250*44.4At2g16660*45.5At2g17420*47.9
p33t83v19748.7
At1g29990b51.2
At2g1926053.3
At2g19450a 54.6At1g6398057.6At2G20320*b59.5
e50t66v25161.7
At3g4656066.5
At1g6264067.9
At5g43430 At5g42800*
At5g4232073.7
At2g03060*76.7
At4g10100 At4g1259077.8
At4g10090 At4g06676
At1g31812c At3g44735b
At1g33980 At1g33265
78.4
At1g29990a79.0At1g28100 e48m39v77379.6At4g09060*81.2
At1g2738582.1
At4g09760*83.2
At1g34350 At1g2286087.0At4g05530* At4g11790b90.2At3g51260*a91.1p58m71v95295.8
At3g55430*a99.2
At3g54670*101.5
At3g59490103.5
e34m62v390h 106.7At3g58500*b107.4At3g62620113.1
e34m43v310At2g26350
At3g43520*113.9
At2g25740*b118.4
p53m47h350121.1At2g20760*b122.8At2g20490b126.8
e46m59v304131.1
At1g11880a134.1
At2g22370139.5
At1g07210141.7e48t78h132At1g07980142.3At1g05205144.2
At1g03687150.1
p48t94h261At1g01290150.8
A9 (J9/N9)
p
A
I
H
N
P
B
V
D
H
X
Q
O
i
b
d
m
e34m43h1190.0At1g028700.7
At1g04950*5.9
e50m32h8410.8
At5g59140b14.2
At5g20250*19.9p53m70v12621.5
At5g15400a35.2At5g14920* e34t74v69936.9At5g13190b40.0
At5g1196044.3p58m35v18046.2
At5g09310c At5g08280c52.6
p48m67v15055.9
At5g06240a59.5At5g05920a62.0
ec5a765.9
At5g0116071.3p62m66v93172.5
A10 (J10/N10)
A
W
R
At C1
At C2
At C3
At C4
At C5
BMC Genomics 2008, 9:113 http://www.biomedcentral.com/1471-2164/9/113
Page 6 of 19(page number not for citation purposes)
Genetic map of B. juncea showing five linkage groups of the B genome (B1, B2, B3, B4 and B5)Figure 4Genetic map of B. juncea showing five linkage groups of the B genome (B1, B2, B3, B4 and B5). The corresponding nomencla-ture followed earlier for the B genome of B. juncea (with a prefix J) [11] and B. nigra (with a prefix G) [18] is given in parenthe-ses. This new nomenclature for the B genome linkage groups has been designated based on the comparative homoeology discerned between the A, B and C genomes in this study. Each genetic locus bears the name of the At (A. thaliana) gene and the colour code of the At chromosome from which it is derived. At loci in italics represent the RFLP probes mapped earlier [11]. Loci marked with an asterisk (*) are derived from multicopy At genes [28]. Loci in black represent markers of the framework map [11]. The organization of the B. juncea LGs based on the genomic blocks identified by Schranz et al. [15] has been repre-sented on the left of each linkage group. The genomic blocks have been coloured differently based on the five At chromosomes from which they originate. Single copy At loci from different blocks mapped as unique insertions are shown in lower case on the right of each genomic block.
e34t74h7190.0
At3g064838.8p58m39h4059.9At1g03910 At3g1312013.2
e45t66v716At3g10572a19.1
At3g17300b At3g15190b26.9e44m38v420At3g18600*27.9
At3g2092030.1
e34m47h10535.1
At5g47890 e47m38h13044.6At5g28750b46.4At5g2783047.2At5g2508048.0At5g6629051.2At1g57680a53.9At1g58220*a55.3e44m39h13156.7At3g2398061.6e35t63v14465.3p53m42h18869.8
At3g14850*74.3
At3g12260b84.9p33m32h14885.7
At3g09050 At3g08690b*90.7
e58m40h8595.6
At3g13062*109.4
B1 (J17/G7)
x
F
F
D
Qv
a
Ni3-C050.0
e62t65h1478.8At1g7598010.5
e62t65h44216.0
Ni4-G1027.5
At1g68310*b35.2e45m34v19236.6
At4g11790a46.5Ni2-A1249.0At3g48100*50.0At3g48540a51.1
GA-N1At4g02425a51.6At5g1963054.6e31m62v19956.8At5g2107059.2At4g17050b63.5e51t78h33566.5At4g1874068.0At4g24680 At4g15910a69.3At5g10460 At4g18150*At4g20410 At3g45100At4g23860 At4g19400At4g21720b At4g16180
At5g07910*At4g16280*
69.8
Na14-G06b75.3At4g2749079.4
e34m47h309At4g2966083.0At4g30790a88.0At4g30950*88.9At4g3113089.7p33t65v19992.3
p64t66h390At4g33140At4g3310097.4
At4g33925100.0At4g34140a103.5At4g34412105.3At4g34700b e34m62v219106.1At4g36960*a At4g37280*be31m50h174115.7
At4g39350*b120.7e35t69h736125.9
B2 (J15/G5)
U
R
M
E
rm
o
p
e47m43h2580.0
At3g54670*a14.6At3g55005*a e31m47v235h15.6At3g5413017.3
e55t63h137h22.2
At4g0419029.8e34m43v140h32.6At3g4761036.1At3g45620*37.4At3g4361038.8At4g03150b40.5e46m59v40242.0At4g00585a44.5At4g0131047.3p53m48v22748.3At4g01897b50.9At4g1093055.9At2g26590a At4g1018058.8At4g1005059.6e31m61v23561.2At2g3486062.9At1g14620a At2g43360At2g44050
68.1
p33m67v370At2g40765a70.7At2g4153073.2At2g45690b At2g36530*a78.3e50t70v23882.5At2g0734088.5At3g47370*90.0e44m50h29893.1At4g09820*93.7At4g07666b94.2At5g59140a99.8e31m42h150103.6At5g17410*108.3At5g17840108.8At5g15750110.1p87t77v400113.3At5g13480*113.8At5g13030115.0
p65t71h400125.3At5g09310a126.9At5g01220 At5g02120p53t82h195
131.8
B3 (J18/G8)
N
M
O
P
J
W
R
o
i
a
g
p
m
e31m60v1710.0At1g804601.0At4g137202.7At4g14110 At4g13940*a4.1At3g52990*8.6
e31m47v96At3g55430*bAt3g55440*a12.7
At3g63420*a20.9
At3g53190*b26.5At3g55005*b27.6
e49m35h803At3g57650*31.2
p48t67h42043.7
p33t65h27554.6
At2g21620b58.5
e31m50v95At1g1674063.5At1g1537065.9
At2g3208071.9p32m66v12773.2
e44m39v340v82.5At5g6522083.2
At5g63760*90.2
p53t76h342*v97.2
e51t78v71At1g47570105.9At2g38130*109.9At2g37560111.6
e47m33v212120.4
At2g36930b124.9
wg6d7b133.7
c
T
N
i
A
J
E
X
B4 (J16/G6)
p87m38v9120.0
At3g02860 At3g02420b5.7
e48m34v83813.5
At3g12260a21.3At3g12120*b22.2
At3g15190a28.3
p58t68v30436.1
e60t65h39042.6
e48m34v83749.9At2g29980*b54.3e55t73h21557.4At2g31490c58.1
At2g33400*63.1p61m44h14564.8
At1g78560*b71.1
e62m33h10774.5
J
F
B5 (J11/G1)
At C1
At C2
At C3
At C4
At C5

BMC Genomics 2008, 9:113 http://www.biomedcentral.com/1471-2164/9/113
Page 7 of 19(page number not for citation purposes)
Genetic map of B. juncea showing three linkage groups of the B genome (B6, B7 and B8)Figure 5Genetic map of B. juncea showing three linkage groups of the B genome (B6, B7 and B8). The corresponding nomenclature fol-lowed earlier for the B genome of B. juncea (with a prefix J) [11] and B. nigra (with a prefix G) [18] is given in parentheses. This new nomenclature for the B genome linkage groups has been designated based on the comparative homoeology discerned between the A, B and C genomes in this study. Each genetic locus bears the name of the At (A. thaliana) gene and the colour code of the At chromosome from which it is derived. At loci in italics represent the RFLP probes mapped earlier [11]. Loci marked with an asterisk (*) are derived from multicopy At genes [28]. Loci in black represent markers of the framework map [11]. The organization of the B. juncea LGs based on the genomic blocks identified by Schranz et al. [15] has been represented on the left of each linkage group. The genomic blocks have been coloured differently based on the five At chromosomes from which they originate. Single copy At loci from different blocks mapped as unique insertions are shown in lower case on the right of each genomic block.
GE-N10.0
e31m62h28811.3
At2g01940*19.4e31m49v9420.0At5g5475023.4At1g6043026.6At1g6178028.3
e62m33h24133.6At2g20490a34.2
At1g1084041.7At1g12840b e34m50v205At2g1529042.5
At2g15430*a43.8p53t91h25252.6At1g18340b54.5GP-N255.5At1g18270*56.1At1g1924056.9p62t78v26560.9At1g2041063.4e55t63v22469.1
p48t67v37080.2
At1g49340*b89.3
B6 (J14/G4)
C
B
A
D
K
w
h
h
B7 (J13/G3)
At1g02410a0.0At1g05850*2.4At1g03330 e31m50v273At1g03180a3.4
At1g05055 At1g05720a4.3At1g087807.3At1g0976010.0p62m59h40011.8
e47m43v84621.9
p64m32v32838.3At1g28530a At1g28560a39.8
At1g2618044.5e50m39h15846.7At1g23180b48.0
At4g34520*b At4g34700a54.6
At1g02090b58.9At4g20150a62.3p62t78h18564.3
GP-N171.7
e50m32h20975.7
At1g02090a83.4At1g01910*85.2e46t65v70885.9
At1g73530*93.2At1g7186593.9At1g70610*95.7
p79t78v127At1g6866097.4At1g67170*a102.0At1g67280* At1g79150102.9
p32m66v270108.0
At1g72380b111.1
e39m55h163*v118.5
At1g78560*a121.6
At2g20320*a125.5
a
B
E
A
U
A
H
e50m32v292At1g05720b0.0
p33t66v20016.1
At4g15520c23.5p53t82v36027.5At2g07690*29.1At2g1771032.6At2g20760*a33.6At2g22000b36.3At2g21620a37.7At2g23090a38.8e39t74v73340.6At5g5873043.9
e35t63h280At5g2264047.3
At5g1820057.7
At5g15400b64.7p64m32h25865.8
At5g09310b76.5p53m42v13977.2At5g10070 At5g08280b77.7
At5g0492083.6p62m59v465At5g0377085.1
p33m38v26099.7At4g21720a103.8At5g28750a104.7At5g49510 At4g20150cAt4g19140
105.2
At4g18230 e44m39v89106.0At4g16060a106.6At4g15530107.2At3g51260*b111.6At3g51010112.8p48m67h295117.1GE-N2119.0At4g07666a120.4At5g24314 At5g24490b122.6e62m32v179126.5At5g27380128.9At4g25140*b137.6At4g26240a e44m50h105139.5
p63t78h267149.8
B8 (J12/G2)
A
t
G
H
I
W
R
q/w
pU
Q
N
At C1
At C2
At C3
At C4
At C5

BMC Genomics 2008, 9:113 http://www.biomedcentral.com/1471-2164/9/113
based on homoeology between the A, B and C genomes asdetermined in the present study. The corresponding link-age group nomenclature proposed earlier for the B. nigragenome (G1–G8) [18] and the B genome of B. juncea(J11–J18) [11] is also given in parentheses in Figure 4, 5and Table 1.
The 533 At loci mapped with variable frequencies to allthe 18 linkage groups of B. juncea (Table 1). Linkagegroup A3 contained the highest number of markers (66)while B5 had the least with only 9 markers. Overall, 63%of the markers mapped to the A genome (A1–A10) at anaverage marker density of 0.34 and average marker inter-val of 2.9 cM (Table 1). The B genome (B1–B8) containedthe remaining 37% of the markers with a marker densityof 0.24 at an average marker interval of 4.7 cM, indicatingthat there is less polymorphism in the B genome as com-pared to the A genome in the intronic regions. As a resulta number of unmapped islands were found in the Bgenome (an island is defined as a region with a gap of ≥20 cM between adjacent markers) (Table 1).
An uneven distribution of At loci originating from eachArabidopsis chromosome was observed in the genome of
B. juncea. Among the 10 LGs of the A genome (A1–A10),all the linkage groups except A2, A6, A7, A8 and A10 con-tained At loci from each of the five Arabidopsis chromo-somes (At C1–At C5). A2 and A6 were devoid of loci fromAt C3 and At C4 respectively. A7 did not contain any locusfrom At C4 and At C5. The linkage group A8 was com-posed of markers from At C1 and At C4 while A10 wascomposed of markers from At C1 and At C5 (Table 1).Linkage group A9 was found to be the most chimeric link-age group consisting of 12 genomic blocks followed by A3with 10 blocks. Linkage group A10 was least chimeric withonly 3 blocks followed by A5 with 4 blocks and A1 and A4with 5 blocks each. The simplest genomic organizationwas observed in linkage groups A1 (primarily consistingof At C3 and At C4 loci), A4 (composed primarily of At C2and At C3 loci), A8 (composed of At C1 and At C4 loci)and A10 (composed of At C1 and At C5 loci). Uneven dis-tribution of the At loci was also observed in the B genome(B1–B8) of B. juncea of which linkage groups B3, B4 andB8 contained loci derived from all the five chromosomesof Arabidopsis (Table 1).
The organization of the B. juncea linkage map with respectto the At genome was also studied on the basis of the dis-
Table 1: Characteristics of B. juncea map based on the distribution of 533 At loci derived from the five chromosomes of Arabidopsis thaliana
At Chromosome Total markers Length in cM Marker density (marker/cM)
No. of gaps (>20 cM distance)
C1 C2 C3 C4 C5
A genomeA1 (J1/N1) 3 3 13 13 1 33 134.4 0.25 1A2 (J2/N2) 12 2 0 6 15 35 90.6 0.39 0A3 (J3/N3) 3 21 14 24 4 66 130.5 0.51 0A4 (J4/N4) 1 17 4 1 5 28 75.7 0.37 0A5 (J5/N5) 7 6 5 1 1 20 93.6 0.21 1A6 (J6/N6) 10 4 3 0 7 24 90.9 0.26 0A7 (J7/N7) 6 12 6 0 0 24 73.5 0.33 0A8 (J8/N8) 18 0 0 16 0 34 69.8 0.49 0A9 (J9/N9) 17 15 9 10 7 58 150.8 0.38 0
A10 (J10/N10) 2 0 0 0 11 13 72.5 0.18 0Total 79 80 54 71 51 335 982.3 2
B genomeB1 (J17/G7) 3 0 13 0 5 21 109.4 0.19 0B2 (J15/G5) 2 0 3 27 4 36 125.9 0.29 1B3 (J18/G8) 1 9 7 10 9 36 131.8 0.27 0B4 (J16/G6) 4 5 7 3 2 21 133.7 0.16 1B5 (J11/G1) 1 3 5 0 0 9 74.5 0.12 1B6 (J14/G4) 9 4 0 0 1 14 89.3 0.16 2B7 (J13/G3) 24 1 0 3 0 28 125.5 0.22 2B8 (J12/G2) 1 6 2 10 14 33 149.8 0.22 1
Total 45 28 37 53 35 198 939.9 8
Gross Total 124 108 91 124 86 533 1922.2 10
The figures in the parentheses are the corresponding LGs of B. juncea and B. napus [11, 16] for the A genome and the corresponding LGs of B. juncea and B. nigra [11, 18] for the B genome.
Page 8 of 19(page number not for citation purposes)

BMC Genomics 2008, 9:113 http://www.biomedcentral.com/1471-2164/9/113
tribution of 24 genomic blocks (A-X) described for ahypothetical ancestor of the At and Brassica lineages bySchranz et al. [15]. This approach facilitated the identifi-cation of conserved blocks between At and B. juncea. Aconserved block was defined as a region that contained atleast two At loci from the same block region. In someinstances, a block was recognized even with a singlemapped marker if one or more markers of the same blockwere found mapping at the corresponding region in ear-lier maps for the A and B genomes [16,18]. Using this cri-teria, a total of 67 genomic blocks were identified in the Agenome of B. juncea with an average of 2.8 paralogousblocks for each block recognized in the hypotheticalancestral species (Table 2). As compared to the A genome,we identified a lesser number of blocks (42) in the Bgenome (Table 2). Among the 42 blocks identified in theB genome of B. juncea, the larger blocks viz. E, F, J, R andU were observed to be represented by three paralogousblocks within the B genome (Table 2).
Comparative block arrangement in the A genomes of B. juncea and B. napusThe A genome of B. juncea (present study) was comparedwith the A genome of B. napus [16] based on the arrange-ment of the 24 genomic blocks. For comparison, all theRFLP markers mapped on B. napus were converted to cor-responding At loci based on the information available in
the supplementary Table S1 of Parkin et al. [16] andassigned to different blocks (A-X) (see Additional file 2).The comparative block arrangement in the A genomes ofB. juncea and B. napus has been shown in Figure 6a.
In terms of the arrangement of the blocks, the A genomesof both B. juncea and B. napus were essentially collinear.We identified five new blocks (M-N in A1, G-H in A3 andH block in A9) in the A genome of B. juncea which werenot detected in the corresponding A genome LGs of B.napus (Figure 6a). All these new blocks were identified inregions with a reasonably high density of IP markers.Additionally, we also established the presence of someblocks (O-P in A2/N2, N in A3/N3, X and H in A9/N9)(Figure 6a) in the A genome of both B. juncea and B. napuswhich were not designated earlier in B. napus by Schranzet al. [15]. Block status to these regions were assigned aswe observed the presence of At loci from these blocks notonly in the homoeologous LGs of the A and C genomes ofB. napus [16] but also in the corresponding LGs of the Agenome of B. juncea in the present study (blocks markedwith asterisk in Figure 6a). Blocks L, W and X observed inthe linkage groups N2, N3 and N6 of B. napus (Figure 6a)could not be detected in the homoeologous A genomeLGs of B. juncea in the present study. This, in all probabil-ity, is due to the absence of IP markers representing these
Table 2: Distribution of the 24 genomic blocks (A-X) in the A and B genomes of B. juncea
Blocks Gene Length of conserved block (Mb) A genome B genome
A At1g01560 – At1g19330 6.4 4 5B At1g19850 – At1g36240 6.7 6 2C At1g43590 – At1g56145 4.5 3 1D At1g63770 – At1g56520 2.4 1 2E At1g65040 – At1g80420 6 2 3F At3g01040 – At3g25520 9.2 3 3G At2g05170 – At2g07733 1.6 2 1H At2g15670 – At2g21140 2.2 4 2I At2g21160 – At2g28910 3.3 4 1J At2g31040 – At2g47730 6.3 3 3K At2g01250 – At2g03750 1 2 1L At3g25855 – At3g29772 2.1 1 0M At3g43740 – At3g49970 2.8 1 2N At3g50950 – At3g62790 4.2 5 3O At4g00030 – At4g04955 2.5 3 1P At4g12070 – At4g08690 1.6 2 1Q At5g28897 – At5g22800 3.3 3 2R At5g22030 – At5g01240 7.1 3 3S At5g41900 – At5g32621 4.4 1 0T At4g12750 – At4g16143 1.6 4 1U At4g16250 – At4g38770 8.9 3 3V At5g48520 – At5g42970 2.4 3 0W At5g49430 – At5g60390 4.2 2 2X At5g60550 – At5g67385 2.5 2 0
Total 97.2 67 42
Page 9 of 19(page number not for citation purposes)
BMC Genomics 2008, 9:113 http://www.biomedcentral.com/1471-2164/9/113
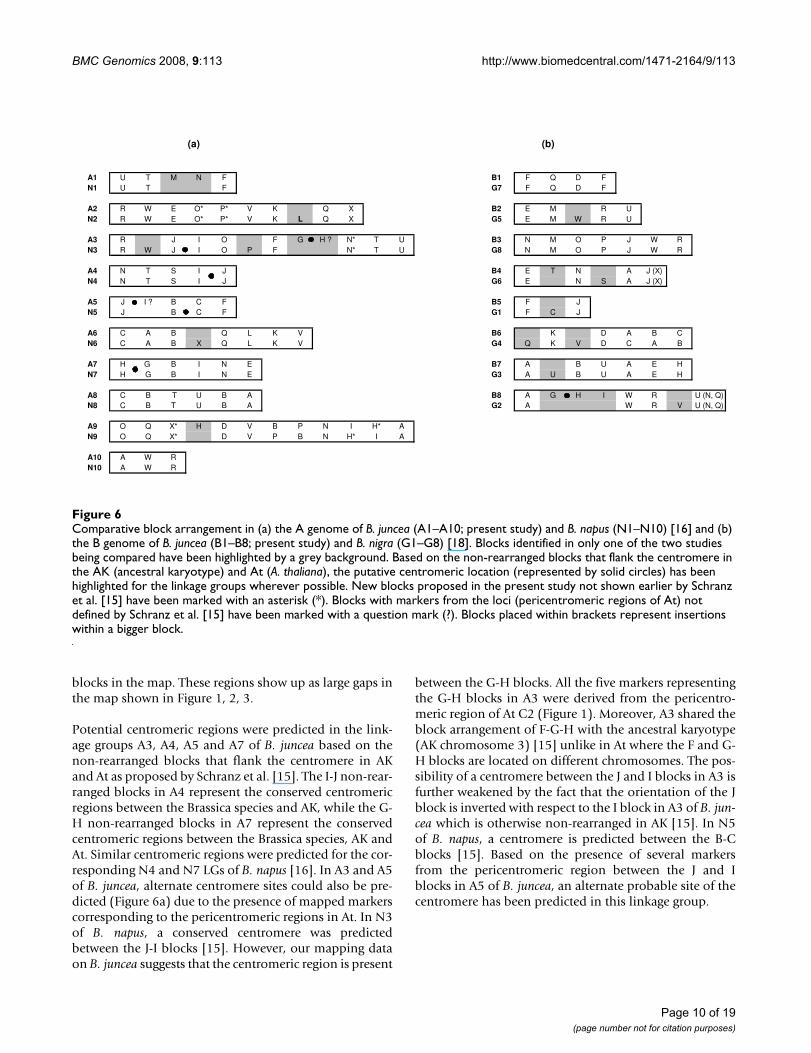
blocks in the map. These regions show up as large gaps inthe map shown in Figure 1, 2, 3.
Potential centromeric regions were predicted in the link-age groups A3, A4, A5 and A7 of B. juncea based on thenon-rearranged blocks that flank the centromere in AKand At as proposed by Schranz et al. [15]. The I-J non-rear-ranged blocks in A4 represent the conserved centromericregions between the Brassica species and AK, while the G-H non-rearranged blocks in A7 represent the conservedcentromeric regions between the Brassica species, AK andAt. Similar centromeric regions were predicted for the cor-responding N4 and N7 LGs of B. napus [16]. In A3 and A5of B. juncea, alternate centromere sites could also be pre-dicted (Figure 6a) due to the presence of mapped markerscorresponding to the pericentromeric regions in At. In N3of B. napus, a conserved centromere was predictedbetween the J-I blocks [15]. However, our mapping dataon B. juncea suggests that the centromeric region is present
between the G-H blocks. All the five markers representingthe G-H blocks in A3 were derived from the pericentro-meric region of At C2 (Figure 1). Moreover, A3 shared theblock arrangement of F-G-H with the ancestral karyotype(AK chromosome 3) [15] unlike in At where the F and G-H blocks are located on different chromosomes. The pos-sibility of a centromere between the J and I blocks in A3 isfurther weakened by the fact that the orientation of the Jblock is inverted with respect to the I block in A3 of B. jun-cea which is otherwise non-rearranged in AK [15]. In N5of B. napus, a centromere is predicted between the B-Cblocks [15]. Based on the presence of several markersfrom the pericentromeric region between the J and Iblocks in A5 of B. juncea, an alternate probable site of thecentromere has been predicted in this linkage group.
Comparative block arrangement in (a) the A genome of B. juncea (A1–A10; present study) and B. napus (N1–N10) [16] and (b) the B genome of B. juncea (B1–B8; present study) and B. nigra (G1–G8) [18]Figure 6Comparative block arrangement in (a) the A genome of B. juncea (A1–A10; present study) and B. napus (N1–N10) [16] and (b) the B genome of B. juncea (B1–B8; present study) and B. nigra (G1–G8) [18]. Blocks identified in only one of the two studies being compared have been highlighted by a grey background. Based on the non-rearranged blocks that flank the centromere in the AK (ancestral karyotype) and At (A. thaliana), the putative centromeric location (represented by solid circles) has been highlighted for the linkage groups wherever possible. New blocks proposed in the present study not shown earlier by Schranz et al. [15] have been marked with an asterisk (*). Blocks with markers from the loci (pericentromeric regions of At) not defined by Schranz et al. [15] have been marked with a question mark (?). Blocks placed within brackets represent insertions within a bigger block.
(a) (b)
A1 U T M N F B1 F Q D FN1 U T F G7 F Q D F
A2 R W E O* P* V K Q X B2 E M R UN2 R W E O* P* V K L Q X G5 E M W R U
A3 R J I O F G H ? N* T U B3 N M O P J W RN3 R W J I O P F N* T U G8 N M O P J W R
A4 N T S I J B4 E T N A J (X)N4 N T S I J G6 E N S A J (X)
A5 J I ? B C F B5 F JN5 J B C F G1 F C J
A6 C A B Q L K V B6 K D A B CN6 C A B X Q L K V G4 Q K V D C A B
A7 H G B I N E B7 A B U A E HN7 H G B I N E G3 A U B U A E H
A8 C B T U B A B8 A G H I W R U (N, Q)N8 C B T U B A G2 A W R V U (N, Q)
A9 O Q X* H D V B P N I H* AN9 O Q X* D V P B N H* I A
A10 A W RN10 A W R
Page 10 of 19(page number not for citation purposes)

BMC Genomics 2008, 9:113 http://www.biomedcentral.com/1471-2164/9/113
Comparative block arrangement in the B genomes of B. juncea and B. nigra vis-à-vis AtComparative organization of the A genomes of B. junceaand B. napus (described above) based on the block bound-aries defined by Schranz et al. [15] confirmed that the setof 24 genomic blocks (A-X) can be used to delineate thegenomic organization of Brassica genomes. The sameblock definition was therefore used to study the segmentalorganization of the B genome of B. juncea. The segmentalstructure of the B genome (B1–B8) of B. juncea in relationto the At genome is represented schematically in Figure 4,5. Since our study allows for a detailed gene-to-gene align-ment between the B genome of Brassica and At which hasnot been reported earlier, the description of the genomicorganization of the eight linkage groups (B1–B8) withrespect to At is described in detail below.
B1 (G7/J17): B1 predominantly consists of two longstretches of collinear genes from At C3 (block F), one eachat the two ends of the linkage group. The two F blocksconstitute about 62% of the total mapped area. The colin-earity of gene order in comparison with At is suggestive ofat least one inversion each in both the F blocks signifyingthat inversions occurred prior to the diversification of thetwo blocks. The orientations of the F blocks are invertedwith respect to each other. The presence of duplicated Fblocks on a single linkage group appears to be a uniquefeature of the B. nigra genome and has not been observedin the A and C genomes. The middle segment of B1 (com-prising around 10% of the LG) has markers from block Q(At C5) and block D (At C1).
B2 (G5/J15): This LG consists of four blocks, E-M-R-U,with the E block (At C1) constituting 20% of the top seg-ment and the U block (At C4) constituting 54% of thelower segment of this linkage group. Except for minorrearrangements, the gene order in the U block is highlycollinear with its corresponding At C4 region. These rear-rangements also explain the presence of markers from theadjacent R and M blocks in this region.
B3 (G8/J18): B3 is constituted of blocks N-M-O-P-J-W-R.Blocks N and M, constituting the top segment of B3, sharecolinearity of gene order with their counterparts in At.Blocks O and P harbour at least one inversion each whichexplains the break in colinearity of the gene order as com-pared with At. The middle segment of B3 is represented byblock J (At C2). A minimum of two inversions within theJ block could have resulted in the reshuffling of genemarkers as compared with At. Blocks R and W constitutethe terminal region of B3. A mixture of markers from AtC2, At C3 and At C4 is seen between the J and W blocks.Three of these markers viz. At3g47370, At4g07666b andAt4g09820 belong to blocks M and P. Their placement
between the J and W blocks could be a consequence of theinversions described above.
B4 (G6/J16): B4 consists of small collinear stretches con-tributed by all the five chromosomes of At. The blockorder is represented by E-T-N-A-J, with an X block inser-tion within the J block. The top of the LG is made up byblocks E, T and N. The arrangement of the genes in the Nblock is suggestive of rearrangements within the block.
B5 (G1/J11): This linkage group consists of two majorblocks: F, constituting 30% and J contributing 12% of thetotal mapped area. The gene order in these two blocks arecollinear with the F and J blocks of At.
B6 (G4/J14): About 70% of the total mapped area in thelower part of the B6 linkage group is made up of blocksfrom At C1 in the order C-B-A-D. The upper part of thelinkage group shows the presence of the K block from AtC2 while the remaining portions above the K block couldnot be assigned to any syntenous block as no At loci couldbe mapped to this region.
B7 (G3/J13): This LG consists predominantly of genemarkers from At C1, representing ~53% of the mappedarea. The block order is A-B-U-A-E-H. The distribution ofthe At C1 specific markers is suggestive of the presence ofthree large collinear regions separated by large gaps andconstituting the top, middle and terminal segments of B7.The top portion of this LG comprises of an A block har-boring a minimum of one inversion breaking its colinear-ity with its counterpart in At. The middle segment isformed by a collinear stretch of genes belonging to the Band U blocks. The terminal segment of B7 comprisesanother A block followed by a long stretch of genesbelonging to block E. The gene order in this block indi-cates two inversions since its divergence from At.
B8 (G2/J12): This is a highly chimeric linkage group com-prising nine blocks [A-G-H-I-W-R-U (with an N-Q seg-ment inserted within the U block)] with loci derived fromall the five chromosomes of At. The terminal segment ofthe linkage group is consists of a U block from At C4 withinsertions from the N and Q blocks. The gene order of Atloci in this block revealed the presence of two sub-blocksordered in opposite orientations. This break in colinearitycan be explained by at least one major inversion whichwould also explain the appearance of two regions harbor-ing markers from the Q block. The middle portion of thisLG is formed of a large collinear region from At C5 (blockR-W). Above the R-W block, there is a contiguous stretchof markers derived from blocks G, H and I. This contigu-ous block arrangement, G-H-I, is observed in At C2whereas it is shared between linkage groups 3 (G-H) and4 (I) in AK with a predicted centromere between the G and
Page 11 of 19(page number not for citation purposes)

BMC Genomics 2008, 9:113 http://www.biomedcentral.com/1471-2164/9/113
H blocks in both At and AK [15]. On the basis of the fore-going, a conserved region constituting the centromerecould be predicted between the G and H blocks in B8.
Lagercrantz [18] reported a comparative map in B. nigraby mapping 284 RFLP loci generated from 160 At DNAfragments. To compare the block arrangement in the Bgenome of B. juncea with its diploid progenitor B. nigra,the RFLP loci of the B. nigra map, wherever possible, wereconverted to orthologous At loci and assigned to differentblocks (A-X) (see Additional file 3). For the conversion,the RFLP probes whose GenBank sequences could beretrieved, were subjected to NCBI BLASTN search to assignthe best corresponding homologous At loci. For the otherRFLP probes (which mapped on different At physicalmaps available at TAIR [31], the corresponding map posi-tion in the AGI physical map was determined and theclosest At locus name was assigned to the RFLP probe. Thecomparative block arrangement observed in this studyand that reported by Lagercrantz [18] is shown in Figure6b. Although a general colinearity is observed between thetwo maps, we identified some new blocks (T in B4 and G,H, I in B8) in the B genome of B. juncea which were notdetected in the earlier study. Conversely, we also identi-fied some blocks in the B. nigra map [18] (C in G1, V inG2, U in G3, Q and V in G4, W in G5 and S in G6) whichcould not be identified in the B genome of B. juncea in thisstudy (Figure 6b and Additional file 3). These discrepan-cies in block arrangements between the two maps couldbe due to a limited coverage of At loci in the B genome ofB. juncea (Table 1) and our inability to convert some ofthe At RFLP loci described earlier [18] in the B. nigra map.Further saturation of the B genome map would facilitategreater accuracy in assigning block status to these regionsfound to be different between the two genomes. Amongthe different blocks identified in the B genome, F, J, R andU were the major blocks with the maximum coverage.These were represented as three homoeologous blocks inboth the maps. A similar triplication for three of theseblocks (F, J and R) was also reported in the previous studyby Lagercrantz [18].
Identification of homoeology between the A, B and C genomes of Brassica speciesConsiderable homoeology has been reported between theLGs of the A and C genomes [16]. With the mappinginformation for the B genome derived from the presentstudy, we were able to compare the block-based architec-ture of the LGs of the three diploid Brassicas to under-stand the extent of homoeology shared between the threegenomes. This analysis provided insights into the promi-nent rearrangements that shaped the three genomes andalso identified those ancestral blocks which remainedunaltered in all the three diploid Brassica genomes. Forthis comparative study, the RFLP loci of the C genome of
B. napus [16] were converted to their corresponding At loci(Additional file 4). Figure 7 provides an overall view ofthe homoeology between the three genomes.
The comparative map of the A (A1–A10), B (B1–B8) andC (C1–C9) genomes of Brassica (Figure 7) is based on theconsensus block arrangements identified in the compara-tive map of the A genome of B. juncea (A1–A10 of thepresent study) and B. napus (N1–N10) reported earlier[16], B genome of B. juncea (B1–B8; present study) and B.nigra (G1–G8) reported earlier [18] and C genome of B.napus (N11–N18) [16]. This comparative analysis showsthat all the linkage groups of the C genome except N16and N17 [16] correspond to LGs of the A genome basedon the extent of the homoeology between them. Hence,we propose that N16 and N17 should be designated as C7and C6 respectively (Figure 7). Based on the homoeologyobserved among the A, B and C genomes in our study, asimilar nomenclature is proposed for the B genome (B1–B8). This homoeology-based designation will enablegreater accuracy and uniformity in the internationalnomenclature of the three diploid progenitor genomes.
All the linkage groups belonging to the three diploidBrassica species could be divided into ten categories orgroups (Group1–10) based on the extent of homoeologybetween them (Figure 7). Group 1 consists of A1/B1–B2/C1. A1 was entirely homoeologous to C1, both being con-stituted by the block arrangement F-T-U. The F-T-Uarrangement was specific to the Rapa/Oleracea lineage.Interestingly, this F-T-U arrangement was found repeatedin both the A (A3) and the C (C3) genomes (Group 3, Fig-ure 7) but was absent from the B genome. The linkagegroup B1 shared the F block with A1/C1 in Group1. Dueto the presence of two F blocks in B1, this linkage groupalso had homoeology with Group 3. B2, which shared theU block with A1 and C1, could also be placed in thisgroup. In Group 2 (A2/B2/C2), A2 and C2 were com-pletely homoeologous, while B2 showed homoeologywith A2 and C2 for the block motifs R-W-E-O-P. Oneinversion in B2 could explain the separation of the E blockfrom the R-W block combination (Figure 8). Group 3 (A3/B1–B3/C3) members shared the common block arrange-ment R-W-J-I-P-O. B3 was almost entirely composed ofthis block arrangement, while an additional F-T-U blockwas present in A3 and C3. Members of Group 4 (A4/B4/C4) shared the block motif J-I-S-N-T. A4 and B4 appearedto be homoeologous along their entire length, while C4had acquired an additional J block. The presence of two Jblocks in C4 was a C genome-specific rearrangement. Dueto the presence of an additional J block, C4 has also beenplaced in group 5. In Group 5 (A5/B5/C4–C5), A5 and B5were homoeologous along their entire length sharing theblock motif J-C-F. C5 shared partial homoeology (blocksF-C) with A5 and B5. The terminal J block present in A5
Page 12 of 19(page number not for citation purposes)

BMC Genomics 2008, 9:113 http://www.biomedcentral.com/1471-2164/9/113
and B5 was however absent in C5. In Group 6 (A6/B6/C5–C6), A6 and B6 were homoeologous along their entirelength sharing the block arrangement C-B-A-V-K-L-Q.One inversion in either of the two genomes could explainthe reverse orientation of the blocks constituting the lowersegment of A6–B6 (blocks V-K-L-Q). Two C genome LGs(C5 and C6) are also components of this group. C5 sharedthe A-B-C block arrangement with A6/B6 while C6 washomoeologous for the block arrangement V-K-L-Q withA6/B6. Members of Group 7 (A7/B7/C7) shared homoe-ology for a large E block while Group 8 (A8/B7/C8) mem-bers were homoeologous for blocks A-B-U. Group 9 (A9/C8–C9) had A9 sharing homoeology with C9 for the
blocks O-Q-X-H-D-V which constituted the top half ofboth the linkage groups. The lower segment of A9 sharedthe block arrangement N-I-H-A with C8. No LG from theB genome seemed to possess any major block homoeolo-gous with A9. Members of group 10 (A10/B8/C9) sharedthe blocks R-W which constituted a major portion of thelinkage group in all the three genomes.
Karyotype changes that led to the divergence of A, B and C genomes of Brassica speciesThe identification of homoeologous chromosomesamong the three genomes of Brassica sp. (A, B and C) inthe present study allows us to predict the possible, macro-
The block arrangements in the A and B genomes are based on the consensus block arrangement of the A genomes of B. juncea (A1–A10; present study) and B. napus (N1–N10) [16] and the B genomes of B. juncea (B1–B8; present study) and B. nigra (G1–G8) [18]Figure 7The block arrangements in the A and B genomes are based on the consensus block arrangement of the A genomes of B. juncea (A1–A10; present study) and B. napus (N1–N10) [16] and the B genomes of B. juncea (B1–B8; present study) and B. nigra (G1–G8) [18]. The C genome is based on the B. napus map (N11–N19) [16]. The original nomenclature of the 2 LGs of the C genome (N16 and N17) and all the LGs of the B genome (G1–G8) have been shown in parentheses with the re-designated nomenclature. Certain single gene insertions were considered as putative blocks (marked with asterisk) if a similar block was found present at the corresponding region in the homoeologous chromosome. Filled bars represent the common blocks shared between all the three members of the group. Large gaps (≥10 cM regions devoid of any markers) in the LGs have been depicted by hatched boxes. Arrows represent the orientation of the gene order (within the block) with respect to the corre-sponding regions in At.
A9
OQ
D
V
P
B
N
I
A
X
H
H
OQ
DV
XH
R
W
C9
A8
T
U
B
A
B, C
C8
N
A, E
U
C
A
B
HI
A4
N
S
J
I
T
N
TS
J
IC
J
D
C4
I
B4 (G6)
T
X
A
N
J
S
E
Group 4
A10
R
W
A
C9
OQ
DV
XH
R
W
V
B8 (G2)
A
G
H
R
N
Q
W
I
U
H
GB
Q
V
LK
U
C6 (N17)
B6(G4)
D
C
A
B
Q
V
L*K
A6
C
A
Q
V
L
K
X
B
A
C
F
B
C5
Group 6 Group 8 Group 9 Group 10
B2(G5)C1A1
B1 (G7)
F
D
Q
F
V*
X*
O*,P*
R
M
E
U
W
U
T
F
N
U
T
F
M,N
Group 1
CN
E
C7 (N16)A7
G, HBIN
E
Group 7
Group 2
B2(G5)
C2
X
R
W
E
V
Q
P,O
L
A2
P/O
R
W
E
VK
QX
L
R
O*,P*M
E
U
W
A3
R
J
IO
F
T
U
W
P
NG, H
R
J
I
O
F
T
U
W
P
GNB
C3
Group 3
B3 (G8)
R
W
O
J
M
N
PI*
A5
B, C
F
J
B5 (G1)
J
F
C
Group 5
N
TS
J
IC
J
D
C4
I
A
C
F
B
C5
B1 (G7)
F
D
Q
F
V*
X*
A, E
C8
N
U
C
A
B
HI
I*
B7 (G3)
A
B
U
E
A
H
U
B7 (G3)
A
B
U
E
A
H
U
Page 13 of 19(page number not for citation purposes)

BMC Genomics 2008, 9:113 http://www.biomedcentral.com/1471-2164/9/113
Page 14 of 19(page number not for citation purposes)
Major rearrangements between the rapa/oleracea and nigra genomes (a, b) and the rapa and oleracea genomes (c, d)Figure 8Major rearrangements between the rapa/oleracea and nigra genomes (a, b) and the rapa and oleracea genomes (c, d). Boxes bearing the same color represent homoeologous blocks while the hatched boxes represent large gaps (≥10 cM regions devoid of any markers). (a) Prominent rearrangements between the A/C and B genomes resulting in altered block arrangement (b) Block organization of one LG of the B genome harbours the blocks from two LGs in the A/C genome explaining the difference of one chromosome between the two genomes (c) B. oleracea genome-specific rearrangements (mainly translocations) after the divergence from the Rapa lineage (d) Block organization of two LGs of the C genome (C8, C9) can be derived from three LGs (A8, A9, A10) of the A genome suggesting that the difference of one chromosome between the A and C genomes could be either due to the gain of one of the these LGs in the Rapa lineage or a reduction of one LG in the oleracea genome.
B, C
F
A5
J
A
C
F
B
C5C4
N
TS
J
IC
J
DI
A6
C
A
Q
V
L
K
X
B
A4
N
S
J
I
T
H
GB
Q
V
LK
U
C6
OQ
DV
XH
R
W
C9
A, E
C8
N
U
C
A
B
HI
A9
OQ
D
V
P
B
N
I
A
X
H
H
A8
T
U
B
A
B, C
A10
R
W
A
(c) (d)
W
V
G
H
R
I
N
Q
U
H
A7
G, HBIN
E
A, E
C8
N
U
C
A
B
HI
G, H
A3/C3
R
J
IO
F
T
U
W
P
N
B3
R
W
O
J
M
N
PI*
A2/C2
P/O
R
W
E
VK
QX
L
O*,P*
B2
R
M
E
U
W
A1/C1
U
T
F
M,N
A10
R
W
A
B1
F
D
Q
F
V*
X*
B8
A
(a) (b)
B7
A
B
U
E
A
CN
E
C7
A8
T
U
B
A
B, C
U

BMC Genomics 2008, 9:113 http://www.biomedcentral.com/1471-2164/9/113
level karyotype changes that led to the divergence of the A,B and C genomes. It has been predicted that the Nigra (B)and the Rapa/Oleracea (A/C) lineages separated fromeach other about 7.9 Mya [32] followed by the splitting ofthe Rapa and Oleracea lineages. Three linkage groups ofthe B genome (B4, B5 and B6; Figure 7) have retained sim-ilar block organization as their corresponding A genomeLGs (A4, A5 and A6; Figure 7). For the remaining five Bgenome chromosomes (B1, B2, B3, B7 and B8), we pro-pose two types of changes: (1) Rearrangements withoutany change in the chromosome number: blocks constitut-ing four LGs of the A/C genome (A1–C1/A2–C2/A3–C3/A10) could be reshuffled to explain the block arrange-ment in four LGs in the B genome (B1/B2/B3/B8) (Figure8a). No reduction in chromosome number seems to havetaken place here. In the process however, both the F-T-Ublock motifs of the A/C genome lost their identity in theB genome while a unique LG with two F blocks emergedin the B genome. (2) Rearrangements with variations inchromosome number: the genomic block arrangement ofB7 could be derived by fusing two linkage groups from theA/C (A7–C7/A8–C8) genome (Figure 8b). This alsoexplains the difference of one LG between the A/C and Bgenomes.
A high level of similarity between the A and C genomeswas established in earlier studies [16]. However, it was notclear whether the changes that were observed between thetwo occurred in one of the lineages after their divergenceor occurred independently in both the lineages. The simi-lar organization of A1–C1, A2–C2, A3–C3 and A7–C7LGs of the A and C genomes (Figure 7) indicated theabsence of any structural changes in these chromosomesafter the divergence of the A and C genomes. We thereforepredict the following types of changes in the evolution ofthe A and C genomes: (1) Rearrangements related to theC4, C5 and C6 chromosomes are specific to the C genome(Figure 8c) and occurred after the diversification of the Aand C genomes since the corresponding LGs of the A andB genomes are identical (Figure 7). These changes, mainlytranslocations, break the homoeology between the A andC genomes (Figure 8c). The remaining two LGs (C8 andC9) appear to be made up of rearranged blocks constitut-ing three LGs of the rapa genome (A8, A9 and A10; Figure8d). The block arrangement of C9 can be achieved by fus-ing half of A9 with almost the entire A10 LG. Similarly,the other half of A9 and the entire A8 represent the blockarrangement of the C8 chromosome (Figure 8d). Theserearrangements would have contributed to the differenceof one chromosome between the A and C genomes.
DiscussionIn this study, we generated a detailed comparative mapbetween B. juncea and Arabidopsis thaliana containing 533At loci including 486 IP markers. Although exons of At
and Brassica species share around 75–90% homology[33], tapping polymorphism available in the intronicsequences is an efficient method to generate PCR-basedmarkers from otherwise highly conserved genes. Thirtytwo percent of the primers designed in this study werefound to be polymorphic between the B. juncea lines, Var-una and Heera, used as parents of the mapping popula-tion. Screening the amplified fragments for SNPs couldlead to a further increase in the number of polymorphicloci. Previous reports on comparative analysis between Atand Brassica species have been based mostly on RFLPprobes [16,18-20,24]. Screening large segregating popula-tions with RFLP markers is rather cumbersome. In con-trast, the polymorphisms obtained using IP markers wereeasily discernable on simple 1.5–2.0% agarose gels andwould therefore enable rapid screening of large segregat-ing populations. Additionally, being genic in origin, IPmarker-based genetic maps would directly reflect the syn-tenic relationship between the two species, B. juncea andAt. Since the IP markers used in this study were designedfrom conserved sequences between At exons and availableBrassica EST/GSS sequences, they also possess enormouspotential for wider applicability across various Brassicaspecies. As the At genome is partially duplicated [34], theuse of multicopy At loci to establish syntenic relationshipsin other species would raise issues of paralogy and orthol-ogy. In contrast, analyzing the distribution of At single-tons in Brassica would give an unambiguousrepresentation of various rearrangements that haveoccurred between the two lineages since their divergence.The major emphasis in this study was therefore on gener-ating IP PCR primers predominantly from single copy lociin Arabidopsis. Our genomic block definitions were basedmostly on At singletons in contrast to earlier studies [16].Irrespective of the approach used to define synteny, thenumber of times each block is represented in the Agenome of B. juncea was found to be highly similar to thatobserved for B. napus. This observation supports the ear-lier hypothesis which advocated the occurrence of dupli-cations in the Arabidopsis genome prior to its divergencefrom the Brassica lineage [16].
In the present study, we analyzed the segmental organiza-tion of the B. juncea genome based on the 24 conservedgenomic blocks described by Schranz et al. [15]. Theseblocks represent the conserved regions common to theAK, At and B. rapa [15]. Block order obtained for B. junceain this study was compared with the available maps forthe A and C constituent genomes of B. napus [16] and theB genome of B. nigra [18]. A high level of conservedmacro-level colinearity was observed between B. junceaand its diploid progenitors. The rapa (A) genomes of bothB. juncea and B. napus were found to be highly comparable(Figure 6a). Similarly, the B genome of B. juncea appearedto maintain similar genomic block architecture as its dip-
Page 15 of 19(page number not for citation purposes)

BMC Genomics 2008, 9:113 http://www.biomedcentral.com/1471-2164/9/113
loid counterpart in B. nigra (Figure 6b). This signified theabsence of large scale perturbations during the formationof the allopolyploid Brassicas contrary to earlier reports bymany groups working on synthetic Brassica polyploids[35-37]. Additionally, the conserved identity of both theconstituent diploid genomes in the Brassica polyploidssuggests the involvement of a strong and active geneaction which inhibits pairing between the homoeologouschromosomes. Thus, survival of the allopolypoids B.napus, B. juncea and B. carinata, in all probability, wasbased on hybrid vigour and suppression of pairing of thehomoeologous chromosomes.
Defining the constitution of the A, B and C Brassicagenomes based on these genomic blocks facilitated thereconstruction of the ancestral karyotype to decipher theevolution and diversification of the Brassica lineage.Common block arrangements shared between the threelineages suggest an ancestral origin. Several such con-served block motifs were identified in this study. Theseinclude blocks R-W-E-O-P (Group 2); blocks R-W-J-I-O-P(Group 3) and blocks J-I-S-T-N (Group 4) (Figure 7).Since the two lineages within the tribe Brassiceae (Nigralineage and Rapa/Oleracea lineage) diverged approxi-mately ~7.9 Mya [32], the block motifs shared by the Aand B genomes would also be ancestral. Thus, the blockmotifs shared between the members of Group 5 (blocks J-C-F) and Group 6 (blocks C-B-A-V-K-L-Q) (Figure 7) arespeculated to be ancestral in origin although their identityin the Oleracea lineage is lost. Based on the comparativegenome analysis of the three diploid Brassica species car-ried out in this study the constitution of the ancestralBrassica karyotype (ABK) in terms of the block arrange-ment could be predicted for at least five LGs (ABK2–ABK6; see Additional File 5). Earlier studies on chloro-plast DNA analysis [38,39] clearly established that the B.rapa/B. oleracea are very closely placed in one lineage andB. nigra belongs to a different lineage. Our results suggestsignificant similarity between the A and B genome for fivelinkage groups. We therefore propose that besides the fiveLG putative ancestor, there were divergent parents(female) involved in the evolution of the two majorBrassica lineages.
Comparative analysis of block organization revealed cer-tain major rearrangements (translocations and fusions)that were pivotal to karyotype diversification in the differ-ent Brassica lineages. Complete homoeology in terms ofblock organization was seen for three linkage groups eachbetween the rapa (A) and oleracea (C) genomes (A1–C1,A2–C2 and A3–C3; Figure 7) and the rapa (A) and nigra(B) genomes (A4–B4, A5–B5 and A6–B6; Figure 7). Thisimplies that although the Rapa and Oleracea lineages aremore closely related, certain block arrangements havebeen retained by the Rapa and Nigra lineages while being
lost from the C genome. If the rearrangements in theblock organization of the remaining LGs are compared,rearrangements leading to lineage-specific karyotypediversification become evident. Our study also highlightscertain rearrangements (Figure 8c) that appear to haveoriginated in the Oleracea lineage after its divergence fromRapa. Since the chromosome number of the commonBrassica ancestor remains uncertain, one cannot discernwhether the splitting of chromosomes led to the succes-sive increase in chromosome number in the three Brassicalineages or fusions led to a reduction in the chromosomenumber. However, in the present study, the rearrange-ments leading to the difference of one LG each betweenthe A-B and A-C lineages could be deciphered (Figure 8b,8d).
Previous studies suggested that two reciprocal transloca-tions, three chromosome fusions and at least three inver-sions were instrumental in the derivation of At from theancestral karyotype-AK [40,41]. In the process, severalnew block boundaries were created. We compared thegenomic block organization of AK, At and the threeBrassica genomes to identify new/common block junc-tions to gain further insight into the evolution of the cru-cifer genomes. In the three Brassica genomes analyzed,block R was found to be almost always associated withblock W (Figure 7) and block Q was associated with blockX. These associations are characteristic of the Brassicagenome and are not found in AK or At [15]. The rapa/oler-acea A3/C3 LGs shared the ancestral pattern of blocks F-G-H (AK chromosome 3) [15] while in At, F and G-H occupydifferent chromosomes. Similarly, with the extent of satu-ration available for the three genetic maps of Brassica, theC-D, K-G and Q-S block fusions characteristic of At arelacking in Brassica. This suggests that different rearrange-ments led to the formation of the Arabidopsis and theBrassica ancestor. A more detailed view of karyotype evo-lution would be available once all the centromeres for theBrassica genomes are identified.
The identification of homoeology based on the conserved24 genomic blocks would help build a unified compara-tive genomics system in the Brassicaceae as has been donefor the Gramineae family by the generation of the 'Crop-Circle' [42-44]. This will facilitate the transfer of informa-tion from one species to another for which IP markerswould be most useful. With the elucidation of genesinvolved in many biochemical pathways and the availa-bility of gene expression data, information generated inthe model species Arabidopsis holds enormous potentialfor application in breeding of Brassica crops. Establish-ment of syntenic relationships between At and Brassicawould be highly beneficial for the identification of candi-date genes contributing to traits of agronomic value fromcorresponding regions in At and also serve as an exhaus-
Page 16 of 19(page number not for citation purposes)

BMC Genomics 2008, 9:113 http://www.biomedcentral.com/1471-2164/9/113
tive resource to generate more markers for fine mappingin syntenic regions of Brassicas.
ConclusionThe present study conclusively establishes the efficacy ofIP markers for the development of a comparative mapbetween a model plant and a polyploid crop species. Thecomparative genome analysis performed in this study hascontributed significantly to our understanding of thehomoeology shared between the A, B and C Brassicagenomes. The study also identifies, at the macro-level, theevolutionary rearrangements leading to karyotype diversi-fication among the three genomes. Additionally, some ofthe putative ancestral Brassica-specific block motifs wereidentified. Syntenic relationships thus establishedbetween B. juncea, B. napus, B. nigra and At will facilitateprecision breeding and identification and positional clon-ing of candidate genes contributing to traits of agronomicvalue in Brassica species.
MethodsA total of 1180 primer pairs (247 from At C1, 193 from AtC2, 214 from At C3, 292 from At C4 and 234 from At C5)were designed. Genes having larger introns were preferredas the incidence of indels is expected to be higher in suchcases. The expected amplicon size for the designed primerpairs was approx. 500 bp-1 kb in A. thaliana. To reducenon-specific amplifications in B. juncea, primer pairsdesigned from At singletons were first tested on At DNA tooptimize conditions for PCR which result in a singleamplicon. For most of the primer pairs screened on AtDNA, the optimum PCR condition was: initial denatura-tion at 94°C for 5 min, followed by 30 cycles of denatur-ation at 94°C for 30 s, annealing at 55°C for 30 s andelongation at 72°C for 1 min followed by a final exten-sion at 72°C for 5 min. Amplified PCR products were ana-lyzed on 1.2–2% w/v agarose gel to score forpolymorphism either on the basis of size/length differ-ence or presence/absence (dominant) of PCR products. Amapping population consisting of 123 doubled haploidlines derived from a cross between Varuna (an Indian cul-tivar) and Heera (an east European line) was used for theconstruction of the linkage map [30]. IP markers wereadded to a framework map of B. juncea described earlierby Pradhan et al. [30] and Ramchairy et al. [11] using theprogram Joinmap version 2.0 [45,46].
AbbreviationsAt: Arabidopsis thaliana; At C1–C5: Chromosomes of At(1–5); AK: Ancestral karyotype; cM: centiMorgan; IP:Intron polymorphism; LG: Linkage group.
Authors' contributionsPP, AJ, NCB, LP and SS designed intron spanning primersfrom one each of the five At chromosomes and mapped
the IP markers on the F1DH population. PP wrote thepaper and put together the figures. The comparative anal-ysis of the A, B and C genomes of Brassica were done byPP. VG contributed to some of the mapping experimentsand organized the laboratory work. AKP looked at all themapping data and helped in organizing the mappinginformation and the manuscript. DP conceived theproject and contributed to the writing of the manuscript.All authors read and approved the final manuscript.
Additional material
Additional file 1Sequence data of the intron spanning primers used in the present study. This file contains the sequence information of all the intron spanning primers which generated polymorphic IP markers deployed to develop the B. juncea genetic map in the present study.Click here for file[http://www.biomedcentral.com/content/supplementary/1471-2164-9-113-S1.xls]
Additional file 2Comparative genome organization of the A genome of B. juncea (A1–A10; present study) and B. napus (N1–N10) [16]. This file contains the map of the A genome of B. napus [16] with the RFLP loci converted to their corresponding At (A. thaliana) loci and a detailed comparison (in terms of the At loci arrangement) of this map with the A genome of B. juncea (present study).Click here for file[http://www.biomedcentral.com/content/supplementary/1471-2164-9-113-S2.ppt]
Additional file 3Comparative genome organization of the B genome of B. juncea (B1–B8; present study) and B. nigra (G1–G8) [18]. This file contains the map of the B genome of B. nigra [18] with the RFLP loci converted to their cor-responding At (A. thaliana) loci and a detailed comparison (in terms of the At loci arrangement) of this map with the B genome of B. juncea (present study).Click here for file[http://www.biomedcentral.com/content/supplementary/1471-2164-9-113-S3.ppt]
Additional file 4The C genome map of B. napus [16] with the RFLP probes converted to their corresponding At loci.Click here for file[http://www.biomedcentral.com/content/supplementary/1471-2164-9-113-S4.ppt]
Additional file 5Putative ancestral Brassica karyotype (ABK2–ABK6). The file contains the figurative representation of the putative ancestral Brassica karyotype (ABK2–ABK6) predicted in our study. This is based on the conserved group structure of groups 2, 3, 4, 5 and 6 (Figure 7). Only partial organ-ization of the putative linkage groups ABK2 and ABK3 is shown represent-ing the common blocks shared between the three diploid Brassica genomes.Click here for file[http://www.biomedcentral.com/content/supplementary/1471-2164-9-113-S5.ppt]
Page 17 of 19(page number not for citation purposes)

BMC Genomics 2008, 9:113 http://www.biomedcentral.com/1471-2164/9/113
AcknowledgementsThe work was financially supported by Dhara Vegetable Oil and Food Com-pany Ltd (DOFCO), a subsidiary of the National Dairy Development Board (NDDB), India. Partial support came from the UGC-SAP programme. SS was funded by a fellowship from the Department of Science and Technol-ogy (DST) under the SERC Fast Track Scheme for Young Scientists. LP was supported by a research fellowship from the Council of Scientific and Indus-trial Research (CSIR). Arundhati Mukhopadhyay, N Arumugam and Y S Sodhi contributed to the development of the mapping population used in the study and Jagdish Verma maintained it in the field.
References1. Johnston JS, Pepper AE, Hall AE, Chen ZJ, Hodnett G, Drabek J, Lopez
R, Price HJ: Evolution of genome size in Brassicaceae. Ann Bot2005, 95:229-235.
2. Lynch M, Force A: The probability of duplicate gene preserva-tion by subfunctionalization. Genetics 2000, 154:459-473.
3. He X, Zhang J: Rapid subfunctionalization accompanied byprolonged and substantial neofunctionalization in duplicategene evolution. Genetics 2005, 169:1157-1164.
4. Roth C, Rastogi S, Arvestad L, Dittmar K, Light S, Ekman D, LiberlesDA: Evolution after gene duplication: models, mechanisms,sequences, systems and organisms. J Exp Zool 2007,306B:58-73.
5. Snowdon RJ, Friedt W: Molecular markers in Brassica oilseedbreeding: current status and future possibilities. Plant Breeding2004, 123:1-8.
6. Mahmood T, Rahman MH, Stringam GR, Yeh F, Good AG: Identifi-cation of quantitative trait loci (QTL) for oil and protein con-tents and their relationships with other seed quality traits inBrassica juncea. Theor Appl Genet 2006, 113:1211-1220.
7. Qiu D, Morgan C, Shi J, Long Y, Liu J, Li R, Zhuang X, Wang Y, TanX, Dietrich E, Weihmann T, Everett C, Vanstraelen S, Beckett P, Fra-ser F, Trick M, Barnes S, Wilmer J, Schmidt R, Li J, Li D, Meng J, Ban-croft I: A comparative linkage map of oilseed rape and its usefor QTL analysis of seed oil and erucic acid content. TheorAppl Genet 2006, 114:67-80.
8. Chen W, Zhang Y, Liu X, Chen B, Tu J, Tingdong F: Detection ofQTL for six yield-related traits in oilseed rape (Brassicanapus) using DH and immortalized F(2) populations. TheorAppl Genet 2007, 115:849-858.
9. Fu FY, Liu LZ, Chai YR, Chen L, Yang T, Jin MY, Ma AF, Yan XY, ZhangZS, Li JN: Localization of QTLs for seed color using recom-binant inbred lines of Brassica napus in different environ-ments. Genome 2007, 50:840-854.
10. Okazaki K, Sakamoto K, Kikuchi R, Saito A, Togashi E, Kuginuki Y,Matsumoto S, Hirai M: Mapping and characterization of FLChomologs and QTL analysis of flowering time in Brassica oler-acea. Theor Appl Genet 2007, 114:595-608.
11. Ramchiary N, Padmaja KL, Sharma S, Gupta V, Sodhi YS, Mukhopad-hyay A, Arumugam N, Pental D, Pradhan AK: Mapping of yieldinfluencing QTL in Brassica juncea: implications for breedingof a major oilseed crop of dryland areas. Theor Appl Genet 2007,115:807-817.
12. Soengas P, Hand P, Vicente JG, Pole JM, Pink DA: Identification ofquantitative trait loci for resistance to Xanthomonas campes-tris pv. campestris in Brassica rapa. Theor Appl Genet 2007,114:637-645.
13. Quijada PA, Udall JA, Lambert B, Osborn TC: Quantitative traitanalysis of seed yield and other complex traits in hybridspring rapeseed (Brassica napus L.): 1. Identification ofgenomic regions from winter germplasm. Theor Appl Genet2006, 113:549-561.
14. Udall JA, Quijada PA, Lambert B, Osborn TC: Quantitative traitanalysis of seed yield and other complex traits in hybridspring rapeseed (Brassica napus L.): 2. Identification of allelesfrom unadapted germplasm. Theor Appl Genet 2006,113:597-609.
15. Schranz ME, Lysak MA, Mitchell-Olds T: The ABC's of compara-tive genomics in the Brassicaceae: building blocks of crucifergenomes. Trends Plant Sci 2006, 11:535-542.
16. Parkin IAP, Gulden SM, Sharpe AG, Lukens L, Trick M, Osborn TC,Lydiate DJ: Segmental structure of the Brassica napus genome
based on comparative analysis with Arabidopsis thaliana.Genetics 2005, 171:765-781.
17. Lagercrantz U, Lydiate DJ: Comparative genome mapping inBrassica. Genetics 1996, 144:1903-1910.
18. Lagercrantz U: Comparative mapping between Arabidopsisthaliana and Brassica nigra indicates that Brassica genomeshave evolved through extensive genome replication accom-panied by chromosome fusions and frequent rearrange-ments. Genetics 1998, 150:1217-1228.
19. Lan T-H, DelMonte TA, Reischmann KP, Hyman J, Kowalski SP,McFerson J, Kresovich S, Paterson AH: An EST – enriched com-parative map of Brassica oleracea and Arabidopsis thaliana.Genome Res 2000, 10:776-788.
20. Babula D, Kaczmarek M, Barakat A, Delseny M, Quiros CF, SadowskiJ: Chromosomal mapping of Brassica oleracea based on ESTsfrom Arabidopsis thaliana: complexity of the comparativemap. Mol Gen Genomics 2003, 268:656-665.
21. Kuittinen H, de Haan AA, Vogl C, Oikarinen S, Leppälä J, Koch M,Mitchell-Olds T, Langley CH, Savolainen O: Comparing the link-age maps of the close relatives Arabidopsis lyrata and A. thal-iana. Genetics 2004, 168:1575-1584.
22. Boivin K, Acarkan A, Mbulu R-S, Clarenz O, Schmidt R: The Arabi-dopsis genome sequence as a tool for genome analysis inBrassicaceae. A comparison of the Arabidopsis and Capsellarubella genomes. Plant Physiol 2004, 135:735-744.
23. Lysak MA, Berr A, Pecinka A, Schmidt R, McBreen K, Schubert I:Mechanisms of chromosome number reduction in Arabidop-sis thaliana and related Brassicaceae species. Proc Natl Acad SciUSA 2006, 103:5224-5229.
24. Lukens L, Zou F, Lydiate D, Parkin I, Osborn T: Comparison of aBrassica oleracea genetic map with the genome of Arabidopsisthaliana. Genetics 2003, 164:359-372.
25. Choi H-K, Kim D, Uhm T, Limpens E, Lim H, Mun J-H, Kalo P, Pen-metsa RV, Seres A, Kulikova O, Roe BA, Bisseling T, Kiss GB, CookDR: A sequence – based genetic map of Medicago truncatulaand comparison of marker colinearity with M. sativa. Genetics2004, 166:1463-1502.
26. Bertin I, Zhu JH, Gale MD: SSCP-SNP in pearl millet – a newmarker system for comparative genetics. Theor Appl Genet2005, 110:1467-1472.
27. Wei H, Fu Y, Arora R: Intron-flanking EST-PCR markers: fromgenetic marker development to gene structure analysis inRhododendron. Theor Appl Genet 2005, 111:1347-1356.
28. Arabidopsis DB: [http://cgpdb.ucdavis.edu/COS_Arabidopsis/data/arabidopsis_single_copy_genes.fasta].
29. Brassica DB: [http://www.atidb.org/cgi-perl/gbrowse/atibrowse/].30. Pradhan AK, Gupta V, Mukhopadhyay A, Arumugam N, Sodhi YS,
Pental D: A high – density linkage map in Brassica juncea(Indian mustard) using AFLP and RFLP markers. Theor ApplGenet 2003, 106:607-614.
31. TAIR DB: [http://www.arabidopsis.org/].32. Lysak MA, Koch MA, Pecinka A, Schubert I: Chromosome triplica-
tion found across the tribe Brassiceae. Genome Res 2005,15:516-525.
33. Quiros CF, Grellet F, Sadowski J, Suzuki T, Li G, Wroblewski T: Ara-bidopsis and Brassica comparative genomics: sequence,structure and gene content in the ABI1-Rps2-Ck1 chromo-somal segment and related regions. Genetics 2001,157:1321-1330.
34. Arabidopsis Genome Initiative: Analysis of the genome sequenceof the flowering plant Arabidopsis thaliana. Nature 2000,408:796-815.
35. Song K, Lu P, Tang K, Osborn TC: Rapid genome change in syn-thetic polyploids of Brassica and its implications for polyploidevolution. Proc Natl Acad Sci 1995, 92:7719-7723.
36. Osborn TC: The contribution of polyploidy to variation inBrassica species. Physiol Plant 2004, 121:531-536.
37. Pires JC, Zhao J, Schranz ME, Leon EJ, Quijada PA, Lukens LN,Osborn TC: Flowering time divergence and genomic rear-rangements in resynthesized Brassica polyploids (Brassi-caceae). Biol J Linnean Soc 2004, 82:675-688.
38. Warwick SI, Black LD: Molecular systematics of Brassica andallied genera (subtribe Brassicinae, Brassiceae) – chloroplastgenome and cytodeme congruence. Theor Appl Genet 1991,82:81-92.
Page 18 of 19(page number not for citation purposes)
http://www.ncbi.nlm.nih.gov/entrez/query.fcgi?cmd=Retrieve&db=PubMed&dopt=Abstract&list_uids=8978073
http://www.ncbi.nlm.nih.gov/entrez/query.fcgi?cmd=Retrieve&db=PubMed&dopt=Abstract&list_uids=8978073
http://www.ncbi.nlm.nih.gov/entrez/query.fcgi?cmd=Retrieve&db=PubMed&dopt=Abstract&list_uids=9799273
http://www.ncbi.nlm.nih.gov/entrez/query.fcgi?cmd=Retrieve&db=PubMed&dopt=Abstract&list_uids=9799273
http://www.ncbi.nlm.nih.gov/entrez/query.fcgi?cmd=Retrieve&db=PubMed&dopt=Abstract&list_uids=9799273
http://www.ncbi.nlm.nih.gov/entrez/query.fcgi?cmd=Retrieve&db=PubMed&dopt=Abstract&list_uids=7644483

BMC Genomics 2008, 9:113 http://www.biomedcentral.com/1471-2164/9/113
Publish with BioMed Central and every scientist can read your work free of charge
"BioMed Central will be the most significant development for disseminating the results of biomedical research in our lifetime."
Sir Paul Nurse, Cancer Research UK
Your research papers will be:
available free of charge to the entire biomedical community
peer reviewed and published immediately upon acceptance
cited in PubMed and archived on PubMed Central
yours — you keep the copyright
Submit your manuscript here:http://www.biomedcentral.com/info/publishing_adv.asp
BioMedcentral
39. Pradhan AK, Prakash S, Mukhopadhyay A, Pental D: Phylogeny ofBrassica and allied genera based on variation in chloroplastand mitochondrial DNA patterns: molecular and taxonomicclassifications are incongruous. Theor Appl Genet 1992,85:331-340.
40. Yogeeswaran K, Frary A, York TL, Amenta A, Lesser AH, NasrallahJB, Tanksley SD, Nasrallah ME: Comparative genome analyses ofArabidopsis spp.: inferring chromosomal rearrangementevents in the evolutionary history of A. thaliana. Genome Res2005, 15:505-515.
41. Koch MA, Kiefer M: Genome evolution among cruciferousplants: a lecture from the comparison of the genetic maps ofthree diploid species – Capsella rubella, Arabidopsis lyratasubsp. petraea and A. thaliana. Am J Botany 2005, 92:761-767.
42. Devos KM, Gale MD: Genome relationships: the grass model incurrent research. Plant Cell 2000, 12:637-646.
43. Feuillet C, Keller B: Comparative genomics in the grass family:molecular characterization of grass genome structure andevolution. Ann Bot 2002, 89:3-10.
44. Devos KM: Updating the 'Crop Circle'. Curr Opin Plant Biol 2005,8:155-162.
45. Stam P: Construction of integrated genetic linkage maps bymeans of a new computer package: JoinMap. Plant 1993,3:739-744.
46. Stam P, van Ooijen JW: JoinMap version 2.0: software for thecalculation of genetic linkage maps. CPRO-DLO. Wageningen1996.
Page 19 of 19(page number not for citation purposes)