Association of Breast Cancer Resistance Protein/ABCG2 Phenotypes and Novel Promoter and Intron 1...
16
Association of Breast Cancer Resistance Protein/ABCG2 Phenotypes and Novel Promoter and Intron 1 Single Nucleotide Polymorphisms □ S Balasubramanian Poonkuzhali, Jatinder Lamba, Stephen Strom, Alex Sparreboom, Kenneth Thummel, Paul Watkins, and Erin Schuetz Department of Pharmaceutical Sciences, St. Jude Children’s Research Hospital, Memphis, Tennessee (B.P., J.L., A.S., E.S.); Department of Pathology, University of Pittsburgh, Pittsburgh, Pennsylvania (S.S.); Department of Pharmaceutics, University of Washington, Seattle, Washington (K.T.); and Department of Medicine, Division of Hepatology, University of North Carolina, Chapel Hill, North Carolina (P.W.) Received August 16, 2007; accepted January 3, 2008 ABSTRACT: The hypothesis was tested that sequence diversity in breast can- cer resistance protein (BCRP)’s cis-regulatory region is a signifi- cant determinant of BCRP expression. The BCRP promoter and intron 1 were resequenced in lymphoblast DNA from the polymor- phism discovery resource (PDR) 44 subset. BCRP single nucleotide polymorphisms (SNPs) were genotyped in donor human livers, intestines, and lymphoblasts quantitatively phenotyped for BCRP mRNA expression. Carriers of the 15622C>T SNP had lower BCRP expression in multiple tissues. The intron 1 SNP 16702C>T was associated with high expression in livers; 1143G>A was associated with low expression in intestine; 12283T>C was asso- ciated with higher expression in the PDR44 and White livers. The 15994C>T promoter SNP was significantly associated with higher BCRP expression in multiple tissues. Patients with the 15994C>T genotype had substantially higher clearance of p.o. imatinib. We next determined whether BCRP expression was re- lated to polymorphic alternative splicing or alternative promoter use. Liver polymorphically expressed an alternatively spliced mRNA [splice variant (SV) 1] skipping exon 2. Although SV1 livers did not uniformly carry the exon 2 G34A allele, 90% of G34A livers expressed SV1 (versus 4% of 34GG livers). BCRP mRNA was sig- nificantly lower among Hispanic livers with the G34A variant geno- type and may be due, in part, to polymorphic exon 2 splicing. Analysis of allele expression imbalance (AEI) showed that PDR44 samples with AEI had lower BCRP mRNA expression; however, no linked cis-polymorphisms were identified. BCRP used multiple promoters, and livers differentially using alternative exon 1b had lower BCRP. In conclusion, BCRP expression in lymphoblasts, liver, and intestine is associated with novel promoter and intron 1 SNPs. The efflux transporter breast cancer resistance protein (BCRP) (ABCG2, MXR, ABCp) is expressed in many tissues, including intestine, placenta, mammary gland, and liver. BCRP plays an important role in the absorption, distribution, and elimination of a growing list of drugs that are its substrates, including the anticancer agents mitoxantrone, doxorubicin, topotecan, imatinib, and methotrexate. BCRP also transports dietary carcinogens and endogenous substrates such as protoporphyrin IX and vitamin B 2 (Jonker et al., 2007; van Herwaarden et al., 2007) and can be inhibited by a growing number of drugs (e.g., gefitinib, nelfinavir) (Burger et al., 2004; Ozvegy-Laczka et al., 2004). Moreover, BCRP is highly expressed as a stem cell marker in a variety of cell types (Zhou et al., 2001; Smalley and Clarke, 2005). BCRP shows significant interindividual variation in expression (Ross et al., 2000; Zamber et al., 2003). BCRP overexpression has been described in drug-resistant ovary, breast, colon, and gastric cancer, fibrosarcoma cell lines, placental tissue, liver canalicular membranes, ducts and lobules of the breast, endothelium of veins and capillaries, epithelium of colon and small intestine, and bile canaliculi (Maliepaard et al., 2001). Increased expression of BCRP has been associated with poor treatment outcome (increased risk of relapse, decreased disease-free survival) in various leukemias, although this observation is controversial (Ross et al., 2000; Damiani et al., 2006). Phenotypes associated with decreased, absent, or drug-inhibited BCRP can be predicted from studies in BCRP / mice. Mice lacking This work is supported in part by the National Institutes of Health (NIH)/ National Institute of General Medical Sciences Pharmacogenetics Research Net- work and Database (U01GM61374, http://pharmgkb.org) under Grant U01 GM61393, and the NIH P30 CA21765 Cancer Center Support grant, and by the American Lebanese Syrian Associated Charities (ALSAC). Article, publication date, and citation information can be found at http://dmd.aspetjournals.org. doi:10.1124/dmd.107.018366. □ S The online version of this article (available at http://dmd.aspetjournals.org) contains supplemental material. ABBREVIATIONS: BCRP, breast cancer resistance protein; SNP, single nucleotide polymorphism; PDR, polymorphism discovery resource; kb, kilobase; TF, transcription factor; HNF, hepatic nuclear factor; NF, nuclear factor; CEBP, CCAAT/enhancer binding protein; UCSC, University of California, Santa Cruz; ECR, evolutionary conserved regions; PCR, polymerase chain reaction; SV, splice variant; AEI, allele expression imbalance; LOH, loss of heterozygosity; PPAR, peroxisome proliferator-activated receptor; CEPH, Centre de’Etude du Polymorphism Humain; bp, base pair; ATG, translation start site; EST, expressed sequence tag; LD, linkage disequilibrium. 0090-9556/08/3604-780–795$20.00 DRUG METABOLISM AND DISPOSITION Vol. 36, No. 4 Copyright © 2008 by The American Society for Pharmacology and Experimental Therapeutics 18366/3315249 DMD 36:780–795, 2008 Printed in U.S.A. 780 http://dmd.aspetjournals.org/content/suppl/2008/01/08/dmd.107.018366.DC1.html Supplemental material to this article can be found at: at ASPET Journals on May 7, 2015 dmd.aspetjournals.org Downloaded from
-
Upload
independent -
Category
Documents
-
view
0 -
download
0
Transcript of Association of Breast Cancer Resistance Protein/ABCG2 Phenotypes and Novel Promoter and Intron 1...

Association of Breast Cancer Resistance Protein/ABCG2Phenotypes and Novel Promoter and Intron 1 Single
Nucleotide Polymorphisms□S
Balasubramanian Poonkuzhali, Jatinder Lamba, Stephen Strom, Alex Sparreboom,Kenneth Thummel, Paul Watkins, and Erin Schuetz
Department of Pharmaceutical Sciences, St. Jude Children’s Research Hospital, Memphis, Tennessee (B.P., J.L., A.S., E.S.);Department of Pathology, University of Pittsburgh, Pittsburgh, Pennsylvania (S.S.); Department of Pharmaceutics,
University of Washington, Seattle, Washington (K.T.); and Department of Medicine, Division of Hepatology,University of North Carolina, Chapel Hill, North Carolina (P.W.)
Received August 16, 2007; accepted January 3, 2008
ABSTRACT:
The hypothesis was tested that sequence diversity in breast can-cer resistance protein (BCRP)’s cis-regulatory region is a signifi-cant determinant of BCRP expression. The BCRP promoter andintron 1 were resequenced in lymphoblast DNA from the polymor-phism discovery resource (PDR) 44 subset. BCRP single nucleotidepolymorphisms (SNPs) were genotyped in donor human livers,intestines, and lymphoblasts quantitatively phenotyped for BCRPmRNA expression. Carriers of the �15622C>T SNP had lowerBCRP expression in multiple tissues. The intron 1 SNP 16702C>Twas associated with high expression in livers; 1143G>A wasassociated with low expression in intestine; 12283T>C was asso-ciated with higher expression in the PDR44 and White livers. The�15994C>T promoter SNP was significantly associated withhigher BCRP expression in multiple tissues. Patients with the�15994C>T genotype had substantially higher clearance of p.o.
imatinib. We next determined whether BCRP expression was re-lated to polymorphic alternative splicing or alternative promoteruse. Liver polymorphically expressed an alternatively splicedmRNA [splice variant (SV) 1] skipping exon 2. Although SV1� liversdid not uniformly carry the exon 2 G34A allele, 90% of G34A liversexpressed SV1 (versus 4% of 34GG livers). BCRP mRNA was sig-nificantly lower among Hispanic livers with the G34A variant geno-type and may be due, in part, to polymorphic exon 2 splicing.Analysis of allele expression imbalance (AEI) showed that PDR44samples with AEI had lower BCRP mRNA expression; however, nolinked cis-polymorphisms were identified. BCRP used multiplepromoters, and livers differentially using alternative exon 1b hadlower BCRP. In conclusion, BCRP expression in lymphoblasts,liver, and intestine is associated with novel promoter and intron 1SNPs.
The efflux transporter breast cancer resistance protein (BCRP)(ABCG2, MXR, ABCp) is expressed in many tissues, including intestine,placenta, mammary gland, and liver. BCRP plays an important role in theabsorption, distribution, and elimination of a growing list of drugs that areits substrates, including the anticancer agents mitoxantrone, doxorubicin,topotecan, imatinib, and methotrexate. BCRP also transports dietarycarcinogens and endogenous substrates such as protoporphyrin IX and
vitamin B2 (Jonker et al., 2007; van Herwaarden et al., 2007) and can beinhibited by a growing number of drugs (e.g., gefitinib, nelfinavir)(Burger et al., 2004; Ozvegy-Laczka et al., 2004). Moreover, BCRP ishighly expressed as a stem cell marker in a variety of cell types (Zhou etal., 2001; Smalley and Clarke, 2005).
BCRP shows significant interindividual variation in expression(Ross et al., 2000; Zamber et al., 2003). BCRP overexpression hasbeen described in drug-resistant ovary, breast, colon, and gastriccancer, fibrosarcoma cell lines, placental tissue, liver canalicularmembranes, ducts and lobules of the breast, endothelium of veins andcapillaries, epithelium of colon and small intestine, and bile canaliculi(Maliepaard et al., 2001). Increased expression of BCRP has beenassociated with poor treatment outcome (increased risk of relapse,decreased disease-free survival) in various leukemias, although thisobservation is controversial (Ross et al., 2000; Damiani et al., 2006).
Phenotypes associated with decreased, absent, or drug-inhibitedBCRP can be predicted from studies in BCRP�/� mice. Mice lacking
This work is supported in part by the National Institutes of Health (NIH)/National Institute of General Medical Sciences Pharmacogenetics Research Net-work and Database (U01GM61374, http://pharmgkb.org) under Grant U01GM61393, and the NIH P30 CA21765 Cancer Center Support grant, and by theAmerican Lebanese Syrian Associated Charities (ALSAC).
Article, publication date, and citation information can be found athttp://dmd.aspetjournals.org.
doi:10.1124/dmd.107.018366.□S The online version of this article (available at http://dmd.aspetjournals.org)
contains supplemental material.
ABBREVIATIONS: BCRP, breast cancer resistance protein; SNP, single nucleotide polymorphism; PDR, polymorphism discovery resource; kb,kilobase; TF, transcription factor; HNF, hepatic nuclear factor; NF, nuclear factor; CEBP, CCAAT/enhancer binding protein; UCSC, University ofCalifornia, Santa Cruz; ECR, evolutionary conserved regions; PCR, polymerase chain reaction; SV, splice variant; AEI, allele expression imbalance;LOH, loss of heterozygosity; PPAR, peroxisome proliferator-activated receptor; CEPH, Centre de’Etude du Polymorphism Humain; bp, base pair;ATG, translation start site; EST, expressed sequence tag; LD, linkage disequilibrium.
0090-9556/08/3604-780–795$20.00DRUG METABOLISM AND DISPOSITION Vol. 36, No. 4Copyright © 2008 by The American Society for Pharmacology and Experimental Therapeutics 18366/3315249DMD 36:780–795, 2008 Printed in U.S.A.
780
http://dmd.aspetjournals.org/content/suppl/2008/01/08/dmd.107.018366.DC1.htmlSupplemental material to this article can be found at:
at ASPE
T Journals on M
ay 7, 2015dm
d.aspetjournals.orgD
ownloaded from

BCRP and exposed to a diet rich in chlorophyll experienced increasedphototoxicity and protoporphyria. This is relevant to humans becausephototoxicity, skin blisters, elevated porphyrins, and iron have nowbeen reported in some humans treated with the BCRP substrate/inhibitor imatinib mesylate (Ho et al., 2003). Thus, humans withaltered BCRP function resulting from variant alleles may be expectedto show altered drug disposition, efficacy, and toxicities includingporphyrias and phototoxicity.
We previously identified several naturally occurring BCRP variants(Zamber et al., 2003). Among the coding single nucleotide polymor-phisms (SNPs), G34A (V12M) in exon 2 and C421A (Q141K) in exon5 occur in most racial groups but with a higher allele frequency inAsians and Hispanics. The C421A polymorphism is associated withsimilar levels of mRNA but decreased protein expression in PA317cells (Imai et al., 2002). Several groups have reported that the C421Agenotype is associated with altered pharmacokinetic parameters ofsome BCRP substrates (de Jong et al., 2004; Sparreboom et al., 2004),whereas others have not found an association (Mathijssen et al.,2003). Notably, the C421A allele has the signature of recent positiveselection, and it is strongest in the Asian population (Wang et al.,2007), suggesting there is some advantageous property of this geno-type. The BCRP G34A variant has been reported to have transportactivity similar to wild-type BCRP in transport of methotrexate,dehydroepiandrosterone sulfate (Kondo et al., 2004), and porphyrin(Tamura et al., 2006). However, the frequency of the variant codingalleles cannot completely explain most human variation in BCRPexpression or activity.
We tested the hypothesis that cis-polymorphisms affecting BCRPexpression are present in DNA regulatory sequences in the promoterand intron 1 and could further explain variation in BCRP expression.Moreover, because variation in BCRP expression in tumors and stemcells involved differential use of alternative first exons (Nakanishi etal., 2006; Zong et al., 2006), we simultaneously determined whetherBCRP expression (and associated SNPs) might be related to polymor-phic splicing or differential promoter use.
Materials and Methods
Subjects. The Institutional Review Boards and Clinical Research AdvisoryCommittees at St. Jude Children’s Research Hospital, the University of Pitts-burgh, the University of North Carolina, and the University of Washingtonapproved the use of these tissue samples for genotyping studies.
Sample Set I. A subset of 44 DNA samples from the polymorphismdiscovery resource (PDR44) was purchased from the Coriell cell/DNA repos-itory (http://ccr.coriell.org/nigms/products/pdr.html). These samples representthe major ethnic groups in the United States (European 26%, African 26%,Mexican 13%, Native American 6%, and Asian 26%) and were used for SNPdiscovery.
Sample Set II. Human liver tissue for sample set II was processed throughthe St. Jude Liver Resource at St. Jude Children’s Research Hospital and wasprovided by the Liver Tissue Procurement and Distribution System (NationalInstitutes of Health contract N01-DK-9-2310) and by the Cooperative HumanTissue Network. DNA from a set of 60 liver samples from three different racialgroups [White (n � 15; 10 males and 5 females), African Americans (n � 17;9 males and 8 females), and Hispanics (n � 28; 19 males and 9 females)] wereincluded for genotyping the common SNPs that were identified in the PDR44.In addition to these SNPs, the full-length BCRP cDNA was amplified andsequenced to look for any other coding sequence variations in these samples.
Sample Set III. DNA from 28 White intestinal biopsy samples (10 from theUniversity of Washington and 18 from the University of North Carolina) wasprocessed as described previously (Mouly et al., 2005) and genotyped for thecommon SNPs identified in the PDR44.
Patient DNA. Samples were obtained at steady state from adult patientspositive for c-kit gastrointestinal stromal tumors. Pharmacokinetic data havebeen described previously on a subset of 82 patients (Gardner et al., 2006).
None of the patients received any medication aside from imatinib that couldpossibly influence the activity of BCRP or the pharmacokinetic profile ofimatinib. The study protocol was approved by the Institutional Review Boards(Leuven, Belgium and Rotterdam, The Netherlands), and written informedconsent was obtained from each patient.
Genomic DNA was extracted from 1 ml of plasma using the UltraSensVirus Kit (Qiagen, Valencia, CA), and the REPLI-g mini/midi kit (Qiagen)was used to amplify genomic DNA. Imatinib concentrations in plasma weredetermined by validated analytical methods using liquid chromatography withtandem mass-spectrometric detection (Guetens et al., 2003). Pharmacokineticparameters, including area under curve, steady-state concentration, and appar-ent oral clearance, were obtained for each patient by noncompartmental anal-ysis using WinNonlin version 5.0 (Pharsight, Mountain View, CA).
The association of variant genotypes with the pharmacokinetic parametersof imatinib was based on a nonparametric Mann-Whitney U test (two-groupcomparison) or a Kruskal-Wallis test (multiple-group comparison). A p � 0.05was considered statically significant.
In Silico Analysis of the BCRP/ABCG2 Gene to Identify PotentialRegulatory Regions to Resequence. Several web-based bioinformatic toolswere used to screen 49 kilobases (kb) of the BCRP gene (30 kb proximalpromoter, introns, 18.9 kb intron 1) for the presence of DNA response elementsfor liver-enriched transcription factors (TFs) and for regions of high evolu-tionarily conservation between multiple species. Cister plot (http://zlab.bu.edu/�mfrith/cister.shtml), NUBIScan (http://www.nubiscan.unibas.ch/), and Transfac(http://transfac.gbf.de/TRANSFAC/lists/matrix/matrixByName.html) were usedto identify regions harboring DNA response elements for various TFs. [TFmatrices included hepatic nuclear factor (HNF) 1, HNF3, GATA, activatorprotein-1, CDX, FOX, SP1, nuclear factor (NF), TATA, CAAT, YY1, DR3and DR4, pregnane X receptor, DR3, DR1, HNF4_DR1, HNF1, HNF3�,HNF4, HNF3�, CCAAT/enhancer binding protein (CEBP)-�, CEBP, CEBP�,HNF6, CEBP�, GATA4, glucocorticoid receptor, HNF3�, NF-1, NF-�B, SP1,and TATA, cAMP response element, estrogen response element, NF-1, E2F,Mef-2, Myf, CCAAT, activator protein-1, Ets, Myc, GATA, LSF, SRF, andTef.] The University of California, Santa Cruz (UCSC) genome browser(http://genome.ucsc.edu), evolutionary conserved region (ECR) (http://ecrbrowser.dcode.org/), and rVISTA (http://genome.lbl.gov/vista/rvista/submit.shtml) were used to identify regions of evolutionary conservation onthe BCRP gene between humans and other species.
DNA Sequencing of BCRP Polymerase Chain Reaction Amplicons. Theregions identified by in silico analysis were amplified from genomic DNAusing specific primers (Table 1). Amplification was carried out in a 1�polymerase chain reaction (PCR) buffer using 50 ng of DNA, 10 pmol each offorward and reverse primers, 0.2 mM dNTPs, and 1.5 units of Taq polymerase(Expand High Fidelity PCR System, Roche, Basel, Switzerland). The PCRconditions include initial denaturation at 95°C for 3 min, followed by 32 to 34cycles of denaturation at 95°C, annealing at appropriate temperatures, andsynthesis at 72°C, with final synthesis at 72°C for 10 min. PCR products werechecked for the correct size by agarose gel electrophoresis. Before sequencing,unincorporated nucleotides and primers were removed by incubation withshrimp alkaline phosphatase (U.S. Biochemical Corp., Cleveland, OH) andexonuclease I (U.S. Biochemical Corp.) for 30 min at 37°C, followed byenzyme inactivation at 80°C for 15 min. Sequencing was carried out on an ABIPrism 3700 Automated Sequencer (Applied Biosystems, Foster City, CA)using the PCR primers or internal sequencing primers (Table 1). Sequenceswere assembled using the Phred-Phrap-Consed package (University of Wash-ington, Seattle, WA; http://droog.mbt.washington.edu/PolyPhred.html), whichautomatically detects the presence of heterozygous single nucleotide substitu-tions by fluorescence-based sequencing of PCR products. Two regions wereproblematic to genotype: 1) a region in intron 1 (position 32222 to 32252 inAC084732) with polymorphic repeats in some PDR44 DNAs and 12 of 60liver samples; and 2) a region approximately �13 kb from the transcriptionstart site (designated: ?insertion in Table 2) did not produce any amplificationproduct in 30% of the samples in each of the cohorts screened. None of thevarious strategies (e.g., repositioning the primers, long-range PCR) used toidentify the nature of the genetic variation (large deletion or insertion) wassuccessful. DNA samples that were homozygous, but not heterozygous, for this“variation” could be genotyped.
781SEQUENCE DIVERSITY IN THE BCRP/ABCG2 PROMOTER
at ASPE
T Journals on M
ay 7, 2015dm
d.aspetjournals.orgD
ownloaded from
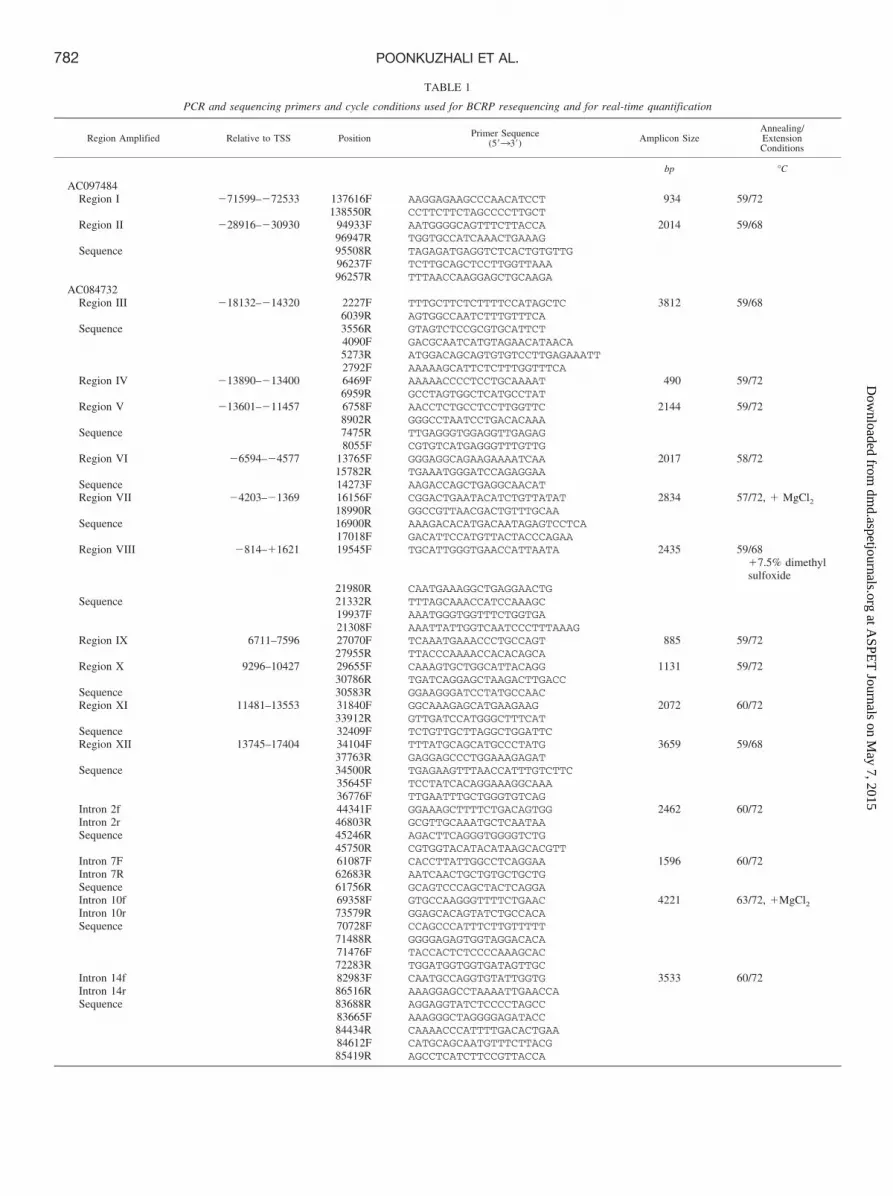
TABLE 1
PCR and sequencing primers and cycle conditions used for BCRP resequencing and for real-time quantification
Region Amplified Relative to TSS Position Primer Sequence(5�33�) Amplicon Size
Annealing/ExtensionConditions
bp °C
AC097484Region I �71599–�72533 137616F AAGGAGAAGCCCAACATCCT 934 59/72
138550R CCTTCTTCTAGCCCCTTGCTRegion II �28916–�30930 94933F AATGGGGCAGTTTCTTACCA 2014 59/68
96947R TGGTGCCATCAAACTGAAAGSequence 95508R TAGAGATGAGGTCTCACTGTGTTG
96237F TCTTGCAGCTCCTTGGTTAAA96257R TTTAACCAAGGAGCTGCAAGA
AC084732Region III �18132–�14320 2227F TTTGCTTCTCTTTTCCATAGCTC 3812 59/68
6039R AGTGGCCAATCTTTGTTTCASequence 3556R GTAGTCTCCGCGTGCATTCT
4090F GACGCAATCATGTAGAACATAACA5273R ATGGACAGCAGTGTGTCCTTGAGAAATT2792F AAAAAGCATTCTCTTTGGTTTCA
Region IV �13890–�13400 6469F AAAAACCCCTCCTGCAAAAT 490 59/726959R GCCTAGTGGCTCATGCCTAT
Region V �13601–�11457 6758F AACCTCTGCCTCCTTGGTTC 2144 59/728902R GGGCCTAATCCTGACACAAA
Sequence 7475R TTGAGGGTGGAGGTTGAGAG8055F CGTGTCATGAGGGTTTGTTG
Region VI �6594–�4577 13765F GGGAGGCAGAAGAAAATCAA 2017 58/7215782R TGAAATGGGATCCAGAGGAA
Sequence 14273F AAGACCAGCTGAGGCAACATRegion VII �4203–�1369 16156F CGGACTGAATACATCTGTTATAT 2834 57/72, � MgCl2
18990R GGCCGTTAACGACTGTTTGCAASequence 16900R AAAGACACATGACAATAGAGTCCTCA
17018F GACATTCCATGTTACTACCCAGAARegion VIII �814–�1621 19545F TGCATTGGGTGAACCATTAATA 2435 59/68
�7.5% dimethylsulfoxide
21980R CAATGAAAGGCTGAGGAACTGSequence 21332R TTTAGCAAACCATCCAAAGC
19937F AAATGGGTGGTTTCTGGTGA21308F AAATTATTGGTCAATCCCTTTAAAG
Region IX 6711–7596 27070F TCAAATGAAACCCTGCCAGT 885 59/7227955R TTACCCAAAACCACACAGCA
Region X 9296–10427 29655F CAAAGTGCTGGCATTACAGG 1131 59/7230786R TGATCAGGAGCTAAGACTTGACC
Sequence 30583R GGAAGGGATCCTATGCCAACRegion XI 11481–13553 31840F GGCAAAGAGCATGAAGAAG 2072 60/72
33912R GTTGATCCATGGGCTTTCATSequence 32409F TCTGTTGCTTAGGCTGGATTCRegion XII 13745–17404 34104F TTTATGCAGCATGCCCTATG 3659 59/68
37763R GAGGAGCCCTGGAAAGAGATSequence 34500R TGAGAAGTTTAACCATTTGTCTTC
35645F TCCTATCACAGGAAAGGCAAA36776F TTGAATTTGCTGGGTGTCAG
Intron 2f 44341F GGAAAGCTTTTCTGACAGTGG 2462 60/72Intron 2r 46803R GCGTTGCAAATGCTCAATAASequence 45246R AGACTTCAGGGTGGGGTCTG
45750R CGTGGTACATACATAAGCACGTTIntron 7F 61087F CACCTTATTGGCCTCAGGAA 1596 60/72Intron 7R 62683R AATCAACTGCTGTGCTGCTGSequence 61756R GCAGTCCCAGCTACTCAGGAIntron 10f 69358F GTGCCAAGGGTTTTCTGAAC 4221 63/72, �MgCl2Intron 10r 73579R GGAGCACAGTATCTGCCACASequence 70728F CCAGCCCATTTCTTGTTTTT
71488R GGGGAGAGTGGTAGGACACA71476F TACCACTCTCCCCAAAGCAC72283R TGGATGGTGGTGATAGTTGC
Intron 14f 82983F CAATGCCAGGTGTATTGGTG 3533 60/72Intron 14r 86516R AAAGGAGCCTAAAATTGAACCASequence 83688R AGGAGGTATCTCCCCTAGCC
83665F AAAGGGCTAGGGGAGATACC84434R CAAAACCCATTTTGACACTGAA84612F CATGCAGCAATGTTTCTTACG85419R AGCCTCATCTTCCGTTACCA
782 POONKUZHALI ET AL.
at ASPE
T Journals on M
ay 7, 2015dm
d.aspetjournals.orgD
ownloaded from

RNA Extraction and Real-Time Reverse Transcription-PCR. RNA wasisolated from sample sets I through III using TRIzol reagent (Invitrogen,Carlsbad, CA). The integrity of the isolated RNA was examined by quantitat-ing the A260/280 ratio and resolving the RNA on a 1% agarose gel. Total RNA(3–5 �g) was reverse-transcribed according to the manufacturer’s instructions(Invitrogen). Relative quantitation of BCRP RNA using real-time PCR wasperformed as described previously (Zamber et al., 2003) using QuantiTectSYBR green PCR kit (Qiagen). Amplification was done with the ABI PRISM7900HT Sequence Detection System (Applied Biosystems). Because we ob-served an additional dissociation curve (amplification of an additional alter-native mRNA) in some of the liver samples with these real-time primers(real-time F1/r), we redesigned the forward primer (real-time f2) (Table 1) toamplify only the wild-type mRNA for quantitation. (The rationale for rede-signing the primer was as follows: the additional dissociation curve weobserved in some samples was caused by insertion of part of intron 7; to avoidamplifying the splice variant (SV), we redesigned the forward primer flankingexons 7 and 8). The sequences of primers used for real-time PCR are given inTable 1. Relative BCRP RNA expression was calculated by the comparative Ctmethod and normalized versus glyceraldehyde-3-phosphate dehydrogenase asa reference transcript (Zamber et al., 2003).
Detection of Alternative First Exons and SVs of BCRP. The UCSCgenome browser of the May 2004 Human Genome assembly identified at leastthree alternative first exons and various BCRP alternatively spliced mRNAs.We designed forward primers in these alternative first exons and a reverseprimer in exon 6 of BCRP to check for the presence of these alternative firstexons in our tissues of interest: liver, intestine, and lymphoblasts. We alsotested for the presence of the SVs shown in the UCSC genome browser bydesigning primers in the flanking exons (Table 1). To check whether thesealternative first exons result in a full-length cDNA, reverse primers in exon 16and a nested reverse primer in exon 10 were used (Table 1).
Analysis of Allelic Imbalance. We used two different assays to determineallele expression imbalance (AEI). First, we sequenced the exon 2 G34A andexon 5 C421A SNPs in DNA and cDNA samples, and those showing disparitybetween the genomic and cDNA sequence [loss of heterozygosity (LOH) in thecDNA] were identified as having allelic imbalance. The results were confirmedusing an exon 5 allele-specific quantitation kit from ABI to quantitate BCRPsignal intensity from each allele in DNA versus RNA (Applied BiosystemsAssays on Demand), and the ratio of signal intensity for the C versus A allelewas calculated.
Quantification of BCRP Gene Copy Number by Real-Time PCR. BCRPgene copy number was determined by quantitative real-time PCR of genomicDNA as described previously (Lamba et al., 2006) from livers (White, n � 15;African Americans, n � 4; Hispanics, n � 3) and PDR samples representingthe highest, medium, and lowest BCRP RNA expressors (n � 5 in eachrange/tissue) using primer pairs (Table 1) to amplify portions of exon 2 or exon5 of BCRP using the SYBR Green PCR kit (Qiagen) according to the
manufacturer’s instructions. Each sample was quantitated in duplicate, andspecificity of amplification was determined by doing melt curve analysis.Standard curves were run with each plate. The quantitative values weredetermined for BCRP using the ��Ct method and normalized relative toCYP3A4 copy number values (Lamba et al., 2006).
Statistical Analysis. Statistical analysis to evaluate possible genotype-phenotype relationships was carried out using the R statistical package (http://www.R-project.org) and the Wilcoxon or Kruskal-Wallis test.
Results
In Silico Analysis of the BCRP Promoter and Intron 1. Becausethe human BCRP promoter (105 kb) and intron 1 (19 kb) total 124 kb,we used bioinformatic tools to judiciously choose regions for rese-quencing. Selection criteria targeted those regions most likely to befunctionally important: evolutionarily conserved sequences and re-gions containing clusters of TF binding sites. Figure 1, A and B,shows snapshots from the UCSC and ECR genome browsers withglobal alignment of mammalian, amphibian, bird, dog, mouse, rat,chick, fugu, and zebrafish. There is no synteny between the BCRPneighboring genes, and the closest 5� neighbor is 160 and 105 kb inmice and humans, respectively. A conserved region located approxi-mately �5 kb from the transcription start site (�15782/�15923 inRefSeq AC084732) was identified as encoding ribosomal protein L31(RPL31 mRNA). Because these two programs use global alignment todetect conserved regions, we confirmed this result using rVISTA, aprogram that uses gene-to-gene alignment. The ribosomal protein L31was confirmed in the promoter of human and mouse BCRP byrVISTA analysis.
The same regions of BCRP were next screened for clusters of TFbinding sites using matrices from Transfac and NUBIScan in theCister/Cluster Buster program (Fig. 1D), and additional regions wereidentified to resequence. In addition, we screened a 1-kb region thatencompassed an alternative exon 1c located �72 kb upstream ofBCRP and that is used in hematopoietic stem cells (Zong et al., 2006)(region 1, Table 1).
TFs found frequently in the ECR regions included HNF1 (liver- andgut-enriched TF), consistent with BCRP expression in liver and in-testine; peroxisome proliferator-activated receptor (PPAR) � andCEBP� and CEBP�, consistent with the role of the ABCG proteins inlipid and sterol homeostasis; CEBP and Cdx family TFs, important forregulating gene expression in the small intestine and for the reportedrole of Cdx2 in regulating iron homeostasis because BCRP transports
TABLE 1—Continued.
Region Amplified Relative to TSS Position Primer Sequence(5�33�) Amplicon Size
Annealing/ExtensionConditions
Reverse transcription-PCR primersAC084732
BCRP exon 1b-f 20049F AACCCAGCTAGGTCAGACGANM-004827
BCRP exon 1a-f 437F CCTGAGCCTTTGGTTAAGACCBCRP exon 6R 1057RBCRP real-time f1 1304F CAGGAGGCCTTGGGATACTTBCRP real-time f2 1324F TGAATCAGCTGGTTATCACTGBCRP real-time r 1411R TGCCACAGCAGTGGAATCTBCRP exon 8F 1348F GGCCTATAATAACCCTGCAGACBCRP exon 10R 1739R GCCCAAAGTAAATGGCACCTBCRP exon 14F 2152F TCTGTTGGTCAATCTCACAACCBCRP exon 16R 2431R CAGGTAGGCAATTGTGAGGAA
BC092408BCRP exon 1c-f 70F CTCGGAAAGCCTCAATGTTC
Copy number primersCYP3A4 CNVF CCCAGACTTGGCCATGGAAACCCYP3A4 CNVR CAGATAAGGGAAAGAGAGGC
TSS, transcription start site.
783SEQUENCE DIVERSITY IN THE BCRP/ABCG2 PROMOTER
at ASPE
T Journals on M
ay 7, 2015dm
d.aspetjournals.orgD
ownloaded from
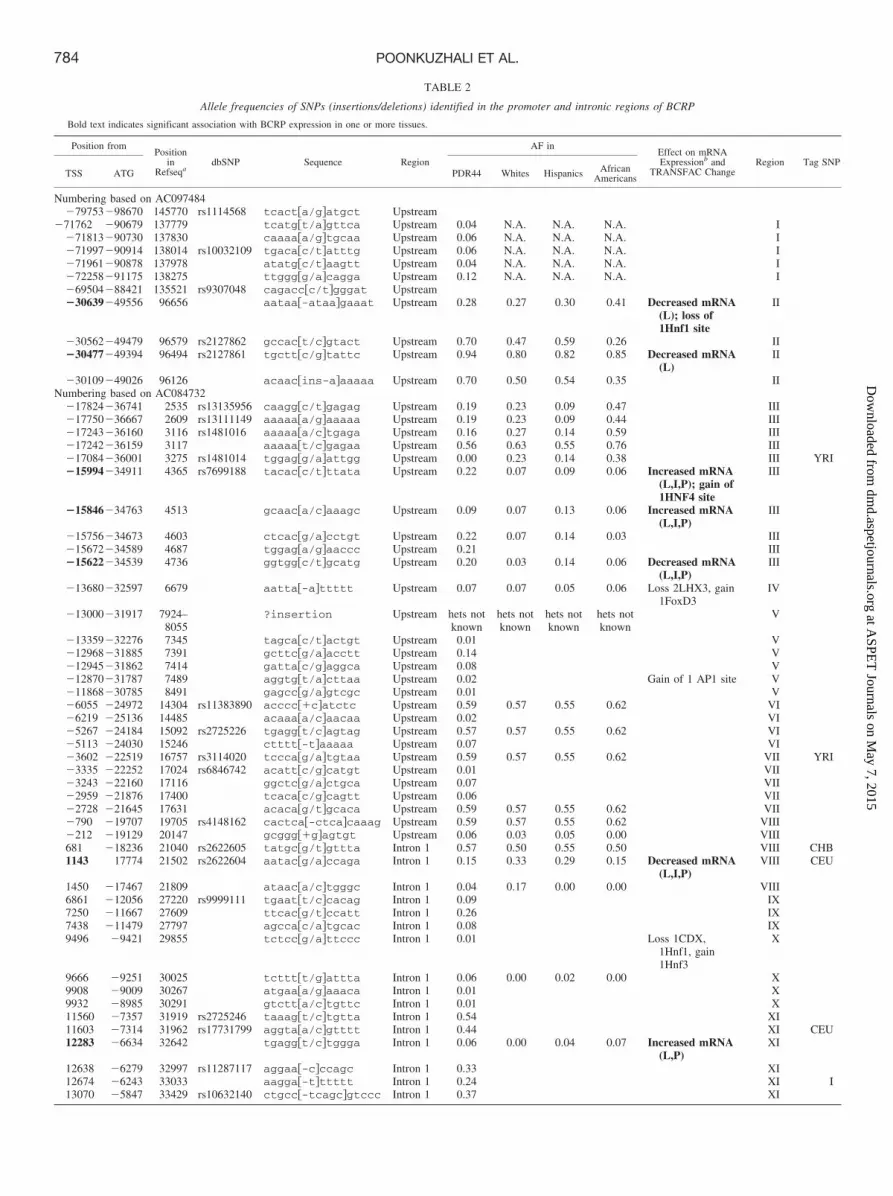
TABLE 2
Allele frequencies of SNPs (insertions/deletions) identified in the promoter and intronic regions of BCRP
Bold text indicates significant association with BCRP expression in one or more tissues.
Position fromPosition
inRefseqa
dbSNP Sequence Region
AF inEffect on mRNAExpressionb and
TRANSFAC ChangeRegion Tag SNP
TSS ATG PDR44 Whites Hispanics AfricanAmericans
Numbering based on AC097484�79753�98670 145770 rs1114568 tcacta/gatgct Upstream
�71762 �90679 137779 tcatgt/agttca Upstream 0.04 N.A. N.A. N.A. I�71813�90730 137830 caaaaa/gtgcaa Upstream 0.06 N.A. N.A. N.A. I�71997�90914 138014 rs10032109 tgacac/tatttg Upstream 0.06 N.A. N.A. N.A. I�71961�90878 137978 atatgc/taagtt Upstream 0.04 N.A. N.A. N.A. I�72258�91175 138275 ttgggg/acagga Upstream 0.12 N.A. N.A. N.A. I�69504�88421 135521 rs9307048 cagaccc/tgggat Upstream�30639�49556 96656 aataa-ataagaaat Upstream 0.28 0.27 0.30 0.41 Decreased mRNA
(L); loss of1Hnf1 site
II
�30562�49479 96579 rs2127862 gccact/cgtact Upstream 0.70 0.47 0.59 0.26 II�30477�49394 96494 rs2127861 tgcttc/gtattc Upstream 0.94 0.80 0.82 0.85 Decreased mRNA
(L)II
�30109�49026 96126 acaacins-aaaaaa Upstream 0.70 0.50 0.54 0.35 IINumbering based on AC084732
�17824�36741 2535 rs13135956 caaggc/tgagag Upstream 0.19 0.23 0.09 0.47 III�17750�36667 2609 rs13111149 aaaaaa/gaaaaa Upstream 0.19 0.23 0.09 0.44 III�17243�36160 3116 rs1481016 aaaaaa/ctgaga Upstream 0.16 0.27 0.14 0.59 III�17242�36159 3117 aaaaat/cgagaa Upstream 0.56 0.63 0.55 0.76 III�17084�36001 3275 rs1481014 tggagg/aattgg Upstream 0.00 0.23 0.14 0.38 III YRI�15994�34911 4365 rs7699188 tacacc/tttata Upstream 0.22 0.07 0.09 0.06 Increased mRNA
(L,I,P); gain of1HNF4 site
III
�15846�34763 4513 gcaaca/caaagc Upstream 0.09 0.07 0.13 0.06 Increased mRNA(L,I,P)
III
�15756�34673 4603 ctcacg/acctgt Upstream 0.22 0.07 0.14 0.03 III�15672�34589 4687 tggaga/gaaccc Upstream 0.21 III�15622�34539 4736 ggtggc/tgcatg Upstream 0.20 0.03 0.14 0.06 Decreased mRNA
(L,I,P)III
�13680�32597 6679 aatta-attttt Upstream 0.07 0.07 0.05 0.06 Loss 2LHX3, gain1FoxD3
IV
�13000�31917 7924–8055
?insertion Upstream hets notknown
hets notknown
hets notknown
hets notknown
V
�13359�32276 7345 tagcac/tactgt Upstream 0.01 V�12968�31885 7391 gcttcg/aacctt Upstream 0.14 V�12945�31862 7414 gattac/gaggca Upstream 0.08 V�12870�31787 7489 aggtgt/acttaa Upstream 0.02 Gain of 1 AP1 site V�11868�30785 8491 gagccg/agtcgc Upstream 0.01 V�6055 �24972 14304 rs11383890 acccc�catctc Upstream 0.59 0.57 0.55 0.62 VI�6219 �25136 14485 acaaaa/caacaa Upstream 0.02 VI�5267 �24184 15092 rs2725226 tgaggt/cagtag Upstream 0.57 0.57 0.55 0.62 VI�5113 �24030 15246 ctttt-taaaaa Upstream 0.07 VI�3602 �22519 16757 rs3114020 tcccag/atgtaa Upstream 0.59 0.57 0.55 0.62 VII YRI�3335 �22252 17024 rs6846742 acattc/gcatgt Upstream 0.01 VII�3243 �22160 17116 ggctcg/actgca Upstream 0.07 VII�2959 �21876 17400 tcacac/gcagtt Upstream 0.06 VII�2728 �21645 17631 acacag/tgcaca Upstream 0.59 0.57 0.55 0.62 VII�790 �19707 19705 rs4148162 cactca-ctcacaaag Upstream 0.59 0.57 0.55 0.62 VIII�212 �19129 20147 gcggg�gagtgt Upstream 0.06 0.03 0.05 0.00 VIII681 �18236 21040 rs2622605 tatgcg/tgttta Intron 1 0.57 0.50 0.55 0.50 VIII CHB1143 17774 21502 rs2622604 aatacg/accaga Intron 1 0.15 0.33 0.29 0.15 Decreased mRNA
(L,I,P)VIII CEU
1450 �17467 21809 ataaca/ctgggc Intron 1 0.04 0.17 0.00 0.00 VIII6861 �12056 27220 rs9999111 tgaatt/ccacag Intron 1 0.09 IX7250 �11667 27609 ttcacg/tccatt Intron 1 0.26 IX7438 �11479 27797 agccac/atgcac Intron 1 0.08 IX9496 �9421 29855 tctccg/attccc Intron 1 0.01 Loss 1CDX,
1Hnf1, gain1Hnf3
X
9666 �9251 30025 tctttt/gattta Intron 1 0.06 0.00 0.02 0.00 X9908 �9009 30267 atgaaa/gaaaca Intron 1 0.01 X9932 �8985 30291 gtctta/ctgttc Intron 1 0.01 X11560 �7357 31919 rs2725246 taaagt/ctgtta Intron 1 0.54 XI11603 �7314 31962 rs17731799 aggtaa/cgtttt Intron 1 0.44 XI CEU12283 �6634 32642 tgaggt/ctggga Intron 1 0.06 0.00 0.04 0.07 Increased mRNA
(L,P)XI
12638 �6279 32997 rs11287117 aggaa-cccagc Intron 1 0.33 XI12674 �6243 33033 aagga-tttttt Intron 1 0.24 XI I13070 �5847 33429 rs10632140 ctgcc-tcagcgtccc Intron 1 0.37 XI
784 POONKUZHALI ET AL.
at ASPE
T Journals on M
ay 7, 2015dm
d.aspetjournals.orgD
ownloaded from

the heme precursor protoporphyrin IX; NKX25/CSX, a homeodomainfactor important in development and found in many tissues that couldbe important for BCRP expression in embryonic stem cells; andSRFQ2–5, serum response TFs important for early growth response.
BCRP Processed Pseudogene in Intron 1 of the NOX5 Gene.Although BCRP is on chromosome 4q22, bioinformatic analysisrevealed an intron-less BCRP pseudogene residing within intron 1 ofthe Nox5 gene on chromosome 15. The pseudogene showed 89%similarity to BCRP in the coding region but lacked exons 1, 15, and16. It appeared to be a processed pseudogene because there is atranscribed mRNA (CR610432) in GenBank with this sequence.
BCRP Sequence Variations. Ninety BCRP SNPs (41 in the pro-moter and 49 in the introns) were identified (Table 2). Forty-threeSNPs were novel, and 47 were in the dbSNP database and/or geno-typed in the Centre de’Etude du Polymorphism Humain (CEPH)samples in the HapMap project.
A comparison of LD between pairs of BCRP loci using the “Haplo-view” analysis of HapMap data in White (CEPHS) indicated that theBCRP gene is framed by seven LD blocks, with three LD blocks in thepromoter region (Supplementary Fig. 1). However, the degree of LD
within each block was low, with six to eight haplotypes in many of theblocks. Given the size of our cohorts, it was not possible to determine theeffect of BCRP haplotypes on BCRP phenotype.
Phenotyping BCRP mRNA Expression. BCRP RNA expressionwas quantified by real-time PCR in the various cohorts. Figure 2shows the range of BCRP RNA expression in livers between threedifferent racial groups: the median (relative BCRP) was lower inHispanics (81.2 � 953) compared with White (101.3 � 2534) andAfrican American (291 � 6877) livers (p � 0.09) (note inset graph isLog2). The mean level of BCRP mRNA was higher in female (124.6� 71) versus male (95 � 78) intestines (not shown), similar to whatwe previously reported (Zamber et al., 2003). However, BCRPmRNA was not different in female versus male livers (105.43 � 9329versus 95.6 � 604, t test, p � 0.33).
Promoter SNPs Associated with BCRP mRNA Expression. Sam-ples carrying the �15994T variant allele had significantly higherBCRP mRNA in the PDR44 (p � 0.003), White (p � 0.08), andHispanic (p � 0.05) livers and intestines (p � 0.02) (Fig. 3A).Samples carrying the �15622C�T variant allele showed significantassociation with low BCRP expression in intestines (p � 0.036),
TABLE 2—Continued.
Position fromPosition
inRefseqa
dbSNP Sequence Region
AF inEffect on mRNAExpressionb and
TRANSFAC ChangeRegion Tag SNP
TSS ATG PDR44 Whites Hispanics AfricanAmericans
13989 �4928 34348 rs6857600 gttgcg/acaatt Intron 1 0.29 0.32 0.20 0.53 Loss of 1 CEBP�site
XII
15463 �3454 35822 rs3109823 tttcca/gtcttg Intron 1 0.28 0.27 0.29 0.71 XII15484 �3433 35843 rs3114018 ctattg/taaatt Intron 1 0.49 0.63 0.50 0.74 XII CEU
YRI16080 �2837 36439 rs2725250 gtagct/cgaaac Intron 1 0.28 0.32 0.43 0.21 XII16214 �2703 36573 rs2622620 aaagtt/gctggg Intron 1 0.52 0.57 0.57 0.85 XII16702 �2215 37061 rs2046134 ttttgc/ttgcat Intron 1 0.10 0.59 0.05 0.00 Increased mRNA
(L); gain of 1GATA4 site
XII YRI
16711 �2206 37070 attttc/tccttc Intron 1 0.04 XII16823 �2094 37182 rs5860120 ttttt-tccccc Intron 1 0.24 0.03 0.04 0.00 Decreased mRNA
(L)XII
18951 34 39310 rs2231137 tcccag/atgtca Exon2 0.13 0.06 0.20 0.06 Exon219156 239 39515 rs4148152 ttttaa/gtttac Intron 2 0.13 0.06 0.20 0.0624353 5436 44712 ttaggg/cagctg Intron 2 0.01 Intron224487 5570 44846 tagatc/tttgct Intron 2 0.01 Intron224580 5663 44939 rs2725255 ttcacc/tcttgt Intron 2 0.05 Intron224686 5769 45045 rs17731538 tcactc/tataat Intron 2 0.12 Intron225049 6132 45408 cccacc/taccgt Intron 2 0.02 Intron225398 6481 45757 rs4148155 cttcat/cattct Intron 2 0.09 0.10 0.21 0.00 Intron2 CHB25579 6662 45938 rs17013859 ctgaag/atgctt Intron 2 0.11 0.00 0.14 0.12 Intron226347 7430 46706 rs2231138 gtataa/ggagag Intron 2 0.06 Intron327742 8825 48101 rs2231142 acttac/aagttc Exon 5 0.12 Exon540981 22064 61340 rs1481012 ccagct/ctgtta Intron 7 0.13 0.00 0.13 0.07 Intron 7 CHB50510 31593 70869 rs2622628 caagag/ttggtg Intron 9 0.19 0.10 0.18 0.21 Intron 950987 32070 71346 rs2054576 tttgct/cacata Intron 9 0.14 Intron 951218 32301 71577 agccat/gtgagt Intron 9 0.04 Intron 951284 32367 71643 rs2231148 tgtgta/ttaagt Intron 9 0.24 Intron 9 CEU51493 32576 71852 rs2231150 tccatt/gaagaa Intron 10 0.01 Intron 1051526 32609 71885 tgtaaa/ctgtca Intron 10 0.02 Intron 1051538 32621 71897 rs2231151 tctttt/cattga Intron 10 0.01 Intron 1051922 33005 72281 rs7681519 accatc/gcaact Intron 10 0.20 Intron 1062989 44072 83348 rs2231162 tgactc/tttagt Intron 13 0.22 Intron 1363217 44300 83576 aactcc/tctttt Intron 14 0.01 Intron 1463596 44679 83955 rs2725267 aagaat/cgaaag Intron 14 0.28 0.10 0.29 0.74 Intron 1463914 44997 84273 rs2231164 ttctta/gaaatt Intron 14 0.43 0.06 0.30 0.68 Intron 14 CHB64152 45235 84511 rs2231165 ttttcc/tgagcc Intron 15 0.07 Intron 1564681 45673 84949 aaggcc/tgcata Intron 15 0.39 Intron 1564984 45691 84967 rs4148159 gttgtt/agtttt Intron 15 0.04 Intron 1564590 45764 85040 rs4148160 aataag/attgag Intron 15 0.01 Intron 1564608 46067 85343 tggtca/gggatg Intron 15 0.12 Intron 15
AF, allele frequency; CEU, Utah residents with ancestry from northern and western Europe; CHB, Han Chinese in Beijing, China; hets, heterozygotes; N.A., not applicable; YRI, Yoruba in Ibadan,Nigeria.
a RefSeq � AC097484 or AC084732.b Effect of variant allele on mRNA expression in liver (L), PDR44 (P), and intestine (I).
785SEQUENCE DIVERSITY IN THE BCRP/ABCG2 PROMOTER
at ASPE
T Journals on M
ay 7, 2015dm
d.aspetjournals.orgD
ownloaded from

Hispanic livers (p � 0.04), and a trend toward significance in thePDR44 (p � 0.16) (Fig. 3B). The �15846A�C was associated withhigh BCRP in all the livers (p � 0.03) (Fig. 3C); BCRP mRNA washigher in White livers with the �30477C�G (p � 0.01) (Fig. 3D);and White livers with a deletion of nucleotides AAAT at �30639 hadsubstantially lower BCRP mRNA (Fig. 3E). Neither the �13-kbpolymorphic genotype (heterozygotes could not be determined, seeunder Materials and Methods) nor the intron 1 polymorphic repeatgenotype showed any association with BCRP expression in anycohort.
Intron 1 SNPs Associated with BCRP mRNA Expression. Sam-ples with the 16702C�T variant allele had significantly higher BCRPRNA levels compared with those with the homozygous wild-typeallele (p � 0.008 among all the livers and p � 0.01 in AfricanAmerican livers) (Fig. 4A). Samples having the variant allele for the12283T�C SNP showed significantly higher BCRP RNA levelscompared with those with the wild-type allele in the PDR44 (p �0.02) and a trend to significance in White livers (p � 0.07) (Fig. 4B).Samples with the BCRP 1143G�A SNP had substantially lower
BCRP expression in intestines (p � 0.06) and a trend toward lowerBCRP mRNA in the PDR44 (p � 0.1) and African American livers(Fig. 4C). A T-deletion at position 16823 from the translation start siteshowed association with significantly lower BCRP RNA levels in allthe livers (p � 0.05) (Fig. 4D).
BCRP Genotype versus mRNA Phenotype in the CEPH Panel.BCRP genotypes for the HapMap CEPH trios were obtained fromNational Center for Biotechnology Information release 35 and werecompared with BCRP mRNA expression data quantitated on Af-fymetrix Focus Arrays (http://www.ncbi.nlm.nih.gov/geo/query/ac-c.cgi?acc � GSE1485). No BCRP HapMap genotypes were signifi-cantly associated with BCRP mRNA expression in the CEPHsamples. We then genotyped the CEPHs for the SNPs that weresignificantly associated with BCRP expression in our study. The�15622C�T (p � 0.03) and �15994 C�T (p � 0.09) were the onlySNPs showing any association with BCRP expression in the CEPHs.
BCRP Genotypes versus Imatinib Pharmacokinetics. No statis-tically significant associations were observed between the BCRP�15846a�c, �15623c�t, 1143g�a, 16702c�t, 16823 delt,
FIG. 1. In silico analysis of the BCRP promoter and intron 1. A, snapshot from the UCSC genome browser displaying the BCRP promoter through exon 2. The trackindicated by “conservation” shows the degree of evolutionary conservation in 17 vertebrates. Heights of the peak are indicative of the degree of conservation. B, snapshotfrom the ECR browser with alignment of human BCRP with mouse and rat. C, results from the rVISTA browser with local alignment of mouse and human BCRP. D, Cisteranalysis of BCRP regions with clusters of binding sites for TFs chosen. Vertical colored lines indicate the probabilities that regulatory factors bind to cis-elements at thesepositions. The black curve indicates the overall probability of being within a cluster of cis-elements bound by their factors. Each color corresponds to a different TF bindingsite. Lines in the upper half of the plot indicate cis-elements on the sense strand, and lines in the lower half refer to the complementary strand.
786 POONKUZHALI ET AL.
at ASPE
T Journals on M
ay 7, 2015dm
d.aspetjournals.orgD
ownloaded from
12283t�c, and �30639delaaat variants and imatinib pharmacokineticparameters (data not shown). In 90 patients with complete pharma-cokinetic and genotypic information, patients with the BCRP�15994CT or TT genotype had a 38.7% increased CL/F comparedwith individuals carrying the CC genotype (p � 0.069) (Fig. 5).
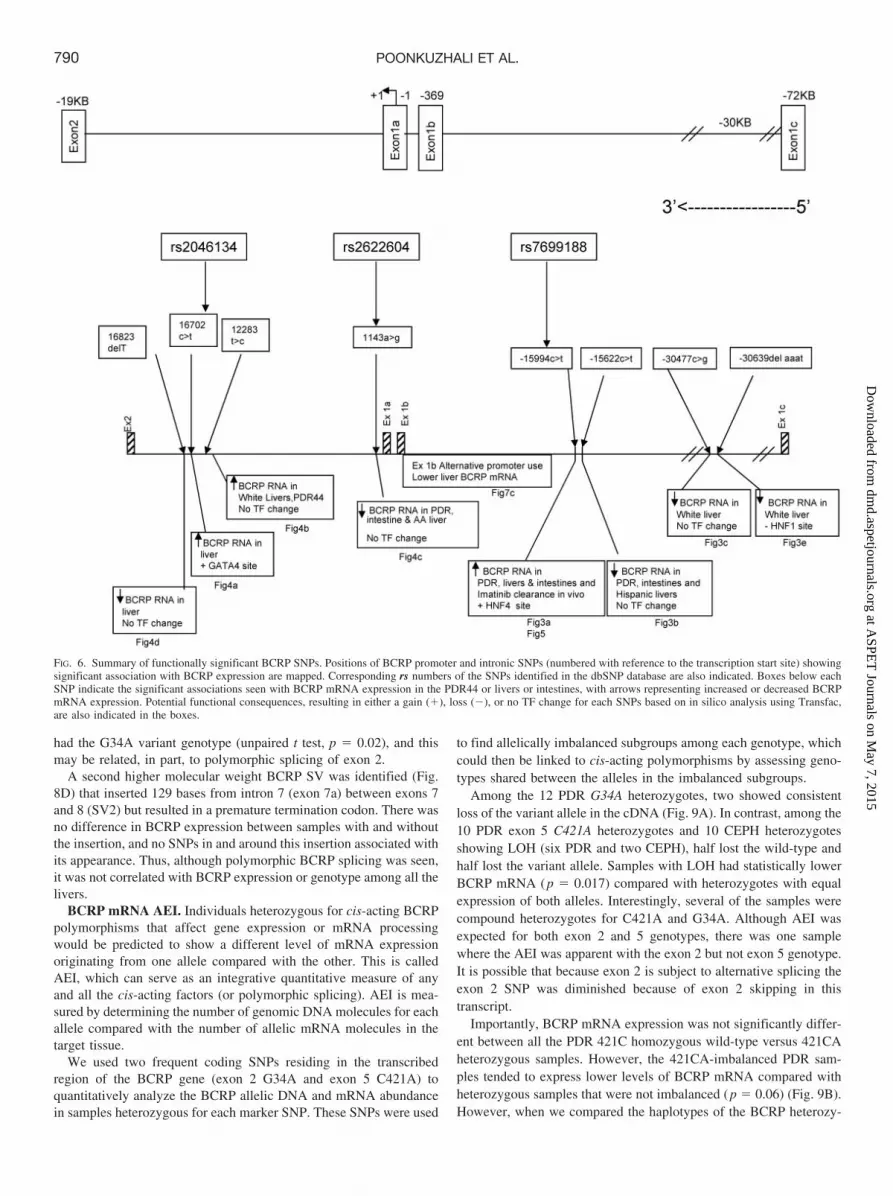
Functional Significance of Novel BCRP SNPs. The potentialfunctional effect of each SNP was determined by in silico analysisusing Transfac to identify whether the SNPs were creating or disrupt-ing any TF binding site (Fig. 6; Table 2). Both of the promoter SNPsassociated with higher BCRP expression in multiple tissues resulted ingain of TF binding sites. The �15994C�T variant resulted in the gainof one HNF4 binding site, and the 16702C�T variant resulted in again of one GATA4 binding site, a TF important for both intestine andliver development (Watt et al., 2007) and for expression of ABCG5and ABCG8 (Sumi et al., 2007). The 4-base pair (bp) (AAAT)�30639 promoter deletion associated with low BCRP RNA levelsresulted in loss of one HNF1 site. None of the other significant SNPsshowed any Transfac change. Although a variety of other SNPs werepredicted to alter TF binding sites (Table 2), none of these SNPs wasassociated with BCRP expression in the tissues examined.
Differential Exon 1b Usage Is Associated with Decreased BCRPHepatic mRNA. Human variation in BCRP expression could alsoresult from the differential use of alternative BCRP promoters and
SNPs influencing promoter activity. Indeed, two reports describedtissue-specific use of multiple BCRP alternative first exons in miceand in drug-selected cancer cells (Nakanishi et al., 2006; Zong et al.,2006). Review of the expressed sequence tag (EST) and Aceview(http://ncbi.nih.gov/IEB/Research/Acembly) databases and UCSC ge-nome browser May 2004 assembly revealed at least three differentalternative first exons in BCRP (Fig. 7A). There were multiple ESTclones showing BCRP mRNAs with an alternative first exon 1. Exon1a represented the known first exon 1 (Bailey-Dell et al., 2001). Thealternative exons 1b and 1c were located 369 bases and 72.2 kbupstream, respectively, of the transcription start site.
To screen for the presence of BCRP transcripts utilizing the variousexon 1s, we used forward primers in each exon 1 and a reverse primerin exon 2. We also confirmed that BCRP transcripts with alternativeexon 1s were full-length BCRP transcripts. Exon 1a and 1b transcriptswere found in 85 to 100% of samples in each cohort; conversely, theexon 1c transcript was absent in intestines and expressed in 45 to 48%of PDR and livers. There were no racial or gender differences in usageof any exon 1s. Next we compared the usage of each exon 1 versusBCRP RNA expression in the livers. Liver samples that generated aBCRP transcript using exon 1b had significantly lower BCRP RNAlevels (Fig. 7C) among all the livers (p � 0.002) and among Whites(p � 0.01) and Hispanics (p � 0.02). No SNPs within 1 kb of exons
FIG. 2. BCRP RNA expression in human livers. Total BCRP RNA expression in 60 livers was measured by quantitative real-time PCR and expressed as “relative BCRPRNA” levels (each sample normalized to its glyceraldehyde-3-phosphate dehydrogenase RNA level and then expressed relative to a single human liver sample) were plottedfrom the lowest to highest relative BCRP in each racial group. The inset box plots show the median values of log2-transformed hepatic BCRP RNA expression in eachracial group. Box plots indicate 1st and 3rd quartiles, with the bold line within the box representing the median value; the whiskers represent the range after excluding theoutliers. The outliers are defined by the R statistical package as data points that fall outside the 1st and 3rd quartiles by more than 1.5 times the interquartile range, andcircles falling outside the box represent outliers. The p values from the Kruskal-Wallis nonparametric test comparing the significance in BCRP expression between the threeraces are shown.
787SEQUENCE DIVERSITY IN THE BCRP/ABCG2 PROMOTER
at ASPE
T Journals on M
ay 7, 2015dm
d.aspetjournals.orgD
ownloaded from

1b and 1c (Table 2; Fig. 1) were related to differential use of thealternative first exons.
Polymorphic BCRP SVs. Polymorphic splicing could also lead tohuman variation in BCRP expression. We amplified BCRP cDNAfrom all the tissues using forward primers in exons 1a, 1b, or 1c and areverse primer in exon 6. An additional low molecular weight band wasseen in some of the livers (Fig. 8A) but not in intestines. This SV1
transcript skipped exon 2 and was found in combination with all the exon1s. The translation start site predictor program http://research.i2r.a-star.e-du.sg/DNAFSMiner revealed only two BCRP ATGs (in exons 2 and 3)that produced in-frame transcripts that did not prematurely terminate. Theexon 2 ATG had a predicted initiation score of 0.878. The alternativetranscripts skipping exon 2 (formed from exon 1a, 1b, or 1c) could use thealternative ATG in exon 3 (predicted initiation scores of 0.589, 0.956, or
FIG. 3. BCRP promoter SNPs showing significant association with BCRP RNA expression in different tissues. Box plots for individual BCRP promoter SNPs (A–E)showing statistically significant association with BCRP mRNA expression in livers, intestines, and PDR samples. The median � S.D. values of log2-normalized BCRPrelative RNA are plotted on the y-axis as described in Fig. 2 legend. The p values from the Kruskal-Wallis nonparametric test or the Wilcox test comparing the significanceof three or two genotypes, respectively, is shown for each of the SNPs.
788 POONKUZHALI ET AL.
at ASPE
T Journals on M
ay 7, 2015dm
d.aspetjournals.orgD
ownloaded from

0.657, respectively) (Fig. 8B) that would result in a BCRP variant proteinthat lacked the first 70 amino acids because the initiating methionine is inexon 2. This variant retains the Walker A and B motifs, and the functionalconsequence of this transcript is unknown. Three EST clones(DA367705, DB168974, and DA414147) supported exon 2 skipping, andthe alternative ATG in exon 3 was conserved in different species.
There was no gender-specific difference in the presence of SV1.Although the median BCRP levels were not significantly differentbetween livers � SV1 (Fig. 8C), BCRP was low in 80% of SV1�livers versus 55% of SV1� livers, and the mean BCRP mRNA wasstrikingly different between the SV1� livers (165 � 223) versusSV1� livers (544 � 767) (unequal variance t test, p � 0.025). Theregion in and around exon 2 was sequenced to identify whether anySNPs were associated with SV1. The exon 2 G34A was more prev-alent in livers with SV1 (26%) versus those without SV1 (3.8%) (p �0.01). Because Hispanics have a lower hepatic level of BCRP com-pared with Whites and African Americans (Fig. 2), we determinedwhether splicing or the G34A genotype was associated with lowerexpression. Similar proportions of Hispanics (17/28) and non-Hispanics (15/32) had SV1 (Fisher’s exact test, p � 0.22). However,BCRP hepatic RNA was significantly lower among Hispanics who
FIG. 5. The BCRP �15994 genotype shows weak association with imatinib phar-macokinetics. Plots show the relationship between apparent oral clearance ofimatinib determined at steady state in patients. Each symbol represents an individualpatient. CC genotype, n � 61; CT genotype, n � 25; TT genotype, n � 4. Lines arethe median with interquartile range (CC, 8.87 l/h versus CT/TT, 12.3 l/h).
FIG. 4. BCRP intronic SNPs showing significant association with BCRP RNA expression in different tissues. Box plots for individual BCRP intron 1 SNPs (A–D) showingstatistically significant association with BCRP mRNA expression are shown as described in Fig. 3 legend.
789SEQUENCE DIVERSITY IN THE BCRP/ABCG2 PROMOTER
at ASPE
T Journals on M
ay 7, 2015dm
d.aspetjournals.orgD
ownloaded from
had the G34A variant genotype (unpaired t test, p � 0.02), and thismay be related, in part, to polymorphic splicing of exon 2.
A second higher molecular weight BCRP SV was identified (Fig.8D) that inserted 129 bases from intron 7 (exon 7a) between exons 7and 8 (SV2) but resulted in a premature termination codon. There wasno difference in BCRP expression between samples with and withoutthe insertion, and no SNPs in and around this insertion associated withits appearance. Thus, although polymorphic BCRP splicing was seen,it was not correlated with BCRP expression or genotype among all thelivers.
BCRP mRNA AEI. Individuals heterozygous for cis-acting BCRPpolymorphisms that affect gene expression or mRNA processingwould be predicted to show a different level of mRNA expressionoriginating from one allele compared with the other. This is calledAEI, which can serve as an integrative quantitative measure of anyand all the cis-acting factors (or polymorphic splicing). AEI is mea-sured by determining the number of genomic DNA molecules for eachallele compared with the number of allelic mRNA molecules in thetarget tissue.
We used two frequent coding SNPs residing in the transcribedregion of the BCRP gene (exon 2 G34A and exon 5 C421A) toquantitatively analyze the BCRP allelic DNA and mRNA abundancein samples heterozygous for each marker SNP. These SNPs were used
to find allelically imbalanced subgroups among each genotype, whichcould then be linked to cis-acting polymorphisms by assessing geno-types shared between the alleles in the imbalanced subgroups.
Among the 12 PDR G34A heterozygotes, two showed consistentloss of the variant allele in the cDNA (Fig. 9A). In contrast, among the10 PDR exon 5 C421A heterozygotes and 10 CEPH heterozygotesshowing LOH (six PDR and two CEPH), half lost the wild-type andhalf lost the variant allele. Samples with LOH had statistically lowerBCRP mRNA (p � 0.017) compared with heterozygotes with equalexpression of both alleles. Interestingly, several of the samples werecompound heterozygotes for C421A and G34A. Although AEI wasexpected for both exon 2 and 5 genotypes, there was one samplewhere the AEI was apparent with the exon 2 but not exon 5 genotype.It is possible that because exon 2 is subject to alternative splicing theexon 2 SNP was diminished because of exon 2 skipping in thistranscript.
Importantly, BCRP mRNA expression was not significantly differ-ent between all the PDR 421C homozygous wild-type versus 421CAheterozygous samples. However, the 421CA-imbalanced PDR sam-ples tended to express lower levels of BCRP mRNA compared withheterozygous samples that were not imbalanced (p � 0.06) (Fig. 9B).However, when we compared the haplotypes of the BCRP heterozy-
FIG. 6. Summary of functionally significant BCRP SNPs. Positions of BCRP promoter and intronic SNPs (numbered with reference to the transcription start site) showingsignificant association with BCRP expression are mapped. Corresponding rs numbers of the SNPs identified in the dbSNP database are also indicated. Boxes below eachSNP indicate the significant associations seen with BCRP mRNA expression in the PDR44 or livers or intestines, with arrows representing increased or decreased BCRPmRNA expression. Potential functional consequences, resulting in either a gain (�), loss (�), or no TF change for each SNPs based on in silico analysis using Transfac,are also indicated in the boxes.
790 POONKUZHALI ET AL.
at ASPE
T Journals on M
ay 7, 2015dm
d.aspetjournals.orgD
ownloaded from

FIG
.7.
A,
usag
eof
alte
rnat
ive
firs
tex
ons
inB
CR
P.O
rgan
izat
ion
ofth
ehu
man
AB
CG
2ge
nean
dth
epo
sitio
nsof
alte
rnat
ive
firs
tex
ons
inB
CR
Par
ein
dica
ted
rela
tive
toth
eex
on1a
tran
scri
ptio
nst
art
site
.A
tle
ast
thre
edi
ffer
ent
firs
tex
ons
with
the
com
mon
tran
slat
ion
star
tsi
tein
exon
2ar
ein
dica
ted.
B,
cart
oon
ofB
CR
P5�
-unt
rans
late
dre
gion
vari
ants
iden
tifie
dby
Nak
anis
hiet
al.
(200
6)fo
rco
mpa
riso
n.C
,al
tern
ativ
eex
on1b
usag
eis
asso
ciat
edw
ithlo
wer
BC
RP
expr
essi
onin
hum
anliv
ers.
Rel
ativ
eB
CR
PR
NA
expr
essi
onin
liver
sw
ithpr
esen
ceor
abse
nce
ofex
on1b
was
com
pare
d.T
hey-
axis
indi
cate
sth
elo
g-tr
ansf
orm
edre
lativ
eB
CR
PR
NA
leve
ls.
Stat
istic
alsi
gnif
ican
cew
asca
lcul
ated
usin
gth
eW
ilcox
onte
st.
791SEQUENCE DIVERSITY IN THE BCRP/ABCG2 PROMOTER
at ASPE
T Journals on M
ay 7, 2015dm
d.aspetjournals.orgD
ownloaded from

FIG. 8. BCRP SVs. A, left shows the agarose gel of reverse transcription-PCR products generated using forward primers in exon 1a, 1b, or 1c and reverse primer in exon6. Arrows indicate exon 2–skipped transcripts (SV1) Right shows potential translation start sites used by the exon 2–skipped transcripts. B, amino acid sequence alignmentfor BCRP wild-type and SV1 lacking the 70 amino terminal amino acids. C, relative BCRP RNA levels in livers arranged by liver with lowest to highest BCRP mRNAin samples with SV1 (left) and without SV1 (right) and the corresponding genotype of exon 2 G34A and intron 2 (19146a�g) in each liver (white, homozygous wild-type;light gray, heterozygous; black, homozygous variant allele). D, agarose gel of reverse transcription-PCR products generated using forward primer in exon 7 and reverseprimer in exon 8 showing higher molecular weight alternative SV2 mRNA (left) and schematic representation of inserted nucleotides from intron 7 (exon 7a).
792 POONKUZHALI ET AL.
at ASPE
T Journals on M
ay 7, 2015dm
d.aspetjournals.orgD
ownloaded from

gous balanced versus imbalanced samples, no cis-acting SNPs weresignificantly associated with BCRP allelic imbalance.
Analysis for BCRP DNA Copy Number Variation. A recentscreen of the CEPH, Yourba, Japanese, and Chinese HapMap samplesfor copy number variation identified 2 of 60 CEPH samples(NA10863 and NA12234) with one copy number gain for BCRP(http://projects.tcag.ca/variation/) (Redon et al., 2006). We screenedDNA from liver and PDR samples representing the highest, lowest,and median BCRP expressors (n � 5 in each range/tissue) but de-tected no copy number variation that might have explained variableBCRP expression.
Discussion
SNPs in regulatory regions represent an important but relativelyunexplored class of genetic variation. We resequenced potential reg-ulatory regions in the 5� region and intron 1 of BCRP and identified90 SNPs. Several SNPs in the 5� region and three in intron 1 showedsignificant association with BCRP RNA expression in the threetissues we analyzed (livers, intestines, and Epstein-Barr virus–immortalized lymphoblasts), as well as imatinib clearance in vivo.Although evolutionary conservation analysis is one strategy used toidentify intragenic regions likely to have functional importance, mostof the SNPs were not in ECRs, but all the SNPs resided in regionsidentified by screening for clusters of TF binding sites. This result isof interest because it was recently shown that binding sites for highlyconserved TFs varied significantly across species, and after aligning
the promoters of orthologous genes, about two thirds of the bindingsites did not align (Odom et al., 2007). This suggests that targetinggenomic regions with clusters of TFs is a useful alternative approachin identifying promoter regions to resequence.
In the present study, roughly one third of the livers showed highBCRP RNA expression. This was similar to previous reports in whichBCRP RNA was more highly expressed in 30% of acute leukemiapatients (Suvannasankha et al., 2004). Several SNPs were associatedwith higher BCRP hepatic expression. Among Whites and Hispanics,the �15994C�T promoter SNP was associated with higher BCRPRNA expression. This SNP was predicted by in silico analysis toresult in the gain of one HNF4 site. Although a role for HNF4 inBCRP regulation has not been shown to date, this TF is highlycoexpressed with BCRP in several tissues (e.g., liver and intestine).Other SNPs in partial LD to �15994 (e.g., �15846) could alsocontribute to the BCRP phenotype. The intronic 12283T�C SNPswere also associated with higher hepatic BCRP in livers from Whitedonors, whereas BCRP RNA was higher in African American liverswith the intronic 16702C�T SNP, which potentially leads to a gain ofa GATA4 site. Conversely, SNPs associated with lower BCRP mRNAincluded the �15622C�T, �30477C�G, and the AAAT deletion at�30639, as well as intron 1 SNPs 122893 T�C and a T deletion at16823.
Notably, although several cis-regulatory sites have been identifiedin the BCRP promoter, we failed to find SNPs in any of them (e.g., a150-bp conserved enhancer region, containing three functional PPAR
FIG. 9. Allelic imbalance in BCRP. A, relative BCRP mRNA arranged from lowest to highest expression in PDR44 cells. The corresponding exon 2 and exon 5 BCRPgenotypes sequenced in genomic DNA (g) versus cDNA (c) are shown below the graph (white, homozygous wild-type; light gray, heterozygous; black, homozygous variantallele). Boxed genotypes indicate samples with discordant genotypes in the cDNA versus DNA. B, left, box plots of BCRP mRNA in samples with the exon 5 wild-typeor heterozygous genotypes. Right, box plots of BCRP mRNA in exon 5 wild-type versus heterozygous genotypes � exon 5 allelic imbalance. The p value was generatedby the Kruskal-Wallis test.
793SEQUENCE DIVERSITY IN THE BCRP/ABCG2 PROMOTER
at ASPE
T Journals on M
ay 7, 2015dm
d.aspetjournals.orgD
ownloaded from

response elements, a functional estrogen response element, and Hif1binding site) (Ee et al., 2004; Krishnamurthy et al., 2004; Szatmari etal., 2006). In addition, although the �790-bp BCRP promoter CTCAdeletion was shown to be associated with the relative extent ofirinotecan conversion to SN38 (Zhou et al., 2005), in our study thisSNP did not show any association with BCRP RNA expression.Nevertheless, it will be important to validate the potential clinicalimportance of BCRP SNPs in vivo.
In a previous study of human intestines, we failed to find anyalternatively spliced BCRP mRNAs. In contrast, more than half of thelivers examined polymorphically expressed an alternative BCRPmRNA (SV1) that skipped exon 2. Although the exon 2 G34A was notpresent in all the SV1 livers, the SV1� livers were significantly morelikely to carry the exon 2 G34A and to have a lower (3.3 times) meanlevel of BCRP mRNA compared with SV1 livers. Moreover, because95% of persons with G34A had SV1, the G34A genotype could beused to identify a subset of SV1 livers and whether SV1 had afunctional consequence. Indeed, the G34A is more frequent in His-panics, who have a lower level of BCRP, suggesting the G34A couldcontribute to this phenotype. Mechanistically, polymorphic BCRPalternative splicing may be diminishing the pool of wild type, andhence functional BCRP mRNA. Moreover, association of the G34Agenotype with lower BCRP expression may be liver-specific becausewe did not detect SV1 in intestines, and alternative splicing can betissue-specific. Whether the G34A change is associated with lowerBCRP mRNA in other tissues that express BCRP, such as brain orplacenta, remains to be determined. Finally, the fact that 95% ofG34A livers were SV1� has implications for designing in vitrostudies to determine the functional consequence of BCRP variantalleles. Several groups have expressed the 34G and 34A (V12 andM12) cDNAs in cell lines and SF9 cell membranes (Kondo et al.,2004). However, the cDNA is already spliced, and it cannot assesshow alternative splicing of this allele may affect the pool of wild-typeBCRP mRNA.
SNPs that affect gene expression level in an allele-specific mannerare often located in the gene regulatory regions such as promoters,introns, and 5�- and 3�-untranslated regions (Ponomarenko et al.,2002). AEI then serves as the phenotype that can be linked to thefunctional cis-acting polymorphisms by genotype scanning along theentire gene locus (Wang and Sadee, 2006). We detected BCRP AEI inthe PDR44 but were unable to identify cis-SNPs (including intronicSNPs) that were uniquely linked with this event. Likewise, others(Kobayashi et al., 2005) have reported BCRP AEI in human placentabut failed to find linked SNP. However, neither our study nor othershave totally resequenced the introns, so it is possible there is anunidentified intron SNP linked to this event. It must also be consid-ered that AEI could result from epigenetic changes because it wasrecently reported that the BCRP promoter could be methylated (To etal., 2006). Likewise, AEI could be influenced by other processesknown to regulate BCRP expression such as kinases (Meyer zuSchwabedissen et al., 2006).
It was recently shown that BCRP 421A coding variant has thesignature of recent positive selection in the Asian population (Wang etal., 2007). It is equally reasonable to consider that there could beevolutionary constraints on the promoter. Intriguingly, one SNP as-sociated with BCRP expression showed a large frequency differencebetween populations (16702), suggesting it might be under recentpositive selective pressure in the African American population, butthis remains to be tested.
In total, the results from the present study indicate that there existssubstantial genetic variability in potential regulatory regions of BCRP,that some SNPs are associated with altered BCRP expression, and that
a number of these SNPs reside in or create or destroy putative TFbinding sites. The fact that the identical SNPs were associated withaltered BCRP expression in multiple tissue types and imatinib clear-ance in vivo strongly suggests that they may be functionally importantand need to be tested further for their relationship to BCRP-mediateddrug clearance in well controlled studies.
Acknowledgments. We thank the Hartwell center at St. JudeChildren’s Research Hospital for the DNA sequencing and oligosynthesis.
References
Bailey-Dell KJ, Hassel B, Doyle LA, and Ross DD (2001) Promoter characterization andgenomic organization of the human breast cancer resistance protein (ATP-binding cassettetransporter G2) gene. Biochim Biophys Acta 1520:234–241.
Burger H, van Tol H, Boersma AW, Brok M, Wiemer EA, Stoter G, and Nooter K (2004)Imatinib mesylate (STI571) is a substrate for the breast cancer resistance protein (BCRP)/ABCG2 drug pump. Blood 104:2940–2942.
Damiani D, Tiribelli M, Calistri E, Geromin A, Chiarvesio A, Michelutti A, Cavallin M, andFanin R (2006) The prognostic value of P-glycoprotein (ABCB) and breast cancer resistanceprotein (ABCG2) in adults with de novo acute myeloid leukemia with normal karyotype.Haematologica 91:825–828.
de Jong FA, Marsh S, Mathijssen RH, King C, Verweij J, Sparreboom A, and McLeod HL (2004)ABCG2 pharmacogenetics: ethnic differences in allele frequency and assessment of influenceon irinotecan disposition. Clin Cancer Res 10:5889–5894.
Ee PL, Kamalakaran S, Tonetti D, He X, Ross DD, and Beck WT (2004) Identification of a novelestrogen response element in the breast cancer resistance protein (ABCG2) gene. Cancer Res64:1247–1251.
Gardner ER, Burger H, van Schaik RH, van Oosterom AT, de Bruijn EA, Guetens G, Prenen H,de Jong FA, Baker SD, Bates SE, et al. (2006) Association of enzyme and transportergenotypes with the pharmacokinetics of imatinib. Clin Pharmacol Ther 80:192–201.
Guetens G, De Boeck G, Highley M, Dumez H, Van Oosterom AT, and de Bruijn EA (2003)Quantification of the anticancer agent STI-571 in erythrocytes and plasma by measurement ofsediment technology and liquid chromatography-tandem mass spectrometry. J Chromatogr A1020:27–34.
Ho AY, Deacon A, Osborne G, and Mufti GJ (2003) Precipitation of porphyria cutanea tarda byimatinib mesylate? Br J Haematol 121:375.
Imai Y, Nakane M, Kage K, Tsukahara S, Ishikawa E, Tsuruo T, Miki Y, and Sugimoto Y (2002)C421A polymorphism in the human breast cancer resistance protein gene is associated withlow expression of Q141K protein and low-level drug resistance. Mol Cancer Ther 1:611–616.
Jonker JW, Musters S, Vlaming ML, Plosch T, Gooijert KE, Hillebrand MJ, Rosing H, BeijnenJH, Verkade HJ, and Schinkel AH (2007) Breast cancer resistance protein (Bcrp1/Abcg2) isexpressed in the harderian gland and mediates transport of conjugated protoporphyrin IX. Am JPhysiol Cell Physiol 292:C2204–C2212.
Kobayashi D, Ieiri I, Hirota T, Takane H, Maegawa S, Kigawa J, Suzuki H, Nanba E, OshimuraM, Terakawa N, et al. (2005) Functional assessment of ABCG2 (BCRP) gene polymorphismsto protein expression in human placenta. Drug Metab Dispos 33:94–101.
Kondo C, Suzuki H, Itoda M, Ozawa S, Sawada J, Kobayashi D, Ieiri I, Mine K, Ohtsubo K, andSugiyama Y (2004) Functional analysis of SNPs variants of BCRP/ABCG2. Pharmacol Res21:1895–1903.
Krishnamurthy P, Ross DD, Nakanishi T, Bailey-Dell K, Zhou S, Mercer KE, Sarkadi B,Sorrentino BP, and Schuetz JD (2004) The stem cell marker Bcrp/ABCG2 enhances hypoxiccell survival through interactions with heme. J Biol Chem 279:24218–24225.
Lamba JK, Chen X, Lan LB, Kim JW, Wei Wang X, Relling MV, Kazuto Y, Watkins PB, StromS, Sun D, et al. (2006) Increased CYP3A4 copy number in TONG/HCC cells but not in DNAfrom other humans. Pharmacogenet Genomics 16:415–427.
Maliepaard M, Scheffer GL, Faneyte IF, van Gastelen MA, Pijnenborg AC, Schinkel AH, van DeVijver MJ, Scheper RJ, and Schellens JH (2001) Subcellular localization and distribution ofthe breast cancer resistance protein transporter in normal human tissues. Cancer Res 61:3458–3464.
Mathijssen RH, Marsh S, Karlsson MO, Xie R, Baker SD, Verweij J, Sparreboom A, andMcLeod HL (2003) Irinotecan pathway genotype analysis to predict pharmacokinetics. ClinCancer Res 9:3246–3253.
Meyer zu Schwabedissen HE, Grube M, Dreisbach A, Jedlitschky G, Meissner K, Linnemann K,Fusch C, Ritter CA, Volker U, and Kroemer HK (2006) Epidermal growth factor-mediatedactivation of the map kinase cascade results in altered expression and function of ABCG2(BCRP). Drug Metab Dispos 34:524–533.
Mouly SJ, Matheny C, Paine MF, Smith G, Lamba J, Lamba V, Pusek SN, Schuetz EG, StewartPW, and Watkins PB (2005) Variation in oral clearance of saquinavir is predicted byCYP3A5*1 genotype but not by enterocyte content of cytochrome P450 3A5. Clin PharmacolTher 78:605–618.
Nakanishi T, Bailey-Dell KJ, Hassel BA, Shiozawa K, Sullivan DM, Turner J, and Ross DD(2006) Novel 5� untranslated region variants of BCRP mRNA are differentially expressed indrug-selected cancer cells and in normal human tissues: implications for drug resistance,tissue-specific expression, and alternative promoter usage. Cancer Res 66:5007–5011.
Odom DT, Dowell RD, Jacobsen ES, Gordon W, Danford TW, Macisaac KD, Rolfe PA, ConboyCM, Gifford DK, and Fraenkel E (2007) Tissue-specific transcriptional regulation has di-verged significantly between human and mouse. Nat Genet 39:730–732.
Ozvegy-Laczka C, Hegedus T, Varady G, Ujhelly O, Schuetz JD, Varadi A, Keri G, Orfi L,Nemet K, and Sarkadi B (2004) High-affinity interaction of tyrosine kinase inhibitors with theABCG2 multidrug transporter. Mol Pharmacol 65:1485–1495.
Ponomarenko JV, Orlova GV, Merkulova TI, Gorshkova EV, Fokin ON, Vasiliev GV, FrolovAS, and Ponomarenko MP (2002) rSNP_Guide: an integrated database-tools system forstudying SNPs and site-directed mutations in transcription factor binding sites. Hum Mutat20:239–248.
Redon R, Ishikawa S, Fitch KR, Feuk L, Perry GH, Andrews TD, Fiegler H, Shapero MH,
794 POONKUZHALI ET AL.
at ASPE
T Journals on M
ay 7, 2015dm
d.aspetjournals.orgD
ownloaded from

Carson AR, Chen W, et al. (2006) Global variation in copy number in the human genome.Nature 444:444–454.
Ross DD, Karp JE, Chen TT, and Doyle LA (2000) Expression of breast cancer resistance proteinin blast cells from patients with acute leukemia. Blood 96:365–368.
Smalley MJ and Clarke RB (2005) The mammary gland “side population”: a putative stem/progenitor cell marker? J Mammary Gland Biol Neoplasia 10:37–47.
Sparreboom A, Gelderblom H, Marsh S, Ahluwalia R, Obach R, Principe P, Twelves C, VerweijJ, and McLeod HL (2004) Diflomotecan pharmacokinetics in relation to ABCG2 421C�Agenotype. Clin Pharmacol Ther 76:38–44.
Sumi K, Tanaka T, Uchida A, Magoori K, Urashima Y, Ohashi R, Ohguchi H, Okamura M,Kudo H, Daigo K, et al. (2007) Cooperative interaction between hepatocyte nuclear factor 4alpha and GATA transcription factors regulates ATP-binding cassette sterol transportersABCG5 and ABCG8. Mol Cell Biol 27:4248–4260.
Suvannasankha A, Minderman H, O’Loughlin KL, Nakanishi T, Ford LA, Greco WR, WetzlerM, Ross DD, and Baer MR (2004) Breast cancer resistance protein (BCRP/MXR/ABCG2) inadult acute lymphoblastic leukaemia: frequent expression and possible correlation with shorterdisease-free survival. Br J Haematol 127:392–398.
Szatmari I, Vamosi G, Brazda P, Balint BL, Benko S, Szeles L, Jeney V, Ozvegy-Laczka C,Szanto A, Barta E, et al. (2006) PPARgamma regulated ABCG2 expression confers cytopro-tection to human dendritic cells. J Biol Chem 281:23812–23823.
Tamura A, Watanabe M, Saito H, Nakagawa H, Kamachi T, Okura I, and Ishikawa T (2006)Functional validation of the genetic polymorphisms of human ATP-binding cassette (ABC)transporter ABCG2: identification of alleles that are defective in porphyrin transport. MolPharmacol 70:287–296.
To KK, Zhan Z, and Bates SE (2006) Aberrant promoter methylation of the ABCG2 gene in renalcarcinoma. Mol Cell Biol 26:8572–8585.
van Herwaarden AE, Wagenaar E, Merino G, Jonker JW, Rosing H, Beijnen JH, and Schinkel
AH (2007) Multidrug transporter ABCG2/breast cancer resistance protein secretes riboflavin(vitamin B2) into milk. Mol Cell Biol 27:1247–1253.
Wang D and Sadee W (2006) Searching for polymorphisms that affect gene expression andmRNA processing: example ABCB1 (MDR1). AAPS J 18:E515–E520.
Wang Z, Wang J, Tantoso E, Wang B, Tai AY, Ooi LL, Chong SS, and Lee CG (2007)Signatures of recent positive selection at the ATP-binding cassette drug transporter superfam-ily gene loci. Hum Mol Genet 16:1367–1380.
Watt AJ, Zhao R, Li J, and Duncan SA (2007) Development of the mammalian liver and ventralpancreas is dependent on GATA4. BMC Dev Biol 7:37.
Zamber CP, Lamba JK, Yasuda K, Farnum J, Thummel K, Schuetz JD, and Schuetz EG (2003)Natural allelic variants of breast cancer resistance protein (BCRP) and their relationship toBCRP expression in human intestine. Pharmacogenetics 13:19–28.
Zhou Q, Sparreboom A, Tan EH, Cheung YB, Lee A, Poon D, Lee EJ, and Chowbay B (2005)Pharmacogenetic profiling across the irinotecan pathway in Asian patients with cancer. Br JClin Pharmacol 59:415–424.
Zhou S, Schuetz JD, Bunting KD, Colapietro AM, Sampath J, Morris JJ, Lagutina I, GrosveldGC, Osawa M, Nakauchi H, et al. (2001) The ABC transporter Bcrp1/ABCG2 is expressed ina wide variety of stem cells and is a molecular determinant of the side-population phenotype.Nat Med 7:1028–1034.
Zong Y, Zhou S, Fatima S, and Sorrentino BP (2006) Expression of mouse Abcg2 mRNA duringhematopoiesis is regulated by alternative use of multiple leader exons and promoters. J BiolChem 281:29625–29632.
Address correspondence to: Erin Schuetz, St. Jude Children’s ResearchHospital, 332 North Lauderdale Street, Memphis, TN 38105. E-mail: [email protected] zdd004084361XX
795SEQUENCE DIVERSITY IN THE BCRP/ABCG2 PROMOTER
at ASPE
T Journals on M
ay 7, 2015dm
d.aspetjournals.orgD
ownloaded from