Differential expression of salt overly sensitive pathway genes determines salinity stress tolerance...
12
Research article Differential expression of salt overly sensitive pathway genes determines salinity stress tolerance in Brassica genotypes K. Chakraborty a , Raj K. Sairam a, * , R.C. Bhattacharya b a Division of Plant Physiology, Indian Agriculture Research Institute, New Delhi 110 012, India b National Research Center on Plant Biotechnology, Pusa Campus, New Delhi 110 012, India article info Article history: Received 22 July 2011 Accepted 3 October 2011 Available online 14 October 2011 Keywords: Brassica Gene expression Potassium Salinity stress Salt overly sensitive pathway Sodium Vacuolar antiporter abstract The objective of the present study was to examine the role of SOS pathway in salinity stress tolerance in Brassica spp. An experiment was conducted in pot culture with 4 Brassica genotypes, i.e., CS 52 and CS 54, Varuna and T 9 subjected to two levels of salinity treatments along with a control, viz., 1.65 (S 0 ), 4.50 (S 1 ) and 6.76 (S 2 ) dS m 1 . Salinity treatment significantly decreased relative water content (RWC), membrane stability index (MSI) and chlorophyll (Chl) content in leaves and potassium (K) content in leaf, stem and root of all the genotypes. The decline in RWC, MSI, Chl and K content was significantly less in CS 52 and CS 54 as compared to Varuna and T 9. In contrast, the sodium (Na) content increased under salinity stress in all the plant parts in all the genotypes, however, the increase was less in CS 52 and CS 54, which also showed higher K/Na ratio, and thus more favourable cellular environment. Gene expression studies revealed the existence of a more efficient salt overly sensitive pathway composed of SOS1 , SOS2, SOS3 and vacuolar Na þ /H þ antiporter in CS 52 and CS 54 compared to Varuna and T 9. Sequence analyses of partial cDNAs showed the conserved nature of these genes, and their intra and intergenic relatedness. It is thus concluded that existence of an efficient SOS pathway, resulting in higher K/Na ratio, could be one of the major factor determining salinity stress tolerance of Brassica juncea genotypes CS 52 and CS 54. Ó 2011 Elsevier Masson SAS. All rights reserved. 1. Introduction Soil salinity is a major abiotic stress affecting crop productivity. Excess of sodium ions are toxic to plants because of their adverse effects on K þ nutrition, cytosolic enzyme activities, photosynthesis, and metabolism [1,2]. Control of intracellular ion homeostasis is essential for all cellular organisms. Three mechanisms function cooperatively to prevent the accumulation of Na þ in the cytoplasm, i.e., restriction of Na þ influx, active Na þ efflux, and compartmental- ization of Na þ in the vacuole [1]. In plants this is achieved through coordinated regulation of transporters for H þ ,K þ , and Na þ . Na þ ions are not strongly discriminated against at the root membrane; therefore, salinity of the xylem stream increases under saline conditions [3,4].K þ content, K þ /Na þ selectivity and cell-membrane stability decreases, while electrolyte leakage increases significantly by salinity in different cultivars of Brassica napus [3]. Further, sodium import, transport, and deposition have been reported to increase by salinity treatment, while K þ and Mg 2þ import, deposition, and remobilization were decreased [5]. Several Arabidopsis sos (salt overly sensitive) mutants, defective in salt tolerance have been characterized [6,7]. The sos mutants are specifically hypersensitive to high external Na þ or Li þ and also unable to grow under very low external K þ concentrations [7]. Allelic tests indicated that the sos mutants define three SOS loci, i.e., SOS1 , SOS2, and SOS3 [7e9]. SOS1 encodes for a plasma membrane Na þ /H þ antiporter, responsible for the exclusion of sodium in the apoplast. SOS2 gene encodes a serine/threonine type protein kinase, which activates SOS1 [10]. The SOS3 gene encodes an EF-hand type calcium- binding protein with similarities to animal neuronal calcium sensors and the yeast calcineurin B subunit [11,12]. In yeast, calcineurin plays a central role in the regulation of Na þ and K þ transport. Mutations in calcineurin B lead to increased sensitivity of yeast cells to growth inhibition by Na þ and Li þ stresses [13]. SOS2 physically interacts with and is activated by SOS3 [14]. Therefore, SOS2 and SOS3 define a regulatory pathway for Na þ and K þ homeostasis and salt tolerance in plants. Besides being regulated by SOS2, SOS1 activity may also be regulated by SOS4. SOS4 catalyzes the formation of pyridoxal-5- phosphate, a cofactor that may serve as a ligand for SOS1, because the latter contains a putative binding sequence for this cofactor [15]. Abbreviations: Chl, chlorophyll; DAA, days after anthesis; DAS, days after sowing; ECe, electrical conductivity of extract; K, potassium; MSI, membrane stability index; Na, sodium; NHX1, tonoplastic Na þ /H þ antiporter; RWC, relative water content; SOS, salt overly sensitive. * Corresponding author. Tel.: þ91 11 25842815; fax: þ91 11 25846107. E-mail address: [email protected] (R.K. Sairam). Contents lists available at SciVerse ScienceDirect Plant Physiology and Biochemistry journal homepage: www.elsevier.com/locate/plaphy 0981-9428/$ e see front matter Ó 2011 Elsevier Masson SAS. All rights reserved. doi:10.1016/j.plaphy.2011.10.001 Plant Physiology and Biochemistry 51 (2012) 90e101
-
Upload
independent -
Category
Documents
-
view
2 -
download
0
Transcript of Differential expression of salt overly sensitive pathway genes determines salinity stress tolerance...

at SciVerse ScienceDirect
Plant Physiology and Biochemistry 51 (2012) 90e101
Contents lists available
Plant Physiology and Biochemistry
journal homepage: www.elsevier .com/locate/plaphy
Research article
Differential expression of salt overly sensitive pathway genesdetermines salinity stress tolerance in Brassica genotypes
K. Chakraborty a, Raj K. Sairama,*, R.C. Bhattacharya b
aDivision of Plant Physiology, Indian Agriculture Research Institute, New Delhi 110 012, IndiabNational Research Center on Plant Biotechnology, Pusa Campus, New Delhi 110 012, India
a r t i c l e i n f o
Article history:Received 22 July 2011Accepted 3 October 2011Available online 14 October 2011
Keywords:BrassicaGene expressionPotassiumSalinity stressSalt overly sensitive pathwaySodiumVacuolar antiporter
Abbreviations: Chl, chlorophyll; DAA, days after antECe, electrical conductivity of extract; K, potassium; MNa, sodium; NHX1, tonoplastic Naþ/Hþ antiporter; RWsalt overly sensitive.* Corresponding author. Tel.: þ91 11 25842815; fax
E-mail address: [email protected] (R.K. Sairam
0981-9428/$ e see front matter � 2011 Elsevier Masdoi:10.1016/j.plaphy.2011.10.001
a b s t r a c t
The objective of the present study was to examine the role of SOS pathway in salinity stress tolerance inBrassica spp. An experiment was conducted in pot culture with 4 Brassica genotypes, i.e., CS 52 and CS 54,Varuna and T 9 subjected to two levels of salinity treatments along with a control, viz., 1.65 (S0), 4.50 (S1)and 6.76 (S2) dS m�1. Salinity treatment significantly decreased relative water content (RWC), membranestability index (MSI) and chlorophyll (Chl) content in leaves and potassium (K) content in leaf, stem androot of all the genotypes. The decline in RWC, MSI, Chl and K content was significantly less in CS 52 andCS 54 as compared to Varuna and T 9. In contrast, the sodium (Na) content increased under salinity stressin all the plant parts in all the genotypes, however, the increase was less in CS 52 and CS 54, which alsoshowed higher K/Na ratio, and thus more favourable cellular environment. Gene expression studiesrevealed the existence of a more efficient salt overly sensitive pathway composed of SOS1, SOS2, SOS3 andvacuolar Naþ/Hþ antiporter in CS 52 and CS 54 compared to Varuna and T 9. Sequence analyses of partialcDNAs showed the conserved nature of these genes, and their intra and intergenic relatedness. It is thusconcluded that existence of an efficient SOS pathway, resulting in higher K/Na ratio, could be one of themajor factor determining salinity stress tolerance of Brassica juncea genotypes CS 52 and CS 54.
� 2011 Elsevier Masson SAS. All rights reserved.
1. Introduction
Soil salinity is a major abiotic stress affecting crop productivity.Excess of sodium ions are toxic to plants because of their adverseeffects on Kþ nutrition, cytosolic enzyme activities, photosynthesis,and metabolism [1,2]. Control of intracellular ion homeostasis isessential for all cellular organisms. Three mechanisms functioncooperatively to prevent the accumulation of Naþ in the cytoplasm,i.e., restriction of Naþ influx, active Naþ efflux, and compartmental-ization of Naþ in the vacuole [1]. In plants this is achieved throughcoordinated regulation of transporters for Hþ, Kþ, and Naþ. Naþ ionsare not strongly discriminated against at the root membrane;therefore, salinity of the xylem stream increases under salineconditions [3,4]. Kþ content, Kþ/Naþ selectivity and cell-membranestability decreases, while electrolyte leakage increases significantlyby salinity in different cultivars of Brassica napus [3]. Further, sodium
hesis; DAS, days after sowing;SI, membrane stability index;C, relative water content; SOS,
: þ91 11 25846107.).
son SAS. All rights reserved.
import, transport, and deposition have been reported to increaseby salinity treatment, while Kþ and Mg2þ import, deposition, andremobilization were decreased [5].
Several Arabidopsis sos (salt overly sensitive)mutants, defective insalt tolerance have been characterized [6,7]. The sos mutants arespecifically hypersensitive to high externalNaþ or Liþ and also unableto grow under very low external Kþ concentrations [7]. Allelic testsindicated that the sos mutants define three SOS loci, i.e., SOS1, SOS2,and SOS3 [7e9]. SOS1 encodes for a plasma membrane Naþ/Hþ
antiporter, responsible for the exclusion of sodium in the apoplast.SOS2 gene encodes a serine/threonine type protein kinase, whichactivates SOS1 [10]. The SOS3 gene encodes an EF-hand type calcium-binding proteinwith similarities to animal neuronal calcium sensorsand the yeast calcineurin B subunit [11,12]. In yeast, calcineurin playsa central role in the regulation of Naþ and Kþ transport. Mutations incalcineurin B lead to increased sensitivity of yeast cells to growthinhibition byNaþ and Liþ stresses [13]. SOS2 physically interactswithand is activated by SOS3 [14]. Therefore, SOS2 and SOS3 definea regulatory pathway for Naþ and Kþ homeostasis and salt tolerancein plants. Besides being regulated by SOS2, SOS1 activity may also beregulated by SOS4. SOS4 catalyzes the formation of pyridoxal-5-phosphate, a cofactor that may serve as a ligand for SOS1, becausethe latter contains a putative binding sequence for this cofactor [15].
Name Sequence Length(bases)
GC % Tm(�C)
Productsize(bp)
BnSOS1-F GGA CTC TAC GAA GTC CTC ACT G 22 54.5 62.7 617BnSOS1-R CAG CTC ATG AGA CCT CTG TGT TC 23 52.2 63.9BnSOS2-F GTT CAG CAG CAG ATA TTT GGT C 22 45.5 61.1 644BnSOS2-R GTC TAC CAT GAA AAG CGA TGG TG 23 47.8 63.0BrSOS3-F GAN GGT CTT ATT CAT AAG GAA GA 23 37.0 58.3 437BrSOS3-R CCT TTA GAT ANG GCA AAG TCA TG 23 41.3 59.9BnNHX1-F GGT ATT GTG ATG TCC CAT TAC AC 23 43.5 60.8 698BnNHX1-R GAG TCA TCA AAT TGT CTC
CAG TAG24 41.7 60.5
Tubulin-F CAG CAA TAC AGT GCC TTG AGT G 19 57.9 60.0 360Tubulin-R CCT GTG TAC CAA TGA AGG
AAA GCC24 50.0 62.2
*Oligo concentration 1.0 mM, Naþ concentration 50 mM.
K. Chakraborty et al. / Plant Physiology and Biochemistry 51 (2012) 90e101 91
Recently Quan et al. [16] reported SOS3-like calcium-bindingprotein8 (SCaBP8), which along with SOS3 is required for the acti-vation of SOS2. Lin et al. [17] further reported that SOS2 also phos-phorylates and activates down stream SCaBP8 but not SOS3.
Among the three SOS loci, SOS1 plays the greatest role in plant salttolerance. Compared with sos2 and sos3 mutant plants, sos1 mutantplants are even more sensitive to Naþ and Liþ stresses [7,8]. Double-mutant analysis indicated that SOS1 functions in the samepathwayasSOS2 and SOS3 [11]. At the plasma membrane a family of P-typeHþ-ATPases serves as the primary pump that generates a protonmotive force for driving the active transport of other solutes, includeKþ and Naþ [18]. Much of the Naþ that enters the cell is alsocompartmentalized into the vacuole through the action of vacuolarNaþ/Hþ antiporters [19,20]. Qiu et al. [21] reported that activity ofvacuolar NHX1 is also regulated by SOS2. The driving force for thevacuolar transporters is the proton motive force created by vacuolarV-type Hþ-ATPases and the Hþ-pyrophosphatase [18]. Recently Yanget al. [22] reported an increase in salt tolerance in transgenicArabidopsis over-expressing AtNHX1, SOS1, SOS3, AtNHX1 þ SOS3,SOS2 þ SOS3, or SOS1 þ SOS2 þ SOS3.
Till now the studies regarding mechanism of salinity tolerancehave been reported in model plants like Arabidopsis and very littlework has been reported in agronomically important crop plants likemustard. Therefore, the aim of the present studywas to characterizethe role of SOS pathway and vacuolar Naþ/Hþ antiporter in main-taining Kþ and Naþ homeostasis, and on salt tolerance in differen-tially tolerant mustard genotypes.
2. Materials and methods
2.1. Plant material and growth conditions
An experimentwas conducted in the pot culture of the Division ofPlant Physiology, Indian Agricultural Research Institute, New Delhiduring the winter seasons of 2009e10 with 3 Brassica juncea culti-vars, viz., CS 52, CS 54 (tolerant), Varuna (susceptible), and Brassicacampestris cultivar T 9 (susceptible). Sowingwasdone in earthenpots(30 cm � 30 cm) lined with 400 gauge polythene sheets and filledwith 10 kg of air dried soil (clay loam) and farmyard manure in 3:1ratio. Before sowing, seedswere treatedwithBavistin (@2 gper 100 gseeds). Nitrogen, phosphorus and potash fertilizers were applied atthe rate of 60:60:40 kg ha�1, respectively. The fertilizer dose wascalculated considering 2.24 � 106 kg of soil per hectare. Salinitytreatment was given 20 days after sowing (DAS) by adding 2.5 L ofwater (control) or saline solutions per 10 kg of air dried soil. Salinitywas created by taking Na:Ca and Cl:SO4 in 4:1 ratios; S1: 25,12.5 and12.5 mmol l�1 of NaCl, Na2SO4 and CaCl2, respectively, and S2: 50,25 and 25 mmol l�1 of NaCl, Na2SO4 and CaCl2, respectively. Soilsamples were collected at vegetative (25 DAS), 50% flowering and atharvest stages of crop growth from the pots of each variety andtreatment, and ECe values were estimated. The mean salinity levelswere 1.65, 4.50 and 6.76 dS m�1 for S0 (control), S1 and S2, respec-tively. Scheduled routine of irrigation was practiced for both controland treated pots throughout the crop growth period. Each treatmentwas replicated 12 times in the form of pots.
Relativewater content, membrane stability index and chlorophyllcontent were recorded at (a) vegetative/pre-flowering (25 DAS),(b) 50% flowering and (c) post-flowering (25 days after anthesis -DAA) stages in the third fully-matured leaf. Potassium and sodiumcontents were estimated at (a) 50% flowering and (b) post-flowering(25DAA) stages in leaves, stemand roots. At each stage sampleswererandomly collected in quadruplicate from 4 pots. For gene expressionstudies, the root and leaf sampleswere collected 24 h after treatmentand total RNA extraction was done immediately after samplecollection and preserved in minus (�) 80 freezer.
2.2. Physiological parameters
Leaf relativewater content (RWC)was estimated by recording theturgid weight of 0.5 g fresh leaf samples by keeping in water for 4 h,followed by drying in hot air oven till constant weight was achieved[23].
RWC ¼ ½ðFresh wt:� Dry wt:Þ=ðTurgid wt:� Dry wt:Þ� � 100
Membrane stability index (MSI) was estimated as per Sairamet al. [24]. For estimation of membrane stability index 100 mg leafmaterial, in two sets, was taken in test tubes containing 10 ml ofdouble distilled water. One set was heated at 40 �C for 30 min ina water bath, and the electrical conductivity of the solution wasrecorded on a conductivity bridge (C1). Second set was boiled at100 �C on a boiling water bath for 10 min, and its conductivity wasmeasured on a conductivity bridge (C2). MSI was calculated as:
MSI ¼ ½1� ðC1=C2Þ� � 100
For chlorophyll estimation 50 mg leaf material was extracted in10 ml dimethylsulfoxide (DMSO) [25]. Samples were heated in anincubator at 65 �C for 4 h and then after cooling to room temper-ature; the absorbance of the extracts was recorded at 645 and663 nm. Chlorophyll content was calculated as per Arnon [26].
2.3. Estimation of potassium and sodium
The thoroughly ground plant material (0.5 g) was pre-digestedin conical flasks (100 ml capacity) by soaking overnight with10 ml of concentrated HNO3, and finally digested in di-acid mixture(20 ml) containing HNO3 and HClO4 acid (9:4) on digestion unit(Gerhardt Turbotherm). The digested material was cooled, dilutedwith distilled water and filtered through Whatman No. 42 filterpaper. The volume was made up to 25 ml and stored in poly-propylene bottles (100 ml capacity) for further analysis. Thecontent of K and Na in the samples and standards were estimatedusing K and Na-specific filters in a flame photometer (ELICO CL361).Standard curve of K and Na were plotted and concentrations ofK and Na in the samples were calculated.
2.4. Gene expression studies
Nucleotide sequences for candidate genes were obtained fromNational Center for Biotechnology Information (http://www.ncbi.nlm.nih.gov/). The Basic Local Alignment Search Tool [27] wasused to identify the homologues of candidate genes. For RT-PCRexpression analysis and cloning of cDNAs, the following oligonu-cleotide primers were designed manually.

K. Chakraborty et al. / Plant Physiology and Biochemistry 51 (2012) 90e10192
For gene expression studies 25 d old plants were subjected todifferent salinity treatments for 24 h. Gene expression of SOS1, SOS2and SOS3was studied in root tissue, while NHX1was studied in leaftissue. Root and leaf samples were harvested from control andtreated plants and total RNA was extracted using RNAeasy kit(Qiagen Inc., Chatsworth CA 91311, USA, Cat No: 749040) accordingto the manufacturer’s instruction. DNA contamination wasremoved from the RNA samples using DNase I (Qiagen Science,Maryland, USA). One mg of total RNA was reverse transcribed usinggene-specific primers and Qiagen one step RT-PCR kit. PCR condi-tions were standardized using gene-specific primers for tubulin.Linear amplification for semi-quantitative RT-PCR was obtainedwith 27 cycles. Reactions were conducted using My Genie 32Thermal Block PCR (Bioneer, Korea) under the following conditions:initial PCR activation step: 15 min at 95 �C, reverse transcription:
Fig. 1. Effect of salinity levels on relative water content (A), membrane stability index (B)
30 min at 50 �C, denaturation: 1 min at 94 �C, annealing: 1 min at58 �C (SOS1, SOS2, SOS3 and NHX1) and 60 �C (tubulin), extension:1 min at 72 �C, final extension: 10 min at 72 �C. The amplificationproducts were separated by electrophoresis on 1.2% agarose gel at120 V in TBE buffer (0.4 M Triseborate, 0.001M EDTA, pH 8.0) usingknown concentration DNA ladders. RT-PCR reactions were repeatedmany times to standardize the time and temperature of annealing.Reported gel photographs were selected from the best of three PCRreactions. Gels were stained with ethidium bromide and visualizedon Uvi Pro Gel Documentation system (Uvitec, England).
The purified cDNA for each gene were cloned into pTz57R/Tvectors and transformed in Escherichia coli (strain DH5a) cells. DH5acells transformed with recombinant plasmid were selected based onantibiotic resistance as well as a-complementation method.Ampicillin-resistant putative recombinants were selected for further
, and chlorophyll content (C) in Brassica genotypes. Vertical bars show � SE of mean.

K. Chakraborty et al. / Plant Physiology and Biochemistry 51 (2012) 90e101 93
analysis. Plasmids were isolated from the confirmed colonies andrestriction analysis was carried out by using Kpn I and Hind IIIenzymes flanking the cloning site of vector pTz57R/T, to confirm thepresence of cloned insert cDNA. E. coli cells containing desiredrecombinant plasmid were given to Xcelris Labs Limited, Bodakdev,Ahmedabad, India, for sequencing the cloned insert cDNA.
2.5. Statistical analyses
Values for RWC, MSI and Chl content are means of 4 observations(n ¼ 4), while in case of ion estimations samples from each of the 4replicates were analyzed twice and the values are means of 8observations (n ¼ 8). The data was subjected to analysis of varianceappropriate to the experimental design. F-test was carried out to testthe significance of the treatment differences and the least significantdifferences (LSD) were computed to test the significance of thedifferent treatments at 5% level of probability by the SPSS 16.0.
3. Results
3.1. Physiological parameters
Relative water content (RWC) decreased in all the genotypesunder increasing level of salinity treatment compared to control
Fig. 2. Effect of salinity levels on potassium content of leaves (A), stem (B), and roots(C) in Brassica genotypes. Vertical bars show � SE of mean.
(S0) at all the stages of growth (Fig. 1A). CS 52 and CS 54 maintainedhigher RWC at both the salinity levels, followed by Varuna and T 9.The last two recorded significant decline in RWC, which resulted inreduced growth and wilting of leaves in treated plants.
Membrane stability index (MSI) decreased with increase insalinity in all the genotypes at all the stages, with an averagedecline ranging from 2 to 10% in CS 52 and CS 54, and 8e20% inVaruna and T 9 (Fig. 1B). At flowering and post-flowering stages, CS52 showed highest MSI, viz., 78.49 and 69.67%; 75.22 and 71.26%under S1 and S2 treatments, respectively. MSI declined significantlyin T 9 under S2 treatment at post-flowering stage from the controlvalue of 72.63 to 43.19%.
Salinity induced decline in chlorophyll content was observed inall the genotypes, but the reduction was less in B. juncea than inB. campestris (Fig. 1C). Under S2 treatment lowest reduction inchlorophyll content was observed in CS 52, which was 25.79, 36.54and 21.75% at vegetative, flowering and post-flowering stages,respectively. Highest salinity induced decline in the chlorophyllcontent was observed in B. campestris genotype T 9 at all the stagesof growth. Under S2 treatment chlorophyll content in T 9 were 8.34,10.81 and 8.46 mg g�1 dry wt. compared to the control (S0) valuesof 18.04, 21.12 and 19.29, resulting in 53.76, 48.81 and 56.14%reductions at vegetative, flowering and post-flowering stages,respectively.
Fig. 3. Effect of salinity levels on sodium content of leaves (A), stem (B), and roots (C)in Brassica genotypes. Vertical bars show � SE of mean.

K. Chakraborty et al. / Plant Physiology and Biochemistry 51 (2012) 90e10194
3.2. Potassium and sodium contents in different plant parts
Potassium content in leaf, stem and root decreased signifi-cantly under salinity in all the genotypes at all the three stages ofgrowth (Fig. 2AeC). The average reductions in leaf K content underS2 treatment over the control plants was 52.57 and 59.42% atflowering and post-flowering stages, respectively. In CS 52 thereduction under S2 treatment was relatively less, viz., 34.57 and43.65% at flowering and post-flowering stages, respectively,compared to the susceptible genotype Varuna, where the reduc-tion in leaf K content was far more, i.e., 57.22 and 96.61% at thetwo stages. The data of K content in the stem also showed similarpattern but the reductions were lesser in stem than that of theleaves. In CS 52 the reductions in stem K content over controlplants were 28.39 and 35.84% at flowering and post-floweringstages, respectively under S2 treatment, whereas in Varuna thereductions were 57.67 and 50.07% at the two stages under S2treatment. In the root, potassium content was lower than that of
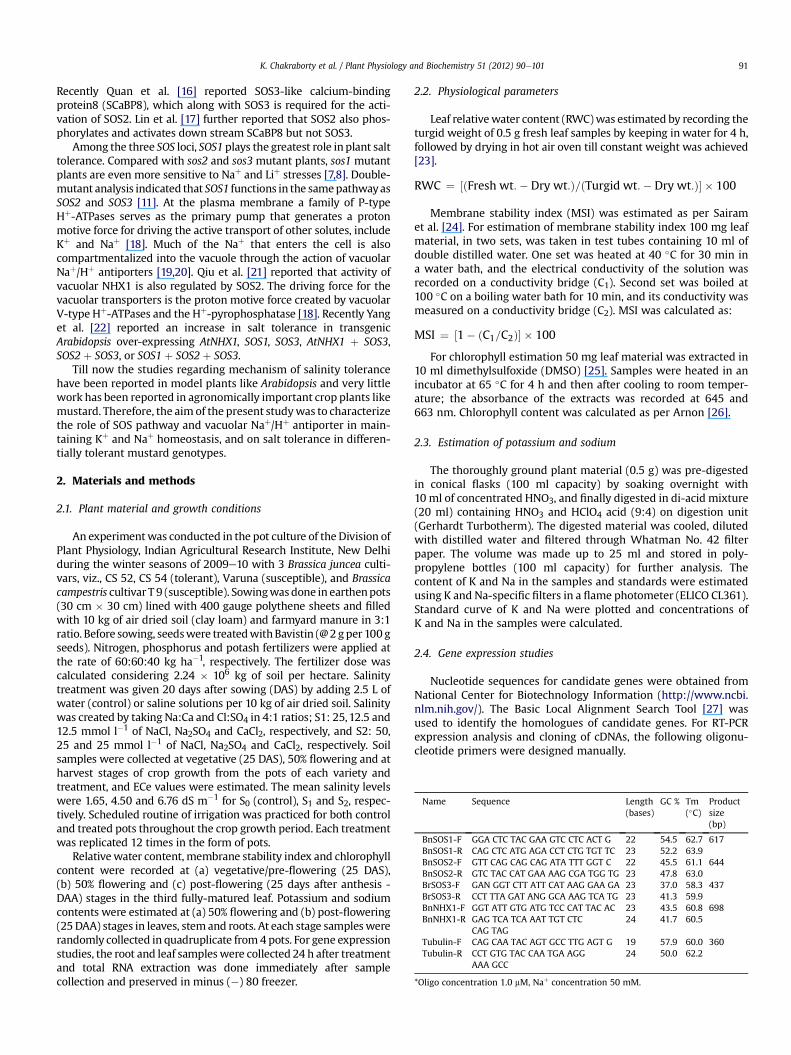
Fig. 4. Effect of salinity levels on potassium/sodium ratios of leaves (A), stem
leaf or stem, and the salt stress induced decline in K content wassignificantly more in Varuna and T 9.
Sodium content increased under different levels of salinity in allthe genotypes in leaf, stem and root (Fig. 3AeC). However, theaverage increase under S2 treatment over control (S0) wasmuch lessin CS 52 and CS 54, i.e., 103.97 and 65.69% increases at flowering andpost-flowering stages, respectively compared to Varuna and T 9,which recorded up to 6 times increases under S2 treatment overcontrol plants at post-flowering stage. The trend of Na accumulationwas similar in stem and root. Among leaf, stem and roots, lowest Nacontent was observed in leaf, followed by stem and highest in roots.
Salinity decreased K/Na ratio in all the plant parts in all thegenotype (Fig. 4AeC). Among all the cultivars, CS 52 and CS 54maintained highest, and Varuna and T 9 lowest K/Na ratios in leaf,stem and roots under S1 and S2 treatments. Among leaf, stem androots, leaves maintained highest K/Na ratio, while roots recordedlowest K/Na ratio in all the genotypes at flowering and post-flowering stages of growth.
(B), and roots (C) in Brassica genotypes. Vertical bars show � SE of mean.

K. Chakraborty et al. / Plant Physiology and Biochemistry 51 (2012) 90e101 95
3.3. Gene expression studies
3.3.1. Salt Overly Sensitive 1 (SOS1)In case of SOS1, RT-PCR was performed with primers obtained
from B. napus and expected amplicons of size 617 bp were observedin all the four genotypes under the three treatments. There wasvery little expression in control plants of the four genotypes. But,very prominent bandswere observed in CS 52 and CS 54, and a littleless in T 9 under S2 treatment, while in Varuna there was very littleincrease in mRNA expression with the increasing level of salinitytreatment (Fig. 5A). About 600 bp long partial cDNA sequences ofSOS1 were obtained in CS 52, CS 54, Varuna and T 9. The partial
Fig. 5. Gene expression of SOS1, (A) SOS2 (B), SOS3 (C) in roots and NHX1 (D) in leaves of whmarker, and S0, S1 and S2 denotes 1.65, 4.50 and 6.76 dS m�1, respectively salinity levels).
cDNAs of SOS1 have been registered in NCBI data base (GeneBankID: HQ848287.1, HQ848288.1, HQ848289.1 and HQ848290.1 for CS52, CS 54, Varuna and T 9, respectively). The partial deduced aminoacid sequences of SOS1 were compared with Triticum aestivum(GeneBank Acc. No. AY326952.3), Oryza sativa japonica (GeneBankAcc. No. AY785147.1) and Arabidopsis thaliana (GeneBank Acc. No.NM126259.3) using ClustalW (2.1) multiple alignment (Fig. 6).
3.3.2. Salt Overly Sensitive 2 (SOS2)In case of SOS2 gene, RT-PCR was performed with primers ob-
tained from B. napus and expected amplicons of size 644 bp wereobtained in all the four genotypes under all the three treatments.
eat genotypes under various salinity levels. b-tubulin was used as internal standard (M:
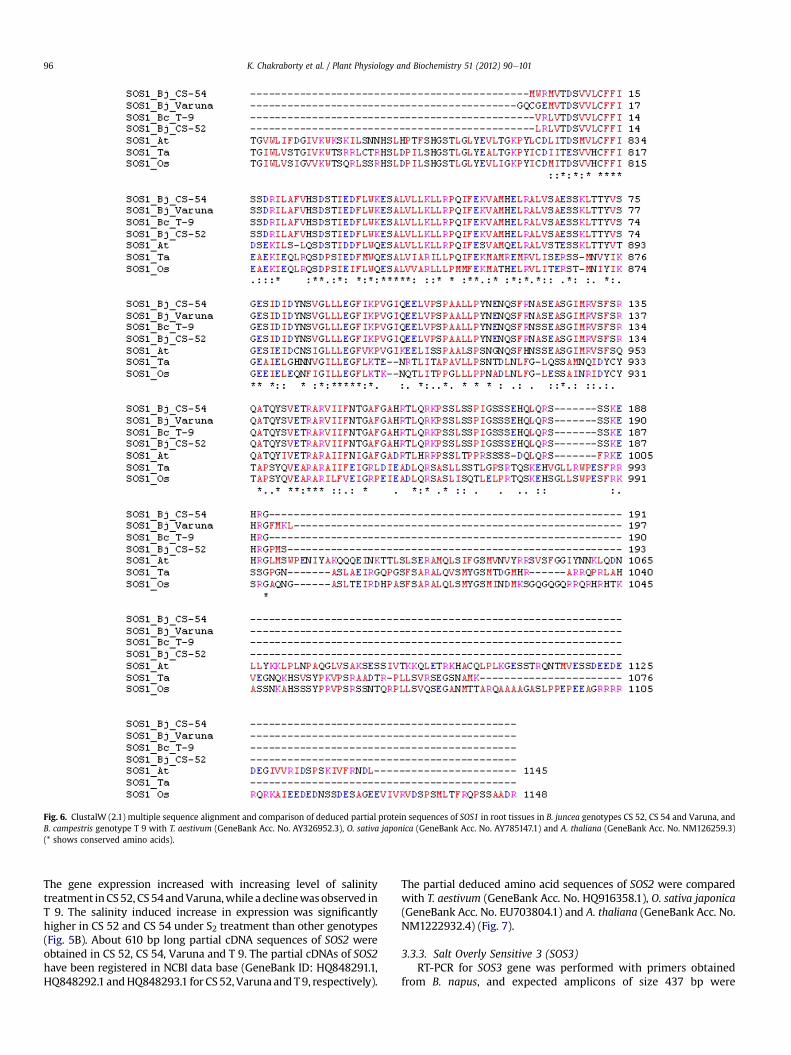
Fig. 6. ClustalW (2.1) multiple sequence alignment and comparison of deduced partial protein sequences of SOS1 in root tissues in B. juncea genotypes CS 52, CS 54 and Varuna, andB. campestris genotype T 9 with T. aestivum (GeneBank Acc. No. AY326952.3), O. sativa japonica (GeneBank Acc. No. AY785147.1) and A. thaliana (GeneBank Acc. No. NM126259.3)(* shows conserved amino acids).
K. Chakraborty et al. / Plant Physiology and Biochemistry 51 (2012) 90e10196
The gene expression increased with increasing level of salinitytreatment inCS52, CS54andVaruna,while a declinewasobserved inT 9. The salinity induced increase in expression was significantlyhigher in CS 52 and CS 54 under S2 treatment than other genotypes(Fig. 5B). About 610 bp long partial cDNA sequences of SOS2 wereobtained in CS 52, CS 54, Varuna and T 9. The partial cDNAs of SOS2have been registered in NCBI data base (GeneBank ID: HQ848291.1,HQ848292.1 andHQ848293.1 for CS52, VarunaandT9, respectively).
The partial deduced amino acid sequences of SOS2 were comparedwith T. aestivum (GeneBank Acc. No. HQ916358.1), O. sativa japonica(GeneBank Acc. No. EU703804.1) and A. thaliana (GeneBank Acc. No.NM1222932.4) (Fig. 7).
3.3.3. Salt Overly Sensitive 3 (SOS3)RT-PCR for SOS3 gene was performed with primers obtained
from B. napus, and expected amplicons of size 437 bp were

Fig. 7. ClustalW (2.1) multiple sequence alignment and comparison of deduced partial protein sequences of SOS2 in root tissues in B. juncea genotypes CS 52, CS 54 and Varuna, andB. campestris genotype T 9 with T. aestivum (GeneBank Acc. No. HQ916358.1), O. sativa japonica (GeneBank Acc. No. EU703804.1) and A. thaliana (GeneBank Acc. No. NM1222932.4)(* shows conserved amino acids).
K. Chakraborty et al. / Plant Physiology and Biochemistry 51 (2012) 90e101 97
observed in all the genotypes. There was very little expression incontrol plants of all the four genotypes, however, significantincreases in mRNA expression was observed under S2 treatment inCS 52 and CS 54 over control. There was very little expression ofSOS3 in T 9 under salt stress (Fig. 5C). About 430 bp long partialcDNA sequences of SOS3 were obtained in CS 52, CS 54, Varunaand T 9. The partial deduced amino acid sequences of SOS3 werecompared with T. aestivum (GeneBank Acc. No. JF263454.1),O. sativa japonica (GeneBank Acc. No. DQ201199.1) and A. thaliana(GeneBank Acc. No. NM122333.4) using ClustalW (2.1) multiplealignment (Fig. 8).
3.3.4. Vacuolar sodium proton antiporter (NHX1)In case of NHX1 gene, RT-PCR was performed with primers ob-
tained from B. napus and expected amplicons of size 698 bp wereobserved in all the genotypes. A very significant increase in gene
expressionwith increasing level of salinitywas observed in CS52 andCS 54. In case of Varuna a slight increasewas observed only under S1treatment, while in case of T 9 very faint bands were observed underS0 andS1, andnoexpressionwasobservedunder S2 salinity treatment(Fig. 5D). About 590 bp long partial cDNA sequences of VacuolarNaþ/Hþ antiporter (NHX1) were obtained in CS 52, CS 54, Varuna and T 9.The partial cDNAs of NHX1 have been registered in NCBI data base(GeneBank ID: HQ848294.1, HQ848295.1 and HQ848296.1 for CS 52,CS 54 and Varuna, respectively). The partial deduced amino acidsequences of NHX1were compared with T. aestivum (GeneBank Acc.No. AY040246.2), O. sativa japonica (GeneBank Acc. No. AB021878.1)and A. thaliana (GeneBank Acc. No. AK226586.1) using ClustalW (2.1)multiple alignments (Fig. 9).
The expression of b-tubulin was almost constant in all thegenotypes, and did not change under control and salinity condi-tions (Fig. 5).

Fig. 8. ClustalW (2.1) multiple sequence alignment and comparison of deduced partial protein sequences of SOS3 in root tissues in B. juncea genotypes CS 52, CS 54 and Varuna, andB. campestris genotype T 9 with T. aestivum (GeneBank Acc. No. JF263454.1), O. sativa japonica (GeneBank Acc. No. DQ201199.1) and A. thaliana (GeneBank Acc. No. NM122333.4)(* shows conserved amino acids).
K. Chakraborty et al. / Plant Physiology and Biochemistry 51 (2012) 90e10198
4. Discussion
The results obtained in thepresent study, conductedwithB. junceagenotypes CS 52, CS 54, Varuna, and B. campestris genotype T 9revealed differential response to salinity stress. All the genotypesrecorded a decline in RWC, MSI and Chl content. However, thedeclines in RWC, MSI and Chl content were significantly less intolerant genotypes CS 52 and CS 54, which could maintain higherRWC, MSI and Chl content even at higher salinity level (6.76 dS m�1)as compared to susceptible genotypes Varuna and T 9. Highconcentration of salt in the root zone reduces soil water potential andthe availability of water [28], resulting in dehydration at cellular levelleading to osmotic stress. Salt stress has been reported to reduce bothRWC and fresh weight significantly in different Brassica genotypes;however the degree of reductions were different in different species[29]. Misra and Dwivedi [4] reported salinity induced decrease inplant growth and water uptake in shoot and root. Cell-membranestability in maize subjected to osmotic stress was correlated withthe salinity and drought resistance of the whole plant [30]. Ahmad[31] has also reported an increase in electrolyte leakage in the leavesof B. juncea plants with the increasing levels of salinity treatmentcompared to unstressed plants. The differential response observed intolerant and susceptible genotypes in terms of chlorophyll contentcould be due to presence of mechanisms, which prevented chloro-phyll degradation in tolerant genotypes than susceptible ones. Thesecould be in terms of their ability to maintain higher RWC and
membrane ultra structure as shown by greater membrane stabilityindex.
Although reduction in K content was observed in all the plantparts in all the genotypes but the decline was significantly lesser inamphidiploids B. juncea cultivars viz. CS 52 and CS 54,which explainstheir tolerant nature towards external salt stress. Ashraf and Sarwar[32] also reported that salinity induced decline in potassium contentin different Brassica spp. was significantly lesser in amphidiploidsgenotypes than that of diploid ones. Patterns of ion accumulationhave been successfully used in discriminating between salt tolerantand salt-sensitive species or cultivars [33]. Salt stress increased theNaþ level in all the plant parts in all the cultivars, but the increaseswere lesser in comparatively tolerant genotypes CS 52 and CS 54,which also showed less sodium accumulation in the leaves than instem and roots, and thus helps in maintaining ion homeostasis inleaves, which are metabolically most active part of the plant.
K/Na ratio, a very good indicator of plant’s response to salt stress,decreased with increasing level of salinity treatment [32]. But theratio was significantly higher in the leaves of CS 52 and CS 54 undersalt stress than the other genotypes, indicating their capacity tomaintain favourable cellular environment for growth and othermetabolic activities,which can be the basis of their tolerance towardssoil salinity. Higher selectivity towards Kþ and restricted uptake ofNaþ has been reported in tolerant genotypes of Indian mustard.Kumar [3] and Garg et al. [34] also reported that the mechanism ofselectivity of ion transport appears to confer tolerance against salt

Fig. 9. ClustalW (2.1) multiple sequence alignment and comparison of deduced partial protein sequences of NHX1 in leaf tissues in B. juncea genotypes CS 52, CS 54 and Varuna, andB. campestris genotype T 9 with T. aestivum (GeneBank Acc. No. AY040246.2), O. sativa japonica (GeneBank Acc. No. AB021878.1) and A. thaliana (GeneBank Acc. No. AK226586.1)(* shows conserved amino acids).
K. Chakraborty et al. / Plant Physiology and Biochemistry 51 (2012) 90e101 99
stress in Indian mustard. K/Na ratio thus can be used as a selectioncriterion for breeding salinity tolerant genotypes.
Higher expression of SOS1, a plasma membrane-bound Naþ/Hþ
antiporter [35] in CS52andCS54would lead to exclusion of toxicNaþ
into apoplast region from cellular environment and consequentlya better salt tolerance. Among the three SOS loci, SOS1 plays thegreatest role in plant salt tolerance. Olías et al. [36] reported thatplasma membrane Naþ/Hþ exchanger SOS1 controls extrusion anddistribution of Naþ in tomato plants, and thus helps in maintaininghigh Kþ/Naþ ratio under salinity stress. Compared with sos2 and sos3mutant plants, sos1 mutant plants are more sensitive to Naþ and Liþ
stresses [37]. Further double-mutants analysis indicated that SOS1,SOS2 and SOS3 function co-ordinately for Naþ exclusion in the samepathway [7].
About 600 bp long partial cDNA sequences of SOS1were obtainedin caseof CS52, CS54, VarunaandT9. Thepartial deducedamino acidsequences of SOS1were comparedwith T. aestivum,O. sativa japonicaand A. thaliana using BLAST tool and ClustalW (2.1) multiple align-ment (Fig. 6). All the four genotypes, showed lowest similarity withT. aestivum (40e43%) and O. sativa japonica (40e41%). However, allthe Brassica genotypes showed higher similarity with A. thaliana
(74e77%), while among the Brassica genus, the similarity was97e98%. ClustalW analysis revealed that the obtained sequences arehighly conserved in Brassica genotypes, and closely related to Arabi-dopsis; however differed significantlywithwheat and ricewith in thesequenced regions.
SOS2, a serine/threonine type protein kinase, which actsupstream to SOS1 in SOS pathway [10], is responsible for theactivation of SOS1. In A. thaliana SOS2 gene is required for intra-cellular Naþ and Kþ homeostasis, and mutation in SOS2 genecauses Naþ and Kþ imbalance, which renders plantsmore sensitivetowards growth inhibition by high Naþ and low Kþ environments[10]. Greater expression of SOS2 in CS 52 and CS 54 may thus beresponsible for better salinity tolerance response of these geno-types under salt stress. ClustalW analysis of deduced amino acidsequences of the four genotypes revealed highest similarity withA. thaliana (84e85%) and lowest with O. sativa japonica (59e60%)and T. aestivum (62%), while about 97e100% similarity wasobserved among the Brassica genotypes (Fig. 7). This indicates thatthis portion of the SOS2 gene is highly conserved in all the Brassicagenotypes. Conserved domains were identified using ‘PROSITE’(release 20.61) and the partial amino acid sequences of SOS2

K. Chakraborty et al. / Plant Physiology and Biochemistry 51 (2012) 90e101100
showed two conserved domains: (1) PROTEIN_KINASE_DOM,protein kinase domain profile (PS 50011) (amino acid residues1e77 in CS 52, CS 54 and T 9; 1e78 in Varuna). (2) NAF, NAF domainprofile (PS 50816) (amino acid residues 118e142 in CS 52, CS 54and T 9; 119e143 in Varuna). A T(Threonine) present at 5th posi-tion in tolerant genotypes CS 52 and CS 54 was replaced byR(Arginine) in susceptible genotypes Varuna and T 9. This could beone of the reasons for the susceptibility of Varuna and T 9 undersalt stress condition than CS 52 and CS 54.
SOS3 gene encodes an EF-hand type calcium-binding proteinwithsimilarities to animal neuronal calcium sensors and the yeast calci-neurin B subunit [11]. Gene product of SOS3 is required for the acti-vation of SOS2 and SOS3 [38]. Mutations in calcineurin B lead toincreased sensitivity of yeast cells to growth inhibitionbyNaþ and Liþ
stresses [13]. It thus seems that very little expression of SOS3 insusceptible genotypes Varuna and T 9 under salt stress could prob-ably be responsible for their relative susceptibility towards salt stress.The partial deduced amino acid sequences of SOS3 were comparedwith T. aestivum, O. sativa japonica and A. thaliana using BLAST tooland ClustalW (2.1) multiple alignment (Fig. 8). All the four Brassicagenotypes showed highest similarity with A. thaliana (84e86%) andleast with T. aestivum (52e53%) and O. sativa japonica (54e60%).However, among the Brassica genus similarity was in the range of87e98%. Conserved domainswere identified using ‘PROSITE’ (release20.61) and the partial amino acid sequences of SOS3 showed twoconserved domains: (1) EF_HAND_1, EF-hand calcium-bindingdomain (PS 00018) (amino acid residues 113e125 in CS 52, 115e127in CS 54,109e121 in Varuna and 105e117 inT 9). (2) EF_HAND_2, EF-hand calcium-binding domain (PS 50222) (amino acid residues19e54 in CS 52, 21e56 in CS 54, 15e50 in Varuna and 11e46 in T 9).An E(glutamic acid) residue at 14th position in tolerant genotypes CS52 and CS 54 has been replaced by G(glycine) in susceptible geno-types Varuna and T 9. Also, there was a deletion in Varuna and T 9 at13th position; where as CS 52 and CS 54 have L(Lysine). Thesedifferences in amino acid residues may be responsible for theobserved differences in plant’s response to salinity stress.
Relatively greater salinity induced gene expression of VacuolarNaþ/Hþ antiporter (NHX1) in CS 52 and CS 54 might have resulted inincreased Naþ sequestration in vacuole, exported from cytosol inthese genotypes. In case of Varuna and T 9 theNHX1 gene expressionwasverynegligible.A. thalianaAtNHX1geneencodes a tonoplastNaþ/Hþ antiporter,which functions in the compartmentalizing of Naþ intothe vacuole, which is one of its defence responses against salt stress[20]. Over-expression of AtNHX1 enhances the salt tolerance of Ara-bidopsis plants [19]. About 590 bp long partial cDNA sequence ofNHX1 was obtained in CS 52, CS 54, Varuna and T 9. The partialdeduced amino acid sequences of NHX1 were compared withT. aestivum, O. sativa japonica and A. thaliana using BLAST tool andClustalW (2.1) multiple alignment (Fig. 9). CS 52, CS 54 and Varuna(B. Juncea), and T 9 (B. campestris) showed relatively less similaritywith T. aestivum and O. sativa japonica (61e63%), but showed muchgreater similarity with A. thaliana (84e85%). Among the B. junceagenotypes the similarity was 93e100%, while B. campestris (T 9)showed 76% similaritywith B. juncea genotypes. The cloned sequencebelonged to TIGR00840 (PSSMID 162063) sodium/hydrogenexchanger 3; the Monovalent Cation: Proton Antiporter-1 (CPA1)Family (TC 2.A.36). The CPA1 family is a large family of proteinsderived from gram-positive and gram-negative bacteria, blue greenbacteria, yeast, plants and animals. Transporters from eukaryoteshavebeen functionally characterized, and all of these catalyzeNaþ/Hþ
exchange. Their primary physiological functions may be in (1) cyto-plasmic pH regulation, extruding the Hþ generated during metabo-lism, and (2) salt tolerance (in plants), due to Naþ uptake intovacuoles. This Hmm is specific for the eukaryotic members of thisfamily. Tolerant genotype CS 52 and CS 54 have H(Histidine),
P(Proline) and A(Alanine) at 170th, 176th and 203rd positions, whichin susceptible genotypes Varuna and T 9 were replaced byN(Arginine), Q(Glutamine) and S(Serine). Moreover tolerant geno-types CS 52 and CS 54 have amino acid deletions at 59th and 84thpositions. At 59th position Varuna has I(isoleucine), and T 9(B. campestris) and A. thaliana have M(methionine)], while at 84thposition, Varuna has E(glutamic acid), T 9 (B. campestris) andA. thaliana have Q(glutamine). These changes could be havinga defining role in the activity of tonoplastic Naþ/Hþ antiporter, andthe resultant susceptibility of T 9 and Varuna to salt stress.
The expression of b-tubulin did not vary under control or salinitycondition in all the genotypes. b-Tubulin is a component of a heter-odimeric protein composed of two closely related 55 kDa proteinscalled a- and b-tubulin. The sequences of these genes are highlyconserved throughout the eukaryotic kingdom. The expression oftubulin is not affected by environmental conditions, and therefore,b-tubulin was used as an internal control.
Arabidopsis transgenic plants over-expressing SOS pathwaygenes showed lower Naþ and greater Kþ accumulation, resulting inhigher salinity stress tolerance [22]. Kumar et al. [39] also reportedstrong correlation between transcript abundance for SOS pathway-related genes and salinity stress tolerance in Brassica. SimilarlyMartínez-Atienza et al. [9] reported that the salt tolerance of rice(O. sativa) was associated with greater expression of SOS1, SOS2 andSOS3, which correlated with its ability to exclude Naþ from theshoot and to maintain a low cellular Naþ/Kþ ratio.
From the present study it is thus apparent that one of the mech-anism governing salinity tolerance in CS 52 and CS 54 could be thesignificantly higher induction of genes coding components of SOSpathway, viz., SOS1, SOS2, SOS3 and vacuolar antiporter NHX1,resulting in restricted uptake of toxic Naþ, and efficient Na-exclusionand sequestration system, which was manifested in lesser reductionin tissue K content and higher K/Na ratio under salt stress, paving theway for better ion homeostasis and salinity tolerance in thesegenotypes. It can thus be suggested that higher K/Na ratio andexpression of SOS pathway genes can be used asmarkers in breedingsalinity tolerant genotypes.
Acknowledgements
Authors are grateful to the authorities of Indian AgriculturalResearch Institute, New Delhi for providing the necessary help, andto Mr. Satya Narain Rai for the technical support. Financial helpprovided by Council of Scientific and Industrial Research, NewDelhito KC is also gratefully acknowledged.
References
[1] X. Niu, R.A. Bressan, P.M. Hasegawa, J.M. Pardo, Ion homeostasis in NaCl stressenvironments, Plant Physiol. 109 (1995) 735e742.
[2] B. Jacoby, Mechanism involved in salt tolerance of plants. in: M. Pessarakli(Ed.), Handbook of Plant and Crop Stress, second ed. Dekker, New York, 1999,pp. 97e123.
[3] D. Kumar, The value of certain plant parameters as an index for salt tolerancein Indian mustard (Brassica juncea L.), Plant Soil 79 (1984) 261e272.
[4] N. Misra, U.N. Dwivedi, Genotypic difference in salinity tolerance of greengram cultivars, Plant Sci. 166 (2004) 1135e1142.
[5] H. Rezaei, K.K. Sima, M.J. Malakouti, M. Pessarakli, Salt tolerance of canola inrelation to accumulation and xylem transportation of cations, J. Plant Nutr. 29(2006) 1903e1917.
[6] S.J. Wu, D. Lei, J.K. Zhu, SOS1, a genetic locus essential for salt tolerance andpotassium acquisition, Plant Cell 8 (1996) 617e627.
[7] J.K. Zhu, J. Liu, L. Xiong, Genetic analysis of salt tolerance in arabidopsis. Evidencefor a critical role of potassium nutrition, Plant Cell 10 (1998) 1181e1191.
[8] J.K. Zhu, Plant salt tolerance and the SOS pathway, in: Proceedings of theXLVIII Italian Society of Agricultural Genetics: SIFV-SIGA Joint Meeting, Lecce,Italy (15e18 September, 2004), ISBN 88-900622-5-8.
[9] J. Martínez-Atienza, X. Jiang, B. Garciadeblas, I. Mendoza, J.K. Zhu, J.M. Pardo,F.J. Quintero, Conservation of the salt overly sensitive pathway in rice, PlantPhysiol. 143 (2007) 1001e1012.

K. Chakraborty et al. / Plant Physiology and Biochemistry 51 (2012) 90e101 101
[10] J. Liu, M. Ishitani, U. Halfter, C.S. Kim, J.K. Zhu, The Arabidopsis thaliana SOS2gene encodes a protein kinase that is required for salt tolerance, Proc. Natl.Acad. Sci. USA 97 (2000) 3730e3734.
[11] J. Liu, J.K. Zhu, A calcium sensor homolog required for plant salt tolerance,Science 280 (1998) 1943e1945.
[12] S. Mahajan, G.K. Pandey, N. Tuteja, Calcium and salt-stress signaling in plants:shedding light on SOS pathway, Arch. Biochem. Biophys. 471 (2008) 146e158.
[13] I. Mendoza, F. Rubio, A. Rodriguez-Navarro, J.M. Pardo, The protein phos-phatase calcineurin is essential for NaCl tolerance of Saccharomyces cerevisiae,J. Biol. Chem. 269 (1994) 8792e8796.
[14] U. Halfter, M. Ishitani, J.K. Zhu, The Arabidopsis SOS2 protein kinase physicallyinteracts with and is activated by the calcium-binding protein SOS3, Proc.Natl. Acad. Sci. USA 97 (2000) 3735e3740.
[15] H. Shi, J.K. Zhu, SOS4, A pyridoxal kinase gene, is required for root hairdevelopment in Arabidopsis, Plant Physiol. 129 (2002) 585e593.
[16] R. Quan, H. Lin, I. Mendoza, Y. Zhang, W. Cao, Y. Yang, M. Shang, S. Chen,J.M. Pardo, Y. Guo, SCaBP8/CBL10, a putative calcium sensor, interacts with theprotein kinase SOS2 to protect Arabidopsis shoots from salt stress, Plant Cell 19(2007) 1415e1431.
[17] H. Lin, Y. Yang, R. Quan, I. Mendoza, Y. Wu, W. Du, S. Zhao, K.S. Schumaker,J.M. Pardo, Y. Guoa, Phosphorylation of SOS3-like calcium binding protein8 bySOS2 protein kinase stabilizes their protein complex and regulates salttolerance in Arabidopsis, Plant Cell 21 (2009) 1607e1619.
[18] H. Sze, X. Li, M.G. Palmgren, Energization of plant membranes byHþ-pumping ATPases: regulation and biosynthesis, Plant Cell 11 (1999)677e689.
[19] R.A. Gaxiola, R. Rao, A. Sherman, P. Grisafi, S.L. Alper, G.R. Fink, The Arabidopsisthaliana proton transporters, AtNhx1 and Avp1, can function in cationdetoxification in yeast, Proc. Natl. Acad. Sci. USA 96 (1999) 1480e1485.
[20] M.P. Apse, G.S. Aharon, W.A. Snedden, E. Blumwald, Salt tolerance Conferredby over-expression of a vacuolar Naþ/Hþ antiport in Arabidopsis, Science 285(1999) 1256e1258.
[21] Q.S. Qiu, Y. Guo, F.J. Quintero, J.M. Pardo, K.S. Schumaker, J.K. Zhu, Regulationof vacuolar Naþ/Hþ exchange in Arabidopsis thaliana by the salt-overly-sensitive (SOS) pathway, J. Biol. Chem. 279 (2004) 207e215.
[22] Q. Yang, Z.Z. Chen, X.F. Zhoua, H.B. Yina, X. Lia, X.F. Xina, X.H. Honga, J.K. Zhu,Z. Gong, Over-expression of SOS (salt overly sensitive) genes increases salttolerance in transgenic Arabidopsis, Mol. Plant 2 (2009) 22e31.
[23] E. Weatherley, Studies in water relations of cotton plants. I. The fieldmeasurement of water deficit in leaves, New Phytol. 49 (1950) 81e87.
[24] R.K. Sairam, P.S. Deshmukh, D.S. Shukla, Tolerance of drought and tempera-ture stress in relation to increased antioxidant enzyme activity in wheat,J. Agron. Crop Sci. 178 (1997) 171e177.
[25] J.D. Hiscox, G.F. Israelstam, A method for extraction of chloroplast from leaftissue without maceration, Can. J. Bot. 57 (1979) 1332e1334.
[26] D.I. Arnon, Copper enzymes in isolated chloroplasts. Polyphenol oxidase inBeta vulgaris, Plant Physiol. 24 (1949) 1e15.
[27] S.R. Altschul, T.L. Madden, A.A. Schaffer, Z. Zhang, J. Zhang, W. Mille,D.J. Lipman, Gapped BLAST and PSI-BLAST: a new generation of proteindatabase search programmes, Nucleic Acids Res. 25 (1997) 3389e3402.
[28] J. Lloyd, P.E. Kriedmann, D. Aspinall, Comparative sensitivity of ‘Prior Lisbon’lemon and ‘Valensa’ orange trees to foliar sodium and chloride concentra-tions, Plant Cell Environ. 12 (1989) 529e540.
[29] Z.S. Siddiqui, M.A. Khan, B.J. Kim, J.S. Huang, T.R. Kwon, Physiologicalresponses of Brassica genotypes to combined drought and salt stress, PlantStress 2 (2008) 78e83.
[30] J.M. Simond, D.M. Orcutt, Free and conjugated desmethylsterol composition ofZea mays hybrids method of determining cold injury, Plant Physiol. 42 (1988)1423e1426.
[31] P. Ahmad, Growth and antioxidant responses in mustard (Brassica juncea L.)plants subjected to combined effect of gibberellic acid and salinity, Arch.Agron. Soil Sci. 56 (2010) 575e588.
[32] M.Y. Ashraf, G. Sarwar, Salt tolerance potential in some membrane ofBrassicaceae: physiological studies on water relations and mineralscontents. in: R. Ahmad, K.A. Malik (Eds.), Prospects for Saline Agriculture.Kluwer Academic Publisher, Dordrecht, The Netherlands, 2002, pp.237e245.
[33] M.C. Shannon, C.M. Grieve, Tolerance of vegetable crops to salinity, ScientiaHort 78 (1999) 5e38.
[34] B.K. Garg, S. Kathju, S.P. Vyas, A.N. Lahiri, Genotypic difference to salt stress inIndian mustard, in: Proceedings of Symposium on Recent Advances inManagement of Arid Ecosystems, Held at Central Arid Zone Research Institute,Jodhpur, from March 3e5, 1977, Rajasthan, India: Arid Zone Research Asso-ciation of India.
[35] H. Shi, I.M. shitani, C.S. Kim, J.K. Zhu, The Arabidopsis thaliana salt tolerancegene SOS1 encodes a putative Naþ/Hþ antiporter, Proc. Natl. Acad. Sci. USA 97(2000) 6896e6901.
[36] R. Olías, Z. Eljakaoui, J.M. Pardo, A. Belver, The Naþ/Hþ exchanger SOS1controls extrusion and distribution of Naþ in tomato plants under salinityconditions, Plant Signal. Behav. 4 (2009) 973e976.
[37] J. Liu, J.K. Zhu, An Arabidopsis mutant that requires increased calcium forpotassium nutrition and salt tolerance, Proc. Natl. Acad. Sci. USA 94 (1997)14960e14964.
[38] M. Ishitani, J. Liu, U. Halfter, C.S. Kim, W. Shi, J.K. Zhu, SOS3 function in plantsalt tolerance requires N myristoylation and calcium binding, Plant Cell 12(2000) 1667e1677.
[39] G. Kumar, R.S. Purty, M.P. Sharma, S.L. Singla-Pareek, A. Pareek, Physiologicalresponses among Brassica species under salinity stress show strong correla-tion with transcript abundance for SOS pathway-related genes, J. PlantPhysiol. 166 (2009) 507e520.