Assessment of Arterial Stiffness in Hypertension: Comparison of Oscillometric (Arteriograph),...
6
Copyright © Lippincott Williams & Wilkins. Unauthorized reproduction of this article is prohibited. Assessment of arterial stiffness in hypertension: comparison of oscillometric (Arteriograph), piezoelectronic (Complior) and tonometric (SphygmoCor) techniques M Noor A. Jatoi, Azra Mahmud, Kathleen Bennett and John Feely 1 Background Arterial stiffness, measured as aortic pulse wave velocity (PWV), and wave reflection, measured as augmentation index (AIx), are independent predictors for total and cardiovascular morbidity and mortality. The aim of this study was to compare a new device, based on oscillometric pressure curves (Arteriograph), which simultaneously measures PWV and AIx, with standard techniques for measuring PWV (Complior) and AIx (SphygmoCor) in untreated hypertensive patients. Methods We compared PWV and AIx measured using the Arteriograph with corresponding Complior and SphygmoCor measurements in 254 untreated hypertensive patients, age 48 W 14 years (mean W SD, range 17–85 years). Results Arteriograph PWV and AIx were closely related with Complior (r U 0.60, P < 0.001) and SphygmoCor (r U 0.89, P < 0.001), respectively. Using stepwise regression analysis, the independent determinants of Arteriograph PWV were age, mean arterial pressure, heart rate and sex (r 2 U 0.44, P < 0.0001) and for AIx were age, weight, mean arterial pressure, heart rate and sex (r 2 U 0.65, P < 0.0001). The bias between the different techniques was determined by age and sex for PWV and age, body weight, sex, heart rate and mean arterial pressure for AIx. Bland – Altman plots showed that although the techniques were closely related, the limits of agreement were wide. Conclusion Although Arteriograph values and the determinants of PWV and AIx are in close agreement with corresponding parameters obtained by Complior and SphygmoCor, respectively, the techniques are not interchangeable. J Hypertens 27:2186–2191 Q 2009 Wolters Kluwer Health | Lippincott Williams & Wilkins. Journal of Hypertension 2009, 27:2186–2191 Keywords: arterial stiffness, arteriograph, augmentation index, hypertension, pulse wave velocity Abbreviations: AIx, augmentation index; BP, blood pressure; CAD, coronary artery disease; CI, confidence interval; ESH, European Society of Hypertension; HR, heart rate; MAP, mean arterial pressure; PP, pulse pressure; PWV, pulse wave velocity Department of Pharmacology and Therapeutics, Trinity College Centre for Health Sciences and Hypertension Clinic, St. James’s Hospital, Dublin, Ireland Correspondence to Azra Mahmud, MRCPI, PhD, Department of Therapeutics & Hypertension Clinic, Trinity Centre for Health Sciences, St. James’s Hospital, Dublin 8, Ireland Tel: +353 1896 2667; fax: +353 1453 9033; e-mail: [email protected] 1 John Feely deceased. Received 21 October 2008 Revised 5 June 2009 Accepted 28 June 2009 See editorial commentary on page 2159 Introduction Arterial stiffness is now regarded as an important marker of cardiovascular risk [1] and measured as pulse wave velocity (PWV) has been shown to be a strong independent pre- dictor of cardiovascular morbidity in hypertension [2], type II diabetes [3] and of all-cause mortality in patients with hypertension [2] end-stage renal disease [4], and in the general population [5] and is recommended in current European Society of Hypertension (ESH) and European Society of Cardiology (ESC) guidelines for risk assessment in hypertension [6]. Wave reflection as an augmentation index (AIx), a composite of PWV, arterial wave reflection and left ventricular ejection is an independent factor associated with poor survival in end-stage renal disease [7] and the extent of angiographic coronary artery disease (CAD) in men of less than 60 years of age [8]. Currently, two systems are in common use: Complior system (Artech Medical, Pantin, France) simultaneously records pressure waves in the carotid and femoral arteries by using a piezoelectronic device, and the PWV is calcu- lated by dividing the distance between the two sites by the transit time between waves. The SphygmoCor (ver- sion 8.1; AtCor Medical, Inc., Sydney, Australia) utilizes radial applanation tonometry and the application of a generalized transfer function to measure wave reflec- tion as AIx and aortic pressures noninvasively. The Arteriograph (TensioMed Ltd., Budapest, Hungary) is a recently developed computerized device using an oscillometric method to determine PWV and AIx. Oscil- lometric pressure curves (pulsatile pressure changes in the brachial artery) registered in the upper arm are detected by plethysmography. Fluctuations in pulsatile pressure in the artery beneath an inflated pressure cuff induce periodic pressure changes in the inflated cuff. These periodic pressure oscillations provide an indirect measure for the pulsatile pressure changes in the artery beneath [9]. The Arteriograph, which yields a simultaneous measure of brachial blood pressure (BP), PWV and AIx, has recently been validated against the 2186 Original article This paper is dedicated to Professor John Feely. 0263-6352 ß 2009 Wolters Kluwer Health | Lippincott Williams & Wilkins DOI:10.1097/HJH.0b013e32833057e8
-
Upload
independent -
Category
Documents
-
view
1 -
download
0
Transcript of Assessment of Arterial Stiffness in Hypertension: Comparison of Oscillometric (Arteriograph),...
C
2186 Original article
Assessment of arterial stiffnes
s in hypertension: comparisonof oscillometric (Arteriograph), piezoelectronic (Complior)and tonometric (SphygmoCor) techniquesMNoor A. Jatoi, Azra Mahmud, Kathleen Bennett and John Feely1
Background Arterial stiffness, measured as aortic
pulse wave velocity (PWV), and wave reflection,
measured as augmentation index (AIx), are independent
predictors for total and cardiovascular morbidity and
mortality. The aim of this study was to compare a new
device, based on oscillometric pressure curves
(Arteriograph), which simultaneously measures PWV and
AIx, with standard techniques for measuring PWV
(Complior) and AIx (SphygmoCor) in untreated
hypertensive patients.
Methods We compared PWV and AIx measured using the
Arteriograph with corresponding Complior and
SphygmoCor measurements in 254 untreated hypertensive
patients, age 48 W 14 years (mean W SD, range 17–85
years).
Results Arteriograph PWV and AIx were closely related with
Complior (r U 0.60, P < 0.001) and SphygmoCor (r U 0.89,
P < 0.001), respectively. Using stepwise regression analysis,
the independent determinants of Arteriograph PWV were
age, mean arterial pressure, heart rate and sex (r2 U 0.44,
P < 0.0001) and for AIx were age, weight, mean arterial
pressure, heart rate and sex (r2 U 0.65, P < 0.0001). The bias
between the different techniques was determined by age
and sex for PWV and age, body weight, sex, heart rate and
mean arterial pressure for AIx. Bland–Altman plots showed
opyright © Lippincott Williams & Wilkins. Unautho
� This paper is dedicated to Professor John Feely.
0263-6352 � 2009 Wolters Kluwer Health | Lippincott Williams & Wilkins
that although the techniques were closely related, the limits
of agreement were wide.
Conclusion Although Arteriograph values and the
determinants of PWV and AIx are in close agreement with
corresponding parameters obtained by Complior and
SphygmoCor, respectively, the techniques are not
interchangeable. J Hypertens 27:2186–2191 Q 2009
Wolters Kluwer Health | Lippincott Williams & Wilkins.
Journal of Hypertension 2009, 27:2186–2191
Keywords: arterial stiffness, arteriograph, augmentation index,hypertension, pulse wave velocity
Abbreviations: AIx, augmentation index; BP, blood pressure; CAD, coronaryartery disease; CI, confidence interval; ESH, European Society ofHypertension; HR, heart rate; MAP, mean arterial pressure; PP, pulsepressure; PWV, pulse wave velocity
Department of Pharmacology and Therapeutics, Trinity College Centre for HealthSciences and Hypertension Clinic, St. James’s Hospital, Dublin, Ireland
Correspondence to Azra Mahmud, MRCPI, PhD, Department of Therapeutics &Hypertension Clinic, Trinity Centre for Health Sciences, St. James’s Hospital,Dublin 8, IrelandTel: +353 1896 2667; fax: +353 1453 9033; e-mail: [email protected]
1 John Feely deceased.
Received 21 October 2008 Revised 5 June 2009Accepted 28 June 2009
See editorial commentary on page 2159
IntroductionArterial stiffness is now regarded as an important marker of
cardiovascular risk [1] and measured as pulse wave velocity
(PWV) has been shown to be a strong independent pre-
dictor of cardiovascular morbidity in hypertension [2], type
II diabetes [3] and of all-cause mortality in patients with
hypertension [2] end-stage renal disease [4], and in the
general population [5] and is recommended in current
European Society of Hypertension (ESH) and European
Society of Cardiology (ESC) guidelines for risk assessment
in hypertension [6]. Wave reflection as an augmentation
index (AIx), a composite of PWV, arterial wave reflection
and left ventricular ejection is an independent factor
associated with poor survival in end-stage renal disease
[7] and the extent of angiographic coronary artery disease
(CAD) in men of less than 60 years of age [8].
Currently, two systems are in common use: Complior
system (Artech Medical, Pantin, France) simultaneously
records pressure waves in the carotid and femoral arteries
by using a piezoelectronic device, and the PWV is calcu-
lated by dividing the distance between the two sites by
the transit time between waves. The SphygmoCor (ver-
sion 8.1; AtCor Medical, Inc., Sydney, Australia) utilizes
radial applanation tonometry and the application of a
generalized transfer function to measure wave reflec-
tion as AIx and aortic pressures noninvasively. The
Arteriograph (TensioMed Ltd., Budapest, Hungary) is
a recently developed computerized device using an
oscillometric method to determine PWV and AIx. Oscil-
lometric pressure curves (pulsatile pressure changes in
the brachial artery) registered in the upper arm are
detected by plethysmography. Fluctuations in pulsatile
pressure in the artery beneath an inflated pressure cuff
induce periodic pressure changes in the inflated cuff.
These periodic pressure oscillations provide an indirect
measure for the pulsatile pressure changes in the
artery beneath [9]. The Arteriograph, which yields a
simultaneous measure of brachial blood pressure (BP),
PWV and AIx, has recently been validated against the
rized reproduction of this article is prohibited.
DOI:10.1097/HJH.0b013e32833057e8
C
Comparison of techniques for arterial stiffness assessment Jatoi et al. 2187
Complior and SphygmoCor largely in a healthy popu-
lation [9] and for PWV in 64 patients with longstanding
hypertension [10]. We compared the PWV and AIx
measures obtained using the Arteriograph with those
generated by the Complior and SphygmoCor and
explored the determinants of these measures using the
respective techniques in a large population of untreated
patients referred for assessment of high BP. In addition,
we used a statistical method for assessing agreement
between two methods of clinical measurement as
described by Bland and Altman [11].
Material and methodsPatientsWe studied 254 untreated hypertensive patients with
elevated BP (�140/90 mm Hg) on three occasions and
confirmed by ambulatory BP recording (daytime >135/
85 mmHg). Patients’ age was 48� 14 (mean�SD, range
17–85 years) and 44% were women (Table 1). None of
the patients were on antihypertensive medication or
other vasoactive agents, including statins, oral contra-
ceptives, steroids or hormone replacement therapy. None
of the patients had secondary hypertension, peripheral
vascular disease, cerebrovascular disease and CAD, valv-
ular heart disorders, dysarrhythmias, diabetes, heart fail-
ure or other significant medical conditions.
All measurements were made in the same temperature-
controlled room (228C). Body weight, height, waist and
hip measurements were recorded in each patient and
BMI was calculated (kg/m2). Patients gave informed
consent, and the study had institutional ethics committee
permission.
Reproducibility and repeatability for PWV and AIx
measured using the Arteriograph were performed in
40 untreated hypertensive patients. Two measurements
were performed at the same session by the same operator,
and the measurements were repeated 1 week later.
opyright © Lippincott Williams & Wilkins. Unauth
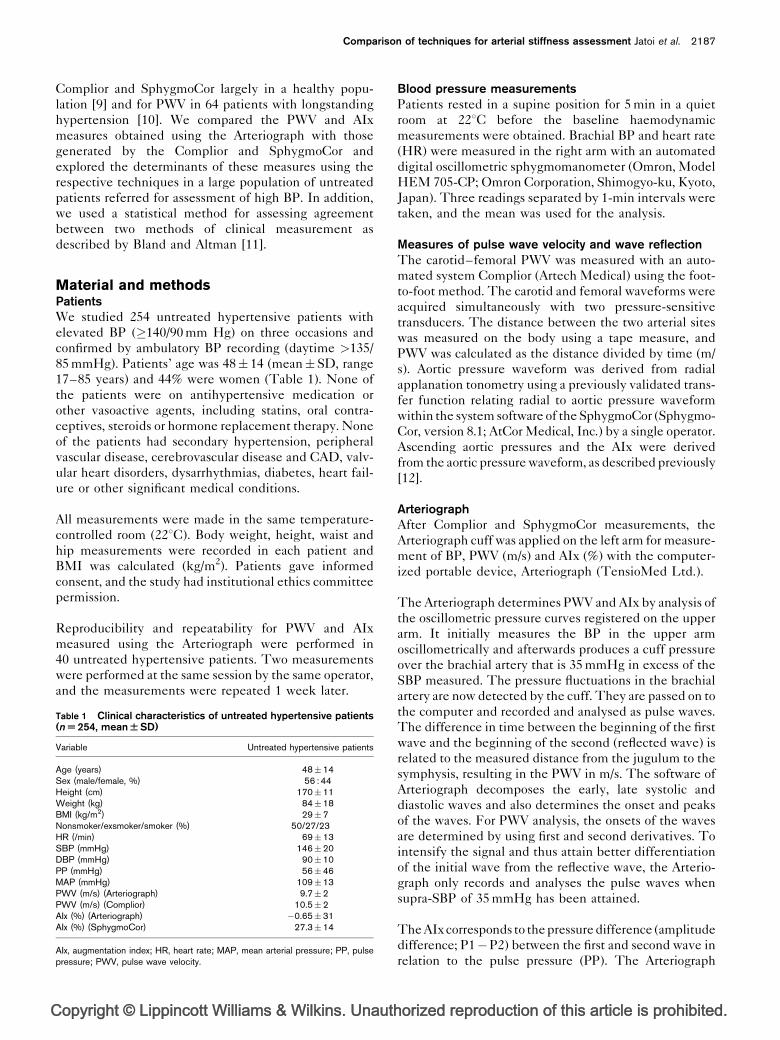
Table 1 Clinical characteristics of untreated hypertensive patients(n U 254, mean W SD)
Variable Untreated hypertensive patients
Age (years) 48�14Sex (male/female, %) 56 : 44Height (cm) 170�11Weight (kg) 84�18BMI (kg/m2) 29�7Nonsmoker/exsmoker/smoker (%) 50/27/23HR (/min) 69�13SBP (mmHg) 146�20DBP (mmHg) 90�10PP (mmHg) 56�46MAP (mmHg) 109�13PWV (m/s) (Arteriograph) 9.7�2PWV (m/s) (Complior) 10.5�2AIx (%) (Arteriograph) �0.65�31AIx (%) (SphygmoCor) 27.3�14
AIx, augmentation index; HR, heart rate; MAP, mean arterial pressure; PP, pulsepressure; PWV, pulse wave velocity.
Blood pressure measurementsPatients rested in a supine position for 5 min in a quiet
room at 228C before the baseline haemodynamic
measurements were obtained. Brachial BP and heart rate
(HR) were measured in the right arm with an automated
digital oscillometric sphygmomanometer (Omron, Model
HEM 705-CP; Omron Corporation, Shimogyo-ku, Kyoto,
Japan). Three readings separated by 1-min intervals were
taken, and the mean was used for the analysis.
Measures of pulse wave velocity and wave reflectionThe carotid–femoral PWV was measured with an auto-
mated system Complior (Artech Medical) using the foot-
to-foot method. The carotid and femoral waveforms were
acquired simultaneously with two pressure-sensitive
transducers. The distance between the two arterial sites
was measured on the body using a tape measure, and
PWV was calculated as the distance divided by time (m/
s). Aortic pressure waveform was derived from radial
applanation tonometry using a previously validated trans-
fer function relating radial to aortic pressure waveform
within the system software of the SphygmoCor (Sphygmo-
Cor, version 8.1; AtCor Medical, Inc.) by a single operator.
Ascending aortic pressures and the AIx were derived
from the aortic pressure waveform, as described previously
[12].
ArteriographAfter Complior and SphygmoCor measurements, the
Arteriograph cuff was applied on the left arm for measure-
ment of BP, PWV (m/s) and AIx (%) with the computer-
ized portable device, Arteriograph (TensioMed Ltd.).
The Arteriograph determines PWV and AIx by analysis of
the oscillometric pressure curves registered on the upper
arm. It initially measures the BP in the upper arm
oscillometrically and afterwards produces a cuff pressure
over the brachial artery that is 35 mmHg in excess of the
SBP measured. The pressure fluctuations in the brachial
artery are now detected by the cuff. They are passed on to
the computer and recorded and analysed as pulse waves.
The difference in time between the beginning of the first
wave and the beginning of the second (reflected wave) is
related to the measured distance from the jugulum to the
symphysis, resulting in the PWV in m/s. The software of
Arteriograph decomposes the early, late systolic and
diastolic waves and also determines the onset and peaks
of the waves. For PWV analysis, the onsets of the waves
are determined by using first and second derivatives. To
intensify the signal and thus attain better differentiation
of the initial wave from the reflective wave, the Arterio-
graph only records and analyses the pulse waves when
supra-SBP of 35 mmHg has been attained.
The AIx corresponds to the pressure difference (amplitude
difference; P1�P2) between the first and second wave in
relation to the pulse pressure (PP). The Arteriograph
orized reproduction of this article is prohibited.

C
2188 Journal of Hypertension 2009, Vol 27 No 11
calculates the AIx on the basis of the formula, AIx%¼[(P2�P1)/PP]� 100 and thus provides the brachial AIx
without applying a transfer function [9].
Statistical analysisAll data were analysed using JMP software (version 7.0,
SAS for Windows; SAS Institute Inc., Cary, North
Carolina, USA). Results were expressed as mean and
standard deviation (mean�SD) and confidence intervals
(CIs) for continuous and percentages for categorical data.
A P value of less than 0.05 was considered significant.
The difference observed between the average values of
PWV (Arteriograph vs. Complior) according to Bland–
Altman [11] and the relationship between the values of
AIx (Arteriograph vs. SphygmoCor) in scatter plot were
likewise calculated (MedCalc version 9.3.9.0; MedCalc
Software bvba, Mariakerke, Belgium) as an estimate of
measurement error for the repeat measurements between
the two methods. For AIx, we normalized the data to
the SD, as values for Arteriograph are largely negative,
whereas those for SphygmoCor were positive. The
relationship between parameters was analysed using cor-
relation (Spearman r). Regression analysis of PWV and
corrected AIx were analysed separately by using the
following determinants: age, body height and weight,
sex, HR and mean arterial pressure (MAP, forward step-
wise regression). In addition, the differences between the
standard and studied technique were calculated and
regression analysis applied to obtain the determinants
(as above) of any discrepant bias. Regression coefficients
and 95% CIs are presented.
ResultsThe characteristics of the untreated hypertensive
patients are shown in Table 1.
The correlation coefficients between two consecutive
measurements using the Arteriograph on the same day
by same operator were: SBP (r¼ 0.92), DBP (r¼ 0.95), PP
(r¼ 0.88), MAP (r¼ 0.96), PWV (r¼ 0.95) and AIx
(r¼ 0.99) (all P< 0.0001). The correlation coefficients
for two measurements performed a week apart were:
SBP (r¼ 0.89), DBP (r¼ 0.75), PP (r¼ 0.83), MAP
(r¼ 0.85), PWV (r¼ 0.97) and AIx (r¼ 0.96) (all
P< 0.0001). The coefficients of variation of two measure-
ments of PWV and AIx performed on the same day were
0.08 m/s and 0.55% and 0.1 m/s and 0.77% performed a
week later.
The values of BP measurements by Arteriograph and
digital oscillometric sphygmomanometer (Omron, Model
HEM 705-CP; Omron Corporation) were correlated for
SBP (r¼ 0.81, P< 0.001), DBP (r¼ 0.79, P< 0.001) and
PP (r¼ 0.67, P< 0.001). The difference observed between
the average values of SBP and DBP (mmHg) for both
methods (Arteriograph and sphygmomanometer) using
Bland–Altman analysis is presented in Fig. 1a and b.
opyright © Lippincott Williams & Wilkins. Unautho
Difference observed between the average values of
PWV using both methods with Bland–Altman analysis
is presented in Fig. 1c. PWV measured by Complior
and Arteriograph was positively correlated (r¼ 0.60,
P< 0.0001) as shown in Fig. 2a. PWV measured by
Arteriograph and Complior was significantly correlated
with age (r¼ 0.56 vs. 0.50, P< 0.001), height (r¼�0.32
vs. �0.19, P< 0.01), HR (r¼ 0.21 vs. 0.19, P< 0.05), SBP
(r¼ 0.40 vs. 0.45, P< 0.001), DBP (r¼ 0.33 vs. 0.31,
P< 0.001) and MAP (r¼ 0.45 vs. 0.44, P< 0.001), and in
the case of Arteriograph, body weight was also significant
(r¼�0.14, P< 0.05). In stepwise regression analysis of
PWV (Arteriograph), the independent determinants were
age, sex, HR and MAP (r2¼ 0.44, P< 0.0001), and for PWV
(Complior), age, HR and MAP (r2¼ 0.37, P< 0.0001),
although sex was not significant (Table 2).
Differences observed between the average values of AIx
(%) of both methods using Bland–Altman analysis are
presented in Fig. 1d. The two methods of measuring AIx
(SphygmoCor as compared with Arteriograph) correlated
significantly with each other (r¼ 0.89, P< 0.001), as
shown in Fig. 2b. The AIx measured by Arteriograph
and SphygmoCor was significantly correlated with age
(r¼ 0.60 vs. 0.58, P< 0.001), height (r¼�0.45 vs. �0.44,
P< 0.01), body weight (r¼�0.45 vs. �0.41, P< 0.001),
HR (r¼�0.15 vs.�0.19, P< 0.05), SBP (r¼ 0.35 vs. 0.29,
P< 0.001), DBP (r¼ 0.32 vs. 0.32, P< 0.001) and MAP
(r¼ 0.44 vs. 0.44, P< 0.001). In stepwise regression
analysis, the independent determinants of AIx measured
by Arteriograph were: age, body weight, MAP, HR and
sex (r2¼ 0.65, P< 0.0001) (Table 3), and by SphygmoCor
were: age, body weight, MAP, HR, height and sex
(r2¼ 0.54, P< 0.0001) (Table 3). A regression model
was constructed to analyse the determinants of the
residual difference between the different techniques:
Arteriograph vs. Complior for PWV and Arteriograph
vs. SphygmoCor for corrected AIx (Table 4). For
PWV, the bias between PWV measured with the Arter-
iograph and the Complior increased in young male
patients. For AIx, the difference between the Arterio-
graph and SphygmoCor measurements was determined
by age, body weight, sex, HR and MAP (Table 4); the
bias decreased with body weight and HR and increased
with age, female sex and MAP.
DiscussionThe aim of this study was to compare the indices of arterial
stiffness measured by Arteriograph with those measured
by Complior and SphygmoCor in an untreated hyperten-
sive population to study whether the determinants of PWV
and AIx were similar with the different techniques and
finally to explore the determinants of the discrepancies
observed between the different techniques.
The present study shows that PWV and AIx measure-
ments obtained with the Arteriograph were significantly
rized reproduction of this article is prohibited.

C
Comparison of techniques for arterial stiffness assessment Jatoi et al. 2189
Fig. 1
30
(a) (b)
(d)(c)
20
10
Dif
fere
nce
betw
een
SB
P (
mm
Hg
) by
Art
erio
grap
h a
nd S
phyg
mom
anom
eter
4
3
2
1
0
Dif
fere
nce
betw
een
PW
V (
m/s
)by
Art
erio
grap
h a
nd C
ompl
ior
0
−10
−20
−30
−40
−1
−0.5
−1.0
−1.5
1.5
1.0
0.5
0.0
−5
−10
−15
−4.9
−1.96 SD
−26.9
−20
15
10
5
0
−2
−3
−4
−5
100
6 8 10 12 14 16
120 140 160
Average of SBP (mmHg)by Arteriograph and Sphygmomanometer
SBP
PWV
DBP
Alx
Average of PWV (mmHg)by Arteriograph and Complior
−4 −3 −2 −1 0 1 2 3
Average of corrected Alx(%)by Arteriograph and SphygmoCor
Dif
fere
nce
betw
een
cor
rect
ed A
lx(%
)by
Art
erio
grap
h a
nd S
phyg
mo
Cor
60 70 80 90 100 110 120 130
Average of DBP (mmHg)by Arteriograph and Sphygmomanometer
Dif
fere
nce
betw
een
DB
P (
mm
Hg
) by
Art
erio
grap
h a
nd S
phyg
mom
anom
eter
180 200 220
+1.96 SD
Mean
17.1
−0.6
−1.96 SD
−13.4
+1.96 SD
Mean
12.2
−0.01
−1.96 SD
−0.95
+1.96 SD
Mean
0.93
−0.7
−1.96 SD
−4.3
+1.96 SD
Mean
2.9
Bland–Altman analysis of the difference in values obtained by comparative techniques vs. average of the techniques. (a) SBP and (b) DBP byArteriograph and Omron Sphygmomanometer, (c) pulse wave velocity by Arteriograph and Complior, (d) augmentation index by Arteriograph andSphygmoCor. AIx, augmentation index; PWV, pulse wave velocity.
correlated with piezoelectronic PWV (Complior, r¼ 0.60)
and tonometric AIx (SphygmoCor, r¼ 0.89) and extends
similar observations by Baulmann et al. [9] in a largely
normotensive or treated hypertensive population with
correlations of 0.69 and 0.92, respectively, and by Rajzer
et al. [10] for PWV by Arteriograph and Complior
(r¼ 0.36) in 64 patients with longstanding hypertension.
The lower correlation coefficient for measurements
observed in the present study may in part be expected
as one moves from a normotensive to a hypertensive
population with a wider age and BP range. Similarly,
our study examined a wider range of values for PWV,
5.4–14.5 compared with 5.8–11.3 m/s in the study by
Baulmann et al. [9] but similar to that of Rajzer et al. [10].
Covering a wider range of values is of importance as the
major purpose of such measurements in clinical practice
is to stratify risk in patients with medical conditions, such
as hypertension, renal failure and so on, in which PWV
values of more than 12 m/s are used to influence therapy
and determine prognosis. Both Baulmann et al. [9] and
Rajzer et al. [10] reported a similar divergence for PWV
determined by Arteriograph and Complior and indeed
also with the SphygmoCor.
Although the strength of relationship between values by
Arteriograph and SphygmoCor/Complior is reassuring,
opyright © Lippincott Williams & Wilkins. Unauth
the correlation coefficient does not measure agreement
and is misleading when comparing two techniques [11]. A
more appropriate statistical approach is required to esti-
mate the 95% CI for the ability of one method to predict
another. By applying Bland–Altman analysis (Fig. 2), it
is clear that the extent of variation for all parameters
is greater than one would accept and is outside the
published reproducibility of the individual techniques
employed and greater than the SD of both PWV and AIx
in our population. For PWV, a value obtained by one
technique may vary by �3.6 m/s and by �17% for AIx to
that determined by the other technique. The former is
similar to that seen in the studies by Baulmann et al. [9]
and Rajzer et al. [10], although such data were not
reported for AIx. Such a magnitude of difference implies
that studies using one technique cannot utilize the others
for follow-up.
A second objective of our study was to compare the
determinants of PWV and AIx as recorded by the differ-
ent techniques, although our findings relate only to a
cohort of untreated hypertensive patients. A number of
physiological factors influence AIx and PWV, including
age [13], body height [14], HR [15], SBP and DBP [16],
MAP [17] and PP [18]. The present study shows that
age, MAP and HR are the main determinants of PWV
orized reproduction of this article is prohibited.

C
2190 Journal of Hypertension 2009, Vol 27 No 11
Fig. 2P
WV
(m
/s)
by A
rter
iogr
aph
4
6
8
10
12
14
16
r = 0.60P < 0.0001
18(a)
(b)
4 6 8 10
PWV (m/s) by Complior
PWV
12 14 16
Alx
(%
) Art
erio
grap
h
−4
−3
−2
−1
1
0
2
r = 0.89P < 0.0001
3
−4 −3 −2 −1
Alx (%) SphygmoCor
Alx
0 1 2 3
Correlation analysis of pulse wave velocity (m/s) obtained withArteriograph and Complior (a) and corrected augmentation index (%)obtained with Arteriograph and SphygmoCor (b). AIx, augmentationindex; PWV, pulse wave velocity.
Table 3 Stepwise regression analysis using correctedaugmentation index (%) by Arteriograph and SphygmoCor as thedependent variable (n U 254)
Variables r2 b SE P
Model for AIx (%) r2¼0.65, P<0.0001 (Arteriograph)Age (years) 0.36 0.033 0.0029 <0.0001Weight (kg) 0.14 �0.02 0.0026 <0.0001Height (cm) 0.005 �0.009 0.0046 0.06Sex (female) 0.034 0.21 0.049 <0.0001HR (/min) 0.077 �0.024 0.0033 <0.0001MAP (mmHg) 0.038 0.025 0.0035 <0.0001
Model for AIx (%) r2¼0.54, P<0.0001 (SphygmoCor)Age (years) 0.34 0.032 0.003 <0.0001Weight (kg) 0.11 �0.014 0.005 0.047Height (cm) 0.04 �0.015 0.005 0.0057Sex (female) 0.01 0.11 0.057 0.047HR (/min) 0.02 �0.017 0.004 <0.0001MAP (mmHg) 0.03 0.017 0.004 <0.0001
AIx, augmentation index; HR, heart rate; MAP, mean arterial pressure; PWV, pulsewave velocity.
Table 4 Stepwise regression analysis showing the determinants ofthe residuals in pulse wave velocity (m/s, top) and augmentationindex (%, bottom) measured by Arteriograph, Complior andSphygmoCor (n U 254)
regardless of which technique is employed, with sex only
a significant determinant for PWV measured using the
Arteriograph. For AIx, age, body weight, sex, HR and
MAP were independent determinants with both tech-
niques, with body height only significant for the
SphygmoCor. Exploring the determinants of the differ-
ences between the different techniques showed that for
PWV, the bias between Arteriograph and the Complior
increased with young age and male sex. For AIx, age,
female sex and BP increased, whereas body weight and
opyright © Lippincott Williams & Wilkins. Unautho
Table 2 Stepwise regression analysis of using pulse wave velocity(m/s) by Arteriograph and Complior as the dependent variable(n U 254)
Variables r2 b SE P
Model for PWV (Arteriograph, m/s) r2¼0.44, P<0.0001Age (years) 0.32 0.04 0.004 <0.0001Sex (female) 0.05 0.22 0.054 <0.0001HR (/min) 0.01 0.01 0.004 0.04MAP (mmHg) 0.07 0.02 0.005 <0.0001
Model for PWV (Complior, m/s) r2¼0.37, P<0.0001Age (years) 0.25 0.03 0.004 <0.0001Sex (female) 0 0.08 0.056 0.15HR (/min) 0.017 0.01 0.005 0.025MAP (mmHg) 0.10 0.024 0.005 0.0001
HR, heart rate; MAP, mean arterial pressure; PWV, pulse wave velocity.
HR decreased the discrepancy between the two tech-
niques. For PWV, the greater bias in young men may
reflect the high prevalence of abdominal obesity in these
patients, which may influence the distance measured to
calculate PWV; however, more studies are needed to
investigate this observation. The greater bias observed
between AIx measured with the Arteriograph and
SphygmoCor with older age, female sex and higher BP
may suggest differences in identification of the inflection
point at high levels of AIx; how higher body weight and
HR may improve bias is not entirely clear. More studies
are needed to explore these interesting data in different
populations as our results apply only to hypertensive
patients.
In conclusion, in comparative terms, the Arteriograph is
easier to apply as it measures BP, PWV and AIx simul-
taneously. The precise placement of the brachial cuff is
less critical in contrast to the placing of sensors over the
carotid and femoral artery or tonometers over the radial
rized reproduction of this article is prohibited.
Variables r2 b SE P
Residual of PWV (m/s) measured by Arteriograph and Complior (r2¼0.07,P<0.001)
Age (years) 0.024 �0.02 0.009 0.02Sex (female) 0.038 �0.34 0.13 0.008HR (/min) 0.004 �0.009 0.01 0.37MAP (mmHg) 0.0002 0.002 0.01 0.86
Residual of AIx measured by Arteriograph and SphygmoCor (r2¼0.58,P<0.0001)
Age (years) 0.29 0.56 0.064 <0.0001Weight (kg) 0.12 �0.30 0.06 <0.0001Height (cm) 0.0008 �0.065 0.10 0.51Sex (female) 0.058 4.92 1.07 <0.0001HR (/min) 0.073 �0.54 0.07 <0.0001MAP (mmHg) 0.039 0.54 0.08 <0.0001M
AIx, augmentation index; HR, heart rate; MAP, mean arterial pressure; PWV, pulsewave velocity.

C
Comparison of techniques for arterial stiffness assessment Jatoi et al. 2191
(or carotid) artery. The low correlation observed between
the BP values measured using a standard sphygmoman-
ometer and the Arteriograph, however, suggests that the
latter cannot be used to reliably measure BP on its own. It
has less variation and similar reproducibility as the other
two techniques, and the determinants for both AIx and
PWV are generally similar for the different methods. As
there is a poor agreement between PWV and AIx
measured with the different devices, these techniques
cannot be used interchangeably. Furthermore, as the
Complior method for measuring PWV has been validated
against the gold standard manual method [19], a poor
agreement with the Arteriograph method suggests that
the latter is not a suitable method for assessing PWV in
clinical practice.
To conclude, the Arteriograph is an operator-independent,
reproducible oscillometric method for the estimation of
arterial stiffness and wave reflection in hypertensive
patients and, as shown previously, in normotensive popu-
lations. Although the Arteriograph, SphygmoCor and
Complior are not interchangeable, the Arteriograph cannot
be considered the ‘gold standard’ technique pending pro-
spective outcome studies.
AcknowledgementThere are no conflicts of interest.
References1 Laurent S, Cockcroft J, Van Bortel L, Boutouyrie P, Giannattasio C, Hayoz
D, et al. Expert consensus document on arterial stiffness: methodologicalissues and clinical applications. Eur Heart J 2006; 27:2588–2605.
2 Laurent S, Boutouyrie P, Asmar R, Gautier I, Laloux B, Guize L, et al.Aortic stiffness is an independent predictor of all-cause and cardiovascularmortality in hypertensive patients. Hypertension 2001; 37:1236–1241.
3 Cruickshank K, Riste L, Anderson SG, Wright JS, Dunn G, Gosling RG.Aortic pulse-wave velocity and its relationship to mortality in diabetes andglucose intolerance: an integrated index of vascular function? Circulation2002; 106:2085–2090.
4 Blacher J, London G, Safar B, Mourad J-J. Influence of age and end-stagerenal disease on the stiffness of carotid wall material in hypertension.J Hypertens 1999; 17:237–244.
5 Mattace-Raso FUS, van der Cammen TJM, Hofman A, van Popele NM, BosML, Schalekamp MADH, et al. Arterial stiffness and risk of coronary heartdisease and stroke: the Rotterdam Study. Circulation 2006; 113:657–663.
6 Mancia G, De Backer G, Dominiczak A, Cifkova R, Fagard R, Germano G,et al. Guidelines for the management of arterial hypertension. J Hypertens2007; 25:1105–1187.
7 London GM, Blacher J, Pannier B, Guerin AP, Marchais SJ, Safar ME.Arterial wave reflections and survival in end-stage renal failure.Hypertension 2001; 38:434–438.
8 Weber T, Auer J, O’Rourke MF, Kvas E, Lassnig E, Berent R, et al. Arterialstiffness, wave reflections, and the risk of coronary artery disease.Circulation 2004; 109:184–189.
9 Baulmann J, Schillings U, Rickert S, Uen S, Dusing R, Illyes M, et al. A newoscillometric method for assessment of arterial stiffness: comparison withtonometric and piezo-electronic methods. J Hypertens 2008; 26:523–528.
10 Rajzer M, Klocek M, Wojciechowska W, IPalka I, Brzozowska-Kiszka M,Kawecka-Jaszcz K. Comparison of Complior, SphygmoCor andArteriograph for assessment of aortic pulse wave velocity in patients witharterial hypertension. J Hypertens 2008; 26:2001–2007.
11 Bland JM, Altman DG. Statistical methods for assessing agreementbetween two methods of clinical measurement. Lancet 1986; 1:307–310.
12 Mahmud A, Feely J. Effect of smoking on arterial stiffness and pulsepressure amplification. Hypertension 2003; 41:183–187.
opyright © Lippincott Williams & Wilkins. Unauth
13 Kelly R, Hayward C, Avolio A, O’Rourke M. Noninvasive determination ofage-related changes in the human arterial pulse. Circulation 1989;80:1652–1659.
14 Smulyan H, Marchais SJ, Pannier B, Guerin AP, Safar ME, London GM.Influence of body height on pulsatile arterial hemodynamic data. J Am CollCardiol 1998; 31:1103–1109.
15 Gatzka CD, Cameron JD, Dart AM, Berry KL, Kingwell BA, Dewar EM, et al.Correction of carotid augmentation index for heart rate in elderly essentialhypertensives. Am J Hypertens 2001; 14:573–577.
16 Kelly RP, Millasseau SC, Ritter JM, Chowienczyk PJ. Vasoactive drugsinfluence aortic augmentation index independently of pulse-wave velocity inhealthy men. Hypertension 2001; 37:1429–1433.
17 Wilkinson IB, MacCallum H, Hupperetz PC, Thoor CJ, Cockcroft JR, WebbDJ. Changes in the derived central pressure waveform and pulse pressurein response to angiotensin II and noradrenaline in man. J Physiol 2001;530:541–550.
18 Wilkinson IB, Prasad K, Hall IR, Thomas A, MacCallum H, Webb DJ, et al.Increased central pulse pressure and augmentation index in subjects withhypercholesterolemia. J Am Coll Cardiol 2002; 39:1005–1011.
19 Asmar R, Benetos A, Topouchian J. Assessment of arterial distensibility byautomatic pulse wave velocity measurement: validation and clinicalapplication studies. Hypertension 1995; 26:485–490.
orized reproduction of this article is prohibited.