Assessment of Adhesives and Sealants market in India
37
Assessment of Adhesives and Sealants market in India HP Adhesives Ltd. November 2021
-
Upload
khangminh22 -
Category
Documents
-
view
2 -
download
0
Transcript of Assessment of Adhesives and Sealants market in India
Assessment of Adhesives and Sealants market in India HP Adhesives Ltd.
November 2021
1
Contents
1 Overview of the Indian economy ..................................................................................................... 3
1.1 Review of GDP growth .............................................................................................................. 3
1.2 Slight rebound in the second half ................................................................................................ 3
1.3 Lower rupee volatility with rising forex reserves............................................................................. 4
1.4 CPI inflation under input-price pressure ....................................................................................... 5
1.5 Raising the long-term potential ................................................................................................... 6
2 Overview of India’s adhesives and sealants market .......................................................................... 9
2.1 Domestic market review ............................................................................................................ 9
2.2 Consumer adhesives market to clock 9-10% CAGR between f iscals 2021 to 2026 ............................11
2.3 PVA dominates the consumer adhesives market..........................................................................12
2.4 Key demand drivers.................................................................................................................13
2.5 Peer comparison .....................................................................................................................15
3 An overview of India’s PVC (polyvinyl chloride) adhesives market ...................................................17
3.1 Domestic market review ...........................................................................................................18
3.2 Key growth drivers ..................................................................................................................19
3.3 Demand for PVC adhesives to be driven by rapid growth in plastic pipes industry .............................22
3.4 Peer comparison .....................................................................................................................23
4 Overview of India’s wood coatings market ......................................................................................26
4.1 India’s paints and coatings market overview ................................................................................26
4.2 Wood coatings forms a small share of the overall pie, with significant growth potential .......................27
4.3 Key demand drivers.................................................................................................................29
4.4 Domestic wood coatings market to grow at 11-13% CAGR from fiscals 2021-26 driven by increasing demand from the PU segment...................................................................................................32
4.5 Peer comparison .....................................................................................................................34

2
Figures
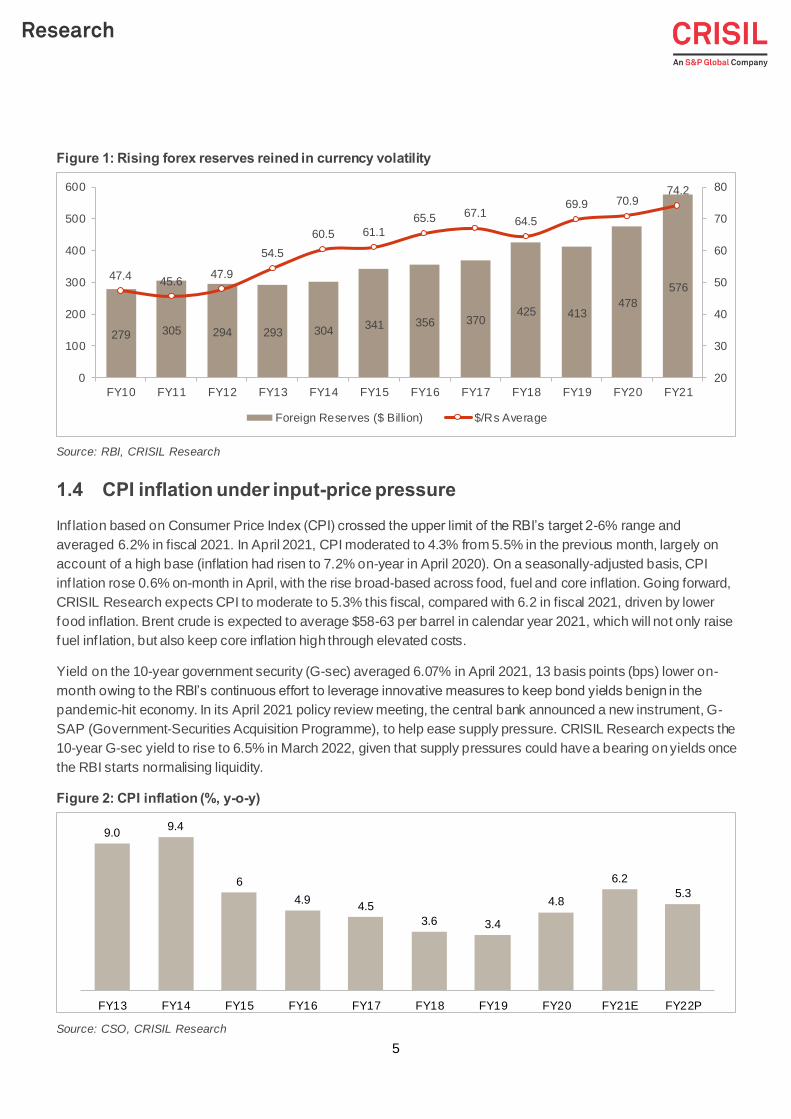
Figure 1: Rising forex reserves reined in currency volatility ............................................................................ 5
Figure 2: CPI inflation (%, y-o-y) ................................................................................................................ 5
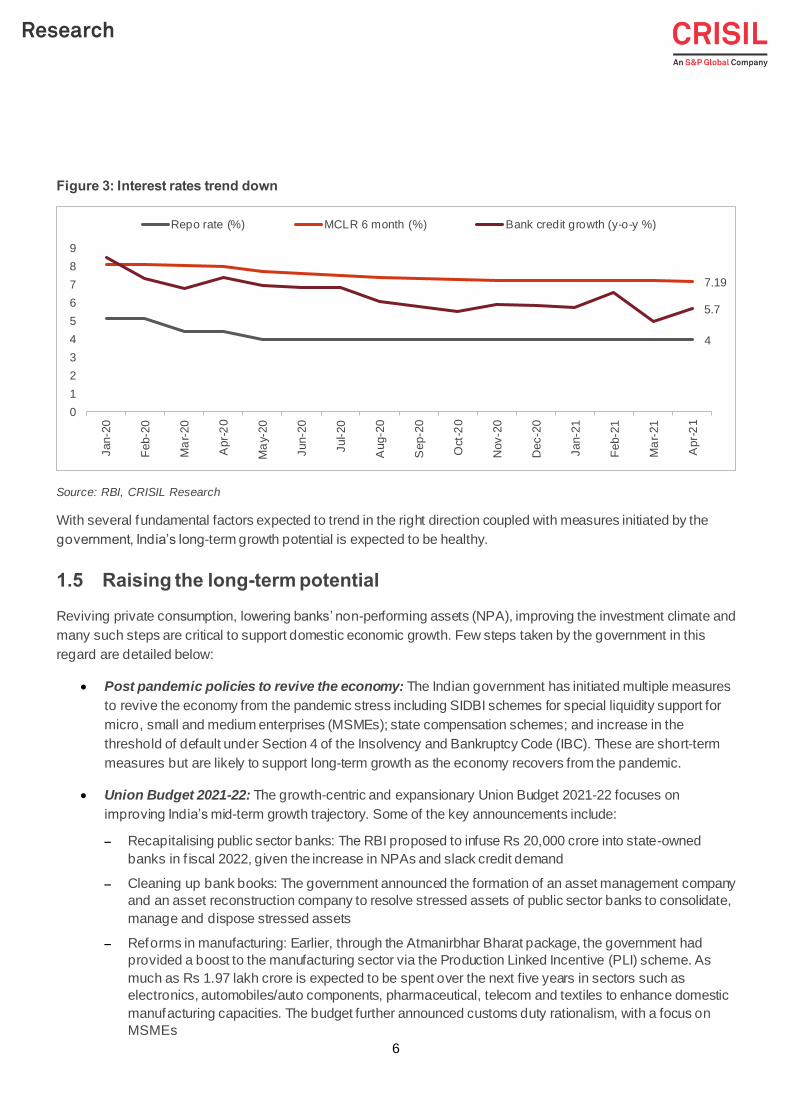
Figure 3: Interest rates trend down............................................................................................................. 6
Figure 4: Market-wise split of adhesives (fiscal 2021).................................................................................... 9
Figure 5: Industry-wise split of consumer adhesives (fiscal 2021) ..................................................................10
Figure 6: Consumer adhesives market on growth path .................................................................................12
Figure 7: Wood furniture market outlook (Rs billion).....................................................................................14
Figure 8: Outlook on electronics industry in India.........................................................................................14
Figure 9: Types and applications of plastic pipes in f iscal 2021......................................................................17
Figure 10: PVC Adhesives market by end-use in f iscal 2021 .........................................................................18
Figure 11: PVC Adhesives market by product type in fiscal 2021 ...................................................................19
Figure 12: Per capita PVC consumption across various countries ..................................................................20
Figure 13: Progress of key metro projects as of f iscal 2021...........................................................................21
Figure 14: Outlook on PVC adhesives market in India..................................................................................22
Figure 15: Expected growth in PVC adhesives by segment...........................................................................23
Figure 16: India paints and coatings market share by player in f iscal 2021 ......................................................26
Figure 17: Wood coatings market by application (f iscal 2021) .......................................................................28
Figure 18: Wood coatings market by product type (fiscal 2021) .....................................................................28
Figure 19: Outlook on building construction investments ..............................................................................30
Figure 20: Wood furniture market outlook...................................................................................................32
Figure 21: Outlook on domestic wood coatings market.................................................................................33
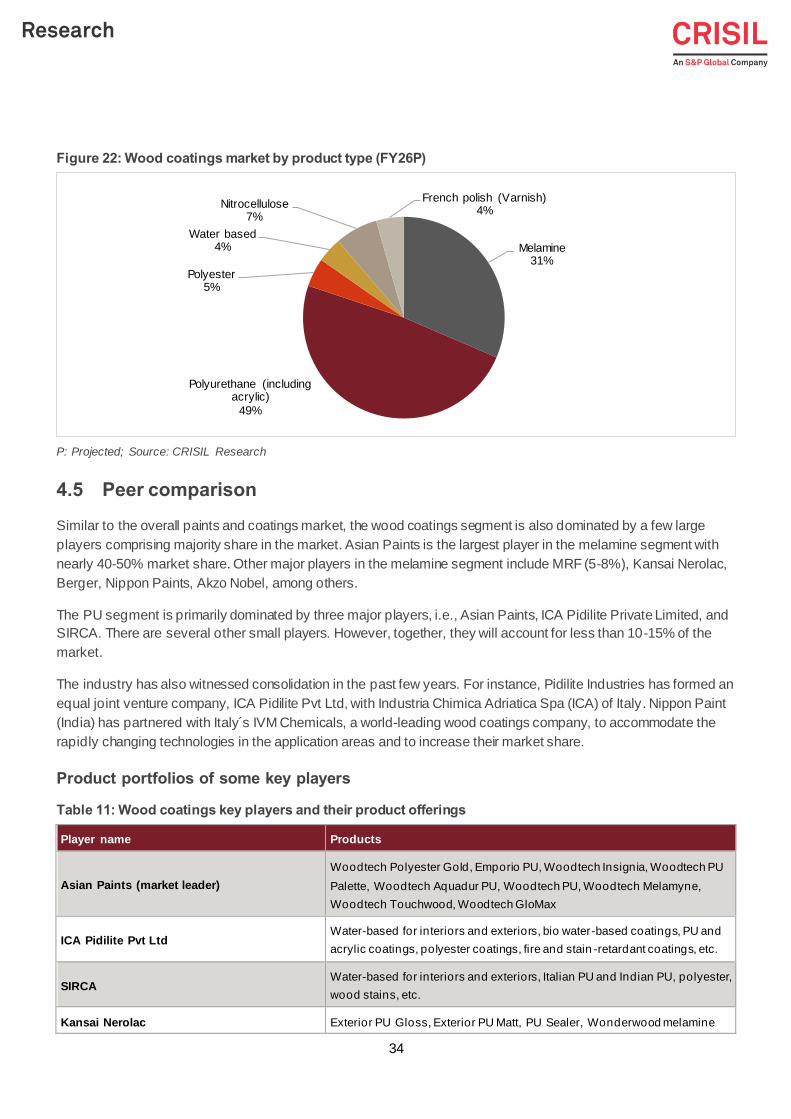
Figure 22: Wood coatings market by product type (FY26P)...........................................................................34

3
1 Overview of the Indian economy
1.1 Review of GDP growth
GDP shrank 7.3% in fiscal 2021
With a population of over ~1.4 billion and GDP of Rs 135 trillion in fiscal 2021, as per the estimates of National
Statistical Office (NSO), India is the sixth largest economy in the world. The country has favourable demographics
with the largest working population; ~67% of the total population in working age group of 15-64 years as on fiscal
2019 (Source: World Bank data indicators). In fact, India’s working population is more than total population of
countries such as Russia, Brazil and the United States (US). Going forward, the working population is expected to
increase further in the long run, thereby driving consumption and growth.
Fiscal 2021’s fourth quarter GDP growth estimate is at 1.6%, having turned positive in the second half of the year.
GDP contracted by 7.3% for f iscal 2021 as per the NSO’s estimates, a consequence of economic slowdown led by
the pandemic. Despite the mild recovery, the Indian economy is still damaged due to the fierce second wave in the
f irst quarter of fiscal 2022 that led to localised lockdowns in most states.
Table 1: Nuances of GDP growth
At basic
prices FY16 FY17 FY18 FY19 FY20 FY21
At market
prices FY16 FY17 FY18 FY19 FY20 FY21
% change
GDP 8 8.2 7.2 6.8 4.0 -7.3
Agriculture 0.6 6.3 5 2.9 4.3 3.6 Private
consumption 7.4 7.3 7.4 8.1 5.5 -9.1
Industry 9.8 6.8 6.2 8.4 -1.8 -5.6 Government
consumption 6.8 12.2 15 9.2 7.9 3.3
Manufacturing 12.8 7.9 5.9 6.9 -2.4 -7.2 Fixed
investment 5.2 10.1 9.3 10 5.4 -10.8
Mining &
quarrying 13.8 13 5.1 1.3 -2.5 -8.5 Exports -5.6 5 4.7 12.5 3.3 -5.0
Services 9.6 7.5 8.1 7.5 7.3 -8.1 Imports -5.9 4 17.6 15.4 -0.8 -13.6
Source: Central Statistics Office (CSO), CEIC, CRISIL Research
1.2 Slight rebound in the second half
India’s GDP rebounded in the second half of fiscal 2021, up 0.5% and 1.6% on-year in the third and fourth quarters,
respectively.
Though the economy shrank as a whole in fiscal 2021, agriculture/ allied activities, electricity, gas, water supply
and other utility services expanded. Contact-intensive trade, hotels, the transport and communication sector, and
broadcasting services were hit the most and de-grew through the fiscal. Construction, a labour-intensive sector,
was severely hit in the first half, but rebounded in the second half. Consequently, the pandemic pushed gross value
added (GVA), the supply-side measure of the economy, of most sectors back by more than a year. GVA growth
printed at -6.2%.

4
The situation remains grim. Dispersion of Covid-19 cases in the first quarter of fiscal 2022 reminds us of the
September 2020 peak. But there is one critical difference: the number of cases appears to have exceeded the peak
by over 4x, highlighting the enormous burden and reinstatement of lockdowns and restrictions. The impact is
evident in high-frequency indicators, which continued to weaken in May.
The f irst half of fiscal 2022 will be supported by a base effect, though materially clouded by the pandemic’s spread.
Global growth and acceleration in vaccinations will support growth. However, continuation of the second wave and
possible future waves ascribe a downside risk to CRISIL Research’s forecast of 9.5% domestic real GDP growth in
f iscal 2022.
Table 2: Our key projections
FY16 FY17 FY18 FY19 FY20 FY21 FY22F
GDP growth (%) 8.0 8.2 7.2 6.8 4.2 -7.3 9.5
CPI (%, average) 4.9 4.5 3.6 3.4 4.8 6.2 5.3
CAD/GDP (%) -1.1 -0.7 -1.8 -2.1 0.9 1.3 -1.2
Exchange rate (Rs/$ March-end) 67 65.9 65 69.5 74.4 72.8 75.0
10-year G-sec yield (%, March-end) 7.5 6.8 7.6 7.5 6.2 6.2 6.5
F: Forecast
Source: CSO, Reserve Bank of India (RBI) and CRISIL estimates; CPI: Consumer Price Index; CAD: current account deficit; G-
sec: government security
1.3 Lower rupee volatility with rising forex reserves
India’s forex reserves swelled ~106%, at ~6.8% compound annual growth rate (CAGR) in the past twelve years, to
$576 billion by fiscal 2021-end from $279 billion. Higher forex reserves have helped the Reserve Bank of India
(RBI) rein in currency volatility, since it provides a cushion during uncertain market events . For instance, the rupee
remained relatively stable during several periods of uncertainties triggered by events such as Grexit, Brexit and a
hike in interest rates by the US Federal Reserve (Fed). However, reserves came under pressure in fiscal 2019
owing to a meltdown in emerging market currencies, led by the Turkish lira, and the apex bank’s intervention in the
derivative currency markets to arrest the rupee’s slide. Again, recently in fiscal 2021, the rupee was under pressure
due to the rising load of pandemic cases in India. Further, in April 2021, the exponential spread of the cases led to
the domestic currency averaging 74.5/USD, depreciating 2.4% on-month from 72.8/USD in March 2021. Concerns
over growth arising from the second wave and subsequent state-announced lockdowns affected the exchange rate.
5
Figure 1: Rising forex reserves reined in currency volatility
Source: RBI, CRISIL Research
1.4 CPI inflation under input-price pressure
Inf lation based on Consumer Price Index (CPI) crossed the upper limit of the RBI’s target 2-6% range and
averaged 6.2% in fiscal 2021. In April 2021, CPI moderated to 4.3% from 5.5% in the previous month, largely on
account of a high base (inflation had risen to 7.2% on-year in April 2020). On a seasonally-adjusted basis, CPI
inf lation rose 0.6% on-month in April, with the rise broad-based across food, fuel and core inflation. Going forward,
CRISIL Research expects CPI to moderate to 5.3% this fiscal, compared with 6.2 in fiscal 2021, driven by lower
food inflation. Brent crude is expected to average $58-63 per barrel in calendar year 2021, which will not only raise
fuel inf lation, but also keep core inflation high through elevated costs.
Yield on the 10-year government security (G-sec) averaged 6.07% in April 2021, 13 basis points (bps) lower on-
month owing to the RBI’s continuous effort to leverage innovative measures to keep bond yields benign in the
pandemic-hit economy. In its April 2021 policy review meeting, the central bank announced a new instrument, G-
SAP (Government-Securities Acquisition Programme), to help ease supply pressure. CRISIL Research expects the
10-year G-sec yield to rise to 6.5% in March 2022, given that supply pressures could have a bearing on yields once
the RBI starts normalising liquidity.
Figure 2: CPI inflation (%, y-o-y)
Source: CSO, CRISIL Research
279 305 294 293 304341 356 370
425 413478
57647.4
45.647.9
54.5
60.5 61.1
65.5 67.164.5
69.9 70.974.2
20
30
40
50
60
70
80
0
100
200
300
400
500
600
FY10 FY11 FY12 FY13 FY14 FY15 FY16 FY17 FY18 FY19 FY20 FY21
Foreign Reserves ($ Billion) $/Rs Average
9.09.4
6
4.94.5
3.6 3.4
4.8
6.2
5.3
FY13 FY14 FY15 FY16 FY17 FY18 FY19 FY20 FY21E FY22P
6
Figure 3: Interest rates trend down
Source: RBI, CRISIL Research
With several fundamental factors expected to trend in the right direction coupled with measures initiated by the
government, India’s long-term growth potential is expected to be healthy.
1.5 Raising the long-term potential
Reviving private consumption, lowering banks’ non-performing assets (NPA), improving the investment climate and
many such steps are critical to support domestic economic growth. Few steps taken by the government in this
regard are detailed below:
• Post pandemic policies to revive the economy: The Indian government has initiated multiple measures
to revive the economy from the pandemic stress including SIDBI schemes for special liquidity support for
micro, small and medium enterprises (MSMEs); state compensation schemes; and increase in the
threshold of default under Section 4 of the Insolvency and Bankruptcy Code (IBC). These are short-term
measures but are likely to support long-term growth as the economy recovers from the pandemic.
• Union Budget 2021-22: The growth-centric and expansionary Union Budget 2021-22 focuses on
improving India’s mid-term growth trajectory. Some of the key announcements include:
‒ Recapitalising public sector banks: The RBI proposed to infuse Rs 20,000 crore into state-owned
banks in f iscal 2022, given the increase in NPAs and slack credit demand
‒ Cleaning up bank books: The government announced the formation of an asset management company
and an asset reconstruction company to resolve stressed assets of public sector banks to consolidate,
manage and dispose stressed assets
‒ Reforms in manufacturing: Earlier, through the Atmanirbhar Bharat package, the government had
provided a boost to the manufacturing sector via the Production Linked Incentive (PLI) scheme. As
much as Rs 1.97 lakh crore is expected to be spent over the next five years in sectors such as
electronics, automobiles/auto components, pharmaceutical, telecom and textiles to enhance domestic
manufacturing capacities. The budget further announced customs duty rationalism, with a focus on
MSMEs
4
7.19
5.7
0
1
2
3
4
5
6
7
8
9
Jan-2
0
Feb-2
0
Ma
r-20
Apr-
20
Ma
y-20
Jun-2
0
Jul-20
Aug-2
0
Sep-2
0
Oct
-20
Nov-2
0
Dec-2
0
Jan-2
1
Feb-2
1
Ma
r-21
Apr-
21
Repo rate (%) MCLR 6 month (%) Bank credit growth (y-o-y %)
7
‒ Roadmap for public sector investment: The budget also pushed for infrastructure creation by
augmenting funds for the flagship National Inf rastructure Pipeline and laying down a roadmap by
increasing capital expenditure, monetising assets and developing instruments for infrastructure
f inancing
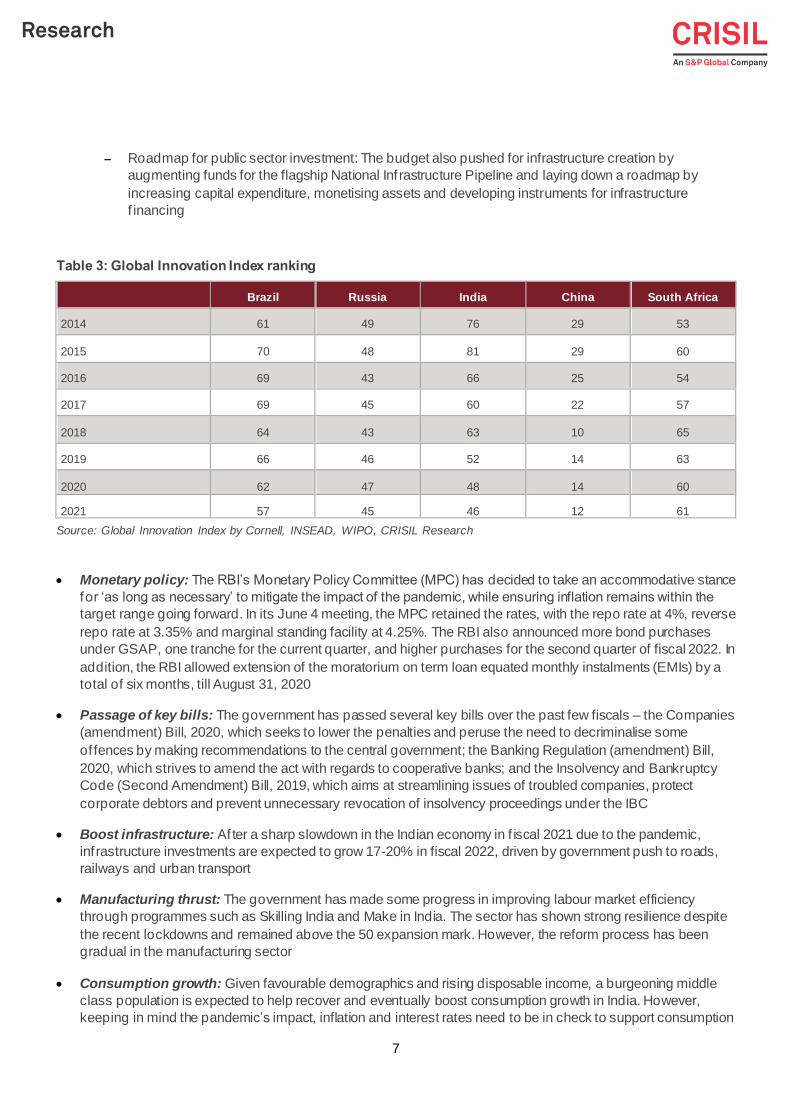
Table 3: Global Innovation Index ranking
Brazil Russia India China South Africa
2014 61 49 76 29 53
2015 70 48 81 29 60
2016 69 43 66 25 54
2017 69 45 60 22 57
2018 64 43 63 10 65
2019 66 46 52 14 63
2020 62 47 48 14 60
2021 57 45 46 12 61
Source: Global Innovation Index by Cornell, INSEAD, WIPO, CRISIL Research
• Monetary policy: The RBI’s Monetary Policy Committee (MPC) has decided to take an accommodative stance
for ‘as long as necessary’ to mitigate the impact of the pandemic, while ensuring inflation remains within the
target range going forward. In its June 4 meeting, the MPC retained the rates, with the repo rate at 4%, reverse
repo rate at 3.35% and marginal standing facility at 4.25%. The RBI also announced more bond purchases
under GSAP, one tranche for the current quarter, and higher purchases for the second quarter of fiscal 2022. In
addition, the RBI allowed extension of the moratorium on term loan equated monthly instalments (EMIs) by a
total of six months, till August 31, 2020
• Passage of key bills: The government has passed several key bills over the past few fiscals – the Companies
(amendment) Bill, 2020, which seeks to lower the penalties and peruse the need to decriminalise some
of fences by making recommendations to the central government; the Banking Regulation (amendment) Bill,
2020, which strives to amend the act with regards to cooperative banks; and the Insolvency and Bankruptcy
Code (Second Amendment) Bill, 2019, which aims at streamlining issues of troubled companies, protect
corporate debtors and prevent unnecessary revocation of insolvency proceedings under the IBC
• Boost infrastructure: Af ter a sharp slowdown in the Indian economy in f iscal 2021 due to the pandemic,
inf rastructure investments are expected to grow 17-20% in fiscal 2022, driven by government push to roads,
railways and urban transport
• Manufacturing thrust: The government has made some progress in improving labour market efficiency
through programmes such as Skilling India and Make in India. The sector has shown strong resilience despite
the recent lockdowns and remained above the 50 expansion mark. However, the reform process has been
gradual in the manufacturing sector
• Consumption growth: Given favourable demographics and rising disposable income, a burgeoning middle
class population is expected to help recover and eventually boost consumption growth in India. However,
keeping in mind the pandemic’s impact, inflation and interest rates need to be in check to support consumption
8
• Development of the financial markets: To develop the financial markets, the government has instituted steps
such as Jan Dhan Yojana, a better monetary policy framework, and passage of the Insolvency and Bankruptcy
Code (Second Amendment) Bill, 2019. Further, the Securities and Exchange Board of India (SEBI) approved
the f ramework for business trusts in India -- real estate investment trusts (REITs) and infrastructure investment
trusts (InvITs) f ramework, both of which are new asset classes for investors. While REIT allows monetisation of
real estate assets, InvIT helps promoters monetise their completed infrastructure projects (having
concessionaire/development agreement). In the budget, the government approved 100% foreign direct
investment (FDI) for insurance intermediaries and increased FDI limit in the sector to 74% from 49%. This step,
along with the emerging digital gold investment options and the platform for infra-debt financing, will help
deepen the domestic financial markets
• Digitalisation: The government has been quick to board the technology bandwagon with its Digital India
programme, which aims to speed up financial inclusion and deliver government services electronically b y
increasing internet connectivity and improving online infrastructure. Digitisation and digitalisation will create an
ef f iciency-led growth spurt over the medium term. In its 2021-22 budget, the government announced certain
initiatives in the digital space, including building a world-class fintech hub at Gandhinagar’s GIFT City,
conducting first-ever digital census, and allocation of Rs 1.15 lakh crore for railway digitisation
Amid these reforms, India’s economic growth is currently recovering and is expected to pick up, after having
dropped 7.3% in fiscal 2021, as four drivers – people learning to live with the new normal, flattening of the Covid-19
af f liction curve, rollout of vaccinations, and investment-focused government spending – converge.
9
2 Overview of India’s adhesives and sealants market
2.1 Domestic market review
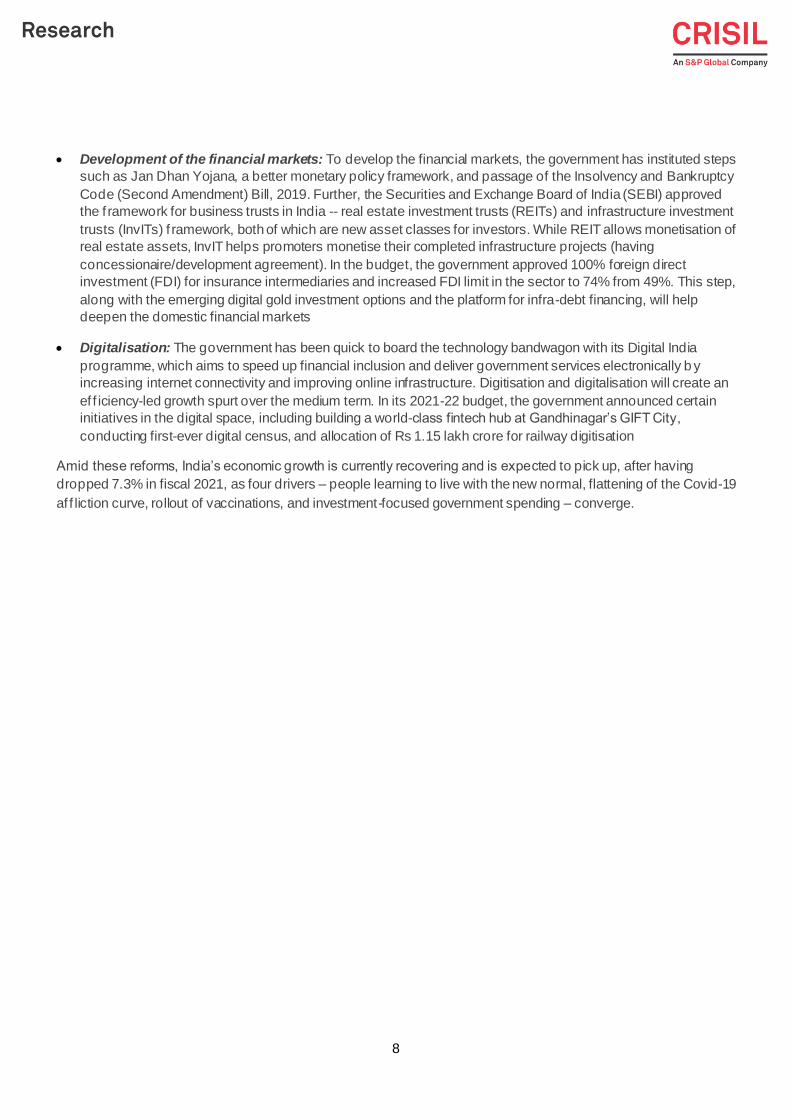
The Rs 134-136 billion (fiscal 2021) domestic adhesives and sealants market is broadly categorised into 1)
industrial and 2) consumer and bazaar adhesives. The industrial segment caters to B2B industries such as
packaging, footwear, paints, automotive, etc. The retail segment caters to industries such as furniture/woodwork,
building construction, arts and craft, electrical fittings, etc.
Figure 4: Market-wise split of adhesives (fiscal 2021)
Source: CRISIL Research
The adhesives and sealants market clocked 8-9% CAGR between fiscals 2015 and 2020, driven by growth in major
end-user industries such as packaging, construction, electronics and woodworking. Construction investments
logged 4-5% CAGR during the period, driven by an increase in spending on roads, railways and urban
inf rastructure. Moreover, the industry reflected healthy growth (7-8% CAGR) in the packaging segment. However,
the adhesives market stagnated in fiscal 2021 because of the pandemic, de-growing at 1-2% CAGR to Rs 134-136
billion. Fortunately, the decline was restricted thanks to growth in food packaging and e-commerce industries,
which catered to people forced to stay at home and ordered online. Moreover, redecorating spends increased,
leading to higher usage of consumer and bazaar adhesives in the furniture market.
Our report focusses on the consumer adhesives market.
The Rs 53-55 billion (fiscal 2021) consumer adhesives industry clocked 8-10% CAGR between fiscals 2015 and
2020, driven by the rapidly growing furniture industry with booming real estate and rising income levels leading to
an increased demand for interiors. Increased investment in building construction investment also contributed to its
growth. The woodwork segment is the largest end-user for consumer adhesives, constituting ~55% of fiscal 2021
revenue. The market de-grew 1-2% in fiscal 2021, due to the pandemic-led reduced construction activity. However,
the decline was restricted due to increased demand from the furniture segment due to work from home, which led
to higher demand for home furniture. However, the economy recovered in the second half of fiscal 2021, leading to
a rise in demand from end-user industries. The consumer adhesives market is expected to recover in fiscal 2022,
Industrial58-60%
Consumer/bazaar40-42%
10
following an expected GDP growth of 9.5% on-year and consequent recovery in infrastructure and construction
activity.
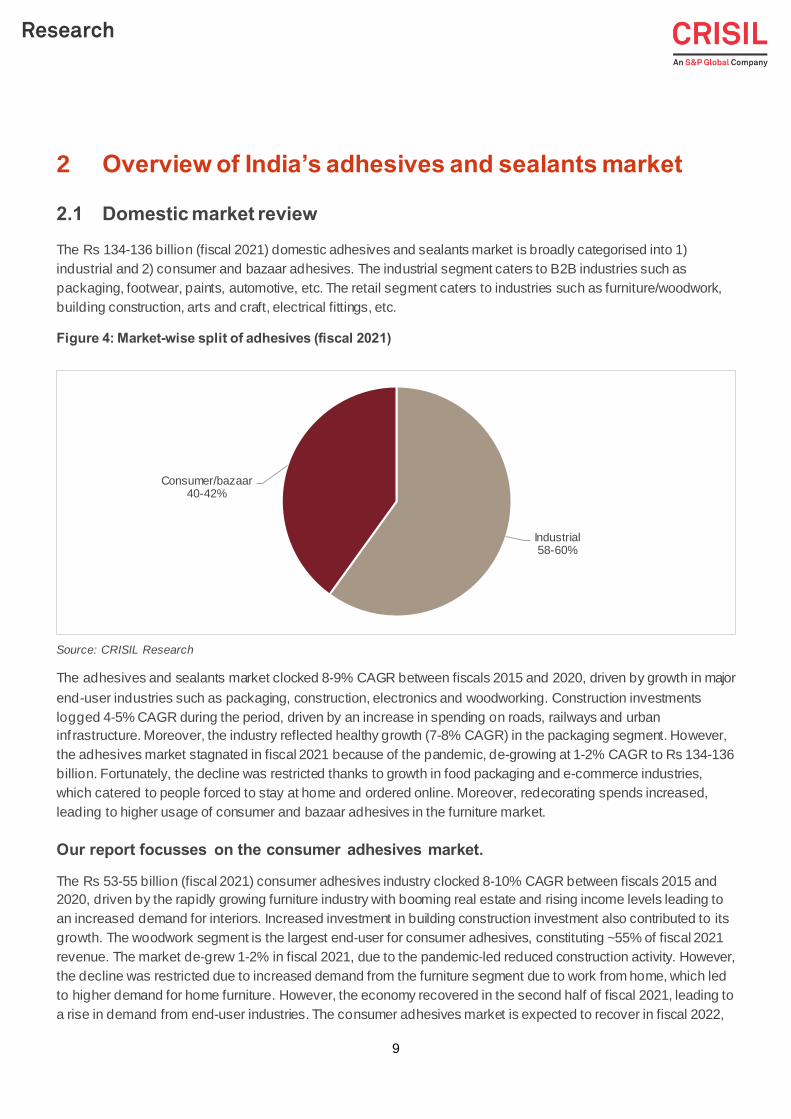
Figure 5: Industry-wise split of consumer adhesives (fiscal 2021)
Others include Stationary/arts and crafts, non-structural adhesion, and footwear
Source: CRISIL Research
The industry can be further classified based on technology into water-borne, solvent-borne, reactive and hot melt
adhesives. PVA (poly vinyl acetate), a water-borne adhesive, dominates the market (26-28% of revenue) due to
growing application in woodwork and furniture industry.
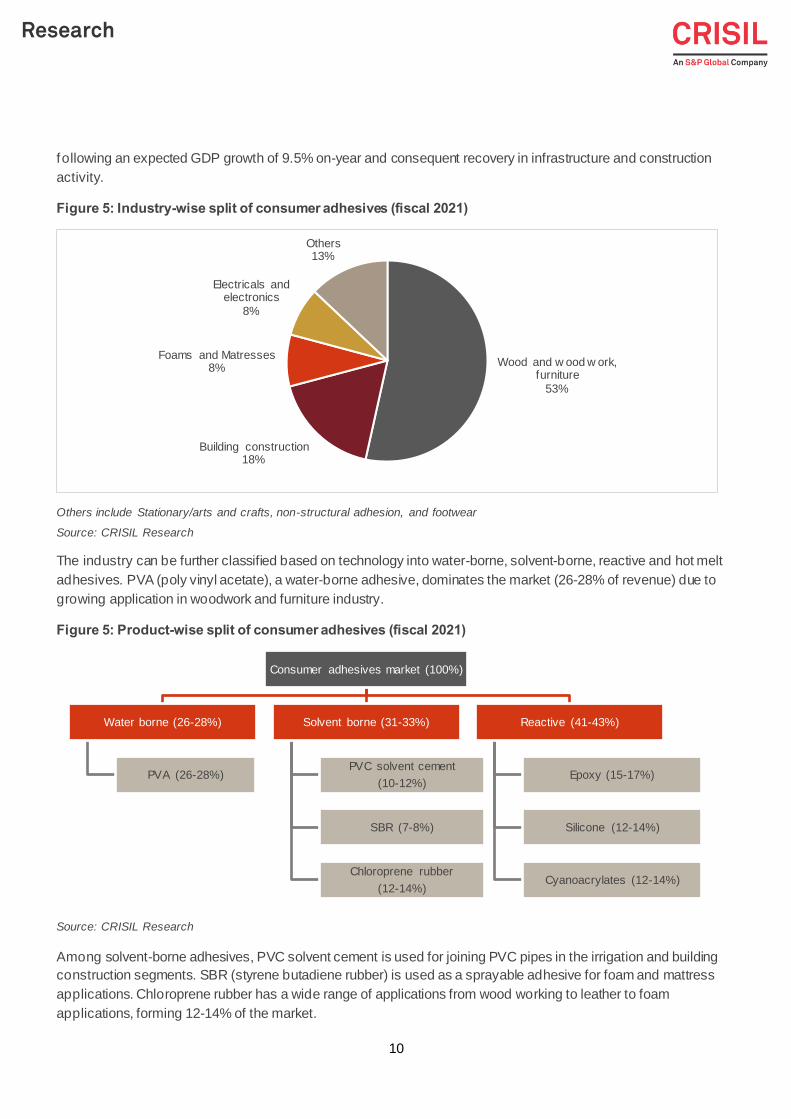
Figure 5: Product-wise split of consumer adhesives (fiscal 2021)
Source: CRISIL Research
Among solvent-borne adhesives, PVC solvent cement is used for joining PVC pipes in the irrigation and building
construction segments. SBR (styrene butadiene rubber) is used as a sprayable adhesive for foam and mattress
applications. Chloroprene rubber has a wide range of applications from wood working to leather to foam
applications, forming 12-14% of the market.
Wood and w ood w ork, furniture
53%
Building construction 18%
Foams and Matresses8%
Electricals and electronics
8%
Others13%
Consumer adhesives market (100%)
Water borne (26-28%)
PVA (26-28%)
Solvent borne (31-33%)
PVC solvent cement
(10-12%)
SBR (7-8%)
Chloroprene rubber
(12-14%)
Reactive (41-43%)
Epoxy (15-17%)
Silicone (12-14%)
Cyanoacrylates (12-14%)
11
Reactive adhesives are dominated by epoxy adhesives (15-17%). These also find application in the furniture,
woodworking and tiling industries, and are used for their water and heat resistance along with durability. These are
also used in the electrical, electronics and automotive space. Cyanoacrylates (FeviKwik) are used for bonding
plastics, metal and rubber components. These are used in moulded furniture, signboards and a wide range of
industrial applications. Silicone sealants (12-14% of the consumer adhesives market) are liquid adhesives. These
create strong adhesive bonds resistant to chemicals, moisture and weathering, and are widely used for basic
household repairs and areas around the sink or any piping due to their water-resistant nature.
Table 4: Types of consumer and bazaar adhesives and their key applications
Water-borne
PVA adhesives
Woodworking , furniture, handicraft, paper labelling and wallpaper installations
Solvent-borne
PVC solvent cement/ adhesive
PVC pipe sealing for drinking water and sewer systems, drainage and ventilation systems, and irrigation
SBR
Foam and mattress
Chloroprene rubber
Leather, foam and woodworking
Reactive adhesives
Epoxy adhesives
Furniture, woodworking , wood, metal, ceramic, marble, glass and rubber
Cyanoacrylates
Plastics, moulded furniture and rubber
Silicone
Drought proofing, doors and windows frames, wall crack fixing, air-conditioner systems sealing and sanitary
sealing
Source: CRISIL Research
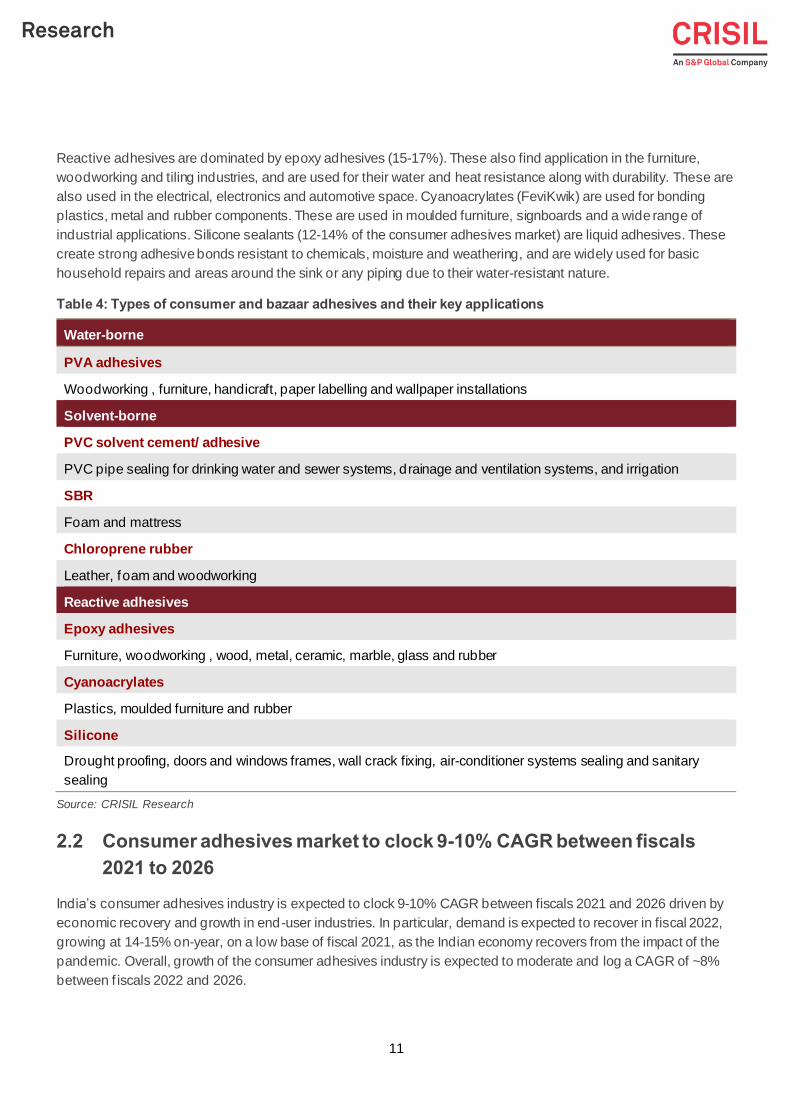
2.2 Consumer adhesives market to clock 9-10% CAGR between fiscals
2021 to 2026
India’s consumer adhesives industry is expected to clock 9-10% CAGR between fiscals 2021 and 2026 driven by
economic recovery and growth in end-user industries. In particular, demand is expected to recover in fiscal 2022,
growing at 14-15% on-year, on a low base of fiscal 2021, as the Indian economy recovers from the impact of the
pandemic. Overall, growth of the consumer adhesives industry is expected to moderate and log a CAGR of ~8%
between f iscals 2022 and 2026.
12
Figure 6: Consumer adhesives market on growth path
Source: CRISIL Research
2.3 PVA dominates the consumer adhesives market
PVA continues to dominate in terms of its application in the furniture market. However, chloroprene rubber has also
gained significance in wood and joinery applications due to lower prices and faster drying properties. Thus, we
expect rapid growth in demand for chloroprene rubber close at the heels of healthy growth in the furniture market.
However, PVA will continue to dominate the market at least till fiscal 2026, due to stronger bonding strength.
Growing awareness of environmental friendliness of water-based adhesives has led to the sustenance of PVA
demand.
The silicone sealants segment is also expected to witness healthy growth driven by rising construction investments
and their wide application in sanitary ware and household repairs owing to superior properties.
Healthy growth in the pipes and fittings market due to rising construction activity, coupled with rapid increase in
irrigation spends and replacement of metal pipes will drive demand for PVC solvent cements.
Table 5: Product-wise demand growth in consumer adhesives
Segment CAGR (FY21-26) Key demand drivers
PVA adhesives 7-9% Rising wooden furniture market
PVC solvent cement/adhesive 9-11% Growth in construction, irrigation spending, replacement of
metal pipes with PVC pipes
SBR 11-13% Growth in foams and mattress demand, due to rising demand
for furniture
Chloroprene rubber 8-10% Rising preference in wood working and foam application
Epoxy adhesives 8-10% Rising demand due to strong adhesion and a wide range of
applications in various surfaces
Cyanoacrylates 7-9% A wide range of applications in wood, plastic, metal, fabric and
ceramics
36-38
54-56 53-55
61-63
84-86
FY15 FY20 FY21 FY22 FY26
(Rs bn)

13
Segment CAGR (FY21-26) Key demand drivers
Silicone 10-12% Rising construction usage and increasing applications in
sanitary fittings repairs
Overall adhesives 8-10%
Source: CRISIL Research
2.4 Key demand drivers
Rising demand for wooden furniture to drive demand
India’s furniture market makes use of multiple types of adhesives, including PVA, SBR, chloroprene rubber,
cyanoacrylates and epoxy. The industry is expected to be driven by several factors, which are contingent to
parameters, such as growing urbanisation, increasing inclination towards more modular and compact furniture, and
rising demand for durable and hybrid furniture. All these factors are expected to positively impact the growth of the
furniture and thereby the consumer adhesives markets in the near term.
Increased customer brand awareness and modern style requirements, coupled with rising player collaboration
through online channels, are expected to support demand. The wooden furniture is no longer restricted to demand
for dewans, backless sofas or chairs. Consumers today are looking for the finest range of latest international
designs and trends for not just the living room, but also for kids’ rooms, study rooms, home offices, outdoor areas
and others. Thus, the furniture industry is now witnessing an expansion in its demand not just for utility purposes,
but more as a style quotient for homes, offices and retail spaces.
Despite furniture demand coming to a standstill in the first quarter of fiscal 2021, due to the nation-wide lockdown,
the industry has already bounced back and reached pre-pandemic demand levels by January 2021, driven by
work-f rom-home and online classes of children. The pandemic made it necessary for everyone to stay inside their
homes to prevent the spread of the virus, which led to a boom in household furniture demand. Several corporates
helped their employees in setting up work-from-home stations by providing allowances. Similarly, online classes
pushed parents to set up proper study tables for their children. This also led to an increase in online sales of
furniture as people chose to stay home due to the fear of the virus. The trend is expected to continue as companies
consider pivoting towards hybrid work models and increased acceptance of work-from-home. Overall, the industry
grew, albeit at a slower pace of 2-3% on-year in fiscal 2021.
Furthermore, CRISIL Research expects demand for wooden furniture to be driven by the anticipated growth in
af fordable housing, commercial construction, rising income levels, desire for better standard of living, favourable
working-age population to influence spending, nuclearisation of families, growing urban population, and better
credit availability and increasing penetration of plastic money. Demand is expected to be further propelled by the
initiatives of PMAY (Pradhan Mantri Awas Yojana) for increasing rural households.
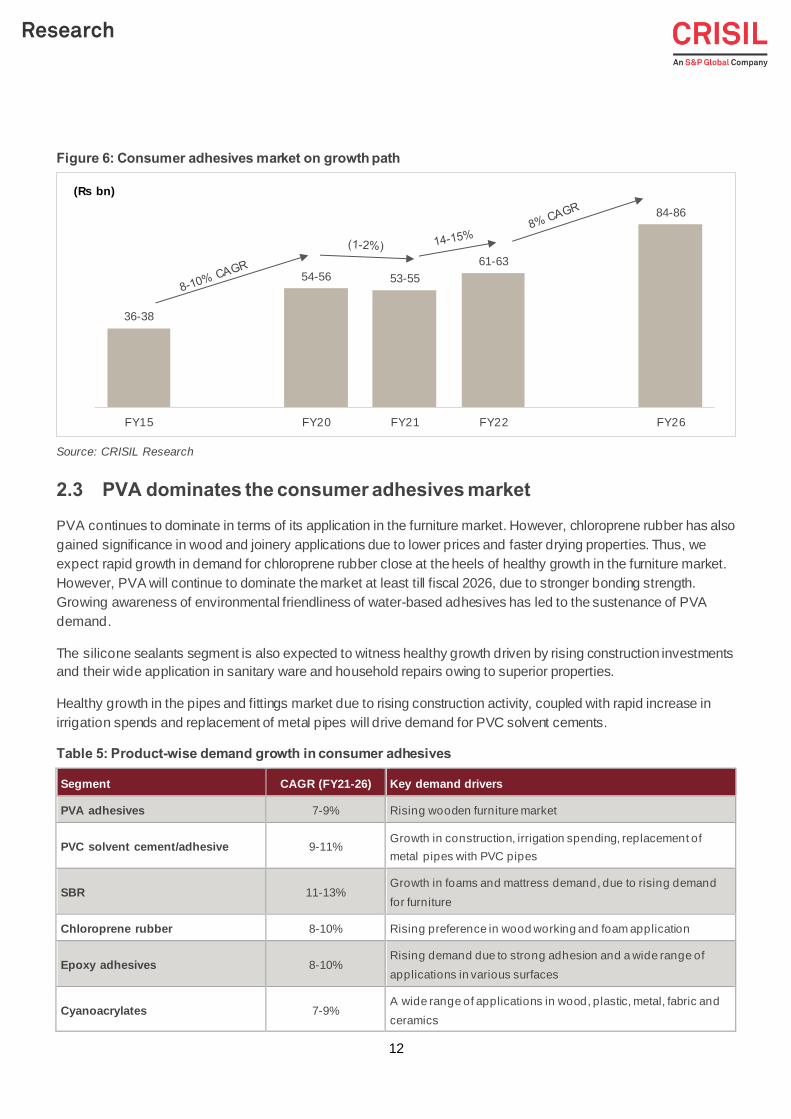
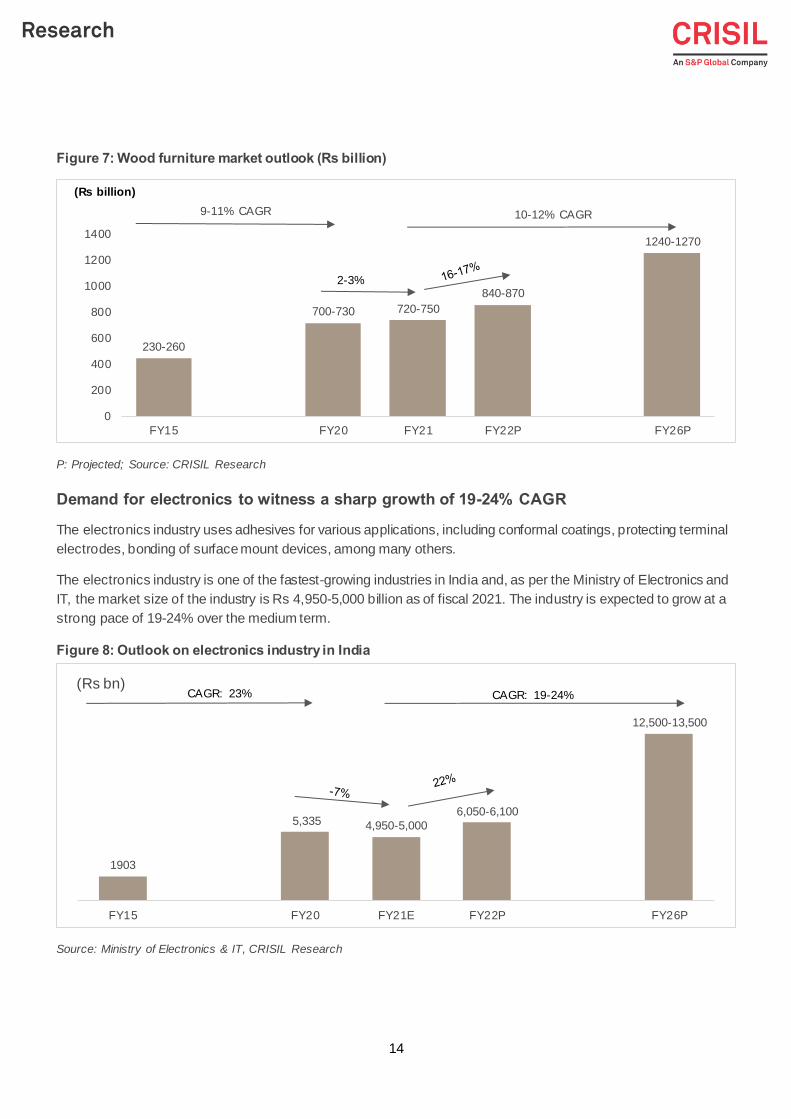
CRISIL Research estimates demand for wooden furniture to expand at a CAGR of 10-12% between fiscals 2021
and 2026.
14
Figure 7: Wood furniture market outlook (Rs billion)
P: Projected; Source: CRISIL Research
Demand for electronics to witness a sharp growth of 19-24% CAGR
The electronics industry uses adhesives for various applications, including conformal coatings, protecting terminal
electrodes, bonding of surface mount devices, among many others.
The electronics industry is one of the fastest-growing industries in India and, as per the Ministry of Electronics and
IT, the market size of the industry is Rs 4,950-5,000 billion as of fiscal 2021. The industry is expected to grow at a
strong pace of 19-24% over the medium term.
Figure 8: Outlook on electronics industry in India
Source: Ministry of Electronics & IT, CRISIL Research
230-260
700-730 720-750
840-870
1240-1270
0
200
400
600
800
1000
1200
1400
FY15 FY20 FY21 FY22P FY26P
9-11% CAGR 10-12% CAGR
2-3%
(Rs billion)
1903
5,335 4,950-5,000
6,050-6,100
12,500-13,500
FY15 FY20 FY21E FY22P FY26P
(Rs bn)CAGR: 23% CAGR: 19-24%
15
Infrastructure and increasing spending on building construction to drive construction
activity
The construction industry makes use of adhesives and sealants across various applications, such as flooring and
carpets, tile insulation, garage doors, resilient flooring, wall covering, pre-finish panels, perimeters of doors, drywall,
lamination, and fixed window frames, among others. These applications primarily make use of three types of
adhesives and sealants, namely epoxy, silicone and cyanoacrylates.
The industry is expected to grow at a medium pace, due to the government’s push for the sector. The government
has introduced multiple policies to boost the National Infrastructure Pipeline (NIP) and the Affordable Rental
Housing Complex (ARHC) scheme, along with Housing for All and other investments in the industrial segment in a
renewed push to the sector under the Atmanirbhar Bharat programme. CRISIL Research expects the investments
in the construction sector to grow at a CAGR of 4-6% over the medium term.
Moreover, increasing demand from the real-estate sector and rising irrigation spending are expected to drive the
demand for PVC-solvent cement.
Increasing demand for non-hazardous, green and sustainable adhesives
Demand for bio-based / green adhesives, such as starch and lignin, is increasing rapidly, as consumers are starting
to realise the adverse effects of petroleum-based products. Consequently, manufacturers are spending huge
amounts of capital for research and development of such adhesives.
Currently, hybrid adhesives are being increasingly used by end-user industries of adhesives, as they are
considered to be green and sustainable alternatives for solvent-based adhesives.
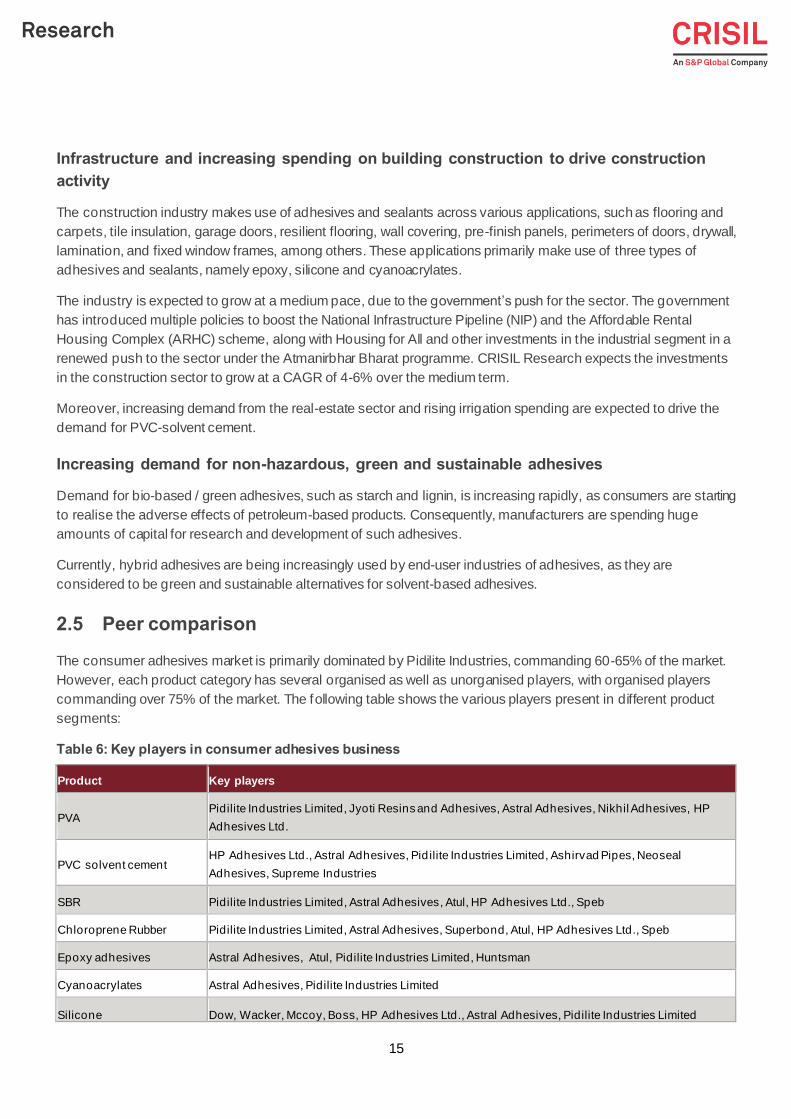
2.5 Peer comparison
The consumer adhesives market is primarily dominated by Pidilite Industries, commanding 60-65% of the market.
However, each product category has several organised as well as unorganised players, with organised players
commanding over 75% of the market. The following table shows the various players present in different product
segments:
Table 6: Key players in consumer adhesives business
Product Key players
PVA Pidilite Industries Limited, Jyoti Resins and Adhesives, Astral Adhesives, Nikhil Adhesives, HP
Adhesives Ltd.
PVC solvent cement HP Adhesives Ltd., Astral Adhesives, Pid ilite Industries Limited, Ashirvad Pipes, Neoseal
Adhesives, Supreme Industries
SBR Pidilite Industries Limited, Astral Adhesives, Atul, HP Adhesives Ltd., Speb
Chloroprene Rubber Pidilite Industries Limited, Astral Adhesives, Superbond, Atul, HP Adhesives Ltd., Speb
Epoxy adhesives Astral Adhesives, Atul, Pidilite Industries Limited, Huntsman
Cyanoacrylates Astral Adhesives, Pidilite Industries Limited
Silicone Dow, Wacker, Mccoy, Boss, HP Adhesives Ltd., Astral Adhesives, Pidilite Industries Limited
16
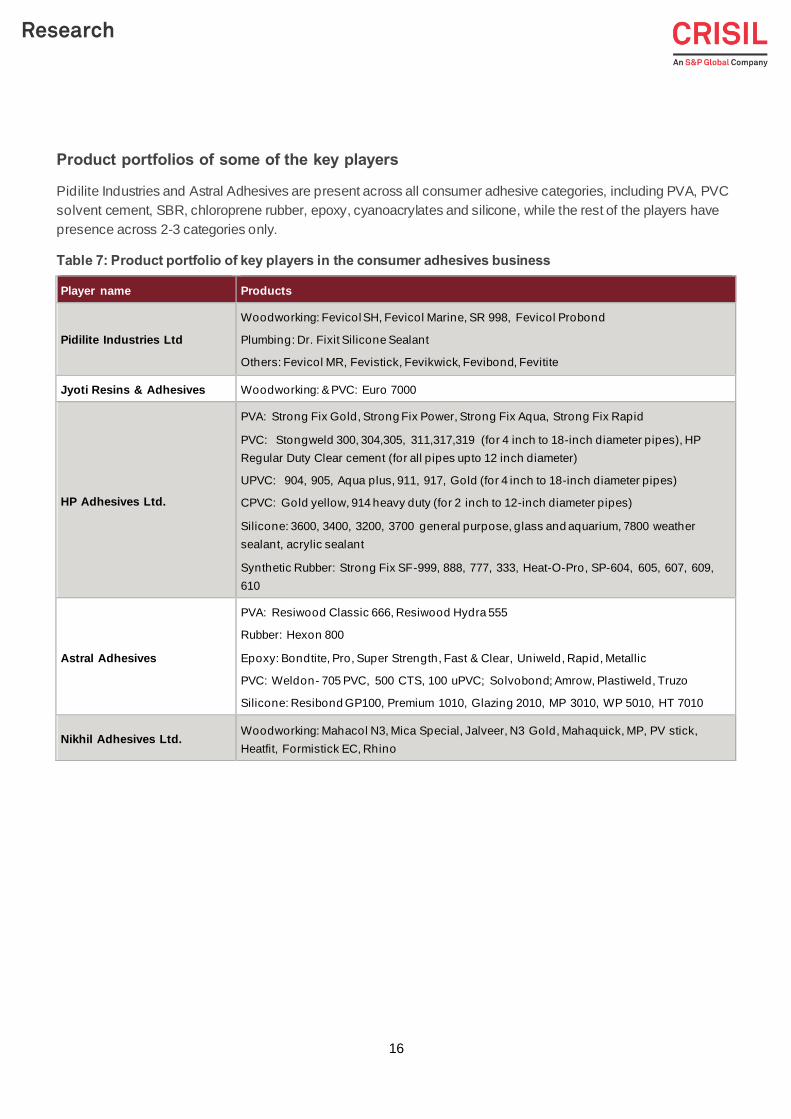
Product portfolios of some of the key players
Pidilite Industries and Astral Adhesives are present across all consumer adhesive categories, including PVA, PVC
solvent cement, SBR, chloroprene rubber, epoxy, cyanoacrylates and silicone, while the rest of the players have
presence across 2-3 categories only.
Table 7: Product portfolio of key players in the consumer adhesives business
Player name Products
Pidilite Industries Ltd
Woodworking: Fevicol SH, Fevicol Marine, SR 998, Fevicol Probond
Plumbing: Dr. Fixit Silicone Sealant
Others: Fevicol MR, Fevistick, Fevikwick, Fevibond, Fevitite
Jyoti Resins & Adhesives Woodworking: & PVC: Euro 7000
HP Adhesives Ltd.
PVA: Strong Fix Gold, Strong Fix Power, Strong Fix Aqua, Strong Fix Rapid
PVC: Stongweld 300, 304,305, 311,317,319 (for 4 inch to 18-inch diameter pipes), HP
Regular Duty Clear cement (for all pipes upto 12 inch diameter)
UPVC: 904, 905, Aqua plus, 911, 917, Gold (for 4 inch to 18-inch diameter pipes)
CPVC: Gold yellow, 914 heavy duty (for 2 inch to 12-inch diameter pipes)
Silicone: 3600, 3400, 3200, 3700 general purpose, glass and aquarium, 7800 weather
sealant, acrylic sealant
Synthetic Rubber: Strong Fix SF-999, 888, 777, 333, Heat-O-Pro, SP-604, 605, 607, 609,
610
Astral Adhesives
PVA: Resiwood Classic 666, Resiwood Hydra 555
Rubber: Hexon 800
Epoxy: Bondtite, Pro, Super Strength, Fast & Clear, Uniweld, Rapid, Metallic
PVC: Weldon- 705 PVC, 500 CTS, 100 uPVC; Solvobond; Amrow, Plastiweld, Truzo
Silicone: Resibond GP100, Premium 1010, Glazing 2010, MP 3010, WP 5010, HT 7010
Nikhil Adhesives Ltd. Woodworking: Mahacol N3, Mica Special, Jalveer, N3 Gold, Mahaquick, MP, PV stick,
Heatfit, Formistick EC, Rhino

17
3 An overview of India’s PVC (polyvinyl chloride)
adhesives market
PVC adhesives, also known as PVC solvent cement, are adhesives, which are used for joining PVC adhesives.
The process is similar to welding, since it melts two pieces of PVC into a single piece. A PVC adhesive consists of
PVC resin, a solvent, and methyl ethyl ketone – which breaks the top layer of the pipes and fittings to be joined
together. The single largest application of PVC adhesives is in the PVC pipes industry, where it is widely used to
join pipes.
Plastic pipes are made of different types of polymers. The four key types are unplasticised polyvinyl chloride (u-
PVC), which represents 72-76% of industry demand by volume, chlorinated polyvinyl chloride (CPVC) – 13-15%,
HDPE – 6-8% and polypropylene (PPR) ~4-5%. Composite pipes, which have a mix of metal and plastic layers, are
also used for similar applications.
Figure 9: Types and applications of plastic pipes in fiscal 2021
PVC adhesives are used for joining u-PVC and CPVC pipes. There are three broad product categories in the PVC
adhesives market –PVC, u-PVC and CPVC, based on the category of pipe they are used for. Similar to PVC pipes,
the PVC adhesives business is a largely B2C business, where the key customers are applicators, including
contractors/plumbers, which are in charge of installing and fixing the pipes and fittings at a particular site.
Polymer pipes
UPVC
72-76% of total demand
Irrigation
Water supply & sanitation
Industrial applications
CPVC
13-15% of total demand
Water supply & sanitation
Hot and cold water systems
Industrialapplications
HDPE
6-8% of total demand
Irrigation
Water supply & sanitation
Industrialapplications
PPR
3-5% of total demand
Hot and cold water systems
Industrial applications
Composite pipe
~1% of total demand
Hot and cold water applications
Gas pipe line and industrial applications
18
3.1 Domestic market review
The size of the Indian PVC adhesives market was Rs 6.81 billion as of fiscal 2020 while in f iscal 2021, the market
de-grew by ~9% to Rs 6.2 billion on account of demand slump as a result of Covid-19 pandemic. The market has
grown at around 10% CAGR, in line with the rapid growth in the plastic pipes segment, which grew at a healthy
CAGR of 10-11% over fiscals 2015 to 2020, reaching about Rs 330-340 billion. Industry growth was driven by rising
demand from the construction and irrigation sectors. In the construction space, increasing investments in water
supply and sanitation (WSS) projects, substitution of metal pipes with polymer pipes, and replacement demand
propelled adhesive offtake. Initiatives such as Pradhan Mantri Krishi Sinchayee Yojana (PMKSY), Accelerated
Irrigation Benefits Programme (AIBP), and Command Area Development and Water Management (CADWM)
Programme fuelled the use of PVC pipes, and hence PVC adhesives in the irrigation sector.
Additionally, the industry received a boost from the government’s Atal Mission for Rejuvenation and Urban
Transformation (AMRUT) scheme, which is aimed at providing basic services such as WSS and ensuring every
household has access to a tap with assured water supply and a sewerage connection. As a result, demand for soil,
waste and rain, and drainage pipes was robust. Among several variants of plastic pipes available in the market,
demand for u-PVC and CPVC, in particular, has been rising, due to affordability, high quality and durability.
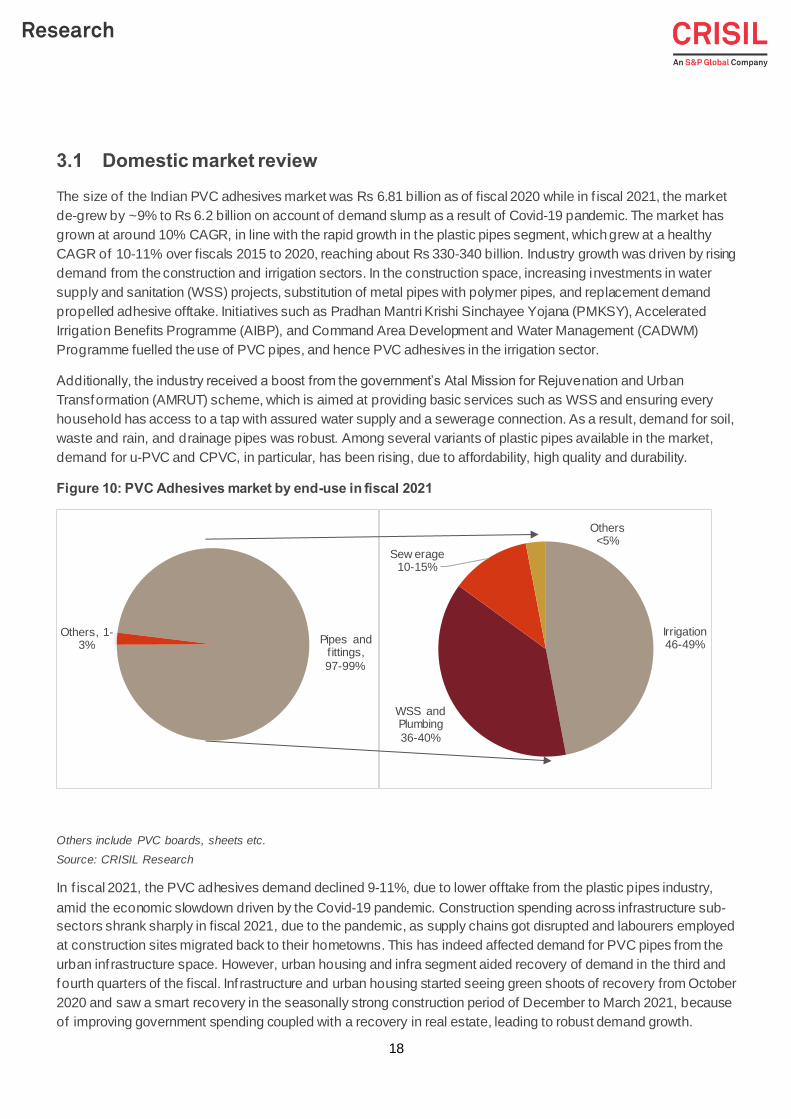
Figure 10: PVC Adhesives market by end-use in fiscal 2021
Others include PVC boards, sheets etc.
Source: CRISIL Research
In f iscal 2021, the PVC adhesives demand declined 9-11%, due to lower offtake from the plastic pipes industry,
amid the economic slowdown driven by the Covid-19 pandemic. Construction spending across infrastructure sub-
sectors shrank sharply in fiscal 2021, due to the pandemic, as supply chains got disrupted and labourers employed
at construction sites migrated back to their hometowns. This has indeed affected demand for PVC pipes from the
urban inf rastructure space. However, urban housing and infra segment aided recovery of demand in the third and
fourth quarters of the fiscal. Inf rastructure and urban housing started seeing green shoots of recovery from October
2020 and saw a smart recovery in the seasonally strong construction period of December to March 2021, because
of improving government spending coupled with a recovery in real estate, leading to robust demand growth.
Pipes and f ittings,
97-99%
Others, 1-3%
Irrigation46-49%
WSS and Plumbing
36-40%
Sew erage10-15%
Others<5%
19
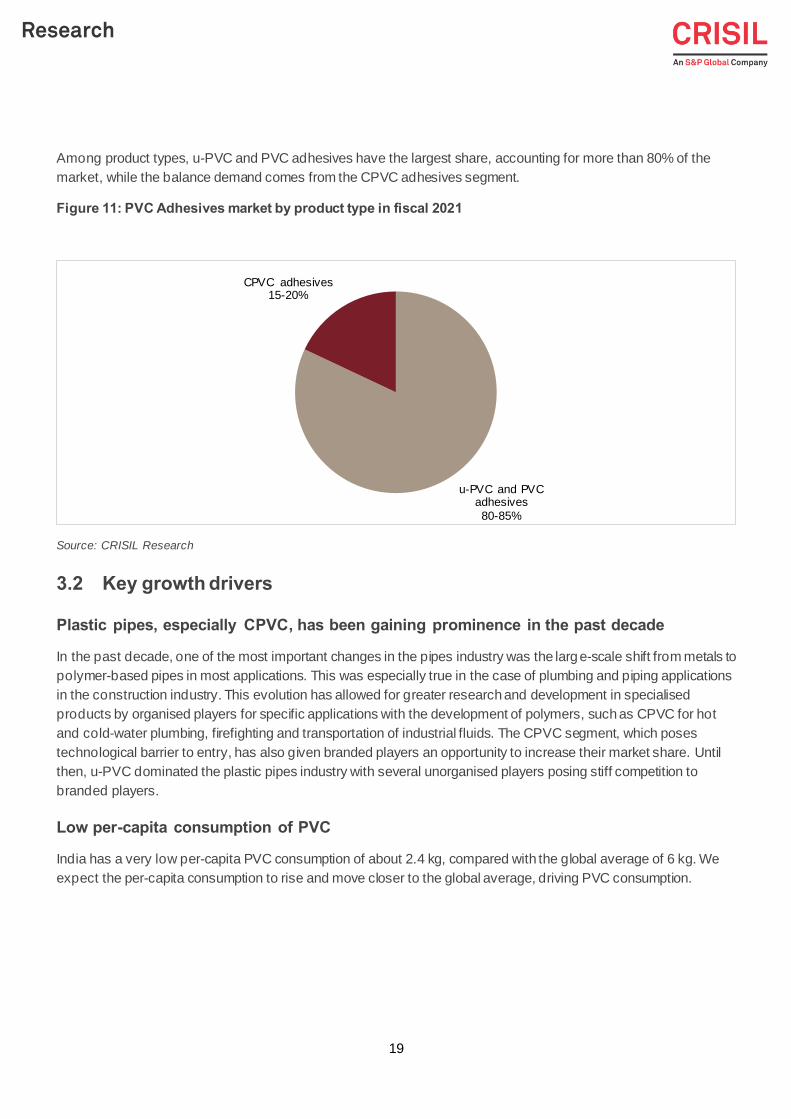
Among product types, u-PVC and PVC adhesives have the largest share, accounting for more than 80% of the
market, while the balance demand comes from the CPVC adhesives segment.
Figure 11: PVC Adhesives market by product type in fiscal 2021
Source: CRISIL Research
3.2 Key growth drivers
Plastic pipes, especially CPVC, has been gaining prominence in the past decade
In the past decade, one of the most important changes in the pipes industry was the large-scale shift from metals to
polymer-based pipes in most applications. This was especially true in the case of plumbing and piping applications
in the construction industry. This evolution has allowed for greater research and development in specialised
products by organised players for specific applications with the development of polymers, such as CPVC for hot
and cold-water plumbing, firefighting and transportation of industrial fluids. The CPVC segment, which poses
technological barrier to entry, has also given branded players an opportunity to increase their market share. Until
then, u-PVC dominated the plastic pipes industry with several unorganised players posing stiff competition to
branded players.
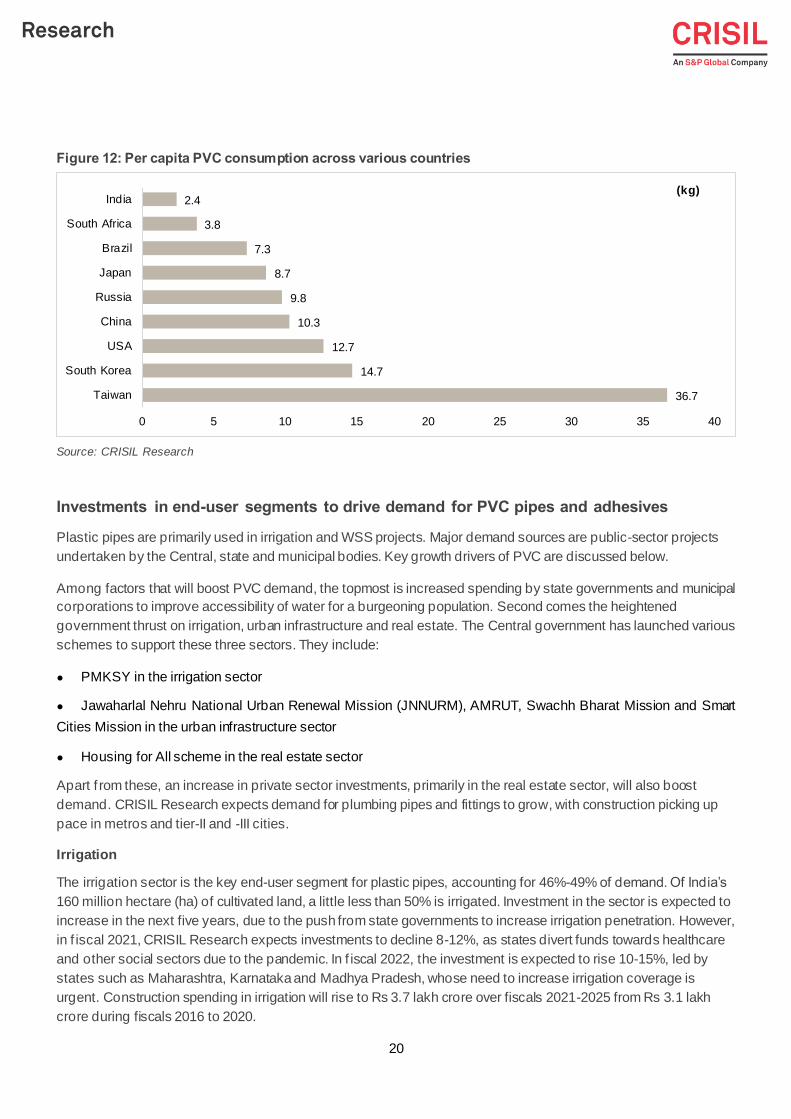
Low per-capita consumption of PVC
India has a very low per-capita PVC consumption of about 2.4 kg, compared with the global average of 6 kg. We
expect the per-capita consumption to rise and move closer to the global average, driving PVC consumption.
u-PVC and PVC adhesives
80-85%
CPVC adhesives15-20%
20
Figure 12: Per capita PVC consumption across various countries
Source: CRISIL Research
Investments in end-user segments to drive demand for PVC pipes and adhesives
Plastic pipes are primarily used in irrigation and WSS projects. Major demand sources are public-sector projects
undertaken by the Central, state and municipal bodies. Key growth drivers of PVC are discussed below.
Among factors that will boost PVC demand, the topmost is increased spending by state governments and municipal
corporations to improve accessibility of water for a burgeoning population. Second comes the heightened
government thrust on irrigation, urban infrastructure and real estate. The Central government has launched various
schemes to support these three sectors. They include:
● PMKSY in the irrigation sector
● Jawaharlal Nehru National Urban Renewal Mission (JNNURM), AMRUT, Swachh Bharat Mission and Smart
Cities Mission in the urban infrastructure sector
● Housing for All scheme in the real estate sector
Apart f rom these, an increase in private sector investments, primarily in the real estate sector, will also boost
demand. CRISIL Research expects demand for plumbing pipes and fittings to grow, with construction picking up
pace in metros and tier-II and -III cities.
Irrigation
The irrigation sector is the key end-user segment for plastic pipes, accounting for 46%-49% of demand. Of India’s
160 million hectare (ha) of cultivated land, a little less than 50% is irrigated. Investment in the sector is expected to
increase in the next five years, due to the push from state governments to increase irrigation penetration. However,
in f iscal 2021, CRISIL Research expects investments to decline 8-12%, as states divert funds towards healthcare
and other social sectors due to the pandemic. In f iscal 2022, the investment is expected to rise 10-15%, led by
states such as Maharashtra, Karnataka and Madhya Pradesh, whose need to increase irrigation coverage is
urgent. Construction spending in irrigation will rise to Rs 3.7 lakh crore over fiscals 2021-2025 from Rs 3.1 lakh
crore during fiscals 2016 to 2020.
36.7
14.7
12.7
10.3
9.8
8.7
7.3
3.8
2.4
0 5 10 15 20 25 30 35 40
Taiwan
South Korea
USA
China
Russia
Japan
Brazil
South Africa
India(kg)

21
Urban infrastructure
Investments in urban infrastructure declined 8-12% in fiscal 2021, as the pandemic has resulted in lower spending
due to a loss of man days amid the lockdown, diversion of state funds to meet social and healthcare spending and
labour migration. In f iscal 2022, the investment is expected to rise 15-20%, as the deferred projects of fiscal 2021
kick off and the government focusses on schemes, such as Swachh Bharat Mission, Jal Jeevan Mission, AMRUT
and metro projects, a bulk of which were under implementation and have achieved financial closure. Over fiscals
2021 to 2025, CRISIL Research expects urban infrastructure to see Rs 2.9 lakh crore of spending, a 1.35x increase
f rom the previous five fiscals. Half of the amount is expected to be in WSS projects, driven primarily by state
governments and through Central government-sponsored programmes, such as Jal Jeevan mission, AMRUT and
Swachh Bharat Mission.
Af ter WSS, metro construction will attract the most investment in urban infrastructure development. CRISIL
Research estimates that spending in metro rail will increase 1.3 times to Rs 1 lakh crore over the next five years.
The bulk of these projects are under construction and have achieved financial closure. The lockdown and migration
of labour drove investment lower in f iscal 2021. However, the projects that were deferred this fiscal are expected to
restart in the next f iscal. A number of projects announced and being implemented by various state governments will
drive the medium-term growth of the sector. A new metro rail policy was announced in the Union Budget for fiscal
2018, which is expected to attract the private sector into the segment.
Figure 13: Progress of key metro projects as of fiscal 2021
Apart from the above-mentioned cities, metro lines are current under construction in Agra, Nagpur, Ahmedabad, Kanpur, Navi
Mumbai, and Patna.
Source: CRISIL Research
In f iscal 2017, the government launched the Smart Cities Mission to transform 100 cities in the country. The project
had an approved budget of Rs 480 billion over five years. The scheme focuses on providing adequate and clean
water supply, sanitation, solid waste management, efficient transportation, affordable housing for the poor, power
supply, robust IT connectivity, e-governance, safety and security of citizens, health, and education. The selected
cities were given a Central government assistance of Rs 2 billion in the first year and promised Rs 1 billion in each
of the next four years, with a matching contribution from the state governments.
22
Real estate sector
Real estate is a key end-user sector for PVC pipes in India. Over the past few years, demand in the real estate
sector has been sluggish. Developers had to delay giving possession of projects due to various reasons, including
approval delays and financial issues. The government passed the Real Estate (Regulation and Development) Act
in 2016 that put in place a regulatory system for the sector to boost the confidence of customers. Moreover, The
Pradhan Mantri Awas Yojana-Urban (PMAY-U), a scheme coming under the Housing for All by 2022 programme,
witnessed healthy construction over past three fiscals, particularly in fiscals 2019 and 2020.
Substitution and replacement demand
Plastic pipes have several advantages over metal pipes. For instance, raw materials used in manufacturing plastic
pipes are derivatives of crude oil. Hence, prices of plastic pipes are correlated to crude oil prices. The fall in crude
oil prices has comparatively lowered raw material prices, and, thus, plastic-pipe prices over fiscals 2015 to 2021.
Superior real estate properties and low prices have accelerated the substitution of metal pipes by plastic pipes. The
increase in the availability of raw materials (PVC, PE and PPR), following the commissioning of new petrochemical
facilities in India will further support the plastic-pipes industry. Another factor driving long-term demand is the
replacement of older pipes with plastic pipes.
Within the plastic pipes industry, CRISIL Research expects demand for PVC adhesives to be driven by increasing
application of CPVC pipes.
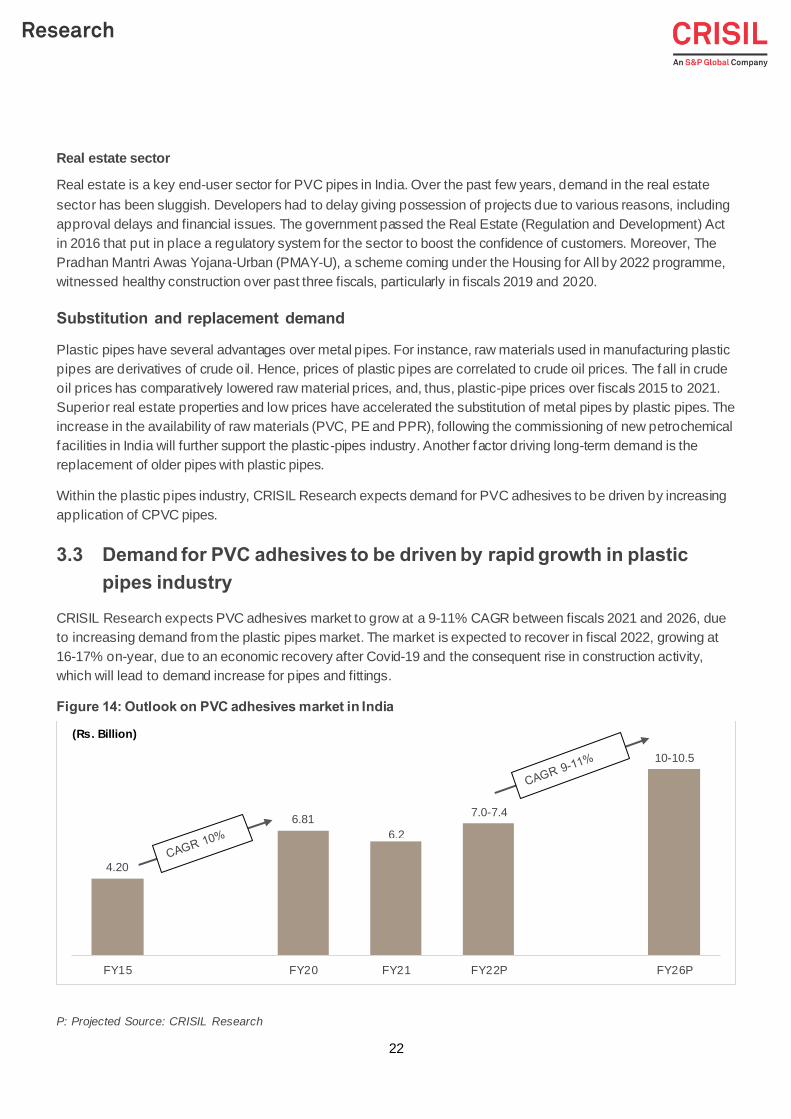
3.3 Demand for PVC adhesives to be driven by rapid growth in plastic
pipes industry
CRISIL Research expects PVC adhesives market to grow at a 9-11% CAGR between fiscals 2021 and 2026, due
to increasing demand from the plastic pipes market. The market is expected to recover in fiscal 2022, growing at
16-17% on-year, due to an economic recovery after Covid-19 and the consequent rise in construction activity,
which will lead to demand increase for pipes and fittings.
Figure 14: Outlook on PVC adhesives market in India
P: Projected Source: CRISIL Research
4.20
6.81
6.2
7.0-7.4
10-10.5
FY15 FY20 FY21 FY22P FY26P
(Rs. Billion)

23
In particular, the CPVC adhesives segment is expected to witness the maximum growth during fiscals 2021 to
2026, as CPVC pipes in India are still at a nascent stage and have huge potential due to factors, such as longevity,
f ire resistance, corrosion- and lead-free nature, and the ability to withstand high temperatures.
u-PVC adhesive demand will be driven by growth in the u-PVC pipes business, growing at an 8-10% CAGR
between f iscals 2021 and 2026. These pipes find application in agriculture and plumbing for potable water supply
and sewerage. Continuous replacement of galvanised iron pipes with these pipes has supported healthy demand
growth in the past. Features such as affordability and longer life compared with metal pipes have aided this
segment. Government initiatives, such as AIBP (Accelerated Irrigation Benefits Programme), also provide growth
potential.
Overall, the share of the CPVC segment is expected to increase to around 15% from the current levels.
Figure 15: Expected growth in PVC adhesives by segment
P: Projected Source: CRISIL Research
3.4 Peer comparison
Even while the PVC adhesives market is at an early-growth stage, competition has been growing with new
companies entering the market. However, the organised sector dominates on the back of the increased brand
awareness of end users.
The market has both core manufacturers and pipes and fittings players who have entered the PVC adhesive
manufacturing space. While leading manufacturers include HP Adhesives Ltd., Astral Adhesives, and Ashirvad
Pipes Pvt. Ltd., the latter category has Prince Pipes, Apollo Pipes, Jain Irrigation, and Supreme Industries, among
others. However, these players manufacture very small volumes as compared with core manufacturers. Though the
market is dominated by organised players, there are a large number of unorganised players who cater to small
contractors and plumbers looking for low-cost products.
HP Adhesives Ltd. is the largest manufacturer, having 14-16% market share followed by Astral Adhesive with a
share of 11-13%. Both players offer a wide range of solvent cements for various types of plastic pipes and fittings.
Pidilite Limited and Ashirvad Pipes Pvt. Ltd. are also among the major manufacturers of PVC adhesives in the
Indian market.
6-6.5
8-8.5
1-1.2
1.5-2.0
FY22P FY26Pu-PVC and PVC C-PVC
(Rs. Billion)

24
25
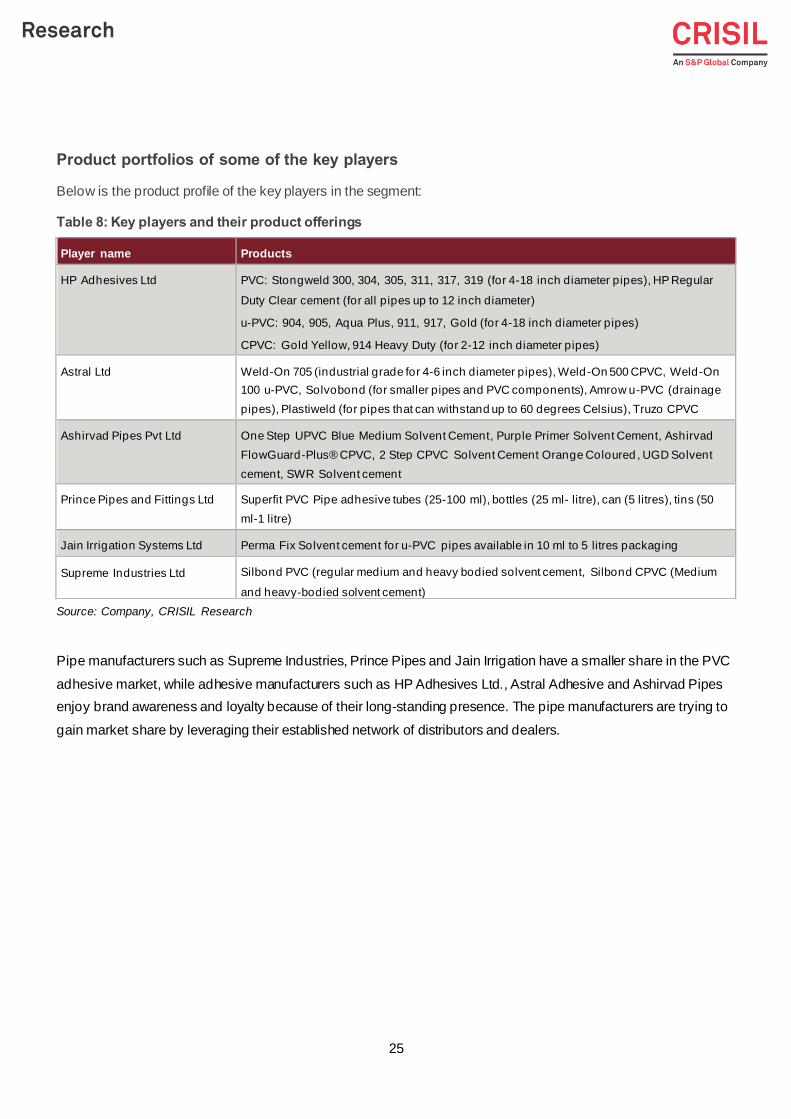
Product portfolios of some of the key players
Below is the product profile of the key players in the segment:
Table 8: Key players and their product offerings
Source: Company, CRISIL Research
Pipe manufacturers such as Supreme Industries, Prince Pipes and Jain Irrigation have a smaller share in the PVC
adhesive market, while adhesive manufacturers such as HP Adhesives Ltd., Astral Adhesive and Ashirvad Pipes
enjoy brand awareness and loyalty because of their long-standing presence. The pipe manufacturers are trying to
gain market share by leveraging their established network of distributors and dealers.
Player name Products
HP Adhesives Ltd PVC: Stongweld 300, 304, 305, 311, 317, 319 (for 4-18 inch diameter pipes), HP Regular
Duty Clear cement (for all pipes up to 12 inch diameter)
u-PVC: 904, 905, Aqua Plus, 911, 917, Gold (for 4-18 inch diameter pipes)
CPVC: Gold Yellow, 914 Heavy Duty (for 2-12 inch diameter pipes)
Astral Ltd Weld-On 705 (industrial grade for 4-6 inch diameter pipes), Weld-On 500 CPVC, Weld-On
100 u-PVC, Solvobond (for smaller pipes and PVC components), Amrow u-PVC (drainage
pipes), Plastiweld (for pipes that can withstand up to 60 degrees Celsius), Truzo CPVC
Ashirvad Pipes Pvt Ltd One Step UPVC Blue Medium Solvent Cement, Purple Primer Solvent Cement, Ashirvad
FlowGuard-Plus® CPVC, 2 Step CPVC Solvent Cement Orange Coloured , UGD Solvent
cement, SWR Solvent cement
Prince Pipes and Fittings Ltd Superfit PVC Pipe adhesive tubes (25-100 ml), bottles (25 ml- litre), can (5 litres), tins (50
ml-1 litre)
Jain Irrigation Systems Ltd Perma Fix Solvent cement for u-PVC pipes available in 10 ml to 5 litres packaging
Supreme Industries Ltd Silbond PVC (regular medium and heavy bodied solvent cement, Silbond CPVC (Medium
and heavy-bodied solvent cement)
26
4 Overview of India’s wood coatings market
4.1 India’s paints and coatings market overview
The domestic paints and coatings industry, with a market size of Rs 500-520 billion in fiscal 2020. In FY21, amidst
slowdown in major end user industries, the paints industry revenue contracted by 5-10% y-o-y (reaching a market
of Rs 460-490 billion), as real estate completions were severely impacted during H1 of FY21 post lockdown
following onset of Covid, which affected decorative paints segment. Furthermore, subdued production growth of
automobile impacted growth of auto paints.
The paints and coatings market is broadly segmented into: (1) decorative; and (2) industrial. Decorative paints find
utility in the housing and construction sector and account for over 70% of the total paint market. This is unlike the
global market where the decorative segment contributes to less than 40% of the market.
Industrial paints and coatings find use in industries such as automobiles, auto ancillaries, consumer durables,
marine vessels, and industrial plant and machinery. They are categorised based on end-user applications, such as
automotive, powder, performance, coil, packaging, and marine coatings. Of these, the automotive segment
constitutes the largest share. Owing to the technology-intensive nature of the end-users, manufacturers have
entered into technical collaborations and joint ventures with leading international paint producers.
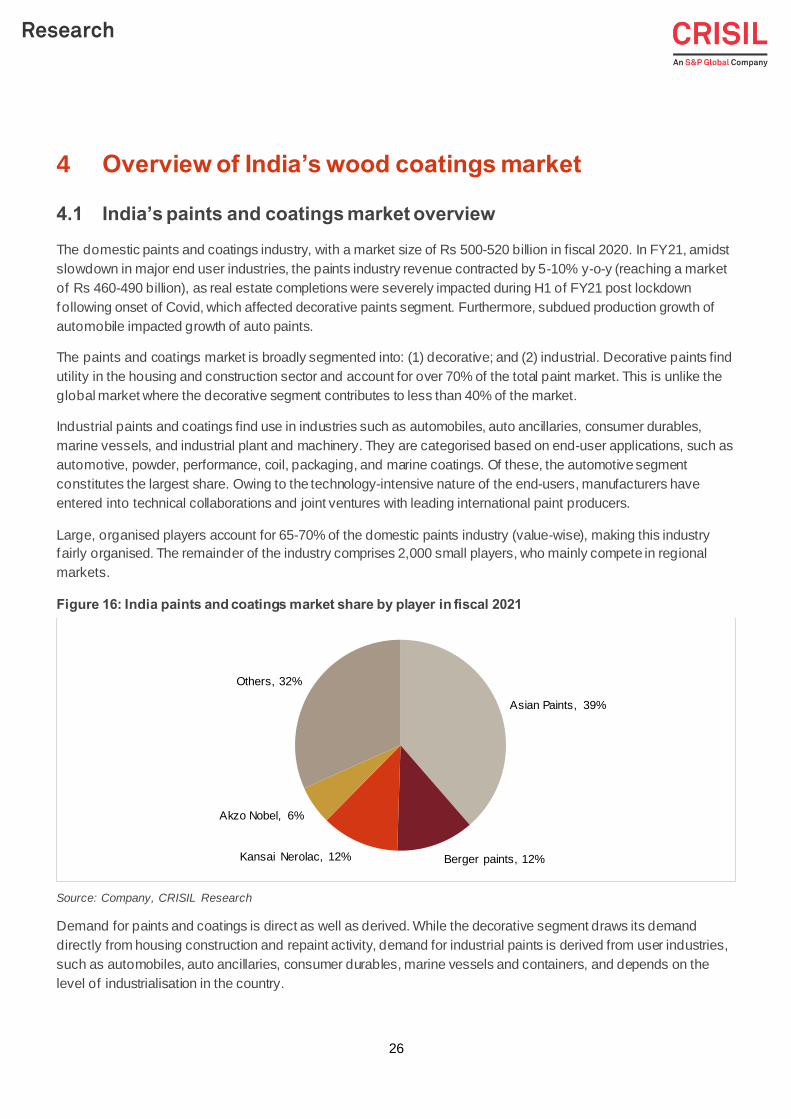
Large, organised players account for 65-70% of the domestic paints industry (value-wise), making this industry
fairly organised. The remainder of the industry comprises 2,000 small players, who mainly compete in regional
markets.
Figure 16: India paints and coatings market share by player in fiscal 2021
Source: Company, CRISIL Research
Demand for paints and coatings is direct as well as derived. While the decorative segment draws its demand
directly from housing construction and repaint activity, demand for industrial paints is derived from user industries,
such as automobiles, auto ancillaries, consumer durables, marine vessels and containers, and depends on the
level of industrialisation in the country.
Asian Paints, 39%
Berger paints, 12%Kansai Nerolac, 12%
Akzo Nobel, 6%
Others, 32%
27
Demand for paints and coatings is influenced mainly by the economic growth rate, which translates into increased
purchasing power and, consequently, increased per capita consumption of paints. Demand for decorative paints
and coatings is also influenced by the interest rates on consumer housing loans and the affordability factor of
houses. The growth rate of the economy also influences repaint demand, which accounts for ~ 60% of demand for
decorative paints. The remaining 40% demand is directly influenced by the increase in fresh civil construction
(housing and commercial), though there is a 12–18-month lag between the construction and painting of a house.
The domestic paints and coatings industry has been growing at 6% CAGR from fiscals 2015-20. Increasing
penetration in rural and non-metro cities, rising per capita consumption of paints and growth in major end-user
industries such as real estate, automobiles and construction sector have been the key growth drivers. Amid the
slowdown in major end-user industries, the paints industry revenue contracted 5-10% y-o-y in fiscal 2021. Real
estate completions were severely impacted during the first half following onset of Covid-19 that affected the
decorative paints segment. Subdued production growth in automobiles has impacted the auto paints segment.
Going ahead, industry revenue is likely to witness healthy growth on the lower base of fiscal 2021. The decorative
segment will see a faster recovery following resumption of real estate construction and expected completions
during the year.
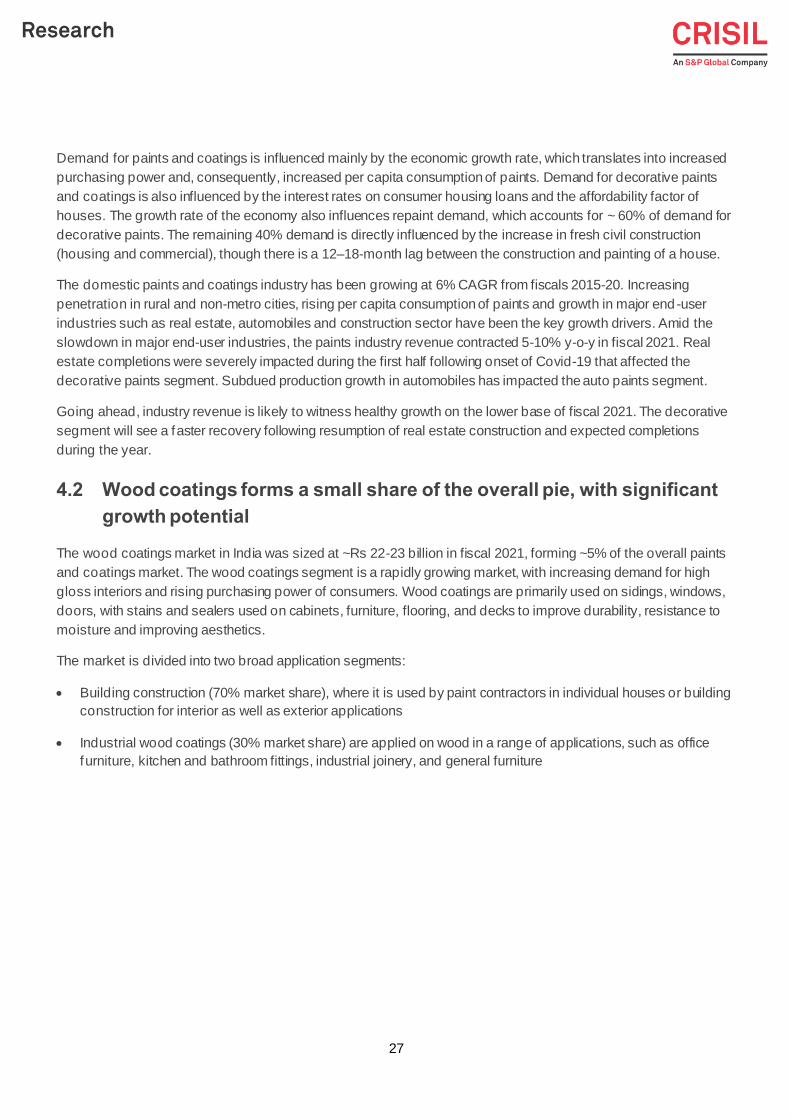
4.2 Wood coatings forms a small share of the overall pie, with significant
growth potential
The wood coatings market in India was sized at ~Rs 22-23 billion in fiscal 2021, forming ~5% of the overall paints
and coatings market. The wood coatings segment is a rapidly growing market, with increasing demand for high
gloss interiors and rising purchasing power of consumers. Wood coatings are primarily used on sidings, windows,
doors, with stains and sealers used on cabinets, furniture, flooring, and decks to improve durability, resistance to
moisture and improving aesthetics.
The market is divided into two broad application segments:
• Building construction (70% market share), where it is used by paint contractors in individual houses or building
construction for interior as well as exterior applications
• Industrial wood coatings (30% market share) are applied on wood in a range of applications, such as office
furniture, kitchen and bathroom fittings, industrial joinery, and general furniture

28
Figure 17: Wood coatings market by application (fiscal 2021)
Source: CRISIL Research
The market has grown at 8-9% CAGR from fiscals 2015-20, driven by rising construction activity. Moreover, the
segment sees rapidly growing demand from redecorating activities, which comprise ~60% of the overall decorative
paints segment. The sharp 8-10% on-year decline in demand in f iscal 2021 severely impacted the real estate
construction segment owing to a nation-wide lockdown.
In terms of product categories, the market is further subdivided into melamine (forming ~40% of the market),
polyurethane, polyester, nitrocellulose, water-based coatings, and French polish.
Figure 18: Wood coatings market by product type (fiscal 2021)
Source: CRISIL Research
Overall expansion in the market from fiscals 2015-20 has been driven by growth from polyurethane (PU), polyester
and water-based coatings, which has grown at 18-22% CAGR. This is owing to their superior quality and improved
properties, which provide better durability and aesthetics. The melamine segment has been increasing at a modest
7% CAGR, driven by rising construction activity and growth in the furniture market. Overall construction capex grew
Building construction (Individual contract
basis), 70%
Furniture and fixtures (Industrial segment)
Melamine40%
Polyurethane (including acrylic)
34%
Polyester3%
Water based3%
Nitrocellulose10%
French polish (Varnish)
10%

29
at 4-5% CAGR during the period, driven by rising infrastructure expenditure and focus on affordable housing.
Nearly 15-16 lakh crore worth of investments were made in residential and commercial properties. Moreover, a
significant demand push came from the re-decorating segment, which has been growing rapidly with rising income
levels. Growth in the nitrocellulose segment has been relatively slow, at ~3-5% CAGR. Moreover, the French polish
segment has been declining at ~2% compound annual rate. This is primarily because of the shifting preference
f rom melamine towards premium PU and acrylic and polyester-based coatings, which have higher durability and
superior properties.
Melamine was a great improvement over French polish when it was introduced in the Indian market in the late
1980s and the 1990s and is popular to date due to its low prices. But melamine has its limitations. The f ilm formed
by melamine is only moderately resistant to water. It deteriorates when exposed to sunlight. The f ilm easily yellows
and loses lustre. Moreover, melamine has carcinogenic properties because of which it is slowly losing popularity.
PU forms a tougher film than melamine. Moreover, it is more scratch-resistant, it is flexible and does not crack with
the movement of wood joints. It can be applied on woods used in exteriors, such as entrance doors and windows. It
does not yellow easily and gives a high lustre which is retained longer due to its UV resistance.
4.3 Key demand drivers
Favourable economic indicators to back decorative paint demand
In line with the global paint industry, growth of the domestic paint industry is closely linked to GDP growth. The
strong positive correlation between industry and GDP growth is a given since demand for paints tends to follow
overall economic activity, including income levels, industrial production and construction spending. Repainting
constitutes ~70% of decorative paint demand. India’s rising disposable income and growing preference for
aesthetics of paints have helped shorten repainting cycles over 10 years, from an 8–9-year cycle to 4-5 years now.
India’s GDP growth is expected to continue, with fiscal 2022 showing a sharp recovery, and the long-term growth
scenario remaining stable. Moreover, government initiatives such as e-NAM, crop insurance, and irrigation
schemes will ensure better rural income.
Rising per capita consumption
India’s per capita consumption of paints is ~4.3 kg as of fiscal 2021, compared with the global average of 13-14 kg.
Thus, there is immense scope for growth in the domestic paints industry over the long term, given that the economy
continues to grow.
Nuclearisation creating more demand:
Additionally, changing lifestyle, rising individualism, changing social/cultural attitudes, and increased mobility of
labour in search of opportunities will lead to increasing nuclearisation in urban areas. Nuclearisation is expected to
reduce the size of the households, thus increasing the number of households and spurring growth in housing
demand.
Growth of housing stock to improve with PMAY implementation
The real estate industry has been in focus with various developments such as demonetisation, enactment of the
Real Estate (Regulation and Development) Act (RERA), 2016, and implementation of the Goods and Services Tax
(GST). The pandemic further impacted the sector. Shortage of manpower in the first half of fiscal 2021 due to
30
migration of labour, no construction activity in April and May 2020, cratering of buyer demand on account of the
pandemic affecting the financial profile of buyers, stretched financial conditions of developers due to depressed
sales, and 6–9-month RERA extension granted by the authority deferring projects will all impact an already slowing
sector. It is noteworthy that the sector had registered a mere -0.3% CAGR growth over the past five fiscals.
Investments in f iscal 2021 declined by 40-50% due to the aforementioned factors.
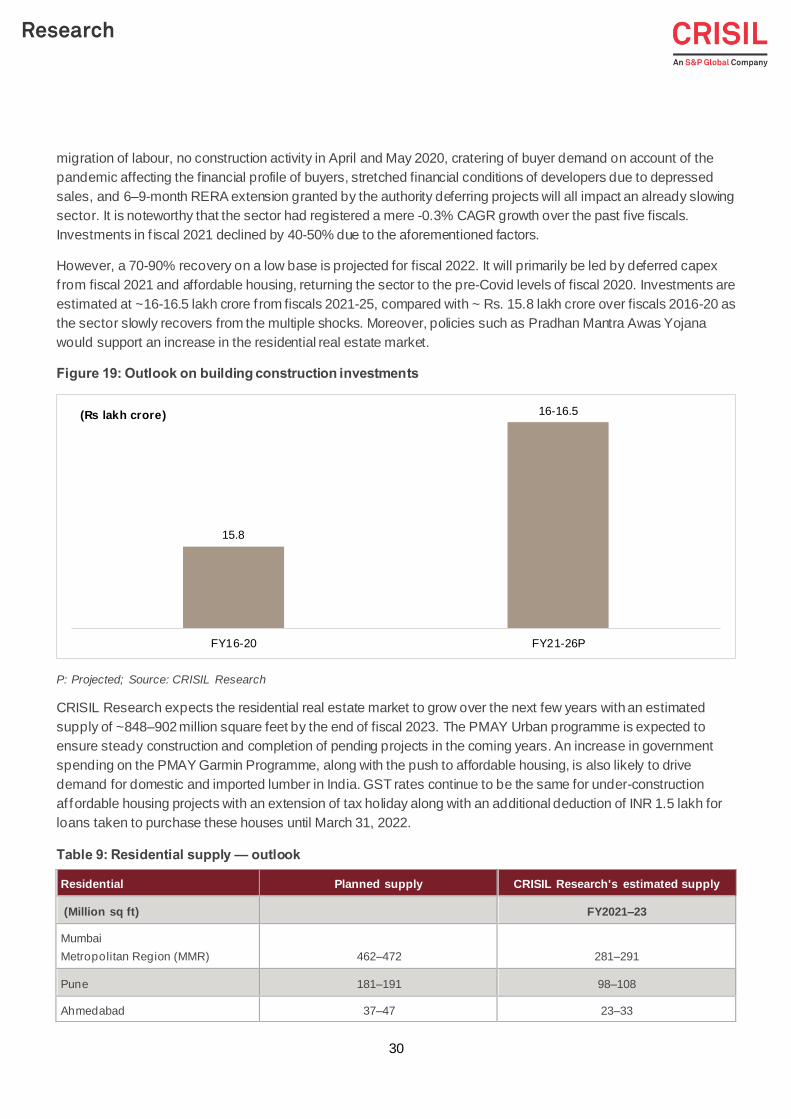
However, a 70-90% recovery on a low base is projected for fiscal 2022. It will primarily be led by deferred capex
f rom fiscal 2021 and affordable housing, returning the sector to the pre-Covid levels of fiscal 2020. Investments are
estimated at ~16-16.5 lakh crore f rom fiscals 2021-25, compared with ~ Rs. 15.8 lakh crore over fiscals 2016-20 as
the sector slowly recovers from the multiple shocks. Moreover, policies such as Pradhan Mantra Awas Yojana
would support an increase in the residential real estate market.
Figure 19: Outlook on building construction investments
P: Projected; Source: CRISIL Research
CRISIL Research expects the residential real estate market to grow over the next few years with an estimated
supply of ~848–902 million square feet by the end of fiscal 2023. The PMAY Urban programme is expected to
ensure steady construction and completion of pending projects in the coming years. An increase in government
spending on the PMAY Garmin Programme, along with the push to affordable housing, is also likely to drive
demand for domestic and imported lumber in India. GST rates continue to be the same for under-construction
af fordable housing projects with an extension of tax holiday along with an additional deduction of INR 1.5 lakh for
loans taken to purchase these houses until March 31, 2022.
Table 9: Residential supply — outlook
15.8
16-16.5
FY16-20 FY21-26P
(Rs lakh crore)
Residential Planned supply CRISIL Research's estimated supply
(Million sq ft) FY2021–23
Mumbai
Metropolitan Region (MMR) 462–472 281–291
Pune 181–191 98–108
Ahmedabad 37–47 23–33
31
Source: CRISIL Research
Lifestyle changes and rising demand for wooden furniture to drive higher usage of wood
coatings:
Wood and wood products are widely used in our day-to-day life. Major applications of wood are in construction
(hard wood flooring, shuttering for beams and columns, door and window frames), furniture, packaging (cases,
boxes, wooden casks), and other niche areas. The furniture market in India is primarily unorganised in nature.
Manufacturing of construction-related wood products is also highly unorganised and fragmented, with most of the
production of doors, windows and interiors being done by individual carpenters on site. However, a visible shift
towards organised retail is evident with an increasing number of people opting for look and functionality, thus
turning to readymade professional options. There was a demand pick-up in fiscal 2020 for wooden furniture, which
continues to dominate the Indian furniture industry. One-of-a-kind antique wooden furniture pieces along with old
materials and styles of carpentry have once again taken over the industry since fiscal 2019. In f iscal 2020, the
wooden furniture sector stood at Rs 700-730 billion ($9.5-9.9 billion), as compared with ~Rs 640 billion in the fiscal
2019, accounting for 60-65% of total demand of the total furniture industry.
During f iscals 2015-20, demand for wooden furniture expanded at 9–11% CAGR, spurred by rising investments
and growth in residential and commercial construction. Growth slowed during fiscal 2017 due to the impact of
demonetisation, since most unorganised players deal in cash. However, it does not impact the industry anymore
and is witnessing an improvement in growth since fiscal 2018, albeit at a modest rate.
India’s furniture market is expected to be driven by several factors, which are contingent to parameters such as
growing urbanisation, increasing inclination towards more modular and compact furniture, and rising demand for
durable and hybrid furniture. All these factors are expected to positively impact the growth of the furniture market in
the near term.
Increased customer brand awareness and modern style requirements, coupled with rising player collaboration
through online channels, are expected to support demand. Wooden furniture is no longer restricted to demand of a
dewan, backless sofa or chair. Consumers today are looking for the finest range of the latest international designs
and trends for not just the living room, but also for kids’ rooms, study rooms, home offices, outdoor areas and
others. Thus, the furniture industry is now witnessing an expansion in its demand not just for utility purposes, but
more as a style quotient for homes, offices and retail spaces.
Despite furniture demand coming to a standstill in the first quarter of fiscal 2021 due to the nationwide lockdown,
the industry has already bounced back. It reached pre-pandemic demand levels by January 2021, driven by work-
f rom-home and online classes of children. The pandemic made it necessary for everyone to stay inside their homes
to prevent the spread of the virus, which led to a boom for household furniture demand. Several corporates helped
Chandigarh 11–15 9–13
Hyderabad 89–99 18–28
Chennai 69–79 42–52
Bengaluru 127–137 92–102
Kochi 1.5–4.5 1.5–4.5
NCR 258–268 201–211
Kolkata 80–90 49–59
32
their employees in setting up work-from-home stations by providing allowances for the same. Similarly, online
classes pushed parents to set up proper study tables for children. This also led to an increase in online sales of
furniture as people chose to stay home. The trend is expected to continue as companies consider pivoting towards
hybrid work models and increased acceptance of the work-from-home practice. Overall, the industry grew, albeit at
a slower pace of 2-3% on-year in f iscal 2021.
Furthermore, we expect demand for wooden furniture to be driven by the anticipated growth in affordable housing,
commercial construction, rising income levels, desire for better standard of living, favourable working age
population to influence spending, nuclearisation of families, growing urban population, and better credit availability
and increasing penetration of plastic money. Demand is expected to be further propelled by the initiatives of PMAY
(Pradhan Mantri Awas Yojana) for increasing rural households.
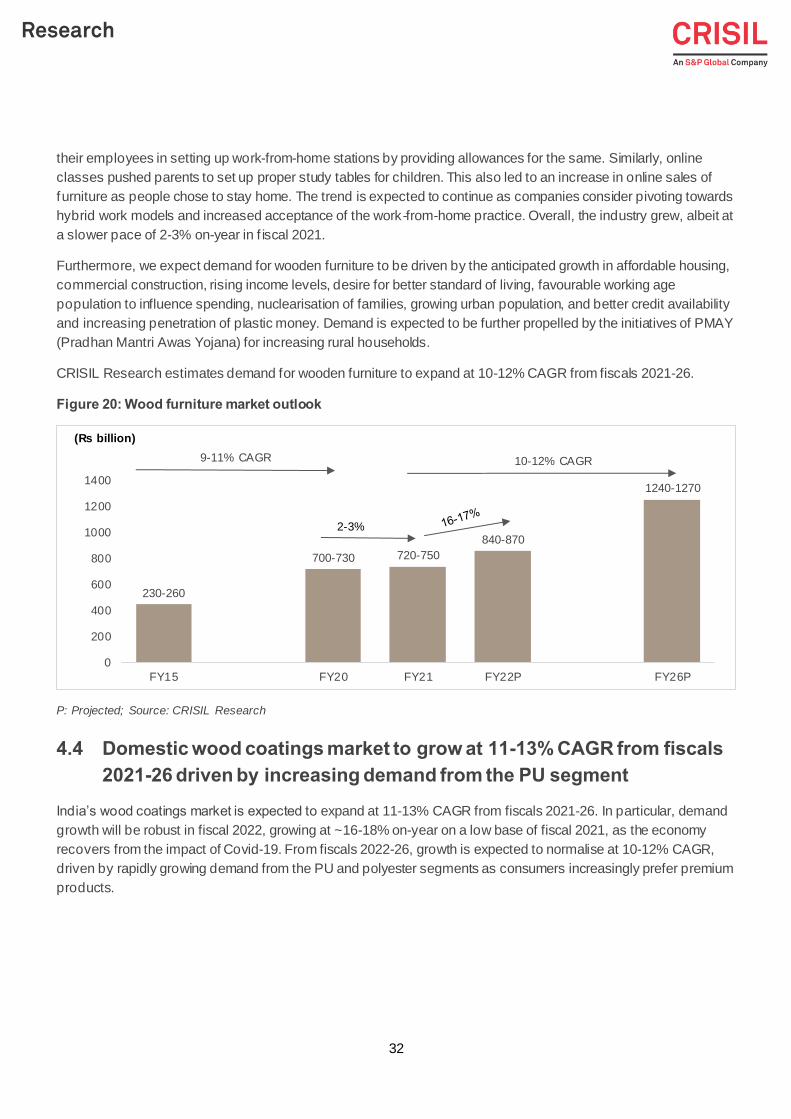
CRISIL Research estimates demand for wooden furniture to expand at 10-12% CAGR from fiscals 2021-26.
Figure 20: Wood furniture market outlook
P: Projected; Source: CRISIL Research
4.4 Domestic wood coatings market to grow at 11-13% CAGR from fiscals
2021-26 driven by increasing demand from the PU segment
India’s wood coatings market is expected to expand at 11-13% CAGR from fiscals 2021-26. In particular, demand
growth will be robust in fiscal 2022, growing at ~16-18% on-year on a low base of fiscal 2021, as the economy
recovers from the impact of Covid-19. From fiscals 2022-26, growth is expected to normalise at 10-12% CAGR,
driven by rapidly growing demand from the PU and polyester segments as consumers increasingly prefer premium
products.
230-260
700-730 720-750
840-870
1240-1270
0
200
400
600
800
1000
1200
1400
FY15 FY20 FY21 FY22P FY26P
9-11% CAGR 10-12% CAGR
2-3%
(Rs billion)
33
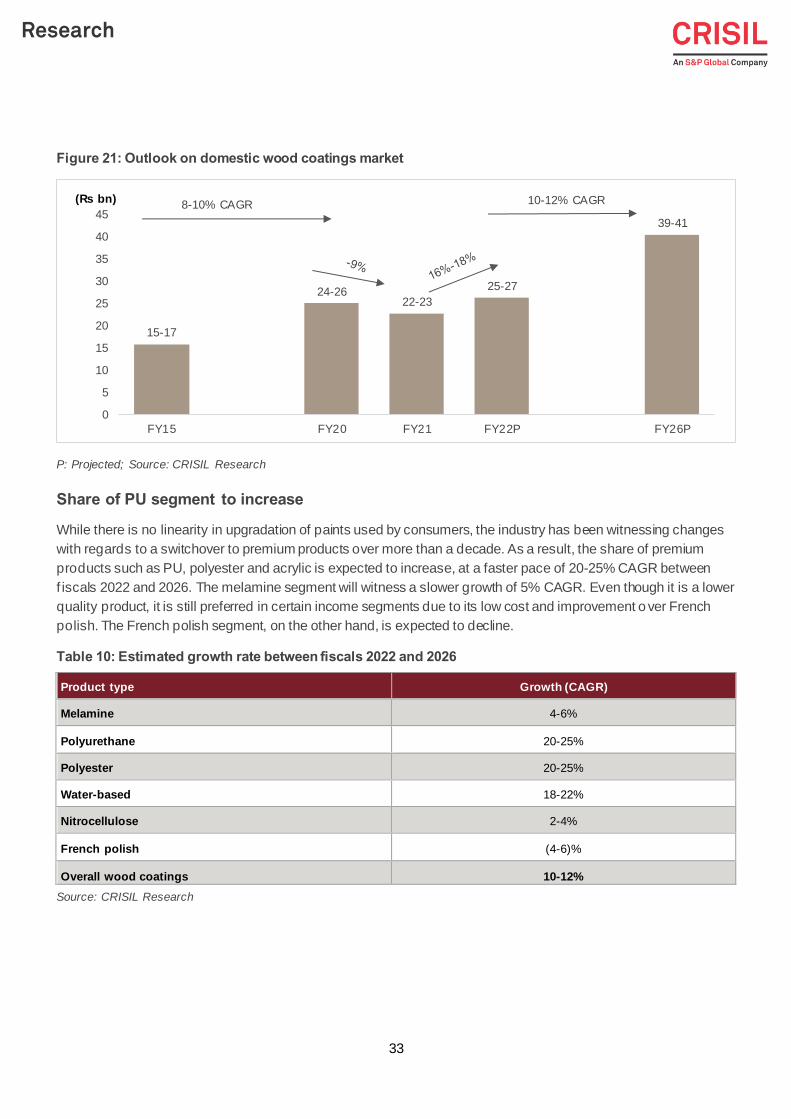
Figure 21: Outlook on domestic wood coatings market
P: Projected; Source: CRISIL Research
Share of PU segment to increase
While there is no linearity in upgradation of paints used by consumers, the industry has been witnessing changes
with regards to a switchover to premium products over more than a decade. As a result, the share of premium
products such as PU, polyester and acrylic is expected to increase, at a faster pace of 20-25% CAGR between
f iscals 2022 and 2026. The melamine segment will witness a slower growth of 5% CAGR. Even though it is a lower
quality product, it is still preferred in certain income segments due to its low cost and improvement o ver French
polish. The French polish segment, on the other hand, is expected to decline.
Table 10: Estimated growth rate between fiscals 2022 and 2026
Source: CRISIL Research
15-17
24-2622-23
25-27
39-41
0
5
10
15
20
25
30
35
40
45
FY15 FY20 FY21 FY22P FY26P
8-10% CAGR 10-12% CAGR(Rs bn)
Product type Growth (CAGR)
Melamine 4-6%
Polyurethane 20-25%
Polyester 20-25%
Water-based 18-22%
Nitrocellulose 2-4%
French polish (4-6)%
Overall wood coatings 10-12%
34
Figure 22: Wood coatings market by product type (FY26P)
P: Projected; Source: CRISIL Research
4.5 Peer comparison
Similar to the overall paints and coatings market, the wood coatings segment is also dominated by a few large
players comprising majority share in the market. Asian Paints is the largest player in the melamine segment with
nearly 40-50% market share. Other major players in the melamine segment include MRF (5-8%), Kansai Nerolac,
Berger, Nippon Paints, Akzo Nobel, among others.
The PU segment is primarily dominated by three major players, i.e., Asian Paints, ICA Pidilite Private Limited, and
SIRCA. There are several other small players. However, together, they will account for less than 10-15% of the
market.
The industry has also witnessed consolidation in the past few years. For instance, Pidilite Industries has formed an
equal joint venture company, ICA Pidilite Pvt Ltd, with Industria Chimica Adriatica Spa (ICA) of Italy. Nippon Paint
(India) has partnered with Italy´s IVM Chemicals, a world-leading wood coatings company, to accommodate the
rapidly changing technologies in the application areas and to increase their market share.
Product portfolios of some key players
Table 11: Wood coatings key players and their product offerings
Melamine31%
Polyurethane (including acrylic)
49%
Polyester5%
Water based4%
Nitrocellulose7%
French polish (Varnish)4%
Player name Products
Asian Paints (market leader)
Woodtech Polyester Gold, Emporio PU, Woodtech Insignia, Woodtech PU
Palette, Woodtech Aquadur PU, Woodtech PU, Woodtech Melamyne,
Woodtech Touchwood, Woodtech GloMax
ICA Pidilite Pvt Ltd Water-based for interiors and exteriors, bio water-based coatings, PU and
acrylic coatings, polyester coatings, fire and stain -retardant coatings, etc.
SIRCA Water-based for interiors and exteriors, Italian PU and Indian PU, polyester,
wood stains, etc.
Kansai Nerolac Exterior PU Gloss, Exterior PU Matt, PU Sealer, Wonderwood melamine

35
Berger Paints Woodkeeper 1k PU, Woodkeeper wood stain, Woodkeeper melamine, etc.
MRF Vapocure paints- Woodcoat interior and exterior, PU and melamine
Argentina | China | Hong Kong | India | Poland | Singapore | UAE | UK | USA
CRISIL Limited: CRISIL House, Central Avenue, Hiranandani Business Park, Powai, Mumbai – 400076. India
Phone: + 91 22 3342 3000 | Fax: + 91 22 3342 3001 | www.crisil.com
About CRISIL Limited
CRISIL is a leading, agile and innovative global analytics company driven by its mission of making markets function better.
It is India’s foremost provider of ratings, data, research, analytics and solutions with a strong track record of growth, cul ture of
innovation, and global footprint.
It has delivered independent opinions, actionable insights, and efficient solutions to over 100,000 customers through busines ses
that operate from India, the US, the UK, Argentina, Poland, China, Hong Kong and Singapore.
It is majority owned by S&P Global Inc, a leading provider of transparent and independent ratings, benchmarks, analytics and
data to the capital and commodity markets worldwide.
About CRISIL Research
CRISIL Research is India's largest independent integrated research house. We provide insights, opinion and analysis on the
Indian economy, industry, capital markets and companies. We also conduct training programs to financial sector professionals
on a wide array of technical issues. We are India's most credible provider of economy and industry research. Our industry
research covers 86 sectors and is known for its rich insights and perspectives. Our analysis is supported by inputs from our
large network sources, including industry experts, industry associations and trade channels. We play a key role in India's fixed
income markets. We are the largest provider of valuation of fixed income securities to the mutual fund, insurance and banking
industries in the country. We are also the sole provider of debt and hybrid indices to India's mutual fund and life insurance
industries. We pioneered independent equity research in India and are today the country's largest independent equity research
house. Our defining trait is the ability to convert information and data into expert judgments and forecasts with complete
objectivity. We leverage our deep understanding of the macro -economy and our extensive sector coverage to provide unique
insights on micro-macro and cross-sectoral linkages. Our talent pool comprises economists, sector experts, company analysts
and information management specialists.
CRISIL Privacy
CRISIL respects your privacy. We may use your contact information, such as your name, address, and email id to fulfil your
request and service your account and to p rovide you with additional information from CRISIL. For further information on
CRISIL’s privacy policy please visit www.crisil.com/privacy.
Disclaimer
CRISIL Research, a division of CRISIL Limited (CRISIL) has taken due care and caution in preparing this Report based on the
information obtained by CRISIL from sources which it considers reliable (Data). However, CRISIL does not guarantee the
accuracy, adequacy or completeness of the Data / Report and is not responsible for any errors or omissions or for the results
obtained from the use of Data / Report. This Report is not a recommendation to invest / disinvest in any company covered in t he
Report. CRISIL especially states that it has no financial liability whatsoever to the subscribers/ users/ transmitters/ distributors of
this Report. CRISIL Research operates independently of and does not have access to information obtained by CRISIL’s Ratings
Division / CRISIL Risk and Infrastructure Solutions Limited (CRIS), which may, in their regular operations, obtain information of
a confidential nature. The views expressed in this Report are that of CRISIL Research and not of CRISIL’s Ratings Division /
CRIS. No part of this Report may be published / reproduced in any form without CRISIL’s prior written approval