
Market & Social Research
47
Market & Social Research June 2014 • Volume 22 Number 1 • ISSN 2202-2732 CONTENTS Ethnography-photography: A visual approach to segmentation and living standard evaluation in emerging markets ..................................................... Page 9 Steven Greenland A comparison of group-based research methods ....................................... Page 22 Melanie Randle, Hugh Mackay and Dorothy Dudley Researching the respondents ....................................................................... Page 39 Karen Johnston and Joanne Ryan
-
Upload
khangminh22 -
Category
Documents
-
view
0 -
download
0
Transcript of Market & Social Research

Market & Social Research
June 2014 • Volume 22 Number 1 • ISSN 2202-2732
CONTENTS
Ethnography-photography: A visual approach to segmentation and living standard evaluation in emerging markets ..................................................... Page 9 Steven Greenland
A comparison of group-based research methods ....................................... Page 22 Melanie Randle, Hugh Mackay and Dorothy Dudley
Researching the respondents ....................................................................... Page 39 Karen Johnston and Joanne Ryan
4Powerful advocacy AMSRS is committed to protecting the interests of the Profession by promoting the use of market and social research to government. AMSRS works with AMSRO on this through the Research Industry Council of Australia. The AMSRS also represents the profession when it is threatened by legislation, ill-informed comment or by the unethical practices of others.
www.amsrs.com.au
Market & Social ResearchJune 2013 • Volume 21 Number 1 • ISSN 1832 7362
CONTENTSThe challenges of market research in emerging markets: .......................... Page 9
A practitioner perspective from Sub-Saharan Africa.Steven Greenland and Kwamena Kwansah-Aidoo
Response mode, response duration and survey bias: ................................ Page 23
results from the 2010 Australian National Infant Feeding Survey. Pramod Adhikari
The who, when, where and how of Smartphone research ........................... Page 29
Brian Fine and Con Menictas
The ‘unfocused’ group discussion technique. .............................................. Page 47
Hugh Mackay
ISSN: 1839-4256ISSN: 1839-4256
London calling
ResearchNews
Australian Market & Social Research Society | Volume 29 | Number 7 | August 2012
6Stay informed Research News and Market & Social ResearchResearch News is the market and social research monthly magazine that informs you about events, ideas and challenges within the industry and the profession, both here and abroad. Market & Social Research (previously AJMSR) is the official journal of the AMSRS and delivers evidence-based findings on research.
AM
SR
S D
irectoryand Yearbook
2013 AMSRS Directory and Yearbook 2013
www.amsrs.com.au
7Market your business in the AMSRS Directory & Yearbook 300+ companies advertise their services in this comprehensive online and annual hardcopy directory which is circulated to members and clients and contains everything you need to know about the industry.
9
8Connect locally and globally There is an online AMSRS LinkedIn community of 2000+ members which is a dynamic forum for discussion and debate. The AMSRS community is linked to 10 Asian market research associations through their founding partnership with Asia Pacific Research Committee (APRC) and to 38 associations globally through their strategic partnership with the Global Research Business Network (GRBN).
Top 10 reasons to be an AMSRS member
Benefits of membership
1Professional standing & credibility Membership of the Society brings you into the body of the profession and is a sign to others that you take your role as a market and/ or social research professional seriously. Full members can use the postnominals MMSRS and all members can use the pictured Member Mark to promote their membership of the Society.
> SUMMER SCHOOL> WINTER SCHOOL
3Relevant Professional DevelopmentProvides its members with access to relevant and up-to-date professional development including courses, webinars, seminars and workshops. The AMSRS also runs a Summer School and Winter School each year which provides another 12 course options for members.
2Member discounts for conferences, courses, seminars, webinars & insurance
AMSRS members receive substantial discounts to Society and affiliated association events. AMSRS members also receive significant insurance discounts through our insurance partner Parmia.
10Exclusive networking opportunities There are 6 Special Interest Groups that operate within the membership. Each state division provides face to face networking opportunities for members.
CLIENTS NETWORKING
GROUP
CNGINDEPENDENT RESEARCHERS
GROUP
IRGONLINE
SERVICES NETWORK
OSN
QUALITATIVE RECRUITERS
GROUP
QRGYOUNG
RESEARCHERS NETWORK
YRNSOCIAL
RESEARCH NETWORK
SRN
5Professional recognition QPMR Qualified Practising Market Researcher (QPMR) is the industry’s professional accreditation scheme that provides recognition to those who have both the core body of knowledge required to undertake market and social research and significant experience in the industry.
Adherence to Professional StandardsAMSRS members adhere to a Code of Professional Behaviour that demonstrates ethical behaviour to clients and consumers. Members have access to a toll-free ethics line to answer any ethical questions and dilemmas.
3Market & Social Research | Volume 22, Number 1, June 2014
MARKET & SOCIAL RESEARCH
Editor
Associate Professor David Bednall - Deakin University - AMSRS member and Fellow
Editorial Advisory Board
Susan Ellis - Melbourne Business School
Dr. Marie-Louise Fry - Griffith University
Philip Gendall - University of Otago
Lester W. Johnson – AMSRS member and Fellow, Melbourne Business School
Pascale Quester - University of Adelaide
Liane Ringham - Inside Story – AMSRS member and Fellow
John Rossiter - University of Wollongong – AMSRS member and Fellow
Geoffrey Soutar - University of Western Australia – AMSRS Life member
Jill Sweeney - University of Western Australia – AMSRS member
Market & Social Research is published by the Australian Market & Social Research SocietyCopyright 2014. ISSN 2202-2732
Australian Market & Social Research SocietyLevel 13 Queen StreetGlebe NSW 2037Australia
Phone: +61 (0) 2 9566 3100Fax: +61 (0) 2 9571 5944Email: [email protected]: www.amsrs.com.au
4Market & Social Research | Volume 22, Number 1, June 2014
Market & Social Research
The Market & Social Research is the official journal of the Australian Market & Social Research Society (AMSRS). It is published twice a year in June and December.
All members of the AMSRS receive a complimentary copy to Market & Social Research as part of their membership.
SUBMISSIONSOriginal papers are invited. There is an editorial policy to ensure that a mix of theoretical and practical papers is presented. Papers should be of some relevance to at least a segment of the population of practicing market or social researchers. Purely academic marketing papers are probably more suitable elsewhere. All papers are refereed by independent assessors.
Authors are required to supply their articles electronically in Microsoft Word format, doubled spaced with article references in Harvard referencing style. Diagrams and figures also need to be provided electronically. In writing papers, authors should consider the style of articles in previous issues.
All editions of Market & Social Research are referenced by EBSCO, an on-line database of journal articles accessible by researchers worldwide. As a writer we need your permission to enable this to occur. Could you please indicate your agreement to your article being referenced in this way when you submit it for publication.
Contributors of paper will receive an electronic copy of the issue in which their article appears.
Market & Social Research is an open publication. All expressions of opinion are published on the basis that they are not to be regarded as expressing the official opinion of the Australian Market & Social Research Society. The AMSRS accepts no responsibility for the accuracy of any opinions or information contained in this publication and readers should rely on their own enquiries in making decisions.
All papers for submission should be forwarded to:Dr. David Bednall, Associate ProfessorSchool of Management and MarketingFaculty of Business and LawDeakin University (Burwood)221 Burwood HighwayBurwood VIC 3125 AustraliaEmail: [email protected]
CONTACT DETAILSAll enquiries regarding Market & Social Research matters should be directed to:
Market & Social Research publicationAustralian Market & Social Research SocietyLevel 1, 3 Queen StreetGlebe NSW 2037 AustraliaPhone: +61 (0) 2 9566 3100Fax: +61 (0) 2 9571 5944Email: [email protected]
Copies of the articles in Market & Social Research may be made for personal or classroom use, without charge and with the publisher’s consent. Copying for any other purpose must first be approved by the publisher. AMSRS recognises the contribution of Associate Professor David Bednall and Deakin University.

5Market & Social Research | Volume 22, Number 1, June 2014
Advice to Authors1
This journal publishes refereed:1. Research articles2. Research Notes3. Case Studiesand opinion pieces (non-refereed).
SUBMISSIONSSubmissions are only accepted by electronic means. Please see www.amsrs.com.au for links to the ScholarOne system.
LENGTHResearch Article submissions should generally not exceed 6,500 words of text, excluding figures, tables, and references. Appendices are not encouraged.
Research Notes should generally be under 4,000 words of text, excluding figures, tables, and references. Appendices are not encouraged. They may be shorter reports of single findings, useful extensions or replications of previous research, or other additions to the literature that warrant publication without the more extended theoretical development or detailed analysis characteristic of regular articles.
Case studies should generally be under 4,000 words of text, excluding figures, tables, references and appendices. Appendices may be included if they contain reports of studies or other data used to support the case.
RESEARCH ARTICLE STRUCTURE These guidelines are for regular research article submissions. Authors who want to use a different structure are advised to contact the editor before submission. Innovation is encouraged so long as there is a clear benefit to the readers of the article.
Subdivision - numbered sections Divide your article into clearly defined and numbered sections. Subsections should be numbered 1.1 (then 1.1.1, 1.1.2, ...), 1.2, etc. (the abstract is not included in section numbering). Use this numbering also for internal cross-referencing: do not just refer to "the text". Any subsection may be given a brief heading. Each heading should appear on its own separate line.
Introduction State the objectives of the work and provide an adequate background, avoiding a detailed literature survey or a summary of the results.
Theory/Conceptual A Theory section should extend, not repeat, the background to the article already dealt with in the Introduction and lay the foundation for the research. Empirical studies should conclude this section with hypotheses or research questions. Non-empirical papers are encouraged to expand this section to give adequate background and treatment of the issues.
Material and methods Where the work is an empirical study, provide sufficient detail to allow another researcher to reproduce the study. Methods already published should be indicated by a reference. Only relevant modifications should be described.
Results and DiscussionResults should be clear and concise. Discussion should explore the significance of the results of the work, not repeat them. A combined Results and Discussion section is often appropriate. Avoid extensive citations and discussion of published literature.
Conclusions The main conclusions of the study should be presented in a short Conclusions section. Implications for further research, limitations and implications of the research for industry practice must be given.
Appendices Appendices are not encouraged.
Table and Figure TitlesThese should appear above the Table or Figure in bold and be numbered consecutively. Supply titles separately, not embedded in the figure or table. Titles should be brief (preferably under 10 words)
Math formulae Present formulae using the Word equation editor. Number consecutively any equations that have to be displayed separately from the text (if referred to explicitly in the text).
Footnotes Footnotes should be avoided except in Tables and Figures. Indicate each footnote with a superscript lowercase letter.
1 These guidelines have been extensively adapted from the submission guidelines for the Australasian Journal of Marketing, see http://www.elsevier.com/wps/find/journaldescription.authors/717638/authorinstructions and Public Opinion Quarterly, see http://www.oxfordjournals.org/our_journals/poq/for_authors/general.html
6Market & Social Research | Volume 22, Number 1, June 2014
ESSENTIAL TITLE PAGE INFORMATION
TitleConcise and informative. Titles are often used in information-retrieval systems. Avoid abbreviations and formulae.
Author names and affiliationsWhere the family name may be ambiguous (e.g., a double name), please indicate this clearly. Present each author’s affiliation (where the actual work was done) after their names.
Corresponding authorClearly indicate who will handle correspondence at all stages of refereeing and publication, also post-publication. Ensure that your e-mail address and the complete postal address are provided.
ABSTRACT A concise and factual abstract is required. The abstract should state briefly the purpose of the research, the principal results and major conclusions. An abstract is often presented separately from the article, so it must be able to stand alone. For this reason, References should be avoided, but if essential, then cite the author(s) and year(s). Also, non-standard or uncommon abbreviations should be avoided, but if essential they must be defined at their first mention in the abstract itself.
KEYWORDS Immediately after the abstract, provide a maximum of 6 keywords, using UK English spelling and avoiding general and plural terms and multiple concepts (avoid, for example, "and", "of").These keywords will be used for indexing purposes.
ABBREVIATIONS Define abbreviations that are not standard in this field in the text. Ensure consistency of abbreviations throughout the article.
ACKNOWLEDGEMENTS Collate acknowledgements in a separate section at the end of the article after the references and do not, therefore, include them on the title page, as a footnote to the title or otherwise. List here those individuals who provided help during the research (e.g., providing language help, writing assistance or proof reading the article, etc.).
FORMATThe default is single spaced, A4 format with 2.54cm margins on each side. The use of colour is acceptable for graphics and figures, but should otherwise be used
sparingly. Its use is intended to make each article easier to follow rather than to cater to aesthetics or fashion. It is anticipated that case studies will include colour photographs and by arrangement, videos.
USE OF WORD PROCESSING SOFTWARE Documents should be submitted in Microsoft Word format. Keep the layout of the text as simple as possible. Please do not use the word processor's options to justify text or to hyphenate words. Please do not use multiple columns of text. However, do use bold face, italics, subscripts, superscripts etc. To avoid unnecessary errors you are strongly advised to use the Word "spell-check" and "grammar-check" functions. The Market & Social Research uses UK English as its preferred style for spelling.
When preparing tables, if you are using a table grid, use only one grid for each individual table and not a grid for each row. Only horizontal lines should be used in Tables. Figures should be embedded in the document. If graphics are used, please also provide a separate file with your submission. If you are not the copyright owner of material you have included, you must evidence your permission to use this material.
ARTWORK
Electronic artwork • Make sure you use uniform lettering and sizing of
your original artwork. • Save text in illustrations as "graphics" or enclose
the font. • Only use the following fonts in your illustrations:
Arial, Courier, Times, Symbol. • Number the illustrations according to their
sequence in the text. • Use a logical naming convention for your artwork
files. • Provide captions to illustrations separately. • Produce images near to the desired size of the
printed version. • Submit each figure as a separate file.
Please do not: • Supply files that are optimised for screen use (like GIF,
BMP, PICT, WPG); the resolution is too low; • Supply files that are too low in resolution; • Submit graphics that are disproportionately large
for the content.
COLOUR ARTWORK Please make sure that artwork files are in an acceptable format (TIFF, EPS or MS Office files) and with the correct resolution.
7Market & Social Research | Volume 22, Number 1, June 2014
REFERENCES The use of Endnote™ bibliographic software is recommended. The APA Sixth Edition is the standard used for referencing.
Citation in text Please ensure that every reference cited in the text is also present in the reference list (and vice versa). Any references cited in the abstract must be referenced in full. Unpublished results and personal communications are not recommended in the reference list, but may be mentioned in the text. If these references are included in the reference list they should follow the standard reference style of the journal and should include a substitution of the publication date with either "Unpublished results" or "Personal communication" Citation of a reference as "in press" implies that the item has been accepted for publication.
Web references As a minimum, the full URL should be given and the date when the reference was last accessed. Any further information, if known (DOI, author names, dates, reference to a source publication, etc.), should also be given. Web references should be included in the reference list.
Reference style Text: Citations in the text should follow the referencing style used by the American Psychological Association. You are referred to the Publication Manual of the American Psychological Association, Sixth Edition, ISBN 978-1-4338-0561-5. Journal names should not be abbreviated. Use journal issue numbers only where these are necessary to identify the source of the article.
List: references should be arranged first alphabetically and then further sorted chronologically if necessary. More than one reference from the same author(s) in the same year must be identified by the letters "a", "b", "c", etc., placed after the year of publication.
Examples: Reference to a journal publication:Brennan, M. & Charbonneau, J. (2010). The effect of an incentive (chocolate) and a replacement questionnaire on sample composition, item non-response and response distribution in a mail survey. Australasian Journal of Market and Social Research, 18(2), 19-31.
Reference to a book:Strunk, W., Jr., & White, E. B. (1979). The elements of style. (3rd ed.). New York: Macmillan, (Chapter 4).
Reference to a chapter in an edited book:Mettam, G. R., & Adams, L. B. (1994). How to prepare an electronic version of your article. In B. S. Jones, & R. Z. Smith (Eds.), Introduction to the electronic age (pp. 281-304). New York: E-Publishing Inc. Submission checklist The following list will be useful during the final checking of an article prior to sending it to the journal for review. Please consult this Guide for Authors for further details of any item: • One Author designated as corresponding Author: • E-mail address • Full postal address • All necessary files have been uploaded • Keywords • All figure and table titles • All tables (including title, footnotes) • Manuscript has been spellchecked and grammar-
checked • References are in the correct format • All references mentioned in the Reference list are
cited in the text, and vice versa • Permission has been obtained for use of
copyrighted material from other sources (including the Web)
The use of a copy editor to check the text for completeness and readability is advised.
If you have further queries, please contact the editor prior to submission.

8Market & Social Research | Volume 22, Number 1, June 2014
Keeping Up
Our journal has a focus on method papers and practices in contemporary market and social research. One of its functions is to help keep readers current, to keep up with contemporary trends in our field. But just how do people keep up? There are so many developments in data collection, sampling and analysis in both qualitative and quantitative fields, not to mention revolutions outside our direct field in customer analytics. QPMR requires some reading and updating of skills. Training forums like the AMSRS Summer School, ACSPRI courses and the Advanced Research Forum of the AMA can play a role. But who attends and how does this trickle down to our academic colleagues and researchers in agencies? Do people read journals regularly to keep up – or is it more opportunistic when a paper or proposal needs to be prepared?
Within academic faculties and agencies the craft approach often remains. Established protocols for research design, for example in scale design and administration, question formats and the conduct of groups become the norm within an organisation. So much of this is taken for granted. When people change agencies it therefore is often a surprise that “we do things differently around here.” As the recent debates over response rates, multimode surveys and revisiting quota sampling techniques illustrate, “it is becoming broke and we shall need to fix it.” So how should this world of practice collide with the increasingly complex world of method? Our readers are invited to contribute a commentary on how they are “Keeping Up” and how we might best do it.
David BednallEditorJune 2014

RE
FE
RE
ED
AR
TIC
LE
9Market & Social Research | Volume 22, Number 1, June 2014
1. INTRODUCTIONVisual research is embraced by numerous disciplines and over the past decade its use has grown significantly (Azzarito, 2013). Yet in marketing, visual research has been somewhat overlooked and its value as a distinct methodology is yet to be fully realised. This paper presents a visual ethnographic-photographic exploratory approach for generating useful insights into consumer segments and living conditions in an emerging market that would not be forthcoming from more traditional research methods.
Emerging markets present enormous growth opportunities for organisations that best appreciate their consumers (Baack & Boggs, 2008). However, they also pose complex challenges for marketing research (Craig & Douglas, 2005); particularly in relation to segmenting consumers. Western segmentation research approaches, used widely in emerging markets, frequently provide flawed or incomplete comprehension. This is due to ignorance of the specific characteristics of developing countries, as well as the limitations of the dominant positivistic methodologies.
The aim and intended contribution of this research is to offer fresh insights into the value of visual methods in researching emerging markets. A secondary aim is to
present a household living conditions categorisation, based upon the application of this approach.
Initially the paper discusses the challenges associated with segmentation research in emerging markets and introduces visual research as a way to overcome these. The specific visual research method follows, describing how images were generated and analysed for a cross-section of households in Nairobi, Kenya. Results and discussion are then presented.
2. EMERGING MARKETS SEGMENTATION RESEARCH CHALLENGESEmerging markets have complex social structures that are frequently harder to investigate and understand than those in more developed countries (Greenland & Kwansah-Aidoo, 2012). Kenya, for example, has one of the world’s largest rich-poor divides, as well as more than 40 tribal groups in a population of over 40 million (Kenya National Bureau of Statistics, 2013).
2.1 Secondary research challengesA key challenge for organisations operating in such regions is gaining the information required for effective market segmentation. Secondary data are particularly pertinent, since international marketing managers are
Ethnography-photography: A visual approach to segmentation and living standard evaluation in emerging markets Steven Greenland, Swinburne University of TechnologyLez Rayman-Bacchus, London Metropolitan University
Corresponding Author:Dr Steven Greenland, Faculty of Business & Enterprise, Swinburne University of Technology,PO Box 218, Hawthorn, VIC 3122 Australia Email: [email protected]
ABSTRACTThis paper presents a visual research approach for segmenting emerging markets and investigating the consumer segments therein, on the basis of observed household living conditions. The study contributes to the paucity of visual research in the marketing arena, and reveals how ethnography-photography can serve as a viable alternative for overcoming some of the challenges associated with using traditional segmentation research in developing countries. Around 10-25 photographs were taken of the interiors, exteriors and surroundings, from a cross-section of 240 households from Nairobi, a major Sub-Saharan African city. The visual data were processed by creating photo montages for each household, which were then ranked and clas-sified according to the observed living conditions. A visual content analysis of this montage sequence enabled households to be categorised into broad living condition groups. Many of different household characteristics used to define and differentiate one group from the next are not considered by traditional segmentation research. This paper therefore highlights the potential of ethnographic-photographic research to support traditional segmentation techniques and enhance understanding of consum-ers in emerging markets.
RE
FE
RE
ED
AR
TIC
LE
10Market & Social Research | Volume 22, Number 1, June 2014
often less familiar with emerging markets and must therefore rely more heavily on available information sources to inform their segmentation decisions. However, secondary sources are often sparse, less systematically compiled and less accurate than those for developed countries (Craig & Douglas, 2005; Terpstra & Sarathy, 2000). Furthermore, the available market data are often inadequate (Craig & Douglas, 2005), with accuracy, currency and comparability issues (Aaker, Kumar, Day, Lawley & Stewart, 2007).
Accurate and reliable segmentation requires detailed understanding of the overall market, so that appropriate homogenous groups within can be identified, evaluated and targeted. However, in many emerging markets this broad understanding is difficult to obtain. While extensive market research has been conducted by both development and commercial organisations, those concerned with aid and development tend to focus on segments suffering acute poverty, while commercial research tends to focus on those with spending power. Few studies available investigate the full spectrum of social strata, and so available market information is frequently biased, or at the very least presents incomplete perspectives on the societal make-up of the emerging market.
2.2 Primary research challengesTraditional western market research methodologies are commonly used in emerging markets (Davis & Young, 2002). This is logical in terms of the economies of scale achieved in research design, the need for research consistency in order to make cross-market comparisons, in addition to the aforementioned
inadequacy of available secondary resources, as well as the international manager’s familiarity with traditional techniques and limited experience of local markets. This last point is significant, since the selection of appropriate target segments is determined by the primary research outputs in conjunction with the marketing manager’s perceptions of the market (Wedel & Kamakura, 2002). However, researchers evaluating the approaches used in emerging markets consistently conclude that western methodologies are not directly transferable (e.g. Craig & Douglas, 2005; Greenland, Coshall & Combe, 2006; Hoskisson, Eden, Lau & Wright, 2000; Reynolds, 2000). Moreover, duplicating research methodologies across borders significantly affects the nature and quality of data generated (Malhotra & Birks, 2003).
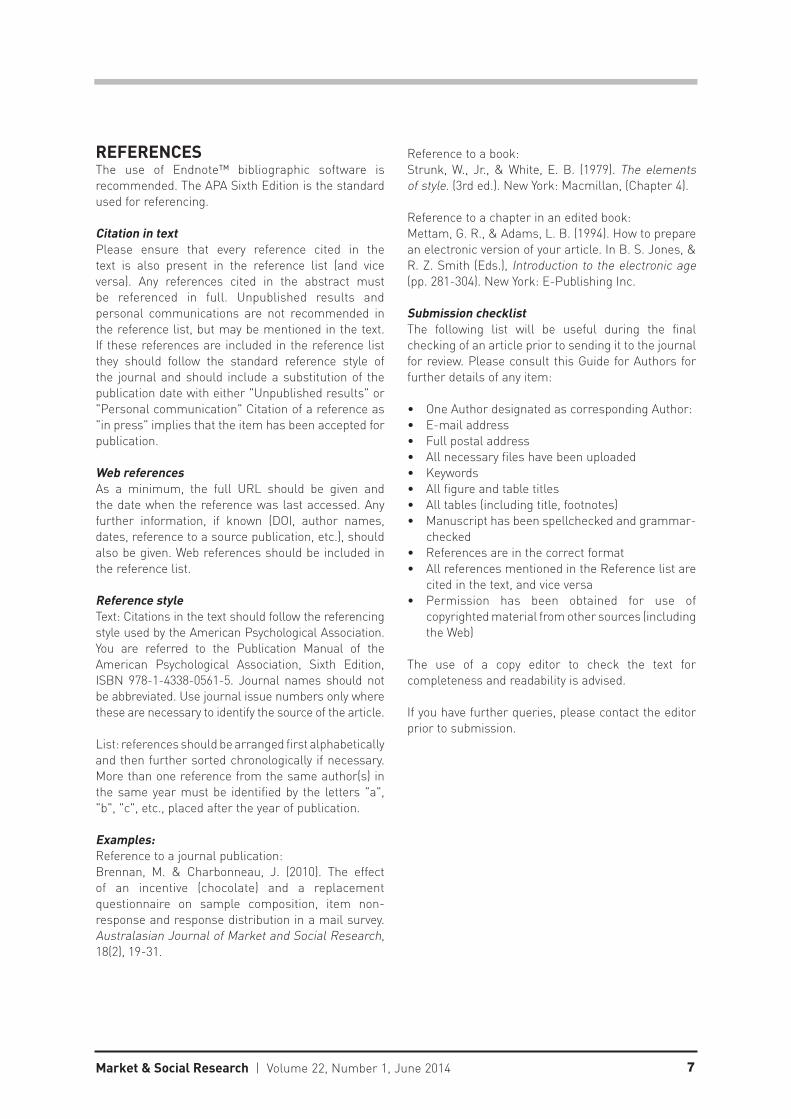
While the value of observational ethnography has been recognised (e.g. Arnould & Wallendorf, 1994), segmentation research in emerging markets most frequently involves surveys based upon geodemographics, income, socioeconomic status, residential classification and product ownership. However, such traditional methods are not always appropriate (Steenkamp & Hofstede, 2002). For instance, geodemographic approaches assume that consumers living in a particular area will share similar characteristics and live in similar types of accommodation, enabling residential neighbourhoods to be categorised according to postcode (McGoldrick, 2002). Yet emerging markets are often characterised by lax or absent planning restrictions, as well as dynamic and shifting populations – in Nairobi, it is therefore common to find many different types of homes and distinct groups living side by side (see Image 1).
IMAGE 1
Aerial image of a location adjacent to Nairobi’s Wilson Airport, showing the close proximity of an array of different housing types and living conditions.

RE
FE
RE
ED
AR
TIC
LE
11Market & Social Research | Volume 22, Number 1, June 2014
Classification on the basis of household products consumed has proven problematic in the dynamic emerging market environment, since product ownership changes quickly and so this living standard measurement (LSM) system becomes rapidly outdated (Rayman-Bacchus & Greenland, 2007). Similarly, socioeconomic classification systems based upon occupation have been inconsistent predictors of living conditions, resulting in differences of opinion among researchers and practitioners regarding emerging market structure and composition. Steenkamp and Hofstede (2002) related the problems of applying these sociodemographic variables across international borders to issues of calibration equivalence, which supports Mangaliso and Lewis’s (2012) observations that traditional research approaches ignored the fundamental situational differences posed by emerging markets.
Segmentation research in emerging markets is an important area requiring further consideration, particularly in relation to the preliminary exploratory stages that assist in identifying variables to include in models (Wedel & Kamakura, 2002). The traditional methods most frequently employed in strategic marketing research have been largely positivist in nature, seeking to provide quantitative rigour, rather than the deeper understanding afforded by interpretivist approaches. Craig and Douglas (2005) confirmed that creative research approaches are needed in emerging markets, while Choudhry (1986) observed that international researchers would gain more insight to both contextual and substantive aspects of socioeconomic life using direct observational methods. Similarly, Mangaliso and Lewis (2012) recommended multiple approaches for researching the diverse emerging market environments, and in particular inductive research grounded in qualitative analysis.
The research design in this study focuses on the exploratory segmentation research stage, and heeds the advice of Bansal and Corley (2011) who encouraged using a wide range of non-traditional qualitative data sources such as photography. Indeed, the complexity of emerging markets and the inadequacies of available secondary sources make a visual approach particularly appropriate for exploratory research seeking to identify aspects that might be included in subsequent quantitative segmentation research phases.
3. VISUAL RESEARCH CHALLENGES Visual research is common in anthropological, sociological and ethnographical studies (Lemelin et al., 2013). Indeed, the value of photography was recognised by some of the earliest researchers of people in
their environments, such as Malinowski’s study of Trobriand Islanders a century ago (Malinowski 1932). More recent influential works on visual methodologies (e.g. Banks, 2001; Rose, 2007) have described an expanding volume of image driven research. This growth has largely been within the same disciplines that have traditionally used images (Harper, 2005 and Pink, 2004). However, the merits of visual research are also being acknowledged in other fields (Azzarito, 2013) including business and management (Bell & Davison, 2013). Nevertheless, its use in these subjects remains comparatively rare (Bell & Davison, 2013; Rose, 2007). For example, consumer marketing research frequently uses images as focal points for evaluating promotion and advertising, product and packaging, retail design, and merchandising. However, few studies have used images as the key data collection component. As Schrat, Warren and Höpfl (2012) observed, such visual research, where photographs and images do not merely serve an illustrative function but rather form the focus of the data collection and analysis, presents “a new way of thinking about interpretative methods” (p. 1). In this regard, the role and value of visual research in marketing is yet to be fully realised.
As with any method of investigation, visual research carries its own strengths and weaknesses (Rose, 2007). In terms of disadvantages, there are the usual positivistic criticisms levelled at all qualitative research in relation to perceived validity, generalisability and reliability of results (Denzin & Lincoln, 2005). Criticism also relates to subjectivity and that analysis relies on the qualitative researcher’s interpretation of the key issues identified from a mass of descriptive information (Greatorex, 1997).
Specific to visual research, there has been “limited guidance on how visual data should be analysed and interpreted, which is problematic, because this is one of the biggest challenges that visual researchers often face” (Bell & Davison, 2013, p.174). Belk and Kozinets (2005) also noted that “much observational data have been to a large extent left on the table because there have been no convenient, reliable, and cost effective ways to capture and analyse such data” (p. 128).
Furthermore, with visual methods there is a danger of the images becoming the all-encompassing focus of attention, at the expense of the analytical framework used to interpret them. There is also the trap of apparent transparency and naive realism (Pink, 2001). That is, images are presented as objectively conveying reality and proof of something (Barthes, 1977), obscuring potentially important cultural and historical contexts, as well as the role of the researcher as author of the
RE
FE
RE
ED
AR
TIC
LE
12Market & Social Research | Volume 22, Number 1, June 2014
image (Bell, 2008). At the same time, the audience is assumed to uncritically receive the (apparently) self-evident message conveyed.
Despite these limitations, the increased use of visual research is testament to the growing recognition of its value. To some extent, this has been encouraged by technology innovations that have advanced capabilities in terms of digitally capturing, storing and organising images (Harper, 2005). The growing volume of published visual research has also established methodological guidance for other researchers. Visual methods provide a means of data collection and analysis that is less restrictive and may be less prone to interviewer bias, and thereby potentially generate more valid data than other methods (Ray & Smith, 2012). Not only can photos depict factual content (Burns & Bush, 2006), but they also provide unique benefits, which include recording details too complex to communicate verbally. Images may also be analysed and revisited post-data collection, so aspects not initially considered to be important at the data capture stage can still be subsequently examined.
4. RESEARCH METHODOLOGY
While acknowledging the limitations above, as a method for offering fresh insight to emerging market complexities, visual research methods are particularly appropriate for the exploratory phases of segmentation research. This research design was shaped around previous grounded theory-based visual studies (Konecki, 2011; Suchar, 1997), as well as recent reviews of visual methods by Bell and Davison (2013) and Ray and Smith (2012). However, the exploratory nature of this research and the lack of previous studies with similar marketing objectives meant that aspects of the methodology, in particular the analytical stages, evolved during the course of the study.
Given the sensitive nature of capturing and using household images, the research process adhered to the European Society for Opinion and Marketing Research strict guidelines (ESOMAR, 2012).
4.1 Participant sample and recruitmentA total of 253 households were recruited during the data collection phase. The sample was designed to capture a representative cross-section of households from Nairobi, Kenya’s capital. Its composition was guided by secondary market information, including the recent census and feedback from board members of Kenya’s Market and Social Research Association
(MSRA) – senior research managers living in Nairobi and working in Africa’s market research industry. Their perspectives yielded both their professional knowledge of segmentation research and also their experience as participants in Nairobi’s socioeconomic structure.
The sample reflected the residential and socioeconomic composition of Nairobi’s population. Once broad Nairobi locations were identified, specific streets from which to draw the sample were randomly selected. Individual households were then recruited on a door-to-door basis, with interviewers commencing recruitment at random starting points along the selected streets. Participants were the male or female heads of households who also provided permission for images to be used in subsequent publications.
4.2 Data collectionTo enhance response rates, all data were captured by experienced local Kenyan market research interviewers working for research agencies that were MSRA corporate members and included some of the largest global market research companies. All interviewers received training in recruiting participants, interviewing and taking photographs, and were closely supervised and monitored in the field. Clear instructions for capturing images of the households and their associated environmental living conditions were provided. Ray and Smith (2012) referred to these as the “structured shooting script” (p.292). The interviewers were instructed to take photographs of the household’s exterior, the various rooms and contents, including cooking facilities, lighting and heating sources, groceries, household products, as well as the utilities. Between 10 and 25 digital photographs were collected for each participating household – the higher numbers of images were required for larger homes.
While video could have been used, static photographs were selected given the relative ease with which these can be produced, processed, analysed and published (Ray & Smith, 2012). Various image production approaches could also have been adopted. For instance, some previous studies used researcher-only photograph production, while others relied solely on participant-only photographic production. This study adopted a hybrid approach described by Ray and Smith (2012) as “joint researcher–participant photographic production” (p. 296). While there were set instructions for image capture, a certain degree of flexibility was maintained, with interviewers asking participants about factors affecting their living
RE
FE
RE
ED
AR
TIC
LE
13Market & Social Research | Volume 22, Number 1, June 2014
conditions, which sometimes prompted the capture of various security, water supply, refuse collection and sanitation related images.
Few visual researchers rely exclusively on images (Bell & Davison, 2013), and Ray and Smith (2012) confirmed the collection of photographs in conjunction with a participant interview as commonplace in visual research. Such additional information assisted in the image classification and interpretation stages. Therefore, in addition to the photographs, a brief questionnaire was administered to participants to capture details of the household’s location, residential type and socioeconomic class.
4.3 Data processing and analysisThe approach for processing and analysing the images was steered by the relevant literature and was highly qualitative in nature. It followed a grounded theory inductive approach (Denzin & Lincoln, 2005; Flick, 2002), which is common in ethnographic observation type studies (Saunders, Lewis & Thornhill, 2009). However, since there were few examples of similar previous studies that generated a visual database of this scale, the analytical procedure evolved during the course of the research.
Images from each household were saved to individual folders labelled with a unique case identification number – the associated questionnaire data were also saved to these folders. This supplementary information was used as a reference for providing the context and situation of the household, rather than the medium for classification. An image montage of the photographs for each household was then created. In common with other studies using photographs, viewing the images as thumbnail files proved useful in this regard (Harper, 2005).
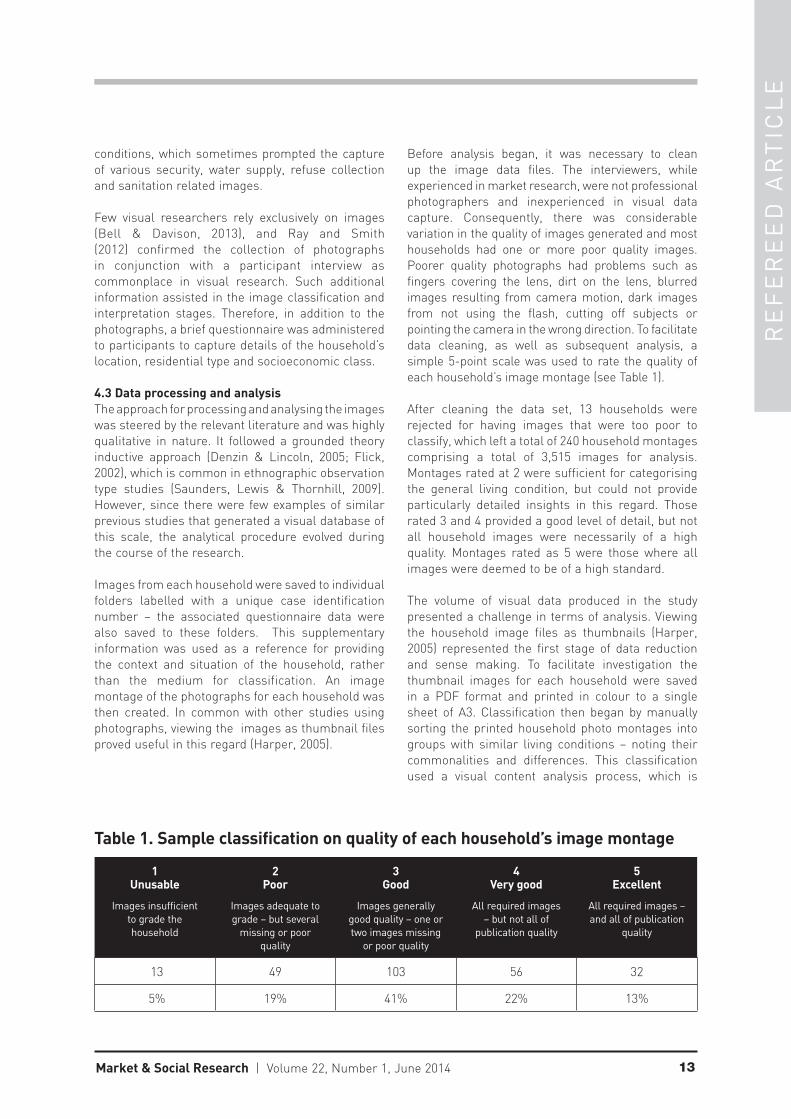
Before analysis began, it was necessary to clean up the image data files. The interviewers, while experienced in market research, were not professional photographers and inexperienced in visual data capture. Consequently, there was considerable variation in the quality of images generated and most households had one or more poor quality images. Poorer quality photographs had problems such as fingers covering the lens, dirt on the lens, blurred images resulting from camera motion, dark images from not using the flash, cutting off subjects or pointing the camera in the wrong direction. To facilitate data cleaning, as well as subsequent analysis, a simple 5-point scale was used to rate the quality of each household’s image montage (see Table 1).
After cleaning the data set, 13 households were rejected for having images that were too poor to classify, which left a total of 240 household montages comprising a total of 3,515 images for analysis. Montages rated at 2 were sufficient for categorising the general living condition, but could not provide particularly detailed insights in this regard. Those rated 3 and 4 provided a good level of detail, but not all household images were necessarily of a high quality. Montages rated as 5 were those where all images were deemed to be of a high standard.
The volume of visual data produced in the study presented a challenge in terms of analysis. Viewing the household image files as thumbnails (Harper, 2005) represented the first stage of data reduction and sense making. To facilitate investigation the thumbnail images for each household were saved in a PDF format and printed in colour to a single sheet of A3. Classification then began by manually sorting the printed household photo montages into groups with similar living conditions – noting their commonalities and differences. This classification used a visual content analysis process, which is
Table 1. Sample classification on quality of each household’s image montage
1Unusable
Images insufficientto grade the household
2Poor
Images adequate to grade – but several
missing or poor quality
3Good
Images generally good quality – one or two images missing
or poor quality
4Very good
All required images – but not all of
publication quality
5Excellent
All required images – and all of publication
quality
13 49 103 56 32
5% 19% 41% 22% 13%
RE
FE
RE
ED
AR
TIC
LE
14Market & Social Research | Volume 22, Number 1, June 2014
particularly appropriate for analysing large numbers of images (Rose, 2007). Following Bell and Davison’s (2013) guidelines, this involved observing the presence or otherwise of key features in order to classify each household’s montage according to the physical environment and living conditions (LC). A constant comparative method (Fram, 2013) was also employed, which involved continually assessing and reviewing the classification of the household montages, with groupings sometimes being revised.To assist classification and interpretation, the household
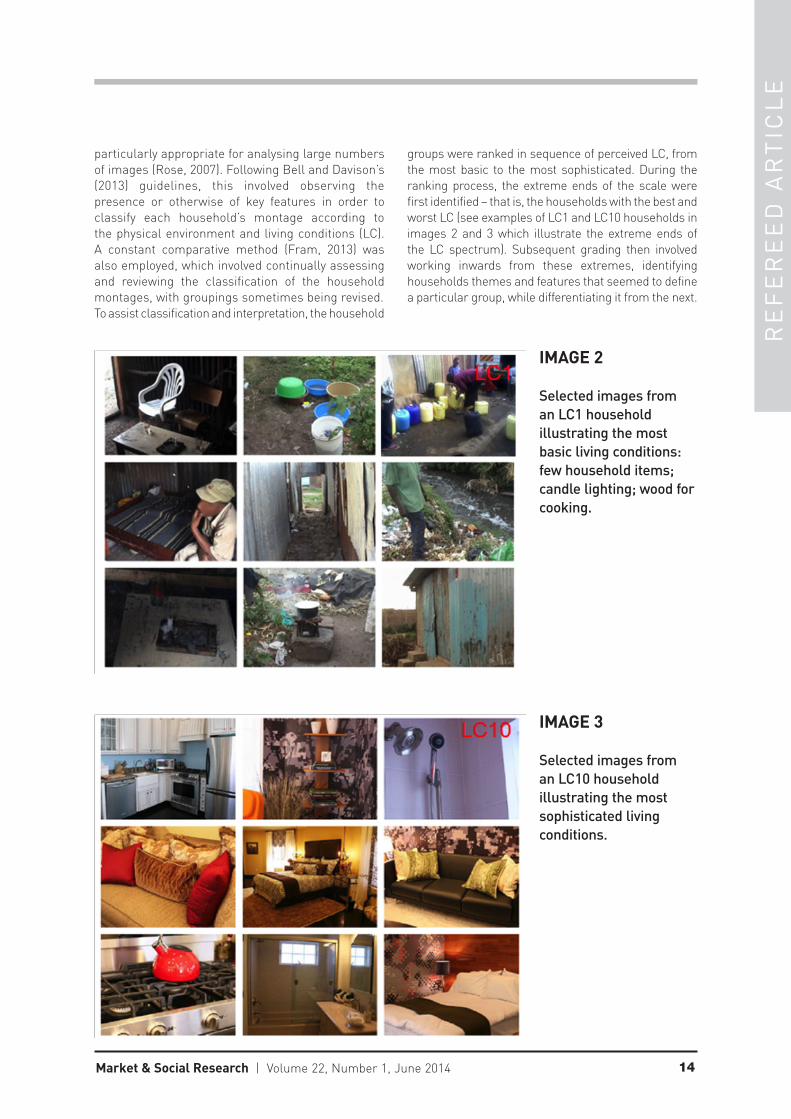
groups were ranked in sequence of perceived LC, from the most basic to the most sophisticated. During the ranking process, the extreme ends of the scale were first identified – that is, the households with the best and worst LC (see examples of LC1 and LC10 households in images 2 and 3 which illustrate the extreme ends of the LC spectrum). Subsequent grading then involved working inwards from these extremes, identifying households themes and features that seemed to define a particular group, while differentiating it from the next.
IMAGE 3
Selected images from an LC10 household illustrating the most sophisticated living conditions.
IMAGE 2
Selected images from an LC1 household illustrating the most basic living conditions: few household items; candle lighting; wood for cooking.
RE
FE
RE
ED
AR
TIC
LE
15Market & Social Research | Volume 22, Number 1, June 2014
Discussing the LC rating and household classification with data collectors and other market researchers, including the MSRA board members who are highly experienced in the market, also assisted. Discussion of images and what they portray has been used effectively in relevant anthropology studies (e.g. Lemelin et al., 2013).To some degree, this process also reduced the criticism of subjectivity which is levelled at qualitative research. The images were the key driver of the categorisation process. However, in instances where a household’s classification was somewhat ambiguous, the supplementary household information was consulted to assist interpretation.
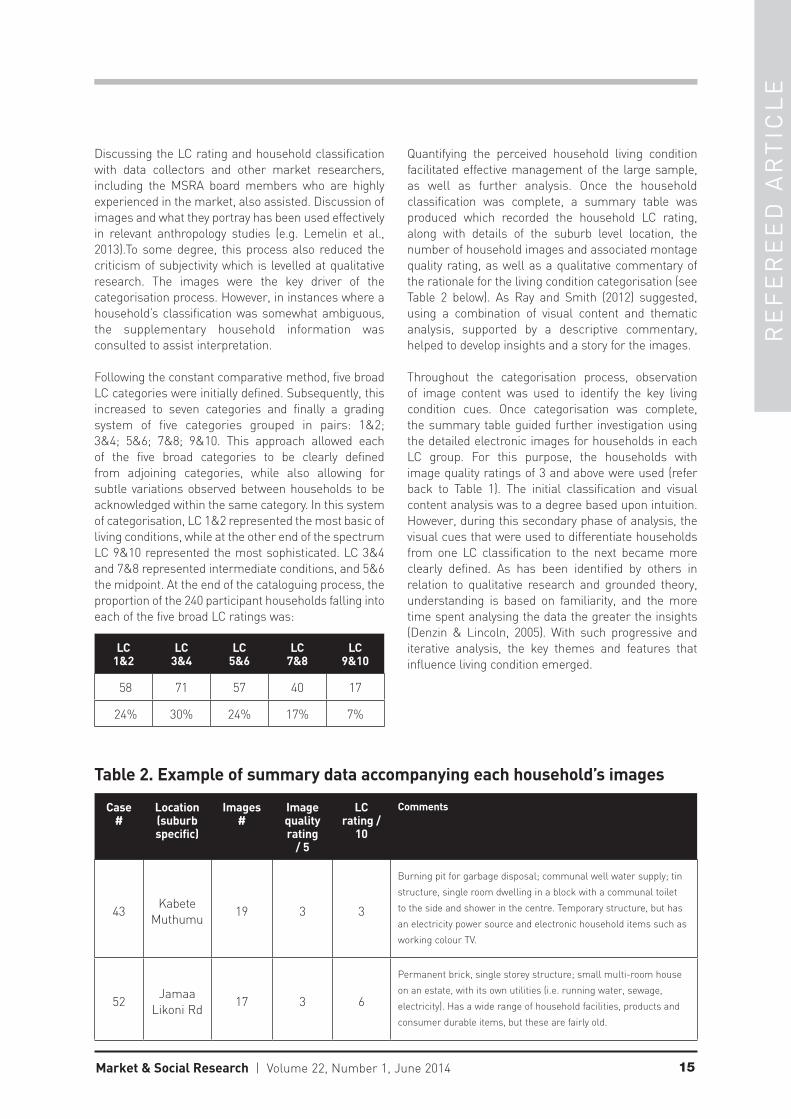
Following the constant comparative method, five broad LC categories were initially defined. Subsequently, this increased to seven categories and finally a grading system of five categories grouped in pairs: 1&2; 3&4; 5&6; 7&8; 9&10. This approach allowed each of the five broad categories to be clearly defined from adjoining categories, while also allowing for subtle variations observed between households to be acknowledged within the same category. In this system of categorisation, LC 1&2 represented the most basic of living conditions, while at the other end of the spectrum LC 9&10 represented the most sophisticated. LC 3&4 and 7&8 represented intermediate conditions, and 5&6 the midpoint. At the end of the cataloguing process, the proportion of the 240 participant households falling into each of the five broad LC ratings was:
LC1&2
LC3&4
LC5&6
LC7&8
LC9&10
58 71 57 40 17
24% 30% 24% 17% 7%
Quantifying the perceived household living condition facilitated effective management of the large sample, as well as further analysis. Once the household classification was complete, a summary table was produced which recorded the household LC rating, along with details of the suburb level location, the number of household images and associated montage quality rating, as well as a qualitative commentary of the rationale for the living condition categorisation (see Table 2 below). As Ray and Smith (2012) suggested, using a combination of visual content and thematic analysis, supported by a descriptive commentary, helped to develop insights and a story for the images.
Throughout the categorisation process, observation of image content was used to identify the key living condition cues. Once categorisation was complete, the summary table guided further investigation using the detailed electronic images for households in each LC group. For this purpose, the households with image quality ratings of 3 and above were used (refer back to Table 1). The initial classification and visual content analysis was to a degree based upon intuition. However, during this secondary phase of analysis, the visual cues that were used to differentiate households from one LC classification to the next became more clearly defined. As has been identified by others in relation to qualitative research and grounded theory, understanding is based on familiarity, and the more time spent analysing the data the greater the insights (Denzin & Lincoln, 2005). With such progressive and iterative analysis, the key themes and features that influence living condition emerged.
Table 2. Example of summary data accompanying each household’s images
Case #
Location(suburb specific)
Images #
Image quality rating
/ 5
LC rating /
10
Comments
43Kabete
Muthumu19 3 3
Burning pit for garbage disposal; communal well water supply; tin
structure, single room dwelling in a block with a communal toilet
to the side and shower in the centre. Temporary structure, but has
an electricity power source and electronic household items such as
working colour TV.
52Jamaa
Likoni Rd17 3 6
Permanent brick, single storey structure; small multi-room house
on an estate, with its own utilities (i.e. running water, sewage,
electricity). Has a wide range of household facilities, products and
consumer durable items, but these are fairly old.

RE
FE
RE
ED
AR
TIC
LE
16Market & Social Research | Volume 22, Number 1, June 2014
5. FINDINGSThis section discusses the main visual indicators of LC that differentiated the household groups. To support this discussion and to illustrate these factors, selected household images from various LC categories are also presented.
5.1 Residential type and population densitySpaciousness and building type were associated with population density, which fell with rising affluence and the rising LC rating. The size and spaciousness of the home was indicative of the LC and associated level of comfort. Households comprising single rooms were dominant at the bottom end of the LC scale, compared with multi-room dwellings and the most spacious homes at the top end. Similarly, dwelling structure and the building materials were also good indicators. More permanent and substantial structures appeared from LC4 and above, with progressively better building standards further along the LC spectrum.
5.2 Local environment and infrastructureThe surrounding area was another visual indicator of the household’s LC. Problems presented by the local environment were related by participants in the interview component of the data collection. For example, LC 1 and LC2 participants described local conditions that included problems with rubbish and lack of formal collection by the city council; lack of effective drainage and predisposition to flooding in the rainy season; lack of, or ineffective, drains and sewage disposal; as well as poor roads. Such challenging urban environmental conditions and lack of infrastructure were not localised or transient. For example, the informal settlement or slum area of Kibera included in the sample housed over
a million people – almost one-third of Nairobi residents. This informal settlement had few drains or sealed roads, which meant they turned to mud in the rainy season. In contrast, roads in the more affluent areas were tarmac, and the most affluent areas also had street lighting. Such features of the households’ local environment might be incorporated in future residential classification systems for emerging markets.
5.3 SecurityLike many emerging markets, Kenya has a significant rich-poor divide (Fotso et al., 2013). Perhaps not surprisingly, security emerged as a concern to all. Security measures observed in the sample varied along the LC spectrum. Even the most basic single room homes had a padlock for the door. The next common feature was reinforcement of the front door with either a grill or an entirely metal door. Progressing up the LC scale, bars and shutters for doors and window were the norm – poorer homes (LC1 to LC3) generally did not have windows. Other security measures found in both lower and higher LC households included grouping homes together in fenced compounds that were patrolled by a security guard at night. The sophistication of the fencing varied across the LC spectrum – simple barbed wire fences at the lower levels, progressing to walls with glass or barbed wire tops, onto sophisticated alarmed, electric fencing systems among LC8, LC9 and LC10 (see image 4 for an example). The wealthier homeowners also frequently had both day and night guards, with the most affluent employing guards from private security firms, as opposed to self-employed individuals. Some higher LC homes also had more than one, if not several guards, patrolling at the same time.
IMAGE 4
Selected images from an LC8 household illustrating a wide range of household products and appliances (including cooker with oven, large fridge and microwave, TV and hi-fi systems), as well as the compound’s gated entrance with security lodge for the security guards.
RE
FE
RE
ED
AR
TIC
LE
17Market & Social Research | Volume 22, Number 1, June 2014
These more affluent homes also regularly had professionally manufactured internal and external security screens and shutters that were drawn at night; panic rooms for refuge should the home be raided; as well as push button panic alarm systems for calling out the private security company. Some of the LC9 and LC10 homes and communal compounds also had camera surveillance, as well as motion detector systems.
Security is not something that has been widely considered in traditional approaches to market segmentation. However, the visual analysis clearly suggests some correlation between LC and the sophistication of the security measures found in this emerging market.
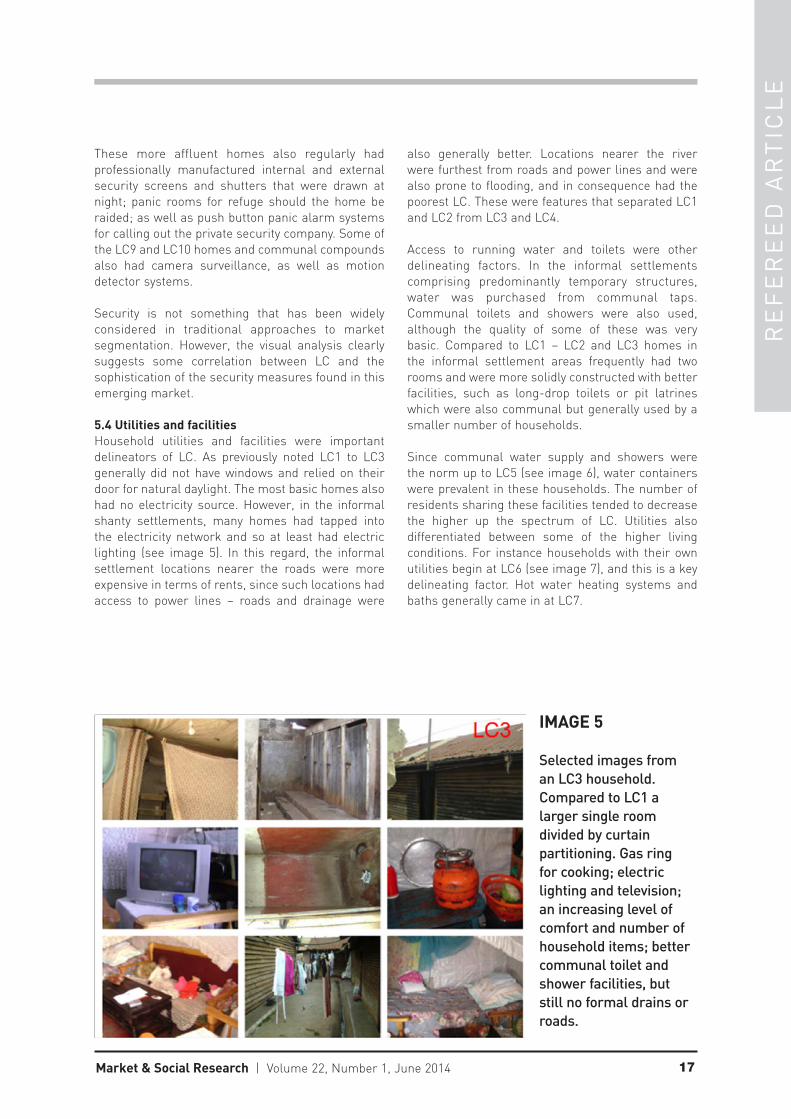
5.4 Utilities and facilitiesHousehold utilities and facilities were important delineators of LC. As previously noted LC1 to LC3 generally did not have windows and relied on their door for natural daylight. The most basic homes also had no electricity source. However, in the informal shanty settlements, many homes had tapped into the electricity network and so at least had electric lighting (see image 5). In this regard, the informal settlement locations nearer the roads were more expensive in terms of rents, since such locations had access to power lines – roads and drainage were
also generally better. Locations nearer the river were furthest from roads and power lines and were also prone to flooding, and in consequence had the poorest LC. These were features that separated LC1 and LC2 from LC3 and LC4.
Access to running water and toilets were other delineating factors. In the informal settlements comprising predominantly temporary structures, water was purchased from communal taps. Communal toilets and showers were also used, although the quality of some of these was very basic. Compared to LC1 – LC2 and LC3 homes in the informal settlement areas frequently had two rooms and were more solidly constructed with better facilities, such as long-drop toilets or pit latrines which were also communal but generally used by a smaller number of households.
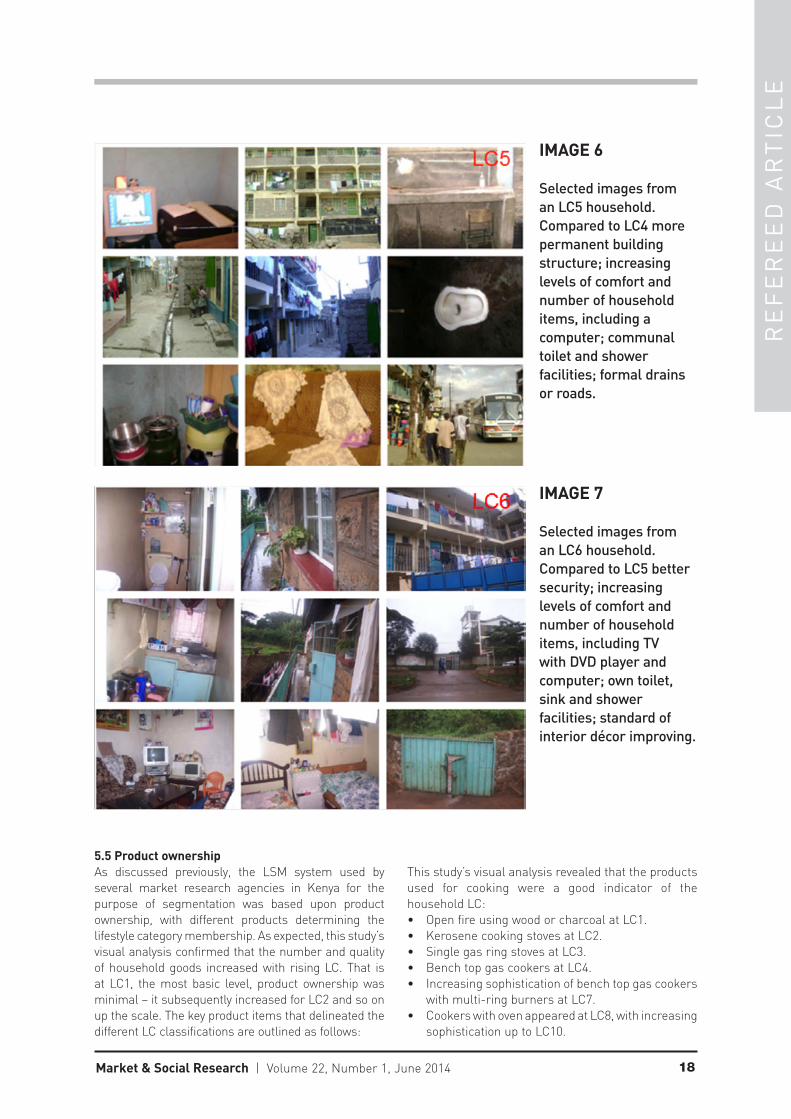
Since communal water supply and showers were the norm up to LC5 (see image 6), water containers were prevalent in these households. The number of residents sharing these facilities tended to decrease the higher up the spectrum of LC. Utilities also differentiated between some of the higher living conditions. For instance households with their own utilities begin at LC6 (see image 7), and this is a key delineating factor. Hot water heating systems and baths generally came in at LC7.
IMAGE 5
Selected images from an LC3 household. Compared to LC1 a larger single room divided by curtain partitioning. Gas ring for cooking; electric lighting and television; an increasing level of comfort and number of household items; better communal toilet and shower facilities, but still no formal drains or roads.
RE
FE
RE
ED
AR
TIC
LE
18Market & Social Research | Volume 22, Number 1, June 2014
5.5 Product ownershipAs discussed previously, the LSM system used by several market research agencies in Kenya for the purpose of segmentation was based upon product ownership, with different products determining the lifestyle category membership. As expected, this study’s visual analysis confirmed that the number and quality of household goods increased with rising LC. That is at LC1, the most basic level, product ownership was minimal – it subsequently increased for LC2 and so on up the scale. The key product items that delineated the different LC classifications are outlined as follows:
This study’s visual analysis revealed that the products used for cooking were a good indicator of the household LC:• Open fire using wood or charcoal at LC1. • Kerosene cooking stoves at LC2.• Single gas ring stoves at LC3.• Bench top gas cookers at LC4. • Increasing sophistication of bench top gas cookers
with multi-ring burners at LC7.• Cookers with oven appeared at LC8, with increasing
sophistication up to LC10.
IMAGE 6
Selected images from an LC5 household. Compared to LC4 more permanent building structure; increasing levels of comfort and number of household items, including a computer; communal toilet and shower facilities; formal drains or roads.
IMAGE 7
Selected images from an LC6 household. Compared to LC5 better security; increasing levels of comfort and number of household items, including TV with DVD player and computer; own toilet, sink and shower facilities; standard of interior décor improving.
RE
FE
RE
ED
AR
TIC
LE
19Market & Social Research | Volume 22, Number 1, June 2014
Other products that defined LC groups included:
• Most basic electrical items started appearing at LC2, but were not present in LC1.
• TVs appeared at LC3, with increasing sophistication all the way up the LC scale.
• General comfort of furniture increased as the LC scale progressed. For example, greater amount of upholstered furniture such as sofas appeared from LC3 and LC4 onwards.
• Computers appeared at LC5 (see image 6).• Bathroom cleaning products appeared at LC6,
since these households generally had their own water supply and private bathroom (facilities communal before that).
• Cars and refrigerators appeared from LC7. • Manufactured furniture as opposed to furniture
made locally by artisans operating at roadsides appeared at LC8, and more imported furniture items were found among LC9 and LC10
• Washing machines appeared at LC9 and above.• More designer/aesthetic household products from
LC9.• Latest HD TVs, dishwashers and other electrical
items were found at LC10, as well as generators to use during power-cuts, which were common in Nairobi.
These products that delineated the various categories of LC warrant further investigation.
The visual analysis highlighted some of the challenges associated with traditional segmentation systems, such as LSM that relies on product ownership. For example, computers were found at LC5 in the visual study. The LSM system used by several local market research agencies previously considered such products to indicate a higher socioeconomic status. Yet the findings here suggest that technological items such as computers become quickly outdated, with older models trickling down to the lower socioeconomic levels as the higher ones upgrade.
This trickle-down effect has increased with the burgeoning middle classes in Nairobi, and it became apparent that a much wider proportion of households owned items that were previously considered exclusive to higher socioeconomic groups. Future product-based consumer classification systems for emerging markets need to reflect this market dynamism, by considering the sophistication of electronic items in particular. For example, the actual make and model of certain products should be captured, as well as their age and source.
The visual analysis enabled more aesthetic aspects, largely ignored by traditional segmentation approaches, to be evaluated. LC8, LC9 and LC10 all had a fairly similar number and range of household goods. However, the modernity, sophistication and quality were highest in LC10, as illustrated by the household images. Similarly, variation across the LC categories in the standard of décor, ambience and quality of fixture and fittings was obvious in the household images. While traditional segmentation is able to differentiate between comfort levels for households with disparate living conditions, it is harder for the standard methods to differentiate between the finer degrees of comfort for adjacent groups. This study’s visual analysis overcame this, and it is easy to appreciate the varying degrees of opulence between LC10 living conditions compared to LC9 and LC8 (see images 3 and 4 for examples).
6. CONCLUSIONS This paper presents an ethnographic-photographic visual research method that was developed specifically to segment and evaluate living conditions for a cross-section of Nairobi consumers. The research makes a contribution in two distinct areas. The first relates to redressing the marginal role that has been allocated to visual research methods by business and management disciplines (Bell & Davison, 2013; Rose, 2007), and marketing. The second relates to the shortcomings of transposing traditional positivist segmentation research to emerging markets, and the need to initially identify the key variables to include in quantitative approaches through preliminary interpretivist exploratory research (Wedel & Kamakura, 2002). In this regard, the use of creative, observational, qualitative methods for gaining insights into the socioeconomic diversity found in these dynamic environments had been advocated previously by others (Choudhry, 1986; Craig & Douglas, 2005; Mangaliso & Lewis, 2012).
The visual research approach presented here was guided by relevant literature – most notably, Bell and Davison (2013), and Ray and Smith (2012). However, given the lack of previous studies with similar marketing objectives, aspects of the methodology evolved during the study. A noted criticism levelled at visual methods relating to subjectivity and researcher bias was ameliorated in this study through a process of “joint researcher–participant photographic production” (Ray & Smith, 2012, p. 296), as well as drawing heavily on the professional knowledge and socialised experience of senior managers from Kenya’s market research industry. These local experts provided input for the sample selection, as well as the analytical phase and confirmation of the final LC classifications.

RE
FE
RE
ED
AR
TIC
LE
20Market & Social Research | Volume 22, Number 1, June 2014
During analyses of the images obtained from a cross section of Nairobi, the households were categorised into five broad LC groups, each comprising two sub-groups. The visual data demonstrated the diversity and contrast living conditions found in emerging markets, from the poorest informal settlements (LC1) to luxury homes (LC10). In this regard, the study provides a unique insight into contemporary Nairobi society, and can help organisations and researchers make a swift appraisal of the socioeconomic composition of this important emerging market.
The LC classification process used a qualitative visual content analysis (Bell & Davison, 2013) and a constant comparative methodology (Fram, 2013). Through several iterations, the criteria that define and delineate the household LC groups were observed and identified. Subsequent findings describe these in detail in relation to residential type and population density, local environment and infrastructure, security, utilities, and facilities, as well as product ownership. Several of these dimensions are considered to varying degrees by traditional approaches to market segmentation. However, the visual analysis provided numerous additional unique insights. Household security measures, for example, emerged as a key LC indicator, along with infrastructure in the local environment, household utilities (communal vs. private), mode of cooking, age/make/model and source of products, and other more aesthetic textural aspects such as comfort and decor. Future research might seek to verify whether these dimensions are applicable in other emerging markets, which would indicate that they should be consistently included in quantitative segmentation research in such regions.
This study therefore confirms the value of the visual research method in marketing, and has established a potentially significant application for segmentation. In this regard, the study highlights the potential for ethnographic-photographic research and its role in complementing the more traditional segmentation research approaches that are commonly used in emerging markets.
REFERENCESAaker, D.A., Kumar, V., Day, G.S., Lawley, M., & Stewart, D. (2007). Marketing Research - The Second Pacific Rim Edition. Milton: Wiley.
Arnould, E. J., & Wallendorf, M. (1994). Market-oriented ethnography: Interpretation building and marketing strategy formulation. Journal of Marketing Research (JMR), 31(4), 484–504.
Azzarito, L. (2013). Introduction in Pedagogies, Physical Culture and Visual Methods. In L. Azzarito, & D. Kirk
(Eds.). New York: Routledge.
Baack, D. W., & Boggs, D. J. (2008). The difficulties in using a cost leadership strategy in emerging markets. International Journal of Emerging Markets, 3(2), 125–139.
Banks, M. (2001). Visual Methods in Social Research. London: Sage Publications.
Bansal, P., & Corley, K. (2011). The coming of age for qualitative research: Embracing the diversity of qualitative methods. Academy of Management Journal, 54, 233–237.
Barthes, R. (1977). The photographic message, in Heath, S. (ed. & trans.), Image, Music, Text, London: Fontana.
Belk, R. W., & Kozinets, R. V. (2005). Videography in marketing and consumer research. Qualitative Market Research: An International Journal, 8 (2), 128–141.
Bell, E. (2008). Reading Management and Organization in Film, Basingstoke: Palgrave MacMillan.
Bell, E., & Davison, J. (2013). Visual management studies: Empirical and theoretical approaches. International Journal of Management Reviews, 15, 167–184.
Burns, A. C., & Bush, R. F. (2006). Marketing Research (5th edition). New Jersey: Pearson.
Choudhry, Y. A. (1986). Pitfalls in international marketing research: Are you speaking French like a Spanish cow? Akron Business and Economic Review, 17 (Winter), 18–29.
Craig, C. S., & Douglas, S. P. (2005). International Marketing Research (3rd edition). Chichester: Wiley.
Davis, R. V., & Young, R. B. (2002). International marketing research: A management briefing. Business Horizons, 45(2), 31–38.
Denzin, N. K., & Lincoln, Y. S. (2005). The discipline and practise of qualitative research. In N. Denzin, & Y. Lincoln (Eds.), The Sage Handbook of Qualitative Research (3rd edition) (pp. 1–32). London: Sage Publications.
ESOMAR (2012). Global Market Research 2012. ESOMAR Industry Report, Amsterdam.
Flick, U. (2002). An Introduction to Qualitative Research (2nd edition). London: Sage Publications
Fotso, J.C., Speizer, I., Mukiira, C., Paul Kizito, P., & Lumumba, V. (2013). Closing the poor-rich gap in contraceptive use in urban Kenya: are family planning
RE
FE
RE
ED
AR
TIC
LE
21Market & Social Research | Volume 22, Number 1, June 2014
programs increasingly reaching the urban poor, International Journal for Equity in Health, 12:71.
Fram, S. M. (2013). The constant comparative analysis method outside of grounded theory. Qualitative Report, 18(1), 1–25.
Greatorex, M. (1997). Qualitative research in Blackwell Encyclopaedic Dictionary of Marketing. B. Lewis, & D. Littler (Eds.), Oxford: Blackwell.
Greenland, S., Coshall, J., & Combe, I. (2006). Evaluating service quality and consumer satisfaction in emerging markets. International Journal of Consumer Studies, 30(6), 582–590.
Greenland, S. J., & Kwansah-Aidoo, K. (2012). The challenges of market research in emerging markets: A practitioner perspective from Africa. Australasian Journal of Market and Social Research, 20(20), 9–22.
Harper, D. (2005). What’s new visually. In N. Denzin, & Y. Lincoln (Eds.), The Sage Handbook of Qualitative Research (3rd edition) (pp. 747–762). London: Sage Publications.
Hoskisson, R., Eden, L., Lau, C., & Wright, M. (2000). Strategy in emerging economies. The Academy of Management Journal, 43(3), 249–267.
Kenya National Bureau of Statistics (2013). Economic Survey 2013. Government of Kenya. Retried from http://www.knbs.or.ke/econsurvey.php.
Konecki, K. T. (2011). Visual grounded theory: A methodological outline and examples from empirical work, Revija Za Sociologiju, 41(2), 131–160.
Lemelin, R. H., Wiersma, E. C., Trapper, L., Kapashesit, R., Beaulieu, M. S., & Dowsley, M. (2013). A dialogue and reflection on photohistory: Engaging indigenous communities in research through visual analysis. Action Research, 11(1), 92–107.
Mangaliso, M. P., & Lewis, A. O. (2012). Making strategic management research relevant to emerging market countries. In C. Wang, D. Ketchen, & D. Bergh (Eds) (pp. 241–263). Research Methodology in Strategy and Management – West Meets East: Toward Methodological Exchange, 7, Emerald Group Publishing Limited.
Malhotra, N. K., & Birks, D. F. (2003). Marketing Research: An Applied Approach. Harlow: Prentice Hall.
Malinowski, B. (1932). Argonauts of the Western Pacific, London: George Routledge and Sons Ltd.
McGoldrick, P. J. (2002). Retail Marketing (2nd edition). London: McGraw-Hill.
Pink, S. (2001). Doing visual ethnography. London: Sage Publications.
Pink, S. (2004). Situating visual research. Chapter 1 in S. Pink, L. Kürti, & A. Alfonso (Eds.), Working images: Visual research and representation in ethnography (pp. 1–11). London: Routledge.
Ray, J. L., & Smith, A. D. (2012). Using photographs to research organizations: Evidence, considerations and application in a field study. Organizational Research Methods, 15, 288–315.
Rayman-Bacchus, L., & Greenland, S. (2007). Visual research methods for understanding emerging markets: A case study of Nairobi, Kenya. International Journal of Interdisciplinary Social Sciences, 1(6), 211–224.
Reynolds, N. L. (2000). Benchmarking international marketing research practise in UK agencies. Benchmarking: An International Journal, 7, 343–359.
Rose, G. (2007). Visual Methodologies (2nd edition). London: Sage Publications.
Saunders, M., Lewis, P., & Thornhill, A. (2009). Research methods for business students. Harlow: Financial Times/Prentice Hall.
Schrat, H., Warren, S., & Höpfl, H. (2012). Guest editorial: Visual narratives of organisation. Visual Studies, 27(1), 1–3.
Steenkamp, J. E. M., & Hofstede, F. T. (2002). International market segmentation: Issues and perspectives. International Journal of Research in Marketing, 19(3), 185–213.
Suchar, C. S. (1997). Grounding visual sociology research in shooting scripts. Qualitative Sociology, 20(1), 33–55.
Terpstra, V., & Sarathy, R. (2000). International Marketing (8th edition). Hinsdale: Dryden Press.
Wedel, M., & Kamakura, W. (2002). Introduction to the special issue on market segmentation. International Journal of Research in Marketing, 19(3), 181–183.
Acknowledgements: Thanks to the Market and Social Research Association and those working in Africa’s market research industry for their support of this research project.

RE
FE
RE
ED
AR
TIC
LE
22Market & Social Research | Volume 22, Number 1, June 2014
1. INTRODUCTIONGroup-based research methods were originally used in the early 20th century for scale development (e.g. Bogardus, 1926) and then subsequently by social scientists after World War II to investigate the effects of post-war propaganda (Merton & Kendall, 1946). Today, group-based research dominates qualitative research in the commercial, social and political spheres. In 2002 an estimated 218,000 groups were conducted in the US at a value of approximately $7 billion, while another 245,000 groups were conducted in Europe, Latin America and Asia-Pacific (Marketing Research Association, 2012).
In some countries group-based research has evolved to include a range of different methodologies, from highly
structured group discussions to more naturalistic and flexible encounters between participants. In other countries, however, including the US and Australia (the latter being the setting for the current study), one approach has come to dominate group-based research particularly in the commercial arena – known most commonly as the “focus group” method.
The “focus group” approach is almost universally prescribed by modern market research text books as the method for conducting group-based research (Bradley, 2010; Churchill, Brown, & Suter, 2007; Hyman & Sierra, 2010; Malhotra, Hall, Shaw, & Oppenheim, 2006; Proctor, 2005; Wilson, Johns, Miller, & Pentecost, 2010; Zikmund & Babin, 2010). This involves assembling a group of 6 to10 people who do not know each other
A comparison of group-based research methods
Melanie Randle*, Institute for Innovation in Business and Social ResearchSchool of Management and Marketing, University of WollongongNorthfields Avenue, Wollongong NSW 2522 AustraliaPhone: +61 2 4221 4858 Fax: +61 (0)2 4221 4154 Email: [email protected]
Hugh Mackay, Institute for Innovation in Business and Social ResearchUniversity of WollongongNorthfields Avenue, Wollongong NSW 2522 AustraliaPhone: +61 2 4221 4437, email: [email protected]
Dorothy Dudley, The Mind & Mood ReportIpsos AustraliaLevel 13, 168 Walker Street, North Sydney NSW 2060Phone: +61 2 9900 5100, email: [email protected]
* Corresponding author
Acknowledgements
This project was funded by the Faculty of Commerce Research Support Scheme and the Marketing Research Innovation Centre (mric) at the University of Wollongong.
ABSTRACTIn the modern era, group-based methods have come to largely dominate qualitative research, particularly in the commercial arena of market research. The most commonly used method is the “focus group” technique, which involves a group of strang-ers being directed to discuss a pre-determined set of topics. In reality, in many parts of the world, including Australia where this study was conducted, focus groups are often employed as the default technique without systematically questioning the appropriateness of methodological characteristics or the impact they have on the resultant data. This empirical study com-pares two different group-based methods – the “focus group” approach and the “unfocused group discussion technique” – to identify differences in the data obtained. Differences are found in regard to a number of aspects including the non-verbal group dynamics, and the extent to which participants say everything they want to say and are able to express their true thoughts and feelings. Findings reinforce the importance of considering alternative methods when designing group-based research studies and provide empirical evidence to inform such methodological decision-making. A future agenda for group-based methodologi-cal research is discussed.

RE
FE
RE
ED
AR
TIC
LE
23Market & Social Research | Volume 22, Number 1, June 2014
in a central location, usually a customised research room with mirrored viewing facilities that allow others (usually those commissioning the research) to watch the group as it happens. The researcher develops a discussion outline and actively directs the discussion to cover all topics within the specified timeframe (usually 1 to 2 hours). This approach is extensively used across social sciences disciplines including, for example, marketing (Papista & Dimitriadis, 2012; Verdurme & Viaene, 2003), social work (Smyth & Michail, 2010), health (Pool, Poell, & ten Cate, 2013), psychology (Bergin, Talley, & Hamer, 2003) and education (Osborne & Collins, 2001). In addition to the focus group method featuring prominently in of much of the academic literature, empirical evidence confirms that it is also the method by far most commonly used in practice by market and social research agencies for group-based research in Australia (Randle, Mackay, & Dudley, 2012).
There has been some commentary on the merits of varying particular aspects of this method, primarily from the disciplines of sociology (Morgan, 1996), health (Khan & Manderson, 1992) and education (Parker & Tritter, 2006). In particular, the degree to which group discussions should be directed by researchers has been debated since the 1940s when US psychotherapist Carl Rogers proposed the “nondirective method” for attitude and personality research (Rogers, 1945). Rogers proposed that the participant be responsible for directing the discussion and that the researcher accept rather than evaluate their views. He argues that this approach eliminates researcher bias and allows the subject to access and express deeper emotions and attitudes. Others have since proposed variations of the nondirective approach in a group setting, for example Morgan (1988) described the notion of “self-managed groups” (p.51), in which the moderator takes a passive role and allows the group to determine the direction of the conversation, while Khan and Manderson (1992) discussed “informal focused group discussions” (p.60) which involve natural groupings and also give control of the discussion over to participants.
One group-based approach which has been used in practice since the 1970s for marketing and social research in Australia is the “unfocused group discussion technique” (Mackay, 2012). This technique aims to minimise the experimental effect of the focus group experience and create a situation that is as close as possible to participants’ everyday lives. It prescribes that participants be members of naturally occurring groups – such as friends, work colleagues or neighbours – and that the group be conducted in its natural habitat (i.e. where members would naturally meet – for example one of their homes, a workplace or their local club).
Ideally, the groups involved in this technique include five to seven members, and never more than eight. The moderator’s role is passive; he or she typically introduces the topic and then says nothing else for the entire discussion, instead letting the conversation take its natural course. The technique discourages the use of video recording because of its potential to alter the natural group dynamic and resulting discussion. No time limit is set; the natural end to the discussion is the appropriate time to conclude.
Researchers generally agree on the importance of design decisions for group-based research: “the decisions taken by the researcher may affect significantly the resulting discussion and have implications for sampling, setting, control, validity and reliability” (Lunt, 1996, p.80). However, this assertion is usually based on the researcher’s hypotheses regarding the effects of methodological factors on the data obtained, rather than sound empirical evidence. Where empirical evidence is available findings are often contradictory, for example in relation to whether strangers or naturally occurring groups are more appropriate for studies involving “sensitive topics” (Kitzinger, 1994; Leask, Hawe, & Chapman, 2001). Previous researchers have recognised this gap and called for more empirical research: “experimental studies are necessary to evaluate alternative qualitative approaches” (Khan & Manderson, 1992, p.65).
The present study attempts to contribute to building such a base of empirical knowledge. We compare the two alternative methods of group-based research described above – the typical focus group approach (referred to for the remainder of this paper as focus groups) and the unfocused group discussion technique (referred to henceforth as unfocused groups). We examine whether the group-based research technique influences the first-order (Schutz, 1967) (or raw) data obtained; and if so, how it differs. Specifically, does the method affect;
1. the number of topics discussed?2. the range of topics discussed?3. the length of discussion?4. the intensity of participant engagement?5. the non-verbal dynamics (interest in the discussion,
enthusiasm about making a contribution, interaction with other participants)?
6. participant frustration (whether participants said everything they wanted to say on the topic)?
7. participant truthfulness (whether participants expressed their true thoughts and feelings)?
RE
FE
RE
ED
AR
TIC
LE
24Market & Social Research | Volume 22, Number 1, June 2014
2. LITERATURE REVIEWFor the most part, the topics discussed within a group are determined by the role the moderator assumes and the degree to which they direct the discussion to cover specific topics (Morgan, 1988; Robinson, 1999). An actively moderated group will discuss each topic in the discussion guide and any topic peripheral to this, or which goes for longer than its allocated time, will be promptly re-directed by the moderator. In contrast, non-moderated groups discuss any topics they choose, and for as long as naturally occurs. Madriz (2000) reported that giving groups more control resulted in them straying from the discussion guide and “tapping into areas of the topic that I had not previously considered. The process added a wealth of information to my research and gave me new insights” (p.846). In this scenario, it is also likely that the topics of particular interest to the group will receive greater (longer) attention, inevitably resulting in fewer total topics being discussed. This view is reinforced by Lunt (1996) who states “in our experience, people do not talk at length or with interest about an issue on which they have nothing meaningful to say”.
Other empirical studies report contradictory evidence, for example Fern (1982) found no difference between moderated and non-moderated groups in the number of ideas generated or the quality of ideas. However in his study the “un-moderated” groups received written (not oral) instructions to guide the discussion, so participants were not actually in control of the topics discussed. Similarly, Nelson & Frontczak (1988) found small interaction and acquaintanceship effects and concluded that groups can be composed of strangers, couples or acquaintances with relatively little effect on idea quantity. Again, methodological considerations raise questions regarding findings, as each participant in the couple groups knew one person well (their partner) but all of the other couples were strangers, and the acquaintance groups included members of a large social club who theoretically might have never even met before.
Our first four hypotheses are based on the premise that left to their own devices a natural group, where individuals all know each other well, discusses topics that are relevant to them (regardless of if they fit within the scope of the relevant discussion guide). Furthermore, because of the relevance of the topics the group spends longer on fewer topics but discuss them with greater intensity and engagement.
H1: Focus groups discuss a greater number of topics than unfocused groups.
H2: Unfocused groups discuss a wider range of topics than focus groups (evidenced by discussion of topics outside the scope of the discussion guide).
H3: Unfocused groups discuss topics at greater length (evidenced by the amount of time spent on each topic).
H4: Participants in the unfocused groups demonstrate greater engagement in the topics discussed (indicated by the degree of questioning and probing by other participants).
One of the key strengths of group-based research is the “synergy” (Kitzinger, 1994) created in the group environment which generates momentum and allows opinions, beliefs, feelings and attitudes to emerge in parallel with individual experiences (Parker & Tritter, 2006). This synergy, also referred to as the non-verbal dynamics of the group (Farnsworth & Boon, 2010), has been described as of equal importance as participants’ verbal comments in group-based research (Robinson, 1999) and has been credited for revealing underlying feelings and attitudes of participants, for example racism, power relationships and cultural nuances (Swenson, Griswold, & Kleiber, 1992). However, despite the agreed importance of participant interaction and group dynamics, literature reviews of focus group studies have found that the nature of interactions between individuals and the group as a whole are rarely reported (Belzile & Öberg, 2012).
One exception was Leask et al. (2001) who compared the non-verbal dynamics of constructed groups (strangers) and pre-existing groups and found the constructed groups to be more animated, enthusiastic, engage in more complex discussion of the topics and express a wider range of views. Conversely, naturally occurring groups were flatter, less enthusiastic and conformed to social norms; and in these groups the moderator needed to prompt more in order to stimulate discussion. The authors suggest that groups of strangers are more eager to share their story with a group of people they do not know. Based on this evidence, we expect to find differences in the non-verbal dynamics of the focus groups and unfocused groups.
H5: Focus groups generate more enthusiastic and energetic non-verbal group dynamics than unfocused groups.
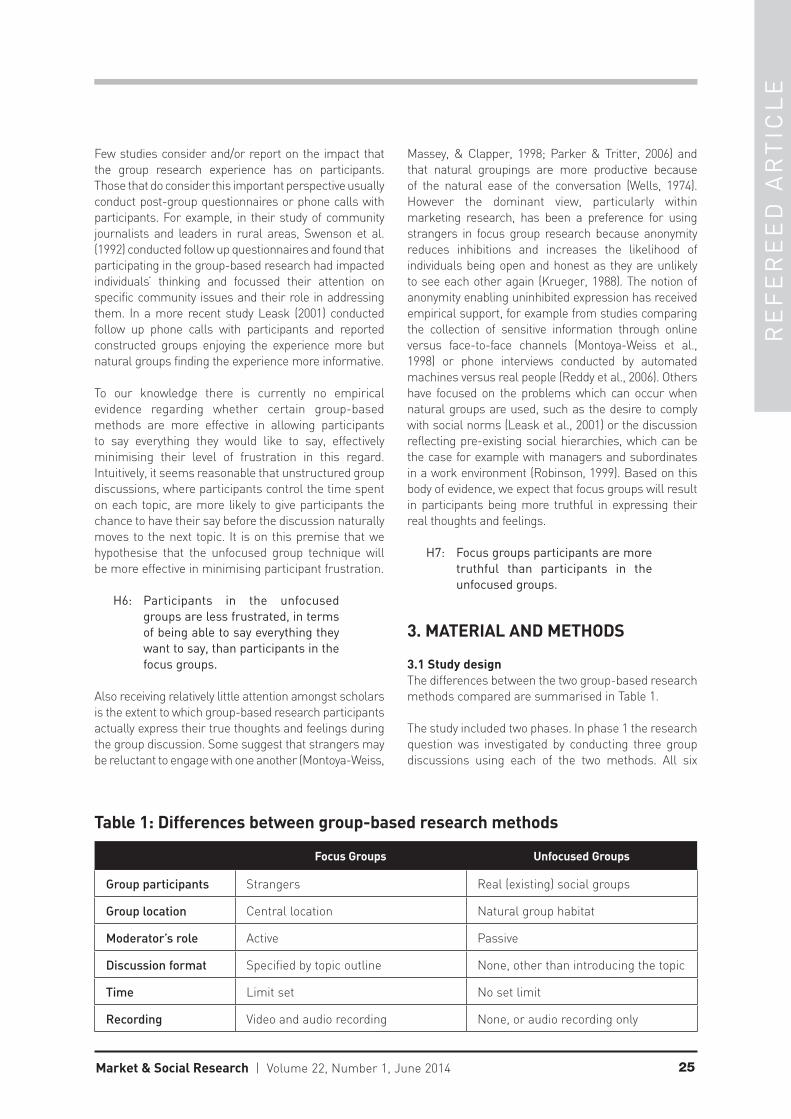
RE
FE
RE
ED
AR
TIC
LE
25Market & Social Research | Volume 22, Number 1, June 2014
Few studies consider and/or report on the impact that the group research experience has on participants. Those that do consider this important perspective usually conduct post-group questionnaires or phone calls with participants. For example, in their study of community journalists and leaders in rural areas, Swenson et al. (1992) conducted follow up questionnaires and found that participating in the group-based research had impacted individuals’ thinking and focussed their attention on specific community issues and their role in addressing them. In a more recent study Leask (2001) conducted follow up phone calls with participants and reported constructed groups enjoying the experience more but natural groups finding the experience more informative.
To our knowledge there is currently no empirical evidence regarding whether certain group-based methods are more effective in allowing participants to say everything they would like to say, effectively minimising their level of frustration in this regard. Intuitively, it seems reasonable that unstructured group discussions, where participants control the time spent on each topic, are more likely to give participants the chance to have their say before the discussion naturally moves to the next topic. It is on this premise that we hypothesise that the unfocused group technique will be more effective in minimising participant frustration.
H6: Participants in the unfocused groups are less frustrated, in terms of being able to say everything they want to say, than participants in the focus groups.
Also receiving relatively little attention amongst scholars is the extent to which group-based research participants actually express their true thoughts and feelings during the group discussion. Some suggest that strangers may be reluctant to engage with one another (Montoya-Weiss,
Massey, & Clapper, 1998; Parker & Tritter, 2006) and that natural groupings are more productive because of the natural ease of the conversation (Wells, 1974). However the dominant view, particularly within marketing research, has been a preference for using strangers in focus group research because anonymity reduces inhibitions and increases the likelihood of individuals being open and honest as they are unlikely to see each other again (Krueger, 1988). The notion of anonymity enabling uninhibited expression has received empirical support, for example from studies comparing the collection of sensitive information through online versus face-to-face channels (Montoya-Weiss et al., 1998) or phone interviews conducted by automated machines versus real people (Reddy et al., 2006). Others have focused on the problems which can occur when natural groups are used, such as the desire to comply with social norms (Leask et al., 2001) or the discussion reflecting pre-existing social hierarchies, which can be the case for example with managers and subordinates in a work environment (Robinson, 1999). Based on this body of evidence, we expect that focus groups will result in participants being more truthful in expressing their real thoughts and feelings.
H7: Focus groups participants are more truthful than participants in the unfocused groups.
3. MATERIAL AND METHODS
3.1 Study designThe differences between the two group-based research methods compared are summarised in Table 1.
The study included two phases. In phase 1 the research question was investigated by conducting three group discussions using each of the two methods. All six
Table 1: Differences between group-based research methods
Focus Groups Unfocused Groups
Group participants Strangers Real (existing) social groups
Group location Central location Natural group habitat
Moderator’s role Active Passive
Discussion format Specified by topic outline None, other than introducing the topic
Time Limit set No set limit
Recording Video and audio recording None, or audio recording only

RE
FE
RE
ED
AR
TIC
LE
26Market & Social Research | Volume 22, Number 1, June 2014
groups were moderated by the same researcher who is experienced in both techniques. Focus groups were observed by two researchers from behind the one-way mirror. Unfocused groups were observed by only one researcher, as it would have been too disruptive to have more without discrete viewing facilities available in participants’ homes. The moderator and observers took detailed notes on the content and the non-verbal dynamics of the group discussions. The content of the Phase 1 discussions was used to test hypotheses H1 through 4 (number and range of topics, length of discussion and intensity of engagement), and the observations of the moderator and observer were used to test hypothesis H5 (non-verbal dynamics). In total, 42 individuals participated in the six group discussions conducted in Phase 1.
Phase 2 involved telephoning all participants within one week of the group discussions and asking about their experience of the group discussions. This information was also used to test hypothesis H5 (non-verbal dynamics), hypothesis H6 (participant frustration) and hypothesis H7 (participant truthfulness). All 42 Phase 1 participants agreed to participate in Phase 2, and all were contacted except one person who could not be reached as her number had been disconnected.
3.2 Discussion topicA key criterion for choosing a discussion topic was that it be reasonably complex, yet interesting to participants and a topic they were likely to have an opinion on. Secondly, it should be broadly relevant to both marketing and social sciences – the areas of interest of the research team. Thirdly, the design needed to include a sample that could be recruited within the funding limitations, with sampling criteria that was reasonably achievable.
The discussion topic was: what is it like to be a woman in her mid-60s in contemporary Australia? This topic is inherently interesting to the sample (women in their mid-60s): they were asked to talk about themselves. In addition, we know anecdotally that this particular socio-demographic group is notoriously willing to talk. It could therefore be argued that if differences were found between techniques with this sample and topic, then it is likely that differences would be present with less vocal groups on less personally interesting topics.
3.3 SampleThe sample was women in their mid-60s who live in each of the three local government areas where groups were held. Participants in the focus groups received a cash incentive of $80. Focus group participants were recruited by a commercial agency and individually invited to participate.
For the unfocused groups, one individual who met the screening criteria was contacted by the recruitment agency and asked if they had a group of about 6 to 7 friends who were also female and in their mid-60s. This person (the group organiser) invited her friends and organised the venue. The group organiser received a cash incentive of $180, all other unfocused group participants received $80. These incentive amounts are regarded as the current industry standard for commercial research in Australia.
3.4 FieldworkFieldwork was conducted between February and May 2012. During phase 1, three groups of 6 to 8 participants were held per method – one each in the North Sydney, Parramatta and Hurstville local government areas of Sydney, Australia. Focus groups were held in commercial research premises with mirrored viewing facilities and were audio and video recorded. Focus groups lasted for a set duration of 90 minutes.
Unfocused groups were held in the location where the group would usually meet (in all cases this was the group organiser’s home) and discussions were audio recorded only. No time limit was set so discussions lasted until they reached a natural conclusion.
At the end of each group discussion participants gave permission for researchers to conduct the follow-up phone calls within one week. Phone interviews lasted between 3 and 10 minutes and were audio recorded for transcription and analysis.
3.5 MeasuresA detailed discussion guide was developed for the focus group discussions (see Appendix 1). It comprised topics considered relevant by the researchers including an introduction and warm up (15 mins), general lifestyle (10 mins), relationships (10 mins), housing (10 mins), work and civic life (10 mins), health and wellbeing (10 mins), leisure and entertainment (10 mins), comparison with previous and future generations (15 mins), close and thanks/final comments.
For the unfocused groups, the moderator explained the nature of the discussion procedure and that we were interested in understanding what it is like to be them: women in their mid-60s in contemporary Australia. They could talk about anything that interested them or that they felt would give insight into what it is like to be them. After this introduction the moderator said nothing for the remainder of the discussion (the moderator introduction is included as Appendix 2).While conversational in style, the follow up phone calls were structured to include the following questions. (1)

RE
FE
RE
ED
AR
TIC
LE
27Market & Social Research | Volume 22, Number 1, June 2014
overall, how did you feel about the group discussion?; (2) to what extent did you feel you had the chance to say everything you wanted to say?; (3) were there any moments in the discussion where you felt reluctant or uncomfortable talking about your own experience?; and (4) thinking of the experience overall, do you feel you ended up saying what you really think and feel?
3.6 Comparison procedureThe variables of interest were (1) number of topics discussed; (2) range of topics discussed; (3) length of discussion; (4) intensity of engagement; (5) non-verbal dynamics; (6) participant frustration; and (7) participant truthfulness.
Group discussions were transcribed and included time-stamps after every individual contribution or every change of topic. Transcripts were coded according to the topics discussed (for example, children, grandchildren, paid work, unpaid work, physical health issues, mental health issues etc.). Once this coding was complete, the number of seconds spent on each topic was calculated. Length of discussion and intensity of engagement were also compared based on the observations of the moderator and observers who were located in the viewing room behind the mirror. Non-verbal dynamics were compared based on the observations of the moderator and the observers, and from participant comments during follow-up phone calls. The comparison of whether individuals said everything they wanted to say and expressed their true thoughts and feelings was based on analysis of the content of participants’ qualitative responses to the questions in the follow-up phone calls.
The first stage of the comparison was performed by the researcher who observed all six group discussions. The second stage of analysis involved discussing the data and findings at length with both the researcher who moderated all six groups and the researcher who observed only the focus group discussions. This ongoing process of consultation and refinement ensured that all three researchers reached agreement on the insights and conclusions being drawn from the comparison.
4. RESULTS AND DISCUSSIONFigure 1 summarises the topics discussed during the groups and the length of time spent on each topic. The left hand column lists the topics discussed. Each of the columns represents one of the six group discussions, with the three focus groups on the left and the three unfocused groups on the right. The degree of shading indicates the length of time spent
on each topic, with no shading indicating the group did not discuss the topic at all, and the black cells indicating the group spent more than eight minutes on that particular topic (refer to key in Figure 1).
4.1 Number of topicsAs can be seen in Figure 1, the majority of cells in the focus group columns have some degree of shading, indicated that most topics were discussed at some point. This is not unexpected, since participants were directed to discuss each topic and if the conversation strayed it would be bought back on track by the moderator. In some cases, rather than say nothing on a topic that was irrelevant to them, participants expressed the personal irrelevance of that topic to the group, for example in relation to leisure time activities:
“Well I’m working so much, I work six days a week so I don’t have any time. I’m too tired.”
Focus group participant.
Conversely, the three columns for the unfocused groups include many more white cells representing topics not discussed at all. This simple but effective visual analysis supports the hypothesis that focus groups discuss more topics than unfocused groups (H1).
4.2 Range of topicsFocus groups raised some personal topics they were comfortable discussing in front of a group of strangers, such as dysfunctional familial relationships and financial difficulties.
“So I have no-one to give me money. I’ve put on two stone in weight because I live on bread because I can’t afford to eat vegies and fruit.”
Focus group participant.
Unfocused groups also raised sensitive topics but they were inherently different, more personally intimate and reflective, for example personal experiences of menopause. Unfocused groups discussed their feelings about growing older, such as feeling invisible and their opinion not mattering any more. There was also discussion of topics outside of the focus group discussion guide, such as current affairs and media stories, and of people they all knew who were going through trauma or illness. (Note that the later topic mentioned here was not raised in the focus groups which is perhaps not surprising as they had no mutual acquaintances, however it is possible that focus group participants could refer to people they know but who are unknown to the others in the group, although this did not happen for this topic in this study). These

RE
FE
RE
ED
AR
TIC
LE
28Market & Social Research | Volume 22, Number 1, June 2014
25
Figures
Figure 1: Graphical representation of group discussions
Discussion topic Focus groups Unfocused groups 1 2 3 1 2 3
Psychological/feelings Finance/money Technology The world today
General lifestyle
Current affairs/social issues Spouse Single Children Parents Grandchildren Friends Pets
Relationships & friendships
Dysfunctional families Staying/happy Downsizing/looking to change Family staying/living with them
Housing
General description Paid work Looking for paid work Unpaid work/volunteering Home duties
Work & civic life
Not working/retired Physical health Mental health Menopause Ageing People they know sick/dead/going through trauma
Health & wellbeing
Medical facilities/health system Social Travel Physical – sports/dancing/gardening etc. Non-physical – reading/TV/puzzles/relaxing etc. Technology Arts Lack of time for leisure activities
Leisure & entertainment
Other Had it better than us Had it worse than us
Previous generation
Different lifestyle Got it better than us Negative qualities Different lifestyle
Next generation
Nice/positive things to say Things were different then Reminiscing Story telling Getting older Don’t think about it/live for today Wondering/worrying about future Future housing – nursing home/live with family etc.
Future
Wills/dying
Key: Shading Seconds Minutes (approx.)
0 0 1-120 0-2 121-300 2-5 >300 >5
Figure 1: Graphical representation of group discussions
RE
FE
RE
ED
AR
TIC
LE
29Market & Social Research | Volume 22, Number 1, June 2014
conversations provided insight into issues occupying their thoughts or which were important to them (e.g. death) but may not necessarily have affected them personally.
“Yeah her father died of emphysema and she was telling me when [he] was going in the ambulance with the oxygen he was still trying to put a smoke
in his mouth.” Unfocused group participant.
Figure 1 illustrates that the focus group discussions stayed within the boundaries of the topics specified in the pre-determined guide, as is typical of group discussions which are actively directed by a moderator. It is also evident that the focus group discussions covered almost all of the elements of the discussion guide, many of which were not discussed by the unfocussed groups (e.g. housing). However, the unfocussed groups did raise topics which were outside of those specified in the original focus group discussion guide, particularly personal topics like menopause and ageing. Therefore, whilst the data does not strongly support the hypothesis that unfocused groups discuss a wider range of topics than focus groups (H2), it does support the notion that they discuss different topics, some of which were not specified in the pre-developed focus group guide.
4.3 Length of discussionThe shading in Figure 1 indicates that for the most part, focus groups discussed topics for a short to moderate length of time (demonstrated by the light to moderate degree of shading in most cells). In contrast, while fewer topics were discussed by the unfocused groups (indicated by more non-shaded cells), the topics they did cover were discussed at greater length (indicated by more dark and black cells). This supports the hypothesis that unfocused groups discuss some topics in at greater length than focus groups (H3).
4.4 Intensity of engagementThe consequence of focus groups being directed from topic to topic within specified time frames was no indication of how long each discussion might have lasted otherwise. In an effort for participants in the focus groups to all have their say on each topic, exchanges between participants sometimes presented as a list of unlinked opinions. For example the following was a sequential exchange in one focus group:
Participant 1: My mother never drove.
Participant 2: My mum did.
Participant 3: My mother had a licence.
Participant 2: My mum had an FJ Holden.
Participant 1: Mum never drove, she had five children.
Participant 2: Most women didn’t drive in those days.
Participant 4: My dad didn’t get his licence until he was in his 40s.
This is not to say that the entire focus group discussion took the form of one line answers, but the example given does illustrate the point that, particularly when a new topic was introduced, participants would often offer immediate responses which were all contributed at the same time and therefore presented as a list of unlinked comments or opinions.
In contrast, unfocused group members listened more intently to each other and asked questions or added to the conversation until the topic naturally changed. The discussion was more multi-faceted and covered more topics, for example the group might start talking about gardening (leisure time), then move to concerns about the quality of produce (current affairs), then to how good they feel when they eat well (health) and then back to growing vegetables (leisure time). This more complex interaction provided greater context for the topics being discussed. In addition, because the unfocused groups could guide the discussion themselves, the relative importance of different topics became evident by the level of interest of group members, the number of participants who contributed and the length of time spent on each topic. This evidence supports the hypothesis regarding greater participant engagement in unfocused groups (H4).
4.5 Non-verbal dynamicsInteraction between participants in the focus groups was initially subdued and their comments were directed towards the moderator, somewhat like students in a classroom. A degree of initial unease was expressed by participants:
“I felt uncomfortable in the beginning.” Focus group participant.
There was also inhibition in the initial stages of focus groups, with apparent contradictions between participants’ introductory statements and later contributions. This may have been because initial introductions were inflated to present a positive image to the group, with later statements once the group had become more relaxed and familiar being more in line with reality. For example when one participant

RE
FE
RE
ED
AR
TIC
LE
30Market & Social Research | Volume 22, Number 1, June 2014
introduced herself she stated that she had two children and:
“I’ve never had a moment’s problem with either of them.”
Focus group participant.
Then later she talked about the problems she’d had with her children and that their relationship had deteriorated:
“He’s got barriers, I’ve got barriers, so we look at one another and we get into a blue ... that’s what
they’re angry with me about.” Focus group participant.
The unfocused groups were relaxed and lively from the very start. In all cases participants had met at their friend’s house shortly before the researchers arrived and were already in conversation, often laughing and joking with each other. When asked to commence the discussion someone would start with a joke or they would just continue what they had been talking about previously. Examples of initial discussion statements were:
Group A: Should you just finish telling us what you were telling us about [grandson]... just finish that off.
Group B: Participant 1: What, the menopausal women?
(all laughing)
Participant 2: Stop joking and get on with it!
It is also worth noting that the general tone of the focus groups was quite negative. For example, participants expressed resentment towards their children for having better lifestyles than they did or do, of being expected to mind grandchildren, of having to look after aging parents, or of having to keep working because their financial situation does not allow them to retire.
“I resent giving up so much of my time so [my children] can go and get the second
wage and have this lifestyle.” Focus group participant.
In contrast, the tone of unfocused groups was more balanced. Some topics were discussed in a negative tone, but this was balanced by other conversations that were very positive – for example about family and leisure time activities they enjoy or reminiscing about old
times. Results support the hypothesis that unfocused group non-verbal dynamics are more energetic and enthusiastic than focus groups (H5).
4.6 Participant frustration Focus groups acknowledged that the discussion had been moved on when necessary by the moderator and that they could have said more on the topic; however they were also aware of the need to get through multiple topics.
“It was a bit hard to sort of jump in. There was a lot to be discussed I thought”. Focus group participant. Participants in the unfocused groups felt that there were some instances they could have said more, but they didn’t want to focus the discussion on themselves. It is possible that this same self-regulation happens in normal group interactions where individuals are mindful of drawing too much attention to themselves, whereas the participants in the focus groups felt that they were there to talk about themselves so had no issues doing so.
“I probably could have said more about what I do myself, but I thought I won't bother because
I am just talking about one person.” Unfocused group participant.
However a key difference between the methods was that if an unfocused group changed the topic too soon participants would bring the conversation back to that topic so they could say what they wanted. This was not possible in focus groups, where the moderator would move the discussion to the next topic regardless of whether everyone had had their say. To a greater degree, unfocused groups felt that they said everything they wanted to say, supporting the hypothesis that unfocused groups produce lower levels of participant frustration (H6).
4.7 Participant truthfulnessFocus groups felt they could say what they really thought because they were unlikely to ever see the other participants again. The perception was that they were anonymous, despite not knowing anything about each other (and that they all lived in the same local area so could possibly have mutual acquaintances or run into each other again).
“You know, the fact that you don’t know anyone there ... even if they do go and say it to somebody else what chance is there of having a connection,
as big as Sydney is?” Focus group participant.
RE
FE
RE
ED
AR
TIC
LE
31Market & Social Research | Volume 22, Number 1, June 2014
There was some reluctance for focus groups to express feelings on potentially controversial or socially sensitive topics, such as multiculturalism or racism. Participants did not want to seem racist by making any negative comments about the changing cultural mix in their local area.
Unfocused groups were relaxed in discussing a range of topics.
“Everything we touched on we actually felt very comfortable about.” Unfocused group participant.“Absolutely yes. It’s important for women to have that sense of belonging, to be able to talk freely.”
Unfocused group participant.
In some cases unfocused groups discussed politically or socially sensitive topics, but participants were quite frank in their views and were comfortable giving opinions, for example on the issues of asylum seeker rights and entitlements:
“The government they help all these people, refugees that come here, they get everything - free dental, free doctors. We never had anything.” Unfocused group participant.
Despite unfocused groups being generally comfortable giving different opinions, some did express reluctance to discuss personally sensitive topics such as financial difficulty, as this was something perceived as embarrassing and they did not want their friends to know about. Results regarding our hypothesis about participant truthfulness (H7) are inconclusive, because both methods included instances where participants were reluctant to discuss particular (but different) types of sensitive topics.
5. CONCLUSIONS
These findings suggest that the group discussion method may affect the nature of the first-order data obtained. Obviously, the focus group approach guarantees data on all discussion guide topics. The unfocused group approach is likely to cover fewer topics, but at greater length, and more insight is gained regarding the topics that are relevant and important for that particular group. In addition, it is likely that additional topics outside of the scope of pre-developed discussion guides would be covered. However in a practical sense, if those commissioning primary research have specific topics they would like discussed these may not be raised spontaneously by unfocused groups.
The results regarding non-verbal dynamics present
some interesting considerations, for example the relatively negative tone of focus groups. This finding supports previous studies reporting that focus groups produce more angry comments, which has been attributed to the synergy of the group keeping the anger going (Geis, Fuller, & Rush, 1986) and turning the discussion into a complaint session (Franz, 2011). This could be because participants see the focus group as an opportunity to vent their frustrations to someone who is interested in hearing their views. In contrast, participants in the unfocused groups may already know the issues that annoy or frustrate each other so there is no need to revisit them during the group discussion. It could also be because focus group participants are directed to discuss topics that they may not have thought about before, and in this situation it is easier to criticise than come up with a considered opinion.
Findings were also reported on the interaction between participants in different group methods. It is generally agreed that a key strength of group-based research is the ability to harness group dynamics to prompt fuller discussion and idea generation as participants query each other and explain their own views (Morgan, 1996; Parker & Tritter, 2006). However the nature of this interaction is rarely reported (Belzile & Öberg, 2012; Kitzinger, 1994), instead group research results are usually presented as a series of interactions between individual participants and the researcher, rather than as participants interacting with each other. The present study suggests that initially, focus group interactions were relatively artificial but that this changed and became more authentic as the discussion progressed, whereas unfocused group participants were more engaged and exhibited more high energy from the very beginning. This contradicts previous studies which found stranger groups to be more energetic and dynamic (Leask et al., 2001), which could be explained by the fact that in that study, the “natural groups” were not groups of close friends but rather members of a recently formed first time mothers group. The authors acknowledged that in their study, natural group participants “were at the delicate stage of establishing group norms and wanting to fit in” (p.153) and as such were pressured by group conformity and consensus. They do however, support other studies which note that groups of people who know each other’s background and circumstances are able to provide greater insights that would be less accessible in alternative settings (Peek & Fothergill, 2009).
Results regarding participant frustration and truthfulness add new knowledge in the area of group-based research. The anonymity of being with strangers enabled participants in the focus groups to speak freely about sensitive issues that they may not want
RE
FE
RE
ED
AR
TIC
LE
32Market & Social Research | Volume 22, Number 1, June 2014
to share with people they see regularly – for example experiencing financial difficulties. However, intimate topics were also raised during the unfocused groups, such as personal experiences of menopause or the physical realities of growing older (e.g. different body parts sagging) and the ways they were dealing with such changes (e.g. supportive underwear). This questions the commonly held belief in marketing research that stranger groups produce more candid and truthful contributions. Further research is required to examine whether some sensitive topics are more appropriate for strangers and others for natural groupings.
Questions are also raised regarding whether participants are more willing to share their story in front of people they do not know than people they have known for some time as suggested by Leask et al. (2001). If this is the case it could be hypothesised that they may be even more comfortable in a one on one (individual interview) situation where they can tell their story exclusively rather than share the speaking time with other group participants. This relationship between participant willingness to divulge information in relation to number of people present and whether they know them or not is an interesting avenue for future research.
One benefit of the unfocused method was that the familiarity of being amongst friends provided a degree of sense checking of participant contributions. In this case, group members actually disputed contributions of others that they knew not to be true, so participants could not say anything too removed from reality. This could not occur in focus groups because participants knew nothing about each other’s lives. Consequently, some contradictions were observed between participant statements at the start of the discussion and towards the end when they felt more relaxed.
Findings present considerations for the design of both commercial and academic qualitative research. Given that the methods produce different data, researchers should challenge the default preference for directed, non-affinity groups when proposing a group-based research design, supporting previous appeals for researchers not to blindly accept the “rules of thumb” regarding group-based research (Morgan, 1996, p.141). Techniques present different strengths and weaknesses, and researchers should carefully consider the research questions and sample before making judgements about which is most appropriate. It is advisable to be mindful of the impact of the social and physical environment on the group dynamics and be open to handing some control over the direction and process to research participants. In essence, be an active listener rather than active moderator.
Practically, given the non-directedness of unfocused groups more discussions may be required to ensure all relevant topics are covered. The focus group approach also has advantages from the commissioning organisation’s perspective: it allows them to view groups behind one-way mirrors, avoids them having to travel to participant’s homes and allows them to test their own hypotheses with the target audience – either by adding their own questions into the discussion guide or having notes delivered to the moderator during the discussion.
It is acknowledged that not all parts of the world have a default technique which dominates group-based research; such is the case in Australia where this research was conducted. However, the findings presented in this paper are relevant for researchers regardless of the situation regarding group-based research in their particular country because they work towards building an empirical knowledge base that can inform methodological decision making. In the case where a range of different methods are more commonly used (as is the case, for example, in many European countries) this research helps inform such decisions. In the case where a default method tends to be used (such as Australia or the US) it prompts researchers to consider alternative techniques and understand the impact of different methodological decisions. Rather than attempting to establish the superiority of one method over another the present study aims to add to the tool box available to qualitative researchers such that they can make appropriate methodological decisions for their particular research question.
A limitation of this study is that it does not permit conclusions to be drawn about which specific aspect of each method might be contributing to the differences, for example, whether the degree of affinity between group participants, the degree of directedness or the natural environment causes the differences identified. Future research which permits modification of just one aspect of the design (e.g. participant affinity, group directedness, physical environment and so on) would allow conclusions to be drawn regarding the effect of changes in that particular aspect. For example, reducing the number of topics included in the discussion guide may give the group longer to talk about each topic and have implications for the length and depth with which they discuss each one.
In addition, this study compares two quite divergent methods: an explicit, sequential, detailed discussion guide with a set timeframes and an active moderator versus a virtually non-moderated method. Whilst the former method is widely used and the one most
RE
FE
RE
ED
AR
TIC
LE
33Market & Social Research | Volume 22, Number 1, June 2014
commonly prescribed by research text books, it should be acknowledged that not all focus groups involve such structured procedures. Many groups fall somewhere in between and may, for example, elicit and then follow-up topics from the group participants or introduce topics that arise in early groups into later groups.
It should also be noted that the content topic chosen for this comparison was inherently interesting to the individuals involved: they were asked to talk about themselves. It could be hypothesised that if differences are found between the methods with this topic (in terms of information generated, level of enjoyment etc.), then it is even more likely that differences would be present on less personally interesting topics where groups might need more assistance for the discussion to be maintained.
It could be argued that the research question chosen for investigation in this study was exploratory in nature and is therefore more suited to a naturalistic and unstructured method (Mattinson & Baskin, 2012). According to Calder (1977), the fact that the objectives of this research are to understand the perspective and experience of a particular group within society suggests that it is more suited to a phenomenological qualitative methodology which produces “everyday knowledge” (p.355), such as the unfocused group discussion technique. Calder’s view serves to further highlight the problem of researchers tending to default to one research method without careful consideration of the implications of using one qualitative technique over another. Having not conducted a similar methods comparison with a range of different research questions or objectives there is currently little empirical evidence to support this view; however it would be valuable as an avenue for future research.
We should also acknowledge that the researchers in this study are also the authors of this paper, which may raise the question of potential bias being introduced by the researchers who are aware of the aims of this study. Having said this, the three researchers have different methodological backgrounds relating to qualitative research and between them have experience conducting both methods compared here in commercial and academic contexts. The consultative process of comparative analysis which involved all three researchers is likely to have gone some way to minimising any such bias.
This empirical evidence demonstrating that different methods produce data which is different in a number of respects leads to multiple other questions to be addressed with future research. For example, are different methods of group-based research more appropriate for particular types of sensitive topics (e.g. personal health problems versus issues of politically correctness)?; for different socio-demographic groups (e.g. would men in their early twenties or working mothers in their forties be more suited to a particular method)?; or for different types of research questions (e.g. social/political issues versus commercial product or advertising testing). There is a need to answer these questions with empirical evidence in order to provide researchers with tools to inform the design of higher quality research projects.
RE
FE
RE
ED
AR
TIC
LE
34Market & Social Research | Volume 22, Number 1, June 2014
REFERENCES
Belzile, J.A., & Öberg, G. (2012). Where to begin? Grappling with how to use participant interaction in focus group design. Qualitative Research, 12(4), 459-472.
Bergin, C, Talley, S, & Hamer, L. (2003). Prosocial behaviours of young adolescents: A focus group study. Journal of Adolescence, 26(1), 13-32.
Bogardus, E.S. (1926). The group interview. Journal of Applied Sociology, 10, 372-382.
Bradley, N. (2010). Marketing research: Tools and techniques (4th ed.). New York, NY: Oxford University Press.
Calder, B.J. (1977). Focus groups and the nature of qualitative marketing research. Journal of Marketing Research, 14(3), 353-364.
Churchill, G.A., Brown, TJ, & Suter, TA. (2007). Basic marketing research (7th ed.). Mason, OH: South-Western Cengage Learning.
Farnsworth, J, & Boon, B. (2010). Analysing group dynamics within the focus group. Qualitative Research, 10(5), 605-624.
Fern, E.F., (1982). The use of focus groups for idea generation: The effects of group size, acquaintaceship and moderator on response quantity and quality. Journal of Marketing Research, 14 (1), 1-13.
Franz, N.K., (2011). The unfocused focus group: Benefit or bane? The Qualitative Report, 16(5), 1380-1388.
Geis, S, Fuller, R, & Rush, J. (1986). Lovers of aids victims: Psychological stressors and counselling needs. Death Studies, 10(1), 43-53.
Hyman, M.R., & Sierra, J.J. (2010). Marketing research kit for dummies. Hoboken: Wiley Publishing.
Khan, M.E., & Manderson, L. (1992). Focus groups in tropical diseases research. Health Policy and Planning, 7(1), 56-66.
Kitzinger, J. (1994). The methodology of focus groups: The importance of interction between research participants. Sociology of Health and Illness, 16(1), 103-121.
Krueger, R. (1988). Focus groups: A practical guide for applied research. Newbury Park, CA: Sage Publications.
Leask, J, Hawe, P, & Chapman, S. (2001). Focus group composition: A comparison betwen natural and constructed groups. Australian and New Zealand Journal of Public Health, 25(2), 152-154.
Lunt, P. (1996). Rethinking the focus group in media and communications research. Journal of Communication, 46(2), 79-98.
Mackay, H. (2012). The unfocused group discussion technique. Australasian Journal of Market and Social Research, 20(1), 47-58.
Madriz, E. (2000). Focus groups in feminist research. In N.K., Denzin & Y.S., Lincoln (Eds.), Handbook of qualitative research (2nd ed.). Thousand Oaks, CA: Sage Publications.
Malhotra, N, Hall, J, Shaw, M, & Oppenheim, P. (2006). Marketing research: An applied orientation (3rd ed.). Frenchs Forest, NSW: Pearson Education Australia.
Marketing Research Association. (2012). Focus groups. Retrieved from http://www.marketingresearch.org/node/12310
Mattinson, D, & Baskin, M. (2012). The focus group fightback. Research. Retrieved from http://www.research-live.com/comment/the-focus-group-fightback/4007398.article
Merton, R.K., & Kendall, PL. (1946). The focussed interview. American Journal of Socioloy, 10(6), 541-547.
Montoya-Weiss, M.M., Massey, A.P., & Clapper, DL. (1998). On-line focus groups: Conceptual issues and a research tool. European Journal of Marketing, 32(7/8), 713-723.
Morgan, D.L., (1988). Focus groups as qualitative research (2nd ed.). Newbury Park, CA: Sage Publications.
Morgan, D.L., (1996). Focus groups. Annual Review of Sociology, 22(1), 129-152.
Nelson, J.E., & Frontczak, N.T. (1988). How acquaintanceship and analyst can influence focus group results. Journal of Advertising, 17(1), 41-48.
Osborne, J, & Collins, S. (2001). Pupils' views of the role and value of the science curriculum: A focus-group study. International Journal of Science Education, 23(5), 441-467.
Papista, E, & Dimitriadis, S. (2012). Exploring consumer-brand relationship quality and identification: Qualitative
RE
FE
RE
ED
AR
TIC
LE
35Market & Social Research | Volume 22, Number 1, June 2014
evidence from cosmetics brands. Qualitative Market Research: An International Journal, 15(1), 33-56.
Parker, A, & Tritter, J. (2006). Focus group method and methodology: Current practice and recent debate. International Journal of Research Method in Education, 29(1), 23-37.
Peek, L, & Fothergill, A. (2009). Using focus groups: Lessons from studying daycare centers, 9/11, and hurricane katrina. Qualitative Research, 9(1), 31-59.
Pool, I, Poell, R, & ten Cate, O. (2013). Nurses’ and managers’ perceptions of continuing professional development for older and younger nurses: A focus group study. International Journal of Nursing Studies, 50(1), 34-43.
Proctor, T. (2005). Essentials of marketing research. Upper Saddle River, NJ: Prentice Hall.
Randle, M, Mackay, H, & Dudley, D. (2012). Do strangers in strange places say strange things? A pilot study examining alternative methods of group-based research. Paper presented at the Australian Market and Social Research Society Conference, Melbourne, VIC.
Reddy, M.K., Fleming, M.T., Howells, N.L., Rabenhorst, M.M., Casselman, R, & Rosenbaum, A. (2006). Effects of method on participants and disclosure rates in research on sensitive topics. Violence and Victims, 21(4), 499-506.
Robinson, N. (1999). The use of focus group methodology - with selected examples from sexual health research. Journal of Advanced Nursing, 29(4), 905-913.
Rogers, C.L. (1945). The nondirective method as a technique for social research. American Journal of Sociology, 50(4), 279-283.
Schutz, A. (1967). The phenomenology of the social world. Evanstone, IL: Northwestern University Press.
Smyth, C, & Michail, S. (2010). Exploring young carers' agency. Qualitative Research, 10(2), 36-50.
Swenson, J.D., Griswold, W.F., & Kleiber, P.B. (1992). Focus groups: Method of inquiry/intervention. Small Group Research, 23(4), 459-474.
Verdurme, A, & Viaene, J. (2003). Exploring and modelling consumer attitudes towards genetically modified food. Qualitative Market Research: An International Journal, 6(2), 95-110.
Wells, W.D. (1974). Group interviewing. In R Ferber (Ed.), Handbook of marketing research. New York: McGraw-Hill.
Wilson, A, Johns, R, Miller, K, & Pentecost, R. (2010). Marketing research: An integrated approach. Frenchs Forest, NSW: Pearson Australia.
Zikmund, W.G., & Babin, B.J. (2010). Essentials of marketing research (4th ed.). Mason, OH: South-Western Cengage Learning.
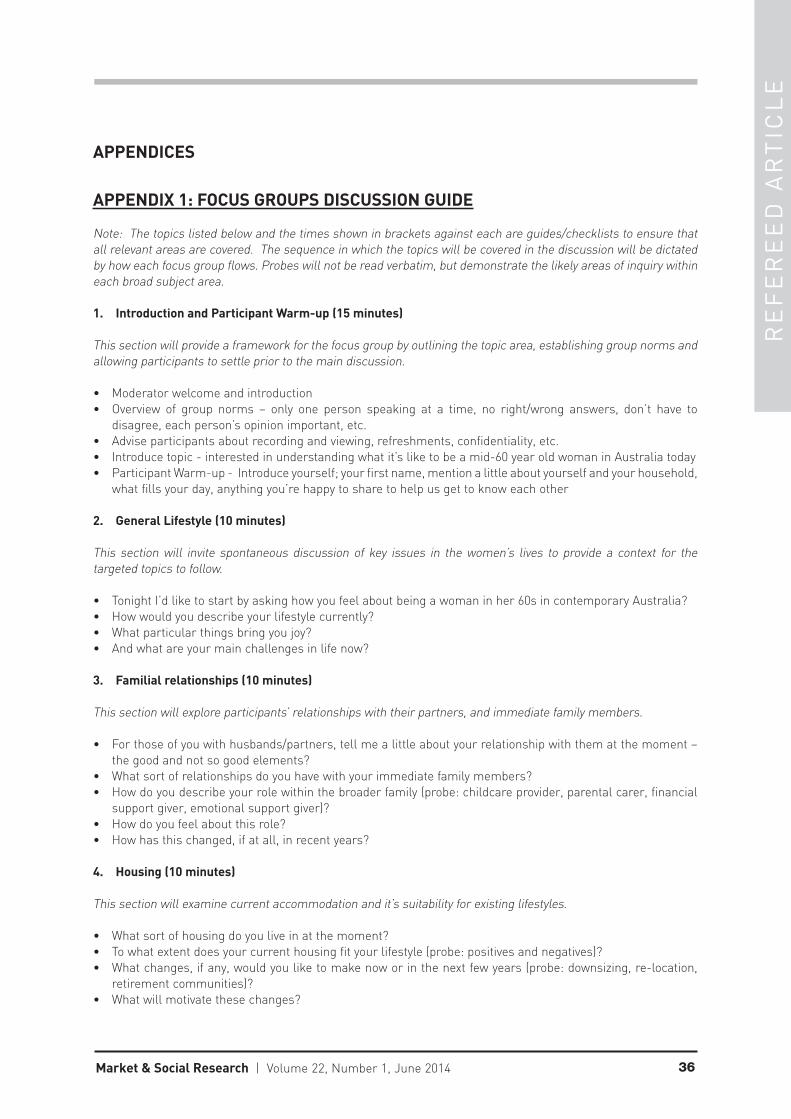
RE
FE
RE
ED
AR
TIC
LE
36Market & Social Research | Volume 22, Number 1, June 2014
APPENDICES
APPENDIX 1: FOCUS GROUPS DISCUSSION GUIDE
Note: The topics listed below and the times shown in brackets against each are guides/checklists to ensure that all relevant areas are covered. The sequence in which the topics will be covered in the discussion will be dictated by how each focus group flows. Probes will not be read verbatim, but demonstrate the likely areas of inquiry within each broad subject area.
1. Introduction and Participant Warm-up (15 minutes)
This section will provide a framework for the focus group by outlining the topic area, establishing group norms and allowing participants to settle prior to the main discussion.
• Moderator welcome and introduction• Overview of group norms – only one person speaking at a time, no right/wrong answers, don’t have to
disagree, each person’s opinion important, etc.• Advise participants about recording and viewing, refreshments, confidentiality, etc.• Introduce topic - interested in understanding what it’s like to be a mid-60 year old woman in Australia today• Participant Warm-up - Introduce yourself; your first name, mention a little about yourself and your household,
what fills your day, anything you’re happy to share to help us get to know each other
2. General Lifestyle (10 minutes)
This section will invite spontaneous discussion of key issues in the women’s lives to provide a context for the targeted topics to follow.
• Tonight I’d like to start by asking how you feel about being a woman in her 60s in contemporary Australia?• How would you describe your lifestyle currently?• What particular things bring you joy?• And what are your main challenges in life now?
3. Familial relationships (10 minutes)
This section will explore participants’ relationships with their partners, and immediate family members.
• For those of you with husbands/partners, tell me a little about your relationship with them at the moment – the good and not so good elements?
• What sort of relationships do you have with your immediate family members?• How do you describe your role within the broader family (probe: childcare provider, parental carer, financial
support giver, emotional support giver)?• How do you feel about this role?• How has this changed, if at all, in recent years?
4. Housing (10 minutes)
This section will examine current accommodation and it’s suitability for existing lifestyles.
• What sort of housing do you live in at the moment?• To what extent does your current housing fit your lifestyle (probe: positives and negatives)?• What changes, if any, would you like to make now or in the next few years (probe: downsizing, re-location,
retirement communities)?• What will motivate these changes?
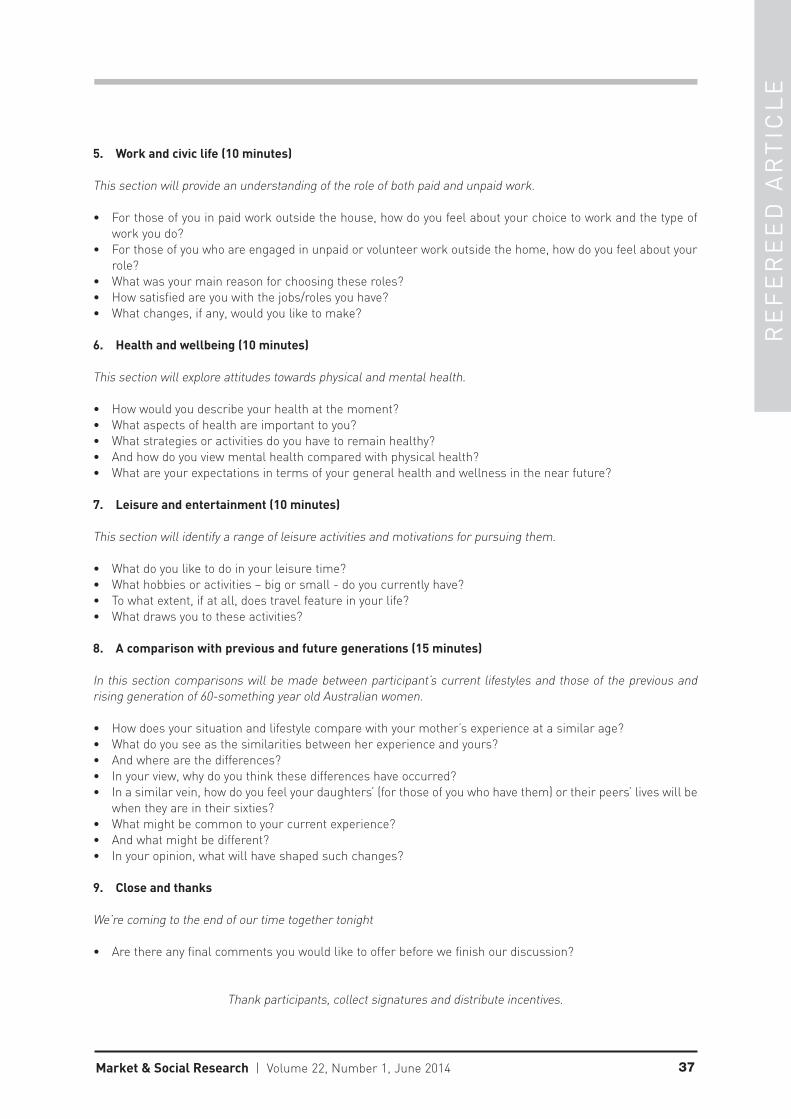
RE
FE
RE
ED
AR
TIC
LE
37Market & Social Research | Volume 22, Number 1, June 2014
5. Work and civic life (10 minutes)
This section will provide an understanding of the role of both paid and unpaid work.
• For those of you in paid work outside the house, how do you feel about your choice to work and the type of work you do?
• For those of you who are engaged in unpaid or volunteer work outside the home, how do you feel about your role?
• What was your main reason for choosing these roles?• How satisfied are you with the jobs/roles you have? • What changes, if any, would you like to make?
6. Health and wellbeing (10 minutes)
This section will explore attitudes towards physical and mental health.
• How would you describe your health at the moment?• What aspects of health are important to you?• What strategies or activities do you have to remain healthy?• And how do you view mental health compared with physical health?• What are your expectations in terms of your general health and wellness in the near future?
7. Leisure and entertainment (10 minutes)
This section will identify a range of leisure activities and motivations for pursuing them.
• What do you like to do in your leisure time?• What hobbies or activities – big or small - do you currently have?• To what extent, if at all, does travel feature in your life?• What draws you to these activities?
8. A comparison with previous and future generations (15 minutes)
In this section comparisons will be made between participant’s current lifestyles and those of the previous and rising generation of 60-something year old Australian women.
• How does your situation and lifestyle compare with your mother’s experience at a similar age?• What do you see as the similarities between her experience and yours?• And where are the differences?• In your view, why do you think these differences have occurred?• In a similar vein, how do you feel your daughters’ (for those of you who have them) or their peers’ lives will be
when they are in their sixties?• What might be common to your current experience?• And what might be different?• In your opinion, what will have shaped such changes?
9. Close and thanks
We’re coming to the end of our time together tonight
• Are there any final comments you would like to offer before we finish our discussion?
Thank participants, collect signatures and distribute incentives.

RE
FE
RE
ED
AR
TIC
LE
38Market & Social Research | Volume 22, Number 1, June 2014
APPENDIX 2: TOPIC INTRODUCTION FOR UNFOCUSSED GROUPS
My name is ______________ and I’m working on a research project among Australian women, trying to find out how you’re feeling about this particular stage of your life. Simple as that.
When we conduct this kind of research, it’s all very relaxed and open-ended. Instead of knocking on your door or ringing up and asking you questions, we like to assemble small groups of people like yourselves – not to answer any questions at all, but simply to chat about the subject we’re interested in. So that’s what’s going to happen: I’ll explain what we’re trying to find out and then I’ll leave it to you to say whatever you’d like to say about that subject.
It’s going to be very informal. There are no rules. I’m not in charge – I’m just going to sit here and listen and take a few notes. I’ll record the discussion as well – just so we don’t miss any of the things you’re saying. Is that OK with everybody? The comments you make will be combined with comments made by other women in groups like this that we’re conducting in various parts of Sydney, and those comments will form the basis of our report on this particular project. Of course, your comments will be completely anonymous – we never use people’s names in our reports, and we don’t even need to know what your names are.
Thank you for giving up your time this evening – obviously, this kind of research depends on people like you being prepared to give us your time and your opinions. So thank you.
Okay then let’s get started. The project we’re working on at the moment is about as general as it could be. We simply want to know what it feels like to be a woman in Sydney in her mid-sixties. In other words, what it feels like to be you. We’re interested in anything at all you might like to say about the way your life is at the moment. It’s entirely up to you what you’d like to say … how you’d like to tackle the subject. There are no right or wrong answers – we’d just like to hear about what it’s like to be you.
Okay … over to you … leave me right out of it. I’m just here to listen. So … if one of you would like to start, let’s just see how the conversation goes from there …
INV
ITE
D C
OM
ME
NT
AR
Y
39Market & Social Research | Volume 22, Number 1, June 2014
INTRODUCTIONIt could be said that respondents are the capital of the market research industry. Developing a relationship that supports and increases the value of that respondent both to the industry and the client should be an ongoing priority for market research professionals. As we continue to integrate technology and online research methods as standard practice it is important to shape that development in a knowledgeable way. While technology is an enabler it also in some ways diminishes control over the respondent relationship in terms of external environmental factors and engagement levels.
During December 2013 Stable Research conducted a survey that explored the opinions, likes and dislikes of our panel members. Our findings closely correlate with lifestyle preferences that are reflected through findings that show research timing is more likely to encourage engagement over incentives. The respondent survey findings also highlight that participants enjoy focus or discussion group research over other methods and that the research topic also substantially influences the decision to participate. In contrast, respondents do not enjoy completing pre-qualifying questionnaires and never being contacted, completing surveys and failing at the end as well as irrelevant or repeated questions. As we hurtle headlong into the development of research methods that embrace technology we must also learn from the end user experience to ensure that we harness innovation in new and exciting ways.
PARTICIPANTS, PREFERENCES AND PERFORMANCEMarket research firms continue to place enormous effort into developing new online products and services, and rightly so. But, is enough thought going into the opinions of respondents when it comes to their engagement and participation levels? If the industry is to continue to provide quality products and services then surely that development is inextricably linked to finding out not only how respondents engage, but their likes and dislikes associated with various survey methods.
In commenting on their study into online survey respondent engagement, Downes-Le Guin, Baker, Mechling and Ruylea (2012) noted that ‘the keys to greater survey engagement lie not in graphical enhancements or greater interactivity in presentation of survey questions, but rather in dealing more effectively with the fundamental components of respondent burden that survey methodologists have long recognised: survey length, topic salience, cognitive burden (i.e. poorly written or hard to answer questions) and frequency of survey requests’ (p. 18 ). At present there is a concerted focus on the development of online research methods and tools, but what about other research methods? Do other research methods provide greater levels of satisfaction and in turn engagement and could some elements of popular research methods be more effectively integrated into online market research developments?
OUR APPROACHWhile there have been numerous studies over the years that have focused on various aspects and components of the market research industry, in November 2013 Stable Research approached the Research News Advisory Group with the idea of conducting research that focused on our panel and their experience and preferences in dealing and engaging in the market research process. Stable Research has a panel of 100,000 members matching with Australian Bureau of Statistics (ABS) Census 2011 distribution of gender and age (ABS, 2012, 3235.0. Between 8 November and 14 November 2013 we conducted an online survey of 10,000 panel members and did not apply any quotas because we wanted a true reflection of our panel. Survey respondents were approached via an email asking them ‘Help shape the future of Research!’ Incentives to participate were offered.
Stable Research received 940 responses with a large majority responding via a computer, rather than a tablet or mobile phone. In 2012-2013 ABS statistics highlighted that men and women accessing the internet were almost even at 84 percent and 83 percent respectively.’ (ABS, 2013, 8146.0). In this instance more
Researching the respondents
Karen Johnston, Director, Stable Research
Joanne Ryan, Infodec Communications
Corresponding author: Karen Johnston, PO Box 2973, Taren Point NSW 2229 Australia. E: [email protected]
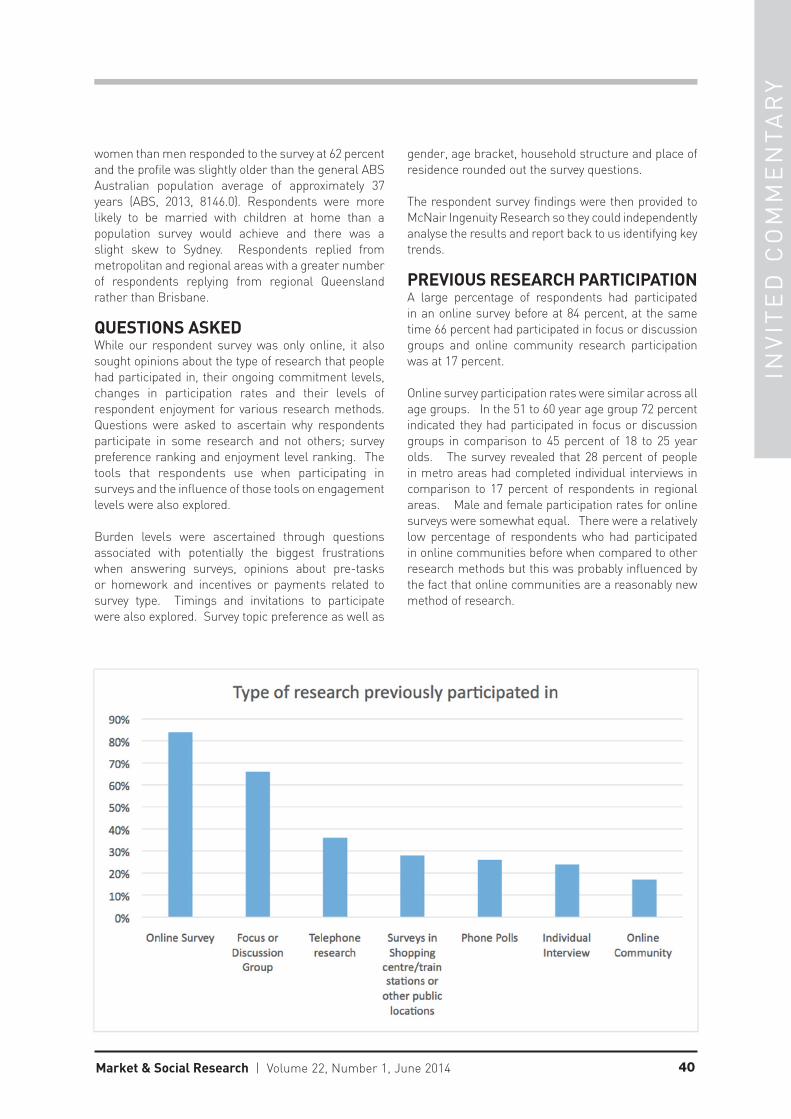
INV
ITE
D C
OM
ME
NT
AR
Y
40Market & Social Research | Volume 22, Number 1, June 2014
women than men responded to the survey at 62 percent and the profile was slightly older than the general ABS Australian population average of approximately 37 years (ABS, 2013, 8146.0). Respondents were more likely to be married with children at home than a population survey would achieve and there was a slight skew to Sydney. Respondents replied from metropolitan and regional areas with a greater number of respondents replying from regional Queensland rather than Brisbane.
QUESTIONS ASKEDWhile our respondent survey was only online, it also sought opinions about the type of research that people had participated in, their ongoing commitment levels, changes in participation rates and their levels of respondent enjoyment for various research methods. Questions were asked to ascertain why respondents participate in some research and not others; survey preference ranking and enjoyment level ranking. The tools that respondents use when participating in surveys and the influence of those tools on engagement levels were also explored.
Burden levels were ascertained through questions associated with potentially the biggest frustrations when answering surveys, opinions about pre-tasks or homework and incentives or payments related to survey type. Timings and invitations to participate were also explored. Survey topic preference as well as
gender, age bracket, household structure and place of residence rounded out the survey questions.
The respondent survey findings were then provided to McNair Ingenuity Research so they could independently analyse the results and report back to us identifying key trends.
PREVIOUS RESEARCH PARTICIPATIONA large percentage of respondents had participated in an online survey before at 84 percent, at the same time 66 percent had participated in focus or discussion groups and online community research participation was at 17 percent.
Online survey participation rates were similar across all age groups. In the 51 to 60 year age group 72 percent indicated they had participated in focus or discussion groups in comparison to 45 percent of 18 to 25 year olds. The survey revealed that 28 percent of people in metro areas had completed individual interviews in comparison to 17 percent of respondents in regional areas. Male and female participation rates for online surveys were somewhat equal. There were a relatively low percentage of respondents who had participated in online communities before when compared to other research methods but this was probably influenced by the fact that online communities are a reasonably new method of research.
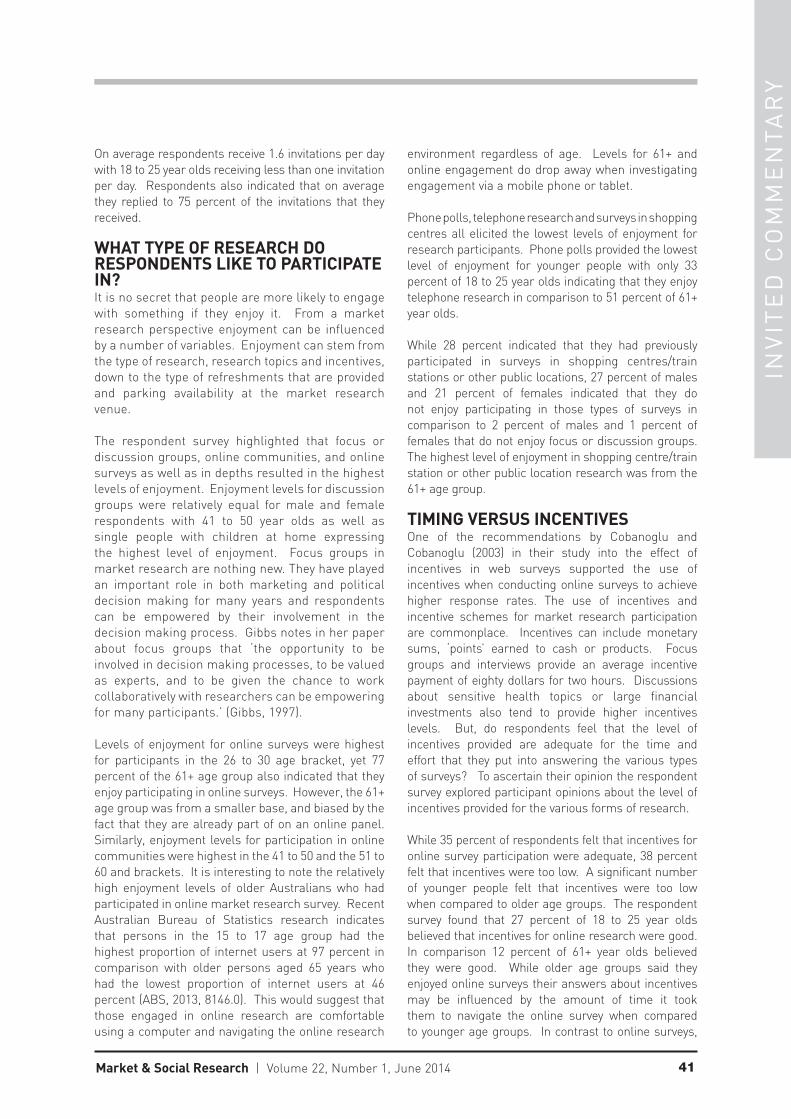
INV
ITE
D C
OM
ME
NT
AR
Y
41Market & Social Research | Volume 22, Number 1, June 2014
On average respondents receive 1.6 invitations per day with 18 to 25 year olds receiving less than one invitation per day. Respondents also indicated that on average they replied to 75 percent of the invitations that they received.
WHAT TYPE OF RESEARCH DO RESPONDENTS LIKE TO PARTICIPATE IN?It is no secret that people are more likely to engage with something if they enjoy it. From a market research perspective enjoyment can be influenced by a number of variables. Enjoyment can stem from the type of research, research topics and incentives, down to the type of refreshments that are provided and parking availability at the market research venue.
The respondent survey highlighted that focus or discussion groups, online communities, and online surveys as well as in depths resulted in the highest levels of enjoyment. Enjoyment levels for discussion groups were relatively equal for male and female respondents with 41 to 50 year olds as well as single people with children at home expressing the highest level of enjoyment. Focus groups in market research are nothing new. They have played an important role in both marketing and political decision making for many years and respondents can be empowered by their involvement in the decision making process. Gibbs notes in her paper about focus groups that ‘the opportunity to be involved in decision making processes, to be valued as experts, and to be given the chance to work collaboratively with researchers can be empowering for many participants.’ (Gibbs, 1997).
Levels of enjoyment for online surveys were highest for participants in the 26 to 30 age bracket, yet 77 percent of the 61+ age group also indicated that they enjoy participating in online surveys. However, the 61+ age group was from a smaller base, and biased by the fact that they are already part of on an online panel. Similarly, enjoyment levels for participation in online communities were highest in the 41 to 50 and the 51 to 60 and brackets. It is interesting to note the relatively high enjoyment levels of older Australians who had participated in online market research survey. Recent Australian Bureau of Statistics research indicates that persons in the 15 to 17 age group had the highest proportion of internet users at 97 percent in comparison with older persons aged 65 years who had the lowest proportion of internet users at 46 percent (ABS, 2013, 8146.0). This would suggest that those engaged in online research are comfortable using a computer and navigating the online research
environment regardless of age. Levels for 61+ and online engagement do drop away when investigating engagement via a mobile phone or tablet.
Phone polls, telephone research and surveys in shopping centres all elicited the lowest levels of enjoyment for research participants. Phone polls provided the lowest level of enjoyment for younger people with only 33 percent of 18 to 25 year olds indicating that they enjoy telephone research in comparison to 51 percent of 61+ year olds.
While 28 percent indicated that they had previously participated in surveys in shopping centres/train stations or other public locations, 27 percent of males and 21 percent of females indicated that they do not enjoy participating in those types of surveys in comparison to 2 percent of males and 1 percent of females that do not enjoy focus or discussion groups. The highest level of enjoyment in shopping centre/train station or other public location research was from the 61+ age group.
TIMING VERSUS INCENTIVESOne of the recommendations by Cobanoglu and Cobanoglu (2003) in their study into the effect of incentives in web surveys supported the use of incentives when conducting online surveys to achieve higher response rates. The use of incentives and incentive schemes for market research participation are commonplace. Incentives can include monetary sums, ‘points’ earned to cash or products. Focus groups and interviews provide an average incentive payment of eighty dollars for two hours. Discussions about sensitive health topics or large financial investments also tend to provide higher incentives levels. But, do respondents feel that the level of incentives provided are adequate for the time and effort that they put into answering the various types of surveys? To ascertain their opinion the respondent survey explored participant opinions about the level of incentives provided for the various forms of research.
While 35 percent of respondents felt that incentives for online survey participation were adequate, 38 percent felt that incentives were too low. A significant number of younger people felt that incentives were too low when compared to older age groups. The respondent survey found that 27 percent of 18 to 25 year olds believed that incentives for online research were good. In comparison 12 percent of 61+ year olds believed they were good. While older age groups said they enjoyed online surveys their answers about incentives may be influenced by the amount of time it took them to navigate the online survey when compared to younger age groups. In contrast to online surveys,
INV
ITE
D C
OM
ME
NT
AR
Y
42Market & Social Research | Volume 22, Number 1, June 2014
the vast majority of respondents felt that incentives for discussion groups were good or adequate. Incentives for participation in online communities, blogs and forums also elicited a response where 22 percent felt incentives were adequate but 19 percent believed they were too low. In terms of participation rates, 49% of respondents indicated that they had not participated in this type of research. The relatively infancy of online community research is highlighted in the Research Industry Council of Australia’s report Australian Markets and Social Research Industry Summary 2012 that notes in 2012 only 2 percent of the total research turnover of Australian market research companies was achieved through online (client owned) community panels. (Research Industry Council of Australia, 2013)
Incentives are relevant to survey participation yet it was timing that trumped incentives when it came to the decision whether to participate in some research and not others. The respondent survey showed 76 percent considered that lack of time was the reason that they participated in some research and not others compared to 52 percent who engaged because of incentives and 42 percent for the survey topic.
Recent findings of the OECD Better Life Initiative research highlight that while Australia ranks at the top in civic engagement and above average for environmental quality, health status, housing, personal security, jobs and earnings, education and skills, subjective
well-being, social connections and income and wealth, it ranks in the bottom 20 percent in terms of work-life balance (OECD, 2014). The survey respondents could be reflective of broader OECD findings that highlight poor work-life balance results for Australians and therefore a lack of disposable time.
If lack of time is significant then answers related to the time that respondents would be more likely to answer a survey become more relevant. The respondent survey showed that the most popular time for survey participation was weekday evenings at 61 percent, followed by Saturday day time at 54 percent and Sunday daytime at 52 percent.
WHAT DO RESPONDENTS LIKE ABOUT ENGAGING IN MARKET RESEARCH?As a result of their study focusing on leverage salience theory, Groves, Presser and Dipko (2004) noted that persons cooperated at higher rates to surveys on topics of likely interest to them. Participant interest in a topic was highlighted as the most important factor in relation to enjoyment levels in group discussions.
More male than female respondents indicated that giving their opinion was the first preference when asked about the reason why they attended market research. Providing an opinion proved popular regardless of the survey method. It was most popular during in-depths
INV
ITE
D C
OM
ME
NT
AR
Y
43Market & Social Research | Volume 22, Number 1, June 2014
and street/central location surveys at 37 percent, followed by telephone and phone polls at 36 percent, online survey and groups at 35 percent and online community research at 33 percent. Incentives ranked highest for 18 to 25 year olds and married/de-facto couples with no children. Enjoyment related to finding out about new products and services also rated well with this group. It appears that people do not really attend research to meet other people as enjoying the market research process and meeting other people achieved the lowest ranking responses.
The Nielsen Top Media Advertisers Australia for 2013 report noted that ‘the top 10 advertiser groups in Australia spent an estimated $1.2 billion in 2013. The categories which were most representative in this elite list of top 10 advertiser groups were a combination of retail, motor vehicle, government, FMCG and communication categories’ (Nielsen, 2014).
If these categories are viewed in terms of research topics that people enjoy most we can see that food, health and other grocery items top the list. Demographic variables across those findings highlight that more women than men prefer surveys about food and other grocery items. Older Australians 61+ enjoy surveys about food, health and government or social issues. As the age of respondent groups increased so did the percentage of those who enjoyed surveys about government or social issues. Enjoyment levels for surveys about alcohol and non-alcoholic beverage were quite similar except for the 18-25 age groups who enjoyed surveys about alcohol more than other age groups. Surveys about financial, technical and automotive had the lowest enjoyment levels, especially for female respondents.
When answering market research surveys 29 percent of respondents said that they had enjoyed completing surveys about food online and by telephone, followed by online community and groups and street/central location at 28 percent. The percentage of respondents who enjoyed surveys about food across all survey methods was more than double that of health and other grocery items. This could support an argument that respondents engage with surveys that are of interest to them, regardless of survey method.
WHAT FRUSTRATES RESPONDENTS WHEN PARTICIPATING IN MARKET RESEARCH?A lot of effort goes into ensuring that survey design not only engages participants but also promotes quality. Issues associated with poorly written questions, survey length and technological skills are all relevant when considering engagement with the end users. When
asked to name their top three frustrations when answering surveys 19 percent of respondents said that completing prequalifying questionnaires and never being contacted was their biggest concern. This was followed by completing surveys and failing at the end and irrelevant/repeated questions at 17 percent. Survey length was the biggest frustration for 16 percent of respondents followed by confusing questions such as double negatives at 12 percent, asking questions that you have already given to a panel at 11 percent and poor questionnaire design at 9 percent.
It probably does not come as a huge surprise that survey length was particularly problematic for the millennial 18 to 25 years age group and single people with children at home. A larger percentage of age groups 41 and above expressed frustration at completing pre-qualifying questionnaires and never being contacted again, this was also particularly relevant for the 61+ age group.
It is interesting to note that the percentage of respondents who expressed frustration at completing pre-qualifying questionnaires and never again being contacted was fairly equal across online surveys, groups, telephone, street/central locations and phone polls. When asked about their top three frustrations, online communities, phone polls and telephone research came out on top.
The percentage of people that highlighted frustration with poor questionnaire design was less than half when compared to completing pre-qualifying questionnaires and never being contact across all types of research. That finding could highlight the fact that the concept of poor survey design is more relevant to the development of industry standards and best practice rather than respondent satisfaction and engagement.
THOUGHTS ABOUT PRE-TASKS OR HOMEWORKPre-tasks or homework often form part of the research process to assist with research engagement and also to help facilitate discussion that delves deeper into respondent insight. Respondents may be requested to complete a task prior to their participation in a group discussion or an interview. Respondents also often receive additional incentives for completing pre-tasks or homework depending on the length and complexity of the task.
When responding to questions about pre-tasks or homework 60 percent of respondents felt that it helped with discussion during research while 15 percent indicated that they felt it was a challenge to complete. The 51-60 year olds felt that pre-tasks and homework helped with discussion during research at 67 percent
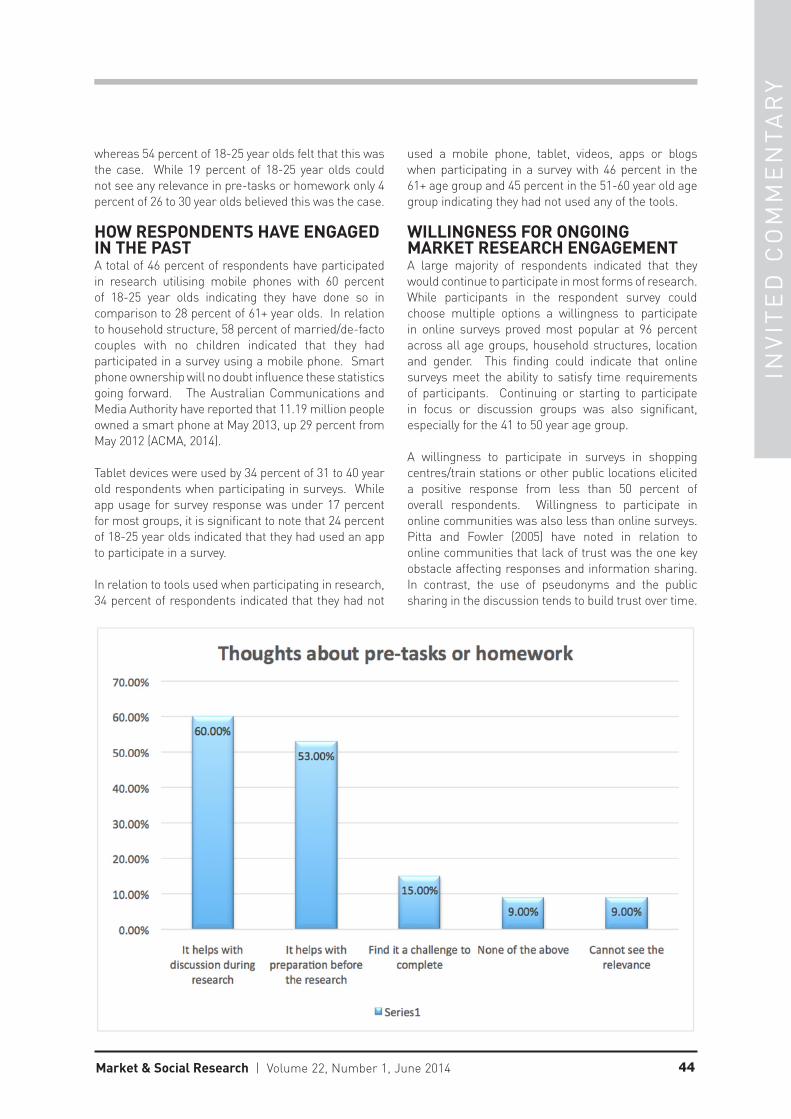
INV
ITE
D C
OM
ME
NT
AR
Y
44Market & Social Research | Volume 22, Number 1, June 2014
whereas 54 percent of 18-25 year olds felt that this was the case. While 19 percent of 18-25 year olds could not see any relevance in pre-tasks or homework only 4 percent of 26 to 30 year olds believed this was the case.
HOW RESPONDENTS HAVE ENGAGED IN THE PASTA total of 46 percent of respondents have participated in research utilising mobile phones with 60 percent of 18-25 year olds indicating they have done so in comparison to 28 percent of 61+ year olds. In relation to household structure, 58 percent of married/de-facto couples with no children indicated that they had participated in a survey using a mobile phone. Smart phone ownership will no doubt influence these statistics going forward. The Australian Communications and Media Authority have reported that 11.19 million people owned a smart phone at May 2013, up 29 percent from May 2012 (ACMA, 2014).
Tablet devices were used by 34 percent of 31 to 40 year old respondents when participating in surveys. While app usage for survey response was under 17 percent for most groups, it is significant to note that 24 percent of 18-25 year olds indicated that they had used an app to participate in a survey.
In relation to tools used when participating in research, 34 percent of respondents indicated that they had not
used a mobile phone, tablet, videos, apps or blogs when participating in a survey with 46 percent in the 61+ age group and 45 percent in the 51-60 year old age group indicating they had not used any of the tools.
WILLINGNESS FOR ONGOING MARKET RESEARCH ENGAGEMENTA large majority of respondents indicated that they would continue to participate in most forms of research. While participants in the respondent survey could choose multiple options a willingness to participate in online surveys proved most popular at 96 percent across all age groups, household structures, location and gender. This finding could indicate that online surveys meet the ability to satisfy time requirements of participants. Continuing or starting to participate in focus or discussion groups was also significant, especially for the 41 to 50 year age group.
A willingness to participate in surveys in shopping centres/train stations or other public locations elicited a positive response from less than 50 percent of overall respondents. Willingness to participate in online communities was also less than online surveys. Pitta and Fowler (2005) have noted in relation to online communities that lack of trust was the one key obstacle affecting responses and information sharing. In contrast, the use of pseudonyms and the public sharing in the discussion tends to build trust over time.
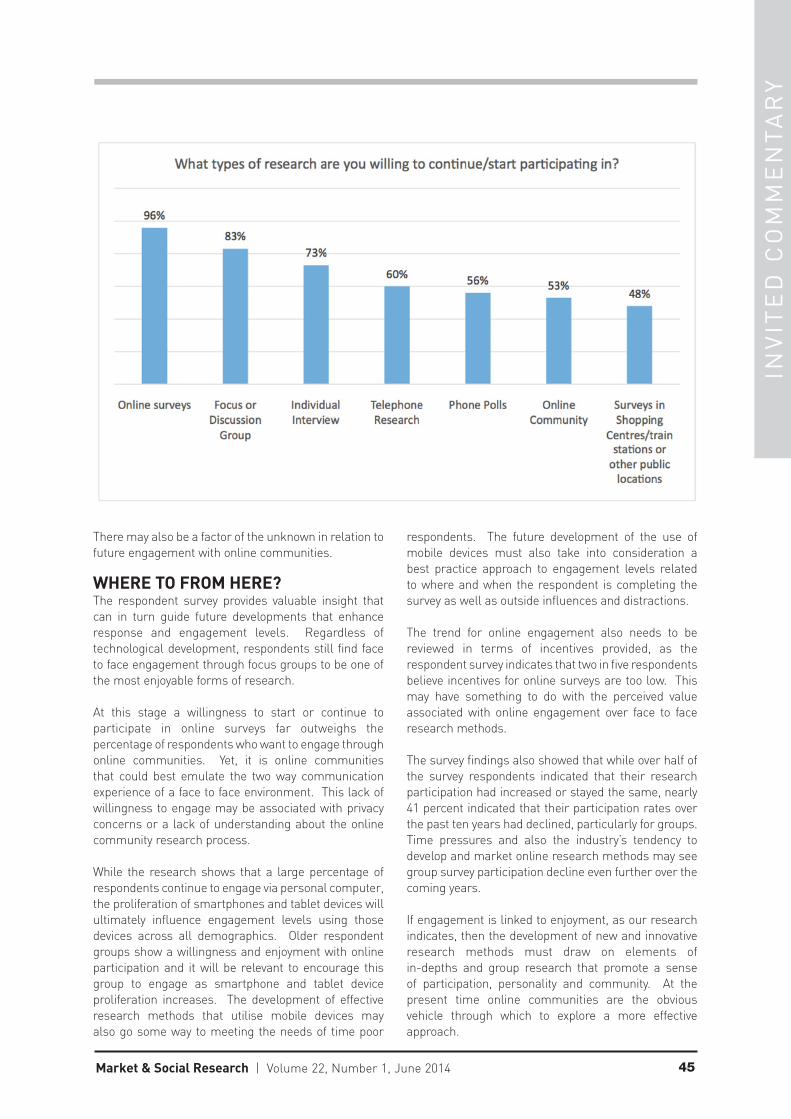
INV
ITE
D C
OM
ME
NT
AR
Y
45Market & Social Research | Volume 22, Number 1, June 2014
There may also be a factor of the unknown in relation to future engagement with online communities.
WHERE TO FROM HERE?The respondent survey provides valuable insight that can in turn guide future developments that enhance response and engagement levels. Regardless of technological development, respondents still find face to face engagement through focus groups to be one of the most enjoyable forms of research.
At this stage a willingness to start or continue to participate in online surveys far outweighs the percentage of respondents who want to engage through online communities. Yet, it is online communities that could best emulate the two way communication experience of a face to face environment. This lack of willingness to engage may be associated with privacy concerns or a lack of understanding about the online community research process.
While the research shows that a large percentage of respondents continue to engage via personal computer, the proliferation of smartphones and tablet devices will ultimately influence engagement levels using those devices across all demographics. Older respondent groups show a willingness and enjoyment with online participation and it will be relevant to encourage this group to engage as smartphone and tablet device proliferation increases. The development of effective research methods that utilise mobile devices may also go some way to meeting the needs of time poor
respondents. The future development of the use of mobile devices must also take into consideration a best practice approach to engagement levels related to where and when the respondent is completing the survey as well as outside influences and distractions.
The trend for online engagement also needs to be reviewed in terms of incentives provided, as the respondent survey indicates that two in five respondents believe incentives for online surveys are too low. This may have something to do with the perceived value associated with online engagement over face to face research methods.
The survey findings also showed that while over half of the survey respondents indicated that their research participation had increased or stayed the same, nearly 41 percent indicated that their participation rates over the past ten years had declined, particularly for groups. Time pressures and also the industry’s tendency to develop and market online research methods may see group survey participation decline even further over the coming years.
If engagement is linked to enjoyment, as our research indicates, then the development of new and innovative research methods must draw on elements of in-depths and group research that promote a sense of participation, personality and community. At the present time online communities are the obvious vehicle through which to explore a more effective approach.
INV
ITE
D C
OM
ME
NT
AR
Y
46Market & Social Research | Volume 22, Number 1, June 2014
REFERENCES
Australian Bureau of Statistics, (2012). Population by age and sex, regions of Australia, 2011. 3235.0
Australian Bureau of Statistics, (2013). Household use of information technology, Australia, 2012-13. 8146.0
Australian Communications and Media Authority, (2014). Australia’s mobile digital economy – ACMA confirms usage, choice, mobility and intensity on the rise. Retrieved on May 2014 from http://www.acma.gov.au/theACMA/Library/Corporate-library/Corporate-publications/australia-mobile-digital-economy.
Cobanoglu, C., & Cobanoglu, N. (2003). The effect of incentives in web surveys: application and ethical considerations. International Journal of Market Research, 45 (4), 475-485
Downes-Le Guin, T., Baker, R., Mechling, J.,& Ruylea, E. (2012). Myths and realities of respondent engagement in online surveys. International Journal of Market Research, 54 (5), 1-21
Gibbs, A. (1997). Focus groups. Social Research Update, University of Surrey. Retrieved on May 2014 from http://sru.soc.surrey.ac.uk/SRU19.html
Groves, R. M., Presser, S., & Dipko, S. (2004). The Role of topic interest in survey participation Decisions. Public Opinion Quarterly, 68 (1) Retrieved on May 2014 from http://poq.oxfordjournals.org/content/68/1/2.full#sec-12
Pitta, D. A., Fowler, D., (2005). Online consumer communities and their value to new product developers. Journal of Product & Brand Management, 14 (5). Retrieved on May 2014 from http://home.ubalt.edu/ntsbpitt/Onlinepercent20Consumerpercent20Communities.pdf
Research Industry Council of Australia (RICA), (2013). Australian Market and Social Research Industry Summary 2012, July 2013, p10
The Nielsen Company, (2014). The Top Media Advertisers January to December 2013. Retrieved on May 2014 from http://www.shopnielsen.com/downloads/nielsen_top_ad_report_march_2014_sampler.pdf
The Organisation for Economic Co-operation and Development, (2014). OECD Better Life Initiative Retrieved on May 2014 from http://www.oecd.org/general/Better-life-index-2014-country-reports.pdf

Not a QPMR but would like to be?It’s not that hard. AMSRS members wishing to become QPMR sit a no cost exam
and the required study text books are available for loan from AMSRS.
Speak to us at AMSRS about how to obtain QPMR or check out information at www.amsrs.com.au/professional-standards/qpmr-accreditation
QUALIFIED PRACTISING MARKET RESEARCHERS
Being a QPMR accredited member is more than just letters after your name. It is evidence of a commitment to being the best and it demonstrates those QPMR senior researchers are:
• CONTEMPORARY – and up to date with current ethical, legislative and privacy regulations that affect the industry; they are required to undertake yearly updates
• EXPERIENCED AND KNOWLEDGEABLE – with a minimum of 5 years in the industry and able to meet the due diligence requirements for the ISO standards – ISO 20252 and ISO 26326
• COMMITTED – to the market and social research industry and to individual professional development and learning
• COURAGEOUS – to acknowledge a world of constant change and to ensure they are keeping up to date with industry developments
• CURIOUS – about the world in general and research in particular to bring the best information possible to the client
• ENGAGED - with the changes occurring in the world of research