MARKET RESEARCH REPORT IN RESPECT OF THE ...
100
MARKET RESEARCH REPORT IN RESPECT OF THE LOGISTICS INDUSTRY AND LOGISTICS PROPERTY MARKET IN THE PRC AND HONG KONG CLIENT: SF REIT Asset Management Limited REF. NO.: DATE: Important This report is for the use only of the party to whom it is addressed for the specific purposes to which it refers and no responsibility is accepted to any third party for use of or reliance on the whole or any part of its contents for any purpose. Neither the whole nor any part of this report or any reference thereto may be included in any document, circular or statement without our prior written approval of the form and context in which it will appear. APPENDIX V LETTER FROM THE MARKET CONSULTANT IN RELATION TO ITS MARKET CONSULTANT REPORT – V-1 – THIS DOCUMENT IS IN DRAFT FORM, INCOMPLETE AND SUBJECT TO CHANGE AND THAT THE INFORMATION MUST BE READ IN CONJUNCTION WITH THE SECTION HEADED “WARNING” ON THE COVER OF THIS DOCUMENT.
-
Upload
khangminh22 -
Category
Documents
-
view
3 -
download
0
Transcript of MARKET RESEARCH REPORT IN RESPECT OF THE ...
MARKET RESEARCH REPORTIN RESPECT OF
THE LOGISTICS INDUSTRY AND LOGISTICS PROPERTYMARKET
INTHE PRC AND HONG KONG
CLIENT: SF REIT Asset Management LimitedREF. NO.:DATE:
Important
This report is for the use only of the party to whom it is addressed for the specific purposes to which it refers andno responsibility is accepted to any third party for use of or reliance on the whole or any part of its contents for anypurpose.
Neither the whole nor any part of this report or any reference thereto may be included in any document, circular orstatement without our prior written approval of the form and context in which it will appear.
APPENDIX V LETTER FROM THE MARKET CONSULTANT INRELATION TO ITS MARKET CONSULTANT REPORT
– V-1 –
THIS DOCUMENT IS IN DRAFT FORM, INCOMPLETE AND SUBJECT TO CHANGE AND THAT THE INFORMATION MUST BE READIN CONJUNCTION WITH THE SECTION HEADED “WARNING” ON THE COVER OF THIS DOCUMENT.
Jones Lang LaSalle Corporate Appraisal
and Advisory Limited
7/F One Taikoo Place
979 King’s Road Hong Kong
tel +852 2846 5000 fax +852 2169 6001
Company Licence No.: C-030171
仲量聯行企業評估及諮詢有限公司香港英皇道979號太古坊一座7樓電話 +852 2846 5000 傳真 +852 2169 6001
公司牌照號碼:C-030171
Our ref:
The Board of Directors
Dear Sirs,
Re: [●]
In accordance with instructions of SF REIT Asset Management Limited (in its capacity
as manager of SF Real Estate Investment Trust) (“REIT Manager”), Jones Lang LaSalle
Corporate Appraisal and Advisory Limited (“JLL” or “We”) has prepared a research report on
the logistics industry and logistics property market in the PRC and Hong Kong for the purpose
of inclusion of relevant information in section of Appendix Report of the Prospects to be
issued in connection with the proposed [REDACTED] on The Stock Exchange of Hong Kong.
JLL is pleased to enclose herewith the market research report for your attention in due
course.
Yours faithfully,
For and on behalf of
Jones Lang LaSalle Corporate Appraisal and Advisory Limited
Gilbert C.H. ChanMRICS MHKIS RPS (GP)
Senior Director
APPENDIX V LETTER FROM THE MARKET CONSULTANT INRELATION TO ITS MARKET CONSULTANT REPORT
– V-2 –
THIS DOCUMENT IS IN DRAFT FORM, INCOMPLETE AND SUBJECT TO CHANGE AND THAT THE INFORMATION MUST BE READIN CONJUNCTION WITH THE SECTION HEADED “WARNING” ON THE COVER OF THIS DOCUMENT.
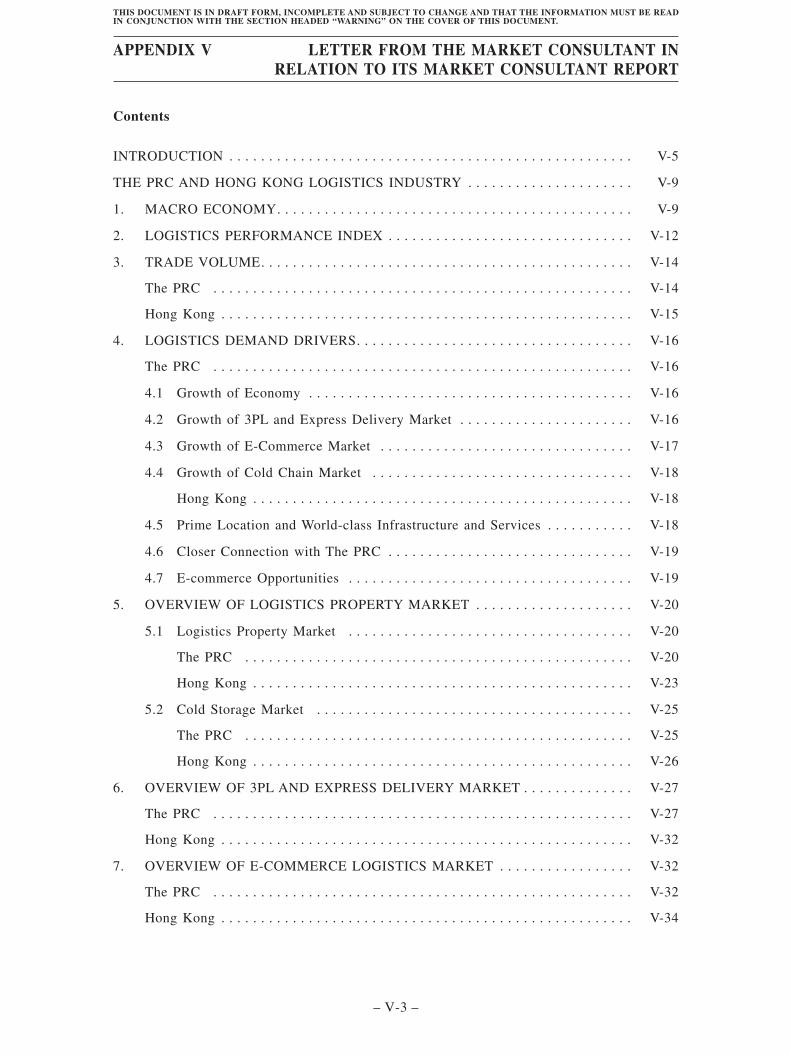
Contents
INTRODUCTION . . . . . . . . . . . . . . . . . . . . . . . . . . . . . . . . . . . . . . . . . . . . . . . . . . . V-5
THE PRC AND HONG KONG LOGISTICS INDUSTRY . . . . . . . . . . . . . . . . . . . . . V-9
1. MACRO ECONOMY. . . . . . . . . . . . . . . . . . . . . . . . . . . . . . . . . . . . . . . . . . . . . V-9
2. LOGISTICS PERFORMANCE INDEX . . . . . . . . . . . . . . . . . . . . . . . . . . . . . . . V-12
3. TRADE VOLUME. . . . . . . . . . . . . . . . . . . . . . . . . . . . . . . . . . . . . . . . . . . . . . . V-14
The PRC . . . . . . . . . . . . . . . . . . . . . . . . . . . . . . . . . . . . . . . . . . . . . . . . . . . . . V-14
Hong Kong . . . . . . . . . . . . . . . . . . . . . . . . . . . . . . . . . . . . . . . . . . . . . . . . . . . . V-15
4. LOGISTICS DEMAND DRIVERS. . . . . . . . . . . . . . . . . . . . . . . . . . . . . . . . . . . V-16
The PRC . . . . . . . . . . . . . . . . . . . . . . . . . . . . . . . . . . . . . . . . . . . . . . . . . . . . . V-16
4.1 Growth of Economy . . . . . . . . . . . . . . . . . . . . . . . . . . . . . . . . . . . . . . . . . V-16
4.2 Growth of 3PL and Express Delivery Market . . . . . . . . . . . . . . . . . . . . . . V-16
4.3 Growth of E-Commerce Market . . . . . . . . . . . . . . . . . . . . . . . . . . . . . . . . V-17
4.4 Growth of Cold Chain Market . . . . . . . . . . . . . . . . . . . . . . . . . . . . . . . . . V-18
Hong Kong . . . . . . . . . . . . . . . . . . . . . . . . . . . . . . . . . . . . . . . . . . . . . . . . V-18
4.5 Prime Location and World-class Infrastructure and Services . . . . . . . . . . . V-18
4.6 Closer Connection with The PRC . . . . . . . . . . . . . . . . . . . . . . . . . . . . . . . V-19
4.7 E-commerce Opportunities . . . . . . . . . . . . . . . . . . . . . . . . . . . . . . . . . . . . V-19
5. OVERVIEW OF LOGISTICS PROPERTY MARKET . . . . . . . . . . . . . . . . . . . . V-20
5.1 Logistics Property Market . . . . . . . . . . . . . . . . . . . . . . . . . . . . . . . . . . . . V-20
The PRC . . . . . . . . . . . . . . . . . . . . . . . . . . . . . . . . . . . . . . . . . . . . . . . . . V-20
Hong Kong . . . . . . . . . . . . . . . . . . . . . . . . . . . . . . . . . . . . . . . . . . . . . . . . V-23
5.2 Cold Storage Market . . . . . . . . . . . . . . . . . . . . . . . . . . . . . . . . . . . . . . . . V-25
The PRC . . . . . . . . . . . . . . . . . . . . . . . . . . . . . . . . . . . . . . . . . . . . . . . . . V-25
Hong Kong . . . . . . . . . . . . . . . . . . . . . . . . . . . . . . . . . . . . . . . . . . . . . . . . V-26
6. OVERVIEW OF 3PL AND EXPRESS DELIVERY MARKET . . . . . . . . . . . . . . V-27
The PRC . . . . . . . . . . . . . . . . . . . . . . . . . . . . . . . . . . . . . . . . . . . . . . . . . . . . . V-27
Hong Kong . . . . . . . . . . . . . . . . . . . . . . . . . . . . . . . . . . . . . . . . . . . . . . . . . . . . V-32
7. OVERVIEW OF E-COMMERCE LOGISTICS MARKET . . . . . . . . . . . . . . . . . V-32
The PRC . . . . . . . . . . . . . . . . . . . . . . . . . . . . . . . . . . . . . . . . . . . . . . . . . . . . . V-32
Hong Kong . . . . . . . . . . . . . . . . . . . . . . . . . . . . . . . . . . . . . . . . . . . . . . . . . . . . V-34
APPENDIX V LETTER FROM THE MARKET CONSULTANT INRELATION TO ITS MARKET CONSULTANT REPORT
– V-3 –
THIS DOCUMENT IS IN DRAFT FORM, INCOMPLETE AND SUBJECT TO CHANGE AND THAT THE INFORMATION MUST BE READIN CONJUNCTION WITH THE SECTION HEADED “WARNING” ON THE COVER OF THIS DOCUMENT.
8. OVERVIEW OF OTHER LOGISTICS MARKET . . . . . . . . . . . . . . . . . . . . . . . V-35
8.1 Air Freight . . . . . . . . . . . . . . . . . . . . . . . . . . . . . . . . . . . . . . . . . . . . . . . . V-35
The PRC . . . . . . . . . . . . . . . . . . . . . . . . . . . . . . . . . . . . . . . . . . . . . . . . . V-35
Hong Kong . . . . . . . . . . . . . . . . . . . . . . . . . . . . . . . . . . . . . . . . . . . . . . . . V-37
8.2 Cold Chain Logistics . . . . . . . . . . . . . . . . . . . . . . . . . . . . . . . . . . . . . . . . . V-38
The PRC . . . . . . . . . . . . . . . . . . . . . . . . . . . . . . . . . . . . . . . . . . . . . . . . . . V-38
Hong Kong . . . . . . . . . . . . . . . . . . . . . . . . . . . . . . . . . . . . . . . . . . . . . . . . V-39
8.3 International Parcels . . . . . . . . . . . . . . . . . . . . . . . . . . . . . . . . . . . . . . . . . V-39
8.4 Inter-city delivery . . . . . . . . . . . . . . . . . . . . . . . . . . . . . . . . . . . . . . . . . . . V-39
8.5 Intra-city on-demand delivery . . . . . . . . . . . . . . . . . . . . . . . . . . . . . . . . . . V-40
The PRC . . . . . . . . . . . . . . . . . . . . . . . . . . . . . . . . . . . . . . . . . . . . . . . . . . V-40
Hong Kong . . . . . . . . . . . . . . . . . . . . . . . . . . . . . . . . . . . . . . . . . . . . . . . . V-41
8.6 Supply Chain Logistics . . . . . . . . . . . . . . . . . . . . . . . . . . . . . . . . . . . . . . . V-42
MODERN LOGISTICS PROPERTY INDUSTRY. . . . . . . . . . . . . . . . . . . . . . . . . . . . V-43
1. OVERVIEW . . . . . . . . . . . . . . . . . . . . . . . . . . . . . . . . . . . . . . . . . . . . . . . . . . . V-43
1.1 In APAC . . . . . . . . . . . . . . . . . . . . . . . . . . . . . . . . . . . . . . . . . . . . . . . . . . V-43
1.2 In the PRC . . . . . . . . . . . . . . . . . . . . . . . . . . . . . . . . . . . . . . . . . . . . . . . . V-44
2. SPECIFICATION ON MODERN LOGISTICS PROPERTY . . . . . . . . . . . . . . . . V-47
2.1 In the PRC . . . . . . . . . . . . . . . . . . . . . . . . . . . . . . . . . . . . . . . . . . . . . . . . V-49
2.2 In Hong Kong . . . . . . . . . . . . . . . . . . . . . . . . . . . . . . . . . . . . . . . . . . . . . . V-50
OVERVIEW OF INDIVIDUAL CITY . . . . . . . . . . . . . . . . . . . . . . . . . . . . . . . . . . . . V-50
1. HONG KONG . . . . . . . . . . . . . . . . . . . . . . . . . . . . . . . . . . . . . . . . . . . . . . . . . . V-50
1.1. Overview . . . . . . . . . . . . . . . . . . . . . . . . . . . . . . . . . . . . . . . . . . . . . . . . . . V-50
1.2. Stock . . . . . . . . . . . . . . . . . . . . . . . . . . . . . . . . . . . . . . . . . . . . . . . . . . . . . V-54
1.3. Supply . . . . . . . . . . . . . . . . . . . . . . . . . . . . . . . . . . . . . . . . . . . . . . . . . . . . V-59
1.4. Vacancy Rate . . . . . . . . . . . . . . . . . . . . . . . . . . . . . . . . . . . . . . . . . . . . . . . V-61
1.5. Rent. . . . . . . . . . . . . . . . . . . . . . . . . . . . . . . . . . . . . . . . . . . . . . . . . . . . . . V-62
1.6. Demand . . . . . . . . . . . . . . . . . . . . . . . . . . . . . . . . . . . . . . . . . . . . . . . . . . . V-63
1.7. Capital Market . . . . . . . . . . . . . . . . . . . . . . . . . . . . . . . . . . . . . . . . . . . . . . V-64
1.8. Outlook . . . . . . . . . . . . . . . . . . . . . . . . . . . . . . . . . . . . . . . . . . . . . . . . . . . V-65
1.9. Comparable Transactions . . . . . . . . . . . . . . . . . . . . . . . . . . . . . . . . . . . . . . V-67
1.10. Individual Asset Analysis. . . . . . . . . . . . . . . . . . . . . . . . . . . . . . . . . . . . . . V-70
APPENDIX V LETTER FROM THE MARKET CONSULTANT INRELATION TO ITS MARKET CONSULTANT REPORT
– V-4 –
THIS DOCUMENT IS IN DRAFT FORM, INCOMPLETE AND SUBJECT TO CHANGE AND THAT THE INFORMATION MUST BE READIN CONJUNCTION WITH THE SECTION HEADED “WARNING” ON THE COVER OF THIS DOCUMENT.
2. FOSHAN CITY . . . . . . . . . . . . . . . . . . . . . . . . . . . . . . . . . . . . . . . . . . . . . . . . . V-74
2.1. Overview . . . . . . . . . . . . . . . . . . . . . . . . . . . . . . . . . . . . . . . . . . . . . . . . . . V-74
2.2. Stock . . . . . . . . . . . . . . . . . . . . . . . . . . . . . . . . . . . . . . . . . . . . . . . . . . . . . V-78
2.3. Supply . . . . . . . . . . . . . . . . . . . . . . . . . . . . . . . . . . . . . . . . . . . . . . . . . . . . V-79
2.4. Vacancy Rate . . . . . . . . . . . . . . . . . . . . . . . . . . . . . . . . . . . . . . . . . . . . . . . V-80
2.5. Rent. . . . . . . . . . . . . . . . . . . . . . . . . . . . . . . . . . . . . . . . . . . . . . . . . . . . . . V-80
2.6. Demand . . . . . . . . . . . . . . . . . . . . . . . . . . . . . . . . . . . . . . . . . . . . . . . . . . . V-81
2.7. Capital Market . . . . . . . . . . . . . . . . . . . . . . . . . . . . . . . . . . . . . . . . . . . . . . V-81
2.8. Outlook . . . . . . . . . . . . . . . . . . . . . . . . . . . . . . . . . . . . . . . . . . . . . . . . . . . V-83
2.9. Comparable Transactions . . . . . . . . . . . . . . . . . . . . . . . . . . . . . . . . . . . . . . V-83
2.10. Individual Asset Analysis. . . . . . . . . . . . . . . . . . . . . . . . . . . . . . . . . . . . . . V-84
3. WUHU CITY. . . . . . . . . . . . . . . . . . . . . . . . . . . . . . . . . . . . . . . . . . . . . . . . . . . V-87
3.1. Overview . . . . . . . . . . . . . . . . . . . . . . . . . . . . . . . . . . . . . . . . . . . . . . . . . . V-87
3.2. Stock . . . . . . . . . . . . . . . . . . . . . . . . . . . . . . . . . . . . . . . . . . . . . . . . . . . . . V-91
3.3. Supply . . . . . . . . . . . . . . . . . . . . . . . . . . . . . . . . . . . . . . . . . . . . . . . . . . . . V-91
3.4. Vacancy Rate . . . . . . . . . . . . . . . . . . . . . . . . . . . . . . . . . . . . . . . . . . . . . . . V-92
3.5. Rent. . . . . . . . . . . . . . . . . . . . . . . . . . . . . . . . . . . . . . . . . . . . . . . . . . . . . . V-92
3.6. Demand . . . . . . . . . . . . . . . . . . . . . . . . . . . . . . . . . . . . . . . . . . . . . . . . . . . V-93
3.7. Capital Market . . . . . . . . . . . . . . . . . . . . . . . . . . . . . . . . . . . . . . . . . . . . . . V-93
3.8. Outlook . . . . . . . . . . . . . . . . . . . . . . . . . . . . . . . . . . . . . . . . . . . . . . . . . . . V-94
3.9. Comparable Transactions . . . . . . . . . . . . . . . . . . . . . . . . . . . . . . . . . . . . . . V-95
3.10. Individual Asset Analysis. . . . . . . . . . . . . . . . . . . . . . . . . . . . . . . . . . . . . . V-96
LIMITING CONDITIONS . . . . . . . . . . . . . . . . . . . . . . . . . . . . . . . . . . . . . . . . . . . . . V-99
INTRODUCTION
In accordance with instructions of SF REIT Asset Management Limited (in its capacity
as manager of SF Real Estate Investment Trust) (“REIT Manager”), Jones Lang LaSalle
Corporate Appraisal and Advisory Limited (“JLL” or “We”) has prepared a research report on
the warehouse market in the PRC and Hong Kong, for the purpose of inclusion of relevant
information in the section of Industry Overview of the Prospectus to be issued in connection
with the proposed [REDACTED] on The Stock Exchange of Hong Kong.
APPENDIX V LETTER FROM THE MARKET CONSULTANT INRELATION TO ITS MARKET CONSULTANT REPORT
– V-5 –
THIS DOCUMENT IS IN DRAFT FORM, INCOMPLETE AND SUBJECT TO CHANGE AND THAT THE INFORMATION MUST BE READIN CONJUNCTION WITH THE SECTION HEADED “WARNING” ON THE COVER OF THIS DOCUMENT.
Certain assumptions have been made in this report because some information is not
available or falls outside the scope of JLL’s knowledge and expertise. While there are
reasonable projections based on information available as at the date of this report, necessary
assumptions have been applied to JLL study. JLL does not warrant the accuracy or correction
of the assumptions.
JLL has relied on the assumptions listed below:
– All relevant records and documents provided by the REIT Manager were true and
correct;
– All published data by relevant statistics bureaus are true and correct;
– All collected information relating to real estate sales transactions from relevant local
housing administrative bureaus were true and correct;
– All land transaction records collected from relevant land resources administrative
bureaus were true and correct;
– Where subscribed data is obtained from renowned public institutions such as Wind
(萬得), a financial information services provider in China. JLL will rely upon the
apparent integrity and expertise of such institutions. JLL will not verify the accuracy
of this information or reports, and assume no responsibility for their accuracy.
It is a general market practice to adopt official data and announcements from various
Chinese government agencies. The information and statistics set out in this section have been
extracted, in part, from various official government publications. JLL believes that the sources
of this information are appropriate sources for such information and statistics and reasonable
care has been exercised by us in extracting and reproducing such information and statistics.
JLL has no reason to believe that such information and statistics are false or misleading or that
any fact has been omitted that would render such information false or misleading. JLL has not
independently verified such information and statistics. Accordingly, JLL does not make any
representation as to the accuracy of such information and statistics, which may be inaccurate,
incomplete, out-of-date or inconsistent with other information compiled within or outside the
PRC.
The major economic and residential property market indicators in the relevant cities of
the PRC have been reviewed in order to provide an overview of the city’s market
characteristics, existing market conditions, emerging trend and prospects as of the date of the
report. The forecast of property sales price should not be predictions of the future. Rather, they
may be considered as the best estimates of current market. JLL makes no warranty or
representation that these forecasts will be achieved. The real estate market is constantly
fluctuating and changing. JLL will not take any responsibility to predict or in any way warrant
the future conditions of residential property market.
APPENDIX V LETTER FROM THE MARKET CONSULTANT INRELATION TO ITS MARKET CONSULTANT REPORT
– V-6 –
THIS DOCUMENT IS IN DRAFT FORM, INCOMPLETE AND SUBJECT TO CHANGE AND THAT THE INFORMATION MUST BE READIN CONJUNCTION WITH THE SECTION HEADED “WARNING” ON THE COVER OF THIS DOCUMENT.
This report was based on desk research of specialised industry literature, government and
regulatory sources, online data sources, third-party reports and surveys. It contains a
significant volume of information which is derived from other sources relating to the economy
and residential property market of the PRC and the relevant city, including National Statistics
Bureau, and other government authorities. JLL has paid necessary attention to its accuracy and
authenticity and does not warrant or represent that such information is free from errors. In the
course of research, JLL conducted site visits and numerous interviews with local developers,
buyers and potential buyers, local marketing agents and market observers in each market.
Moreover, the databases of JLL were utilised if necessary. This report is based on the
information available to us as at January 31st, 2021.
Introduction of JLL
Jones Lang LaSalle Corporate Appraisal and Advisory Limited (formerly known as Jones
Lang LaSalle Sallmanns) is part of Jones Lang LaSalle and it conducts advisory and appraisal
services. Jones Lang LaSalle is a professional services and investment management firm
offering specialised real estate services to clients seeking increased value by owning,
occupying and investing in real estate. Jones Lang LaSalle has more than 280 corporate offices,
operates in more than 80 countries and has a global workforce of more than 93,000.
APPENDIX V LETTER FROM THE MARKET CONSULTANT INRELATION TO ITS MARKET CONSULTANT REPORT
– V-7 –
THIS DOCUMENT IS IN DRAFT FORM, INCOMPLETE AND SUBJECT TO CHANGE AND THAT THE INFORMATION MUST BE READIN CONJUNCTION WITH THE SECTION HEADED “WARNING” ON THE COVER OF THIS DOCUMENT.
Definition
“JLL” Jones Lang LaSalle
“CREIS” China Real Estate Index System
“CAGR” Compound annual growth rate
“GFA” Gross floor area
“N/A” Not available/not applicable
“HKEx” Hong Kong Exchanges and Clearing Limited
APPENDIX V LETTER FROM THE MARKET CONSULTANT INRELATION TO ITS MARKET CONSULTANT REPORT
– V-8 –
THIS DOCUMENT IS IN DRAFT FORM, INCOMPLETE AND SUBJECT TO CHANGE AND THAT THE INFORMATION MUST BE READIN CONJUNCTION WITH THE SECTION HEADED “WARNING” ON THE COVER OF THIS DOCUMENT.
THE PRC AND HONG KONG LOGISTICS INDUSTRY
1. Macro Economy
The PRC
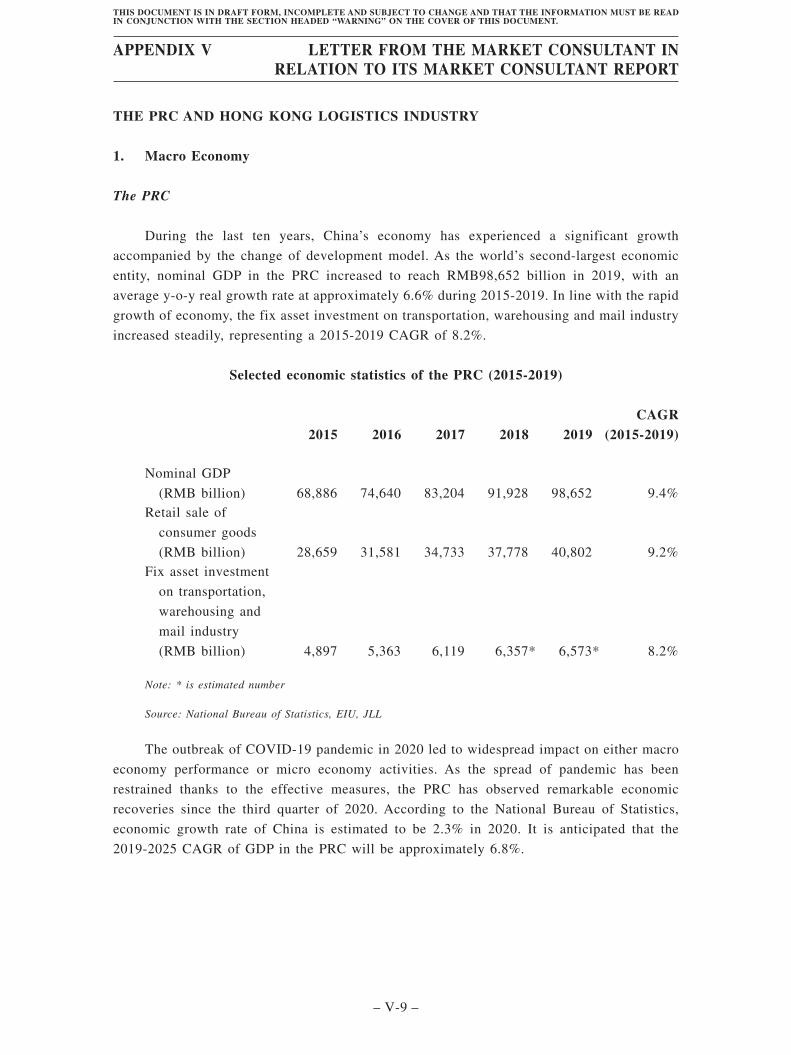
During the last ten years, China’s economy has experienced a significant growth
accompanied by the change of development model. As the world’s second-largest economic
entity, nominal GDP in the PRC increased to reach RMB98,652 billion in 2019, with an
average y-o-y real growth rate at approximately 6.6% during 2015-2019. In line with the rapid
growth of economy, the fix asset investment on transportation, warehousing and mail industry
increased steadily, representing a 2015-2019 CAGR of 8.2%.
Selected economic statistics of the PRC (2015-2019)
2015 2016 2017 2018 2019CAGR
(2015-2019)
Nominal GDP
(RMB billion) 68,886 74,640 83,204 91,928 98,652 9.4%Retail sale of
consumer goods
(RMB billion) 28,659 31,581 34,733 37,778 40,802 9.2%Fix asset investment
on transportation,
warehousing and
mail industry
(RMB billion) 4,897 5,363 6,119 6,357* 6,573* 8.2%
Note: * is estimated number
Source: National Bureau of Statistics, EIU, JLL
The outbreak of COVID-19 pandemic in 2020 led to widespread impact on either macro
economy performance or micro economy activities. As the spread of pandemic has been
restrained thanks to the effective measures, the PRC has observed remarkable economic
recoveries since the third quarter of 2020. According to the National Bureau of Statistics,
economic growth rate of China is estimated to be 2.3% in 2020. It is anticipated that the
2019-2025 CAGR of GDP in the PRC will be approximately 6.8%.
APPENDIX V LETTER FROM THE MARKET CONSULTANT INRELATION TO ITS MARKET CONSULTANT REPORT
– V-9 –
THIS DOCUMENT IS IN DRAFT FORM, INCOMPLETE AND SUBJECT TO CHANGE AND THAT THE INFORMATION MUST BE READIN CONJUNCTION WITH THE SECTION HEADED “WARNING” ON THE COVER OF THIS DOCUMENT.
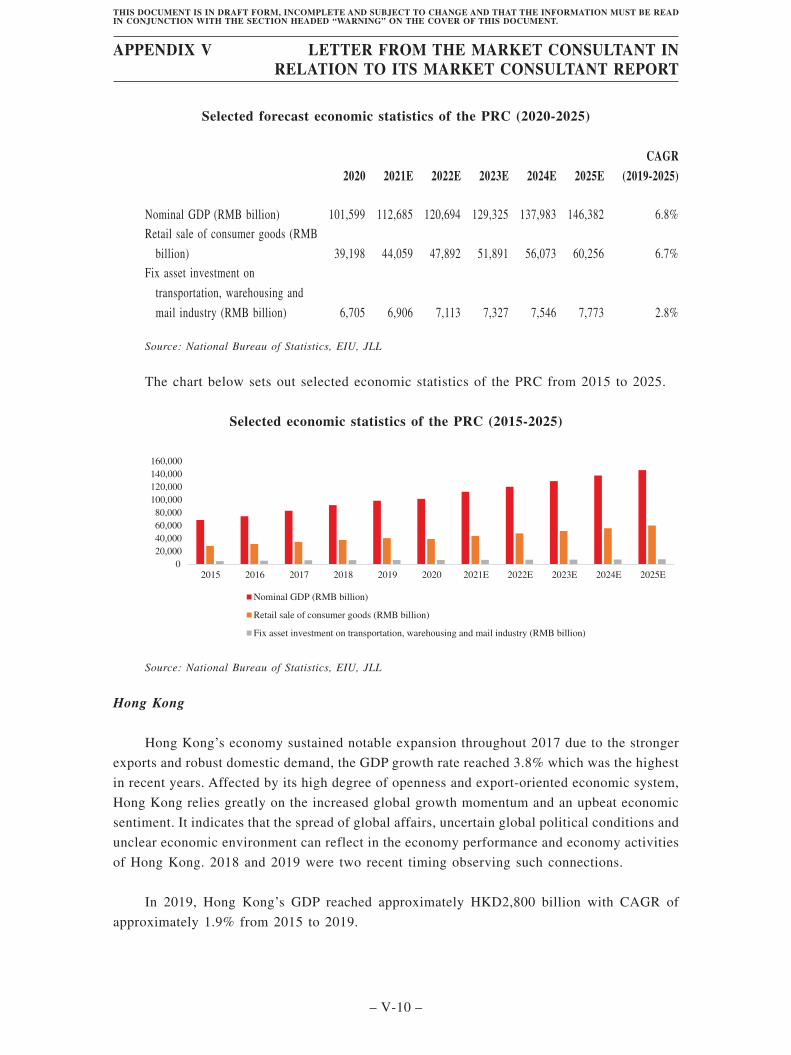
Selected forecast economic statistics of the PRC (2020-2025)
2020 2021E 2022E 2023E 2024E 2025ECAGR
(2019-2025)
Nominal GDP (RMB billion) 101,599 112,685 120,694 129,325 137,983 146,382 6.8%Retail sale of consumer goods (RMB
billion) 39,198 44,059 47,892 51,891 56,073 60,256 6.7%Fix asset investment on
transportation, warehousing and
mail industry (RMB billion) 6,705 6,906 7,113 7,327 7,546 7,773 2.8%
Source: National Bureau of Statistics, EIU, JLL
The chart below sets out selected economic statistics of the PRC from 2015 to 2025.
Selected economic statistics of the PRC (2015-2025)
Nominal GDP (RMB billion)
Retail sale of consumer goods (RMB billion)
Fix asset investment on transportation, warehousing and mail industry (RMB billion)
0
20,000
40,000
60,000
80,000
100,000
120,000
140,000
160,000
2015 2016 2017 2018 2019 2020 2021E 2022E 2023E 2024E 2025E
Source: National Bureau of Statistics, EIU, JLL
Hong Kong
Hong Kong’s economy sustained notable expansion throughout 2017 due to the stronger
exports and robust domestic demand, the GDP growth rate reached 3.8% which was the highest
in recent years. Affected by its high degree of openness and export-oriented economic system,
Hong Kong relies greatly on the increased global growth momentum and an upbeat economic
sentiment. It indicates that the spread of global affairs, uncertain global political conditions and
unclear economic environment can reflect in the economy performance and economy activities
of Hong Kong. 2018 and 2019 were two recent timing observing such connections.
In 2019, Hong Kong’s GDP reached approximately HKD2,800 billion with CAGR of
approximately 1.9% from 2015 to 2019.
APPENDIX V LETTER FROM THE MARKET CONSULTANT INRELATION TO ITS MARKET CONSULTANT REPORT
– V-10 –
THIS DOCUMENT IS IN DRAFT FORM, INCOMPLETE AND SUBJECT TO CHANGE AND THAT THE INFORMATION MUST BE READIN CONJUNCTION WITH THE SECTION HEADED “WARNING” ON THE COVER OF THIS DOCUMENT.

Taking into account the threat of COVID-19 in 2020, the government predicts that Hong
Kong’s GDP will drop 6% to 8% in real terms. In an optimistic scope1, it is estimated that Hong
Kong’s economy will see recovery in 2021 and achieve 2019-2025 CAGR of GDP at
approximately 1.3%.
The table below sets out selected major economic indicators in Hong Kong for the years
indicated.
Selected economic statistics of Hong Kong (2015-2019)
2015 2016 2017 2018 2019CAGR
(2015-2019)
GDP (HKD billion)
constant price 2,600 2,656 2,757 2,835 2,800 1.9%Private consumption
expenditure
(HKD billion)
constant price 1,709 1,743 1,839 1,936 1,915 2.9%
Source: Census and Statistics Department, Wind, EIU, JLL
Selected forecast economic statistics of Hong Kong (2020-2025)
2020E 2021E 2022E 2023E 2024E 2025ECAGR
(2019-2025)
GDP (HKD billion) constant price 2,591 2,686 2,777 2,855 2,934 3,019 1.3%Private consumption expenditure
(HKD billion) constant price 1,724 1,930 1,969 2,008 2,048 2,089 1.5%
Source: International Monetary Fund, Wind, JLL
1 i.e trade tensions between the US and the PRC to be relaxed, the COVID-19 in Hong Kong to be under control,etc.
APPENDIX V LETTER FROM THE MARKET CONSULTANT INRELATION TO ITS MARKET CONSULTANT REPORT
– V-11 –
THIS DOCUMENT IS IN DRAFT FORM, INCOMPLETE AND SUBJECT TO CHANGE AND THAT THE INFORMATION MUST BE READIN CONJUNCTION WITH THE SECTION HEADED “WARNING” ON THE COVER OF THIS DOCUMENT.

The chart below sets out selected economic statistics of Hong Kong from 2015 to 2025.
Selected economic statistics of Hong Kong (2015-2025)
0
500
1,000
1,500
2,000
2,500
3,000
3,500
2015 2016 2017 2018 2019 2020E 2021E 2022E 2023E 2024E 2025E
GDP (HKD billion) constant price Private consumption expenditure (HKD billion) constant price
Source: Census and Statistics Department, International Monetary Fund, Wind, EIU, JLL
2. Logistics Performance Index
The Logistics Performance Index (LPI) is an interdisciplinary World Bank project
launched 10 years ago. The ambition was to develop simple comparators of how efficiently
supply chains connect firms to markets,or logistics performance and help countries frame their
own policies and motivate consistent approaches to interventions and reforms at the national
level. The information on logistics infrastructure, service provision, cross-border trade
facilitation, and other aspects is invaluable for policymakers, traders, and a wide audience of
other stakeholders, including researchers and teachers. These indexes are announced every two
years since most countries’ performance does not change very much over the course of every
year.
The table below sets out selected major economic indicators in the PRC for the years
indicated.
Selected logistics indicators of the PRC (2014, 2016, 2018)
YearOverall
Rank
Ranks of each dimension
Customs InfrastructureInternational
shipmentsLogistics
competenceTracking
& tracing Timeliness
2018 26 31 20 18 27 27 272016 27 31 23 12 27 28 312014 28 38 23 22 35 29 36
Source: Worldbank
APPENDIX V LETTER FROM THE MARKET CONSULTANT INRELATION TO ITS MARKET CONSULTANT REPORT
– V-12 –
THIS DOCUMENT IS IN DRAFT FORM, INCOMPLETE AND SUBJECT TO CHANGE AND THAT THE INFORMATION MUST BE READIN CONJUNCTION WITH THE SECTION HEADED “WARNING” ON THE COVER OF THIS DOCUMENT.
LPI reports referred that China, aligned with developed entitles such as Canada and
France, has set up many national strategies or dedicated organisations advancing logistics,
which showed great determinations from China’s government on developing the industry.
Specifically, the enormous investment on logistics infrastructure played a key role on
promoting the overall rank. Currently, China is the leader in the top-performing upper-middle-
income economies (containing Thailand, South Africa, etc.). Also, the report records that China
has a large government-related Federation of Logistics and Purchasing, which could provide a
stable support to the development of China’s logistics industry in the long run.
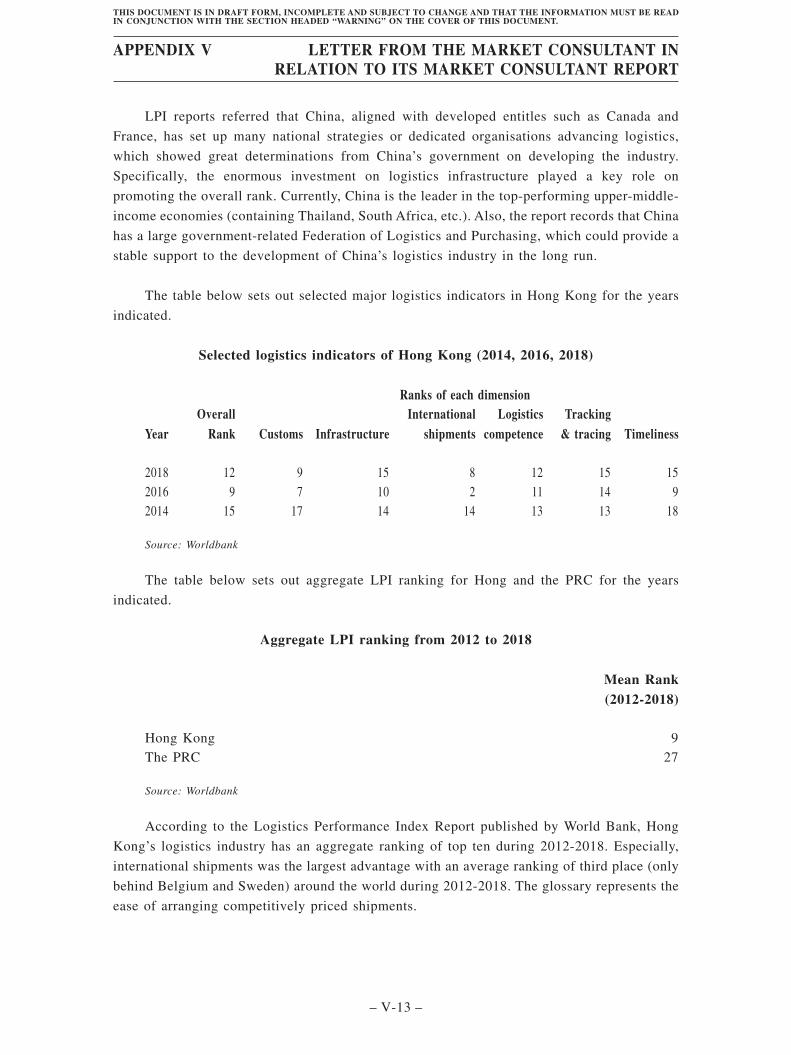
The table below sets out selected major logistics indicators in Hong Kong for the years
indicated.
Selected logistics indicators of Hong Kong (2014, 2016, 2018)
YearOverall
Rank
Ranks of each dimension
Customs InfrastructureInternational
shipmentsLogistics
competenceTracking
& tracing Timeliness
2018 12 9 15 8 12 15 152016 9 7 10 2 11 14 92014 15 17 14 14 13 13 18
Source: Worldbank
The table below sets out aggregate LPI ranking for Hong and the PRC for the years
indicated.
Aggregate LPI ranking from 2012 to 2018
Mean Rank(2012-2018)
Hong Kong 9The PRC 27
Source: Worldbank
According to the Logistics Performance Index Report published by World Bank, Hong
Kong’s logistics industry has an aggregate ranking of top ten during 2012-2018. Especially,
international shipments was the largest advantage with an average ranking of third place (only
behind Belgium and Sweden) around the world during 2012-2018. The glossary represents the
ease of arranging competitively priced shipments.
APPENDIX V LETTER FROM THE MARKET CONSULTANT INRELATION TO ITS MARKET CONSULTANT REPORT
– V-13 –
THIS DOCUMENT IS IN DRAFT FORM, INCOMPLETE AND SUBJECT TO CHANGE AND THAT THE INFORMATION MUST BE READIN CONJUNCTION WITH THE SECTION HEADED “WARNING” ON THE COVER OF THIS DOCUMENT.
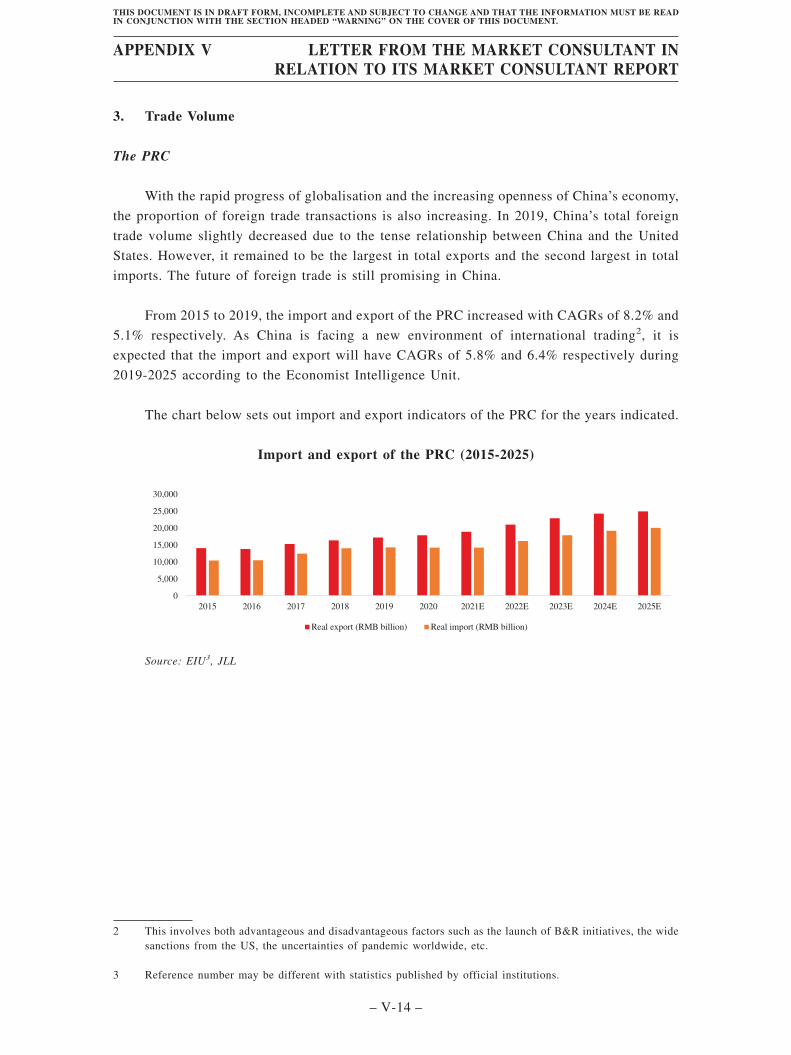
3. Trade Volume
The PRC
With the rapid progress of globalisation and the increasing openness of China’s economy,
the proportion of foreign trade transactions is also increasing. In 2019, China’s total foreign
trade volume slightly decreased due to the tense relationship between China and the United
States. However, it remained to be the largest in total exports and the second largest in total
imports. The future of foreign trade is still promising in China.
From 2015 to 2019, the import and export of the PRC increased with CAGRs of 8.2% and
5.1% respectively. As China is facing a new environment of international trading2, it is
expected that the import and export will have CAGRs of 5.8% and 6.4% respectively during
2019-2025 according to the Economist Intelligence Unit.
The chart below sets out import and export indicators of the PRC for the years indicated.
Import and export of the PRC (2015-2025)
0
5,000
10,000
15,000
20,000
25,000
30,000
2015 2016 2017 2018 2019 2020 2021E 2022E 2023E 2024E 2025E
Real export (RMB billion) Real import (RMB billion)
Source: EIU3, JLL
2 This involves both advantageous and disadvantageous factors such as the launch of B&R initiatives, the widesanctions from the US, the uncertainties of pandemic worldwide, etc.
3 Reference number may be different with statistics published by official institutions.
APPENDIX V LETTER FROM THE MARKET CONSULTANT INRELATION TO ITS MARKET CONSULTANT REPORT
– V-14 –
THIS DOCUMENT IS IN DRAFT FORM, INCOMPLETE AND SUBJECT TO CHANGE AND THAT THE INFORMATION MUST BE READIN CONJUNCTION WITH THE SECTION HEADED “WARNING” ON THE COVER OF THIS DOCUMENT.
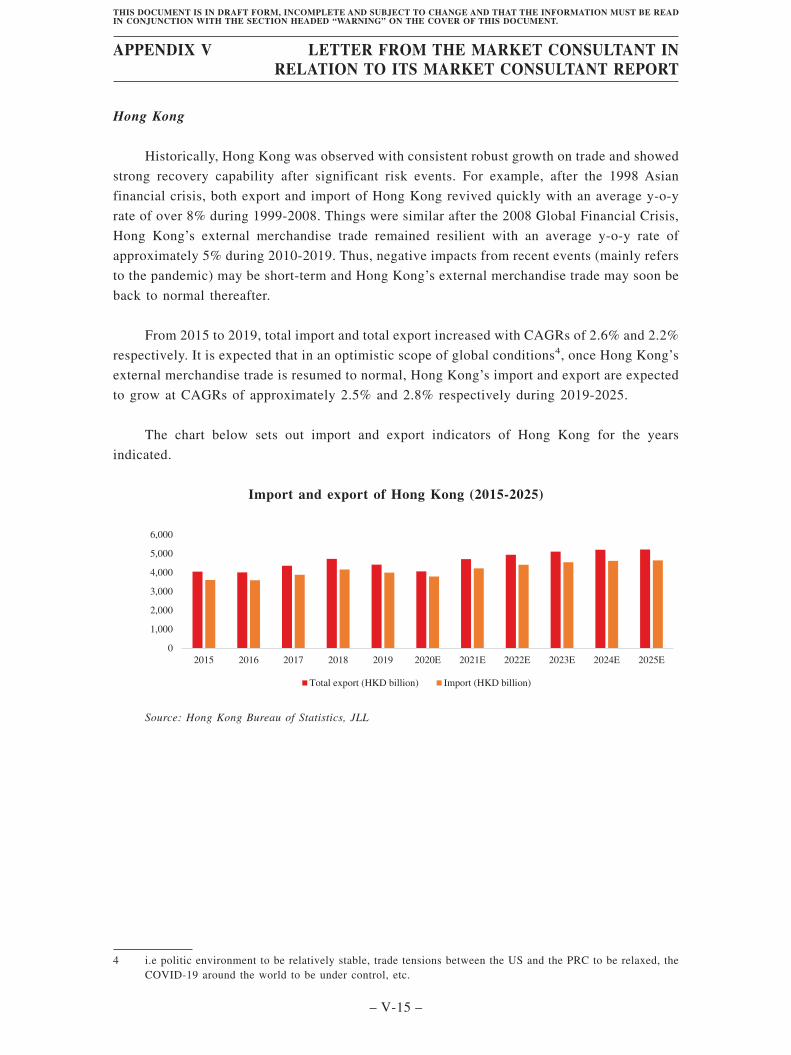
Hong Kong
Historically, Hong Kong was observed with consistent robust growth on trade and showed
strong recovery capability after significant risk events. For example, after the 1998 Asian
financial crisis, both export and import of Hong Kong revived quickly with an average y-o-y
rate of over 8% during 1999-2008. Things were similar after the 2008 Global Financial Crisis,
Hong Kong’s external merchandise trade remained resilient with an average y-o-y rate of
approximately 5% during 2010-2019. Thus, negative impacts from recent events (mainly refers
to the pandemic) may be short-term and Hong Kong’s external merchandise trade may soon be
back to normal thereafter.
From 2015 to 2019, total import and total export increased with CAGRs of 2.6% and 2.2%
respectively. It is expected that in an optimistic scope of global conditions4, once Hong Kong’s
external merchandise trade is resumed to normal, Hong Kong’s import and export are expected
to grow at CAGRs of approximately 2.5% and 2.8% respectively during 2019-2025.
The chart below sets out import and export indicators of Hong Kong for the years
indicated.
Import and export of Hong Kong (2015-2025)
0
1,000
2,000
3,000
4,000
5,000
6,000
2015 2016 2017 2018 2019 2020E 2021E 2022E 2023E 2024E 2025E
Total export (HKD billion) Import (HKD billion)
Source: Hong Kong Bureau of Statistics, JLL
4 i.e politic environment to be relatively stable, trade tensions between the US and the PRC to be relaxed, theCOVID-19 around the world to be under control, etc.
APPENDIX V LETTER FROM THE MARKET CONSULTANT INRELATION TO ITS MARKET CONSULTANT REPORT
– V-15 –
THIS DOCUMENT IS IN DRAFT FORM, INCOMPLETE AND SUBJECT TO CHANGE AND THAT THE INFORMATION MUST BE READIN CONJUNCTION WITH THE SECTION HEADED “WARNING” ON THE COVER OF THIS DOCUMENT.
4. Logistics Demand Drivers
The PRC
4.1 Growth of Economy
The economic growth of the PRC contributes to the rapid expansion of consumer group
in terms of either population or unit consumption. It has also become the main driver for the
development of logistics and warehousing. During the last two decades, the number of urban
households and per capita expenditure in the PRC keep increasing, contributing to the booming
of social consumption. Such trend, together with the steady expansion of middle and high
income groups and the improvement of the disposable income per capita, have expedited the
development of the emerging e-commerce industry, generating demand for 3PL services and
modern logistics facilities.
In 2000, the PRC had only 3 cities with retail sales of consumer goods over RMB100
billion (around USD14.5 billion), while the number of cities skyrocketed to 110 in 2019.
Growing sales of consumer goods categorising fast fashion, durable item, food, beverage,
commodity, motor and so on motivate manufacturers to enlarge production. As a result, it has
generated a growing demand for logistics property, especially those with modern standard.
Another achievement from economic growth lies on the geographical expansion of city
boundary. The emergence of metropolitan clusters, two of them are Yangtze River Delta and
Guangdong-Hong Kong-Macao Greater Bay Area, strengthens the connection and synergy
between cities. Such transformation connotes the mega-construction on transport infrastructure
and the transfer of industrial facilities.
Besides, people in tertiary cities now have stronger willingness and capabilities to
consume. In 2014, the State Council issued the Mid-to-long term development plan for the
logistics industry (2014-2020) (物流業發展中長期規劃(2014-2020年)) which regarded
logistics industry as one of the fundamental and strategic industries for the national economy
development. Taking advantage of metropolitan clusters’ evolution, the distribution of logistics
facility of all kinds significantly widens.
4.2 Growth of 3PL and Express Delivery Market
3PL (including express delivery) is a segment market of logistics services, the growth of
this market has contributed to overall growth of the industry by improving the level of
specialisation.
The 2015-2019 CAGR for express delivery in the PRC 28.3%. It is expected that express
delivery will increase with 2019-2025 CAGR of 15.0%.
APPENDIX V LETTER FROM THE MARKET CONSULTANT INRELATION TO ITS MARKET CONSULTANT REPORT
– V-16 –
THIS DOCUMENT IS IN DRAFT FORM, INCOMPLETE AND SUBJECT TO CHANGE AND THAT THE INFORMATION MUST BE READIN CONJUNCTION WITH THE SECTION HEADED “WARNING” ON THE COVER OF THIS DOCUMENT.

The chart below sets out relevant data showing the revenue for express delivery in the
PRC from 2015-2025.
Revenue for express delivery in the PRC (2015-2025)
-
500
1,000
1,500
2,000
2015 2016 2017 2018 2019 2020 2021E 2022E 2023E 2024E 2025E
Revenue for express delivery (RMB billion)
Source: State Post Bureau, National Bureau of Statistics, Wind, JLL
4.3 Growth of E-Commerce Market
The growth of e-commerce will directly drive the development of logistics. The central
government of the PRC has realised the importance of e-commerce logistics years ago, and has
underlined that the development of e-commerce logistics is crucial for the whole logistics
industry.
In March 2016, the Ministry of Commerce, National Development and Reform
Commission (“NDRC”) and four other major ministries announced the Specific Development
Plan for E-commerce Logistics 2016-2020 (全國電子商務物流發展專項規劃(2016-2020)),
which stimulated the construction of logistics infrastructure nationwide.
In early 2018, the State Council issued the Opinions on promoting the coordinated
development of e-commerce and express delivery (關於推進電子商務與快遞物流協同發展的意見). The file proposed six promotion policies including accelerating the constructions of
related infrastructure, optimising the traffic management of delivery, improving the service
standard at the last step of delivery, etc.
From 2015 to 2019, the e-commerce market grew with a CAGR of approximately 28.4%.
It is estimated that the volume of e-commerce will increase to be approximately RMB18.2
trillion by 2025 with 2019-2025 CAGR of 12.8%.
APPENDIX V LETTER FROM THE MARKET CONSULTANT INRELATION TO ITS MARKET CONSULTANT REPORT
– V-17 –
THIS DOCUMENT IS IN DRAFT FORM, INCOMPLETE AND SUBJECT TO CHANGE AND THAT THE INFORMATION MUST BE READIN CONJUNCTION WITH THE SECTION HEADED “WARNING” ON THE COVER OF THIS DOCUMENT.
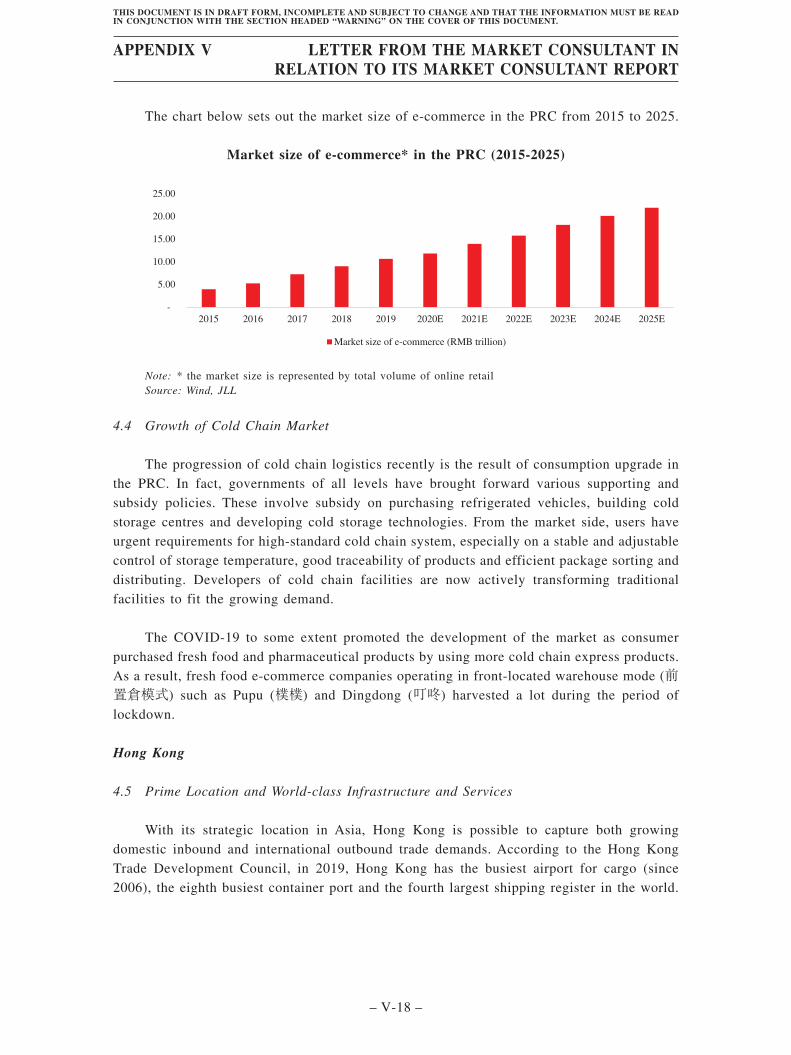
The chart below sets out the market size of e-commerce in the PRC from 2015 to 2025.
Market size of e-commerce* in the PRC (2015-2025)
-
5.00
10.00
15.00
20.00
25.00
2015 2016 2017 2018 2019 2020E 2021E 2022E 2023E 2024E 2025E
Market size of e-commerce (RMB trillion)
Note: * the market size is represented by total volume of online retailSource: Wind, JLL
4.4 Growth of Cold Chain Market
The progression of cold chain logistics recently is the result of consumption upgrade inthe PRC. In fact, governments of all levels have brought forward various supporting andsubsidy policies. These involve subsidy on purchasing refrigerated vehicles, building coldstorage centres and developing cold storage technologies. From the market side, users haveurgent requirements for high-standard cold chain system, especially on a stable and adjustablecontrol of storage temperature, good traceability of products and efficient package sorting anddistributing. Developers of cold chain facilities are now actively transforming traditionalfacilities to fit the growing demand.
The COVID-19 to some extent promoted the development of the market as consumerpurchased fresh food and pharmaceutical products by using more cold chain express products.As a result, fresh food e-commerce companies operating in front-located warehouse mode (前置倉模式) such as Pupu (樸樸) and Dingdong (叮咚) harvested a lot during the period oflockdown.
Hong Kong
4.5 Prime Location and World-class Infrastructure and Services
With its strategic location in Asia, Hong Kong is possible to capture both growingdomestic inbound and international outbound trade demands. According to the Hong KongTrade Development Council, in 2019, Hong Kong has the busiest airport for cargo (since2006), the eighth busiest container port and the fourth largest shipping register in the world.
APPENDIX V LETTER FROM THE MARKET CONSULTANT INRELATION TO ITS MARKET CONSULTANT REPORT
– V-18 –
THIS DOCUMENT IS IN DRAFT FORM, INCOMPLETE AND SUBJECT TO CHANGE AND THAT THE INFORMATION MUST BE READIN CONJUNCTION WITH THE SECTION HEADED “WARNING” ON THE COVER OF THIS DOCUMENT.
Of equal importance, Hong Kong’s people and enterprises have showcased their
capabilities on providing world-class trading services concerning with air transport, freight
forwarding, sea transport so that to maintain the city’s position as the busiest trade hub of Asia.
Hong Kong’s logistics industry shall continuously enjoy benefits from it.
Moreover, the proposals of “Belt and Road Initiative” (B&R) have further cemented
international status for Hong Kong as a key logistics and trading hub in the world. Hong
Kong’s focal point as a logistics hub for China and the region will underpin demand for
logistics facility in Hong Kong. So far, Hong Kong has signed free trade agreements (FTAs)
with 20 economies, including the Association of Southeast Asian Nations, Georgia and
Australia and has signed Investment Promotion and Protection Agreements with 30 foreign
economies and concluded negotiations with Bahrain, Maldives, Mexico and Myanmar.
Arrangements with B&R-related economies and other trading partners including the Mainland
of China, India, Korea, Singapore, Thailand, Malaysia, Japan, Australia, New Zealand, Israel
and Canada have been signed to mutually recognise respective “Authorized Economic
Operator” Programmes to facilitate customs clearance.
4.6 Closer Connection with The PRC
The GBA developments allows full integration of transport networks between Hong Kong
and the nine mainland cities of the PRC, including air cargo, ground transportation and
warehousing services. The Hong Kong-Zhuhai-Macao Bridge, Guangzhou-Shenzhen-Hong
Kong Express Rail Link and the Three-runway System of the Hong Kong International Airport
(under construction) will strengthen connectivity between Hong Kong, the Mainland and the
world.
Moreover, the external sector of Hong Kong has recorded significant growth since 2003
under the Closer Economic Partnership Arrangement (“CEPA”), which is a free trade
agreement to strengthen the trading and investment between Hong Kong and China and to
foster the economic integration and long term trade development of both places. According to
this arrangement, Hong Kong logistics services suppliers are given greater flexibility and in
more preferential terms when trying to access the mainland’s logistics market. Service
suppliers are allowed to establish contractual joint ventures, equity joint ventures or
wholly-owned operations to provide airport operation services, computer reservation system
services, sales and marketing services and other supporting services for air transport.
4.7 E-commerce Opportunities
According to Statista, e-commerce sales as a proportion of total retail sales (e-commerce
penetration) will steadily increasing worldwide year-on-year. So far, the APAC has the largest
e-commerce market in the world. However, online retail currently accounts for less than 10%
of total retail sales worldwide, which indicates a huge potential for e-commerce as a future
growth driver.
APPENDIX V LETTER FROM THE MARKET CONSULTANT INRELATION TO ITS MARKET CONSULTANT REPORT
– V-19 –
THIS DOCUMENT IS IN DRAFT FORM, INCOMPLETE AND SUBJECT TO CHANGE AND THAT THE INFORMATION MUST BE READIN CONJUNCTION WITH THE SECTION HEADED “WARNING” ON THE COVER OF THIS DOCUMENT.
Under this background, Hong Kong encounters plenty opportunities in e-commerceindustry benefited from its strategic location in APAC. It is a region being regarded as theworld factories where a huge amount of industrial products are produced with Hong Kong asthe most important logistics hub.
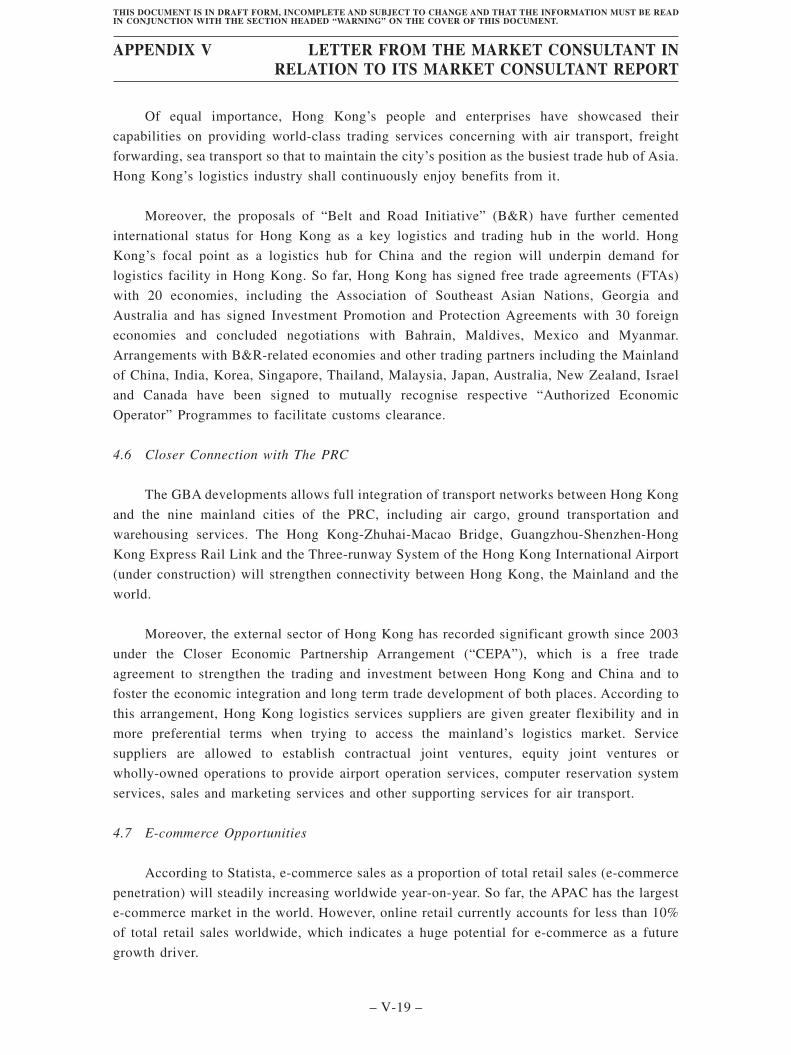
The growth of the e-commerce market in Hong Kong and the PRC is a major driver forthe logistics properties market as e-commerce activities require comprehensive logistics andwarehousing support for merchandise storage and distribution. Underpinned by increasinginternet usage and household spending power in Hong Kong and the PRC, the e-commercemarket has expanded rapidly in these markets over the last decade. The market size in HongKong for e-commerce grew with a CAGR of approximately 34.8% during 2015-2019.Considering a relatively large volume base in 2020 comparing with 2015, it is expected thatthe market size will increase to be approximately RMB76.4 billion in 2025, with 2019-2025CAGR of 15.1%.
The chart below sets out market size for e-commerce in Hong Kong from 2015 to 2025.
Market size for e-commerce in Hong Kong (2015-2025)
0
20
40
60
80
100
2015 2016 2017 2018 2019 2020E 2021E 2022E 2023E 2024E 2025E
Market size (RMB billion)
Source: Statista, JLL
5. Overview of Logistics Property Market
5.1 Logistics Property Market
The PRC
Overview
The logistics property market (storage for common goods) in the PRC has seen greatchanges since the Reform and Opening-up 40 years ago. From 2001 to 2019, the fix assetinvestment on logistics property experienced a process of rapid growth and then followedby a decline. Previous drivers for the rapid development faded and it indicates that thewarehousing market in the PRC is oversupply has changed from the time of rapid increaseto the time of improving stock utility.
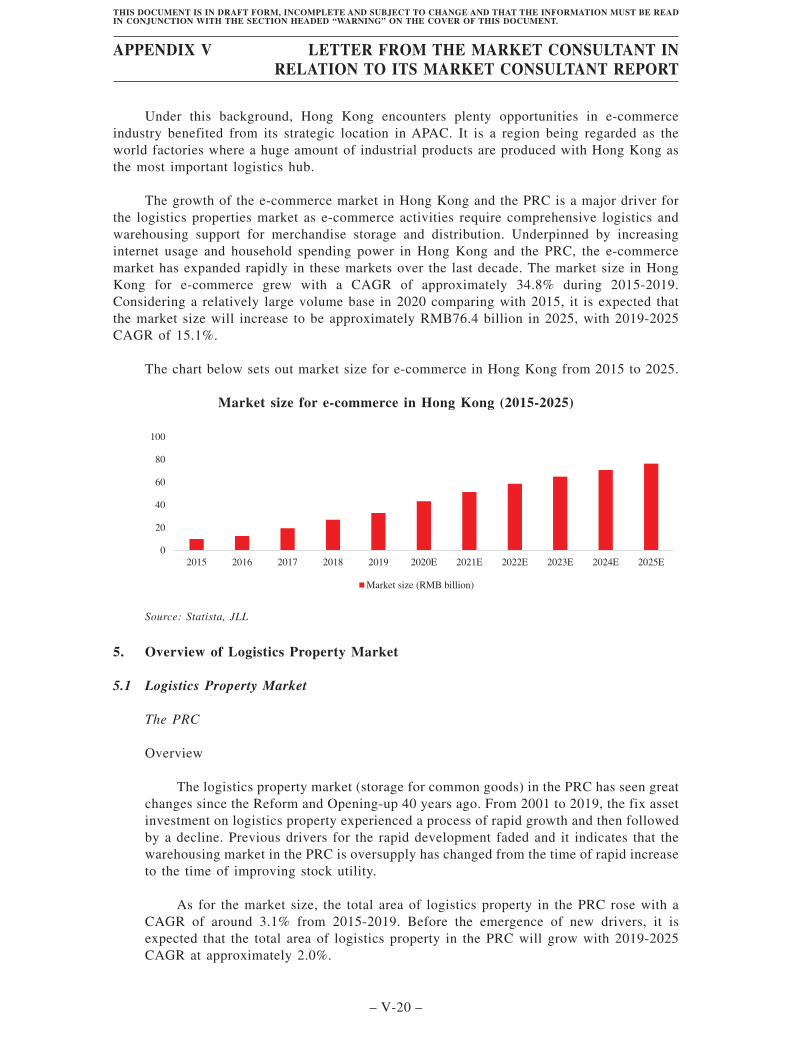
As for the market size, the total area of logistics property in the PRC rose with aCAGR of around 3.1% from 2015-2019. Before the emergence of new drivers, it isexpected that the total area of logistics property in the PRC will grow with 2019-2025CAGR at approximately 2.0%.
APPENDIX V LETTER FROM THE MARKET CONSULTANT INRELATION TO ITS MARKET CONSULTANT REPORT
– V-20 –
THIS DOCUMENT IS IN DRAFT FORM, INCOMPLETE AND SUBJECT TO CHANGE AND THAT THE INFORMATION MUST BE READIN CONJUNCTION WITH THE SECTION HEADED “WARNING” ON THE COVER OF THIS DOCUMENT.
The chart below sets out total area of logistics property in the PRC from 2015 to2025.
Total area of logistics property* in the PRC (2015-2025)
8.5
9.0
9.5
10.0
10.5
11.0
11.5
12.0
12.5
2015 2016 2017 2018 2019 2020E 2021E 2022E 2023E 2024E 2025E
Total area of logistics property (million sq.m.)
Note: * exclude those with special storage such as items that are susceptible to pollution, hazardous article,etc..
Source: China Association of Warehousing and Distribution
Drivers
Before 2015, the rapid expansion of the market was mainly because of the short of
logistics properties across the nation and it finally resulted in a large size yet fragment
market. In recent years, as extensive growth turning inapplicable, the market has found
several new drivers as below:
Industrial concentration. Capital market always seeks for potential investment
opportunities, and the logistics property market has become a fine investment in many
countries abroad. To mitigate industry chaos and improve operating efficiency, the market
would have to take advantages of capital to complete M&A actions.
Demand from new retail (新零售). The concept of “new retail” was proposed by
Jack Ma, founder and previous chairman of e-commerce behemoth Alibaba Group in
2016. It generally refers to the integration of digitalisation, online-offline sales channels
and the flexible supply chain. Logistics properties, as a matter of course, stand at an
important place for its functions of packages dispatching and distributing and stock
arranging.
Supply chain consolidation. Logistics property is a crucial factor for supply chain
consolidation, which is to reduce types of expenditures in related businesses. So far,
internet giants, including JD.com and Alibaba, chose to invest in self-built logistics
properties and to build their own standardised system.
APPENDIX V LETTER FROM THE MARKET CONSULTANT INRELATION TO ITS MARKET CONSULTANT REPORT
– V-21 –
THIS DOCUMENT IS IN DRAFT FORM, INCOMPLETE AND SUBJECT TO CHANGE AND THAT THE INFORMATION MUST BE READIN CONJUNCTION WITH THE SECTION HEADED “WARNING” ON THE COVER OF THIS DOCUMENT.

Internet propelling. The implements of internet technologies and mega-dataanalysis are remarkably reforming the logistics property market. Cloud warehouse (雲倉),derived from cloud calculation technology (雲計算技術), enables users to forecastpreferences of consumers and to adjust inventories in advance. Its ultimate goal is toautomatically figure out the real-time optimal solution for the storage, allocation andrestocking occurring in multiple logistics properties.
Key players
Considering the relatively small quantity and low quality, logistics property marketin the PRC is now at an phase of fast development. It has few barriers with high degreeof marketisation and fierce competition. Generally, there are three main kinds of playersin the market, namely logistics property real estate developers and service providers,logistics property tenants and logistics property financing companies.
Especially, SF is one of key logistics property real estate developers and serviceproviders competing with both international and domestic players. Players of this groupaim at developing logistics properties for rental income. Benefited from the prosperity ofe-commerce, developers have expanded their footprint from tier-1 cities to lower-tiercities. They are the main force for the multidimensional, networked and large-scalingdevelopment of logistics property. Representative enterprises include GLP, Prologis (安博), ESR, Blogis (寶灣), Vanke and SF. Moreover, e-commerce giants such as JD.com andSuning have joined this group.
RepresentativeEnterprises(order bycitiescoverage)
IndustryBackground
MainPurpose Geography
Project No.(logisticsproperty
for commongoods)
SF Express logistics for rent approx. 100 cities, mainlyeastern, north-east andsouth-east of China
113
Company Q logistics for rent 89 cities, around high-tiercities
>700
Company R logistics for rent 47 cities, relativelybalanced around China
142
Company S logistics for rent 44 cities, around high-tiercities
57
Company T real estate for rent 42 cities, mainly inmetropolitan clusters
>300
Company U 3PL/express for self-use 34 cities, mainly in YRDand central China
63
Company V e-commerce for self-use 22 cities, eastern andnorthern Chinacomposite the most
183
Company W e-commerce for self-use 18 cities, YRDcomposites the most
35
Note: Data in the table are as of 2020
Source: Annual reports of companies, JLL
APPENDIX V LETTER FROM THE MARKET CONSULTANT INRELATION TO ITS MARKET CONSULTANT REPORT
– V-22 –
THIS DOCUMENT IS IN DRAFT FORM, INCOMPLETE AND SUBJECT TO CHANGE AND THAT THE INFORMATION MUST BE READIN CONJUNCTION WITH THE SECTION HEADED “WARNING” ON THE COVER OF THIS DOCUMENT.

Hong Kong
Overview
Hong Kong logistics property are scatteredly located in industrial-usage lands or
suburban areas. Based on the statistics from Rating and Valuation Department, Over 80%
of the stock was in the New Territories, with predominance in Kwai Tsing, Sha Tin and
Tsuen Wan which accounted for 69% of the total spaces.
Since the 1990s, because of the lack of land resource, the total stock barely
increased and even declined in 2018. No new supply is forecast to be available in 2020
while new spaces of 75,800 sq.m. in Tuen Mun is expected to be completed in 2021. The
short of supply mismatches Hong Kong’s advantages as one of the busiest collecting and
distributing centre in the world and to some extent limits the sustainable development of
Hong Kong’s logistics industry.
The total area of logistics property in Hong Kong rose with a CAGR of around 0.8%
from 2015-2019 and it is expected that the total area of logistics property in Hong Kong
will grow mildly with 2019-2025 CAGR at approximately 0.4% mainly because of the
lack of land resource.
The chart below sets out the total area of the logistics property in Hong Kong from
2015 to 2025.
Total area of logistics property in Hong Kong (2015-2025)
-
1.00
2.00
3.00
4.00
5.00
2015 2016 2017 2018 2019 2020E 2021E 2022E 2023E 2024E 2025E
Total area of logistics property (million sq.m.)
Note: this statistic includes private storage (including premises designed or adapted for use as godowns, orcold stores, and ancillary offices) only
Source: Rating and Valuation Department, JLL
APPENDIX V LETTER FROM THE MARKET CONSULTANT INRELATION TO ITS MARKET CONSULTANT REPORT
– V-23 –
THIS DOCUMENT IS IN DRAFT FORM, INCOMPLETE AND SUBJECT TO CHANGE AND THAT THE INFORMATION MUST BE READIN CONJUNCTION WITH THE SECTION HEADED “WARNING” ON THE COVER OF THIS DOCUMENT.
Drivers
Drivers for Hong Kong logistics property market mainly come from the demand
increase and project renewal:
Strong storage demand. Hong Kong’s storage demand is and will be well supported
by trading activities around the world. There is a growing shortage of modern logistics
properties in Hong Kong and the PRC. The shortage is primarily attributable to the
combination effect of the scarcity of suitable sites in the Greater Bay Area and other
prime cities in the PRC, as well as increasing demand from tenants in the logistics,
express delivery, e-commerce and cold storage sectors due to their rapid growth as a
result of shifting consumer demands globally.
E-commerce growth. The explosive growth of international e-commerce is driving
suppliers to locate their sourcing, goods storage, warehousing management and
distribution decisions in Hong Kong, creating an urgency for Hong Kong logistics
property operators to reshape and diminish the gap between demand and performance.
Logistics property evolution. To fulfil the needs of modern logistics operators,
high-quality spaces, such as those provided by modern logistics centres, have emerged in
the market. Although the supply of such facilities is far from adequate in Hong Kong, it
offers a way of renewal for those outdated logistics properties.
Key players
Compared with the PRC, Hong Kong’s logistics property market is relatively
concentrated and has a stable competitive landscape. More information on the key players
in Hong Kong can be check in below section of “OVERVIEW OF INDIVIDUAL CITY
– HONG KONG – Supply”.
APPENDIX V LETTER FROM THE MARKET CONSULTANT INRELATION TO ITS MARKET CONSULTANT REPORT
– V-24 –
THIS DOCUMENT IS IN DRAFT FORM, INCOMPLETE AND SUBJECT TO CHANGE AND THAT THE INFORMATION MUST BE READIN CONJUNCTION WITH THE SECTION HEADED “WARNING” ON THE COVER OF THIS DOCUMENT.

5.2 Cold Storage Market
The PRC
Cold storage warehouse plays a crucial role in cold chain logistics in the PRC. As
the new retail concept and the demand of consumption upgrade emerged, it can be
witnessed that the demand for cold storage increase, especially from fresh food supply
chain. The ownership of cold storage warehouse is so far a core competitiveness for cold
chain enterprises in the PRC.
Below are two features of the cold storage market in the PRC, showing great
potentials of the market:
Firstly, the supply of refrigerated warehouse is insufficient and has an uneven
distribution. According to Global Cold Chain Alliance (GCCA), the refrigerated
warehouse capacity per urban resident in 2018 was around 0.132 cubic metre, below the
average of global (approximately 0.2 cubic metre), and has a huge gap with developed
countries. As for geographic distribution, around 37.2% refrigerated warehouse located in
eastern China (mainly contains the Yangtze River Delta and Zhejiang province), which
was the most, followed by around 15.5% in central China (mainly contains Beijing-
Tianjin-Hebei Region, Hunan and Hubei provinces).
Secondly, the usage of refrigerant is not standardised. Over 96% operator of
refrigerated warehouse fails to accept safer, cleaner and more sustainable refrigerant,
such as carbon dioxide and the compound of carbon dioxide and ammonia, because of the
tremendous initial investment on facilities and daily maintenance5.
The 2015-2019 CAGR for total area of cold storage warehouse in the PRC was
approximately 9.9%. It is expected that the total area of cold storage warehouse will reach
approximately 190 million cubic metre with 2019-2025 CAGR of 3.4%.
5 Source: JLL Research
APPENDIX V LETTER FROM THE MARKET CONSULTANT INRELATION TO ITS MARKET CONSULTANT REPORT
– V-25 –
THIS DOCUMENT IS IN DRAFT FORM, INCOMPLETE AND SUBJECT TO CHANGE AND THAT THE INFORMATION MUST BE READIN CONJUNCTION WITH THE SECTION HEADED “WARNING” ON THE COVER OF THIS DOCUMENT.
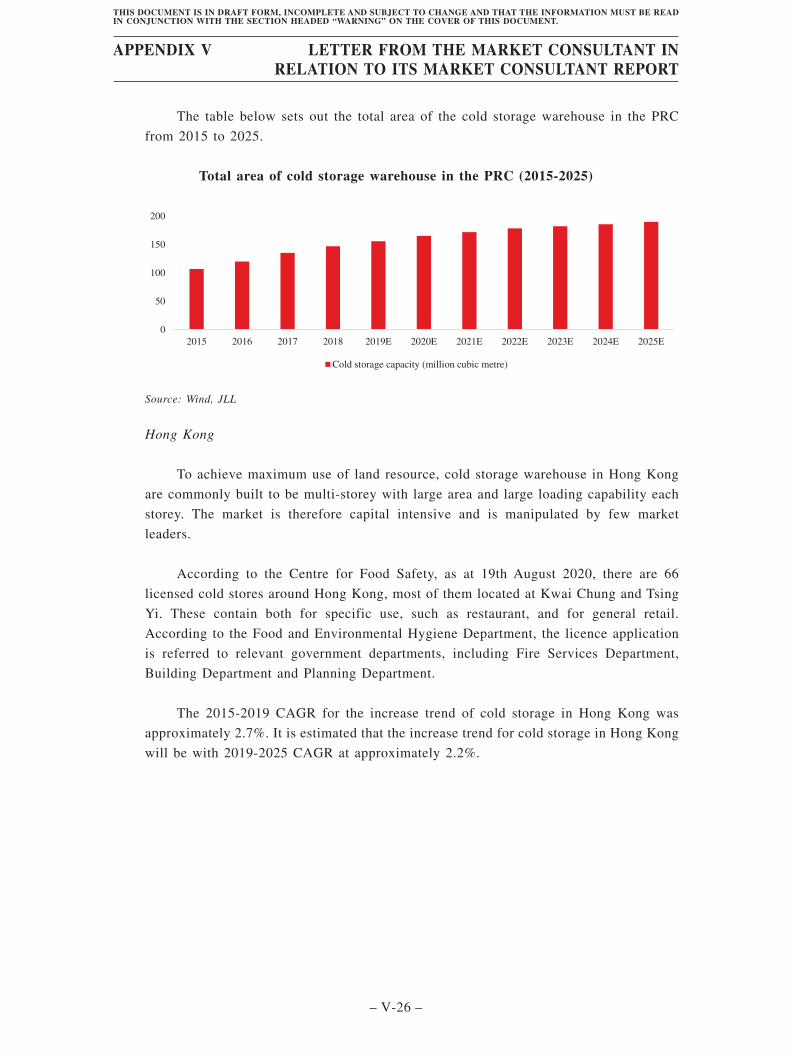
The table below sets out the total area of the cold storage warehouse in the PRC
from 2015 to 2025.
Total area of cold storage warehouse in the PRC (2015-2025)
0
50
100
150
200
2015 2016 2017 2018 2019E 2020E 2021E 2022E 2023E 2024E 2025E
Cold storage capacity (million cubic metre)
Source: Wind, JLL
Hong Kong
To achieve maximum use of land resource, cold storage warehouse in Hong Kong
are commonly built to be multi-storey with large area and large loading capability each
storey. The market is therefore capital intensive and is manipulated by few market
leaders.
According to the Centre for Food Safety, as at 19th August 2020, there are 66
licensed cold stores around Hong Kong, most of them located at Kwai Chung and Tsing
Yi. These contain both for specific use, such as restaurant, and for general retail.
According to the Food and Environmental Hygiene Department, the licence application
is referred to relevant government departments, including Fire Services Department,
Building Department and Planning Department.
The 2015-2019 CAGR for the increase trend of cold storage in Hong Kong was
approximately 2.7%. It is estimated that the increase trend for cold storage in Hong Kong
will be with 2019-2025 CAGR at approximately 2.2%.
APPENDIX V LETTER FROM THE MARKET CONSULTANT INRELATION TO ITS MARKET CONSULTANT REPORT
– V-26 –
THIS DOCUMENT IS IN DRAFT FORM, INCOMPLETE AND SUBJECT TO CHANGE AND THAT THE INFORMATION MUST BE READIN CONJUNCTION WITH THE SECTION HEADED “WARNING” ON THE COVER OF THIS DOCUMENT.

The chart below sets out relevant data showing the increase trend for cold storage
in Hong Kong from 2015 to 2025.
Increase trend* for cold storage market in Hong Kong (2015-2025)
0
5
10
15
20
2015 2016 2017 2018 2019 2020E 2021E 2022E 2023E 2024E 2025E
Sales of Fish, livestock and poultry, fresh or frozen & Fruits and vegetables, fresh (HKD billion)
Note: * the increase trend is represented by the sales of fresh foodSource: Census and Statistics Department of Hong Kong, JLL
Currently, Chevalier, CR Logistics, Kerry and Brilliant make up the majority of
commercial cold storage warehouse market. After the acquisition of HAVI Group’s cold
chain business in Hong Kong, SF Holding has become one of key players. The HAVI
Group has almost 40 years of supply chain management experience in cold chain
operations and has one logistic centre in Hong Kong.
6. Overview of 3PL and Express Delivery Market
Express delivery is a professional branch of 3PL. It has evolved to be one of the most
important fields of logistics industry because of its crucial functions on supporting a range of
industries, especially e-commerce. It commonly refers to a door-to-door, small-size and
individual parcel delivery service with fast delivery time. Express delivery is a representative
for the model change of logistics from B2B (Business to Business) to B2C (Business to Client).
It has evolved to be one of the most important fields of logistics industry because of its crucial
functions on supporting a range of industries, especially e-commerce. As a pillar for the
modern service industry, express delivery has features of containing enormous employment,
high economic value-added and technology-intensive orientation.
The PRC
According to China Federation of Logistics and Purchasing (中國物流與採購聯合會) and
Wind, from 2015 to 2019, the total revenue of 3PL increased from RMB1,020.2 billion
(USD61.0 billion) to RMB1,531.9 billion (USD203.2 billion), with CAGR of approximately
10.7%. The number ranked second behind the U.S. and it is expected that by the end of 2020,
the total revenue of third-party logistics will reach approximately RMB1,626.3 billion
(USD235.7 billion).
APPENDIX V LETTER FROM THE MARKET CONSULTANT INRELATION TO ITS MARKET CONSULTANT REPORT
– V-27 –
THIS DOCUMENT IS IN DRAFT FORM, INCOMPLETE AND SUBJECT TO CHANGE AND THAT THE INFORMATION MUST BE READIN CONJUNCTION WITH THE SECTION HEADED “WARNING” ON THE COVER OF THIS DOCUMENT.
On the other hand, express delivery stands as a pilot driver for the sustainable
development of the PRC. In 2017, the State Post Bureau published the 13th Five-year
Development Plan for Express Delivery Industry (快遞業發展“十三五”規劃), which proposed
the service to cover the most area of the country and to connect with the globe by the end of
2020, with the business volume estimated to reach around 70 billion pieces.
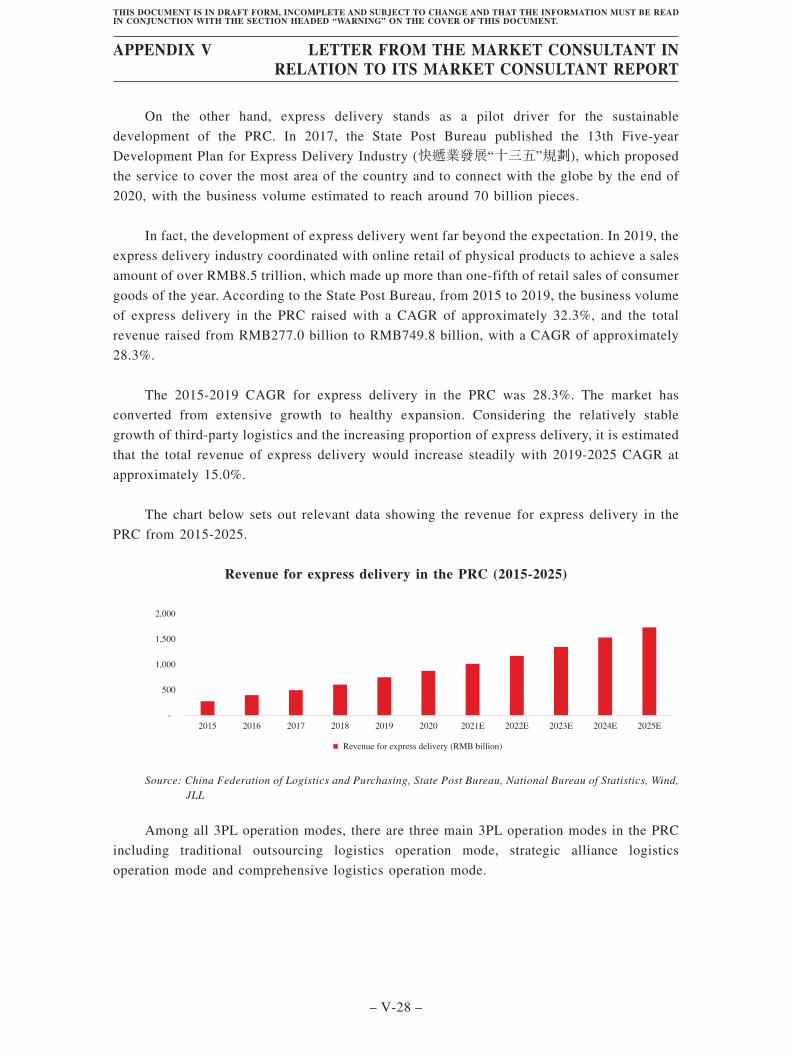
In fact, the development of express delivery went far beyond the expectation. In 2019, the
express delivery industry coordinated with online retail of physical products to achieve a sales
amount of over RMB8.5 trillion, which made up more than one-fifth of retail sales of consumer
goods of the year. According to the State Post Bureau, from 2015 to 2019, the business volume
of express delivery in the PRC raised with a CAGR of approximately 32.3%, and the total
revenue raised from RMB277.0 billion to RMB749.8 billion, with a CAGR of approximately
28.3%.
The 2015-2019 CAGR for express delivery in the PRC was 28.3%. The market has
converted from extensive growth to healthy expansion. Considering the relatively stable
growth of third-party logistics and the increasing proportion of express delivery, it is estimated
that the total revenue of express delivery would increase steadily with 2019-2025 CAGR at
approximately 15.0%.
The chart below sets out relevant data showing the revenue for express delivery in the
PRC from 2015-2025.
Revenue for express delivery in the PRC (2015-2025)
-
500
1,000
1,500
2,000
2015 2016 2017 2018 2019 2020 2021E 2022E 2023E 2024E 2025E
Revenue for express delivery (RMB billion)
Source: China Federation of Logistics and Purchasing, State Post Bureau, National Bureau of Statistics, Wind,JLL
Among all 3PL operation modes, there are three main 3PL operation modes in the PRC
including traditional outsourcing logistics operation mode, strategic alliance logistics
operation mode and comprehensive logistics operation mode.
APPENDIX V LETTER FROM THE MARKET CONSULTANT INRELATION TO ITS MARKET CONSULTANT REPORT
– V-28 –
THIS DOCUMENT IS IN DRAFT FORM, INCOMPLETE AND SUBJECT TO CHANGE AND THAT THE INFORMATION MUST BE READIN CONJUNCTION WITH THE SECTION HEADED “WARNING” ON THE COVER OF THIS DOCUMENT.
In terms of the attributes of the company, the operators are classified into four different
types: state-owned company, private company, company spun off from large corporation and
foreign company. Especially, express delivery in the PRC is highly concentrated, and private
companies are currently dominating the market. Based on the State Post Bureau of the PRC (國家郵政局), the concentration rate of Top 5 express delivery company in terms of the express
business volume achieved around 68.3% as of the end of 2019.
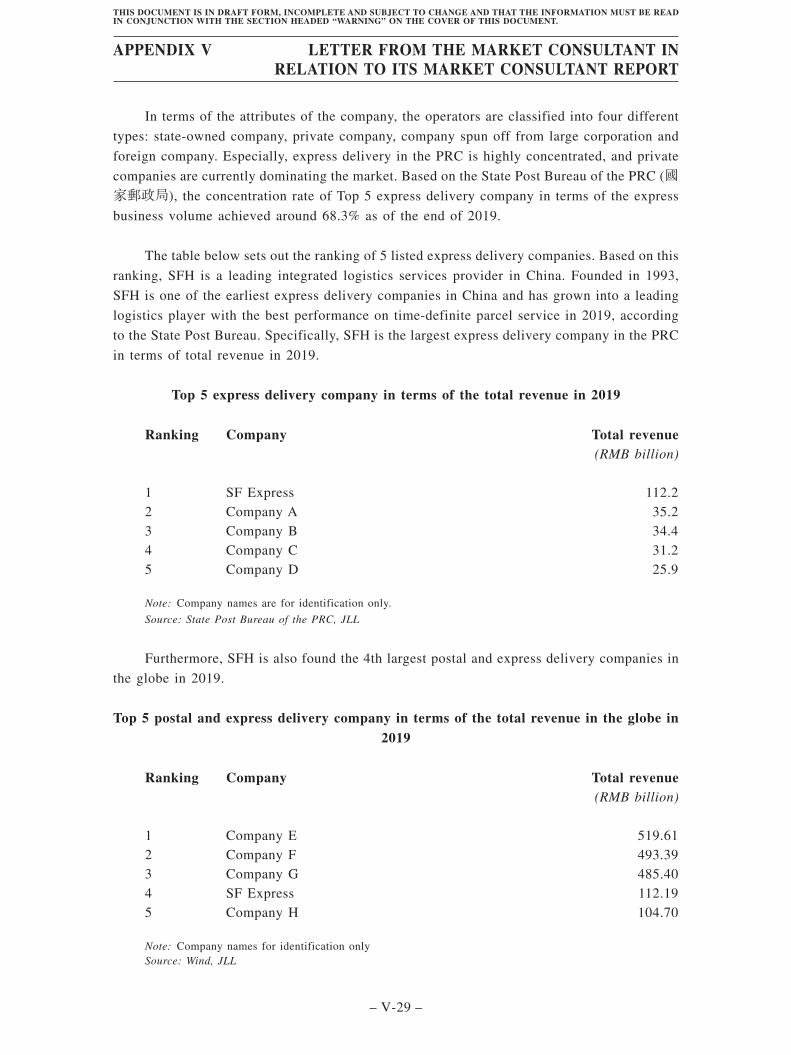
The table below sets out the ranking of 5 listed express delivery companies. Based on this
ranking, SFH is a leading integrated logistics services provider in China. Founded in 1993,
SFH is one of the earliest express delivery companies in China and has grown into a leading
logistics player with the best performance on time-definite parcel service in 2019, according
to the State Post Bureau. Specifically, SFH is the largest express delivery company in the PRC
in terms of total revenue in 2019.
Top 5 express delivery company in terms of the total revenue in 2019
Ranking Company Total revenue(RMB billion)
1 SF Express 112.22 Company A 35.23 Company B 34.44 Company C 31.25 Company D 25.9
Note: Company names are for identification only.
Source: State Post Bureau of the PRC, JLL
Furthermore, SFH is also found the 4th largest postal and express delivery companies in
the globe in 2019.
Top 5 postal and express delivery company in terms of the total revenue in the globe in2019
Ranking Company Total revenue(RMB billion)
1 Company E 519.612 Company F 493.393 Company G 485.404 SF Express 112.195 Company H 104.70
Note: Company names for identification onlySource: Wind, JLL
APPENDIX V LETTER FROM THE MARKET CONSULTANT INRELATION TO ITS MARKET CONSULTANT REPORT
– V-29 –
THIS DOCUMENT IS IN DRAFT FORM, INCOMPLETE AND SUBJECT TO CHANGE AND THAT THE INFORMATION MUST BE READIN CONJUNCTION WITH THE SECTION HEADED “WARNING” ON THE COVER OF THIS DOCUMENT.
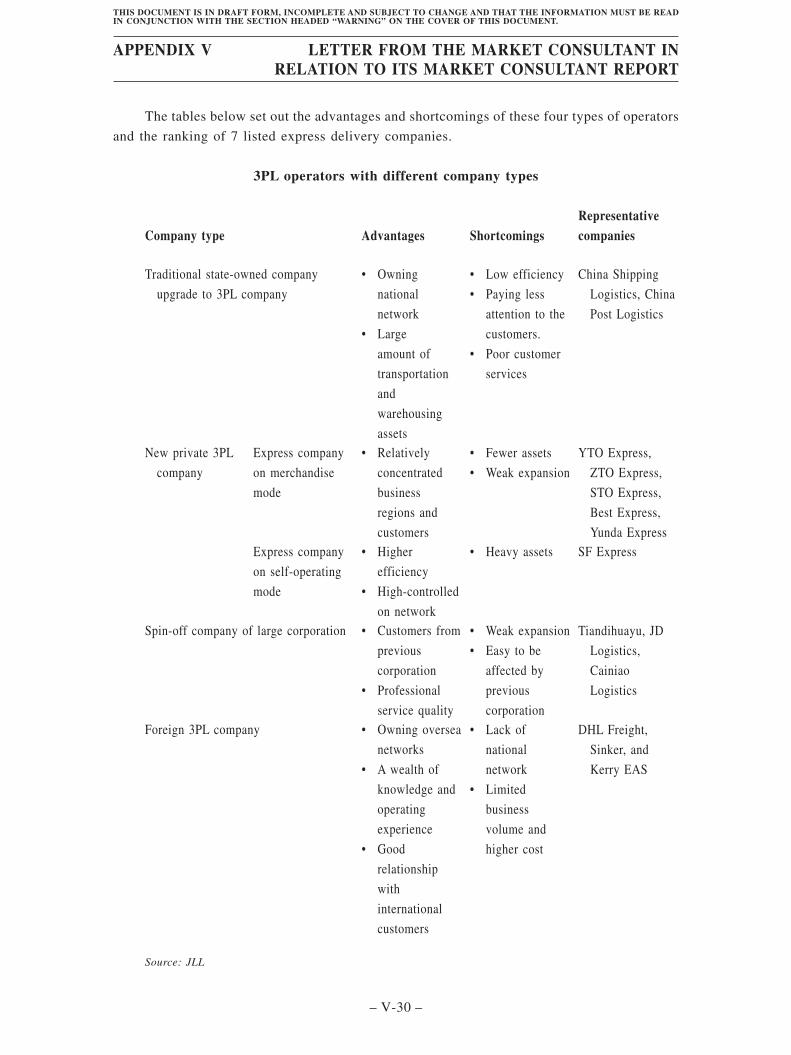
The tables below set out the advantages and shortcomings of these four types of operators
and the ranking of 7 listed express delivery companies.
3PL operators with different company types
Company type Advantages ShortcomingsRepresentativecompanies
Traditional state-owned company
upgrade to 3PL company
• Owning
national
network
• Large
amount of
transportation
and
warehousing
assets
• Low efficiency
• Paying less
attention to the
customers.
• Poor customer
services
China Shipping
Logistics, China
Post Logistics
New private 3PL
company
Express company
on merchandise
mode
• Relatively
concentrated
business
regions and
customers
• Fewer assets
• Weak expansion
YTO Express,
ZTO Express,
STO Express,
Best Express,
Yunda ExpressExpress company
on self-operating
mode
• Higher
efficiency
• High-controlled
on network
• Heavy assets SF Express
Spin-off company of large corporation • Customers from
previous
corporation
• Professional
service quality
• Weak expansion
• Easy to be
affected by
previous
corporation
Tiandihuayu, JD
Logistics,
Cainiao
Logistics
Foreign 3PL company • Owning oversea
networks
• A wealth of
knowledge and
operating
experience
• Good
relationship
with
international
customers
• Lack of
national
network
• Limited
business
volume and
higher cost
DHL Freight,
Sinker, and
Kerry EAS
Source: JLL
APPENDIX V LETTER FROM THE MARKET CONSULTANT INRELATION TO ITS MARKET CONSULTANT REPORT
– V-30 –
THIS DOCUMENT IS IN DRAFT FORM, INCOMPLETE AND SUBJECT TO CHANGE AND THAT THE INFORMATION MUST BE READIN CONJUNCTION WITH THE SECTION HEADED “WARNING” ON THE COVER OF THIS DOCUMENT.

The table below sets out examples of market price for 3PL and express delivery service
of general purpose in the PRC.
Market price for Key 3PL service and express delivery in the PRC
Business CategoryRepresentativesoperators Weight (kg) Distance (km) Time Level
Price perkg*Distance(RMB*10-3)
Pricingfactors
Full Truck Loading Company X 5,000 1,212(Beijing-Shanghai)
Economical(5 Days)
1.39 • Distance• Time
levelFast (3 Days) 1.6910,000 Economical
(5 Days)1.39
Fast (3 Days) 1.695,000 2,135
(Beijing-Guangzhou)
Economical(5 Days)
1.02
Fast (3 Days) 1.19Less Truck Loading Company X 100 1,212
(Beijing-Shanghai)
Economical(4 Days)
1.77 • Distance• Time
level200 Economical(4 Days)
1.77
100 2,135(Beijing-Guangzhou)
Economical(4 Days)
1.30
100 On Time(3 Days)
1.48
SF Express 100 1,212(Beijing-Shanghai)
Economical(3 Days)
2.24 • Weight• Distance• Time
level200 Economical
(3 Days)1.98
100 2,135(Beijing-Guangzhou)
Economical(4 Days)
1.70
Express delivery SF Express 10 1,212(Beijing-Shanghai)
Instant(1-2 Day)
9.32 • Weight• Distance• Time
levelEconomical
(2-3 Days)5.20
5 Instant(1-2 Day)
10.40
Economical(2-3 Days)
6.27
10 2,135(Beijing-Guangzhou)
In time(1-2 Days)
6.98
Economical(2-3 Days)
3.79
Company Y 10 1,212(Beijing-Shanghai)
Economical(2 Days)
8.66 • Weight• Distance
5 Economical(2 Days)
9.08
10 2,135(Beijing-Guangzhou)
Economical(3 Days)
4.92
5 Economical(3 Days)
5.15
Source: JLL
APPENDIX V LETTER FROM THE MARKET CONSULTANT INRELATION TO ITS MARKET CONSULTANT REPORT
– V-31 –
THIS DOCUMENT IS IN DRAFT FORM, INCOMPLETE AND SUBJECT TO CHANGE AND THAT THE INFORMATION MUST BE READIN CONJUNCTION WITH THE SECTION HEADED “WARNING” ON THE COVER OF THIS DOCUMENT.

Hong Kong
The logistics industry has been the traditional pillar industry in Hong Kong. Therefore,Hong Kong’s 3PL and express delivery industries started earlier than that in the PRC. In recentyears, with the gradual development of logistics industry, many local and foreign operatorsstarted to establish regional distribution centres in Hong Kong to take advantage of HongKong’s convenient and accessible external transportation network including internationalairports and free ports.
The top 3PL providers in Hong Kong include JSI Logistics, Kerry Logistics, OmniLogistics, etc.. Most of them provide a series of 3PL services, such as Business-to-Business(B2B), Business-to-Customer (B2C), regional express and logistics fulfilment solution.
The table below sets out examples of market price for express delivery service of generalpurpose in Hong Kong.
Representativesoperators Weight (kg) Distance (km) Time Level
Price per kg(HKD)
Pricingfactors
SF Express 5 Local Common (2 Days) 15.6 • Weight10 Local Common (2 Days) 13.820 Local Common (2 Days) 12.9500 Local Common (2 Days) 12.0
Company Z 10 Local (Area I) Common (1 Day) 18 • Distance10 Local (Area II) Common (1 Day) 22
Company I 1 Local Common (0.5-1 Day) 40 • Weight• Payment
method• Time
level
5 Local Common (0.5-1 Day) 17.610 Local Common (0.5-1 Day) 14.8Monthly paid Local Common (0.5-1 Day) 14.5-221 Local Fast (3 hours) 1505 Local Fast (3 hours) 3010 Local Fast (3 hours) 35
Source: JLL
7. Overview of E-Commerce Logistics Market
E-commerce (electronic commerce) is the activity of electronically buying or sellingproducts on online services platforms. A typical e-commerce system consists of online-shop(containing payment methods), products, online-shoppers and logistics. The e-commerce sectorand retailing industry evolve rapidly with technological updates, changes in user preferences,product innovation and the availability, reliability and security of e-commerce platforms.
The PRC
With over 900 million internet users, the PRC is the fast-growing and largest e-commercemarket in the world. The total volume of e-commerce saw a year-on-year growth of 17.8% in2019. E-commerce sale of the PRC was the largest globally, accounted for around 44.9% of theworld’s e-commerce sales and exceeded more than twice of those of the US in 2019.
APPENDIX V LETTER FROM THE MARKET CONSULTANT INRELATION TO ITS MARKET CONSULTANT REPORT
– V-32 –
THIS DOCUMENT IS IN DRAFT FORM, INCOMPLETE AND SUBJECT TO CHANGE AND THAT THE INFORMATION MUST BE READIN CONJUNCTION WITH THE SECTION HEADED “WARNING” ON THE COVER OF THIS DOCUMENT.
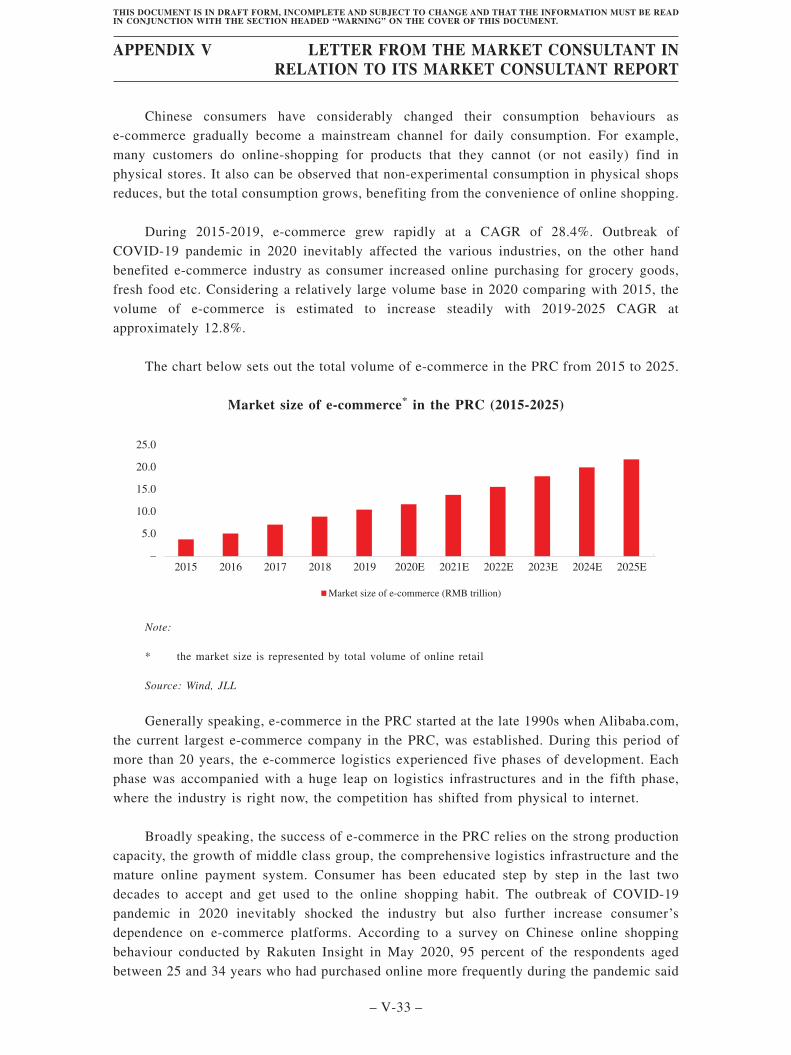
Chinese consumers have considerably changed their consumption behaviours ase-commerce gradually become a mainstream channel for daily consumption. For example,many customers do online-shopping for products that they cannot (or not easily) find inphysical stores. It also can be observed that non-experimental consumption in physical shopsreduces, but the total consumption grows, benefiting from the convenience of online shopping.
During 2015-2019, e-commerce grew rapidly at a CAGR of 28.4%. Outbreak ofCOVID-19 pandemic in 2020 inevitably affected the various industries, on the other handbenefited e-commerce industry as consumer increased online purchasing for grocery goods,fresh food etc. Considering a relatively large volume base in 2020 comparing with 2015, thevolume of e-commerce is estimated to increase steadily with 2019-2025 CAGR atapproximately 12.8%.
The chart below sets out the total volume of e-commerce in the PRC from 2015 to 2025.
Market size of e-commerce* in the PRC (2015-2025)
–
5.0
10.0
15.0
20.0
25.0
Market size of e-commerce (RMB trillion)
2015 2016 2017 2018 2019 2020E 2021E 2022E 2023E 2024E 2025E
Note:
* the market size is represented by total volume of online retail
Source: Wind, JLL
Generally speaking, e-commerce in the PRC started at the late 1990s when Alibaba.com,the current largest e-commerce company in the PRC, was established. During this period ofmore than 20 years, the e-commerce logistics experienced five phases of development. Eachphase was accompanied with a huge leap on logistics infrastructures and in the fifth phase,where the industry is right now, the competition has shifted from physical to internet.
Broadly speaking, the success of e-commerce in the PRC relies on the strong productioncapacity, the growth of middle class group, the comprehensive logistics infrastructure and themature online payment system. Consumer has been educated step by step in the last twodecades to accept and get used to the online shopping habit. The outbreak of COVID-19pandemic in 2020 inevitably shocked the industry but also further increase consumer’sdependence on e-commerce platforms. According to a survey on Chinese online shoppingbehaviour conducted by Rakuten Insight in May 2020, 95 percent of the respondents agedbetween 25 and 34 years who had purchased online more frequently during the pandemic said
APPENDIX V LETTER FROM THE MARKET CONSULTANT INRELATION TO ITS MARKET CONSULTANT REPORT
– V-33 –
THIS DOCUMENT IS IN DRAFT FORM, INCOMPLETE AND SUBJECT TO CHANGE AND THAT THE INFORMATION MUST BE READIN CONJUNCTION WITH THE SECTION HEADED “WARNING” ON THE COVER OF THIS DOCUMENT.
they would continue to do so after businesses are open and social distancing measures arelifted. Some sections of e-commerce were clashed while more sections emerged and enhanced.Penetration rate of e-commerce on daily shopping demand is expected moving up to a newlevel.
Hong Kong
E-commerce emerged in Hong Kong earlier than in the PRC and it developed in a quite
different way. HKTV Mall, once the most popular TV shop, has become one of the largest local
e-commerce platforms in Hong Kong. Global e-commerce giants such as ebay and Amazon
have considerable contracted online stores physically operated in Hong Kong. They have built
their reputations in Hong Kong that potential buyers having queries from all over the world can
at most time get instant replies even at midnight and enjoy well experience from after-sales
services. Another advantage is that e-commerce retailers can save great taxes and
transportation expenses when doing businesses in Hong Kong.
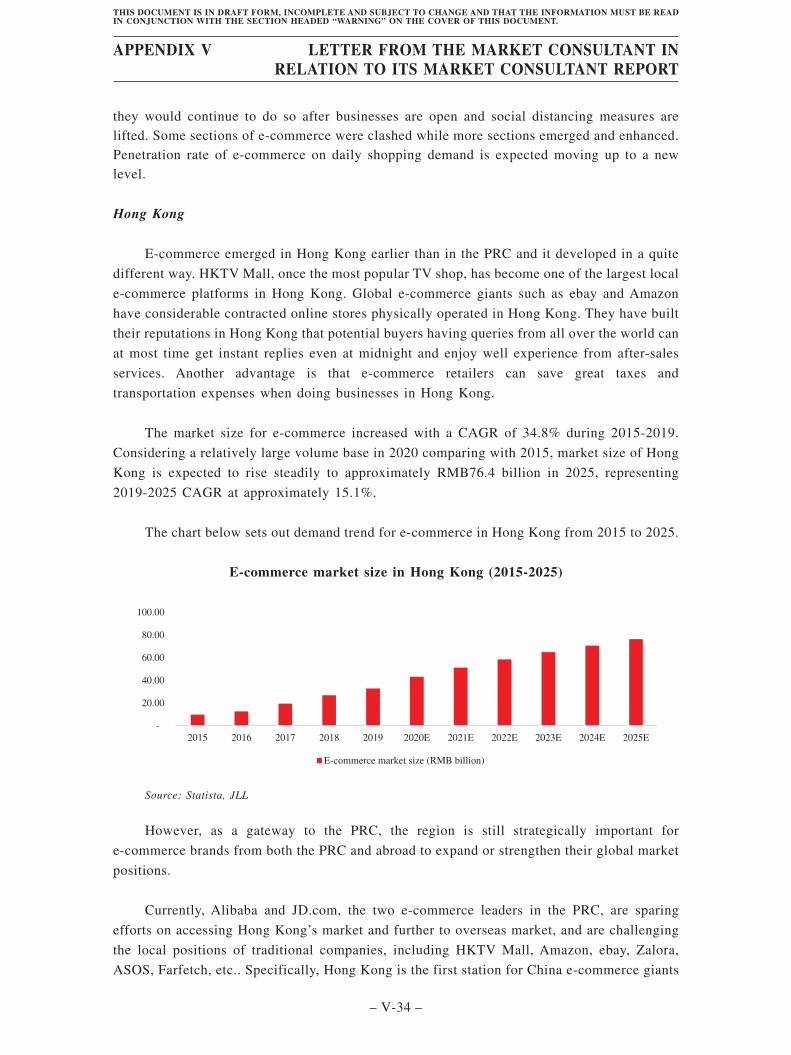
The market size for e-commerce increased with a CAGR of 34.8% during 2015-2019.
Considering a relatively large volume base in 2020 comparing with 2015, market size of Hong
Kong is expected to rise steadily to approximately RMB76.4 billion in 2025, representing
2019-2025 CAGR at approximately 15.1%.
The chart below sets out demand trend for e-commerce in Hong Kong from 2015 to 2025.
E-commerce market size in Hong Kong (2015-2025)
-
20.00
40.00
60.00
80.00
100.00
2015 2016 2017 2018 2019 2020E 2021E 2022E 2023E 2024E 2025E
E-commerce market size (RMB billion)
Source: Statista, JLL
However, as a gateway to the PRC, the region is still strategically important for
e-commerce brands from both the PRC and abroad to expand or strengthen their global market
positions.
Currently, Alibaba and JD.com, the two e-commerce leaders in the PRC, are sparing
efforts on accessing Hong Kong’s market and further to overseas market, and are challenging
the local positions of traditional companies, including HKTV Mall, Amazon, ebay, Zalora,
ASOS, Farfetch, etc.. Specifically, Hong Kong is the first station for China e-commerce giants
APPENDIX V LETTER FROM THE MARKET CONSULTANT INRELATION TO ITS MARKET CONSULTANT REPORT
– V-34 –
THIS DOCUMENT IS IN DRAFT FORM, INCOMPLETE AND SUBJECT TO CHANGE AND THAT THE INFORMATION MUST BE READIN CONJUNCTION WITH THE SECTION HEADED “WARNING” ON THE COVER OF THIS DOCUMENT.

to extend their business from domestic-concentrated to cross-border. For export, these
e-commerce players are keen to have business presence in Hong Kong where has a reliable
business image and an excellent international connectivity. For import, Chinese consumers
recently have stronger buying demands on global commodities that most e-commerce
companies have sensed the trend. Hong Kong is crucial for transporting global commodities
into the mainland legally as well as remaining a relatively low price.
8. Overview of Other Logistics Market
8.1 Air Freight
According to IATA (International Air Transport Association), in 2019 the global total air
cargo volume reached 61.2 million tons and the Asia Pacific region accounted for the largest
proportion, sharing 35.4% of the total volume, followed by North America and Europe.
The chart below sets out the distribution of global air cargo in 2019.
The distribution of global air cargo (2019)
35.4%
23.3%2.7%
13.2%
23.8%
1.6%
Asia Pacific
Europe
Latin America
Middle East
North America
Africa
Source: IATA, JLL
The PRC
With the development of manufacturing industry and cross-border e-commerce, the
export volume increased rapidly in recent years, promoting the growth of total air cargo
volume.
According to the Civil Aviation Administration of China, the total air cargo volume
of the PRC grew steadily from 5.63 million tons in 2010 to 7.53 million tons in 2019 with
a CAGR of 3.3%.
APPENDIX V LETTER FROM THE MARKET CONSULTANT INRELATION TO ITS MARKET CONSULTANT REPORT
– V-35 –
THIS DOCUMENT IS IN DRAFT FORM, INCOMPLETE AND SUBJECT TO CHANGE AND THAT THE INFORMATION MUST BE READIN CONJUNCTION WITH THE SECTION HEADED “WARNING” ON THE COVER OF THIS DOCUMENT.
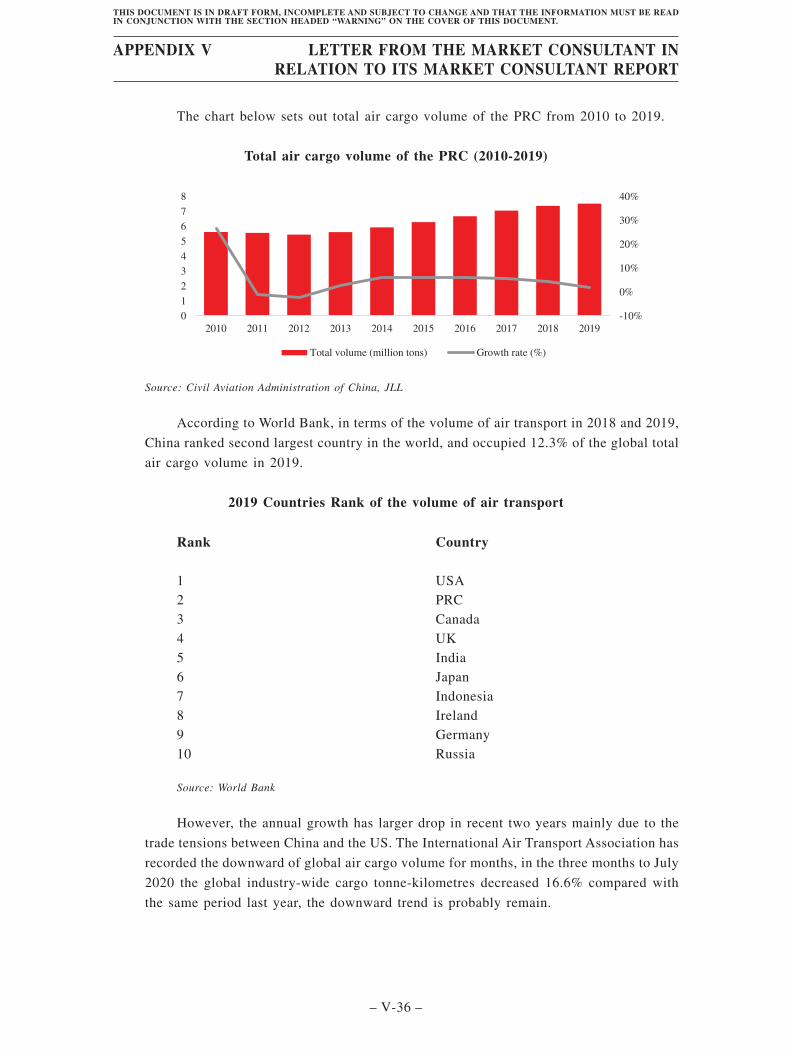
The chart below sets out total air cargo volume of the PRC from 2010 to 2019.
Total air cargo volume of the PRC (2010-2019)
-10%
0%
10%
20%
30%
40%
0
1
2
3
4
5
6
7
8
2010 2011 2012 2013 2014 2015 2016 2017 2018 2019
Total volume (million tons) Growth rate (%)
Source: Civil Aviation Administration of China, JLL
According to World Bank, in terms of the volume of air transport in 2018 and 2019,
China ranked second largest country in the world, and occupied 12.3% of the global total
air cargo volume in 2019.
2019 Countries Rank of the volume of air transport
Rank Country
1 USA2 PRC3 Canada4 UK5 India6 Japan7 Indonesia8 Ireland9 Germany10 Russia
Source: World Bank
However, the annual growth has larger drop in recent two years mainly due to the
trade tensions between China and the US. The International Air Transport Association has
recorded the downward of global air cargo volume for months, in the three months to July
2020 the global industry-wide cargo tonne-kilometres decreased 16.6% compared with
the same period last year, the downward trend is probably remain.
APPENDIX V LETTER FROM THE MARKET CONSULTANT INRELATION TO ITS MARKET CONSULTANT REPORT
– V-36 –
THIS DOCUMENT IS IN DRAFT FORM, INCOMPLETE AND SUBJECT TO CHANGE AND THAT THE INFORMATION MUST BE READIN CONJUNCTION WITH THE SECTION HEADED “WARNING” ON THE COVER OF THIS DOCUMENT.
Hong Kong
Since 2010, Hong Kong has ranked the city with the highest air cargo volume in the
world for 10 consecutive years. Based on the statistics published by Hong Kong Maritime
and Port Board, from 2010 to 2019, the total air cargo volume of Hong Kong increased
at a CAGR of 1.7% from 4.13 million tons to 4.81 million tons, sharing almost 7.7% of
the global air cargo market. This growth was mainly driven by the increasing air cargo
import and re-export volume of products manufactured in the PRC as the air trade with
the PRC occupied 17.8% of total air trade volume of Hong Kong, and the rising import
and re-export activity stimulated by the initial development of cross-border e-commerce
industry in the PRC.
However, the annual growth rate bottomed out in 2019 possibly because of the
turbulence in Hong Kong society. It is expected that with the economy recovery and the
consumption levels increase, Hong Kong air cargo volume would possibly return to have
a stable development in the near future.
2019 Cities rank of air cargo traffic
Rank City Country Air Cargo Traffic(million tonnes)
1 Hong Kong PRC 4.812 Memphis USA 4.323 Shanghai PRC 3.634 Louisville USA 2.795 Incheon South Korea 2.76
Source: Airports Council International
APPENDIX V LETTER FROM THE MARKET CONSULTANT INRELATION TO ITS MARKET CONSULTANT REPORT
– V-37 –
THIS DOCUMENT IS IN DRAFT FORM, INCOMPLETE AND SUBJECT TO CHANGE AND THAT THE INFORMATION MUST BE READIN CONJUNCTION WITH THE SECTION HEADED “WARNING” ON THE COVER OF THIS DOCUMENT.

The chart below sets out the proportion of air trade volume between Hong Kong and
top 5 countries/regions to Hong Kong’s total trade volume in 2019.
The proportion of air trade volume with top 5 countries/regionsto total trade volume of Hong Kong (2019)
17.8%
10.4%
9.5%
7.9%
6.2%
48.1%
Mainland China
USA
Taiwan
Singapore
Japan
Other counties/regions
Source: Hong Kong External Merchandise Trade
8.2 Cold Chain Logistics
Cold chain logistics includes all the means used to ensure a constant temperature for a
product that is not heat stable, from the time it is manufactured until the time it is used. An
unbroken cold chain is an uninterrupted series of refrigerated production, storage and
distribution activities, along with associated equipment and logistics, which maintain a desired
low-temperature range.
The PRC
Comparing with that in developed western countries, the development of cold chain
logistics in the PRC is now at an early stage. This can be represented in several features.
Firstly, the total supply of cold chain facilities is insufficient and has an uneven
distribution, example can be seen from the development of cold storage market mentioned
above.
Secondly, the concentration rate of the logistics industry is relatively low so that
players can hardly derive benefits from economies of scale. According to the China
Federation of Logistics & Purchasing (中國物流與採購聯合會), the top 10 cold chain
logistics players accounts for less than 5% market shares while the top 100 accounts for
only around 10%. The immature of cold chain logistics in the PRC also denotes future
opportunities for the industry. First, demand for cold chain facilities raised from a wide
range of fields and it increases so rapid that presents an obvious supply gap. For the
second, automation and intelligentisation are two keys for the industry to breakthrough.
For the third, the national government has attached its importance on the industry and is
supposed to propose supporting policies on increasing industrial land supply for cold
chain facilities.
APPENDIX V LETTER FROM THE MARKET CONSULTANT INRELATION TO ITS MARKET CONSULTANT REPORT
– V-38 –
THIS DOCUMENT IS IN DRAFT FORM, INCOMPLETE AND SUBJECT TO CHANGE AND THAT THE INFORMATION MUST BE READIN CONJUNCTION WITH THE SECTION HEADED “WARNING” ON THE COVER OF THIS DOCUMENT.
Under this context, it is estimated that the 2015-2019 CAGR of cold chain in the
PRC was approximately 21.0% and the 2019-2025 CAGR will be approximately 11.5%.
Hong Kong
With a history of over 40 years, the cold chain industry in Hong Kong has made
remarkable development. Most of Hong Kong’s cold chain logistics enterprises are
originated from traditional logistics or consolidated with each other. Unlike that in the
PRC, the cold chain industry in Hong Kong is concentrated to a high degree. It is not only
because of the limited land resource for cold chain facilities which cause high barrier of
funding, but also the strong capacity of market leaders to integrate the whole industry
chain.
In August 2018 and February 2019, SF Holding completed the acquisition of cold
chain business in the PRC, Hong Kong China and Macau China from the U.S. HAVI
Group and the acquisition of supply chain. This investment helped SF, as a group, to be
one of market leaders in cold chain industry and might be beneficial to build up its own
cold chain business in the future.
8.3 International Parcels
Cross-border parcels business refers to a parcel delivery in which the parcel is picked
from one country or region and delivered to an address in another country or region. Among
the global cross-border parcels in 2018, the postal service took over 70% of the deliveries.
These cross-border packages are mainly clothing, consumer electronics, health and beauty
products, and 72% of the packages are lighter than 1 kilogramme.
China is an important participant in the global cross-border parcel delivery market.
According to State Post Bureau, in 2018, China occupied 38% of the global cross-border
parcels market.
8.4 Inter-city delivery
Inter-city logistics refers to the logistics service that occur between two or more cities or
the delivery from one city to another. It could be divided into urban logistics which is serving
for the city and its surrounding area, and regional logistics which is focusing on the logistics
service in the whole region. Overall speaking, inter-city logistics has three key features as
locality, short distance and large amount.
APPENDIX V LETTER FROM THE MARKET CONSULTANT INRELATION TO ITS MARKET CONSULTANT REPORT
– V-39 –
THIS DOCUMENT IS IN DRAFT FORM, INCOMPLETE AND SUBJECT TO CHANGE AND THAT THE INFORMATION MUST BE READIN CONJUNCTION WITH THE SECTION HEADED “WARNING” ON THE COVER OF THIS DOCUMENT.
The main participants of inter-city logistics include goods supply enterprises,
transportation enterprises, consumers and local governments. In the inter-city logistics,
transportation enterprises take logistics facilities including logistics park and distribution
centre as nodes, and deliver goods to the consumers through roads, railway. Meanwhile,
inter-city logistics can integrate logistics activities such as transportation, storage, loading and
unloading as well as packaging and processing.
The national government supports the overall development of logistics industry including
inter-city logistics. Besides, the government would issue several policies to regulate different
segments of logistics service, and plan the coordinated development of logistics with related
industries. In some regions, especially those with developed logistics industry, the local
governments have put forward relevant policies to promote the development of inter-city
logistics in the region.
8.5 Intra-city on-demand delivery
Intra-city on-demand delivery is a kind of logistics mode with excellent flexibility to cope
with urgent logistics requirements (commonly within short distance, i.e. 3 kilometre) which
can be raised by customers at any time of the day. It provides door-to-door delivery services
without storage and commonly completed within an hour for short distance or a day for
city-wide delivery. The most significant feature of such business is to react to orders instantly
and complete logistics tasks just on time and it requires the company to have a sufficient
transport capability and network.
The PRC
The concept of intra-city on-demand delivery in the PRC emerged roughly in 2009
and was firstly refined by the founder of Dianwoda, a pioneer company in this field. In
around 2016, the concept spread widely because of the rise of two internet service
platforms giants, Meituan and Ele.me. The two giants focus on the O2O (online to offline)
businesses of meal takeaways and running errands for buying small-size commodities,
which raise enormous demand of intra-city on-demand delivery.
According to iResearch, the size of the market reached approximately RMB131.3
billion in 2019, with a CAGR of approximately 52.9% during the period of 2015-2019.
It is expected that market size of intra-city on-demand delivery in the PRC will reach
approximately RMB386.9 billion in 2025 with 2019-2025 CAGR of 19.7%.
APPENDIX V LETTER FROM THE MARKET CONSULTANT INRELATION TO ITS MARKET CONSULTANT REPORT
– V-40 –
THIS DOCUMENT IS IN DRAFT FORM, INCOMPLETE AND SUBJECT TO CHANGE AND THAT THE INFORMATION MUST BE READIN CONJUNCTION WITH THE SECTION HEADED “WARNING” ON THE COVER OF THIS DOCUMENT.
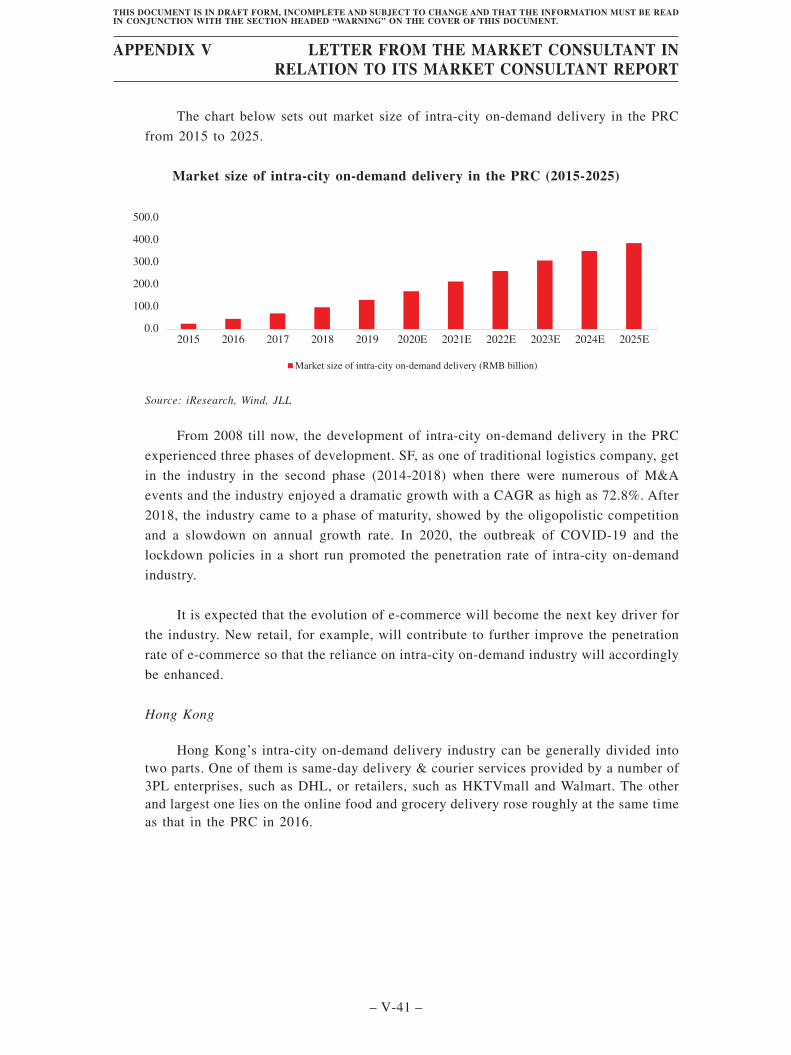
The chart below sets out market size of intra-city on-demand delivery in the PRC
from 2015 to 2025.
Market size of intra-city on-demand delivery in the PRC (2015-2025)
0.0
100.0
200.0
300.0
400.0
500.0
Market size of intra-city on-demand delivery (RMB billion)
2015 2016 2017 2018 2019 2020E 2021E 2022E 2023E 2024E 2025E
Source: iResearch, Wind, JLL
From 2008 till now, the development of intra-city on-demand delivery in the PRC
experienced three phases of development. SF, as one of traditional logistics company, get
in the industry in the second phase (2014-2018) when there were numerous of M&A
events and the industry enjoyed a dramatic growth with a CAGR as high as 72.8%. After
2018, the industry came to a phase of maturity, showed by the oligopolistic competition
and a slowdown on annual growth rate. In 2020, the outbreak of COVID-19 and the
lockdown policies in a short run promoted the penetration rate of intra-city on-demand
industry.
It is expected that the evolution of e-commerce will become the next key driver for
the industry. New retail, for example, will contribute to further improve the penetration
rate of e-commerce so that the reliance on intra-city on-demand industry will accordingly
be enhanced.
Hong Kong
Hong Kong’s intra-city on-demand delivery industry can be generally divided intotwo parts. One of them is same-day delivery & courier services provided by a number of3PL enterprises, such as DHL, or retailers, such as HKTVmall and Walmart. The otherand largest one lies on the online food and grocery delivery rose roughly at the same timeas that in the PRC in 2016.
APPENDIX V LETTER FROM THE MARKET CONSULTANT INRELATION TO ITS MARKET CONSULTANT REPORT
– V-41 –
THIS DOCUMENT IS IN DRAFT FORM, INCOMPLETE AND SUBJECT TO CHANGE AND THAT THE INFORMATION MUST BE READIN CONJUNCTION WITH THE SECTION HEADED “WARNING” ON THE COVER OF THIS DOCUMENT.

According to Statista, revenue in the online food delivery segment in Hong Kong isprojected to reach USD744 million in 2020. Representative players include internationalcompanies such as Foodpanda, Deliveroo and UberEATS. Besides, the online grocerydelivery is growing rapidly during the COVID-19 as many people are cooped up at home.HKTVmall, ParknShop, Jou Sun, Food Monster are some of the active players in thisfield.
The 2015-2019 CAGR of Hong Kong’s intra-city on-demand delivery was 9.8% andit is estimated that market size of intra-city on-demand delivery in Hong Kong willincrease with a 2019-2025 CAGR of approximately 8.3%.
The chart below sets out market size of intra-city on-demand delivery in Hong Kongfrom 2015 to 2025.
Market size of intra-city on-demand delivery* in Hong Kong (2015-2025)
0.0
100.0
200.0
300.0
400.0
500.0
Market size of intra-city on-demand delivery (RMB billion)
2015 2016 2017 2018 2019 2020E 2021E 2022E 2023E 2024E 2025E
Note:
* is represented by online-food delivery
Source: Statista, JLL
8.6 Supply Chain Logistics
The supply chain logistics is the advanced form of traditional logistics. It shares several
common features with traditional logistics yet is quite different on business concept and
operation details. Specifically, both logistics modes cover and focus on every step along with
product circulation, including packaging, transiting, storing, dispatching and distributing. Both
of them would consider the characteristics of the product, such as temperature requirements
and fragility, to decide and arrange proper methods for better completion of logistics tasks.
APPENDIX V LETTER FROM THE MARKET CONSULTANT INRELATION TO ITS MARKET CONSULTANT REPORT
– V-42 –
THIS DOCUMENT IS IN DRAFT FORM, INCOMPLETE AND SUBJECT TO CHANGE AND THAT THE INFORMATION MUST BE READIN CONJUNCTION WITH THE SECTION HEADED “WARNING” ON THE COVER OF THIS DOCUMENT.
However, to understand supply chain logistics, one should stand out to see the whole
supply chain originating from the production to the ultimate consumption. For traditional
logistics, a logistics task starts when the commodity is handed over from upstream, such as
manufacturers or e-commerce retailers, and ends when the commodity is delivered to
downstream, such as retail shops, or end users. During this process, logistics enterprises are
isolated from the production and sales activities. They would have to figure out their own ways
on reducing logistics fix costs as the logistics activities can hardly bring about added value. It
leads to a consequence that traditional logistics enterprises spend the most of efforts on
cost-saving and become less sensitive on the changes of either upstream or downstream. Their
services turn out to be homogeneous and they might find plenty of difficulties to guarantee
service quality.
At present, large-scale companies pioneer to adopt supply chain logistics for their
businesses. DELL, for example, initiated the DELL mode of supply chain logistics, which is
driven by the orders. Consumers would need to wait for a few days to get the product they buy
as DELL only arranges its production and logistics after receiving the requests. E-commerce
giants in the PRC, such as Alibaba and JD, are now endeavouring on the other mode of supply
chain logistics, namely smart logistics which is able to forecast the demand change of client
and adjust the supply chain activities in time so that customers will have a short waiting time.
According to the definition and anticipation of supply chain logistics, Hong Kong now
has a logistics development closer to the form of supply chain logistics, than the PRC. It is
probably because of the competitive landscape (dominated by large-scale listed companies who
involve in a wide range of businesses), the lack of land resource (requiring for extreme
efficiency and quick reactions to the market) and the root of modern logistics concepts.
MODERN LOGISTICS PROPERTY INDUSTRY
1. Overview
1.1 In APAC
Asia Pacific’s positive macro and socio-economic fundamentals have been shaping its
industrial and logistics sectors. The Asia Pacific economy is slated to remain the fastest-
growing region in the world with its strong population growth, rapid urbanisation and emerging
middle class. Complementing these positive underlying macro drivers are structural shifts in
the industrial and retail sectors, and the continual advancement in technology and automation.
The logistics sub-market in particular is expected to be a key growth driver for APAC,
given the expansion of the 3PL industry and the growth of e-commerce platforms. A number
of Asia Pacific logistics markets have performed well, with performance on a par with markets
in Europe and the United States.
APPENDIX V LETTER FROM THE MARKET CONSULTANT INRELATION TO ITS MARKET CONSULTANT REPORT
– V-43 –
THIS DOCUMENT IS IN DRAFT FORM, INCOMPLETE AND SUBJECT TO CHANGE AND THAT THE INFORMATION MUST BE READIN CONJUNCTION WITH THE SECTION HEADED “WARNING” ON THE COVER OF THIS DOCUMENT.
Differing market performances reflect the diversity in scale and maturity across the
region. China is one of largest markets in the Asia Pacific. Further rapid growth in the Asia
Pacific industrial market is anticipated, backed by positive underlying industry and macro
fundamentals.
1.2 In the PRC
The 2010s saw China’s mushrooming middle class and spending on consumer goods
spawn sharp increases in companies’ requirements for modern storage and speedy distribution.
In many major cities, modern logistics property developers could barely build fast enough to
keep up with demand.
Throughout our analysis, we find that three key themes are likely to play a crucial role
in shaping China’s logistics property market over the next ten years:
Self-used demand. China’s consumer market continues to grow, making up for slightly
slower growth rates with sheer size. The COVID-19 outbreak may have a short-term impact,
but China’s consumer story is a long-term trend that will continue despite such shocks. As
consumer trends evolve, investors and operators must adapt to changes in how retail sales
manifest as logistics property demand.
Metropolitan clusters. China’s push to develop city clusters will increasingly determine
where consumers concentrate and where developers and investors should focus their attention.
Areas like the Yangtze River Delta (YRD), GBA, Beijing-Tianjin-Hebei (also called Jing-Jin-
Ji, or JJJ for short), and Chengdu-Chongqing (also called Chengyu) have done well over the
past decade. However, the government’s ambitious plans to foster the growth of city clusters
will supercharge these regions while potentially supporting the emergence of new ones as well.
The most important clusters currently include the YRD, the GBA, the JJJ, and the Chengyu.
Other regional integration initiatives are underway and are likely to lead to the emergence of
new opportunities for regional distribution in the years ahead.
The top city clusters stand at the leading edge of what is possible with logistics properties
and distribution, especially at the regional level. The most centrally located cities in these
clusters can reach over 25 million consumers in a two-hour drive, and the tightly packed urban
areas of the YRD and GBA allow some cities (and the logistics properties in them) to access
up to 60 million people. At the same time, immense investments in transport infrastructure
(notably expressways) are laying the groundwork for ever-more efficient distribution across the
clusters.
One of the biggest beneficiaries of these trends will be satellite markets: logistics
property markets that are growing in small cities just outside of major urban centres. The most
competitive satellite markets occupy advantageous locations with quick access to both their
clusters’ biggest cities and other major markets, making them ideal locations for regional
distribution centres that can reach consumers throughout each cluster.
APPENDIX V LETTER FROM THE MARKET CONSULTANT INRELATION TO ITS MARKET CONSULTANT REPORT
– V-44 –
THIS DOCUMENT IS IN DRAFT FORM, INCOMPLETE AND SUBJECT TO CHANGE AND THAT THE INFORMATION MUST BE READIN CONJUNCTION WITH THE SECTION HEADED “WARNING” ON THE COVER OF THIS DOCUMENT.
Technology application. Technology will play a decisive role as users maximiseefficiency by making the best use of the highest-quality logistics property space available. Thistrend will drive occupiers in China’s vast network of low-quality logistics properties toconsider upgrading to prime properties. There also will be higher requirements for equippinglogistics properties for automation, cold chain, and other high-tech uses, and operators, in turn,must future-proof their assets to cater to these needs.
To this list, we can potentially add the recent outbreak of COVID-19. The pandemic andcontainment effort highlighted the critical role of logistics properties in China’s society andeconomy. As the outbreak recedes, we expect governments and firms to continue upgrading thelogistics sector, with particular upside potential for supply chains and warehousing handlingfresh foods, pharmaceuticals, and other essential goods.
(a) Greater Bay Area
GBA includes nine cities in the Pearl River Delta, Guangdong province, plus HongKong and Macau. At the end of 2019, the Greater Bay Area had usual residencepopulation of approximately 72.7 million and achieved a nominal GDP of approximatelyRMB11,634.6 billion with 2015-2019 CAGR of approximately 8.0%. In terms of theregional development, GBA has leapt to be one of the most important logistics propertymarkets in China. The region has a top rank on the non-bonded market capacity, freightvolume, highway construction, degree of openness and efficiency of clearance.
In 2018, the 13th National People’s Congress (十三屆全國人民代表大會) promotedaccelerating the construction of the Greater Bay Area. Recent landmark infrastructuresuch as the Shenzhen-Zhongshan Aisle (深中通道), the Hong Kong-Zhuhai-Macau Bridge(港珠澳大橋), the Huizhou Airport and the Pearl River Delta International Airport (珠三角新幹線機場) would further promote the economic synergy and industrial upgrade of theurban cluster as well as reduce the travelling time in the Greater Bay Area.
In February 2019, the State Council officially published the Outline DevelopmentPlan for the Guangdong-Hong Kong-Macao Greater Bay Area (粵港澳大灣區發展規劃綱要), which highlighted the mission on improving the interconnection within Greater BayArea through initiatives including enhancing the global logistics position of Hong Kong,constructing the cluster of world class airports, improving the land transport system andso on. It raised the investment confidence and improved the development prospects of thearea. Leverage on the existing infrastructure, the Greater Bay Area aims to achieveintegration of the cities into a “one-hour living circle”, thus the logistics demand in theregion is expected to increase.
Generally, logistics property market in GBA performed well that major cities enjoya low level of vacancy rate in recent years. Affected by the COVID-19, the rental demandfor modern logistics property in GBA saw a rapid increase. For the long term,manufacturing industry, 3PL and e-commerce will remain to be key drivers for thelogistics demands in this district. Nominal GDP of Greater Bay Area is expected to growat a CAGR of around 6.5% during 2019-2025.
APPENDIX V LETTER FROM THE MARKET CONSULTANT INRELATION TO ITS MARKET CONSULTANT REPORT
– V-45 –
THIS DOCUMENT IS IN DRAFT FORM, INCOMPLETE AND SUBJECT TO CHANGE AND THAT THE INFORMATION MUST BE READIN CONJUNCTION WITH THE SECTION HEADED “WARNING” ON THE COVER OF THIS DOCUMENT.
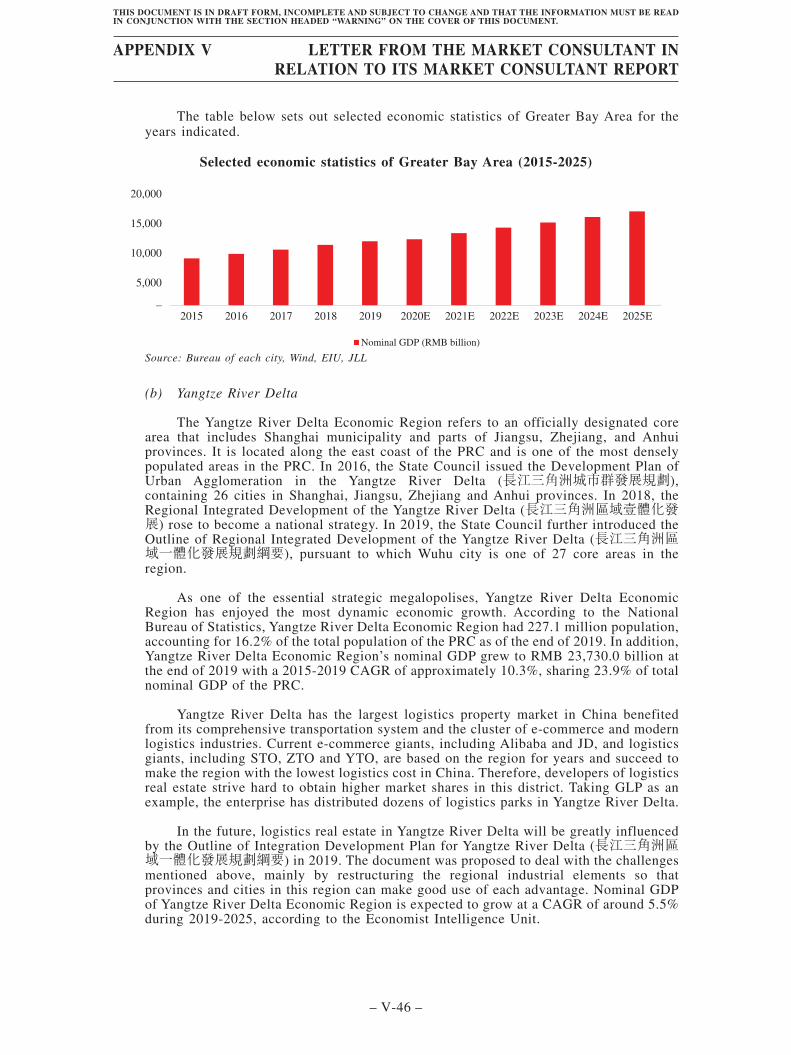
The table below sets out selected economic statistics of Greater Bay Area for theyears indicated.
Selected economic statistics of Greater Bay Area (2015-2025)
–
5,000
10,000
15,000
20,000
Nominal GDP (RMB billion)
2015 2016 2017 2018 2019 2020E 2021E 2022E 2023E 2024E 2025E
Source: Bureau of each city, Wind, EIU, JLL
(b) Yangtze River Delta
The Yangtze River Delta Economic Region refers to an officially designated corearea that includes Shanghai municipality and parts of Jiangsu, Zhejiang, and Anhuiprovinces. It is located along the east coast of the PRC and is one of the most denselypopulated areas in the PRC. In 2016, the State Council issued the Development Plan ofUrban Agglomeration in the Yangtze River Delta (長江三角洲城市群發展規劃),containing 26 cities in Shanghai, Jiangsu, Zhejiang and Anhui provinces. In 2018, theRegional Integrated Development of the Yangtze River Delta (長江三角洲區域壹體化發展) rose to become a national strategy. In 2019, the State Council further introduced theOutline of Regional Integrated Development of the Yangtze River Delta (長江三角洲區域一體化發展規劃綱要), pursuant to which Wuhu city is one of 27 core areas in theregion.
As one of the essential strategic megalopolises, Yangtze River Delta EconomicRegion has enjoyed the most dynamic economic growth. According to the NationalBureau of Statistics, Yangtze River Delta Economic Region had 227.1 million population,accounting for 16.2% of the total population of the PRC as of the end of 2019. In addition,Yangtze River Delta Economic Region’s nominal GDP grew to RMB 23,730.0 billion atthe end of 2019 with a 2015-2019 CAGR of approximately 10.3%, sharing 23.9% of totalnominal GDP of the PRC.
Yangtze River Delta has the largest logistics property market in China benefitedfrom its comprehensive transportation system and the cluster of e-commerce and modernlogistics industries. Current e-commerce giants, including Alibaba and JD, and logisticsgiants, including STO, ZTO and YTO, are based on the region for years and succeed tomake the region with the lowest logistics cost in China. Therefore, developers of logisticsreal estate strive hard to obtain higher market shares in this district. Taking GLP as anexample, the enterprise has distributed dozens of logistics parks in Yangtze River Delta.
In the future, logistics real estate in Yangtze River Delta will be greatly influencedby the Outline of Integration Development Plan for Yangtze River Delta (長江三角洲區域一體化發展規劃綱要) in 2019. The document was proposed to deal with the challengesmentioned above, mainly by restructuring the regional industrial elements so thatprovinces and cities in this region can make good use of each advantage. Nominal GDPof Yangtze River Delta Economic Region is expected to grow at a CAGR of around 5.5%during 2019-2025, according to the Economist Intelligence Unit.
APPENDIX V LETTER FROM THE MARKET CONSULTANT INRELATION TO ITS MARKET CONSULTANT REPORT
– V-46 –
THIS DOCUMENT IS IN DRAFT FORM, INCOMPLETE AND SUBJECT TO CHANGE AND THAT THE INFORMATION MUST BE READIN CONJUNCTION WITH THE SECTION HEADED “WARNING” ON THE COVER OF THIS DOCUMENT.
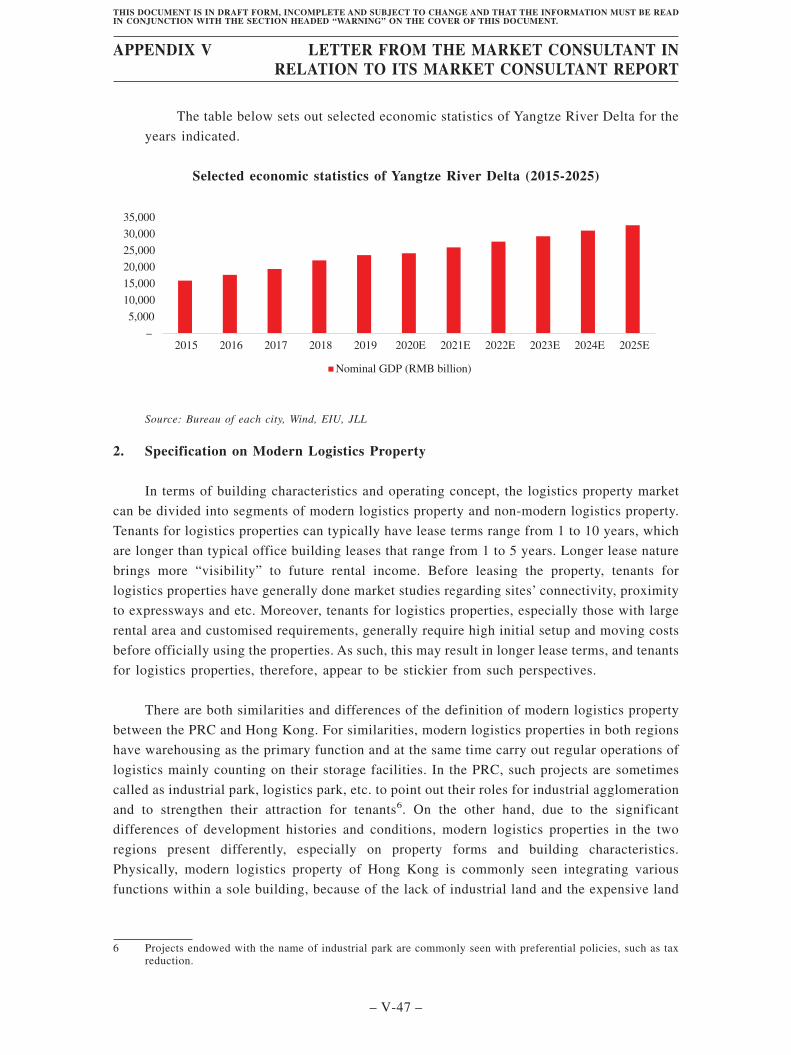
The table below sets out selected economic statistics of Yangtze River Delta for the
years indicated.
Selected economic statistics of Yangtze River Delta (2015-2025)
–
5,000
10,000
15,000
20,000
25,000
30,000
35,000
2015 2016 2017 2018 2019 2020E 2021E 2022E 2023E 2024E 2025E
Nominal GDP (RMB billion)
Source: Bureau of each city, Wind, EIU, JLL
2. Specification on Modern Logistics Property
In terms of building characteristics and operating concept, the logistics property market
can be divided into segments of modern logistics property and non-modern logistics property.
Tenants for logistics properties can typically have lease terms range from 1 to 10 years, which
are longer than typical office building leases that range from 1 to 5 years. Longer lease nature
brings more “visibility” to future rental income. Before leasing the property, tenants for
logistics properties have generally done market studies regarding sites’ connectivity, proximity
to expressways and etc. Moreover, tenants for logistics properties, especially those with large
rental area and customised requirements, generally require high initial setup and moving costs
before officially using the properties. As such, this may result in longer lease terms, and tenants
for logistics properties, therefore, appear to be stickier from such perspectives.
There are both similarities and differences of the definition of modern logistics property
between the PRC and Hong Kong. For similarities, modern logistics properties in both regions
have warehousing as the primary function and at the same time carry out regular operations of
logistics mainly counting on their storage facilities. In the PRC, such projects are sometimes
called as industrial park, logistics park, etc. to point out their roles for industrial agglomeration
and to strengthen their attraction for tenants6. On the other hand, due to the significant
differences of development histories and conditions, modern logistics properties in the two
regions present differently, especially on property forms and building characteristics.
Physically, modern logistics property of Hong Kong is commonly seen integrating various
functions within a sole building, because of the lack of industrial land and the expensive land
6 Projects endowed with the name of industrial park are commonly seen with preferential policies, such as taxreduction.
APPENDIX V LETTER FROM THE MARKET CONSULTANT INRELATION TO ITS MARKET CONSULTANT REPORT
– V-47 –
THIS DOCUMENT IS IN DRAFT FORM, INCOMPLETE AND SUBJECT TO CHANGE AND THAT THE INFORMATION MUST BE READIN CONJUNCTION WITH THE SECTION HEADED “WARNING” ON THE COVER OF THIS DOCUMENT.
price. Thus, modern logistics property building is customised, multi-storey with multifunctions
and might be limited to meet the high-standard hardware requirements as comparison to that
in the mainland (such as net ceiling height, loading capacity). As comparison, benefited from
relatively sufficient industrial land, modern logistics property in the PRC is able to locate
separated buildings with different functions. Developers do not have to increase the layer of
logistics property for more storage area and have more rooms on improving hardware facilities.
Modern logistics property is in majority built recently with high level of modernisation
and equipped with ancillary facilities. It can be used for multiple function of storage and to
fulfil higher standard on logistics efficiency raised by modern logistics. Thus, modern logistics
property is able to offer higher rental level than the non-modern one and its tenants are
commonly with large-size storage amount. As modern logistics raising higher requirements on
logistics efficience for booming storage demand, non-modern logistics property is out-of-date
and lose its competitiveness. The outbreak of the COVID-19 pandemic has also accelerated
structural changes in consumers’ spending habits and retailers’ supply chain management,
causing retailers and suppliers to modernise and improve their logistics facilities and
capabilities in response to these changes.
Modern logistics property developer might merge and acquire such non-modern logistics
property as a way of obtaining industrial land. It is not uncommon for a larger proportion of
the floor area of modern logistics properties to be leased to only one or two major operator
tenants. Further, the operator generally give new tenants rent-free periods ranging from one to
three months, with occasionally longer periods being given to incentivise selected key or
longstanding tenants.
As per to the definition above, we categorised the portfolio of SF for Wuhu Foshan and
Tsingyi belongs to modern logistics properties. They face competition from other properties in
Hong Kong and Foshan and Wuhu in the PRC and the neighbouring sub-districts in varying
degrees.
APPENDIX V LETTER FROM THE MARKET CONSULTANT INRELATION TO ITS MARKET CONSULTANT REPORT
– V-48 –
THIS DOCUMENT IS IN DRAFT FORM, INCOMPLETE AND SUBJECT TO CHANGE AND THAT THE INFORMATION MUST BE READIN CONJUNCTION WITH THE SECTION HEADED “WARNING” ON THE COVER OF THIS DOCUMENT.
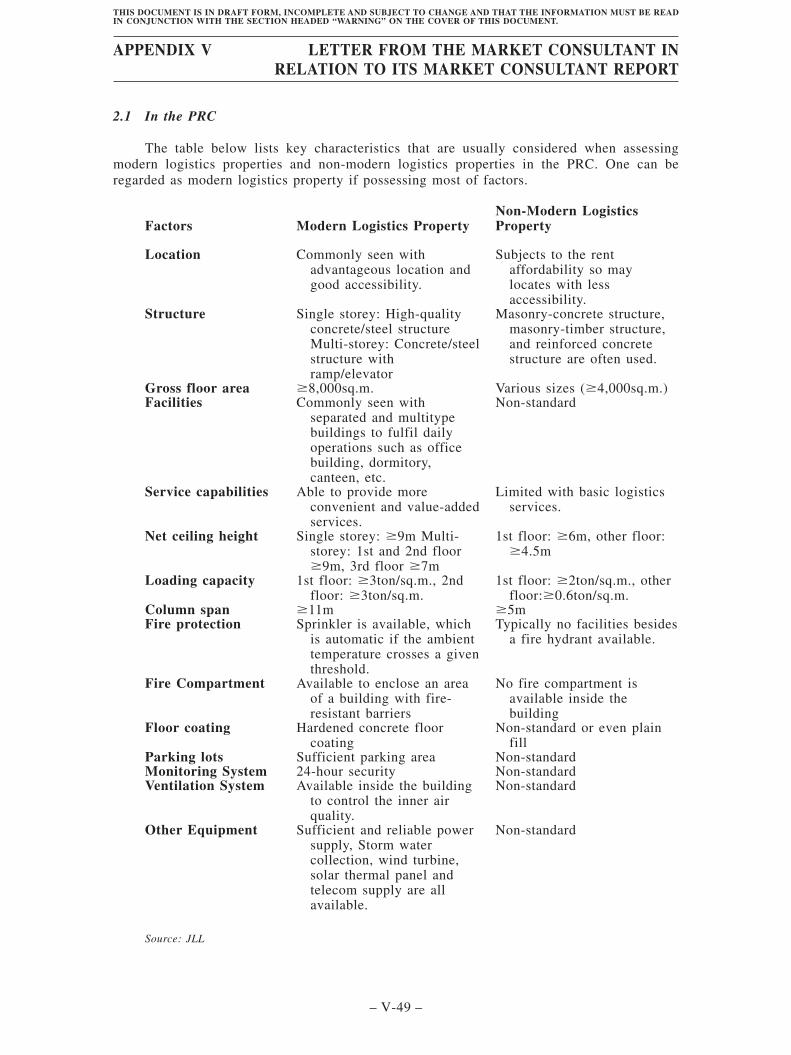
2.1 In the PRC
The table below lists key characteristics that are usually considered when assessingmodern logistics properties and non-modern logistics properties in the PRC. One can beregarded as modern logistics property if possessing most of factors.
Factors Modern Logistics PropertyNon-Modern LogisticsProperty
Location Commonly seen withadvantageous location andgood accessibility.
Subjects to the rentaffordability so maylocates with lessaccessibility.
Structure Single storey: High-qualityconcrete/steel structureMulti-storey: Concrete/steelstructure withramp/elevator
Masonry-concrete structure,masonry-timber structure,and reinforced concretestructure are often used.
Gross floor area �8,000sq.m. Various sizes (�4,000sq.m.)Facilities Commonly seen with
separated and multitypebuildings to fulfil dailyoperations such as officebuilding, dormitory,canteen, etc.
Non-standard
Service capabilities Able to provide moreconvenient and value-addedservices.
Limited with basic logisticsservices.
Net ceiling height Single storey: �9m Multi-storey: 1st and 2nd floor�9m, 3rd floor �7m
1st floor: �6m, other floor:�4.5m
Loading capacity 1st floor: �3ton/sq.m., 2ndfloor: �3ton/sq.m.
1st floor: �2ton/sq.m., otherfloor:�0.6ton/sq.m.
Column span �11m �5mFire protection Sprinkler is available, which
is automatic if the ambienttemperature crosses a giventhreshold.
Typically no facilities besidesa fire hydrant available.
Fire Compartment Available to enclose an areaof a building with fire-resistant barriers
No fire compartment isavailable inside thebuilding
Floor coating Hardened concrete floorcoating
Non-standard or even plainfill
Parking lots Sufficient parking area Non-standardMonitoring System 24-hour security Non-standardVentilation System Available inside the building
to control the inner airquality.
Non-standard
Other Equipment Sufficient and reliable powersupply, Storm watercollection, wind turbine,solar thermal panel andtelecom supply are allavailable.
Non-standard
Source: JLL
APPENDIX V LETTER FROM THE MARKET CONSULTANT INRELATION TO ITS MARKET CONSULTANT REPORT
– V-49 –
THIS DOCUMENT IS IN DRAFT FORM, INCOMPLETE AND SUBJECT TO CHANGE AND THAT THE INFORMATION MUST BE READIN CONJUNCTION WITH THE SECTION HEADED “WARNING” ON THE COVER OF THIS DOCUMENT.
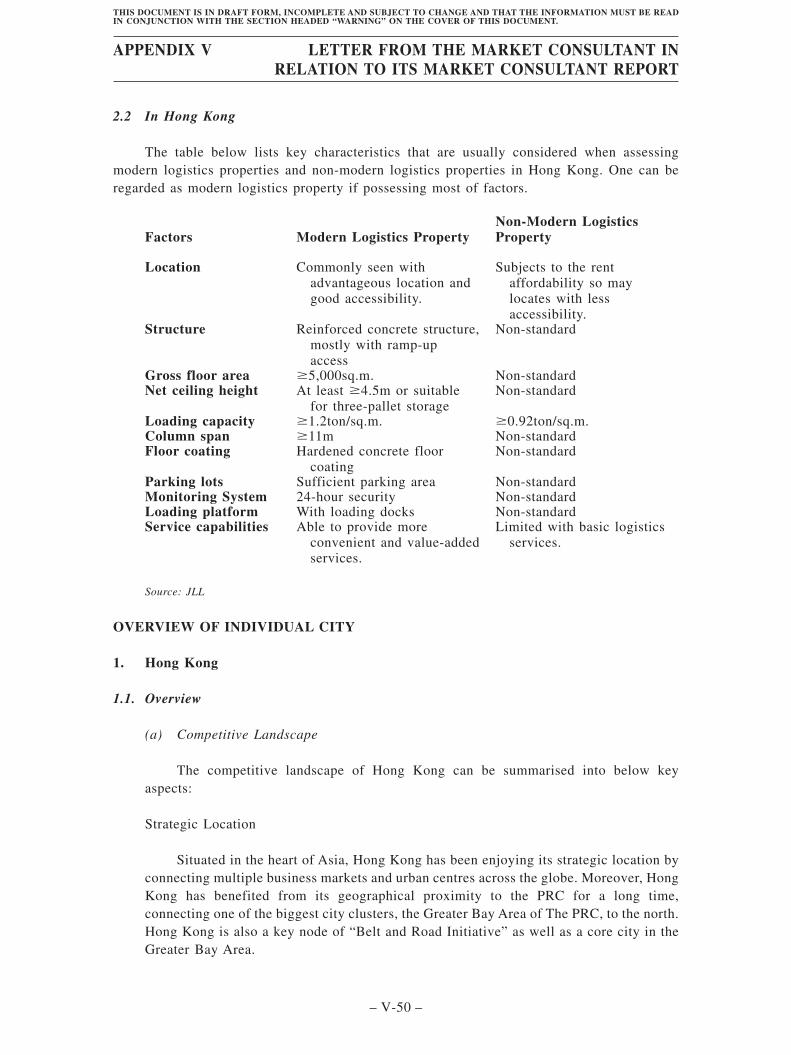
2.2 In Hong Kong
The table below lists key characteristics that are usually considered when assessingmodern logistics properties and non-modern logistics properties in Hong Kong. One can beregarded as modern logistics property if possessing most of factors.
Factors Modern Logistics PropertyNon-Modern LogisticsProperty
Location Commonly seen withadvantageous location andgood accessibility.
Subjects to the rentaffordability so maylocates with lessaccessibility.
Structure Reinforced concrete structure,mostly with ramp-upaccess
Non-standard
Gross floor area �5,000sq.m. Non-standardNet ceiling height At least �4.5m or suitable
for three-pallet storageNon-standard
Loading capacity �1.2ton/sq.m. �0.92ton/sq.m.Column span �11m Non-standardFloor coating Hardened concrete floor
coatingNon-standard
Parking lots Sufficient parking area Non-standardMonitoring System 24-hour security Non-standardLoading platform With loading docks Non-standardService capabilities Able to provide more
convenient and value-addedservices.
Limited with basic logisticsservices.
Source: JLL
OVERVIEW OF INDIVIDUAL CITY
1. Hong Kong
1.1. Overview
(a) Competitive Landscape
The competitive landscape of Hong Kong can be summarised into below keyaspects:
Strategic Location
Situated in the heart of Asia, Hong Kong has been enjoying its strategic location byconnecting multiple business markets and urban centres across the globe. Moreover, HongKong has benefited from its geographical proximity to the PRC for a long time,connecting one of the biggest city clusters, the Greater Bay Area of The PRC, to the north.Hong Kong is also a key node of “Belt and Road Initiative” as well as a core city in theGreater Bay Area.
APPENDIX V LETTER FROM THE MARKET CONSULTANT INRELATION TO ITS MARKET CONSULTANT REPORT
– V-50 –
THIS DOCUMENT IS IN DRAFT FORM, INCOMPLETE AND SUBJECT TO CHANGE AND THAT THE INFORMATION MUST BE READIN CONJUNCTION WITH THE SECTION HEADED “WARNING” ON THE COVER OF THIS DOCUMENT.

Kwai Tsing district possesses the strategic position in the territory. It is one of the
18 districts of Hong Kong and consists of Kwai Chung and Tsing Yi. The district contains
many mature infrastructures, such as the Tsing Ma Bridge that links to the airport, and the
Container Terminal 9 that connects to other busiest ports in the world.
World-class Infrastructure and Transportation Hub
As a regional hub, Hong Kong is well-known for its world-class infrastructure and
transportation capability. According to the 2019 Global Competitiveness Report issued by
the World Economic Forum, Hong Kong ranked the 3rd in terms of infrastructure
competitiveness (基建競爭力) in the world. Currently, Hong Kong possesses renowned
infrastructure including international airport, container terminals, express rail link (Hong
Kong section), Hong Kong-Zhuhai-Macau Bridge, etc.
Below summarises major existing and future infrastructures and their benefits.
Name Benefits
The third runway ofHKIA
A three-runway system can handle around 100 millionpassengers and cargo throughout of 9 million tonnes by2030.
The Liantang/HeungYuen WaiBoundary ControlPoint
It will significantly reduce travelling time between HongKong and Shenzhen and Guangdong East, facilitate futuredevelopment in these areas and extend the economichinterland of Hong Kong and Shenzhen. Strengthening thelinkage with Shenzhen and Guangdong East is of strategicimportance in terms of regional integration and co-operation.
The Hong Kong-Zhuhai-MacauBridge
It shortens the travelling time to Zhuhai from 4 hours to 45minutes.
Route 6 It is expected to relieve the congestion problem in Kowloon,and to serve as an alternative route for the existing TseungKwan O Tunnel.
The TuenMun-Chek LapKok Link
It is expected that the congestion between Tuen Mun Roadand Wong Chu Road would not appear during peak hours. Italso helps relieve the traffic burden in other areas in TuenMun.
North LantauHighway
It shortens the travelling distance between the Chek Lap Kokairport and Hong Kong Island, and improves the transportsystem in the North West Territories.
Shenzhen BayBridge
It enhances the connectivity between Hong Kong and the PRCand promotes the growth of the trading and logistic sectorsas well as the modern logistics property market in HongKong.
Source: JLL
APPENDIX V LETTER FROM THE MARKET CONSULTANT INRELATION TO ITS MARKET CONSULTANT REPORT
– V-51 –
THIS DOCUMENT IS IN DRAFT FORM, INCOMPLETE AND SUBJECT TO CHANGE AND THAT THE INFORMATION MUST BE READIN CONJUNCTION WITH THE SECTION HEADED “WARNING” ON THE COVER OF THIS DOCUMENT.
According to the Hong Kong International Airport (HKIA), Hong Kong connects
approximately 220 destinations worldwide by around 120 airlines, handling 71.5 million
passengers in total in 2019. Despite losing its mantle as the world’s busiest container port,
HKIA is still one of the busiest airports for cargo movements around the globe.
The completions of the high-speed railway as well as the Hong Kong-Zhuhai-Macau
Bridge further promote the interconnection between Hong Kong and the cities of the The
PRC. The high-speed railway connects Hong Kong and Shenzhen’s Futian CBD in 15
minutes, while the Hong Kong-Zhuhai-Macau Bridge shorten the travelling time to
Zhuhai and Macau by 80%. It is believed that such interconnection will facilitate the
unshakable position of Hong Kong’s renowned infrastructure and transportation hub.
Logistics Hub
Hong Kong has long been the regional logistics hub and enjoying the prosperity of
logistics market thanks to the well-developed world-class air, sea and road infrastructures
and transportations. In addition, Hong Kong values and embraces free trade. As such,
Hong Kong’s logistics sector, which has been growing all over these years, also takes
advantages of the trading industry.
(b) Logistics Real Estate Industry
Benefited from the strategic location of Hong Kong in Asia, the city has been
enjoying prosperity of Trading and Logistics Industry, which is one of the Four Key
Industries. Specifically, the Trading and Logistics Industry accounted for 21% of Hong
Kong’s GDP and 19% of employment in 2018, according to the latest figures from the
Census and Statistics Department.
Nowadays, there are more than 25,600 trading and logistics related companies
locally and growing numbers of companies are setting up regional distribution hubs in
Hong Kong to gain extra advantage through the well-developed and interconnected air,
sea and road transportation modes.
APPENDIX V LETTER FROM THE MARKET CONSULTANT INRELATION TO ITS MARKET CONSULTANT REPORT
– V-52 –
THIS DOCUMENT IS IN DRAFT FORM, INCOMPLETE AND SUBJECT TO CHANGE AND THAT THE INFORMATION MUST BE READIN CONJUNCTION WITH THE SECTION HEADED “WARNING” ON THE COVER OF THIS DOCUMENT.
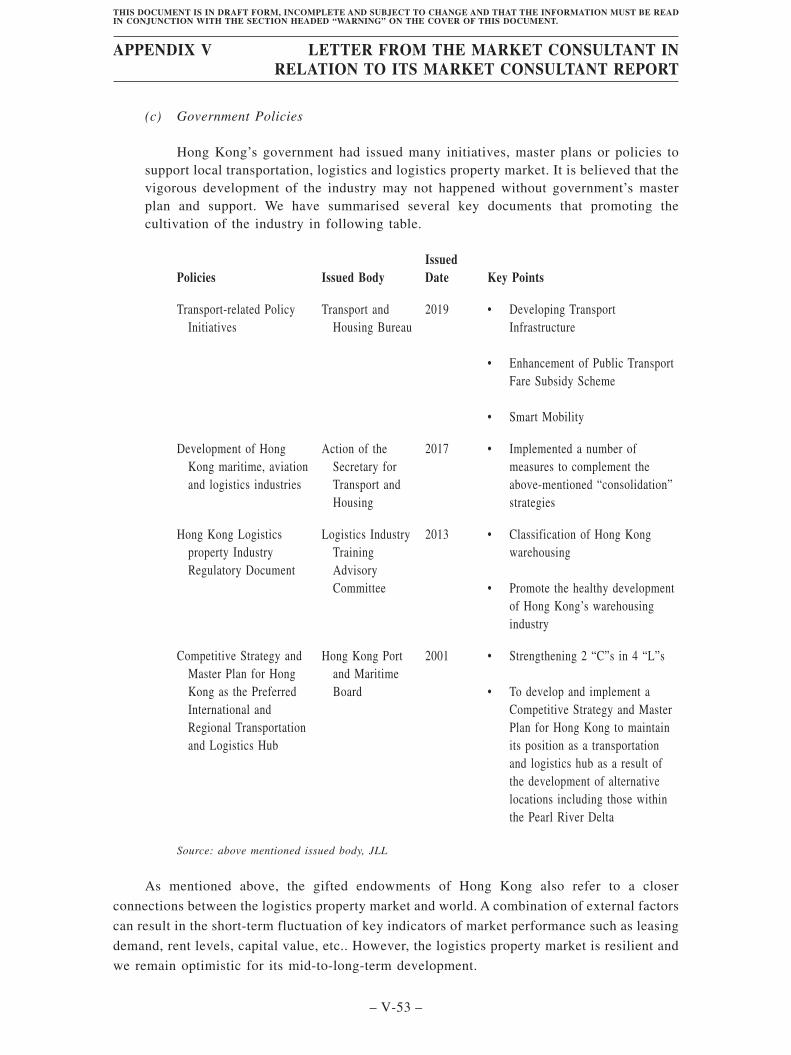
(c) Government Policies
Hong Kong’s government had issued many initiatives, master plans or policies tosupport local transportation, logistics and logistics property market. It is believed that thevigorous development of the industry may not happened without government’s masterplan and support. We have summarised several key documents that promoting thecultivation of the industry in following table.
Policies Issued BodyIssuedDate Key Points
Transport-related PolicyInitiatives
Transport andHousing Bureau
2019 • Developing TransportInfrastructure
• Enhancement of Public TransportFare Subsidy Scheme
• Smart Mobility
Development of HongKong maritime, aviationand logistics industries
Action of theSecretary forTransport andHousing
2017 • Implemented a number ofmeasures to complement theabove-mentioned “consolidation”strategies
Hong Kong Logisticsproperty IndustryRegulatory Document
Logistics IndustryTrainingAdvisoryCommittee
2013 • Classification of Hong Kongwarehousing
• Promote the healthy developmentof Hong Kong’s warehousingindustry
Competitive Strategy andMaster Plan for HongKong as the PreferredInternational andRegional Transportationand Logistics Hub
Hong Kong Portand MaritimeBoard
2001 • Strengthening 2 “C”s in 4 “L”s
• To develop and implement aCompetitive Strategy and MasterPlan for Hong Kong to maintainits position as a transportationand logistics hub as a result ofthe development of alternativelocations including those withinthe Pearl River Delta
Source: above mentioned issued body, JLL
As mentioned above, the gifted endowments of Hong Kong also refer to a closer
connections between the logistics property market and world. A combination of external factors
can result in the short-term fluctuation of key indicators of market performance such as leasing
demand, rent levels, capital value, etc.. However, the logistics property market is resilient and
we remain optimistic for its mid-to-long-term development.
APPENDIX V LETTER FROM THE MARKET CONSULTANT INRELATION TO ITS MARKET CONSULTANT REPORT
– V-53 –
THIS DOCUMENT IS IN DRAFT FORM, INCOMPLETE AND SUBJECT TO CHANGE AND THAT THE INFORMATION MUST BE READIN CONJUNCTION WITH THE SECTION HEADED “WARNING” ON THE COVER OF THIS DOCUMENT.
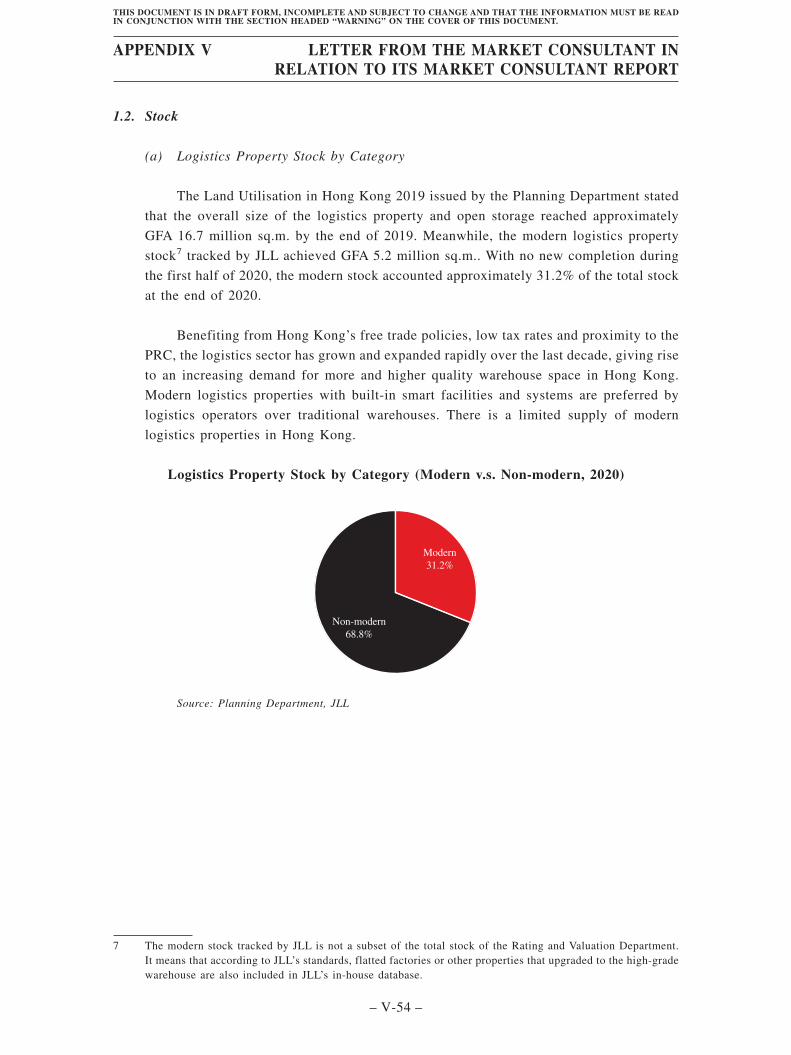
1.2. Stock
(a) Logistics Property Stock by Category
The Land Utilisation in Hong Kong 2019 issued by the Planning Department stated
that the overall size of the logistics property and open storage reached approximately
GFA 16.7 million sq.m. by the end of 2019. Meanwhile, the modern logistics property
stock7 tracked by JLL achieved GFA 5.2 million sq.m.. With no new completion during
the first half of 2020, the modern stock accounted approximately 31.2% of the total stock
at the end of 2020.
Benefiting from Hong Kong’s free trade policies, low tax rates and proximity to the
PRC, the logistics sector has grown and expanded rapidly over the last decade, giving rise
to an increasing demand for more and higher quality warehouse space in Hong Kong.
Modern logistics properties with built-in smart facilities and systems are preferred by
logistics operators over traditional warehouses. There is a limited supply of modern
logistics properties in Hong Kong.
Logistics Property Stock by Category (Modern v.s. Non-modern, 2020)
Non-modern
68.8%
Modern
31.2%
Source: Planning Department, JLL
7 The modern stock tracked by JLL is not a subset of the total stock of the Rating and Valuation Department.It means that according to JLL’s standards, flatted factories or other properties that upgraded to the high-gradewarehouse are also included in JLL’s in-house database.
APPENDIX V LETTER FROM THE MARKET CONSULTANT INRELATION TO ITS MARKET CONSULTANT REPORT
– V-54 –
THIS DOCUMENT IS IN DRAFT FORM, INCOMPLETE AND SUBJECT TO CHANGE AND THAT THE INFORMATION MUST BE READIN CONJUNCTION WITH THE SECTION HEADED “WARNING” ON THE COVER OF THIS DOCUMENT.
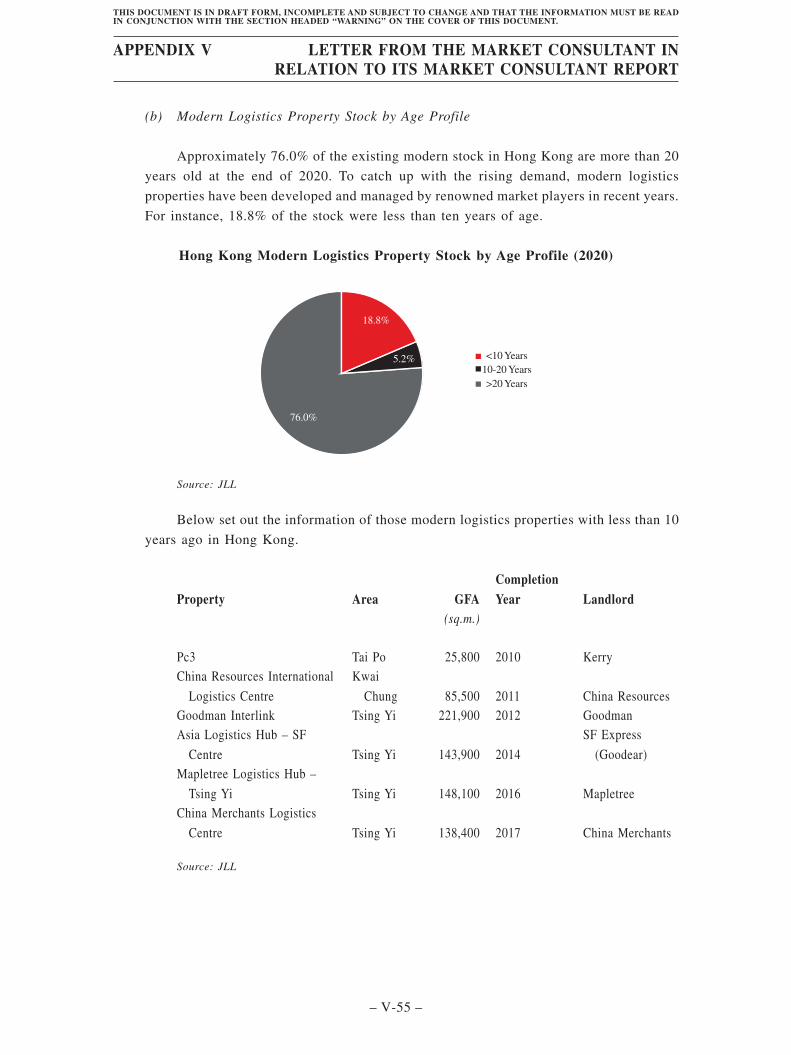
(b) Modern Logistics Property Stock by Age Profile
Approximately 76.0% of the existing modern stock in Hong Kong are more than 20
years old at the end of 2020. To catch up with the rising demand, modern logistics
properties have been developed and managed by renowned market players in recent years.
For instance, 18.8% of the stock were less than ten years of age.
Hong Kong Modern Logistics Property Stock by Age Profile (2020)
18.8%
5.2%
76.0%
<10 Years
10-20 Years
>20 Years
Source: JLL
Below set out the information of those modern logistics properties with less than 10
years ago in Hong Kong.
Property Area GFACompletionYear Landlord
(sq.m.)
Pc3 Tai Po 25,800 2010 KerryChina Resources International
Logistics Centre
Kwai
Chung 85,500 2011 China ResourcesGoodman Interlink Tsing Yi 221,900 2012 GoodmanAsia Logistics Hub – SF
Centre Tsing Yi 143,900 2014
SF Express
(Goodear)Mapletree Logistics Hub –
Tsing Yi Tsing Yi 148,100 2016 MapletreeChina Merchants Logistics
Centre Tsing Yi 138,400 2017 China Merchants
Source: JLL
APPENDIX V LETTER FROM THE MARKET CONSULTANT INRELATION TO ITS MARKET CONSULTANT REPORT
– V-55 –
THIS DOCUMENT IS IN DRAFT FORM, INCOMPLETE AND SUBJECT TO CHANGE AND THAT THE INFORMATION MUST BE READIN CONJUNCTION WITH THE SECTION HEADED “WARNING” ON THE COVER OF THIS DOCUMENT.
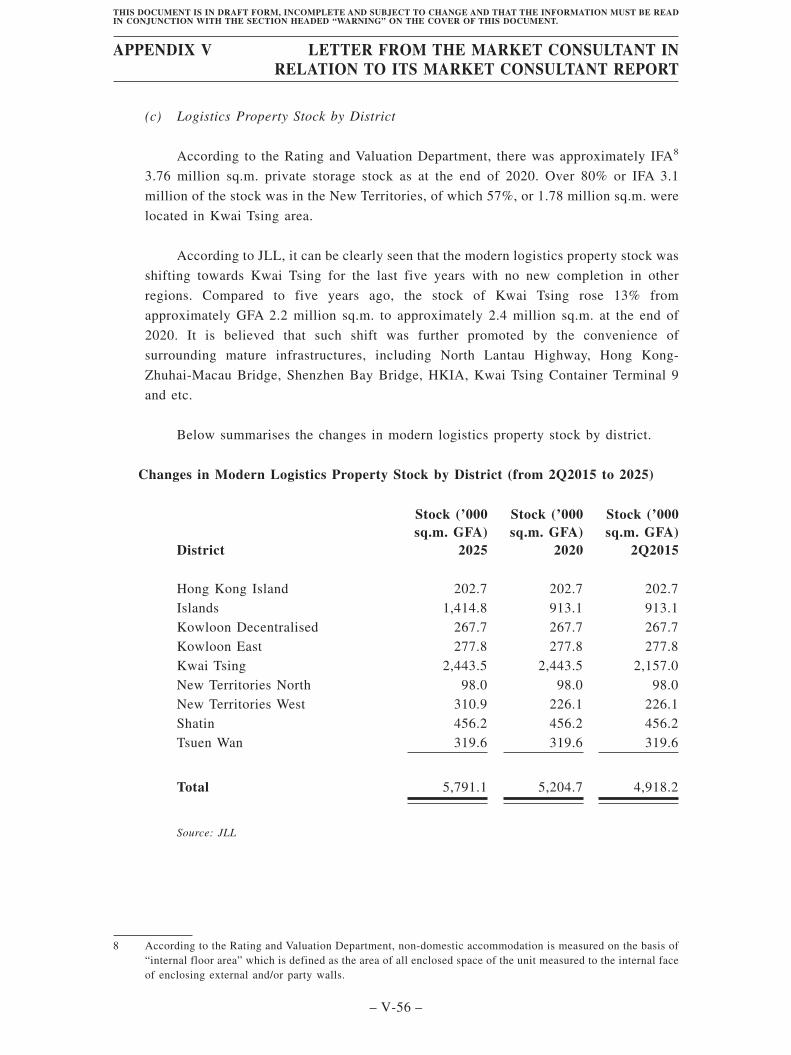
(c) Logistics Property Stock by District
According to the Rating and Valuation Department, there was approximately IFA8
3.76 million sq.m. private storage stock as at the end of 2020. Over 80% or IFA 3.1
million of the stock was in the New Territories, of which 57%, or 1.78 million sq.m. were
located in Kwai Tsing area.
According to JLL, it can be clearly seen that the modern logistics property stock was
shifting towards Kwai Tsing for the last five years with no new completion in other
regions. Compared to five years ago, the stock of Kwai Tsing rose 13% from
approximately GFA 2.2 million sq.m. to approximately 2.4 million sq.m. at the end of
2020. It is believed that such shift was further promoted by the convenience of
surrounding mature infrastructures, including North Lantau Highway, Hong Kong-
Zhuhai-Macau Bridge, Shenzhen Bay Bridge, HKIA, Kwai Tsing Container Terminal 9
and etc.
Below summarises the changes in modern logistics property stock by district.
Changes in Modern Logistics Property Stock by District (from 2Q2015 to 2025)
District
Stock (’000sq.m. GFA)
2025
Stock (’000sq.m. GFA)
2020
Stock (’000sq.m. GFA)
2Q2015
Hong Kong Island 202.7 202.7 202.7Islands 1,414.8 913.1 913.1Kowloon Decentralised 267.7 267.7 267.7Kowloon East 277.8 277.8 277.8Kwai Tsing 2,443.5 2,443.5 2,157.0New Territories North 98.0 98.0 98.0New Territories West 310.9 226.1 226.1Shatin 456.2 456.2 456.2Tsuen Wan 319.6 319.6 319.6
Total 5,791.1 5,204.7 4,918.2
Source: JLL
8 According to the Rating and Valuation Department, non-domestic accommodation is measured on the basis of“internal floor area” which is defined as the area of all enclosed space of the unit measured to the internal faceof enclosing external and/or party walls.
APPENDIX V LETTER FROM THE MARKET CONSULTANT INRELATION TO ITS MARKET CONSULTANT REPORT
– V-56 –
THIS DOCUMENT IS IN DRAFT FORM, INCOMPLETE AND SUBJECT TO CHANGE AND THAT THE INFORMATION MUST BE READIN CONJUNCTION WITH THE SECTION HEADED “WARNING” ON THE COVER OF THIS DOCUMENT.

Figures indicated that by the end of 2020, 85.6% of the total modern stock was
situated in the New Territories district (including Islands, Tsuen Wan, Shatin, New
Territories West, New Territories North and Kwai Tsing), and Kwai Tsing was dominating
in terms of stock volume. By 2025, the leading position of Kwai Tsing is expected to be
remained, while the share of the Islands will be increased given upon completion of a
mega size modern logistics property project in Kwo Lo Wan.
Modern Logistics Property Stock by District (2020)
Hong Kong Island3.9%Tsuen Wan
6.1%
Kowloon Decentralised5.1%
Kowloon East5.3%
Kwai Tsing46.9%
New Territories North1.9%
New Territories West4.3%
Shatin8.8%
Islands17.5%
Source: JLL
Modern Logistics Property Stock by District (2025)
Hong Kong Island
3.5%
Islands
24.4%
Kowloon Decentralised
4.6%
Kowloon East
4.8%
Kwai Tsing
42.2%
New Territories North
1.7%
New Territories West
5.4%
Shatin
7.9%
Tsuen Wan
5.5%
Source: JLL
APPENDIX V LETTER FROM THE MARKET CONSULTANT INRELATION TO ITS MARKET CONSULTANT REPORT
– V-57 –
THIS DOCUMENT IS IN DRAFT FORM, INCOMPLETE AND SUBJECT TO CHANGE AND THAT THE INFORMATION MUST BE READIN CONJUNCTION WITH THE SECTION HEADED “WARNING” ON THE COVER OF THIS DOCUMENT.
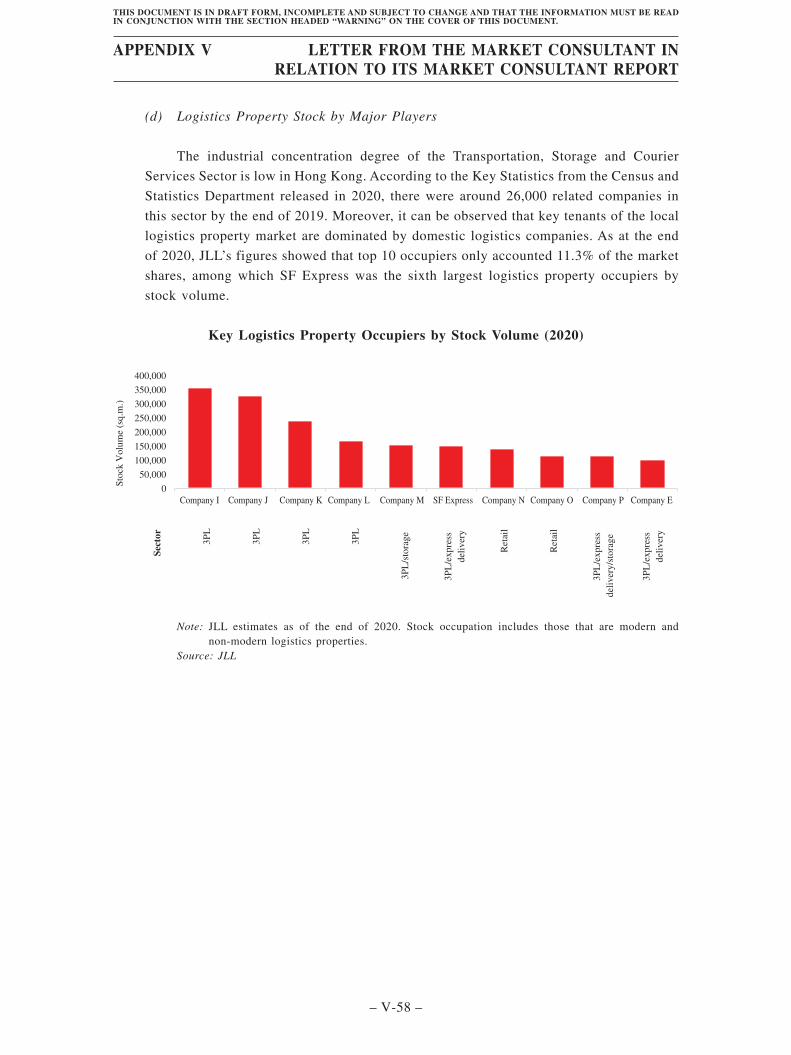
(d) Logistics Property Stock by Major Players
The industrial concentration degree of the Transportation, Storage and Courier
Services Sector is low in Hong Kong. According to the Key Statistics from the Census and
Statistics Department released in 2020, there were around 26,000 related companies in
this sector by the end of 2019. Moreover, it can be observed that key tenants of the local
logistics property market are dominated by domestic logistics companies. As at the end
of 2020, JLL’s figures showed that top 10 occupiers only accounted 11.3% of the market
shares, among which SF Express was the sixth largest logistics property occupiers by
stock volume.
Key Logistics Property Occupiers by Stock Volume (2020)
Sect
or
3P
L
3P
L
3P
L
3P
L
3P
L/s
tora
ge
3P
L/e
xp
ress
del
iver
y
Ret
ail
Ret
ail
3P
L/e
xp
ress
del
iver
y/s
tora
ge
3P
L/e
xp
ress
del
iver
y
0
50,000
100,000
150,000
200,000
250,000
300,000
350,000
400,000
Company I Company J Company K Company L Company M SF Express Company N Company O Company P Company E
Sto
ck V
olu
me
(sq
.m.)
Note: JLL estimates as of the end of 2020. Stock occupation includes those that are modern andnon-modern logistics properties.
Source: JLL
APPENDIX V LETTER FROM THE MARKET CONSULTANT INRELATION TO ITS MARKET CONSULTANT REPORT
– V-58 –
THIS DOCUMENT IS IN DRAFT FORM, INCOMPLETE AND SUBJECT TO CHANGE AND THAT THE INFORMATION MUST BE READIN CONJUNCTION WITH THE SECTION HEADED “WARNING” ON THE COVER OF THIS DOCUMENT.
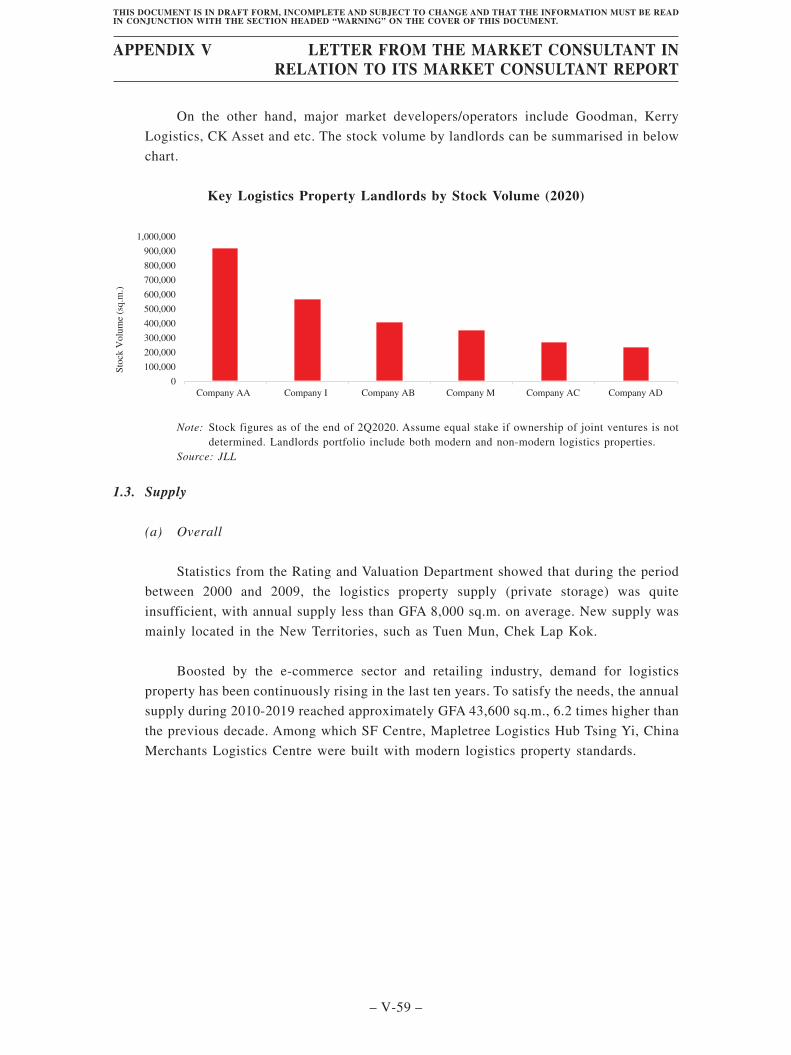
On the other hand, major market developers/operators include Goodman, Kerry
Logistics, CK Asset and etc. The stock volume by landlords can be summarised in below
chart.
Key Logistics Property Landlords by Stock Volume (2020)
0
100,000
200,000
300,000
400,000
500,000
600,000
700,000
800,000
900,000
1,000,000
Company AA Company I Company AB Company M Company AC Company AD
Sto
ck V
olu
me
(sq
.m.)
Note: Stock figures as of the end of 2Q2020. Assume equal stake if ownership of joint ventures is notdetermined. Landlords portfolio include both modern and non-modern logistics properties.
Source: JLL
1.3. Supply
(a) Overall
Statistics from the Rating and Valuation Department showed that during the period
between 2000 and 2009, the logistics property supply (private storage) was quite
insufficient, with annual supply less than GFA 8,000 sq.m. on average. New supply was
mainly located in the New Territories, such as Tuen Mun, Chek Lap Kok.
Boosted by the e-commerce sector and retailing industry, demand for logistics
property has been continuously rising in the last ten years. To satisfy the needs, the annual
supply during 2010-2019 reached approximately GFA 43,600 sq.m., 6.2 times higher than
the previous decade. Among which SF Centre, Mapletree Logistics Hub Tsing Yi, China
Merchants Logistics Centre were built with modern logistics property standards.
APPENDIX V LETTER FROM THE MARKET CONSULTANT INRELATION TO ITS MARKET CONSULTANT REPORT
– V-59 –
THIS DOCUMENT IS IN DRAFT FORM, INCOMPLETE AND SUBJECT TO CHANGE AND THAT THE INFORMATION MUST BE READIN CONJUNCTION WITH THE SECTION HEADED “WARNING” ON THE COVER OF THIS DOCUMENT.
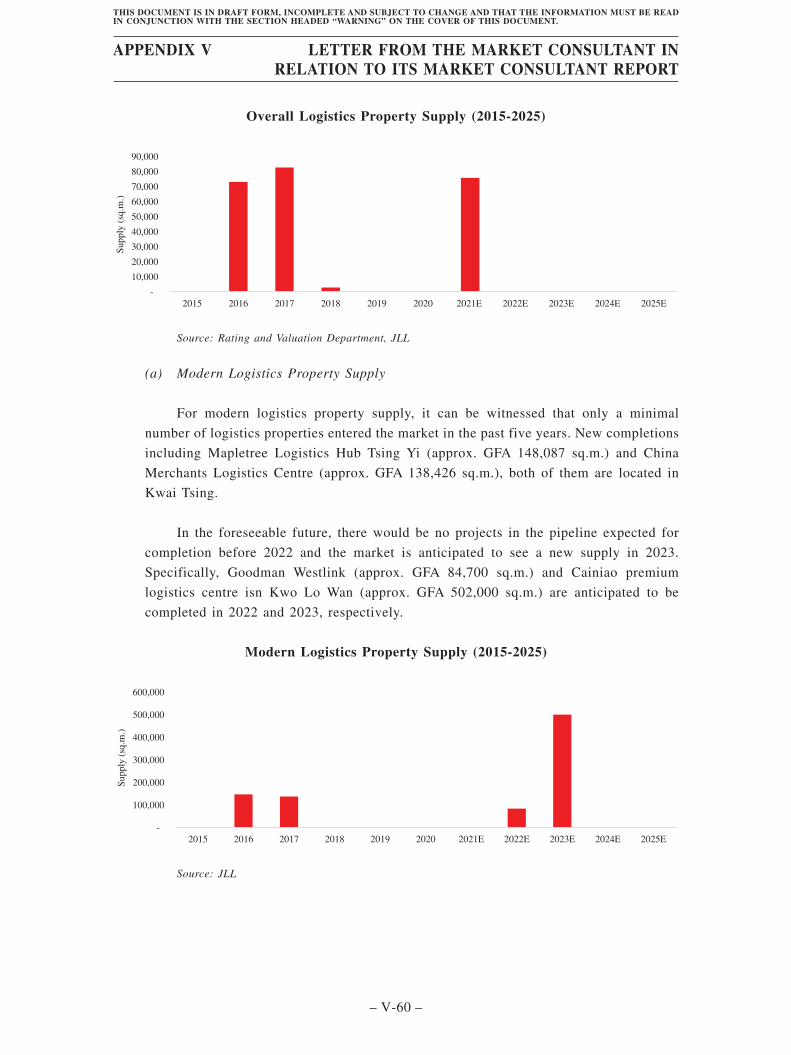
Overall Logistics Property Supply (2015-2025)
-
10,000
20,000
30,000
40,000
50,000
60,000
70,000
80,000
90,000
2015 2016 2017 2018 2019 2020 2021E 2022E 2023E 2024E 2025E
Supply
(sq
.m.)
Source: Rating and Valuation Department, JLL
(a) Modern Logistics Property Supply
For modern logistics property supply, it can be witnessed that only a minimal
number of logistics properties entered the market in the past five years. New completions
including Mapletree Logistics Hub Tsing Yi (approx. GFA 148,087 sq.m.) and China
Merchants Logistics Centre (approx. GFA 138,426 sq.m.), both of them are located in
Kwai Tsing.
In the foreseeable future, there would be no projects in the pipeline expected for
completion before 2022 and the market is anticipated to see a new supply in 2023.
Specifically, Goodman Westlink (approx. GFA 84,700 sq.m.) and Cainiao premium
logistics centre isn Kwo Lo Wan (approx. GFA 502,000 sq.m.) are anticipated to be
completed in 2022 and 2023, respectively.
Modern Logistics Property Supply (2015-2025)
-
100,000
200,000
300,000
400,000
500,000
600,000
2015 2016 2017 2018 2019 2020 2021E 2022E 2023E 2024E 2025E
Su
pp
ly (
sq.m
.)
Source: JLL
APPENDIX V LETTER FROM THE MARKET CONSULTANT INRELATION TO ITS MARKET CONSULTANT REPORT
– V-60 –
THIS DOCUMENT IS IN DRAFT FORM, INCOMPLETE AND SUBJECT TO CHANGE AND THAT THE INFORMATION MUST BE READIN CONJUNCTION WITH THE SECTION HEADED “WARNING” ON THE COVER OF THIS DOCUMENT.
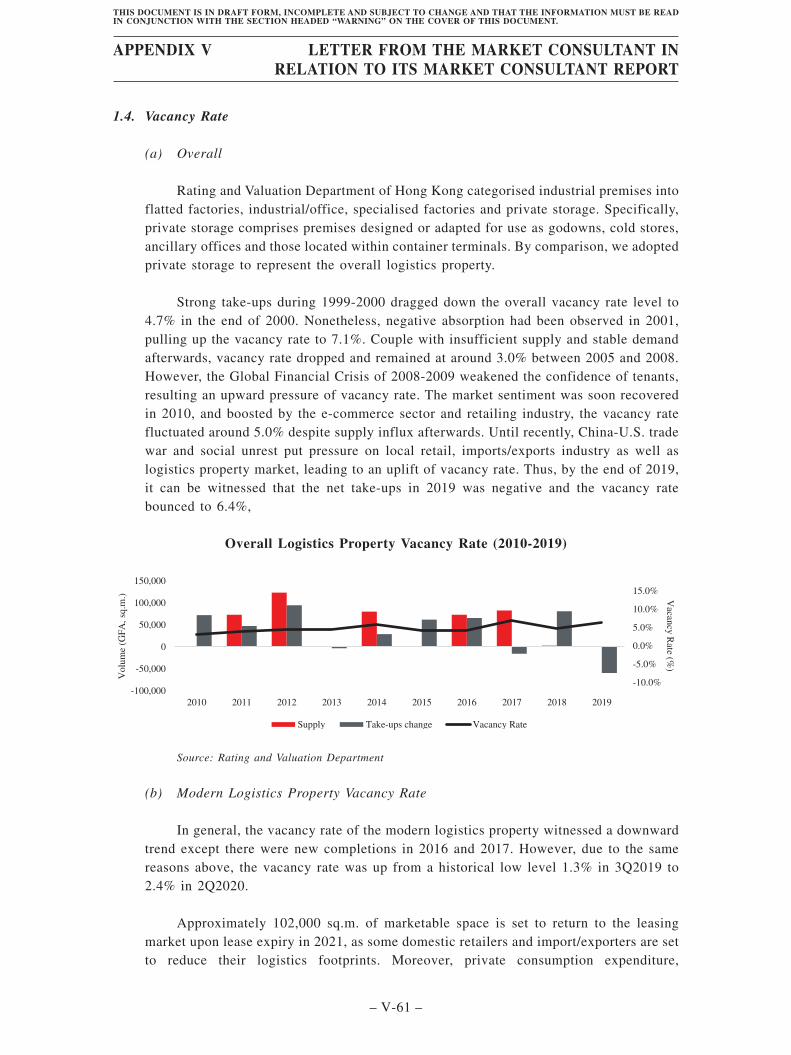
1.4. Vacancy Rate
(a) Overall
Rating and Valuation Department of Hong Kong categorised industrial premises intoflatted factories, industrial/office, specialised factories and private storage. Specifically,private storage comprises premises designed or adapted for use as godowns, cold stores,ancillary offices and those located within container terminals. By comparison, we adoptedprivate storage to represent the overall logistics property.
Strong take-ups during 1999-2000 dragged down the overall vacancy rate level to4.7% in the end of 2000. Nonetheless, negative absorption had been observed in 2001,pulling up the vacancy rate to 7.1%. Couple with insufficient supply and stable demandafterwards, vacancy rate dropped and remained at around 3.0% between 2005 and 2008.However, the Global Financial Crisis of 2008-2009 weakened the confidence of tenants,resulting an upward pressure of vacancy rate. The market sentiment was soon recoveredin 2010, and boosted by the e-commerce sector and retailing industry, the vacancy ratefluctuated around 5.0% despite supply influx afterwards. Until recently, China-U.S. tradewar and social unrest put pressure on local retail, imports/exports industry as well aslogistics property market, leading to an uplift of vacancy rate. Thus, by the end of 2019,it can be witnessed that the net take-ups in 2019 was negative and the vacancy ratebounced to 6.4%,
Overall Logistics Property Vacancy Rate (2010-2019)
-10.0%
-5.0%
0.0%
5.0%
10.0%
15.0%
-100,000
-50,000
0
50,000
100,000
150,000
2010 2011 2012 2013 2014 2015 2016 2017 2018 2019
Vacan
cy R
ate (%)
Volu
me
(GF
A,
sq.m
.)
Supply Take-ups change Vacancy Rate
Source: Rating and Valuation Department
(b) Modern Logistics Property Vacancy Rate
In general, the vacancy rate of the modern logistics property witnessed a downwardtrend except there were new completions in 2016 and 2017. However, due to the samereasons above, the vacancy rate was up from a historical low level 1.3% in 3Q2019 to2.4% in 2Q2020.
Approximately 102,000 sq.m. of marketable space is set to return to the leasingmarket upon lease expiry in 2021, as some domestic retailers and import/exporters are setto reduce their logistics footprints. Moreover, private consumption expenditure,
APPENDIX V LETTER FROM THE MARKET CONSULTANT INRELATION TO ITS MARKET CONSULTANT REPORT
– V-61 –
THIS DOCUMENT IS IN DRAFT FORM, INCOMPLETE AND SUBJECT TO CHANGE AND THAT THE INFORMATION MUST BE READIN CONJUNCTION WITH THE SECTION HEADED “WARNING” ON THE COVER OF THIS DOCUMENT.

merchandise trade and retail sales volume of Hong Kong are all forecast to have negativegrowth in 2020, as the weakened economy in the aftermath of the pandemic could takelonger to recover. On the flip side, there are no projects in the pipeline expected forcompletion before 2022.
Modern Logistics Property Vacancy Rate (2015-2025)
0.0%
1.0%
2.0%
3.0%
4.0%
5.0%
6.0%
-100,000
0
100,000
200,000
300,000
400,000
500,000
600,000
2015 2016 2017 2018 2019 2020 2021E 2022E 2023E 2024E 2025E
Vacan
cy R
ate(%
)Volu
me
(GF
A s
q.m
.)
Supply Take-ups Vacancy Rate
Source: JLL
1.5. Rent
Under similar external factors (such as location, policies, proximity to infrastructures,
and etc.), modern logistics properties are able to charge a higher rent compared to non-modern
facilities. This is because modern logistics property generally possesses sufficient floor-to-
floor height, loading capacity and platform, car parking lots, and ancillary functions, such as
office area. Modern logistics property commanded a 17.7% premium over the rental in
non-modern logistics property in 2019.
Statistics show that the net effective rent of modern logistics property enjoyed a stable
growth from 2015 to early 2019, and drop from HKD145.6/sq.m./mth since 2Q2019 and further
slid to HKD135.6/sq.m./mth in 2Q2020.
Logistic facilities’ rents are expected to rebound slightly in the second half of 2021. In
short run, cost-sensitive tenants in trading, retail and etc. sectors are more likely to relocate to
cost-saving facilities so the rental level of modern logistics property will see a 3-5% drop in
2021. In the mid-to-long term, limited supply and strong demand rebound will be the key
drivers for rental growth. Modern logistics property could enjoy a higher rental growth if
demand for high-quality logistics property starts to pick up.
APPENDIX V LETTER FROM THE MARKET CONSULTANT INRELATION TO ITS MARKET CONSULTANT REPORT
– V-62 –
THIS DOCUMENT IS IN DRAFT FORM, INCOMPLETE AND SUBJECT TO CHANGE AND THAT THE INFORMATION MUST BE READIN CONJUNCTION WITH THE SECTION HEADED “WARNING” ON THE COVER OF THIS DOCUMENT.

The chart below sets out the rent performance of Hong Kong modern logistics property
market during 2015-2025.
Modern Logistics Property Net Effective Rent (2015-2025)
-
20.00
40.00
60.00
80.00
100.00
120.00
140.00
160.00
2015 2016 2017 2018 2019 2020E 2021E 2022E 2023E 2024E 2025E
Modern warehouse
Net
Eff
ecti
ve
Ren
t (H
KD
per
sq.m
. p
er d
ay)
Source: JLL
Moreover, in the past five years, it can be observed that the rental gap between modern
and non-modern logistics property narrowed mainly due to lack of leasable space in modern
logistics property, boosting up the rental value of non-modern logistics property. However,
shared with the same reasons mentioned above, the rental value of non-modern logistics
property started to sink.
Supported by excellent features such as higher handing efficiency, well-designed, larger
floor area and etc., it is forecasted that the modern logistics property will remain resilient and
outperform non-modern logistics property. It is anticipated that market recovery will contribute
a steady rental growth of modern logistics property in the period between 2022 and 2025, with
a CAGR of 2.2%.
1.6. Demand
Demand for logistics logistics properties in Hong Kong has been growing for years due
to its modern location in Asia, creating significant opportunities for trading, logistics, logistics
properties and etc. The city is the ideal place to develop a logistics, supply chain, logistics
property and storage business benefited by its free-port status, mature infrastructure and
transportation. Increasing trade with the PRC and other Asia Pacific regions cultivate the
prosperity of the industry. As such, companies with the background of storage, logistics, retail
and etc. have been the essential demand for local logistics property market. Besides, it is also
difficult to convert non-modern logistics properties to modern logistics properties since
conversion would involve significant physical transformation, such as loading capacity and net
ceiling height, which is costly and time-consuming. Conversion may not be feasible, for
example, where a traditional warehouse is located in a place with low power distribution that
fails to meet the high energy consumption requirements of modern warehouses.
APPENDIX V LETTER FROM THE MARKET CONSULTANT INRELATION TO ITS MARKET CONSULTANT REPORT
– V-63 –
THIS DOCUMENT IS IN DRAFT FORM, INCOMPLETE AND SUBJECT TO CHANGE AND THAT THE INFORMATION MUST BE READIN CONJUNCTION WITH THE SECTION HEADED “WARNING” ON THE COVER OF THIS DOCUMENT.
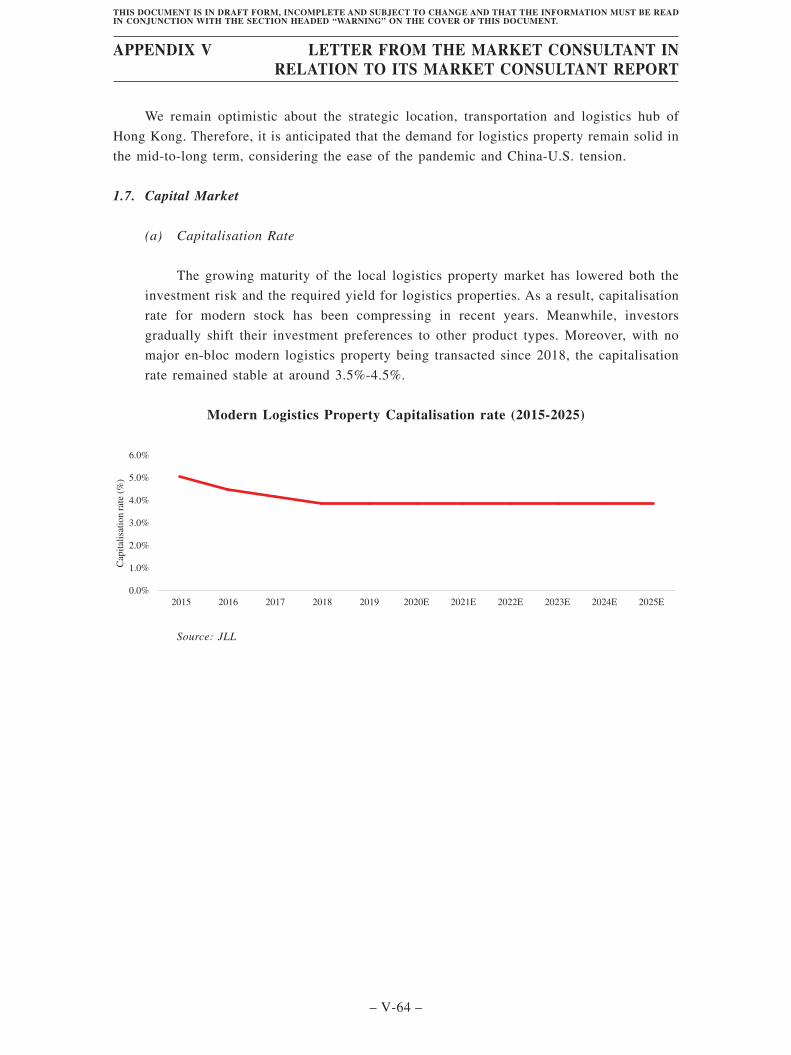
We remain optimistic about the strategic location, transportation and logistics hub of
Hong Kong. Therefore, it is anticipated that the demand for logistics property remain solid in
the mid-to-long term, considering the ease of the pandemic and China-U.S. tension.
1.7. Capital Market
(a) Capitalisation Rate
The growing maturity of the local logistics property market has lowered both the
investment risk and the required yield for logistics properties. As a result, capitalisation
rate for modern stock has been compressing in recent years. Meanwhile, investors
gradually shift their investment preferences to other product types. Moreover, with no
major en-bloc modern logistics property being transacted since 2018, the capitalisation
rate remained stable at around 3.5%-4.5%.
Modern Logistics Property Capitalisation rate (2015-2025)
0.0%
1.0%
2.0%
3.0%
4.0%
6.0%
5.0%
2015 2016 2017 2018 2019 2020E 2021E 2022E 2023E 2024E 2025E
Cap
ital
isat
ion r
ate
(%)
Source: JLL
APPENDIX V LETTER FROM THE MARKET CONSULTANT INRELATION TO ITS MARKET CONSULTANT REPORT
– V-64 –
THIS DOCUMENT IS IN DRAFT FORM, INCOMPLETE AND SUBJECT TO CHANGE AND THAT THE INFORMATION MUST BE READIN CONJUNCTION WITH THE SECTION HEADED “WARNING” ON THE COVER OF THIS DOCUMENT.
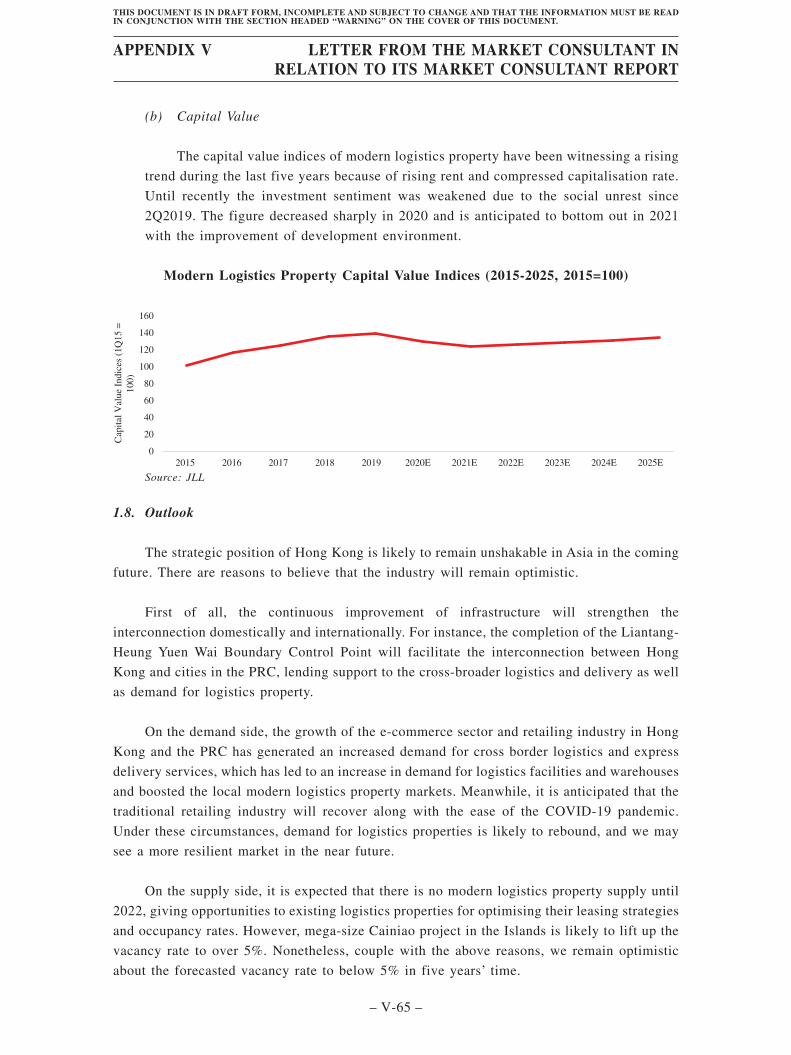
(b) Capital Value
The capital value indices of modern logistics property have been witnessing a rising
trend during the last five years because of rising rent and compressed capitalisation rate.
Until recently the investment sentiment was weakened due to the social unrest since
2Q2019. The figure decreased sharply in 2020 and is anticipated to bottom out in 2021
with the improvement of development environment.
Modern Logistics Property Capital Value Indices (2015-2025, 2015=100)
0
20
40
60
80
100
160
140
120
2015 2016 2017 2018 2019 2020E 2021E 2022E 2023E 2024E 2025E
10
0)
Cap
ital
Val
ue
Indic
es (
1Q
15 =
Source: JLL
1.8. Outlook
The strategic position of Hong Kong is likely to remain unshakable in Asia in the coming
future. There are reasons to believe that the industry will remain optimistic.
First of all, the continuous improvement of infrastructure will strengthen the
interconnection domestically and internationally. For instance, the completion of the Liantang-
Heung Yuen Wai Boundary Control Point will facilitate the interconnection between Hong
Kong and cities in the PRC, lending support to the cross-broader logistics and delivery as well
as demand for logistics property.
On the demand side, the growth of the e-commerce sector and retailing industry in Hong
Kong and the PRC has generated an increased demand for cross border logistics and express
delivery services, which has led to an increase in demand for logistics facilities and warehouses
and boosted the local modern logistics property markets. Meanwhile, it is anticipated that the
traditional retailing industry will recover along with the ease of the COVID-19 pandemic.
Under these circumstances, demand for logistics properties is likely to rebound, and we may
see a more resilient market in the near future.
On the supply side, it is expected that there is no modern logistics property supply until
2022, giving opportunities to existing logistics properties for optimising their leasing strategies
and occupancy rates. However, mega-size Cainiao project in the Islands is likely to lift up the
vacancy rate to over 5%. Nonetheless, couple with the above reasons, we remain optimistic
about the forecasted vacancy rate to below 5% in five years’ time.
APPENDIX V LETTER FROM THE MARKET CONSULTANT INRELATION TO ITS MARKET CONSULTANT REPORT
– V-65 –
THIS DOCUMENT IS IN DRAFT FORM, INCOMPLETE AND SUBJECT TO CHANGE AND THAT THE INFORMATION MUST BE READIN CONJUNCTION WITH THE SECTION HEADED “WARNING” ON THE COVER OF THIS DOCUMENT.
On the supply side, it is expected that there is no modern logistics property supply until
2022, giving opportunities to existing logistics properties for optimising their leasing strategies
and occupancy rates. However, mega-size Cainiao project in the Islands is likely to lift up the
vacancy rate. Nonetheless, couple with the above reasons, we remain optimistic about the
forecasted vacancy rate to below 5% in five years’ time.
Hong Kong’s logistics industry remains firmly on the radar of investors. While growth in
values is likely to slow in the short run, investors’ confidence in the structural drivers for the
logistics sector is expected to remain intact. Therefore, capital values are forecast to stay
relatively firm, with modest yield compression may be observed.
APPENDIX V LETTER FROM THE MARKET CONSULTANT INRELATION TO ITS MARKET CONSULTANT REPORT
– V-66 –
THIS DOCUMENT IS IN DRAFT FORM, INCOMPLETE AND SUBJECT TO CHANGE AND THAT THE INFORMATION MUST BE READIN CONJUNCTION WITH THE SECTION HEADED “WARNING” ON THE COVER OF THIS DOCUMENT.
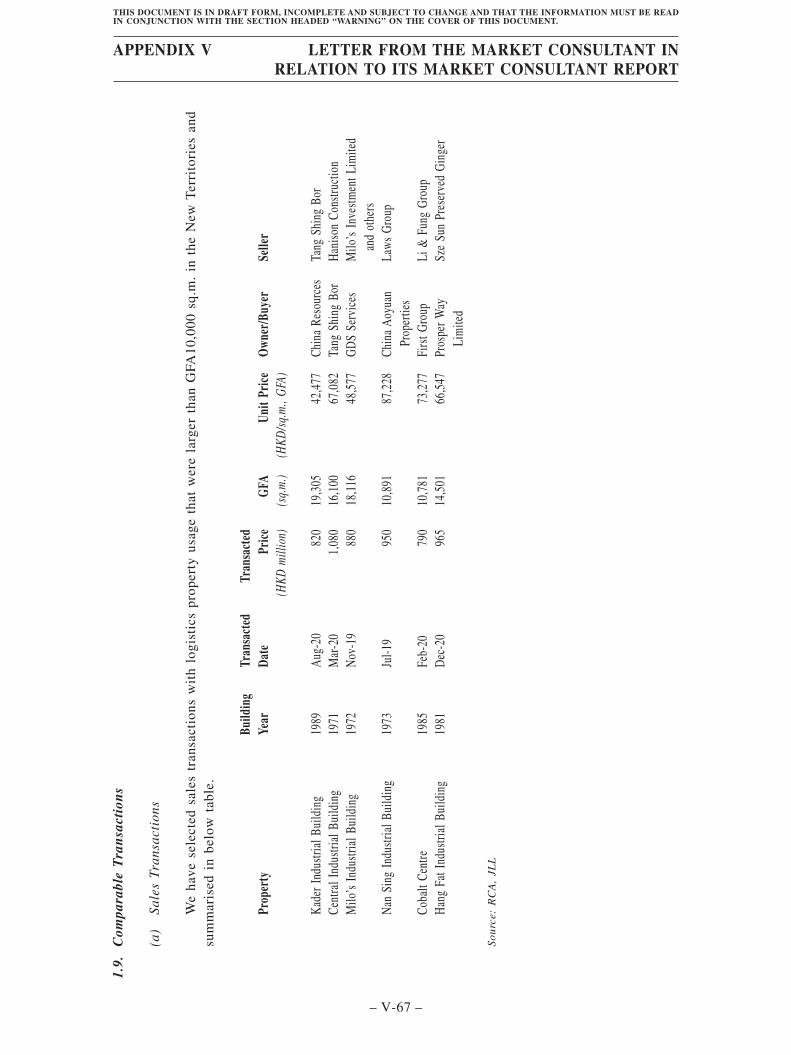
1.9.
Com
para
ble
Tra
nsa
ctio
ns
(a)
Sale
sTr
ansa
ctio
ns
We
have
sele
cted
sale
str
ansa
ctio
nsw
ith
logi
stic
spr
oper
tyus
age
that
wer
ela
rger
than
GFA
10,0
00sq
.m.
inth
eN
ewT
erri
tori
esan
dsu
mm
aris
edin
belo
wta
ble.
Prop
erty
Build
ing
Year
Tran
sact
edDa
teTr
ansa
cted
Pric
eG
FAUn
itPr
ice
Own
er/B
uyer
Selle
r(H
KDm
illio
n)(s
q.m
.)(H
KD/s
q.m
.,G
FA)
Kad
erIn
dustr
ialB
uild
ing
1989
Aug
-20
820
19,3
0542
,477
Chin
aRe
sour
ces
Tang
Shin
gBo
rCe
ntra
lInd
ustri
alBu
ildin
g19
71M
ar-2
01,
080
16,1
0067
,082
Tang
Shin
gBo
rH
aniso
nCo
nstru
ctio
nM
ilo’s
Indu
stria
lBui
ldin
g19
72N
ov-1
988
018
,116
48,5
77G
DS
Serv
ices
Milo
’sIn
vestm
entL
imite
dan
dot
hers
Nan
Sing
Indu
stria
lBui
ldin
g19
73Ju
l-19
950
10,8
9187
,228
Chin
aA
oyua
nPr
oper
ties
Law
sG
roup
Coba
ltCe
ntre
1985
Feb-
2079
010
,781
73,2
77Fi
rstG
roup
Li&
Fung
Gro
upH
ang
FatI
ndus
trial
Build
ing
1981
Dec
-20
965
14,5
0166
,547
Pros
perW
ayLi
mite
dSz
eSu
nPr
eser
ved
Gin
ger
Sour
ce:
RC
A,
JLL
APPENDIX V LETTER FROM THE MARKET CONSULTANT INRELATION TO ITS MARKET CONSULTANT REPORT
– V-67 –
THIS DOCUMENT IS IN DRAFT FORM, INCOMPLETE AND SUBJECT TO CHANGE AND THAT THE INFORMATION MUST BE READIN CONJUNCTION WITH THE SECTION HEADED “WARNING” ON THE COVER OF THIS DOCUMENT.
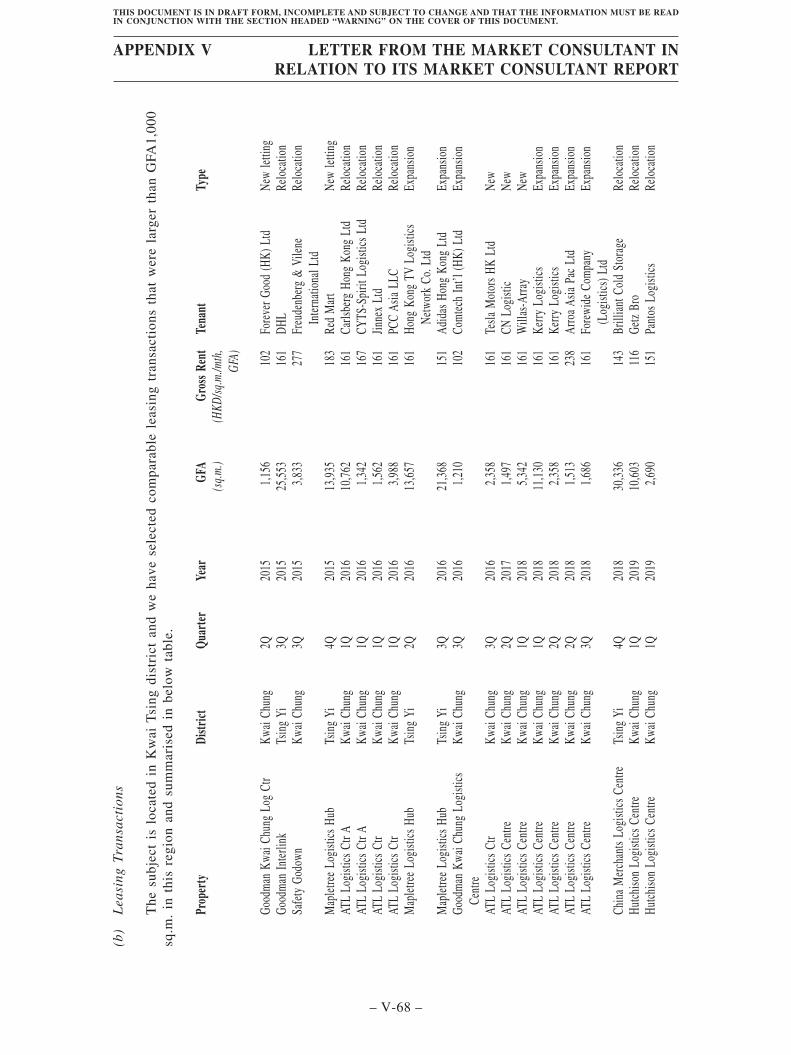
(b)
Lea
sing
Tran
sact
ions
The
subj
ect
islo
cate
din
Kw
aiT
sing
dist
rict
and
we
have
sele
cted
com
para
ble
leas
ing
tran
sact
ions
that
wer
ela
rger
than
GFA
1,00
0sq
.m.
inth
isre
gion
and
sum
mar
ised
inbe
low
tabl
e.
Prop
erty
Distr
ictQ
uart
erYe
arG
FAG
ross
Rent
Tena
ntTy
pe(s
q.m.
)(H
KD/sq
.m./m
th,
GFA)
Good
man
Kwai
Chun
gLo
gCt
rKw
aiCh
ung
2Q20
151,
156
102
Fore
verG
ood
(HK)
Ltd
New
letti
ngGo
odm
anIn
terli
nkTs
ing
Yi3Q
2015
25,5
5316
1DH
LRe
loca
tion
Safe
tyGo
down
Kwai
Chun
g3Q
2015
3,83
327
7Fr
eude
nber
g&
Vile
neIn
tern
atio
nalL
tdRe
loca
tion
Map
letre
eLo
gisti
csHu
bTs
ing
Yi4Q
2015
13,9
3518
3Re
dM
art
New
letti
ngAT
LLo
gisti
csCt
rAKw
aiCh
ung
1Q20
1610
,762
161
Carls
berg
Hong
Kong
Ltd
Relo
catio
nAT
LLo
gisti
csCt
rAKw
aiCh
ung
1Q20
161,
342
167
CYTS
-Spi
ritLo
gisti
csLt
dRe
loca
tion
ATL
Logi
stics
Ctr
Kwai
Chun
g1Q
2016
1,56
216
1Jin
nex
Ltd
Relo
catio
nAT
LLo
gisti
csCt
rKw
aiCh
ung
1Q20
163,
988
161
PCC
Asia
LLC
Relo
catio
nM
aple
tree
Logi
stics
Hub
Tsin
gYi
2Q20
1613
,657
161
Hong
Kong
TVLo
gisti
csNe
twor
kCo
.Ltd
Expa
nsio
n
Map
letre
eLo
gisti
csHu
bTs
ing
Yi3Q
2016
21,3
6815
1Ad
idas
Hong
Kong
Ltd
Expa
nsio
nGo
odm
anKw
aiCh
ung
Logi
stics
Cent
reKw
aiCh
ung
3Q20
161,
210
102
Com
tech
Int’l
(HK)
Ltd
Expa
nsio
n
ATL
Logi
stics
Ctr
Kwai
Chun
g3Q
2016
2,35
816
1Te
slaM
otor
sHK
Ltd
New
ATL
Logi
stics
Cent
reKw
aiCh
ung
2Q20
171,
497
161
CNLo
gisti
cNe
wAT
LLo
gisti
csCe
ntre
Kwai
Chun
g1Q
2018
5,34
216
1W
illas
-Arra
yNe
wAT
LLo
gisti
csCe
ntre
Kwai
Chun
g1Q
2018
11,1
3016
1Ke
rryLo
gisti
csEx
pans
ion
ATL
Logi
stics
Cent
reKw
aiCh
ung
2Q20
182,
358
161
Kerry
Logi
stics
Expa
nsio
nAT
LLo
gisti
csCe
ntre
Kwai
Chun
g2Q
2018
1,51
323
8Ar
roa
Asia
Pac
Ltd
Expa
nsio
nAT
LLo
gisti
csCe
ntre
Kwai
Chun
g3Q
2018
1,68
616
1Fo
rewi
deCo
mpa
ny(L
ogist
ics)
Ltd
Expa
nsio
n
Chin
aM
erch
ants
Logi
stics
Cent
reTs
ing
Yi4Q
2018
30,3
3614
3Br
illia
ntCo
ldSt
orag
eRe
loca
tion
Hutc
hiso
nLo
gisti
csCe
ntre
Kwai
Chun
g1Q
2019
10,6
0311
6Ge
tzBr
oRe
loca
tion
Hutc
hiso
nLo
gisti
csCe
ntre
Kwai
Chun
g1Q
2019
2,69
015
1Pa
ntos
Logi
stics
Relo
catio
n
APPENDIX V LETTER FROM THE MARKET CONSULTANT INRELATION TO ITS MARKET CONSULTANT REPORT
– V-68 –
THIS DOCUMENT IS IN DRAFT FORM, INCOMPLETE AND SUBJECT TO CHANGE AND THAT THE INFORMATION MUST BE READIN CONJUNCTION WITH THE SECTION HEADED “WARNING” ON THE COVER OF THIS DOCUMENT.
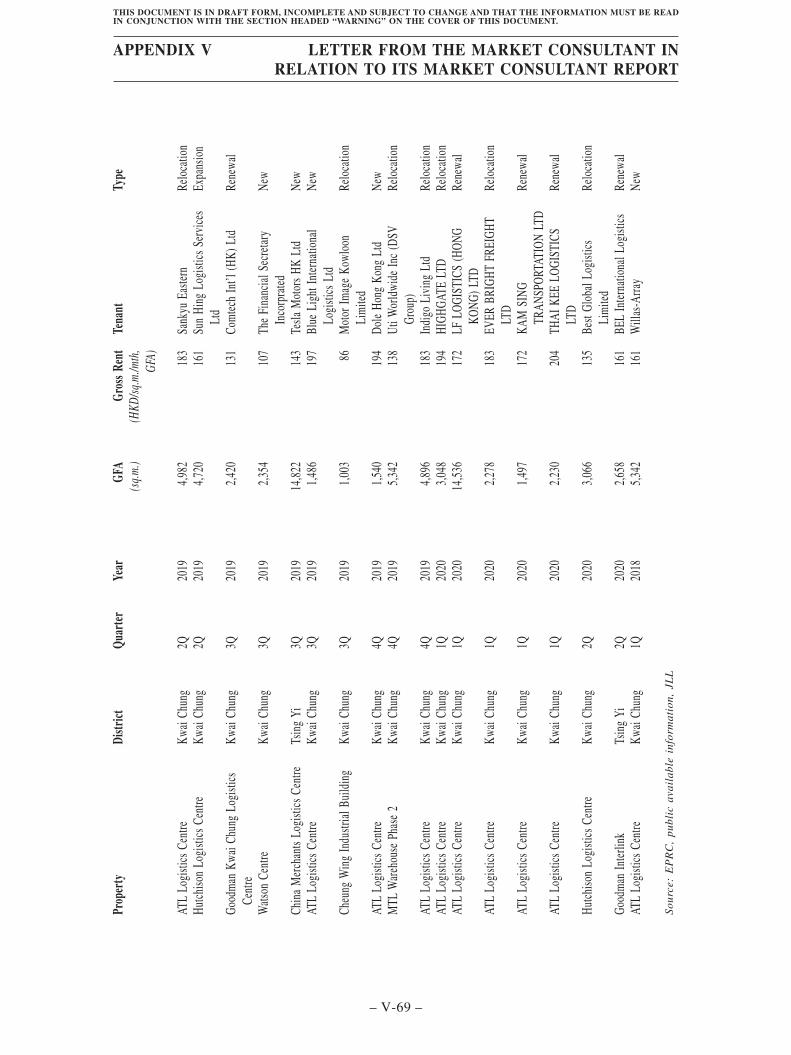
Prop
erty
Distr
ictQ
uart
erYe
arG
FAG
ross
Rent
Tena
ntTy
pe(s
q.m.
)(H
KD/sq
.m./m
th,
GFA)
ATL
Logi
stics
Cent
reKw
aiCh
ung
2Q20
194,
982
183
Sank
yuEa
stern
Relo
catio
nHu
tchi
son
Logi
stics
Cent
reKw
aiCh
ung
2Q20
194,
720
161
Sun
Hing
Logi
stics
Serv
ices
Ltd
Expa
nsio
n
Good
man
Kwai
Chun
gLo
gisti
csCe
ntre
Kwai
Chun
g3Q
2019
2,42
013
1Co
mte
chIn
t’l(H
K)Lt
dRe
newa
l
Wat
son
Cent
reKw
aiCh
ung
3Q20
192,
354
107
The
Fina
ncia
lSec
reta
ryIn
corp
rate
dNe
w
Chin
aM
erch
ants
Logi
stics
Cent
reTs
ing
Yi3Q
2019
14,8
2214
3Te
slaM
otor
sHK
Ltd
New
ATL
Logi
stics
Cent
reKw
aiCh
ung
3Q20
191,
486
197
Blue
Ligh
tInt
erna
tiona
lLo
gisti
csLt
dNe
w
Cheu
ngW
ing
Indu
stria
lBui
ldin
gKw
aiCh
ung
3Q20
191,
003
86M
otor
Imag
eKo
wloo
nLi
mite
dRe
loca
tion
ATL
Logi
stics
Cent
reKw
aiCh
ung
4Q20
191,
540
194
Dole
Hong
Kong
Ltd
New
MTL
War
ehou
sePh
ase
2Kw
aiCh
ung
4Q20
195,
342
138
UtiW
orld
wide
Inc
(DSV
Grou
p)Re
loca
tion
ATL
Logi
stics
Cent
reKw
aiCh
ung
4Q20
194,
896
183
Indi
goLi
ving
Ltd
Relo
catio
nAT
LLo
gisti
csCe
ntre
Kwai
Chun
g1Q
2020
3,04
819
4HI
GHGA
TELT
DRe
loca
tion
ATL
Logi
stics
Cent
reKw
aiCh
ung
1Q20
2014
,536
172
LFLO
GIST
ICS
(HON
GKO
NG)L
TDRe
newa
l
ATL
Logi
stics
Cent
reKw
aiCh
ung
1Q20
202,
278
183
EVER
BRIG
HTFR
EIGH
TLT
DRe
loca
tion
ATL
Logi
stics
Cent
reKw
aiCh
ung
1Q20
201,
497
172
KAM
SING
TRAN
SPOR
TATI
ONLT
DRe
newa
l
ATL
Logi
stics
Cent
reKw
aiCh
ung
1Q20
202,
230
204
THAI
KEE
LOGI
STIC
SLT
DRe
newa
l
Hutc
hiso
nLo
gisti
csCe
ntre
Kwai
Chun
g2Q
2020
3,06
613
5Be
stGl
obal
Logi
stics
Lim
ited
Relo
catio
n
Good
man
Inte
rlink
Tsin
gYi
2Q20
202,
658
161
BEL
Inte
rnat
iona
lLog
istic
sRe
newa
lAT
LLo
gisti
csCe
ntre
Kwai
Chun
g1Q
2018
5,34
216
1W
illas
-Arra
yNe
w
Sour
ce:
EP
RC
,pu
blic
avai
labl
ein
form
atio
n,JL
L
APPENDIX V LETTER FROM THE MARKET CONSULTANT INRELATION TO ITS MARKET CONSULTANT REPORT
– V-69 –
THIS DOCUMENT IS IN DRAFT FORM, INCOMPLETE AND SUBJECT TO CHANGE AND THAT THE INFORMATION MUST BE READIN CONJUNCTION WITH THE SECTION HEADED “WARNING” ON THE COVER OF THIS DOCUMENT.
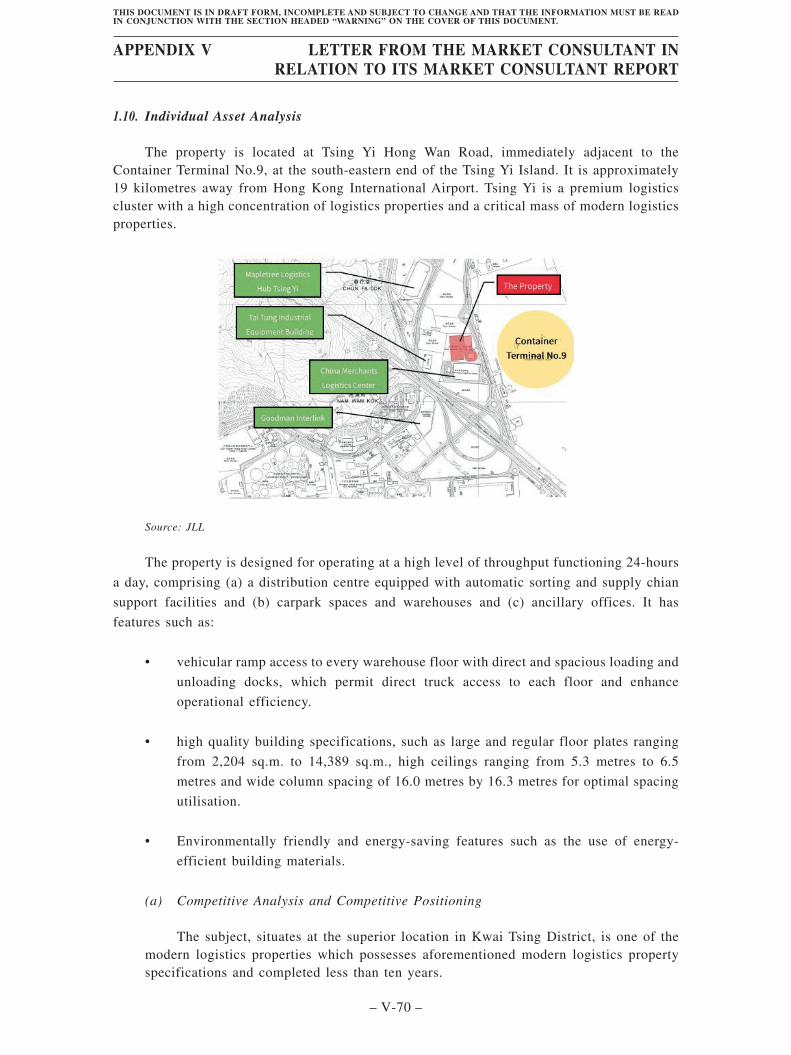
1.10. Individual Asset Analysis
The property is located at Tsing Yi Hong Wan Road, immediately adjacent to theContainer Terminal No.9, at the south-eastern end of the Tsing Yi Island. It is approximately19 kilometres away from Hong Kong International Airport. Tsing Yi is a premium logisticscluster with a high concentration of logistics properties and a critical mass of modern logisticsproperties.
Source: JLL
The property is designed for operating at a high level of throughput functioning 24-hours
a day, comprising (a) a distribution centre equipped with automatic sorting and supply chian
support facilities and (b) carpark spaces and warehouses and (c) ancillary offices. It has
features such as:
• vehicular ramp access to every warehouse floor with direct and spacious loading and
unloading docks, which permit direct truck access to each floor and enhance
operational efficiency.
• high quality building specifications, such as large and regular floor plates ranging
from 2,204 sq.m. to 14,389 sq.m., high ceilings ranging from 5.3 metres to 6.5
metres and wide column spacing of 16.0 metres by 16.3 metres for optimal spacing
utilisation.
• Environmentally friendly and energy-saving features such as the use of energy-
efficient building materials.
(a) Competitive Analysis and Competitive Positioning
The subject, situates at the superior location in Kwai Tsing District, is one of themodern logistics properties which possesses aforementioned modern logistics propertyspecifications and completed less than ten years.
APPENDIX V LETTER FROM THE MARKET CONSULTANT INRELATION TO ITS MARKET CONSULTANT REPORT
– V-70 –
THIS DOCUMENT IS IN DRAFT FORM, INCOMPLETE AND SUBJECT TO CHANGE AND THAT THE INFORMATION MUST BE READIN CONJUNCTION WITH THE SECTION HEADED “WARNING” ON THE COVER OF THIS DOCUMENT.

Kwai Tsing District, which consists of Tsing Yi and Kwai Chung, is situated at thesouthern part of the New Territories. Kwai Tsing is one of the most important economicarteries of Hong Kong. It contains the Kwai Tsing Container Terminals, one of the busiestcontainer terminals in the world.
At the end of 2020, Kwai Tsing District has the largest modern logistics propertystock in Hong Kong, totalling 2.4 million sq.m., or 46.9% of the total stock, creating arelatively competitive environment for the subject. For example, Goodman Interlink,Mapletree Logistics Hub and China Merchants Logistics Centre are considered modernlogistics property and the major competitors within the area. Except Goodman Interlink,the occupancy rates of the others achieved 100% as of 3Q2020.
The competition is likely to remain stable as there is no new supply in this regionin coming years. The nearest completions will not be arrived until 2022-2023, such asGoodman’s modern logistics (est. completion year 2022) in Area 49 in Tuen Mun and thepremium logistics centre in Kwo Lo Wan in the South Cargo Precinct of the HKIA (est.completion year 2023).
(b) Performance Analysis
The subject is a ramp-up 16-storey building, providing warehouse, loading docks,
ancilliary offices, stores, car parking space and etc.
Floor UsesFloor to
floor heightFloor
loading(metre) (tons/sq.m.)
B/F Car parking spaces 6.0 4.1G/F Ramp access warehouse, vehicle
queuing spaces
6.3-8.7 1.9
1/F-2/F Ramp access warehouse, loading
and unloading spaces, car
parking spaces
7.3 1.6
3/F-5/F Ramp access warehouse
(including cold storage portion
in 4/F), loading and unloading
spaces, car parking spaces
5.1-7.7 1.5
6/F-8/F Ramp access warehouse, stores,
loading and unloading spaces,
car parking spaces
6.3-7.7 1.5
9/F Ancillary office, stores, computer
room, changing room
4.4 5.1
10/F-14/F Ancillary office 4.1 5.1
Source: S.F. Express, JLL
APPENDIX V LETTER FROM THE MARKET CONSULTANT INRELATION TO ITS MARKET CONSULTANT REPORT
– V-71 –
THIS DOCUMENT IS IN DRAFT FORM, INCOMPLETE AND SUBJECT TO CHANGE AND THAT THE INFORMATION MUST BE READIN CONJUNCTION WITH THE SECTION HEADED “WARNING” ON THE COVER OF THIS DOCUMENT.
The tenant mix of the subject is quite simple, dominating by storage, 3PLs and
logistics companies. The first and second largest tenant together occupy approximately
86% total warehouse space.
The face unit rent of the logistics property part varied, and subjected to the leased
area, floor, contract period and etc., ranging from HKD89~192/sq.m./mth, excluding
management fee, as of September 2020.
(c) SWOT Analysis
The SWOT analysis can be summarised in below table.
Strengths Weaknesses
• The subject is relatively new (<10 years old)with modern logistics standards. It is also oneof the newest logistics facilities within the area
• One of the very few prime projects that provideramp assess warehouse, cold storage andancillary office
• Strong project management experience by S.F.Express
• Proximity to the expressway (200 metres), theContainer Terminal 9 (8 minutes driving time)and the HKIA (23 minutes driving time)
• N/A
Opportunities Threats
• No new modern supply in foreseeable years
• It is expected that the 3rd runway of the HKIAwill be completed in 2020, benefiting thesurrounding districts as well as the subject
• To seize the growing demand of e-commerce
• There is plenty ofleasable space incomparable that maycompete with thesubject in terms ofleasing strategy
Source: JLL
APPENDIX V LETTER FROM THE MARKET CONSULTANT INRELATION TO ITS MARKET CONSULTANT REPORT
– V-72 –
THIS DOCUMENT IS IN DRAFT FORM, INCOMPLETE AND SUBJECT TO CHANGE AND THAT THE INFORMATION MUST BE READIN CONJUNCTION WITH THE SECTION HEADED “WARNING” ON THE COVER OF THIS DOCUMENT.

(d) Performance Outlook
The strategic position of Tsing Yi, such as close to the container terminal and theHKIA, will continue lend a hand to the logistics demand in the area. And it is anticipatedthat such position will be further promoted along with improving infrastructure, such asthe 3rd runway of the HKIA, benefiting Tsing Yi as well as the subject.
It is expected the subject will be fully occupied in the mid-term, thanks to theprofound project management experience, leasing strategy and strong self-used demandof the S.F. Express. Considered the achievable rents of the subject and the marketperformance of other comparable, we estimate that the subject could achieve unit rentranging from HKD140~219/sq.m./mth, excluding management fee, in coming 3 years.
(e) Overview of Comparable Projects
Below table set out the overview of the comparable projects in surrounding area.
NameGoodmanInterlink
MapletreeLogistics HubTsing Yi
China MerchantsLogistics Centre
Completion Year 2012 2016 2017Owner Goodman
Interlink LimitedMapletreeLogistics Trust
China MerchantsGroup
Total Lettable Area(approx. sq.m., ramp access)
224,800 148,100 138,400
Total Leasable Area(approx. sq.m., cold storage)
N/A N/A 14,900
Approx. Efficiency 50%-55% 55% Approx. 58%Storey 25/s cargo centre 10/s cargo centre 10/s cargo centre
with ancillaryoffice
Current Occupancy Rate (approx.) 91% 100% 100%Rent/Achievable Rent
(approx. HKD/sq.m./mth, rampaccess, as at 3Q2020)
183/178 172/151-161 172/151-161
Rent/Achievable Rent(approx. HKD/sq.m./mth, coldstorage, as at 3Q2020)
N/A N/A 185/172
Key Tenants DHL, SagawaExpress, BELInternationalLogistics
Red Mart, HongKong TVLogistics, AdidasHong Kong
Brilliant, TeslaMotors
Source: JLL
APPENDIX V LETTER FROM THE MARKET CONSULTANT INRELATION TO ITS MARKET CONSULTANT REPORT
– V-73 –
THIS DOCUMENT IS IN DRAFT FORM, INCOMPLETE AND SUBJECT TO CHANGE AND THAT THE INFORMATION MUST BE READIN CONJUNCTION WITH THE SECTION HEADED “WARNING” ON THE COVER OF THIS DOCUMENT.
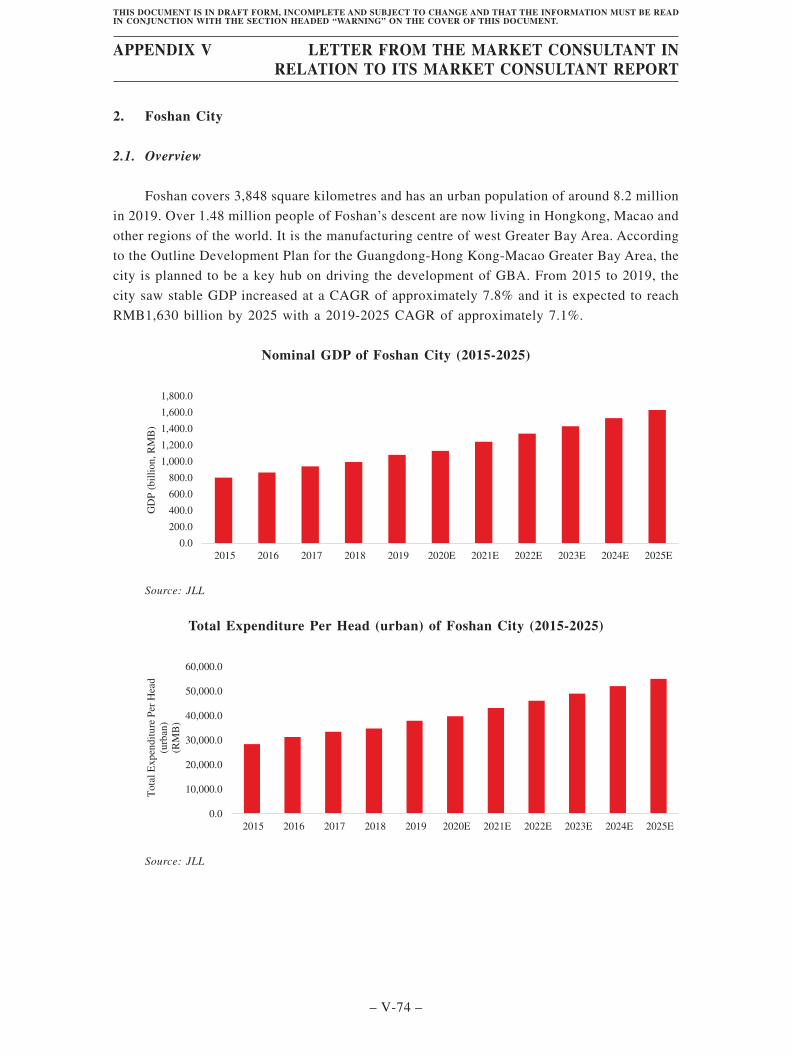
2. Foshan City
2.1. Overview
Foshan covers 3,848 square kilometres and has an urban population of around 8.2 million
in 2019. Over 1.48 million people of Foshan’s descent are now living in Hongkong, Macao and
other regions of the world. It is the manufacturing centre of west Greater Bay Area. According
to the Outline Development Plan for the Guangdong-Hong Kong-Macao Greater Bay Area, the
city is planned to be a key hub on driving the development of GBA. From 2015 to 2019, the
city saw stable GDP increased at a CAGR of approximately 7.8% and it is expected to reach
RMB1,630 billion by 2025 with a 2019-2025 CAGR of approximately 7.1%.
Nominal GDP of Foshan City (2015-2025)
0.0
200.0
400.0
600.0
800.0
1,000.0
1,200.0
1,400.0
1,600.0
1,800.0
2015 2016 2017 2018 2019 2020E 2021E 2022E 2023E 2024E 2025E
GD
P (
bil
lion
, R
MB
)
Source: JLL
Total Expenditure Per Head (urban) of Foshan City (2015-2025)
0.0
10,000.0
20,000.0
30,000.0
40,000.0
50,000.0
60,000.0
2015 2016 2017 2018 2019 2020E 2021E 2022E 2023E 2024E 2025E
daeH
reP
eruti
dne
px
Elat
oT
(urb
an)
(RM
B)
Source: JLL
APPENDIX V LETTER FROM THE MARKET CONSULTANT INRELATION TO ITS MARKET CONSULTANT REPORT
– V-74 –
THIS DOCUMENT IS IN DRAFT FORM, INCOMPLETE AND SUBJECT TO CHANGE AND THAT THE INFORMATION MUST BE READIN CONJUNCTION WITH THE SECTION HEADED “WARNING” ON THE COVER OF THIS DOCUMENT.
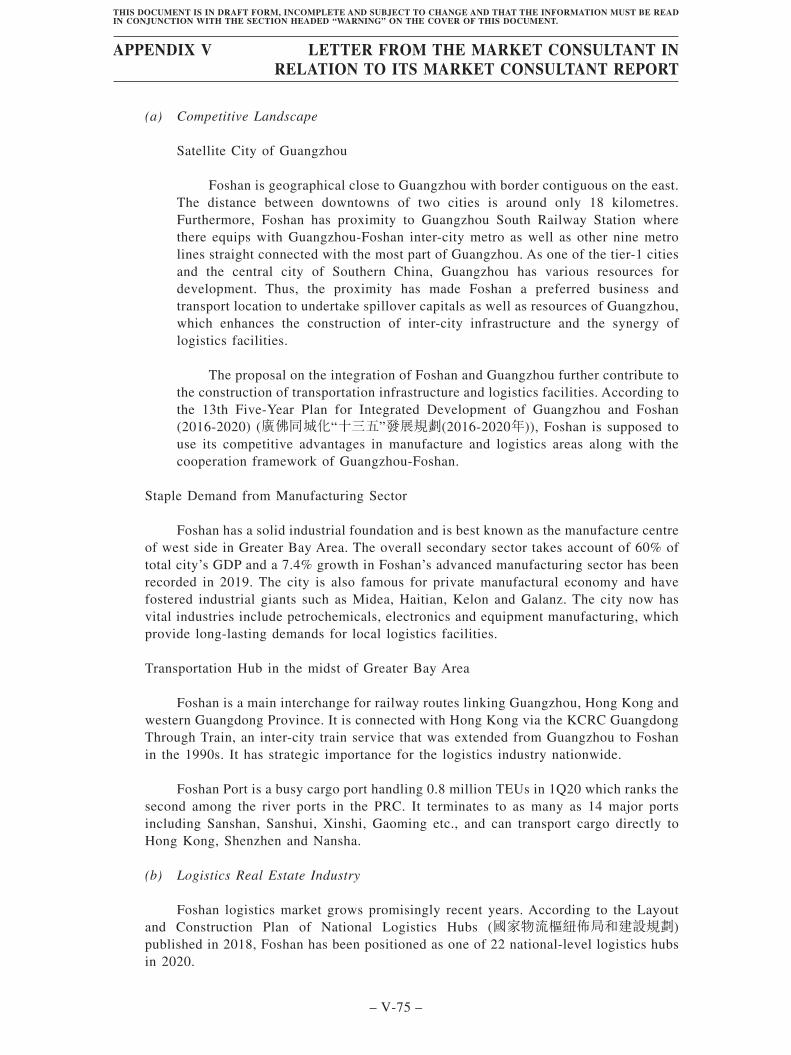
(a) Competitive Landscape
Satellite City of Guangzhou
Foshan is geographical close to Guangzhou with border contiguous on the east.The distance between downtowns of two cities is around only 18 kilometres.Furthermore, Foshan has proximity to Guangzhou South Railway Station wherethere equips with Guangzhou-Foshan inter-city metro as well as other nine metrolines straight connected with the most part of Guangzhou. As one of the tier-1 citiesand the central city of Southern China, Guangzhou has various resources fordevelopment. Thus, the proximity has made Foshan a preferred business andtransport location to undertake spillover capitals as well as resources of Guangzhou,which enhances the construction of inter-city infrastructure and the synergy oflogistics facilities.
The proposal on the integration of Foshan and Guangzhou further contribute tothe construction of transportation infrastructure and logistics facilities. According tothe 13th Five-Year Plan for Integrated Development of Guangzhou and Foshan(2016-2020) (廣佛同城化“十三五”發展規劃(2016-2020年)), Foshan is supposed touse its competitive advantages in manufacture and logistics areas along with thecooperation framework of Guangzhou-Foshan.
Staple Demand from Manufacturing Sector
Foshan has a solid industrial foundation and is best known as the manufacture centreof west side in Greater Bay Area. The overall secondary sector takes account of 60% oftotal city’s GDP and a 7.4% growth in Foshan’s advanced manufacturing sector has beenrecorded in 2019. The city is also famous for private manufactural economy and havefostered industrial giants such as Midea, Haitian, Kelon and Galanz. The city now hasvital industries include petrochemicals, electronics and equipment manufacturing, whichprovide long-lasting demands for local logistics facilities.
Transportation Hub in the midst of Greater Bay Area
Foshan is a main interchange for railway routes linking Guangzhou, Hong Kong andwestern Guangdong Province. It is connected with Hong Kong via the KCRC GuangdongThrough Train, an inter-city train service that was extended from Guangzhou to Foshanin the 1990s. It has strategic importance for the logistics industry nationwide.
Foshan Port is a busy cargo port handling 0.8 million TEUs in 1Q20 which ranks thesecond among the river ports in the PRC. It terminates to as many as 14 major portsincluding Sanshan, Sanshui, Xinshi, Gaoming etc., and can transport cargo directly toHong Kong, Shenzhen and Nansha.
(b) Logistics Real Estate Industry
Foshan logistics market grows promisingly recent years. According to the Layoutand Construction Plan of National Logistics Hubs (國家物流樞紐佈局和建設規劃)published in 2018, Foshan has been positioned as one of 22 national-level logistics hubsin 2020.
APPENDIX V LETTER FROM THE MARKET CONSULTANT INRELATION TO ITS MARKET CONSULTANT REPORT
– V-75 –
THIS DOCUMENT IS IN DRAFT FORM, INCOMPLETE AND SUBJECT TO CHANGE AND THAT THE INFORMATION MUST BE READIN CONJUNCTION WITH THE SECTION HEADED “WARNING” ON THE COVER OF THIS DOCUMENT.
(c) Government Policies
Relevant policies for logistics industry in Foshan are as below:
Policies Issued Body Issued Date Key Points
About ContinuingUrban Land UseTax Deduction ofCommodityStorage FacilitiesLand for LogisticsCompanies (《關於繼續實施物流企業大宗商品倉儲設施用地城鎮土地使用稅優惠政策的公告》)
Ministry ofFinance/StateTaxationAdministration
2020.03.31 To continueimplementing thepolicy that ofwaiving anddeducting UrbanLand Use Tax ofCommodityStorage FacilitiesLand for LogisticsCompanies
Outline DevelopmentPlan for theGuangdong-HongKong-MacaoGreater BayArea(《粵港澳大灣區發展規劃綱要》)
The State Council ofthe People’sRepublic of China
2019.02.18 To leverage theleading roles of thestrongcombinations ofHong Kong-Shenzhen,Guangzhou-Foshanand Macao-Zhuhai,expedite theintegrateddevelopment ofGuangzhou andFoshan, enhancetheir overallstrength and globalinfluence, and leadthe Greater BayArea inparticipating ininternationalcooperation ingreat intensity
APPENDIX V LETTER FROM THE MARKET CONSULTANT INRELATION TO ITS MARKET CONSULTANT REPORT
– V-76 –
THIS DOCUMENT IS IN DRAFT FORM, INCOMPLETE AND SUBJECT TO CHANGE AND THAT THE INFORMATION MUST BE READIN CONJUNCTION WITH THE SECTION HEADED “WARNING” ON THE COVER OF THIS DOCUMENT.
Policies Issued Body Issued Date Key Points
The 13th Five-YearPlan for Integrateddevelopment ofGuangzhou andFoshan(2016-2020) (《廣佛同城化“十三五”發展規劃(2016-2020年)》)
Guangzhou People’sGovernment/FoshanPeople’sGovernment
2017.10.18 To strengthencompetitiveadvantagesbetweenGuangzhou andFoshan as well aslink both cities forintensivecommunication
The 13th Five-YearPlan for Economicand SocialDevelopment ofFoshan (《佛山市國民經濟和社會發展第十三個五年規劃綱要》)
Foshan People’sGovernment
2016.05.18 Promote modernlogistics industry,with movements toconstruct logisticsparks and centres,and attractrenowned logisticsenterprises andrelated serviceinstitutions aroundmainland andoverseas
The 13th Five-YearPlan forTransportationDevelopment ofFoshan (《佛山市“十三五”交通發展規劃》)
Foshan City TrafficBureau
2016.05.18 Facilitate logisticsindustrydevelopmentpolicy; leveragethe logisticsinfrastructure;construct logisticsinformationsystem; promoteefficient cargoorganisationsystem; establishconvenient citydistribution system
Source: JLL
Foshan’s logistics property market was speculated with less impacts from
COVID-19 and the internal imbalance of supply and demand continue to be the main
reason for the changes of market performance. For example, operators were observed
stabilising rental level and some of them even remained the growth rate as previous.
APPENDIX V LETTER FROM THE MARKET CONSULTANT INRELATION TO ITS MARKET CONSULTANT REPORT
– V-77 –
THIS DOCUMENT IS IN DRAFT FORM, INCOMPLETE AND SUBJECT TO CHANGE AND THAT THE INFORMATION MUST BE READIN CONJUNCTION WITH THE SECTION HEADED “WARNING” ON THE COVER OF THIS DOCUMENT.
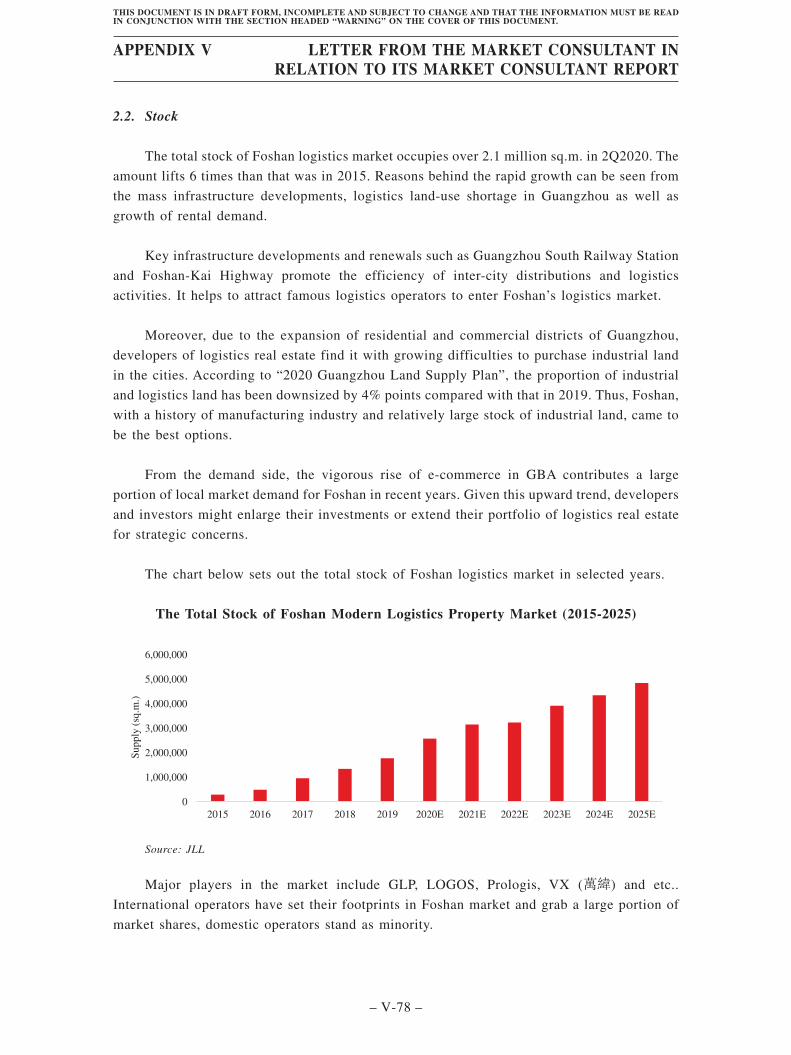
2.2. Stock
The total stock of Foshan logistics market occupies over 2.1 million sq.m. in 2Q2020. The
amount lifts 6 times than that was in 2015. Reasons behind the rapid growth can be seen from
the mass infrastructure developments, logistics land-use shortage in Guangzhou as well as
growth of rental demand.
Key infrastructure developments and renewals such as Guangzhou South Railway Station
and Foshan-Kai Highway promote the efficiency of inter-city distributions and logistics
activities. It helps to attract famous logistics operators to enter Foshan’s logistics market.
Moreover, due to the expansion of residential and commercial districts of Guangzhou,
developers of logistics real estate find it with growing difficulties to purchase industrial land
in the cities. According to “2020 Guangzhou Land Supply Plan”, the proportion of industrial
and logistics land has been downsized by 4% points compared with that in 2019. Thus, Foshan,
with a history of manufacturing industry and relatively large stock of industrial land, came to
be the best options.
From the demand side, the vigorous rise of e-commerce in GBA contributes a large
portion of local market demand for Foshan in recent years. Given this upward trend, developers
and investors might enlarge their investments or extend their portfolio of logistics real estate
for strategic concerns.
The chart below sets out the total stock of Foshan logistics market in selected years.
The Total Stock of Foshan Modern Logistics Property Market (2015-2025)
0
1,000,000
2,000,000
3,000,000
4,000,000
5,000,000
6,000,000
2015 2016 2017 2018 2019 2020E 2021E 2022E 2023E 2024E 2025E
Su
pp
ly (
sq.m
.)
Source: JLL
Major players in the market include GLP, LOGOS, Prologis, VX (萬緯) and etc..
International operators have set their footprints in Foshan market and grab a large portion of
market shares, domestic operators stand as minority.
APPENDIX V LETTER FROM THE MARKET CONSULTANT INRELATION TO ITS MARKET CONSULTANT REPORT
– V-78 –
THIS DOCUMENT IS IN DRAFT FORM, INCOMPLETE AND SUBJECT TO CHANGE AND THAT THE INFORMATION MUST BE READIN CONJUNCTION WITH THE SECTION HEADED “WARNING” ON THE COVER OF THIS DOCUMENT.
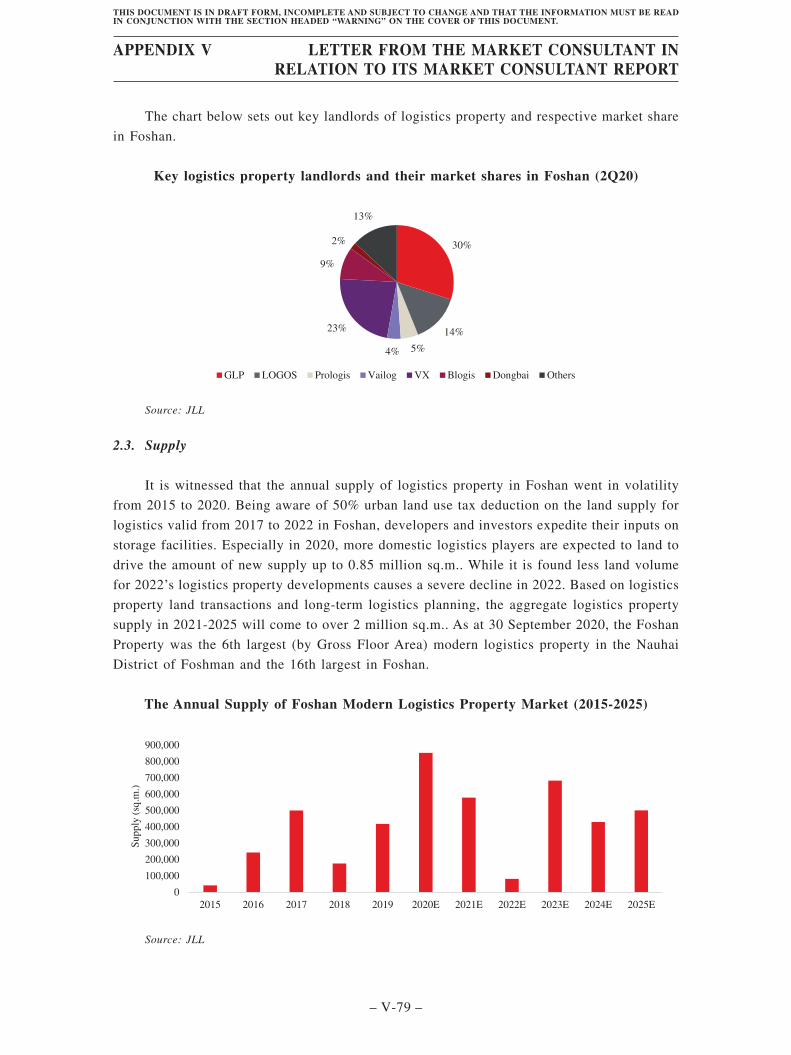
The chart below sets out key landlords of logistics property and respective market share
in Foshan.
Key logistics property landlords and their market shares in Foshan (2Q20)
GLP LOGOS Prologis Vailog VX Blogis Dongbai Others
30%
14%
5%4%
23%
9%
2%
13%
Source: JLL
2.3. Supply
It is witnessed that the annual supply of logistics property in Foshan went in volatility
from 2015 to 2020. Being aware of 50% urban land use tax deduction on the land supply for
logistics valid from 2017 to 2022 in Foshan, developers and investors expedite their inputs on
storage facilities. Especially in 2020, more domestic logistics players are expected to land to
drive the amount of new supply up to 0.85 million sq.m.. While it is found less land volume
for 2022’s logistics property developments causes a severe decline in 2022. Based on logistics
property land transactions and long-term logistics planning, the aggregate logistics property
supply in 2021-2025 will come to over 2 million sq.m.. As at 30 September 2020, the Foshan
Property was the 6th largest (by Gross Floor Area) modern logistics property in the Nauhai
District of Foshman and the 16th largest in Foshan.
The Annual Supply of Foshan Modern Logistics Property Market (2015-2025)
0
100,000
200,000
300,000
400,000
500,000
600,000
700,000
800,000
900,000
2015 2016 2017 2018 2019 2020E 2021E 2022E 2023E 2024E 2025E
Su
pp
ly (
sq.m
.)
Source: JLL
APPENDIX V LETTER FROM THE MARKET CONSULTANT INRELATION TO ITS MARKET CONSULTANT REPORT
– V-79 –
THIS DOCUMENT IS IN DRAFT FORM, INCOMPLETE AND SUBJECT TO CHANGE AND THAT THE INFORMATION MUST BE READIN CONJUNCTION WITH THE SECTION HEADED “WARNING” ON THE COVER OF THIS DOCUMENT.
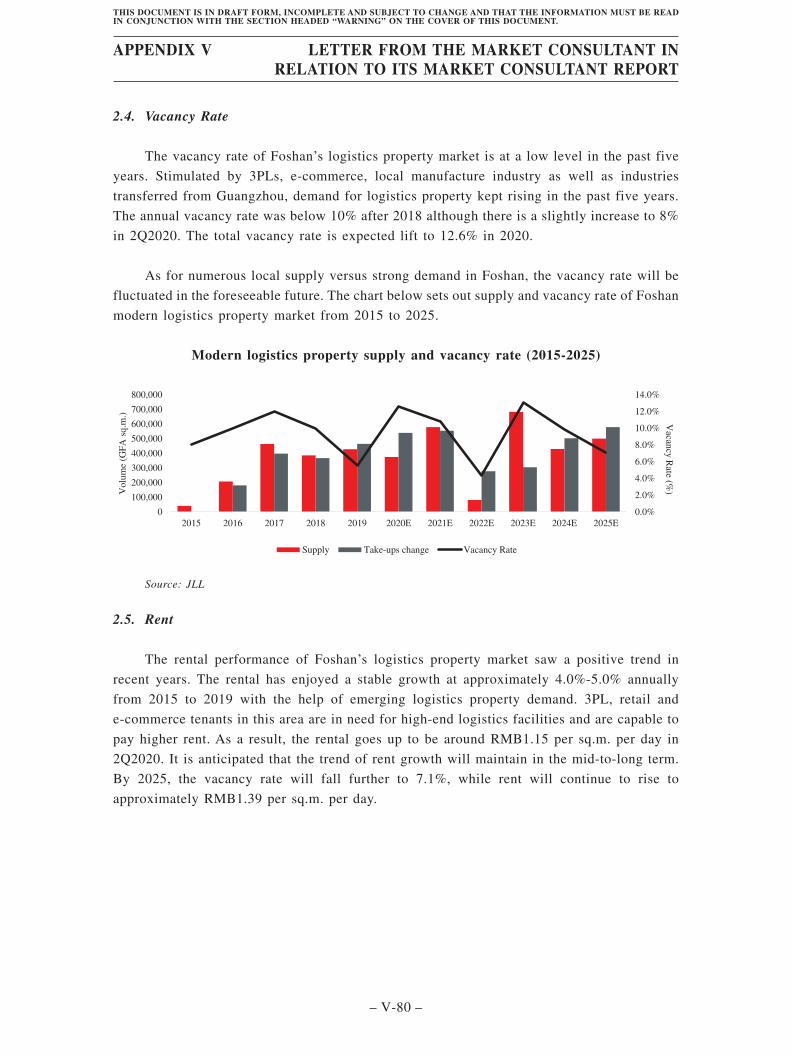
2.4. Vacancy Rate
The vacancy rate of Foshan’s logistics property market is at a low level in the past five
years. Stimulated by 3PLs, e-commerce, local manufacture industry as well as industries
transferred from Guangzhou, demand for logistics property kept rising in the past five years.
The annual vacancy rate was below 10% after 2018 although there is a slightly increase to 8%
in 2Q2020. The total vacancy rate is expected lift to 12.6% in 2020.
As for numerous local supply versus strong demand in Foshan, the vacancy rate will be
fluctuated in the foreseeable future. The chart below sets out supply and vacancy rate of Foshan
modern logistics property market from 2015 to 2025.
Modern logistics property supply and vacancy rate (2015-2025)
0.0%
2.0%
4.0%
6.0%
8.0%
10.0%
12.0%
14.0%
0
100,000
200,000
300,000
400,000
500,000
600,000
700,000
800,000
2015 2016 2017 2018 2019 2020E 2021E 2022E 2023E 2024E 2025E
Vacan
cy R
ate (%)V
olu
me
(GF
A s
q.m
.)
Supply Take-ups change Vacancy Rate
Source: JLL
2.5. Rent
The rental performance of Foshan’s logistics property market saw a positive trend in
recent years. The rental has enjoyed a stable growth at approximately 4.0%-5.0% annually
from 2015 to 2019 with the help of emerging logistics property demand. 3PL, retail and
e-commerce tenants in this area are in need for high-end logistics facilities and are capable to
pay higher rent. As a result, the rental goes up to be around RMB1.15 per sq.m. per day in
2Q2020. It is anticipated that the trend of rent growth will maintain in the mid-to-long term.
By 2025, the vacancy rate will fall further to 7.1%, while rent will continue to rise to
approximately RMB1.39 per sq.m. per day.
APPENDIX V LETTER FROM THE MARKET CONSULTANT INRELATION TO ITS MARKET CONSULTANT REPORT
– V-80 –
THIS DOCUMENT IS IN DRAFT FORM, INCOMPLETE AND SUBJECT TO CHANGE AND THAT THE INFORMATION MUST BE READIN CONJUNCTION WITH THE SECTION HEADED “WARNING” ON THE COVER OF THIS DOCUMENT.
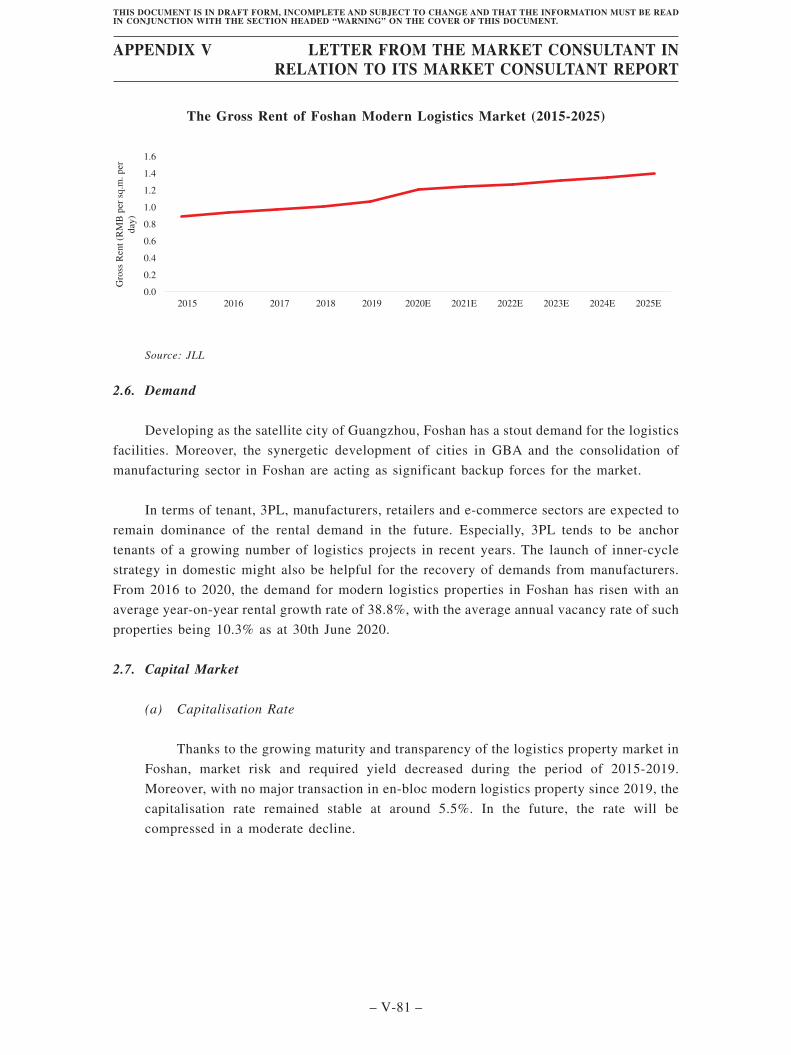
The Gross Rent of Foshan Modern Logistics Market (2015-2025)
0.0
0.2
0.4
0.6
0.8
1.0
1.2
1.6
1.4
2015 2016 2017 2018 2019 2020E 2021E 2022E 2023E 2024E 2025E
Gro
ss R
ent
(RM
B p
er s
q.m
. p
er
day
)
Source: JLL
2.6. Demand
Developing as the satellite city of Guangzhou, Foshan has a stout demand for the logistics
facilities. Moreover, the synergetic development of cities in GBA and the consolidation of
manufacturing sector in Foshan are acting as significant backup forces for the market.
In terms of tenant, 3PL, manufacturers, retailers and e-commerce sectors are expected to
remain dominance of the rental demand in the future. Especially, 3PL tends to be anchor
tenants of a growing number of logistics projects in recent years. The launch of inner-cycle
strategy in domestic might also be helpful for the recovery of demands from manufacturers.
From 2016 to 2020, the demand for modern logistics properties in Foshan has risen with an
average year-on-year rental growth rate of 38.8%, with the average annual vacancy rate of such
properties being 10.3% as at 30th June 2020.
2.7. Capital Market
(a) Capitalisation Rate
Thanks to the growing maturity and transparency of the logistics property market in
Foshan, market risk and required yield decreased during the period of 2015-2019.
Moreover, with no major transaction in en-bloc modern logistics property since 2019, the
capitalisation rate remained stable at around 5.5%. In the future, the rate will be
compressed in a moderate decline.
APPENDIX V LETTER FROM THE MARKET CONSULTANT INRELATION TO ITS MARKET CONSULTANT REPORT
– V-81 –
THIS DOCUMENT IS IN DRAFT FORM, INCOMPLETE AND SUBJECT TO CHANGE AND THAT THE INFORMATION MUST BE READIN CONJUNCTION WITH THE SECTION HEADED “WARNING” ON THE COVER OF THIS DOCUMENT.
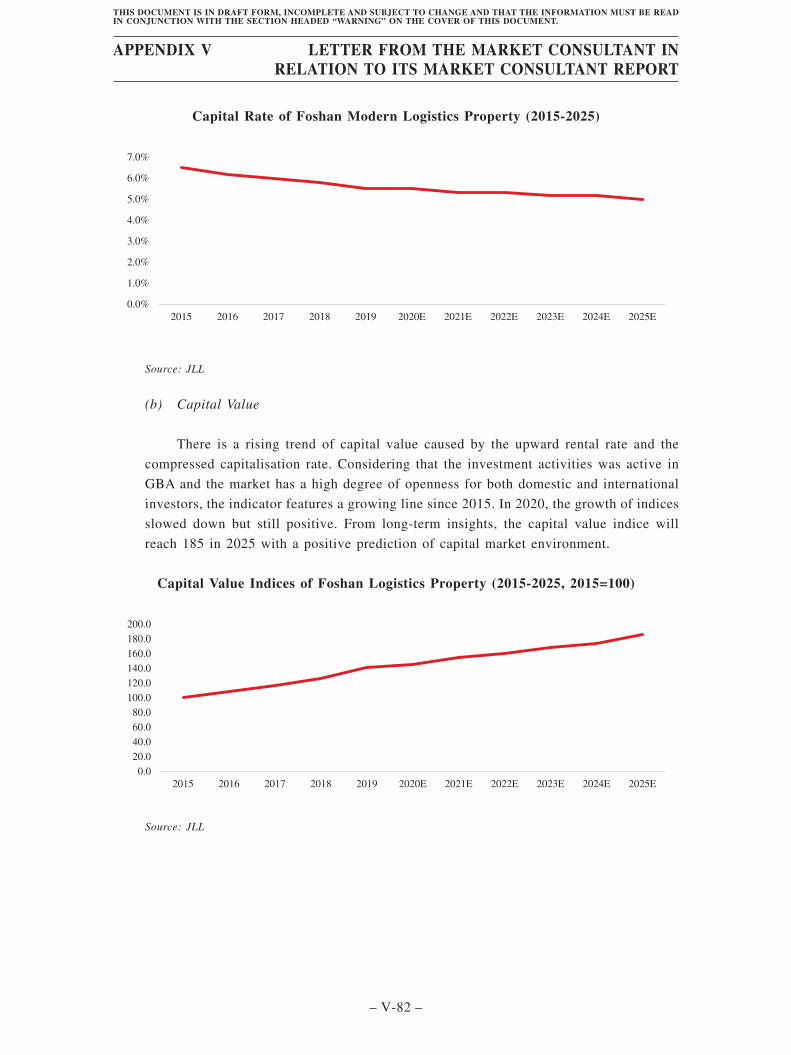
Capital Rate of Foshan Modern Logistics Property (2015-2025)
0.0%
1.0%
2.0%
3.0%
4.0%
5.0%
6.0%
7.0%
2015 2016 2017 2018 2019 2020E 2021E 2022E 2023E 2024E 2025E
Source: JLL
(b) Capital Value
There is a rising trend of capital value caused by the upward rental rate and the
compressed capitalisation rate. Considering that the investment activities was active in
GBA and the market has a high degree of openness for both domestic and international
investors, the indicator features a growing line since 2015. In 2020, the growth of indices
slowed down but still positive. From long-term insights, the capital value indice will
reach 185 in 2025 with a positive prediction of capital market environment.
Capital Value Indices of Foshan Logistics Property (2015-2025, 2015=100)
0.0
20.0
40.0
60.0
80.0
100.0
120.0
140.0
160.0
180.0
200.0
2015 2016 2017 2018 2019 2020E 2021E 2022E 2023E 2024E 2025E
Source: JLL
APPENDIX V LETTER FROM THE MARKET CONSULTANT INRELATION TO ITS MARKET CONSULTANT REPORT
– V-82 –
THIS DOCUMENT IS IN DRAFT FORM, INCOMPLETE AND SUBJECT TO CHANGE AND THAT THE INFORMATION MUST BE READIN CONJUNCTION WITH THE SECTION HEADED “WARNING” ON THE COVER OF THIS DOCUMENT.
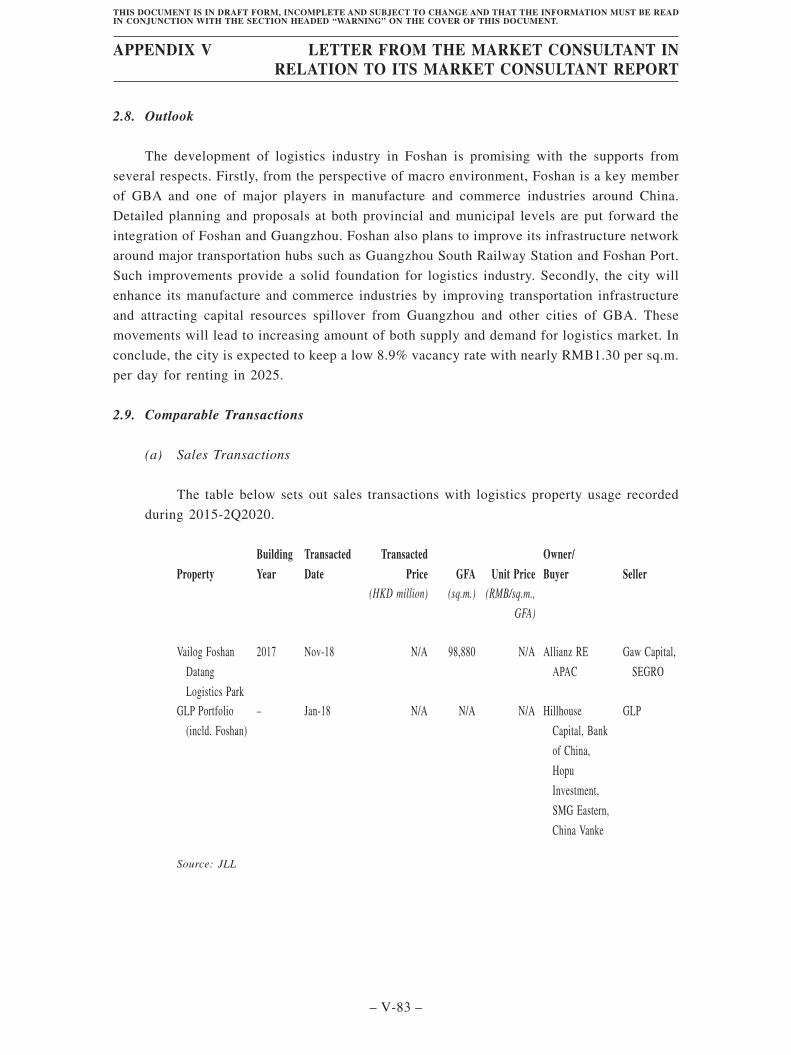
2.8. Outlook
The development of logistics industry in Foshan is promising with the supports from
several respects. Firstly, from the perspective of macro environment, Foshan is a key member
of GBA and one of major players in manufacture and commerce industries around China.
Detailed planning and proposals at both provincial and municipal levels are put forward the
integration of Foshan and Guangzhou. Foshan also plans to improve its infrastructure network
around major transportation hubs such as Guangzhou South Railway Station and Foshan Port.
Such improvements provide a solid foundation for logistics industry. Secondly, the city will
enhance its manufacture and commerce industries by improving transportation infrastructure
and attracting capital resources spillover from Guangzhou and other cities of GBA. These
movements will lead to increasing amount of both supply and demand for logistics market. In
conclude, the city is expected to keep a low 8.9% vacancy rate with nearly RMB1.30 per sq.m.
per day for renting in 2025.
2.9. Comparable Transactions
(a) Sales Transactions
The table below sets out sales transactions with logistics property usage recorded
during 2015-2Q2020.
PropertyBuildingYear
TransactedDate
TransactedPrice GFA Unit Price
Owner/Buyer Seller
(HKD million) (sq.m.) (RMB/sq.m.,
GFA)
Vailog Foshan
Datang
Logistics Park
2017 Nov-18 N/A 98,880 N/A Allianz RE
APAC
Gaw Capital,
SEGRO
GLP Portfolio
(incld. Foshan)
– Jan-18 N/A N/A N/A Hillhouse
Capital, Bank
of China,
Hopu
Investment,
SMG Eastern,
China Vanke
GLP
Source: JLL
APPENDIX V LETTER FROM THE MARKET CONSULTANT INRELATION TO ITS MARKET CONSULTANT REPORT
– V-83 –
THIS DOCUMENT IS IN DRAFT FORM, INCOMPLETE AND SUBJECT TO CHANGE AND THAT THE INFORMATION MUST BE READIN CONJUNCTION WITH THE SECTION HEADED “WARNING” ON THE COVER OF THIS DOCUMENT.
(b) Leasing Transactions
The table below sets out leasing transactions with logistics property usage recorded
during 2015-2Q2020.
Property District Quarter Year GFA Gross Rent Tenant Type(sq.m.) (RMB/sq.m./
mth, GFA)
GLP Sanshan
Logistics Park
Nanhai 2Q 2020 5,000 38 BMW Expansion
GLP Shunde
Logistics Park
Shunde 3Q 2018 3,000 36 Best Express Relocation
LOGOS Nanhai
Park
Nanhai 3Q 2017 80,000 33 JD New-letting
Source: JLL
2.10. Individual Asset Analysis
(a) Competitive Analysis and Competitive Positioning
The subject is located at Shishan town, Nanhai district, where it enjoys a
comfortable location for operation. It is about 15 kilometres away from Foshan Shadi
Airport and 17 kilometres away from Foshan West Railway Station.The straight line from
the subject to Guangzhou Railway Station is around 23 kilometres which is the largest
high-speed railway station in the Southern China, and to Guangzhou Baiyun Airport is
around 28 kilometres, which is one of the biggest aviation transportation hubs in the PRC,
costing 60 mins and 55 mins by road respectively.
Foshan has a high concentration of logistics property, creating a relatively fierce
competitive environment for the subject. In Nanhai, the district has already concentrated
major players such as GLP, LOGOS, VX and etc. because of its convenience and
economic prosperity. The subject is positioned as a distribution centre for SF and other
affiliated entities to avoid intense competition in the market. The subject is equipped with
intelligent technology such as Cross-Belt Sorters and Automated Guided Vehicle (AGV)
to improve the efficiency of logistics activities, making it a leader in adopting advanced
distribution system.
APPENDIX V LETTER FROM THE MARKET CONSULTANT INRELATION TO ITS MARKET CONSULTANT REPORT
– V-84 –
THIS DOCUMENT IS IN DRAFT FORM, INCOMPLETE AND SUBJECT TO CHANGE AND THAT THE INFORMATION MUST BE READIN CONJUNCTION WITH THE SECTION HEADED “WARNING” ON THE COVER OF THIS DOCUMENT.
(b) Performance Analysis
The subject is a modern logistics property designed with over 84,000 sq.m. for
leasehold use. It comprises: (a) a ramp-up three-storey distribution centre; and (b) an
ancillary building. It is equipped with intelligent technology and built-to-suit facilities,
such as automatic sorting and supply chain support facilities, to house the needs of its
single logistics tenant. Before its completion, the subject was already wholly reserved by
SF Express Foshan Branch to use as a distribution centre, with a lease term of five-year
term end at 3Q2025. The contracted rent is around RMB0.94 per sq.m. per day with an
annual growth rate of 4%.
The SubjectTotal GFA Area (m2) 84,891No. of storey 3Year of completion 2020Occupancy rate (at 30th September
2020)Reserved by SF Express Foshan Branch
and will fully occupiedRent (RMB/sq.m./day, excl. tax and
management fee at 30thSeptember 2020)
RMB0.94/sq.m./day
(c) SWOT Analysis
Strengths Weaknesses
• Prime location
• Stable connection with the tenant
• Professional management by SF
Express
• Equipped with intelligent
technology
• Sole tenant might reduce SF’s
speaking power on negotiation
Opportunities Threats
• Integration of Guangzhou-Foshan
• Intense communication with other
Greater Bay Area cities
• High expectancy of warehouse
capital appreciation
• Fierce competition of local
logistics market
Source: JLL
APPENDIX V LETTER FROM THE MARKET CONSULTANT INRELATION TO ITS MARKET CONSULTANT REPORT
– V-85 –
THIS DOCUMENT IS IN DRAFT FORM, INCOMPLETE AND SUBJECT TO CHANGE AND THAT THE INFORMATION MUST BE READIN CONJUNCTION WITH THE SECTION HEADED “WARNING” ON THE COVER OF THIS DOCUMENT.
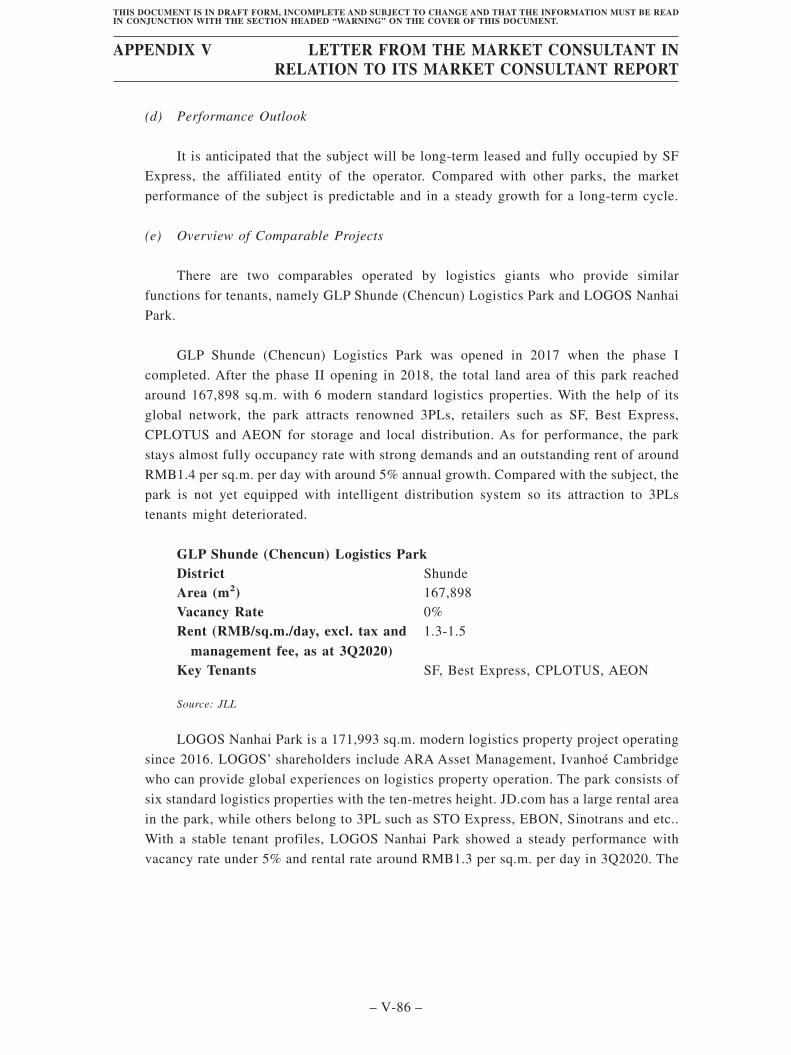
(d) Performance Outlook
It is anticipated that the subject will be long-term leased and fully occupied by SF
Express, the affiliated entity of the operator. Compared with other parks, the market
performance of the subject is predictable and in a steady growth for a long-term cycle.
(e) Overview of Comparable Projects
There are two comparables operated by logistics giants who provide similar
functions for tenants, namely GLP Shunde (Chencun) Logistics Park and LOGOS Nanhai
Park.
GLP Shunde (Chencun) Logistics Park was opened in 2017 when the phase I
completed. After the phase II opening in 2018, the total land area of this park reached
around 167,898 sq.m. with 6 modern standard logistics properties. With the help of its
global network, the park attracts renowned 3PLs, retailers such as SF, Best Express,
CPLOTUS and AEON for storage and local distribution. As for performance, the park
stays almost fully occupancy rate with strong demands and an outstanding rent of around
RMB1.4 per sq.m. per day with around 5% annual growth. Compared with the subject, the
park is not yet equipped with intelligent distribution system so its attraction to 3PLs
tenants might deteriorated.
GLP Shunde (Chencun) Logistics ParkDistrict ShundeArea (m2) 167,898Vacancy Rate 0%Rent (RMB/sq.m./day, excl. tax and
management fee, as at 3Q2020)1.3-1.5
Key Tenants SF, Best Express, CPLOTUS, AEON
Source: JLL
LOGOS Nanhai Park is a 171,993 sq.m. modern logistics property project operating
since 2016. LOGOS’ shareholders include ARA Asset Management, Ivanhoé Cambridge
who can provide global experiences on logistics property operation. The park consists of
six standard logistics properties with the ten-metres height. JD.com has a large rental area
in the park, while others belong to 3PL such as STO Express, EBON, Sinotrans and etc..
With a stable tenant profiles, LOGOS Nanhai Park showed a steady performance with
vacancy rate under 5% and rental rate around RMB1.3 per sq.m. per day in 3Q2020. The
APPENDIX V LETTER FROM THE MARKET CONSULTANT INRELATION TO ITS MARKET CONSULTANT REPORT
– V-86 –
THIS DOCUMENT IS IN DRAFT FORM, INCOMPLETE AND SUBJECT TO CHANGE AND THAT THE INFORMATION MUST BE READIN CONJUNCTION WITH THE SECTION HEADED “WARNING” ON THE COVER OF THIS DOCUMENT.

growth rate is around 5% annually. However, the park is not close to any highway or
quick-speed road which can lead to an inefficiency of cargo distribution.
LOGOS Nanhai ParkDistrict NanhaiArea (m2) 171,993Vacancy Rate 2.9%Rent (RMB/sq.m./day, excl. tax and
management fee, as at 3Q2020)1.3
Key Tenants JD, STO Express, EBON, Sinotrans
Source: JLL
3. WUHU CITY
3.1. Overview
Wuhu is a prefecture-level city in south eastern Anhui province of the PRC. Sitting on the
southeast bank of the Yangtze River, Wuhu borders Hefei to the northwest and is approximately
90 kilometres southwest of Nanjing, the provincial capital of Jiangsu. From 2015 to 2019,
Wuhu saw stable GDP increased at a CAGR of approximately 10.2% and it is expected to grow
at a CAGR of approximately 6.4% during 2019-2025. As of 2019, the city had a population of
approximately 3.77 million of permanent residents.
Nominal GDP of Wuhu City (2015-2025)
0.0
100.0
200.0
300.0
400.0
500.0
600.0
2015 2016 2017 2018 2019 2020E 2021E 2022E 2023E 2024E 2025E
GD
P (
bil
lion
, R
MB
)
Source: JLL
APPENDIX V LETTER FROM THE MARKET CONSULTANT INRELATION TO ITS MARKET CONSULTANT REPORT
– V-87 –
THIS DOCUMENT IS IN DRAFT FORM, INCOMPLETE AND SUBJECT TO CHANGE AND THAT THE INFORMATION MUST BE READIN CONJUNCTION WITH THE SECTION HEADED “WARNING” ON THE COVER OF THIS DOCUMENT.
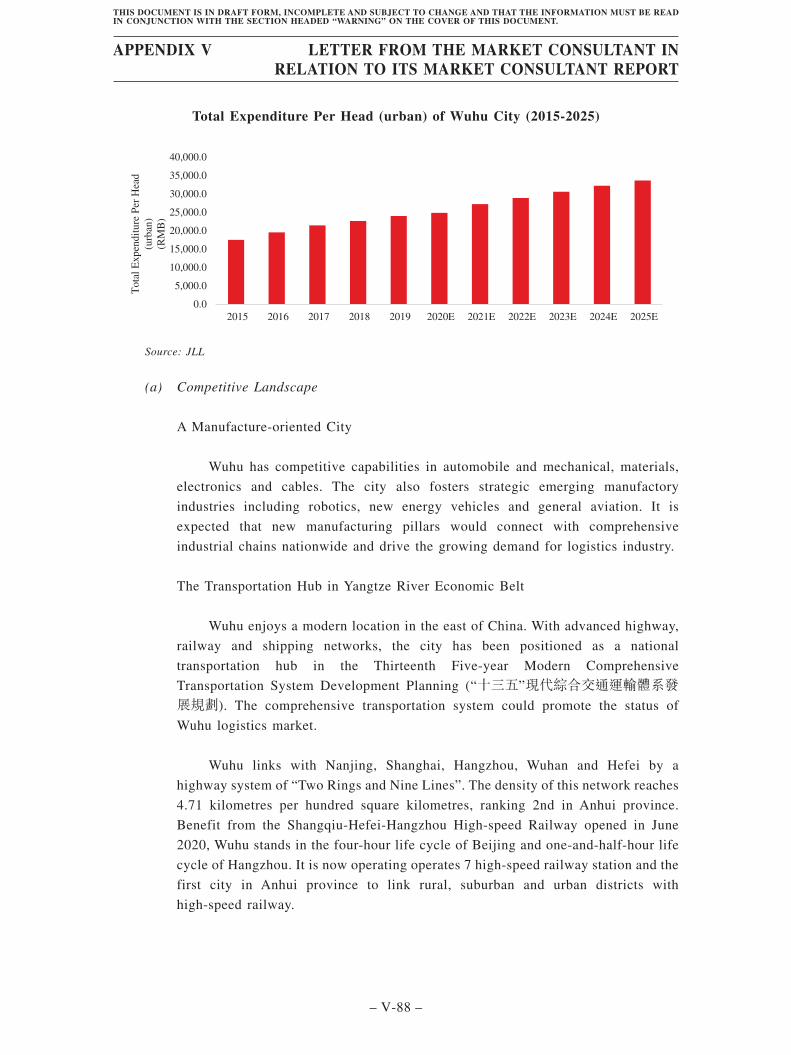
Total Expenditure Per Head (urban) of Wuhu City (2015-2025)
0.0
5,000.0
10,000.0
15,000.0
20,000.0
25,000.0
30,000.0
35,000.0
40,000.0
2015 2016 2017 2018 2019 2020E 2021E 2022E 2023E 2024E 2025E
Tota
l E
xpen
dit
ure
Per
Hea
d
(urb
an)
(RM
B)
Source: JLL
(a) Competitive Landscape
A Manufacture-oriented City
Wuhu has competitive capabilities in automobile and mechanical, materials,
electronics and cables. The city also fosters strategic emerging manufactory
industries including robotics, new energy vehicles and general aviation. It is
expected that new manufacturing pillars would connect with comprehensive
industrial chains nationwide and drive the growing demand for logistics industry.
The Transportation Hub in Yangtze River Economic Belt
Wuhu enjoys a modern location in the east of China. With advanced highway,
railway and shipping networks, the city has been positioned as a national
transportation hub in the Thirteenth Five-year Modern Comprehensive
Transportation System Development Planning (“十三五”現代綜合交通運輸體系發展規劃). The comprehensive transportation system could promote the status of
Wuhu logistics market.
Wuhu links with Nanjing, Shanghai, Hangzhou, Wuhan and Hefei by a
highway system of “Two Rings and Nine Lines”. The density of this network reaches
4.71 kilometres per hundred square kilometres, ranking 2nd in Anhui province.
Benefit from the Shangqiu-Hefei-Hangzhou High-speed Railway opened in June
2020, Wuhu stands in the four-hour life cycle of Beijing and one-and-half-hour life
cycle of Hangzhou. It is now operating operates 7 high-speed railway station and the
first city in Anhui province to link rural, suburban and urban districts with
high-speed railway.
APPENDIX V LETTER FROM THE MARKET CONSULTANT INRELATION TO ITS MARKET CONSULTANT REPORT
– V-88 –
THIS DOCUMENT IS IN DRAFT FORM, INCOMPLETE AND SUBJECT TO CHANGE AND THAT THE INFORMATION MUST BE READIN CONJUNCTION WITH THE SECTION HEADED “WARNING” ON THE COVER OF THIS DOCUMENT.
As one of 28 major river ports in China, Wuhu Port lies by the lower reach of
Yangtze River. Wuhu aims to be the container distribution centre in the lower reach
of Yangtze River and operates high-level route line of 190.3 kilometres.
Integration into Yangtze River Delta and Anhui Free Trade Area
According to Outline Of the Integrated Regional Development Of The Yangtze
River Delta (長江三角洲區域一體化發展規劃綱要), Wuhu plays an important role
for the development of Yangtze River Economic Belt and a central city of south
Anhui province.
Moreover, Wuhu is an indispensable member of Anhui Free Trade Area.
According to China (Anhui) Pilot Free Trade Area General Plan (中國(安徽)自由貿易試驗區總體方案), the logistics related area in Wuhu will involve in domestic and
“One Belt One Road” markets.
(b) Logistics Real Estate Industry
Started late in Wuhu, the logistics real estate industry has expanded remarkably
recent years. With the benefit of modern location and supportive policies, Wuhu has
attracted many of well-known operators entering such as GLP, Pingan, SF and Yupei. The
logistics giants bring experiences of operating modern logistics properties and also attract
famous tenants from 3PL, manufacture and retail to settle down. From the side of demand,
e-commerce distribution and manufacturing product storage contribute most of modern
logistics property requests.
According to the Layout and Construction Plan of National Logistics Hubs (國家物流樞紐佈局和建設規劃》) published in 2018, Wuhu is positioned as one of port-oriented
national logistics hubs. Nevertheless, Wuhu is encouraged in the Outline of the Integrated
Regional Development of the Yangtze River Delta (長江三角洲區域一體化發展規劃綱要)
to construct Wuhu-Maanshan River-Sea Joint Transportation Node. The preliminary plans
provide brilliant scenarios for Wuhu logistics real estate industry which needs to join
positively in the development of the Yangtze River Delta and strengthen competitive
edges of location and development advantages.
APPENDIX V LETTER FROM THE MARKET CONSULTANT INRELATION TO ITS MARKET CONSULTANT REPORT
– V-89 –
THIS DOCUMENT IS IN DRAFT FORM, INCOMPLETE AND SUBJECT TO CHANGE AND THAT THE INFORMATION MUST BE READIN CONJUNCTION WITH THE SECTION HEADED “WARNING” ON THE COVER OF THIS DOCUMENT.
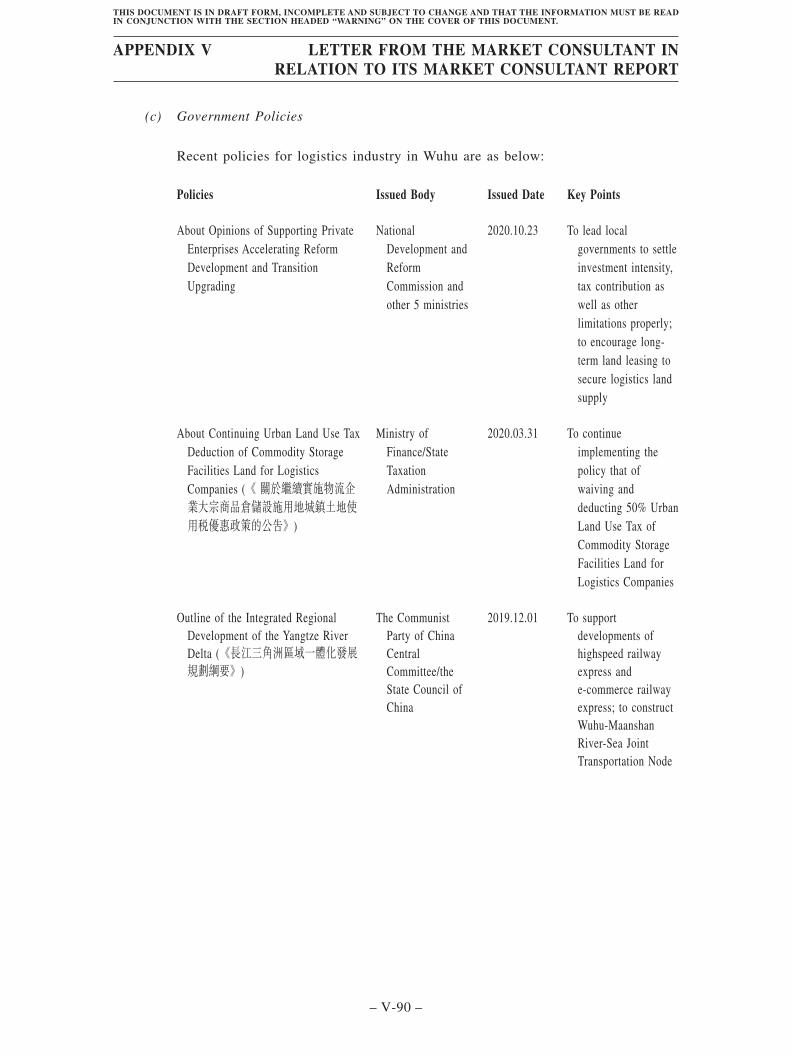
(c) Government Policies
Recent policies for logistics industry in Wuhu are as below:
Policies Issued Body Issued Date Key Points
About Opinions of Supporting PrivateEnterprises Accelerating ReformDevelopment and TransitionUpgrading
NationalDevelopment andReformCommission andother 5 ministries
2020.10.23 To lead localgovernments to settleinvestment intensity,tax contribution aswell as otherlimitations properly;to encourage long-term land leasing tosecure logistics landsupply
About Continuing Urban Land Use TaxDeduction of Commodity StorageFacilities Land for LogisticsCompanies (《 關於繼續實施物流企業大宗商品倉儲設施用地城鎮土地使用稅優惠政策的公告》)
Ministry ofFinance/StateTaxationAdministration
2020.03.31 To continueimplementing thepolicy that ofwaiving anddeducting 50% UrbanLand Use Tax ofCommodity StorageFacilities Land forLogistics Companies
Outline of the Integrated RegionalDevelopment of the Yangtze RiverDelta (《長江三角洲區域一體化發展規劃綱要》)
The CommunistParty of ChinaCentralCommittee/theState Council ofChina
2019.12.01 To supportdevelopments ofhighspeed railwayexpress ande-commerce railwayexpress; to constructWuhu-MaanshanRiver-Sea JointTransportation Node
APPENDIX V LETTER FROM THE MARKET CONSULTANT INRELATION TO ITS MARKET CONSULTANT REPORT
– V-90 –
THIS DOCUMENT IS IN DRAFT FORM, INCOMPLETE AND SUBJECT TO CHANGE AND THAT THE INFORMATION MUST BE READIN CONJUNCTION WITH THE SECTION HEADED “WARNING” ON THE COVER OF THIS DOCUMENT.
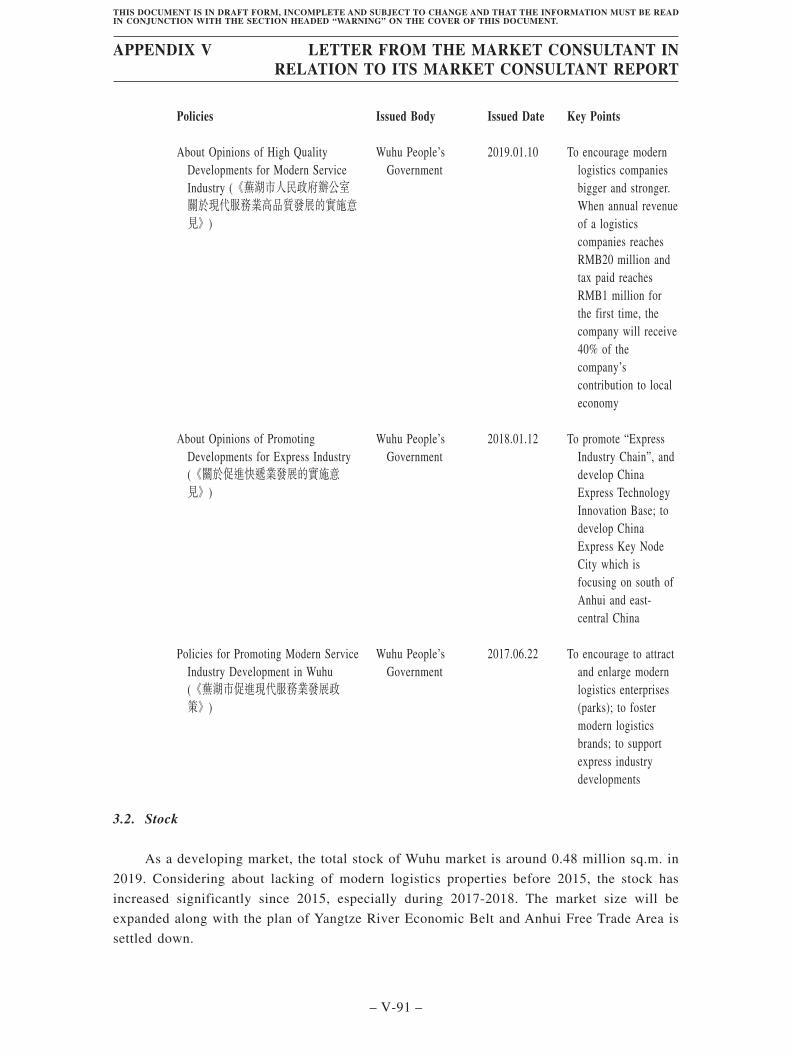
Policies Issued Body Issued Date Key Points
About Opinions of High QualityDevelopments for Modern ServiceIndustry (《蕪湖市人民政府辦公室關於現代服務業高品質發展的實施意見》)
Wuhu People’sGovernment
2019.01.10 To encourage modernlogistics companiesbigger and stronger.When annual revenueof a logisticscompanies reachesRMB20 million andtax paid reachesRMB1 million forthe first time, thecompany will receive40% of thecompany’scontribution to localeconomy
About Opinions of PromotingDevelopments for Express Industry(《關於促進快遞業發展的實施意見》)
Wuhu People’sGovernment
2018.01.12 To promote “ExpressIndustry Chain”, anddevelop ChinaExpress TechnologyInnovation Base; todevelop ChinaExpress Key NodeCity which isfocusing on south ofAnhui and east-central China
Policies for Promoting Modern ServiceIndustry Development in Wuhu(《蕪湖市促進現代服務業發展政策》)
Wuhu People’sGovernment
2017.06.22 To encourage to attractand enlarge modernlogistics enterprises(parks); to fostermodern logisticsbrands; to supportexpress industrydevelopments
3.2. Stock
As a developing market, the total stock of Wuhu market is around 0.48 million sq.m. in
2019. Considering about lacking of modern logistics properties before 2015, the stock has
increased significantly since 2015, especially during 2017-2018. The market size will be
expanded along with the plan of Yangtze River Economic Belt and Anhui Free Trade Area is
settled down.
APPENDIX V LETTER FROM THE MARKET CONSULTANT INRELATION TO ITS MARKET CONSULTANT REPORT
– V-91 –
THIS DOCUMENT IS IN DRAFT FORM, INCOMPLETE AND SUBJECT TO CHANGE AND THAT THE INFORMATION MUST BE READIN CONJUNCTION WITH THE SECTION HEADED “WARNING” ON THE COVER OF THIS DOCUMENT.
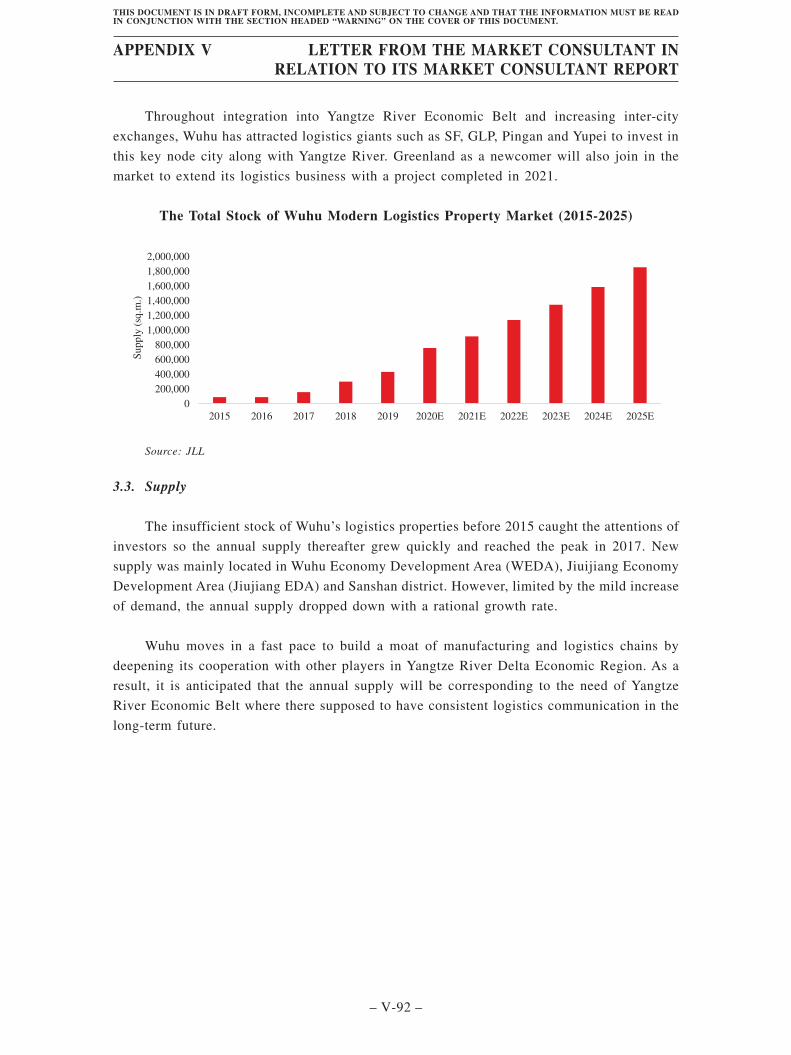
Throughout integration into Yangtze River Economic Belt and increasing inter-city
exchanges, Wuhu has attracted logistics giants such as SF, GLP, Pingan and Yupei to invest in
this key node city along with Yangtze River. Greenland as a newcomer will also join in the
market to extend its logistics business with a project completed in 2021.
The Total Stock of Wuhu Modern Logistics Property Market (2015-2025)
0
200,000
400,000
600,000
800,000
1,000,000
1,200,000
1,400,000
1,600,000
1,800,000
2,000,000
2015 2016 2017 2018 2019 2020E 2021E 2022E 2023E 2024E 2025E
Su
pp
ly (
sq.m
.)
Source: JLL
3.3. Supply
The insufficient stock of Wuhu’s logistics properties before 2015 caught the attentions of
investors so the annual supply thereafter grew quickly and reached the peak in 2017. New
supply was mainly located in Wuhu Economy Development Area (WEDA), Jiuijiang Economy
Development Area (Jiujiang EDA) and Sanshan district. However, limited by the mild increase
of demand, the annual supply dropped down with a rational growth rate.
Wuhu moves in a fast pace to build a moat of manufacturing and logistics chains by
deepening its cooperation with other players in Yangtze River Delta Economic Region. As a
result, it is anticipated that the annual supply will be corresponding to the need of Yangtze
River Economic Belt where there supposed to have consistent logistics communication in the
long-term future.
APPENDIX V LETTER FROM THE MARKET CONSULTANT INRELATION TO ITS MARKET CONSULTANT REPORT
– V-92 –
THIS DOCUMENT IS IN DRAFT FORM, INCOMPLETE AND SUBJECT TO CHANGE AND THAT THE INFORMATION MUST BE READIN CONJUNCTION WITH THE SECTION HEADED “WARNING” ON THE COVER OF THIS DOCUMENT.
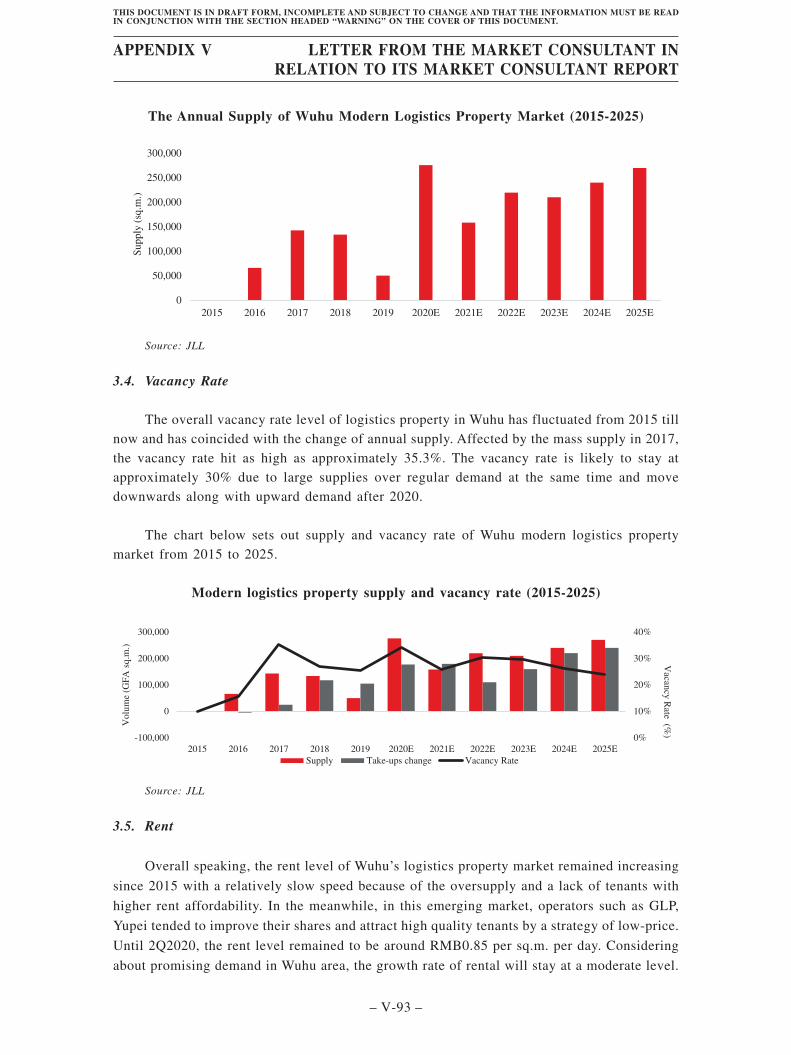
The Annual Supply of Wuhu Modern Logistics Property Market (2015-2025)
0
50,000
100,000
150,000
200,000
250,000
300,000
2015 2016 2017 2018 2019 2020E 2021E 2022E 2023E 2024E 2025E
Su
pp
ly (
sq.m
.)
Source: JLL
3.4. Vacancy Rate
The overall vacancy rate level of logistics property in Wuhu has fluctuated from 2015 tillnow and has coincided with the change of annual supply. Affected by the mass supply in 2017,the vacancy rate hit as high as approximately 35.3%. The vacancy rate is likely to stay atapproximately 30% due to large supplies over regular demand at the same time and movedownwards along with upward demand after 2020.
The chart below sets out supply and vacancy rate of Wuhu modern logistics propertymarket from 2015 to 2025.
Modern logistics property supply and vacancy rate (2015-2025)
0%
10%
20%
30%
40%
-100,000
0
100,000
200,000
300,000
2015 2016 2017 2018 2019 2020E 2021E 2022E 2023E 2024E 2025E
Vacan
cy R
ate(%
)V
olu
me
(GF
A s
q.m
.)
Supply Take-ups change Vacancy Rate
Source: JLL
3.5. Rent
Overall speaking, the rent level of Wuhu’s logistics property market remained increasing
since 2015 with a relatively slow speed because of the oversupply and a lack of tenants with
higher rent affordability. In the meanwhile, in this emerging market, operators such as GLP,
Yupei tended to improve their shares and attract high quality tenants by a strategy of low-price.
Until 2Q2020, the rent level remained to be around RMB0.85 per sq.m. per day. Considering
about promising demand in Wuhu area, the growth rate of rental will stay at a moderate level.
APPENDIX V LETTER FROM THE MARKET CONSULTANT INRELATION TO ITS MARKET CONSULTANT REPORT
– V-93 –
THIS DOCUMENT IS IN DRAFT FORM, INCOMPLETE AND SUBJECT TO CHANGE AND THAT THE INFORMATION MUST BE READIN CONJUNCTION WITH THE SECTION HEADED “WARNING” ON THE COVER OF THIS DOCUMENT.
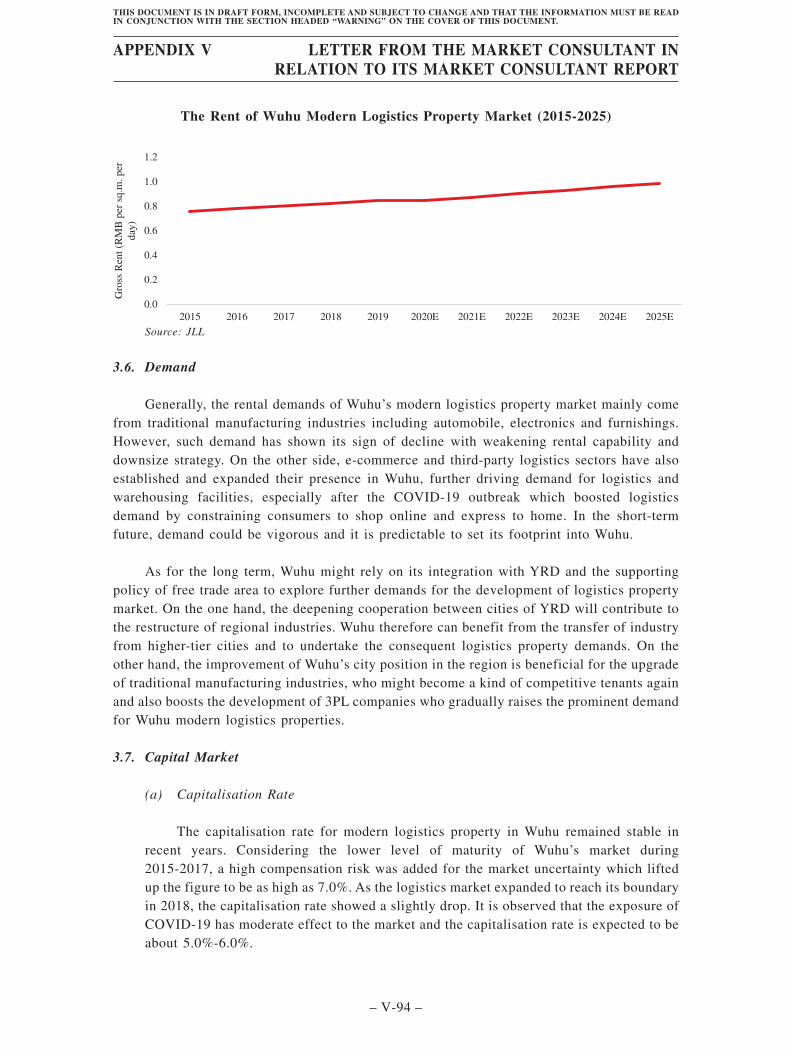
The Rent of Wuhu Modern Logistics Property Market (2015-2025)
0.0
0.2
0.4
0.6
0.8
1.0
1.2
2015 2016 2017 2018 2019 2020E 2021E 2022E 2023E 2024E 2025E
Gro
ss R
ent
(RM
B p
er s
q.m
. p
er
day
)
Source: JLL
3.6. Demand
Generally, the rental demands of Wuhu’s modern logistics property market mainly comefrom traditional manufacturing industries including automobile, electronics and furnishings.However, such demand has shown its sign of decline with weakening rental capability anddownsize strategy. On the other side, e-commerce and third-party logistics sectors have alsoestablished and expanded their presence in Wuhu, further driving demand for logistics andwarehousing facilities, especially after the COVID-19 outbreak which boosted logisticsdemand by constraining consumers to shop online and express to home. In the short-termfuture, demand could be vigorous and it is predictable to set its footprint into Wuhu.
As for the long term, Wuhu might rely on its integration with YRD and the supportingpolicy of free trade area to explore further demands for the development of logistics propertymarket. On the one hand, the deepening cooperation between cities of YRD will contribute tothe restructure of regional industries. Wuhu therefore can benefit from the transfer of industryfrom higher-tier cities and to undertake the consequent logistics property demands. On theother hand, the improvement of Wuhu’s city position in the region is beneficial for the upgradeof traditional manufacturing industries, who might become a kind of competitive tenants againand also boosts the development of 3PL companies who gradually raises the prominent demandfor Wuhu modern logistics properties.
3.7. Capital Market
(a) Capitalisation Rate
The capitalisation rate for modern logistics property in Wuhu remained stable inrecent years. Considering the lower level of maturity of Wuhu’s market during2015-2017, a high compensation risk was added for the market uncertainty which liftedup the figure to be as high as 7.0%. As the logistics market expanded to reach its boundaryin 2018, the capitalisation rate showed a slightly drop. It is observed that the exposure ofCOVID-19 has moderate effect to the market and the capitalisation rate is expected to beabout 5.0%-6.0%.
APPENDIX V LETTER FROM THE MARKET CONSULTANT INRELATION TO ITS MARKET CONSULTANT REPORT
– V-94 –
THIS DOCUMENT IS IN DRAFT FORM, INCOMPLETE AND SUBJECT TO CHANGE AND THAT THE INFORMATION MUST BE READIN CONJUNCTION WITH THE SECTION HEADED “WARNING” ON THE COVER OF THIS DOCUMENT.
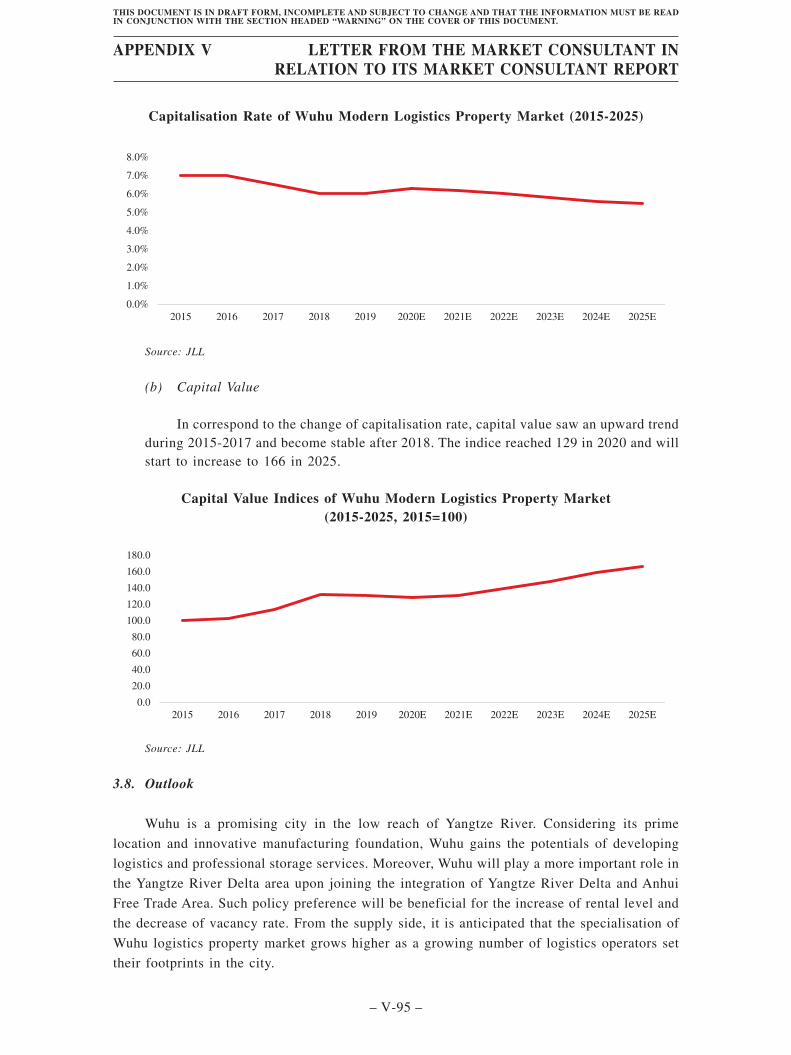
Capitalisation Rate of Wuhu Modern Logistics Property Market (2015-2025)
0.0%
1.0%
2.0%
3.0%
4.0%
5.0%
6.0%
7.0%
8.0%
2015 2016 2017 2018 2019 2020E 2021E 2022E 2023E 2024E 2025E
Source: JLL
(b) Capital Value
In correspond to the change of capitalisation rate, capital value saw an upward trendduring 2015-2017 and become stable after 2018. The indice reached 129 in 2020 and willstart to increase to 166 in 2025.
Capital Value Indices of Wuhu Modern Logistics Property Market(2015-2025, 2015=100)
0.0
20.0
40.0
60.0
80.0
100.0
120.0
140.0
160.0
180.0
2015 2016 2017 2018 2019 2020E 2021E 2022E 2023E 2024E 2025E
Source: JLL
3.8. Outlook
Wuhu is a promising city in the low reach of Yangtze River. Considering its prime
location and innovative manufacturing foundation, Wuhu gains the potentials of developing
logistics and professional storage services. Moreover, Wuhu will play a more important role in
the Yangtze River Delta area upon joining the integration of Yangtze River Delta and Anhui
Free Trade Area. Such policy preference will be beneficial for the increase of rental level and
the decrease of vacancy rate. From the supply side, it is anticipated that the specialisation of
Wuhu logistics property market grows higher as a growing number of logistics operators set
their footprints in the city.
APPENDIX V LETTER FROM THE MARKET CONSULTANT INRELATION TO ITS MARKET CONSULTANT REPORT
– V-95 –
THIS DOCUMENT IS IN DRAFT FORM, INCOMPLETE AND SUBJECT TO CHANGE AND THAT THE INFORMATION MUST BE READIN CONJUNCTION WITH THE SECTION HEADED “WARNING” ON THE COVER OF THIS DOCUMENT.
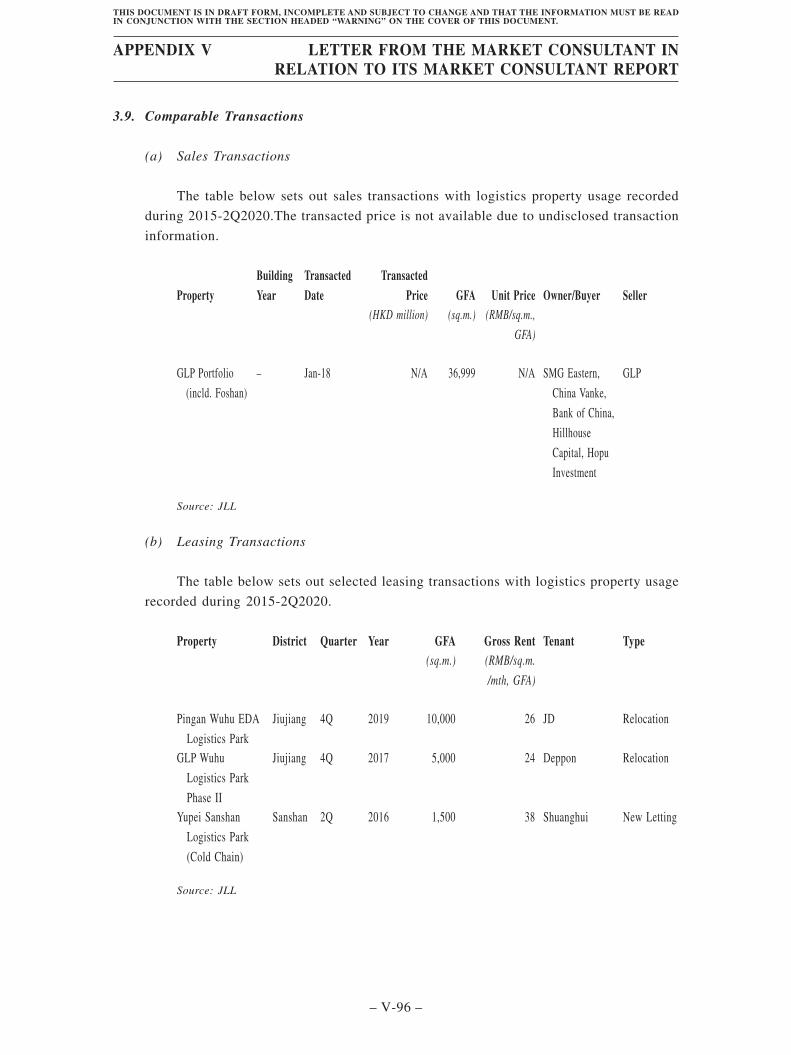
3.9. Comparable Transactions
(a) Sales Transactions
The table below sets out sales transactions with logistics property usage recorded
during 2015-2Q2020.The transacted price is not available due to undisclosed transaction
information.
PropertyBuildingYear
TransactedDate
TransactedPrice GFA Unit Price Owner/Buyer Seller
(HKD million) (sq.m.) (RMB/sq.m.,
GFA)
GLP Portfolio
(incld. Foshan)
– Jan-18 N/A 36,999 N/A SMG Eastern,
China Vanke,
Bank of China,
Hillhouse
Capital, Hopu
Investment
GLP
Source: JLL
(b) Leasing Transactions
The table below sets out selected leasing transactions with logistics property usage
recorded during 2015-2Q2020.
Property District Quarter Year GFA Gross Rent Tenant Type(sq.m.) (RMB/sq.m.
/mth, GFA)
Pingan Wuhu EDA
Logistics Park
Jiujiang 4Q 2019 10,000 26 JD Relocation
GLP Wuhu
Logistics Park
Phase II
Jiujiang 4Q 2017 5,000 24 Deppon Relocation
Yupei Sanshan
Logistics Park
(Cold Chain)
Sanshan 2Q 2016 1,500 38 Shuanghui New Letting
Source: JLL
APPENDIX V LETTER FROM THE MARKET CONSULTANT INRELATION TO ITS MARKET CONSULTANT REPORT
– V-96 –
THIS DOCUMENT IS IN DRAFT FORM, INCOMPLETE AND SUBJECT TO CHANGE AND THAT THE INFORMATION MUST BE READIN CONJUNCTION WITH THE SECTION HEADED “WARNING” ON THE COVER OF THIS DOCUMENT.
3.10. Individual Asset Analysis
(a) Competitive Analysis and Competitive Positioning
The subject is located in Jiujiang district and its proximity to key transport on hubs
is helpful for logistics and distributions. The subject is at a distance of 1 kilometre away
from Ningwu Expressway (East) Station, 6 kilometres from Wuhu East High Speed
Railway Station and 9.8 kilometres from Wuhu International Cargo Port. Also it is close
to Ning Wu Highway which connects the north and south parts of the Yangtze River Delta
Economic Region, by a 2.2 kilometres straight line.
Jiujiang governs 820 square kilometres which consists of Wuhu Economic
Development Area, Jiujiang Economic Development Area. As the political centre, cultural
centre and financial centre of Wuhu city, Jiujiang enjoys a convenient location to develop
automobile and high-end manufacturing. Most of well-known modern logistics properties
(about 65% of total market) are located at Jiujiang district, creating a fierce competition
for the subject.
Considering stapled demand from 3PL for local distribution, the subject is designed
to be compatible with distribution functions. However, most of competitors in the area
focuses on normal freight and e-commerce storage. Most of them are equipped with
facilities for common use. Thus, it can be costly for a tenant to redesign the logistics
property for its customised demand, such as distribution centre with modern functions.
(b) Performance Analysis
The subject, a modern logistics property, started operating in early November 2018
and catch up the “Double Eleven” online shopping festival of the year. The total GFA of
the subject is around 62,304 sq.m., consisting one distribution centre, one block of office
building, number of logistics properties, dorms and other facilities. It comprises (a) two
single-storey high standard warehouses that offer features such as temperature and
humidity controls to support cold chain logistics; (b) a two-storey distribution centre
equipped with automatic sorting and supply chain support facilities; (c) a research and
development building; and (d) two ancillary buildings. The detailed sizes of distribution
centre, office building, logistics properties and affiliated facilities are 22,567.77 sq.m.,
9,192.81 sq.m., 29,972.98 sq.m. and 570.6 sq.m. separately. In terms of Gross Floor Area
as at 30 September 2020, the Wuhu Property ranked the 4th among the modern logistics
properties in Wuhu.
The subject has attracted a diversified tenant profile covering SF affiliated entities,
e-commerce operators and 3PLs. Specifically, partial area of distribution centre (about
55% in total) was firstly leased by SF Express in 2018 and the ratio climb to be
approximately 88% in 3Q2020. There are two logistics properties fully taken by Joybos,
APPENDIX V LETTER FROM THE MARKET CONSULTANT INRELATION TO ITS MARKET CONSULTANT REPORT
– V-97 –
THIS DOCUMENT IS IN DRAFT FORM, INCOMPLETE AND SUBJECT TO CHANGE AND THAT THE INFORMATION MUST BE READIN CONJUNCTION WITH THE SECTION HEADED “WARNING” ON THE COVER OF THIS DOCUMENT.

an online furniture retailer, since the very beginning. The office building was for internal
use before 2019 and after its official openness to the market, the vacancy rate decrease
significantly from 35% to approximately 23% in 3Q2020.
As of 3Q2020, the rent of distribution centre reached nearly RMB0.88 per sq.m. per
day, overperforming the overall market of Wuhu. Besides, rents of logistics properties and
office building recorded recorded RMB0.57 per sq.m. per day and RMB0.53 per sq.m. per
day respectively. The growth rate was stable and locked at around 5% until now.
The SubjectTotal GFA Area (m2) 62,304No. of storey 2 in distribution centre; 1 in warehouses; 6 in office
building; 1 in affiliated facilitiesYear of completion 2018Occupancy rate
(at 30th September2020)
88% in distribution centre; 7% in warehouses; 77% in
office building
Rent (RMB/sq.m./day,excl. tax andmanagement fee, at30th September 2020)
0.88 RMB/sq.m./day in distribution centre; 0.57
RMB/sq.m./day in warehouses; 0.53 RMB/sq.m./day
in office building
Source: JLL
(c) SWOT Analysis
The SWOT analysis for the subject is as follows:
Strengths Weaknesses
• Prime location• Mixed real estate product portfolio• Professional management by SF
Express• Secured tenant sources
• Comparatively small size on GFA
Opportunities Threats
• Potential demands from the AnhuiFree Trade Area and Yangtze RiverDelta Integration
• Fierce competition in the area• Unstable local logistics demand
APPENDIX V LETTER FROM THE MARKET CONSULTANT INRELATION TO ITS MARKET CONSULTANT REPORT
– V-98 –
THIS DOCUMENT IS IN DRAFT FORM, INCOMPLETE AND SUBJECT TO CHANGE AND THAT THE INFORMATION MUST BE READIN CONJUNCTION WITH THE SECTION HEADED “WARNING” ON THE COVER OF THIS DOCUMENT.
(d) Performance Outlook
Based on the SWOT analysis, the subject gains strengths from mixed productportfolio compared with other single-use projects. The subject also has constant tenantsources especially from affiliated entities with long-term letting. In other words, thesubject will have a comparatively low operational risk and is capable to make a steadygrowth onwards.
To cope with any changes of the market at any time, SF Express and SF Freight havesecured the storage and dispatch areas of distribution centre and warehouses, maintaininga low level of vacancy rate for these two properties. On the other hand, the office buildingwill also be fully occupied by logistics related industries with an expectation on thegrowing demand on local office leasing. To sum up, the overall rental growth of thesubject will remain at approximately 5% per annum in the short-to-mid-term period.
(e) Overview of Comparable Projects
There are two comparable projects in the vicinity of the subject, namely GLP WuhuLogistics Park and Pingan Wuhu EDA Logistics Park. The two comparables are bothlocated within 5 kilometre radius of the subject and developed by well-known operators.
GLP Wuhu Logistics Park was opened in 2016 when its phase I completed. The totalGFA of the park is over 150,000 sq.m. after the completion of phase II and phase III. Justlike other GLP parks in China, GLP Wuhu Logistics Park is positioned as a high standardlogistics property to attracts 3PLs, e-commerce retailers and manufacturing sectors. Themarket performance of the park was robust with a rental rate of nearly RMB0.9 per sq.m.per day and 95% occupancy rate as of 3Q2020. Compared with the subject, GLP WuhuLogistics Park is expert in marketing due to its global network but with fewer functions.It is also lack of long-term local partners or affiliated tenants to diversified the marketrisks.
GLP Wuhu Logistics ParkDistrict JiujiangArea (m2) 153,000Vacancy Rate 5%Rent (RMB/sq.m./day, excl. tax and
management fee, as at 3Q2020)0.9
Key Tenants Deppon
Source: JLL
Pingan Wuhu EDA Logistics Park was completed in 2017 with around 103,721 sq.m.GFA. Pingan, a cross-border developer, who started its investment in enormous logisticsproperties projects of tier-2 and tier-3 cities in recent years, is a newcomer for Wuhu.Pingan Wuhu EDA Logistics Park is positioned as a high standard logistics propertymainly for 3PLs and e-commerce retailers, such as JD.com. However, performance of theproject is questioned considering the less experience of Pingan in logistics market.
APPENDIX V LETTER FROM THE MARKET CONSULTANT INRELATION TO ITS MARKET CONSULTANT REPORT
– V-99 –
THIS DOCUMENT IS IN DRAFT FORM, INCOMPLETE AND SUBJECT TO CHANGE AND THAT THE INFORMATION MUST BE READIN CONJUNCTION WITH THE SECTION HEADED “WARNING” ON THE COVER OF THIS DOCUMENT.

Vacancy rate of the project stayed at around 60% since 2017 and the rent was RMB0.87per sq.m. per day so far. It also has a disadvantage on securing the stable and high-qualitytenants for the long-term operation.
Pingan Wuhu EDA Logistics ParkDistrict JiujiangArea (m2) 103,721Vacancy Rate 40%Rent (RMB/sq.m./day, as excl. tax and
management fee, at 3Q2020)0.87
Key Tenants JD
Source: JLL
LIMITING CONDITIONS
This report is for the use of the party to whom it is addressed only and no liabilityaccepted to any third party for the whole or any part of its contents. It may not be reproduced,either in whole or in part, nor altered in any way, without the prior written permission of JonesLang LaSalle Corporate Appraisal and Advisory Limited (“JLL”).
The information and analysis in this report should be regarded solely as a general guideinstead of a formal valuation for any land or property interest. It must not be used as part ofsuch contents.
The information contained in this report has been obtained from a variety of sourcesgenerally regarded to be reliable and is considered to be reasonable at the time of undertakingthis research. Whilst care has been taken in its preparation, no representation is made, orresponsibility accepted by JLL, in respect of the accuracy or timeliness of the whole or anypart. Potential investors or developers are encouraged to carry out their own assessment ofmarket potentials or project feasibility.
JLL stressed again that forecasting future sales prices, development and investmentreturns and development viability is a problematic exercise which at best should be regardedas an indicative assessment of possibilities rather than values with absolute certainties. Theprocess of marking forward projections involves assumptions which are acutely sensitive tochanging conditions, variations in any one of which factors may significant effect the viabilityof a project and JLL draw your attention to this factor. Such conditions external events includebut are not restricted to new laws or government regulations, changes of company strategiesor policies, innovations of social economic and policies, and other important incidents whichhave influence on the market.
JLL should not be required to give testimony or attendance in court or to any governmentagency due to the conclusions on the referenced property, unless prior arrangements have beenmade. JLL also does not accept any liability in negligence of otherwise for any loss or damagesuffered by any party resulting from reliance on this report other than as specified in thecontract of engagement.
APPENDIX V LETTER FROM THE MARKET CONSULTANT INRELATION TO ITS MARKET CONSULTANT REPORT
– V-100 –
THIS DOCUMENT IS IN DRAFT FORM, INCOMPLETE AND SUBJECT TO CHANGE AND THAT THE INFORMATION MUST BE READIN CONJUNCTION WITH THE SECTION HEADED “WARNING” ON THE COVER OF THIS DOCUMENT.