THE ECONOMIC AND SOCIAL RESEARCH INSTITUTE
65
THE ECONOMIC AND SOCIAL RESEARCH INSTITUTE Some Aspects of Price Inflation in Ireland R. C. GEARY and J. L. PRATSCHKE January, x968 Paper No. 40 73 LOWER BAGGOT STREET, DUBLIN 2. i ,1
-
Upload
khangminh22 -
Category
Documents
-
view
1 -
download
0
Transcript of THE ECONOMIC AND SOCIAL RESEARCH INSTITUTE
THE ECONOMIC AND SOCIAL
RESEARCH INSTITUTE
Some Aspects of Price Inflation in Ireland
R. C. GEARY and J. L. PRATSCHKE
January, x968 Paper No. 40
73 LOWER BAGGOT STREET, DUBLIN 2.
i,1
THE ECONOMIC AND SOCIAL RESEARCH INSTITUTECOUNCIL r967-68
J. J. MCELUGOTT, M.A., LL.D.,¯ President of the Institute.
’tG. O’BRIEN, D.LITT., LITT.D.,Chairman of the Council.
C. S. ANDREWS, B.COMM., D.ECON.SC.,Chairman, Radio Telefis ]~ireann.
T. J. BARR1NGTON,Director, Institute of Public Administration.
*J. P. BEDDY, D.ECON.SC., LL.D. (H.C.)Chairman and Managing Director, The Industrial Credit Co. Ltd.
R. D. C. BLACK, PH.D.,Professor, Department of Economics, The Queen’s University, Belfast.
"tF. B. CHUBB, M.A., D.PHIL.,Professor, Department of Political Science, Trinity College, Dublin.
VERY REV. D. CREGAN, C.M.,President, St. Patrick’s Training College, Drumcondra, Dublin.
REV. PETER DEMPSEY, O.F.M.CAP., M.A., PH.D., D.D.,Professor, Department of Applied Psychology, University College, Cork.
*M. P. FOOARTY, M.A., D.POL.SOC.SC. (Louvain),Director of the Institute.
’tW. A. HONOHAN, M.A., F.I.A.,Secretary, Department of Social Welfare.
"tREV. JAMES KAVANAGH, M.A., S.T.L.,Professor, Department of Social Science, University College, Dublin.
IVOR KENNY, M.A.,Director, Irish Management Institute.
T. P. LINEHAN, B.E., B.SC.,Director, Central Statistics Office.
P. LYNCH, M.A.,Chairman, Medico-Social Research Board.
CHARLES MCCARTHY, B.L.,Chairman, Human Sciences Committee.
*M. D. McCAR~, M.A., PH.D.,President, University College, Cork.
G. A. MEAGHER,Chairman, An Foras Forbartha.
*J. F. MEENAN, M.A., B.L.,Professor of Political Economy, University College, Dublin.
J. C. NAGLE, M.COMM.,Sccretary, Department of Agriculture.
D. NEVIN,Assistant Secretary, Irish Congress of Trade Unions.
REV. J. NEWMAN, M.A., D.PH.,Professor of Sociology, St. Patrick’s College, Maynooth.
L. O’BUACHALLA, M.COMM.,Professor. Department of Economics, University College, Galway.
TADHG O CEARBHAILL,Secretary, Department of Labour.
REV. E. F. O’DoI-IERTY, M.A., B.D., PH.D.,Professor, Department of Logic and Psychology, University College, Dublin.
D. P. O’MAHONY, M.A., PH.D., B.L.,Professor, Department of Economics, University College, Cork.
’*W. J. L. RYAN, M.A., PH.D.,Professor of Industrial Economics, Trinity College, Dublin.
J. C. TONGE,Federation of Irish Industries.
T. WALSH, D.SC.,Director, An Foras TaMntais.
*T. K. WHITAKER, M.SC.(ECON.), D.ECON.SC.,Secretary, Department of Finance.
*Members of Executive Committee.
Copies of this paper may be obtained from The Economic and Social Research Inatitute, 73 Lower BaggotStreet, Dublin 2, price 5/- a copy.
Some Aspects of Price Inflation in Ireland

Contents
Foreword
Tables, Charts, Abbreviations
I. Introduction
2. International Aspects
3. Group and Individual Prices
4. Industrial and Agricultural Prices
5. Aspects of Prices in the Service Sector, with Special Reference to Retail Distribution
6. Prices in the Input-Output Context with Special Reference to Services
7. Rate of Return on Capital
8. The General Price Level and the External Trading Gain
9. Some Remarks on Index Number Making with Special Reference to the Quality Problem
IO. Conclusion
Appendices
Page
vii
,..VIII
I
3
9
I3
16
23
27
30
35
46
5°
ForewordWe started this research to try to find out why prices are persistently rising or, more precisely, to answer
the question: are rising prices a necessary condition for economic advance under modern conditions?What has transpired is a statistical document, mainly descriptive of price trends in Ireland during the post-war period, though we venture to propound in the final section of the paper, unproven theses for dis-cussion. We hope that others will tackle this, one of the most important socio-economic problems of ourtime, here and elsewhere, and that our data will prove useful to them. We would feel amply rewarded ifour paper should lead to more public awareness of, and concern for, the price situation.
While responsibility for the content of the paper is entirely ours, we would like to express our thanks tothe Referee, the Central Statistics Office and An Foras Talflntas (for computer services).
vii

Table
LIST OF TABLES
PAGE
1 Annual Price Indexes 1946-1965 2 Table 162 Consumer Price Indexes in Selected Countries
1948-1965 43 Consumer Price Disparity Indexes for Groups
of Countries 4 I74 Commodity Group Consumer Price Index
Numbers, Mid-August 1953 to 1965 95 Indexes of Certain Items of Indirect Taxation 1o 186 Frequency Distributions of Price Indexes and
Log Price Indexes of the 197 Items included 19in the Official Consumer Price Index Computa-tion 1 i
7 Frequency Constants for Distributions of 20Price Indexes and Log Price Indexes of the197 Items included in the Official ConsumerPrice Index Computations 1I 21
8 Number of Items Increasing Most in Price inFour Periods and Their Interperiod Con-cordance I2
9 Price and Volume Indexes for Irish Trans-portable Goods Industries 1963 to Base 1955 22as ioo, and Percentage of Gross OutputExported in 1963 for Manufacturing Industries 13 23
IO Price Indexes for Farmers’ Cash Sales,Purchases, Terms of Trade, and Gains orLosses from Terms of Trade 1953-1965 15 24
11 Index Numbers of (i) Added Value per PersonEngaged (Income per Head), (ii) Productivity 25and (iii) Price in (a) Agriculture, Forestry,Fishing, (b) Rest of Economy and (c) TotalEconomy 1958 and 1961-1965 18 26
12 Corcordance between Adjusted ConsumerPrice Index and Adjusted General WholesalePrice Index, Mid-August i953-1965 19 2713 Derivation of Indexes of Margin per PersonEngaged, Productivity and Price of Distribu-tion for All Retail Distribution 1956-196o 21
14 Index Numbers of Margin per Person Engaged, 28Productivity, and Price of Retail Distributionin Four Groups of Business 1956-I96o 22 29
15 Irish 196o Input-Output Table for ThreeIndustrial Groups (IG); Value at Subsidized 3°Producers’ Prices 23
PAOE
Percentage Effect on Price in Three IndustrialGroups of IO Per Cent. Rise in Price in Eachof Four Primary Inputs and in ConsumerPrices 24Derivation of the Price Index Number forServices in Household Expenditure, 1953,1958, 196o and 1964 25Calculation of Price Indexes of PersonalExpenditure at Purchasers’ Prices 26GDFCF and Depreciation at Current andConstant (1958) Prices, and Profit at CurrentPrices; Non-Agricultural Sector 1958-1965 27Estimates of Capital on Two Bases, Profits asPercentage of Capital and Index NumbersThereof; Non-Agricultural Sector 1958-1965 28Estimates of Capital, Profit and Profit RateIndex with Depreciation taken at 5 Per Cent.of Fixed Capital Stock, on Two Bases of ProfitCapitalization in 1958; Non-AgriculturalSector 1958-1965 29Profit as Percentage of Total Factor Income;Non-Agricultural Sector 1958-1965 30Estimates of the Trading Gain T’ for Irelandin Each Pair of Consecutive Years 1958-i959to 1963-1964 33National Accounts Price Index Numbers,Ireland, I947-1964 34Comparison of Estimates of the Trading GainT’ and T" for Ireland 1948-1964, with PreviousYear as Base Year 34Percentages of Gross Output of the Buildingand Constrnetion Industry in Three Categoriesof Cost, 1953-1964 38Price Index Numbers (1953 as ioo) of Pro-duction and Materials in the Building andConstruction Industry, 1953-I965, fromDifferent Sources 39General Wholesale Price Index Numbers inStage of Production Categories 4ICorrelation Coefficients Between the Inde-pendent Variables x1, 12, x8, taken in Pairs 45Regression of Log Car Prices on Sets of Inde-pendent Variables 45
APPENDIX TABLES
A1 Consumer Prices in Ireland and U.K., Quarterly, 1947- A5 Index Numbers (to base 1953 as lOO) of (i) Value, (ii)1966 Volume and (iii) Implicit Price of Gross Output of
A2 Prices and National Income in the U.K., 187o-i937 Irish Industries, 1954-i964A3 Farrfiers’ Cash Payments 1953-1965 A6 Implicit Price Indexes in Economic Sectors, 1959-i965A4 Price Index Numbers of Farmers’ Purchases and Cash
Receipts 1954-1965
LIST OF CHARTS
PAOE PAOE1 Irish Price Index Numbers, Annual 1946-1965 2 4 Adjusted Consumer Price Index and Adjusted Whole-2 Price Indexes in Ireland and the U.K., Quarterly sale Price Index, Ireland, 1953-1965 2o
1947-1966, Base 1953 as ioo 6 5 Index Numbers (Base 1962 as IOO) of Rate of Return3 Quarterly Consumer Price Index Numbers, I947- on Capital on Two Bases (A and B, Table 2o) and
1965, Log Deviations from Mean, Actual Data, Fitted Hourly Earnings (C) in TG Industries, 1958-1965 29Linear and Orthopolynominal Trends 8 6 Prices and National Income in the U.K., 185o-1937 52
ABBREVIATIONS
CD Census of Distribution ISBCIE C6ras Iompair ]~ireann (Irish Transport Co.) ITff 6. SBCIP Census of Industrial ProductionCP(I) Consumer Price (Index) MDSCSO Central Statistics Office NIEDF Degrees of Freedom NIECEEC European Economic Community RLTERI The Economic Research Institute (now ESRI) SAESRI The Economic and Social Research Institute SDGDFCF Gross Domestic Fixed Capital Formation SSISIGNP Gross National Product TG(I)IO Input-Output WP(I)
viii
Irish Statistical BulletinIrish Trade ffournal and Statistical Bulletin (now
ISB)Monthly Digest of Statistics (U.K.)National Income and Expenditure (CSO)National Industrial and Economic CouncilReturns of Local TaxationStatistical AbstractStandard DeviationStatistical and Social Inquiry Society of IrelandTransportable Goods (Industries)Wholesale Price (Index)

SOMEASPECTS
IN
OF PRICE
IRELAND*
INFLATION
by
R. C. GEARY and J. L. PRATSCHKE
1. INTRODUCTION
In every country prices have risen snbstantiaUysince the end of the war. In Ireland, as in six otherEuropean countries, consumer prices had almostdoubled between 1948 and 1965--see Table 2. Isthis situation of continuously rising prices in theindefinite future a fact of life which must be acceptedand with which we must somehow cope, or does itmean that a sudden, and possibly catastrophic, fallin prices, like that of May 192o after World War I,is to be anticipated? History generally has a way ofrepeating itself and similarities are observablebetween our times and others, but with much longertime-lags between cause and effect in the morerecent period. One might hope that, as governmentsnowadays have much greater control of theireconomies than in the past, and with the develop-ment of the social conscience, disastrous price fallscan be avoided or mitigated. It is only a hope, how-ever.
We start our examination with the five mostfamiliar price index numbers,1 to set the price scenein the Irish context--see Table i and Chart x. Thereis seen to be a wide disparity between the differentindexes in each of the two periods i946-1953 and1953-1965 but these disparities are different incharacter: for example, since 1953 the rise inconsumer prices was by far the largest of the five
1Here ignore the technical distinction between price andunit value index numbers. In Table r import and export priceindexes so-called are really unit value indexes. We discuss thepoint in Section 9.
*R. C. Geary is a Research Consultant and J. L. Pratschkeis a Research Assistant of The Economic and Social ResearchInstitute. The paper has been accepted for publication by theInstitute. The authors are responsible for the contents of thepaper including the views expressed therein.
but in 1946-1953 consumer prices rose least. Otherpoints to be noted as significant in the later periodare:--
(i) increases in import and export prices are farless than in wholesale and consumer prices
(ii) general similarity in trends of wholesaleand retail prices but with a widening gap inthe later years;
(iii) close similarity in agricukural and exportprice trends (as is to be expected because ofthe predominance of farm products inexports), but with a significant deviation inthe past two years due in part, no doubt, tothe increasing importance of industrialexports;
(iv) the terms of trade (ratio of export to importprices) after being unfavourable for mostof the period have moved to nearly 1953parity in 1964-65.
Chart I, wkh other well-known data about theeconomic trend, suggest a multitude of problemsworth investigation, and we hope to examine someof these problems here.
This paper provides a statistical description ofsome aspects of the Irish price trend since 1946.This background should be useful for a moreseverely econometric analysis of Irish experience,designed specifically to establish cause-effect relation-ships.
The trend is first considered in the context ofEuropean experience; we then turn our attention toreviewing, in turn, aspects of industrial and

150 C~RT x: IRISH PRICE INDt~X NUMBERS ANNUAL, z946.r965
Consum eP
130
120
100
9O
70
i60
’5 0 ’55 ’60 ’65~ource: Table z.

agricukural prices, and also to the price of services.The gain from the terms of trade is consideredwithin the framework of deflated national accounts.
The large quantity of primary analysis which
occupied us in the preparation of this paper involveda critical appraisal of some of the available indexnumbers; we do not, however, claim to be compre-hensive in our treatment of them.
TABLE 1: ANNUAL PRICE INDEXES, 1946-1965
Base: 1953 as IOO
National AccountsConsumer Wholesale Import Export (implicit) Indexes
Year Prices Prices Prices PricesExpenditure Fixed Capital
72"9 66.0 68"8 63"5 (a) (a)77"o 73 "4 81"6 67"2 78"4 82"979 "4 77"6 82"6 78"6 80"5 89-679"6 77"z 79’0 8o-1 79"9 88.88o.8 81.6 86"3 85"6 81"7 89-8
87.2 94"5 IO5"4 97"1 88"3 94.194"8 99"8 lO6"6 99"3 95 "5 lOO"399"8 I00"0 IOO’O I00"0 I00"0 IO0"O
IOI’I 98"6 lOO’7 98"4 lOO’6 98"8lO2"7 1oi.6 104"1 lO1"4 lO3.2 lO1"4
lO7"I lO3"1 lO6.1 95"9 lO6-2 lO7"3111"5 lO9"9 111"9 97"6 iio.6 I 12"0116"5 113"5 lO7’O IOl’I 114.8 II3"6116"5 113"5 lO4.7 I04"o 115"1 113"6II7"O 112"9 lO6.6 102"2 I15"7 115"8
120’2 114"7 lO7.7 lOI’O II8"4 119"8I25"3 I18"3 lO7.6 IOI’9 122"9 123"9128"4 119"8 lO9"4 103"9 125"7 126"3137"o I26"8 11o"4 109"8 I33"5 134"2143"9 131’6 112"9 I10"9 I39 14o
AgriculturalPrices
62"07I’278"578"882"3
90"593"6
I00"0
98"7lO3.1
93"599"8
IO2’5lO2"499"6
I00"0
lOI"7102"2
113"1117"7
Basic Sources:(a) Not available.(i) Economic Statistics,
(ii) Statistical Abstract (SA),(iii) National Income and Expenditure (NIE).
2. INTERNATIONAL ASPECTS
In 1965, compared with 1958, Ireland occupiedabout a middle position amongst European countriesas regards the rise in consumer prices--see Table 2.In the period 1948-1958 and again in 1958-1963 therise in Ireland was less than in the U.K.; and weshall hint at even larger issues. Since 1963 Irishprices have risen more steeply than British prices.
Our interest in Table 2 lies deeper than in itsformal showing. We want to try to answer thefollowing question: are Irish and British pricemovements in time alike? As a simple empirical toolwe have devised what we term the disparity index dwhich is given by
T x x100 It 2t
d=--f-~ ~- _ ~t=l 1 9,
where x1 and x ~ are the indexes for any two countries
in year t,-xI and-x a the means of the indexes over thewhole period. The raw data in Table 2 cannot, in ourview, validly be used for the construction of ourindex since, if a single year base other than 1953 wereused, different results would be obtained. Theformula used may be regarded as affording meansover the whole period. The Ireland-U.K. value is1.94. This value is compared with lO others (withU.K. as reference in each case) in three periods onthe last three lines of Table 2.
Over the whole period 1948-65 the U.K. disparityindex is lowest for Ireland, Sweden and Norway.Of the I I countries, price trends are closer to U.K.in the later period for 5 countries.
These resuks were sufficiently suggestive to makeit seem worthwhile to compute the disparity indexesfor groups of countries. The results are shown inTable 3.
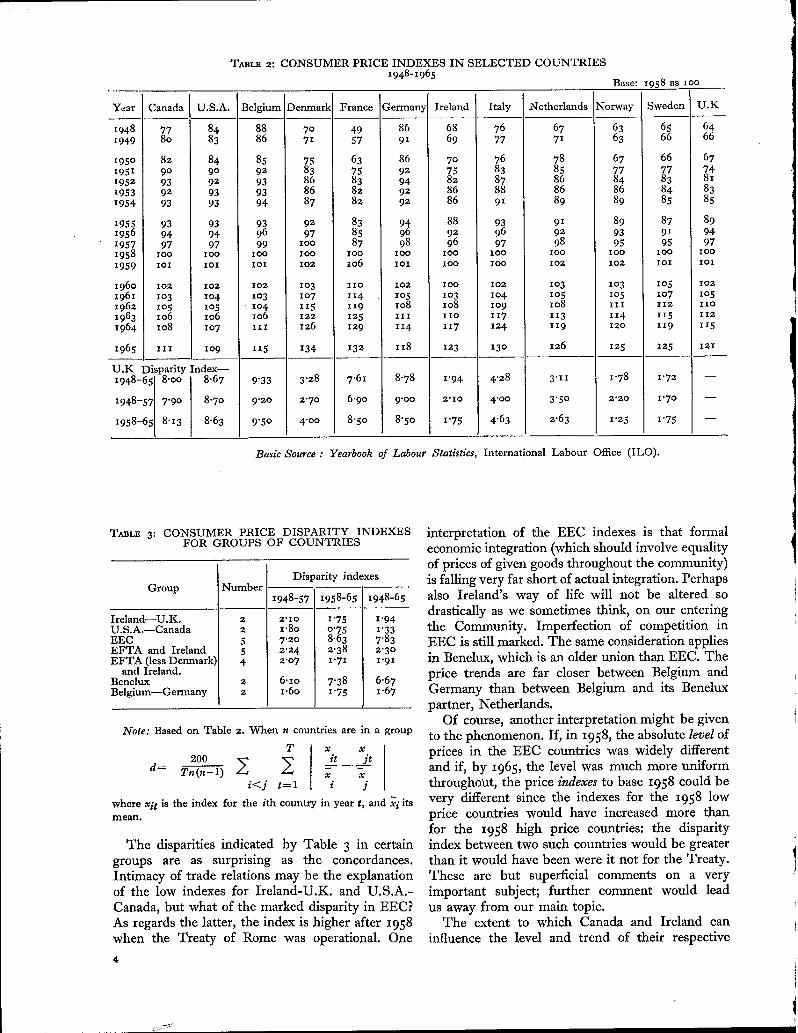
TABLE 2: CONSUMER PRICE INDEXES IN SELECTED COUNTRIES1948-1965
Base: 1958 as xoo
Year
1948I949
195o
19511952I953I954
I95519561957I9581959
196oI961196219631964
1965
U.K
Canada U.S.A. Belgium Denmark France Germany Ireland Italy Netherlands Norway Sweden U.K
77 84 88 7° 49 86 68 76 67 63 65 6480 83 86 7I 57 9I 69 77 7I 63 66 66
82 84 85 75 63 86 70 76 78 67 66 679° 9° 92 83 75 92 75 83 85 77 77 7493 92 93 86 83 94 82 87 86 84 83 8i
92 93 93 86 82 92 86 88 86 86 84 8393 93 94 87 82 92 86 91 89 89 85 85
93 93 93 92 83 94 88 93 91 89 87 8994 94 96 97 85 96 92 96 92 93 91 9497 97 99 1oo 87 98 96 97 98 95 95 97
ioo ioo ioo ioo ioo ioo ioo 1oo ioo ioo ioo iooioI ioi ioi Io2 io6 ioi ioo lOO io2 io2 ioi ioi
io2 lO2 lO2 Io3 IiO lO2 ioo io2 lO3 Io3 Io5 io2lO3 lO4 IO3 Io7 II4 lO5 lO3 Io4 io5 Io5 lO7 Io5Io5 lO5 ¯ lO4 115 119 1o8 lO8 io9 io8 ill ii2 iiolO6 lO6 lO6 122 125 iii iio I17 ii3 II4 Ii5 ii2lO8 lO7 ixr 126 129 II4 117 124 1I9 i2o II9 I15
IiI Io9 xi5 134 132 118 I23 13o 126 125 125 12I
Disparity
65 8-00
Index--8"67 9"33 3"28 7.61 8"78 I’94 4"28 3.ii 1 ’78 I’72
"57 7"9o 8.7° 9"20 2.7° 6.90 9"00 2"10 4"00 3"50 2"20 I’7°
~55 8"I3 8"63 9’50 4.00 8"50 8"50 x’75 4"63 2"63 I’25 I’75
1948-6
I948-5
I958-65
Basic Source : Yearbook of Labour Statistics, International Labour Office (ILO).
TABLE 3: CONSUMER PRICE DISPARITY INDEXESFOR GROUPS OF COUNTRIES
Group
Ireland--U.K.U.S.A.--CanadaEECEFTA and IrelandEFTA (less Denmark)
and Ireland.BeneluxBelgium--Germany
Disparity indexesNumber
1948-57
2 2"I02 1"8o5 7"205 2"244 2"07
2 6-1o2 I’60
I958-65
1"75o’758’632"38I"7I
7"381"75
1948-65
1"941"337"832"3°
1.91
6"67x’67
Note: Based on Table 2. When n countries are in a group
T x x200 it jt
i<j t=l i j
where xit is the index for the ith country in year t, and xi itsmean.
The disparities indicated by Table 3 in certaingroups are as surprising as the concordances.Intimacy of trade relations may be the explanationof the low indexes for Ireland-U.K. and U.S.A.-Canada, but what of the marked disparity in EEC?As regards the latter, the index is higher after 1958when the Treaty of Rome was operational. One
interpretation of the EEC indexes is that formaleconomic integration (which should involve equalityof prices of given goods throughout the community)is falling very far short of actual integration. Perhapsalso Ireland’s way of life will not be altered sodrastically as we sometimes think, on our enteringthe Community. Imperfection of competition inEEC is still marked. The same consideration appliesin Benelux, which is an older union than EEC. Theprice trends are far closer between Belgium andGermany than between Belgium and its Beneluxpartner, Netherlands.
Of course, another interpretation might be givento the phenomenon. If, in 1958, the absolute level ofprices in the EEC countries was widely differentand if, by 1965, the level was much more uniformthroughout, the price indexes to base 1958 coald bevery different since the indexes for the 1958 lowprice countries would have increased more thanfor the 1958 high price countries: the disparityindex between two such countries would be greaterthan it would have been were it not for the Treaty.These are but superficial comments on a veryimportant subject; further comment would leadus away from our main topic.
The extent to which Canada and Ireland caninfluence the level and trend of their respective

internal prices is closely circumscribed, dominated,as they are, by external conditions. NonethelessIreland should have regard to this margin betweenits internal price trend and those of its principaltrading partners, the U.K., of course, in particular.As shown in Table 2 the change-over from 2 pointsin our favour in each of the years 196o-63 to 2points against us in 1964-65 is to be deplored, asincreasing export costs, mainly through the influenceof the consumer price index on the money wagerate.
It might be thought that the disparities shown inTables 2 and 3 are partly due to statistical reasons.In our opinion this factor, undoubtedly present, hasbut a minor effect on the level of the respectiveindex numbers.
These brief paragraphs purport merely to shed alittle light on one aspect, albeit an important one, ofthe problem of Ireland’s adaptation to EECconditions, a general topic surely meriting fullinvestigation, based on the experience of othercountries now in the Community.
Our colleague, C. E. V. Leser, has helpfullysuggested an alternative approach to the measure-ment of price index concordance in time betweencountries. Instead of our disparity index, Leserproposed that we should use the coefficient ofcorrelation between pairs of countries applied to yearto year changes in the indexes, either as index pointsor as percentages: using changes in index points,r (i, j), the correlation coefficient between Axlt andAxit (where xit is the index for country i in year t,Axlt=xlt+i--xit would be the measure of disparityin price trends between countries i and j.
Generally the correlation approach yields resultsconsistent with those of the disparity index over thewhole period 1948-1965. As regards comparisonswith U.K. (Table 2, third last line), of the IIpossible comparisons 9 yield almost the samepicture (in particular as showing the indexes ofSweden, Ireland and Norway close to that of U.K.),France and Netherlands, with very low correlationcoefficients, being the two exceptions. As regardsother comparisons (Table 3, final column) the U.S.A.and Canada trends are seen to be extremely closewith a correlation of .92 (Ireland-U.K., .76). Thisanalysis reverses the rather surprising disparityindex showing of closeness of price trends betweenBelgium and Germany: the correlation coefficientis only "49, which is not exceptional.
Many other formulae for the disparity index areconceivable, but none could alter our essential pointthat the U.K. and Irish indexes are more alike intrend than is the case of most other pairs of countriesin Table 2.
The concordance between Irish-U.K. consumerprices shown in Table 2 merits closer examination.
In Chart 2 (Table AI) are displayed quarterlyindexes for the two countries starting with August1947. The correspondence is apparent, apart from amarked aberration in 1947-49. After 1949 there maybe said to be three phases in the comparison:--(i) 1949-1954, similarity, (ii) 1955-1963, similaritybut with U.K. figures more or less regularly higherthan Irish figures, (iii) 1964-65, close similarity.With regard to phase (ii), it is evident that the twoseries would be brought much closer together bymodernising the weighting diagram to, say, that of1958, instead of the actual 1953. The steeper risein Irish prices starting November 1963 is due partlyto the Turnover Tax. At any rate the Tax and, nodoubt, other causes have had the remarkable effectof rendering the indexes for the two countriesalmost identical (to base August 1953) during theperiod May 1964 to November 1965.
Neither index shows any real tendency to fallthroughout the period. There are discernible,however, "level periods" of more or less stableprices as follows (by reference to Ireland):--(i) August I947-August 195o, (ii) May 1953-November 1954, (iii) May I956-February 1957,(iv) August I958-August 196o, (v) May 1962-August 1963. Evidently another level was reachedin May 1965. On these levels, prices, as it were,have a breather and then take off again, usuallyhelped on their way by increased indirect taxation,as we shall see in the next section.
The similarities of the two graphs (for example,the near coincidence of the price pause periods) onChart 2 lead us to conclude tentatively that therehas been a marked concordance between the trendsin Irish and British consumer prices generally sinceabout 195o. This inference would be so important(answering, as it would, the question "Why areIrish prices rising?" by the affirmation "Mainlybecause British prices are rising") that we deem itprudent to submit the data to more intensiveexamination. It may be well to make the preliminaryobservation that the analysis has nothing to do withthe comparative level of prices in the two countriesat any given time (a problem studied by EdwardNevin9’) but only with price changes.
From now on we deal with the commonlogarithms of the indexes, in the first instancebecause we want to derive average quarter toquarter price changes in the two countries. Ineffect, we fit exponential curves to the raw data ofChart 2. In Charts 3 (A and B) the deviations of the
~The Irish Price Level: A Comparative Study, ERI PaperNo. 9, October I962:-- "For commodities which are producedin Ireland it appears to be true, more often than not, thatthe final price to the consumer is of the order of 8 per cent.higher than the price of the equivalent product to the Britishconsumer .... producers’ prices may be on average some ioper cent above the United Kingdom equivalent".

CHART 2: PRICE INDEXES~IN IRELAND AND U.K., QUARTERLY, z947-z966, BASE z953 AS zoo
Index 17o
160
t50
140
130
120
110
100
9O
80
Years ~47 ’48I I I I I I I I I : I I I I I I I I !
’49 ’50. ’51 ’52 ’53 ’54 ’55 156 ’57 :58 ’59 ’60 "61 ’62 "63 ’64 ’65 ’66
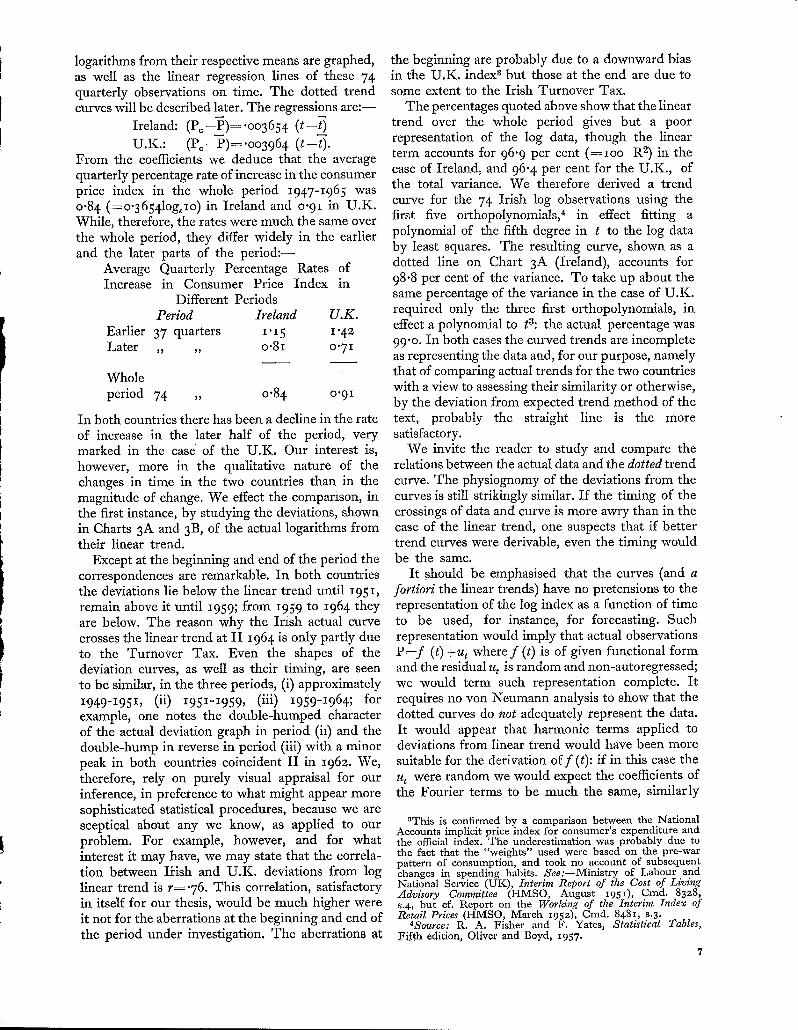
logarithms from their respective means are graphed,as well as the linear regression lines of these 74quarterly observations on time. The dotted trendcurves will be described later. The regressions are:--
Ireland: (Pc--P)--"°°3654 (t--~
U.K.: (Pc--P)=.oo3964 (t--t).From the coefficients we deduce that the averagequarterly percentage rate of increase in the consumerprice index in the whole period 1947-1965 waso.84 (=o.36541og~Io) in Ireland and o.91 in U.K.While, therefore, the rates were much the same overthe whole period, they differ widely in the earlierand the later parts of the period:-
Average Quarterly Percentage Rates ofIncrease in Consumer Price Index in
Different PeriodsPeriod Ireland U.K.
Earlier 37 quarters 1"15 1"42Later ,, ,, o.8i o.71
Wholeperiod 74 ,, 0"84 °"91
In both countries there has been a decline in the rateof increase in the later half of the period, verymarked in the case of the U.K. Our interest is,however, more in the qualitative nature of thechanges in time in the two countries than in themagnitude of change. We effect the comparison, inthe first instance, by studying the deviations, shownin Charts 3A and 3B, of the actual logarithms fromtheir linear trend.
Except at the beginning and end of the period thecorrespondences are remarkable. In both countriesthe deviations lie below the linear trend until 195 I,remain above it until 1959; from 1959 to 1964 theyare below. The reason why the Irish actual curvecrosses the linear trend at II 1964 is only partly dueto the Turnover Tax. Even the shapes of thedeviation curves, as well as their timing, are seento be similar, in the three periods, (i) approximately1949-1951, (ii) 1951-1959, (iii) 1959-1964; forexample, one notes the double-humped characterof the actual deviation graph in period (i0 and thedouble-hump in reverse in period (iii) with a minorpeak in both countries coincident II in 1962. We,therefore, rely on purely visual appraisal for ourinference, in preference to what might appear moresophisticated statistical procedures, because we aresceptical about any we know, as applied to ourproblem. For example, however, and for whatinterest it may have, we may state that the correla-tion between I~ish and U.K. deviations from loglinear trend is r=.76. This correlation, satisfactoryin itself for our thesis, would be much higher wereit not for the aberrations at the beginning and end ofthe period under investigation. The aberrations at
the beginning are probably due to a downward biasin the U.K. index~ but those at the end are due tosome extent to the Irish Turnover Tax.
The percentages quoted above show that the lineartrend over the whole period gives but a poorrepresentation of the log data, though the linearterm accounts for 96"9 per cent (= ioo R2) in thecase of Ireland, and 96.4 per cent for the U.K., ofthe total variance. We therefore derived a trendcurve for the 74 Irish log observations using thefirst five orthopolynomials,~ in effect fitting apolynomial of the fifth degree in t to the log databy least squares. The resulting curve, shown as adotted line on Chart 3A (Ireland), accounts for98.8 per cent of the variance. To take up about thesame percentage of the variance in the case of U.K.required only the three first orthopolynomials, ineffect a polynomial to ta: the actual percentage was99.o. In both cases the curved trends are incompleteas representing the data and, for our purpose, namelythat of comparing actual trends for the two countrieswith a view to assessing their similarity or otherwise,by the deviation from expected trend method of thetext, probably the straight line is the moresatisfactory.
We invite the reader to study and compare therelations between the actual data and the dotted trendcurve. The physiognomy of the deviations from thecurves is still strikingly similar. If the timing of thecrossings of data and curve is more awry than in thecase of the linear trend, one suspects that if bettertrend curves were derivable, even the timing wouldbe the same.
It .should be emphasised that the curves (and afortiori the linear trends) have no pretensions to therepresentation of the log index as a function of timeto be used, for instance, for forecasting. Suchrepresentation would imply that actual observationsP=f (t) +ut where f (t) is of given functional formand the residual ut is random and non-autoregressed;we would term such representation complete. Itrequires no yon Neumann analysis to show that thedotted curves do not adequately represent the data.It would appear that harmonic terms applied todeviations from linear trend would have been moresuitable for the derivation off (t): if in this case theut were random we would expect the coefficients ofthe Fourier terms to be much the same, similarly
aThis is confirmed by a comparison between the NationalAccounts implicit price index for consumer’s expenditure andthe official index. The underestimation was probably due tothe fact that the "weights" used were based on the pre-warpattern of consumption, and took no account of subsequentchanges in spending habits. See:--Ministry of Labour andNational Service (UK), Interbn Report of the Cost of LivingAdvisory Committee (HMSO, August i95i), Cmd. 8328,s.4, but cf. Report on the Working of the Interim Index ofRetail Prices (HMSO, March i952), Cmd. 848I, s.3.
4Source: R. A. Fisher and F. Yates, Statistical Tables,Fifth edition, Oliver and Boyd, I957.
7
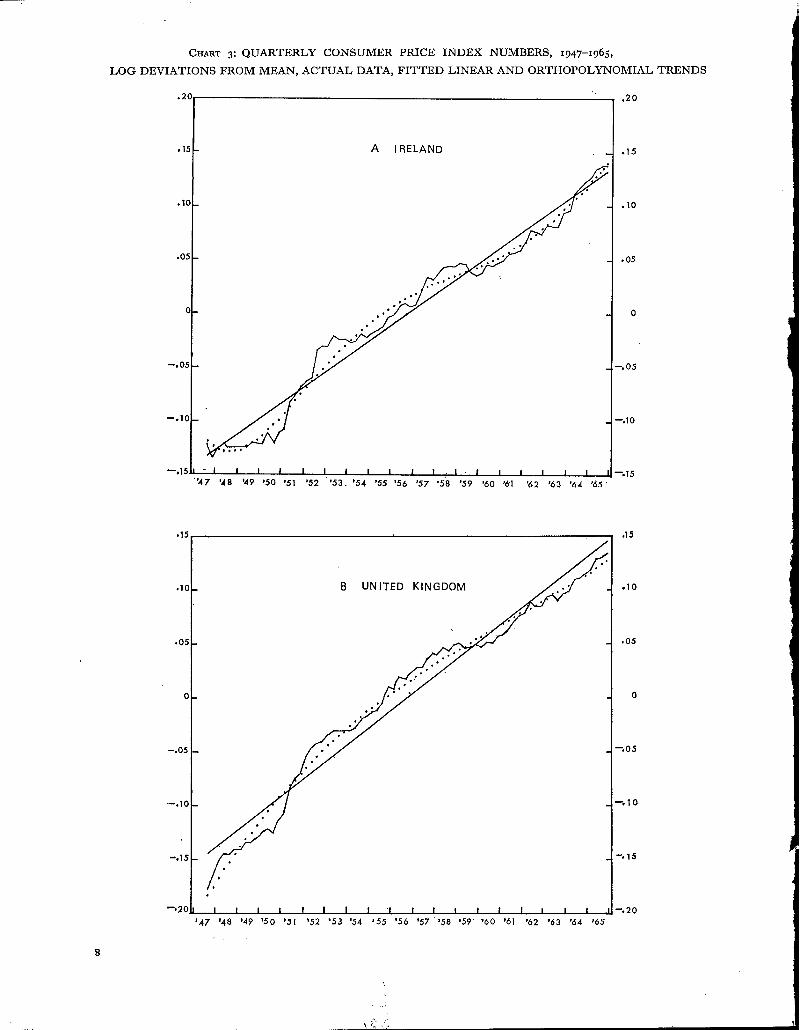
CHART 3: QUARTERLY CONSUMER PRICE INDEX NUMBERS, x947-I965,
LOG DEVIATIONS FROM MEAN, ACTUAL DATA, FITTED LINEAR AND ORTHOPOLYNOMIAL TRENDS
.]5 A IRELAND
¯ o5
¯ 15 ,15
.]c B UNITED KINGDOM. .lo
--,I0 10
-,15 15
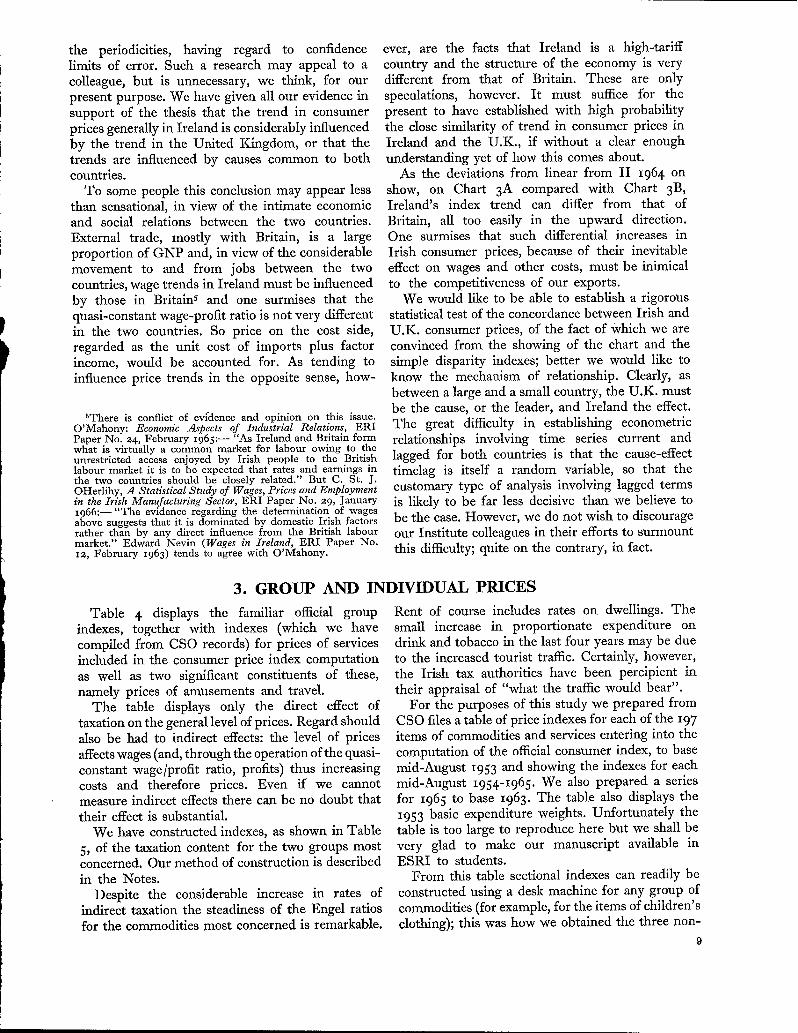
the periodicities, having regard to confidencelimits of error. Such a research may appeal to acolleague, but is unnecessary, we think, for ourpresent purpose. We have given all our evidence insupport of the thesis that the trend in consumerprices generally in Ireland is considerably influencedby the trend in the United Kingdom, or that thetrends are influenced by causes common to bothcountries.
To some people this conclusion may appear lessthan sensational, in view of the intimate economicand social relations between the two countries.External trade, mostly with Britain, is a largeproportion of GNP and, in view of the considerablemovement to and from jobs between the twocountries, wage trends in Ireland must be influencedby those in Britains and one surmises that thequasi-constant wage-profit ratio is not very differentill the two countries. So price on the cost side,regarded as the unit cost of imports plus factorincome, would be accounted for. As tending toinfluence price trends in the opposite sense, how-
~There is conflict of evidence and opinion on this issue.O’Mahony: Economic Aspects of Industrial Relations, ERIPaper No. 24, February 1965:-- "As Ireland and Britain formwhat is virtually a common market for labour owing to theunrestricted access enjoyed by Irish people to the Britishlabour market it is to be expected that rates and earnings inthe two countries should be closely related." But C. St. J.OHerlihy, A Statistical Study of Wages, Prices and Employmentin the Irish Manufacturing Sector, ERI Paper No. 29, January1966:--"The evidence regarding the determination of wagesabove suggests that it is dominated by domestic Irish factorsrather than by any direct influence from the British labourmarket." Edward Nevin (Wages in Ireland, ERI Paper No.I2, February 1963) tends to agree with O’Mahony.
ever, are the facts that Ireland is a high-tariffcountry and the structure of the economy is verydifferent from that of Britain. These are onlyspeculations, however. It must suffice for thepresent to have established with high probabilitythe close similarity of trend in consumer prices inIreland and the U.K., if without a clear enoughunderstanding yet of how this comes about.
As the deviations from linear from II 1964 onshow, on Chart 3A compared wittl Chart 3B,
Ireland’s index trend can differ from that ofBritain, all too easily in the upward direction.One surmises that such differential increases inIrish consumer prices, because of their inevitableeffect on wages and other costs, must be inimicalto the competitiveness of our exports.
We would like to be able to establish a rigorousstatistical test of the concordance between Irish andU.K. consumer prices, of the fact of Which we areconvinced from the showing of the chart and thesimple disparity indexes; better we would like toknow the mechanism of relationship. Clearly, asbetween a large and a small country, the U.K. mustbe the cause, or the leader, and Ireland the effect.The great difficulty in establishing econometricrelationships involving time series current andlagged for both countries is that the cause-effecttimelag is itself a random variable, so that thecustomary type of analysis involving lagged termsis likely to be far less decisive than we believe tobe the case. However, we do not wish to discourageour Institute colleagues in their efforts to surmountthis difficulty; quite on the contrary, in fact.
3. GROUP AND INDIVIDUAL PRICES
Table 4 displays the familiar official groupindexes, together with indexes (which we havecompiled from CSO records) for prices of servicesincluded in the consumer price index computationas well as two significant constituents of these,namely prices of amusements and travel.
The table displays only the direct effect oftaxation on the general level of prices. Regard shouldalso be had to indirect effects: the level of pricesaffects wages (and, through the operation of the quasi-constant wage/profit ratio, profits) thus increasingcosts and therefore prices. Even if we cannotmeasure indirect effects there can be no doubt thattheir effect is substantial.
We have constructed indexes, as shown in Table5, of the taxation content for the two groups mostconcerned. Our method of construction is describedin the Notes.
Despite the considerable increase in rates ofindirect taxation the steadiness of the Engel ratiosfor the commodities most concerned is remarkable.
Rent of course includes rates on dwellings. Thesmall increase in proportionate expenditure ondrink and tobacco in the last four years may be dueto the increased tourist traffic. Certainly, however,the Irish tax authorities have been percipient intheir appraisal of "what the traffic would bear".
For the purposes of this study we prepared fromCSO flies a table of price indexes for each of the 197items of commodities and services entering into thecomputation of the official consumer index, to basemid-August 1953 and showing the indexes for eachmid-August 1954-1965. We also prepared a seriesfor 1965 to base 1963. The table also displays the1953 basic expenditure weights. Unfortunately thetable is too large to reproduce here but we shall bevery glad to make our manuscript available inESRI to students.
From this table sectional indexes can readily beconstructed using a desk machine for any group ofcommodities (for example, for the items of children’sclothing); this was how we obtained the three non-
9

TABLE 4" COMMODITY GROUP CONSUMER PRICE INDEX NUMBERS. MID-AUGUST 1953 TO 1965Base: August I953 as ioo
I953Commodity Group expen- 1954 1955 1956 1957 1958 1959 196o 1961 1962 1963 I964 1965
diture
Food%
40’8 102"3 104’o 104"6 114’7 119"2 115"7 ii6"6 120"3 I23"I 123’2 134"7 I40’ZClothing and Footwear 12"7 I00"I 100"2 Io1"8 lO2.8 lO3’3 lO4"2 lO5"7 1o6’9 lO9"9 111"7 119"1 i21.8Fuel and Light 7.0 99"8 lO4’2 116"6 I2I’I 119"7 111"2 lO8.9 I14"9 I20"1 I24"O 132"4 132"3Housing 6"2 102"5 lO5"8 11o.9 115"2 117"5 119"8 123"5 127.6 133"1 139"o 147"2 156"4Sundries-- 33"3 99"9 101"2 III"5 116.1 118"4 119"9 I22"8 !125"7 135"1 136"8 151"1 I59"5
Drink and Tobacco 13"2 IO0"O IOO’I 112"7 119"2 121"9 123"1 I27"4 13o"9 144"9 145"2 i6i.5 174"2Consumer Durables 2"5 99"1 99"6 105"3 Io7"4 lO9"2 11o"5 III’0 II2"O 114"3 115"1 121"8 124"4Other Goods and
Services 17"6 ii0o’8 lO2"6 lO9"1 115"6 117’7 119"4 lZI’7 124"7 132"o 134"9 149"5 155"7Services lO’5 lO1"1 lO3"7 III’O 111"0 116"7 118"6 I22"I 124"1 132"9 136’9 152"6 158"6
Amusements 2.6 I04"I lO5"8 11o"5 112.6 115’o I15"3 116"9 118"3 i3o.o 137.1 151"2 157"oTravel 4"4 99"7 100"2 II3"I II9"I 121.4 I22"I 126"2 126"2 134"1 133"9 145"8 148"9
I-Total All Items~
inc. Drink andTobacco I00 IOI’I lO2.7 io7.8 I14"I 116"9 115"6 117"2 120"5 115"9 117"3 138"8 144"8excl. Drink andTobacco 86.8 IOI’2 io3.i lO7.O I13"4 116.1 114"4 115"6 118"9 123’o 124"6 135"3 14o.3
Basic Sources: Irish Trade �ournal and Statistical Bulletin ITff 6.SB), later Irish Statistical Bulletin (ISB).
official indexes in Table 4. Table 4 is as far as weconsider it necessary to go in the preparation of sub-indexes, which we may perhaps describe as"functional". We could, of course, have contemplatedthe construction of demand and supply relation-ships based, as regards final prices, on our data onsub-indexes and important individual commodities,analogous to the work of C. E. Y. Leser on cross-section datae; when these tasks are undertaken ourmanuscript table will be useful. For our presentpurpose it suffices to note that the prices ofindividual commodities (even of those whose pricescontain a large element of taxation) are those whichbuyers are prepared to pay and sellers to accept.The very wide range of price trend variation whichwe shall presently describe may be regarded there-fore as a social phenomenon. For example, we havenothing to add to the obvious explanation of thevery large increases in prices of education andprivate domestic service but that education isprobably largely a phenomenon of increased demand,and domestic service of reduced supply. Of course,many studies on these and other prices, by way ofexplanation, are conceivable.
We have little to say, therefore, on individualprices but we propose to deal instead with thepatterns of price changes in the "population" of197 items. In what follows we regard the 197 indexesas frequency distributions and analyse them as such.
Four distributions are shown in Table 6 and thecomputed constants of each in Table 7.
Subtables A and C of Table 6 show at a glancethe very considerable range of price changes in bothintervals 1953-1965 and 1963-1965. The most
eC. E. V. Leser, Demand Relationships for Ireland, ERIPaper No. 4, April 1962; and A Further Analysis of lrishIlousehold Budget Data~ ERI Paper No. 23, August 1964.
I0
remarkable showing of Table 7 is the manner inwhich the skewness of the distribution (measuredby %/b~-m8/mS/~2) is transformed from the highlysignificant 1.o9 and o.77 for the raw indexes to0.38 and o.o6 for the logarithmic distributions:actually for 1953-65 the logarithmic ~v/bl is signi-ficant7 of normal theory skewness at the .05
7For normal theory significant levels for ~/bl and a see:R. C. Geary and E. S. Pearson, "Tests of Normality" (Biome-trika Office, University College, London, 1938).
TABLE 5: INDEXES OF CERTAIN ITEMS OF INDIRECTTAXATION
Year
1953195419551956195719581959196o196119621963I9641965
Rates I
1
IOO
lO8"5114"7118"2129"3128"813o"7134"9138"6I43"2153"5161"8I78"6
Drink, [tobacco,
petrol
II00
99"299"2
114"6I2I"3121"6
121"6I29"1131’7142"9142"9I55"2172"2
Consumer prices(excl. housing,
drink, tobacco),Mid-August
IO0
IOl’l
Io2"9lO6"7113"3II6"O114"o115"O118"2122"2
123"5134"4I39"I
As % ofpersonal
expenditure
Drink,Rent tobacco
4 5
5"I 15"75"3 I5"25"2 I4"95"5 15’25"9 15’75"7 15’35’8 z5"45"6 15"35"7 15’25"6 16’25"7i 16’5
(5a~ I(a)16"2
(a) Not available.Notes:
Col. z: Basic Source: Returns of Local Taxation (RLT); theindex is a Laspeyres-type price index using 1953valuations as quantum-weights.
Col. 2: Basic Source: Revenue Commissioners’ Reports; theindex is a Laspeyres-type price index using 1953quantity weights. A separate index using 1958 weightswas also constructed, but showed no significantdivergence from the I953-weighted index.
Col. 3: Basic Source: IT:] &" SB, now ISB, and CSO files.Cols. 4-5: Basic Source: NIE: raw percentages for 1953-I957
slightly adjusted because of official revisions.
4
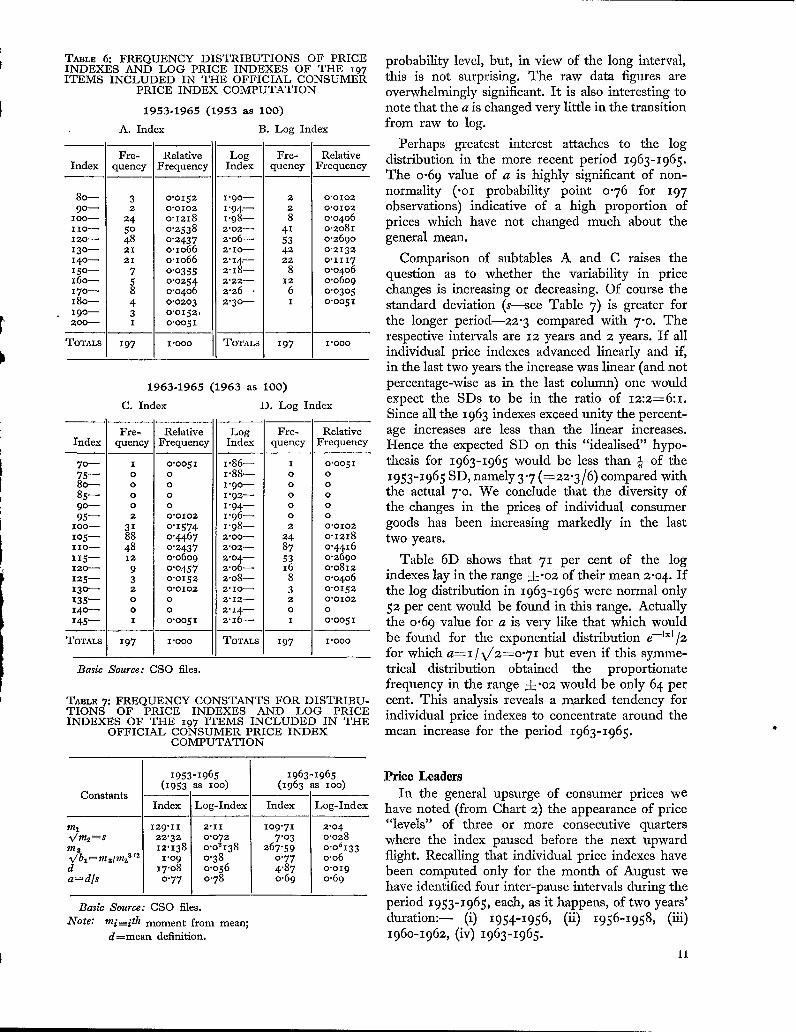
TABLE 6: FREQUENCY DISTRIBUTIONS OF PRICEINDEXES AND LOG PRICE INDEXES OF THE 197ITEMS INCLUDED IN THE OFFICIAL CONSUMER
PRICE INDEX COMPUTATION
1953.1965 (1953 as 100)
A. Index B. Log Index
Index
80--9°--
I O0----
II0--
120--
I3o--14o--15o--16o--I70--
18o--19o--200--
TOTALS
Fre- Relative iquency Frequency
3 ! o’o1522 0"0102
24 o’121850 0"253848 0"243721 o.Io6621 O.lO667 0"03555 0"02548 0"04064 0"02033 o"o152,I 0"005I
197 I.OOO
Lo~ IIndex I
l’qO-- I
I’O~-- I
I’O5-- I
2"O2.-- I
2"00-- I
2"10-- l
2"14--
2"18--2-’22--
2.26--2"3o~
TOTALS
i i
/Yre- Iquency I
2 I2
8 :415342228
12
6I
I97
RelativeFrequency
0"0102
0"0102
0’0406o.2o81o’269oo’2132
o’11170.0406o’o6o90"0305o.oo51
I’O00
Index
7°-
75--8o---85--9°_
95--TOO--
Io5--11o---II5--120--
I25--13o---135--I4o--I45--
TOTALS
1963.1965 (1963 as 100)
C. Index D. Log Index
Fre-
quency
I
0
00
0
2
318848I2
932
O
O
I
197
RelativeFrequency
o’oo51O
OO
O
0"0102
o"1574o’44670"24370.06090"0457o.o1520’0102
0
0
0’0051
I’O00
Log Fre-Index quency
I’86-- I1.88-- oI"9o-- o1"92~ oI"94-- o1"96-- o1"98-- 22"00-- 242"02-- 872"04-- 532"06-- i62.o8~ 82"10-- 32"I2-- 2
2"14-- o2.x6-- I
TOTALS 197
RelativeFrequency
o’oo51O
O
O
O
O
O’OIO2
o"I218
o’44160"269°0"0812
0.0406o’o152
0"0102
0
o"oo5I
I’O00
Basic Source: CSO files.
TABLE 7: FREQUENCY CONSTANTS FOR DISTRIBU-TIONS OF PRICE INDEXES AND LOG PRICEINDEXES OF THE 197 ITEMS INCLUDED IN THE
OFFICIAL CONSUMER PRICE INDEXCOMPUTATION
1953-1965 1963-1965(1953 as IOO) (I963 as IOO)
Constants ,I
Index Log-Index] Index Log-Index
vU1129"I1 2"II lO9"71 2"o4
~v/?n2 ~ s 22"32 0.072 7’03 o.o28~s 12"138 o’o8138 267"59 o.o8133a/bl=m31m S ,2 1"O9 0"38 0"77 0"06
d 17"o8 0"056 4.87 o"o19a=dls 0"77 0"78 0"69 o.69
Basic Source: CSO files.
Note: mi=ith moment from mean;
d=mean definition.
probability level, but, in view of the long interval,this is not surprising. The raw data figures areoverwhelmingly significant. It is also interesting tonote that the a is changed very little in the transitionfrom raw to log.
Perhaps greatest interest attaches to the logdistribution in the more recent period 1963-1965.
The o-69 value of a is highly significant of non-normality (.oi probability point o.76 for 197observations) indicative of a high proportion ofprices which have not changed much about thegeneral mean.
Comparison of subtables A and C raises thequestion as to whether the variability in pricechanges is increasing or decreasing. Of course thestandard deviation (s--see Table 7) is greater forthe longer period--z2"3 compared with 7.o. Therespective intervals are IZ years and 2 years. If allindividual price indexes advanced linearly and if,in the last two years the increase was linear (and notpercentage-wise as in the last column) one wouldexpect the SDs to be in the ratio of 12:2=6:1.Since all the 1963 indexes exceed unity the percent-age increases are less than the linear increases.Hence the expected SD on this "idealised" hypo-thesis for 1963-1965 would be less than @ of the1953-1965 SD, namely 3"7 (--22"3/6) compared withthe actual 7"o. We conclude that the diversity ofthe changes in the prices of individual consumergoods has been increasing markedly in the lasttwo years.
Table 6D shows that 71 per cent of the logindexes lay in the range 4-’o2 of their mean 2.o4. Ifthe log distribution in 1963-1965 were normal only52 per cent would be found in this range. Actuallythe o.69 value for a is very like that which wouldbe found for the exponential distribution e-Ixl/z
for which a=i/V’2----o.71 but even if this symme-trical distribution obtained the proportionatefrequency in the range +.o2 would be only 64 percent. This analysis reveals a marked tendency forindividual price indexes to concentrate around themean increase for the period 1963-1965.
Price LeadersIn the general upsurge of consumer prices we
have noted (from Chart 2) the appearance of price"levels" of three or more consecutive quarterswhere the index paused before the next upwardflight. Recalling that individual price indexes havebeen computed only for the month of August wehave identified four inter-pause intervals during theperiod 1953-1965, each, as it happens, of two years’duration:~ (i) 1954-1956, (ii) 1956-1958, (iii)196o-1962, (iv) 1963-1965.
11
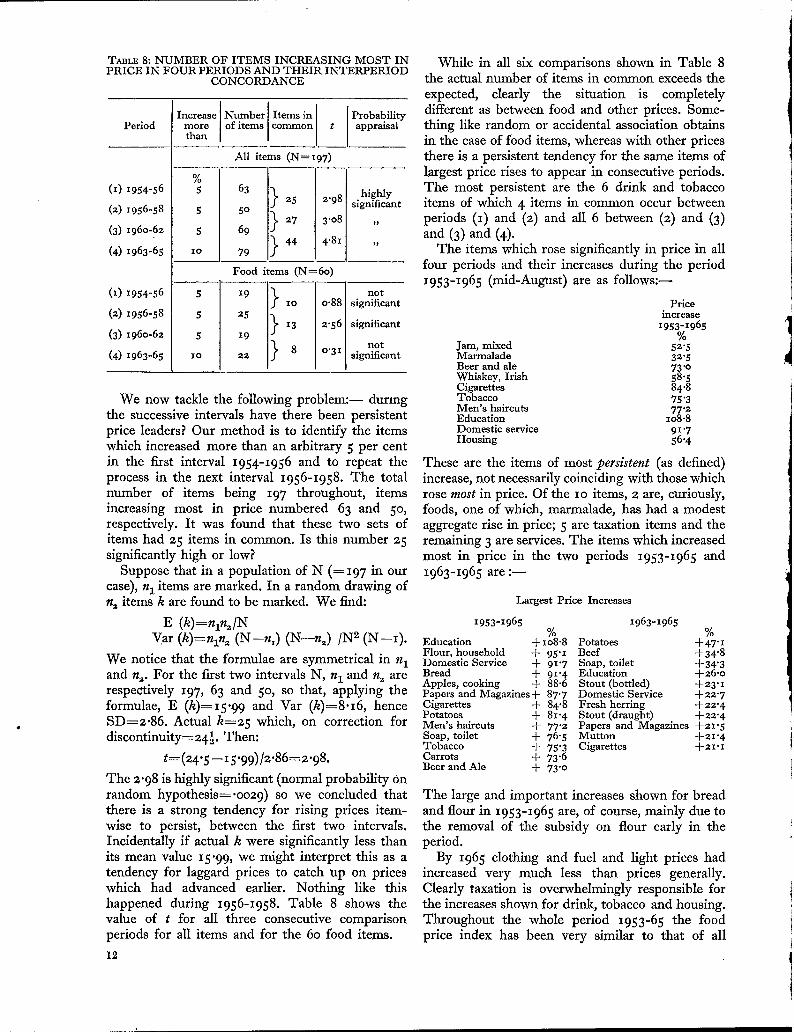
TABLE 8: NUMBER OF ITEMS INCREASING MOST INPRICE IN FOUR PERIODS AND THEIR INTERPERIOD
CONCORDANCE
PeriodNumber Items ,.’n ] [ Probability
IncreaSetnhOJne of items commont . appraisal .
All items (N=I97)
(I) 1954-561°/! 63
(2) 1956-58 50 i 25
27(3) I96O’62 69
44(4) 1963-65 lO 79
(1) 1954-56 5
(2) 1956-58 5
(3) 196o-62 5
(4) 1963-65 lO
highly2"98 significant
3"o8 ,,
4"81 ,,
Food items (N=6o)
io 0.88 significant25
I3 2"56 significant19
not22 8 o"31 significant
We now tackle the following problem:-- duringthe successive intervals have there been persistentprice leaders? Our method is to identify the itemswhich increased more than an arbitrary 5 per centin the first interval 1954-1956 and to repeat theprocess in the next interval 1956-1958. The totalnumber of items being 197 throughout, itemsincreasing most in price numbered 63 and 5°,respectively. It was found that these two sets ofitems had 25 items in common. Is this number 25significantly high or low?
Suppose that in a population of N (= I97 in ourcase), nI items are marked. In a random drawing ofn2 items k are found to be marked. We find:
E (k)=nln2/NVar (k)=nln2 (N--n~) (N--n2) /N2 (N--I).
We notice that the formulae are symmetrical in n1and n2. For the first two intervals N, n1 and n2 arerespectively 197, 63 and 5°, so that, applying theformulae, E (k)= 15"99 and Var (k)= 8.I 6, henceSD=2.86. Actual k=25 which, on correction fordiscontinuity=24{-. Then:
t=(24"5 --15"99)/2"86=2"98.
The 2.98 is highly significant (normal probability onrandom hypothesis=.oo29) so we concluded thatthere is a strong tendency for rising prices item-wise to persist, between the first two intervals.Incidentally if actual k were significantly less thanits mean value 15.99, we might interpret this as atendency for laggard prices to catch up on priceswhich had advanced earlier. Nothing like thishappened during 1956-1958. Table 8 shows thevalue of t for all three consecutive comparisonperiods for all items and for the 60 food items.
12
While in all six comparisons shown in Table 8the actual number of items in common exceeds theexpected, clearly the situation is completelydifferent as between food and other prices. Some-thing like random or accidental association obtainsin the case of food items, whereas with other pricesthere is a persistent tendency for the same items oflargest price rises to appear in consecutive periods.The most persistent are the 6 drink and tobaccoitems of which 4 items in common occur betweenperiods (i) and (2) and all 6 between (z) and (3)and (3) and (4).
The items which rose significantly in price in allfour periods and their increases during the period1953-1965 (mid-August) are as follows:--
Priceincrease
1953-I965%
Jam, mixed 52"5Marmalade 32"5Beer and ale 73’oWhiskey, Irish 58"5Cigarettes 84’8Tobacco 75 ’3Men’s haircuts 77"2Education IO8"8Domestic service 91 ’7Housing 56.4
These are the items of most persistent (as defined)increase, not necessarily coinciding with those whichrose most in price. Of the IO items, 2 are, curiously,foods, one of which, marmalade, has had a modestaggregate rise in price; 5 are taxation items and theremaining 3 are services. The items which increasedmost in price in the two periods 1953-1965 and1963-1965 are :--
Largest Price Increases
1953-1965 1963-1965% %
Education + lO8"8 Potatoes +47"1Flour, household + 95"1 Beef +34"8Domestic Service + 9I"7 Soap, toilet +34"3Bread + 91.4 Education +26.oApples, cooking + 88"6 Stout (bottled) +23"1Papers and Magazines+ 87"7 Domestic Service +22"7Cigarettes + 84"8 Fresh herring +22"4Potatoes + 8I’4 Stout (draught) + 22"4Men’s haircuts + 77"2 Papers and Magazines +2I"5Soap, toilet + 76.5 Mutton +21"4Tobacco + 75"3 Cigarettes +21"xCarrots + 73"6Beer and Ale + 73"o
The large and important increases shown for breadand flour in 1953-1965 are, of course, mainly due tothe removal of the subsidy on flour early in theperiod.
By 1965 clothing and fuel and light prices hadincreased very much less than prices generally.Clearly taxation is overwhelmingly responsible forthe increases shown for drink, tobacco and housing.Throughout the whole period 1953-65 the foodprice index has been very similar to that of all

prices, excluding drink and tobacco, though theweighting of food is less than 5° per cent--seefirst column of Table 4. As various aspects of pricesof services are fairly closely examined later, we note
here, from Table 4, simply that prices of serviceitems included in the official computation of theconsumer price index (see Table 4) have risen morethan prices generally.
4. INDUSTRIAL AND AGRICULTURAL PRICES
A considerable amount of official information isavailable with regard to value and volume of grossoutput of Irish industries. We are thus enabled toderive the implicit price index numbers (as P=V/Q)for many industries for several years past. We givethe value, volume and derived price data for trans-portable goods industries for the years 1953-1964in index number form, as an appendix (Table AS).The table is elaborate but we consider that it maywell be useful for further research in connectionwith the derivation of supply equations for industry,for example. As will appear, in the time available tous for a broad survey of prices, we have been ableto exploit only a few aspects analytically. In fact, thetable itself may well be our most useful contributionto this section of the paper.
Transportable Goods IndustriesIn the first instance we examine the relationship
between price and volume. Is increased price astimulus to increased volume, with enhancement ofprofit (the supply aspect), or is there an inverserelation between the two factors, which would tendto be the case on the demand hypothesis? Of course,we need not postulate any economic law in theinverse relationship case, but the human one that adesired level of profit is conceivable on high pricesand low output (with saving of effort and capital),or vice versa.
We give our data in Table 9. As will be seen, weconfine our analysis to the single span of years 1955-1963, 1955 because it was the year in which arecession of the economy set in, after a long periodof post-war growth, and 1963 as the last year forwhich all the industry data was available when wemade our analysis.
As regards price indexes P, of the 42 shown nofewer than 35 (or a proportion of 35/42=.83) liewithin the range m~s (actually 116.34-15.4----lOO.9 to 131.7). On the normal hypothesis theproportion would be only 68 per cent. The findingis therefore similar to that for consumer prices:were it not for a few industries the price increasein the period 1957-1963 would be appreciablylower.
We find rpQ=--.4° which, with 42 pairs ofobservations, is significant at the .oi probabilitylevel. The inverse relationship between price andquantum tends to be true, in a fairly pronounced
TABLE 9: PRICE (P) AND VOLUME (Q) INDEXES FORIRISH TRANSPORTABLE GOODS INDUSTRIES I963TO BASE 1955 AS IOO, AND PERCENTAGE OF GROSS
OUTPUT EXPORTED (E) IN 1963 FORMANUFACTURING INDUSTRIES"
IndustryNumber P Q E
1 2 3 4
I’I ... 113’5 I I4"4)I’2 ... lO7.3 i88.8~ (a)1"4 ... 115"1 157"o92"I’I ... lO6.8 I39"6 412"1"2 ... 115"4 249"5 922"1"4 ... IOI’I lO7.1 X2"1"8 ... 13o.9 146"5 II2"1"9 ... IO1"8 155"2 482"I"1o ... 111"4 128"7 O2"1’11 ... lO5"4 168"4 672’2"I ... lO5.2 141"3 142"2-,’2 ... 126"4 lO7"I 382"2,"3 ... 114"9 ilO"3 32"2"4 ... 125"2 II4"3 I2"3 ... 164.6 88.6 O3"I ... 98"2 n5"o 164"1 ... 115"4 188.2 134"2 ... lO4"1 182"8 I24"3 ... 113"o 199"o 44"4 ... IOI.3 145"7 175"1 ... 137"1 93"9 65"~. ... 127"3 15o’9 315"3 ... lO4.2 174"7 255"4 ... 114"1 137"5 45"5 ... 11o"3 162"2 I76"1 ... 111’7 141"6 666"2 ... 111"2 220.6 266"3 ... I01"0 144"3 2I7 ... lO5.2 144"7 178 ... 123"3 I37"I 149.i ... 113"4 118"1 o9"Z ... 115"5 205. i 149"3 ... lO9"4 143"7 49"4 ... lO4.O 221"6 OO’I ... 134"1 153"4 20
[I ... 118"2 174"9 i6[2"1 ... 132"6 12I’2 O12"2 ... 154"7 n7"7 5t2"3 ... lO4.1 3o8"7 2412"5 ... 157"1 59"7 O
2"I’6/7 ... 11o’6 I41 "3 183"2/3 ... lO9"5 134.o 3
(a) Not available.
Note: Table A5 is basic source of Cols. 2 and 3, which alsogives rubrics (Col. i). It is to be noted that the figures presentedin Table 9 differ slightly from those in Table A5. The latterincludes adjustments made subsequent to the first draft ofthis paper, and may be taken as representing July 1967estimates. Source Col. 4: Report on the Economic Situation1965, National Industrial and Economic Council (NIEC),Report No. II, Table 13.
way, in Ireland in recent years. We must be cautiousabout our test of significance, however, havingregard to the manner in which our data are derived:V, value, being given, P, price, is derived as P=
13
V[Q which we then correlate with Q. Now if Vand Q were two sets of positive quantities absolutelyrandom to one another, a negative correlation,devoid of meaning, would be found between Q andV[Q.8 This is not so with our data, since V and Q,value and quantity, are closely related. Also, theofficial Irish volume data are calculated by firstcomputing price on a year to year basis, using theFisher Ideal formula, and dividing the value indexby the price index so derived. Conceptually thisgives identically the same result as if year to yearvolume were computed directly, also using theIdeal formula; the price approach is used becauseof the statistical difficulty of dealing with theproducts for which quantities are not available. Insum, we do not think that our result is seriouslyaffected by this statistical mirage, and we regard theresult as significant. We would have wished tocarry out the same analysis on a year to year basisusing the data in the appendix table, thus increasingour number of pairs of observations from our 42to 462 (=II x42), thereby greatly improving thetest of significance of any correlation as well,perhaps, as showing a trend in time in the correla-tion, which, in general, reveals a somewhat unde-sirable state of affairs. The state of demand canscarcely be the causal factor for the inverse relation-ship, since, with the possibility of export, demandis quasi-infinite for Irish products efficientlyproduced and marketed. Our finding of this inverserelationship between price and quantum for industryis therefore similar to that suggested for agricultureon time series analysis. ~ As one possible reason itis suggested that what it may show is simply thecontraction of output as costs, and, therefore, pricesrise, and the good becomes less competitive withimports, and conversely.
As regards exports our analysis was necessarilyconfined to the 39 manufacturing industries--seeTable 9. We would expect exporting industries(i.e. industries which export an appreciable pro-portion of their gross output/ to have increased lessin price and to have increased more in volume ofoutput. This actually is what we find:--
rpQ~-----’40; rpE=--’25; rQEm-’38.
The first and third are statistically significant near(but less than) the .oi probability level (with37DF), while rpE can claim formally only some-thing like -I probability for significance. As far as
8R. C. Gear] and T. P. Linehan: "Paradoxes in StatisticalClassification", Studi in onore di Corrado Gini, Vol. I, Uni-versita degli Studi di Roma, i96o.
OR. C. Gcary: "Variability in Agricultural Statistics onSmall and Medium-sized Farms in an Irish County", yournalof the Statistical and Social Inquiry Society of Ireland, x956-57.See also: R. C. Geary, "Irish Economic Development Sincethe Treaty", Studies, December 1951, p. 41o.
it
this analysis goes (and it certainly does not go farenough on these issues of fundamental importance)it would appear that the inverse relationshipbetween price of gross output of manufacturingindustry and percentage exported is less emphaticthan one might have anticipated.
The partial correlation coefficients are as follows:
rpQ.E=--’34; rpE.Q~--’12; rQE.P=’32.
All the partial coefficients are appreciably lessemphatic than the corresponding simple coefficients,which showed fairly marked interaction between thethree phenomena measured. The first and third arestill significant (36DF) at the .o5 probability level,meaning that, as regards rpQ.E, when the exportpercentage is fixed there is still a significant inverserelation between prices and quantum output. Asto rpE.Q, the inverse relation between priceincrease and percentage exported is small, if itexists at all.
We do not see much point, at this stage, in tryingto establish a regression equation purporting toexplain the trend in industrial prices. For this,industrial price indexes for the U.K., as an additionalcolumn in Table i, would be required, since it ispossible that price trends in the U.K. are the maindeterminants of those in Ireland. We recommendthis analysis to other researchers as part of the yearto year approach referred to above.
An Aspect of Agricultural PricesWe propose to investigate one aspect only: the
trend in the terms of trade of the agriculturalindustry in recent years.
At first sight this trend appears to be unfavourable.Farmers sell agricultural produce and purchase:(i) materials (feedingstuffs etc.), (ii) householdgoods, (iii/ the services of paid agricultural workersand (iv) local government services (rates). In 1965(to base 1953 as lOO/ their selling price index was118 and, as regards purchases, (i/ the (general)consumers’ price index was 144, (ii) the minimumagricultural wage index was 197 and (as indicatedin section 3), (iii) the rates index was 179, mitigatedby (iv) the index for feedingstuffs, fertiliser(subsidised), seeds of 93. A weighted price indexfor expenses (excluding the proportionately heavyhousehold outgoings/ would appear to be substan-tially above the selling price index of 118 in 1965.Our task will be to refine and extend these priceindex numbers for their proper application tofarming and to provide terms of trade indexes forthe years 1953-1965.
In its customary sense terms of trade relate tothe country as a whole the terms of trade indexis the ratio (x lOO/ of the export price index to theimport price index. Our "country" here becomes
all the farms in the country, trading, as an unit,with the "rest of the world" (comprising the rest ofIreland and abroad). Intra-transactions of farmersare ignored. We have decided that paid agriculturalworkers should be regarded as outside the agricul-tural boundary, principally because their wagesrate seems to be determined by the scarcity of suchlabour and the climate of opinion affecting wagesgenerally, trade union pressure and the like. Weconfine our analysis to cash transactions, ignoringthe large subsistence element in Irish agriculture.We also ignore the considerable income of agricul-turists from non-agricultural activities (road work,income, especially in the West, of farm dwellerswho work in towns) and unearned income (income-type grants, emigrants’ remittances, etc.). Finally,saving, principally in the form of increase in live-stock, is left out of account.
With these qualifications the terms of trade indexis interpreted in quantum terms as follows: in thebase year (in our case 1953) ioo standard units ofagricultural produce were exchanged for IOO unitsof household and other products. If, in 1965, theterms of trade fell to 8o, 125 (= IOO~/8o) identicalunits of agricultural produce would have to beexchanged for the ioo units "imported" in 1953.
We display our results in Table io. The priceindex for farmers’ sales is quite straightforward: itis the official agricultural price index. Purchaseswere considered in 9 categories for weightingpurposes, the principal items being: (i) householdcash expenses, (ii) feed, fertiliser and seed, (iii)agricultural wages. The basic data for the calcula-tions are given in Appendix Table A3 and A4. Asto method, attention is directed to the notes to thesetables. Here it is necessary to emphasize thefollowing points:--
(i) A consumer price index had to beconstructed for farm households, in defaultof an official index, for which there is a realneed. This was done by eliminating potatoes,milk, eggs, and half the expenditure weightfor butter and rent from the official computa-tion.
(ii) Amounts of rates and annuities actually paidwere regarded as proportionately their ownprice index numbers.
(iii) Wage rates were the usual official averageminimum agricultural rates per week.
(iv) Rather arbitrary price indexes were used foritems of less importance. We are fortunatein having an official index for by far thelargest expense item, feed, fertiliser and seed.
(v) The purchase price indexes were calculatedon a year to year basis using the Fisher Idealformula. This greatly increased the volumeof computations as compared with using abase-weighted Laspeyres but it was felt thatthe latter might be unreliable in view of thefairly appreciable change in quantumweights over the 12 years.
(vi) Household cash expenditure, as a weight,was found as a residual. No allowance was,therefore, made for cash saving as a specificitem. Our treatment merely involves theassumption that the price index applicableto saving is the (agricultural) consumerprice index, a reasonable assumption.
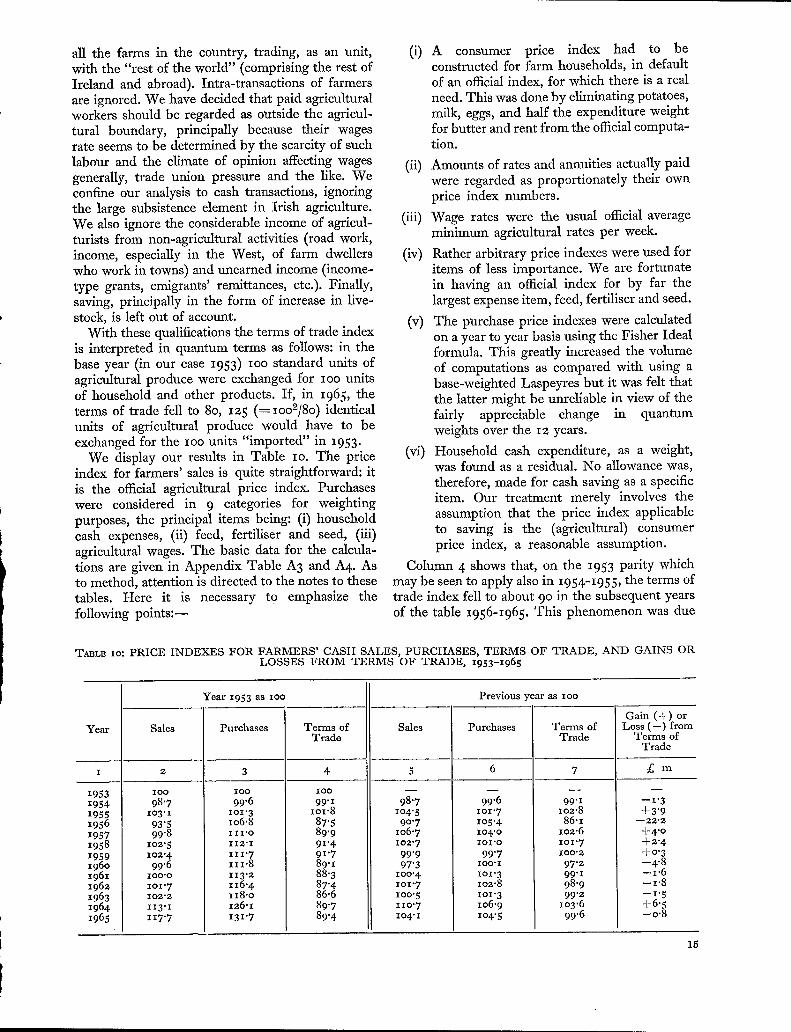
Column 4 shows that, on the i953 parity whichmay be seen to apply also in i954-1955, the terms oftrade index fell to about 9° in the subsequent yearsof the table I956-I965. This phenomenon was due
TABLE tO: PRICE INDEXES FOR FARMERS’ CASH SALES, PURCHASES, TERMS OF TRADE, AND GAINS ORLOSSES FROM TERMS OF TRADE, 1953-1965
Year 1953 as 1oo Previous year as lOO
Gain (+) orYear Sales Purchases Terms of Sales Purchases Terms of Loss (--) from
Trade Trade Terms ofTrade
1 2 3 4 5 6 7 £ m
1953 IO0 ioo IO0
1954 98"7 99.6 99"I 98"7 99"6 99"1 --1"31955 lO3"1 IOI’3 101"8 104"5 101"7
lO2"8 + 3"91956 93"5 106"8 87"5 90"7 lO5"4 86.1 --22.2
1957 99"8 III’O 89"9 IO6"7 lO4’O lO2.6 +4"0
1958 lO2"5 112"1 9I’4 IO2"7 IOI’O lO1"7 +2"4
1959 lO2"4 111"7 9I’7 99"9 99’7 lOO.2 +0"3196o 99"6 111"8 89"I 97"3 IO0"I 97"2 --4.8
1961 IO0"O 113"2 88"3 1OO"4 lOl.3 99"1 --1"6
1962 lOl "7 116"6 87"4 101"7 io2.8 98"9 --1"8
1963 102"2 II8"0 86"6 1OO"5 IOI’3 99"2 --1"5
1964 II3"I I26"I 89"7 11o’7 lO6"9 lO3"6 +6"51965 117"7 I3I"7 89"4 lO4"I IO4"5 99"6
[ --0"8
15
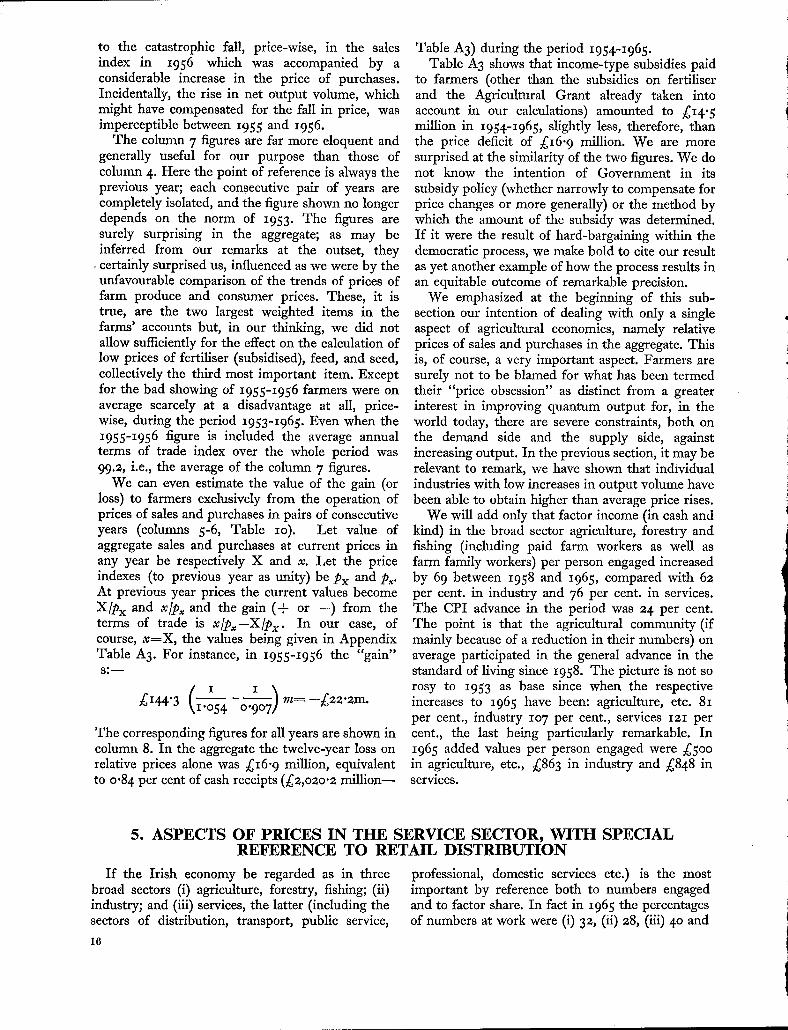
to the catastrophic fall, price-wise, in the salesindex in 1956 which was accompanied by aconsiderable increase in the price of purchases.Incidentally, the rise in net output volume, whichmight have compensated for the fall in price, wasimperceptible between 1955 and i956.
The column 7 figures are far more eloquent andgenerally useful for our purpose than those ofcolumn 4. Here the point of reference is always theprevious year; each consecutive pair of years arecompletely isolated, and the figure shown no longerdepends on the norm of i953. The figures aresurely surprising in the aggregate; as may beinferred from our remarks at the outset, theycertainly surprised us, influenced as we were by theunfavourable comparison of the trends of prices offarm produce and consumer prices. These, it istrue, are the two largest weighted items in thefarms’ accounts but, in our thinking, we did notallow sufficiently for the effect on the calculation oflow prices of fertiliser (subsidised), feed, and seed,collectively the third most important item. Exceptfor the bad showing of I955-i956 farmers were onaverage scarcely at a disadvantage at all, price-wise, during the period I953-i965. Even when the1955-I956 figure is included the average annualterms of trade index over the whole period was99.2, i.e., the average of the column 7 figures.
We Call even estimate the value of the gain (orloss) to farmers exclusively from the operation ofprices of sales and purchases in pairs of consecutiveyears (columns 5-6, Table IO). Let value ofaggregate sales and purchases at current prices inany year be respectively X and x. Let the priceindexes (to previous year as unity) be Px and Px.At previous year prices the current values becomeX/px and x]p~ and the gain (+ or --) from theterms of trade is x/p~--X]px. In our case, ofcourse, x-----X, the values being given in AppendixTable A3. For instance, in 1955-1956 the "gain"S’--
£144"3 O"m= --£22"2m.
The corresponding figures for all years are shown incolumn 8. In the aggregate the twelve-year loss onrelative prices alone was £16.9 million, equivalentto o.84 per cent of cash receipts (£2,o2o.2 million--
Table A3) during the period 1954-1965.Table A3 shows that income-type subsidies paid
to farmers (other than the subsidies on fertiliserand the Agricultural Grant already taken intoaccount in our calculations) amounted to £14.5million in i954-i965, slightly less, therefore, thanthe price deficit of £16.9 million. We are moresurprised at the similarity of the two figures. We donot know the intention of Government in itssubsidy policy (whether narrowly to compensate forprice changes or more generally) or the method bywhich the amount of the subsidy was determined.If it were the result of hard-bargaining within thedemocratic process, we make bold to cite our resultas yet another example of how the process results inan equitable outcome of remarkable precision.
We emphasized at the beginning of this sub-section our intention of dealing with only a singleaspect of agricultural economics, namely relativeprices of sales and purchases in the aggregate. Thisis, of course, a very important aspect. Farmers aresurely not to be blamed for what has been termedtheir "price obsession" as distinct from a greaterinterest in improving quantum output for, in theworld today, there are severe constraints, both onthe demand side and the supply side, againstincreasing output. In the previous section, it may berelevant to remark, we have shown that individualindustries with low increases in output volume havebeen able to obtain higher than average price rises.
We will add only that factor income (in cash andkind) in the broad sector agriculture, forestry andfishing (including paid farm workers as well asfarm family workers) per person engaged increasedby 69 between 1958 and 1965, compared with 62per cent. in industry and 76 per cent. in services.The CPI advance in the period was 24 per cent.The point is that the agricultural community (ifmainly because of a reduction in their numbers) onaverage participated in the general advance in thestandard of living since 1958. The picture is not sorosy to 1953 as base since when the respectiveincreases to 1965 have been: agriculture, etc. 81per cent., industry lO7 per cent., services 121 percent., the last being particularly remarkable. In1965 added values per person engaged were £5o0in agriculture, etc., £863 in industry and £848 inservices.
5. ASPECTS OF PRICES IN THE SERVICE SECTOR, WITH SPECIALREFERENCE TO RETAIL DISTRIBUTION
If the Irish economy be regarded as in threebroad sectors (i) agriculture, forestry, fishing; (ii)industry; and (iii) services, the latter (including thesectors of distribution, transport, public service,
16
professional, domestic services etc.) is the mostimportant by reference both to numbers engagedand to factor share. In fact in 1965 the percentagesof numbers at work were (i) 32, (ii) 28, (iii) 4o and
the percentages of factor income (i) 22, (ii) 32,(iii) 46. Consequently, no study on prices, or anyother economic aspect, with any pretension tobreadth of coverage, can disregard the great servicesector, as a whole and in its main parts.
It unfortunately happens, however, in this as inall other countries, that the relevant statisticsrelating to services are fewer than in the case ofagriculture and industry. There are obviousstatistical difficulties. How is one to quantify theservices of medicine, education or the public service,as a preliminary to pricing them? This problem hasjust begun to be studied in a few countries, U.S.A.in particular.
In our opinion there is, at any rate, no conceptualdifficulty; exactly as in the case of sectors producingmaterial goods, a service sector has an outputvalue, a non-factor input value and hence an addedvalue and this added current value V is factorisableinto price P and quantum Q; later we shall giveactual figures for the retail distribution sector.
We have tried to factorise the service sector as awhole(i.e. (iii) above)but our effort proved abortive.1°
In very broad outline our method was as follows:Official estimates are available for GNP at constantprices for a long term of years. From these,reasonably accurate estimates of volume of grossdomestic product (GDP) were obtained. Alsoavailable were value and volume of net agriculturaloutput from which price indexes were calculated;these price indexes were divided into the officialcurrent value for the sector (i) constituent to giveestimates of volume of added value for agriculture,forestry, fishing. Rather similarly, as regardsindustry, price indexes were obtained as the quotientof curren’ CIP net output value divided by theofficial volume indexes, which price indexes wereused as deflators of values in sector (ii). Volume insector (iii), services, was then obtained as a residual--the difference between volume GDP and the sumof the volumes of (i) and (ii).
The price indexes for sector (iii), obtained asthe quotient of current value by volume, did notappear to be satisfactory, from other evidence, sowe refrain from giving them here. In our view, theweak link was in our assumption that the officialCIP volume indexes, represented net (or addedvalue) volume indexes; actually they are grossvolumes for the individual industries weighted bybasic net outputs, but represent gross volume ofoulput rather than added value volume output.Especially during recent years, when industry hasbeen expanding and diversifying so rapidly, ourassumption is untenable; nothing less than a fulldouble deflation process, applied industry-wise to
1°We tackle this problem later (see Section 7) from anotherangle, showing some results,
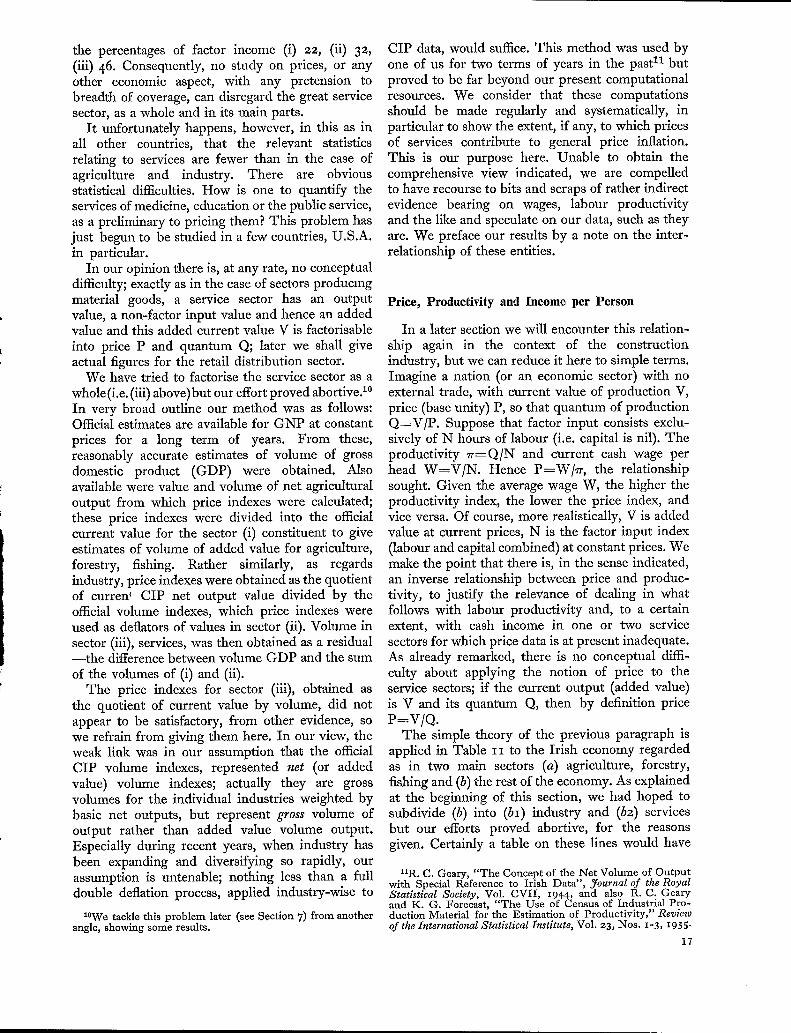
CIP data, would suffice. This method was used byone of us for two terms of years in the past11 butproved to be far beyond our present computationalresources. We consider that these computationsshould be made regularly and systematically, inparticular to show the extent, if any, to which pricesof services contribute to general price inflation.This is our purpose here. Unable to obtain thecomprehensive view indicated, we are compelledto have recourse to bits and scraps of rather indirectevidence bearing on wages, labour productivityand the like and speculate on our data, such as theyare. We preface our results by a note on the inter-relationship of these entities.
Price, Productivity and Income per Person
In a later section we will encounter this relation-ship again in the context of the constructionindustry, but we can reduce it here to simple terms.Imagine a nation (or an economic sector) with noexternal trade, with current value of production V,price (base unity) P, so that quantum of productionQ=V/P. Suppose that factor input consists exclu-sively of N hours of labour (i.e. capital is nil). Theproductivity ~=Q/N and current cash wage perhead W=V/N. Hence P~-W/~r, the relationshipsought. Given the average wage W, the higher theproductivity index, the lower the price index, andvice versa. Of course, more realistically, V is addedvalue at current prices, N is the factor input index(labour and capital combined) at constant prices. Wemake the point that there is, in the sense indicated,an inverse relationship between price and produc-tivity, to justify the relevance of dealing in whatfollows with labour productivity and, to a certainextent, with cash income in one or two servicesectors for which price data is at present inadequate.As already remarked, there is no conceptual diffi-culty about applying the notion of price to theservice sectors; if the current output (added value)is V and its quantum Q, then by definition priceP=V/Q.
The simple theory of the previous paragraph isapplied in Table i i to the Irish economy regardedas in two main sectors (a) agriculture, forestry,fishing and (b) the rest of the economy. As explainedat the beginning of this section, we had hoped tosubdivide (b) into (bi) industry and (b2) servicesbut our efforts proved abortive, for the reasonsgiven. Certainly a table on these lines would have
11R. C. Geary, "The Concept of the Net Volume of Outputwith Special Reference to Irish Data", Journal of the RoyalStatistical Society, Vol. CVII, x944, and also R. C. Gearyand K. G. Forecast, "The Use of Census of Industrial Pro-duction Material for the Estimation of Productivity," Reviewof the International Statistical Institute, Vol. 23, Nos. x-3, x955.
17
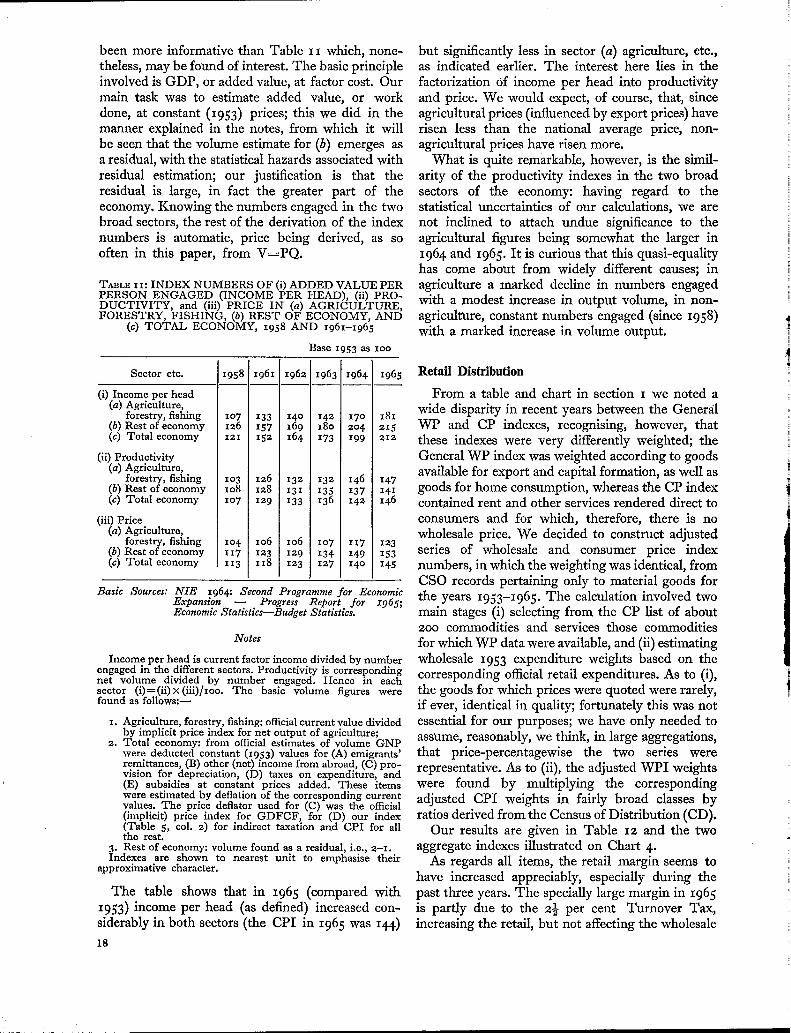
been more informative than Table x I which, none-theless, may be found of interest. The basic principleinvolved is GDP, or added value, at factor cost. Ourmain task was to estimate added value, or workdone, at constant (1953) prices; this we did in themanner explained in the notes, from which it willbe seen that the volume estimate for (b) emerges asa residual, with the statistical hazards associated withresidual estimation; our justification is that theresidual is large, in fact the greater part of theeconomy. Knowing the numbers engaged in the twobroad sectors, the rest of the derivation of the indexnumbers is automatic, price being derived, as sooften in this paper, from V=PQ.
TABLE I I: INDEX NUMBERS OF (i) ADDED VALUE PERPERSON ENGAGED (INCOME PER HEAD), (ii) PRO-DUCTIVITY, and (iii) PRICE IN (a) AGRICULTURE,FORESTRY, FISHING, (b) REST OF ECONOMY, AND
(c) TOTAL ECONOMY, I958 AND i961-1965
Base I953 as 1oo
Sector etc. x958 I961 x962 I963 I964 I965
i) Income per head(a) Agriculture,
forestry, fishing xo7 I33 14o I42 17° i8I(b) Rest of economy i26 I57 169 I8o 2o4 215(c) Total economy I2I 152 I64 I73 I99 212
ii) Productivity [(a) Agriculture, i
forestry, fishing ! Io3 I26 132 I32 I46 I47(b) Rest of economy io8 I28 131 135 I37 i4t(c) Total economy 1o7 129 I33 I36 I42 i46
[ii) Price(a) Agriculture,
forestry, fishing Io4 1o6 io6 lO7 IX7 i23(b) Rest of economy 117 x~3 129 I34 I49 i53(c) Total economy II3 II8 r23 I27 I4o 145
Basic ,~ources: NIE 1964: Second Programme for EconomicExpansion -- Progress Report for I965;Economic Statistics--Budget Statistics.
Notes
Income per head is current factor income divided by numberengaged in the different sectors. Productivity is correspondingnet volume divided by number engaged. Hence in eachsector (i)=(ii)x(iii)/ioo. The basic volume figures werefound as follows:--
I. Agriculture, forestry, fishing: official current value dividedby implicit price index for net output of agriculture;
2. Total economy: from official estimates of volume GNPwere deducted constant (1953) values for (A) emigrants’remittances, (B) other (net) income from abroad, (C) pro-vision for depreciation, (D) taxes on expenditure, and(E) subsidies at constant prices added. These itemswere estimated by deflation of the corresponding currentvalues. The price deflator used for (C) was the official(implicit) price index for GDFCF, for (D) our index(Table 5, col. 2) for indirect taxation and CPI for allthe rest.
3. Rest of economy: volume found as a residual, i.e., 2-1.Indexes are shown to nearest unit to emphasise their
approximative character.
The table shows that in 1965 (compared with1953) income per head (as defined) increased con-siderably in both sectors (the CPI in 1965 was 144)18
but significantly less in sector (a) agriculture, etc.,as indicated earlier. The interest here lies in thefactorization of income per head into productivityand price. We would expect, of course, that, sinceagricultural prices (influenced by export prices) haverisen less than the national average price, non-agricultural prices have risen more.
What is quite remarkable, however, is the simil-arity of the productivity indexes in the two broadsectors of the economy: having regard to thestatistical uncertainties of our calculations, we arenot inclined to attach undue significance to theagricultural figures being somewhat the larger in1964 and 1965. It is curious that this quasi-equalityhas come about from widely different causes; inagriculture a marked decline in numbers engagedwith a modest increase in output volume, in non-agriculture, constant numbers engaged (since I958)with a marked increase in volume output.
Retail Distribution
From a table and chart in section I we noted awide disparity in recent years between the GeneralWP and CP indexes, recognising, however, thatthese indexes were very differently weighted; theGeneral WP index was weighted according to goodsavailable for export and capital formation, as well asgoods for home consumption, whereas the CP indexcontained rent and other services rendered direct toconsumers and for which, therefore, there is nowholesale price. We decided to construct adjustedseries of wholesale and consumer price indexnumbers, in which the weighting was identical, fromCSO records pertaining only to material goods forthe years 1953-1965. The calculation involved twomain stages (i) selecting from the CP list of about200 commodities and services those commoditiesfor which WP data were available, and (ii) estimatingwholesale 1953 expenditure weights based on thecorresponding official retail expenditures. As to (i),the goods for which prices were quoted were rarely,if ever, identical in quality; fortunately this was notessential for our purposes; we have only needed toassume, reasonably, we think, in large aggregations,that price-percentagewise the two series wererepresentative. As to (ii), the adjusted WPI weightswere found by multiplying the correspondingadjusted CPI weights in fairly broad classes byratios derived from the Census of Distribution (CD).
Our results are given in Table 12 and the twoaggregate indexes illustrated on Chart 4.
As regards all items, the retail margin seems tohave increased appreciably, especially during thepast three years. The specially large margin in 1965is partly due to the 2½ per cent Turnover Tax,increasing the retail, but not affecting the wholesale

index. No significance should be attached to theirregularity of the margins; these are undoubtedlydue to statistical aberrations. The 1965 figure for allitems can be interpreted as follows. The retail priceindex (excluding the effect of the Turnover Tax)was I4o.9in I965 compared with io6.8 in 1956. Themark-up percentage (retail-wholesale margin as apercentage of selling value) in i956 was iS.i for allitems. Using the price index numbers it is easy toshow that this percentage advanced to I9.8 for allitems in 1965, on the trading pattern of i956, asignificant increase in (as we shall see) a very stableproportion.
As regards the groups the showing for i965 is byno means uniform. For three groups, (i) clothing andfootwear, (ii) consumer durables (when allowance ismade for Turnover Tax) and (iii) miscellaneousgoods, the wholesale index was greater than theretail. On the face of it this would indicate improvedefficiency of distribution in these groups. We are notinclined to draw such a firm inference, given thenature of our data and the fact that the wholesaleand retail sources are so very different. We are wellaware that our table, though onerous to prepare, isfar from being the last word on the subject. We give
our computations for what they are worth. Themethodology may be found to have some interestand an encouragement to others to pursue this aspectin the most important service sector.
A further effort at clarification is displayed inTable 13. Here we try to apply the double deflationmethod to retail distribution using CD with theadjusted CPI and WPI data described above. Wehad to confine this aspect of our inquiry to the fiveyears i956-i96o, the only recent period of con-secutive years for which CD data were available.
Row 6 of the table purports to represent thequantum of the service of retail distribution, on thebasis of 1953 prices. As the notes indicate, it is thedifference between the constant (1953) values ofsales and purchases. It is, in fact, the deflated valueof the row 3 values. These are not precisely whatthe theory requires, namely added value, since themargins include items like cost of containers andother non-factor charges in addition to employeecompensation and profit. However, they will serveour purpose since we are interested only in relativevalues. Our price deflators were derived from theadjusted CPI and WPI systems used in the prepara-tion of Table I2.
TABLE I2: CONCORDANCE BETWEEN ADJUSTED CONSUMER PRICE INDEX AND ADJUSTED GENERAL _WHOLESALE PRICE INDEX, MID-AUGUST, 1953-1965
Base: Mid-August 1953 as ioo
Group I953 1954 1955 1956 1957 I958 1959 196o 1961 I962 I963 1964 1965
Food:Wholesale IO0 lOO"4 lOO.6 lOO.3 II2"8 116.8 11o"9 Ill.4 116.6 116"8 116"1 127"1 I30"IRetail I00 lO1"7 lO3"6 IO4"4 115’5 II9"7 116"8 117"6 121"2 123"5 123"5 135"9 141"8
Clothing and Footwear:Wholesale I00 102"2 Io2"9 lO7"O lO9"5 111.8 I13"7 n4.6 118.o i2o.8 123"7 13o"2 132’2Retail I00 100"2 IOO.5 102"1 lO3"2 lO3"7 104"8 IO6"5 lO7"7 II0"8 112"7 120"1 122"9
Fuel and Light:Wholesale IO0 111"9 118-1 I25"9 129"7 102"2 97"9 95"3 lO3.2 102"7 112"4 115"8 117"4Retail IO0 99"7 lO6.6 123"2 127.6 125"5 11o"9 106"6 II5"O I21"8 129’I 14o’8 I4O"4
3undry items:Consumer Durables
Wholesale IO0 IOl’l I02"I lO4"6 108"4 112"0 112"9 113’6 II7"8 115"7 II8.O I22"5 122"2Retail I00 98"4 99"o lOl.6 io4.8 lO7"4 IO7"6 lO9"1 lO9.8 112"2 113.o I19"8 I22’2
Drink and Tobacco:Wholesale I00 99"2 99"o lO9’5 115"9 117"2 117"9 118.7 122’4 134"7 134"8 145"6 157"7Retail I00 I00"0 I00"I 112’7 II9.2 121.9 123"1 127"4 13o"9 I44"9 145"2 I6I’5 174"2
Miscellaneous Goods:Wholesale IO0 lOI"4 Io2"7 III’2 II3"3 113"8 123.8 125"8 128.o 132"I 136"8 I4I"9 149"3Retail I00 99"9 lOO.6 lO7.8 I1O’4 IIO’8 112.6 113"4 144"2 1121.2 122"1 131"5 135"2
total Sundry items:Wholesale 100 99"7 99"7 lO9"3 114.9 II6"4 118.2 II9"I 122’6 132.8 I33"7 143.2 153"8Retail IO0 99’9 100"0 lll’I 116.9 n9"3 120"5 124"1 127.o 139"2 I39"7 148"8 165"1
M1 Items:Wholesale I00 IOI’2 IOI’7 105"o 113"8 II5"I I i2.4 112"8 II7"6 12o.6 I2I"4 131.o I35"7Retail I00 Ioo"9 I02"4 io6.8 I14"6 117"5 115"5 II6’9 I20"2 122.6 I26"I I36"9 144"5
19

O
150
C~UU~T 4: ADJUSTED CONSUMER PRICE INDEX AND ADJUSTED WHOLESALE PRICE INDEX, IRELAND,z953-z965
140.
130
120
110
100
/ Reta i l!
/- /
/ Wholesale
i1
~
lll~"~
_
k--~-’l~ I I I I I I I I I I I
’53 ’54 "55 ’56 ’57 ’58 ’59 ’60 ’61 ’62 ’63 ’64 ’65

Having regard to the somewhat rough and readydata of the price systems in their present application(incidentally relating to the month of August andnot averages for the whole year, as would be desir-able) we were very agreeably surprised by the quiteremarkable concordance of the resulting implicitprice indexes for sales and purchases (rows 7 and 8);in the years 1957-196o they are almost identical. Atthe risk of looking a statistical gift horse in themouth we must confess that this result is somewhatfortuitous, a cancelling out in aggregate of errors inconstituents, for it is not borne out in each of the 14descriptions of business used in the calculation. Theexcellent concordance in the aggregate is what onemight expect as consistent with a practice of constantpercentage mark-up.
The outcome is the three last rows in the table:in 196o the price P of the service of distributionincreased by 5’4 per cent (compared with 1956)because margin per person W (row 13) increased bymore than productivity (row 14).
The rise in productivity in the retail distributionsector, while appreciable, was much less thanindustry:
Volume of Output per Person Engaged(I956 as IOO)
1956 1957 1958 I959 196oIndustry(transportablegoods) IOO lO3"3 IIO"3 I22.I I26.oRetaildistribution IOO 96.7 IOi.2 IO3.8 lO8.I
It is a great pity that CD particulars are notavailable after 196o, to chart the way during theconsiderable advance in the economy during the pastfew years in the important distribution sector. Thisdisparity, especially recently, between the identicallyweighted wholesale and retail price indexes (Table12) can leave little doubt about there having been anincrease in the retail mark-up percentage, in turndue to income per head in the sector having out-distanced productivity. Improved productivity is ofbenefit to the general public, in this or any othersector, only insofar as the improvement exceeds therise in added value per person engaged.
The practice of constant percentage mark-up is
TABLE I3: DERIVATION OF INDEXES OF MARGIN PER PERSON ENGAGED, PRODUCTIVITY, AND PRICEOF DISTRIBUTION FOR ALL RETAIL DISTRIBUTION, 1956-6o
I956 1957 I958 I959 i96o
,t current prices (£m)--I Sales and stock changes 244"3 243’7 255"0 26o.2 271"12 Purchases 200"0 200.5 209"7 213"6 221"63 Retail margin 44’3 43"z 45"3 46"6 49 "4
~t constant (1953) prices (£m)--4 Sales and stock changes 23I’I 216.2 22I’8 228"25 Purchases 235"4
191"1 177"6 181"86 Retail margin
187"1 192"740"3 38"6 40"0 4I’I 42"7
mplicit price index (1953 as 1oo)--7 Sales and stock changes IO5"68 Purchases
112"7 i15.o 114.o IIS"IIo4"6 II2’9 IxS"4 114"2 n5"o
9 Retail margin IO9"9 111"9io Persons engaged (ooo)113"o 113"3 II5"8
IIO’2 lO9"2 IO8"2 I08"4 lO8.O:etail margin per person engaged (£)--
11 Current prices12 Constant prices (1953 as ioo)
4o2 395 418 430 458366 354 370 379 395
adex numbers (I956 as lOO)13 Margin per person IO0 98"4 1o4.i 106"914 Productivity
113"9IO0 96"7 iol.2
15 Price103"8 lO8.1
IO0 IOI’8 lO2.8 lO3.1 I05"4
Basic Sources: CD and CP and WP records of CSO.
Notes: Rows i, 2, 3, lO: CDRow 4: From values for 14 descriptions of business deflated by appropriate price indexes from CP system.Row 5: From values for 14 descriptions of business deflated by appropriate price indexes from WP system.Row 6: Difference between 4 and 5.Row 7: Quotient (x 1oo) of I by 4.Row 8: Quotient (x lOO) of 2 by 5.Row 9: Quotient (x lOO) of 3 by 6.Row n: Quotient of 3 by IO.Row i2: Quotient of 6 by IO.Row 13: From I I.Row 14: From 12.Row 15: Quotient (x ioo) of I3 by 14.Calculations were made from figures with more digits than shown in the table.

confirmed in Table 13. For the five years 1956-I96Orow 3 (the retail margin) as a percentage of row x(sales) lies within the narrow range 17.8--18"2. Thislow percentage level of 18 shows that the scope forthe reduction (absolute or relative) in retail pricethrough improved efficiency in retail distribution islimited. The lack of data referring to more recentyears prevents any evaluation of the effects onproductivity of recent developments in retail trading(e.g. supermarkets, and bulk buying by retailgroups). From the comparative trends in retail andwholesale prices (Table I2) it appears that thepercentage mark-up has increased perceptibly inrecent years. It also appears that improved produc-tivity has resulted merely in improved income perhead for persons engaged in the sector. The publicinterest is not served thereby. Improved productiv-ity in any sector of the economy should be sharedamongst the general public by price reduction,absolute or relative.
Table 14 shows, for four broad groups ofdescriptions of business, the index numbers corre-sponding to those of the last three rows of Table 13,for the aggregate of all retail shops. We now see thatthe nice statistical regularity of the aggregate concealswidely disparate trends in the constituents. Thusthe modest rise in margin per person for all fourgroups--incidentally the only figure for whichofficial sanction can be claimed as it is the quotient,in index form, of the retail margin by numberengaged--factorizes quite differently between thegroups into productivity and price. In groups I andIlI productivity declined and the price of theservice increased; in groups II and IV the reversewas the case.
T.~LE 14: INDEX NUMBERS OF MARGIN PER PERSONENGAGED, PRODUCTIVITY, AND PRICE OF RETAILDISTRIBUTION IN FOUR GROUPS OF BUSINESSES,
x956-x96o
Group description ofbusiness
I Food, drink andtobacco--
Margin per personProductivityPrice
II Drapery andclothing--
Margin per personProductivityPrice
II Vehicles--Margin per personProductivityPHce
V Other businesses--Margin per person.ProductivityPrice
1956
IOOIOOIOO
IOOIooIOO
IOOIOOIOO
IOOIOOIOO
I957
98"594"304"4
98"805"094"z
oo.699"1
. oi’5
98"695 "403"3
I958
Io2"995"8
Io7.5
IOI’5II3"4
89"5
IO4"49I"3
IX4"3
io8.1io4"4io3.5
I959
Io3"x84"9
i2i.3
II0"8i23"o
90"I
Io7"99o’8
II8"8
II2"OI22"2
9I"6
I96O
iio.486.4
I27"7
117"2i29"190"8
ili"586"9
128"4
II8"5i29.6
91’4
Note: ,flee Notes to Table 13.
22
While Table 14 has its own measure of statisticalregularity, especially in the transition from year toyear, we are far from chiming a high degree ofvalidity for the figures themselves. We are scepticalabout the magnitude of changes between 1956 and196o in productivity in the groups, and hence in theprice index numbers, though we consider that thefindings of the preceding paragraph as regardsgroups I and III (and II and IV) are so emphaticthat (apart from the actual figures) they must betrue in general tenor. As already stated in connectionwith Table 12, the CPI and WPI systems used forconstructing deflating price index numbers comefrom sources divorced from one another and fromthe CD data. As is well known, such divorce isprone to cause statistical trouble.12
Elsewhere13 one of us analysed the reason whythe double deflation method is liable to yieldaberrant statistical results, in its application toindividual manufacturing industries. One of thesedifficulties was that if the margin (or net output)was small in relation to sales (or gross output), thissmall margin, a residue, had, on deflation of outputand input values, to bear the brunt of inevitableerrors in the deflating price indexes. This Irishexperience was confirmed in other countries. Theconsensus is that the double deflation method istheoretically sound but creates difficulties inpractice. We have gone a step further with themethod in trying to apply it realistically to the mostimportant service sector.
Ours, therefore, is not the last word on this topic,but nearly the first. Truth to say, at this stage, weare more interested in methodology, realisticallyapplied, than we are in actual results. We areconvinced, at any rate, that quantum (and thereforeprices) of services is an important and realisableconcept. We are also convinced that satisfactorystatistical results will not be forthcoming unless anduntil the data are analysed at the individual firmlevel, whether the firm be in industry or distribution,using its own data for sales, purchases, stock changes,and prices.
It is ironically true that, for all the emphasisnowadays on quantum product (and productivityderived from this), very few firms, here or else-where, have any notion about how it is to becalculated, except in the very short term whenproduct mix is homogeneous and structureunchanged between base and current periods. Suchcases are few, for change is of the essence ofeconomic advance.
XZThere is a statistical aphorism that statistics, purportingto relate to the same thing but coming from different sources,are different.
13R. C. Geary and K. G. Forecast, op. eit., footnote ix.
1

PRICES IN THE INPUT-OUTPUT CONTEXT WITH SPECIALREFERENCE TO SERVICES
Our object in the first part of this section is to
emphasize, if on theoretical grounds, the essential
importance of the input-output (I0) approach for
the assessment of the ukimate price effect (indirect
as well as direct) of price changes in primary inputs
(incomes, imports, etc.). If there are n industrial
sectors, m primary input factors (including imports)
then the basic pricing equations are
n n
(6.I) 2plal/+Zrrk/bk/=pi, j= I, . . ., n.$=I }=I
Here ali are the inter-industrial technical co-efficients, bk/the primary input coefficients in thebase year. Given these coefficients, the Pl and 7rki
are price index numbers (or percentage price
changes) of the gross outputs of the industries and
of the primary inputs respectively. Given the
industrial structure, equations (6.1) describe the
new equilibrium on a cost basis, consequent on
a change in prices. Any set of n variables from the
set (Pi, ~rk/) can be determined from (6.1) given the
aq, bki (i.e. the basic structure) as well as the values
of the rest of the set (Pc, ~%’)" The customaryproblem is to determine the n industrial gross
output prices, given the coefficients and the ~rky.
The input-output convention wiI1 be noted in (6.1);
the prices for the output of each industry are
the same whatever the purchasing industry, i.e.
as if the industry produced a single homogeneous
product. This assumption is not very realistic
because of product mix. However, if we interpret
our answers as average prices for the whole
producing industry we probably will not be
far wrong. In the base year the Pi and ~r/k are all
unity so that
(6.2) n n
ali + Z bk/= I.i=I k~l
These relations simply state that the sums of thecolumn coefficients are unity; In matrix form (6.1)may be written
(6.3) p’(I --A)=c’
where A is tile square matrix [ alj [ and c’ is the
TABLE 15: IRISH 196o INPUT-OUTPUT TABLE FOR THREE INDUSTRIAL GROUPS (IG).SUBSIDIZED PRODUCERS’ PRICES
VALUES AT
Values in £ million
"’"-~-Consumin IG
2 House-?roducing 3
holds
I 3 4 5
Agriculture, forestry,fishing 81.7 I’1 6I’2
Industry 23"2 206.7Services 3z’2 135"2
?rimary input:-Imports I19"8 7"9 61"O
Indirect taxation 49"3 9"2 31"9Minus subsidies ’3 --5"8 --6’7Employee compensa-
tion I I16"5 155"8Profit (incl. deprecia-
tion) i 5 50’8 89"5
Total input=output 197"8
Other
6
53’8186"91Ol.3
31.64.0
6"1
48"3
432"3
Final demand
Total
7
115"o393"6236"5
92"635"9
6.1
48"3
928"2
Output=input
8
197"8444"5279"9
235"6lO6.O
--19"9
295"5
311"1
Coefficients for IG
I --x 2 3
19110 11
1;1"o557 [ "o725
"o773 "2697¯ o584 [ "IIO8
--’o37oF’oI32
¯ o863 "2622
i "6192 "I72
"oo4I¯ 0827
"O28I
¯ o329--’o239
"5564
"3197
1
Coeffs.
forhouse-holds
i2
"I233"4168"2727
"I229"o643
Notes: This table is a synoptic version of the 196o Irish 36 X 36 table prepared by CSO and kindly made available to R.C.Geary for his lectures on IO in ESRI in 1965. These lectures, which incorporate the CSO table (as well as its inverse(I-A)-1), are available in mimeograph in the Institute for the use of graduate students. In these lectures the reserva-tions which CSO have made in regard to the table are emphasized.
The "other" final demand column is the aggregate of government expenditure, capital formation (fixed and stockchanges) and exports (visible and invisible).
For the above table transactions within each IG are eliminated; accordingly the output values shown are less than thetotal of the outputs of the constituent industries in the CSO table (considerably so in the case of IG 2). Also, thevalue figures shown above (to I decimal place) were prepared from the CSO table (to 3 decimal places) so that rowsand columns may not exactly add to the aggregates shown. The last 4 unitary columns were calculated from valuesto 3 decimal places,.
23
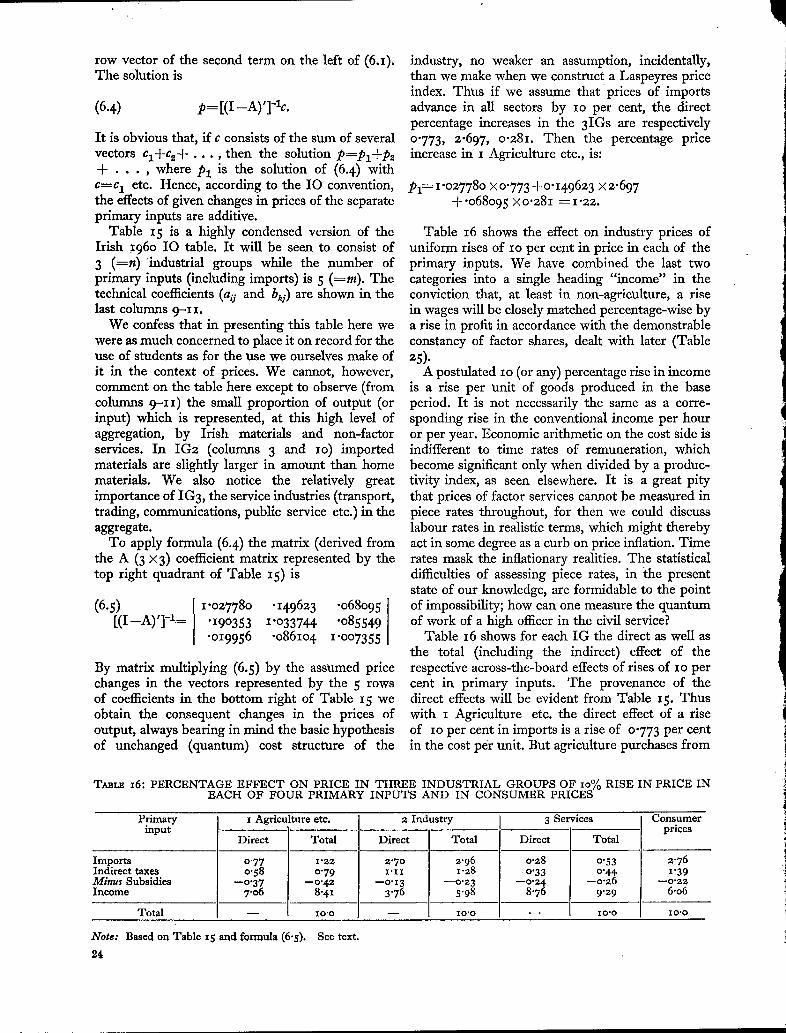
row vector of the second term on the left of (6.1).The solution is
(6.4) p=[(I --A)’]-~c.
It is obvious that, if c consists of the sum of severalvectors cl+c~+..., then the solution P=Pl+Pa+ . . . , where Pl is the solution of (6.4) withc=c1 etc. Hence, according to the IO convention,the effects of given changes in prices of the separateprimary inputs are additive.
Table 15 is a highly condensed version of theIrish I96O IO table. It will be seen to consist of
3 (--n) industrial groups while the number ofprimary inputs (including imports) is 5 (=m). Thetechnical coefficients (aq and bki) are shown in thelast colunms 9-1i.
We confess that in presenting this table here wewere as much concerned to place it on record for theuse of students as for the use we ourselves make ofit in the context of prices. We cannot, however,comment on the table here except to observe (fromcolumns 9-11) tile small proportion of output (orinput) which is represented, at this high level ofaggregation, by Irish materials and non-factorservices. In IG2 (columns 3 and io) importedmaterials are slightly larger in amount than homematerials. We also notice the relatively greatimportance of iG3, the service industries (transport,trading, communications, public service etc.) in theaggregate.
To apply formula (6.4) the matrix (derived fromthe A (3 ×3) coefficient matrix represented by thetop right quadrant of Table 15) is
(6.5)
]I’°2778° "I49623 "o68o95[
[(I--A)’]-~= ’I90353 1"o33744 "o85549¯ o19956 "o861o4 1"oo7355
By matrix multiplying (6.5) by the assumed pricechanges in the vectors represented by the 5 rowsof coefficients in the bottom right of Table 15 weobtain the consequent changes in the prices ofoutput, always bearing in mind the basic hypothesisof unchanged (quantum) cost structure of the
industry, no weaker an assumption, incidentally,than we make when we construct a Laspeyres priceindex. Thus if we assume that prices of importsadvance in all sectors by IO per cent, the directpercentage increases in the 3IGs are respectivelyo.773, 2.697, o.281. Then the percentage priceincrease in I Agriculture etc., is:
P1=I’O2778o ×0"773+0"149623 ×2"697+.o68o95 ×o.28I=1.22.
Table 16 shows the effect on industry prices ofuniform rises of IO per cent in price in each of theprimary inputs. We have combined the last twocategories into a single heading "income" in theconviction that, at least in non-agriculture, a risein wages will be closely matched percentage-wise bya rise in profit in accordance with the demonstrableconstancy of factor shares, dealt with later (Table25).
A postulated IO (or any) percentage rise in incomeis a rise per unit of goods produced in the baseperiod. It is not necessarily the same as a corre-sponding rise in the conventional income per houror per year. Economic arithmetic on the cost side isindifferent to time rates of remuneration, whichbecome significant only when divided by a produc-tivity index, as seen elsewhere. It is a great pitythat prices of factor services cannot be measured inpiece rates throughout, for then we could discusslabour rates in realistic terms, which might therebyact in some degree as a curb on price inflation. Timerates mask the inflationary realities. The statisticaldifficulties of assessing piece rates, in the presentstate of our knowledge, are formidable to the pointof impossibility; how can one measure the quantumof work of a high officer in the civil service?
Table 16 shows for each IG the direct as well asthe total (including the indirect) effect of therespective across-the-board effects of rises of IO percent in primary inputs. The provenance of thedirect effects will be evident from Table 15. Thuswith i Agriculture etc. the direct effect of a riseof IO per cent ill imports is a rise of o.773 per centin the cost per unit. But agriculture purchases from
TABLE 16: PERCENTAGE EFFECT ON PRICE IN THREE INDUSTRIAL GROUPS OF 1o% RISE IN PRICE INEACH OF FOUR PRIMARY INPUTS AND IN CONSUMER PRICES
Primaryinput
ImportsIndirect taxesMinus SubsidiesIncome
Total
I Agriculture etc. 2 Industry 3 Services Consumeri prices
Direct Total Direct Total Direct Total
0"77 I’22 ~’7o 2"96 0.28 0"53 z.760"58 0"79 I’II 1"28 o’33 o’44 1.39
--0’37 --0"42 --O’I3 --’0"23 --0"24 --0’26 --0’22
7"06 8"41 3"76 5"98 8"76 9"29 6.06
-- [ I0"0 IO’O -- IO’O IO’O
Note: Based on Table x5 and formula (6"5). See text.
24
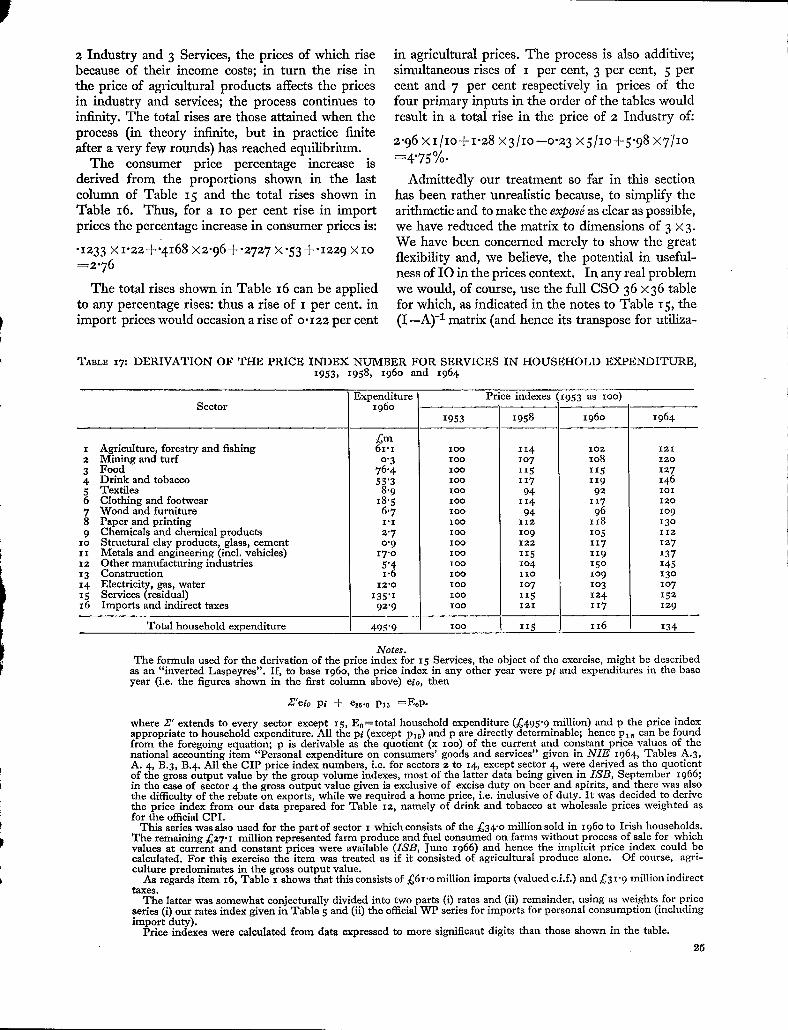
2 Industry and 3 Services, the prices of which risebecause of their income costs; in turn the rise inthe price of agricultural products affects the pricesin industry and services; the process continues toinfinity. The total rises are those attained when theprocess (in theory infinite, but in practice finiteafter a very few rounds) has reached equilibrium.
The consumer price percentage increase isderived from the proportions shown in the lastcolumn of Table 15 and the total rises shown inTable 16. Thus, for a IO per cent rise in importprices the percentage increase in consumer prices is:
¯ 1233 x 1"22+-4168 12"96+.2727 x’53 +’1229 × lO=2.76
The total rises shown in Table 16 can be appliedto any percentage rises: thus a rise of I per cent. inimport prices would occasion a rise of o.122 per cent
in agricultural prices. The process is also additive;simultaneous rises of I per cent, 3 per cent, 5 percent and 7 per cent respectively in prices of thefour primary inputs in the order of the tables wouldresult in a total rise in the price of 2 Industry of:
2.96 × i/lO+I.28 ×3/IO--O.23 ×5/zo+5.98 ×711o=4"75%.
Admittedly our treatment so far in this sectionhas been rather unrealistic because, to simplify thearithmetic and to make the exposd as clear as possible,we have reduced the matrix to dimensions of 3 × 3.We have been concerned merely to show the greatflexibility and, we believe, the potential in useful-ness of IO in the prices context. In any real problemwe would, of course, use the full CSO 36 ×36 tablefor which, as indicated in the notes to Table 15, the(I--A)-1 matrix (and hence its transpose for utiliza-
TABLE I7: DERIVATION OF THE PRICE INDEX NUMBER FOR SERVICES IN HOUSEHOLD EXPENDITURE,1953, z958, 196o and 1964
Expenditure Price indexes 1953 as ioo)Sector 196o
1953 1958 196o 1964
£m1 Agriculture, forestry and fishing 61.1 IO0 114 102 121
Mining and turf 0.3 IO0 lO7 1o8 12o3 Food 76"4 I00 n5 115 1274 Drink and tobacco 55’3 100 117 119 1465 Textiles 8"9 IO0 94 92 IOI6 Clothing and footwear 18"5 IO0 II4 117 1207 Wood and furniture 6’7 IO0 94 96 1098 Paper and printing I’I I00 112 118 1309 Chemicals and chemical products 2"7 100 Io9 1o5 iizo Structural clay products, glass, cement 0"9 IO0 IZ2 117 127I Metals and engineering (ind. vehicles) 17"o I00 115 I19 1372 Other manufacturing industries 5"4 I00 1o4 15o I453 Construction 1"6 I00 zxo lO9 13o4 Electricity, gas, water 12"0 IO0 lO7 lO3 lO75 Services (residual) 135"I IO0 115 124
Total household expenditure 495"9 I00 xI5 116 I"
1526 Imports and indirect taxes 92"9 IO0 121 117 129
134
Notes.The formula used for the derivation of the price index for 15 Services, the object of the exercise, might be described
as an "inverted Laspeyres". If, to base 196o, the price index in any other year were pl and expenditures in the baseyear (i.e. the figures shown in the first column above) elo, then
Z’elo Pl + ezs.o P*5 =E0p.
where Z" extends to every sector except 15, E0=total household expenditure (£495"9 million) and p the price indexappropriate to household expenditure. All the pl (except Pxs) and p are directly determinable; hence P15 can be foundfrom the foregoing equation; p is derivable as the quotient (x ioo) of the current and constant price values of thenational accounting item "Personal expenditure on consumers’ goods and services" given in ]VIE 1964, Tables A.3,A. 4, B.3, B.4. All the CIP price index numbers, i.e. for sectors 2 to 14, except sector 4, were derived as the quotientof the gross output value by the group volume indexes, most of the latter data being given in ISB, September 1966;in the ease of sector 4 the gross output value given is exclusive of excise duty on beer and spirits, and there was alsothe difficulty of the rebate on exports, while we required a home price, i.e. inclusive of duty. It was decided to derivethe price index from our data prepared for Table 12, namely of drink and tobacco at wholesale prices weighted asfor the official CPI.
This series was also used for the part of sector I which consists of the £34"0 million sold in 196o to Irish households.The remaining £27"I million represented farm produce and fuel consumed on farms without process of sale for whichvalues at current and constant prices were available (ISB, June 1966) and hence the implicit price index could becalculated. For this exercise the item was treated as if it consisted of agricultural produce alone. Of course, agri-culture predominates in the gross output value.
As regards item 16, Table I shows that this consists of £6x.omillion imports (valued c.i.f.) and £31"9 million indirecttaxes.
The latter was somewhat conjecturally divided into two parts (i) rates and (ii) remainder, using as weights for priceseries (i) our rates index given in Table 5 and (ii) the official WP series for imports for personal consumption (includingimport duty).
Price indexes were calculated from data expressed to more significant digits than those shown in the table.
25

tion by formula (6.5)) has been provided. It isobvious that for the methods indicated it is notnecessary to postulate uniform rises applying toevery row, as in the 3 × 3 treatment above.
It will be evident from Table 15 that the Irish IOtable is constructed, like most others, on theprinciple of sellers’ (as distinct from purchasers’)prices. For instance, in the row for I Agricultureetc., all the values are at agricultural etc. prices, therow (and column) total being the value of the grossoutput at farmers’ etc. prices. In particular this istrue of £61 million entered in the column forhousehold expenditure. But the column total of£496 million is the national accounting figure forhousehold expenditure at market prices. Hence thevery large figure for services, namely £135 million,in the column includes, indeed as a large constituent,the cost of distribution of the goods shown else-where in the column from the producer to theconsumer. Of course, the total also includes expendi-ture on services like education, amusements,professional, personal etc., sold without inter-mediary from the producer to the consumer.Usually this feature of the sellers’ price method isregarded as a disadvantage as applied to the house-hold expenditure column, for which it would appearmuch more natural to show item by item whatpurchasers actually paid--see Table 18. For us, onthe contrary, it had the advantage of enabling us toestimate, with some reasonable (but not exaggerated,as will appear) degree of confidence, the price trendin the aggregate of this great swathe of expenditureon services. It will be recalled (see Section 4) thatthis problem of pricing services defeated us when wetried to approach it through industrial shares ofGDP, for the reason that these shares were addedvalues and we lacked a reliable price index to deflateadded value in industry. The clue to our measure ofsuccess with household expenditure lies in thesebeing gross values (at a certain level of pricing) forwhich price indexes were estimable.
The method of derivation of the price indexesfor services is described at some length in the Notesto Table 17, which shows that the index was 152 in1964, to base 1953 as IOO. It will be observed thatthe weighting system shown in the first column of thetable is but an extended version of the "Households"column of Table 15, except for some slight adjust-ments in the decimal point to make the Table 17figures add. We are far from claiming a great degreeof statistical validity in the actual index of 152. Theprincipal objection is perhaps our implicit assump-tion that the sectoral price indexes, which relate tototal gross output, are applicable to householdsalone, an objection which, however, does not applyto the heavily weighted items I, 4 and 16; it may’have some relevance in the case of item 3. The point
26
is that if the price indexes were lower generality forsales to other Irish industries, exports, government,capital formation, they would be higher for sales tohouseholds. Such an upward bias generally would,admittedly, lower the services index, as calculated,given the price index for total household expendi-ture. While the latter was impeccably official, wemust have regard also to the difficulties of CSO inestablishing constant price estimates of service itemsin personal expenditure. Fortunately we are in aposition to derive the latter very readily fromNIE 1964. The results are shown in Table 18. Theindexes for other categories are shown as well.
TABLE 18: CALCULATION OF PRICE INDEXES OFPERSONAL EXPENDITURE AT PURCHASERS’
PRICES
Expen- Price IndexesCategory diture
in i96o 1958 x--~o i964
~m.Food, non-alcoholicbeverages 183"3 IO0 99 IIIAlcoholic beverages,tobacco 80"3 IO0 zoff 133Clothing, footwear,personal equipment 52"3 I00 ioz I14Fuel and power (exclu-ding motor spirit) 24.8 IO0 94 X00Durable household goods 23"o IO0 io2 113Transport equipment 13"9 IO0 fox 105Other goods 29"6 I00 lO3 I22Other expenditure 128"3 IO0 1o2 119Less expenditure by non-residents --39"7 ~IO0 --ioi --118
?otal Personal Expenditure 495"8 ioo IOI n6Bas~e Source: NIE i964.
It is impossible to reconcile statistically the 196oexpenditure column of Table 18 with column 5 ofTable I5, though we can do so qualitatively. Weobserve in the first plaee that total expenditure, at
£495"8 million, is the same; the itemised constituentsof the two columns are quite different. One of themain reasons is that the Table 18 figures (exceptthe last) include non-resident expenditure, includedas an invisible export in Column 6 of Table 15. Theshort-fall in Table 17 in the values for Sectors 1-53and for Sector 4, compared respectively with thefirst two items of expenditure in Table 18, emphas-izes the difference in principle of construction of thetwo sets of figures, those of Table 15 at producers’and Table 18 at purchasers’, i.e. retail, prices.
Our main concern is, however, with Item 8 ofTable 18 (predominantly "services" in content) andItem 15 of Table 17. It curiously happens that thetotals are quite similar (£128 and £135 million),which masks the fact that the respective contentsare drastically different. The Table 17 figureincludes all the value of the service of distribution,implicitly included in the retail price values ofItems !-7 of Table 18. Item 8, Table 18 includes the
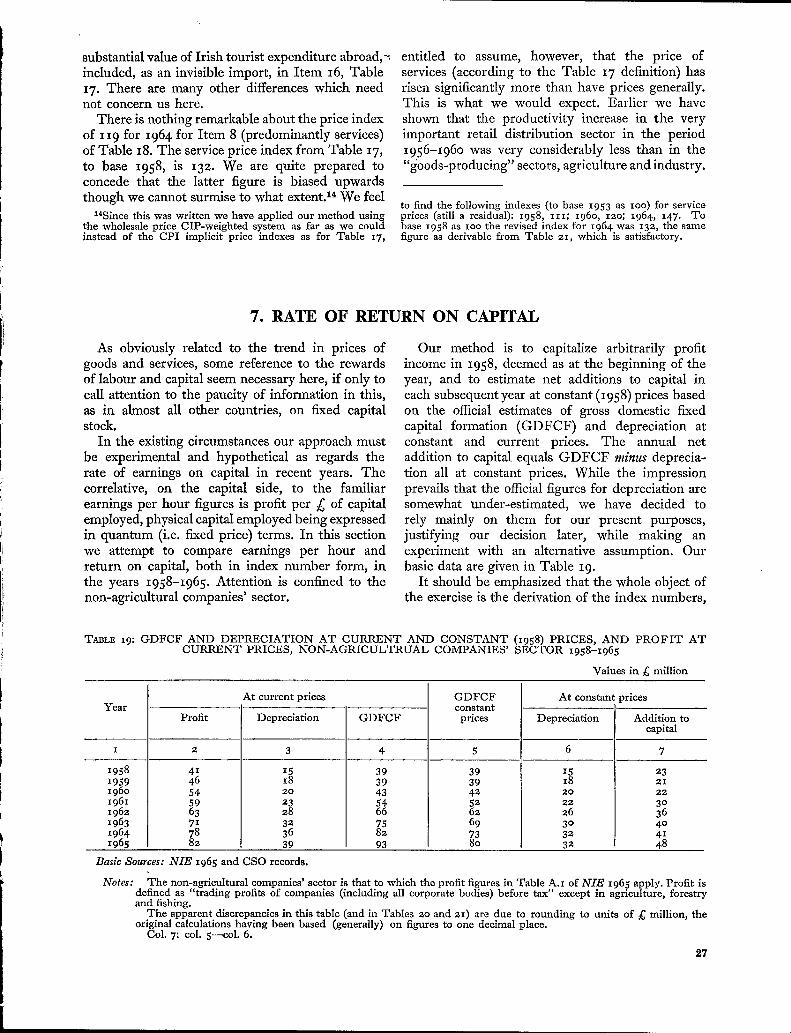
substantial value of Irish tourist expenditure abroad,included, as an invisible import, in Item 16, Table17. There are many other differences which neednot concern us here.
There is nothing remarkable about the price indexof 119 for 1964 for Item 8 (predominantly services)of Table 18. The service price index from Table 17,to base 1958, is 132. We are quite prepared toconcede that the latter figure is biased upwardsthough we cannot surmise to what extent.14 We feel
xaSince this was written we have applied our method usingthe wholesale price CIP-weighted system as far as we couldinstead of the CPI implicit price indexes as for Table 17,
entitled to assume, however, that the price ofservices (according to the Table 17 definition) hasrisen significantly more than have prices generally.This is what we would expect. Earlier we haveshown that the productivity increase in the veryimportant retail distribution sector in the period1956-196o was very considerably less than in the"goods-producing" sectors, agriculture and industry.
to find the following indexes (to base 1953 as lOO) for serviceprices (still a residual): 1958, iii; 196o, i2o; 1964, 147. Tobase 1958 as IOO the revised index for 1964 was 13z, the samefigure as derivable from Table 2I, which is satisfactory.
7. RATE OF RETURN ON CAPITAL
As obviously related to the trend in prices ofgoods and services, some reference to the rewardsof labour and capital seem necessary here, if only tocall attention to the paucity of information in this,as in almost all other countries, on fixed capitalstock.
In the existing circumstances our approach mustbe experimental and hypothetical as regards therate of earnings on capital in recent years. Thecorrelative, on the capital side, to the familiarearnings per hour figures is profit per £ of capitalemployed, physical capital employed being expressedin quantum (i.e. fixed price) terms. In this sectionwe attempt to compare earnings per hour andreturn on capital, both in index number form, inthe years 1958-1965. Attention is confined to thenon-agricultural companies’ sector.
Our method is to capitalize arbitrarily profitincome in 1958, deemed as at the beginning of theyear, and to estimate net additions to capital ineach subsequent year at constant (1958) prices basedon the official estimates of gross domestic fixedcapital formation (GDFCF) and depreciation atconstant and current prices. The annual netaddition to capital equals GDFCF minus deprecia-tion all at constant prices. While the impressionprevails that the official figures for depreciation aresomewhat under-estimated, we have decided torely mainly on them for our present purposes,justifying our decision later, while making anexperiment with an alternative assumption. Ourbasic data are given in Table 19.
It should be emphasized that the whole object ofthe exercise is the derivation of tile index numbers,
TABLE 19: GDFCF AND DEPRECIATION AT CURRENT AND CONSTANT (1958) PRICES, AND PROFIT ATCURRENT PRICES, NON-AGRICULTRUAL COMPANIES’ SECTOR 1958-1965
Values in £ million
At current prices GDFCF At constant pricesYear constant i
Profit Depreciation GDFCF prices Depreciation Addition tocapital
1 2 3 4 5 6 7
I958 41 15 39 39 15 231959 46 18 39 39 18 21196o 54 20 43 42 20 22
1961 59 23 54 52 22 301962 63 28 66 62 26 361963 71 32 75 69 3o 401964 78 36 82 73 32 411965 82 39 93 8o 32 48
Basic Sources: NIE 1965 and CSO records.
Notes: The non-agricultural companies’ sector is that to which the profit figures in Table A.I of ]VIE 1965 apply. Profit isdefined as "trading profits of companies (including all corporate bodies) before tax" except in agriculture, forestryand fishing.
The apparent discrepancies in this table (and in Tables 20 and 21) are due to rounding to units of £ million, theoriginal calculations having been based (generally) on figures to one decimal place.
CoL 7: col 5---col. 6.
97

TABLE 20: ESTIMATES OF CAPITAL (AT 1958 PRICES) ON TWO BASES, PROFIT AS PERCENTAGE OFCAPITAL AND INDEX NUMBERS THEREOF, NON-AGRICULTURAL COMPANIES’ SECTOR
1958-1965
Capital at beginning of Profit as percentage of Index (I962 as ioo) ofYear year, basis-- capital, basis-- profit rate, basis--
!
A B A B A B
I 2 3 4 5 6 7
£m j~m % %1958 4o6 5o8 1o 8 79 761959 429 53I lO.8 8"7 86 83I96o 450 552 12"O 9"8 95 931961 473 574 I’~’4 IO’2 98 971962 503 604 12"6 lO"5 I00 I00
1963 538 640 13"1 II’O lO4 lO51964 578 679 13’5 II’5 IO8 IIO
1965 619 720 I3"2 I1"4 IO5 lO9
Index (I962as zoo) of
earnings perhour in TG
industries (C)
75"578"183"889"7
IOO
Io4"6II5"I
12o.9
Notes: See Notes to Table I9.Col. 2: Profit (Table 19 col. 2) in I958 capitalized at io%, the A series figures for subsequent years found by adding entries
in col. 7, Table 19.Col. 3: As in col. 2, using capitalization rate of 8% in 1958, the B price.Col. 8: October 1958-1964, September 1965. SA 1965, Table 116 and CSO.
in columns 6-7 of Table 20 and column 7 of Table21. As will be seen from the note to Table 20, theseare derived from the initial capitalization in 1958of profit on two bases, (A) IO per cent and (B) 8 percent, these percentages being quite arbitrary.
It is notorious that the showing of an indexnumber depends largely on the year chosen as base.We have decided that 1962 is more suitable for ourpurposes than what might appear the more "normal"base, namely 1958. The latter year, while usuallyregarded as marking the beginning of the economicupsurge of recent years, was also the nadir of arecession starting in 1955 in which it is to bepresumed that profit was low. On the other hand(by reference to the annual trend of GNP at constantprices) 1962 was the year in which the economy hadrecovered to the point it would have reached hadthere been no recession in 1956.
The principal inference we draw from ourexercise is that despite the considerable differencein the assumed rates of initial capitalization, theeffect on the index numbers of profit rates (Table 20,columns 6-7) is relatively small: herein lies thejustification of the exercise. We also infer that thelower rate of capital assumed initially the steeperthe rise in profit rate.15 Incidentally, for nationalaccounting purposes, profit is defined as afterdepredation but before tax. The index numbers, intaking into account the great increase in fixedcapital stock since 1958, put a different picture onthe considerable increase in the amount of profit(Table 19, column 2) during the period. Thus in1962-1965 the rate of return increased by 7 per cent
XSThe view might be taken that our higher rate of io percent is still too low. An assumed higher rate would result in astill lower increase in the rate of return on capital.
9.8
(Table 20, column 6) while the amount of profitincreased by 3° per cent; in the period 1958-1965the respective increases were 32 per cent and lO2per cent. During the two intervals the rises inconsumer prices were respectively 15 per cent. and24 per cent. At least since 1962 the rate of returnon company capital cannot be said to be a majorcause of price inflation. Of course, the great increasein the amount of capital (GDFCF as percentage ofGNP, both at constant prices, 13 per cent in 1951,16 per cent in 1962, 19 per cent in 1965) may bea source of inflation.
As Chart 5 shows, the A gradient of increase inprofit rate was considerably greater during theperiod 1958-1961 than in the period 1962-1965.The increases in the earlier period must have actedas a stimulus to increased investment. It is significantthat, though 1965 was a year of deceleration in theeconomy, the profit rate continued to grow.
The chart also shows the marked contrast betweenthe rate of growth in hourly earnings in TGindustries (C, Table 2% column 8) and in rates ofreturn on capital (A or B). The movements of quantaof labour and capital were in the contrary direction(a small increase in the labour force and a largeincrease in capital) with the remarkable effect (aswe shall see later in this section) of near constancyin proportionate shares of total income.
The figures for capital given in Table 20, columns2-3, are not designed to be taken seriously. They arebut a means to an end, the index numbers shown incolumns 6-7, and the latter figures are to be regardedas having an impressionistic rather than an absolutesignificance. At the same time, the capital figuresshown in Table 2% column 2, when considered inrelation to the depreciation figures in Table 19,

CHART S: INDEX NUMBERS (BASE 1962 AS lOO)OFRATE OF RETURN ON CAPITAL ON TWO BASES (AAND B, TABLE 2o) AND HOURLY EARNINGS (C) INTG INDUSTRIES, 1958-i955
120!
110
100
9O
8O
7O
,...f <
,qis/
tJ/ ,,- .-
I I I i I I I I’58 ’59 ’60 ’61 %2 ’63 ’64 "65
Basic Source: Table 20, cols. 6-8.
column 7, have a certain plausibility--we shallcertainly make no higher claim for them. In Irelandin 1958 a depreciation rate of 3"7 per cent. (or anaverage asset lifetime of 27 years) was not unreason-able, having regard to the fact that fixed assetsinclude buildings (with a lifetime of 5O-lOO years)as well as plant and machinery (with a lifetime of
perhaps lO-25 years). We would also expect thedepreciation rate to increase in recent years (throughimproved capital-consciousness, attention to obsoles-cence, retooling, etc.): we note that in 1965 it hadadvanced to over 5 per cent.
12o While we prefer to use the official estimates fordepreciation for the present purposes, we werecurious to know how the indexes of profit rateswould be affected by using higher figures for
11 o depreciation in our calculations. Table 2I shows theresults, using a fixed annual depreciation rate of6 per cent. The calculations now become a littlecomplicated since, of course, a change in the amount
!oo of depreciation at current prices changes the profit
figure as well as the annual addition to capital. Weneed not enter into the details of the calculations,leaving the reader, if he wishes, to satisfy himself
9o from the table that they are consistent.
The increases in the profit rate index (Table 2i,column 7) are very similar to those of A and B from
so1962 on. In the period 1958-1962 the Table 21increases in the index are much steeper than thoseof Table 2o, thus confirming the finding that thegradient of increase in the profit rate has levelledoff somewhat compared with the earlier years.
70The marked difference in trend in the unitary cost
of labour and capital (see Chart 5) highlights theremarkable constancy during the period of theproportionate factor shares in the non-agriculturalsector shown in Table 22. It should be explainedthat the coverage of Table 22 is wider than that ofTables 19-21: unfortunately statistics of remunera-tion of employees were not available for thecompanies’ sector. This calculation involved theassumption that the sector income described asother than remuneratton of employees, was "profit"on capital though it contains remuneration of the
TABLE 21: ESTIMATES OF CAPITAL, PROFIT AND PROFIT RATE INDEX WITH DEPRECIATION TAKENAT 6% OF FIXED CAPITAL STOCK, ON THE BASIS OF PROFIT CAPITALIZATION AT lO% IN 1958. NON-
AGRICULTURAL COMPANIES’ SECTOR 1958-1955
Capital at At current prices Depreciation at Profit as Index (1962Year beginning of constant (1958) percentage of as IOO) of profit
year at constant Profit Depreciation prices capital rate(1958) prices
I 2 3 4 5 6 7
£m £m £m ~ITI %1958 350 35 2I 21 IO 681959 368 42 22 22 11"5 78I96o 385 5o 23 23 13"1 891961 404 57 25 24- 14-’1 95I962 432 64 28 26 14"8 IO0
1963 468 73 3o 28 15"5 lO5I964 5lo 79 35 31 15"6 io61965 552 82 39 33 14"9 xor
Notes: See Notes to Table I9. This table has been based on Table I9 on the principles of invariance of (i) gross profit (profit+ depreciation) at current prices and (ii) GDFCF at constant prices. Thus (allowing for rounding)
(i) cols. 3+ 4=cols. 2 +3, Table 19.(ii) A col 2 + col. 5=col. 5, Table 19.
29

T^BnE 22: "PROFIT" AS PERCENTAGE OF TOTAL FACTOR INCOME. NON-AGRICULTURAL SECTOR1958-1965
Profit basis 1958 1959 196o 1961 I 1962 1963 1964 I965 -
I 27"2 28"0 28"7 28"7 28"0 28"2 26"8II
27’524"5 25 "9 27’0 27"4 26"9 27"5 25’8 26"4
Notes:Profit basis I: "Other" as percentage of total factor income in sectors numbered 16-19 NIE I965, Table A2.Profit basis II: Same sector as I, but "profit" capitalized at xo % arid depreciation at 5 % capital stock.
self-employed as well as profit. It is not consideredthat the latter factor seriously vitiates the showingof the table, concerned, as we are, only with trends.
The quasi-constancy of the proportionate factorshares is the more striking when one considers thegreat increases in the two constituents of factorincome, namely employee compensation and profitduring the period. There is a considerable literatureon the question of the constancy of proportionatefactor shares, 16 and all that it implies. If one takes
XeSee thesis (in the Library of the Institute) of MaryBoland,M.A., formerly research scholar of ERI.
the position, even on empirical grounds (in the Irishcontext), of the inevitability of the ratio, one isprovided with an argument in favour of the validityof the official estimates for depreciation. In fact, inTable 22 the first row of percentages is based onthe official figures, the second on the assumption ofa 5 per cent depreciation rate. Both rows show littlevariation but the first row is more stable than thesecond, the coefficients of variation (ratio of standarddeviation to mean) being respectively o"o24 ando’o38. The second row percentages are thereforemore than 5° per cent morevariablethan the first row.
8. THE GENERAL PRICE LEVEL AND THE EXTERNAL TRADING GAIN
The Fundamental Identity at Current PricesThe-well known national accounting identity
income=product in current price terms has theadvantage that the terms "income" and "product"are indistinguishable and may be used inter-changeably. This is not necessarily, or even generally,the case when accounting entities are expressed atconstant prices. It is necessary to have regard tosome aspects of the controversial problem ofaccounting at constant prices because at the macro,as at the micro, level, prices and quanta are sointimately related that no price index has anyobjective meaning unless it can be envisaged as thedeflator of a current flow. This near truism does not,unfortunately, solve the methodological problem ofmaking price or volume index numbers: in theidentity PQ--V we know only V, except in the caseof single, well-defined products. To a certainextent, however, the fl0w concept does help con-ceptually in defining price index numbers.
It may be well to start with the income/productidentity at current prices in the given period, saya year:
(8.~) Y=C+I+X--M,
where Y is income, C consumption (governmentand private), I investment (fixed and stock changes),X exports, M imports. Exports and imports include
80
invisibles and are, in fact, as defined in the balanceof international payments. Income Y may be grossor net, depending on whether I includes or excludescapital consumption (i.e. depreciation); Y may beat factor cost or at market prices, depending onwhether C (and possibly I) have or have not beenpurged of indirect taxes less subsidies. On the latterpoint, when the identity is used in form (8.1)market prices are usually postulated. Identity (8. I) isentirely consistent and additive throughout theeconomy, when "exports" and "imports" aresuitably defined in regard to the sectors (in whateverdetail down even to the individual prod~/cer), while,of course, the elements of C and I, as final goods andservices, are directly additive. The fundamentalproperty enshrined in Y as defined by (8.1) is thattotal income is the sum of sectoral incomes.
Supply at Current and Constant PricesThe concept moves nearer to the kind of reality
contemplated for the constant price concept bywriting (8.1) as:
(8.2) Y+M=C+I+X.
Each side represents the value at current prices ofgoods and services available in the economy whichmay be termed the supply; the left side describeshow this value was formed, namely by the applica-
tion of the services of manufacture, distribution,transport etc., the skills of the nation (given capitalstock and natural resources), total Y, to imports M.The right side describes how the goods and serviceswere distributed in the three categories specified.
It is only in a special sense that one can speak ofsupply as being equal to (i) home production plus(ii) imports as distinguishable entities since Y in(8.2) is "home production" only by definition; it isnot, in general, "production" in the sense of avisible complex of goods and services (and there-fore price-deflatable) except in the trivial case ofM-----o~7; it is only the combination of the factorservices of Y combined with imports M whichproduce usable goods and services; the two con-stituents are, in general, indistinguishable in anytangible good or service; on the other hand, thethree constituents on the right of (8.2) are each thesum of individual goods and services which canunambiguously be deflated to give a value atconstant prices. The value at constant prices (i.e. theprices of the individual goods and services in somebase year) of the aggregate availabilities is
(8.3) C’+I’+X’,
where primes indicate constant price values of therespective entities. It will be noted that the constantprice version of availabilities can be obtained only inthis way. It cannot be derived from the left side of(8.2). This fact marks a fundamental differencebetween the current and constant price concepts; inthe current case each of the five macro elementsspecified at (8.2) is separately estimable and ifthere be a discrepancy between the two sides of (8.2)it is merely statistical, an aggregate of errors ofestimation.
Net Investment Abroad and the Trading GainIn the constant price case it is necessary to have
recourse to definition. Define national product
(8.4) Y’:C’+I’-kX’--M’,
where
(84) c’=c/pc ; I’ =I/pz ;x’=X]px; M’~-M]pM,
with the p’s the appropriate price indexes, unity inthe base year. If one requires the price index ofnational product it is derived as
(8.6) py=Y/Y’.
lTIn the non-financial sense; when net external financialclaims are conceptually admissible the situation is different:see later.
The practice sometimes adopted in the past ofestimating Y’ by deflating Y by some generalpurposes index like that of wholesale prices, con-sumer prices etc., was simply incorrect.
The economic purist is wont to point out that thewhole concept of values of individual flows, anda fortiori the concept of accounts at constant prices,is a fiction, that the only reality is the set of currentvalues. This is correct up to a point. A situation inwhich between base and current periods the priceof each and every commodity remained unchangedis simply inconceivable, even if, in a sense, priceson average were unchanged. He is right in pointingout that quantities demanded are related to relativeprices and that, for all its theoretical elegance, theindifference curve (or surface) analysis associatedwith the names of Kontis, Staehle etc., is notoperational. The empiricist’s reply is that in asituation of generally rising or falling prices there isa challenge, and indeed a public demand, to measureon average the rise or fall, however he does it; thatprice and quantity have a meaning in the case of theindividual commodity; that it usually does notmatter much what formula for measurement is used.
These considerations apply to formula (8.4). Itseems in the highest degree desirable to measure thequantum product of the nation, for the measurementof productivity in particular; we simply cannot becontent with the current value of the product in asituation of changing prices. The formula enshrinesat the national level the principle of "doubledeflation". It is, of course, constructed on theanalogy of the current price formula (8.i); the fullseries of constant price national accounts, of which(8.4) is one, are so constructed. Exactly as in thecase of the current series, formula (8.4) is consistentin that the Y’ is the sum which would be obtainedit one applied the formula suitably interpreted toeach separate sector of the economy, however thesectorization was made, even down to the individualenterprise. The formula for Y’ is surely the most"natural" way to define national product. It is nowused in all countries which have the data for thecalculation, by Ireland in particular.18 Ireland, infact, seems to have been the first country to adoptthe concept officially, as applied to the agriculturalsector. The double deflation procedure was proposedmany years ago, independenlly by S. Fabricant,R. Wilson and R. C. Geary. Unofficial atiempts toapply the concept to estimate added value atconstant prices in different industrial sectors incertain countries (Ireland al~d Australia in particular)have not so far proved successful, principallybecause the CIP and price data on which thecalculations were based were not sufficiently
~SNIF-,, I96z, I964 (Pr. 74z4, 8716).
accurate. The results of the elaborate Irish experi-mentation have been published.19 It has recentlybeen suggested that the double deflation techniqueshould be applied by individual industrial concernsto estimate the trend of their productivity.S°
Associated with the internal or production account(8.1) in the national accounting system is the externalaccount at current prices
(8.7) X--M--N,
where N is the current value of net external invest-ment (+ or --). There is no difference in expertopinion as to the tangible reality of N, in the sensethat it may have a positive value due solely to thefavourable movement of export, compared withimport, prices. On the analogy of (8.7) one cannot,therefore, regard X’--M’ as the deflated value ofN simply because one would have to contemplatethe absurd possibility of N and its quantum N’being of opposite signs and therefore with animplicit price PN (=N/N’) negative. The consensusis that N should be separately deflatable (like X andM) so that the deflated value is, at least, positive ornegative as N is positive or negative. One thenintroduces a balancing item T’, the trading gain,to give the external account at constant prices:
(8.8) X’+T’=M’+N’.
T’ may be positive or negative. There is no doubtabout its substantial reality in any discussion on thelevel of incomes, prices and welfare. The trouble isits statistical determination.
Statistical difficulties are, of course, also en-countered with X’ and M’ particularly in connec-tion with services, fees, dividends, etc., but thesedifficulties are as nothing compared with N’ (andhence T’, from (8.8)) on which there is no con-sensus. A large part of the conceptual difficulty offinding a suitable price deflator PN for the currentexport excess N=X--M arises from the fact that Nas an entity in its own right has only a remotefunctional existence, when the economic process isconsidered in non-financial terms. Supply has tointervene between the economic realities of NI andX: M is in a sense functionally related to supply;X is a constituent of the distribution of supply; M inthis sense precedes X. The ultimate curb on thenation’s standard of consumption is the quasi-equality of X and M because unfortunately othernations will give us credit in very limited degree andnot for long. When our economic policy statement is
IIR. C. Geary, op. dt., footnote Ix and also R. C. Gearyand K. G. Forecast, op. cit., footnote zx.
SOR. C. Gear,/, "Do-It-Yourself Economics of the Firm",Productivity Measurement Review, February x965.
32
"we must export" what we really mean is "we needimports which we must pay for by exports".
Some Remarks on the Balance of Payments ¯The balance N is, however, meaningful as a
financial concept: every payment to normal residentsby others is an export and every payment byresidents to others is an import. Payments in andout may, in the aggregate over a sufficiently longperiod, be regarded as equal. From this financialangle there is no qualitative difference betweenwhat are regarded as "capital" and "current" itemsin the balance of payments statement. If one hada complete record of payments and ignored thisdistinction between "capital" and "current" Nwould be zero and the difficulty about its deflationwould disappear because N’=o; and stocks andforeign currency have prices just as non-financialgoods and services have.
As so often in statistical work, determination ofthe best procedure leads one inevitably to closeanalysis of one’s basic data, in this case the balanceof international payments. We cannot take on trustthat the different procedures will yield much thesame answer; we can only hope. The whole conceptof the trading gain is of great importance in Irelandin view of the relative magnitude of its externaltrade.
In view of the uncertainty about the calculationof N’, we can, at least, agree that we have all interestin trying to make N as small as possible; in policy-making (i.e. for the future) we may plausibly takeN=o which eliminates the difficulty and unam-biguously gives
(8.9) xfrom (8.8) since N’=o and M=X.
A National Price IndexWe may write
(8.1o) Z’=C’+I’+N’,
where Z’ is the quantum of goods and services inthe widest sense acquired by the nation during theyear of reference, its element N’ can be positive ornegative. The national income=national product=expenditure on goods and services of all kinds atcurrent prices is Y. The national price index Pz isaccordingly
(8.11) pz---Y/Z’.
Using (8.4) and (8.8) p can be expressed in a moresignificant manner than (8.11) as

(8. lZ) pz=Yl(Y’ +T’).
In the denominator the Y’ is national productionrelevant to the study of productivity, as defined by(8.4).
The trading gain T’ cannot be ignored. Inmagnitude it may in its year to year changes be aslarge as the change in production Y’ itself.~1
Attention to the ancient precept of "buying in thecheapest and selling in the dearest market" in itsnational application may be as advantageous asimproving productivity and may be less expensivein so far as the latter involves extension of tangiblecapital: the issue is really marketing v. productiveefficiency. It paradoxically happens that a markedimprovement in productivity may, however, beinimical to the terms of trade, for a great increase ina particular export may result in a decrease inexport price. Actually a normal manner of dis-tributing the benefits of improved productivity tothe whole of mankind should be by reduction ofexport prices. One may surmise that the loss throughthe terms of trade (expressed in the negativetrading gain) will be comparatively small comparedto the profits in greater volume of trade. Except forparticular products in particular situations, it seemsunlikely that a small country can influence theprices of its imports or exports much: the little,however, may be well worth trying for.
Values of Irish Trading and National Prices
The methodological dispute about the deflationof N has delayed the acceptance of the notion of thetrading gain T’ and, in turn, of national accountsat constant prices. R. W. Burge would deflate N (tofind N’) by Px when X>M and by PM whenM >X; J. L. Nicholson favours PM in every case;8. Fabricant would use some capital price deflator;R. C. Geary would accept any deflator with theformula
(8.13) p2q=apx+bpM, a+b=I, a>~o, b~>o,
using the single degree of freedom to bring aboutconsistency in terms of trade between sectors of theeconomy. Later Geary opted for the formula (8.13)with a=b=½, i.e.
(8.14) PN=(Px+PM)/2.
The various concepts are discussed in the literature.~2
It was a pity that no one thought of investigatingthe effects of the different concepts on the statistical
~lp. Dearie (ed.) Studies in Social and Financial Accounting,Income and Wealth Series IX, (International Association forResearch in Income and Wealth, London 1961); see alsoTable z5.
z2p. Dearie, op. cit., footnote 21.
results. This deficiency is now remedied by referenceto recent Irish macro data. Formulae for T’, usingthree formulae for Pn and (8.8), are as follows:
Formula p, T ’
A PM X(px--pM)/pxPM
C 1 X(px--1)]px--M(pM--1)]PM
TA is formally Nicholson’s position and de factothat of Burge as applied to Ireland where a positiveimport excess is almost endemic. T~ is based onGeary’s formula (8.14) above. Taking PN as unityas at C implies that net external investment N inany year is money and the formula might be regardedas representing Fabricant’s position in an extremeIorm.
The results are shown in the following table.
TABLE 23: ESTIMATES OF THE TRADING GAIN T’FOR IRELAND IN EACH PAIR OF CONSECUTIVE
YEARS i958-59 TO 1963-64
£ million
Value of T"Year using formula~
Base Current A B C
19581959196oI9611962I963
I959196o196II962I963I964
8.8--5"7--2"3
5"4-I’1
I7"2
9"0
--5"7--2"3
5"5I’I
17"9
9"0
--5"7--2"3
5"3o’7
16"7
Basic Source: NIE 1964.
There is no significant difference between the figuresin the three columns over a testing period in whichevery kind of aberration in relative prices and in thenet external deficit is encountered. These resultsare reassuring especially having regard to the usesto which T’, in particular, wlU be put, the deter-ruination of the "true" national price level and thepermissible level of non-inflationary incomes. Itdoes not really matter what "reasonable" pricedeflator one uses for current net external investmentN. The trading gain T’ is of the same order ofmagnitude as year to year changes in real GNP(i.e. Y’) and the virtual ignoring of this factor inappraisals of the economic level and trend ishazardous.
Prices in the National Accounts
If within the framework of the national incomeaccounts one desired, ab initlo, and without reference
33
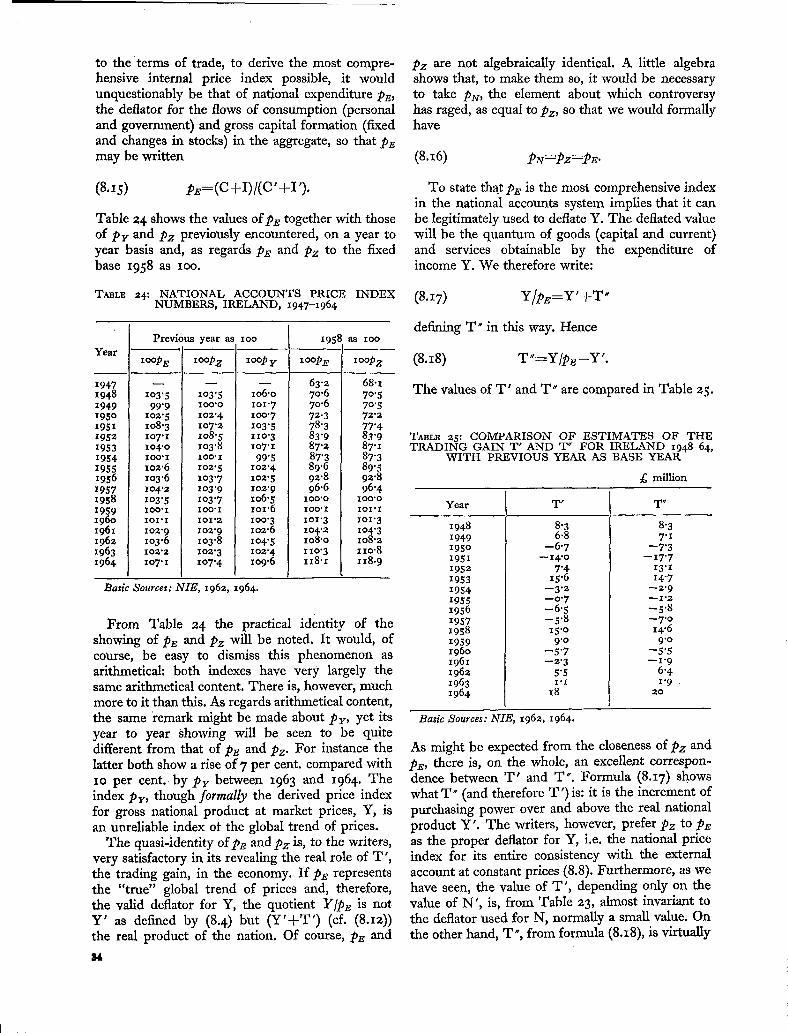
to the~terms of trade, to derive the most compre-hensive internal price index possible, it wouldunquestionably be that of national expenditure pg,the deflator for the flows of consumption (personaland government) and gross capital formation (fixedand changes in stocks) in the aggregate, so that pgmay be written
(8.15)
Table 24 shows the values ofpE together with thoseof py and Pz previously encountered, on a year toyear basis and, as regards PE and Pz to the fixedbase 1958 as ioo.
Pz are not algebraically identical. A little algebrashows that, to make them so, it would be necessaryto take P2¢, the element about which controversyhas raged, as equal to Pz, so that we would formallyhave
(8.16) Pzc=Pz=PE.
To state that p~ is the most comprehensive indexin the national accounts system implies that it canbe legitimately used to deflate Y. The deflated valuewill be the quantum of goods (capital and current)and services obtainable by the expenditure ofincome Y. We therefore write:
TABLE 24: NATIONAL ACCOUNTS PRICE INDEX (8.17)NUMBERS, IRELAND, 1947-1964
as I00
xoopy
lO6"OIOI"7100"7lO3"51 Io"3Io7"199’5
lO2"4lO2"5Io2"9IO6"5lOI’61OO"3lO2"6lO4"5lO2"4lO9"6
1958 as lOO
loopE 1oo10Z
63"2 68"17o’6 7o’57o’6 7o’572.3 72"z78"3 77"483 "9 83 "987"z 87"I87"3 87’389"6 89"592"8 92"896"6 96"4
IOO’O IO0"O
10o’1 1oi’1I01 "3 IOI "3
1o4"z lO4"3io8.o lO8.211o’3 iio.8118"i 218.9
YearPrevious year
xoopE zOOpg
lO3"5 lO3"599"9 1oo.o
Io2"5 lO2"4lO8"3 107"2Io7"1 Io8"5Io4"o lO3"8I~’l IO0"l
lO2"6 lO2"5lO3"6 lO3"7lO4’2 zo3’9IO3"5 lO3’7IC~’I I~’I
IOI’I IO1"2
lO2"9 lO2"9lO3’6 lO3"8io2.2 1o2"3lO7"I lO7"4
194719481949195°
195119521953195419551956I95719581959196o1961I96219631964
Basic Sources: NIE, I962, 1964.
From Table 24 the practical identity of theshowing of PE and Pz will be noted. It would, ofcourse, be easy to dismiss this phenomenon asarithmetical: both indexes have very largely thesame arithmetical content. There is, however, muchmore to it than this. As regards arithmetical content,the same }emark might be made about PY, yet itsyear to year Showing will be seen to be quitedifferent from that of PE and Pz. For instance thelatter both show a rise of 7 per cent. compared with1o per cent. by py between 1963 and 1964. Theindex py, though formally the derived price indexfor gross national product at market prices, Y, isan unreliable index ot the global trend of prices.
The quasi-ldentity ofpa and Pz is, to the writers,very satisfactory in its revealing the real role of T’,the trading gain, in the economy. If PE representsthe "true" global trend of prices and, therefore,the valid deflator for Y, the quotient Y/PE is notY’ as defined by (8.4) but (Y’+T’) (cf. (8.12))the real product of the nation. Of course, pg and
84
Y/pz=Y’+T"
defining T" in this way. Hence
(8.18) T"=Y[pE-Y’.
The values of T’ and T" are compared in Table 25.
TABLE 25: COMPARISON OF ESTIMATES OF THETRADING GAIN T’ AND T~ FOR IRELAND 1948~4,
WITH PREVIOUS YEAR AS BASE YEAR
£ million
Year T’ T"
19481949195°
I9511952195319541955195619571958I959I96o1961196219631964
8"36"8
--6"7--14.o
7"4-15"6
--3"2--o’7--6"5--5"8
15.o9.0
--5"7--2"3
5"5I"1
18
8"37"1
--7"3--I7"7I3"I
14"7~2"9--1"2
--5"8--7"0
14.69.0
--5"5--I"9
6"41.9
20
Basic Sources: NIE, 1962, 1964.
As might be expected from the closeness of Pz andpg, there is, on the whole, an excellent correspon-dence between T’ and T". Formula (8.I7) showswhat T" (and therefore T’)is: it is the increment ofpurchasing power over and above the real nationalproduct ¥’. The writers, however, prefer Pz to pEas the proper deflator for Y, i.e. the national priceindex for its entire consistency with the externalaccount at constant prices (8.8). Furthermore, as wehave seen, the value of T’, depending only on thevalue of N’, is, from Table 23, almost invariant tothe deflator used for N, normally a small value. Onthe other hand, T", from formula (8.18), is virtually

the small difference between two large aggregatesand is consequently suspect arithmetically.
The significance of the derivation of T~, viaformulae (8.15) and (8.I8), lies in its having beendetermined without explicit reference to the external
account. T’ (or T") is therefore an element in thematerial welfare of the nation as tangible as anyother element and should be taken into account inparticular in the determination of the money levelof incomes which can be paid without inflation.
9. SOME REMARKS ON INDEX NUMBER MAKING WITH SPECIALREFERENCE TO THE QUALITY PROBLEM
Some remarks here on the methodology of priceindex number making may not be out of place. Itwill be evident that, for us, V=PQ is an identity,implying that, however the price and quantumindexes are calculated, they must be reconciled as aproduct with V, value, the only element in theidentity of which, truth to say, we are sure. Theidentity implies that a price index number is con-ceivable only as a deflator of a well-defined valueflow. In making a price index number P the possiblederivation of Q should always be borne in mind;more and more analysts are coming to realise thatthe Q should not only be conceivable, but actuallybe calculated. The various CSO price indexesconform with the flow principle, thus the CPI,agricultural output and input prices (or unit values),the whole WP series of IO indexes and the sub-indexes. It is only very rarely, however, that officialstatistical services supply the Q corresponding tothe index P, or vice versa, consistent with V=PQ.Nearly always one is given P or Q. It would appearto be an easy matter for the statistical authoritiesto give both P and Q in most cases where they makethemselves responsible for either.
We have made it clear that, given V, value, andQ, quantity, we prefer to use P as V/Q than anyprice index constructed as such: for instance, weprefer, as a general retail price index, the ]VIEquotient for personal expenditure on consumers’goods and services to the official CPI, for aU thesacro-sanctity of the latter, and the Irish index is avery good index of its kind. Actually the two serieson an annual basis compare very well; comparisonsfor some other pairs of price indexes are not so good:we later give an important instance of the priceof output for the construction industry. Of coursethere is no suggestion of abandoning CPI in favourof a V/Q figure derived from the national accounts:at present these are available only at annual intervals,which is far too infrequent for CPI purposes, andare much out of date. Mainly for wage escalationpurposes the CPI are required at quarterly intervals,and promptly. We suggest that the weighting ofCPI be constantly brought up to dataparipassu withthe national expenditure data. This would certainly
have the effect of bringing CPI into closer con-fortuity wkh the corresponding national accountderived figure.
When, consequent on the new household budgetinquiry, now in process, a revised CPI is issued wehope that the indexes will relate to the wholemonth of reference and not to a single mid-monthday. It would appear that this change can readily beeffected by staggering area-wise the quarterlycollection of prices of commodities and servicesthroughout the month. As a result of the pricequotations relating to a particular day, some of thenational average prices (even though based on largenumbers of quotations), notably of vegetables,behave in an aberrant way from quarter to quarter.We believe that average monthly prices wouldbe more regular in their behaviour.
In order that there should be consistency betweenprices and quanta throughout the economic systemit is highly desirable that, as far as possible, thebasic statistical information should come from thesame sources. It is hoped that when the WP systemis being revised this suggestion will be considered.Would it not be possible to arrange that the WPcorrespondents should all be representative of thelarger industrial concerns, importers, etc.? Weknow that in Ireland, some effect is given to thisdesideratum; it should be made systematic.
We consider that official statistics, in tile P and Qindex number systems, especially when these areannual figures, should supply figures to previousyear as IOO. The majority of users of index numbersare interested only in recent percentage changesand should be facilitated. Even if the series has agiven year base (e.g. 1953 as IOO) the indexes shouldbe constructed on the link relative principle withup to date weights. This method is widely used inCSO. Of course, it is customary to calculate year toyear changes from fixed base-weighted Laspeyresindexes. We should recognise what we are doing:we are stating that the year to year percentagechange is so-and-so when the basic pattern ofexpenditure is that of io or 15 years ago. Especiallywhen the percentage change is small, this inferenceusually puts a severe strain on that misused
principle "the weighting doesn’t matter". Weightingof all index numbers should be kept up to dateaccording to the latest information available as toconsumption, etc., habits. The link relative method,with up-to-date weights, can be made to subserveboth ends, namely reliability (i) as a fixed-basefigure, and (ii) as showing year-to-year changes.It is only when one has to graft commodities in orout that the link relative method has its hazards,but then no method is quite satisfactory, as regardsgrafting. A situation can arise in which a com-modity practically vanishes (and is therefore leftout of the index calculation) and returns perhapsyears later (to be included). The link relativeandnormal grafting procedures would imply that thecommodity temporarily excluded has not changedin price during its period of exclusion; and this maybe far from being the case. There were many suchinstances in Ireland during World War II, notablycoal. One must be very sceptical of an index numberwhen the number base is remote. All CSO indexeshave now a post-war base. Researchers who wantto survey a long term of years must use linkedindex series at their own risk.
Before making our own contribution to thequality problem in its relation to the making ofprice index numbers we should remark that indexnumber practitioners are wont to distinguish be-tween what are termed unit value indexes and priceindexes. Unit value indexes are constructed foreconomic flows in which it is customary to stateboth quantity (Q) and current value (V) in relationto the constituent commodities. It usually happensthat both these data are available for a high per-centage (say 9° per cent) of the big flows so thatthe accuracy of the index is not compromised eitherby omitting the commodities in regard to whichvalue only is stated or making some reasonableassumption about the price trend of the "valueonly" commodities; the latter procedure is to bepreferred since it usually is known that this residualpart has a different price trend from the larger partfor which both V and Q are known. For the purposeof the discussion the unit value coverage is thereforeassumed to be IOO per cent.
The unit value indexes are therefore a by-productof certain series of official statistics, compiledprimarily for other purposes. While the officialcommodity lists of the major commodity flows maycontain thousands of items, these descriptionsusually are too generalised to furnish "prices" inthe sense that businessmen and consumers under-stand the term. It would never be practical to com-pile official statistics in the detail required for theconduct of business: hundreds of thousands ofrubrics would be necessary. Price index numbers,however, contemplate "prices" in this sense. We
therefore speak of commodities as the items des-cribed in official statistics and varieties (of "eachcommodity) as the description which is meaningfulfrom the pricing point of view. Thus import andindustrial production statistics will state number(i.e. quantity) of refrigerators; "refrigerator" is thecommodity description. The "variety" descriptionmay specify name of maker, capacity and otherprecise attributes in relation to prices. In making aprice index number (typically the Irish WPI system)it is customary to use a sample of variety prices.Price index numbers to a fixed base are calculatedfor each variety, and the simple average of theseindexes is taken as the index number for the com-modity. Flow indexes are then produced by appro-priate base expenditure weighting at the commoditylevel. The price index derives its prestige from thefact that the precisely defined variety prices areassumed to have all the same qualities at the differentpoints of time to which the price index relates.There can be no such assurance in the case of theunit value index. The variety content at com-modity level for most goods can change from timeto time. The value per unit at these times relates todifferent sets of qualities.
Change is of the very essence of economic evolu-tion in time. In consequence, it is impossible tomaintain unchanged for an extended period the samevarieties of a commodity. The usual practice is tograft in substitute varieties in place of those whichfall out; over a few years it can happen that allvarieties have changed. During change periods it isusually necessary to assume that the commodityprice has moved proportionately as the varietiesthat remain. There is clearly a possibility of bias(probably downward) during such transition periods,since the new varieties probably have a differentprice trend from the old. Of course, the lesser theinterval of time the lower the bias of this kind, whichreinforces our earlier argument in favour of currentindex numbers to base previous year as IOO. Despitethe risk of bias it is a wise practice in making priceindex numbers to use a large number of varieties foreach important commodity to provide for fall-out; asa working rule the number of variety quotationsmight be roughly proportional to the expenditureweight of the commodity. There should be nodifficnlty in obtaining great numbers of quotationsfrom price lists and time of computation should notbe a limiting factor in this computer age.
The impossibility of producing price indexnumbers in which over a period generally unchangedquality can reasonably be assumed is only one of thereasons why we tend to favour unit value indexesmore than do most of our colleagues with practicalexperience in this field, which is still very far fromstating a positive preference for unit value indexes.

It is the great merit of unit values that they cover thewhole field and that price, quantity and hence valuedata come from identical sources--may we, in thisconnection, refer to our footnoted aphorism3~ Weassume that there is a considerable number of com-modities in the flow. We think that unit values of in-dividual commodities should be accorded a prestigein their own right. In our view the commodity de-scription implies a function or use: thus, a suit ofclothes, a pound of butter, a typewriter. The state-ment and consciousness of average unit values ofthese have some social importance. If at a period inthe past socks were all made of wool and nowadays ofnylon (say wool socks are extinct) it is meaningful tostate and compare the national average retail pricesof a pair of socks at the two periods as an element inthe cost of living. If at the two times the basic pricedata are collected at the same outlets one has anadded guarantee of comparability. Thus, unit valueindexes avoid the "quality problem", as it isnormally understood, by defining the quality ofgoods in terms of function and sales-outlet.
Even when there is no ostensible change betweentime periods in the variety content for a commoditythere may be bias in the average price at commoditylevel. Even if the variety is specifically describedaccording to many attributes identical at the twotimes, it is to be assumed that, in general, thevariety at the later time has greater utility than atthe earlier: this should come about by competition.This remark applies particularly to highly manufac-tured articles, in which quite simple changes, notimplied in the description, may improve theutility. It is a safe inference that price index numbersall have an upward bias, for this reason, and quantumQ a downward bias. No statistical procedure canremove this kind of bias. As an important inference,all the evidence goes to show that the averagematerial welfare (a quantum) has improved over ageneration or so to a greater extent than is indicatedby any statistical indexes but the bias is not measur-able. No price index number, however meticulouslycomputed, is completely reliable, especially over thelonger period. There is a diminishing return, there-fore, in effort expended in making index numbers.
We are not convinced that stochastic theory has asignificant role in assessing limits of error inestimating price index numbers. If the number ofquotations is reasonably large the confidence limitsof error due to prices sampling are nearly certain tobe much smaller than errors which can arise in otherways. Our own empirical rule is to compute bothLaspeyres and Paasche indexes whenever this ispossible and to regard the "true" index as some-where between the two figures, on elementary in-
aaSee footnote x2.
difference curve considerations: the wider thedifference between the figures, the less reliable theindex from any formula. The Fisher Ideal (thegeometric mean of the two) is taken as the estimateof the "true" index.
Building and Construction
In Ireland, as in other countries, this is the largestnon-agricultural industry and so merits specialattention from the pricing point of view. It alsounfortunately happens (in this country as elsewhere)that it is one of the least satisfactory, statistically,from the viewpoint of constructing price andquantity index numbers. It has proved almostimpossible to attain adequate coverage for theindustry in CIP, despite the devoted and ingeniousefforts of the official statisticians.
We confine ourselves here to a critique of theofficial wholesale price index numbers for theindustry, a monthly series published quarterly formany years in ISB. Table 6 of tile series gives anindex for prices of materials in the Building industryand the product index is given in Table 9, whichpertains to prices of capital goods generally.
The very concept of output price of this industryis beset with difficulties. To determine price onemust have a precise notion of the quantum unit,which ordinarily pertains to a single commodity(e.g. a cwt. of creamery butter) or to several com-modities combined in fixed quantities, e.g. as inmaking a Laspeyres price index. In the constructionindustry, however, the unit is almost inconceivable,since it may be a church, a factory, a road, an officeblock, a three-room dwelling, each made to differentspecifications, raising the quality problem (whichwe deal with later) in its most acute form. There isno special difficulty, fortunately, about stating out-put in current value; the CIP requirement is "valueof work done" in the specified calendar year in thevarious categories, hospitals, schools, dwellings, etc.which values are meaningfully additive.
We start with the percentages of gross output inthe familiar categories (i) materials (including fueletc.) (ii), employee compensation and (iii) "re-mainder" (profit and non-factor costs other thanmaterials). The results are shown in Table 26 for theyears 1953-1964.
The percentages in Table 26 are derived on twobases (i) including payments to other firms for workdone (columns 2-4) and (ii) excluding this item(columns 5-7).~ Exclusion implies that suchreceipts were from other firms in the constructionindustry so that series (ii), in excluding intra-transactions as far as possible, is in accordance withthe principle that, for the valid construction of price
*4We are indebted to T. P. Linehan for this suggestion.
87

TABLS 26: PERCENTAGES OF GROSS OUTPUT OF THE BUILDING AND CONSTRUCTION INDUSTRY INTHREE CATEGORIES OF COST, x953-64
Year
x953x954x955x956x957I958x959x96oI96Xx962x963x964
Percentage of gross output--
(i) including payment to other firms for work done (ii) excluding payment to other firms for work done
Employee EmployeeMaterials, etc. compensation Remainder Materials, etc. compensation Remainder
2 3 4 5 6 7
5° 37 x4 45"9 39"5 z4"65z 36 I2 47"7 39"z I3"I
5z 37 12 47"5 39"8 I2"7
5x 36 x3 46"4 39"6 14"o50 37 I3 45"2 40"6 I4"2
49 35 16 44’8 38"1 x7"I50 35 15 45"4 38"5 I6"I
54 35 II 48"2 39"I I2"7
53 35 I2 47"6 38"8 i3.6
54 34 I2 46"8 39"7 x3"554 33 I4 45"5 38"4 I6"I
54 33 I3 45’I 39"o 15"9
index numbers on the flow principle, one shouldregard the section of the economy (in this case theconstruction industry) as if it were a single trans-acting unit, selling and buying. We are confrontedwith the difficulty, however, that there is a consider-able discrepancy between what firms included inCIP state that they paid out to other firms for workdone and the amounts stated to be received; ofcourse, if the coverage of CIP were complete and ifthe sub-contractors Were all in the industry, receiptsand payments in aggregate would be identical. As itis, payments by CIP firms are greatly in excess ofreceipts which is quite consistent with CIP firmsbeing predominantly the larger firms. We decidedto use the larger payments deduction (from grossoutput and materials, etc. to keep net output intact),justifying ourselves on the very satisfactory showingof the series (ii) percentages in Table 26. This itemhas greatly increased in recent years, in fact from£x.8 million in i953 to £6.6 million in i963.
Despite the fact that the tendering procedure mayimpart an element of competition in prices to thisindustry, the universal practice in pricing appears tobe cost-plus, which should result in a quasi-constancy at least to the profit dement and thereforeto the remainder percentages (columns 4 and 7). Asit happens, these are relatively the least stablethroughout the period, ranging from ii to x6 forseries (i) and from 13 to 17 in series (ii). The quasi-constancy of the series (ii) percentages, quite devoidof trend, is surely quite remarkable, having regardespecially to the great changes in gross outputduring the period--only £I9 million in i957 and
£44 million in 1963: for materials the phenomenonof larger figures in the period 196o-1963, comparedwith the earlier years, is entirely absent from theseries (ii) percentages. The considerable improve-ment in constancy resulting from "exclusion" in
a8
columns 5 and 6, compared with columns 2 and 3respectively, will be noted.
Because of the difficulties mentioned above ofbasing estimates of volume or quantum for theconstruction industry on the categories of gross out-put, as in the case of nearly all transportable goodsindustry, output volume is based exclusively onquantities of input, i.e. cement, timber, etc. most ofwhich are specific and priceable. This implies nochange in the volume of materials per unit of out-put. This assumption deserves a critical investiga-tion because of the changing structure of the buildingindustry, and the increasing tendency to havematerials made available in a prepared form.Knowing the volume and value indexes, we are nowin a position to derive price indexes as P=V/Q.The data are given in Table z7.
Let X and x be index numbers (base unity) ofgross output and materials respectively, currentlyvalued; p~ is the price index of materials. Thenvolume Q (according to the official formula) is givenby:--
(9.i) Q=x]p~.
But the implicit price index P of gross output is:--
(9.2) P=X/Q=p.X/x,
from (9.I). But, from Table 26, we are entitled toassume empirically that (bearing in mind that Xand x are index numbers) X--x; whence, from (9.2),P=p~. Of course, in practice, it would be imprudentto conclude that in all circumstances the price ofoutput equals price of material input; at this stagewe suggest only that the two price index numberscannot be widely different.

TABLE 27: PRICE INDEX NUMBERS (1953 AS lOO) OF PRODUCT AND MATERIALS IN THE BUILDING ANDCONSTRUCTION INDUSTRY, I953-1965, FROM DIFFERENT SOURCES
Wholesaleprice for
Gross output Labourprodueti-
CorrectedW P index
Price of materialsEmploy-Year
Implicitprice
B & C ind’yP
Value Volume vity, 7r for B & Cind’y, P’
ImplicitCIP
Wholesaleprice
IO
IOO96"698.6
lO5"6iii.9112"5lO8.OlO9’5112"o114"7II5"0119"3I22"9
ment
6 84 5 72 3i 9
1953195419551956I95719581959196oI96I1962196319641965
ioo90"395"7
lO3"8111’6lO9"1lO8"2lO3"9lO4.1IO6"7II0"2II6"o
(a)
ioo1oi’7lOO"9
94"870"279"284"19o’4
lO4.8123"7150"317o"7
(a)
IO0II2"6105’49I’362"972"677"787-o
ioo.7IIS"9136"4147"2
(a)
I00 IO097"9 lOO"9
lOO"3 98"9lO6"7 89.4III’5 65"2II3"5 65"0111"3 67"O114"5 69"3119"I 74"9125"4 82"5126"5 91"9I36"2 94"414o"3 (a)
i
iooIIr6lO6.6102"2
96"4II1"7115"9125"5I34"5140"4148"4155"9
(a)
ioo93"297"4
lO5"6113"4lO8"OlO4"OIo3"3lO4"OlO7"2lO5.6IIO’6
(a)
IO093"998"9
lO4"9IO9"9lO6"4io7.olO9"1lO7"9lO8"8lO9.2I13"9
(-)
(a) not available.Basic Source: ISB
Col. 2: Value excludes amount paid for work given out.,, 3: Official CIP figures.,, 4: Quotient (x IOO) col. 2/col 3-,, 5: Official. Table 9, wholesale price series.,, 6: Based on official CIP average numbers engaged.,, 7: Quotient (x ioo) col 3/col. 6.
.Notes:
8: Formula (9.3) and cols. 5 and 7. Xo was taken as 0"5426 the proportion borne on average by materials in materialsplus employee compensation, CIP 1953-63.
9: Quotient (x ioo) index CIP value of materials (excluding amount paid for work given out) by col. 3.1o: Official. Table 6, wholesale price series.
We may state at once our opinion that, in thepresent state of knowledge, CSO is right in basingestimates of quantum output on volume of materialinput. Attention should be given, however, to theproblem of estimating volume output directly, i.e.from the gross output categories themselves. Thisindustry is an important contributor to grosscapital formation, in regard to which reasonablyaccurate quantum data are essential.
As regards product prices (P) the official formulafor current monthly index numbers is a Laspeyres
(9.3) P-----P~ Xo +P~ Wo,
where Xo and Wo are proportionately value ofmaterials and employee compensation respectivelyin the base year, p, and p~ being the currentindexes (to base unity) for price of materials andstandard rate of wages per hour. Since all indexesare unity in the base year,
(9"4) I = Xo + Wo.
Let us consider the underlying logic of theLaspeyres formula in its relation to this industry.In general, the formula states the current cost of acomplex of given quantities of goods and services,which cost IOO (usually) or, in our case, unity in the
base year. Formula (9.3) states that the fixed costelements taken into account for pricing the con-struction industry are so many tons of cement, somany square feet of timber etc. and so many hoursof labour. Our point is that the assumption of fixityof hours of labour is, as we shall see, invalid. Fewerhours of labour applied to materials are nowrequired to produce a given piece of construction,compared with the base year. In a word, labourproductivity has increased, and increased con-siderably, in this industry. As an example, supposethat two houses, identical in every detail, are builtin the base and current period. The total cost of thebase year house was unity (apart from overheads),of which (say) 0.6 (=Xo) was cost of materials ando.4 (=Wo) was cost of labour. If prices of materialsin the current year have increased by 2o per cent.the new cost of materials is 0.72. But if hours oflabour applied to the same quota of materials hasdeclined to 2/3Nor labour productivity has risen by5° per cent.--of those in the base year while moneywages per hour have increased by 5° percent., clearly the labour cost element in the currentyear remains o.4 (=0.4ק xi.5), so that the totalcurrent cost is 1.12 (=o.72+o.4o). This is thecorrect product price index, in this example. Using(9.3) the official--formula (9.3)--figure would be1.32 (=0.72+0.4 × 1.5).
39

"Within the logic of the official approach theformula should therefore be:
(9"5) P ’=xop,, +WoP,o[rr
where 7r is labour productivity which is estimable forthe industry from CIP as the quotient of theofficial figures for quantum output by averagenumber of persons engaged, during the period1953-1964. All the relevant data are given in Table27. Our estimates of P’ are derived by working backfrom the official prices P, using (9.5), with p~ theofficial material price index (Table 27, column io).
Formula (9.5) is so important for our purpose thatit seems worthwhile showing how it is consistentwith the basic identity V=PQ. If, on the cost-plusbasis, current value of output (V) is proportionalto:--
V=x+w,~5
with, in the base year, as before:--
By definition, Q, the quantum index based onmaterials alone, is:u
Q=x[Xopx.
Then, if the labour productivity and hourly wageindexes are 7r and p~ respectively, and N the indexof labour hours,
~r=Q /N=x [xoNP.p,~=W/WoN.
Hence, on reduction,
P ’=V/Q=xop~ +Wop,o/rr
which is formula (9.5).Comparison of columns 5 and 8 of Table 27 shows
that the official wholesale price index has been con-siderably biased upwards, especially during the lastfew years because of the implicit assumption in thecalculation of unchanged productivity throughoutthe period, whereas, as column 7 indicates, labourproductivity 1r increased very considerably.~6 It is,however, far easier to be critical of the official
2ax here is not to be confused with the same symbol in (9.I)and (9.2).
t6It should be noted that our critique concentrates on theomission of labour productivity from the calculation. However,allowance should also be made for possible changes in thequality of material inputs, and if this were done, it may bethat the wholesale price series for the industry would be lessbiased. As an analysis of quality change is presented in thefollowing subsection, no attempt was made to take account ofit here.
4O
wholesale price series than to make useful sugges-tions for their improvement. The series comprisesI2 tables pertaining to most of the major flows of theeconomy (home production for personal consump-tion, imports, materials for use in all industry etc.)culminating in Table I2, termed the "general"wholesale price index, which shows by commoditygroups the prices applicable to the largest flow in theeconomy, namely of goods available for home con-sumption, capital formation and exports. AU theindexes are Laspeyres-type, the basic weightingdiagram being values of commodities in I95o.Literally thousands of price quotations are used andthese have to be separately weighted for each table.The series is a monthly one.
Of course if the weights could be kept reasonablyup-to-date (as in the case of agricultural priceindexes and other) the statistical reliability would begreatly improved. Up-to-dateness in weighting,however, using formula (9.3) will not give a correctindex. Formula (9.5) should be used even with theyear to year link relative method, for the construc-tion and any other industries in which employeecompensation is an element in weighting. There aretwo major difficulties here (i) the CIP, on which theweighting is largely based, is nearly 3 years out ofdate and (ii) even with the data available the con-struction of the weighting diagrams for the I2tables is a most formidable task.
In the case of the construction industry, however,the materials plus employee compensation weightingbase might be retained. Labour productivity shouldbe taken into account, so that, in effect, the wageindex would not be per hour but per unit of output.Productivity data, sufficiently accurate for priceindex making, should be currently estimable, evenby extrapolation of the latest available CIP trend.So the weights would be changed from year to year.
While the indexes in columns 4, 5 and 8 of Table27 all purport to relate to price of product in theconstruction industry, it is not seriously suggestedthat the column 4 series can ever be used for currentWP index purposes: it is available only at annualintervals, and is very belated. It should, however,be used systematically as a retrospective check onthe current WP series with the ultimate objective ofmaking all the official series of indexes; pertainingto prices, quantum, earnings and productivity,mutually consistent.
In the interest of improved consistency in theseseries and, of course, for the value of such statisticsin themselves, consideration might be given toproviding quarterly data for service-type industries(construction, electricity etc.) on quantum output,earnings, employment and hours worked, exactly onthe lines of the invaluable Quarterly IndustrialInquiry which now covers TG industries only.

Two additional series of price indexes areprovided (columns 9-1o, Table 27) purporting tocompare a unit value index (colmnn 9) with a "true"wholesale price index. The latter is a Laspeyres,whereas the unit value is a year-to-year FisherIdeal. From 1961 on, the implicit CIP index seemsto be systematically lower than the wholesale index.We do not know if this is due to the wholesale priceweighting getting out of date, or because of thedifference between unit value trends (necessarilyignoring quality changes in the different materials)and wholesale prices which have fairly close regardto such changes in using price quotations for manyvarieties of the materials. The latter should not be alarge factor in the discrepancy since the moreimportant building materials are fairly specific.Certainly if the unit values, in statistical quality,are equal to (or better than) the wholesale pricequotations the implicit CIP prices (column 9) areto be preferred to those of colulim IO because theweighting of the former is up to date. The officialmaterial price indexes (colunm io) have been biasedupwards in the last few years, probably because ofthe remoteness of the weighting base.
The revealed upward bias in construction productprice sheds a certain amount of light on a curiousphenomenon which has become apparent in recentyears, namely the tendency for "more elaboratelytransformed products" to increase more in pricesthan the other two stage of production pricecategories used "Crude products" and "Simplytransformed products". The indexes for certainyears are shown in Table 28.
TABLE 28: GENERAL WHOLESALE PRICE INDEXNUMBERS IN STAGE OF PRODUCTION
CATEGORIES
Base 1953 as lOO
Stage of Production 1955 1958 1963 1964 1965
1. Crude products lO9"2 II2"O Io9"3 121"2 127"72. Simply transformed
products 96’6 11o"4 II0"2 I13"9 115.13. More elaborately
transformedproducts lOO’3 114"9 I26"3 132"6 137"7
General Index 101"6 113"5 XI9’8 126"8 I3I’6
Experience, here and elsewhere, has shown that inthe past the more advanced the stage of productionof the commodity the less marked the fluctuationin price from time to time. In regard to a particularadvanced product the explanation used to be thatthe factor element was the stabiliser, so that theproduct price percentage-wise tended to be lowerthan in the case of its materials. Partly the reasonfor the exceptional behaviour of stage 3 prices is
probably the upward bias in the construction priceindex,~7 demonstrated above, for construction is, ofcourse, a stage 3 activity. We do not know to whatextent this bias affects the stage 3 products or thegeneral index itself. Comparing Tables 8 and 9 of thewholesale price series, i.e. prices of stage 3 industrialgoods, with construction prices we find a markedsimilarity in trend in the period 1953-1965,culminating in an identical figure 14o.3 for both in1965. On the other hand the stage 3 indexes forhome production for personal consumption haveadvanced more than for the other two stages, andbuilding has but a small weight in the personal con-sumption price index. An explanation of theseconsumption indexes would be that the factorcontent of price is ahead of productivity in theeconomy as a whole. We do not know if this be so,or to what an extent. Our investigation of the con-struction industry has at least indicated that onemust be careful about affirmations with regard toprice and productivity, and that the official whole-sale price series generally is in need of revision.
The Quality Problem
There has been considerable interest in recentyears in the possibility of correcting price quotationsfor quality changes over time:
"Consumer price indices should rest in com-parisons of identical or equivalent qualities ofcommodities priced at different times. To ensurethat this condition is fulfilled every possible effortshould be made to eliminate the influence of qualitychanges."2sIn what follows it will be understood that we
have in mind price (as distinct from unit value)index number making. In theoretical discussions onprice index numbers, it is generally assumed that itis possible to obtain successively over time pricequotations for identical goods. As already indicated,this is not always feasible. Most commodities areavailable in a number of varieties at any given time.Furthermore, the constitution of individual varietieschanges over time. These quality disparities may bedescribed as quality differentials and qualitychanges, respectively. Quality changes in thecommodities included in price indexes make itdifficult to interpret secular price trends withprecision, unless some quantitative allowance ismade for the quality change. It is also necessary toquantify quality differentials in order to substitute anew variety into the index computation.
27CSO demur in pointing out that the construction industrybias has scarcely any effect on the stage 3 index numbers.
~STenth International Conference of Labour Statisticians,(ILO), Resolution 5, (I) ; Report IV (Geneva, 1962). (Italicsours.)
41
Once the existence of the problem of qualkychange is explicitly recognised, it becomes necessaryto evolve some technique for quantifying thechanges. The failure to evolve an acceptable methodhas been one of the most serious defects of mostprice indexes because an index may be biased ineither direction unless a suitable adjustment ismade.~9 The direction of the bias introduced intothe price index depends on the direction of thechange in the general price level, and also on thenature of the adjustment being made (if any).
In periods of generally rising costs of production,i.e. in periods when prices generally are tending toincrease, entrepreneurs may attempt to maintaintheir prices but reduce the quality of their products.Failure to separate price and quality change wouldyield an unduly low measure of the price rise underthese circumstances¯ On the other hand, duringperiods of gradual improvements in quality theprice index will tend to be biased upwards; as statedabove, we believe this to be of more commonoccurrence.
If relative prices were accurate indicators of thequality differentials existing at any given time, therewould be no problem in computing prices indexes :new varieties could be grafted into the index quitereadily. This is rarely possible, however, except inpurely competitive markets "when the majority ofbuyers are informed and able to judge what theybuy. In such a case, differences in price can betrusted to reflect differences in quality",z°
Attention has recently been given to the exten~to which consumers regard price as an index ofquality,zx As a result, it seems that consumers mayadopt a range of prices as a guide to the quality ofvarious varieties, or goods--i.e, they may feel thatall goods of a similar type within a price rangep4-Apare of approximately the same quality. Even thoughthe writers felt justified in reporting that "priceserves as an indicator of quality with far greaterfrequency than is generally believed",32 their resultsdo not give much reason for believing that price is asufficiently good index of quality for price indexes.Cases like that of the perfume starkly advertised (nodoubt having regard to the psychology of givers andreceivers of this commodity as a gift) as "the mostexpensive perfume in the world" are few.
If, then, relative prices are rejected as indicators ofquality differentials, some other approach isnecessary. One alternative is to define the quality ofa good in terms of its physical, measurable attributes.
~lThe Price Statistics of the Federal Government (PriceStatistics Review Committee of NBER) I96r.
SOT. Scitovsky, Welfare and Competition (Unwin UniversityBooks, London) I963. , ....
SlA Gabor and C W J Granger, Price as an lnaicator¯ ¯ " ¯ ¯ ¯ ¯of (j~ahty--Report of an E-nqu, ry", Economzca, February 1966.
s*I~.
42
Goods of exactly similar physical characteristics aredefined to be of identical quality, regardless of theirrelative market prices. Differences in relative pricesof identical goods are attributed to buyers’ imperfectknowledge or to non-quantifiable qualities.
In the preceding paragraphs, the quality problemhas been discussed in rather general terms; at thepractical level, however, the particular methodadopted for specifying the goods selected for in-clusion in the index computation determines theprecise nature of the problem. In principle, thestatistician is faced with the choice of threetechniques:q
(i) he may adopt a very broad system of com-modity specification; or
(ii) he may adopt a detailed and rigid system ofspecification; or
(iii) he may elect to follow the price behaviour ofone variety of a good and treat it as repre-sentative of all available varieties o2 the good.
If the first is selected, then there is no means ofknowing whether or not prlce-quotations fromdifferent reporters are for the same goods, eithersuccessively over time, or at any one time; this islike the unit value situation. The question of qualityis ignored, and the price index may be biased ineither direction.
If, on the other hand, the system of commodityspecification is very detailed, the volume of price-recording and calculations will be very large, unlesscombined with some random sampling method ofprice-collection: we have already dealt with thisaspect. The price used in the index computation foreach good is an average of the prices of the varietiesavailable. If one of these varieties disappears fromthe market, it is necessary to substitute anothervariety into the index computation. Unless this isdone, an average of the remaining varieties may givea misleading measure of price trends.83
The difficulties associated with the selection of thethird method are similar to those of (ii) above whenthe variety originally selected is replaced on themarket.
Thus, problems of quality arise when, betweensuccessive collections of price quotations, one varietydisappears from the market, and is replaced byanother. This transition may be sudden or gradual.
In the case of sudden transition, the situationenvisaged is as follows: variety X alone is on sale attime o at price Pox; variety Y alone is on sale attime i at price p,y. The problem is to calculate theprice-index for time ~ (Ioi). One method is toregard the quotient ply/po,,----Io, as the index.However, implicit in this is the assumption that X
33E. yon Hofsten, Price Indexes and Quality Change (GeorgeAllen & Unwin, London), I952.

and Y are of exactly the same quality, and that thereis no need to adjust Ioi for quality differentialbetween X and Y. If, however, it is possible todescribe the quality of X and Y unidimensionally,then we might define g’ as follows:
g’~-Kx/tCy
where Ki is a measure of the quality of i, andKx/xy is the quality differential between X and Y.If g’ is a unique numerical measure of the qualitydifferential, then the index may be defined as
i p~_yI ’oi-----~v ¯ Pox
where I’ denotes that the index has been adjusted forquality.
It should be noted that the discussion so farpresumes that the dropping-out of one variety fromthe market is the result of market pressures. If,however, the change in varieties is enforced (e.g. byrationing in wartime), it may be desirable from ageneral welfare point of view to disregard qualitydisparities. If the consumer has no option but tobuy a variety of higher price (and quality) thanheretofore, then the price change might be regardedas entirely a pure price change. Von Hofsten, how-ever, would prefer to allow for quality, and defines
II ....
Piyoi --g, " --Pox in this case also.
The numerical value of Iol may differ radicallyfrom 1%i. For example, the Irish national averageprice per glass of Irish whiskey was as set out in thefoUowing table:
Time Pdce Proo~Strength
I96o February 47"69d. 760May 47.69d. 7°o
Source: CSO Files.
In this example, Ioi----ioo. But if proof-strength istaken as the one significant quality dimension, then
70g’=76--, and I’,o= i.o86.
That is, Io, shows no change in the price index forIrish whiskey while I’o~ shows an increase of 8.6per cent. It should be noted that the CSO use I’oiin the computation of the CPI.
This example is rather special: the difference inquality between X and Y was well-known andpublicised. To describe whiskey in terms of but onequality characteristic (i.e. proof-strength) is,obviously, a simplification, but may not be too un-reasonable. Proof-strength, however, does not seemto be relevant to the quality of other alcoholic drinks,
e.g. wines, where non-quantifiable characteristicsseem to be most significant.
A more usual problem is that associated withgradual transition, where one variety graduallydisplaces another on the market, e.g. variety X isavailable at time o at price Pox; variety X andvariety Y are available at time i at prices Pix Pxyrespectively; variety Y alone is available at time 2 at
price P2y. Here, Io~=p2y. This is unsatisfactoryPox
since it makes no allowance for the quality differ-ential between X and Y. Frequently, the reaction is
1" =Pix P2__y. Thisto splice the index, defining _ oz Pox "Piy
definition implies that g’~-p~y/PIx i.e. that the ratioof the prices of Y to X when they were both avail-able adequately measures the quality differential ofY over X. The legitimacy of I%2 as a true indexdepends entirely on whether or not gt~-piy/Pi~.
This may be true in purely competitive markets, butdoes not necessarily apply in all markets.
The introduction of this factor g’, by yonHofsten, is an improvement on the previous splicingtechnique. It suffers, however, from the seriousdifficulty, previously mentioned, that it attempts tocapture the quality of goods in a single dimension.The Stone-Griliches approach takes the question astep further.
To quantify qualkitative change by their tech-nique we require a method of comparing varietiesin terms of their qualities that command a price. "Inessence, it [the method] consists of viewing acommodity as a bundle of qualities, each one ofwhich contributes (positively or negatively) to theutility or productivity derived from the commodityin question, with many or most of these dimensionsor qualities quantifiable. Moreover, since at anypoint of time it may be possible to observe different’quality’ combinations selling at different prices, onemay be able to estimate (impute) the price (value) ofthese dimensions at the margin".84 That is, eachcommodity i may be said to have n qualities)tii (j=i, . . . , n) indicated by n quality indicators
71i (j=I, . . . , n). Using this notation, we mayexpress p~, the price of i, as a function of he asfollows:--
(9.I) p,=f(a0), j= .... ,
from which we may derive
~Pi d~,j(9.2) dpi=~_. ~.. "
1
34Z. Griliches, "Measurement of Price and Quality Changes"Models of Income Determination (Studies in Income and Wealth,Vol. 28; Conference on Research in Income and Wealth),1964, p. 39I.
43

i.e. the change in price of the ith good, which wouldhave occurred if the jth quality indicator Ae wereincreased by d~0., ceteris paribus, is represented by(opl/a)~7)d)q).. This dpl is the hypothetical priceincrease--the increase that one would expect fromthe function: the actual price increase, dpia may bedifferent. Thus, we may write
(9.3) dp a=dp’ +dp
where dp’i is the element of price change unexplainedby quality changes, i.e. dp’i measures the pure pricechange. Thus, this approach offers a method of con-vetting quality changes into corresponding pricechanges. To do this, some estimate of dpddAq isneeded. This can be obtained once a set of indicatorsAq for the quality characteristics have been selected,and the functional relationship specified in (9.1)obtained by means of cross-section price-specifica-tion regressions.
Confining attention, for simplicity, to the linearcase, let the expected price per conventional unitp, be
n
(9.4) pc=a+ 21 bix~j-=i
where a and the bi are regression coefficients and x~is the quantum of quality j. If the prices per con-ventional unit in base and current period for varietiesare Po and p~, for which the known quality quantaare respectively Xjo and xi~, j=I .... , n, thenthe corrected price index is clearly:--
(9.5) r _ p’o~ Pog
where
(9.6) g=P4/P4--=(a+,S, bixj~)[(a+Zbsxio).
Obviously the method can be adapted to prices at thecommodity level (some kind of average of thevariety quotations), provided that the quantumquality content of the commodity is known at thetwo periods. We may have determined regression(9.4) for base and current periods inevitably findingdifferent sets of regression coefficients for the twoperiods, in which case two estimates of g, namelygo and gx would become available; exactly as in thecase of classical price index theory, g in (9.5) mightbe taken as the geometric mean of go and g~ whichshould not be very different in value. Our successin quantifying quality characteristics will beadjudged by the value of R2 of the regression. Thefurther R~ recedes from unity the less our confidencethat our set of characteristics is that to whichpurchasers attach significance. We now try toobtain equation (9.4) for motor cars in Ireland in1966.
t4
The objective now becomes to establish a priceindex number corrected for quality changes for eachcommodity. In general multivariate regressionanalysis will be used, the variables dependent and in-dependent, at any given time, being price perconventiomfl unit-e.g, per yard, per ton, etc.--(dependent) and the n measures of the variousqualities of the varieties of the commodity included.These measures (as in our application which follows)may include I and o for some "dummy" variables:for variables possessing the quality in question, (i);for variables not possessing the quality, (o); this kindof variable may be very useful for the purposecontemplated in relation perhaps to a highlyadvertised brand name. It is important to note thatwe accept market valuations on the qualities whichmay appear irrational from strict logic; for instance,at the present time quantity of material in women’sgarments is almost certainly negatively correlatedwith price; at other times the contrary may be true.The value assigned to a given quality may differfrom time to time, due to changes in the publictaste, and therefore demand.
Quantification of Quality of Motor Cars in IrelandThe dependent variable is the natural log of list
prices of new cars as at December i6th, 1966; datafor 47 cars were used. The prices are those recom-mended by the Society of Irish Motor Traders, andrefer only to new cars. Details regarding qualityspecifications are taken from the reviews publishedin Motoring Which? and Motoring Life. The in-dependent variables are as follows:--
xl:engine capacity, measured in iooo ccsx2: engine power, measured in ioo bhp (net)x8: economy, measured in hundreds of miles per
gallon of petrol
"Dummy" variables were used to quantify otherqualities as follows--
x4: reliabilityx5: handling performancexs: interior comfortxT: car manufactured by firm Fxs: car manufactured by firm G
If a particular model of car was explicitly regardedby the motoring press as reliable, then a value of xwas given to x~, and the value o was givert to therest. A similar approach was adopted for each ofthe other qualities indicated by dummies.
Strong coUinearity was found to exist between35
some of the independent variables--Table 29. This
35We are indebted to Mr. Dermot Harrington, of An ForasTalfintais, for performing the regression computations on thecomputer of Art Foras.

point was also noted in an American study of thesame problem,a6 In an attempt to isolate this
feature, the 47 observations of car specifications were
divided into three groups--A (15 makes) those of
engine capacity less than ilOO ccs; B (14 makes)
those between 1ioi ccs and 15oo ccs; C (I8 makes)
those between 15Ol ccs and 2ooo ccs. Correlationcoefficients were also calculated for the independent
variables in each group.
TABLE 29: CORRELATION COEFFICIENTS BETWEENTHE INDEPENDENT VARIABLES xl, 12, 13, TAKEN
IN PAIRS
11~ X~ 11, X8 Xl~ X8
Group A o"91 --0"84 --0"75Group B 0"38 --0"83 --o.16Group C 0’83 --0.80 --o.71All Groups o’9o --o’83 --0’74
It will be noted that there is a high positive correla-
tion between x1 (capacity) and x2 (power) in eachcase except Group B, and that there is a strong
negative correlation between x1 and 13 (economy) in
all groups. The correlation between x2 and xs isstrongly negative except in group B.
Our regression plan envisaged using as regressors
36The Price Statistics of the Federal Government, (PriceStatistics Review Committeee of NBER) i961, p. 18o.
(i) variables 1-3, (ii) variables 1-6 and (iii) variables1-8 for the ear groups A, B, C and All. The results
are given in Table 3°. Regressions are missing for
(ii) B and (iii) A and B because in these cases one
dummy variable had constant values (o or I)throughout the group.
While the Re’s as a group are rather dis-
appointingly low (i.e. the regression formulae donot afford a particularly good representation of the
price data) all the equations are overwhelminglysignificantm, except those numbered 6 and 8: with
these exceptions the value of R2 is greater than its
o.5% probability critical value. Equation No. 6 is,
however, significant at the 5% probability level.We confine our comment about the coefficients to
the six equations, numbered i, z, 4, 5, 7, 9, as those
with highest R2 and therefore most useful forrepresentation purposes. The most significant re-
gressor throughout is No. z--engine power, the
coefficient of which is significant at the 5 % prob-
ability level at least in the case of equations i, 4, 7and 9, i.e. in four of the six equations we deem
worth consideration; in one of the exceptions,
equation 2, both variables I and 3 are significant
(but not z).The coefficients with largest t’s are those
ruBy the F(fx, fO=f~R2[fl(I--R2) test; DF’s ft=numberof variables, f2 = T--f1-- I, where T is number of observations
TABLE 3O: REGRESSION OF LOG CAR PRICES ON SETS OF INDEPENDENT VARIABLES
EquationNo.
5
6
7
8
9
Parallel--IO
1I
12
Group
A
B
C
All
A
C
All
C
All
All
All
All
Constant
PCl pc fi pc8
6.12 --0"07 I"5I --o’5I(0"37) io’59) (o.66)
3"2I 1"7o -o’13 4"22(0"35) [o’I9) (r24)
5"68 o’I4 o’74 1"75(o.18) [0"35) (2.i8)
6"36 0"22 0"48 --0.70(O’II) ’,o"19) (0"57)
5"90 o’o8 I’I4 --0"3°
(0"36) [0"57) (0"73)5"89 0’07 0’79 o’86
(0"25) [o’47) (2"53)6.15 o.I6 0’62 --0"58
(0"12) (0"23) (0"58)6"55 o"13 0"59 --0"45
(0"29) (0"73) (2"78)6"24 o"I7 o’63 --0"78
(0"12) (0"22) (0"58)f6"35-~ 6.39 --o’I8 o’42 --0’58L6.48 (o.ii) (0"20) (0"59)
F6.i5~6.i7 o.i2 0.56 -o.46[.6"27 (o"12) (0"23) (0"60)
["6"18 !"{6"23 --0"14 0"58 --0.60[6"29
, (0"12)(0"22) (0"60)
Coefficient of--
pc4 18 pc6
R$
.8o
"75
"59
0’03 0"05(0"07) (0’o7)
--0"03 o’Io(O’I9) (O’11)0’04 0"07
(0"07) (0"05)--0.20 --0.05
(0"36) (o"I7)0"04 0"05
(0"07) (0"05)
0"04 0’07(0"07) (0’05)
0"04 0"05(0’07) (0"05)
"79
o’13 .88(0"06)o’o9 "63
(o’I6)0"09 "81
(0"07)o.16 --o’19 --0’23 "70
(0"20) (0"29) (o’I8)O’IO [ O’OI --O’I4 "83
(o’o7) i (0"07) (0’06)
"$o
0"II(0"07)
0"11(0"07)
0.03 ! --o.13(o’o7) (o’o7)
"53
"58
Note: The values in brackets ( ) under the coefficient estimates are estimated standard deviations.
45
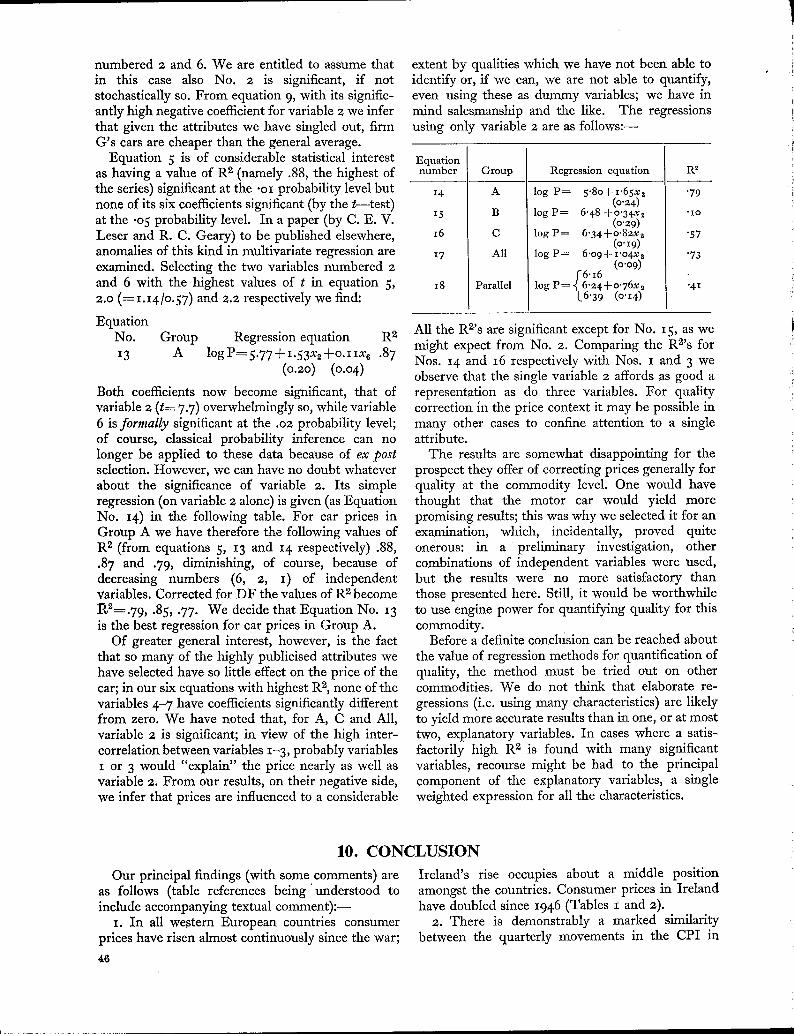
numbered z and 6. We are entitled to assume thatin this case also No. z is significant, if notstochastically so. From equation 9, with its signific-antly high negative coefficient for variable 2 we inferthat given the attributes we have singled out, firmG’s cars are cheaper than the general average.
Equation 5 is of considerable statistical interestas having a value of R2 (namely .88, the highest ofthe series) significant at the .oI probability level butnone of its six coefficients significant (by the t--test)at the .05 probability level. In a paper (by C. E. V.Leser and R. C. Geary) to be published elsewhere,anomalies of this kind in multivariate regression areexamined. Selecting the two variables numbered 2and 6 with the highest values of t in equation 5,2.0 (=I.I4/o.57) and 2.z respectively we find:
EquationNo. Group Regression equation R2
13 A logP=5.77+:t.53xo+o.ixx6 .87(0.20) (0.04)
Both coefficients now become significant, that ofvariable z (t= 7.7) overwhelmingly so, while variable6 is formally significant at the .02 probability level;of course, classical probability inference can nolonger be applied to these data because of ex postselection. However, we can have no doubt whateverabout the significance of variable 2. Its simpleregression (on variable 2 alone) is given (as EquationNo. 14) in the following table. For car prices inGroup A we have therefore the following values ofR~ (from equations 5, I3 and 14 respectively) .88,.87 and .79, diminishing, of course, because ofdecreasing numbers (6, 2, I) of independentvariables. Corrected for DF the values of R2 become~2=.79, .85, .77. We decide that Equation No. 13is the best regression for car prices in Group A.
Of greater general interest, however, is the factthat so many of the highly publicised attributes wehave selected have so little effect on the price of thecar; in our six equations with highest R2, none of thevariables 4-7 have coefficients significantly differentfrom zero. We have noted that, for A, C and All,variable 2 is significant; in view of the high inter-correlation between variables I-3, probably variablesI or 3 would "explain" the price nearly as well asvariable 2. From our results, on their negative side,we infer that prices are influenced to a considerable
extent by qualities which we have not been able toidentify or, if we can, we are not able to quantify,even using these as dummy variables; we have inmind salesmanship and the like. The regressionsusing only variable z are as follows:--
Equationnumber Group Regression equation R2
I4
15
i6
17
I8
A
B
C
All
Parallel
log P= 5"8o+1"65x2(0"24)
log P= 6’48 +o’34x2(0’29)
log P= 6"34+o’82x2(o"I9)
log P= 6"o9+I’O4Xa(0’09)
F’6’16log P= ~6"z4+o’76x~
L6"39 (o’14)
’79
"IO
"57
"73
All the R2’s are significant except for No. 15, as wemight expect from No. 2. Comparing the R2’s forNos. 14 and 16 respectively with Nos. I and 3 weobserve that the single variable 2 affords as good arepresentation as do three variables. For qualitycorrection in the price context it may be possible inmany other cases to confine attention to a singleattribute.
The results are somewhat disappointing for theprospect they offer of correcting prices generally forquality at the commodity level. One would havethought that the motor car would yield morepromising results; this was why we selected it for anexamination, which, incidentally, proved quiteonerous: in a preliminary investigation, othercombinations of independent variables were used,but the results were no more satisfactory thanthose presented here. Still, it would be worthwhileto use engine power for quantifying quality for thiscommodity.
Before a definite conclusion can be reached aboutthe value of regression methods for quantification ofquality, the method must be tried out on othercommodities. We do not think that elaborate re-gressions (i.e. using many characteristics) are likelyto yield more accurate results than in one, or at mosttwo, explanatory variables. In cases where a satis-factorily high R2 is found with many significantvariables, recourse might be had to the principalcomponent of the explanatory variables, a singleweighted expression for all the characteristics.
10. CONCLUSION
Our principal findings (with some comments) areas follows (table references being "understood toinclude accompanying textual comment):--
I. In all western European countries consumerprices have risen almost continuously since the war;
t6
Ireland’s rise occupies about a middle positionamongst the countries. Consumer prices in Irelandhave doubled since I946 (Tables I and 2).
2. There is demonstrably a marked similaritybetween the quarterly movements in the CPI in
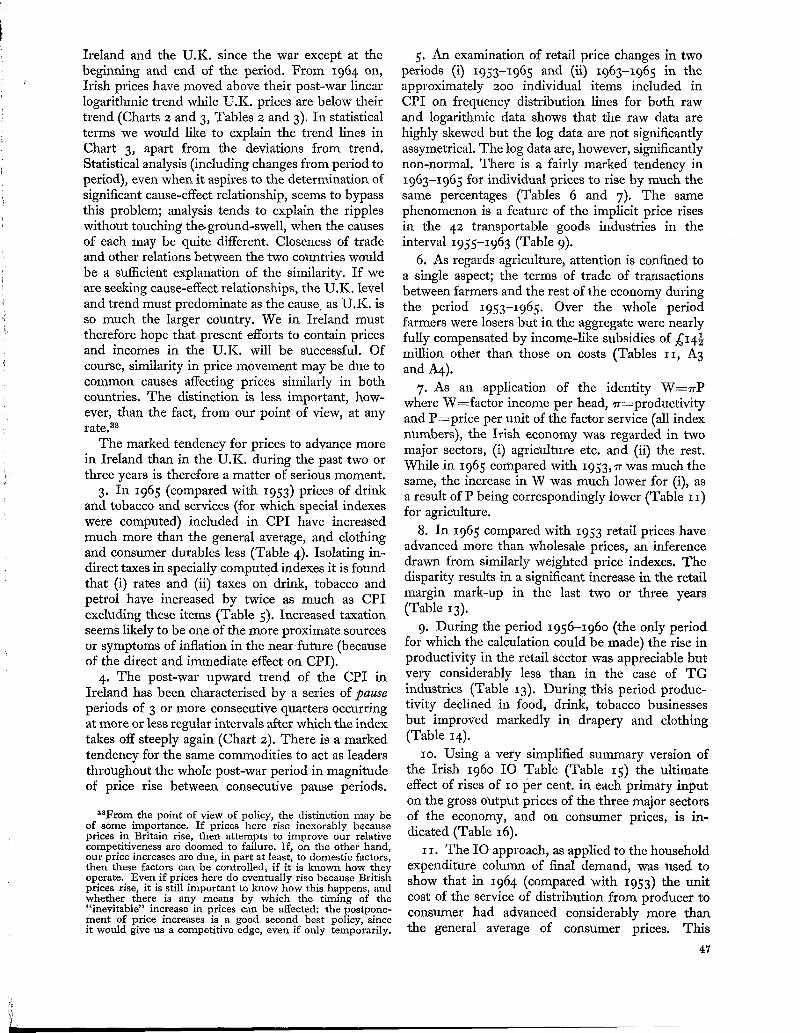
Ireland and the U.K. since the war except at thebeginning and end of the period. From 1964 on,Irish prices have moved above their post-war linearlogarithmic trend while U.K. prices are below theirtrend (Charts 2 and 3, Tables 2 and 3). In statisticalterms we would like to explain the trend lines inChart 3, apart from the deviations from trend.Statistical analysis (including changes from period toperiod), even when it aspires to the determination ofsignificant cause-effect relationship, seems to bypassthis problem; analysis tends to explain the rippleswithout touching the.ground-swell, when the causesof each may be quite different. Closeness of tradeand other relations between the two countries wouldbe a sufficient explanation of the similarity. If weare seeking cause-effect relationships, the U.K. leveland trend must predominate as the cause, as U.K. isso much the larger country. We in Ireland musttherefore hope that present efforts to contain pricesand incomes in the U.K. will be successful. Ofcourse, similarity in price movement may be due tocommon causes affecting prices similarly in bothcountries. The distinction is less important, how-ever, than the fact, from our point of view, at anyrate.s8
The marked tendency for prices to advance morein Ireland than in the U.K. during the past two orthree years is therefore a matter of serious moment.
3. In i965 (compared with I953) prices of drinkand tobacco and services (for which special indexeswere computed) included in CPI have increasedmuch more than the general average, and clothingand consumer durables less (Table 4)- Isolating in-direct taxes in specially computed indexes it is foundthat (i) rates and (ii) taxes on drink, tobacco andpetrol have increased by twice as much as CPIexcluding these items (Table 5). Increased taxationseems likely to be one of the more proximate sourcesor symptoms of inflation in the near future (becauseof the direct and immediate effect on CPI).
4. The post-war upward trend of the CPI inIreland has been characterised by a series of pauseperiods of 3 or more consecutive quarters occurringat more or less regular intervals after which the indextakes off steeply again (Chart z). There is a markedtendency for the same commodities to act as leadersthroughout the whole post-war period in magnitudeof price rise between consecutive pause periods.
3SFrom the point of view of policy, the distinction may beof some importance. If prices here rise inexorably becauseprices in Britain rise, then attempts to improve our relativecompetitiveness are doomed to failure. If, on the other hand,our price increases are due, in part at least, to domestic factors,then these factors can be controlled, if it is known how theyoperate. Even if prices here do eventually rise because Britishprices rise, it is still important to know how this happens, andwhether there is any means by which the timing of the"inevitable" increase in prices can be affected: the postpone-ment of price increases is a good second best policy, sinceit would give us a competitive edge, even if only temporarily.
5. An examination of retail price changes in twoperiods (i) 1953-1965 and (ii) 1963-1965 in theapproximately 2oo individual items included inCPI on frequency distribution lines for both rawand logarithmic data shows that the raw data arehighly skewed but the log data are not significantlyassymetrical. The log data are, however, significantlynon-normal. There is a fairly marked tendency ini963-I965 for individual prices to rise by much thesame percentages (Tables 6 and 7). The samephenomenon is a feature of the implicit price risesin the 42 transportable goods industries in theinterval 1955-1963 (Table 9).
6. As regards agriculture, attention is confined toa single aspect; the terms of trade of transactionsbetween farmers and the rest of the economy duringthe period i953-i965. Over the whole periodfarmers were losers but in the aggregate were nearlyfully compensated by income-like subsidies of £I4½million other than those on costs (Tables II, A3and A4).
7. As an application of the identity W=TrPwhere W=factor income per head, 7r=productivityand P--price per unit of the factor service (all indexnumbers), the Irish economy was regarded in twomajor sectors, (i) agriculture etc. and (ii) the rest.While in i965 compared with I953,~r was much thesame, the increase in W was much lower for (i), asa result of P being correspondingly lower (Table I I)for agriculture.
8. In i965 compared with I953 retail prices haveadvanced more than wholesale prices, an inferencedrawn from similarly weighted price indexes. Thedisparity results in a significant increase in the retailmargin mark-up in the last two or three years(Table I3).
9. During the period i956-i96o (the only periodfor which the calculation could be made) the rise inproductivity in the retail sector was appreciable butvery considerably less than in the case of TGindustries (Table i3). During this period produc-tivity declined in food, drink, tobacco businessesbut improved markedly in drapery and clothing(Table i4).
Io. Using a very simplified summary version ofthe Irish i96o IO Table (Table i5) the ultimateeffect of rises of Io per cent. in each primary inputon the gross output prices of the three major sectorsof the economy, and on consumer prices, is in-dicated (Table I6).
11. The IO approach, as applied to the householdexpenditure column of final demand, was used toshow that in i964 (compared with i953) the unitcost of the service of distribution from producer toconsumer had advanced considerably more thanthe general average of consumer prices. This
47
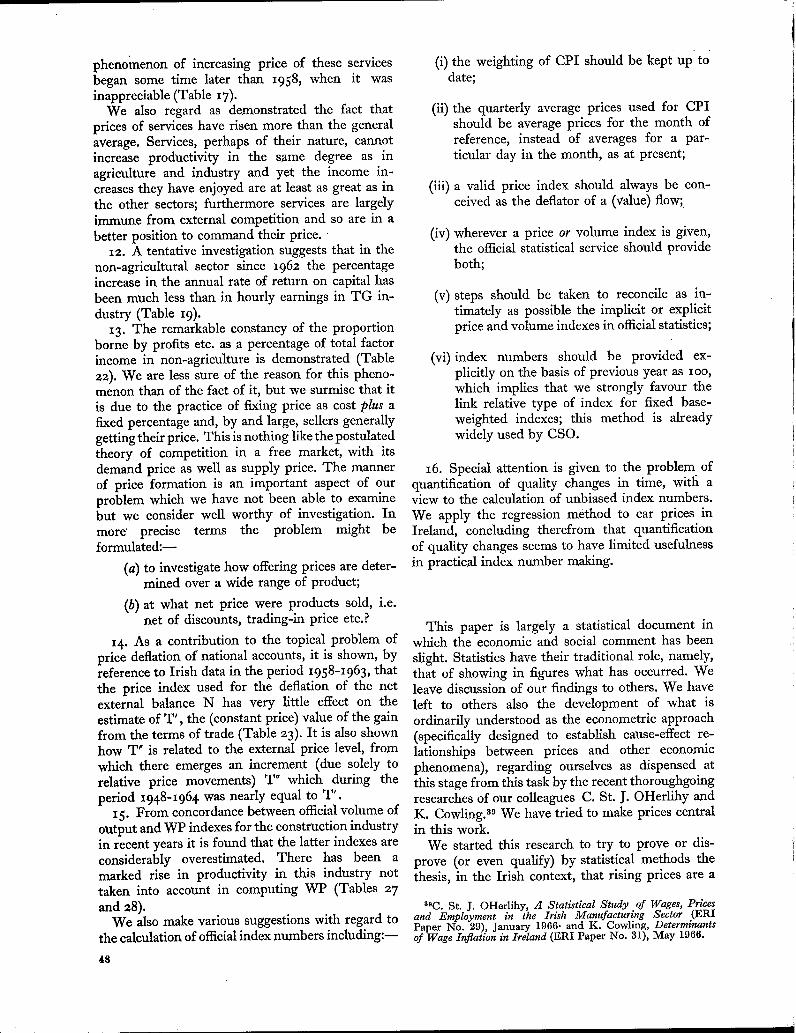
phenomenon of increasing price of these servicesbegan some time later than I958, when it wasinappreciable (Table x7).
We also regard as demonstrated the fact thatprices of services have risen more than the generalaverage. Services, perhaps of their nature, cannotincrease productivity in the same degree as inagriculture and industry and yet the income in-creases they have enjoyed are at least as great as inthe other sectors; furthermore services are largelyimmune from external competition and so are in abetter position to command their price.
IZ. A tentative investigation suggests that in thenon-agricuhural sector since I96z the percentageincrease in the annual rate of return on capital hasbeen much less than in hourly earnings in TG in-dustry (Table I9).
13. The remarkable constancy of the proportionborne by profits etc. as a percentage of total factorincome in non-agriculture is demonstrated (Tablez2). We are less sure of the reason for this pheno-menon than of the fact of it, but we surmise that itis due to the practice of fixing price as cost plus afixed percentage and, by and large, sellers generallygetting their price. This is nothing like the postulatedtheory of competition in a free market, with itsdemand price as well as supply price. The mannerof price formation is an important aspect of ourproblem which we have not been able to examinebut we consider well worthy of investigation. Inmore’ precise terms the problem might beformulated:--
(a) to investigate how offering prices are deter-mined over a wide range of product;
(b) at what net price were products sold, i.e.net of discounts, trading-in price etc.?
14. As a contribution to the topical problem ofprice deflation of national accounts, it is shown, byreference to Irish data in the period I958-I963, thatthe price index used for the deflation of the netexternal balance N has very little effect on theestimate of T’, the (constant price) value of the gainfrom the terms of trade (Table 23). It is also shownhow T" is related to the external price level, fromwhich there emerges an increment (due solely torelative price movements) T~ which during theperiod x948-I964 was nearly equal to T’.
15. From concordance between official volume ofoutput and WP indexes for the construction industryin recent years it is found that the latter indexes areconsiderably overestimated. There has been amarked rise in productivity in this industry nottaken into account in computing WP (Tables 27and 28).
We also make various suggestions with regard tothe calculation of official index numbers including:m
48
(i) the weighting of CPI should be kept up todate;
(ii) the quarterly average prices used for CPIshould be average prices for the month ofreference, instead of averages for a par-ticular day in the month, as at present;
(iii) a valid price index should always be con-ceived as the deflator of a (value) flow;.
(iv)wherever a price or volume index is given,the official statistical service should provideboth;
(~) steps should be taken to reconcile as in-timately as possible the implicit or explicitprice and volume indexes in official statistics;
(vi)index numbers should be provided ex-plicitly on the basis of previous year as Ioo,which implies that we strongly favour thelink relative type of index for fixed base-weighted indexes; this method is alreadywidely used by CSO.
I6. Special attention is given to the problem ofquantification of quality changes in time, witla aview to the calculation of unbiased index numbers.We apply the regression method to car prices inIreland, concluding therefrom that quantificationof quality changes seems to have limited usefulnessin practical index number making.
This paper is largely a statistical document inwhich the economic and social comment has beenslight. Statistics have their traditional role, namely,that of showing in figures what has occurred. Weleave discussion of our findings to others. We haveleft to others also the development of what isordinarily understood as the econometric approach(specifically designed to establish cause-effect re-lationships between prices and other economicphenomena), regarding ourselves as dispensed atthis stage from this task by the recent thoroughgoingresearches of our colleagues C. St. J. OHerlihy andK. Cowling39 We have tried to make prices centralin this work.
We started this research to try to prove or dis-prove (or even qualify) by statistical methods thethesis, in the Irish context, that rising prices are a
s~C. St. J. OHerlihy, A Statistical Study of Wages, Pricesand Employment in the Irish Manufacturing Sector (ERIPaper No. 29), January 1966. and K. Cowling, Determinantsof Wage Inflation in Ireland (ERI Paper No. 31), May 1966.

necessary condition for economic advance, whilerecognising its relevance in all advanced economiesin modern times. We have not succeeded in provingit statistically, but believe it to be true, in the main.We have even begun to doubt if, indeed, it requiresstatistical verification, except to qualify it. In thefirst draft, we discussed this at length, its causesand social effects, but decided to eliminate thesection as out of tone with the rest of the paper.
Table A2 represents one of our efforts to copewith the aforementioned affirmation. We place thetable, and Chart 6 based on it, on record for the useof students. The Chart shows that, in the U.K.,during the last half of the i9th century, prodigiouseconomic advance was accompanied by generallyfalling prices. In the century before World War IIincreasing prices were not always a concomitant ofeconomic advance.
Some means must be found for achievingeconomic advance without generally rising prices;as a personal viewpoint, we would willingly con-template a lower (quantum) rate of GNP per caputthan at present planned (without reference to prices)if thereby stable prices could be ensured. Ill ad-vanced economies, generally rising prices are evilsto be eradicated. Rising prices sap the moral fibreof the community by endowing some individualswith unmerited gains and by reducing the standardof living of the lower and constant income classes,unless compensated for by a policy of income re-distribution, entailing high rates of taxation. Risingprices threaten internal peace because they promote
labour troubles, and external peace because of thedanger of a deterioration in the terms of tradebetween economically advanced and less advancedcountries.
We are impressed by the strength of the greatpos~-war upsurge of paces (little affected, be itnoted, by booms and depressions). Observationsuggests that most common attitudes and actionsare conducive to rising prices. Increases in realincome stimulate man’s insatiable desire for more:only by securing a higher income can his potentialdemand become effective. Because we would alllike more (if it were not for the constraint of income)demand is potentially excessive.40 We suggest that,since our potential demands are not dependent onour social class--in this sense, we are almost a class-less society, everybody wanting everything--thereis a persistent pressure on prices because of bothexcess effective demand and rising costs of produc-tion (arising from real income increases). The pointis not pursued here, though it has an extensiveliterature, for the reason given above.
Our analysis, in Section 2 of the paper, convincesus that Ireland cannot stabilize prices unless anduntil the U.K. succeeds in doing so. At all times,the Irish price trend must be kept in line with thatof U.K., and, if possible, a shade below it. In thelast two years covered by this study, Chart 3 showsa disquieting aberration in the contrary sense.
~°The authors of The Problem of Rising Prices (OECD,Paris, 1961), found that Ireland was free from excess demand(in the technical economic sense) during 1953-1959. In oursense of the term, potential demand is endemically "excess".
49
\
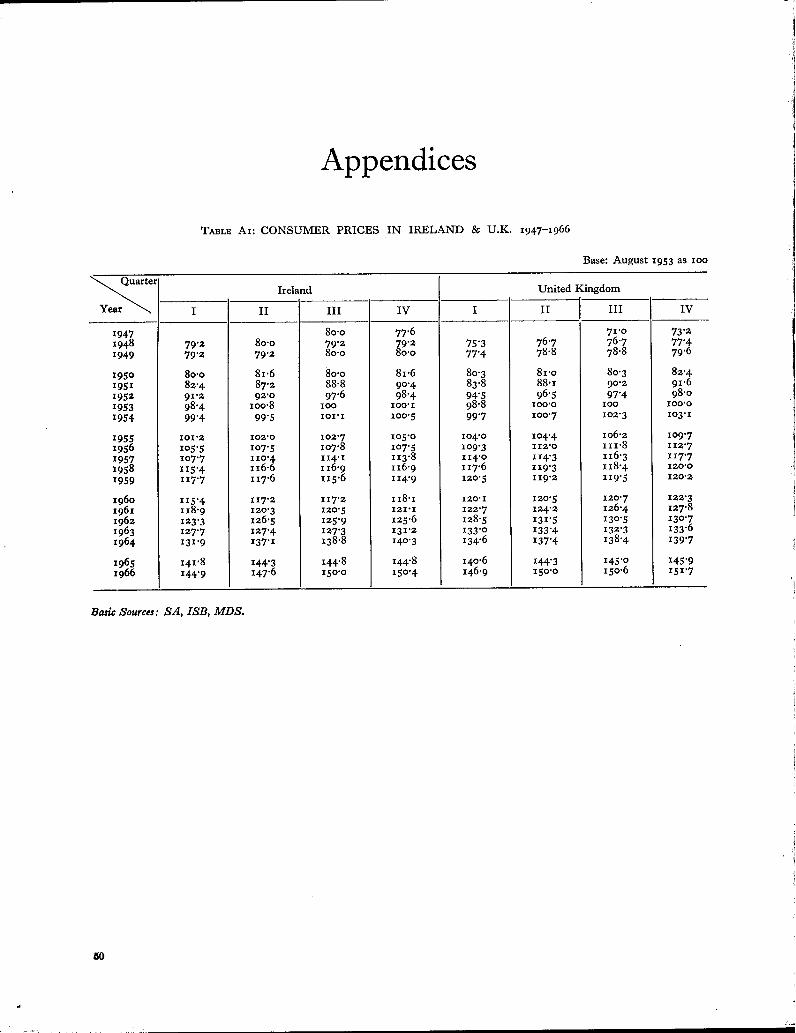
Appendices
T~a3LE At: CONSUMER PRICES IN IRELAND & U.K. I947-1966
Base: August 1953 as too
~artyear ~t
Ireland United Kingdom!
I II III IV I II III IV
I947 80"0 77"6 7I’0 73"z1948 79’2 80"0 79"2 79"2 75"3 76"7 76"7 77’41949 79"Z 79"2 80"0 8o’o 77"4 78.8 78.8 79"6
195o 8o’o 81.6 80"0 81"6 80"3 81.o 80"3 82’4I951 82"4 87"2 88.8 90"4 83"8 88.1 90"2 91"6I95Z 9I’2 92’0 97"6 98"4 94"5 96"5 97"4 98"o1953 98"4 10o"8 IOO IO0"l 98"8 I00"0 I00 IO0"O
I954 99"4 99"5 IOI’I lOO’5 99"7 ioo.7 lO2"3 I03"I
1955 101"2 102"0 lO2"7 lO5"O lO4"O lO4"4 IO6"2 I09"71956 lO5"5 I07"5 lO7.8 IO7"5 lO9"3 II2"O II1"8 II2"7
1957 lO7"7 11o"4 II4"l 113"8 114"o 114"3 II6"3 I I7"71958 115"4 116"6 116.9 116"9 117"6 II9"3 118"4 I20"0
1959 117’7 II7"6 115"6 II4"9 12o’5 II9"2 119"5 I20"2
196o 115’4 II7"2 117"2 118"1 120’I 12o"5 12o"7 122"3I96I 118"9 I20"3 12o"5 I21"I 122’7 124"2 I26"4 127"81962 I23"3 126’5 125"9 125"6 128"5 I31"5 13o’5 I3o"71963 I27"7 127"4 127"3 13I’2 133.o 133"4 I32"3 133"6x964 131"9 137"1 138"8 I40’3 134"6 137"4 138"4 I39"7
1965 I41"8 I44"3 144"8 I44"8 14o’6 144"3 I45"o 145"91966 144’9 147’6 15o’o I50"4 146"9 i5o.o I50"6 151’7
Basic Sources: ,SA, LYlB, MD£1.
50
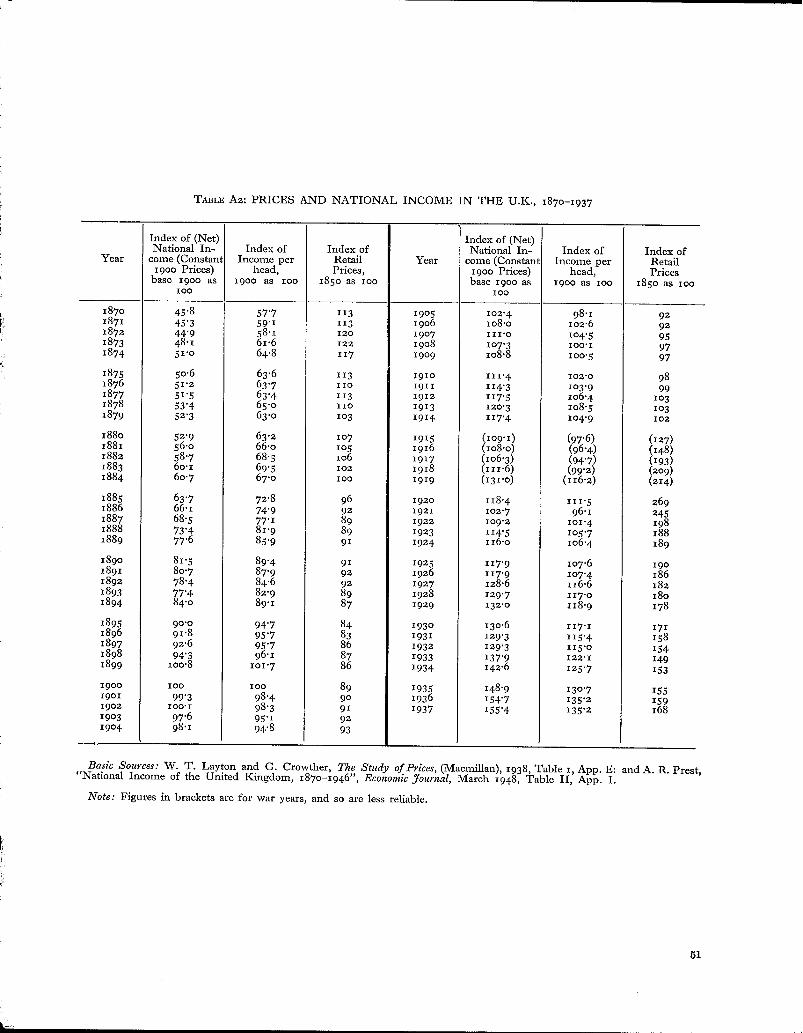
TABLE A2: PRICES AND NATIONAL INCOME IN THE U.K., 187o-1937
Index of (Net) Index of (Net)National In- Index of Index of National In- Index of
Year come (ConstantIndex of
Income per Retail Year come (Constant Income per Retail19oo Prices) head, Prices, 19oo Prices)
base 19oo ashead, Prices
I9OO as IOO I85o as ioo base 19oo as I9OO as ioo 185o as IOOIOO ioo
187o 45"8 57"7 1131871
19o5 lO2"4 98"1 9245"3 59"1 113 19o6 lO8.O lO2"6
187292
44"9 58"1 12o iii.o1873
19o748"I
lO4"5 956I’6 122 1908 IO7.3 ioo.l
187497
51"o 64"8 117 19o9 lO8.8 Ioo’5 97
1875 50"6 63"6 113 191o In’4 102"O 981876 51"2 63"7 IiO 19111877
114"3 103"963"499
51"5 113 1912 117"5 106"4 lO31878 53"4 65"0 IiO 1913 120"3 lO8"5 Io31879 52’3 63"0 lO3 1914 II7’4 lO4.9 1o2
188o 52"9 63"2 lO7 (lO9"1)1881
1915 (97’6) (127)56"0 66.o lO5 1916 (lO8.O)
1882 58.7(96"4) (I48)
68"5 lO6 (lO6"3)1883
191760"I (94"7) (193)
69’5 IO2 I918 (III’6) (99"2) (209)1884 6o’7 67.o IOO 1919 (131"o) (116"2) (214)
1885 63"7 72"8 96 II8"41886192o
66.1111"5 269
I88774"9 92
68"51921 lO2"7 96"1 245
77"1 89 1922 lO9.2 IO1"4 198i888 73"4 81"9 89 1923 114"5 lO5"7 1881889 77"6 85"9 91 1924 II6"O lO6’4 189
I89O 81"5 89"4 911891 8o’7
1925 117’9 Io7"6 19o87"9 92 1926 117’9 lO7"4 I86
I892 78"4 84’6 92 1927 128"6 116"6 I821893 77"4 82"9 89 1928 129’7 II7"O I8o1894 84.o 89"1 87 1929 132"o IIS"9 178
I895 90"0 94"7 841896
13o.691"8
193o 117"1 17I95"7 83
18971931 129"3 115"4 I58
92"6 95"7 86I898
193296"1
129"3 115"0 15494"3 87
1899 lOO.81933 137"9 122"1 149IOI"7 86 1934 142.6 125"7 I53
IO0 89 1935 148’9 13o’798"415519oo ioo
99"3 90 1936 154"7 I35"2 15919Ol19o2 I00"I 98"3 91 1937 155"4 135"2 16819o3 97’6 95"I 92I9O4 98’1 94"8 93
Basic Sources: W. T. Layton and O. Crowther, The Study of Prices, (Macmillan), 1938, Table 1, App. E: and A. R. Prest,"National Income of the United Kingdom, i87o-i946", Economic Journal, March 1948, Table II, App. I.
Note: Figures in brackets are for war years, and so are less reliable.
51
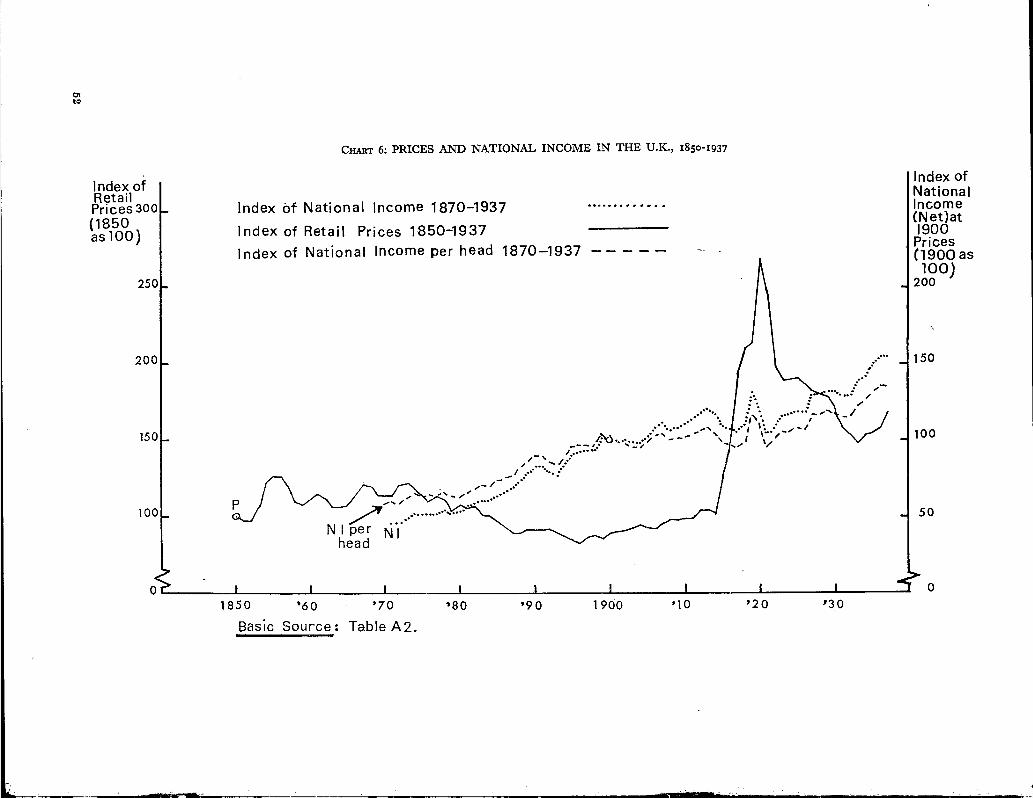
Index ofRetailPrices3OO(1850aslO0)
250
200
150 _
100 _
CHART 6: PRICES AND NATIONAL INCOME IN THE U.K., z85o-z937
Index of National Income 1870-1937 .............
Index of Retail Prices 1850-1937
Index of National Income per head 1870-1937 -
~- o ¯ ,°°% oo :: (/~
:- .~ ,,
¯ ..’" " .’.i". :" ,2,° %°,°° ~% °¯ ¯
"/.;" ":.:" v. J¯o¯’°° *- /,, .:../.-"
I ..." "..-" . d ~ f~ o;"
~%. /4 °1.oO
p . o,°¯° °
I I I ! ! I I I I1850 ~60 ’70 ~80 ’90 1900 ,10 ~20 s30
Basic Source: TableA2.
Index ofNationalIncome(Net)at1900
Prices(1900 as
100)20O
150
. 100
_ 50
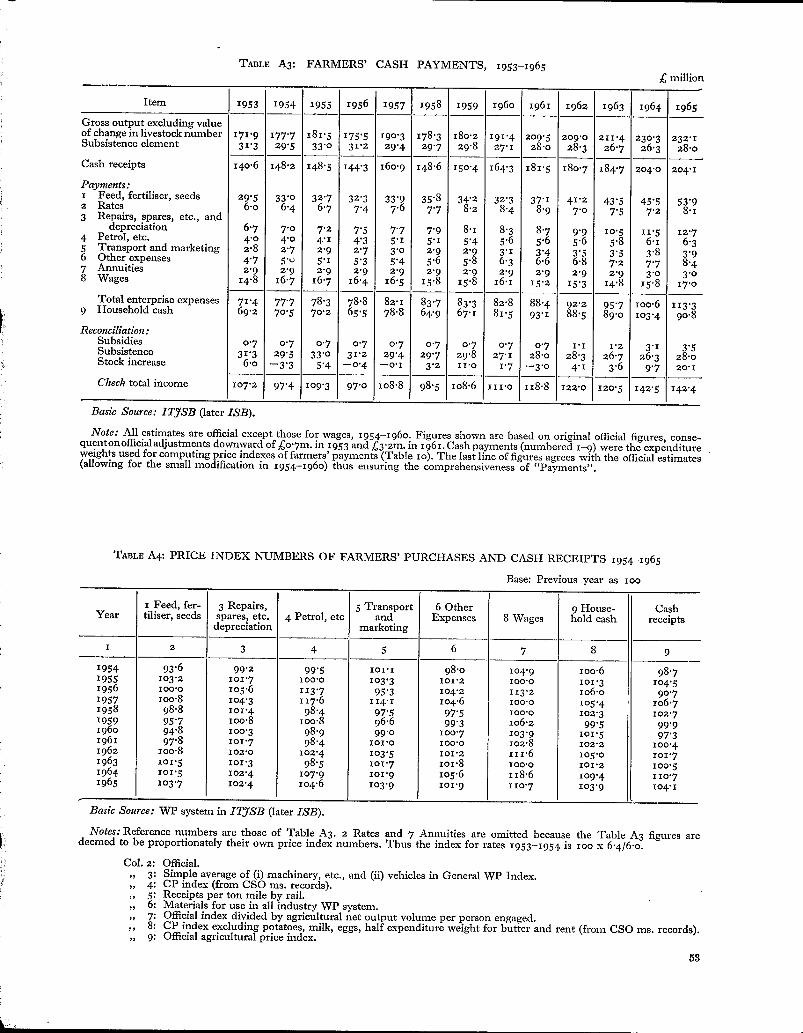
TABLE A3: FARMERS’ CASH PAYMENTS, 1953-1965
£ million
Item 1953 1954 I955 I956 1957 I958 1959 196o i96i 1962 1963 I964 I965
Gross output excluding valueof change in livestock number 171"9 18I"5 18o"2Subsistence element
177"7 175"5 19o"3 178.3 191’4 209"5 209"0 211"4 230"3 232"131"3 29"5 33"0 31"2 29"4 29"7 a9’8 27.i 28.o 28’3 26"7 26"3 28"0
Cash receipts 14o"6 148"2 148"5 I44"3 16o.9 148.6 15o"4 164.3 18i ’5 18o"7 184"7 204.0 204. i
Payments:
29"5 33"0Rates
32"7 32"3 33"9 35"86.0
34"2 32"36.4 6.7 7.6
37"I 41 "2 43 "5 45"5 53"91 Feed, fertiliser, seeds
Repairs, spares, etc., and7"4 7"7 8"Z 8’4 8"9 7"o 7"5 7’2 8"I
3depreciation 6"7 7.o 7"2 7"5 7"7 7"9 8"1 8"3 8’7 9"9 lO’5 11"5 12"7
4 Petrol, etc. 4.0 4.0 4.1g Transport and marketing
4"3 5.i 5.1 5"62.8
5"4 5"6 5"6 5"8 6"1 6"32"7 2"9 3.0
Other expenses2"7 2"9 2"9 3"I 3"4 3"5 3"5 3’8 3"9
4"7 5-G 5.1 5"3 5"4 5"6 5"8 6"3 6.6 6"87 Annuities 7"2 7"7 8"4
2"98
2"9Wages
2"9 2"9 2"9 2"9 2"9 2"9 2"9 2"9 2.9 3.o 3"oI4"8 16"7 16"7 16.4 16"5 15"8 15"8 I6"I 15"2 15"3 14"8 15"8 I7"O
Total enterprise expenses 71"4 77"7 78"3 78"8 82"I 83 "7 83"3 82"89 Household cash 69"2
88"4 92"2 95"7 lOO.6 113"370"5 70"2 65"5 78"8 64"9 67"1 81"5 93"I 88"5 89’0 lO3"4 9o’8
Reconciliation:0"7 0"7Subsistence
0"7 0"7 0.7 o’7 o’7 o’7 0"7 I’I 1"2 3"I 3"5Subsidies
31"3 31.2Stock increase
29"5 33"o 29"4 29"7 29"8 27’I 28’0 28"3 26"7 26"3 28"06"o --3"3 5"4 --o.4 --O’I 3"2 I I’O 1"7 --3.0 4"1 3’6 9"7 20"I
Check total income lO7"2 97 "4 io9.3 97"0 io8.8 98"5 lO8.6 llI’O 118"8 122"O 120"5 142"5 142’4
Basic Source: ITJSB (later ISB).
Note: All estimates are official except those for wages, 1954-196o. Figures shown are based on original official figures, conse-quentonofficialadjustments downward of £o’7m. in 1953 and £3"2m. in 1961. Cash payments (numbered 1-9) were the expenditureweights used for computing price indexes of farmers’ payments (Table I o). The last line of figures agrees with the official estimates(allowing for the small modification in 1954-196o) thus ensuring the comprehensiveness of "Payments".
TABLE A4: PRICE INDEX NUMBERS OF FARMERS’ PURCHASES AND CASH RECEIPTS I954-1965
Base: Previous year as ioo
I Feed, fer- 3 Repairs, 5 Transport 6 OtherYear tiliser, seeds 9 House- Cash
spares, etc. 4 Petrol, etc and Expenses 8 Wages hold cashdepreciation
receiptsmarketing
3 4 5 6 7 8 9I 2
1954 93"6 99"2 99"5 IOI’I 98’0 lO4"9 lOO’6 98"71955 lO3"2 Io1"7 I00"01956
lO3"3 101"2 I00’0 IOI"3 lO4.5lO5"6 113"7 lO4"2I00"8
95"3 II3’2 IO6"O 90"7100"0
1957 lO4"3 II7"6 II4"I lO4’6 IO0’O lO5"4 lO6.71958 98"8 lO1"4 98"4 97"5 97"5 IO0’O lO2"3 IO2"71959 95 "7 IOO’8 I00"8I96o
96"6 io6.294"8
99"3 99"5 99"9lOO.3 98.91961lOO.797"8
99’o lO3"9 lOl.5 97"3IOI"7 98"4 IOI’O IOO’O
I962lO2.8 102"2 lOO"4lOO.8 I02"0 lO2"4 lO3"5 111.6
1963IOI’2 Io5"o lO1"7IOI"5 lOI"3 98"5 101"8
I964Io1"7 IO0"O 101"2 100"5lO1"5 lO2"4 lO7"9 lOl.9 118.6
1965lO5"6 lO9"4 IlO"7lO3"7 lO2"4 lO4"6 IO3"9 lO1"9 1Io"7 lO3"9 lO4"1
Basic Source: WP system in ITJSB (later ISB).
Notes: Reference numbers are those of Table A3. 2 Rates and 7 Annuities are omitted because the Table A3 figures aredeemed to be proportionately their own price index numbers. Thus the index for rates 1953-1954 is ioo x 6.4/6.o.
Col. 2: Official.,, 3: Simple average of (i) machinery, etc., and (ii) vehicles in General WP Index.,, 4: CP index (from CSO ms. records).,, 5: Receipts per ton mile by rail.,, 6: Materials for use in all industry WP system.,, 7: Official index divided by agricultural net output volume per person engaged.,, 8: CP index excluding potatoes, milk, eggs, half expenditure weight for butter and rent (from CSO ms. records).,, 9: Official agricultural price index.
58
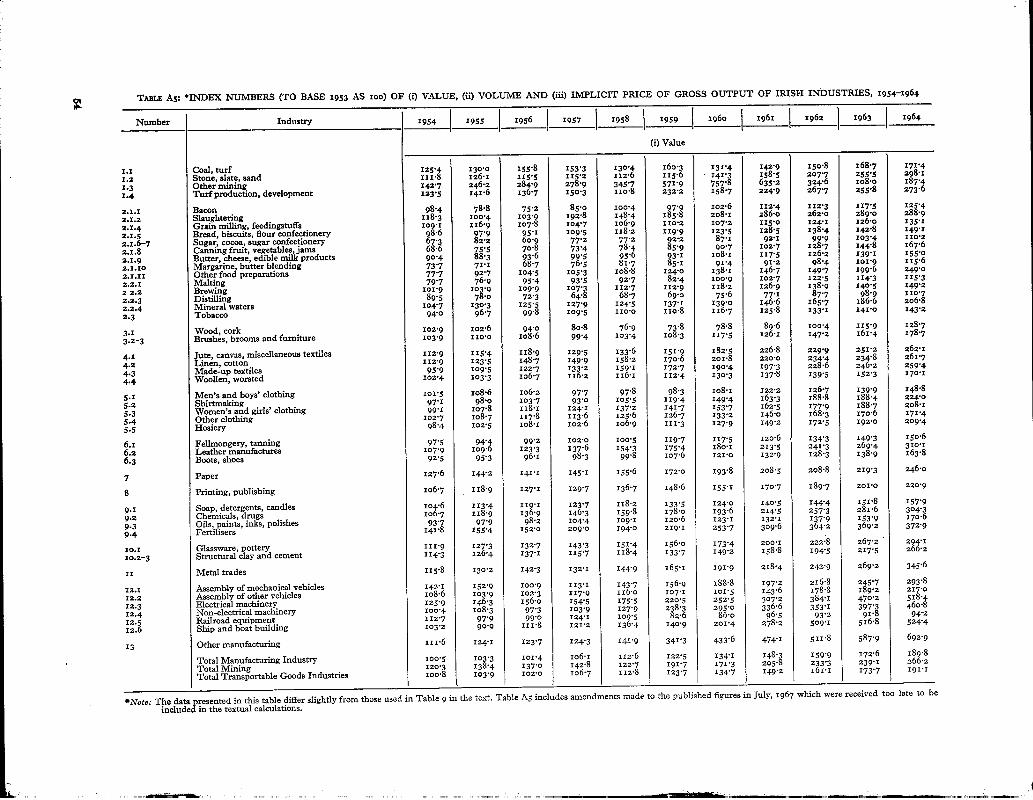
T.~LE AS: *INDEX NUMBERS (TO BASE 1953 AS zoo) OF (i) VALUE, (ii) VOLUME AND (iii) IMPLICIT PRICE OF GROSS OUTPUT OF IRISH INDUSTRIES, z954-1964
Number Industry 2954 1955 1956 1957 1958 1959 196o 1961 1962 1963 1964
(i) Value
15o’8 I68"7 I71"4i.I Coal, turf 125"4 13o-o 155"8 153"3 13o-4 16o"3 I31"4 I42"9
¯ 141-3 158"5 207"7 255"5 298"11.2 Stone, slate, sand 111"8 i26.1 115"5 115"2 112"6 115"6
635"2 324"6 lO8.O I87"41.3 Other mining I4-2"7 246"2 286"9 278"9 345"7 57I"9 757"8
267"7 255"8 273"61.4 Turf production, development 123"5 x41"6 136"7 z5o’3 zzo’8 232"2 158"7 224"9
lO2-6 112"4 112"3 117"5 I25"42.1.1 Bacon 98"4 78"8 75"2 85"0 ioo’4 97"9
2o8"I 286"0 262"0 289"0 288"92.1.2 Slaughtering 118"3 lOO’4 lO3"9 I92"8 I48"4 185"8
II0"2 lO7"2 115"o 124-1 126"o 135"12.1-4 Grain milling, feedingstuffs lO9"1 I16"9 lO7"8 lO4"7 lO6"9
i28.5 I38"4 142"8 149"12.1-5 Bread, biscuits, flour confectionery 98"6 97"9 95"1 Io9"5 118’2 119"9 123"5
IIO’22.1.6--7 Sugar, cocoa, sugar confectionery 67"3 82"2 60"9 77"2 77"2 92"2 87"1 92"1 99"9 lO3"4
I28"7 144"8 167"62.I.8 Canning fruit, vegetables, jams 68"6 75"5 70’8 73"4 78"4 85"9 90’7 lO2"7
io8’i 117"5 I26"2 139"1 155"o2.1.9 Butter, cheese, edible milk products 9o’4 88"3 93’6 99"5 95"6 93"1
85"1 91"4 91"2 08"4 101"9 II5"62.I.IO Margarine, butter blending 73"7 71"1 68’7 76"5 81"7
lO8.8 124"o 138"x 146"7 149’7 199"6 249"02*I.II Other food preparations 77"7 92"7 Io4"5 lO5"3
82"4 1oo’9 102"7 122"5 zi4"3 115"32.2.I Malting 79"7 76"9 95"4 93"5 92"7
112’7 1x2"9 i18.2 126"9 138"9 I4o"5 149"22 2.2 Brewing 1oi-9 103"9 Io9"9 lO7"3
68"7 69"o 75"6 77"1 87"7 08"9 11o"72.2-3 Distilling 89"5 78"0 72"3 64"8
137"1 139"o I46’6 I65"7 186"6 206"82.2,4 Mineral waters Io4"7 13o’3 125"5 127"9 124"5
IlO’O ilO.8 116"7 125"8 133"1 141"O 143"g2-3 Tobacco 94"o 96"7 99"8 lO9"5
80.8 76"9 73’8 78’8 89"6 lOO’4 115"9 128"73.X Wood, cork Io2"9 lO2"6 94"0
io8.6 lO3’4 lO8"3 117"5 126"I 147"2 161"4 I78"73.2-3 Brushes, brooms and furniture xo3"9 11o.o 99’4
133"6 I51’9 182"5 226"8 229"9 251"2 262’14.1 Jute, canvas, miscellaneous textiles 112"9 I15"4 118"9 129"5
158’2 17o’6 2o1"8 220"0 234"4 234"8 261"74.7 Linen, cotton I12"9 i23-5
148"7 I49"9I22"7 I33"2 159’1 172"7 19o"4 197"3 228.6 246"2 259"4
4.3 Made-up textiles 95"9 lO9"5116"2 zz6-z 112.4 I3o"3 137-8 I39"5 152"3 17o"I
4.4 Woollen, worsted 102"4 Io3"3 Io6’7
lO6-2 97’8 98’3 lO8.1 I22’2 I26"7 139"9 I48.85.1 Men’s and boys’ clothing lO1"5 lO8.6 97"7
93’0 lO5’5 119’4 149"4 163"3 188-8 188"4 22~O5-2 Shlrtmaking 97"1 98"0 lO3’7
118.i 124"I 137"2 141"7 I53’7 162"5 177"9 188"7 2o8-15.3 Women’s and girls’ dothlng 99"1 lO7"8
113"6 125’6 126"7 133"2 I46"o 168"3 17o"6 I71"45.4 Other clothing Io2’7 lO8’7 117"8
lO8"1 Io2’6 1o6"9 111"3 127"9 I49"2 I72"5 i92.o 209"45-5 Hosiery. 98"4 lO2"5
12o.6 I49"3 15o’66.1 Fellmongery, tanning 97’5 94"4 99"2 102’0 lOO’5 119’7 117"5 134"3
18o.1 213’5 241"3 269"4 310"16.2 Leather manufactures lO7"9 lO9"6 123"3 137"6 154"3 175"4
128"3 138’9 163"86.3 Boots, shoes 92"5 95"3 96"1 98"3 99"8 lO7"6 121"0 I32"9
155"6 172"o 193"8 208"5 208’8 219"3 246"07 Paper 127"6 144"2 141"1 z45’I
155’1 17o’7 I89"7 201"O 220"98 Printing, publishing lO6"7 118"9 127"1 129"7 136’7 148’6
119’1 123"7 i18.2 133’5 124"o 14o.5 144"4 151"8 157"99.1 Soap, detergents, candies lO4"6 113"4
136"9 146"3 159"8 178"o 193"6 214"5 257"3 281"6 304"39.2 Chemicals, drugs 1o6"7 118"9
98"2 lO4"4 lO9’1 12o’6 123"1 132"1 137’9 153"9 17o’69-3 Oils, paints, inks, polishes 93"7 97"9
152"o 209’0 I94"o 219"1 253"7 309’6 364"2 369"z 372"99.4 Fertilisers 141"8 155’4
151"4 156’o 173"4 200"1 222~8 267’2 ’ 294"110.1 Glassware, pottery 111"9 127"3 132’7 143"3
118"4 133"7 149"2 158"8 194"5 217"5 266"2zo.z-3 Structural day and cement 114"3 126"4 137"z 115"7
218"4 242’9 269"2 345"6ix Metal trades 115"8 130-2 142"3 132"i 144"9 165"1 191’9
156’9 188.8 197"2 216’8 245"7 293"8ia.x Assembly of mechanical vehicles 142.1 152’9 lOO’9 113"1 143"7
lO2"3 I17"9 116"o lO7.I lO1"5 143"6 178"8 189"2 217’O12.2 Assembly of other vehicles lO8"6 lO3’9
156"o 154"5 175"5 22o’5 252"5 307"2 384"I 470"2 518"4I2-3 Electrical machinery 125"9 I46"3
lO3"9 I27"9 238"3 295"0 336’6 353"1 397"3 46o’812.4 Non-electrical machinery 100"4 lO8"3 97"3
124"I Io9’5 82.6 86’0 96"5 93"2 91"8 94"212.5 Railroad equipment II2"7 97"9 99’0
2OI"4 278-2 5o9.1 516"8 524"412.6 Ship and boat building lO3"2 90"0 11I’8 I21"2 I36"4 14o’9
II1"6 123"7 124"3 141’9 341’3 433"6 474"1 511"8 587"9 692"9X3 Other manufacturing 124"1
172"6 189"8Total Manufacturing Industry lOO"5 I03"3 ioi.4
lO6.1 112"6 122"5 I34"1 148’3 159"9239’1 266’2
Total Mining 120"3 I38"4 I37"o 142"8 122"7 191"7 171"3 205"8 233"3161’1 191"1
Total Transportable Goods Industries lOO.8 lO3"9 102"O lO6"7 112-8 123"7 134"7 149"2 173’7
*Note: The data presented in this table differ slightly from those used in Table 9 n the text. Table A5 includes amendments made to the published figures in July, 1967 which were received too late to beincluded in the textual calculations.

TABLE A5: INDEX NUMBERS (TO BASE 1953 AS zoo) OF (i) VALUE, (il) VOLUME AND (iii) IMPLICIT PRICE OF GROSS OUTPUT OF IRISH INDUSTRIES, 1954-I964-- (continued)
Number Industry 1954 I955 1956 1 1957 I958 1959 196o 1961 1961 I963 I964
(ii) Vohmle
i.i Coal, turf 128"5 121’8 145"5 145 "7 I23"7 14o"o I23"0 123’9 I23"8 I39"3 138"51.2 Stone, slate, sand IXI’2 I33"5 123"1 125-1 127"7 128’o 153"7 162’3 219"5 251.8 297’21.3 Other mining 13o’8 209"2 251’7 297"8 286"1 41o"8 591"3 528’6 267"2 lO7"8 I55"21.4 Turf production, development 11o.o 128"5 146"2 155"4 95’2 203"2 143"5 193"3 201"0 2o1"8 205"0
2.i.i Bacon lO5"6 85"2 79"0 89’6 lO3"3 99"5 lO6’9 II6"3 II6"2 I18"9 122"72.1.2 Slaughtering lO9"5 97"0 99"4 82.6 127"8 I64"1 I76"I 252"2 239"3 239’1 214"92.1.4 Grain milling, feedingstuffs lOO"7 Io5-3 99"o 95"9 97.1 I02"I 99’8 lO6’3 112’4 112’8 II8"22.1.5 Bread, biscuits, flour confectionery IOI’O 98"7 94"4 88"3 84"4 85"5 86"0 86.3 90’6 93"3 94"12.1.6 Sugar 77"4 119"5 63"4 100"3 89"1 122"5 99"6 lO5-5 I15"6 111"6 IX0"2Z.1.6--7 Sugar, cocoa, sugar confectionery 65"5 75"5 58"3 67"3 67’7 75"9 77"5 83"6 88"3 87"8 90"42.1.7 Cocoa, sugar confectionery 59"8 54"3 55"6 55"2 59"2 58"5 69"2 75"3 77"6 78"9 83"2a.I.8 Canning fruit, vegetables, jams 7o’7 75"1 68’6 68"3 73"8 82’6 87"5 94’9 lO7"6 iio.o 12o.82.I.9 Butter, cheese, edible milk produet~ 9o’4 88"3 95"1 I02’2 99"4 96.1 IO8"2 117"2 126"4 137"o 149’42.i.IO Margarine, butter blending 84"1 81’9 80-3 82"3 87"5 91"2 98"2 97"I 101"3 Io5"4 I13"62,1,II Other food preparations 9o’7 103"1 117"6 127’1 118-6 134-o 146"7 I53"4 152"1 165"6 2OI’42.a.I Malting IOO’O 91"3 120"1 lO7"6 98"6 96’8 122.8 119"8 149"9 129"o I36"12.2.2 Brewing 102"9 lO4’5 III"3 lO5"5 lO6’9 Io5-8 11o-6 117"7 113"3 ZII"9 I14"42.2,3 Distilling 94"4 82"4 77’3 65’6 67"7 68"5 76-2 76"7 84"8 90"9 92"62.2.4 Mineral waters lO4"O 129’7 II4"I 112"3 lO7"7 119"3 117’6 124"6 I36"9 148’3 159"42.3 Tobacco 94"9 99"1 92-8 90"2 80.8 80"9 83"9 87’o 86"1 87"8 85"8
3-I Wood, cork 102"2 I02"I 92"2 83"5 8I’7 76"8 81-o 90’5 lO1"5 117"4 125"23.2 Brushes, brooms lO6"8 lO5"7 120"0 lO6"9 I05"7 108"9 I19"5 I20"l x30"I 139’5 I5o"43.2-3 Brushes, brooms and furniture 111"3 IIS’5 113"7 98"2 lO5’9 114"8 117’3 II9"9 133"0 148"3 146"63.3 Furniture 111"8 I16’6 II2"9 97"2 lO6"1 115"7 117"3 IaO-O 133"6 149"7 I46’3
#.I Jute, canvas, miscellaneous textiles 118"9 128"7 136"3 146"7 151"9 I65"2 I94"4 229"7 229"2 242"7 244"7Linen, cotton iIi.5 125.o 148"8 155"3 168"3 185"6 220"4 230"2 240"3 227"8 263"3
#-3 Made-up textiles 96"3 I06"0 I14-2 128.6 152’2 I6I’2 I72"4 174"2 I96"9 209"2 225 "0~-4 Woollen, worsted lO3"8 Io5"8 lO5"9 113’3 Z09"Z 117"2 137"8 141.2 I44’1 153"7 161"3
3.I Men’s and boys’ clothing 97"3 97"4 90"7 8"5 77"0 76"3 81.8 89"5 89"8 91"5 97"25.2 Shirtmaking 99"4 lOO"3 lO4"3 9’6 95"4 lO3"8 125"6 I32"2 I48"1 15I’4 I71"8~-3 Women’s and girls’ clothing 98"1 Io3"9 110’9 II0-9 I14’6 121"8 127-6 I38"o I65"I 167"6 185"5~.4 Other clothing lO8"1 ilO.8 12o-7 II1"8 121"7 124"5 123"3 136"3 142"2 I52"4 15o’3~.5 Hosiery lO5"5 lO9"4 118"2 II3"I 114-3 I19"9 138"8 157"4 170"4 181.6 204"5
).I Fellmongery, tanning 93"5 93"3 97’0 96"5 io1.8 lO7"3 lOO.8 lO6"9 120"2 I3I"9 134’7L2 Leather manufactures lO3.4 82.6 90"2 II5-I III’6 128.8 125’7 143"o 169"7 182"5 202"2).3 Boots, shoes 90-6 94"8 95"1 94"6 96"4 Io3"4 I15"8 126"4 123"o I36.8 155"5
Paper 123"4 I37-8 I32"9 137"3 I48-9 164"4 I81"4 I94"8 195"8 I99"4 220"5Printing, publishing lO4"7 112"7 II5"7 I13-3 117"3 I23"8 126-I 135’3 148"7 154"2 I58"4
}.I Soap, detergents, candies Io4"4 11I"5 III’O iii.5 lO4"5 116-1 11I"7 134"o I29"7 131"7 129"3).2 Chemicals, drugs lO5"6 115-8 132’6 135"o 144"o 157"3 178"o 196"1 223"0 237"5 272"3h3 Oils, paints, inks, polishes 95"5 100"2 94’5 98"8 lO5"9 113"5 I18-o 128"4 13I"9 144"3 153"6~.4 Fertilisers 131’6 14I"7 I35"6 z75"2 i62"2 208"6 247"9 287"5 314-1 317"I 320"0
iO.I Glassware, pottery 104"5 119’o 122"4 125"7 I32.1 128.6 144"7 X6I’I 175’0 I85-8 202"0:0.:2 Cement 125"5 142"4 15o"9 11I’2 1Io"4 133"2 158"o 157"8 188.1 187"2 219"7:0"2-3 Structural clay and cement 114"5 I21"7 121"9 92"5 92"7 III’O I27"9 135"8 I68-3 179"1 218"310.3
Structural clay Io9-2 112"2 lO8"4 84"o 84"9 IOI’O I13"6 126"3 16o.8 I79"2 224"0
:I Metal trades 12I"4 152"4 134"1 I20"2 126.6 148.o I69"5 188"5 204"6 231"6 274"5
12.I Assembly of mechanical vehicles 144"6 157’3 94"5 lO5"3 131"o 144"2 I7I’6 I65’o I72"1 19o"6 219"62.2 Assembly of other vehicles lO9"O lO6-O 98"3 Io9"7 98-0 87"4 80"6 99"5 120"0 124"8 I31"52.3 Electrical machinery 124"5 142"2 I42"6 138"2 161"3 205"5 233"0 291"8 364"4 439"0 479"52-4 Non-electrical machinery 96"2 92’7 79"9 83"9 97"7 17o"1 208.6 263"1 251"5 274"1 3o1"92.5 Railroad equipment 113"5 96"2 89"5 112"9 91"8 67"9 64"2 65"2 59’2 57"4 54"32.6 Ship and boat building lOO.9 Io8-5 126"7 128"9 I22"5 I29"2 z47"4 195"o 255"5 19o"4 182"4
3 Other manufacturing 118.8 122"2 121"1 115"7 I31"4 I92"5 226"8 250"2 274"3 313"5 367"9
Total Manufacturing Industry lO2"9 lO6.4 lO3"6 lO2"5 lO5"8 114’5 124"3 135"I 143"6 151"o 162.5Total Mining 113"9 132"I 142"8 14o"5 II3"9 181"o 159’2 186"3 199"2 2o7"1 223 "7Total Transportable C-oods Industries 1o3"3 lO7’5 lO5"3 lO4"5 lOO’5 117"5 126"0 I37"4 146"2 153"5 165"3

ta T~I.E AS: INDEX NUMBERS (TO BASE 1953 AS 1oo) OF (1) VALUE, (ii) VOLU~’ViE AND (iii) IMPLICIT PRICE OF GROSS OUTPUT OF IRISH INDUSTRIES, 1954-1964---(¢onHnued)
Number IndustryI 1954 ] 1955 1956 ] 1957 1958 [ 1959 x96o z961 z961 I963 1964
(i£i) Implicit Price
I.l Coal, turf 97"6 J Io6"7 Io7"1 zo5"z Io5"4 I14"3 lO6.8 115"3 12I"8 I21"1 I23"81.2 Stone, date, sand *oo’5 94"5 93"8 92"1 88"2 90"3 91"9 97"7 94"6 101"5 lOO"31.3 Other mining lO9"1 1z7"7 z13"2 93"7 12o.8 I39"2 128"2 ZOO’2 12z-5 I00’2 12o’71.4 Tuff production, development iz2"3 1Io’2 93"5 96"7 116"4 I14"5 1*o-6 1z6"3 133"2 126.8 133"5
2.1.1 Bacon 93"2 92"5 95"2 94"9 97"2 98"4 95"8 96"6 96"6 98-8 102"22.1.2 Slaughtering lO8.O *03"5 lO4"5 112"3 I16"1 113"2 zzS.z 113"4 lO9"5 120"9 134"42.1.4 Grain mil/ing, feedingstu~s lO8"3 zxo’5 108"9 109"2 IIO’I lO7"9 lO7"4 Io8-2 I10"4 zxx-7 114"32.I.5 Bread, biscuits, flour confectionery 97"6 99"2 *00"7 124"o I40"o 140"2 I43"6 148"9 I52"8 153"1 158"42.Z-6-7 Sugar, cocoa, sugar confectionery 1oz’7 lO8"9 1o4"5 114"7 114"o 121"5 112"4 110"2 113"1 117"8 121"92.1.8 Canning fruit, vegetables, jams 97"o 1oo’5 *03"2 107"5 Io6"2 1o4"o lO3"7 *08-2 *19"6 I3I"6 138-72.1.9 Butter, cheese, edible milk products 100’0 IO0"O 97"3 96"2 96"9 99"9 lOO"3 99"8 lO1"5 1o3 72.I.10 Margarine, butter blending 87"6 86"8 ~[~ 93"O 93"4 93"3 93"1 97"1 96"7 lOl-82.I.1I Other food preparations 88-0 91"8 93"6 85"3 98"7 118"2 94"z 93"~95’ 98"4 96"~ 123"62.2.I Malting 85"3 84"2 79"4 86"9 94"0 85-1 82"2 51"4 81"7 88.6 84"72.2.2 Brewing 99"o 99"4 98"7 101"7 lO5"4 Io6"7 lO6"9 lO7"8 i22.6 125"6 13o’42.2.3 Distilling 94"8 94"7 93"5 98"8 zo1"5 IOO’7 99"2 *00’5 1o3"4 lO8.8 1z9"52.2.4 Mineral waters 100"7 10o"5 IZO’O I13"9 1*5"6 114"9 118"2 117"7 12I’0 125"8 129"72.3 Tobacco 99"1 97"6 1o7.5 IZI.4 136"* 137.o 139"1 144"6 154"6 16o"6 x66"9
3.1 Wood, cork 1oo’7 *oo’5 lO2’O i 96"8 94"I 96"z 97"3 99"0 98"9 98"7 Io2’83.2--3 Brushes, brooms and furniture 93"4 i
95"2 95"5 i Ioz’2 97"6 94"3 100"2 lO5"2 **o’7 xo8-8 121"9
4.1 Jute, canvas, miscellaneous textiles 95’o 89"7 87"2 88"3 88"o 91"9 93"9 987 100"0 *o3"5 lO7"14.2 Linen, cotton lO1"3 98"8 99"9 96"5 94"o 91"9 9z’6 95"o 97"5 ~oa’9 99"44.3 Made-up textiles 99"6 1o3"3 lO7"4 zoy6 lO4"5 I07"I 1.o’4 zxy3 116.1 117"7 115"34.4 Woollen, worsted 98"7 97’6 lOO’8 lOt’6 lO6"4 95"9 94"6 97"6 96"8 99"1 lO5"5
5.1 Men’s and boys’ clothing lO4"3 *1*’5 117"1 I24"5 127"o 128.8 132"2 136’5 x4I-X 152-9 I53"15-2 Shirtmaking 97"7 97"7 99"4 zo3"8 1.o’6 115"O 118-9 123"5 127"5 124"4 130"45.3 Women’s and girls’ dothlng 10*’0 103"8 lO6"5 zzz’9 119"7 1*6"3 12o"5 117"8 *o7"8 112"6 112"25-4 Other clothing 95"0 98"z 97"6 zoz’6 103"2 1o*.8 lO8"O 1o7-i 1*8"4 111"9 zz4"o5.5 Hosiery 93"3 93"7 91"5 90"7 93"5 92"8 92"2 94"8 101"2 Io5"7 102"4
6.1 FelLmongery, tanning lO4"3 zoz’z lO2"3 Io5"7 98"7 111-6 116"6 112"8 111"7 I13"2 1*1.86.2 Leather manufactures lO4"4 *32"7 136"7 1*9"5 I38"3 I36"2 143"3 149"3 142"2 z47"6 z53"46-3 Boots, shoes 102"1 100"5 lO1.1 lO3"9 lO3"5 1o4.1 lO4"5 1o5"* lO4"3 1o1"5 zo5"3
7 Paper *o3"4 lO4’6 Io6"2 1o5"7 *o4"5 lO4-6 lO6"8 lO7"O *o6.6 IIO’O 111.6
8 Printing, publishing *0*’9 lO5"5 lO9"9 114"5 II6"5 120"0 I23"0 I26"2 127"6 13o"4 139"5
9.1 Soap, detergents, candles 1oo’2 I lO1"7 107"3 IIO’9 zI3"I 115"o IXI’O lO4"9 11*"3 115"3 Iaa"I
9.2 Chemicals, drugs 1o*.o IOZ-7 I03"2 lO8"4 IlI’O IIY3 lO8.8 *09"4 1*5"4 118"6 zzz.8
9.3 Oils, paints, inks, polishes 98"1 97"7 lO3"9 lO5"7 *o3"o Io6"3 lO4"3 *02"9 lO4"5 lO6"7 11I’1
9.4 Fertilisers Io7"8 1o9"7 112-1 1*9"3 *19"6 lO5"O 102"3 *07"7 zz6"o 1z6"4 116"5
10.1 Glassware, pottery lO7"I zo7-o Io8"4 i 114"o II4-6 121"3 II9-8 124"2 127"3 I43"8 I45"610.2--3
Structural clay and cement 99"8 ! lO3"9 1.2"5 125"1 127"7 12o’5 116-7 ,16"9 I15"6 118.1 zzz"9
11 Metal trades 95"4 98"3 lO6-1 lO9"9 114"5 11z-6 izy2 I15"9 ,I8’7 1.6"2 125"9
I2.I Assembly of mechanical vehicles 98"3 97"z Io6"8 lO7"4 lO9"7 *o8"8 IlO’O 119"5 126"o 128’9 133"712.2 Assembly of other vehicles 99"6 98"o 1o4"* lO7"5 II8"4 *22"5 125"9 144"3 149"o 151"6 165"o12.3 Electrical machinery I01"1 102"9 1o9"4 11I"8 lO8"8 107"3 lO8"4 lO5"3 Io5"4 1o7"* zoS.xI2.4 lqon-electrical machinery lO4"4 1.6-8 121"8 123"8 13o’9 14o’I 141"4 127"9 14o"4 *44"9 I52’6I2.5 Railroad equipment 99"3 lOl-8 1Io.6 1o9"9 119"3 121"6 134"o z48"o *57"4 159"9 173"512.6 Ship and boat building lO2"3 83"8 88"2 94"0 IIZ"3 lO9"1 I36"5 I42"7 199"3 27*’4 287"5
13 Other manufacturing 93"9 lO1"6 I02"1 lO7"3 io8’o 177"3 191"6 189"5 x86"6 I87"5" 188"3
Total iVIanufacturlng Indtmtry 97"7 97"1 97"9 lO3"5 *o6"4 lO7"O *07"9 lO9’8 111"4 II4’3 116-8Total Mining .... lO5"7 lO4"8 95"9 95"5 lO6"8 1o7"o lO7"6 1,O"5 117"i 115"5 119.oTotal Transportable Gooos/naustnes 97"6 96"7 06"9 I02"1 lO5"9 lO5"3 Io6"9 *08"6 IIO’2 II3"2 115.6
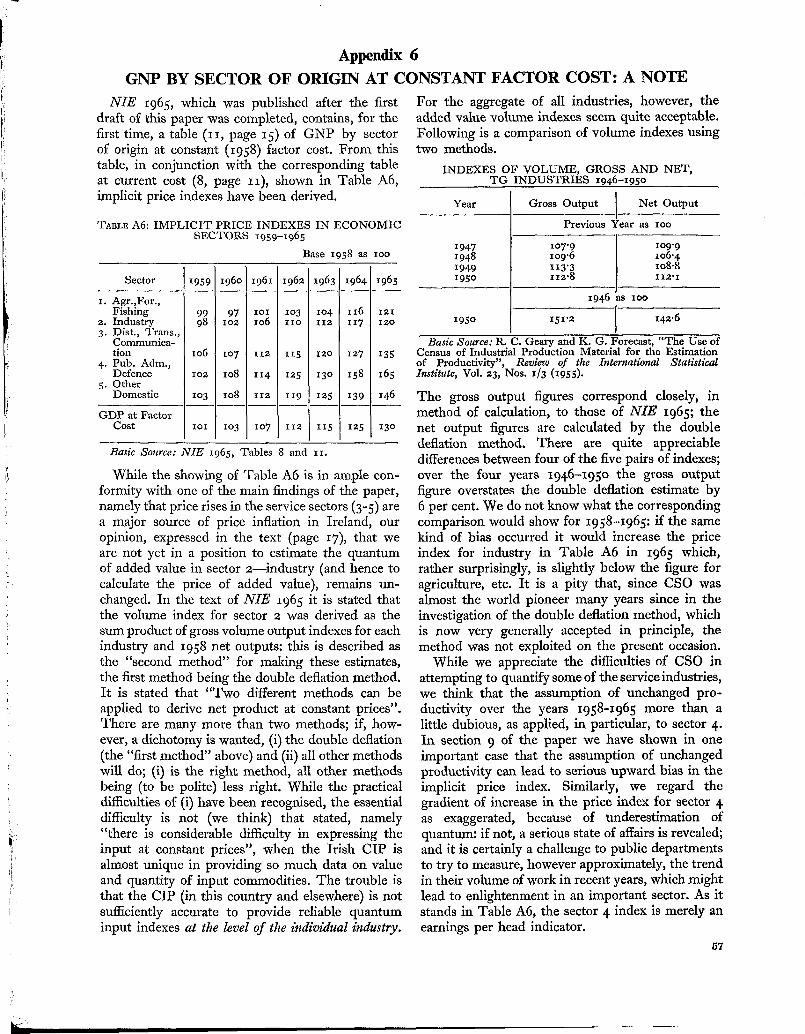
Appendix 6
GNP BY SECTOR OF ORIGIN AT CONSTANT FACTOR COST: A NOTE
NIE 1965, which was published after the firstdraft of this paper was completed, contains, for thefirst time, a table (ii, page 15) of GNP by sectorof origin at constant (1958) factor cost. From thistable, in conjunction with the corresponding tableat current cost (8, page II), shown in Table A6,implicit price indexes have been derived.
TABLE A6: IMPLICIT PRICE INDEXES IN ECONOMICSECTORS 1959-I965
Base 1958 as ioo
Sector
i. Agr.,For.,Fishing
2. Industry3. Dist., Trans.,
Communica-tion
4. Pub. Adm.,Defence
5. OtherDomestic
GDP at FactorCost
1959 I 196°99 I 9798 ] IOZ
lO6 [ lO7
IOZ [ Io8
I O_~31 1 o_~_8
101 [ IO3
1961
IOIlO6
112
II4
II2
lO7
1962
) lO3IiO
, I15
125
1119
i19.
1963
lO4112
1964 1965
116 121117 I2O
12o 127 135
I30 I58 I65
1251 139 146
115 125 130
Basic Source: NIE 1965, Tables 8 and 11.
While the showing of Table A6 is in ample con-formity with one of the main findings of the paper,namely that price rises in the service sectors (3-5) area major source of price inflation in Ireland, ouropinion, expressed in the text (page 17), that weare not yet in a position to estimate the quantumof added value in sector e--industry (and hence tocalculate the price of added value), remains un-changed. In the text of NIE 1965 it is stated thatthe volume index for sector 2 was derived as thesum product of gross volume output indexes for eachindustry and 1958 net outputs: this is described asthe "second method" for making these estimates,the first method being the double deflation method.It is stated that "Two different methods can beapplied to derive net product at constant prices".There are many more than two methods; if, how-ever, a dichotomy is wanted, (i) the double deflation(the "first method" above) and (ii) all other methodswill do; (i) is the right method, all other methodsbeing (to be polite) less right. While the practicaldifficulties of (i) have been recognised, the essentialdifficulty is not (we think) that stated, namely"there is considerable difficulty in expressing theinput at constant prices", when the Irish CIP isahnost unique in providing so much data on valueand quantity of input commodities. The trouble isthat the CIP (in this country and elsewhere) is notsufficiently accurate to provide reliable quantuminput indexes at the level of the individual industry.
For the aggregate of all industries, however, theadded value volume indexes seem quite acceptable.Following is a comparison of volume indexes usingtwo methods.
INDEXES OF VOLUME, GROSS AND NET,TG INDUSTRIES I946-I95O
IYear Gross Output
INet Output
IPrevious Year as 1oo
194719481949195o
195o
lO7"9io9.6113"3112"8
lO9.9xo6.4lO8.8II2"I
1946 as 1oo
I5I’2 [ 142"6
Basic Source: R. C. Geary and K. G. Forecast, "The Use ofCensus of Industrial Production Material for the Estimationof Productivity", Review of the International StatisticalInstitute, Vol. 23, Nos. 1/3 (1955).
The gross output figures correspond closely, inmethod of calculation, to those of ]VIE 1965; thenet output figures are calculated by the doubledeflation method. There are quite appreciabledifferences between four of the five pairs of indexes;over the four years 1946-195o the gross outputfigure overstates the double deflation estimate by6 per cent. We do not know what the correspondingcomparison would show for 1958-1965: if the samekind of bias occurred it would increase the priceindex for industry in Table A6 in 1965 which,rather surprisingly, is slightly below the figure foragriculture, etc. It is a pity that, since CSO wasalmost the world pioneer many years since in theinvestigation of the double deflation method, whichis now very generally accepted in principle, themethod was not exploited on the present occasion.
While we appreciate the difficulties of CSO inattempting to quantify some of the service industries,we think that the assumption of unchanged pro-ductivity over the years 1958-1965 more than alittle dubious, as applied, in particular, to sector 4.In section 9 of the paper we have shown in oneimportant case that the assumption of unchangedproductivity can lead to serious upward bias in theimplicit price index. Similarly, we regard thegradient of increase in the price index for sector 4as exaggerated, because of underestimation ofquantum: if not, a serious state of affairs is revealed;and it is certainly a challenge to public departmentsto try to measure, however approximately, the trendin their volume of work in recent years, which mightlead to enlightenment in an important sector. As itstands in Table A6, the sector 4 index is merely anearnings per head indicator.
57
THE ECONOMIC AND SOCIAL RESEARCH INSTITUTE
Reprint Series :
1. Commentary on "Europe’s Future in Figures" R.C. Geary
2. Forms of Engel Functions C.E.V. Leser
3. The Cost Structure of British Manufacturing, 1948-61E. T. Nevin
4. The Life of Capital Assets: An Empirical Approach E.T. Herin
5. Estimation of Quasi-linear Trend and Seasonal VariationC. E. V. Leser
6, The Pattern of Personal Expenditure in Ireland C.E.V. Leser
7. Some Remarks about Relations between Stochastic Variables:A Discussion Document R.C. Geary
8. Towards An Input-Output Decision Model for IrelandR. C. Geary
9. Do-It-Yourself Economics of the Firm; First Draft of a StatisticalScheme R.C. Geary
10. Recent Demographic Developments in Ireland C.E.V. Leser
I1. The Average Critical Value Method for Adjudging RelativeEfficiency of Statistical Tests in Time Series RegressionAnalysis R.C. Geary
12. A Note on Residual Heterovariance and Estimation Efficiencyin Regression R.C. Geary
13. Direct Estimation of Seasonal Variation C.E.V. Leser
14. Ex post Determination of Significance in Multivariate Regressionwhen the Independent Variables are Orthogonal R. C. Geary
15. The Economies Of An Off-Shore Island G.G. Firth
16. The Role of Macroeconomic Models in Short-Term ForecastingC. E. V. Leser
Geary Lecture:
A Simple Approach to Macro-economic Dynamics R. G. D. Allen
THE ECONOMIC AND SOCIAL RESEARCH INSTITUTEPublication Series :
1. The Ownership of Personal Property in Ireland Edward Nevin2. Short Term Economic Forecasting and its Application in lreland
Alfred Kuehn3. The lrish Tariff’and The E.E.C.: A Factual Survey
Edward Nevin4. Demand Relationships for lreland C.E.V. Leser5. Local Government Finance in lreland: A Preliminary Survey
David Walker6. Prospects of the Irish Economy in 1962 Alfred Kuehn7. The Irish Woollen and Worsted Industry, 1946-59: A Study
in Statistical Method R.C. Geary8. The Allocation of Public Funds for Social Development
David Walker9. The Irish Price Level: A Comparative Study Edward Nevin
10. lnland Transport in lreland" A Factual Survey D.J. Reynolds11. Public Debt and Economic Development Edward Nevin12. Wages in Ireland, 1946--62 Edward Nevin13. Road Transport: The Problems and Prospects in Ireland
D. J. Reynolds14. Imports and Economic Growth in Ireland, 1947-61
C. E. V. Leser15. The Irish Economy in 1962 and 1963 C.E.V. Leser16. lrish County Incomes in 1960 E.A. Attwood and R. C. Geary17. The Capital Stock of Irish Industry Edward Nevin18. Local Government Finance and County lncomes David Walker19. Industrial Relations in Ireland: The Background
David O’Mahony20. Social Security in Ireland and Western Europe
P. R. Kaim-Caudle21. The Irish Economy in 1963 and 1964 C.E.V. Leser22. The Cost Structure of Irish Industry, 1950-60 Edward Nevin23. A Further Analysis of Irish Household Budget Data, 1951-1952
C. E. V. Leser24. Economic Aspects of Industrial Relations David O’Mahony25. Psychological Barriers to Economic Achievement P. Pentony26. Seasonality in Irish Economic Statistics C.E.V. Leser27. The Irish Economy in 1964 and 1965 C.E.V. Leser28. Housing in Ireland; Some Economic Aspects
P. R. Kaim-Caudle29. A Statistical Study of Wages, Prices and Employment in the Irish
Manufacturing Sector C. St.J. OHerlihy30. Fuel and Power in Ireland: Part L Energy Consumption in 1970
J. L. Booth
31. Determinants of Wage Inflation in lreland Keith Cowling32. Regional Employment Patterns in the Republic of Ireland
T. J. Baker33. The Irish Economy in 1966
The Staff of The Economic and Social Research Institute34. Fuel and Power in Ireland: Part IL Electricity and Turf
J. L. Booth35. Fuel and Power in Ireland: Part 111. International and Temporal
Aspects of Energy Consumption J.L. Booth36. Institutional Aspects of Commercial and Central Banking
in Ireland John Hein37. Fuel and Power in Ireland; Part 1V, Sources and Uses of Energy
J. L. Booth38. A Study of Imports C.E.V. Leser39. The Irish Economy in 1967
The Staff of The Economic and Social Research Institute40. Some Aspects of Price Inflation in Ireland
R. C. Geary and J. L. Pratschke
Printed by Cahill and Co. Limited, Parkgate Printing Works, Dublin