Economic and Social Development
641
Varazdin Development and Entrepreneurship Agency and University North in cooperation with Faculty of Management University of Warsaw Faculty of Law, Economics and Social Sciences Sale - Mohammed V University in Rabat Polytechnic of Medimurje in Cakovec Economic and Social Development 51 st International Scientific Conference on Economic and Social Development Development Book of Proceedings Editors: Khalid Hammes, Mustapha Machrafi, Vladimir Huzjan Rabat, 26-27 March 2020
-
Upload
khangminh22 -
Category
Documents
-
view
0 -
download
0
Transcript of Economic and Social Development
Varazdin Development and Entrepreneurship Agency and University North
in cooperation with Faculty of Management University of Warsaw
Faculty of Law, Economics and Social Sciences Sale - Mohammed V University in Rabat Polytechnic of Medimurje in Cakovec
Economic and Social Development
51st International Scientific Conference on Economic and Social Development Development
Book of Proceedings
Editors: Khalid Hammes, Mustapha Machrafi, Vladimir Huzjan
Rabat, 26-27 March 2020

Varazdin Development and Entrepreneurship Agency and University North in cooperation with
Faculty of Management University of Warsaw Faculty of Law, Economics and Social Sciences Sale - Mohammed V University in Rabat
Polytechnic of Medimurje in Cakovec
Editors: Khalid Hammes, Economics and Social Sciences Sale - Mohammed V University in Rabat, Morocco
Mustapha Machrafi, Economics and Social Sciences Sale - Mohammed V University in Rabat, Morocco Vladimir Huzjan, Croatian Academy of Sciences and Arts, Croatia
Economic and Social Development 51st International Scientific Conference on Economic and Social Development Development
Book of Proceedings
Rabat, 26-27 March 2020
Title ◼ Economic and Social Development (Book of Proceedings), 51st International Scientific Conference on Economic and Social
Development Development
Editors ◼ Khalid Hammes, Mustapha Machrafi, Vladimir Huzjan
Scientific Committee / Programski Odbor ◼ Marijan Cingula (President), University of Zagreb, Croatia; Sannur Aliyev, Azerbaijan State
University of Economics, Azerbaijan; Ayuba A. Aminu, University of Maiduguri, Nigeria; Anona Armstrong, Victoria University, Australia;
Gouri Sankar Bandyopadhyay, The University of Burdwan, Rajbati Bardhaman, India; Haimanti Baner ji, Indian Institute of Technology,
Kharagpur, India; Victor Beker, University of Buenos Aires, Argentina; Asmae Benthami, Mohammed V University, Morocco; Alla Bobyleva,
The Lomonosov Moscow State University, Russia; Leonid K. Bobrov, State University of Economics and Management, Novosibirsk, Russia;
Rado Bohinc, University of Ljubljana, Slovenia; Elisabeth de Jesus Oliveira Brito, University of Aveiro, Portugal; Adnan Celik, Selcuk
University, Konya, Turkey; Angelo Maia Cister, Federal University of Rio de Janeiro, Brasil; Mirela Cristea, University of Craiova, Romania;
Taoufik Daghri, Mohammed V University, Morocco; Oguz Demir, Istanbul Commerce University, Turkey; T.S. Devaraja, University o f
Mysore, India; Onur Dogan, Dokuz Eylul University, Turkey; Darko Dukic, University of Osijek, Croatia; Gordana Dukic, University of
Osijek, Croatia; Alba Dumi, Vlora University, Vlore, Albania; Galina Pavlovna Gagarinskaya, Samara State University, Russia; Mirjana
Gligoric, Faculty of Economics - Belgrade University, Serbia; Maria Jose Angelico Goncalves, Porto Accounting and Business School -
P.Porto, Portugal; Mehmet Emre Gorgulu, Afyon Kocatepe University, Turkey; Klodiana Gorica, University of Tirana, Albania; Aleksandra
Grobelna, Gdynia Maritime University, Poland; Liudmila Guzikova, Peter the Great Saint-Petersburg Polytechnic University, Russia; Anica
Hunjet, University North, Koprivnica, Croatia; Khalid Hammes, Mohammed V University, Morocco; Oxana Ivanova, Ulyanovsk State
University, Ulyanovsk, Russia; Irena Jankovic, Faculty of Economics, Belgrade University, Serbia; Myrl Jones, Radford University, USA;
Hacer Simay Karaalp, Pamukkale University, urkey; Dafna Kariv, The College of Management Academic Studies, Rishon Le Zion, Is rael;
Hilal Yildirir Keser, Uludag University, Bursa, Turkey; Sophia Khalimova, Institute of Economics and Industrial Engineering of Siberian
Branch of Russian Academy of Science, Novosibirsk, Russia; Marina Klacmer Calopa, University of Zagreb, Croatia; Igor Klopota n,
Medjimursko Veleuciliste u Cakovcu, Croatia; Vladimir Kovsca, University of Zagreb, Croatia; Goran Kozina, University North, Koprivnica,
Croatia; Dzenan Kulovic, Univeristy of Zenica, Bosnia and Herzegovina; Robert Lewis, Les Roches Gruyere University of Applied Sciences,
Bulle, Switzerland; Ladislav Lukas, Univ. of West Bohemia, Faculty of Economics, Czech Republic; Mustapha Machrafi, Mohammed V
University, Morocco; Pascal Marty, University of La Rochelle, France; Vaidotas Matutis, Vilnius University, Lithuania; Daniel Francois
Meyer, North West University, South Africa; Marin Milkovic, University North, Koprivnica, Croatia; Abdelhamid Nechad, Abdelma lek
Essaadi University, Morocco; Gratiela Georgiana Noja, West University of Timisoara, Romania; Zsuzsanna Novak, Corvinus Univer sity of
Budapest, Hungary; Tomasz Ochinowski, University of Warsaw, Poland; Barbara Herceg Paksic, University of Osijek, Croatia; Ver a Palea,
Universita degli Studi di Torino, Italy; Dusko Pavlovic, Libertas International University, Zagreb, Croatia; Igor Pihir, University of Zagreb,
Croatia; Dmitri Pletnev, Chelyabinsk State University, Russian Federation; Miroslaw Przygoda, University of Warsaw, Poland; Karlis
Purmalis, University of Latvia, Latvia; Nicholas Recker, Metropolitan State University of Denver , USA; Kerry Redican, Virginia Tech,
Blacksburg, USA; Humberto Ribeiro, University of Aveiro, Portugal; Robert Rybnicek, University of Graz, Austria; Joanna Staws ka,
University of Lodz, Poland; Elzbieta Szymanska, Bialystok University of Technology, Poland; Katarzyna Szymanska, The State Higher School
of Vocational Education in Ciechanow, Poland; Ilaria Tutore, University of Naples Parthenope, Italy; Claudia Miranda Veloso, University of
Aveiro, Portugal; Ilko Vrankic, University of Zagreb, Croatia; Stanislaw Walukiewicz, Bialystok University of Technology, Poland; Thomas
Will, Agnes Scott College, USA; Li Yongqiang, Victoria University, Australia; Peter Zabielskis, University of Macau, China; S ilvija Zeman,
Medjimursko Veleuciliste u Cakovcu, Croatia; Tao Zeng, Wilfrid Laurier University, Waterloo, Canada; Snezana Zivkovic, University of Nis,
Serbia.
Review Committee / Recenzentski Odbor ◼ Marina Klacmer Calopa (President); Ana Aleksic; Sandra Raquel Alves; Ayuba Aminu; Mihovil
Andjelinovic; Josip Arneric; Lidija Bagaric; Tomislav Bakovic; Sanja Blazevic; Leonid Bobrov; Ruzica Brecic; Anita Ceh Casni; Iryna
Chernysh; Mirela Cristea; Oguz Demir; Stjepan Dvorski; Robert Fabac; Ivica Filipovic; Sinisa Franjic; Fran Galetic; Mirjana Gligoric;
Tomislav Globan; Anita Goltnik Urnaut; Tomislav Herceg; Irena Jankovic; Emina Jerkovic; Dafna Kariv; Oliver Kesar; Hilal Yildirir Keser ;
Martina Dragija Kostic; Tatjana Kovac; Vladimir Kovsca; Angelo Maia Cister; Katarina Marosevic; Vaidotas Matutis; Marjana Merkac Skok;
Daniel Francois Meyer; Natanya Meyer; Josip Mikulic; Ljubica Milanovic Glavan; Guenter Mueller; Ivana Nacinovic Braje; Zlatko Nedelko;
Gratiela Georgiana Noja; Zsuzsanna Novak; Alka Obadic; Claudia Ogrean; Igor Pihir; Najla Podrug; Vojko Potocan; Din ko Primorac; Zeljka
Primorac; Sanda Renko; Humberto Ribeiro; Vlasta Roska; Souhaila Said; Armando Javier Sanchez Diaz; Tomislav Sekur; Lorena Sku flic;
Mirko Smoljic; Petar Soric; Mario Spremic; Matjaz Stor; Tomasz Studzieniecki; Lejla Tijanic; Daniel Tomic; Boris Tusek; Rebeka Daniela
Vlahov; Ilko Vrankic; Thomas Will; Zoran Wittine; Tao Zeng; Grzegorz Zimon; Snezana Zivkovic; Berislav Zmuk.
Organizing Committee / Organizacijski Odbor ◼ Domagoj Cingula (President); Djani Bunja; Marina Klacmer Calopa; Spomenko Kesina;
Erlino Koscak; Tomasz Ochinowski; Miroslaw Przygoda; Michael Stefulj; Rebeka Danijela Vlahov; Sime Vucetic.
Publishing Editor ◼ Spomenko Kesina, Mario Vrazic, Domagoj Cingula
Publisher ◼ Design ◼ Print ◼ Varazdin Development and Entrepreneurship Agency, Varazdin, Croatia / University North, Koprivnica,
Croatia / Faculty of Management University of Warsaw, Warsaw, Poland / Faculty of Law, Economics and Social Sciences Sale - Mohammed
V University in Rabat, Morocco / Polytechnic of Medimurje in Cakovec, Cakovec, Croatia
Printing ◼ Online Edition
ISSN 1849-7535
The Book is open access and double-blind peer reviewed.
Our past Books are indexed and abstracted by ProQuest, EconBIZ, CPCI (Web of Science) and EconLit databases and available for download
in a PDF format from the Economic and Social Development Conference website: http://www.esd-conference.com
© 2020 Varazdin Development and Entrepreneurship Agency, Varazdin, Croatia; University North, Koprivnica, Croatia; Faculty of
Management University of Warsaw, Warsaw, Poland; Faculty of Law, Economics and Social Sciences Sale - Mohammed V University
in Rabat, Morocco; Polytechnic of Medimurje in Cakovec, Cakovec, Croatia. All rights reserved. Authors are responsible for the linguistic
and technical accuracy of their contributions. Authors keep their copyrights for further publishing.

CONTENTS
ORGANIZED CRIMINAL ACTIVITIES IN THE FIELD OF INSURANCE IN RUSSIA
AND ABROAD .....................................................................................................................1
Roman N. Borovskikh, Nadezhda I. Verchenko
THE SOCIAL AND ECONOMIC FACTORS OF THE REHABILITATION OF A
POST-STROKE PATIENT .................................................................................................8 Еlena Sevostyanova, Irina Trushina, Мark Loskutnikov, Natalia Kurenkova
ACTIVE LABOUR MARKET POLICIES, THE BUSINESS CYCLE AND LABOUR
FORCE SHORTAGES ...................................................................................................... 14 Katarina Moravcikova, Vladimir Balaz
USER PREFERENCES IN THE EXPERIENCE ECONOMY ....................................... 28 Aija Freimane
AUDIT OF ASSETS OF LOCAL AND REGIONAL SELF-GOVERNMENTS ............ 38 Dubravka Mahacek, Aleksandar Vcev, Kristina Peic
VALUATION AND CLASSIFICATION OF FIXED ASSETS IN SELECTED LOCAL
GOVERNMENT ................................................................................................................ 47
Magdalena Glebocka, Ewa Mackowiak
SECULAR RITUALS AND THEIR ECONOMIC EFFICIENCY .................................. 62
Alexandr Shmakov
REGIONAL ASPECTS OF 2024 NATIONAL PROJECTS ON STRATEGIC
DEVELOPMENT IN RUSSIA .......................................................................................... 70 Anatoly Pleslov, Olga Lukashenko
THE ANALYSIS OF THE ELECTRONIC COMMERCE IN THE CONTEXT OF
BUYERS’ BEHAVIOR ...................................................................................................... 80
Andzela Veselova
THE EU UNEMPLOYMENT UNDER THE RECENT DEVELOPMENTS OF THE
GLOBAL ECONOMIC GLOBALIZATION ................................................................... 89
Athanasios G. Panagopoulos
SLOVAK R&D STRATEGIC INFRASTRUCTURES AND SMART
SPECIALIZATION.......................................................................................................... 101 Miroslav Balog
ENTREPRENEURSHIP IN RENEWABLE ENERGY AND THE POWER OF
INNOVATION ................................................................................................................. 110
Maria-Floriana Popescu

FACTORS INFLUENCING ONLINE SHOPPING BEHAVIOR WITH MEDIATING
ROLE OF CUSTOMER PERCEIVED VALUE ............................................................ 121 Samar Rahi, Maheen Ishaq
CREATIVE ENVIRONMENT FOR DEVELOPMENT OF ENTREPRENEURIAL
IDEAS IN TOURISM – MASH-UP EVENT AS AN INNOVATIVE EVALUATION
MODEL ............................................................................................................................ 135 Tamara Floricic, Irena Sker
ZERO WASTE CONCEPT IN TOURISM ..................................................................... 150 Daniela Soldic Frleta, Dora Zupan
PREDICTION OF FINANCIAL HEALTH OF BUSINESS ENTITIES OF SELECTED
SECTOR USING IN05 AND VERIFICATION OF ITS PREDICTIVE ABILITY
THROUGH ROC ............................................................................................................. 161 Dusan Karpac, Viera Bartosova, Filip Rebetak
EARNINGS MANAGEMENT PHENOMENON ........................................................... 166 Susana Cristina Rodrigues Aldeia
FORMULATION OF MOTIVATION POLICY IN A GENERAL EDUCATION
ORGANIZATION APPLYING PERSONNEL MARKETING TECHNOLOGIES .... 172
Elena V. Kolnik, Yuliya A. Masalova
THE PARTNER LOANS' MULTIDISCIPLINARY ANALYSIS - PORTUGUESE'S
CASE STUDY ................................................................................................................... 180 Susana Cristina Rodrigues Aldeia
FAIR TRADE: A CRITIC IN ETHICS .......................................................................... 186
Essakhi Adam
FORTHCOMING REFORM OF UNIVERSITY HOSPITAL FINANCING AND
POSSIBILITIES FOR EFFICIENCY IMPROVEMENT IN LATVIA ......................... 193 Mara Petersone, Karlis Ketners, Ingars Erins
THE ROLE OF TNCS AS INNOVATIVE LEADERS IN THE GLOBAL ECONOMY
........................................................................................................................................... 201
Kovtun Olga, Lihovitskaya Darya
THE APPLICATION GIS AND REMOTE SENSING DATA TO THE DEVELOPMENT
OF A MULTISCALE SOIL INFORMATION SYSTEM .............................................. 211 Anna Pavlova
WILL FRESH GRADUATES EXPERIENCE DIFFERENT STYLES OF MENTORING
WHEN THEY ENTER LABOUR MARKET ................................................................. 219
Gabriela Kalinova
RURAL HOUSEHOLD DECISION TO PARTICIPATE IN OFF FARM WORK:
USING A DOUBLE HURDLE MODEL ......................................................................... 229 Hussein N. Nassoro
THE ROLE OF 'ORIENT' AS 'OTHER' IN EUROPE’S VISUAL COMMUNICATION
STRATEGIES .................................................................................................................. 244 Ilze Loza
MEDIA INDUSTRY IN A POST-INDUSTRIAL SOCIETY: MEDIA INDUSTRY
REVENUE CONVERGENCE AND BLURRED BOUNDARIES IN MEDIA SECTOR
........................................................................................................................................... 254 Josko Lozic
PRICE RISK AND ITS IMPACT ON PRICE DECISION-MAKING AND PRICING OF
A COMPANY ................................................................................................................... 263
Anna Kubjatkova, Jana Kliestikova, Lubica Gajanova
THE RELATIONSHIP BETWEEN TERRITORIAL COHESION AND REGIONAL
COMPETITIVENESS IN THE EUROPEAN UNION ................................................... 269 Lela Tijanic, Ines Kersan-Skabic, Daniel Tomic
LINKING TRANSFORMATIONAL LEADERSHIP, SENSE OF BELONGING AND
INTRAPRENEURSHIP ................................................................................................... 279
Fahd Slamti
ANALYSIS OF THE PAY AMOUNT IN THE RUSSIAN ECONOMY BY TYPES OF
ACTIVITY AND EMPLOYMENT OF HIRED LABOR .............................................. 287 L. Fyodorova
ASSESSMENT OF MORTGAGE AVAILABILITY FOR THE POPULATION OF THE
RUSSIAN FEDERATION ............................................................................................... 296
Lyudmila Rudy, Tatyana Tropnikova
ENTERPRISE INTEGRATION AND MARKET PERFORMANCE RESULTS ........ 306 Sofia Lyubyashenko
THE BRAIN DRAIN OF PEOPLE FROM SLOVAKIA ............................................... 313 Martina Chrancokova, Gabriel Weibl, Dusana Dokupilova
ECONOMIC THEORY AND THE CONSTRUCTION OF REALITY ........................ 323 Maxim Petrenko
GLOBAL FINANCIAL CRISIS AND ITS IMPACT ON NIGERIAN ECONOMY .... 329 Ayuba A. Aminu, Yahaya Yunusa Malgwi
AXIOLOGICAL BASIS OF ENTREPRENEURIAL ACTIVITY ................................ 336 Natalya Rubtsova
EXPERIENCE IN REFORMING TEACHER TRAINING SYSTEMS IN EUROPE
(EXAMPLE OF GERMANY AND FRANCE) ............................................................... 344
Natalya Nos, Uiliia Ostrovaya

THE CONCEPT OF TRUST WHEN INTEGRATING LABOR MIGRANTS INTO
SMALL FAMILY BUSINESSES .................................................................................... 350 Pal Zoltan Bite, Marta Konczosne Szombathelyi, Zoltan Baracskai
ANALYSIS OF THE IMPACT OF MARKETING ONLINE AND OFFLINE
COMMUNICATION CHANNELS ON CUSTOMER PURCHASING BEHAVIOR .. 358
Peter Jucha, Simona Jaculjakova, Dominik Laitkep, Tatiana Corejova
DETERMINATION OF SOME HEAVY METALS IN VARIETY OF WATERMELON
SAMPLES CULTIVATED IN KAGA LOCAL GOVERNMENT AREA, BORNO
STATE, NIGERIA ........................................................................................................... 370
Kolo B. G., Shugaba A., Kagu M.
SOCIAL PROGRAMMING IN THE CONTEXT OF SOCIAL ECONOMY
DEVELOPMENT IN BULGARIA .................................................................................. 380 Venelin Terziev
ATTITUDES TOWARDS ENVIRONMENTAL PROTECTION ADOPTED BY THE
BUSINESS SUBJECTS IN THE REPUBLIC OF CROATIA ....................................... 390
Ivan Kovac, Kristina Petljak, Dora Naletina
THE CONCEPT OF ADAPTIVE INFORMATION SECURITY MANAGEMENT IN
DIGITAL ORGANIZATIONS BASED ON THE ANALYSIS AND MONITORING OF
BUSINESS PROCESSES ................................................................................................. 402
Zinaida Rodionova, Irbulat Utepbergenov
THE DYNAMIC OF INDICATORS OF THE FINANCIAL MARKET IN THE
PROCESS OF CYCLICAL DEVELOPMENT IN THE NATIONAL ECONOMY ..... 409 Viktor Barkhatov, Ekaterina Lymar, Ivan Koptelov
QUALITATIVE STUDY OF THE INCLUSIVE COMPETENCE OF TEACHERS OF
VOCATIONAL EDUCATION INSTITUTIONS ........................................................... 417 Svetlana Kurnosova, Nikolai Kokanov, Tatyana Lushnikova, Linara Battalova, Yulia Petrova,
Elena Martynova
VALUE AND PRICE OF NETWORK COMMUNICATIONS OF PERSONNEL ...... 421
Yuri Startsev, Alexander Taradanov
METHODOLOGY FOR ASSESSING WORKER’S BEHAVIORAL OPPORTUNISM
IN RUSSIAN CORPORATIONS .................................................................................... 426 Elena Kozlova, Dmitri Pletnev
FINANCIAL DEVELOPMENT INDICATORS AND ECONOMIC GROWTH: A
COMPARATIVE STUDY BETWEEN MOROCCO, COMOROS, MAURITIUS,
RWANDA, TUNISIA AND SENEGAL........................................................................... 435 Saanyane Moussa Omar, Hammes Khalid
CURRENT STATE AND DEVELOPMENT PERSPECTIVES OF CSR
PERFORMANCE IN AZERBAIJAN ............................................................................. 443
Shahla Gahramanova

TRENDS AND CONTRADICTIONS OF ECONOMY GLOBALIZATION ............... 451
Shafa Guliyeva
SOCIAL MEDIA COMMUNICATION STRATEGY FOR HEALTH AND
WELLBEING PROVIDERS – MAJOR ELEMENTS THAT KEEP CONSUMERS
ENGAGED ....................................................................................................................... 459
Orindaru Andreea, Caescu Stefan-Claudiu
CRISIS MANAGEMENT IN TOURISM – LITERATURE REVIEW ......................... 466
Dora Smolcic Jurdana, Daniela Soldic Frleta, Romina Agbaba
HUMAN PERSONAL TIME: APPEALING TO ITS DUALITY AND
HARMONIZATION ........................................................................................................ 476 Svetlana Sotnikova, Elena Razomasova, Elena Mikhailova
SOCIAL MEDIA MARKETING AS TOOL OF BUSINESS SUCCESS ...................... 485 Veronika Paurova, Anna Krizanova, Margareta Nadanyiova
DATING THE GROWTH CYCLE OF MOROCCO AND ITS SYNCHRONIZATION
WITH THE CYCLES OF THE MAIN TRADING PARTNERS .................................. 492
Soussi Noufail Outmane, Abdelghani Bensaid
RISK IN SOCIAL PRACTICES: «NORMALIZATION» AND «HABITUALIZATION»
........................................................................................................................................... 499 Svetlana Ilynykh, Svetlana Rovbel, Elena Naumova, Evgeniya Komf
DIVERGENCES AND THEIR EVIDENTIAL VALUE IN THE PROCESS OF
MAXIMIZING EARNINGS FROM TRADING OF FINANCIAL MARKETS ........... 506 Jan Chutka, Ladislav Vagner
THE WORLD ECONOMY ON THE EVE OF A NEW CRISIS ................................... 512 Mushfig Feyzullaev, Ramiz Javadov, Nazim Hajiyev
MUNICIPAL SOCIAL RESPOSIBILITY ...................................................................... 521 Kristina Afric Rakitovac, Mojca Tavcar Bencic
CONCEPT OF BUSINESS ACCOUNTING AND INTEGRATED REPORTING ...... 532 Victor Plotnikov, Olesya Plotnikova
INTERCULTURAL LEARNING THROUGH THE ERAMUS STUDENT MOBILITY
PROGRAMME ................................................................................................................ 538
Violeta Vidacek-Hains, Amalija Parlaj
PRICE FENCES AS A MECHANISM OF COMPANY´S DIFFERENT PRICING TO
CUSTOMERS WITH DIFFERENT WILLINGNESS TO PAY .................................... 547 Zdenka Vidrova, Margareta Nadanyiova, Jana Kliestikova
THE IMPORTANCE OF WELL-TARGETED MARKETING ON SELECTED
BRANDS ........................................................................................................................... 554
David Vrtana, Anna Krizanova, Juraj Kolencik

DIRECTIONS AND PROBLEMS OF INVESTMENT ACTIVITY IN THE
NOVOSIBIRSK REGION ............................................................................................... 562 Vyacheslav Markelov
MANAGEMENT OF NON-PROFIT ORGANIZATIONS ............................................ 571 Zuzana Rosnerova, Dagmar Hraskova
THEORETICAL BACKGROUND OF SIMPLE ACCOUNTING AND COMPARISON
OF THE USE OF SIMPLE ACCOUNTING IN THE CONDITIONS OF SLOVAK
REPUBLIC AND CZECH REPUBLIC .......................................................................... 581 Filip Rebetak, Dusan Karpac, Viera Bartosova
THE IMPORTANCE OF TIME MANAGEMENT IN NON-PROFIT
ORGANIZATIONS .......................................................................................................... 587
Emilia Gresakova, Darina Chlebikova
SOCIAL EFFECTIVENESS AS METER IN THE DEVELOPMENT OF SOCIAL
ECONOMY ...................................................................................................................... 594 Venelin Terziev
INTERNATIONALIZATION, CONCENTRATION AND BUSINESS SUCCESS OF
RETAILERS: THE CASE OF CROATIA ...................................................................... 604
Ivan Kovac
TAXATION OF LUXURY GOODS................................................................................ 615
Maris Juruss, Janis Brizga, Liga Gasune, Valerijs Skribans
TESTING THE IMPACT OF GLOBAL FINANCIAL CRISIS ON GLOBAL TRADE
INTEGRATION ............................................................................................................... 624
Ahliman Abbasov
51st International Scientific Conference on Economic and Social Development – Rabat, 26-27 March 2020
1
ORGANIZED CRIMINAL ACTIVITIES IN THE FIELD OF
INSURANCE IN RUSSIA AND ABROAD
Roman N. Borovskikh
Professor at the Department of the Criminal Law and National Security,
Novosibirsk State University of Economics and Management
Novosibirsk, Russia
Nadezhda I. Verchenko
Associate Professor at Criminal Law and National Security Department,
Novosibirsk State University of Economics and Management, Candidate of Law
Novosibirsk, Russia
ABSTRACT
Based on the results of the analysis of data obtained through the method of expert assessments
of information, as well as on the materials of the existing law enforcement practices, the article
discusses typical mechanisms of organized criminal activities in the field of insurance.
Keywords: crimes in the field of insurance, fraud, organized criminal activities
1. INTRODUCTION
Currently, the law enforcement practices addressing crimes in the insurance sector in Russia is
characterized by the following criminalistically significant trends:
1. such practices focus on the insurance fraud detection and investigation (article 159.5 of the
RF Criminal Code);
2. other crimes in the insurance industry (including fraud associated crimes) often have no
adequate criminal law response (remain undisclosed, not identified, analysed in the
framework of civil law relations as non-criminal torts, etc.);
3. the result of addressing insurance frauds in the vast majority of cases is the neutralization
of individually committed (simple, household, non-group) frauds, as well as frauds
committed as a part of group of persons (group fraud);
4. cases of neutralized group fraud in the insurance industry are characterized by a rather
primitive content of the criminal activity group nature: such groups, as a rule, consist of
amateur swindlers, and are formed spontaneously, often on the basis of family and friendly
ties, they do not have a corruption cover-up, and are aimed at committing a single fraud,
etc.
At the same time, the significant manifestations of organized criminal activity in the insurance
sector can be reviewed through some indirect signs. In particular, the study of law enforcement
practices show that quite often the court's sentences on the conviction of amateur criminals
contain the information about unidentified persons who in a certain way assisted in the
commission of the crime (for example, by mediation in the production of false documents or
by promising mediation in the documents processing by the insurance companies, or by
promising to produce falsified expert opinions, documents on road accidents, etc.). Thus, the
"chain" of organized and organized corrupt criminal activities in the sphere of insurance, as a
rule, remain undisclosed, and only the final link of the chain – the direct perpetrator of fraud (a
dilettante criminal) - is neutralized. That said, it is not always possible either to curb or address
expeditiously the coordinating activities of the persons, carrying out single or group criminal
activities in the sphere of insurance.
51st International Scientific Conference on Economic and Social Development – Rabat, 26-27 March 2020
2
The results of the analysis of data, obtained through the method of expert assessments of
information, as well as the materials of the existing law enforcement practice, make it possible
to identify typical mechanisms of organized criminal activities in the field of insurance.
2. A FINANCIAL PYRAMIDS SCHEMES MECHANISM OF ORGANIZED
CRIMINAL ACTIVITIES WITH LARGE-SCALE EMBEZZLEMENT
The essence of such typical mechanism of organized criminal activities in the field of insurance
is associated with the malicious use of legislative gaps and contradictions concerning the legal
status of certain subjects of the insurance business (for example, mutual insurance companies,
etc.) and the legal regulation of advertising and marketing activities in the field of insurance
(the network method of sales of insurance policies in particular). Here is a good example. In
early 2009, the media reported that yet another pyramid disguised as a mutual insurance
company had collapsed. Nadezda (Hope) financial pyramid offered financial support to
pensioners and promised to assist young people with employment. To get a job in the company,
potential candidates had only to bring in their friends and relatives. Customers came to Nadezda
to insure their life and health at high interest. According to the investigators, among the victims
of the pyramid there were citizens of Mari El, Chuvashia, Kirov region, Moscow and other
regions of Russia1. The sentence of the court, delivered in 2012, stated that Mr S. and Mr B.,
leaders of this financial pyramid, had been carrying out criminal activities under the guise of
the mutual insurance company since 2005. Mr S. and Mr B. were convicted by the court under
part 4 of article 159 of the RF Criminal Code (109 episodes) for committing a large scale fraud
by an organized group (the total amount of the stolen property amounted to 5,510,500 rubles)
and sentenced them to the imprisonment for 9 years and 6 months, 8 years and 6 months,
respectively2. In this regard, large-scale illegal activities of the so-called "insurance
consultants", "brokers" deserve special attention. About 20 firms were engaged in similar
activities in Russia and abroad, the most noticeable being SiSaveInvest. SiSaveInvest
advertised and sold life insurance policies of foreign insurance companies such as Fortuna
(Switzerland), Grave (Austria), Medlife (Cyprus), Clerical Medical International (UK), ALICO
(USA) and American Security Life (Liechtenstein). Potential policyholders were tempted by
the opportunity to accumulate funds in reliable foreign banks (mainly Swiss) or in foreign
insurance companies, usually registered offshore. However, insurance contracts are designed
in such a way that when an insured event occurs, it is extremely difficult to achieve fulfillment
of obligations from the insurer (for example, under the terms of one of the contracts, in order
to receive an insurance payment, the policyholder has to submit original criminal procedural
documents to the foreign insurer at its registered address). SiSaveInvest sells policies both in
its offices, and through the system of multilevel network marketing3. In the Russian forensic
literature, SiSaveInvest is described as one of the possible schemes of fraud and money
laundering. As L. Y. Drapkin and Y. M. Zlochenko note, the criminal scheme was that the
employees of SiSaveInvest, having no license, distributed insurance policies of foreign
companies in Vladimir, Tula, Rostov and Tyumen regions, which is prohibited by the
legislation of the Russian Federation. The entry fee for individuals amounted $US 1,000. But
the bulk of the money came from large enterprises, whose employees were insured by the heads
of these organizations, quite often the employees were insured and charged without their
1 Nadezda mutual insurance company. Fininstructor website. Retrieved 01.10.2019 from http://www.fininstruktor.ru/nadejda.html 2 The sentence of the Industrial district court of Izhevsk № 1-1 / 12 of 24.04.2012. Website Judicial and regulatory acts of the Russian Federation. Retrieved 01.10.2019 from http://sudact.ru/regular/doc/fBY3zJPefhdw 3 The system of multi-level-marketing is widely used in order to sell goods or services. See details: Barber D. Just What is...Network Marketing? M.: Fair Press, 2001, 192 p.; Kardava A. Is Network marketing a pyramid scheme? A Scam? Or ... a system of distribution of goods and services. M.: PROMIS Inernational, 2002, 304 p.; Rakhimova L. We start MLM: network marketing. M.: 2003, 208 p.

51st International Scientific Conference on Economic and Social Development – Rabat, 26-27 March 2020
3
consent and knowledge. Thus, a lot of Togliatti VAZ employees of were 'insured' for almost
$US 6,000,000. Even greater sums were 'collected' by the insurers at Magnitogorsk Iron & Steel
Works, and company Vneshtorgbank (Moscow) – $US 50,000, Moscow post office − more
than 756 million rubles, JSC Semikarakorsknefteprodukt (Rostov) - $US 140 000, MIG-Svyaz
( Urengoy), Fiber-Optic plant (Vologda) and many others, including high-security and sensitive
enterprises. To conceal the embezzlement of budget money, corrupt officials concluded
fictitious repair and construction works contracts with commercial companies. The insurance
premiums of the overwhelming majority of insured individuals were appropriated under the
pretext of violation of contractual obligations or on other far-fetched excuses. In 1998-2000
SiSaveInvest employees started transferring money abroad under quite a plausible pretext –
they allegedly sign insurance contracts and finalize them in Austria. After the money had been
transferred to SраrkаssеНаrtbеrg-Vоrаu Bank in Austria, the money could have been
transferred either to ВudареstВаnk (Hungary), or to Наnsаbаnk-Latvia (Riga). In addition, the
money was laundered through the Swiss bank ShwеizerisjerBankverein and BаnkоfСурrus.
According to operational data, banks located in offshore zones were used to mask the illegal
origin of the "insurance" money. It is estimated that in 1996-2000 the money outflow amounted
at least $US 3 billion in Russia4. In modern practice, we managed to find an example of effective
criminal prosecution of heads of SiSaveInvest structural divisions. Therefore, in 2008-2009 the
officers of the Department of Internal Affairs for Orenburg region detected and investigated
two fraudulent criminal schemes. According to the first scheme, the SiSaveInvest financial
adviser targeted customers, willing to conclude contracts of cumulative pension insurance.
When the customer consented to conclude the contract of pension insurance, the life insurance
contract was signed on behalf of a foreign insurance company (for $US 2,500). The sum was
paid in cash to the financial adviser, who later provided the client with confirmation that their
money was transferred to the account opened in the client's name with the insurance company.
In fact, the confirmation was a cheque issued by a foreign bank, where G. had opened a personal
account. At the same time, SiSaveInvest had never been licensed to carry out insurance
activities, this organization was neither listed in the register of subjects of insurance business,
nor it was registered in the tax register.
3. A TYPICAL MECHANISM OF ORGANIZED CRIME ACTIVITIES, ASSOCIATED
WITH THE LARGE-SCALE INTRA-CORPORATE THEFT IN THE INSURANCE
SECTOR
These are typically high-ranking employees of insurance companies who organise and carry
out crimes in the sphere of insurance in a group of subordinate agents and heads of agency
departments. The striking example is a criminal case of embezzlement in the Vector insurance
company, initiated against A. Kondratenkov, the beneficiary of a number of large insurance
companies in Russia5. The subject of theft are the premiums that are not partially credited to
the insurer's cash register, for example, by manipulating the agency commissions payments.
The study of foreign experience in combating insurance crimes was based on the analysis of
the media, published court decisions and specialized scientific literature. According to the
results, it can be concluded that the main type of criminal encroachments in this area is
insurance fraud. The study of foreign practice shows that the global average level of insurance
fraud is about 10%6.
4 The Drapkin L. Ya., Y. M. Zlotchenko Criminal ways of the legalization of proceeds derived from crime. In Organized crime and corruption. Special ediition. No. 1. Yekaterinburg: Zashchita-Ural, 2001. 5 O. Kutasov, T. Grishina They have come for the insurer from the Crimea. Retrieved 01.10.2019 from https://www.kommersant.ru/doc/4073761
6 Koshkin D. S. Insurance fraud: foreign and domestic practices. Finance 2006, No. 10. Retrieved 01.01.2018 from http://www.lawmix.ru/bux/78877/

51st International Scientific Conference on Economic and Social Development – Rabat, 26-27 March 2020
4
Thus, the European Insurance Committee estimates losses from fraud in Europe at €8 billion,
constituting 2% of all insurance premiums in the EU7. In Germany, 7.5 to 9 thousand of
insurance frauds are committed annually, at a total amount of approximately 6-8% of all
insurance payments, and in monetary terms, insurers lose from 4 to 6 billion Deutsche marks8.
In the UK, insurance fraud is the most profitable risk-return type of crime, and its main danger
is that the proceeds from insurance fraud are used to finance other criminal activities. According
to the Financial Services Authority (FSA), fraudsters in the UK receive about 10% of auto
insurance premiums and about 15% of property insurance premiums. Insurance company
Norwich Union published the results of a synthesis study conducted on the basis of various
reports on the scale of fraud in the UK. According to the company's calculations, the damage
to the economy made by insurance fraudsters amounted to £15.8 billion ($8,5 billion) in 2004.
Overall, it says, damage amounts to 1.4% of the UK's GDP, or £650 per household9. The
Association of British insurers (ABI) spends about £200 million a year to fight insurance
fraud10. In France, losses caused by unscrupulous customers of insurance companies are
estimated at about $ 3 billion. According to official data, the disclosed fraud cases only account
for a total of 10% of the insurance indemnity paid.11. In Holland, payments to fraudsters account
for approximately 5% of all insurance payments, reaching about $ 300 million12. Car insurance
fraud is one of the most common crimes in China13. A striking example is 334 established facts
of insurance fraud committed during the period from late 2010 to May 2013 by a law breaker
from Shenzhen. According to the South China Morning Post newspaper, the fraud was carried
out by the criminal by staging road accidents14. There are manifestations of a high degree of
organization of this criminal business in China. In 2012, Chinese police stopped the activities
of a criminal group that included 95 people. The group specialized in the staging of road
accidents and received illegally insurance payments. The damage to insurance companies from
criminal activity is estimated at ¥13 million or $2 million15. In Canada, the experts estimate that
fraudsters damage the insurance industry amounting to about $1.3 billion a year. It is believed
that 10 to15 cents per each dollar of the premium are paid to fraudulent claims. In the United
States, insurance fraud is recognized as one of the most common crimes. According to the FBI,
the insurance industry consists of more than 7,000 companies that collect over $1 trillion in
premiums each year. At the same time, FBI experts note that the total cost of insurance fraud
(non-health insurance) is estimated to be more than $40 billion per year16. The study of foreign
literature shows that insurance fraud is the main, but not the only type of organized criminal
activity in the field of insurance abroad. The work of the American author B. Zalm, published
by the American Bar Association Publ., examines briefly the issues of criminal liability for
insurance fraud, as well as the identification, disclosure and investigation of such crimes. The
author presents these questions taking into account the fact that this crime can be committed by
a wide range of subjects involved in insurance.
7 Ibid. 8 Ibid. 9 Vide Koshkin D. S. The work cited 10 City of London police. Insurance Fraud Enforcement Department (IFED). Annual Review 2012. Retrieved 01.01.2018 from https://www.cityoflondon.police.uk/advice-and-support/fraud-and-economic-crime/ifed/Pages/Annual-review.aspx 11 Vide Koshkin D. S. The work cited 12 Vide Koshkin D. S. The work cited 13 Chinese motorist arrested for insurance fraud. Retrieved 01.01.2018 from http://www.rg.ru/2013/07/05/strahovka-anons.html 14 P. Boehler Shenzhen insurance scammer arrested for 334 car crashes, police say. Retrieved 01.01.2018 from http://www.scmp.com/news/china/article/1275886/shenzhen-insurance-scammer-arrested-334-car-crashes-say-police 15 In China, an insurance fraudster, who provoked 334 road accidents in 3 years and received $58 thousand from insurers, was arrested. Retrieved 01.01.2018 from http://forinsurer.com/news/ 13/07/08/29534 16 Insurance fraud. Retrieved 01.01.2018 from www.fbi.gov/stats-services/publications/insurance-fraud/insurance_fraud
51st International Scientific Conference on Economic and Social Development – Rabat, 26-27 March 2020
5
In this sense, the study of B. Zalm, as one of the few, reflects the author's broad view on the
problem of fraud in the insurance industry17. In the reference manual published in New York,
L. Hymes and J. Wells examine the issues of criminological characterization, criminal liability
and fraud investigation in various types of insurance18. The work is characterized by a
pronounced victimological aspect. Another example of this kind of investigations is the work
of Wolff A. "The case of the insurance fraud sacrifices"19. It is necessary to single out some
studies of the American experts (J. Kuller, G. Reinhard, J. Lichtor, D. Morse, L. Ackling, etc.),
which deal with the organization of insurance companies activities in order to fight insurance
fraud20. In particular, J. Lichtor's work on the identification of signs of fraud in the field of life
and health insurance presents a practical guide for employees of insurance organizations, as
well as insurance investigators and private detectives21. There are other works of a similar
kind22. The practical manual by D. Morse and L. Ackling is even more meaningful from the
point of view of the addressee of the given recommendations – employees of an insurance
organization23. The analysed studies contain brief applied reference manuals aimed at the other
participants of insurance process – insurers as consumers of the insurance services24. In
addition, all the studies contain victimological aspect of the problem under consideration. For
example, A. Lewis addresses his research on insurance fraud prevention potential to victims of
this crime25. In the American literature, there are studies of insurance fraud phenomenon in
different sectors. For example, the monograph by R. Dubois describes the issues of detection
and prevention of fraud in the field of auto insurance; expert methods of this crime detection
are studied by the author26. The work of the American expert, B. Sawyer, deals with the
detection of fraud in the field of marine insurance27. The study of R. Bourhis discusses some
issues of criminalistic characteristics and prevention of fraud in the field of personal
insurance28. Thus, the undertaken comparative law research shows that in Russia and other
countries considerable attention is paid to the fraud detection and investigation of and other
crimes committed in the field of insurance.
LITERATURE:
1. A Consumer Guide to Insurance Fraud Maryland Insurance Administration. Balrimore,
2009, 10 p.
2. Bourhis R. Insult to Injury: Insurance, Fraud, and the Big Business of Bad Faith. R.
Bourhis. San Francisco: Berrett-Koehler Publishers, 2005, 263 p.
3. Chinese motorist arrested for insurance fraud. Retrieved 01.01.2018 from
http://www.rg.ru/2013/07/05/strahovka-anons.html
17 Zalma, B. The Insurance Fraud Deskbook. Chicago: ABA Book Publishing, 2015, 486 p. 18 Insurance Fraud Casebook: Paying a Premium for crime. L. Hymes, T. J. Wells. New York, 2004, 288 p. 19 Wolff A. The Case of The Insurance Fraud Sacrifices. V. 13: Zen and the Art of Investigation. Indiana: AutorHouse, 2014, 186 p. 20 Insurance Fine Art, Insurance Fraud and the Need for Reform Within the Insurance Industry Following the Case of Dr.
Steven G. Cooperman. California, 2008, 136 p.; Defending Against Insurance Fraud Claims: Leading Lawyers on Representing Insurers in Investigating and Preventing Fraudulent Activity. J. M. Kuller, G. R. Reinhardt. Boston, Mass.: Aspatore, 2011, 308 p.; Models of Insurance Fraud: Build-up, Ex Post Moral Hazard and Optimal Contracts. USA, 1998, 308 p. 21 Lichtor, J. M. Personal Injury Insurance Fraud: The Process of Detection : a Primer for Insurance and Legal Professionals. NY: Lawyers & Judges Publishing Comp., 2002, 190 p. 22 Introduction to Insurance Fraud: An Investigator's Manual. USA, 1978, 187 p. 23 Insurance Fraud: Law and Practice. Practical insurance guides. D. Morse, L. S. Ackling. New York, 2004, 178 p. 24 A Consumer Guide to Insurance Fraud Maryland Insurance Administration. Balrimore, 2009, 10 p. 25 Lewis, Albert B. Danger! Insurance Fraud in Progress: How to Avoid Becoming a Victim. USA: Carriage House Pr., 1987, 381 p. 26 DuBois, Robert A. Insurance Fraud and Motor Vehicle Collisions. Robert A. DuBois. Washington: Institute of Police Technology and Management, 1993, 128 p. 27 Soyer, B. Marine insurance fraud. B. Soyer. New York: Informa Law from Routledge, 2014, 378 p. 28 Bourhis R. Insult to Injury: Insurance, Fraud, and the Big Business of Bad Faith. R. Bourhis. San Francisco: Berrett-Koehler Publishers, 2005, 263 p.
51st International Scientific Conference on Economic and Social Development – Rabat, 26-27 March 2020
6
4. City of London police. Insurance Fraud Enforcement Department (IFED). Annual Review
2012. Retrieved 01.01.2018 from https://www.cityoflondon.police.uk/advice-and-
support/fraud-and-economic-crime/ifed/Pages/Annual-review.aspx
5. DuBois, Robert A. Insurance Fraud and Motor Vehicle Collisions. Robert A. DuBois.
Washington: Institute of Police Technology and Management, 1993, 128 p.
6. Ibid.
7. In China, an insurance fraudster, who provoked 334 road accidents in 3 years and received
$58 thousand from insurers, was arrested. Retrieved 01.01.2018 from
http://forinsurer.com/news/
13/07/08/29534
8. Insurance Fine Art, Insurance Fraud and the Need for Reform Within the Insurance
Industry Following the Case of Dr. Steven G. Cooperman. California, 2008, 136 p.;
Defending Against Insurance Fraud Claims: Leading Lawyers on Representing Insurers in
Investigating and Preventing Fraudulent Activity. J. M. Kuller, G. R. Reinhardt. Boston,
Mass.: Aspatore, 2011, 308 p.; Models of Insurance Fraud: Build-up, Ex Post Moral
Hazard and Optimal Contracts. USA, 1998, 308 p.
9. Insurance Fraud Casebook: Paying a Premium for crime. L. Hymes, T. J. Wells. New
York, 2004, 288 p.
10. Insurance fraud. Retrieved 01.01.2018 from
www.fbi.gov/stats-services/publications/insurance-fraud/insurance_fraud
11. Insurance Fraud: Law and Practice. Practical insurance guides. D. Morse, L. S. Ackling.
New York, 2004, 178 p.
12. Introduction to Insurance Fraud: An Investigator's Manual. USA, 1978, 187 p.
13. Koshkin D. S. Insurance fraud: foreign and domestic practices. Finance 2006, No. 10.
Retrieved 01.01.2018 from http://www.lawmix.ru/bux/78877/
14. Lewis, Albert B. Danger! Insurance Fraud in Progress: How to Avoid Becoming a Victim.
USA: Carriage House Pr., 1987, 381 p.
15. Lichtor, J. M. Personal Injury Insurance Fraud: The Process of Detection : a Primer for
Insurance and Legal Professionals. NY: Lawyers & Judges Publishing Comp., 2002, 190 p.
16. Nadezda mutual insurance company. Fininstructor website. Retrieved 01.10.2019 from
http://www.fininstruktor.ru/nadejda.html
17. O. Kutasov, T. Grishina They have come for the insurer from the Crimea. Retrieved
01.10.2019 from https://www.kommersant.ru/doc/4073761
18. P. Boehler Shenzhen insurance scammer arrested for 334 car crashes, police say. Retrieved
01.01.2018 from http://www.scmp.com/news/china/article/1275886/shenzhen-insurance-
scammer-arrested-334-car-crashes-say-police
19. Soyer, B. Marine insurance fraud. B. Soyer. New York: Informa Law from Routledge,
2014, 378 p.
20. The Drapkin L. Ya., Y. M. Zlotchenko Criminal ways of the legalization of proceeds
derived from crime. In Organized crime and corruption. Special ediition. No. 1.
Yekaterinburg: Zashchita-Ural, 2001.
21. The sentence of the Industrial district court of Izhevsk № 1-1 / 12 of 24.04.2012. Website
Judicial and regulatory acts of the Russian Federation. Retrieved 01.10.2019 from
http://sudact.ru/regular/doc/fBY3zJPefhdw
22. The system of multi-level-marketing is widely used in order to sell goods or services. See
details: Barber D. Just What is...Network Marketing? M.: Fair Press, 2001, 192 p.; Kardava
A. Is Network marketing a pyramid scheme? A Scam? Or ... a system of distribution of
goods and services. M.: PROMIS Inernational, 2002, 304 p.; Rakhimova L. We start MLM:
network marketing. M.: 2003, 208 p.

51st International Scientific Conference on Economic and Social Development – Rabat, 26-27 March 2020
7
23. Wolff A. The Case of The Insurance Fraud Sacrifices. V. 13: Zen and the Art of
Investigation. Indiana: AutorHouse, 2014, 186 p.
24. Zalma, B. The Insurance Fraud Deskbook. Chicago: ABA Book Publishing, 2015, 486 p.

51st International Scientific Conference on Economic and Social Development – Rabat, 26-27 March 2020
8
THE SOCIAL AND ECONOMIC FACTORS OF THE
REHABILITATION OF A POST-STROKE PATIENT
Еlena Sevostyanova
Chelyabinsk State University
Bratiev Kashirinykh str., 129, Chelyabinsk, Russia
Irina Trushina
Chelyabinsk State University
Bratiev Kashirinykh str., 129, Chelyabinsk, Russia
Мark Loskutnikov
Iron&Steel Hospital
Naberezhnaya str., 18, Magnitogorsk, Russia
Natalia Kurenkova
GBUZ Regional Clinical Hospital №3
Prospekt Pobedy, 287, Chelyabinsk, Russia
ABSTRACT
Diseases in the circulatory system of the brain are not only a medical but also a social and
economic problem at present, as a stroke patient needs long-term rehabilitation while
remaining disabled until the restoration of the lost functions. The study identified psychological
factors that prevent the rapid and complete rehabilitation of patients after the ischemic stroke.
The neurologic status was assessed on the modified mRS Rankin Scale as well as on the NIHSS
Bartel Scale. Beck Depression Inventory (BDI) has helped to identify features of depression in
patients with various clinical manifestations of stroke. The practical significance of the work is
the possibility of developing psychological support programs based on the results of the study,
which would provide an optimized rehabilitation process for patients after ischemic stroke.
Keywords: Psychological features of the post-stroke patients, rehabilitation, stroke
1. INTRODUCTION
Diseases in the circulatory system of the brain are issues of great medical and social importance,
and a global epidemic that endangers the lives and health of people around the world. Over
thirty million people around the world have had a stroke. The number of deaths from stroke is
6.2 million annually. More than 80 percent of people who have had a stroke become disabled.
Stroke is the leading cause of disability among all diseases. Patients who have had a stroke need
constant care. More than 80% of stroke patients have a speech disorder. People who care for
stroke patients are likely to be depressed and have a feeling of having to bear a heavy burden.
In 2019, the U.S. spent $48 billion on post-stroke care (4% of healthcare costs), and Finland
spent $1.2 billion (6.1% of healthcare costs). In the Russian Federation, 450 thousand new
strokes occur every year. The Russian Federation spends $0.9 billion (57.2 billion rubles)
annually on rehabilitation after stroke. The cost of treatment of one stroke patient in Russia,
including inpatient treatment, rehabilitation, and secondary prevention, is 127 thousand rubles
per year. High rates of becoming a disabled person after having a stroke lead to loss of working
capacity, limitations in everyday life, long-term rehabilitation.
51st International Scientific Conference on Economic and Social Development – Rabat, 26-27 March 2020
9
Post-stroke depression (PSD) has an adverse impact on the functional outcome of rehabilitation,
quality of life, leading to longer and more expensive rehabilitation. A quarter (25.4%) of stroke
survivors have experienced post-stroke depression (PSD). The percentage of occurrence of PSD
is 46% during the first week of the acute phase of the stroke. The percentage of patients who
suffer from PSD may be significantly higher, as most cases may be neglected due to various
comorbid and post-stroke clinical conditions that may conceal the depression. Scientists from
Chile and Spain have revealed that dysarthria is an acquired motor speech disorder of
neurological origin that significantly decreases the degree of social interaction. Patients who
experience problems with social interaction are three times more likely to become depressed
than patients who do not experience such problems. Prevention of the PSD requires the
participation of both the society and the family. Aphasia was significantly associated with PSD
in the first six months after stroke. The consequences of a stroke affect both the patient and his
social environmen. There is a growing need for verbal communication and emotional
regulation, as the patient needs assistance due to movement disorders, but dysarthria prevents
this from happening. De Ryck et al. (Belgium) emphasizes the importance of rigorous and long-
term monitoring and support of stroke patients and their caregivers. The aim of this study is to
evaluate the features of the manifestation of PSD, depending on clinical disorders.
2. RESEARCH PARTICIPANTS AND METHODOLOGICAL BASIS
The research involved 50 post-stroke patients in total. The criterion for including patients into
the research was the first case of experiencing the atherothrombotic ischemic stroke in an
internal carotid art system confirmed by a C.T. scan of the brain. 50 post-stroke patients were
separated into two groups. The first group (25 patients with movement and speech disorders)
consisted of 11 women (average age – 52±2.1 years) and 14 men (average age – 61±3.5 years).
The second group (25 patients with movement and speech disorders) consisted of 12 women
(average age – 59.6+2.5 years) and 13 men (average age – 62.2±3.4 years). The dynamics were
assessed by the modified Rankin Scale (mRs), the results of the National Institute of Health
Stroke Scale (NIHSS) and the Montreal Cognitive Assessment (MoCa) were used, the Beck
Depression Inventory (BDI) and the Barthel Index (B.I.) was applied, and D. Amirkhan's coping
strategy was applied as well (adapted by N.A. Sirot and V.M. Yaltonsky). Test results and
quantitative criteria are described with the help of arithmetical mean (M), standard deviation
(S.D.). The reliability was taken at a 95% confidence interval. A comparison of the values
between the groups on each visit was carried out using the non-parametric Mann-Whitney U
test.
3. RESULTS AND DISCUSSION
Both groups were comparable in the assessment of the modified Rankin Scale (mRs) (p=0.289),
the National Institute of Health Stroke Scale (NIHSS) (p=0.756), Index Bartel (p=0.305), the
Montreal Cognitive Assessment (MoCa) (p=0.066). No significant differences were found on
these scales, which revealed that there are no significant differences in neurological status
between the first and second groups. Testing according to the coping strategy of D. Amirkhan
(adapted by N.A. Sirota and V.M. Yaltonsky) did not reveal any statistically significant
differences between the groups in the value of the sum of point of the "Problem solving" and
"Avoidance" scales (Table 1.). When the tests were conducted with the use of the Beck
Depression Inventory (BDI) the statistically significant difference between the groups in terms
of the sum of points was observed: in the first group the average value was higher and amounted
to 26.6±3.5 points, in the second group – 11.8±1.7 points (p=0.001). When comparing groups
in terms of depression severity, a statistically significant difference was also revealed: Group 1
scored 3.1±0.6, and Group 2 scored 1.4±0.5 (p=0.002) (Table 1). During the testing, according
to D. Amirkhan's "Coping Strategies Indicator" method (adapted by N.A. Sirot and V.M.
51st International Scientific Conference on Economic and Social Development – Rabat, 26-27 March 2020
10
Yaltonsky) statistically significant difference between the groups was observed: in the first
group the average value was lower and amounted to 17,7±3,8 points, while in the second group
– 24,7±4,1 points (p=0,044) (Table 1.).
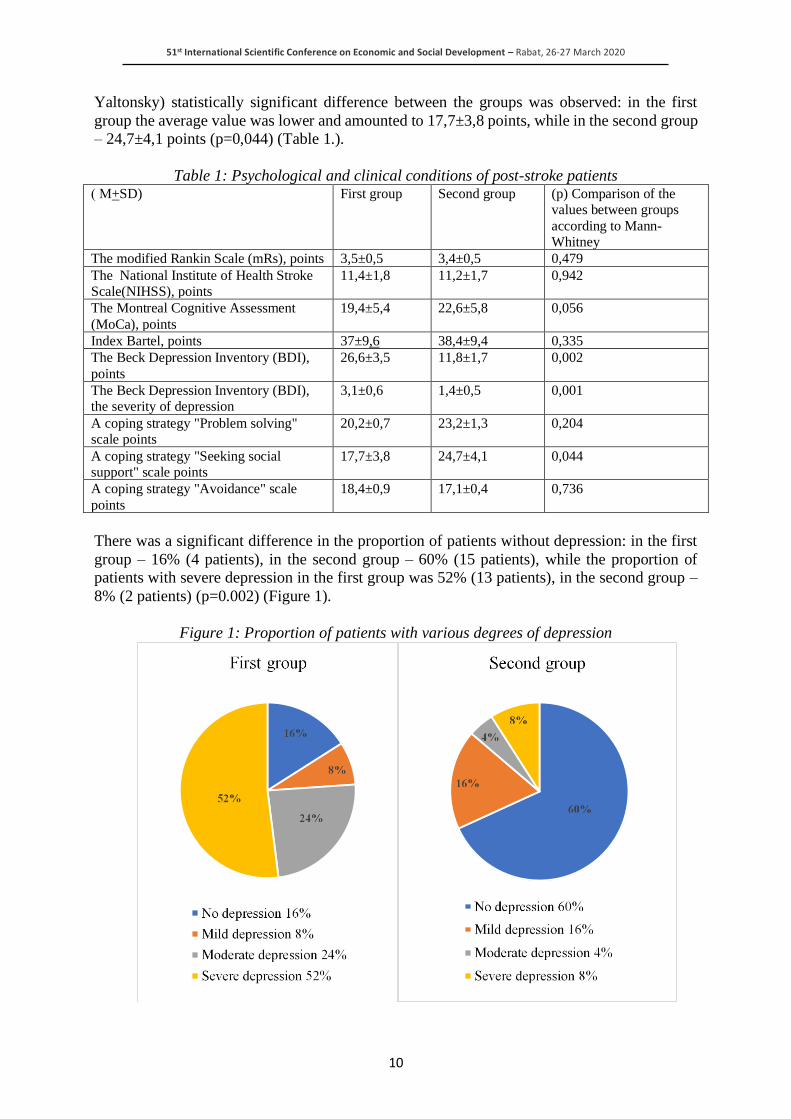
Table 1: Psychological and clinical conditions of post-stroke patients ( М+SD) First group
Second group
(p) Comparison of the
values between groups
according to Mann-
Whitney
The modified Rankin Scale (mRs), points 3,5±0,5 3,4±0,5 0,479
The National Institute of Health Stroke
Scale(NIHSS), points
11,4±1,8 11,2±1,7 0,942
The Montreal Cognitive Assessment
(MoCa), points
19,4±5,4 22,6±5,8 0,056
Index Bartel, points 37±9,6 38,4±9,4 0,335
The Beck Depression Inventory (BDI),
points
26,6±3,5 11,8±1,7 0,002
The Beck Depression Inventory (BDI),
the severity of depression
3,1±0,6 1,4±0,5 0,001
A coping strategy "Problem solving"
scale points
20,2±0,7 23,2±1,3 0,204
A coping strategy "Seeking social
support" scale points
17,7±3,8 24,7±4,1 0,044
A coping strategy "Avoidance" scale
points
18,4±0,9 17,1±0,4 0,736
There was a significant difference in the proportion of patients without depression: in the first
group – 16% (4 patients), in the second group – 60% (15 patients), while the proportion of
patients with severe depression in the first group was 52% (13 patients), in the second group –
8% (2 patients) (p=0.002) (Figure 1).
Figure 1: Proportion of patients with various degrees of depression

51st International Scientific Conference on Economic and Social Development – Rabat, 26-27 March 2020
11
Figure 2: Results of empirical data on the test of D. Amirkhan's coping strategies (adapted by
N.A.Sirota and V.M.Yaltonsky)
Patients of the first group had almost equal average values on all of the three scales, i.e., they
did not have a strongly expressed coping strategy (Figure 2), while values on the scale of
"Seeking social support" were significantly lower compared to patients of the second group
(p=0.044). The strategy of "Seeking social support" and "Problem solving" dominated
insignificantly among the patients of the second group, but there were also patients using the
strategy of "Avoidance" (Figure 2). In summary, Beck's questionnaire revealed depression in
patients in both groups, i.e., stroke became an excessive psychological burden for all the
patients. However, patients with different clinical manifestations of early hemispheric stroke
revealed different degrees of depression (both movement and speech disorders resulted in
severe depression, whereas only movement disorders caused mild depression). Patients of the
first group showed a lack of ability to express their emotions and wishes, as well as the inability
to interact with others, which led to the refusal to seek help and social support. The main
psychological factor affecting the rehabilitation of patients is PSD. Speech disorder was related
to the more severe manifestations of the PSD and reduced use of the coping strategy of "Seeking
social support" and "Problem solving". In order to reduce the severity of PSD in patients with
speech disorders, we suggest the use of sand tray therapy for the patient himself and caregiver
(emotion response) and tablet pc technology (with a single click, the patients choose their needs
from the available options), which simplifies the contact between the patient and the caregiver,
thus improving the quality of life of the patient and his environment. These simple methods
lead to significant economic benefits, and their further development and control of the dynamics
of patients are necessary for the long term.
4. CONCLUSION
During the analysis of the results obtained with the help of Beck's questionnaire, more than half
of all patients included in the study had PSD manifestations with varying degrees of severity.
According to the literature, approximately a quarter of patients have PSD. This discrepancy
may be due to the sampling features (inclusion of patients with three or more Rankin Scale
20.2
17.7 18.4
23.224.7
17.1
0
5
10
15
20
25
30
Сoping strategy, scale
"Problem solving"
Coping strategy, scale
"Seeking social support"
Coping strategy, scale
"Avoidance"
First group Second group

51st International Scientific Conference on Economic and Social Development – Rabat, 26-27 March 2020
12
points) and insufficient diagnosis of PSD during the acute phase of stroke. Severe depression
of patients with speech disorders can be related to the particular importance of the
communicative function in conveying emotions and socialization of the person. Speech
disorders affect the ability to express wishes and thoughts, and the helping process becomes
difficult as well as social participation decreases. Post-stroke patients need help due to
movement disorders, and verbal communication is becoming increasingly important. The
obtained data coincide with De Ryck, Aceituno, Cooper. Cooper C.L. et al. (United Kingdom)
found that stroke survivors have great difficulty with emotional regulation, and emotional
regulation itself affects social participation and quality of life more than movement disorders.
The presence of speech disorders increases the reduction in social participation. Optimization
of interaction between post-stroke patients and their caregivers leads to a reduction in PSD
among patients and depression among caregivers, which improves the quality of life and
rehabilitation outcomes and saves up to 60 thousand rubles or more that are spent on each
patient during rehabilitation. The authors declare that there is no conflict of interest.
LITERATURE:
1. Aceituno C. et al. (2019). Quality of life in people with dysarthria. Revista de Logopedia:,
Foniatria y Audiologia, 2019 (Volume 39, Issue 1), pages 27-31.
2. Cooper C., Phillips L., Johnston M., Whyte M., Macleod M. (2015). The role of emotion
regulation on social participation following a stroke. The British Journal of Clinical
Psychology, 2015 (54(2)), pages 81-99.
3. De Ryck A. et al. (2014). Poststroke depression and its multifactorial nature: Results from
a prospective longitudinal study. Journal of the Neurological Sciences,2014 (Volume 347,
Issue 1-2), pages 159-166.
4. Evers S., Ament A., Blaauw G. (2000). Economic Evaluation in Stroke Research. Stroke,
2000 (31(5)), pages 1046-1053.
5. Gaio M. et al. (2019). Effect of a Passive Intervention on Carers of Stroke Survivors during
the Early Poststroke Period. Journal of Neuroscience Nursing, 2019 (Volume 51, Issue 6),
pages 299-304.
6. Jiang X., Lin, Y., Li Y. (2014). Correlative study on risk factors of depression among
acute stroke patients. European Review for Medical and Pharmacological Sciences, 2014
(18(9)), pages 1315-1323.
7. Jorgensen, T. et al. (2016). Incidence of depression after stroke and associated risk factors
and mortality outcomes in a large cohort of Danish patients. JAMA Psychiatry, 2016
(Volume 73, Issue 10), pages 1032-1040.
8. Kotov S., Isakova E., Sheregeshev V. (2020). Possibilities for Correcting Emotional and
Behavioral Impairments in Stroke Patients during Rehabilitation Therapy. Neuroscience
and Behavioral Physiology, 2020 (Volume 50, Issue 2), pages 156-161.
9. Liu Z., Zhou X., Zhang W., Zhou, L. (2019). Factors associated with quality of life early
after ischemic stroke: the role of resilience. Topics in Stroke Rehabilitation, 2019 (Volume
26, Issue 5), pages 335-341.
10. Nakase T., Tobisawa M., Sasaki M., Suzuki A. (2016). Outstanding Symptoms of
Poststroke Depression During the Acute Phase of Stroke. PLoS One, 2016 (11 (10)).
Retrieved 10.02.2020 https://pubmed.ncbi.nlm.nih.gov/
11. Shi Y., Yang D., Zeng Y., Wu W. (2017). Risk Factors for Post-stroke Depression: A Meta-
analysis. Front Aging Neurosci, 2017 (9), pages 218.
12. Stroke. (2018). Guide for doctors: Edited by Stakhovskaya L.V., Kotov S. V.2-e ed., rev.and
extra. Moscow: LLC «Medical informative agency».

51st International Scientific Conference on Economic and Social Development – Rabat, 26-27 March 2020
13
13. Trusova N., Levin O. (2019). Clinical significance and possibilities of therapy of post-
stroke depression. S.S. Korsakov Journal of Neurology and Psychiatry, 2019 (Volume 119,
Issue 9), pages 60-67.
14. Yagudina R, Kulikov A, Krylov V, Solovieva E, Fedin A. (2019). Pharmacoeconomic
analysis of the neuroprotective medicines in the treatment of ischemic stroke. S.S. Korsakov
Journal of Neurology and Psychiatry, 2019 (119(7)), pages 74-82.
51st International Scientific Conference on Economic and Social Development – Rabat, 26-27 March 2020
14
ACTIVE LABOUR MARKET POLICIES, THE BUSINESS CYCLE AND
LABOUR FORCE SHORTAGES
Katarina Moravcikova
Institute for Forecasting, Centre of Social and Psychological Sciences,
Slovak Academy of Sciences, Slovak Republic
Vladimir Balaz
Institute for Forecasting, Centre of Social and Psychological Sciences,
Slovak Academy of Sciences, Slovak Republic
ABSTRACT
Most studies on active labour market policies (ALMP) concentrate on ALMP performance by
instrument type. Some studies analyse ALMP performance during recession and/or excessive
supply of labour over demand. There is little research on ALMP performance in periods of
economic boom and a shrinking supply of labour. This paper analyses large-scale databases
relating to jobseekers and ALMP instruments in 2014-2018 in Slovakia. It evaluates the effects
of ALMP on increases in employment and employability. The period studied was notable for
two concurrent developments: economic boom and a shrinking labour supply. The authors
analyse the performance of ALMP on an annual basis so as to explore effects of business cycles
and labour shortages. The unemployment figures were quite high in 2014. Access to jobs was
difficult for all kinds of jobseekers, including those with a good education and skills. A booming
economy and demographic transitions eased the pressures on the Slovak labour market over
time. The demand for job seekers with acceptable levels of human capital increased
significantly after 2015. By 2018, the typical unemployed person had low skills and a low level
of education. The jobseekers supported by the ALMPs in place actually found it more difficult
to find employment than jobseekers outside of the ALMP system after 2015 in Slovakia. Future
ALMP instruments will have to concentrate on boosting the employment rates within specific
socio-demographic groups (women, elderly workers) and strengthening the social and
employment inclusion of marginalised communities.
Keywords: active labour market policies, business cycle, labour shortages
1. INTRODUCTION
1.1. Literature review
The rationale for active labour market policies (ALMP) is based on the market failures that
individuals and firms may encounter in relation to the labour market. Plenty of factors, both
internal and external to labour markets, may affect market operation. The most common market
failures include poor labour market opportunities, imperfect matching process relating to
workers and jobs, wage rigidities, information asymmetry between job-seekers and potential
employers, and discrimination against minorities (Blanchard and Katz, 1997). Expenditure on
ALMP by developed OECD Member States is substantial, but assumptions that high spending
on ALMPs will generate more jobs and decrease unemployment rates often proved naive
(Martin, 2015, p. 2). Brown and Koettl, (2015) found little support for the belief that high
expenditure on ALMP means a high number of jobs created/sustained by the ALMP
instruments. Van Vooren et al, 2018, p. 3) conducted a meta-analysis of 57 experimental and
quasi-experimental studies on ALMP. Their findings were generally positive, but also generally
that ALMPs had relatively minor effects on their participants. Card, Kluve and Weber, 2010)
performed a meta-analysis of 199 ALMPs across 26 OECD countries which were operational

51st International Scientific Conference on Economic and Social Development – Rabat, 26-27 March 2020
15
in the period 1996 – 2007. They concluded that different specific categories of ALMP varied
in their ability to generate sustainable jobs. Card, Kluve and Weber (2017) also surveyed 526
ALMP instruments from 47 countries operational in the period 1980 – 2012. The ALMP
differed in their ability to generate short-term as opposed to long-term effects. In the long-term,
the ALMP instruments which targeted the classroom, on-the-job development and the
accumulation of human capital performed best. Card, Kluve and Weber (2017) found above-
average performance for ALMP targeting specific socioeconomic groups, e.g. female and
elderly job seekers. Escudero (2018) reviewed ALMP which were operational across 31 OECD
countries in the period 1985. She found that ALMPs targeting vulnerable population groups
were more efficient than other ALMP instruments (Escudero 2018, p. 1).
1.2. Research gap
Most research on ALMP concentrates on performance by specific ALMP instruments. The
main targets for ALMP instruments are job broking activities, labour market training; and/or
job creation via subsidised employment. Some studies have focused on ALMP designed for
specific socio-economic and socio-demographic groups (female jobseekers, elderly workers,
workers with health disabilities). Relatively few studies have concentrated on ALMP
performance over the business cycle. Nordlund (2011, p. 51) found some evidence that ALMP-
based training had more positive effects during recessions than during booms, in Sweden.
Andersen and Svarer (2012, p. 17) analysed the performance of Danish ALMPs during
recessions. They argued that early intervention may prevent the lock-in effect and decrease the
costs of ALMPs. The abovementioned studies concentrate on ALMP performance in the course
of recessions and/or periods of excessive supply of labour over demand. There is little research
on ALMP performance in periods of economic boom and a shrinking supply of labour. The
availability of labour has become a major issue across the entire central and eastern European
region in the late 2010s (Galgóczi 2017, p. 12). Shrinkage of labour supply results from rapidly
ageing populations (caused by low fertility rates in particular) and massive emigration by young
people (Baláž, and Karasová, 2017). Stehrer and Leitner (2019) explored future trends in labour
supply and demand across the European Union. They found that, in the EU29, labour demand
would exceed the active working-age population by around 2029, but the critical point will be
reached by 2025 in the Czech Republic, Lithuania, Poland, Bulgaria, Slovenia, Germany,
Estonia, Hungary, and the Slovak Republic’ (Stehrer and Leitner 2019, p. 35). They came to
the conclusion that problems with labour shortages would loom large in the future. The general
demographic and labour force scenarios foreseen by the International Monetary Fund indicate
that the supply of labour in central and eastern Europe will decrease significantly over the next
three decades. The increasing participation rates as regards women and older workers will
‘ameliorate but not fully offset the decline in the labour force’ (IMF 2019, p. 15). In Slovakia,
the labour force will decline by 20 percent by 2050. This current study analyses large-scale
databases related to jobseekers and the ALMP instruments operational in 2014-2018 in
Slovakia. It evaluates the effects of ALMP in terms of increases in employment and
employability. The studied period was notable for two concurrent developments: economic
boom and the shrinkage of the labour supply. The authors analyse the performance of the
available ALMPs on an annual basis, so as to explore the effects of the business cycle in relation
to labour shortages.
1.3. Active labour market policies through the business cycle and demographic transition
In Slovakia, ALMPs have received significant support from national and European resources
in the period 2014-2018. The ALMP instruments were implemented via national projects and
supported by the European Social Fund. Total support for ALMP was €785.21m in the
abovementioned period (COLSAF, 2015-2019). The Slovak labour market underwent a

51st International Scientific Conference on Economic and Social Development – Rabat, 26-27 March 2020
16
thorough transformation in the period 2014-2018. The transformation resulted from (a) an
improved economic situation and increasing rates of economic growth; and (b) demographic
transition. The strong demographic cohorts born in 1950-1955 went to retirement and were
replaced by weak cohorts born in 1990-1995. This replacement of cohorts and the effects of a
great deal of emigration by the youth population resulted in significant labour shortages. These
shortages were reflected in rapid decreases in the numbers of unemployed and in unemployment
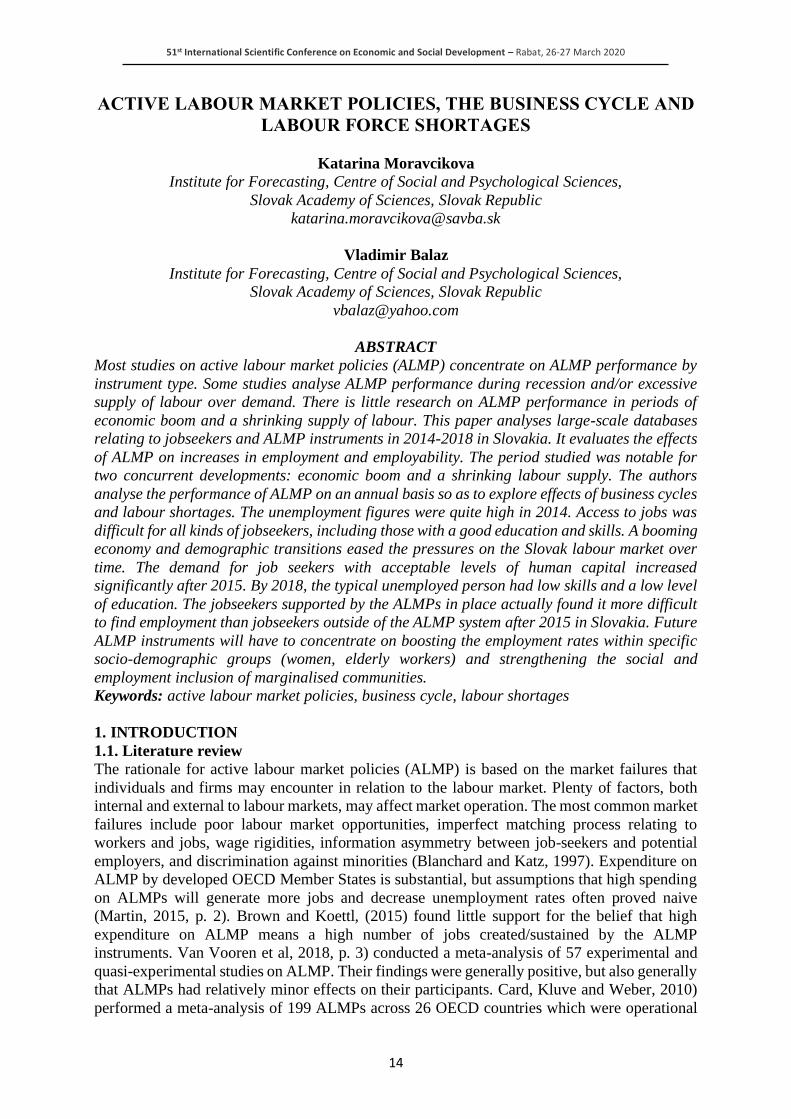
rates (Figures 1 and 2), substantial growth in job vacancies (Figures 1 and 3) and big hikes in
average wages. These trends were very visible both at the national and regional levels (Figures
1, 2 and 3). Some 0.0149 vacancies per one unemployed were available by December 2013, but
by December 2018 there were 0.5347. The annual average growth in real wages was 4.2% in
the period 2014-2018.
Figure 1: The Slovak labour market in 2014-2018: unemployment figures, job vacancies
figures and unemployment rates (%), monthly data (COLSAF)
Figure following on the next page
0.0
2.0
4.0
6.0
8.0
10.0
12.0
14.0
0
50,000
100,000
150,000
200,000
250,000
300,000
350,000
400,000
01/1
4
03/1
4
05/1
4
07/1
4
09/1
4
11/1
4
01/1
5
03/1
5
05/1
5
07/1
5
09/1
5
11/1
5
1/1
6
3/1
6
5/1
6
7/1
6
9/1
6
11/1
6
1/1
7
3/1
7
5/1
7
7/1
7
9/1
7
11/1
7
1/1
8
3/1
8
5/1
8
7/1
8
9/1
8
11/1
8
unemployed job vacancies unemployment rate (%), left axis
%

51st International Scientific Conference on Economic and Social Development – Rabat, 26-27 March 2020
17
Figure 2: Unemployment rates at the regional level (%), 2013-2018 (COLSAF and authors’
computations)
Figure following on the next page
51st International Scientific Conference on Economic and Social Development – Rabat, 26-27 March 2020
18
Figure 3: Job vacancies per one unemployed at the regional level, 2013-2018 (COLSAF and
authors’ computations)
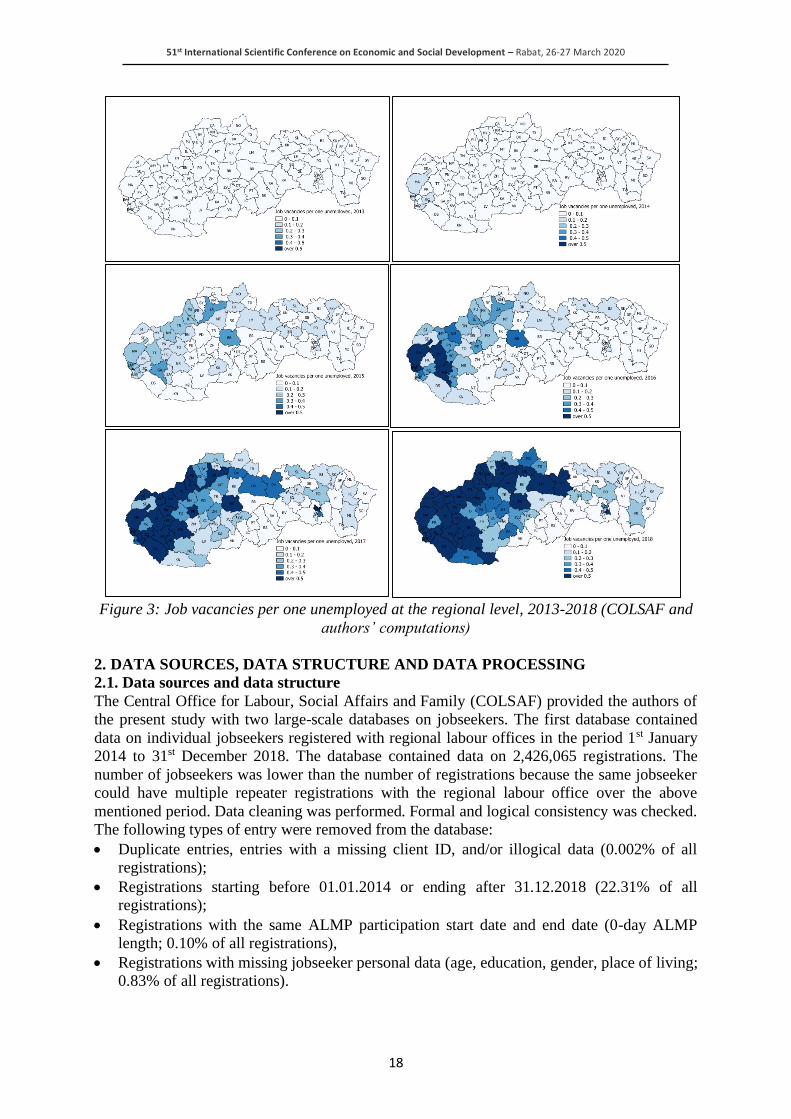
2. DATA SOURCES, DATA STRUCTURE AND DATA PROCESSING
2.1. Data sources and data structure
The Central Office for Labour, Social Affairs and Family (COLSAF) provided the authors of
the present study with two large-scale databases on jobseekers. The first database contained
data on individual jobseekers registered with regional labour offices in the period 1st January
2014 to 31st December 2018. The database contained data on 2,426,065 registrations. The
number of jobseekers was lower than the number of registrations because the same jobseeker
could have multiple repeater registrations with the regional labour office over the above
mentioned period. Data cleaning was performed. Formal and logical consistency was checked.
The following types of entry were removed from the database:
• Duplicate entries, entries with a missing client ID, and/or illogical data (0.002% of all
registrations);
• Registrations starting before 01.01.2014 or ending after 31.12.2018 (22.31% of all
registrations);
• Registrations with the same ALMP participation start date and end date (0-day ALMP
length; 0.10% of all registrations),
• Registrations with missing jobseeker personal data (age, education, gender, place of living;
0.83% of all registrations).
51st International Scientific Conference on Economic and Social Development – Rabat, 26-27 March 2020
19
• Registrations indicating the jobseeker’s age as being lower than 15 or higher than 62 years.
These jobseekers were not eligible for support from the ALMP (0.06% of all registrations).
Some 1,866,711 registrations remained after cleaning. As indicated above, one jobseeker may
have had several registrations over time. As many as 39 repeated registrations per individual
jobseeker were identified. Only the first registration was considered in further analysis. There
were 897,249 individual jobseekers in the database, registered over the period 01.01.2014 -
30.6.2018. The second database contained data on jobseekers supported by one or more ALMP
instruments. There was a total of 699,593 registrations in the period 1st January 2014 - 31st
December 2018. In fact, only a minority of the jobseekers were supported by ALMP
instruments. The same jobseeker, on the other hand, could benefit from several ALMP
instruments, and/or from repeated participations in the same ALMP instruments. The ALMP
database contained the following information on jobseekers supported by specific ALMP
instruments: client ID, type of ALMP instrument (section of the 5/2004 Law on Employment
Services) and the start and end date of participation by the individual jobseeker in s specific
ALMP instrument. Formal and logical checking of the data was performed. The following
entries were removed from the database:
• Duplicate entries (1.55% of all registrations).
• Registrations starting before 01.01.2014 or ending after 31.12.2018 (9.08% of all
registrations).
• Registrations with the same ALMP participation start and end dates (0 day ALMP length)
or registrations with a length of participation other than those specified by the 5/2004 Law
on Employment Services (3.95% of all registrations).
Some 614,436 registrations of jobseekers supported by ALMP instruments were retained after
data cleaning. It was possible for one jobseeker to have participated in several ALMP
instruments, and/or benefited from repeated participation in the same ALMP instrument. As
many as 22 ALMP-supported repeated registrations per individual jobseeker were identified.
After data-cleaning the number of individual ALMP-supported jobseekers was 313,932 in the
period 01.01.2014-30.06.2018.
2.2. ALMP instruments targeted at improving the likelihood of employment and
enhancing employability
The ALMP instruments targeted at improving the likelihood of employment and enhancing
employability accounted for 70.33% of all such instruments while instruments targeting job
retention were in effect with respect to 29.67% of total jobseekers in the period 2014-2018. The
ALMP in the former category focused on the open labour market, while the ALMP in the latter
category supported protected labour markets (e.g., protected workplaces for handicapped
people). The ALMPs in the latter category were closely associated with social programmes for
disadvantaged people; thus, these were excluded from further analysis. The Slovak ALMP
instruments are labelled according to specific Sections of the 5/2004 Law on Employment
Services. We analysed six major ALMP instruments targeted at improving the likelihood of
employment and enhancing employability:
1) Section 50j, subsidised jobs with local governments;
2) Section 51, subsidised traineeships after graduation;
3) Section 52, public works;
4) Section 52a, public works based on voluntary opportunities;
5) Section 54, national projects, mostly on job subsidy;
6) Section 54 REPAS, retraining and courses.
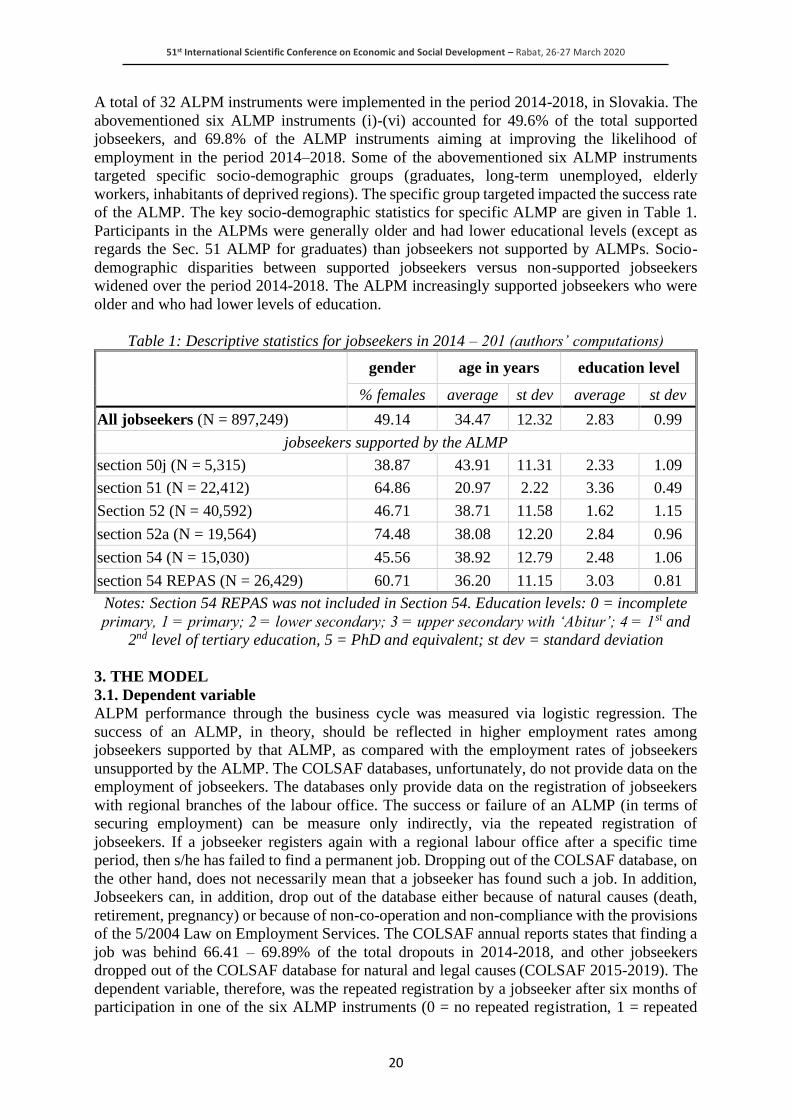
51st International Scientific Conference on Economic and Social Development – Rabat, 26-27 March 2020
20
A total of 32 ALPM instruments were implemented in the period 2014-2018, in Slovakia. The
abovementioned six ALMP instruments (i)-(vi) accounted for 49.6% of the total supported
jobseekers, and 69.8% of the ALMP instruments aiming at improving the likelihood of
employment in the period 2014–2018. Some of the abovementioned six ALMP instruments
targeted specific socio-demographic groups (graduates, long-term unemployed, elderly
workers, inhabitants of deprived regions). The specific group targeted impacted the success rate
of the ALMP. The key socio-demographic statistics for specific ALMP are given in Table 1.
Participants in the ALPMs were generally older and had lower educational levels (except as
regards the Sec. 51 ALMP for graduates) than jobseekers not supported by ALMPs. Socio-
demographic disparities between supported jobseekers versus non-supported jobseekers
widened over the period 2014-2018. The ALPM increasingly supported jobseekers who were
older and who had lower levels of education.
Table 1: Descriptive statistics for jobseekers in 2014 – 201 (authors’ computations)
gender age in years education level
% females average st dev average st dev
All jobseekers (N = 897,249) 49.14 34.47 12.32 2.83 0.99
jobseekers supported by the ALMP
section 50j (N = 5,315) 38.87 43.91 11.31 2.33 1.09
section 51 (N = 22,412) 64.86 20.97 2.22 3.36 0.49
Section 52 (N = 40,592) 46.71 38.71 11.58 1.62 1.15
section 52a (N = 19,564) 74.48 38.08 12.20 2.84 0.96
section 54 (N = 15,030) 45.56 38.92 12.79 2.48 1.06
section 54 REPAS (N = 26,429) 60.71 36.20 11.15 3.03 0.81
Notes: Section 54 REPAS was not included in Section 54. Education levels: 0 = incomplete
primary, 1 = primary; 2 = lower secondary; 3 = upper secondary with ‘Abitur’; 4 = 1st and
2nd level of tertiary education, 5 = PhD and equivalent; st dev = standard deviation
3. THE MODEL
3.1. Dependent variable
ALPM performance through the business cycle was measured via logistic regression. The
success of an ALMP, in theory, should be reflected in higher employment rates among
jobseekers supported by that ALMP, as compared with the employment rates of jobseekers
unsupported by the ALMP. The COLSAF databases, unfortunately, do not provide data on the
employment of jobseekers. The databases only provide data on the registration of jobseekers
with regional branches of the labour office. The success or failure of an ALMP (in terms of
securing employment) can be measure only indirectly, via the repeated registration of
jobseekers. If a jobseeker registers again with a regional labour office after a specific time
period, then s/he has failed to find a permanent job. Dropping out of the COLSAF database, on
the other hand, does not necessarily mean that a jobseeker has found such a job. In addition,
Jobseekers can, in addition, drop out of the database either because of natural causes (death,
retirement, pregnancy) or because of non-co-operation and non-compliance with the provisions
of the 5/2004 Law on Employment Services. The COLSAF annual reports states that finding a
job was behind 66.41 – 69.89% of the total dropouts in 2014-2018, and other jobseekers
dropped out of the COLSAF database for natural and legal causes (COLSAF 2015-2019). The
dependent variable, therefore, was the repeated registration by a jobseeker after six months of
participation in one of the six ALMP instruments (0 = no repeated registration, 1 = repeated
51st International Scientific Conference on Economic and Social Development – Rabat, 26-27 March 2020
21
registration). If a jobseeker ended his/her participation in an ALMP by June 2018, for example,
the model could follow the pattern of his/her registration with regional labour offices until
December 2018.
3.2. Independent variables
The choice of explanatory variables was both theory- and data-driven. Findings by major
studies on ALMP guided the theory-driven choice of explanatory variables. The choice of
explanatory variables also had to acknowledge some data limitations (the limitations of the
COLSAF database and the lack of availability of contextual data on regional labour markets).
The following data sources (A to F) were used:
a) The COLSAF database on individual jobseekers provided a vector of socio-demographic
variables (gender, age, education).
b) The COLSAF database on ALMP provided data on participation in specific ALMP
(sections 50j, 51, 52, 52a, 54, and 54 REPAS); the same database also provided data on the
number of days spent involved in ALMP instruments – by jobseekers. Some studies on
ALMP indicate that time spent involved in an ALMP may be a proxy for building human
capital (Card et 2017).
c) The DataCube database constructed by the Statistical Office of the Slovak Republic
provided a vector of regional variables (general population data, data on enterprise density,
data on wages, housing, urban population and marginalised population).
d) The COLSAF regional statistics provided data on unemployment rates, vacancies and
material deprivation.
e) The Ministry of Education, Science, Research and Sports provided data on early school
leavers and the effects of ninth-graders’ final exams on regional levels.
f) The Deputy Prime Minister Office for Investment and Informatisation provided data on the
regional allocation of the European Investment and Structural Funds (ESIF).
A vector of regional variables (from sources C to F) was computed for 79 Slovak districts (LAU
1 level). The vector included the following 16 variables:
1) population density per square km;
2) enterprises per 1000 population;
3) foreign enterprises per 1000 population;
4) proportion of urban population, %;
5) proportion of adult population with tertiary education, %;
6) average wage, EUR;
7) proportion of marginalised Roma population in total population %;
8) proportion of population in material deprivation, %;
9) proportion of early school leavers in total school leavers, %;
10) unemployment rates, %;
11) average success rate of primary schools in terms of ninth-graders’ final exams, %;
12) distance of district capital to Bratislava, km;
13) internal immigration rate, per 1000 population;
14) new flats completed, per 1000 population;
15) ESIF spending on demand-driven projects, per EUR inhabitant1;
16) job vacancies per one unemployed.
• Variables 1 - 6, as well as 14 - 15 indicate the overall developmental level of a specific
district. The higher the values for population density, urban population, population with
1 The ALMP spending was excluded from the ESIF spending

51st International Scientific Conference on Economic and Social Development – Rabat, 26-27 March 2020
22
tertiary education, average wage, enterprise density, new flats and immigration are, the
better the performance of regional labour market.
• Variables 7 to 12, as well as variable 16 indicate the level of human and social capital
inhering in a specific district, and the performance of the regional labour market
respectively. Variable 15 (ESIF spending on demand-drive projects per inhabitant) indicates
the developmental level of a specific district. The ESIF projects allocate higher support to
deprived regions.
3.3. Factor analysis
The logistic regression was performed despite certain conditions relating to multicollinearity
and the distribution of residuals by explanatory variables. Multicollinearity is an unwelcome
situation in which one predictor variable can be linearly predicted from the others with a
substantial degree of accuracy. The collinearity tests generated high correlation coefficients
between variables like unemployment rates, material deprivation levels and/or wage levels.
Such multicollinearity problems can be mitigated via factor analysis. A high number of
individual variables is reduced to a low number of factors. The results of the factor analysis are
reported in Table 2. The factor analysis established four factors. The four factors explained
76.3% of the total variance in the exploratory variables:
• Factor 1, ‘Development’ covers the overall developmental level of a district with regard to
population density, enterprise density, wage levels, and urbanisation and education levels.
• Factor 2, ‘Poverty’ includes variables representing unemployment; material deprivation
rates; the proportion of marginalised Roma populations in relation to the total population;
peripheral location; and the performance of the regional education system.
• Factor 3, ‘Mobility’ included variables representing internal immigration rates and the
construction of new housing.
• Factor 4, ‘ESIF support’ includes the levels of ESIF spending, and partially also the job
vacancies reported on the regional labour market2.
Table following on the next page
2 Variable 16 ‘job vacancies per one unemployed’ loads all on four factors.
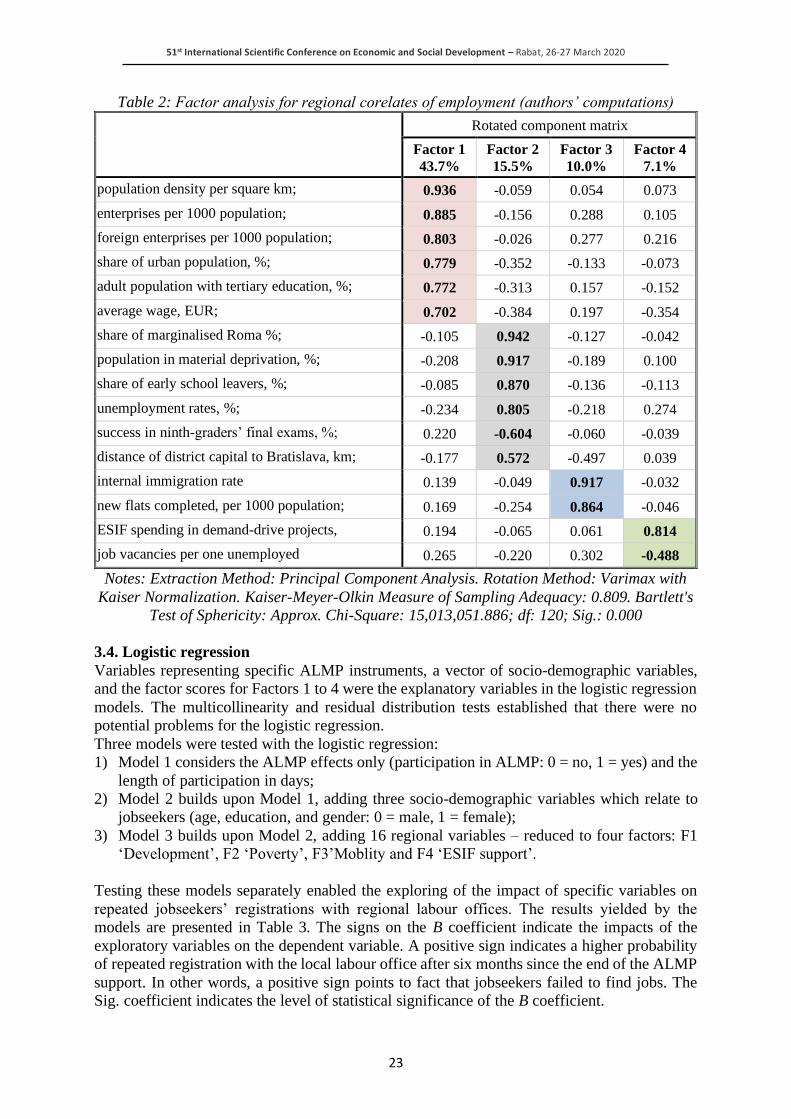
51st International Scientific Conference on Economic and Social Development – Rabat, 26-27 March 2020
23
Table 2: Factor analysis for regional corelates of employment (authors’ computations)
Rotated component matrix
Factor 1
43.7%
Factor 2
15.5%
Factor 3
10.0%
Factor 4
7.1%
population density per square km; 0.936 -0.059 0.054 0.073
enterprises per 1000 population; 0.885 -0.156 0.288 0.105
foreign enterprises per 1000 population; 0.803 -0.026 0.277 0.216
share of urban population, %; 0.779 -0.352 -0.133 -0.073
adult population with tertiary education, %; 0.772 -0.313 0.157 -0.152
average wage, EUR; 0.702 -0.384 0.197 -0.354
share of marginalised Roma %; -0.105 0.942 -0.127 -0.042
population in material deprivation, %; -0.208 0.917 -0.189 0.100
share of early school leavers, %; -0.085 0.870 -0.136 -0.113
unemployment rates, %; -0.234 0.805 -0.218 0.274
success in ninth-graders’ final exams, %; 0.220 -0.604 -0.060 -0.039
distance of district capital to Bratislava, km; -0.177 0.572 -0.497 0.039
internal immigration rate 0.139 -0.049 0.917 -0.032
new flats completed, per 1000 population; 0.169 -0.254 0.864 -0.046
ESIF spending in demand-drive projects, 0.194 -0.065 0.061 0.814
job vacancies per one unemployed 0.265 -0.220 0.302 -0.488
Notes: Extraction Method: Principal Component Analysis. Rotation Method: Varimax with
Kaiser Normalization. Kaiser-Meyer-Olkin Measure of Sampling Adequacy: 0.809. Bartlett's
Test of Sphericity: Approx. Chi-Square: 15,013,051.886; df: 120; Sig.: 0.000
3.4. Logistic regression
Variables representing specific ALMP instruments, a vector of socio-demographic variables,
and the factor scores for Factors 1 to 4 were the explanatory variables in the logistic regression
models. The multicollinearity and residual distribution tests established that there were no
potential problems for the logistic regression.
Three models were tested with the logistic regression:
1) Model 1 considers the ALMP effects only (participation in ALMP: 0 = no, 1 = yes) and the
length of participation in days;
2) Model 2 builds upon Model 1, adding three socio-demographic variables which relate to
jobseekers (age, education, and gender: 0 = male, 1 = female);
3) Model 3 builds upon Model 2, adding 16 regional variables – reduced to four factors: F1
‘Development’, F2 ‘Poverty’, F3’Moblity and F4 ‘ESIF support’.
Testing these models separately enabled the exploring of the impact of specific variables on
repeated jobseekers’ registrations with regional labour offices. The results yielded by the
models are presented in Table 3. The signs on the B coefficient indicate the impacts of the
exploratory variables on the dependent variable. A positive sign indicates a higher probability
of repeated registration with the local labour office after six months since the end of the ALMP
support. In other words, a positive sign points to fact that jobseekers failed to find jobs. The
Sig. coefficient indicates the level of statistical significance of the B coefficient.
51st International Scientific Conference on Economic and Social Development – Rabat, 26-27 March 2020
24
The majority of the B coefficients were significant at the 0.001 level. The Wald statistics test
whether and how much an explanatory variable in a model is significant - High Wald statistics
indicate robustness in the estimates.
3.5. Model 1
All ALPM variables had negative signs in Model 1, for 2014. Model 1 indicates that jobseekers
participating in ALMPs under sections, 50j, 51, 52, 52a, 54, and 54 REPAS had a lower
probability of repeated registration with the regional labour office after six months than
jobseekers with no ALMP support. The unemployment rates (12.3%) and unemployed numbers
(331,733) were quite high in 2014 (Figure 2). And also, in 2014, the ALMP instruments
supported jobseekers with both high and low levels of employability. All ALMP variables had
positive signs as regards Model 1 in the period 2015-2018. This means that jobseekers
participating in ALMP under sections, 50j, 51, 52, 52a, 54, and 54 REPAS had a higher
probability of repeated registration with the regional labour office after six months than
jobseekers with no ALMP. This change in the efficiency of ALMP resulted from a profound
transformation of the Slovak labour market in the period 2015-2018. The unemployment rate
dropped to 10.6 percent by December 2015 and to 5.0 percent by December 2018. The
unemployed numbers decreased from 286,825 to 138,198 in the same period. The labour
shortages were reflected in a dramatic increase in the number of job vacancies: from 9,169 in
2014 to 73,890 in 2018. The number of job vacancies rose rapidly despite a significant increase
in the stock of foreign workers in Slovakia over the same period. The Slovak employers
preferred jobseekers with a higher stock of human capital. Jobseekers with a higher stock of
human capital were more likely to maintain their employment and less likely to register with
their regional labour office. Jobseekers with lower levels of human capital, on the other hand,
tended to continue to register with the regional labour offices. These jobseekers were repeatedly
selected for one or more ALMPs, but nevertheless found it difficult to find a job because of
their low employability levels. Labour shortages and a cohort of jobseekers with low
employability levels explain why all the ALMP instruments had positive signs in the period
2015-20183. The variable related to the length of time a jobseeker is involved with an ALMP
has a positive sign: the higher the number of days a jobseeker is supported by an ALMP, the
higher the likelihood of repeated registration with the regional labour office. Jobseekers
supported by the section 52 ALMP instrument (public works) accounted for the highest average
number of days of support. This ALPM was designed for people with the lowest levels of
education and/or those living in underdeveloped regions. Many participants in the section 52
ALMP instrument were assigned to the same ALMP repeatedly for several years. This explains
why the length of stay in an ALMP is positively correlated with repeated registrations at the
regional labour office.
3.6. Model 2
Model 2 includes all the variables from Model 1, but uses in addition gender, age and the
educational level of jobseekers. The education variable had a negative sign across all years.
This means that the higher the educational level the lower the probability of repeated
registration with the regional labour office. The gender variable had a negative sign for the
years 2014 and 2015, but positive one in 2016, 2017 and 2018. Females had a higher probability
of repeated registration than males in the period 2016-2018. The age variable had a positive
sign for the period 2014-2016, but a negative sign in the years 2017 and 2018 (the younger the
jobseeker, the lower the probability of repeated registration). The overall interpretation is that
elderly workers and females remained the least employable jobseekers in a shrinking market.
3 The section 54 REPAS was not significant on 0.05 level for 2018.
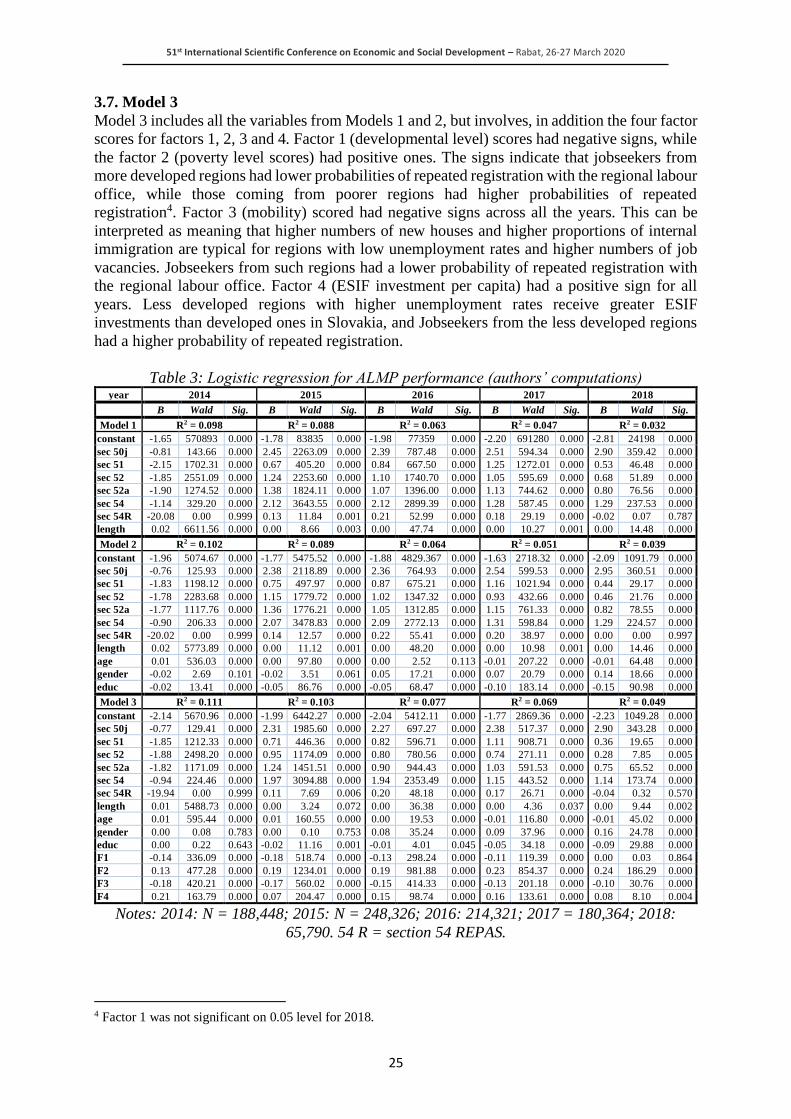
51st International Scientific Conference on Economic and Social Development – Rabat, 26-27 March 2020
25
3.7. Model 3
Model 3 includes all the variables from Models 1 and 2, but involves, in addition the four factor
scores for factors 1, 2, 3 and 4. Factor 1 (developmental level) scores had negative signs, while
the factor 2 (poverty level scores) had positive ones. The signs indicate that jobseekers from
more developed regions had lower probabilities of repeated registration with the regional labour
office, while those coming from poorer regions had higher probabilities of repeated
registration4. Factor 3 (mobility) scored had negative signs across all the years. This can be
interpreted as meaning that higher numbers of new houses and higher proportions of internal
immigration are typical for regions with low unemployment rates and higher numbers of job
vacancies. Jobseekers from such regions had a lower probability of repeated registration with
the regional labour office. Factor 4 (ESIF investment per capita) had a positive sign for all
years. Less developed regions with higher unemployment rates receive greater ESIF
investments than developed ones in Slovakia, and Jobseekers from the less developed regions
had a higher probability of repeated registration.
Table 3: Logistic regression for ALMP performance (authors’ computations) year 2014 2015 2016 2017 2018
B Wald Sig. B Wald Sig. B Wald Sig. B Wald Sig. B Wald Sig.
Model 1 R2 = 0.098 R2 = 0.088 R2 = 0.063 R2 = 0.047 R2 = 0.032
constant -1.65 570893 0.000 -1.78 83835 0.000 -1.98 77359 0.000 -2.20 691280 0.000 -2.81 24198 0.000
sec 50j -0.81 143.66 0.000 2.45 2263.09 0.000 2.39 787.48 0.000 2.51 594.34 0.000 2.90 359.42 0.000
sec 51 -2.15 1702.31 0.000 0.67 405.20 0.000 0.84 667.50 0.000 1.25 1272.01 0.000 0.53 46.48 0.000
sec 52 -1.85 2551.09 0.000 1.24 2253.60 0.000 1.10 1740.70 0.000 1.05 595.69 0.000 0.68 51.89 0.000
sec 52a -1.90 1274.52 0.000 1.38 1824.11 0.000 1.07 1396.00 0.000 1.13 744.62 0.000 0.80 76.56 0.000
sec 54 -1.14 329.20 0.000 2.12 3643.55 0.000 2.12 2899.39 0.000 1.28 587.45 0.000 1.29 237.53 0.000
sec 54R -20.08 0.00 0.999 0.13 11.84 0.001 0.21 52.99 0.000 0.18 29.19 0.000 -0.02 0.07 0.787
length 0.02 6611.56 0.000 0.00 8.66 0.003 0.00 47.74 0.000 0.00 10.27 0.001 0.00 14.48 0.000
Model 2 R2 = 0.102 R2 = 0.089 R2 = 0.064 R2 = 0.051 R2 = 0.039
constant -1.96 5074.67 0.000 -1.77 5475.52 0.000 -1.88 4829.367 0.000 -1.63 2718.32 0.000 -2.09 1091.79 0.000
sec 50j -0.76 125.93 0.000 2.38 2118.89 0.000 2.36 764.93 0.000 2.54 599.53 0.000 2.95 360.51 0.000
sec 51 -1.83 1198.12 0.000 0.75 497.97 0.000 0.87 675.21 0.000 1.16 1021.94 0.000 0.44 29.17 0.000
sec 52 -1.78 2283.68 0.000 1.15 1779.72 0.000 1.02 1347.32 0.000 0.93 432.66 0.000 0.46 21.76 0.000
sec 52a -1.77 1117.76 0.000 1.36 1776.21 0.000 1.05 1312.85 0.000 1.15 761.33 0.000 0.82 78.55 0.000
sec 54 -0.90 206.33 0.000 2.07 3478.83 0.000 2.09 2772.13 0.000 1.31 598.84 0.000 1.29 224.57 0.000
sec 54R -20.02 0.00 0.999 0.14 12.57 0.000 0.22 55.41 0.000 0.20 38.97 0.000 0.00 0.00 0.997
length 0.02 5773.89 0.000 0.00 11.12 0.001 0.00 48.20 0.000 0.00 10.98 0.001 0.00 14.46 0.000
age 0.01 536.03 0.000 0.00 97.80 0.000 0.00 2.52 0.113 -0.01 207.22 0.000 -0.01 64.48 0.000
gender -0.02 2.69 0.101 -0.02 3.51 0.061 0.05 17.21 0.000 0.07 20.79 0.000 0.14 18.66 0.000
educ -0.02 13.41 0.000 -0.05 86.76 0.000 -0.05 68.47 0.000 -0.10 183.14 0.000 -0.15 90.98 0.000
Model 3 R2 = 0.111 R2 = 0.103 R2 = 0.077 R2 = 0.069 R2 = 0.049
constant -2.14 5670.96 0.000 -1.99 6442.27 0.000 -2.04 5412.11 0.000 -1.77 2869.36 0.000 -2.23 1049.28 0.000
sec 50j -0.77 129.41 0.000 2.31 1985.60 0.000 2.27 697.27 0.000 2.38 517.37 0.000 2.90 343.28 0.000
sec 51 -1.85 1212.33 0.000 0.71 446.36 0.000 0.82 596.71 0.000 1.11 908.71 0.000 0.36 19.65 0.000
sec 52 -1.88 2498.20 0.000 0.95 1174.09 0.000 0.80 780.56 0.000 0.74 271.11 0.000 0.28 7.85 0.005
sec 52a -1.82 1171.09 0.000 1.24 1451.51 0.000 0.90 944.43 0.000 1.03 591.53 0.000 0.75 65.52 0.000
sec 54 -0.94 224.46 0.000 1.97 3094.88 0.000 1.94 2353.49 0.000 1.15 443.52 0.000 1.14 173.74 0.000
sec 54R -19.94 0.00 0.999 0.11 7.69 0.006 0.20 48.18 0.000 0.17 26.71 0.000 -0.04 0.32 0.570
length 0.01 5488.73 0.000 0.00 3.24 0.072 0.00 36.38 0.000 0.00 4.36 0.037 0.00 9.44 0.002
age 0.01 595.44 0.000 0.01 160.55 0.000 0.00 19.53 0.000 -0.01 116.80 0.000 -0.01 45.02 0.000
gender 0.00 0.08 0.783 0.00 0.10 0.753 0.08 35.24 0.000 0.09 37.96 0.000 0.16 24.78 0.000
educ 0.00 0.22 0.643 -0.02 11.16 0.001 -0.01 4.01 0.045 -0.05 34.18 0.000 -0.09 29.88 0.000
F1 -0.14 336.09 0.000 -0.18 518.74 0.000 -0.13 298.24 0.000 -0.11 119.39 0.000 0.00 0.03 0.864
F2 0.13 477.28 0.000 0.19 1234.01 0.000 0.19 981.88 0.000 0.23 854.37 0.000 0.24 186.29 0.000
F3 -0.18 420.21 0.000 -0.17 560.02 0.000 -0.15 414.33 0.000 -0.13 201.18 0.000 -0.10 30.76 0.000
F4 0.21 163.79 0.000 0.07 204.47 0.000 0.15 98.74 0.000 0.16 133.61 0.000 0.08 8.10 0.004
Notes: 2014: N = 188,448; 2015: N = 248,326; 2016: 214,321; 2017 = 180,364; 2018:
65,790. 54 R = section 54 REPAS.
4 Factor 1 was not significant on 0.05 level for 2018.

51st International Scientific Conference on Economic and Social Development – Rabat, 26-27 March 2020
26
4. CONCLUSIONS
This paper has analysed the performance of the active labour market policies operational in
2014-2018 in Slovakia. The sample consisted of 897,249 individual jobseekers, of which
209,480 (23.35%) benefited at least once from ALMP support. The ALMP instruments
analysed in this paper accounted for a substantial proportion of the total ALMPs targeting
improvements in the probability of employment and enhancements in employability in 2014-
2018 – in Slovakia. The six ALMP instruments (Sections 51, 52, 52a, 50j, 54, and 54 REPAS)
covered 125,170 jobseekers, some 59.75% of all ALMP-supported jobseekers. The role of these
ALMP instruments in relation to job generation, however, was limited. The proportion of
ALMP-supported jobseekers who remained unemployed indicates that most jobs were
generated by the market, outside of the direct ALMP interventions. The participation of
jobseekers in ALMP was limited by the amount of support available for market interventions,
but also by the low level of interest in ALMPs expressed by jobseekers. Most of the new jobs
which emerged in the studied periods were generated by the (booming) economy. Incentives
for participation in ALMP decreased over the period 2014-2018. Labour shortage was another
important factor effecting employability. Demographic transition made it much easier for job
seekers to find jobs in 2018 – as compared to 2014. The unemployment figures were quite high
in 2014. Access to jobs was difficult for all kinds of jobseekers, including those with a good
education and skills. A booming economy and demographic transition eased pressures on the
Slovak labour market. As indicated by the high numbers of vacancies, there was substantial
demand for job seekers with acceptable levels of human capital. By 2018, a typical unemployed
person had low skills and low levels of education. The jobseekers supported by ALMP
instruments actually found it more difficult to find employment than jobseekers outside of the
ALMP instruments, after 2015 in Slovakia. This finding is not an argument for the cancellation
of the ALMP instruments, but rather for the modification of their design and focus. The Slovak
structure of ALMP spending is rather different from that in developed OECD economies. The
current structure of the ALMP spending concentrates on short-term courses, training and re-
training (Sec. 54, Sec. 54 REPAS). The ALMPs which focus on the human capital account offer
the best performance (Card et al., 2010). This analysis indicated that education was an important
predictor of employability. Here, there were no ALMP instruments supporting education and
the long-term building of human capital. Slovakia also ranks among the EU member countries
with the lowest levels of participation in life-long learning (LLL). The participation rates in
LLL were 11.1% in the EU28, but 4.0% in Slovakia in 2018 (Eurostat, 2019). The Slovak
population is rapidly ageing. The old age dependency ratio is projected to rise at a greater pace
in Slovakia than in the developed EU countries over the next few decades (EC, 2018). The
current orientation of the ALMP instruments towards short-term courses and re-training does
not address the challenges of ageing and labour shortages. Future ALMP instruments will have
to concentrate on boosting employment rates across specific socio-demographic groups
(women, elderly workers), and on strengthening the social and employment inclusion of
marginalised communities.
ACKNOWLEDGEMENT: This research was supported by VEGA grant No. 2/0002/18 and
the APVV grant No. APVV-14-0324.
LITERATURE:
1. Andersen, T. M. and Svarer, M. (2012). Active labour market policies in a recession. IZA
Journal of Labor Policy, 2012, 1: 7.
2. Baláž, V. and Karasová, K. (2017). Geographical Patterns in the Intra-European Migration
before and after Eastern Enlargement: The Connectivity Approach. Ekonomický c̆asopis,
65(1): 3 - 30.
51st International Scientific Conference on Economic and Social Development – Rabat, 26-27 March 2020
27
3. Brown, A. J. and Koettl, J. (2015). Active labor market programs-employment gain or fiscal
drain?. IZA Journal of Labor Economics, 4(1): 12.
4. Blanchard, O. and Katz, L.F. (1997). What we Know and do not Know about the Natural
Rate of Unemployment. Journal of Economic Perspectives, 11 (1): 51 – 72.
5. Card, D., Kluve, J. and Weber, A. (2010). Active labour market policy evaluations: A meta‐
analysis. The economic journal, 120(548): F452 - F477.
6. Card, D., Kluve, J. and Weber, A. (2017). What works? A meta analysis of recent active
labor market program evaluations. Journal of the European Economic Association, 16(3):
894 - 931.
7. COLSAF (2015-2019). Vyhodnotenie uplatňovania aktívnych opatrení na trhu práce
v rokoch 2014-2018 {Evaluation of the ALMP implemented in 2014-2018}. Retrieved
8.11.2019 from https://www.upsvr.gov.sk/statistiky/aktivne-opatrenia-tp-statistiky.html?
page_id=1248.
8. Escudero. V. (2018). Are active labour market policies effective in activating and
integrating low-skilled individuals? An international comparison. IZA Journal of Labor
Policy, 7(4): 1 – 26.
9. European Commission (2018). The 2018 Ageing Report: Economic and Budgetary
Projections for the EU Member States (2016-2070). Institutional Paper 07, 9. May 2018.
Luxembourg: Publications Office of the European Union.
10. Eurostat (2019). Lifelong learning, Participation rate in education and training (last 4
weeks) by sex and age. Retrieved 8.11.2019 from https://ec.europa.eu/eurostat/
data/database.
11. Galgóczi, B. (2017): Why central and eastern Europe needs a pay rise. Working Paper
2017.01. Brussels: European Trade Union Institute.
12. International Monetary Fund (2019): Demographic Headwinds in Central and Eastern
Europe. IMF European Departmental Paper Series. No. 19. Washigton: International
Monetary Fund, Publication Services.
13. Martin, J. P. (2015). Activation and active labour market policies in OECD countries:
stylised facts and evidence on their effectiveness. IZA Journal of Labor Policy, 4(1): 4.
14. Nordlund, M. (2011): What works best when? The role of active labour market policy
programmes in different business cycles. International Journal of Social Welfare, 20(1): 43
– 54.
15. Stehrer. R. and Leitner S.M.(2019): Demographic Challenges for Labour Supply and
Growth. Research Report 439. The Vienna Institute for International Economic Studies.
16. Vooren, M., Healermans, C., Groot, W. and van den Brink, H. M. (2018). The Effectiveness
of Active Labor Market Policies: A Meta-Analysis. Journal of Economic Surveys. First
published. Retrieved 8.11.2019 from https://onlinelibrary.wiley.com/doi/abs/10.1111/
joes.12269.a
51st International Scientific Conference on Economic and Social Development – Rabat, 26-27 March 2020
28
USER PREFERENCES IN THE EXPERIENCE ECONOMY
Aija Freimane
Art Academy of Latvia, Latvia
ABSTRACT
User preferences in the experience and service economy are complicated due to oversaturated
market offerings ranging from material-based products to e-services and digital technology
solutions. Every business has its own objectives, but all their products and services must offer
promises that persuade users to buy and consume them. Products and services primarily fulfil
physiological and safety needs, but their value in everyday life may differ across generations.
Product and service promises affect people of all generations, while the business objectives of
companies and manufacturers generally are indifferent to the users who purchase and use their
products and services. Across generations, many users are unwilling to pay more for products
and services whose origins are known or whose resources have been responsibly sourced to
reduce environmental and social problems. The findings of this paper are based on in-depth
structured online interviews with 250 respondents and reveal the perceived design value
preferences for three options: a wood product, an e-service and a digital technology solution.
The survey asks which solution is used the most often in everyday life, is the most comfortable
to use, saves resources, has the longest-lasting use, most effectively fulfils user needs and
creates the most positive experience, satisfaction and sense of well-being. This study analyses
what users value and prefer among these three design solutions, what their perceived design
value preferences indicate and what they predict or imply about the development of the
experience and service economy. The study results show that among all generations, wood
products are the most often valued and preferred; they are the most comfortable to use and
create the most positive experience, satisfaction and sense of well-being. Wood products
provide longest-lasting use, and their usage saves the most resources. Digital technology
solutions, on the other hand, most effectively fulfil the users’ daily needs. E-services were not
preferred in any category in comparison to wood products and digital technology solutions.
The study indicates the differences and similarities in user-perceived design value preferences
among generations and has implications for the design of new and improved products and
services.
Keywords: design value, experience economy, user preferences
1. INTRODUCTION
Experience drives the perceived values of users and consumers, its force of attraction far
exceeding that of the entertainment or culture industry. Our experience is constructed by our
perceptions (Coxon, 2015, p. 12) and is formed by our memory and how we selectively
remember an interaction. Also, experiences are tied to the passage of time and are interpreted
based on our life moments, and thus memory helps customers to get more value from products
and services not just by improving usability but by unlocking options and potential (Newbery
& Farnham, 2013). Experience emerges from trying or testing something out, which is our
physical interaction with a product and service and forms frequent users and promotes the good
of society and growth of the business, which starts with an attitude (Cramer & Simpson, 2004).
Individual experience is processed through social, cultural and historical filters. Experience is
closely tied to the impact of technology and is more strongly felt than ever and at scales never
seen before. Not only products, but even more strongly, e-services and digital technology
solutions create experiences that differ from physical services and can be experienced both
passively and actively.
51st International Scientific Conference on Economic and Social Development – Rabat, 26-27 March 2020
29
An experience occurs when a company intentionally uses services as the stage to engage
individual customers in a way that creates a memorable event and experience (Pine II &
Gilmore, 1998). An economy based on experiences is one ‘in which many goods or services
are sold by emphasizing the effect they can have on people’s lives’ (Cambridge Business
English Dictionary, n.d.). In general it is the same form of economy as the one based on
commodities, an industrial economy, based on goods, and a service economy (Pine, 2019). An
experience economy is the evolutionary outcome of a service economy (Fuchs, 2011) and an
expansion of the product-service system. Although an experience is intangible, memorable and
linked with time, at the touchpoints it is purely tangible and material. Touchpoints or interaction
points with products or services are events that create memorabilia – things that are remarkable
and worthy of remembrance. Thus, according to the author, design is a method that defines a
true need and as a result creates happiness and satisfaction. This paper discusses user
preferences in the experience and service economies, which are complicated due to
oversaturated market offerings ranging from material-based products to e-services and digital
technology solutions. Every business has its own objectives, and all products and services must
offer promises that persuade users to buy the products and affect them in ways that will
encourage continued consumption.
1.1. Methodology
The findings of this paper are based on in-depth structured online interviews with 250
respondents and reveal the perceived design value preferences as an outcome of experience for
the use of three options: a wood product, an e-service and a digital technology solution. The
survey aims to measure the perception of business objectives and attitudes towards sustainable
consumption and production (SCP) aspects in a product and service life cycle. The study
analyses what users value and indicates what the implications are for the experience and service
economy. Respondents were asked to participate in interviews voluntarily and anonymously.
They were asked to categorise themselves according to demographic cohorts of the following
generations: Silent Generation (<1945), Baby Boomers (1946–1964), Generation X (1965–
1980), Millennials or Generation Y (1981–2000) and Generation Z (Gen Z) (2001<), taking
into account locally and country-specific experienced economic, political and social events,
values, attitudes and behaviour characteristic of the nation. In the interviews, participants were
asked their preferences for three options: a wood product, an e-service and a digital technology
solution. The survey sought to identify which is used most often in everyday life, the most
comfortable to use, saves the most time and resources, has the longest-lasting use, most
effectively fulfils user needs and creates the most positive experience, satisfaction and sense of
well-being. Each respondent chose the particular wood product, e-service and digital
technology solution they preferred individually. Respondents were asked to define and rank
their goodwill towards SCP aspects in product–service preferences on a scale from 1 to 5, with
5 being the highest. This study is part of the analysis of a complex design identification system
and is subject to the limitation of having selected its respondents on a country-specific basis.
The influence and impact of cultural aspects will be researched in future studies to determine
the cross-cultural value impact on a defined design identification system.
2. FINDINGS
Products and services primarily fulfil physiological and safety needs, but their value in everyday
life may differ across generations. The principal aim of a business is profit, and the medium to
reach that aim consists of products and services that fulfil users’ expectations by promising
memorable experiences. This results in a paradox, as too many products are designed, produced,
and, thus, consumed, following a scheme of planned obsolescence, with negative effects on the
51st International Scientific Conference on Economic and Social Development – Rabat, 26-27 March 2020
30
environment and communities over the long term. The findings section describes the results of
the study based on the analysis of user preferences and indicates dilemmas for later discussion.
2.1. Perception of business value
Products and services are mediums of a company’s purpose. The mission statement expresses
why the company exists, its values and what it provides for the customers or market. It combines
physical, emotional and logical elements into one exceptional experience, creating a loyal
customer. As such, customers or product/service users should be interested in the business’s
desires and intentions. Every product or service has a purpose for the particular target audience,
and the objective or mission statement communicates that purpose. Respondents of this study
say that objectives of the companies and manufacturers are not important to them (Table 1).
Individual user needs are more important when purchasing and using a product or service, agree
all generations. Half of Baby Boomers and Generation X say that they know the objectives of
the company and manufacturer before they make a purchase. This indicates that consumers are
indifferent to the objectives that drive business; therefore, businesses should aim to fulfil real
user needs.
Table 1: Consideration of the business objectives of the company and/or manufacturer when
purchasing and using a product or service by generations
Yes, I know the objectives
before I make a
purchase
1946–1964 The Baby
Boomers
1965–1980 Generation X
No, I’m not interested in the
company’s
objectives
2001< Generation Z
The objectives
of the company
are not
important to me; my needs are
more important
< 1945 The
Silent
Generation
1946–1964
The Baby
Boomers
1965–1980
Generation X
1981–2000
Millennials or
Generation Y
Source: Postdoctoral research ‘Identification system of design’s socio-economic impact’, Aija
Freimane, 2019
If the respondents say that the objectives of the companies and manufacturers are not important
to them, when they choose to buy and use a product or service, they consider the promise or
mission statement of the company very much.
Table 2: Consideration of the stated promise or mission of the company before buying or
using the product or service by generations
1 2 3 4 5
< 1945 The Silent Generation
1946–1964 The Baby Boomers
1965–1980 Generation X
1981–2000 Millennials or Generation Y
2001< Generation Z
Source: Postdoctoral research ‘Identification system of design’s socio-economic impact’, Aija
Freimane, 2019

51st International Scientific Conference on Economic and Social Development – Rabat, 26-27 March 2020
31
Dilemma: Communicating user needs in business as a mission statement as the company’s
value could target the client or user more effectively.
2.2. Preference of sustainable solutions as an experience value
The importance of values in the sustainable development paradigm is stressed by the sustainable
consumption and production (SCP) discourse (Oslo Roundtable on SCP, 1994). SCP considers
consumption of resources from the viewpoint of the end product and the final consumption by
assessing the product’s lifecycle (Freimane, 2015). Hence, sustainable and long-lasting
solutions should be the core topic and every company should address the solving of ecological,
environmental and social problems through their products and services in line with addressing
the true needs of people. Thus it was useful to know whether people as users are willing to pay
more for products and services whose origins are known or whose resources have been
responsibly sourced to reduce environmental and social problems. There are no common
features across all generations, but Millennials and Generation X members say that they are
willing to pay more to be environmentally and socially responsible, whereas Gen Z members
say they are not. That indicates a paradox between acting on and expressing good will, as Gen
Z members in particular are known for ‘Fridays for Future’ activism. Gen Z are the ones who
grew up with the information of ecological problems, thus the willingness to rethink their
behaviour, to act, rather just protest or make statements, should be visible.
Table 3: Breakdown by generational willingness to pay more for a product and/or service in
which the origin is known and the resources have been responsibly sourced to reduce
environmental and social problems 1 2 3 4 5
< 1945 The Silent Generation
1946–1964 The Baby Boomers
1965–1980 Generation X
1981–2000 Millennials or
Generation Y
2001< Generation Z
Source: Postdoctoral research ‘Identification system of design’s socio-economic impact’, Aija
Freimane, 2019
Information about ecological and environmental problems is overwhelming our lives and media
all over the globe. We, as users and human beings, should be aware of the full product life cycle
and consider SCP in every decision we make. According to the study, none of the generations
consider the amount of resources used in the product or service development, manufacturing
and implementation process. This shows that users care about the fulfilment of their own needs
but not how the solution is performed.
Table 4: Consideration of resources used in the product or service development,
manufacturing and implementation process by generations
1 2 3 4 5
1946–1964 The Baby Boomers
< 1945 The Silent
Generation
1965–1980 Generation X
1981–2000 Millennials or
Generation Y
2001< Generation Z
Source: Postdoctoral research ‘Identification system of design’s socio-economic impact’, Aija
Freimane, 2019
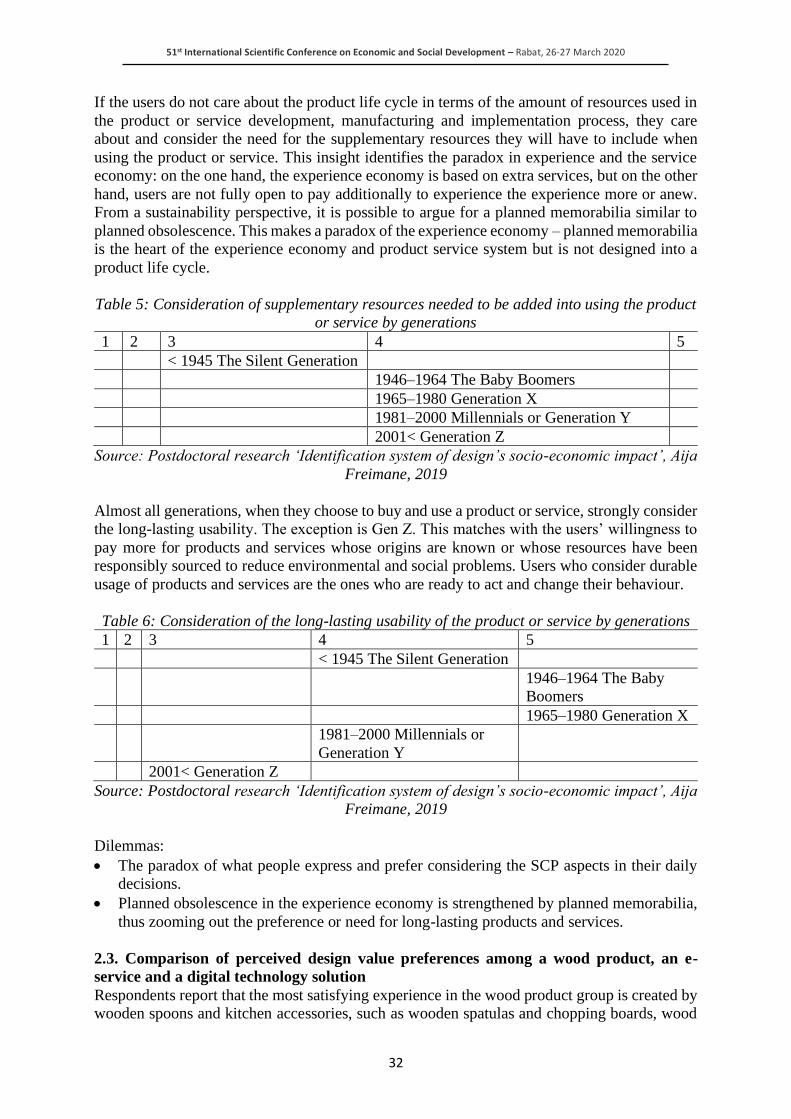
51st International Scientific Conference on Economic and Social Development – Rabat, 26-27 March 2020
32
If the users do not care about the product life cycle in terms of the amount of resources used in
the product or service development, manufacturing and implementation process, they care
about and consider the need for the supplementary resources they will have to include when
using the product or service. This insight identifies the paradox in experience and the service
economy: on the one hand, the experience economy is based on extra services, but on the other
hand, users are not fully open to pay additionally to experience the experience more or anew.
From a sustainability perspective, it is possible to argue for a planned memorabilia similar to
planned obsolescence. This makes a paradox of the experience economy – planned memorabilia
is the heart of the experience economy and product service system but is not designed into a
product life cycle.
Table 5: Consideration of supplementary resources needed to be added into using the product
or service by generations
1 2 3 4 5
< 1945 The Silent Generation
1946–1964 The Baby Boomers
1965–1980 Generation X
1981–2000 Millennials or Generation Y
2001< Generation Z
Source: Postdoctoral research ‘Identification system of design’s socio-economic impact’, Aija
Freimane, 2019
Almost all generations, when they choose to buy and use a product or service, strongly consider
the long-lasting usability. The exception is Gen Z. This matches with the users’ willingness to
pay more for products and services whose origins are known or whose resources have been
responsibly sourced to reduce environmental and social problems. Users who consider durable
usage of products and services are the ones who are ready to act and change their behaviour.
Table 6: Consideration of the long-lasting usability of the product or service by generations
1 2 3 4 5
< 1945 The Silent Generation
1946–1964 The Baby
Boomers
1965–1980 Generation X
1981–2000 Millennials or
Generation Y
2001< Generation Z
Source: Postdoctoral research ‘Identification system of design’s socio-economic impact’, Aija
Freimane, 2019
Dilemmas:
• The paradox of what people express and prefer considering the SCP aspects in their daily
decisions.
• Planned obsolescence in the experience economy is strengthened by planned memorabilia,
thus zooming out the preference or need for long-lasting products and services.
2.3. Comparison of perceived design value preferences among a wood product, an e-
service and a digital technology solution
Respondents report that the most satisfying experience in the wood product group is created by
wooden spoons and kitchen accessories, such as wooden spatulas and chopping boards, wood

51st International Scientific Conference on Economic and Social Development – Rabat, 26-27 March 2020
33
furniture, such as wood tables, beds, and closets, and wood products that provide satisfactory
experiences, such as kendama (a coordination skill toy), longboards and skim boards. The
choice of the wood product group as sustainable was especially valued by Gen Z. When asked
to choose the most satisfying experience provided by digital technology solutions, the
respondents named smart phones and Smart-ID in particular, but Gen Z particularly values
Spotify. However, the most common answers for a digital technology solution among the Silent
generation and the Baby Boomers were ‘I don’t know what a digital technology solution is’ or
‘I don’t use it.’ According to an Eventbrite study, ‘more than 3 in 4 millennials (78%) would
choose to spend money on a desirable experience or event over buying something desirable,
and 55% of millennials say they’re spending more on events and live experiences than ever
before’ (Pol, 2014). However, wood products are identified as creating the most positive
experience, satisfaction and sense of well-being over three options. The paradox is that the
Silent Generation in particular name digital technology solutions, but Millennials choose wood
products as those that have created the most positive experience.
Table 7: Preferred solution by generations that create the most positive experience,
satisfaction and sense of well-being in your everyday life
< 1945 The Silent
Generation
1946–1964 The
Baby Boomers
1965–1980
Generation X
1981–2000
Millennials or
Generation Y
2001<
Generation Z
Digital-
technology
solution
Wood product Wood product,
digital-
technology
solution
Wood product
Source: Postdoctoral research ‘Identification system of design’s socio-economic impact’, Aija
Freimane, 2019
Both digital technology solutions and wood products most effectively fulfil the everyday needs
of all generations. Fulfilment of needs is a step towards the most positive experience,
satisfaction and sense of well-being. Respondents agree that everyday needs are most
effectively fulfilled by digital technology solutions, but the most positive experience,
satisfaction and sense of well-being are created by wood products.
Table 8: Preferred solution by generations that most effectively fulfils needs < 1945 The Silent
Generation
1946–1964 The
Baby Boomers
1965–1980
Generation X
1981–2000
Millennials or
Generation Y
2001< Generation Z
Digital-technology
solution
Wood product
Digital-technology solution
Wood product, digital-
technology solution
Source: Postdoctoral research ‘Identification system of design’s socio-economic impact’, Aija
Freimane, 2019
The most positive experience, satisfaction and sense of well-being is linked with the everyday
use of products and services. All generations clearly stated that wood products are the most
comfortable to use; however, digital technology solutions provide the greatest everyday
comfort for Generation Z. Therefore, products for Gen Z need to be comfortable, long-lasting,
easy to use, visually beautiful, aesthetic, enjoyable, practical and good quality, but the services
need to present positive attitudes, be friendly, intuitive, comfortable, pleasurable and effective
(Freimane, 2019). Thus a digital technology solution, particularly Spotify, provides comfort to
Gen Z, in comparison with e-services or wood products in particular.

51st International Scientific Conference on Economic and Social Development – Rabat, 26-27 March 2020
34
Table 9: Preferred solution by generations that are the most comfortable to use in everyday
life
< 1945 The
Silent
Generation
1946–1964 The
Baby Boomers
1965–1980
Generation X
1981–2000
Millennials or
Generation Y
2001< Generation Z
Wood product
Digital-technology
solution
Source: Postdoctoral research ‘Identification system of design’s socio-economic impact’, Aija
Freimane, 2019
Perception of the most positive experience, satisfaction and sense of well-being is composed of
the abovementioned fulfilment of the needs and comfortable use of products or services, which
leads to the willingness to use them again and again. The respondents indicated that digital
technology solutions are most often used in everyday life by all generations, except the Silent
Generation. This shows that digital technology solutions have come into people’s lives more
than any other product.
Table 10: The preferred most often used solution in everyday life by the generations
< 1945 The
Silent
Generation
1946–1964 The Baby
Boomers
1965–1980
Generation
X
1981–2000
Millennials or
Generation Y
2001<
Generation Z
Wood product Wood product, e-service
or digital-technology
solution
Digital-technology solution
Source: Postdoctoral research ‘Identification system of design’s socio-economic impact’, Aija
Freimane, 2019
The perception of sustainable products and services depends not only on the consideration of
the resources used in the development, manufacturing and product or service implementation
process, but also efficiency in its usage. While most respondents believe that the usage of the
particular wood product is the most efficient and saves the most resources in the full product
life cycle, the Silent Generation and Millennials believe that it is provided by digital technology
solutions.
Table 11: Preferred solution by generations that is the most efficient and saves the most
resources
< 1945 The
Silent
Generation
1946–1964
The Baby
Boomers
1965–1980
Generation X
1981–2000
Millennials or
Generation Y
2001<
Generation Z
Digital-
technology
solution
Wood product
Wood product, e-
service or digital
technology solution
Wood product
Source: Postdoctoral research ‘Identification system of design’s socio-economic impact’, Aija
Freimane, 2019
An interesting outcome is the preference of all generations for one out of three options they are
most likely to use over the long term. Surprisingly, the Silent Generation prefers a digital
technology solution, whereas all the other generations choose the wood products. This is linked
to the SCP practice that wood products do not need supplementary resources while being used
or renewed as a subscription.
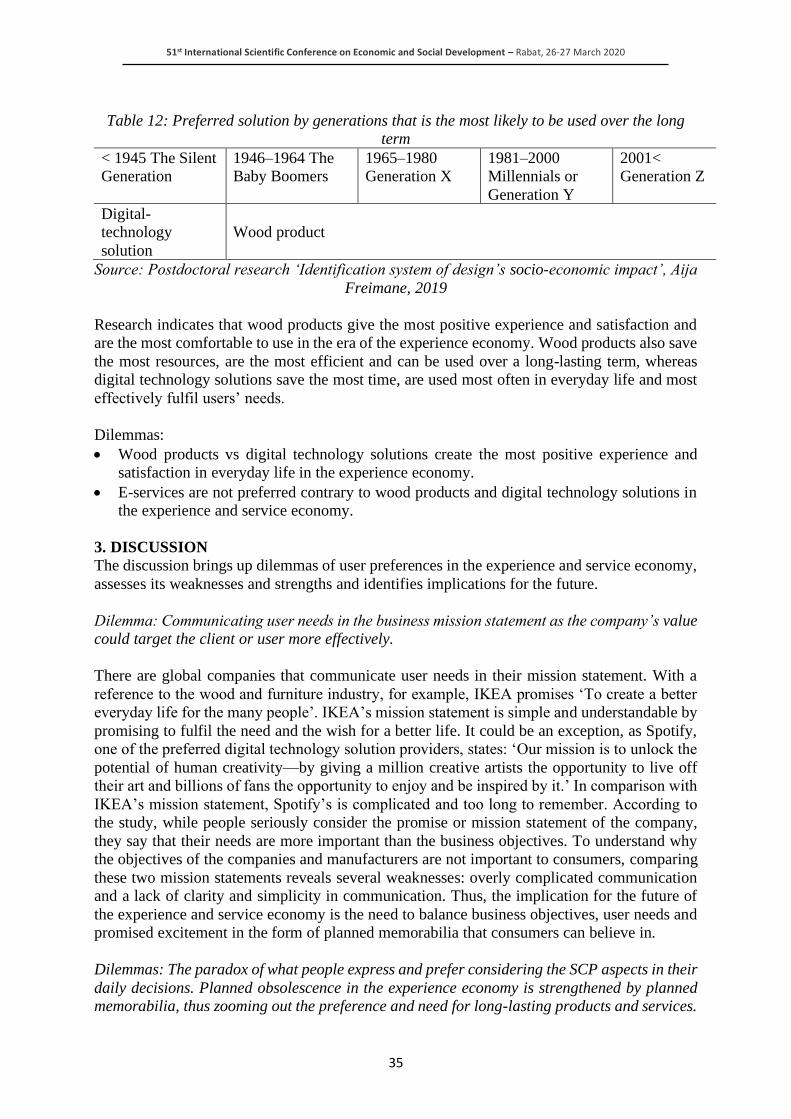
51st International Scientific Conference on Economic and Social Development – Rabat, 26-27 March 2020
35
Table 12: Preferred solution by generations that is the most likely to be used over the long
term
< 1945 The Silent
Generation
1946–1964 The
Baby Boomers
1965–1980
Generation X
1981–2000
Millennials or
Generation Y
2001<
Generation Z
Digital-
technology
solution
Wood product
Source: Postdoctoral research ‘Identification system of design’s socio-economic impact’, Aija
Freimane, 2019
Research indicates that wood products give the most positive experience and satisfaction and
are the most comfortable to use in the era of the experience economy. Wood products also save
the most resources, are the most efficient and can be used over a long-lasting term, whereas
digital technology solutions save the most time, are used most often in everyday life and most
effectively fulfil users’ needs.
Dilemmas:
• Wood products vs digital technology solutions create the most positive experience and
satisfaction in everyday life in the experience economy.
• E-services are not preferred contrary to wood products and digital technology solutions in
the experience and service economy.
3. DISCUSSION
The discussion brings up dilemmas of user preferences in the experience and service economy,
assesses its weaknesses and strengths and identifies implications for the future.
Dilemma: Communicating user needs in the business mission statement as the company’s value
could target the client or user more effectively.
There are global companies that communicate user needs in their mission statement. With a
reference to the wood and furniture industry, for example, IKEA promises ‘To create a better
everyday life for the many people’. IKEA’s mission statement is simple and understandable by
promising to fulfil the need and the wish for a better life. It could be an exception, as Spotify,
one of the preferred digital technology solution providers, states: ‘Our mission is to unlock the
potential of human creativity—by giving a million creative artists the opportunity to live off
their art and billions of fans the opportunity to enjoy and be inspired by it.’ In comparison with
IKEA’s mission statement, Spotify’s is complicated and too long to remember. According to
the study, while people seriously consider the promise or mission statement of the company,
they say that their needs are more important than the business objectives. To understand why
the objectives of the companies and manufacturers are not important to consumers, comparing
these two mission statements reveals several weaknesses: overly complicated communication
and a lack of clarity and simplicity in communication. Thus, the implication for the future of
the experience and service economy is the need to balance business objectives, user needs and
promised excitement in the form of planned memorabilia that consumers can believe in.
Dilemmas: The paradox of what people express and prefer considering the SCP aspects in their
daily decisions. Planned obsolescence in the experience economy is strengthened by planned
memorabilia, thus zooming out the preference and need for long-lasting products and services.
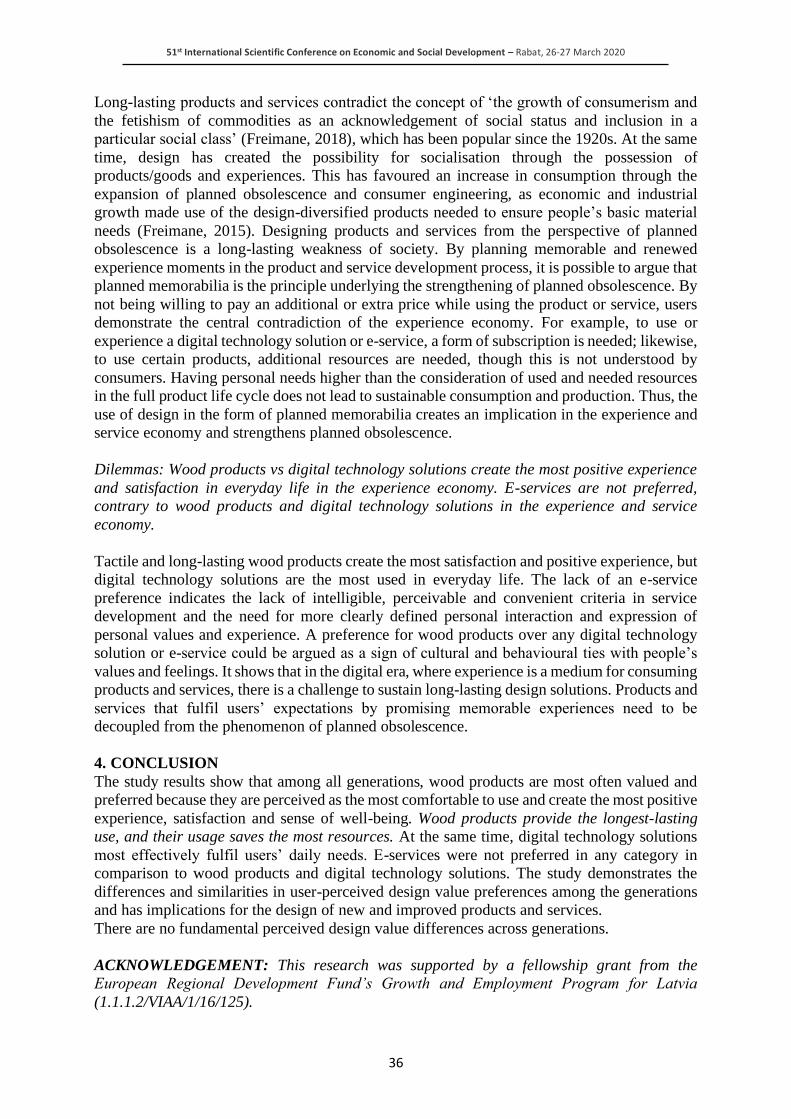
51st International Scientific Conference on Economic and Social Development – Rabat, 26-27 March 2020
36
Long-lasting products and services contradict the concept of ‘the growth of consumerism and
the fetishism of commodities as an acknowledgement of social status and inclusion in a
particular social class’ (Freimane, 2018), which has been popular since the 1920s. At the same
time, design has created the possibility for socialisation through the possession of
products/goods and experiences. This has favoured an increase in consumption through the
expansion of planned obsolescence and consumer engineering, as economic and industrial
growth made use of the design-diversified products needed to ensure people’s basic material
needs (Freimane, 2015). Designing products and services from the perspective of planned
obsolescence is a long-lasting weakness of society. By planning memorable and renewed
experience moments in the product and service development process, it is possible to argue that
planned memorabilia is the principle underlying the strengthening of planned obsolescence. By
not being willing to pay an additional or extra price while using the product or service, users
demonstrate the central contradiction of the experience economy. For example, to use or
experience a digital technology solution or e-service, a form of subscription is needed; likewise,
to use certain products, additional resources are needed, though this is not understood by
consumers. Having personal needs higher than the consideration of used and needed resources
in the full product life cycle does not lead to sustainable consumption and production. Thus, the
use of design in the form of planned memorabilia creates an implication in the experience and
service economy and strengthens planned obsolescence.
Dilemmas: Wood products vs digital technology solutions create the most positive experience
and satisfaction in everyday life in the experience economy. E-services are not preferred,
contrary to wood products and digital technology solutions in the experience and service
economy.
Tactile and long-lasting wood products create the most satisfaction and positive experience, but
digital technology solutions are the most used in everyday life. The lack of an e-service
preference indicates the lack of intelligible, perceivable and convenient criteria in service
development and the need for more clearly defined personal interaction and expression of
personal values and experience. A preference for wood products over any digital technology
solution or e-service could be argued as a sign of cultural and behavioural ties with people’s
values and feelings. It shows that in the digital era, where experience is a medium for consuming
products and services, there is a challenge to sustain long-lasting design solutions. Products and
services that fulfil users’ expectations by promising memorable experiences need to be
decoupled from the phenomenon of planned obsolescence.
4. CONCLUSION
The study results show that among all generations, wood products are most often valued and
preferred because they are perceived as the most comfortable to use and create the most positive
experience, satisfaction and sense of well-being. Wood products provide the longest-lasting
use, and their usage saves the most resources. At the same time, digital technology solutions
most effectively fulfil users’ daily needs. E-services were not preferred in any category in
comparison to wood products and digital technology solutions. The study demonstrates the
differences and similarities in user-perceived design value preferences among the generations
and has implications for the design of new and improved products and services.
There are no fundamental perceived design value differences across generations.
ACKNOWLEDGEMENT: This research was supported by a fellowship grant from the
European Regional Development Fund’s Growth and Employment Program for Latvia
(1.1.1.2/VIAA/1/16/125).
51st International Scientific Conference on Economic and Social Development – Rabat, 26-27 March 2020
37
LITERATURE:
1. Cambridge Business English Dictionary (n.d.).
https://dictionary.cambridge.org/dictionary/english/experience-economy. Retrieved from
https://dictionary.cambridge.org:
https://dictionary.cambridge.org/dictionary/english/experience-economy
2. Coxon, I. (2015). Fundamental Aspects of Human Experience: A Phenomeno(logical)
Explanation. In P. Benz, Experience Design. Concepts and Case studies. (pp. 11–21).
London: Bloomsbury.
3. Cramer, J. P., & Simpson, S. (2004). How Firms Succeed: A Field Guide to Design
Management. Atlanta: Ostberg.
4. Freimane, A. (2015). Design for Sustainable Social Well-being: Paradigm Shift of Design.
Summary of Doctoral Thesis. Riga: Art Academy of Latvia, Aija Freimane.
5. Freimane, A. (2018). Design footprints for mining the future. EDUKACIJA MENE,
MENUI, PER MENA (EDUCATION IN, FOR AND THROUGH ART), 105–116.
6. Freimane, A. (2019). Perceived Design Value through the Lens of Generation Z. The Design
After, CUMULUS Conference Proceedings, Bogota, Colombia (pp. 302–311). Bogota:
Universidad de los Andes, School of Architecture and Design, Bogota, Colombia.
7. Fuchs, V. R. (2011). Who Shall Live? Health, Economics and Social Choice. Singapore:
World Scientific.
8. Newbery, P., & Farnham, K. (2013). Experience Design: A Framework for Integrating
Brand, Experience, and Value. New Jersey: Willey.
9. Oslo Roundtable on SCP. (1994). http://www.iisd.ca/consume/oslo000.html. Ielādēts 2012.
gada 09. 04 no http://www.iisd.ca: http://www.iisd.ca/consume/oslo000.html
10. Pine II, J. B., & Gilmore, J. H. (1998). Welcome to the Experience Economy. Harvard
Business Review, July–August.
11. Pine, J. (2019, December 5). https://blooloop.com/features/joe-pine-experience-economy/.
Retrieved from https://blooloop.com: https://blooloop.com
12. Pol, H. (2014, July 1). https://eventbrite-s3.s3.amazonaws.com/marketing/Millennials_
Research/Gen_PR_Final.pdf. Retrieved from
https://eventbrite-s3.s3.amazonaws.com/: https://eventbrite-s3.s3.amazonaws.com

51st International Scientific Conference on Economic and Social Development – Rabat, 26-27 March 2020
38
AUDIT OF ASSETS OF LOCAL AND REGIONAL SELF-
GOVERNMENTS
Dubravka Mahacek
State Audit Office, Požega Regional Office
Associate Professor at Faculty of Medicine in Osijek, Croatia
Aleksandar Vcev
Professor at Faculty of Dental Medicine and Health in Osijek, Croatia
Kristina Peic
Polytechnic of Požega, Croatia
ABSTRACT
The aim of this paper is to investigate the assets of local and regional self-government units.
The conducted research is based on two counties (Vukovar-Srijem and Međimurje) for 2013,
2015 and 2016. The assumption is that the assets of counties vary significantly in their structure
and value. This is investigated from the asset information contained in financial audit reports
and from the data obtained from performance audit related to the field of assets. Scientific
literature from the said field was also used. Horizontal and vertical analysis of assets was
carried out and the structure of total assets (financial and non-financial) is analysed. Audit
reports have been drafted by the State Audit Office as the highest audit institution in the
Republic of Croatia and are considered reliable as a source of information. The audit seeks to
determine whether the entity's financial position is presented in a fair and objective manner.
Objectivity criteria are consistent and concrete application of generally accepted accounting
principles and standards. The task of the state audit is to provide information to citizens on
business activities, and to inform the public about the management of public funds. The State
Audit Report is submitted to the Croatian Parliament and to the public through the website of
the State Audit Office. The paper confirms the assumption that counties differ significantly in
the value of their assets and the structure of their available assets. Recommendations given by
the audit were researched. The assumption that the audit resulted in numerous
recommendations was confirmed. The assumption that recommendations were effective and
that they resulted in better asset managements was also confirmed. This can be stated since
recommendation evaluation was performed after a certain time has passed.
Keywords: Audit, Report, Assets, Recommendations, Counties
1. INTRODUCTION
The paper focuses on the assets of local units, which differ significantly by counties, as well as
by cities and municipalities. Asset irregularities occur, and therefore audit orders and
recommendations related to the area are presented. Performed audit results in an audit report.
Pursuant to the annual work program, the entities that will be audited, whose financial
statements will be reviewed and the time required to perform the audit is determined. The
Auditor General decides when the audit will begin and the decision consists of the name of the
local unit and the audit team members. At the same time, an internal audit decision is made,
specifying the time required to perform the audit. An audit plan is then drafted, which contains
the planned time for the audit to be conducted by individual audit areas and by members of the
audit team.

51st International Scientific Conference on Economic and Social Development – Rabat, 26-27 March 2020
39
The audit is announced to the local unit in advance and the required documentation is prepared.
The subject of auditing local and regional self-government units is adoption and execution of
the budget, i.e. the aim is to determine the regularity and compliance with legal regulations.
Audit methods and procedures are applied and evidence needed to produce the report are
collected. The report consists of several parts. The audited entity is obliged to follow the orders
and recommendations given for the previous period. It is determined in which cases the orders
and recommendations were acted upon and in which cases the orders and recommendations
were not acted upon. The audit orders and recommendations for the period for which the audit
was performed are an integral part of the audit report. The financial audit report provides an
opinion that may be unconditional, conditional, reserved, and negative.
2. AUDIT OF LOCAL UNIT ASSETS
An audit of assets should establish the value of assets compared to the previous year and identify
the reasons for significant discrepancies. The realization is determined in accordance with the
legal provisions, statutes, regulations and decisions of the local unit. The compliance of internal
acts and decisions in accordance with legal provisions is determined. Within the asset audit
frame, the structure of the assets is determined, i.e. what constitutes financial and what
constitutes non-financial assets.
2.1. Audit procedures, asset revenue realization and findings and recommendations
Assets auditing applies the same audit procedures as in other areas (revenues and receipts,
expenses and expenditures, public procurement). An external auditor uses the work of others in
his/her work, i.e. he/she may use the work of an internal auditor if an audit has been carried out
in that area. "An internal auditor must rank potential areas of audit examination according to
their risk criteria in order to determine priorities and focus the examination on highest risk areas
and activities in business conduct of an enterprise" (Tušek, Žager, 2006, p.328). In most local
units, this area was not subject to internal audit, and there was no possibility to use the work of
others when performing external audit. The findings and recommendations of the external audit
in the area of assets were numerous and significant. Assets auditing is a demanding and complex
process. Business events related to the acquisition of assets directly from suppliers are easy to
audit. "However, business events related to donated property, non-monetary exchange and
assets built with own resources are more difficult to audit. For example, it may be difficult to
check the value of an asset that has been exchanged with others, or to appropriately audit the
accumulation of expenses of assets built with own resources. If such events exist, the inherent
risk assessment should be increased." (Messier Jr., 1998, p. 557). The assets area was not
subject to either internal or external audits, so there were no known errors, i.e. inherent risk
assessment had to be increased. Each audited entity disposes of certain assets. Assets are
necessary for performing the activity of the entity and they differentiate in their structure. At
the end of the year, an inventory of assets is made. "The inventory of assets should include
assets irrespective of whether the property relations have been resolved, or whether the property
was leased etc." (Mahaček, 2016, p. 125). The size and share of each type of assets is different
in individual counties, as well as in cities and municipalities. The type of assets varies
significantly across levels of government (counties, cities, and municipalities). When looking
at assets, it is also necessary to look at the revenue from assets at the disposal of local units.
Overall revenue realization from assets at the level of Vukovar-Srijem County (which includes
the county, cities and municipalities) for 2018 amounted to HRK 64,044,841.00 (Ministry of
Finance, 2019), of which revenue from financial assets amounted to HRK 1,589,832.00. In
2018, Vukovar-Srijem County generated revenue from assets in the amount of HRK
15,171,259.00, of which revenue from financial assets amounted to HRK 1,558,031.00. At the
county level, assets revenues in 2018 were 17.96% higher than in 2016, when they amounted

51st International Scientific Conference on Economic and Social Development – Rabat, 26-27 March 2020
40
to HRK 54,295,759.00. Overall revenue from assets at the level of Međimurje County (which
includes the county, cities and municipalities) for 2018 amounted to HRK 38,042,347.00
(Ministry of Finance), of which revenue from financial assets amounted to HRK 7,974,637.00.
For 2018, Međimurje County generated revenue from assets in the amount of HRK
7,769,079.00, of which revenue from financial assets amounted to HRK 1,508,844.00. At the
county level, assets revenues in 2018 were 15.1% higher than in 2016, and they amounted to
HRK 33,062,773.00. If we compare the two observed counties, we see that at the level of all
units within the county, revenue from assets for 2018 was significantly higher in Vukovar-
Srijem County, i.e. 68.35% higher (64,044,841.00 / 38,042,347.00). At the county level,
revenue from assets for 2018 was also significantly higher in Vukovar-Srijem County, by
95.28% (15,171,259.00 / 7,768,079.00). We can conclude that in both counties, revenues from
assets in 2018 increased compared to 2016. Comparing the two counties, we have noticed a
significantly higher realization of revenue from assets in absolute amount in Vukovar-Srijem
County compared to Međimurje County.
2.1.1. Audit of assets of Vukovar-Srijem County
Vukovar-Srijem County comprises of five cities and 26 municipalities with a total population
of 180,117, the county seat is in Vukovar. Table 1 below gives an overview of assets of
Vukovar-Srijem County. The State Audit Office's audit reports for 2013, 2015 and 2016 were
used as the source of the data.
Table 1: Value of assets of Vukovar-Srijem County (in HRK), source: authors according to
data from financial audit reports for 2013, 2015 and 2016
No Description 2013 2015 2016
2013 = 100
Index for
2015
Index for
2016
1. Non-financial assets 51,897,305 52,722,453 52,705,453 101.59 101.56
1.1. Natural resources (land) 8,108,161 8,408,160 8,408,160 103.70 103.70
1.2. Buildings 41,407,792 42,151,279 41,639,467 101.80 100.56
1.3. Plants and equipment 275,232 260,082 230,329 94.50 83.69
1.4. Means of transport 281,029 377,709 347,970 134.40 123.82
1.5. Non-financial assets in
preparation
1,500,000 0 214,438 0.00 14.30
1.6. Other non-financial assets 325,091 1,525,223 1,865,089 469.17 573.71
2. Financial assets 47,121,103 40,599,837 44,992,784 86.16 95.48
2.1. Funds 495,420 5,895,259 9,181,221 1,189.95 1,853.22
2.2. Other claims 13,309,202 2,364,354 3,310,494 17.76 24.87
2.3. Receivables for loans issued 16,357,608 16,604,085 16,751,379 101.51 102.41
2.4. Stocks and shares of equity 8,599,300 8,761,069 10,993,669 101.88 127.84
2.5. Receivables for operating
revenues
7,353,386 6,831,963 4,636,842 92.91 63.06
2.6. Receivables from sales of non-
financial assets
1,006,187 143,107 119,179 14.22 11.84
Total assets 99,018,408 93,322,290 97,698,237 94.25 98.67
Local government assets consist of non-financial and financial assets. Assets refer to "resources
controlled by the budget, i.e. the budget users as a result of past events and from which future
benefits are expected to be exercised." (Ordinance on Budget Accounting and the Accounting
Plan, Article 17). Assets are basically divided into non-financial assets and financial assets.
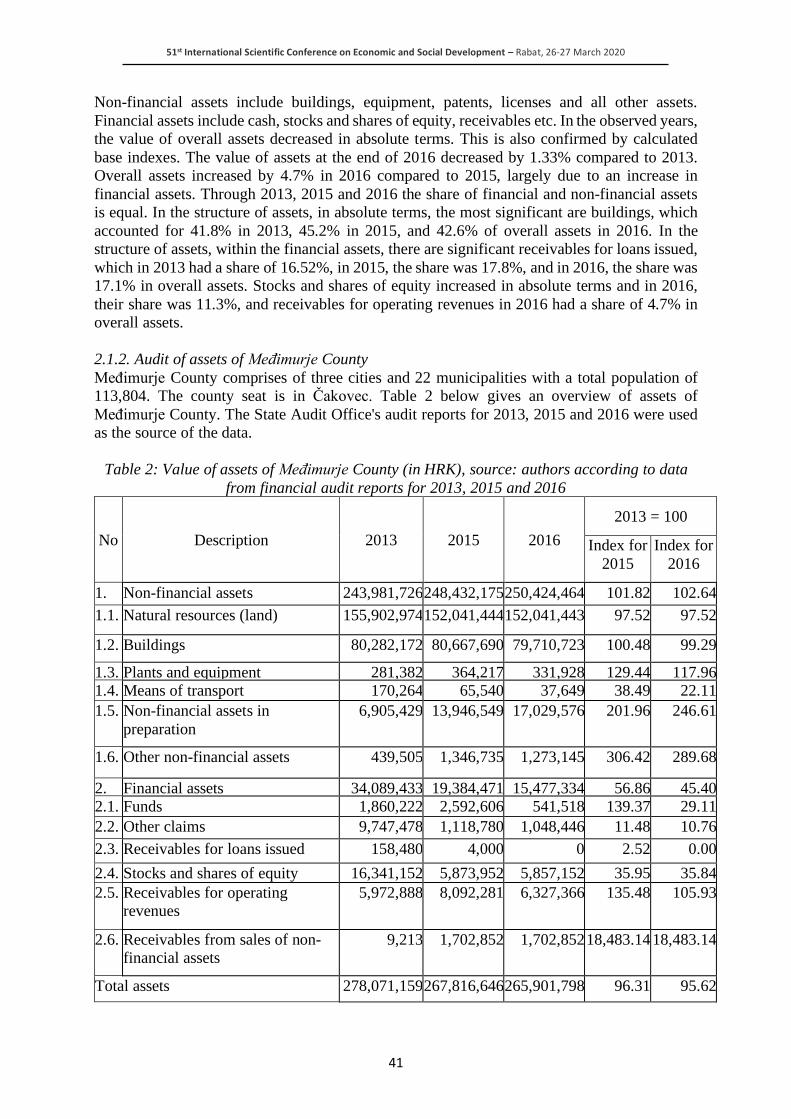
51st International Scientific Conference on Economic and Social Development – Rabat, 26-27 March 2020
41
Non-financial assets include buildings, equipment, patents, licenses and all other assets.
Financial assets include cash, stocks and shares of equity, receivables etc. In the observed years,
the value of overall assets decreased in absolute terms. This is also confirmed by calculated
base indexes. The value of assets at the end of 2016 decreased by 1.33% compared to 2013.
Overall assets increased by 4.7% in 2016 compared to 2015, largely due to an increase in
financial assets. Through 2013, 2015 and 2016 the share of financial and non-financial assets
is equal. In the structure of assets, in absolute terms, the most significant are buildings, which
accounted for 41.8% in 2013, 45.2% in 2015, and 42.6% of overall assets in 2016. In the
structure of assets, within the financial assets, there are significant receivables for loans issued,
which in 2013 had a share of 16.52%, in 2015, the share was 17.8%, and in 2016, the share was
17.1% in overall assets. Stocks and shares of equity increased in absolute terms and in 2016,
their share was 11.3%, and receivables for operating revenues in 2016 had a share of 4.7% in
overall assets.
2.1.2. Audit of assets of Međimurje County
Međimurje County comprises of three cities and 22 municipalities with a total population of
113,804. The county seat is in Čakovec. Table 2 below gives an overview of assets of
Međimurje County. The State Audit Office's audit reports for 2013, 2015 and 2016 were used
as the source of the data.
Table 2: Value of assets of Međimurje County (in HRK), source: authors according to data
from financial audit reports for 2013, 2015 and 2016
No Description 2013 2015 2016
2013 = 100
Index for
2015
Index for
2016
1. Non-financial assets 243,981,726 248,432,175 250,424,464 101.82 102.64
1.1. Natural resources (land) 155,902,974 152,041,444 152,041,443 97.52 97.52
1.2. Buildings 80,282,172 80,667,690 79,710,723 100.48 99.29
1.3. Plants and equipment 281,382 364,217 331,928 129.44 117.96
1.4. Means of transport 170,264 65,540 37,649 38.49 22.11
1.5. Non-financial assets in
preparation
6,905,429 13,946,549 17,029,576 201.96 246.61
1.6. Other non-financial assets 439,505 1,346,735 1,273,145 306.42 289.68
2. Financial assets 34,089,433 19,384,471 15,477,334 56.86 45.40
2.1. Funds 1,860,222 2,592,606 541,518 139.37 29.11
2.2. Other claims 9,747,478 1,118,780 1,048,446 11.48 10.76
2.3. Receivables for loans issued 158,480 4,000 0 2.52 0.00
2.4. Stocks and shares of equity 16,341,152 5,873,952 5,857,152 35.95 35.84
2.5. Receivables for operating
revenues
5,972,888 8,092,281 6,327,366 135.48 105.93
2.6. Receivables from sales of non-
financial assets
9,213 1,702,852 1,702,852 18,483.14 18,483.14
Total assets 278,071,159 267,816,646 265,901,798 96.31 95.62

51st International Scientific Conference on Economic and Social Development – Rabat, 26-27 March 2020
42
In the observed years, the value of overall assets decreased in absolute terms. This is also
confirmed by calculated base indexes. The value of assets at the end of 2016 decreased by
4.38% compared to 2013. Overall assets decreased in 2016 compared to 2015 by 0.71%. Non-
financial assets through 2013, 2015 and 2016 accounted for a much larger share than financial
assets. In the structure of assets, in absolute terms, the most significant are natural resources
(land), which accounted for 56.1% in 2013, 56.8% in 2015, and 57.2% in overall assets in 2016.
In the structure of assets, within the financial assets, there are significant receivables for loans
issued, which in 2013 had a share of 5.9%, in 2015 the share was 2.2%, while in 2016 the share
was 2.2 % in overall assets. Receivables for operating income were significant and in 2013 they
accounted for 2.15%, in 2015 they accounted for 3.02% and in 2016 they accounted for 2.38%
of overall assets. At the end of 2016, the total assets of Međimurje County increased by HRK
168,203,561.00 or 172.17% compared to Vukovar-Srijem County. The structure of assets of
Međimurje County is significantly different from the assets structure of Vukovar-Srijem
County.
3. AUDIT ORDERS AND RECOMMENDATIONS
This paper examines audit orders and recommendations regarding the management and disposal
of real estate, which makes up a significant proportion of assets of local units. The State Audit
Office has conducted an audit of the management and disposal of real estate and has compiled
reports for each county. In a report for Međimurje County, the State Audit Office found that
the management and disposal of real estate of Međimurje County, the cities of Čakovec and
Prelog and the municipalities of Domašinec, Kotoriba, Nedelišće, Orehovica and Sveti Martin
na Muri is efficient, while in all other units in the area of Međimurje County the same is partially
effective. The State Audit Office assessed that the management and disposal of real estate in
Vukovar-Srijem County and the City of Vinkovci is efficient, while in all other local units in
the Vukovar-Srijem County the same is partially effective. In addition to the financial audit,
performance audits are also performed. They focus on particular areas, programs and projects.
The financial audits carried out in local units identified irregularities and omissions related to
the recording, listing and evaluation, and leasing, purchase and sale of assets. The disposal of
and management of certain types of assets was not regulated in detail by laws or regulations,
and different actions were observed when disposing of the same types of assets. Therefore,
there was a need to audit the effectiveness of real estate owned by the local units. Following
the audit, a summary report was prepared. It states that the management and disposal of real
estate in 32 local units is effective, while in all other local units it is partially effective. Property
management and disposal has been evaluated as effective in seven counties (Karlovac,
Koprivnica-Križevci, Međimurje, Primorje-Gorski Kotar, Virovitica-Podravina, Vukovar-
Srijem and Zagreb), 19 cities (Buzet, Čakovec, Duga Resa, Gospić, Karlovac, Kastav, Ivanec,
Labin, Ludbreg, Opatija, Ozalj, Prelog, Senj, Slavonski Brod, Slunj, Umag-Umago, Vinkovci,
Virovitica and Zaprešić) and six municipalities (Domašinec, Kotoriba, Nedelišće, Orehovica,
Rakovica and Sveti Martin na Muri). The methods of gathering and analysing evidence used in
the audit process are:
• consistency of the application of laws and other regulations and internal acts of local units
that prescribe procedures and activities related to real estate were examined
• business books and bookkeeping documents that serve as evidence of business events were
checked and data collected through questionnaires were analysed
• interviews with responsible persons were conducted and explanations were provided
regarding certain business events
After the performance audit was finalized, recommendations were made. The objectives of the
audit were to evaluate the integrity of the real estate data, the regulatory arrangements for
51st International Scientific Conference on Economic and Social Development – Rabat, 26-27 March 2020
43
managing and disposal of real estate, whether local units manage and dispose of real estate in
accordance with regulations and effectively and to evaluate the effectiveness of internal control
systems in managing and disposal of real estate. We have investigated the orders and
recommendations given in the two counties observed and list them below:
• determine the actual state of assets which the local unit manages and disposes of or should
manage and dispose of in accordance with the laws and other regulations, and for the said
property check the registration of ownership rights in the land registers
• record business changes related to real estate in the books of accounts, harmonize data on
the value of long-term non-financial assets in the analytical accounting records and general
ledger, conduct a complete inventory of assets and liabilities, and record the assets whose
procurement process is completed in the relevant asset accounts and perform value
adjustments. In the books of account, record land by type, amount and value, as well as all
assets for which property relations have been resolved, and for property for which property
relations have not been resolved, undertake activities for resolving and recording in the
books of accounts. Initiate the process of registering property rights in favour of the local
unit in the land registers of real estate belonging to the local unit and harmonize the data in
the land registers and cadastre
• organize and maintain the property register in the manner and data prescribed for the state
property register, and programmatically link the property register with the books of
accounts, so that the same data is not repeatedly entered
• determine the purpose of the property managed and disposed of by the local unit, and
establish records of the realized income and expenses from the management and disposal
of real estate for each real estate unit, so that the efficiency of management and disposal of
real estate can be determined and monitored
• plan activities for resolving property-legal relations and evaluation and recording of assets
in the books of accounts in order to improve the performance of business of recording assets
in the books and property register, uniformity of treatment and accuracy of data
• adopt a property management and disposal strategy and an annual asset management and
disposal plan. Arrange the authority, procedures and criteria for all forms of asset
management and disposal planned by strategic documents
• in accordance with the provisions of the Right of Access to Information Act, publish a
tender for the disposal of real estate on the web pages of the local unit
• in accordance with the principle of good management and for the purpose of efficient
disposal of assets and budgetary funds in the acquisition of real estate, to make an analysis
to determine the economic justification of the proposed or selected form of acquisition of
real estate. For properties that are not in operation or are not appropriate for use, take
measures to arrange them, i.e. put them into operation according to their intended purpose.
Prior to the sale of real estate, it is proposed to determine the reasons why the real estate is
for sale, i.e. to justify the sale of real estate
• lease business premises and conclude lease agreements in accordance with the provisions
of the Lease and Sale of Business Premises Act and the acts of the local unit. When granting
business premises for use to associations in the form of non-financial support for the
financing of programs and projects, conduct a public tender in accordance with the
provisions of the Associations Act and the Regulation on the Criteria, Measures and
Procedures for financing and contracting programs and projects of interest for the general
good carried out by the associations
• in cases where a long period of time has passed from the appraisal to the sale of the real
estate, determine whether there were any changes that influenced, or could have affected
the appraised value of the asset and, if necessary, re-appraise the asset value before the
tender
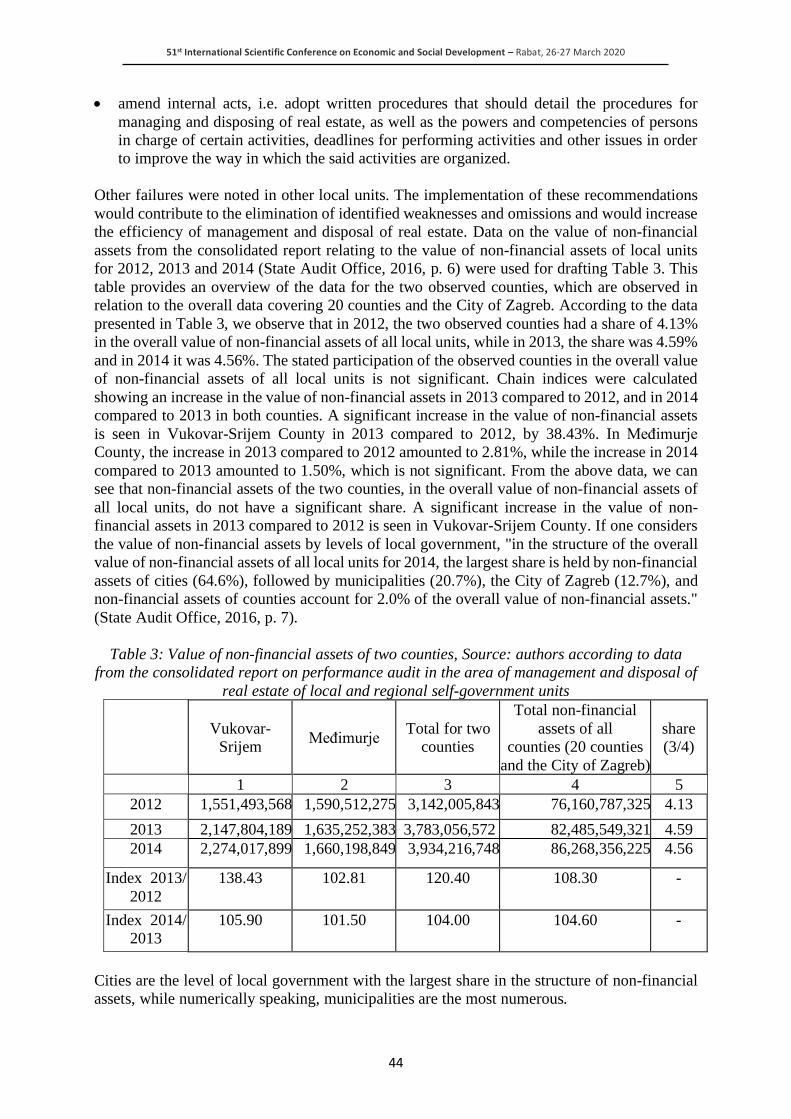
51st International Scientific Conference on Economic and Social Development – Rabat, 26-27 March 2020
44
• amend internal acts, i.e. adopt written procedures that should detail the procedures for
managing and disposing of real estate, as well as the powers and competencies of persons
in charge of certain activities, deadlines for performing activities and other issues in order
to improve the way in which the said activities are organized.
Other failures were noted in other local units. The implementation of these recommendations
would contribute to the elimination of identified weaknesses and omissions and would increase
the efficiency of management and disposal of real estate. Data on the value of non-financial
assets from the consolidated report relating to the value of non-financial assets of local units
for 2012, 2013 and 2014 (State Audit Office, 2016, p. 6) were used for drafting Table 3. This
table provides an overview of the data for the two observed counties, which are observed in
relation to the overall data covering 20 counties and the City of Zagreb. According to the data
presented in Table 3, we observe that in 2012, the two observed counties had a share of 4.13%
in the overall value of non-financial assets of all local units, while in 2013, the share was 4.59%
and in 2014 it was 4.56%. The stated participation of the observed counties in the overall value
of non-financial assets of all local units is not significant. Chain indices were calculated
showing an increase in the value of non-financial assets in 2013 compared to 2012, and in 2014
compared to 2013 in both counties. A significant increase in the value of non-financial assets
is seen in Vukovar-Srijem County in 2013 compared to 2012, by 38.43%. In Međimurje
County, the increase in 2013 compared to 2012 amounted to 2.81%, while the increase in 2014
compared to 2013 amounted to 1.50%, which is not significant. From the above data, we can
see that non-financial assets of the two counties, in the overall value of non-financial assets of
all local units, do not have a significant share. A significant increase in the value of non-
financial assets in 2013 compared to 2012 is seen in Vukovar-Srijem County. If one considers
the value of non-financial assets by levels of local government, "in the structure of the overall
value of non-financial assets of all local units for 2014, the largest share is held by non-financial
assets of cities (64.6%), followed by municipalities (20.7%), the City of Zagreb (12.7%), and
non-financial assets of counties account for 2.0% of the overall value of non-financial assets."
(State Audit Office, 2016, p. 7).
Table 3: Value of non-financial assets of two counties, Source: authors according to data
from the consolidated report on performance audit in the area of management and disposal of
real estate of local and regional self-government units
Vukovar-
Srijem Međimurje
Total for two
counties
Total non-financial
assets of all
counties (20 counties
and the City of Zagreb)
share
(3/4)
1 2 3 4 5
2012 1,551,493,568 1,590,512,275 3,142,005,843 76,160,787,325 4.13
2013 2,147,804,189 1,635,252,383 3,783,056,572 82,485,549,321 4.59
2014 2,274,017,899 1,660,198,849 3,934,216,748 86,268,356,225 4.56
Index 2013/
2012
138.43 102.81 120.40 108.30 -
Index 2014/
2013
105.90 101.50 104.00 104.60 -
Cities are the level of local government with the largest share in the structure of non-financial
assets, while numerically speaking, municipalities are the most numerous.

51st International Scientific Conference on Economic and Social Development – Rabat, 26-27 March 2020
45
4. CONSLUSION
The conducted research has confirmed that the assets of local and regional self-government
units is an important area that should be given due attention. Therefore, we investigated the
assets of two counties and their structure and movement over a period of time. In addition,
assets income in these counties was also investigated. It was confirmed that the two observed
counties differ significantly in the value of assets at their disposal and in the structure of their
assets. The overall assets of Međimurje County are significantly higher than those of Vukovar-
Srijem County. Natural resources (land) have the most significant share in assets structure,
while buildings had the most significant share in assets structure of Vukovar-Srijem County.
Comparing the two counties, we have noticed a significantly higher realization of property
revenues in absolute amount in Vukovar-Srijem County compared to Međimurje County. Audit
orders and recommendations regarding the management and disposal of real estate, which
constitute a significant proportion of assets of local units, were explored. It has been determined
that there are various irregularities and omissions that need to be addressed. The value of non-
financial assets at the local government level is significant in cities and therefore attention needs
to be paid to implementing the recommendations. This has the effect of satisfying the needs of
living and working in a particular area. It would be useful to investigate the structure of assets
of local units and, in that regard, the revenues generated. Existing assets need to be put into
service in order to increase the efficiency of management and disposal of real estate.
LITERATURE:
1. Mahaček, D. (2016): Revizija u zdravstvenome sustavu, Medicinski fakultet u Osijeku,
ISBN 978-953-7736-28-6, pp. 125.
2. Ministry of Finance: Ostvarenje proračuna JLP(R)S za period 2014. – 2018., Retrieved on
October 27, 2019 from : http://www.mfin.hr/hr/ostvarenje-proracuna-jlprs-za-period-2014-
2018
3. Ministry of Finance: Pravilnik o proračunskom računovodstvu i Računskom planu, Official
Gazette 124/14, 115/15, 87/16 and 3/18
4. State Audit Office, Čakovec, June 2014, Izvješće o obavljenoj reviziji Međimurska
županija, Retrieved on November 8, 2019 from http://www.revizija.hr/izvjesca/2014/rr-
2014/lokalne-jedinice/zupanije/medimurska-zupanija.pdf
5. State Audit Office, Čakovec, July 2016, Izvješće o obavljenoj reviziji Međimurska
županija, Retrieved on November 10, 2019 from
http://www.revizija.hr/datastore/filestore/86/medimurska.pdf
6. State Audit Office, Čakovec, July 2017, Izvješće o obavljenoj reviziji Međimurska
županija, Retrieved on November 12, 2019 from
http://www.revizija.hr/datastore/filestore/125/MEDIMURSKA.pdf
7. State Audit Office, Vinkovci, July 2014, Izvješće o obavljenoj reviziji Vukovarsko-
srijemska županija, Retrieved on November 14, 2019 from
http://www.revizija.hr/izvjesca/2014/rr-2014/lokalne-jedinice/zupanije/vukovarsko-srijem
ska-zupanija.pdf
8. State Audit Office, Vinkovci, July 2016, Izvješće o obavljenoj reviziji Vukovarsko-
srijemska županija, Retrieved on November 16, 2019 from
http://www.revizija.hr/datastore/filestore/86/vukovarsko-srijemska.pdf
9. State Audit Office, Vinkovci, July 2017, Izvješće o obavljenoj reviziji Vukovarsko-
srijemska županija, Retrieved on November 18, 2019 from
http://www.revizija.hr/datastore/filestore/125/VUKOVARSKO_SRIJEMSKA.pdf

51st International Scientific Conference on Economic and Social Development – Rabat, 26-27 March 2020
46
10. State Audit Office, Zagreb, March 2016, Izvješće o obavljenoj reviziji učinkovitosti
upravljanje i raspolaganje nekretninama jedinica lokalne i područne (regionalne)
samouprave, Retrieved on November 20, 2019 from
http://www.revizija.hr/izvjesca/2016/rr-2016/revizije-ucinkovitosti/upravljanje-i-raspola
ganje-nekretninama-lokalnih-jedinica/upravljanje-i-raspolaganje-nekretninama-skupno-
izvjesce.pdf
11. State Audit Office, Čakovec, January 2016, Izvješće o obavljenoj reviziji upravljanje i
raspolaganje nekretninama jedinica lokalne i područne (regionalne) samouprave na
području Međimurske županije, Retrieved on November 22, 2019 from
http://www.revizija.hr/izvjesca/2016/rr-2016/revizije-ucinkovitosti/upravljanje-i-raspolag
anje-nekretninama-lokalnih-jedinica/medimurska-zupanija.pdf
12. State Audit Office, Vukovar, January 2016, Izvješće o obavljenoj reviziji upravljanje i
raspolaganje nekretninama jedinica lokalne i područne (regionalne) samouprave na
području Vukovarsko-srijemske županije, Retrieved on November 24, 2019 from
http://www.revizija.hr/izvjesca/2016/rr-2016/revizije-ucinkovitosti/upravljanje-i-raspolag
anje-nekretninama-lokalnih-jedinica/vukovarsko-srijemska-zupanija.pdf
13. Tušek, B. & Žager, L., (2006), Revizija, Hrvatska zajednica računovođa i financijskih
djelatnika, Zagreb, pp. 328.
14. William F. Messier Jr., (1998), Revizija – Priručnik za revizore i studente, Faber & Zgombić
Plus, Zagreb, pp. 557.

51st International Scientific Conference on Economic and Social Development – Rabat, 26-27 March 2020
47
VALUATION AND CLASSIFICATION OF FIXED ASSETS IN
SELECTED LOCAL GOVERNMENT
Magdalena Glebocka
University of Economics in Katowice, Poland
Ewa Mackowiak
University of Economics in Katowice, Poland
ABSTRACT
Fixed assets and intangible assets remain one of the most difficult accounting issues in the
entities of the public finance sector. In private sector entities, the issue was regulated by the
Accounting Act in 1995. In the public finance sector, on the other hand, it was addressed in the
Regulation of 28 July 2006 on detailed accounting principles and the chart of accounts for the
state budget, budgets of local government units and certain units of the public finance sector.
Changes in public finance resulting from the amendment to the Public Finance Act also led to
an amendment to the Regulation. The new provisions were adopted by the Regulation of the
Minister of Development and Finance as of 13 September 2017 on special accounting
principles and the chart of accounts for the state budget, budgets of local government units,
budgetary units, local government budgetary establishments, state special-purpose funds and
state budgetary units based outside the borders of the Republic of Poland. Pursuant to the
Regulation, entities of the public finance sector keep accounts in compliance with the provisions
of the Accounting Act, taking into account the principles set out in the Act on Public Finance.
In addition, paragraph 1 of Article 2 of the Accounting Act stipulates that the provisions also
apply to: communes, poviats, voivodships and their associations, as well as to:
a) state, communal, poviat and voivodship budgetary units,
b) communal, poviat and voivodship budgetary establishments,
c) state special-purpose funds
The article aims to propose a different method for the recognition and depreciation of fixed
assets in local government units and their impact on the financial result of a local government
unit.
Keywords: public finance sector, valuation, fixed assets
1. INTRODUCTION
The principles of the functioning and establishment of units of the public finance sector are
defined in the Act of 27 August 2009 on public finance. Chapter 3 provised the detailed
description of their functioning and types.According to Article 9, the public finance sector is
composed of: bodies of public authorities, including government administration bodies, state
control and law enforcement bodies, as well as courts and tribunals, local government units,
metropolitan associations, budgetary units, local government budgetary establishments,
executive agencies, budgetary and state economy institutions, state special-purpose funds, ZUS
(The Social Insurance Institution), KRUS (the Agricultural Social Insurance Fund), NFZ (the
National Health Fund), public autonomous health care management units, public universities,
PAN (the Polish Academy of Sciences), state and local cultural institutions, and others.
Figure following on the next page
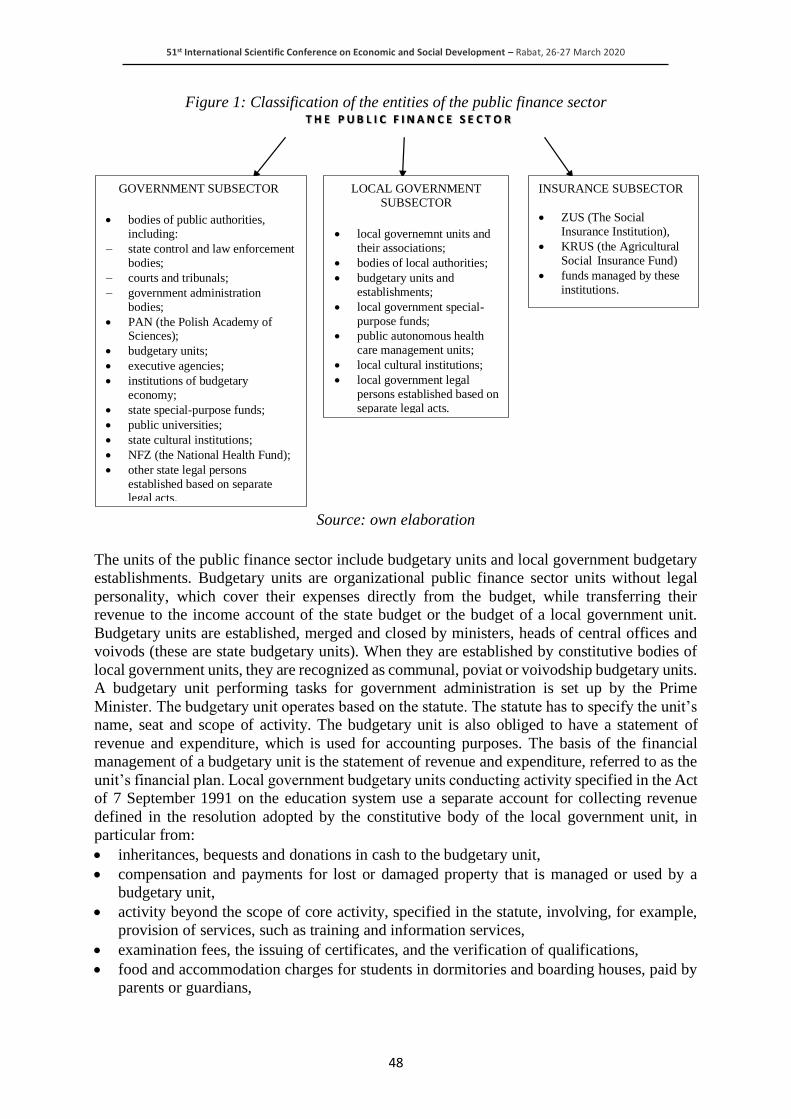
51st International Scientific Conference on Economic and Social Development – Rabat, 26-27 March 2020
48
Figure 1: Classification of the entities of the public finance sector
Source: own elaboration
The units of the public finance sector include budgetary units and local government budgetary
establishments. Budgetary units are organizational public finance sector units without legal
personality, which cover their expenses directly from the budget, while transferring their
revenue to the income account of the state budget or the budget of a local government unit.
Budgetary units are established, merged and closed by ministers, heads of central offices and
voivods (these are state budgetary units). When they are established by constitutive bodies of
local government units, they are recognized as communal, poviat or voivodship budgetary units.
A budgetary unit performing tasks for government administration is set up by the Prime
Minister. The budgetary unit operates based on the statute. The statute has to specify the unit’s
name, seat and scope of activity. The budgetary unit is also obliged to have a statement of
revenue and expenditure, which is used for accounting purposes. The basis of the financial
management of a budgetary unit is the statement of revenue and expenditure, referred to as the
unit’s financial plan. Local government budgetary units conducting activity specified in the Act
of 7 September 1991 on the education system use a separate account for collecting revenue
defined in the resolution adopted by the constitutive body of the local government unit, in
particular from:
• inheritances, bequests and donations in cash to the budgetary unit,
• compensation and payments for lost or damaged property that is managed or used by a
budgetary unit,
• activity beyond the scope of core activity, specified in the statute, involving, for example,
provision of services, such as training and information services,
• examination fees, the issuing of certificates, and the verification of qualifications,
• food and accommodation charges for students in dormitories and boarding houses, paid by
parents or guardians,
GOVERNMENT SUBSECTOR
2.
• bodies of public authorities,
including:
− state control and law enforcement
bodies;
− courts and tribunals;
− government administration
bodies;
• PAN (the Polish Academy of Sciences);
• budgetary units;
• executive agencies;
• institutions of budgetary
economy;
• state special-purpose funds;
• public universities;
• state cultural institutions;
• NFZ (the National Health Fund);
• other state legal persons
established based on separate legal acts.
LOCAL GOVERNMENT
SUBSECTOR
1.
• local governemnt units and
their associations;
• bodies of local authorities;
• budgetary units and
establishments;
• local government special-
purpose funds;
• public autonomous health
care management units;
• local cultural institutions;
• local government legal
persons established based on
separate legal acts.
INSURANCE SUBSECTOR
• ZUS (The Social
Insurance Institution),
• KRUS (the Agricultural
Social Insurance Fund)
• funds managed by these
institutions.

51st International Scientific Conference on Economic and Social Development – Rabat, 26-27 March 2020
49
• subsidies and other payments applicable under the EU’s Common Agricultural Policy,
received based on separate regulations.1
The Act on Public Finance also stipulates how the own revenues of budgetary units can be spent
(Zysnarska A. 2008, p. 19):
1. to finance current and property-related expenses related to the revenue generated by the
budgetary unit from fees for releasing tender documentation,
2. towards the goals indicated by the donor,
3. on renovation or restoration of property when reveue is generated:
• from compensation and payments for lost or damaged property transferred to a
budgetary unit for management or use.
The local government budgetary establishment is an organizational unit of the public finance
sector that:
1. performs specific tasks in return for payment,
2. covers the costs of its operations from its own revenue with the following reservations:
a) the local government budgetary establishment may receive grants and targeted grants
from the budget of the local government unit for current tasks co-financed with the funds
referred to in Article 5, paragraph 1, points 2 and 3 (the Act on Public Finance);
b) targeted grants for financing or co-financing the costs of investment projects. To the
extent specified in separate acts, the local government budgetary establishment may
receive a subsidy.
2. CLASSIFICATION OF FIXED ASSETS ACCORDING TO THE ACCOUNTING
ACT
The Accounting Act defines assets as the property that is controlled by the entity and has a
reliably assessed value. They originate in past events and will bring economic benefits in the
future. Assets are classified based on the criterion of time, resulting in the division into fixed
and current assets. Fixed assets include intangible assets, property, plant and equipment, long-
term receivables, long-term investments and long-term accruals and deferred income. The
Accounting Act, in paragraph 1of Article 3, defines fixed assets as tangible fixed assets and
their equivalents, with an expected useful economic life longer than one year, complete, fit for
use and designed to serve an undertaking’s purposes. They include in particular:
a) immovable property - including land, the perpetual usufruct right to land, buildings and
structures, as well as premises owned on a separate basis, cooperative ownership rights to
residential premises, and cooperative rights to commercial premises,
b) plant and machinery, means of transport and other things,
c) improvements in third party items of property, plant and equipment,
d) livestock.
The above list shows that fixed assets are mainly assets that have the physical form, but they
may also include assets that are of different nature. The best example involves property rights,
e.g. the perpetual usufruct right to land. Fixed assets also include assets which are complete at
the time of recording them as owned by an undertaking and they do not need to be assembled,
repaired or renovated in order to be used for their intended purpose for a period longer than one
year as from the balance sheet date. The period of use is determined separately in each economic
undertaking. Notably, the Accounting Act does not require that an undertaking should own
property, plant and equipment based, for example, on the title deed.
1 Cf. Act of 27 August 2009 on public finance, Article 11a
51st International Scientific Conference on Economic and Social Development – Rabat, 26-27 March 2020
50
The undertaking may exercise control over assets based on lease contracts that fulfill the
conditions for transferring control to the user. This means that fixed assets are maintained in
connection with an undertaking’s statutory activity (manufacturing, trade, administration).
Fixed assets may also take the form of operational leases, they may be made available for use,
or they may be used based on a rental or lease agreement. Such assets will be recognized as an
undertaking’s assets if the contract fulfills at least one of the conditions specified in items 1-7,
paragraph 4, Article 3 of the Accounting Act:
• ownership of the assets is transferred to the user at the end of the term for which it was
concluded;
• it confers the right for the user to acquire the assets following the expiry of the term for
which it was concluded at a price lower than the market price;
• the term for which it was concluded corresponds, to a major extent, to the expected useful
economic life of the fixed asset or property right, save that it may not be shorter than 3/4 of
that period. The ownership title to the assets may be transferred to the user following the
expiry of the term for which the contract was concluded;
• the total charges, less the discount, determined at the date of the contract's conclusion and
payable during the term of the contract, exceed 90 per cent of the market value of the assets
at that date. The total charges include the terminal value of the assets that the user undertakes
to pay for the transfer of the ownership title. The total charges do not include the payments
to the financing party for additional services, taxes or insurance premiums relating to the
asset if the user covers these in addition to the charges for use;
• it contains a pledge by the financing party to conclude another contract with the user to give
the same asset for use against remuneration or extend the existing contract on more
advantageous terms and conditions than those stipulated in the existing contract;
• it provides for the possibility of terminating it, subject that any resulting costs and losses
incurred by the financing party will be borne by the user;
• the asset has been adapted to the user's individual needs.
The Classification of Fixed Assets (KŚT) was introduced pursuant to the Regulation of the
Council of Ministers of 10 December 2010 and has remained in force since 1 January 2011. It
replaced the Generic Classification of Fixed Assets (KRŚT), adopted by the decision No. 51 of
the President of the Central Statistical Office on 17 December 1991 on the Generic
Classification of Fixed Assets (Official Journal No. 21, item 132, Central Statistical Office).
The introduction of the new classification was associated with the changes in many legal acts.
The new definition of fixed assets was also related with the need to account for new technical
and technological solutions in the classification. It is also associated with the new classifications
of the Polish Classification of Products and Services (PKWiU) and the Polish Classification of
Buildings and Structures (PKOB).2 The rules for classifying fixed assets are primarily based on
the functions they perform in an undertaking. Pursuant to the Regulation of the Council of
Ministers of 10 December 2010, fixed assets include:
• immovable property (land, buildings, civil engineering structures),
• machines, technical equipment and tools,
• means of transport for persons or goods,
• livestock.
Taking into account the principles for classifying fixed assets discussed, the first level of the
classification distinguishes the following 10 single-digit groups of fixed assets:
• Group 0 – Land,
2 K. Sawicki, „Rachunkowość finansowa przedsiębiorstw”, Polskie Wydawnictwo Ekonomiczne, Warszawa 2005, p. 61

51st International Scientific Conference on Economic and Social Development – Rabat, 26-27 March 2020
51
• Group 1 – Buildings and premises and cooperative rights to commercial premises and
cooperative ownership rights to residential premises,
• Group 2 – Civil engineering facilities,
• Group 3 – Power boilers and machines,
• Group 4 – General purpose machinery, equipment and apparatus,
• Group 5 – Specialist machinery, equipment and apparatus,
• Group 6 – Technical devices,
• Group 7 – Means of transport,
• Group 8 – Tools, instruments, movables and equipment, not classified elsewhere,
• Group 9 – Livestock.3
3. THE CLASSIFICATION OF FIXE ASSETS IN BUDGETARY UNITS AND LOCAL
GOVERNMENT BUDGETARY ETSABLISHMENTS
In budgetary units and local government budgetary establishments, property, plant and
equipment are classified as follows:
• fixed assets,
• other fixed assets,
• investments (fixed assets under construction).
The Regulation of the Minister of Development and Finance defines fixed assets as follows:
assets referred to in item 15, paragraph 1, Article 3 of the Accounting Act, including fixed assets
owned by the State Treasury or local government units, received in management or used and
intended for the needs of the unit. In consequence, these definitions show that, in accordance
with item 15, paragraph 1, Article 3 of the Accounting Act, in order to recognize a given asset
as a fixed asset, it must meet the following conditions jointly:
1) must be a tangible fixed asset (or its equivalent);
2) its expected useful life must exceed one year;
3) it must be:
• complete,
• usable,
• intended for the use of the unit.
If land granted in permanent management to a budgetary unit has these characteristics, the head
of the unit will be obliged to include it in the unit’s accounting books. Other fixed assets are the
assets listed in paragraph 3, Article 6 of the Regulation, which are financed with funds for
current expenses (except for the first equipment of a new facility, which is also financed with
investment funds). They include:
• books and other library collections (proided that a library operates in the unit),
• teaching resources for schools and education establishments,
• clothing and uniforms,
• furniture and carpeting,
• livestock,
• fixed assets of the initial value not exceeding the amount specified in the regulations on
corporate income tax, for which depreciation write-offs are recognized as tax-deductible
costs in 100% of their value upon their adoption for use.
3 Regulation of the Council of Ministers of 10 December 2010 on the Classification of Fixe Assets (Journal of Laws 2010, No. 242, item 1622, as later amended), p. 16362

51st International Scientific Conference on Economic and Social Development – Rabat, 26-27 March 2020
52
Budgetary units and local government budgetary establishments can perform a one-time
depreciation of other fixed assets in the month when they are taken over for use, regardless of
their value. The exception is the last group of other fixed assets, the so-called low-value fixed
assets. The Accounting Act allows for a one-time depreciation, i.e. a write-off of a fixed asset
as a cost, however it does not indicate what a low value means. This value was specified in the
Act on Income Tax and currently amounts to PLN 10,000. Interestingly, a one-time write-off
of other fixed assets is a possibility, but not an obligation.
4. PRINCIPLES FOR MEASURING FIXED ASSETS IN UNITS OF THE PUBLIC
FINANCE SECTOR
The performance of tasks assigned to units of the public finance sector requires the involvement
of public funds. The assessment of the proper management of these units is carried out based
on how funds are used, basically whether they are allocated accurately and effectively and
whether expenses are incurred adequately in relation to the assigned tasks. The assets at the
disposal of public sector entities are public property, which is why the processes taking place
in the public sector are subject to control. The assessment is performed based on the information
included in a unit’s accounting records. Accounting as a system of mapping, predicting and
communicating the states and dynamics of an economic unit’s resource position performs this
function regardless of which sector the unit belongs to [Nowak, 2014, p. 193]. In units of the
public finance sector, the accounting policy is closely related to the principles of its functioning
regulated by the Act of 27 August 2009 on Public Finance. Pursuant to paragraph 1, Article 40
of the Act on Public Finance, entities of the public finance sector keep accounts in compliance
with the provisions of the Accounting Act, taking into account the specific principles set out in
the Act on Public Finance and further specified in the Regulation of the Minister of Finance of
13 September 2017 on special accounting principles and the chart of accounts for the state
budget, budgets of local government units, budgetary units, local government budgetary
establishments, state special-purpose funds and state budgetary units based outside the borders
of the Republic of Poland [Regulation]. The special accounting principles that apply to the
public sector concern [Paragraph 2, Article 40 of the Act on Public Finance]:
1) records of budgetary implementation;
2) records of task-based budgetary implementation;
3) records of fixed assets owned by the State Treasury or local government units;
4) measurement of individual assets and liabilities;
5) preparation of financial statements and recipients of these reports and they shape individual
features of the accounting policy of a particular unit.
The useful life of fixed assets means that the value of economic benefits determined at the time
of their initial recognition may change over time. Measurement in accounting is continuous and
is performed on a regular basis to assess probable economic benefits [Hońko, 2013, p. 71]. One
of the most important elements of the accounting policy involves the choice of the methods of
measurement of assets and liabilities. In terms of the reliability of the unit’s image presented in
the financial statements, balance sheet valuation is of particular importance. It should be
emphasized that the value of fixed assets is a significant parameter of the assessment of:
• the financial condition of the unit,
• its capacity for continued operations,
• transformations,
• restructuring,
• sanation [Chluska, 2016, p. 38].

51st International Scientific Conference on Economic and Social Development – Rabat, 26-27 March 2020
53
In units of the public finance sector, the principles of the initial and subsequent measurement
of fixed assets originate in the provisions of the Accounting Act and the Regulation. The
National Accounting Standard 11 ‘Fixed assets’ complements the statutory regulations. Due to
the differences in the rules concerning the financing of public entities, the NAS 11 guidelines
can be applied on a voluntary basis. Under the Regulation, the specific principles for
measurement (and recording of fixed assets) that should be taken into account in the process of
creating the accounting policy relate to:
• the separation of the group of other fixed assets subject to one-time depreciation,
• the measurement of fixed assets owned by the State Treasury or local government units
received free of charge, based on the decision of the competent authority at the value
specified by the decision.
The method of initial recognition of fixed assets in the accounting books depends, among
others, on:
• sources of financing,4
• intended use and
• initial value.
The correct determination of the initial value5 of a fixed asset affects not only the way of its
initial recognition, but also the amount of costs. Depending on the method of the acquisition6
of a fixed asset, its initial value is determined by such measurement parameters as (Table 1):
• the purchase price,
• the manufacturing cost,
• the selling price, or
• another value.
Table following on the next page
4 Depending on the method of financing, fixed assets are divided into basic fixed assets or other fixed assets. Basic fixed assets are financed with funds allocated for investment financing. Other fixed assets, on the other hand, are funded from current
expenditure and are subject to depreciation in full at the time they are released for use, with the exception of the situation when such assets are used to equip a new building under construction, which is also financed from investment funds. 5 The initial value is the purchase price, the cost of manufacture or other value according to which the fixed asset was first recognized in the unit’s accounting books. Upon recognition, the initial value of a fixed asset is equal to its gross book value [point 3.5 of NAS 11]. 6 Pursuant to point 3.4 of NAS 11, the acquisition of a fixed asset includes all factual and legal activities resulting in the recognition of a fixed asset, acquired in particular through purchase, manufacture, financial leasing, unpaid receipt, payment in kind (in-kind contribution), exchange, reclassifying from investment property, in the accounting books.

51st International Scientific Conference on Economic and Social Development – Rabat, 26-27 March 2020
54
Table 1: Principles for determining the initial value of fixed assets. Acquisition method Measurement
parameter
Initial value
Purchase The purchase price .The purchase price [paragraph 2, Article 28 of the Accounting
Act] is:
• the purchase price of an asset comprising the amount
payable to the seller
• less the deductible value added tax and excise duty,
• in the case of imports, increased by any public levies
• increased by any costs connected directly with the
purchase and adaptation of the asset to make it fit for use
or trading, including transport, loading, unloading, storage
costs or costs of introducing to trading,
• less any rebates, discounts and any other similar
reductions or benefits.
If it is impossible to determine the acquisition price of an
asset, including in particular an asset received free of charge,
including as a donation, it is measured at the selling price of an identical or similar asset.
Internal manufacture The manufacturing
cost
The manufacturing cost includes:
• the value at the purchase price of tangible assets and
external services used,
• salaries and contributions,
• other costs that can be included in the value of the fixed
assets.
In-kind contribution
(non-cash
contribution)
Free-of-charge
acquisition
The selling price
Fair value
Value specified in
the decision issued
by a competent
body
The net selling price (value) of an asset is its selling price
recoverable on the balance sheet date, net of value added tax
and excise duty, less any rebates, discounts and any other
similar reductions and costs to adapt the asset for sale and to
sell it, increased by any targeted subsidy receivable. If it is impossible to determine the net selling price of an asset, its fair
value should be otherwise determined as of the balance sheet
date [paragraph 5, Article 28 of the Accounting Act].
The fair value is the amount for which a given asset could be
exchanged and the liability paid off as a market transaction
between willing, well informed and unrelated parties
[paragraph 6, Article 28 of the Accounting Act].
Value specified in the decision of the competent authority on
the handover of particular fixed assets.
Source: own elaboration
The definition of permanent management is given in paragraph 1, Article 43 of the Act on Real
The purchase price and the manufacturing cost of fixed assets (and fixed assets under
construction) comprise the total costs incurred by the unit during the period of construction,
assembly, adaptation and improvement up to the balance sheet date or the date they are accepted
for use, including:
• non-deductible value added tax and excise duty,
• the cost of servicing the liabilities incurred to finance them and the exchange rate
differences related to them, less any related gains [paragraph 8, Article 28 of the Accounting
Act].
• real estate by an organizational unit.
Particular fixed assets are recognized in the unit’s accounting books at their initial value [item
6.1. NAS 11], i.e. the purchase price or the manufacturing cost [paragraphs 2 and 8, Article 28,

51st International Scientific Conference on Economic and Social Development – Rabat, 26-27 March 2020
55
paragraphs 3 and 8, Article 28 of the Accounting Act] increased by the costs of external
financing [paragraphs 8, Article 28 of the Accounting Act]. The statutory regulations ensure
the right to capitalising the costs of external financing in the initial value of fixed assets. In the
case of budgetary units and establishments, the initial value of fixed assets does not include
costs of external financing, because the costs of servicing the liabilities incurred to finance the
acquisition of a fixed asset are charged to the budget that incurred them. If it is not possible to
determine the purchase price or the manufacturing cost of a fixed asset (for example in relation
to the disclosed surpluses), its initial value is determined based on the net selling price of the
same or a similar asset [item 6.30. NAS 11]. Budgetary units and establishments may receive,
free of charge, into management or perpetual usufruct, fixed assets owned by the State Treasury
or local government units. In such a case, the initial value of fixed assets is set by the decision
of the competent authority making the transfer [paragraph 1, Article 6 of the Regulation]. In a
situation when used fixed assets are transferred between budgetary units and establishments,
their initial value corresponds to the gross value and the depreciation recorded in the books of
the transferring entity. However, a situation may arise when units receive fixed assets free of
charge based on decisions that do not provide information so as to their value. In consequence,
they need to estimate the value of such assets based on the selling price of the same or similar
asset. If the subject of the transfer is real estate, the measurement method7 is specified in the
Act of 21 August 1997 on real estate management [the Act on Real Estate]. Accordingly, the
value of real estate received in permanent management determined in this way may become the
basis for determining the initial value of the real estate received free of charge or as a donation
to the receiving unit. In the event that the transfer involves real estate that was previously
included in the real estate resource, the measurement performed for the purpose of the decision
on permanent management cannot be used as the measurement for the purpose of accounting
records (it cannot be used as the initial value of the real estate). This would breach the continuity
of records required by the principle of historical cost. The transfer of real estate between the
organizational units of the same owner cannot justify a change in the measurement of real
estate, nor can an update performed by a surveyor in order to determine the permanent
management fee [Rup, 2017, p. 105]. The acquisition of fixed assets in exchange for budget
appropriations constitutes a special case. Pursuant to paragraph 1, Article 66 of the Act of 29
August 1997 on the Tax Code [Tax Code], a tax debt extinguishes as a result of the transfer of
a real estate title or property rights to:
• the State Treasury – in exchange for arrears on taxes constituting state budget revenue,
• a commune, a poviat or a voivodship – in exchange for arrears on taxes constituting revenue
for the budgets of these units.
The transfer is executed upon request of the taxpayer, based a written agreement concluded
between the taxpayer and the official acting in his capacity within government administration
or an application addressed to the competent official or the marshal of a voivodship [www1].
The application should contain at least the identification of tax arrears to which the transfer is
to be made and the value of property rights or assets to be transferred [items 1 and 2, paragraph
2, Article 66 of the Tax Code]. The initial value of the acquired fixed asset will be stated in the
agreement and will correspond to the value accepted by the two parties to the agreement. One
of the ways to acquire fixed assets is to build them.
7 Pursuant to Article 150 of the Act on Real Estate, the following categories can be used for real estate measurement:
• the market value of real estate,
• the replacement value of real estate,
• the cadastral value of real estate. The measurement of real estate can be conducted using the following approaches [paragraph 2, Article 152 of the Act on Real Estate]: comparative, income-based, cost-based, mixed.
51st International Scientific Conference on Economic and Social Development – Rabat, 26-27 March 2020
56
Units of the public finance sector can implement investment projects, as a result of which new
facilities are built or existing ones are modernised. Investment can involve the construction or
assembly of purchased fixed assets or investment purchases. Until completed, they constitute
fixed assets under construction. Fixed assets arising from completed investment are measured
at their manufacturing cost. The costs of manufacturing a fixed asset internally include [point
6.38 NAS 11]:
a) direct costs of building an asset – the costs that can be linked with a given asset directly,
based on source documents or relevant units of measurement (coefficients) clearly defining
the amount of costs incurred in relation to an asset in question,
b) indirect costs of building an asset, which cannot be directly assigned to a given asset,
including:
• costs shared in the process of the construction of more than one asset and
• costs of maintaining tangible, intangible and human resources used for the construction
of a given asset as well as other activity.
The initial value of a new fixed asset includes the costs of decommissioning (e.g. demolition)
of another fixed asset, provided that its decommissioning is a prerequisite for launching a
relevant construction project. On the other hand, the initial value of a new fixed asset does not
increase the net value of the liquidated fixed asset, unless, in connection with the construction
of a new fixed asset, the unit liquidates another fixed asset without physically removing it and
the existing asset will become part of the new fixed asset [item 6.53 and 6.54 NAS 11]. The
cost of manufacturing a fixed asset also includes the costs of trials and tests (technological start-
up) carried out to check the operation of the fixed asset and determine its fitness for use as
intended by the unit or external requirements, incurred by the unit until the date when it is
launched for use. The initial value of a fixed asset under construction reduces the value in the
net selling price of semi-finished products, finished products or services sold or received as a
result of tests and trials, provided that their value is significant [item 6.51 NAS 11]. NAS 11
provides guidelines for identifying the causal relationship between the cost incurred and the
initial value of the fixed asset that was produced. However, not all the guidelines are applicable
to units of the public finance sector, so the standard can be used only to a limited extent. This
applies in particular to the rules for financing tangible investments in units of the public finance
sector and the rules for capitalising the costs and revenues of external financing in the initial
value of the fixed assets that were produced [items 6.58-6.77 NAS 11]. The initial value of
fixed assets is subject to changes stemming from the improvement8, the connection or
disconnection of peripheral parts, their updated value and planned impairment resulting from
their use. When the unit decides to record espenses as improvement, it takes into account the
criterion of the significant initial value of a fixed asset, defined in its accounting principles
(policy). If the expenses incurred on the improvement of a given asset are, on an annual basis,
lower than the significant initial value of this asset, they are recognised as operating costs [items
4.28-4.32 and 8.29-8.32 NAS 11]. In their accounting policy, units of the public finance sector
can adopt solutions based on tax regulations. In consequence, improvement related expenses
not exceeding PLN 10,000 can be recognized as costs and not be capitalized in the initial value
8 The improvement of a fixed asset involves expenses that increase its usable value. In practice, the following actions are considered to constitute improvements:
• modification – a change of the existing state of a fixed asset to another state,
• extension – an increase (enlargement) of an asset,
• reconstruction – a restoration of an asset that shows signs of complete or partial wear and tear,
• adaptation – a conversion of an asset so that it can be used for a purpose other than its original purpose or the addition of new features,
• modernization – an upgrade of a fixed asset.

51st International Scientific Conference on Economic and Social Development – Rabat, 26-27 March 2020
57
of the fixed asset9 [paragraph 13, Article 16g of the Corporate Income Tax Act]. The change in
the initial value (and depreciation applied so far) may arise from the statutory review of the
value of fixed assets conducted under separate provisions. This aims to eliminate the impact of
inflation and update the unit’s fixed assets and depreciation cost. In terms of the usefulness of
information included in the financial statements, the measurement of assets performed on the
balance sheet date is of crucial importance. Pursuant ot Article 28 of the Accounting Act,
tangible fixed assets should be measured not less frequently than on the balance sheet date – at
the purchase price or the manufacturing cost, or at reviewed value (following the revaluation
of fixed assets), less depreciation or amortization write-offs, as well as write-offs for permanent
impairment10. Fixed assets as assets with long-term economic usability are gradually impaired.
Impairment may result from their use or the passage of time. It may also be caused by adverse
changes in the unit’s economic environment, unforeseen changes in law, or erroneous
investment decisions11. Consequently, the unit will not obtain the economic benefits expected
upon the acquisition of the fixed asset. The information on the value of assets can only be
reliable if this is taken into account. In the case of public sector units, the principle of prudence
applied to the measurement of fixed assets on the balance sheet date may be used to assess
whether public funds are used in an appropriate manner. In units of the public finance sector, the
specific principles that make up their accounting policy should reflect the use of funds in a true and
reliable manner, creating the basis for assessing the rationale behind their use. It is important to
remember that the evaluation of the performance of the public finance sector involves determining
whether social goals are achieved with efficacy and efficiency, while economic goals remain
secondary in terms of importance. The focus of the accounting policy on tax solutions is a
simplification that allows estimating the impairment of assets and the costs involved in the use of
fixed assets. When this solution is applied by commercially oriented enterprises, it may lead to
wrong decisions. The successful decision-making process depends on the correctness, credibility
and reliability of the information used. The selection of accounting principles in the area of fixed
assets translates into the picture of the unit’s economic situation in the financial statements.
5. PRINCIPLES AND METHODS OF DEPRECIATION OF FIXED ASSETS IN UNITS OF
THE PUBLIC FINANCE SECTOR
Fixed assets are classified as assets with long useful life. The principle of prudence requires that
entities report in the financial result [paragraph 1, Article 7 of the Accounting Act] decreases in the
usable value or commercial value of assets, including depreciation or amortization write-offs. The
depreciation of a fixed asset is a cost that reflects the scheduled, gradual and systematic distribution
of value subject to depreciation over time, arising from the use of the fixed asset or the passage of
time, which reduces the initial value of the asset12. Unlike impairment, depreciation reflects the
gradual use of the potential for generating economic benefits specific to a given asset, rather than
partial or total loss of this potential [item 8.1 NAS 11].
9 If fixed assets were improved as a result of modification, extension, reconstruction, adaptation or modernization, the initial value of these assets is increased by total expenses incurred on their improvement, including the purchase of components or peripheral parts whose unit purchase price exceeds PLN 10,000. Fixed assets are considered improved when total expenses incurred on their modification, extension, reconstruction, adaptation or modernization in a given tax year exceeds PLN 10,000 and these expenses increase their usable value compared to the value as on the date of adopting fixed assets for use, measured with the period of use, production capacity, quality of products obtained with improved fixed assets and their operating costs. 10 Permanent impairment occurs when it is highly likely that the unit’s assets will not yield a significant or full expected economic benefit in the future. This justifies a write-down bringing the value of an asset recorded in the accounting books to the net selling price, and in the event of its absence – to its fair value determined otherwise [Paragraph 7, Article. 28 of the Accounting Act]. 11 The basis for impairment originating in external and internal sources are presented in items 4.3. and 4.4. NAS 4 'Impairment of assets'. 12 Pursuant to Article 7.3 of the Regulation, land and cultural goods are not depreciated or amortized, while under paragraph 2, Article 31 of the Accounting Act, land is not subject to depreciation (except for land used for open-cast mining).

51st International Scientific Conference on Economic and Social Development – Rabat, 26-27 March 2020
58
The choice of principles and methods of depreciation of fixed assets is one of the elements of
accounting policy and aims at ensuring the accuracy and reliability of information presented in the
financial statements. Accordingly, the unit is responsible for developing a depreciation schedule
that would take into account the causal relationship between the impairment of a fixed asset and
economic benefits that it generates. In the process of creating their accounting policy, units of the
public finance sector draw on the provisions of the Accounting Act and the Regulation, while
additionally also referring to the guidelines of NAS 11. Under Article 7.1 of the Regulation, units
may determine the principles of depreciation of fixed assets based on:
a) the provisions of the Accounting Act or
b) the rates specified in the Act of 15 February 1992 on corporate income tax [the Act on
Corporate Income Tax] or
c) the rates set by the superior unit or the board of the local government unit.
On the date when the unit adopts a fixed asset for use, it should determine a period, a rate and a
method of depreciation, taking into account the economic useful life of a given asset13. Depreciation
or amortization write-offs are made through a systematic distribution of its initial value over the
period of depreciation [paragraph 1, Article 32 of the Accounting Act]. The determination of the
rate14 and method of depreciation should relate to how economic benefits are generated by the
asset [item 8.9 NAS 11]. The period of economic useful life and depreciation rates are subject
to periodic verification [paragraph 3, Article 32 of the Accounting Act], while the depreciation
method adopted remains unchanged. The Accounting Act does not define depreciation
methods, but detailed explanations are included in NAS 11. The methods of depreciation of
fixed assets that are listed in NAS 11 [item 8.10. NAS 11] include the linear, degressive and
natural methods as well as the degressive-linear method adopted by tax regulations [items 8.18
and 8.22 NAS 11]. The focus of the accounting policy on the solutions adopted in the
accounting or tax law also affects the time when depreciation starts. Under paragraph 1, Article
32 of the Accounting Act, depreciation starts after the fixed asset has been accepted for use. On
the other hand, NAS 11 [item 8.33 NAS 11] also allows for the recognition of depreciation
charges (based on the gross book value of the asset15) in the month following the month when
the fixed asset was adopted for, which remains in compliance with tax regulations. The
depreciation is completed no later than when the value of the depreciation (amortization) write-
off is equal to the initial value of the fixed asset, the asset is qualified for liquidation, sale, or
its shortage is confirmed. As a rule, depreciation is calculated in monthly installments [item 8.1
NAS 11]. In the case of entities of the public finance sector, units exempt from corporate income
tax may depreciate fixed assets once a year, while units paying tax for periods other than
monthly periods – once a given period [Article 7.4 of the Regulation]. It is possible to apply
simplifications in the accounting policy for fixed assets with low initial unit value. The
simplification involves [paragraph 6, Article 31 of the Accounting Act]:
• making collective write-offs for groups of assets similar in type and purpose, or
• a one-time write-down of the initial value of the fixed assets in question.
13 The economic useful life of a fixed asset is influenced by [paragraph 2, Article 32 of the Accounting Act]:
• the number of shifts during which the fixed asset is in operation,
• the rate of technical and economic advancements,
• the productivity rate of a fixed asset measured by the number of hours of its operation or by the number of products manufactured or by another appropriate measure,
• legal or other restrictions on the time of use of a fixed asset,
• the net selling price of the significant remains of a fixed asset expected at liquidation. 14 If a fixed asset comprises components or peripheral components, determining the useful life and depreciation rates of the fixed asset, the unit can take into account the differences in the useful life of individual parts or the manner of consuming the economic benefits arising from them [item 8.26 NAS 11]. 15 The value of a fixed asset subject to depreciation is the gross book value of the asset, less any impairment losses and the value of a significant remain of the asset [KSR 11, item 3.6.].

51st International Scientific Conference on Economic and Social Development – Rabat, 26-27 March 2020
59
Simultaneously, the specific rules for financing fixed assets in the public finance sector should
be taken into account, as they necessitate the division of fixed assets into two main groups:
• basic fixed assets financed from investment funds,
• other fixed assets acquired from current expenses (except for the first equipment of a
facility).
Basic fixed assets are subject to systematic depreciation (amortization) write-offs, whereas
other fixed assets are depreciated outright.
5.1. Depreciation according to balance sheet law and tax law
Table 1: Comparison of depreciation according to balance sheet law and tax law. The stage of depreciation
The Accounting Act Tax regulations
The choice of the
method of
depreciation
The choice is made by the entity –
the method can be linear, degressive,
natural, progressive
- the linear method – all assets are depreciated
or
- the degressive method - machines and
devices included in groups 3-6 and 8 of the
Classification of Fixed Assets
The change of the
method
unacceptable unacceptable
The rate and period
of depreciation
The unit makes the relevant decision
taking into account the period of
economic useful life of the fixed
asset
Specified in the list of depreciation rates
included in the nnnex to the tax laws
The change of rates Regular verification of the periods
and rates of depreciation
- an increase – based on adequate coefficients
– from the month following the month in
which the circumstances justifying the changes occurred,
- a decrease – starting from the month when
the means were recorded or from the first
month of each subsequent fiscal year
The frequency of
write-offs
In equal installments for each
reporting period
In equal installments every month or in equal
installments every quarter or once at the end of
the fiscal year
The end of
depreciation
Not later than when:
- the value of depreciation or
amortization write-offs equals the
initial value of a fixed asset,
- the fixed asset is assigned for
liquidation, - the fixed asset is sold,
- there is a shortage of the fixed
asset
Until the end of the month when:
- the sum of depreciation write-offs equals
their initial value,
- the fixed asset is put into liquidation,
- the fixed asset is sold,
- there is a shortage of the fixed asset
Fixe assets used on
a seasonal basis
They are depreciated in the entire
financial year
They are depreciated during their period of
use.
Source: own elaboration
The group of other fixed assets includes the assets of specific type and use, but also the assets
with low initial value, for which depreciation can be calculated in a simplified manner. The
provisions of the Regulation explicitly refer tax law when determining the threshold of the value
of low-value fixed assets. This simplification is also granted by the Accounting Act, which does
not determine the value-based threshold for classifying assets as fixed assets. Based on the
principle of materiality, the unit has the right not to recognize assets of low initial value as fixed
assets [paragraph 6, Article 32 of the Accounting Act, item 4.28 NAS 11].

51st International Scientific Conference on Economic and Social Development – Rabat, 26-27 March 2020
60
These types of assets can:
a) be recognized as fixed assets and:
• be covered by a collective inventory item,
• constitute individual inventory items depreciated once on the date when they are
adopted for use,
b) be written off outright as the costs of materials on the date of adoption of use.
This provision enables the recognition of the amount of PLN 10,000, specified by tax regulations
[paragraph 3, Article 16f of the Corporate Income Tax Act], as insignificant and the performance of
one-off depreciation charges regardless of the useful life of the asset. In units of the public finance
sector, classifying an asset in a group of other fixed assets is associated with recognizing their value
in the cost of materials. This solution represents a narrow approach to the provisions of the
Accounting Act specifying simplifications in the manner of depreciation of low-value fixed assets.
The development of depreciation policy is the responsibility of every entity that keeps accounts.
The adopted detailed rules should fairly reflect the way resources are used and economic
benefits they generate, creating the basis for assessing the rationality of their use. The evaluation
whether unit of the public finance sector operate effectively is conducted through the prism of
the principle of efficacy and efficiency of their operation. Efficacy refers to the extent to which
their objectives were achieved and their tasks were performed. Effectiveness is assessed in
relation to the lilelihood of achieving the set goal while minimizing the costs or achieving the
maximum goal at the assumed costs [Babuśka, 2016, p. 24]. The focus of depreciation policy
on tax solutions is a simplification that allows for the estimation of the impairment of property
and the costs of using fixed assets. However, the success of the decision-making process
depends on the accuracy of the information used. In the case of commercially oriented entities,
the use of such simplifications may lead to erroneous conclusions. When defining the principles
of depreciation of fixed assets, tax law does not take into account the manner of obtaining
economic benefits. The relation between revenue and the corresponding cost is determined in
an arbitrary manner by applying tax depreciation rates provided by regulations.
6. CONCLUSION
To sum up, fixed assets in units of the public finance sector are subject to special rules, which
include the following:
1) fixed assets owned by the State Treasury or local government units that have been received
free of charge, based on the decision of the competent authority, may be measured at the
value specified
2) fixed assets and intangible assets are amortized or depreciated. Depreciation or amortization
write-offs are made according to the principles adopted by the unit in accordance with the
provisions of the Accounting Act. When determining the rules of depreciation, the unit may
adopt rates specified in the Act of 15 February 1992 on corporate income tax, or rates
specified by the superior unit or the board of a local government unit,
3) one-time depreciation write-offs, involving writing off the costs in the month when the asset
is adopted for use, apply to: books and other library collections, teaching resources for
schools and education establishments, clothing and uniforms, furniture and carpeting,
livestock, other fixed assets and intangible assets with a value not exceeding the value
specified in the Act of 15 February 1992 on corporate income tax, for which depreciation
write-offs are recognized as tax deductible in 100% of their value upon their adoption for
use,
4) land and cultural goods are not depreciated or amortized,

51st International Scientific Conference on Economic and Social Development – Rabat, 26-27 March 2020
61
5) the initial value of fixed assets and amortization write-offs made so far are subject to updates
in compliance with the principles set out in separate provisions, and the results of the
updates are referred to the fund,
6) the inventory of real estate should ensure the comparison of data arising from the accounting
records with the records of the commune, poviat and voivodship real estate resources,
7) war stocks are subject to the inventory according to the rules set by the head of the unit
servicing the authorizing body of the budget part.
LITERATURE:
1. Babuśka E. (2016), Mierniki realizacji celów i zadań w jednostce budżetowej, Finanse,
Rynki Finansowe, Ubezpieczenia, nr 6 (84), Uniwersytet Szczeciński, Szczecin, cz.1., s.23-
34.
2. Chluska J. Polityka rachunkowości w zarządzaniu jednostkami sektora finansów
publicznych, Studia ekonomiczne. Zeszyty Naukowe Uniwersytetu Ekonomicznego w
Katowicach, nr 274, 2016, s. 36- 45.
3. Hońko S. (2013), Wycena w rachunkowości, znaczenie, podstawy, parametry i zasady,
Uniwersytet Szczeciński, Szczecin.
4. Komunikat nr 2 Ministra Finansów z dnia 29 marca 2012 r. w sprawie ogłoszenia uchwały
Komitetu Standardów Rachunkowości w sprawie przyjęcia znowelizowanego Krajowego
Standardu Rachunkowości Nr 4 „Utrata wartości aktywów”, Dz.Urz.MF z dnia 23 kwietnia
2012, poz. 15.
5. Nowak W.E., 2014, Rachunkowość sektora finansów publicznych jako rachunkowość
branżowa, Prace naukowe uniwersytetu Ekonomicznego we Wrocławiu, Branżowe
problemy rachunkowości i podatków, nr 373, Wrocław, s. 182- 194.
6. Rozporządzenie Ministra Rozwoju i Finansów z dnia 13 września 2017 r. w sprawie
rachunkowości oraz planów kont dla budżetu państwa, budżetów jednostek samorządu
terytorialnego, jednostek budżetowych, samorządowych zakładów budżetowych,
państwowych funduszy celowych oraz państwowych jednostek budżetowych mających
siedzibę poza granicami Rzeczypospolitej Polskiej, Dz.U z 2017 r., poz.1911, z póź. zm.
7. Rup P. (2017), Aspekty prawne i rachunkowe klasyfikacji oraz wyceny nieruchomości w
jednostkach sektora finansów publicznych, Państwo i Społeczeństwo, 2017 (XVII) nr 2, s.
89-110.
8. Uchwała nr 4/2017 Komitetu Standardów Rachunkowości z dnia 03.04.2017 r. w sprawie
przyjęcia Krajowego Standardu Rachunkowości nr 11 "Środki trwałe", Dz. Urz. MRiF z
2017 r. poz. 105.
9. Ustawa z dnia 15.02.1992 r. o podatku dochodowym od osób prawnych, tj. Dz. U. z 2019
r. poz. 865, z 2020 r. poz. 183
10. Ustawa z dnia 21 sierpnia 1997 r. o gospodarce nieruchomościami, Dz. U. z 2018 r. poz.
2204 i 2348 oraz z 2019 r. poz. 270, 492, 801.
11. Ustawa z dnia 27 sierpnia 2009 r. o finansach publicznych, t.j. Dz. U. z 2019 r. poz. 869,
1622, 1649, 2020.
12. Ustawa z dnia 29 sierpnia 1997 r. Ordynacja podatkowa, t.j. Dz. U. z 2019 r. poz. 900, 924,
1018, 1495, 1520, 1553, 1556, 1649, 1655, 1667, 1751, 1818, 1978, 2020, 2200.
13. Ustawa z dnia 29.09.1994 r. o rachunkowości, Dz. U. z 2019 r. poz. 351, tekst jednolity.
14. www1: Przeniesienie własności rzeczy lub praw w zamian za zaległe podatki - jak to
zaksięgować [ data dostępu: 11.02.2020]
51st International Scientific Conference on Economic and Social Development – Rabat, 26-27 March 2020
62
SECULAR RITUALS AND THEIR ECONOMIC EFFICIENCY
Alexandr Shmakov
Novosibirsk State University of Economics and Management,
Novosibirsk State Technical University
Novosibirsk, Russia
ABSTRACT
An approach to evaluating the effectiveness of secular rituals is outlined. First, the author
compares the approaches used in research literature to define the “ritual” term. The key
characteristics of ritual are revealed to give an original definition of “ritual”. An emphasis is
put on describing rituals as an element of secular culture. Then functions of rituals described
by sociologists are analyzed, studying which led to an assumption that all rituals are pragmatic
to a certain degree. Within the economic logic, these functions are reduced to the function of
decreasing transaction costs in person-to-person interaction. In the next section of the paper,
the concept of ritual efficiency is defined. The author builds on the idea that rituals facilitate
optimization of social relations by cutting transaction costs. As a result, additional wealth is
created. Ritual efficiency is defined through a ratio of transaction costs-cutting due to a
particular ritual to the costs of exercising and maintaining the ritual. The proposed
interpretation of ritual efficiency needs further clarification of transaction costs. The idea is to
break the structure of transaction costs into procedural and behavioral transaction costs.
Procedural transaction costs are regarded as the costs associated with the essence of the
procedures in a particular institutional environment required for establishing and protecting
property rights, as well as losses generated by violations of these procedures. Behavioral costs
are understood as the costs and losses arising during social-and-psychological adaptation of
participants of the relationships, formed to establish and protect property rights, to actions of
their partners and the conditions of an institutional environment, where those relationships
take place, as well as the costs of functioning of the institutions and organizations, designed to
create conditions for personal adaptation. A neo-institutional approach for classifying
transaction costs depending on a transaction nature is used for procedural transaction costs.
The author suggests that classification of behavioral transaction costs should be based on types
and forms of personal (individual) adjustment. Intra-personal (individual) and inter-personal
(person-to-person) behavioral transaction costs are delineated with a more detailed intra-
group breakdown.
Keywords: functions of rituals, ritual efficiency, rituals, transaction costs
1. INTRODUCTION
The development of the concept of social capital has led to the recognition of a number of socio-
psychological phenomena, including rituals of interpersonal interaction, as factors that
influence economic results. Given the ongoing changes to the code of ritual behavior, it seems
relevant to describe and evaluate its impact. It is necessary to develop a methodological
framework for evaluating the effectiveness of interpersonal interaction rituals.
The following tasks are expected to be solved during the research:
1. to identify the functions of interpersonal interaction rituals;
2. to form a concept of the effectiveness of interpersonal interaction rituals;
3. to clarify the composition of transaction costs.
51st International Scientific Conference on Economic and Social Development – Rabat, 26-27 March 2020
63
2. CONCEPT AND FUNCTIONS OF RITUALS
Based on the works of S. Silva (2013), R. Firth (1951), V. Fuchs-Heinritz (1978), J. and A.
Theodorson (1969), and others the following definition of ritual is suggested: a ritual is a
stereotypical sequence of symbolic actions performed in the course of social relationships that
is regulated by society and expresses certain social and cultural values. A ritual is traditionally
understood as a culturally determined set of standardized symbolic actions that express certain
values or problems of the group. In the past, rituals were primarily religious in nature. In the
modern world, the main focus is to consider rituals as a form of symbolic behavior that affects
the socialization processes (Radcliffe-Brown, 2001). Along with traditional rituals of religious
culture, there are modern rituals of secular social culture. Therefore, ritual behaviors can be
called general cultural universals (Garfinkel, 1967). Scientists recognize that rituals are
characterized by a certain level of pragmatism: utilitarian or symbolic (Baiburin, 1993; Vohs,
2013). Utilitarian pragmatics implies obtaining some utility by satisfying the need for material
goods, while sign pragmatics implies the need for symbolic forms. Moreover, the need for
symbolic forms can be no less significant (Toporov, 1988; Langer, 1956). It is symbolization
that is a means of ensuring the cooperation of efforts of a large number of individuals aimed to
solve the problems of the group. Through rituals, the group solves the most important tasks of
reproducing symbolic values (social institutions, traditions, statuses, etc.) (Malinowski, 1926).
Sociologists note the importance of using rituals in terms of creating conditions for sustainable,
effective functioning of groups. Based on the works of E. Durkheim (2018) the four main
functions of rituals were defined:
1. Function of individuals' socialization. Ritual actions contribute to the formation of the
qualities necessary for effective interaction within the group, facilitate the process of
socialization. Performing ritual actions teaches individuals to balance their interests with
the interests of the group, to control their behavior in accordance with the accepted
standards, to comply with the requirements of the team, to inhibit impulsive behavior,
leading to the standardization of external behaviour (Marett, 1914) and internalization of
sociocultural norms (Saringulian, 1968), thus facilitating the processes of social interaction
(Levkovich, 1970).
2. Integrated function. Performing ritual actions contributes to the building of a sense of
solidarity in the group, interconnectedness and unity among its members. The building of
solidarity helps to increase the effectiveness of communications, as well as the integration
of actions aimed at achieving the group's common goals. Stereotyped ritual actions make
the behavior of participants more familiar and predictable, and contribute to the
strengthening of collective ties (Abramyan, 1983; Rappaport, 1971).
3. The reproducing function. Ritual actions contribute to the fixation and reproduction of a
system of historically developed cultural values: maintaining a system of values,
institutions, traditions, and other rules of social organization in society. Rituals are used to
assign social roles to individuals when they are included in a group or to change their
statuses within these roles (initiation), and to maintain a hierarchy of social roles, statuses,
and values (Gluckman, 1964). The rules of social relationships are fixed (Etkin, 1963).
Performing rituals helps people to actualize and consolidate the experience of social
interaction and legitimize social norms (Jensen, 1963).
4. Psychotherapeutic function. Performance of rituals contributes to the maintenance of
psychological comfort in the group, the sublimation of mental stress. The sense of solidarity
and belonging, experienced during rituals, psychologically helps individuals to cope better
with crisis situations and preserve the unity of the team. The feeling of discomfort caused
by the need to adapt to changes is reduced (Rappaport, 1971; Lotman, 1987).
51st International Scientific Conference on Economic and Social Development – Rabat, 26-27 March 2020
64
Within the framework of economic logic, these four functions can be consolidated into the
function of reducing transaction costs in the process of group members' interaction.
Ritualization can be described as a group's response to a situation of uncertainty (Howe, 2000).
A high degree of uncertainty increases the transaction costs of interaction between group
members. As a response to perceived losses, a person develops an adaptive behavior strategy
aimed at eliminating a frustrating problem situation, which implies choosing or forming
behavior, agreeing with their role, and updating the necessary skills (Melnikov, 2014). One of
the strategies is to use rituals that reduce uncertainty.
3. EFFECTIVENESS OF RITUALS - TRANSACTION COSTS
The effectiveness of a ritual is determined by how much this ritual implements its functions
(Rudenkov, 2015). Since we were able to consolidate the functions of the ritual into a reduction
of transaction costs in the course the group members interaction, the effectiveness of the ritual
can be determined by the ratio of the savings in transaction costs as a result of the ritual to the
cost of implementing and maintaining the specified ritual. Rituals are effective, if by reducing
transaction costs they create additional wealth, which is distributed among the group members
in different ways. As an operational definition of transaction costs, we will use the following:
transaction costs are the costs of establishing and protecting property rights and freedoms
accepted in society (Tambovtsev, 1996). In the future, we will not distinguish freedoms from
the totality of property rights, since the freedoms being a full-fledged element of wealth can be
characterized as property in the economic interpretation. We suggest dividing the transaction
costs into: (1) procedural transaction costs, (2) behavioral transaction costs.
3.1. Procedural transaction costs
Procedural transaction costs are the costs associated with the need to implement procedures
provided by the institutional environment to establish and protect property rights, as well as
losses resulting from violations of these procedures. When classifying procedural transaction
costs, researchers, in most cases, start with the nature of the transactions through which the
transfer of property rights is carried out. Three types of transactions correspond to three groups
of transaction costs (Furubotn, 2005) (table. 1).
Table following on the next page

51st International Scientific Conference on Economic and Social Development – Rabat, 26-27 March 2020
65
Table 1: Groups of procedural transaction costs depending on the type of transaction Type of transaction Group of transaction costs
Transactions imply relationships
that arise as a result of a voluntary
agreement between equal parties
under the law.
Market transaction costs are the costs that arise when using a market
mechanism, that is, when carrying out transactions. These in turn
include:
a) search costs and information costs, which are related to the search
and transmission of information about sellers, buyers, prices, product
quality before the negotiation process, with the implementation of
communications by parties to the future exchange, as well as losses
caused by incomplete and imperfect information found;
b) costs of negotiating and making decisions, which are related to
negotiating, concluding and processing contracts, as well as losses
due to poorly concluded, poorly executed and unprotected
agreements;
c) costs of monitoring and ensuring the performance of contracts,
which arise from the need to monitor compliance with delivery dates,
to measure the quality and volume of delivered products and other
terms of the contract, the need to protect the rights and to ensure the
performance of the contract, as well as losses from the breach of
contracts.
Management transactions imply
voluntarily accepted by the
parties relationships of power and
subordination between the legal
levels of the hierarchy.
Management transaction costs are the costs that arise when
implementing relationships within hierarchical structures, that is,
when implementing management transactions. These include:
a) the cost of creating, maintaining, and changing organizational
design, which are related to the costs of personnel management,
information technology investments, anti-takeover protection, public
relations, and lobbying;
b) operating costs of the organization consisting of two parts: first,
information costs, which include the cost of making decisions,
monitoring the execution of orders, measuring employee
performance, agency costs, etc.; second, the costs of goods and
services physically crossing the borders of related industries, which
relate to the cost of intra-company transportation, downtime, etc.
Rationing transactions imply a
binding relationship of power and
subordination between parties of
unequal legal status.
Political transaction costs are the costs that arise during the operation
and adjustment of the institutional framework of the state structure,
that is, during the implementation of rationing transactions. These
include:
a) the costs of creating, maintaining and changing the formal and
informal political organization of the system that are related to the
costs of establishing the legal framework, administrative structure,
military, educational, judicial systems, etc.;
b) the costs of state structure operating, which are related to the costs
of implementing the functions of the state: provision of legislation,
justice, defense, transport, education, etc.
3.2. Behavioral transaction costs
Behavioral transaction costs are the costs and losses that arise during the socio-psychological
adaptation to the actions of parties involved in the relations of the property rights establishment
and protection, to the conditions of the institutional environment in which these relations are
carried out, as well as costs for the functioning of institutions and organizations designed to
create conditions for personal adaptation. The key in this definition is the concept of socio-
psychological adaptation of an individual – the process of acquiring a certain status by the
individual, mastering certain socio-psychological role functions (Naimushina, 2010). When
classifying behavioral transaction costs we will proceed from the type of adaptation of an
individual: internal or external (Ivanova, 2014) (table. 2).

51st International Scientific Conference on Economic and Social Development – Rabat, 26-27 March 2020
66
Table 2: Groups of behavioral transaction costs depending on the type of adaptability Type of adaptability Group of transaction costs
Internal adaptability is a complete
adaptation of a personality in which
there is a restructuring of functional
systems of the personality.
Intrapersonal (individual) costs are the costs and losses that arise during
the psychological adaptation to the actions of parties involved in
relations of the property rights establishment and protection and to the
conditions of the institutional environment in which these relations are
carried out. These include: a) costs associated with assuming a social role;
b) costs of updating the skills required to match the social role;
c) losses associated with the possible suffering, arising in the course of
interactions with the external environment;
d) the cost of protection against possible losses specified in the
paragraph (b).
External adaptation is the adaptation
of an individual to the environment
in which there is no significant
alteration of the functional structures
and systems of the individual.
Interpersonal costs are the costs and losses arising in the course of
social adaptation to the actions of parties involved in the relations of
the property rights establishment and protection, to the conditions of the
institutional environment in which these relations are carried out, as
well as costs for the functioning of institutions and organizations
designed to create conditions for personal adaptation. These include:
(I) Costs of individual adaptation: a) the costs of conformity are losses associated with compliance with
restrictions, reducing the flexibility of the system of public relations,
the loss by society of the basis for the adaption to changing conditions;
b) the costs of innovative adaptation are the costs of protection from
opportunistic behaviour and losses from opportunistic behaviour, losses
from the reducing level of trust, losses resulting from unreasonable
risks, losses from deformation of the motivation system, etc.;
c) the costs of ritualism are the costs of taking precautionary measures,
protecting against risks associated with competition, opportunistic
behaviour, etc., losses from compliance with restrictions, reducing
business activity, and other initiatives; d) the costs of retreatism are the losses from reducing the flexibility of
the system of public relations, opportunistic behaviour, reducing the
level of trust, deforming the system of motivation, reducing business
activity, the cost of protection from opportunistic behaviour, the
maintenance of unproductive population and the fight against this form
of social adaptation;
e) the costs of rebellion are the costs of formulating and consolidating
ideas about the existing and alternative social reality, changing the old
ones, forming and maintaining new social orders.
(II) The costs of operating institutions and organizations designed to
create conditions for individual adaptation that balance the sustainability and development of the institutional environment:
a) the costs of formulating ideas about social reality;
b) costs of developing and maintaining public practices.
One of the manifestations of internal adaptability is the formation of intrapersonal behavioral
transaction costs – costs and losses that arise during the psychological adaptation to the actions
of parties involved in relations of the property rights establishment and protection and to the
conditions of the institutional environment in which these relations are carried out.
Intrapersonal behavioral transaction costs can be interpreted as the cost of an individual's
restructuring (accepting a social role, updating the required skills) in accordance with the
requirements of the external environment, as well as losses associated with suffering arising
during interactions with the external environment. It is proposed to distinguish the following
groups of interpersonal behavioural costs: the costs associated with the acceptance of a social
role; the costs of updating the skills required to match this social role; the losses associated with
possible suffering that occurs during interactions with the external environment; the costs of
51st International Scientific Conference on Economic and Social Development – Rabat, 26-27 March 2020
67
preventing these losses. External adaptation is associated with the formation of interpersonal
behavioural transaction costs – costs and losses that arise during the social adaptation to the
actions of parties involved in the relations of the property rights establishment and protection,
to the conditions of the institutional environment in which these relations are carried out, as
well as costs for the functioning of institutions and organizations designed to create conditions
for personal adaptation. When classifying this type of transaction costs, we will start with the
typology of forms of individual adaptation by R. Merton (Merton, 2006). Merton identified five
forms of individual adaptation: conformity, innovation, ritualism, retreatism, and rebellion.
Conformity is a form of individual adjustment in which an individual changes their behavior or
opinion under the influence of society. Transaction costs associated with this form of individual
adaptation are expressed primarily in losses caused by the reduced flexibility in the system of public
relations; in losses associated with tight restrictions on alternative ways of behaviour. The
predominance of this form of adaptation guarantees temporary social stability, but it is a barrier to
innovation and leads to the loss by society the basis for the adaption to changing conditions.
Innovation is a form of individual adaptation in which an individual uses institutionally prohibited but
effective means to achieve their cultural goals. As a result, the use of this form of adaptation increases
transaction costs associated with opportunistic behaviour. As a result of abuse of trust, its level
decreases, which leads to losses associated with the difficulty of cooperation and the need to spend
additional efforts to protect against opportunistic behaviour. Willingness to take risks is associated
with losses that occur when this risk is not economically justified. As people's individual
achievements are no longer linked to their strengths and efforts, individuals tend to lean on network
connections (netopism), and there is a ground for the development of superstitions, belief in chance,
luck, which undermines the motivation to make efforts aimed to achieve success by institutionalized
means (Bakke, 1934). Ritualism is a form of individual adjustment in which an individual rejects
or reduces the value of cultural goals to the level at which these goals can be met, while
continuing to persistently observe institutional norms. This form of adaptation is characterized
by a high level of distrust, since external threats are felt acutely, and there is a need of protection
against all sorts of risks, including the risk of opportunistic behaviour. The level of
entrepreneurial activity and other initiatives decreases because people prefer to perform routine,
relatively safe actions, the level of risk falls below the optimum level, and the cost of taking
precautionary measures increases above the optimum level. Retreatism is a form of individual
adjustment in which the individual rejects both the cultural goals of society and the acceptable
institutional means of achieving them. This form of individual adaptation is associated with the
main groups of transaction costs described earlier. As in the case of conformity, there is no
desire for innovative activity, which means that there are losses from reduced flexibility in the
system of public relations. The individual does not recognize the cultural values of society, does
not strive for success, therefore, similar to ritualism, the level of entrepreneurial initiatives
decreases, the level of trust decreases, there are difficulties with cooperation, which also leads
the growth of transaction costs. The individual ignores institutional practices, hence, as in the
case of innovation, the transaction costs of opportunistic behaviour increase. Moreover, the
retreating individual becomes an unproductive ballast for society, and society spends resources
on the prosecution of individuals who have chosen this form of adaptation. Rebellion is a form
of individual adjustment in which the individual not only rejects the cultural goals of society
and the prescribed institutional means of achieving them, but also proposes an alternative to
them. The use of this form of individual adaptation is associated with the costs of demonstrating
the source of large-scale frustrations in the social structure, the costs of finding alternatives to
the existing social structure that meets public expectations, the costs of forming and
consolidating ideas about the existing and alternative social reality, the costs of changing the
old, formulating and maintaining new social orders. It should not be forgotten that in order to
maintain any existing social order, it is necessary to bear the transaction costs associated with

51st International Scientific Conference on Economic and Social Development – Rabat, 26-27 March 2020
68
the functioning of institutions and organizations designed to create conditions for the
implementation of preferable forms of the individual's adaptation, providing the required
balance between the stability and development of the institutional environment. The existence
of a political system that provides the desired level of conformity requires expenses related both
to formulation of desired ideas about social reality, and to building and maintaining certain
social orders. The costs incurred by the individual, and associated with compliance with
institutional norms must be compensated by certain socialized rewards. The distribution of
social statuses within the established order should be organized in such a way as to create
incentives for maintaining status obligations. The above-mentioned factors are related to
transaction costs, the alternative of which is the manifestation of aberrant behavior, erosion of
institutional norms, and anomie (Marshall, 2002).
4. CONCLUSION
Rituals are characterized by a certain degree of pragmatism: utilitarian or symbolic.
Sociologists distinguish four main functions of rituals: the socialization function of individuals,
integrating function, reproducing function, and psychotherapeutic function. Within the
framework of economic logic, these functions can be consolidated into the function of reducing
transaction costs in the process of group members' interaction. Rituals are effective, if by
reducing transaction costs they create additional wealth, which is distributed among the group
members in different ways. If we were able to consolidate the functions of the ritual into a
reduction of transaction costs in the course the group members interaction, the effectiveness of
the ritual can be determined by the ratio of the savings in transaction costs as a result of the
ritual to the cost of implementing and maintaining the specified ritual. Transaction costs are the
costs of establishing and protecting property rights and freedoms accepted in the society. The
structure of transaction costs includes procedural transaction costs and behavioural transaction
costs. Procedural transaction costs are the costs associated with the need to implement
procedures provided by the institutional environment to establish and protect property rights,
as well as losses resulting from violations of these procedures. Behavioural transaction costs
are the costs and losses that arise during the socio-psychological adaptation to the actions of
parties involved in the relations of the property rights establishment and protection, to the
conditions of the institutional environment in which these relations are carried out, as well as
costs for the functioning of institutions and organizations designed to create conditions for
personal adaptation.
LITERATURE:
1. Abramyan, L. A. (1983). Primitive celebration and mythology [Pervobytnyi prazdnik i
mifologiia] Yerevan, 231 p.
2. Bakke, E. W. (1934). The Unemployed Man. New York.
3. Durkheim, E. (2018). Elementary forms of religious life: the totemic system in Australia
Trans. from Eng. [Elementarnye formy religioznoi zhizni: totemicheskaia sistema v
Avstralii] Moscow: Delo publishing house, RANEPA, 736 p.
4. Etkin, W. (1964). Theories of socialization and communication In Etkin, W. Social
behavior and evolution among the vertebrates. Chicago, pp.167-205.
5. Firth, R. (1951). Elements of social organization. London, 258 p.
6. Fuchs-Heinritz, W. (1978). Lexikon zur Soziologie. Opiaden: Westdeutscher Verlag.
7. Furubotn, E., Richter, R. (2005). Institutions and Economic Theory: The Contribution of
the New Institutional Economics. Trans. from Eng. [Instituty i ekonomicheskaya teoriya:
Dostizhenie novoi institutsionalnoi ekonomicheskoi teorii] S.Petersburg, Publishing House
of St. Petersburg State University, 702 p.
8. Garfinkel, H. (1967). Studies in Ethnomethodology. Englewood Cliff, New Jersey.
51st International Scientific Conference on Economic and Social Development – Rabat, 26-27 March 2020
69
9. Gluckman, M. (1964). Closed systems and open minds. Edinburgh: London.
10. Howe, L. (2000). Risk, Ritual and Performance. The Journal of the Royal
Anthropological Institute, 2000 (No. 1), pp. 63-79.
11. Ivanova, A. I. (2014). Social and psychological adaptation: classification and mechanisms
[Sotsialno-psikhologicheskaya adaptatsiya: klassifikatsiia i mekhanizmy] Vestnik
Universiteta (Bulletin of the University) (No. 9), pp. 255-259.
12. Jensen A. E. (1963). Myth and cult among primitive peoples. Chicago.
13. Langer S. K. (1956). Philoeophie in a new key: A study in the symbolism of reason, rite and
art. New York.
14. Levkovich, V. L. (1970). Customs and rituals and their role in improving family relations
[Obychai i obriady i ikh rol v sovershenstvovanii semeinykh otnoshenii] Moscow, pp. 69-
89.
15. Lotman, Yu. (1987). A few thoughts on the typology of culture [Neskolko myslei o tipologii
kultury] In Uspenskiy B.A. Yazyki kultury i problemy perevodimosti: monografiya
(Languages of culture and problems of translatability: the monograph) Moscow, 256 p.
16. Malinowski, B. (1926). Myth in primitive psychology. London.
17. Marett, R. R. (1914). The threshold of religion. London.
18. Marshall, D. (2002). Behavior, Belonging, and Belief: A Theory of Ritual Practice.
Sociological Theory, 2002 (No. 3), pp. 360-380.
19. Melnikov, V. V. (2011). Non-competitive behavior as a factor of transaction costs
[Nekonkurenstnost povedeniia kak faktor transaktsionnykh izderzhek] Terra Economicus,
(No. 4), pp. 23-37.
20. Merton, R. (2006). Social theory and social structure Trans. from Eng. [Sotsialnaya teoriya
i sotsialnaya struktura] Moscow: Khranitel, 873 p.
21. Naimushina, A. G. (2010). Psychophysiological mechanisms of ecological adaptation
[Psikhofiziologicheskie mekhanizmy ekologicheskoi adaptatsii] Fundamentalnye
issledovaniya (Fundamental research) (No. 6), pp. 76-81.
22. Radcliffe-Brown, A. R. (2001). Structure and function in primitive society. Essays and
lectures Trans. from Eng. [Struktura i funktsiya v primitivnom obshchestve. Ocherki i
lektsii] Moscow: Eastern Literature publishing company of the Russian Academy of
Sciences, 304 p.
23. Rappaport, R. (1971). Ritual, sanctity and cybernetics. American Anthropologist, 1971 (No.
73(1)), pp. 59-76.
24. Rudenkov, I. A. (2015). Economic evaluation of institutions: assessment and factors
[Ekonomicheskaya otsenka institutov: otsenka i faktory] Retrieved from:
http://www.bsu.by/Cache/pdf/389863.pdf.
25. Saringulyan, K. S. (1986). Culture and regulation of activities [Kultura i regulyatsiya
deyatelnosti] Yerevan, 156 p.
26. Silva, S. (2013). Remarks on Similarity in Ritual Classification: Affliction, Divination and
Object Animation. History of Religions, 2013 (No. 2), pp.151-169.
27. Tambovtsev V.L. (1996). Textbook under the editorship of Tambovtsev V.L. Moscow:
Economic Department Moscow state University, 171 p.
28. Theodorson, G., and Theodorson, A. A. (1969). Modem dictionary of sociology. New York:
Crowell Company.
29. Toporov, V. N. (1988). About the ritual: introduction to the concept [O rituale: vvedenie v
problematiku] Arkhaicheskii ritual v folklornykh i ranneliteraturnykh pamyatnikakh
(Archaic ritual in folklore and early literary monuments) Moscow, pp. 7-60.
30. Vohs, K., Wang, Y, Gino, F., Norton, M. (2013). Rituals Enhance Consumption.
Psychological Science, 2013 (No. 9), pp.1714-1721.
51st International Scientific Conference on Economic and Social Development – Rabat, 26-27 March 2020
70
REGIONAL ASPECTS OF 2024 NATIONAL PROJECTS ON
STRATEGIC DEVELOPMENT IN RUSSIA
Anatoly Pleslov
Novosibirsk State University of Economics and Management
Novosibirsk, Russia
Olga Lukashenko
Novosibirsk State University of Economics and Management
Novosibirsk, Russia
ABSTRACT
The priority goals and objectives at the regional level under the frame of the National Projects
for strategic development of the Russian Federation till 2024 are analyzed. Project milestones
in performance assessment of top officials as well as regional authorities of the Russian
Federation in the course of executing the National Projects are reviewed, particularly, through
a focus on development of industrial parks with use of regional resources and the existing
institutional tools for their establishment and operation. The study findings will be valuable for
senior officials as well as specialists in public administration over regional economies.
Keywords: industrial parks, industrial policy, institutional tools, national projects,
performance indicators, points of economic growth, strategic development
1. INTRODUCTION
No.204 Order of the President of the Russian Federation signed in May 2018 outlined the main
strategic goals of development of Russia till 2024 and specified the directions for achieving the
set goals in the form of the 12 National Projects that should be shaped by the RF Government
in collaboration with the regional authorities. The focal areas of further development of the
Russian Federation include demographics and healthcare, education and culture, science and
digital economy, improvements in the environment and urban milieu, construction of residential
housing and motor roads, boosting labour productivity, supporting employment and small and
medium business, international cooperation and export, etc. [2]. The current of events has
shown, though, that the authorities at all levels are not ready to address the tasks set by the
President both in terms of their direct involvement in devising the National Projects within the
deadlines and organizational and administrative support for the Projects. On a date, which is of
special symbolic significance for Russia – the 9 May, the State Council held a designated
meeting in 2019 where the RF President summed up the intermediary progress in fulfilling the
National Projects and highlighted the absence of crucial achievements in the past year with a
visible positive effect upon the domestic economy and the quality of live of the population [5].
Absence of visible results, in this case, can be interpreted as evidence of systemic problems in
management over social-and economic development on the national and regional scales.
Systemic integrated efforts of the authorities at all levels towards fulfilling the National Projects
are currently being mainstreamed, putting a special emphasis upon the role of the regional
authorities and personal responsibility of the regional leaders. In this context, the main areas of
efforts must be identified at the regional level of power that would enable comprehensive
solving of social-and economic development goals for regions under the frame of the National
Projects, based on which an objective, nonpartisan performance assessment of the work of the
regional leaders will be possible.
51st International Scientific Conference on Economic and Social Development – Rabat, 26-27 March 2020
71
2. GOAL-SETTING BY THE REGIONAL AUTHORITIES TO FULFILL THE
NATIONAL PROJECTS FOR STRATEGIC DEVELOPMENT OF RUSSIA TILL 2024
Expectations to Heads of the regions are strengthened upon No.193 Order of the Russian
President of 25.04.2019 on performance assessment of the Heads of the subjects of the Russian
Federation [3]. This act abolished No. 548 Order of the President of Russia that had set 24 target
values, only indirectly reflecting the objectives of the National Projects. Instead, the new No.
193 Order specifies 15 targets for personal assessment of the work of the regional Heads: the
level of confidence in the authorities; the number of high-performance jobs in the private sector;
the number of small and medium businesses and individual entrepreneurs; labour productivity
in the non-resource-based sector; the level of salaries and wages; the scope of investments in
fixed capital (except federal projects); the poverty level; life expectancy at birth; natural
population growth; the number of families whose housing conditions improved; housing
affordability and access; the share of towns with favourable milieu; the quality of the
environment; the level of education; the share of regional highways that meet the established
standards. Even a rather sketchy comparative analysis of the main 12 directions of the National
Projects and the above-listed 15 estimated targets leads to a conclusion that 12 targets clearly
match the National Projects and the remaining three are integrated assessment values as
demonstrated in Table 1, compiled on the basis of the data taken from the official web-site of
the President of Russia [5].
Table following on the next page
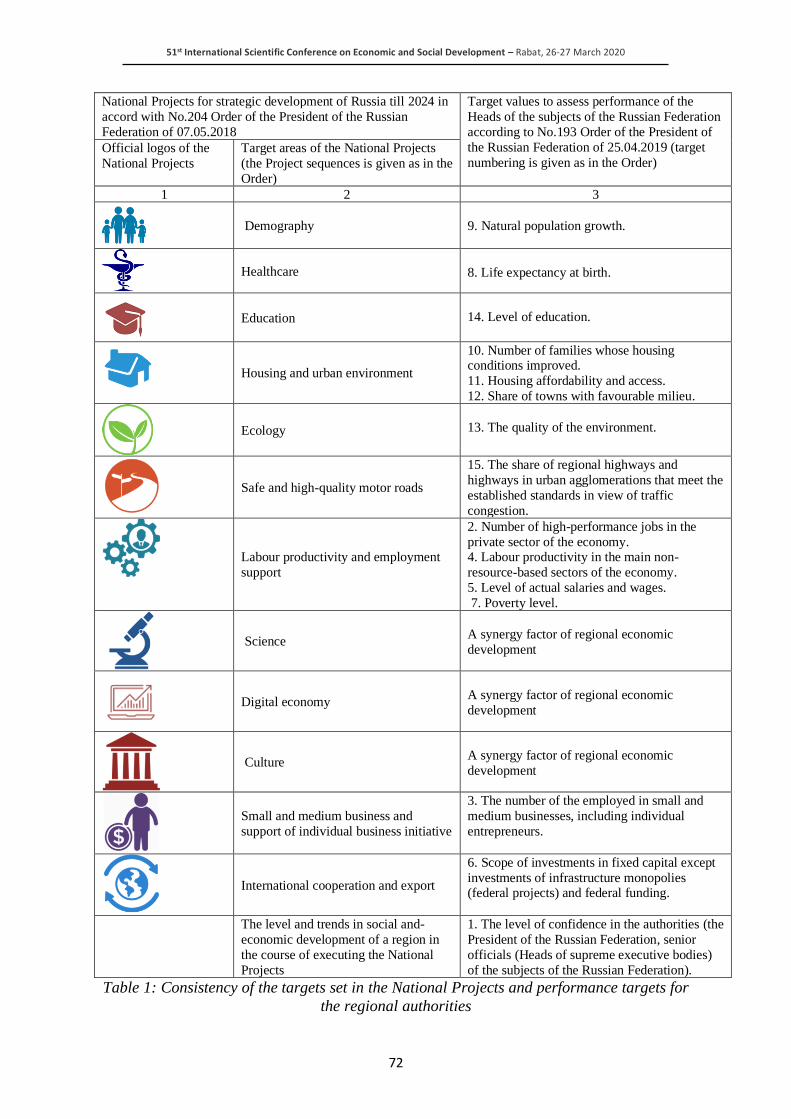
51st International Scientific Conference on Economic and Social Development – Rabat, 26-27 March 2020
72
National Projects for strategic development of Russia till 2024 in
accord with No.204 Order of the President of the Russian
Federation of 07.05.2018
Target values to assess performance of the
Heads of the subjects of the Russian Federation
according to No.193 Order of the President of
the Russian Federation of 25.04.2019 (target
numbering is given as in the Order) Official logos of the
National Projects
Target areas of the National Projects
(the Project sequences is given as in the
Order)
1 2 3
Demography
9. Natural population growth.
Healthcare
8. Life expectancy at birth.
Education
14. Level of education.
Housing and urban environment
10. Number of families whose housing conditions improved.
11. Housing affordability and access.
12. Share of towns with favourable milieu.
Ecology
13. The quality of the environment.
Safe and high-quality motor roads
15. The share of regional highways and
highways in urban agglomerations that meet the
established standards in view of traffic
congestion.
Labour productivity and employment
support
2. Number of high-performance jobs in the
private sector of the economy. 4. Labour productivity in the main non-
resource-based sectors of the economy.
5. Level of actual salaries and wages.
7. Poverty level.
Science
A synergy factor of regional economic
development
Digital economy
A synergy factor of regional economic
development
Culture
A synergy factor of regional economic
development
Small and medium business and
support of individual business initiative
3. The number of the employed in small and
medium businesses, including individual
entrepreneurs.
International cooperation and export
6. Scope of investments in fixed capital except
investments of infrastructure monopolies (federal projects) and federal funding.
The level and trends in social and-
economic development of a region in
the course of executing the National
Projects
1. The level of confidence in the authorities (the
President of the Russian Federation, senior
officials (Heads of supreme executive bodies)
of the subjects of the Russian Federation).
Table 1: Consistency of the targets set in the National Projects and performance targets for
the regional authorities
51st International Scientific Conference on Economic and Social Development – Rabat, 26-27 March 2020
73
Commenting on No. 193 Order, some experts try to shift the discussions from the economic to
the social realm, interpreting the Order as an attempt to shuffle off the responsibility for
executing the National Projects from senior federal officials to Heads of the regions [9]. This
destructive position has no objective grounds. In the past two years indeed there have been
intensive replacements in the pool of Governors when 48 out of 85 Heads of the regions
assumed office in 2018 – 2019. No less significant staff changes have been taking place in the
federal government bodies, culminating in the resignation of the Cabinet on 15 January 2020.
The Government Cabinet was approved by the President on 21 January and soon the new Prime-
Minister Mikhail Mishustin confirmed, as also did most Governors acceding to the office, that
the main objective of the Cabinet is to fulfill the National Projects, undertaking personal
responsibility by the Cabinet ministers for the outcome. Thus, an executive chain of command
is being actively shaped across Russia on the basis of personal responsibility for achieving the
national targets and addressing the strategic tasks for developing the Russian Federation till
2024, as specified in No.204 Order of the President of the Russian Federation of 07.05.2018.
No. 193 Order certainly formalizes personal responsibility of the regional leaders for achieving
particular target values of the National Projects and consolidates their efforts in consistence
with the federal authorities. It is an obvious positive result of an institutional impact upon the
system of public administration with the purposes of carrying out a unified social-and-economic
policy across the entire territory of the Russian Federation. The Order effectively lists the
priority values to be achieved at the regional level under the frame of fulfilling the National
Projects, and at the same time the responsibility zones between the federal and regional
authorities are delineated. Social-and-economic development of Russia till 2024 is undoubtedly
a continuation of 2012 - 2020 National Development Strategy based on 11 so-called “May”
Orders of the President of the Russian Federation issued in 2012. Still, this is a new, ascending
stage of evolution in the development strategy of Russia in general and each region in particular.
It can be demonstrated through a comparison of the goals and objectives of the National Projects
and the 2012 May Orders as summarized in Table 2.
Table following on the next page
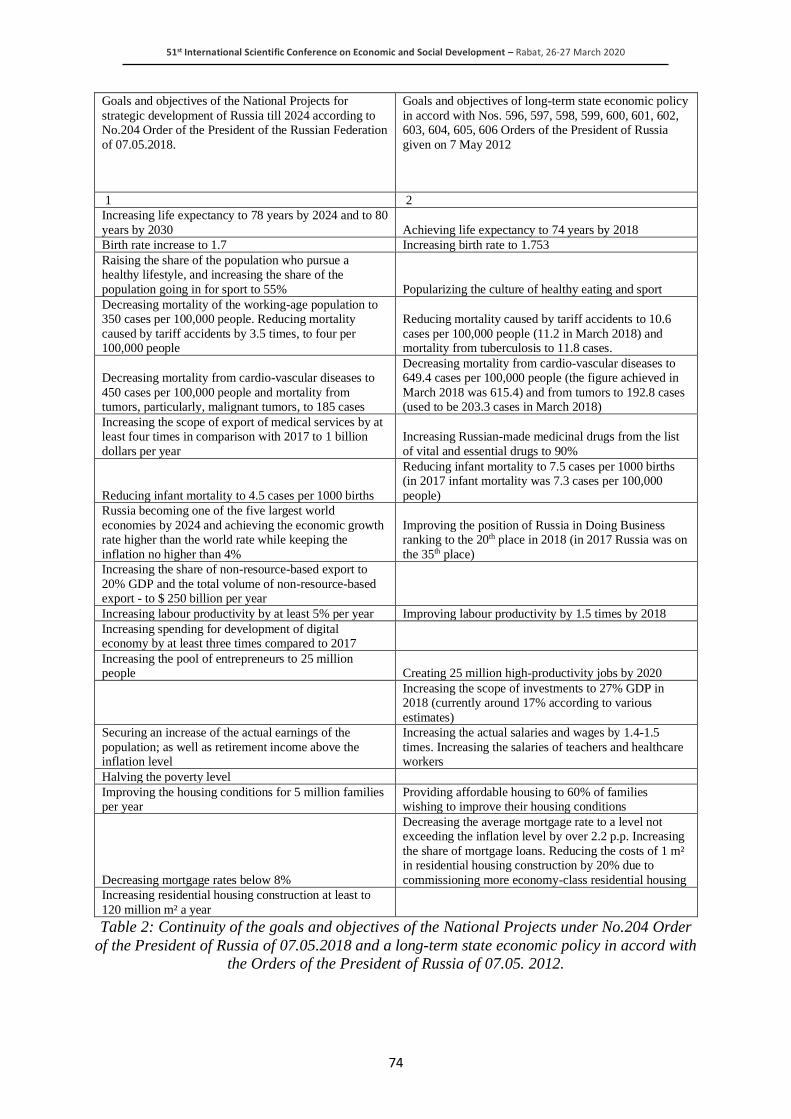
51st International Scientific Conference on Economic and Social Development – Rabat, 26-27 March 2020
74
Goals and objectives of the National Projects for
strategic development of Russia till 2024 according to No.204 Order of the President of the Russian Federation
of 07.05.2018.
Goals and objectives of long-term state economic policy
in accord with Nos. 596, 597, 598, 599, 600, 601, 602, 603, 604, 605, 606 Orders of the President of Russia
given on 7 May 2012
1 2
Increasing life expectancy to 78 years by 2024 and to 80
years by 2030 Achieving life expectancy to 74 years by 2018
Birth rate increase to 1.7 Increasing birth rate to 1.753
Raising the share of the population who pursue a healthy lifestyle, and increasing the share of the
population going in for sport to 55% Popularizing the culture of healthy eating and sport
Decreasing mortality of the working-age population to 350 cases per 100,000 people. Reducing mortality
caused by tariff accidents by 3.5 times, to four per 100,000 people
Reducing mortality caused by tariff accidents to 10.6
cases per 100,000 people (11.2 in March 2018) and mortality from tuberculosis to 11.8 cases.
Decreasing mortality from cardio-vascular diseases to
450 cases per 100,000 people and mortality from tumors, particularly, malignant tumors, to 185 cases
Decreasing mortality from cardio-vascular diseases to 649.4 cases per 100,000 people (the figure achieved in
March 2018 was 615.4) and from tumors to 192.8 cases (used to be 203.3 cases in March 2018)
Increasing the scope of export of medical services by at least four times in comparison with 2017 to 1 billion
dollars per year
Increasing Russian-made medicinal drugs from the list
of vital and essential drugs to 90%
Reducing infant mortality to 4.5 cases per 1000 births
Reducing infant mortality to 7.5 cases per 1000 births (in 2017 infant mortality was 7.3 cases per 100,000
people)
Russia becoming one of the five largest world
economies by 2024 and achieving the economic growth rate higher than the world rate while keeping the
inflation no higher than 4%
Improving the position of Russia in Doing Business ranking to the 20th place in 2018 (in 2017 Russia was on
the 35th place)
Increasing the share of non-resource-based export to
20% GDP and the total volume of non-resource-based export - to $ 250 billion per year
Increasing labour productivity by at least 5% per year Improving labour productivity by 1.5 times by 2018
Increasing spending for development of digital economy by at least three times compared to 2017
Increasing the pool of entrepreneurs to 25 million people Creating 25 million high-productivity jobs by 2020
Increasing the scope of investments to 27% GDP in 2018 (currently around 17% according to various
estimates)
Securing an increase of the actual earnings of the
population; as well as retirement income above the inflation level
Increasing the actual salaries and wages by 1.4-1.5
times. Increasing the salaries of teachers and healthcare workers
Halving the poverty level
Improving the housing conditions for 5 million families per year
Providing affordable housing to 60% of families wishing to improve their housing conditions
Decreasing mortgage rates below 8%
Decreasing the average mortgage rate to a level not exceeding the inflation level by over 2.2 p.p. Increasing
the share of mortgage loans. Reducing the costs of 1 m² in residential housing construction by 20% due to
commissioning more economy-class residential housing
Increasing residential housing construction at least to
120 million m² a year
Table 2: Continuity of the goals and objectives of the National Projects under No.204 Order
of the President of Russia of 07.05.2018 and a long-term state economic policy in accord with
the Orders of the President of Russia of 07.05. 2012.
51st International Scientific Conference on Economic and Social Development – Rabat, 26-27 March 2020
75
Another important aspect of successful execution of the National Projects is their inseparable
connection with fulfilling the National Plan for Developing Competition in Russia. 2018 – 2020
National Plan was approved by № 618 Order of the President of the Russian Federation of
21.12.2017 [12]; its ultimate objective is to increase consumer satisfaction, economic efficiency
and competitiveness, facilitate sustainable growth and development of mixed economy.
According to the standpoint taken by President of Russia Vladimir Putin, violating the
antimonopoly law is a gross offence comparable to treason. Restricting competition incurs
colossal damages to the economy and without solving the problems in this sphere Russia will
not be able to move forward [13]. The National Plan and the National Projects have common
goals on economic development and sustainable growth and cannot be efficiently fulfilled
separately from each other so intergration of the Plan and the Projects is the paramount priority.
The synergy of the two strategic documents will enable to reach the goals in the field of
increasing economic growth, improving the quality of life and well-being of the population.
Otherwise, possible adverse resulst will include continued futile spending of budgetary funds
and increasing the scope of state assets in the economy. Integration means, first of all, that
measures specified in a national project fall under strict control of a body responsible for the
National Competition Development Plan – the Federal Antimonopoly Service (FAS Russia).
From the regional prospective, it translated in robust FAS efforts to start the ball rolling at the
regional level. FAS has entered into Agreements on Cooperation in the field of competition
with all subjects of the Russian Federation; FAS senior officers at the level of Deputy Head of
FAS visited all regions twice in 1.5 years to draw and approve regional competition
development programmes. Under the frame of the Agreements on Cooperation with regions,
FAS, with involvement of its regional Offices, has drafted the Guidelines on Road Maps that
contain an approximate list of measures, which can be expanded by regions. FAS further
provides support in drafting Road Maps on competition development and approves them. So
far, FAS has received 82 Road Maps for approval, most of which are already considered and
more than one third of the Road Maps are approved. At the same time, doing this work, FAS
summarizes the best practices that will be recommended for use to all regions of Russia. Each
region has selected 33 markets from the list compiled by FAS as the prime targets for
developing competition in a particular region, with a possibility to add some other markets
depending on a regional specifics and determine the indicators to measure the success rate of
competition development in a segment. Action Plans must be drafted for each selected segment.
So far, Russian regions have been actively involved in this work – 100% regions have approved
the key competition development targets and made amendments to the regulations on regional
executive bodies, in terms of antimonopoly comapliance. Road Maps for developing
competition across regions are being mainstreamed. Regional Action Plans aimed at fulfilling
the National Projects must be submitted to FAS for further analysis. It is helpful in exposing
shortcomings in public procedures and elements of cartels associated with the National Projects.
For example, preliminary results of analyzing regional Action Plans aimed at fulfilling the
National Projects show in some cases avoidance of competitive procedures in procurement,
violations in granting subsidies and concluding prohibited agreements. The general targets of
the National Plan includes halving antimonopoly violations by the authorities (which account
for nearly 50% of all antimonopoly violations committed in the Russian Federation), particular
regional executive bodies, by 2020; doubling the share of procurement by small and medium
companies in regions by 2020; and curtailing presence of state and municipal unitary enterprises
on competitive markets. The interim achievements at a new stage of the pro-competitive policy
in Russia (2018) are quite consistent: antimonopoly violations by the authorities decreased by
14%, the share of small and medium business in public procurement reached 29.7% (the target
set for 2020 is 31%), and the share of procurement by particular types of legal entities from
small and medium business is 12.1% (the target to be achieved by 2020 is 18%).

51st International Scientific Conference on Economic and Social Development – Rabat, 26-27 March 2020
76
At the same time, 6 867 unitary enterprises were registered in Russia as of 1 January 2019,
which is 49% more in comparison with 1 January 2013. More than one third (38%) of such
enterprises operate in sectors with developed competition such as real estate, lease, commerce.
Overall, operations of unitary enterprises on competitive markets are not transparent which can
lead to abusing and unreasonable monopolization, having, therefore, a strong adverse effect on
competition. The relevant law banning unitary entprises on competitive amrkets is finally
passed in the third reading by the parliament (December 2019) and a transitional period is set
until 2025. Antimonopoly compliance is another important tool for efficient deterrence of
adverse trends, particularly, at the level of municipalities. It implies adopting an in-house
system of conformity to fair competition rules by regional market players and regional
authorities to avoid high economic and reputational risks associated with breaching
antimonopoly regulations. Since even the tightest policy of regulators cannot fully elimitate
violations of the law, and it inevitably raises the regulators’ costs upon the society, it is essential
that participants of economic operations independently suppress and rpevent violations, using
tools of inner control. So far, all executive bodies have adopted antimonopoly compliance
systems and are currently refining them and learning how to employ them efficiently. Due to
interim achievements of the targets set in the first National Plan, FAS, together with “OPORA
Russia”, a national NGO of small business and entrepreneurs, FAS is drafting a new, 2021-
2025 National Competition Development Plan (the deadline is 1 April 2020). The main focus
of the new Plan will be to create conditions for increasing the number of small and medium
companies, and people employed in this sector of the economy, guarantee a possibility for small
and medium business to operate on competitive markets. Summing up, fulfillment of the
National Projects at the regional level requires an in-depth, critical analysis of the entire efforts
undertaken in the previous development period and continuation of successful projects in each
particular region. Success can be reached only through rational use of not only targeted federal
resources but also the resources available in the regions. It means, first of all, independent
search of available resources at the regional level to meet the target values.
3. THE KEY TASKS AND TOOLS OF A REGIONAL POLICY OF ECONOMIC
GROWTH
The policy of development is a leading function of the regional authorities and comprises
research-and-engineering, educational, industrial, investment and foreign trade elements.
Currently, the policy of development is formulated as a totality of interrelated National Projects
of strategic development of Russia till 2024. Under the existing conditions, reaching a trajectory
of a sustainable growth of the regional economy and the level of life of the population is possible
only on the basis of concentrating the available resources in the breakthrough directions of the
policy of development. All 85 regions of the Russian Federation have different resource bases;
however, each of them possesses its own unique set of capabilities typical for Russia in general.
According to Sergey Glaziev, a member of the Russian Academy of Sciences, it concerns, first
of all:
• High level of education of the population and spiritual traditions, steering the local
population towards productive and creative work, social justice and partnership, personal
self-fulfillment in the interests of the society;
• Developed research-and-engineering potential, presence of mature engineering-and-
manufacturing structures in some sectors under the modern and contemporary technological
paradigms;
• Large-scale, free production capacities in the manufacturing sector enabling to promptly
increase fabrication of products with high-added value;
• Rich natural resources covering the most part of internal needs in raw materials and energy
carriers.

51st International Scientific Conference on Economic and Social Development – Rabat, 26-27 March 2020
77
At the same time, an essential administrative target is the ability of the Heads of regions to
employ the options and institutional tools enabling to find comprehensive solutions in regional
development. Nearly all target values for personal assessment of performance of regional
leaders depend directly or indirectly on the outcome of the regional industrial policy under the
frame of No.488-FZ Federal Law “On industrial policy in the Russian Federation”, which sets
the goals, particularly, to provide employment and enhance the level of life of the population
[1]. The Law spells out all parameters of the industrial policy and such forms of regional
development of the manufacturing sector as industrial parks and industrial clusters. These forms
of production organization have become the mainstream in the world practice and proved to be
efficient. Industrial parks originated in the UK at the end of the XIX c. The lands owned by the
state or farmers were classified under the commercial grade due to development of industrial
production and typically were subsequently added to the confines of towns. From the beginning
of the XX c., industrial zones / estates were equipped with appropriate communications
infrastructures, and private developers have been in charge of their further upgrowth. Later, the
UK experience was extrapolated to the US, Canada and Western Europe. Nowadays, there are
more than 20,000 industrial parks in 90 countries all over the world. According to a generally
accepted international classification, there are two types of industrial parks depending on
characteristics of a particular site: “greenfield” and “brownfield”. The same principle is
formalized in the Russian National Standard GOST R 56301 – 2014 “Industrial Parks.
Requirements”, which clearly formulates that “greenfield” industrial parks are established on
previously underdeveloped real estates, typically, without any utilities and transport
infrastructure at the time of commissioning a project, while brownfield industrial parks are built
on the basis of earlier existing enterprises or production facilities, and equipped with utilities
and transport infrastructure, that usually were and / or are under reconstruction and (or) capital
repair. Institutional factors, robustly burgeoning since 2012, shape a framework of government
guarantees to support establishing and functioning of industrial parks. For instance, the
“Industrial Park Standard” came into effect in 2012. No. 488-FZ Federal Law “On industrial
policy in the Russian Federation and GOST “Industrial Parks. Requirements” National
Standard were adopted in 2014. No.794 Decree of the Government of the Russian Federation
of 04.08.2015 highlights that the purpose of establishing industrial parks (estates) is to organize
the necessary conditions on their territory for production of industrial products by residents of
industrial parts. According to a Decree issued by the Russian Government, from 1 January 2016
the Ministry of Industry and Trade of the Russian Federation is in charge for ascertaining
conformance of industrial parks and their managing companies to the statutory requirements,
keeping the Register of industrial parks (estates), entering them into the Register, and drafting
proposals annually on the state support in the form of compensating the costs incurred by
regions to establish such parks. The Ministry of Industry and Trade of the Russian Federation
keeps an official Register of industrial parks by regions; as of January 2020 it contained 46
industrial parks (estates) in 19 regions of Russia [7]. Government subsidies have been allocated
to the subjects of the Russian Federation since 2016 to compensate the costs of establishing
industrial park infrastructure in accord with No. 1119 Decree, with the following breakdown:
4348.33 million RUB in 2916; 3075.85 33 million RUB in 2017; 2609.53 33 million RUB in
2018; and the estimated figure for 2019 is 1165.54 33 million RUB [6]. The full picture of
establishment, development and performance of industrial parks (estates) in Russia in general
and its particular regions can be derived from data reported by the Ministry of Industry and
Trade of the Russian Federation, the Association of Industrial Parks of Russia and the subjects
of the Russian Federation. The Association of Industrial Parks of Russia (AIP of Russia) is a
national sectoral NGO, integrating industrial parks (estates) since 2010. In 2015 AIP of Russia
were authorized to issue certifications to industrial parks on conformity to the running
standards.

51st International Scientific Conference on Economic and Social Development – Rabat, 26-27 March 2020
78
The certification is a mandatory condition for including industrial parks (estates) in the Register
of the Russian Ministry of Industry and Trade. At the beginning of 2020, AIP of Russia
comprised 150 legal entities, including100 industrial parks, from 48 subjects of the Russian
Federation, of which 34 are certified, and they form a pool of park-candidates for including in
the Register [8]. The Federal Law on industrial policy directs that industrial parks (estates) and
industrial clusters are a form of spatial organization of industry recognized by the state and their
presence in the territory of a particular region is a factor of an efficient industrial policy of the
region. Currently, 80 subjects of the Russian Federation have announced 875 industrial parks
that, apart from the 46 parks entered in the State Register and 48 certified parks, include 781
facilities that regions intend to develop, and that are currently are at the state of design or
construction [10]. Obviously, these 781 facilities that at the moment do not function as
industrial parks can be considered in the capacity of a quantitatively-significant potential base
for establishing operating industrial parks across regions. Thus, it is a project, valuable for all
regions, on pursuing an efficient industrial policy with use of an operational institutional tool
based on No.488-FZ Federal Law “On industrial policy in the Russian Federation”, which
complies to the goals and objectives of the National Projects for strategic development of Russia
till 2024. It is exactly on the territories of industrial parks with completed modern production
and transport infrastructure, where attractive conditions will be created for investors ready to
develop operations in the form of industrial enterprises (park residents), particularly, small and
medium business, which, in its turn, will increase the overall investment attractiveness of a
territory [11]. As a result, new modern high-productivity workstations can be created,
generating decent salaries for workers, and subsequently leading to improved housing
conditions and providing high-quality education to the younger generation. Thereby, a chain of
positive social-and-economic effects is built up that ultimately decreases the poverty level,
improves the quality of life of the population and raises the level of confidence in the power-
holders.
4. CONCLUSIONS
1) Currently, a double pattern of setting the goals for fulfillment of the National Projects by
regional authorities is formed. First, there are directive goals for achieving the regional
targets of the National Projects. Second, 15 indicators are determined in the regulatory
framework to evaluate performance of supreme officials of the subjects of the Russian
Federation and regional executive bodies, that are directly linked to successful execution in
the regions of the National Projects for strategic development of the Russian Federation till
2024.
2) To fulfill the regional elements of the National Projects and achieve the target values of
evaluating performance of the senior regional officials and regional executive bodies, the
working agenda of regional authorities should include development of a regional economic
growth policy as a top priority. The key objective, tasks and tools for creating points of
growth should be identified exactly within this policy to enable comprehensive solutions
for regional development.
3) Based on the positive established practice, such points of regional economic growth can
become industrial parks established as part of an efficient industrial policy under No.488-
FZ Federal Law “On industrial policy in the Russian Federation”. It ensures achieving the
set of target values for evaluating performance of senior officials and regional authorities,
and answers the purposes of the National Projects for strategic development of the Russian
Federation till 2024.

51st International Scientific Conference on Economic and Social Development – Rabat, 26-27 March 2020
79
LITERATURE:
1. No.488-FZ Federal Law “On industrial policy in the Russian Federation” of 31.12.2014 //
Retrieved 14.12.2019 from a web-site on legal acts, codes and regulatory acts in the Russian
Federation: https://legalacts.ru/doc/federalnyi-zakon-ot-31122014-n-488-fz-o/ [in Russian]
2. No. 204 Order of the President of the Russian Federation “On the national goals and
strategic objectives for development of the Russian Federation till 2024” of 07.05.2018 //
Retrieved 17.12.2019 from the official web-site of the President of the Russian Federation:
http://www.kremlin.ru/acts/bank/43027 [in Russian]
3. No.193 Order of the President of the Russian Federation “On assessing performance of
senior officials (Heads of supreme government bodies) of the subjects of the Russian
federation and executive bodies of the subjects of the Russian Federation” of 07.04.2019 //
Retrieved 12.12.2019 from the official web-site of the President of the Russian Federation:
http://www.kremlin.ru/acts/bank/43027 [in Russian]
4. Kashin, A., Komarova, O. (2017). The role of small business in shaping and developing
economic agglomerations. Journal of Economy and Entrepreneurship. 2017. No. 3-2 (80-
2). Pp. 555-558. [in Russian]
5. Retrieved 18.12.2019 from the official web-site of the President of the Russian Federation::
http://kremlin.ru/events/president/news/60485 [in Russian]
6. Retrieved 16.12.2019 from the official web-site of the Government of the Russian
Federation: http://government.ru/. [in Russian]
7. Retrieved 10.01.2020 from the official web-site of the Ministry of Industry and Trade of
the Russian Federation (Minpromtorg Russia): http://minpromtorg.gov.ru/docs/orders/ [in
Russian]
8. Retrieved 19.12.2019 from the official web-site of the Industrial Parks Association:
http://www.indparks.ru/upload/medialibrary/8f4/Obzor%202016%20site%20(1).pdf [in
Russian]
9. Retrieved 17.12.2019 from: https://svpressa.ru/ [in Russian]
10. A list of industrial parks of Russia – 2019. Retrieved 24.01.2020 from:
https://russiaindustrialpark.ru/industrialparks_catalog_perecheny_spisok_russia [in
Russian]
11. Pleslov, A. (2017). Organizational and economic factors of establishing and developing
industrial parks. Russian Journal of Entrepreneurship. 2017. V. 18. No. 5. Pp.749-759. [in
Russian]
12. No. 618 Order of the President of the Russian Federation “On the main directions of the
state policy for competition development” of 21.12.2017. Retrieved 08.01.2020 from:
https://fas.gov.ru/documents/600680
13. Lukashenko, O. (2017). Chapter 2. Theoretical foundations of competition policy. § 2.
Specifics of competition at the modern stage. Pp. 63-81. In Karaganchu, A, Knyazeva, I.
Competition policy for preventing restrictive business practice and anticompetitive state
aid. Experience and practice of the European Union. Novosibirsk: Novosibirsk State
University Publishing. 2017. 296 p. [in Russian].

51st International Scientific Conference on Economic and Social Development – Rabat, 26-27 March 2020
80
THE ANALYSIS OF THE ELECTRONIC COMMERCE IN THE
CONTEXT OF BUYERS’ BEHAVIOR
Andzela Veselova
University of Latvia
Aspazijas blv.5., Latvia
ABSTRACT
Nowadays, the trend of online trade or selling and purchasing things through the Internet keeps
increasing all over the world, including Latvia. This means that buyers tend to prefer online
shops instead of real stores. It is possible that relatively soon the online trade will replace other
types of retail sales. Although it seems more convenient for both buyers and sellers, there is a
bunch of negative aspects to consider. Online trade is the way of sales of goods or services on
Internet sites instead of physical trading points like shops, markets, kiosks etc. The customers
of Internet shops see the offer on a website, place their orders and the purchased goods are
delivered by post or delivery service. Sometimes, on rare occasions, the seller takes care of the
delivery itself. The aim of the research is to explore the behaviour models of the buyers
purchasing goods online basing on theories related to online trade, detect the different and
elaborate the conclusions. The tasks to complete are following: analyse theoretical aspects of
online trade and its models and make the conclusions.
Keywords: e commerce, online shops, online trade
1. INTRODUCTION
Information and communication technologies overcome borders, distance and time.
Technologies are the main driving force of globalization. Nowadays, the widest accessibility of
international electronic commerce as well as the promotion of electronic trade is among top
economic priorities of many countries (Barnes, Vidgen, 2002). One of the most important parts
of electronic commerce is shopping online. Online trade keeps spreading all over the world.
The wide range of goods and services makes online trade an important instrument for
individuals, companies, institutions of different sectors and state authorities. The partnerships
become more efficient through using information and communication technologies. The
efficiency of cooperation relates to the decreasing costs of the trading deals. (Cristobal, Flavian,
Guinaliu, 2007). Namely, deals online reduce the costs related to the finding and processing
the information, discussions and signature of contracts, therefore the sales procedure is fast and
simple, increasing the possibilities to attract investments and to improve the geographic
accessibility. According to author, the development of electronic commerce in today’s world
closely relates to the economic development. Largely, the electronic commerce bases on growth
of IT use and increase of trade deals in the world. The electronic commerce and, particularly,
the online trade, has become reality due to the innovations and human achievements in
information and communication technologies. In online trade, Internet accessibility is one of
the core values. Electronic commerce opens new opportunities for the development of the
company, offering goods or services 24/7, ensuring the uninterrupted advertising of the
company or even becoming a part of the global market. In order to ensure successful sales of
goods or services as well as to make profit, the customers and end users of the purchased goods
and services must be in focus. From the company’s perspective, it is very important to find out
the reasons motivating the buyers to purchase particular goods or services online as well as the
steps and order of their activities taken during the purchase procedure (Marimon, Vidgen,
Barnes, Cristobal, 2010). Besides, it is important to find out the external impacts to the buyer’s
actions taken during the purchase procedure.

51st International Scientific Conference on Economic and Social Development – Rabat, 26-27 March 2020
81
More and more often, the customers choose to purchase different products and services on
online. Constantly increasing range of goods and services is one of the reasons to prefer
shopping online. All these circumstances intensify the competition between the companies
working in e-commerce field. Therefore, a detailed study of activities of current and potential
customers reduces the risks of inappropriate offers by the merchants. The aim of the research
is to explore the behaviour models of the buyers purchasing goods online basing on theories
related to online trade, detect the different and elaborate the conclusions. The tasks to complete
are following: analyse theoretical aspects of online trade and its models and make the
conclusions. Nowadays, the proportion of online trade and Internet shopping keeps increasing
both in Latvia and all over the world. It means that the buyers tend to prefer online shops instead
of real retail stores. Possibly, relatively soon the online trade will replace the rest of retail sales
as more appropriate and beneficial method both for buyers and sellers. However, there are also
many negative aspects of the issue.
2. THE IMPORTANCE OF ONLINE TRADE AND ITS MODELS
According to D. Chaffey, the online trade is a type of trade, where the goods and services are
sold on the Internet instead of real retailers, such as stores, markets, kiosks and other. It means
that the customers of online shops browse the offer on the website, place their orders and the
delivery of the products is organized by mail or a delivery service company. On rare occasions,
the seller delivers the goods itself (Chaffey, 2016). According to R.T. Watson, P. Berthon, F.L.
Pitt and G.M. Zinkhan, online trade has conquered the hearts of the buyers by making their
lives easier. They do not have to spend time to go to the retail shops. Besides, the prices of the
goods and services on Internet tend to be lower than the prices of the same products sold in high
street shops. In case of online trade, the seller needs just a warehouse to store the goods and the
office for management purposes, sparing the costs related to the management and maintenance
of the stores. The difference in costs allows offering the same products for better price in
comparison to retailers (Watson, Berthon, Pitt, Zinkhan, 2008). Feng Li points out that online
trade, however, has many disadvantages discouraging many buyers to choose this kind of
shopping. There are a lot of fraud on Internet and a huge number of methods to deceive the
buyers using online shops. The most popular is a simple swindling of money by ordering
prepayment of goods and failing to deliver the order afterwards (Feng, 2015). In is essential to
check, whether the online shop delivering the goods is secure and free from fraud. Online trade
also includes the possibility that something can be mixed up and the buyer will not receive the
ordered product. It is not possible to see and try the product in reality, which is an important
disadvantage when purchasing clothing. Despite the basic price online often is lower,
sometimes the delivery costs covered by the buyer reaches the prices of the retailer. Besides,
sometimes the delivery costs are not clearly stated, thus leading to the disappointment of the
customers (Suppliers of trade, 2018). It is hard to conclude whether the online trade is better or
worse in comparison to traditional retail sales, but it is clear that it will keep attracting the
customers. Lately, in the largest part of the world the online trade dominates over the regular
retail sales. It keeps developing due to many innovations that also allow dealing with
deficiencies step by step. The most significant features that make online shopping attractive are
comfort, speed and low prices etc. However, the shopping as process in a traditional way,
including the ambience and the possibility to try the product are also important for many
consumers. According to author, an online shop is one of the most popular solutions of
electronic commerce. The online shop is a virtual place, where the seller offers the products
and services via new electronic technologies, but the customer uses the technologies to find out
the information on offer and places the order to be delivered.
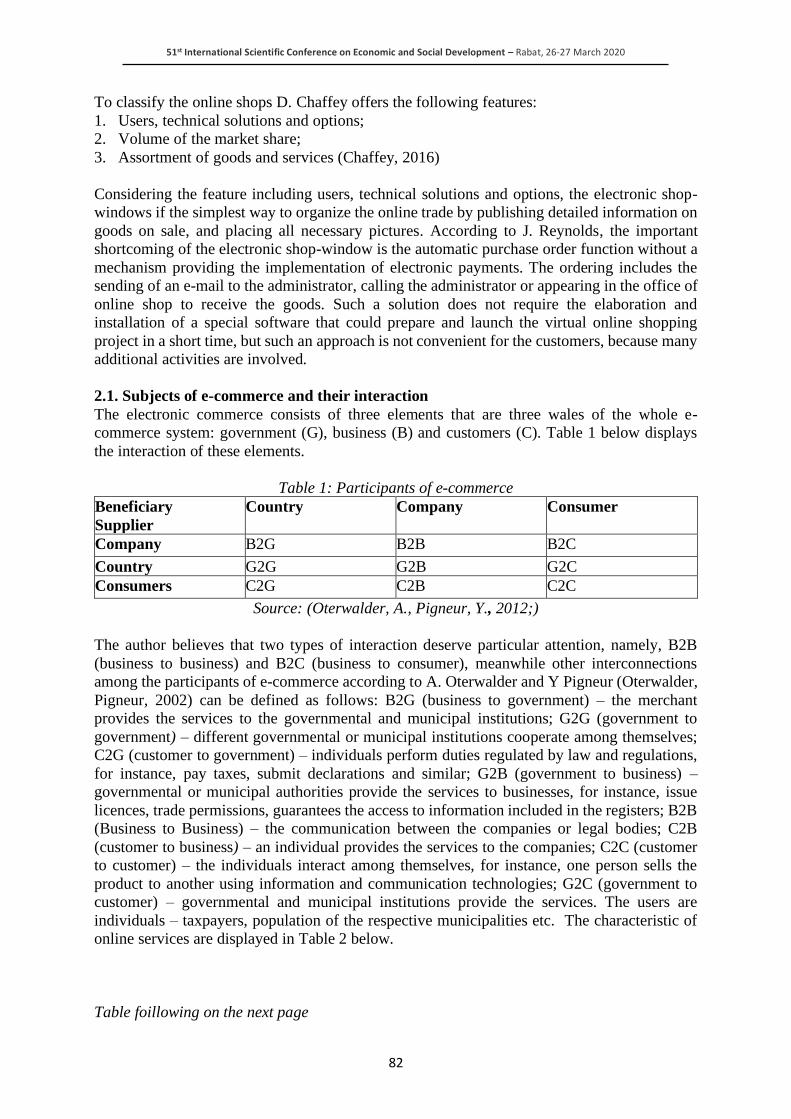
51st International Scientific Conference on Economic and Social Development – Rabat, 26-27 March 2020
82
To classify the online shops D. Chaffey offers the following features:
1. Users, technical solutions and options;
2. Volume of the market share;
3. Assortment of goods and services (Chaffey, 2016)
Considering the feature including users, technical solutions and options, the electronic shop-
windows if the simplest way to organize the online trade by publishing detailed information on
goods on sale, and placing all necessary pictures. According to J. Reynolds, the important
shortcoming of the electronic shop-window is the automatic purchase order function without a
mechanism providing the implementation of electronic payments. The ordering includes the
sending of an e-mail to the administrator, calling the administrator or appearing in the office of
online shop to receive the goods. Such a solution does not require the elaboration and
installation of a special software that could prepare and launch the virtual online shopping
project in a short time, but such an approach is not convenient for the customers, because many
additional activities are involved.
2.1. Subjects of e-commerce and their interaction
The electronic commerce consists of three elements that are three wales of the whole e-
commerce system: government (G), business (B) and customers (C). Table 1 below displays
the interaction of these elements.
Table 1: Participants of e-commerce
Beneficiary
Supplier
Country Company Consumer
Company B2G B2B B2C
Country G2G G2B G2C
Consumers C2G C2B C2C
Source: (Oterwalder, A., Pigneur, Y., 2012;)
The author believes that two types of interaction deserve particular attention, namely, B2B
(business to business) and B2C (business to consumer), meanwhile other interconnections
among the participants of e-commerce according to A. Oterwalder and Y Pigneur (Oterwalder,
Pigneur, 2002) can be defined as follows: B2G (business to government) – the merchant
provides the services to the governmental and municipal institutions; G2G (government to
government) – different governmental or municipal institutions cooperate among themselves;
C2G (customer to government) – individuals perform duties regulated by law and regulations,
for instance, pay taxes, submit declarations and similar; G2B (government to business) –
governmental or municipal authorities provide the services to businesses, for instance, issue
licences, trade permissions, guarantees the access to information included in the registers; B2B
(Business to Business) – the communication between the companies or legal bodies; C2B
(customer to business) – an individual provides the services to the companies; C2C (customer
to customer) – the individuals interact among themselves, for instance, one person sells the
product to another using information and communication technologies; G2C (government to
customer) – governmental and municipal institutions provide the services. The users are
individuals – taxpayers, population of the respective municipalities etc. The characteristic of
online services are displayed in Table 2 below.
Table foillowing on the next page

51st International Scientific Conference on Economic and Social Development – Rabat, 26-27 March 2020
83
Table 2: Characteristics of Online Services
Year Authors The main ideas of the online service concepts
2000
Grönroos C., Heinonen
F., Lindholm M. &
Isoniemi K.
• Basic services;
• Additional offers, customer participation
2001 Conrick M. & Essen A.
• Special, personalized communication
• Customize of business offer in real time;
• The correction of the company's real-time
mode;
• Cross product development;
• The possibility of attracting customers.
2003
Ribbnink F., van Riel A.C., Liljander V. &
Jurriens P.
• Basic services;
• Promotional services;
• Ancillary services;
• Additional services;
• User interface.
2005 Roth, Boyer &Hallowell
• Increasing of service delivery capabilities
• Offering the new services of a lower cost,
with the widest geographic coverage and
product diversity
2008 Heinonen K.
• Value depends on benefits and “victim”;
• Value of worth: technical, functional, time,
spatial
2010 Conrick M. & Essen A.
• Innovative service concept;
• Innovative service system;
• Innovative service process.
Source: By the author basing on models by Grönroos, Heinonen, Lindholm & Isoniemi;
Lemon& Rust; Ribbnink, van Riel, Liljander & Jurriens; Boyer, Hallowell & Roth; Heinonen
K.; Conrick.& Essen
Thus, the analysis leads to conclude that the main task of the online service similarly to the
traditional services is to meet the needs of the consumers, and it is achieved through other
elements of the service, such as flexible price, additional comfort, speed, control, simple dealing
and constant improvements. The author makes several conclusions regarding the main
characteristics of online services discussed by various authors in their theories:
1. All theories pay particular attention to the communication with the customer, customer
reviews, information flow, interchange of information and personalized communication.
2. The main difference from the traditional service mentioned by the researchers is the use of
new technologies and innovations in the services provided by the Internet.
2.2. Evaluation criteria of e-commerce services
In latest decades, the quality assessment methods for services have become an important field
for marketing research. Due to the increasing importance of the services, the scientists and
businesspersons work to improve the quality of the provided services (Chaffey, 2016). One can
define the quality of the electronic services as general assessment of the clients and the decision
on best practice quality in the field of electronic services in virtual market. Since the issue is in
focus of the research from 2000 on, this study will base on most popular models of online
services’ efficiency assessment starting from the aforementioned period (Chaffey, 2016). Table
3 displays the common aspects regarding the most popular quality criteria models for electronic
services in chronological order.

51st International Scientific Conference on Economic and Social Development – Rabat, 26-27 March 2020
84
Table 3: Parameters for electronic services’ quality assessment
Authors Year Quality assessment parameters
Wigand R.T. &
Swaid, S.I.
2009 Ease of use of the website, quality of information, reliability,
responsiveness, trust, personalization.
Stehenaus, R.,
Raman, M.,
Alam, N. &
Kuppusamy, M.
2008 Ease of use, appearance, reliability, customization,
communication, initiative.
Lin Y. & Lee Y. 2005 Website design, reliability, responsiveness, personalization.
Ribbink D., van
Riel A.C.,
Streukens S. &
Liljander V.
2004 Ease of use, website design, customization, responsiveness,
trust.
Gilly M.&
Wolfinbarger. M
2003 Performance (reliability), site design, customer service, security
(confidentiality).
Santos J. 2003 Ease of use, appearance, connectivity, The structure and
arrangement, content, reliability, efficiency, support,
communication, safety, initiative
Vidgen, R.T.&
Barnes S.J.
2000 Ease of use, design, information, trust and empathy.
Source: Chaffey, 2016
In 2003, J. Santos identified several factors that define the quality of electronic services. He
mentioned the ease of use of the site, its appearance, communication, structure and layout as
well as contents, reliability, efficiency, support, communication, safety and initiative (Santos,
J. 2003). At the same time, M. Gilly and M. Wolfinbarger, in their turn, identified four quality
aspects of electronic services as follows: performance (reliability), website design, customer
service and security (privacy) (Gilly, Wolfinbarger, 2003). In 2004, D. Ribbink, A.C. van Riel,
S. Streukens and V. Liljander defined five quality parameters of electronic services – ease of
use, website design, customization, responsiveness and trust (Ribbink, van Riel, Streukens &
Liljander, 2004). In 2005, Y. Lin and Y. Lee came up with five quality criteria for electronic
services – website design, reliability, responsiveness, trust and personalization (Lin, Lee, 2005).
At the same time, A. Parasuraman, A. Malhotra and V. Zeithaml in their study proved that in
order to assess the quality of electronic services, two different evaluation scales – E-RecSQUAL
and ES-QUAL – should be applied. The main scale ES-QUAL consists of four parameters:
efficiency, performance, accessibility and confidentiality. E-RecS-QUAL is a sub-scale of ES-
QUAL and includes the elements related to the processing of troubleshooting and orders related
to the service. E-RecS-QUAL suits only for the customers that have accidentally opened the
website. This scale considers relevant three quality aspects – operativeness, compensation and
contact (Parasuraman, Malhotra, Zeithaml, 2012). In 2008, R. Stehenaus, M. Raman, N. Alam
and M. Kuppusamy offered six dimensions of electronic services. They identified the following
parameters to assess the efficiency of an Internet shop: ease of use, appearance, reliability,
personalization, communication and initiative (Stehenaus, Raman, Alam, & Kuppusamy,
2008). In 2009, R.T. Wigand and S.I. Swaid identified the following quality parameters for
electronic services – ease of use of the website, quality of information, reliability,
responsiveness, trust, personalization (Wigand, Swaid, 2009). R.T. Vidgens and S.J. Barnes, in
their turn, defined five quality dimensions of electronic services, emphasizing the criterion
“ease of use”.
51st International Scientific Conference on Economic and Social Development – Rabat, 26-27 March 2020
85
They believed that this particular criterion includes appearance, ease of use and navigation as
well as fast and clear image transmission to the user (Vidgen, Barnes, 2000). D. Ribbink, A.C.
van Riel, S. Streukens and V. Liljander also accentuated the ease of use as the most important
assessment criterion, believing it includes such critical aspects as functionality, availability of
information, ease of ordering and navigation (Ribbink, van Riel, Streukens & Liljander, 2004).
R.T. Wigand and S.I. Swaid agreed to the opinion of other researchers and include in their
model a parameter that, they believe, include the most important aspects for the customer –
perception of convenience and ease of navigation in using the website. (Wigand, Swaid, 2009)
The next step after evaluation of the ease of use of online shop, the next important issues are
simplicity, availability and clearness of all actions to be taken for standard user. J. Santos
describes simplicity as the ease of use of the website to search external information necessary
for the customer, the simplicity of internal navigation and browsing options within the website.
The external browsing related to the search of the particular website on Internet (Santos, 2003).
R. Stehenaus, M. Raman, N. Alam and M. Kuppusamy relate the ease of use of the website to
the ease of memorization of e-mail address, easy navigation as well as concise and clear
contents, terms and conditions (Stehenaus, Raman, Alam, Kuppusamy, 2008). All authors,
except R.T. Wigand and S. I. Swaid in their models emphasize the web design criterion, which,
they believe, is an important issue for the customers during the purchasing procedure (Wigand,
Swaid, 2009). R. T. Vidgen and S. J. Barnes believe that design means attractive appearance
and aesthetics (Vidgen, Barnes, 2000). Y. Lin and Y. Lee totally agrees with R.T. Vigen and
S. J. Barnes, because the web design is a key factor for the visual assessment of the interface
by the users and consumers (Lin, Lee, 2005). D. Ribbink, A.C. van Riel, S. Streukens, S. and
V. Liljander supports the opinion of aforementioned authors. They believe that the website must
be visually pleasant. Therefore, one more service quality dimension turns out related to the web
design user’s interface. Authors mention that one of the advantages of IT is the possibility to
adapt the website to the needs of user even if it is not very easy. (Ribbink, van Riel, Streukens
& Liljander, 2004). J. Santos writes that the design includes the correct colour, graphics, picture
and use of animations, also web pages of appropriate size. According to Santos, design is the
first parameter assessed by the Internet users (Santos, 2003). R. Stehenaus, M. Raman, N. Alam
and M. Kuppusamy are of similar opinion. They believe that appearance means attractive
graphics, colors and images. In addition, the website must be understandable and well-
organized (Stehenaus, Raman, Alam, Kuppusamy, 2008). M. Gilly and M. Wolfinbarger assess
this parameter in the light of Internet service users’ experience. They state that the website
design includes navigation, information search, processing of orders, personalization and the
selection of goods, but excludes customer service (Gilly, Wolfinbarger, 2003). All included
authors have paid attention to information and the way it is presented to the user. R.T. Vidgen
and S. J. Barnes write that the information assessment parameter consists of its suitability to the
goal and needs of the user (Vidgen, Barnes, 2000). According to J. Santos, the information is
the content of the website related to the products and the demonstration of website functions
(Santos, 2003). Too extensive or too limited information are both negative factors. The
information on website containing the description of goods must precisely represent and
describe the qualities of the products placed for sale. The description of the product must match
the customer’s idea of what he or she has ordered. R.T. Wigand and S. I. Swaid fully share this
opinion claiming that the quality of information includes consumer perception of usefulness
and quality of websites (Wigand, Swaid, 2009). In addition, for the assessment of service
quality such criteria as credibility, safety, confidentiality and customer loyalty, are very
important. Maintainability, writes J. Santos, is the ability to carry out the promised service
correctly and consistently, including the frequency of website updating, immediate response to
the requests of the customers, accuracy in online shopping and payments (Santos, 2003). R. T.
Wigand and S. I. Swaid (2009) identify the credibility of the service with such factors as buyers’

51st International Scientific Conference on Economic and Social Development – Rabat, 26-27 March 2020
86
perception about the reliability of the website (confirmation letters of order placement, order
tracking function) and the commitment of the seller regarding precise implementation of the
service (according to the statements published in the website). Y. Lin and Y. Lee (2005) believe
that the reliability is what guarantees the ability of the website to process the orders, guarantee
fast deliveries and comply with the requirements of personal data security. According to R.
Stehenaus, M. Raman, N. Alam and M. Kuppusamy, the reliability includes order accuracy,
updated content and fulfilment of promises (Stehenaus, Raman, Alam, Kuppusamy, 2008). M.
Gilly and M. Wolfinbarger, in their turn, identify the security with confidentiality and relates it
to secure credit card payments and general confidentiality of customer-related information
(Gilly, Wolfinbarger, 2003). D. Ribbink, A.C. van Riel, S. Streukens and V. Liljander (2004)
in their research proved that both security and confidentiality cause many doubts in the context
of online shopping. A. Parasuraman, A. Malhotra and V. Zeithaml combined two parameters
(security and privacy) and renamed the new criterion “protection” that included the security of
the site and the protection of sensitive information of the customers (Parasuraman, Malhotra,
Zeithaml, 2012). D. Ribbink, A.C. van Riel, S. Streukens and V. Liljander shared the view that
the security and confidentiality cause great doubt in the field of electronic services (Ribbink,
van Riel, Streukens & Liljander, 2004). They considered security separated and independent
criterion indicating on its autonomy from threats, risks or doubts (including financial volatility)
during the implementation of service. R.T. Vidgen and S. J. Barnes (2000) believe that the
reliability is the main parameter containing security and confidentiality related to personal data
collecting as well as to the reputation of the website. Y. Lin and Y. Lee (2005) define reliability
as the readiness of the customers to accept the vulnerability in case of a deal on Internet basing
on their positive expectations related to the further activities of the online shop. There are also
the efficiency parameters of the service identified by the authors in different ways. According
to J. Santos, the efficiency includes downloading, search and navigation speed (Santos, 2003).
M. Wolfinbarger and M. Gilly (2003) believe that the efficiency criteria of customer service
include the responsiveness, appropriate and ready service that can react fast to the demand of
the buyer. A. Parasuraman, A. Malhotra and V. Zeithaml (2012) point out, that efficiency is
characterized site accessibility and ease of use, also operating speed (Parasuraman, Malhotra,
& Zeithaml, 2012). Some authors in their works emphasize such criteria as relations with
customers and communication in general. J. Santos believes that the communication depends
on quantity and quality of the links distributed by the website meanwhile the connection means
descriptive information of customers, on-time provision of due information and communication
in the language that customers understand (Santos, 2003). A. Parasuraman, A. Malhotra and V.
Zeithaml (2012), in their turn, considered communication the accessibility of a particular help
through phone or Internet. R. Stehenaus, M. Rama, N. Alam and M. Kuppusamy attribute a
similar feature to the communication criterion explained as the availability of the website to the
customers meaning the possibility to contact the provider of the website and offer different
communication means and channels aimed to reach the support service of the site (Stehenaus,
Raman, Alam, Kuppusamy, 2008). Personalization of the provided services is also important
since every customer wishes to feel unique. D. Ribbink, A. C. van Riel, S. Streukens and V.
Liljander (2004) stated that the personalization can be elaborated basing on previous purchases
as well as on information provided by other customers. The users of electronic services await
fast feedback to their orders and suggested improvements (Ribbink, van Riel, Streukens &
Liljander, 2004). Stehenaus R., Raman M., Alam, N. un Kuppusamy M. (2008) also focuses
on personalization. The individualization must be adapted to the user’s interface in a way that
is beneficial for the customer. R. T. Wigand and S. I. Swaid stated that personalization includes
the perception of the customers about individualized attention and differentiation of services
adapted particularly for a maximum satisfaction of customers’ needs (Wigand, Swaid, 2009).
51st International Scientific Conference on Economic and Social Development – Rabat, 26-27 March 2020
87
According to Y. Lin and Y. Lee (2005), the personalization requires personal attention, for
instance, sending personal recognition letters on behalf of the online shop, provision of
feedback responding to the questions and comments of customers. R.T. Vidgen and S. J. Barnes
(2000) view personalization as the part of such criterion as empathy which relates to the quality
of feedback (Vidgen, Barnes, 2000). Several authors emphasize such criterion as initiative or
stimulus. J. Santos (2003) identifies both notions and considers initiative a stimulus transmitted
by the seller to the customer in order to achieve more frequent views of the website by additional
bonuses and rewards. R. Stehenaus, M. Raman, N. Alam and M. Kuppusamy regarded initiative
as the component of promotion carried out by the website provider aiming to keep the current
clients and to attract new customers (Stehenaus, Raman, Alam, Kuppusamy, 2008). Less than
a half of the authors consider operativeness important among the website assessment criteria.
Y. Lin and Y. Lee (2005) claimed that operativeness shows the frequency of services provided
voluntarily by an online shop responding to customer requests regarding information browsing,
navigation and service speed important to the target audience. Operativeness means efficient
reaction to the problems and returning customer through the website. R.T. Wigand and S.I.
Swaid connects operativeness to the assistance to the customer and customer’s perception
regarding the support, when necessary either in automatized way or using the human factor.
(Wigand, Swaid, 2009). Maintenance includes the perception of the customers about the loyalty
and reliability of the website. The support mentioned by J. Santos can be also included in this
criterion, since its characteristics are similar to the previously quoted definition of
operativeness. Author believes that the support relates to technical assistance, user instructions
and personal advices available on website for the convenience of the customers.
3. CONCLUSIONS
The analysis performed leads the author to several important conclusions regarding the
assessment criteria of online services:
1. The largest part of the attention turns to the website design and image, credibility of
information, security and confidentiality, meanwhile the degree of quality compliancy and
customer loyalty are not in the focus.
2. None of the lists provided by the authors includes all necessary and unified assessment
criteria, despite many criteria lists are similar.
3. The studies of the technical aspects of services are very limited in terms of quality
assessment parameters. Therefore, there is plenty of criteria for online service quality
assessment, but not a general unified list of criteria suitable to assess the quality level of
Internet services. In order to find out the most important assessment criteria, it is necessary
to know, which criteria are most important for the customers.
LITERATURE:
1. Barnes, S.J., Vidgen, R.T. (2002). An Integrative Approach to the Assessment of E-
Commerce Quality. Journal of Electronic Commerce Research, 3(3), 114-127.
2. Chaffey, D. (2016). E-business and e- commerce management. Prentice Hall Ltd., p.31.
3. Cristobal, E., Flavian, C., & Guinaliu, M. (2007). Perceived E-Service Quality:
Measurement Validation and Effects on Consumer Satisfaction and Website Loyalty.
Managing Service Quality: An International Journal, 17(3), 317-340.
4. Feng, L. (2015).What is e-business?How the Internet transform organization, Blackwell
publishing Ltd., p.28.
5. Gilly M., Wolfinbarger M. (2003). eTailQ:demensionalizing, measuring and predicting
etail quality.Journal of Retailing.Vol.79,p.187
6. Internet Banking. (2008). Journal of Internet Banking and Commerce. Vol. 13(2).p.1.

51st International Scientific Conference on Economic and Social Development – Rabat, 26-27 March 2020
88
7. Lin, Y., Lee, Y. (2005). Customer Perceptions of E-service Quality in Online Shopping,
International Journal of Retail & Distribution Management, 33(2-3), pp.161-176.
8. Marimon, F., Vidgen, R., Barnes, S. & Cristobal, E. (2010). Purchasing behaviour in an
online supermarket: the applicability of E-S-QUAL. International Journal of Market
Research, 52(1), 111-129.
9. Oterwalder, A., Pigneur, Y. (2012). E-business model design, classification and
measurments. Thunderbird International Business Review, p.27.
10. Parasuraman A., Malhotra A., Zeithaml V.A.(2012). E-S-QUAL: A multiple-item scale for
assessing electronic service quality. Journal of Service Research. Vol. 7(3).p. 213.
11. Ribbink, D., van Riel, A.C., Streukens, S., Liljander V. (2004). Comfort your online
customer: quality, trust and loyalty on the Internet. Managing Service Quality. Vol.
14(6).p.359.
12. Santos, J. (2003).E-service Quality: A Model of Virtual Service Quality Dimensions.
Managing Service Quality, 13(3), pp. 233-246.
13. Stehenaus R., Raman M., Alam, N., Kuppusamy M. Information Technology in Malaysia:
E-Service Quality and Uptake of and Uptake of Internet banking. Journal of internet
banking and commerce.Vol. 24 (3), p.9.
14. Suppliers of trade. Retrieved 20.01.2020. from : http://www.ltvc.lv.
15. Vidgen, R.T., Barnes, S.J. (2000). An Integrative Approach to the Assessment of E-
Commerce Quality. Journal of Electronic Commerce Research. Vol. 3(3).p.114.
16. Watson, R.T., Berthon, P., Pitt.F. L, Zinkhan, G.M. (2008). Electronic Commerce: The
Strategic Perspective.A Global Text, Zurich, p.11.
17. Wigand, R.T.,Swaid S.I. (2009). Measuring the quality of e-service: Scale development and
initial validation. Journal of Electronic Commerce Research. Vol. 10(1). p.13.

51st International Scientific Conference on Economic and Social Development – Rabat, 26-27 March 2020
89
THE EU UNEMPLOYMENT UNDER THE RECENT DEVELOPMENTS
OF THE GLOBAL ECONOMIC GLOBALIZATION
Athanasios G. Panagopoulos
University of Macedonia
Egnatia str. 156, GR546 36, Thessaloniki, Greece
ABSTRACT
The literature recognizes that the gradual countries’ involvement in the economic globalization
has generated competitive environments that stimulate innovation and economic growth. Yet,
globalization has also apparently led to the increase of inequality, contributing for waves of
populism and discontent, claiming for justice in sharing these benefits. Thus, it is not surprising
that the interaction globalization/social justice is paying attention to politicians and academics,
seeking to identify if there is reason to fear that the globalization leads to increase inequality.
The paper deals with the link between globalization and social justice, measured by updated
indicators that improved the data quality and broadened their baseline. In what globalization
concerns are applied the renewed KOF index, including de facto and de jure perspectives.
Concerning social justice, are used the latest “EU Social Justice Index”. Structural
unemployment trends, such as the long duration distressing people’s skills and motivation, as
well as youth unemployment, which has stimulated immigration and led to the departure of
skilled young people, have greatly reduced their potential for growth. GDP declined, corporate
failures increased, as did unemployment and poverty. Governments have greatly limited their
spending, particularly at the social level, in order to meet the targets, set in the adjustment
programs. In addition, countries no longer have financial conditions to implement measures to
stimulate the economy, in order to promote a faster recovery. It has recently been surprising
that the escalation of globalization has put people in a precarious employment position, who
felt they were protected from the competition of low wages. This paper, also, reflects on the
effects of the recent global financial crises in the EU members, which especially hit the Euro
zone.
Keywords: Globalization, Indicators, Justice, Unemployment
1. INTRODUCTION
The link between globalization and social justice plays a key role in the current political debate,
based on the general conviction that the inequality caused by globalization is a major stimulus
to populism (Pastor & Veronesi, 2018). Overall, globalization seems to support the gradual
convergence of incomes across countries, even as trade liberalization has allowed many
emerging countries, especially China, to achieve very substantial and sustained levels of
economic growth over a long period (Harger, Young & Hall, 2017). However, the centre of the
current discussion focuses on income inequality within countries, particularly in the more
developed and industrialized economies. Not surprisingly, the United States, for example, is
widely recognized as the country experiencing the most pronounced increase in income
inequality, partly because competition from emerging economies has affected the jobs of less
qualified people (Saez, 2018). While research recognizes and identifies a number of factors
which have influenced those trends, there is also some consensus that the trends in economic
globalization, technological change, especially in the field of information and communication
technologies, biased reforms in tax systems. Particularly, the labour market and the deregulation
of financial markets have contributed to growing social inequalities and territorial disparities
within countries (Herr, 2015). This global economic and financial crisis that has hit the
European Union, particularly some euro zone countries, has caused unsettling symptoms of
51st International Scientific Conference on Economic and Social Development – Rabat, 26-27 March 2020
90
opposition to the European project and the growth of waves of populism and nationalism (Guiso
et al., 2019). The US-initiated crisis quickly changed the centre of gravity for Europe and
revealed the fragility of some economies, notably the high levels of public debt of euro zone
countries and the effects on their economic and financial sustainability and the single currency
itself. This process has resulted in the deterioration of economic conditions, provoking social
unrest and contestation and even hostility towards the process of European integration, which
has had electoral consequences in recent years (Hernandez & Kriesi, 2016). In this context, the
paper focuses on the interaction between the levels of economic globalization of the countries
that make up the European Union and the components that embody Social Justice. The paper
analyzes the impacts that the economic and financial crisis, which occurred after 2007, had on
social justice indicators, especially on access to the labour market, in the various groups of
European Union countries, i.e. those that integrate or not the European Monetary Union. The
paper is considered relevant from the point of view of the literature, as, to the best of our
knowledge, this is the only paper so far that analyzes the impacts of the recent financial crisis
on the twofold levels of globalization and social justice and unemployment. Additionally, the
paper explores the new indicators produced by the KOF, separating the de jure and de facto
dimensions, as well as updated data from the EU Social Justice Index.
2. TRADITIONAL INTERNATIONAL TRADE THEORIES AND DISTRIBUTION OF
TRADE GAINS
Traditional theories of international trade, including the classical approach and neoclassical
models, provide rationality for countries’ economic specialization and advocate trade as a
creator of wealth. These theories thus justify economic globalization as the result of a
worldwide liberalization process in which countries specialize according to their comparative
advantages and from which everyone can benefit. They do not attach much importance on the
distribution of trade gains by countries and economic agents and, as such, have not provided
coherent answers to understand some current trends in globalization, especially with regard to
the growing inequality in income distribution in the world within countries. In our opinion, it
justifies to stress the argument of these theories and to counter the criticism of the unrealistic
assumptions on which they are based. Thus, the emphasis we give to these theories in the
literature review allows us to gauge their limits and the need to seek more robust theoretical
frameworks that take into account the specificity of resources and the quality of production
factors available in the several countries. This makes it possible to understand the criticism of
the way economic and financial liberalization has taken place and the growing marginalization
of less skilled labour in income sharing. Therefore, considering the interaction between the
dynamics of globalization and the variables of social justice, being complex, is entirely
pertinent. The term “globalization” used today involves multiple and complex features, ranging
from culture, technology, politics and economics, to the notion of interdependence as the
standard of personal relationships. In reality, people are increasingly dependent on each other,
in the various territorial levels that we consider, reflecting the growing number of contacts
made, mostly financial and commercial, generating a greater flow of goods, services and
technologies on a global scale, which reinforced the economic dimension of the phenomenon.
The increasing dependency of relations on a global scale is at the heart of globalization,
although there are different perspectives in the various social sciences that deal with the subject.
Thus, since Wallerstein (1974) the approaches recognize the disparate effects of dependence on
the geography and nature of economic flows, emphasizing their effects on global inequality.
The dependency ratio is explicitly characterized by asymmetry in per capita income, since most
of the wealth is concentrated in developed countries, and at the same time there is a growing
divergence in income distribution within countries, regardless of their level of development. In
economic terms, globalization has been treated as a phase of the world capitalist system, whose
51st International Scientific Conference on Economic and Social Development – Rabat, 26-27 March 2020
91
main causal mechanisms stem from the economic requirements of multinational corporations
penetrating foreign markets, resulting in significant competition and expansion of trade flows.
Globalization is also seen as a form of convergence of interconnected production systems,
basically from the neoclassical economic model that presents the convergence of prices of
goods and factors such as the effect of market arbitrage. The modern economy emerged from
criticism of the mercantilist tradition and builds the theoretical basis for the industrialization,
international trade, and the building of European states. The basic principles of liberalism can
be summarized by the competition in all markets and then by the creation of the gold-standard
monetary system. Such conditions ensure the passage of individual interests into a global
harmonious order, based on the invisible hand argument. Smith (1976) considers the territorial
distribution of markets as a requirement of the division of labour, which he conceives as the
principal source of the wealth of nations and defends free trade to generate prosperity for the
various stakeholders. The theoretical foundation of free trade is due to Ricardo, by explaining
the international division of labour on the basis of differences in labour productivity. The
reasoning on the relative cost advantage grounds the conviction that trade can be a positive sum
game if countries specialize in products where it has the lowest opportunity cost. So, all
countries must participate in the world trade system for the benefit of all (Ricardo, 1970).
Nowadays, this position on country specialization and free trade, as promoters of growth, is a
powerful anti-protectionist reason in trade policy debates. This optimism on the economic and
social effects of trade was strengthened identifying a set of positive political effects from trade
liberalization (Hirschman, 1986). However, the optimism of free trade has also been challenged
in terms of social issues when it became clear that large-scale poverty and subjection to the
economic system left deep traces in allegedly wealth-generating processes. Nationalist and
socialist ideas, in relation to the latter standing out the thought of Marx, assume that there are
strong conflicts of interests in the functioning of the capitalist system, leading to the need for
capital to expand in the various national markets in order to generate profits on a permanent
basis as condition of their survival. Capital goes beyond the nation-state, but depends on it for
its survival (Engels & Marx, 1969). In addition, labour exploited as a source of profit is reduced
to poverty, accelerated by gradual automation and, as a consequence, consumer demand in
domestic markets decreases. To explain the role of factor endowments in trade, the Stolper and
Samuelson model (SS), based on factors - labour and land - and two goods, using different
factorial intensities, predicts a linear relation between commodity prices and factor prices. Thus,
the real wage will increase in both sectors (goods), while the real remuneration of the
landowners will decrease in both productions. In an ideal world, free trade would tend to
promote the equalization of prices of goods and factors of production. However, the persistence
of trade barriers, transport costs and technological differences between countries prevents such
a convergence in the real world from being verified, as evidenced by the empirical tests carried
out (Deardorff, 1994). These models of trade and distribution of gains allow us to sketch the
effects of price changes on the well-being of identifiable economic groups with severe
distributional implications. There are similar results in models that show that under competitive
conditions, as long as the importable good remains to be produced, there is at least one
production factor that worsens its position with trade liberalization (Rodrik, 2018). That is, in
an impressive way the trade generically always produces losers and winners. The pattern of
gains and losses will depend on the details of the model. In the case of the SS model, the result
is a relative change in workers’ income, in favour of those with high skills. So, trade has an
influence on the distribution of income within countries, for two reasons: first, because factors
cannot move instantly and at no cost between industries and, on the other, because changes in
product composition have effects on the demand for factors. Traditional trade theories show
that trade equals an exchange of factors embodied in commodities, so buying them in a low-
wage country implies procuring low-cost factors.
51st International Scientific Conference on Economic and Social Development – Rabat, 26-27 March 2020
92
So, imports from low-wage countries threaten some labour in countries where wages are high.
The distributional effect is that unskilled workers in low-wage countries earn from free trade as
well as skilled workers in developed countries. The losers with free trade would be skilled
workers in poor countries and unskilled workers in rich countries. However, the reality did not
confirm such predictions. Skilled workers in poor countries have improved with globalization
and the less skilled have lost, so most unequal distributions in income have arisen in poor
countries. In fact, income distribution in poor countries has become more unequal as a result of
globalization mounting (Hillmann, 2008).
3. INFLUENCES OF GLOBALIZATION ON INEQUALITY AND SOCIAL JUSTICE
Most traditional theories do not consider the effect of trade on the income distribution is a
reason to limit it. Though, the distributive impacts have to be taken into account and must
therefore be considered and regulated by the action of the states in their economic and social
policy. In the 1980s and 1990s there were significant developments in favour of government
intervention in trade policy orientations. On the one hand, the emergence of strategic trade
policy (Brander & Spencer, 1985) provided additional reasons for countries to derive gains in
promoting industries considered strategic. On the other hand, criticisms of globalization,
centred on their effects on workers in less developed countries, but also on workers in
industrialized countries, are strongly appearing. Many authors expressed their distress with
some results of globalization. Stigliz’s position in Globalization and its Discontents is a clear
example and an inexorable landmark (Stiglitz, 2002). He acknowledges that, while markets are
efficient and provide the basis for growth, they are also a source of injustice because income
earned and accumulated wealth are inconsistent with social equality standards. Thus, the author
sustains that it is the responsibility of governments to moderate social inequality arising from
the play of markets through public policies in the fields of taxation and income redistribution
(Stiglitz, 2017). Globalization hampers the distributive effects of social justice, limiting the
ability of governments to intervene with effective distributive policies. In integrated capital
markets, the mobility flows occur to places where taxes are lower (Benassy-Quere et al., 2005),
so, if capital is mobile and does not escape the highest taxes, the tax bases will then be limited
to the income of immobile labour. Thus, capital cannot be taxed as labour, making globalization
socially unfair and undesirable, while acting as a brake on redistribution policies. For some,
globalization is seen not only as a barrier to social justice due to the constraints it imposes on
governments, but it is the main reason for the inequality in the distribution of income because
of the injustice of the markets (Ravallion, 2018). Equality in income distribution is generally
seen as one of the determinants of social justice, making it a topic of greater concern, where the
search for it allows one to confront the efficiency of markets and public policies oriented
towards equity. Social justice is a salient topic in public discourse and political decision, as
politicians vow to promote social justice. Globalization has been a widely studied phenomenon
in different variants and some care is acknowledged in whether it is consistent with social
justice. The debate has been controversial, even because the different concepts of social justice
show that it is multifaceted, which makes measurement very difficult. An essential question
concerns what gives rise to or impedes social justice and there several studies have tested the
causal links between the two phenomena (Merkel & Giebler, 2009). Contestants of
globalization admit that it has negative effects on social justice for whom the poor have been
penalized by the waves of globalization. They assume that social justice is limited when social
spending is reduced or when labour markets are deregulated. Stiglitz believes that trade
liberalization so quickly has gone too far at the cost of rising unemployment, with the problem
being the way it has been managed (Stiglitz, 2006). The political prescription is that
governments must protect social agreements and if they collide with the demands of the global
economy, it is this that must give way (Rodrik, 2011).
51st International Scientific Conference on Economic and Social Development – Rabat, 26-27 March 2020
93
The empirical evidence is contrasted in relation to the link between globalization and social
justice. We will briefly highlight some results obtained in the search for interaction between the
two processes. Kauder & Potrafke (2014) investigate how social justice correlates with
globalization between 1991- 2007 and the results show that OECD countries with a rapid
globalization process enjoy greater social justice, suggesting that voters demand active
governments when globalization is intensified, validating the compensation thesis. According
to Meinhard & Potrafke (2012), a higher social security benefit due to the risks of international
competition induces the State to broaden its intervention in order to ensure welfare levels, rising
social spending in the course of globalization. In another sense, Sinn (2003) considers that
globalization influenced the attributes associated with social justice, mainly reducing the weight
of the public sector and the social state, limiting cohesion in the countries. In short, most studies
acknowledge that the most globalized countries, with the highest insertion in value creation
chains worldwide, also display higher levels of social justice. It is under this background that
we will then develop our empirical application by testing the interaction between various
dimensions of economic globalization and social justice in the countries of the European Union.
It should be noted that the EU member-states are very different realities, both in terms of
economic and technological development, as well as in the way in which their social and
political models are organized and operated. The application covers the period 2008-16, which
means that the impacts of the latest economic and financial crisis are assessed in the paper.
4. DATA AND METHODOLOGY
Here we will use two recently updated and renewed indicators with new methodologies that
seek to cover the diverse dimensions of globalization and social justice. We refer specifically
to the KOF indicators on globalization produced by the KOF Swiss Economic Institute1 and the
Social Justice indicator compiled by the Bertelsmann Stiftung. In methodological terms, we
will use regression and correlation analyzes between the variables of interest, after their graphic
visualization. As we have seen, the impacts of globalization on different economic and social
aspects have been widely discussed in the literature. To analyze such effects in the analytical
level it is necessary to have variables that allow to measure globalization as a multidimensional
phenomenon, which suggests the use of multifaceted indicators. Such indicators should reflect
how the process manifests itself in the lives of the citizens of the various countries that
communicate with each other, exchange goods and services, ideas and information, or
governments that cooperate to address global political problems. Thus, the measurement of
globalization is usually made using composite indicators that try to capture the different
manifestations of the phenomenon. Indicators such as KOF are presented as a solution, allowing
the combination of different levels of globalization in a final index, becoming the globalization
indicator most used in the literature. The KOF indicator was created by Dreher (2006), updated
in Dreher et al. (2008) and has recently broadened its scope with the work of Gyglia et.al.
(2018). Inherent in composite indicators is the risk of excessive simplification, which may result
in misinterpretation of the results. Therefore, instead of building an index based on a broad
definition, the new version of the KOF allows the flexible aggregation of different dimensions
and characteristics of globalization, introducing the clear distinction between de facto and de
jure measures. Thus, while de facto measures of globalization include variables representative
of flows and activities, de jure actions encompass variables that represent policies that generate
flows and activities. Quinn et al. (2011), had already shown that the use of measures of de facto
or de jure financial opening produced very different results in the causal link between the
growth of financial integration and economic opening. This separation between de facto and de
jure variables was applied to all sub-dimensions of the index.
1 https://www.kof.ethz.ch/en/forecasts-and-indicators/indicators/kof-globalisation-index.html, accessed on March 2, 2019
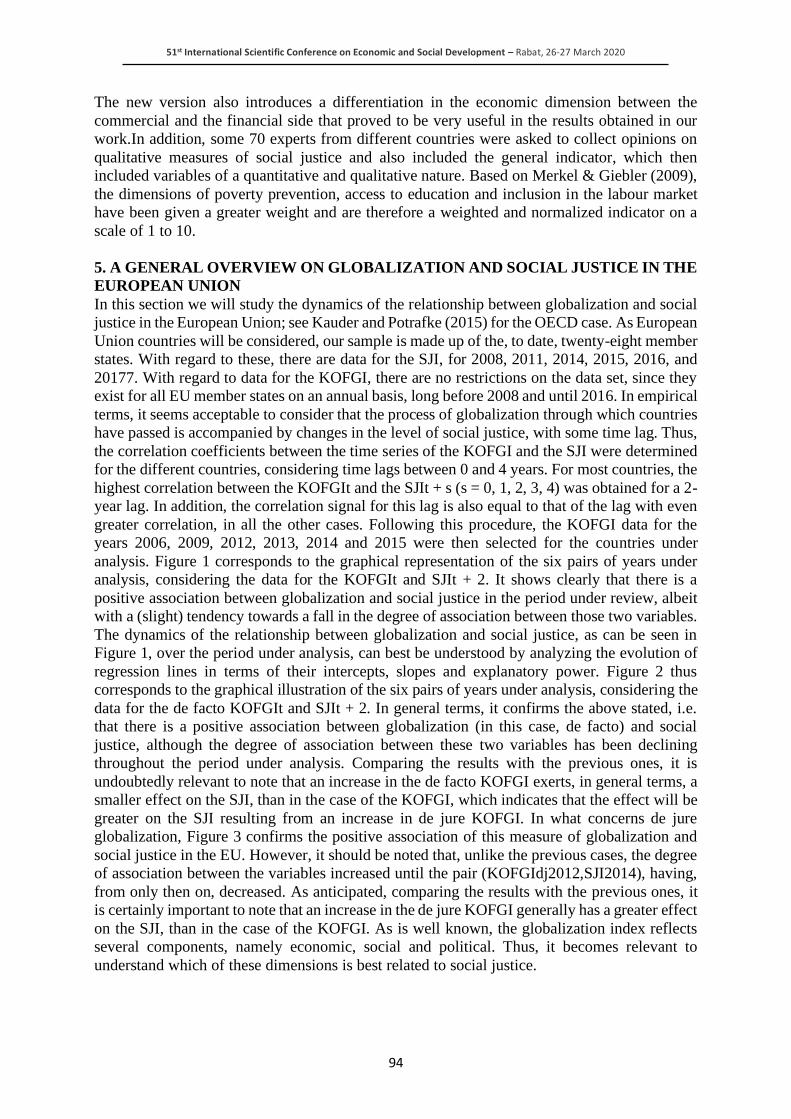
51st International Scientific Conference on Economic and Social Development – Rabat, 26-27 March 2020
94
The new version also introduces a differentiation in the economic dimension between the
commercial and the financial side that proved to be very useful in the results obtained in our
work.In addition, some 70 experts from different countries were asked to collect opinions on
qualitative measures of social justice and also included the general indicator, which then
included variables of a quantitative and qualitative nature. Based on Merkel & Giebler (2009),
the dimensions of poverty prevention, access to education and inclusion in the labour market
have been given a greater weight and are therefore a weighted and normalized indicator on a
scale of 1 to 10.
5. A GENERAL OVERVIEW ON GLOBALIZATION AND SOCIAL JUSTICE IN THE
EUROPEAN UNION
In this section we will study the dynamics of the relationship between globalization and social
justice in the European Union; see Kauder and Potrafke (2015) for the OECD case. As European
Union countries will be considered, our sample is made up of the, to date, twenty-eight member
states. With regard to these, there are data for the SJI, for 2008, 2011, 2014, 2015, 2016, and
20177. With regard to data for the KOFGI, there are no restrictions on the data set, since they
exist for all EU member states on an annual basis, long before 2008 and until 2016. In empirical
terms, it seems acceptable to consider that the process of globalization through which countries
have passed is accompanied by changes in the level of social justice, with some time lag. Thus,
the correlation coefficients between the time series of the KOFGI and the SJI were determined
for the different countries, considering time lags between 0 and 4 years. For most countries, the
highest correlation between the KOFGIt and the SJIt + s (s = 0, 1, 2, 3, 4) was obtained for a 2-
year lag. In addition, the correlation signal for this lag is also equal to that of the lag with even
greater correlation, in all the other cases. Following this procedure, the KOFGI data for the
years 2006, 2009, 2012, 2013, 2014 and 2015 were then selected for the countries under
analysis. Figure 1 corresponds to the graphical representation of the six pairs of years under
analysis, considering the data for the KOFGIt and SJIt + 2. It shows clearly that there is a
positive association between globalization and social justice in the period under review, albeit
with a (slight) tendency towards a fall in the degree of association between those two variables.
The dynamics of the relationship between globalization and social justice, as can be seen in
Figure 1, over the period under analysis, can best be understood by analyzing the evolution of
regression lines in terms of their intercepts, slopes and explanatory power. Figure 2 thus
corresponds to the graphical illustration of the six pairs of years under analysis, considering the
data for the de facto KOFGIt and SJIt + 2. In general terms, it confirms the above stated, i.e.
that there is a positive association between globalization (in this case, de facto) and social
justice, although the degree of association between these two variables has been declining
throughout the period under analysis. Comparing the results with the previous ones, it is
undoubtedly relevant to note that an increase in the de facto KOFGI exerts, in general terms, a
smaller effect on the SJI, than in the case of the KOFGI, which indicates that the effect will be
greater on the SJI resulting from an increase in de jure KOFGI. In what concerns de jure
globalization, Figure 3 confirms the positive association of this measure of globalization and
social justice in the EU. However, it should be noted that, unlike the previous cases, the degree
of association between the variables increased until the pair (KOFGIdj2012,SJI2014), having,
from only then on, decreased. As anticipated, comparing the results with the previous ones, it
is certainly important to note that an increase in the de jure KOFGI generally has a greater effect
on the SJI, than in the case of the KOFGI. As is well known, the globalization index reflects
several components, namely economic, social and political. Thus, it becomes relevant to
understand which of these dimensions is best related to social justice.

51st International Scientific Conference on Economic and Social Development – Rabat, 26-27 March 2020
95
Figure 1: The association between globalization and social justice in the EU
Figure 2: The association between de facto globalization and social justice in the EU
The arguments presented above justify a more detailed analysis in terms of the two strands of
the globalization index. As mentioned, we consider data for the revised version of the KOF by
Gygli et al. (2019). These authors distinguish de facto globalization as meaning of actual flows
and activities from de jure globalization as a means of policy measures that, in principle,
facilitate or aim to facilitate globalization. Indeed, if globalization can have positive
consequences, in particular an increase in social justice, de jure globalization can be expected
to present itself more clearly, possibly even more than defacto globalization, since this reflects
less controllable exogenous aspects by the economic authorities of each country.

51st International Scientific Conference on Economic and Social Development – Rabat, 26-27 March 2020
96
Figure 3: The association between de jure globalization and social justice in the EU
6. FINANCIAL GLOBALIZATION AND SOCIAL JUSTICE IN A DETAILED
OVERVIEW ON THE EUROPEAN UNION
As we have seen, economic literature remains somewhat divided in the debate on the effects of
free trade on income distribution. With regard to financial globalization, the application of the
principles of liberalization, by allowing savings to be channelled to countries where returns are
highest, have also been unquestionable for many years. In fact, capital flows between countries
enable inter-temporal consumption between them as a result of external borrowing and allow
investors to diversify portfolios globally. In the period after the financial crisis of 2007, several
studies were carried out on the impact of financial globalization on inequality in world terms.
For example, Jaumotte, Lall (2013) and Furceri et al. (2017) report the existence of negative
impacts of financial integration on inequality. In general, studies have argued that the
liberalization of external capital flows has led to significant and lasting declines in labour
participation in National Income and to corresponding increases in inequality, which can be
observed in the changes registered by the Gini coefficient. In this perspective, financial
globalization seems to have complemented the impacts of trade by exerting downward pressure
on labour share in the National Income. The question has therefore been asked to understand
why financial globalization contributes to this situation. There seems to be no great analogy to
the theorems of neoclassical theory of international trade, so that, as Rodrik (2018)
acknowledges, to some extent, the distributive effects of financial globalization are a real
surprise. In fact, the extreme volatility of financial flows is abruptly depressing the countries
most exposed to international markets, which significantly reduces their ability to react and the
effectiveness of any adjustment measures. Also in the euro area, financial integration has played
a major role in the dynamics of globalization and, in particular, in the evolution of social justice
in those countries. As a first step, monetary unification and the creation of the euro in 1999 led
to the reduction of risk premiums in countries where it was higher, such as Greece, Spain and
Portugal, leading to the convergence of borrowing costs amongst member countries. Such
developments have enabled the emergence of large current account deficits and the
accumulation of significant levels of external debt (Baldwin & Gros, 2015). Sectors that
produced non-tradable goods were boosted in the countries receiving foreign investment, to the

51st International Scientific Conference on Economic and Social Development – Rabat, 26-27 March 2020
97
detriment of the tradable goods sectors. This imbalance led to an accumulation of current
account deficits which, in the countries referred to, quickly became an economic and social
collapse, due to the sudden stoppage of external capital inflows that provoked financial and
economic crisis in the most indebted countries (Kang & Shambaugh, 2016). The crisis has
shown that trade and financial integration processes are of a different nature and may have
different effects on the stability of countries. Aizenman (2016) recognizes that trade impacts
are deeper and more structural than the effects of financial integration, which are more volatile
and revocable, affecting the countries involved and the European monetary union itself. This
distinction results from the inter-temporal nature of financial flows, which is undoubtedly
different from that of trade flows. Thus, financial globalization in conjunction with the
monetary unification, joining countries with high structural divergences in their economies and
with non-synchronized business cycles, has also produced adverse distributional impacts within
the group of countries of the euro zone, more expressively than in countries that had their own
currency (Raitano, 2016). It is in this background that we will further examine the empirical
analysis of this work, taking into account the developments in some of the EU Member States
regarding the KOF and SJI indicators in the period after the global financial crisis and the
subsequent sovereign debt crisis that affected some of the more fragile economies of the euro
zone. As is well known, despite all attempts at convergence, the European Union is made up of
countries with considerably different characteristics. Firstly, a possible approach would be to
separate countries according to whether or not they belong to the euro zone. Yet, within the
euro zone, a group of central countries and a group of peripheral countries can be identified.
Similarly, for countries outside the euro zone, a group of countries that have decided voluntarily
not to join and another group that may join the euro zone (but do not fulfil Maastricht criteria)
can be identified. Having this into account, we proceed with our analysis of the relationship
between globalization and social justice in the European Union, in a detailed way, by
considering the following four groups of member-states:
• Euro zone periphery (EZP) – Greece; Italy; Portugal; Spain.
• Euro zone core (EZC) – Austria, Belgium, Finland, France, Germany, Ireland,
Luxembourg, Netherlands.
• Opting out (OPT) – Denmark; Sweden, United Kingdom,
• Visιgrad group (VIS) – Czech Republic; Hungary; Poland; Slovakia.
Figure 4 shows the evolution of the relationship between globalization and social justice,
between 2008 and 2016. The OPT group clearly constitutes a cluster with the highest levels of
globalization and social justice, the relationship of which shows some dynamics, apparently in
the direction of greater globalization, accompanied by a reduction of social justice. In turn, the
EZC group is also plainly identifiable as a cluster, for which the dynamics of the link between
globalization and social justice have not changed significantly. With respect to the VIS group,
the dynamics of the relationship between globalization and social justice seem to point to an
inverse association between both, being apparent an increase in the level of social justice. The
EZP group stands out from the relationship between globalization and social justice, as
globalization levels have increased, but this has been associated with increases, but also a sharp
decline, from 2011 to 2014, in the levels of social justice.
Figure following on the next page
51st International Scientific Conference on Economic and Social Development – Rabat, 26-27 March 2020
98
Figure 4: The evolution of the relationship between globalization and social justice
The situation previously reported did not have the same expression when we used the indicator
of de facto financial globalization. In fact,, despite the fall in access to the labour market, the
level of financial integration of the EZP group remained unchanged during the crisis. On the
other hand, the globalization of the trade side has risen sharply in these countries, settling to the
loud rise in trade deficits in these countries, offset by Germany’s strong trade surpluses. For
many authors, the euro crisis has been seen as having at its origin the excessive fiscal deficits
that lead to the accumulation of significant public debts. This diagnosis applies mainly to
Greece and Italy, but also to Portugal and Spain, countries included in the EZP group.
Implicitly, the analysis suggests that these countries had a lax behaviour in their fiscal policy,
which removed their international competitiveness. It is a fact that the export-led growth
strategy has generated strong trade deficits in some euro area countries in the first decade of
this currency’s life. When the global financial crisis hit Europe, trade deficits have become
unsustainable. With the exception of Greece, neither public debts nor fiscal deficits were a
major problem in euro zone countries before 2008 (Weeks, 2014). Of course, the euro zone is
not a closed economy and its members are trading separately with the rest of the world, although
most of the flows take place inside the euro area. This means that the largest share of the external
demand of each member comes from within the monetary area itself. Therefore, the expansion
or contraction in the domestic demand of each member has an impact on the external demand
of the partners. Since countries use the same currency, in the case of the Euro, adjustments in
relative prices cannot be made by means of nominal reductions in the exchange rate, which can
then become deflationary and recessive for the whole area. In this way, asymmetric functioning
within Monetary Union is generated which is not limited to adjustments in the current account,
but is expressed in the crystallization of groups of creditor countries and debtors within the euro
zone, influencing the political orientations of the respective countries.
7. CONCLUSION
A basic principle of economics is that real life involves choices and trade-offs. Economic
globalization widens the influence of markets and limits the discretionary power of national
governments, hence the dilemmas posed between the efficiency of global markets and the
constraints in domestic markets to the redistributive policies of governments. The neoclassical
models of international trade have spurred the expectation that trade liberalization would
promote social justice, as the incomes of the less skilled in the poorer countries should increase.
However, although often overlooked, they also predicted that the incomes of the low-skilled in
developed countries should be reduced as a result of competitive imports from less developed
countries. The question is whether our conception of social justice is global or strictly national.
51st International Scientific Conference on Economic and Social Development – Rabat, 26-27 March 2020
99
The challenge of globalization then arises because it has increased the incomes of the most
highly skilled people in all quarters, promoting the reduction of inequality between countries
and, at the same time, aggravating inequality within (almost) all countries. There seems to be
strong evidence that the situation of the less skilled (poorer) has deteriorated in relative terms,
in both the more developed and less developed countries. At the same time, the welfare state
that must protect the poorest has been threatened by migration and the strong mobility of the
tax base, principally of capital. It has recently been surprising that the escalation of globalization
has put people in a precarious employment position, who felt they were protected from the
competition of low wages. The early stage of trade liberalization has led to deindustrialization
in developed countries, plagued by the relocation of sectors to low-cost countries, and
subsequently the liberalization of trade in services has exposed to competition those that
produce services that were previously not traded. Thus, global competition creates widespread
uncertainty and apprehension, which has grown as globalization has allowed the universal
diffusion of models that have made the Western world richer. The results of the empirical
application show that the countries with the greatest degree of globalization, regardless of
whether or not they are integrated into the euro zone, have better resisted the impacts of the
crisis and have not revealed significant declines in the social justice levels during the period.
Also, the countries that most recently joined the EU and which have a lower level of
globalization and maintain their monetary and exchange rate autonomy have not suffered losses
in terms of social justice, especially in access to the labour market and poverty risk indicators.
Finally, the southern countries that are part of the euro area and which have lower levels of
economic globalization have seen their levels of social justice deteriorate significantly during
the crisis, in particular as regards access to the labour market and the risk of poverty. Summing
up, the results obtained attest to the relevance of the interaction between the variables
considered in the paper: Globalization and Social Justice. Therefore, in later studies it is
justified to deepen and to detail the analysis the characteristics covered by the new
methodologies and variables considered in the indicators that we used. On the other hand, the
results also justify the apprehensions of many authors about the deficient architecture and
implementation of the European Monetary Union, which in a period of global financial crisis
did not have the capacity to provide support for the states that are hardest hit by the financial
markets and so to prevent the waves of contagion between the several member countries of the
single currency.
LITERATURE:
1. Aizenman, J. (2016). Optimal currency area: A 20th century idea for the 21st century?
NBER Working Paper, 22097. doi:10.3386/w22097
2. Aspers, P., & Kohl, S. (2015). Economic theories of globalization. In B. S. Turner & R. J.
Holton (Eds.), The Routledge international handbook of globalization studies. Routledge.
3. Baldwin, R. & Gros, D. (2015). What caused the Euro zone crisis? Retrieved from
https://www.ceps.eu/system/files/What%20caused%20the%20EZ%20Crisis%20B%20DG
%20CEPS%20Commentary.pdf
4. Brander, J. A., & Spencer, B. J. (1985). Export subsidies and international market share
rivalry. Journal of International Economics, 18(1-2), 83–100. doi:10.1016/0022-
1996(85)90006-6
5. Deardorff, A. (1994). The possibility of factor price equalization, revisited. Journal of
International Economics, 36(1–2), 167–175. doi:10.1016/0022-1996(94)90063-9
6. Dreher, A., Gaston, N., & Martens, P. (2008). Measuring globalization – Gauging its
consequences. Berlin, Germany: Springer.
51st International Scientific Conference on Economic and Social Development – Rabat, 26-27 March 2020
100
7. Engels, F., & Marx, K. (1969). Die Deutsche Ideologie. MEW 3. Berlin, Germany:
DietzVerlag. Review of International Organizations, 1–32. doi:10.100711558-019-09344-
2
8. Harger, K., Young, A. T., & Hall, J. C. (2017). Globalization, institutions, and income
convergence. The Journal of Regional Analysis & Policy, 47(2), 110–125.
9. Hernαndez, E., & Kriesi, H. (2016). The electoral consequences of the financial and
economic crisis in Europe. European Journal of Political Research, 55(2), 203–224.
doi:10.1111/1475-6765.12122
10. Herr, H., & Ruoff, B. (2015). Labour and financial markets as drivers of inequality. In A.
Gallas, H. Herr, F. Hoffer, & C. Scherrer (Eds.), Combating inequality: The global north
and south (pp. 77–95). Routledge.
11. Hillman, A. L. (2008). Globalization and social justice. The Singapore Economic Review,
53(02), 173–189. doi:10.1142/S0217590808002896
12. Hirschman, A. O. (1986). Rival views of market society and other recent essays. New York:
Viking.
13. Jaumotte, F., Lall, S., & Papageorgiou, C. (2013). Rising income inequality: technology, or
trade and financial globalization? IMF Economic Review, 61(2), 271–309.
doi:10.1057/imfer.2013.7
14. Jones, R. W. (1979). A three-factor model in theory, trade and history. In R. W. Jones (Ed.),
International Trade: Essays in Theory (pp. 85–101). Amsterdam, The Netherlands: North-
Holland.
15. Kang, J. S., & Shambaugh, J. C. (2016). The rise and fall of European current account
deficits. Economic Policy, 31(85), 153–199. doi:10.1093/epolic/eiv018
16. Kauder, B., & Potrafke, N. (2015). Globalization and social justice in OECD countries.
Review of World Economics, 151(2), 353–376. doi:10.100710290-015-0213-1
17. Merkel, W., & Giebler, H. (2009). Measuring social justice and sustainable governance in
the OECD. In B. Stiftung (Ed.), Sustainable governance indicators 2009, policy
performance and executive capacity in the OECD (pp. 187–215). Gόtersloh, Germany:
Bertelsmann Stiftung.
18. Pastor, L., & Veronesi, P. (2018). Inequality aversion, populism, and the backlash against
globalization (No. w24900). National Bureau of Economic Research. doi:10.3386/w24900
19. Potrafke, N. (2015). The evidence on globalization. World Economy, 38(3), 509–552.
doi:10.1111/twec.12174
20. Raitano, M. (2016). Income inequality in Europe since the crisis. Intereconomics, 51(2),
67-72. Retrieved from https://link.springer.com/article/10.1007%2Fs10272-016-0579-x
21. Ravallion, M. (2018). Inequality and globalization: A review essay. Journal of Economic
Literature, 56(2), 620–642. doi:10.1257/jel.20171419
22. Ricardo, D. (1970). On the principles of political economy and taxation. Cambridge, UK:
Cambridge University Press.
23. Samuelson, P. A. (1971). Ohlin was right. The Swedish Journal of Economics, 73(4), 365–
384. doi:10.2307/3439219
24. Smith, A. (1976). An inquiry into the nature and causes of the wealth of nations. Oxford,
UK: Clarendon Press.
25. Stiglitz, J. E. (2002). Globalization and its discontents. New York: W. W. Norton &
Company.
26. Stiglitz, J. E. (2006). Making globalization work. New York: W. W. Norton & Company.
51st International Scientific Conference on Economic and Social Development – Rabat, 26-27 March 2020
101
SLOVAK R&D STRATEGIC INFRASTRUCTURES AND SMART
SPECIALIZATION
Miroslav Balog
Centre of Social and Psychological Sciences, Slovak Academy of Sciences
Šancová 56, 811 05, Slovak Republic
ABSTRACT
The Slovak Republic shows low innovation performance compared to developed countries. One
of the reasons is the significant technological gap of public R&D organizations. In order to
improve this status, technological upgrading in public R&D organizations was systematically
supported by the national government. In total, 14 strategic research infrastructures, university
science parks and research centres were funded via European Structural Investment Funds
(ESIF). These infrastructures were built by the most respected national public universities and
the Slovak Academy of Sciences. The infrastructures show a tendency to specialize in line with
the R&D priority areas identified by the national Smart specialization strategy (RIS3). The aim
of the paper is to introduce the trends in cooperation with companies, as well as the services
provided to foster economic development.
Keywords: Science Park, Research Center, R&D, Innovation, Smart Specialization, ESIF, RIS3
1. INTRODUCTION
The first science parks emerged in the US in the early 1950s (Link, 2003), as a crucial
institutional innovation of the US innovation system. Science parks in the US created the
preconditions for economic development in the coming decades. Thanks to science parks, the
role of universities was highlighted, in terms of providing knowledge creation and the wide
spread of innovation into the economy. The importance of universities as a knowledge-provider
for business innovation is acknowledged (Bozeman, 2000) in the triple spiral concept as well
as the open innovation concept (Chesbrough, 2006). Science parks represent the catalytic
interface between traditional creators of (scientific) knowledge, such as universities, and
industry. Science parks can also be defined as a technology transfer vehicle for modernizing
(often regional) production systems. Other definitions consider science parks as real estate that
combines scientific skills from universities. Despite some variation in the definitions, the
science park is generally a physical site that differs from general property management by
providing opportunities for the transfer of knowledge between industry and academia (Hansson,
2005). As well as in the US, parks were created in many countries throughout the world. They
were set up in particular to support regional development and industries, as well as to stimulate
academia-industry interactions that would promote the emergence of new technology
companies (Henriques, 2018). Currently, there are many parks within the European Union
whose activities have almost doubled over the past 15 years (EC, 2013). The success of these
parks has also inspired many non-European countries (Şimşek, 2016; Phan, 2005; Yang, 2009).
In terms of strategic profiling, parks can be characterized by the specialization and services
provided (McCarthy, 2018). First, specialization represents the focus on the specific industry
or technology domain; it is strategic decision as to which kinds of companies are located in the
park (Bergek, 2008). Specialized parks are able to provide highly specific technology solutions,
making them more attractive across a particular industry that includes the companies located
within parks. Companies co-located within specialized science parks have similar needs and
interests, which encourage mutual cooperation and use of the same resources (Schwartz, 2010).
The second dimension is the extent of services provided to firms (Breznitz, 2017). The parks
can provide a wide range of services in different areas, and differ in the scope of services
51st International Scientific Conference on Economic and Social Development – Rabat, 26-27 March 2020
102
provided to firms. The range of services may be broad or narrow, as in the case of specialization
(McCarthy, 2018). By providing a wide range of services at favourable prices, the development
of companies can be effectively stimulated (Vanderstraeten, 2016). However, possible negative
consequences can be generated. For example, a firm’s dependence on the subsidized services
is seen as a negative effect. This may affect its ability to survive in the real market, as start-ups
in parks have higher mortality in general (Criaco, 2014), which may be associated with this
effect. The main components of all parks that underlie their activities are as follows: real estate,
technology transfer, and partnership amongst academia, the private sector and government
(Link, 2003). Science parks carry out some or all of these activities, providing space for their
tenants, especially for innovative start-ups which undertake applied R&D. For this reason, parks
include business incubators, and also accommodate other non-R&D entities that support start-
ups (Link, 2003). The overall setting depends on the extent to which they meet the needs of
tenant companies (Vanderstraeten, 2016). As these types of specific R&D infrastructures with
high expertise specialize in technological domains, they are capable of promoting economic
specialization and regional development. Therefore, they have become part of strategies for
smart specialization, which is a concept broadly implemented across the EU.
2. METHODOLOGY
Slovakia is classed as a low-innovation economy; this means that it is driven by multinational
companies, while local SMEs are not performing well due to their low innovation activities.
The main goal of the research was to evaluate selected aspects of new unique comprehensive
R&D infrastructures, namely science parks and research centres. These were created by the
public R&D organizations, namely universities and the Slovak Academy of Sciences (SAS).
The research was carried out by means of qualitative methods. The survey addressed all science
parks and research centres, to which questionnaires with closed and semi-open questions were
sent. Subsequently, in-depth interviews were conducted with parks/centres’ CEOs or financial
managers. The questionnaire survey was carried out in two series from October 2017 until
March 2018. This method of empirical research allowed the collection of both quantitative and
qualitative data. The questionnaire survey was focused on the collection of basic information,
as well as specific data in the area of provided services. After the questionnaire survey and data
processing, direct in-depth interviews with representatives of individual strategic
infrastructures took place from March to May. In case of any irregularities, telephone interviews
with authorized representatives were carried out from September to December.
3. MAIN FINDINGS
University science parks and research centres were built in Slovakia thanks to European
structural and investment funds, during the so-called 2007–2013 programming period. These
EU funds allowed the creation of a total of 14 science parks and research centres; these may be
considered strategic R&D infrastructures. From the budget perspective, research centres
projects were half the size of science parks. The projects were mostly realized on the basis of
consortia involving several organizations. Therefore, networking of public R&D organizations
and the selection of specialized technology domains were carried out. For example, the
Research Centre of Advanced Materials and Technologies (Promatech) involves respected
national universities, as well as the Slovak Academy of Sciences: these are the Institute of
Materials Research of SAS, Institute of Experimental Physics of SAS, Institute of Geotechnics
of SAS, Institute of Materials and Machine Mechanics of SAS, Technical University of Košice,
and Pavol Jozef Šafárik University in Košice. The support did not determine the preferred
technological areas; rather, these were selected by the consortia, who identified their R&D
strengths that were suitable for prospective cooperation with the industry.
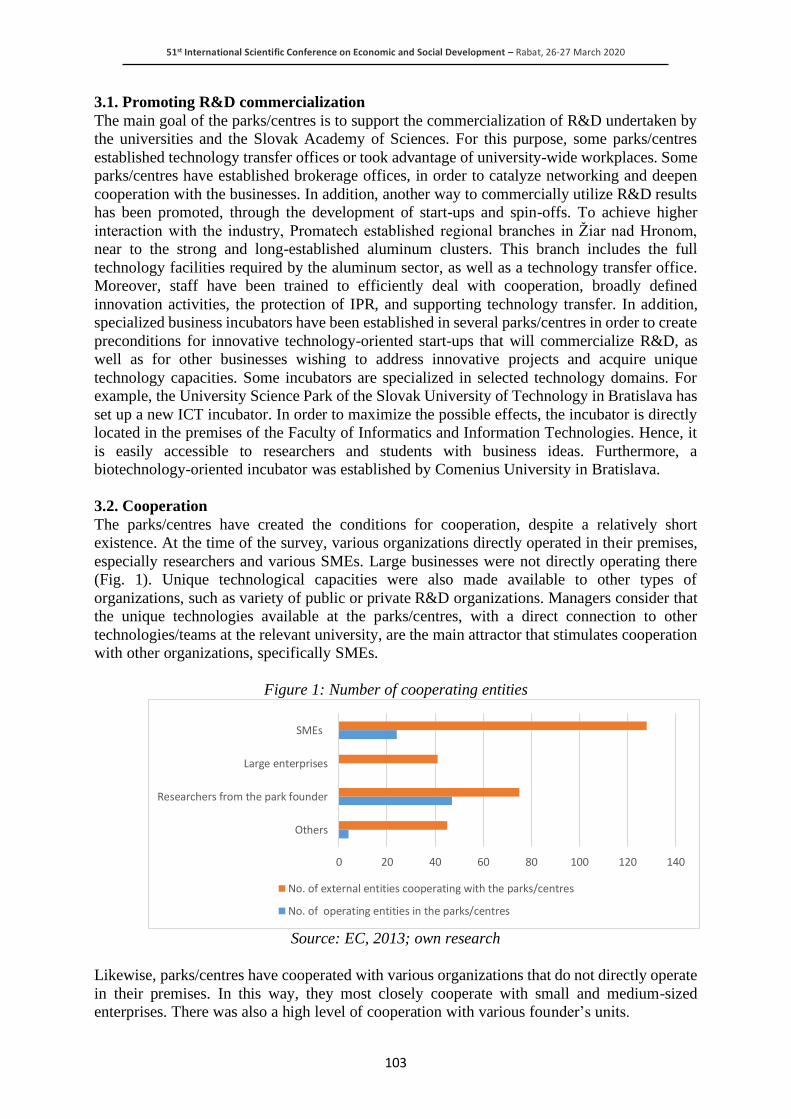
51st International Scientific Conference on Economic and Social Development – Rabat, 26-27 March 2020
103
3.1. Promoting R&D commercialization
The main goal of the parks/centres is to support the commercialization of R&D undertaken by
the universities and the Slovak Academy of Sciences. For this purpose, some parks/centres
established technology transfer offices or took advantage of university-wide workplaces. Some
parks/centres have established brokerage offices, in order to catalyze networking and deepen
cooperation with the businesses. In addition, another way to commercially utilize R&D results
has been promoted, through the development of start-ups and spin-offs. To achieve higher
interaction with the industry, Promatech established regional branches in Žiar nad Hronom,
near to the strong and long-established aluminum clusters. This branch includes the full
technology facilities required by the aluminum sector, as well as a technology transfer office.
Moreover, staff have been trained to efficiently deal with cooperation, broadly defined
innovation activities, the protection of IPR, and supporting technology transfer. In addition,
specialized business incubators have been established in several parks/centres in order to create
preconditions for innovative technology-oriented start-ups that will commercialize R&D, as
well as for other businesses wishing to address innovative projects and acquire unique
technology capacities. Some incubators are specialized in selected technology domains. For
example, the University Science Park of the Slovak University of Technology in Bratislava has
set up a new ICT incubator. In order to maximize the possible effects, the incubator is directly
located in the premises of the Faculty of Informatics and Information Technologies. Hence, it
is easily accessible to researchers and students with business ideas. Furthermore, a
biotechnology-oriented incubator was established by Comenius University in Bratislava.
3.2. Cooperation
The parks/centres have created the conditions for cooperation, despite a relatively short
existence. At the time of the survey, various organizations directly operated in their premises,
especially researchers and various SMEs. Large businesses were not directly operating there
(Fig. 1). Unique technological capacities were also made available to other types of
organizations, such as variety of public or private R&D organizations. Managers consider that
the unique technologies available at the parks/centres, with a direct connection to other
technologies/teams at the relevant university, are the main attractor that stimulates cooperation
with other organizations, specifically SMEs.
Figure 1: Number of cooperating entities
Source: EC, 2013; own research
Likewise, parks/centres have cooperated with various organizations that do not directly operate
in their premises. In this way, they most closely cooperate with small and medium-sized
enterprises. There was also a high level of cooperation with various founder’s units.
0 20 40 60 80 100 120 140
Others
Researchers from the park founder
Large enterprises
SMEs
No. of external entities cooperating with the parks/centres
No. of operating entities in the parks/centres

51st International Scientific Conference on Economic and Social Development – Rabat, 26-27 March 2020
104
The cooperation was also relatively intensive with large enterprises as well as other public R&D
organizations (Fig. 1). All parks/centres expect a boost in the direct involvement of various
R&D organizations, such as enterprises and other R&D organizations, which will use their
technological capabilities. This implies a gradual intensification of cooperation with market
actors. All parks/centres carry out various activities in order to stimulate this kind of
cooperation, and broader commercialization of R&D is broadly undertaken by universities and
the Slovak Academy of Sciences.
3.3. Services provided
Similar types of infrastructures in other countries provide a wide range of services. In general,
the services provided differ according to the type of park, technological focus, as well as the
development stage. Mapping at European level has divided the services provided into three
categories: i. Professional Business Support and Innovation Services; ii. Property-related
Services; and iii. Social and Recreational Services (EC, 2013). Slovak parks/centres also
provide a wide range of differect types of services in these categories. The first category,
Professional Business Support and Innovation Services, includes consulting, business
development, IPR and fundraising. The most European parks (EC, 2013) provide networking
(83.9%), business development (79%), assistance with venture/seed capital funds (77.4%), IPR
consultancy (66.1%), and accounting, legal and related services (62.9%). Slovak parks/centres
provide services to a much lower extent than the EU entities (Fig. 2). Most of them provide
networking (57.1%), training courses (42.9%) and IPR (42.9%). Only 7.1% provide assistance
with other venture/seed capital funds. It is expected that all types of services provided would
increase over the next five-year period. A greater increase is expected in the provision of
accounting, legal and related services (50%), but also in assistance with other venture/seed
capital funds (21.4%). A significant boost of venture/seed capital needs is linked with the
increased commercialization, via start-ups and spin-offs that will need external funding. Within
five years, it is anticipated that Slovak parks/centres will reach the level of their European
counterparts in terms of training courses (64.3%). It is also indicated that innovative enterprises
will need support in knowledge and skills development.
Figure 2: Professional Business Support and Innovation Services (%)
Source: EC, 2013; own research
0 10 20 30 40 50 60 70 80 90
Accounting, legal, and related services
Assistance with other venture/seed capital funds
Business development / Support services
IP consultancy. Patent attorneys. etc.
Development of resident organisations
Networking
Training courses
5 years present EU
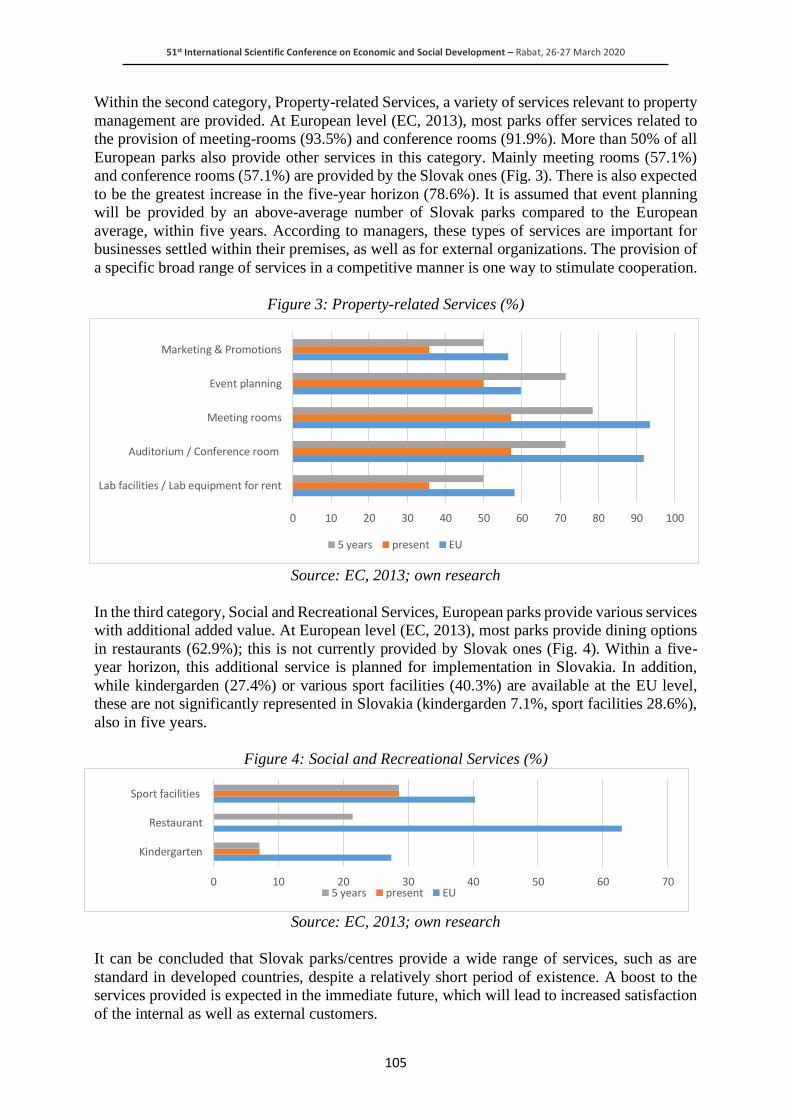
51st International Scientific Conference on Economic and Social Development – Rabat, 26-27 March 2020
105
Within the second category, Property-related Services, a variety of services relevant to property
management are provided. At European level (EC, 2013), most parks offer services related to
the provision of meeting-rooms (93.5%) and conference rooms (91.9%). More than 50% of all
European parks also provide other services in this category. Mainly meeting rooms (57.1%)
and conference rooms (57.1%) are provided by the Slovak ones (Fig. 3). There is also expected
to be the greatest increase in the five-year horizon (78.6%). It is assumed that event planning
will be provided by an above-average number of Slovak parks compared to the European
average, within five years. According to managers, these types of services are important for
businesses settled within their premises, as well as for external organizations. The provision of
a specific broad range of services in a competitive manner is one way to stimulate cooperation.
Figure 3: Property-related Services (%)
Source: EC, 2013; own research
In the third category, Social and Recreational Services, European parks provide various services
with additional added value. At European level (EC, 2013), most parks provide dining options
in restaurants (62.9%); this is not currently provided by Slovak ones (Fig. 4). Within a five-
year horizon, this additional service is planned for implementation in Slovakia. In addition,
while kindergarden (27.4%) or various sport facilities (40.3%) are available at the EU level,
these are not significantly represented in Slovakia (kindergarden 7.1%, sport facilities 28.6%),
also in five years.
Figure 4: Social and Recreational Services (%)
Source: EC, 2013; own research
It can be concluded that Slovak parks/centres provide a wide range of services, such as are
standard in developed countries, despite a relatively short period of existence. A boost to the
services provided is expected in the immediate future, which will lead to increased satisfaction
of the internal as well as external customers.
0 10 20 30 40 50 60 70 80 90 100
Lab facilities / Lab equipment for rent
Auditorium / Conference room
Meeting rooms
Event planning
Marketing & Promotions
5 years present EU
0 10 20 30 40 50 60 70
Kindergarten
Restaurant
Sport facilities
5 years present EU

51st International Scientific Conference on Economic and Social Development – Rabat, 26-27 March 2020
106
3.4. Specialization
In order to execute efficient R&D-related funds planning, the concept of smart specialization
strategies (RIS3) has been widely implemented at EU level (EC, 2012). This concept was a
significant impulse at national level, which shifted policy focus from the traditional science-
oriented priorities to market-oriented needs, as well as addressing crucial challenges such as
Industry 4.0. The national Research and Innovation Strategy for Smart Specialisation of the
Slovak Republic was approved in 2013. The strategy’s broad vision is defined as follows: To
drive a structural change in the Slovak economy towards growth, based on increasing
innovation capability and R&D excellence, in order to promote self-sustaining growth in
income, employment and standard of living. The strategy’s vision is intended to be achieved
through the following strategic objectives (RIS3 SK, 2013):
1. Deepening the integration and embeddedness of key major industries; increasing local
value, added through the cooperation of the local supply chains; and turning local supply
chains into embedded clusters
2. Increased contribution of research to the economic growth, via global excellence and local
relevance
3. Creating a dynamic, open and inclusive innovative society as one of the preconditions for
the increase in the standard of living
4. Improving the quality of human resources for an innovative Slovakia
The development of RIS 3 was the so-called ex-ante condition for obtaining European
Structural and Investment Funds resources for the 2014–2020 programming period. The aim of
this approach is to deliberately identify a limited number of priority areas to which sufficient
resources are subsequently allocated. Based on the national RIS 3, the Operational Programme
Research and Innovation was prepared, with an allocation of EUR 2.3 billion. In 2017, the RIS
3 Implementation Plan was developed to identify the technological priorities in detail (IP RIS3
SK, 2017). Five domain platforms have been created for this goal:
• Vehicles for the 21st century
• Industry for the 21st century
• Digital Slovakia and the creative industry
• Population health and health technologies
• Healthy food and the environment
Parks/centres carry out a number of different types of R&D activities that are in line with the
focus of all domains. This means that parks/centres have the potential to contribute to the
fulfillment of objectives in all priority areas under the national RIS3. Most of the parks/centres reported specialization in multiple domains. Most of them (9) operate only in the Population
Health and Health Technology domain. The smallest number are operating in the domain of Healthy Food and the Environment.
Domain No. of parks/centres
Vehicles for the 21st century 8
Industry for the 21st century 8
Digital Slovakia and the creative industry 5
Population health and health technologies 9
Healthy food and the environment 5
Table 1: Specialization in strategic Domains
A total of four parks/centres carry out R&D only in one domain; these are exclusively
biomedical-oriented organizations, which means that they are highly specialized entities.
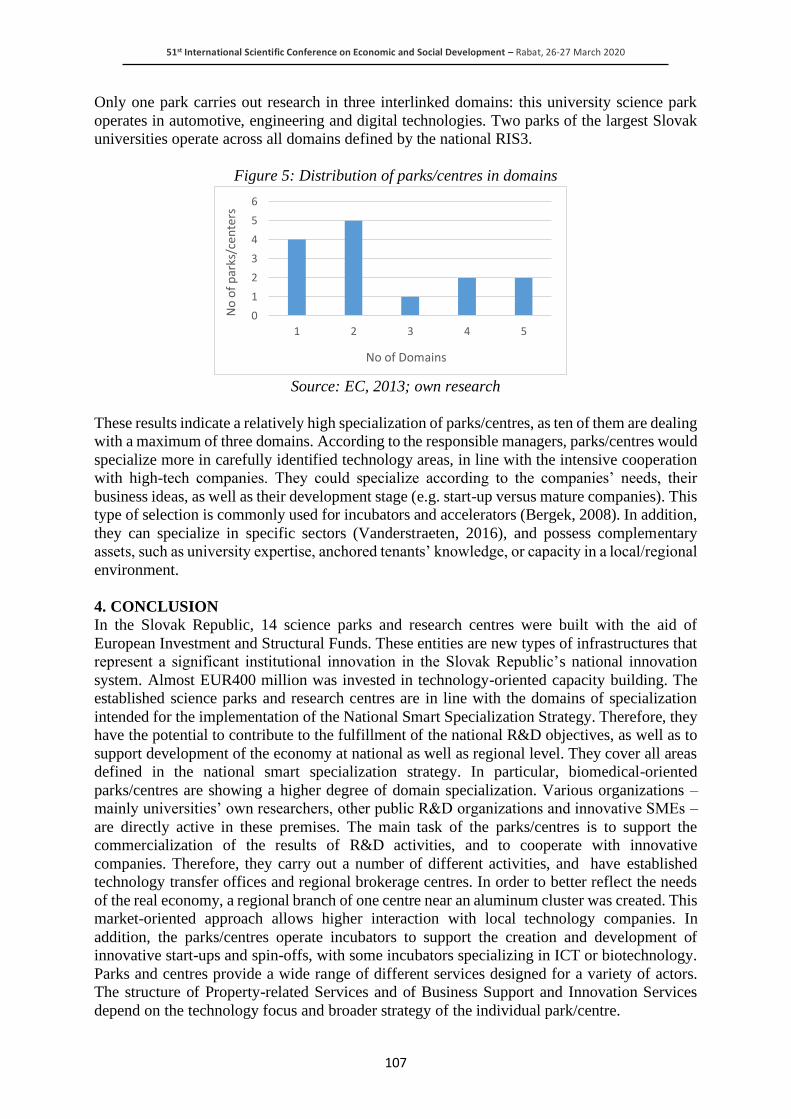
51st International Scientific Conference on Economic and Social Development – Rabat, 26-27 March 2020
107
Only one park carries out research in three interlinked domains: this university science park
operates in automotive, engineering and digital technologies. Two parks of the largest Slovak
universities operate across all domains defined by the national RIS3.
Figure 5: Distribution of parks/centres in domains
Source: EC, 2013; own research
These results indicate a relatively high specialization of parks/centres, as ten of them are dealing
with a maximum of three domains. According to the responsible managers, parks/centres would
specialize more in carefully identified technology areas, in line with the intensive cooperation
with high-tech companies. They could specialize according to the companies’ needs, their
business ideas, as well as their development stage (e.g. start-up versus mature companies). This
type of selection is commonly used for incubators and accelerators (Bergek, 2008). In addition,
they can specialize in specific sectors (Vanderstraeten, 2016), and possess complementary
assets, such as university expertise, anchored tenants’ knowledge, or capacity in a local/regional
environment.
4. CONCLUSION
In the Slovak Republic, 14 science parks and research centres were built with the aid of
European Investment and Structural Funds. These entities are new types of infrastructures that
represent a significant institutional innovation in the Slovak Republic’s national innovation
system. Almost EUR400 million was invested in technology-oriented capacity building. The
established science parks and research centres are in line with the domains of specialization
intended for the implementation of the National Smart Specialization Strategy. Therefore, they
have the potential to contribute to the fulfillment of the national R&D objectives, as well as to
support development of the economy at national as well as regional level. They cover all areas
defined in the national smart specialization strategy. In particular, biomedical-oriented
parks/centres are showing a higher degree of domain specialization. Various organizations –
mainly universities’ own researchers, other public R&D organizations and innovative SMEs –
are directly active in these premises. The main task of the parks/centres is to support the
commercialization of the results of R&D activities, and to cooperate with innovative
companies. Therefore, they carry out a number of different activities, and have established
technology transfer offices and regional brokerage centres. In order to better reflect the needs
of the real economy, a regional branch of one centre near an aluminum cluster was created. This
market-oriented approach allows higher interaction with local technology companies. In
addition, the parks/centres operate incubators to support the creation and development of
innovative start-ups and spin-offs, with some incubators specializing in ICT or biotechnology.
Parks and centres provide a wide range of different services designed for a variety of actors.
The structure of Property-related Services and of Business Support and Innovation Services
depend on the technology focus and broader strategy of the individual park/centre.
0
1
2
3
4
5
6
1 2 3 4 5
No
of
par
ks/c
ente
rs
No of Domains

51st International Scientific Conference on Economic and Social Development – Rabat, 26-27 March 2020
108
Most of the parks provide key services in the field of networking, as well as training courses,
IPR, meeting rooms and conference rooms. Relatively few parks provide services in the field
of assistance with other venture/seed capital funds; this is mainly due to insufficient deal flow.
Slovak parks/centres provide the services provided in European parks, in all categories.
However, these services are provided by fewer parks compared to the EU ones; the main reason
is that they are still in start-up phase.
ACKNOWLEDGEMENT: This work was supported by grant VEDA No. 2/0002/18.
LITERATURE:
1. Bergek, A., Norrman, C. (2008). Incubator best practice: a framework. Technovation, 28,
20-28.
2. Bozeman, B. (2000). Technology transfer and public policy: a review of research and
theory. Research Policy, 29(4-5), 627-655.
3. Breznitz, S.M., Clayton, P. A., Defazio, D., Isett, K. R. (2017). Have you been served? The
impact of university entrepreneurial support on start-ups’ network formation. The Journal
of Technology Transfer, 1-25.
4. Chesbrough, H. (2006). Open innovation: A new paradigm for understanding industrial
innovation. In H. Chesbrough, W. Vanhaverbeke, and J. West (Eds.), Open Innovation.
Researching a New Paradigm (pp. 1-12). New York, NY: Oxford University Press.
5. Criaco, G., Minola, T., Migliorini, P., Serarols-Tarrés, C. (2014). To have and have not”:
founders’ human capital and university start-up survival. The Journal of Technology
Transfer, 39(4), 567-593.
6. EC, European Commission (2012). Guide to Research and Innovation Strategies for Smart
Specialisations. Luxembourg: Publications Office of the European Union.
7. EC, European Commission (2013). Setting up, managing and evaluating EU Science And
Technology Park. An advice and guidance report on good practice. European Commission,
Directorate-General for Regional and Urban policy. REGIO DG Unit G1 - Competence
Centre: Smart and Sustainable Growth.
8. Hansson, F., Husted, K., Vestergaard, J. (2005). Second generation science parks: from
structural holes jockeys to social capital catalysts of the knowledge society.
Technovation,25(9), 1039-1049.
9. Henriques, I.C., Sobreiro, V. A., Kimura, H. (2018). Science and technology park: Future
challenges, Technology in Society, 53, 144-160
10. IP RIS3 SK (2017). Implementation Plan of the Research and Innovation Strategy for Smart
Specialization of the Slovak Republic, Office of the Deputy Prime Minister of the Slovak
Republic for Investments and Informatization
11. Link, A.N., Scott, J. T. (2003). U .S. science parks: the diffusion of an innovation and its
effects on the academic missions of universities. International Journal of Industrial
Organization, 21, 1323-1356.
12. McCarthy, I. P., Silvestre, B. S., Nordenflycht, A., Breznitz, S. M. (2018). A typology of
university research park strategies: What parks do and why it matters. Journal of
Engineering and Technology Management, 47, 110-122.
13. Phan, P. H., Siegel, D. S., Wright, M. (2005). Science parks and incubators: observations,
synthesis and future research. Journal of Business Venturing, 20(2), 165-182.
14. RIS3 SK. (2013). Research and Innovation Strategy for Smart Specialization of the Slovak
Republic. Ministry of Economy of the Slovak Republic
15. Schwartz, M., Hornych, C. (2010). Cooperation patterns of incubator firms and the impact
of incubator specialization: empirical evidence from Germany. Technovation, 30(9-10),
485-495.

51st International Scientific Conference on Economic and Social Development – Rabat, 26-27 March 2020
109
16. Şimşek, K., Yıldırım, N. (2016). Constraints to Open Innovation in Science and Technology
Parks. Procedia - Social and Behavioral Sciences, 235, 719-728.
17. Vanderstraeten, J., van Witteloostuijn, A., Matthyssens, P., Andreassi, T. (2016). Being
flexible through customization—the impact of incubator focus and customization strategies
on incubatee survival and growth. Journal of Engineering and Technology Management,
41, 45-64.
18. Yang, C., Motohashi, K., Chen, J. (2009). Are new technology-based firms located on
science parks really more innovative? Evidence from Taiwan. Research Policy, 38(1), 77-
85.
51st International Scientific Conference on Economic and Social Development – Rabat, 26-27 March 2020
110
ENTREPRENEURSHIP IN RENEWABLE ENERGY AND THE POWER
OF INNOVATION
Maria-Floriana Popescu
The Bucharest University of Economic Studies, Romania
ABSTRACT
Climate change has become one of the world’s greatest problems and is widely recognized as
the world’s most important environmental issue. In this study, we try to understand the complex
system of the renewable energy sector of entrepreneurial initiative. There is a radical threat to
the energy sector and while renewable sources gain exponential momentum and become more
and more incorporated into the energy mix, there is an increasing need for energy experts to
manage change with both the technical understanding and the mentality of business innovation,
and therefore take full advantage of an emerging world of possibilities. The article aims to
examine what are an entrepreneur’s key motives in this field and what factors affect the process
of creating a project for renewable energy. Moreover, the paper tries to present a conceptual
model of sustainable entrepreneurship in the renewable energy sector while taking into account
the power of innovation.
Keywords: Renewable Energy, Entrepreneurship, Innovation, Climate Change
1. INTRODUCTION
The threat of climate change has led in recent decades to a growing drive for companies
operating in the energy sector to find sustainable ways to meet energy demand. This move has
led to a rapid rise in the deployment of variable renewable energy capacity, such as wind and
solar, in the energy markets, resulting in an explosion of companies (and technology) seeking
to compete in the historically slow-moving and highly vertically integrated energy distribution
market (1, 2). Such new entrants bring with them new business models for how companies
build, develop and capture value, trying to address somewhat the gap between business as usual
in the energy sector and a fully renewable build energy sector. In addition, national strategic
energy strategies for the adoption of renewables and the transition to a zero carbon free emission
system (3, 4, 13–18, 5–12) do not usually discuss the potentially dramatic changes expected by
energy utilities and suppliers to implement variable renewable energy and to reach government
renewable goals, nor the effect this will have on the economic viability of their business models
(19–24). Similarly, although many traditional energy utilities have built strategic company
visions around increasing their use of renewable resources in the energy mix, few provide
concrete steps to adjust their business models to the future-proof, let alone profitable, of their
companies against a sustainable energy future (the European Union is though committed to
become climate neutral by 2050 and it has proposed the Climate Law – the legal expression of
European Union’s political engagement, which sets us on the road towards a more sustainable
future, the heart of the Green Deal, and it gives European industry and investors the
predictability and transparency, as well as guidance to EU’s green growth strategy, ensuring a
smooth and equitable transition for every Member State). In view of the emergence of new
business models for energy utility and along with the incentives give to SMEs and entrepreneurs
in the field, this paper seeks to examine the different business models currently employed by
companies operating in the energy utility area, both conventional models and those emerging
by companies trying to fulfil the role of energy utility. An important prerequisite for achieving
sustainable socio-economic systems is the transition from fossil fuels to renewable energy
sources (RES). In particular, the intertwined problems of climate change and depletion of fossil
fuel require active action towards a rapid transition to RES (25–32).

51st International Scientific Conference on Economic and Social Development – Rabat, 26-27 March 2020
111
This transition is very difficult for developed industrialized countries, where energy
consumption has risen 10-15 times since the Industrial Revolution and is currently dominated
by fossil fuel resources, as well as for so-called “developing” countries due to their lack of
financial resources and expertise while facing rapid rises in energy demand and transition
towards RES. For example, the latest data from the European Union regarding the share of
energy from renewable sources in gross final energy consumption (33) reached 18% in 2018
and it is more than double compared to 2004 when it was 8.5% (Figure 1).
Figure 1: Share of energy from RES in the EU Member States
Source: Eurostat, 2020
2. ENTREPRENEURSHIP IN RENEWABLE ENERGY
We used to hear in the past century that “business means business”. What that meant was that
money for profit and shareholder trumped over employee health or environmental protection.
To some, this laissez faire mentality may have built a foundation to prosperity, but for many
significant social costs and for the planet enduring environmental costs. Corporate social
responsibility has been all the rage for many years as it meant for a company to align its
activities with social values. We’re in a different era now, where other things matter. Over the
last fifty years, the role of entrepreneurship in society has changed dramatically. The value of
entrepreneurship seemed to fad off during the immediate post-World War II era. A generation
ago, the entrepreneurial firm did not seem to be influential in the approach of public policy to
boost growth and create employment within the framework of regional clusters. It was
presented to the public, for example Servan-Schreiber cautioned of the “American Challenge”
in the context of the “dynamism, organisation, innovation and boldness that characterize the
giant American corporations” (34) in proposing a new public policy strategy to foster growth
and international competitiveness at European level. Since giant companies were regarded as
the engine of development and innovation, Servan-Schreiber supported the “creation of large
industrial units which are able both in size and management to compete with the American
giants”(34). In recent years, the condition has been completely reversed as entrepreneurship has
become known throughout the world as an engine for economic and social development.

51st International Scientific Conference on Economic and Social Development – Rabat, 26-27 March 2020
112
“Entrepreneurship is an economic phenomenon worthy of attention from those who worry
about economic growth and particularly from those charged with sustaining that growth” (35).
While the global population rises, finite-resource reality is creeping in. The energy needs will
not forever be reliant on fossil fuels. Advances in technology have helped us to tap into reserves
that were previously inaccessible but that only delayed the inevitable. Together with negative
effects from fossil fuels, these concerns have generated an environmentally and socially
conscious attitude between different groups of economic actors, including consumers,
investors, companies and governments. Businesses and investors looking for gains have taken
advantage of consumer interest in cleaner energy options and green business projects start to be
encouraged by the government. Sustainability and sustainable growth are slowly gathering
traction in public discourse, and in academic research, with more focus and respect. The need
for “traditional” entrepreneurship is still needed and crucial to the ongoing growth of profound
innovation and market change, but a new generation of entrepreneurs emerges. A permanent
shift in the creation of communities is needed to guarantee an enduring potential. Sustainable
development is crucial not only to the long-term well-being of the environments, but also to
curving the inevitable slow decline of the human race. Environmentally and socially responsible
economics is imperative. Sustainable development sets the foundations for an emerging new
area of entrepreneurship-Sustainable Entrepreneurship which represents aspects of
environmental, economic, and social sustainability in a holistic approach to a venture start-up.
3. INNOVATIONS IN RENEWABLE ENERGY SOURCES
Fossil fuels are distinguished, given their impact on the environment, by favourable physical-
chemical characteristics (e.g., high power density, storable, inert under normal environment
conditions, etc.) enabling stable, high-quality energy flows that easily supply human societies.
By comparison, RES are typically characterized by lower power density levels, their usage
competes with other biosphere processes, while those with higher potential (i.e. wind, solar) are
critically impacted by their intermittency and volatility (36, 37, 46–53, 38–45). However,
because of their modularity and capacity to produce energy at a local level, RES offer a crucial
transformative ability from a social point of view, allowing for the creation of local, democratic
and participatory bottom-up initiatives from citizens. Thus, RES’ mutual ownership allows for
the democratization of access to resources (or means of production), and therefore has the
ability to contribute to the energy transition in a way that is far more meaningful than a mere
technical fix (25, 54, 62–70, 54–61). Energy systems undergo quick changes to meet the rising
volumes of integrated renewable energy, such as wind and solar. Recent years have seen
massive development of RESs. Privatization, the unbundling of the energy sector and financial
incentives and energy related policies have helped boost this progress. For example, in 2016,
RES generated 24.6 per cent of United Kingdom’s gross electricity consumption, mainly from
onshore and offshore wind farms and solar photovoltaic plants, representing 44.9 per cent and
12.5 per cent of the total RES capacity installed at 35.7 GW, respectively (71). RES are variable,
difficult to forecast and dependent on weather conditions, thus posing new challenges in the
management and operation of electricity systems, as more flexibility measures are needed to
ensure safe operation and stability. These measures include integration of fast-acting supply,
demand response and energy storage facilities. In addition to the improvements that have been
triggered by energy distribution and renewable resources, energy systems are at the edge of the
digital age. The massive deployment of smart meters in numerous countries has shown that they
are ready to commit for change in the digital technology transformation era, Industry 4.0 (72–
77). Energy systems will need significant investment in meeting ambitious targets for reducing
emissions. The EU alone is expected to require €200 billion per year for generation, network
and energy efficiency development (78) for the transition to a more sustainable and stable
energy system. Upgrades to the power grid in the US will cost $2 trillion by 2030 (79).
51st International Scientific Conference on Economic and Social Development – Rabat, 26-27 March 2020
113
Tasks that are increasingly daunting as energy systems evolve, to become more dynamic,
decentralized, complex and ‘multiagent’ with a growing number of actors and possible actions,
need to be adopted to mitigate needed investment. Enhanced communication and data sharing
between different parts of the power network is increasingly necessary, making it more difficult
for central and operation management. In order to accommodate these trends of decentralization
and digitisation, local centralized control and management techniques are required. One of the
most promising global innovations in recent history to tackle the problem of sustainable energy
supply can be seen the transition to renewable energies (80, 81). Renewable energies deliver
though two significant benefits: they are fairly clean, and they can be used in a decentralized
manner (82). Although the first advantage is widely known, it seldom receives the attention it
deserves. Decentralization has also played a crucial role in the energy transition, as private
households and businesses have invested in self-consumption solar systems to reduce their
energy bills. It leads though to a more competitive energy industry, and energy supply
“democratization”. The democratization, in addition to conventional energy companies, brings
new entrants to energy markets. The rise of Renewable Energy Cooperatives (RECs) can be
considered as one of the most prominent current trends. Based on the well-known idea of
cooperatives that originated in Europe in the 19th century (83), RECs offer incentives for
individual citizens and businesses outside the energy industry to, on one hand, combine
resources and become renewable power producers, and, on the other, engage in cooperative
energy usage. RECs have gained ground in many countries thanks to the growing international
recognition of renewable energy resources. For example, the European federation for renewable
energy cooperatives (REScoop) currently has 1500 RECs as members within its federation, and
a total of 1,000,000 European citizens (84).
4. KEY RESOURCES FOR A SUSTAINABLE ENTREPRENEUR
The development of a private profit-making company is not limited to entrepreneurship. In a
variety of contexts, entrepreneurship and entrepreneurial innovation, including small or large
corporations, non-profit organizations and government agencies, are commonly assumed to be
individuals who establish new business enterprises and gain private benefit, while it can be
concentrated on a local, regional or international marketplace. Entrepreneurship that focuses on
value for society is often called a social entrepreneurship (85–90), while entrepreneurship
focusing on value creation, both personally and privately, is simply called entrepreneurship.
Addressing ecological and social concerns would create economic and social incentives. This
is one of the core philosophies and a subject of this paper. Sustainable companies may help
address the concerns of society, while providing business owners with profit-making
opportunities. Therefore, the sustainable industry is primarily about improving business
practices as the successful businesses concentrate on developing innovative products / services
/ activities that resolve or alleviate current environmental and social concerns. Performance in
adopting sustainable business practices depends on innovation and entrepreneurship, the core
subjects of this paper (an apparently more and more debated in current times). Entrepreneurship
and creativity / innovation, in many specific sustainable business contexts, are important. These
are crucial to the success of start-ups that provide innovative solutions to the environmental or
social challenges we face nowadays. Entrepreneurship and creativity are also of great interest
for mature and notorious companies. Companies pursue sustainability entrepreneurship for a
number of purposes like improving their brand identity and reputation, or simply financially
gaining from becoming industry leaders in corporate practices that reduce environmental and
social impacts in their operating sphere. Some also engage in corporate innovation which affects
meaningful societal change (also there are individuals that engage in social entrepreneurship,
pursuing to change the society we live in today and aiming for the grated good – such an
example can be Bill Drayton who is regarded as one of our time’s most influential and
51st International Scientific Conference on Economic and Social Development – Rabat, 26-27 March 2020
114
innovative social entrepreneurs, who in 1980 founded Ashoka which aims to find and support
social entrepreneurs globally). If we are to talk about successful entrepreneurial initiatives, they
require quickly and efficiently mobilizing a wide range of capital. All entrepreneurial projects
must have resources such as capital, talent, and know-how (e.g., accounting, finance,
operations, management, legal, and regulatory), equipment, and facilities (91). Successful
entrepreneurial initiatives might even require quickly and efficiently mobilizing a wide range
of capital. Although management teams need to be hired fairly quickly, usually one or two
individuals are driving the entrepreneurial process initially through hard work and
determination to succeed. The business team becomes the key factor as the business grows, as
the expertise, knowledge, and capabilities of the entrepreneur must be improved and
complemented by the talents of other team members. Before beginning every new
entrepreneurial venture, it is important to have sufficient financial resources; this is no different
for tackling a sustainable business operation. Funding may come from a range of sources while
typically, when there are expectations for high growth in the industry, a new business may
attract private investors. Of this reason, clean technology is a business field that could
potentially draw investors. Above all the tools listed above, which are critical in the
entrepreneurial phase, there is a single most important factor in the shoes of the individual
entrepreneur – their ability to recognize a market opportunity and create an innovative solution
to that opportunity with market potential, to get a product or service out, to sell to consumers,
to assemble an organizational team, and to gain confidence, is the core of each new
entrepreneurial endeavour, as they need to be passionate, inspiring, motivated, and willing to
do what they do and engage to do in the future. There are various studies made on this subject
and field, but the profile of an energy entrepreneur role model in terms of key demographics
and competencies developed by EIT InnoEnergy can be found in Figure 2 (92), and it comprises
the data collected from five different European regions – namely, Iberia (Spain and Portugal),
Benelux (The Netherlands, Belgium and Luxemburg), Scandinavia (Sweden and Finland),
France and Germany – from a total of more than 800 entrepreneurial profiles.
Figure following on the next page
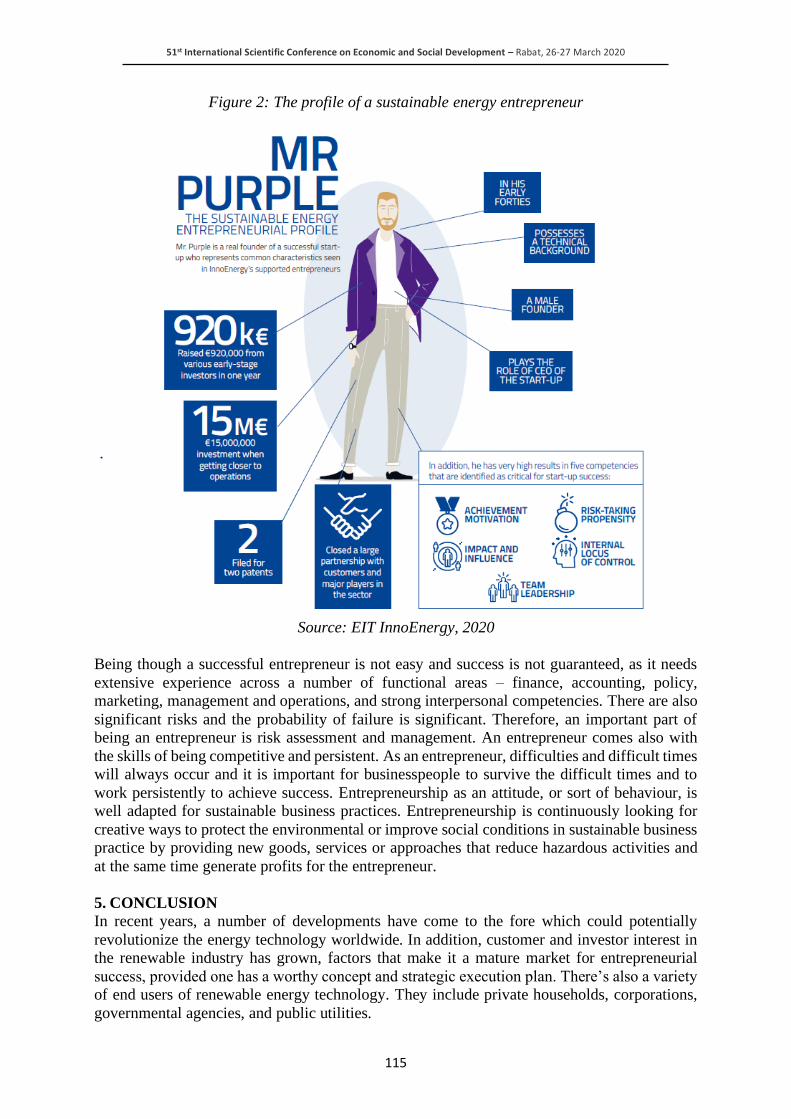
51st International Scientific Conference on Economic and Social Development – Rabat, 26-27 March 2020
115
Figure 2: The profile of a sustainable energy entrepreneur
Source: EIT InnoEnergy, 2020
Being though a successful entrepreneur is not easy and success is not guaranteed, as it needs
extensive experience across a number of functional areas – finance, accounting, policy,
marketing, management and operations, and strong interpersonal competencies. There are also
significant risks and the probability of failure is significant. Therefore, an important part of
being an entrepreneur is risk assessment and management. An entrepreneur comes also with
the skills of being competitive and persistent. As an entrepreneur, difficulties and difficult times
will always occur and it is important for businesspeople to survive the difficult times and to
work persistently to achieve success. Entrepreneurship as an attitude, or sort of behaviour, is
well adapted for sustainable business practices. Entrepreneurship is continuously looking for
creative ways to protect the environmental or improve social conditions in sustainable business
practice by providing new goods, services or approaches that reduce hazardous activities and
at the same time generate profits for the entrepreneur.
5. CONCLUSION
In recent years, a number of developments have come to the fore which could potentially
revolutionize the energy technology worldwide. In addition, customer and investor interest in
the renewable industry has grown, factors that make it a mature market for entrepreneurial
success, provided one has a worthy concept and strategic execution plan. There’s also a variety
of end users of renewable energy technology. They include private households, corporations,
governmental agencies, and public utilities.
51st International Scientific Conference on Economic and Social Development – Rabat, 26-27 March 2020
116
End users can use public incentives and can also affect public discourse and procurement
strategies, regulations, mandates and policies. Above all, green companies and sustainable
pioneers have an impact on their choices regarding new products and services. As end-users are
becoming more aware of the impact of a product on the environment from manufacturing to
discontinued use, customers might need cleaner production processes and recycling facilities
for the end of the life of a product. And this provides a business / entrepreneurial opportunity.
Moreover, innovation, as a further commitment towards it, will lower the barriers and costs of
pollution and efficiency standards in public policy, and this can also be true for some policies
to tackle social injustices (e.g. innovations that increase workers’ productivity and output and
can lower the costs of increasing minimum wages). Entrepreneurship and innovation, the
concepts that go hand in hand nowadays, also need success in sustainable entrepreneurial
practices. This paper provided an overview of entrepreneurship and innovation in terms of
sustainable development as the trend nowadays is on delivering new products and services as a
response to societal issues for a sustainable and proactive way to answer to climate change and
all other issues mankind is facing nowadays that threat the smooth existence of future
generations. The value of entrepreneurship and innovation also extends to businesses that
change the way products and services are created. Innovative practices and entrepreneurship
can be used by the latter to build their brand identity and to be market leaders in doing things
that generate mutual value for society and their companies and also contribute to improvements
in practices in their industry and entire society in the long run.
ACKNOWLEDGEMENT: This work was cofinanced from the European Social Fund through
Operational Programme Human Capital 2014-2020, project number POCU/380/6/13/125015
“Development of entrepreneurial skills for doctoral students and postdoctoral researchers in
the field of economic sciences”
LITERATURE:
1. S. T. Bryant, K. Straker, C. Wrigley, The typologies of power: Energy utility business
models in an increasingly renewable sector. J. Clean. Prod. (2018)
https:/doi.org/10.1016/j.jclepro.2018.05.233.
2. P. Nillesen, M. Pollitt, “New Business Models for Utilities to Meet the Challenge of the
Energy Transition” in Future of Utilities - Utilities of the Future: How Technological
Innovations in Distributed Energy Resources Will Reshape the Electric Power Sector,
(Elsevier Inc., 2016), pp. 283–301.
3. L. Krog, K. Sperling, A comprehensive framework for strategic energy planning based on
Danish and international insights. Energy Strateg. Rev. 24, 83–93 (2019).
4. S. Cajot, et al., Obstacles in energy planning at the urban scale. Sustain. Cities Soc. 30, 223–
236 (2017).
5. C. Morlet, J. Keirstead, A comparative analysis of urban energy governance in four
European cities (2013).
6. M. Procesi, et al., Strategic use of the underground in an energy mix plan: Synergies among
CO2, CH4 geological storage and geothermal energy. Latium Region case study (Central
Italy). Appl. Energy 110, 104–131 (2013).
7. S. Koskela, et al., Estonian electricity supply scenarios for 2020 and their environmental
performance. Energy Policy 35, 3571–3582 (2007).
8. J. F. Mercure, P. Salas, An assessement of global energy resource economic potentials.
Energy 46, 322–336 (2012).
9. F. Hvelplund, S. Djørup, Multilevel policies for radical transition: Governance for a 100%
renewable energy system. Environ. Plan. C Polit. Sp. 35, 1218–1241 (2017).

51st International Scientific Conference on Economic and Social Development – Rabat, 26-27 March 2020
117
10. B. Müller, The case for japanese—russian joint implementation in implementing the kyoto
protocol. Clim. Policy 1, 403–410 (2001).
11. W. Poortinga, M. Aoyagi, N. F. Pidgeon, Public perceptions of climate change and energy
futures before and after the Fukushima accident: A comparison between Britain and Japan.
Energy Policy 62, 1204–1211 (2013).
12. W. Uddin, et al., Current and future prospects of small hydro power in Pakistan: A survey.
Energy Strateg. Rev. 24, 166–177 (2019).
13. B. Lin, J. Liu, Y. Yang, Impact of carbon intensity and energy security constraints on
China’s coal import. Energy Policy 48, 137–147 (2012).
14. A. Mirakyan, R. De Guio, Integrated energy planning in cities and territories: A review of
methods and tools. Renew. Sustain. Energy Rev. 22, 289–297 (2013).
15. H. Al Garni, A. Kassem, A. Awasthi, D. Komljenovic, K. Al-Haddad, A multicriteria
decision making approach for evaluating renewable power generation sources in Saudi
Arabia. Sustain. Energy Technol. Assessments 16, 137–150 (2016).
16. C. Meza, A review on the Central America electrical energy scenario. Renew. Sustain.
Energy Rev. 33, 566–577 (2014).
17. N. Edomah, C. Foulds, A. Jones, Policy making and energy infrastructure change: A
Nigerian case study of energy governance in the electricity sector. Energy Policy 102, 476–
485 (2017).
18. European Parliament, Directive 2009/28/EC of the European Parliament and of the Council
of 23 April 2009. Off. J. Eur. Union 140, 16–62 (2009).
19. I. Gallego-Álvarez, I. M. García-Sánchez, C. da Silva Vieira, Climate Change and Financial
Performance in Times of Crisis. Bus. Strateg. Environ. 23, 361–374 (2014).
20. R. W. Bacon, J. Besant-Jones, Global electric power reform, privatization, and
liberalization of the electric power industry in developing countries. Annu. Rev. Energy
Environ. 26, 331–359 (2001).
21. S. Ruggiero, H. Lehkonen, Renewable energy growth and the financial performance of
electric utilities: A panel data study. J. Clean. Prod. 142, 3676–3688 (2017).
22. S. T. Bryant, K. Straker, C. Wrigley, The discourses of power – governmental approaches
to business models in the renewable energy transition. Energy Policy 130, 41–59 (2019).
23. S. T. Bryant, K. Straker, C. Wrigley, The typologies of power: Energy utility business
models in an increasingly renewable sector. J. Clean. Prod. 195, 1032–1046 (2018).
24. F. P. Sioshansi, “The Implications of Distributed Energy Resources on Traditional Utility
Business Model” in Renewable Energy Integration: Practical Management of Variability,
Uncertainty, and Flexibility in Power Grids: Second Edition, (Elsevier, 2017), pp. 271–
278.
25. N. W. Arnell, et al., A global assessment of the effects of climate policy on the impacts of
climate change. Nat. Clim. Chang. 3, 512–519 (2013).
26. J. Wang, L. Feng, X. Tang, Y. Bentley, M. Höök, The implications of fossil fuel supply
constraints on climate change projections: A supply-side analysis. Futures 86, 58–72
(2017).
27. I. Arto, I. Capellán-Pérez, R. Lago, G. Bueno, R. Bermejo, The energy requirements of a
developed world. Energy Sustain. Dev. 33, 1–13 (2016).
28. A. Garcia-Olivares, Energia para una sociedad post-carbono sostenible. Sci. Mar. 80, 257–
268 (2016).
29. Y. Y. Deng, et al., Quantifying a realistic, worldwide wind and solar electricity supply.
Glob. Environ. Chang. 31, 239–252 (2015).
30. I. Capellán-Pérez, C. de Castro, I. Arto, Assessing vulnerabilities and limits in the transition
to renewable energies: Land requirements under 100% solar energy scenarios. Renew.
Sustain. Energy Rev. 77, 760–782 (2017).
51st International Scientific Conference on Economic and Social Development – Rabat, 26-27 March 2020
118
31. K. Bithas, P. Kalimeris, Re-estimating the decoupling effect: Is there an actual transition
towards a less energy-intensive economy? Energy 51, 78–84 (2013).
32. I. Capellán-Pérez, M. Mediavilla, C. de Castro, Ó. Carpintero, L. J. Miguel, Fossil fuel
depletion and socio-economic scenarios: An integrated approach. Energy 77, 641–666
(2014).
33. Eurostat, SHARES (Renewables) (2020) (March 7, 2020).
34. J.-J. Servan-Schreiber, The American Challenge (Hamish Hamilton, 1968) (March 6, 2020).
35. D. M. Hart, The emergence of entrepreneurship policy: Governance, start-ups, and growth
in the U.S. knowledge economy (Cambridge University Press, 2003)
https:/doi.org/10.1017/CBO9780511610134.
36. D. Connolly, H. Lund, B. V. Mathiesen, E. Pican, M. Leahy, The technical and economic
implications of integrating fluctuating renewable energy using energy storage. Renew.
Energy 43, 47–60 (2012).
37. W. F. Pickard, D. Abbott, Addressing the intermittency challenge: Massive energy storage
in a sustainable future [Scanning the Issue] in Proceedings of the IEEE, (2012), pp. 317–
321.
38. T. Trainer, Some problems in storing renewable energy. Energy Policy 110, 386–393
(2017).
39. A. Harjanne, J. M. Korhonen, Abandoning the concept of renewable energy. Energy Policy
127, 330–340 (2019).
40. E. K. Hart, M. Z. Jacobson, A Monte Carlo approach to generator portfolio planning and
carbon emissions assessments of systems with large penetrations of variable renewables.
Renew. Energy 36, 2278–2286 (2011).
41. T. Trainer, Can renewables etc. solve the greenhouse problem? The negative case. Energy
Policy 38, 4107–4114 (2010).
42. T. Trainer, A critique of Jacobson and Delucchi’s proposals for a world renewable energy
supply. Energy Policy 44, 476–481 (2012).
43. M. Meinshausen, et al., Greenhouse-gas emission targets for limiting global warming to
2°C. Nature 458, 1158–1162 (2009).
44. T. Trainer, Can renewables etc. solve the greenhouse problem? The negative case. Energy
Policy 38, 4107–4114 (2010).
45. V. Smil, Power density: a key to understanding energy sources and uses (2015).
46. V. Smil, “Energy in nature and society: general energetics of complex systems” (2009)
(March 6, 2020).
47. C. A. S. Hall, K. Klitgaard, C. A. S. Hall, K. Klitgaard, “How We Do Economics Today”
in Energy and the Wealth of Nations, (Springer International Publishing, 2018), pp. 5–21.
48. C. A. S. Hall, K. Klitgaard, C. A. S. Hall, K. Klitgaard, “How We Got to Where We Are
Today: A Brief History of Economic Thought and Its Paradoxes” in Energy and the Wealth
of Nations, (Springer International Publishing, 2018), pp. 23–65.
49. C. A. S. Hall, K. Klitgaard, Energy and the wealth of nations: An introduction to biophysical
economics (Springer International Publishing, 2018) https:/doi.org/10.1007/978-3-319-
66219-0.
50. C. De Castro, M. Mediavilla, L. J. Miguel, F. Frechoso, Global solar electric potential: A
review of their technical and sustainable limits. Renew. Sustain. Energy Rev. 28, 824–835
(2013).
51. C. Schade, D. Pimentel, Population crash: Prospects for famine in the twenty-first century.
Environ. Dev. Sustain. 12, 245–262 (2010).
52. J. Rockström, M. Lannerstad, M. Falkenmark, Assessing the water challenge of a new green
revolution in developing countries. Proc. Natl. Acad. Sci. U. S. A. 104, 6253–6260 (2007).

51st International Scientific Conference on Economic and Social Development – Rabat, 26-27 March 2020
119
53. P. A. Kharecha, J. E. Hansen, Implications of “peak oil” for atmospheric CO2 and climate
(2007) https:/doi.org/10.1029/2007GB003142 (March 6, 2020).
54. I. Capellán-Pérez, N. Johanisova, J. Young, C. Kunze, Is community energy really non-
existent in post-socialist Europe? Examining recent trends in 16 countries. Energy Res. Soc.
Sci. 61 (2020).
55. R. Hueting, Why environmental sustainability can most probably not be attained with
growing production. J. Clean. Prod. 18, 525–530 (2010).
56. R. Salvador, M. V. Barros, L. M. da Luz, C. M. Piekarski, A. C. de Francisco, Circular
business models: Current aspects that influence implementation and unaddressed subjects.
J. Clean. Prod. 250 (2020).
57. V. Fournier, Escaping from the economy: The politics of degrowth. Int. J. Sociol. Soc.
Policy 28, 528–545 (2008).
58. Research, Degrowth Declaration of the Paris 2008 conference. J. Clean. Prod. 18, 523–524
(2010).
59. F. Schneider, G. Kallis, J. Martinez-Alier, Crisis or opportunity? Economic degrowth for
social equity and ecological sustainability. Introduction to this special issue. J. Clean. Prod.
18, 511–518 (2010).
60. S. Becker, C. Kunze, Transcending community energy: collective and politically motivated
projects in renewable energy (CPE) across Europe. People, Place and Policy Online 8, 180–
191 (2014).
61. S. D’Alessandro, T. Luzzati, M. Morroni, Energy transition towards economic and
environmental sustainability: feasible paths and policy implications. J. Clean. Prod. 18,
291–298 (2010).
62. F. Berkhout, P. Marcotullio, T. Hanaoka, Understanding energy transitions. Sustain. Sci. 7,
109–111 (2012).
63. C. Kunze, S. Becker, Collective ownership in renewable energy and opportunities for
sustainable degrowth. Sustain. Sci. 10, 425–437 (2015).
64. N. Johanisova, S. Wolf, Economic democracy: A path for the future? Futures 44, 562–570
(2012).
65. R. P. Thombs, When democracy meets energy transitions: A typology of social power and
energy system scale. Energy Res. Soc. Sci. 52, 159–168 (2019).
66. W. Bell, Futures studies comes of age: Twenty-five years after the limits to growth. Futures
33, 63–76 (2001).
67. N. Johanisova, S. Wolf, Economic democracy: A path for the future? Futures 44, 562–570
(2012).
68. B. Hamm, The study of futures, and the analysis of power. Futures 42, 1007–1018 (2010).
69. M. Redclift, In our own image: the environment and society as global discourse. Environ.
Hist. 1, 111–123 (1995).
70. S. Barca, Energy, property, and the industrial revolution narrative. Ecol. Econ. 70, 1309–
1315 (2011).
71. Department for Business Energy & Industrial Strategy, “DIGEST of United Kingdom
energy statistics 2017 - Chapter 6 Renewable sources of energy” (2017) (March 7, 2020).
72. A. B. Jaffe, R. G. Newell, R. N. Stavins, A tale of two market failures: Technology and
environmental policy. Ecol. Econ. 54, 164–174 (2005).
73. S. Zhou, D. C. Matisoff, G. A. Kingsley, M. A. Brown, Understanding renewable energy
policy adoption and evolution in Europe: The impact of coercion, normative emulation,
competition, and learning. Energy Res. Soc. Sci. 51, 1–11 (2019).
74. R. Veugelers, Which policy instruments to induce clean innovating? Res. Policy 41, 1770–
1778 (2012).

51st International Scientific Conference on Economic and Social Development – Rabat, 26-27 March 2020
120
75. C. Cuijpers, B. J. Koops, “Smart metering and privacy in Europe: Lessons from the Dutch
case” in European Data Protection: Coming of Age, (Springer Netherlands, 2013), pp. 269–
293.
76. S. S. S. R. Depuru, L. Wang, V. Devabhaktuni, Smart meters for power grid: Challenges,
issues, advantages and status. Renew. Sustain. Energy Rev. 15, 2736–2742 (2011).
77. S. Zhou, M. A. Brown, Smart meter deployment in Europe: A comparative case study on
the impacts of national policy schemes. J. Clean. Prod. 144, 22–32 (2017).
78. European Commission, “A Framework Strategy for a Resilient Energy Union with a
Forward-Looking Climate Change Policy” (2015).
79. P. Bronski, et al., “The economics of load defection: How grid-connected solar-plus-battery
systems will compete with traditional electric service–why it matters, and possible” (2015)
(March 7, 2020).
80. S. Chehbi-Gamoura, R. Derrouiche, Big valuable data in supply chain: Deep analysis of
current trends and coming potential in IFIP Advances in Information and Communication
Technology, (Springer New York LLC, 2017), pp. 230–241.
81. W. Ketter, M. Peters, J. Collins, A. Gupta, Competitive Benchmarking: An IS Research
Approach to Address Wicked Problems with Big Data and Analytics. SSRN Electron. J.
(2015) https:/doi.org/10.2139/ssrn.2700333.
82. B. Robyns, A. Davigny, B. François, A. Henneton, Electricity production from renewable
energies (2012) (March 7, 2020).
83. H. Bonus, Das Selbstverständnis moderner Genossenschaften: Rückbindung von
Kreditgenossenschaften an ihre Mitglieder (1994).
84. REScoop.eu (2020) (March 7, 2020).
85. J. Kickul, T. Lyons, Understanding social entrepreneurship: The relentless pursuit of
mission in an ever changing world (2016) (March 7, 2020).
86. C. Durkin, R. Gunn, Social entrepreneurship: A skills approach (2016) (March 7, 2020).
87. T. Saebi, N. J. Foss, S. Linder, Social Entrepreneurship Research: Past Achievements and
Future Promises. J. Manage. 45, 70–95 (2019).
88. C. Hervieux, A. Voltan, Framing Social Problems in Social Entrepreneurship. J. Bus. Ethics
151, 279–293 (2018).
89. H. Rawhouser, M. Cummings, S. L. Newbert, Social Impact Measurement: Current
Approaches and Future Directions for Social Entrepreneurship Research.
journals.sagepub.com 43, 82–115 (2019).
90. D. M. Kee, Defining social entrepreneurship: A Schumpeterian non-solution. Int. J. Entrep.
Small Bus. 31, 416–433 (2017).
91. R. Gittell, M. Magnusson, M. Merenda, Sustainable Business Cases (Flat World
Knowledge, Inc, 2013).
92. EIT InnoEnergy, “An analysis of entrepreneurial competencies in sustainable energy start-
ups in Europe” (2018) (March 8, 2020).
51st International Scientific Conference on Economic and Social Development – Rabat, 26-27 March 2020
121
FACTORS INFLUENCING ONLINE SHOPPING BEHAVIOR WITH
MEDIATING ROLE OF CUSTOMER PERCEIVED VALUE
Samar Rahi
Assistant Professor at Hailey College of Banking and Finance,
University of the Punjab Lahore, Pakistan
Maheen Ishaq
Research Scholar at Hailey College of Banking and Finance,
University of the Punjab Lahore, Pakistan
ABSTRACT
The internet has developed new ways of customer-firm interactions by changing the way
services are delivered to the customers. For Pakistan, though, the reception of such patterns
has been increasingly problematic. As admiration for online shopping cherished in Pakistan
several online websites popped up. Different variables are accountable to make a customer to
shop online, which is enormously helping the IT businesses in Pakistan to prosper. After the
adoption of online shopping in Pakistan, the main concern is to create customers satisfaction.
The aim of this paper is to present conceptual framework which identify and access the
perception of online shopping customers through the identification of factors having impact on
customer satisfaction. The motivation behind this study is to comprehend a model of web-based
shopping just as to bring up the real determining elements towards consumer satisfaction. The
customer satisfaction is the most important factor towards the development and expansion of
online stores.
Keywords: Information Quality, Website Design, Responsiveness, Privacy, Price, Delivery,
Customer Perceived Value, Customer Satisfaction
1. INTRODUCTION
The entry of the web has completely changed the manner in which businesses are directed
worldwide. Nowadays, users have a great network through which they can keep themselves in
touch with various online businesses. One of the options accessible to them is that of electronic
commerce, which can be characterized as an electronic atmosphere where purchasers and
dealers meet to trade certain goods and services. Electronic commerce is forcefully altering the
means for shopping. Nowadays, individuals are more enthusiastic to utilize technology in every
single field of their life, hence integrating advancement in their purchasing procedure too.
Fundamentally, the idea of online store was extended in 1990‟s Chen and Chang (2003). When
contrasted with regular or conventional shopping there has been a move towards internet
shopping because of simplicity, luxury, suitability, cost sparing and effectiveness. Web based
shopping is turning into an appropriate method of buying, regardless of whether you're at home,
in office, or in another nation. This is particularly valid for established nations, where each store
has its site you can purchase from. This tendency to shop online is now emerging in the Asia
also, particularly in Pakistan. Progression in technology has altered the way of delivering
services to the customers and has also changed the way by which a firm and a customer
interacts. Now the days are gone where one must go to the store for shopping. With the help of
up-to-date technology now presence of customer is not necessary because services are provided
over long distances without any physical presence. Online shopping is simplified by the
availability of internet to the consumers (Rahi & Ghani, 2018a, 2018b). As admiration for
online shopping cherished in Pakistan several online websites popped up.

51st International Scientific Conference on Economic and Social Development – Rabat, 26-27 March 2020
122
It is astonishing but welcoming development and an appropriate means of spending due to its
24-hour accessibility by the user as well as its worldwide range and well-ordered
communication of consumer and retailer. Preceding few years there is a huge traditional shift
of companies to online retailing (S. Rahi, 2017). This is due to the improved acceptance and
obtainability of Internet to a large number of users that has directed several business units to
have confidence in that now internet is irrefutable, an authentic and money-spinning network
of sales. As indicated by Economic Survey of Pakistan (2015-16), the number of internet users
have arrived at 30.99 million as compared to 2.10 million in (2011-12). However, the internet
entrance is 17.5% as per Internet Usage Stats, 2017. This development has generated the online
retail industry and culture of web-based shopping like Daraz.pk, Kaymu, Shophive.com,
Symbos.pk, Yayvo.com and some more. Numerous little online retailers have also made their
entrance into digital markets. Statistics released by SBP sets the scope of e-commerce market
at Rs99.3 billion in 2018 as compared to 51.8billion in 2017 with a yearly growth of 92 percent.
The number of e-commerce payments have rushed 2.3-times while the figure of registered e-
commerce merchants has enlarged by 2.6 times. At the end of 2017, the number of total
registered e-commerce merchants has enlarged to 905 as compared to 344 registered merchants
in 2016 (Samar Rahi, 2018). Businesses in Pakistan have embraced e-commerce. Hundreds of
retailers are now selling online goods to customers ranging from clothing to electronic
equipment. Quick increase in trend to shop online in Pakistan has undervalued the significance
of satisfaction of the customer which is an important factor to be kept in mind while scheming
any online retail outlet. Customers will return if they must not be satisfied with their experience
of online shopping (S. Kim & Stoel, 2004; S. Rahi, 2018a). For years, the satisfaction of
customer has been so significant in this sector of online shopping. Generating customer
satisfaction basically provides distinction and advantage over the competitors. A lot of factors
can create satisfaction of customers by meeting customer’s perception concerning online
services such as website design, information quality, price, delivery, response and
confidentiality. Dissatisfaction among customers usually lead to loss of the customers and
income. Dissatisfaction among customers arises if the quality of services being delivered
doesn’t meet the perception of the customers. Therefore, to e- commerce the factors creating
satisfaction of customers of online shopping in Pakistan is of prior significance. Perception of
customer is basically customer’s perception regarding quality of online shopping services being
delivered. Thus, customer’s satisfaction is created if perceived value of customers is positive.
As, there is direct link between satisfaction of customer and performance of organization shown
through research on satisfaction of customer and market orientation. So, if companies wanted
to gain competitive advantage then there is a need to understand their customers completely, as
a result they can provide services to their customers more competently and improve them
uninterruptedly Garver and Gagnon (2002). Subsequently, to attain growth and share in the
market, internet companies are required to know how to create customers satisfaction, in this
choppy e-commerce environment McKinney, Yoon, and Zahedi (2002).To compute
satisfaction of customers through online shopping, researchers have evolved and verified
various factors, from various perspectives Szymanski and Hise (2000); Koivumäki (2001);
Evanschitzky, Iyer, Hesse, and Ahlert (2004); S. Kim and Stoel (2004). Based on earlier
researches, this research seeks to empirically evaluate the perception of customer playing the
role of mediating variable in between online shopping services and customer satisfaction. This
errand is cultivated by plotting a consumer satisfaction model in nature of internet business,
perceiving key builds recommended by earlier examinations and building up a lot of theories.
2. LITERATURE REVIEW
Topic of satisfaction has been discussed extensively in the traditional retailing literature J. B.
Mason and Bearden (1979);Oliver and Linda (1981);E. W. Anderson, Fornell, and Lehmann
51st International Scientific Conference on Economic and Social Development – Rabat, 26-27 March 2020
123
(1994);Terblanche and Boshoff (2001);Ofir and Simonson (2007). Research on determining the
constructs of customer satisfaction under the context of e-commerce is at an encouraging stage
(Heiner, Gopalkrishnan, Josef, & Dieter, 2004; Rahi, Alnaser, & Ghani, 2019). The earlier
studies have been providing extensive foundation to gain understanding regarding satisfaction
of customer with respect to online shopping. From the viewpoint of purchasing process and
retail expertise, few experimental studies have been conducted in context of online shopping to
discover the fundamental determinants of customer satisfaction. Zhang, Prybutok, and Huang
(2006); Yang and Fang (2004) have made several attempts to examine the satisfaction of
customers when online services are provided to them. Various determinants have been
examined in context of e-services to determine the impact of customer’s perception on its
satisfaction (F. M. Alnaser, Ghani, & Rahi, 2019; Zhang et al., 2006).When online retailing
sites are such ordered and directed that shopping is supposed to be very pleased for the
customers then ultimately it will create customer satisfaction. Johnson, Nader, and Fornell
(1996) suggested that services being provided to the customer’s on-line store, must be reliable,
correct and based on up to standard data. Likewise, the information quality of a product has a
positive impact on the satisfaction of customer, founded on the evidence provided by Johnson
et al. (1996). Quality of information delivered by e-commerce markets is based on the
wholeness, correctness, set-up and currency features Wixom and Todd (2005). Usually, it deals
with trustworthiness, elasticity, incorporation, availability and appropriateness of an online
system. Product quality, service quality, system’s design, product quality of software and
quality of interaction between computer and human, are the various prospects through which
information quality of online websites is monitored (F. M. Alnaser et al., 2018; Kuo & Chen,
2011). In e-commerce retailing, the factor of privacy is also a critical concept Shergill and Chen
(2005); Stead and Gilbert (2001). This is due to the expectation of customers who requires
confidentiality of its financial and private data being shared with the retailer. Customer
perceived value is an essential marketing and branding concept entrenched in equity theory.
This concept is collaborating, relativistic preference and experience Holbrook (2005). To
predict buying behavior of customer, the concept of perceived value is considered a firm
paradigm R. E. Anderson and Srinivasan (2003). Therefore, the way customers perceive,
increases their willingness to buy and decreases their search intentions for substitutes. Chia Chi
Lin (2003) found that customer perceived value (saving money, convenience, time saving,
prompt delivery, warranty and free home delivery) has a significant impact on satisfaction of
customer.
2.1. Customer Satisfaction
Writing on satisfaction started in 1970’s Day and Hunt (1982). In this writing, to characterize
the term, ‘satisfaction’ two words have been used. A Latin term of 'satis' signifying 'adequate'
has been utilized to characterized initial segment of word satisfaction, though the subsequent
part contains a Latin term of 'faction' which signifies 'furious to do'. In past investigations, the
word itself has been utilized for level of solace and composure achieving from incorrect and
immoral deeds Aigbavboa and Thwala (2013). The idea of satisfaction has been utilized in
different disciplines in unexpected ways and associated to anybody of them: customers, sick
persons, laborers and workers. Satisfaction has been significantly related to clients utilizing the
items, in the field of marketing. A large portion of the work has been made regarding
satisfaction. This topic has been pondered by merchant concerning its consumer values and
assessments (Kim, 1997). Satisfaction is identical and equal for every user. This delineates that
satisfaction is a subjective term rather than any typical term. It has been a mistaken belief that
satisfaction is a feeling, rather it as an assessment of a feeling. Hoyer, Macinnis, and Pieters
(2001) related satisfaction with acknowledgment, relief, enjoyment, contentment, and energy
sensation.

51st International Scientific Conference on Economic and Social Development – Rabat, 26-27 March 2020
124
Furthermore, it is suggested that satisfaction acts as a linkage in the purchasing procedure or
occasionally it might function as a result of the purchasing procedure. Satisfaction has been
determined by related factors when it is seen as an utilization action or a result, whereas
satisfaction working as a procedure, indicate its precursors not simply the satisfaction Parker
and Mathews (2001). Swan and Combs (1976) stepped up to relate the term performance with
satisfaction. It has been suggested that either performance has a positive or a negative impact
on satisfaction. Perceived value of performance can determine the positive or a negative effect
on satisfaction when related with expectations. Satisfaction ends up being negative if perceived
value of performance falls beneath expectations and similarly, satisfaction ends up being
positive if the perceived value of performance falls above expectations. Oliver (1980) proposed
expectancy disconfirmation theory which displays more relevant, proper and summed up
meaning of this concept. As indicated by this concept, satisfaction of customer is related with
the change in performance of the product. Distinction among expectation and perception of the
performance of products leads to the satisfaction of customer. More prominent the expectations,
more noteworthy the satisfaction of customer will be Aigbavboa and Thwala (2013).
Satisfaction might be positive or negative disconfirmation. When perceived performance of the
product or services ends up being better, as compared to expectations then it is said to be
positive disconfirmation. Similarly, if the perceived performance of a product or services ends
up being not as much as it what was expected then it is termed as negative disconfirmation.
This concept basically, develops a link between satisfaction and the concept of expectations. In
majority of the latest literature, this is the most broadly accepted explanation of satisfaction.
Creation of satisfaction by the utilization of various rare assets of an organization turns out to
be positive Bearden and Teel (1983). Satisfaction of customer is constructively connected with
the retention of customer. Customer will perform various transactions, if he is satisfied with a
specific vendor, which will lead the business towards development and progression Zeithaml
(2000).
2.2. Information Quality
The actual D&M model was based on R. O. Mason (1978), modification of Shannon and
Weaver (1949) numerical theory of communication, who determined three degrees of
information: (1) accurateness and effectiveness of the framework producing information known
as technical level, (2) capacity to move the expected message known as semantic level, and (3)
its effect on the recipient known as effectiveness level (Shannon and Weaver, 1949). This
theory was adapted by R. O. Mason (1978) for information system and therefore extended the
level of effectiveness into three sub-classes: (1) receipt of data, (2) influence on the receiver,
and (3) influence on the framework. Delone and McLean model for the achievement of
information system is based on six variables: (1) quality of system, (2) quality of information,
(3) use of system, (4) satisfaction of user, (5) individual’s impact, (6) organizational impact.
This theory developed for information system postulates that the matchup between quality of
data and information positively affects performance, in case the client experiences satisfaction
and utilize the system (S. Rahi, 2018b). Quality of information involves the desired attributes
(for example significance, exactness, appropriateness, fulfillment, comprehension, and
availability) of the framework yields; that is basically web pages and reports of administration
(Petter, DeLone, & McLean, 2013). For Akter, D’Ambra, and Ray (2013) quality of
information performs an analytical part in building up an inspirational frame of mind toward
the benefits of utilizing a particular IT. As a whole, quality of information incorporates the
attributes of usefulness, appropriateness, completeness and accurateness Guo, Ling, and Liu
(2012). Relationship between information quality of a product and online satisfaction of a
customer has been analytically investigated by many researchers Szymanski and Hise (2000);
Cho and Park (2001);X. Liu, He, Gao, and Xie (2008); Maditinos and Theodoridis (2010); Eid
51st International Scientific Conference on Economic and Social Development – Rabat, 26-27 March 2020
125
(2011); Lin, Wu, and Chang (2011);Polites, Williams, Karahanna, and Seligman (2012);Guo et
al. (2012);Dharmesti and Nugroho (2013); Khan et al., 2015). X. Liu et al. (2008) and Maditinos
and Theodoridis (2010)have recognized that information quality of a product is a solid predictor
of customer satisfaction. During the search of information and valuation of substitutes clients
extremely depend on the provided information. Quality information exhibited by the site helps
clients in contrasting items, taking known decision regarding purchases and improving the
security of transaction C. Liu and Arnett (2000);Park and Kim (2003); Lin, 2007). Positive
relationship between information quality of product and online client satisfaction have also
been recognized by (Khan et al., 2015). Eid (2011) determined that satisfaction and trust of
customers is upgraded regarding online site, when the information provided through website is
more precise and dependable. Moreover, X. Liu et al. (2008) research discovers that increased
level of quality information will in turn increase customer satisfaction. This indicates that
quality information has a positive effect on satisfaction of customer. Thus, we hypothesized
information quality as:
• H1a. Information quality has a positive influence on customer perceived value.
• H1b. Information quality has a positive impact on customer satisfaction.
2.3. Website Design
Online customer satisfaction is associated with the characteristics of web design (Cho & Park,
2001; Rahi, 2019). Lee and Lin (2005) experienced that the design of website had a positive
impact on online customer satisfaction and perceived quality of services. Efficient design of
website consists of capability of navigation as well as graphical attraction Cyr (2008). Spiller
and Lohse (1997) indicate the impact of website design on online customer satisfaction. As
stated by Szymanski and Hise (2000) the vibe related with the site and how it operates play an
important role in determining the satisfaction of client regarding website. The current research
work has additionally contended that another significant factor which guarantees the success of
website is user friendly design Hsu, Chang, and Chen (2012). When website is quick, organized,
systematic and simple to explore then shopping is supposed to be more satisfying and enjoyable
Szymanski and Hise (2000). As per Dharmesti and Nugroho (2013) great web architecture
requires perfect screen appearance, well-defined path of data and fast loading of data which
will render web-based shopping increasingly pleasant to the clients and may influence
satisfaction of customer. It was recognized further that, numerous attributes of website design
have an impact on quality of services which as a result influences satisfaction of customers (D.
J. Kim, 2012; Rahi, Abd.Ghani, & Hafaz Ngah, 2019; Rahi, Ghani, & Ngah, 2020). The impact
of design of website on satisfaction of consumer has been considered broadly. Maditinos and
Theodoridis (2010) determined that, an important determining factor of online satisfaction of
consumer is the design of website. X. Liu et al. (2008) determined that website design has a
positive relation with online consumer satisfaction and their results are compatible with the
results of Szymanski and Hise (2000) and Eid (2011). The investigation of Szymanski and Hise
(2000) further shows that ample struggle on design of website proves to be significant because
clients' early reaction on website is determined through page structure, design and match of
colours. Similarly, a well-made website catches the attention of client and enhance the
opportunity of buying by increasing online customer satisfaction, Evanschitzky et al. (2014)
have further examined this impact and determined that design of website is an effective
indicator of online customer satisfaction. Thus, website design is proposed as:
• H2a. Website design has a positive influence on customer perceived value.
• H2b. Website design has a positive impact on customer satisfaction

51st International Scientific Conference on Economic and Social Development – Rabat, 26-27 March 2020
126
2.4. Responsiveness
In online atmosphere the rapidness of services providers responds properly to client is known
as responsiveness (Hu, Wang, & Hung, 2012; Rahi & Abd. Ghani, 2018; Zeithaml,
Parasuraman, & Malhotra, 2002). Sohn and Tadisina (2008) define responsiveness as readiness
or eagerness of workers. In this research, responsiveness is described as quick reply to the
request of clients and rapid processes. Responsiveness demonstrates how proficiently a firm
tends to deal with queries of client and offer explanation for their issues. In this situation, it is
necessary for firms to recognize the needs of client regarding their everyday tasks and make
these processes secure and effective (Parasuraman, Zeithaml, & Berry, 1988; Rahi & Abd.
Ghani, 2019b, 2019c). Researchers have discovered that responsiveness isn't just an essential
factor of SERVQUAL model, yet it has an additional impact on satisfaction of customer (Al-
Azzam, 2015; R. Samar & Mazuri, 2019a, 2019b). Degree of consumer satisfaction is increased
if workers respond actively to the queries of client Al-Azzam (2015). The level of
responsiveness is greatly reliant on the attitude and conduct of representatives. Therefore, it is
significant for firms to provide mandatory training to their representatives regarding consistent
dealing of clients. Thus, it will bring about increased online customer satisfaction and better
association with firms (Loke, Taiwo, Salim, Downe, & PETRONAS, 2011; Rahi & Abd. Ghani,
2019a). Thus, we proposed following hypothesis:
• H3a. Responsiveness has a positive influence on customer perceived value.
• H3b. Responsiveness has a positive impact on customer satisfaction.
2.5. Privacy
Zeithaml et al. (2002) built up a seven-dimensional model known as e-SERVQUAL for
determining quality of electronic services. The factors comprise of effectiveness, dependability,
satisfaction, privacy, responsiveness, recompense and contact. The first four factors constitute
the core of service quality model (F Alnaser, Ghani, & Rahi, 2018; S. Samar, Ghani, & Alnaser,
2017). The dimension of privacy incorporates confirmation of secrecy of data of transaction,
for instance, data of credit card (Zeithaml et al. (2002);Parasuraman, Zeithaml, and Malhotra
(2005)). Securing people's recognizable data on the web is an important issue of privacy to be
deal with. Selling and disclosing data of customer for the purpose of money-making were
discovered to be the critical predictor of privacy and trust (FMI Alnaser, Ghani, & Rahi, 2017).
As indicated by Schaupp and Bélanger (2005), in electronic commerce privacy can be termed
as the readiness to share individual’s personal data over the web, which is necessary when a
transaction is to be made concerning purchase. Numerous websites have set up policies
regarding privacy in order to facilitate minds of people McGinity (2000). In context of online
shopping, there are particular firms that confirm, audit and then declare policies regarding
privacy (Rahi, Ghani, & Ngah, 2018; Ranganathan & Ganapathy, 2002). As per Pan and
Zinkhan (2006), problem about privacy has a great impact on the trust of online customer with
regards to the online retailer. Indeed, a few investigations state that the main problem in the
extension of Internet shopping is the issue of privacy (Hoffman, Novak, & Peralta, 1999; Hou
& Rego, 2002; Rahi, Ghani, Alnaser, & Ngah, 2018). It is understood that more the clients have
a sense of security as well as assured of effective transactions or suitable reactions in the event
of any trouble, the more positive is their approach towards the online framework and the more
noteworthy is their level of satisfaction. Therefore, we proposed privacy as:
H4a. Privacy has a positive influence on customer perceived value.
H4b. Privacy has a positive impact on customer satisfaction.
2.6. Price
According to Zeithaml (1988), from the client’s point of view, “to obtain a product or a service
the amount what is given up or sacrificed is termed as price". Bei and Chiao (2001) determined

51st International Scientific Conference on Economic and Social Development – Rabat, 26-27 March 2020
127
that "the cost is characterized as what is forfeited or given up to obtain a certain product or
service ", while Kotler and Armstrong (2012) proposed that "price is the sum of money being
charged for the purpose of utilizing a certain product or a service ". Phillip and Keller (2012)
and Kusdyah (2012) described price as a measurable factor which comprises of a number of
indicators, for instance, reasonable cost, discounted cost, adequate cost, contender cost, and
suitability of cost. As per Oliver (1997), depending upon the principle of equity the price is
being judged by the customers in conformity to the quality of services being delivered to them
which brings about satisfaction or dissatisfaction of customer. In a macroeconomic research
based on seven industrial areas it was discovered that the perception of price impacts on client’s
satisfaction (F. Alnaser, M. Ghani, S. Rahi, M. Mansour, & H. Abed, 2017; Fornell, Johnson,
Anderson, Cha, & Bryant, 1996). In internet shopping, clients can't really observe or deal with
the item: they are uncertain that what is displayed on the web is compatible with what is really
gotten. In such an insecure environment, the perception of price plays a significant part in
calculating the post purchase satisfaction of client as well as client’s intention to return (F. M.
I. Alnaser, M. A. Ghani, S. Rahi, M. Mansour, & H. Abed, 2017; Crisp, Jarvenpaa, & Todd,
1997; C. Liu & Arnett, 2000). As there is a positive impact of price on customer satisfaction
so, firms should enhance their client’s satisfaction by meeting up their perception regarding
prices and offering them affordable, economical, appealing and low prices (S Rahi, 2017; Rahi,
Ghani, & Alnaser, 2017; R. Samar, Norjaya, & Feras, 2017). Thus, we advance the following
hypothesis on price:
• H5a. Price has a positive influence on customer perceived value.
• H5b. Price has a positive impact on customer satisfaction.
2.7. Delivery
The delivery of services is linked with the aptitude and ability of the service provider to deliver
certain products or services to the customer on time. It is essential as it will indicate towards
the customer’s satisfaction and loyalty. Therefore, to deliver desired products and services on
time proper planning as well as effective strategy is required [38]. In an investigation directed
by (X. Liu et al., 2008), the problem of delivery is a very common observable fact prevailing
in the atmosphere of online shopping and has a positive influence on shopping as well as
satisfaction of customer. Delay in delivery of certain product or services leads to dissatisfaction
of customer. Discoveries from various research work shows the positive impact of delivery on
satisfaction of customer. Therefore, we proposed following hypothesis:
• H6a. Delivery has a positive influence on customer perceived value.
• H6b. Delivery has a positive impact on customer satisfaction.
2.8. Customer Perceived Value
Customer perceived value is a major marking idea established in theory of equity. This idea is
collaborative, understanding and relativistic (Rahi, 2016b; S. Rahi & M. Ghani, 2016). The
concept of customer perceived value is viewed as a firm standard to foresee purchasing conduct
(R. E. Anderson & Srinivasan, 2003; Rahi, 2015). As a result, an increase in perceived value of
customer reduces the intent of customer to look for another possibility, hence a long-term
relationship is developed with dealers (Ghani, Rahi, Yasin, & Alnaser, 2017; S. Rahi & M. A.
Ghani, 2016). Author like Chia C Lin (2003) discovered that perceived value of customer is a
significant predictor of customer satisfaction. Customer perceived value and quality are the
basic elements influencing the satisfaction of a customer, which further impacts the loyalty of
customer (Rahi, 2016a; Rahi, Ghani, & Muhamad, 2017; Turel & Serenko, 2006). Thus,
customer perceived value is hypothesized as:
• H7. Customer perceived value has a positive impact on customer satisfaction

51st International Scientific Conference on Economic and Social Development – Rabat, 26-27 March 2020
128
3. RESEARCH MODEL
Figure 1: Research model
4. CONCLUSION
The main concern is to create customer satisfaction after the adoption of online shopping in
Pakistan, so this research work basically adds value to the sparse literature by investigating
online shopping customer satisfaction through a conceptual framework in e-commerce
environment. This conceptual model identifies and accesses the perception of online customer
all the way through identifying such factors having impact on customer’s satisfaction.
Furthermore, this research model incorporates variables known as information quality, website
design, responsiveness, price, delivery and customer perceived value as a mediator, having
impact on the satisfaction of customers. Customers who buy online are more concerned
regarding information quality, website design, responsiveness, price and delivery. All these
variables positively impact on the satisfaction of customers. Other variables having impact on
customer satisfaction such as customer trust, customer education, loyalty etc. needs to be
examined. All this lays down the foundation for future research work. In order to make research
work more representative and generalizable these parameters should be investigated at large
scale. This study will help businessmen, retailers, merchants, customers and scholars. In order
to get better understanding of customers in the context of online shopping, this research work
can also be conducted in other countries.
LITERATURE:
1. Aigbavboa, C., & Thwala, W. (2013). A theoretical framework of users’
satisfaction/dissatisfaction theories and models. Paper presented at the 2nd International
Conference on Arts, Behavioral Sciences and Economics Issues (ICABSEI'2013) Dec.
2. Akter, S., D’Ambra, J., & Ray, P. (2013). Development and validation of an instrument to
measure user perceived service quality of mHealth. Information & Management, 50(4),
181-195.
51st International Scientific Conference on Economic and Social Development – Rabat, 26-27 March 2020
129
3. Al-Azzam, A. F. M. (2015). The impact of service quality dimensions on customer
satisfaction: A field study of Arab bank in Irbid city, Jordan. European Journal of Business
and Management, 7(15), 45-53.
4. Alnaser, F., Ghani, M., & Rahi, S. (2017). The Impact of SERVQUAL Model and
Subjective Norms on Customer’s Satisfaction and Customer Loyalty in Islamic Banks: A
Cultural Context. Int J Econ Manag Sci, 6(5), 455.
5. Alnaser, F., Ghani, M., & Rahi, S. (2018). Service quality in Islamic banks: The role of
PAKSERV model, customer satisfaction and customer loyalty. Accounting, 4(2), 63-72.
6. Alnaser, F., Ghani, M., Rahi, S., Mansour, M., & Abed, H. (2017). Determinants of
Customer Loyalty: The Role of Service Quality, Customer Satisfaction and Bank Image of
Islamic Banks in Palestine. Int J Econ Manag Sci, 6(461), 2.
7. Alnaser, F. M., Ghani, M. A., & Rahi, S. (2019). The Implementation of Partial Least
Square Modelling (PLS) For Marketing Research in Arab Countries: Introduction to
Beginner Users-Evidence from Islamic Banks of Palestine. Economic and Social
Development: Book of Proceedings, 1134-1141.
8. Alnaser, F. M., Ghani, M. A., Rahi, S., Mansour, M., Abed, H., & Alharbi, A. H. (2018).
Extending the Role of Servqual Model in Islamic Banks with Subjective Norms, Customer
Satisfaction and Customer Loyalty. Paper presented at the Economic and Social
Development (Book of Proceedings), 32nd International Scientific Conference on
Economic and Social.
9. Alnaser, F. M. I., Ghani, M. A., Rahi, S., Mansour, M., & Abed, H. (2017). The Influence
of Services Marketing Mix (7 Ps.) and Subjective Norms on Customer’s Satisfaction in
Islamic Banks of Palestine. European Journal of Business and Management, 9(27).
10. Anderson, E. W., Fornell, C., & Lehmann, D. R. (1994). Customer satisfaction, market
share, and profitability: Findings from Sweden. Journal of marketing, 58(3), 53-66.
11. Anderson, R. E., & Srinivasan, S. S. (2003). E‐satisfaction and e‐loyalty: A contingency
framework. Psychology & marketing, 20(2), 123-138.
12. Bearden, W. O., & Teel, J. E. (1983). Selected determinants of consumer satisfaction and
complaint reports. Journal of Marketing Research, 20(1), 21-28.
13. Bei, L.-T., & Chiao, Y.-C. (2001). An integrated model for the effects of perceived product,
perceived service quality, and perceived price fairness on consumer satisfaction and loyalty.
Journal of consumer satisfaction, dissatisfaction and complaining behavior, 14, 125.
14. Chen, S. J., & Chang, T. Z. (2003). A descriptive model of online shopping process: some
empirical results. International Journal of Service Industry Management.
15. Cho, N., & Park, S. (2001). Development of electronic commerce user‐consumer
satisfaction index (ECUSI) for Internet shopping. Industrial Management & Data Systems.
16. Crisp, C. B., Jarvenpaa, S. L., & Todd, P. A. (1997). Individual differences and internet
shopping attitudes and intentions. Graduate School of Business Working Paper, University
of Texas.
17. Cyr, D. (2008). Modeling web site design across cultures: relationships to trust, satisfaction,
and e-loyalty. Journal of Management Information Systems, 24(4), 47-72.
18. Day, R. L., & Hunt, H. K. (1982). New findings on consumer satisfaction and complaining.
19. Dharmesti, M. D. D., & Nugroho, S. S. (2013). The antecedents of online customer
satisfaction and customer loyalty. Journal of Business and Retail Management Research,
7(2).
20. Eid, M. I. (2011). Determinants of e-commerce customer satisfaction, trust, and loyalty in
Saudi Arabia. Journal of electronic commerce research, 12(1), 78.
21. Evanschitzky, H., Emrich, O., Sangtani, V., Ackfeldt, A.-L., Reynolds, K. E., & Arnold, M.
J. (2014). Hedonic shopping motivations in collectivistic and individualistic consumer
cultures. International Journal of Research in Marketing, 31(3), 335-338.
51st International Scientific Conference on Economic and Social Development – Rabat, 26-27 March 2020
130
22. Evanschitzky, H., Iyer, G. R., Hesse, J., & Ahlert, D. (2004). E-satisfaction: a re-
examination. Journal of retailing, 80(3), 239-247.
23. Fornell, C., Johnson, M. D., Anderson, E. W., Cha, J., & Bryant, B. E. (1996). The
American customer satisfaction index: nature, purpose, and findings. Journal of marketing,
60(4), 7-18.
24. Garver, M. S., & Gagnon, G. B. (2002). Seven keys to improving customer satisfaction
programs. Business Horizons, 45(5), 35-42.
25. Ghani, M. A., Rahi, S., Yasin, N. M., & Alnaser, F. M. (2017). Adoption of Internet
Banking: Extending the Role of Technology Acceptance Model (TAM) with E-Customer
Service and Customer Satisfaction. World Applied Sciences Journal, 35(9), 1918-1929.
26. Guo, X., Ling, K. C., & Liu, M. (2012). Evaluating factors influencing consumer
satisfaction towards online shopping in China. Asian Social Science, 8(13), 40.
27. Heiner, E., Gopalkrishnan, R., Josef, H., & Dieter, A. (2004). E-satisfaction: a re-
examination. Journal of retailing, 80(3), 239-247.
28. Hoffman, D. L., Novak, T. P., & Peralta, M. A. (1999). Information privacy in the
marketspace: Implications for the commercial uses of anonymity on the Web. The
Information Society, 15(2), 129-139.
29. Holbrook, M. B. (2005). Customer value and autoethnography: subjective personal
introspection and the meanings of a photograph collection. Journal of business research,
58(1), 45-61.
30. Hou, J., & Rego, C. (2002). Internet marketing: An overview. Office of Naval Research
(ONR), Grant N, 140110917, 2002.
31. Hoyer, W. D., Macinnis, D. J., & Pieters, R. (2001). Customer behavior. Boston, Houghton
Mifflin Company.
32. Hsu, C.-L., Chang, K.-C., & Chen, M.-C. (2012). The impact of website quality on customer
satisfaction and purchase intention: perceived playfulness and perceived flow as mediators.
Information Systems and e-Business Management, 10(4), 549-570.
33. Hu, Y. C., Wang, J. H., & Hung, L. P. (2012). Evaluating microblogging e‐service quality
using ANP. Journal of Multi‐Criteria Decision Analysis, 19(1-2), 89-111.
34. Johnson, M. D., Nader, G., & Fornell, C. (1996). Expectations, perceived performance, and
customer satisfaction for a complex service: The case of bank loans. Journal of Economic
Psychology, 17(2), 163-182.
35. Kim, D. J. (2012). An investigation of the effect of online consumer trust on expectation,
satisfaction, and post-expectation. Information Systems and e-Business Management, 10(2),
219-240.
36. Kim, S., & Stoel, L. (2004). Apparel retailers: website quality dimensions and satisfaction.
Journal of Retailing and Consumer Services, 11(2), 109-117.
37. Koivumäki, T. (2001). Customer satisfaction and purchasing behaviour in a web-based
shopping environment. Electronic Markets, 11(3), 186-192.
38. Kotler, P., & Armstrong, G. (2012). Principles of marketing 14th edition. New Jearsey:
Pearson Education Inc.
39. Kuo, H.-M., & Chen, C.-W. (2011). Application of quality function deployment to improve
the quality of Internet shopping website interface design. International Journal of
Innovative Computing, Information and Control, 7(1), 253-268.
40. Kusdyah, I. (2012). Persepsi Harga, Persepsi Merek, Persepsi Nilai, dan Keinginan
Pembelian Ulang Jasa Clinic Kesehatan (Studi Kasus Erha Clinic Surabaya). Jurnal
Manajemen Pemasaran, 7(1), 25-32.
41. Lee, G. G., & Lin, H. F. (2005). Customer perceptions of e‐service quality in online
shopping. International Journal of Retail & Distribution Management.

51st International Scientific Conference on Economic and Social Development – Rabat, 26-27 March 2020
131
42. Lin, C.-C., Wu, H.-Y., & Chang, Y.-F. (2011). The critical factors impact on online
customer satisfaction. Procedia Computer Science, 3, 276-281.
43. Lin, C. C. (2003). A critical appraisal of customer satisfaction and e‐commerce. Managerial
Auditing Journal.
44. Lin, C. C. (2003). The role of customer perceived value in generating customer satisfaction:
An e-business perspective. Journal of Research in Marketing & Entrepreneurship, 5(1), 25-
39.
45. Liu, C., & Arnett, K. P. (2000). Exploring the factors associated with Web site success in
the context of electronic commerce. Information & Management, 38(1), 23-33.
46. Liu, X., He, M., Gao, F., & Xie, P. (2008). An empirical study of online shopping customer
satisfaction in China: a holistic perspective. International Journal of Retail & Distribution
Management.
47. Loke, S.-P., Taiwo, A. A., Salim, H. M., Downe, A. G., & PETRONAS, U. T. (2011).
Service quality and customer satisfaction in a telecommunication service provider. Paper
presented at the International conference on financial management and economics.
48. Maditinos, D. I., & Theodoridis, K. (2010). Satisfaction determinants in the Greek online
shopping context. Information Technology & People.
49. Mason, J. B., & Bearden, W. O. (1979). Satisfaction/dissatisfaction with food shopping
among elderly consumers. Journal of Consumer Affairs, 13(2), 359-369.
50. Mason, R. O. (1978). Measuring information output: A communication systems approach.
Information & management, 1(4), 219-234.
51. McGinity, M. (2000). Staying connected: surfing the turf. Communications of the ACM,
43(4), 19-21.
52. McKinney, V., Yoon, K., & Zahedi, F. M. (2002). The measurement of web-customer
satisfaction: An expectation and disconfirmation approach. Information systems research,
13(3), 296-315.
53. Ofir, C., & Simonson, I. (2007). The effect of stating expectations on customer satisfaction
and shopping experience. Journal of Marketing Research, 44(1), 164-174.
54. Oliver, R. L. (1980). A cognitive model of the antecedents and consequences of satisfaction
decisions. Journal of Marketing Research, 17(4), 460-469.
55. Oliver, R. L. (1997). Emotional expression in the satisfaction response. Satisfaction: A
behavioral perspective on the consumer, 291325.
56. Oliver, R. L., & Linda, G. (1981). Effect of satisfaction and its antecedents on consumer
preference and intention. ACR North American Advances.
57. Pan, Y., & Zinkhan, G. M. (2006). Exploring the impact of online privacy disclosures on
consumer trust. Journal of retailing, 82(4), 331-338.
58. Parasuraman, A., Zeithaml, V. A., & Berry, L. L. (1988). Servqual: A multiple-item scale
for measuring consumer perc. Journal of retailing, 64(1), 12.
59. Parasuraman, A., Zeithaml, V. A., & Malhotra, A. (2005). ES-QUAL: A multiple-item scale
for assessing electronic service quality. Journal of service research, 7(3), 213-233.
60. Park, C. H., & Kim, Y. G. (2003). Identifying key factors affecting consumer purchase
behavior in an online shopping context. International Journal of Retail & Distribution
Management.
61. Parker, C., & Mathews, B. P. (2001). Customer satisfaction: contrasting academic and
consumers’ interpretations. Marketing Intelligence & Planning.
62. Petter, S., DeLone, W., & McLean, E. R. (2013). Information systems success: The quest
for the independent variables. Journal of management information systems, 29(4), 7-62.
63. Phillip, K., & Keller, K. L. (2012). Marketing Management 14th edition Jakarta: PT. Indeks
Kelompok Gramedia.
51st International Scientific Conference on Economic and Social Development – Rabat, 26-27 March 2020
132
64. Polites, G. L., Williams, C. K., Karahanna, E., & Seligman, L. (2012). A theoretical
framework for consumer e-satisfaction and site stickiness: An evaluation in the context of
online hotel reservations. Journal of Organizational Computing and Electronic Commerce,
22(1), 1-37.
65. Rahi, S. (2015). Moderating Role of Brand Image With Relation to Internet Banking and
Customer Loyalty: A Case of Branchless Banking. The Journal of Internet Banking and
Commerce, 20(3).
66. Rahi, S. (2016a). Impact of Customer Perceived Value and Customers Perception of Public
Relation on Customer Loyalty with Moderating Role of Brand Image. The Journal of
Internet Banking and Commerce, 21(2), ---.
67. Rahi, S. (2016b). Impact of Customer Value, Public Relations Perception and Brand Image
on Customer Loyalty in Services Sector of Pakistan. Arabian J Bus Manag Review S2, 004.
68. Rahi, S. (2017). Research design and methods: A systematic review of research paradigms,
sampling issues and instruments development. International Journal of Economics &
Management Sciences, 6(2), 1-5.
69. Rahi, S. (2017). Structural Equation Modeling Using SmartPLS: CreateSpace Independent
Publishing Platform.
70. Rahi, S. (2018). Examining the Effects of Travel Constraints, Tourist Satisfaction and
Website Image on Tourist Loyalty in Developing Countries Context. Economic and Social
Development: Book of Proceedings, 478-487.
71. Rahi, S. (2018a). Research Design and Methods: CreateSpace Independent Publishing
Platform.
72. Rahi, S. (2018b). Technology Adoption Issues in Banks: CreateSpace Independent
Publishing Platform.
73. Rahi, S. (2019). Integration of UTAUT model in internet banking adoption context. Journal
of Research in Interactive Marketing, 13(3), 411-435. doi: 10.1108/jrim-02-2018-0032
74. Rahi, S., & Abd. Ghani, M. (2018). The role of UTAUT, DOI, perceived technology
security and game elements in internet banking adoption. World Journal of Science,
Technology and Sustainable Development, 15(4), 338-356. doi: doi:10.1108/WJSTSD-05-
2018-0040
75. Rahi, S., & Abd. Ghani, M. (2019a). Does gamified elements influence on user’s intention
to adopt and intention to recommend internet banking? International Journal of Information
and Learning Technology, 36(1), 2-20. doi: doi:10.1108/IJILT-05-2018-0045
76. Rahi, S., & Abd. Ghani, M. (2019b). Integration of expectation confirmation theory and
self-determination theory in internet banking continuance intention. Journal of Science and
Technology Policy Management, 0(0), null. doi: doi:10.1108/JSTPM-06-2018-0057
77. Rahi, S., & Abd. Ghani, M. (2019c). Investigating the role of UTAUT and e-service quality
in internet banking adoption setting. The TQM Journal, 31(3), 491-506.
78. Rahi, S., Abd.Ghani, M., & Hafaz Ngah, A. (2019). Integration of unified theory of
acceptance and use of technology in internet banking adoption setting: Evidence from
Pakistan. Technology in Society, 58, 101120. doi:
https://doi.org/10.1016/j.techsoc.2019.03.003
79. Rahi, S., Alnaser, F. M., & Ghani, M. A. (2019). Designing Survey Research:
Recommendation for Questionnaire Development, Calculating Sample Size and Selecting
Research Paradigms. Economic and Social Development: Book of Proceedings, 1157-1169.
80. Rahi, S., & Ghani, M. (2016). Internet Banking, Customer Perceived Value and Loyalty:
The Role of Switching Costs. J Account Mark, 5(4), 188. doi: 10.4172/2168-9601.1000188
81. Rahi, S., Ghani, M., Alnaser, F., & Ngah, A. (2018). Investigating the role of unified theory
of acceptance and use of technology (UTAUT) in internet banking adoption context.
Management Science Letters, 8(3), 173-186.
51st International Scientific Conference on Economic and Social Development – Rabat, 26-27 March 2020
133
82. Rahi, S., Ghani, M., & Muhamad, F. (2017). Inspecting the Role of Intention to Trust and
Online Purchase in Developing Countries. J Socialomics 6(1). doi: 10.41 72/2167-
0358.1000191
83. Rahi, S., Ghani, M., & Ngah, A. (2018). A structural equation model for evaluating user’s
intention to adopt internet banking and intention to recommend technology. Accounting,
4(4), 139-152.
84. Rahi, S., & Ghani, M. A. (2016). Customer's Perception of Public Relation in E-Commerce
and its Impact on E-Loyalty with Brand Image and Switching Cost. Journal of Internet
Banking and Commerce, 21(3).
85. Rahi, S., & Ghani, M. A. (2018a). Investigating the Role of E-Service Quality and Brand
Image in Internet Banking Acceptance Context with Structural Equation Modeling (SEM-
PLS). Paper presented at the Economic and Social Development (Book of Proceedings),
30th International Scientific Conference on Economic and Social.
86. Rahi, S., & Ghani, M. A. (2018b). A Structural Equation Modeling (SEM-AMOS) for
Investigating Brand Loyalty and Customer’s Intention towards Adoption of Internet
Banking Paper presented at the Economic and Social Development (Book of Proceedings),
29th International Scientific Conference on Economic and Social.
87. Rahi, S., Ghani, M. A., & Alnaser, F. M. (2017). The Influence of E-Customer Services and
Perceived Value on Brand Loyalty of Banks and Internet Banking Adoption: A Structural
Equation Model (SEM). The Journal of Internet Banking and Commerce, 22(1), 1-18.
88. Rahi, S., Ghani, M. A., & Ngah, A. H. (2020). Factors Propelling the Adoption of Internet
Banking: The Role of E-Customer Service, Website Design, Brand Image and Customer
Satisfaction. International journal of Business Information System 0(0). doi:
10.1504/IJBIS.2020.10020858
89. Ranganathan, C., & Ganapathy, S. (2002). Key dimensions of business-to-consumer web
sites. Information & Management, 39(6), 457-465.
90. Samar, R., & Mazuri, A. G. (2019a). Does gamified elements influence on user's intention
to adopt internet banking with integration of UTAUT and General Self-Confidence?
International Journal of Business Excellence, 0(0). doi: 10.1504/IJBEX.2019.10016706
91. Samar, R., & Mazuri, A. G. (2019b). Integration of DeLone & McLean and Self-
Determination Theory in internet banking continuance intention context. International
Journal of Accounting and Information Management, 27(3).
92. Samar, R., Norjaya, M. Y., & Feras, M. A. (2017). Measuring the role of website design,
assurance, customer service and brand image towards customer loyalty and intention to
adopt interent banking. The Journal of Internet Banking and Commerce, 22(S8).
93. Samar, S., Ghani, M., & Alnaser, F. (2017). Predicting customer’s intentions to use internet
banking: the role of technology acceptance model (TAM) in e-banking. Management
Science Letters, 7(11), 513-524.
94. Schaupp, L. C., & Bélanger, F. (2005). A conjoint analysis of online consumer satisfaction1.
Journal of electronic commerce research, 6(2), 95.
95. Shannon, C. E., & Weaver, W. (1949). The mathematical theory of information. Urbana:
University of Illinois Press, 97.
96. Shergill, G. S., & Chen, Z. (2005). WEB-BASED SHOPPING:
CONSUMERS'ATTITUDES TOWARDS ONLINE SHOPPING IN NEW ZEALAND.
Journal of electronic commerce research, 6(2), 78.
97. Sohn, C., & Tadisina, S. K. (2008). Development of e-service quality measure for internet-
based financial institutions. Total Quality Management, 19(9), 903-918.
98. Spiller, P., & Lohse, G. L. (1997). A classification of Internet retail stores. International
Journal of Electronic Commerce, 2(2), 29-56.

51st International Scientific Conference on Economic and Social Development – Rabat, 26-27 March 2020
134
99. Stead, B. A., & Gilbert, J. (2001). Ethical issues in electronic commerce. Journal of
Business Ethics, 34(2), 75-85.
100. Swan, J. E., & Combs, L. J. (1976). Product Performance and Consumer Satisfaction:
A New Concept: An Empirical Study Examines the Influence of Physical and Psychological
Dimensions of Product Performance on Consumer Satisfaction. Journal of marketing,
40(2), 25-33.
101. Szymanski, D. M., & Hise, R. T. (2000). E-satisfaction: an initial examination. Journal
of retailing, 76(3), 309-322.
102. Terblanche, N., & Boshoff, C. (2001). Measuring customer satisfaction with some of
the controllable elements of the total retail experience: an exploratory study. South African
Journal of Business Management, 32(2), 35-42.
103. Turel, O., & Serenko, A. (2006). Satisfaction with mobile services in Canada: An
empirical investigation. Telecommunications policy, 30(5-6), 314-331.
104. Wixom, B. H., & Todd, P. A. (2005). A theoretical integration of user satisfaction and
technology acceptance. Information systems research, 16(1), 85-102.
105. Yang, Z., & Fang, X. (2004). Online service quality dimensions and their relationships
with satisfaction. International Journal of Service Industry Management.
106. Zeithaml, V. A. (1988). Consumer perceptions of price, quality, and value: a means-end
model and synthesis of evidence. Journal of marketing, 52(3), 2-22.
107. Zeithaml, V. A. (2000). Service quality, profitability, and the economic worth of
customers: what we know and what we need to learn. Journal of the Academy of Marketing
Science, 28(1), 67-85.
108. Zeithaml, V. A., Parasuraman, A., & Malhotra, A. (2002). Service quality delivery
through web sites: a critical review of extant knowledge. Journal of the Academy of
Marketing Science, 30(4), 362-375.
109. Zhang, X., Prybutok, V., & Huang, A. (2006). An empirical study of factors affecting
e-service satisfaction. Human systems management, 25(4), 279-291.

51st International Scientific Conference on Economic and Social Development – Rabat, 26-27 March 2020
135
CREATIVE ENVIRONMENT FOR DEVELOPMENT OF
ENTREPRENEURIAL IDEAS IN TOURISM – MASH-UP EVENT AS AN
INNOVATIVE EVALUATION MODEL
Tamara Floricic
Juraj Dobrila University of Pula, Faculty of economics and tourism “Dr Mijo Mirkovic”
Preradovićeva 1, HR 52100 Pula, Croatia
Irena Sker
Faculty of tourism and hospitality management, Primorska 42, Opatija, Croatia
Grad Poreč, Senior associate for economy and EU projects, Obala Maršala Tita 5/1, Croatia
ABSTRACT
The idea represents a primary step towards entry into the entrepreneurial world; it is a core
consideration which can result in future business ventures. However, in affirmation, there are
numerous trials and corrections before the realisation of the idea itself, i.e. each idea does not
necessarily result in a successful innovation. Mash-up represents an event of exceptional
benefit for entrepreneurs, start-ups, educational institutions and creative people, i.e. target
groups which have a common goal – evaluation of their own ideas as the basis for a successful
entrepreneurial venture. The aim of this paper is to point to the significance of the Mash-up
event as a creative and stimulating environment for development, evaluation and selection of
successful entrepreneurial ideas in tourism. Apart from the actual testing of new ideas, this type
of event represents a significant opportunity for development of creativity and innovativeness,
potential participants’ skills and interconnection as a possibility for realising mutual business
synergies in tourism. The potential is significant from the educational aspect and also due to
the possibility of inclusion of educational institutions, linking with entrepreneurship, thus
forming the basis for further research. For the purposes of identification and development of
successful business ideas, three phases of evaluation of ideas in tourism were analysed in the
paper (initial evaluation of the presented ideas, evaluation of development of ideas by mentors
and evaluation of modified ideas through specific criteria), which is conducted by experts from
the field of tourism, entrepreneurship, technology, economics and management, and which form
a considerable basis for decision making on future successful business performance. The
importance of mentorship and individual approach are tested in the paper and the event
structure methodology is proposed, which contributes to innovations, development of
individuals, tourism and entrepreneurship. The paper’s purpose and contribution follow from
the afore-stated, i.e. presentation of an innovative model of development and evaluation of new
ideas in tourism entrepreneurship, which contribute to the solution of challenges and to the
development of micro and macro tourism environments.
Keywords: business venture, creative thinking, entrepreneurship, idea development,
innovations, Mash-up, start-up, tourism
1. INTRODUCTION
Modern business is characterised by prompt changes, intensive competition, fast transfer of
information, globalisation and considerable spreading of new technologies. For the purposes of
survival in the turbulent market and realisation of competitive advantage, each existing and
potential entrepreneurial subject must direct and adapt its business and thinking towards the
challenges which the “modern” market imposes before them. The adaptation to the “modern”
market includes encouragement of innovations, which are the result of creativity, new ideas and

51st International Scientific Conference on Economic and Social Development – Rabat, 26-27 March 2020
136
company networking. Creativity is a term which is usually used for the activity of formation of
new ideas, approaches or activities, while innovation is a process of creation and
implementation of the stated creative ideas in a specific context. Therefore, in this paper, we
start from the theoretical definition of the very terms of creativity and innovativeness and the
explanation of the process from creativity to innovation, i.e. development of entrepreneurship.
Company development, as well as development of whole economies, is based on new products,
on finding new markets and consumer groups and on implementation of new technologies.
Creation of something new or implementation of something old in a new way is creativity in
itself, which is often mentioned as one of the important characteristics of entrepreneurs
(Pupavac, 2015). Further to characteristics of entrepreneurship, i.e. entrepreneurs, the following
F. Bahtijarević-Šiber’s (2008) notion is important: “The question of entrepreneurial talent,
creation of conditions for their development, encouragement and implementation in the
promotion of individual and social development becomes a key question of modern societies”.
Creativity is wealth; there is no product or service in which an original idea could not generate
value and create competitive advantage. Innovation and creativity are the main driving forces
for any success (Srića, 2010). Development of entrepreneurship as a whole, as well as
performance of the majority of companies, depends on creativity of the company management,
creativity of staff and innovativeness of the overall organisation, i.e. the ability to generate
innovative products and services in the market (Jakovljević, Radman Peša and Čovo, 2012).
Each increase in the creativity competencies has a direct effect on the increase in efficiency and
productivity and directly leads to greater profits. In every business it is of great importance to
allow creative thinking which has a different approach to problem solving and, when such an
approach is applied, the outcome can be both a useful and pleasant surprise. In the first place,
it is a person who is creative, but a product or a process can also be creative, even the
environment and the society as a whole. Creativity facilitates achievement of the difference
between “mediocrity” and “excellence”, linking of seemingly unbondable phenomena and
creation of new behaviour and work patterns. Creativity itself, therefore, consists of what we
already know about business and on our openness and preparedness to combine and link already
familiar phenomena to get a completely new, satisfactory solution (Matković, 2016). Creativity
is everything that an individual does, what he thinks of and, if, through the process of
evaluation, an original pioneering solution has been reached, we talk about innovation.
Innovation is something new, something someone creative turned into a creation. Creativity is,
therefore, discovery, while innovativeness is creation (Glasser, 1997). An idea represents a
primary step in the process itself of development of innovation and can result in a future
successful business venture. Each creative idea does not necessarily have to become innovation,
but there is no innovation without creativity. Creativity is the basis for changes and is not
sufficient as such if there are no inventive and entrepreneurial individuals (Matković, 2016)
who will breathe a new life and soul into a creative idea, i.e. applicability and purposefulness
in everyday life. However, there are numerous series of trials and corrections before realisation
of the idea itself, i.e. every idea does not result in a successful innovation. By analysing
experiences and evidence, as well as the history of great ideas, it can be concluded that some
individuals brought ideas effortlessly, naturally and completely intuitively, while others came
across ideas just by chance, owing to circumstances, “assisted” by luck. The largest number of
important inventions were, however, born out of the combination of inspiration and hard work
and perseverance to elaborate, defend and consistently build a path towards the final success –
often despite strong opposition, unfavourable circumstances and even total rejection by the
environment. There are two possibilities for each creative thought: to be accepted or rejected.
Namely, it occurs that ideas do not manage to reach those for whom they are intended or, even
better said, that they are not presented in such a way as to be accepted and, of course, later
implemented.

51st International Scientific Conference on Economic and Social Development – Rabat, 26-27 March 2020
137
Unfortunately, many good ideas are wasted or forgotten and rejected for different reasons,
maybe even without any reason whatsoever (Matković, 2016). The idea becomes the main
factor that leads some products to success. But in the multitude of ideas there are only a small
number of those, which on their own or together with other ideas, can result in successful
products, and only a few that are revolutionary and lead, through innovation, to exceptional
results (Stevanović, Marjanović and Štorga, 2012: 1952). Starting from the above stated
reflections and perceived problems, the main purpose of this paper is to propose a methodology
for an innovative model of development and evaluation of new ideas in tourism
entrepreneurship through a Mash-up event, which represents an important and central approach
in the process itself from creativity to innovation, as illustrated in Figure 1.
Figure 1: Process from creativity to innovation, i.e. process of entrepreneurship development
Source: Authors
Creativity represents a platform for consideration and development of ideas which can also be
generated with different creative thinking methods. Once ideas have been generated, it is very
important to make a selection of ideas which will be further elaborated and evaluated. One of
the evaluation models is the Mash-up concept itself, which represents the core of this paper for
realisation of successful innovation and entrepreneurship development. It is necessary to
observe the development of entrepreneurs and entrepreneurial environment as a process which
begins with creativity as a backbone of every creation. Endeavours of companies, start-ups, as
well as of educational institutions, as institutions for the “creation of entrepreneurial profiles”
should therefore be directed towards teamwork, creative thinking techniques, which,
synergically, could result in new ideas and, ultimately, in innovations. A Mash-up event
represents a crucial part of an integrated mechanism from creativity to innovation and
development of entrepreneurship, i.e. a significant component in the phase of product
development preparation, whose basis is networking and goal, evaluation and development of
ideas as potential successful innovation. The term Mash-up can be interpreted as mess, mixture,
i.e. fusion of different elements. Mash-ups are often defined by the type of content that they
aggregate. A content Mash-up, for example, brings together various types of contents for
presentation through an interface (Rouse, 2016). Analysing work on the topic of Mash-up leads
us to the conclusion that the word itself primarily concerns a personal learning environment
(Wild, Mödritscher and Sigurdarson, 2009), i.e. that it is more significantly associated with
online learning platforms (Jarvis, Gauntlett and Collins, 2011), and that, from the aspect of
digitalisation, can be defined as a Mash-up indicating a way to create new (Web) applications
by combining existing data and services from several sources. In the past few years, Web
Mashups have become a popular approach towards creating a new generation of customizable
Web applications (Amine Chatti et al., 2009). However, in the context of this paper, we
primarily focus on the combination of different elements, i.e. integration of different
individuals, networked in the real environment which contributes to the development of
individuals, groups, i.e. micro and macro environment. Creative environment is organised in
the sense of events, where different subjects, from individuals, creative individuals, beginner
entrepreneurs, i.e. start-ups, ICT experts, civil sector representatives, to developed
INNOVATION
51st International Scientific Conference on Economic and Social Development – Rabat, 26-27 March 2020
138
entrepreneurial subjects who, as their goal, have to improve their businesses by implementing
innovative solutions and educational institutions, for the purposes of development and
recognition of creative ideas, development of the skills of participants themselves and linking
with entrepreneurship. The Event is directed towards different target groups, as an inspirational
environment provides opportunities for transformation of innovative ideas into tangible results.
Mash-up events are focused on activating the entrepreneurial talents and provide an opportunity
to take raw ideas and turn them into successful innovations. With activation of entrepreneurial
talent, the event also enables development of one’s own creativity to critical consideration of
one’s own ideas, development of presentational and communication competencies, as well as
innovation and teamwork skills.
2. RESEARCH DESIGN AND METHODOLOGY
In the phase of preparation for product development, i.e. the phase which represents the first
part of the innovation process, participants do not have a sufficiently clear idea of what the end
product will be like and not only in view of its appearance, but also in view of its functional
and other characteristics. It is the large number of unknowns that present the biggest
aggravating circumstances, but also the biggest creative opportunity. Classification,
assessment, evaluation and selection of ideas are, therefore, carried out most often today based
on the professional knowledge of reviewers, i.e. assessors (Soukhoroukova, Spann and Skiera,
2010). Different approaches to idea assessment can be noted in researches. One part of
researches addresses general idea assessment, i.e. idea assessment independently from a
specific product. Such assessments are based on a small number of attributes, which is not
enough for various cases of product development. The second part of researches deals with
detailed and more precise assessments of attributes but is too strongly determined by the
characteristics of specific products that it can hardly be considered as general. A considerably
smaller number of papers deal with a general approach to idea description, assessment and
comparison, as well as qualitative and quantitative evaluation of ideas for the purposes of
product development. It can, therefore, be concluded that there is a certain gap in researches,
especially in consideration of the problem of idea description and selection (Stevanović, 2012).
As a consequence of the previous conclusion, in this paper, definition of idea assessment
methodology using a creative Mash-up event is examined by means of the research key field,
i.e. the selection and recognition of those ideas which can contribute to product development,
improve the process of decision making during the preparation for product development and,
ultimately, lead to development of entrepreneurs and entrepreneurship. The paper analyses the
applicability of Mash-up methodology in evaluation and development of entrepreneurial ideas
with the focus on tourism. For the purposes of identification and development of successful
business ideas, three phases of idea evaluation in tourism are analysed in this paper (initial
evaluation of presented ideas, evaluation of idea development by mentors and evaluation of
modified ideas through certain criteria), conducted by experts from the fields of tourism,
entrepreneurship, technology, economics and management and represents an important ground
for making decisions on future business performance. The significance of mentorship and
individual approach are tested in the paper and the methodology of event structure is proposed,
which contributes to innovations, development of individuals, tourism and entrepreneurship.
The purpose and scientific contribution of the paper, presentation of the innovative
development model and evaluation of new, i.e. modified ideas in tourism entrepreneurship,
which contribute to the resolution of challenges and to development of the micro and macro
tourism environment arise from the above stated. The research, as a part of applied researches,
has a theoretical goal which is directed towards formulation and proposal of the methodology
of evaluation and idea development, as a contribution to the product development theory, which
can serve for improvement of the decision making process in the early phase of product
51st International Scientific Conference on Economic and Social Development – Rabat, 26-27 March 2020
139
development and a practical goal, as development of the idea evaluation system based on the
defined methodology through an innovative Mash-up event. The research methods used in this
paper are the methods of analysis and synthesis, verification and discussion, abstraction and
generalisation, as well as statistical methods, and the evaluation itself was carried out in
Treviso, Italy, in March 2019, where the Mash-up event was organised as an international event
with the purpose of development of entrepreneurship, development of “fresh” ideas, which
represent a considerable potential for conversion into a higher dimension, i.e. a successful
innovation. A total of 23 ideas were submitted at the Event, of which 20 entrepreneurial ideas
in tourism were presented, structured according to 4 tourist areas.
2.1. Methodology of innovative evaluation model and entrepreneurial idea development
A Mash-up programme and event is designed to match people from the same or different
communities with the knowledge, tools, and expert advice they need to figure out if there is a
great business to be built around their great idea. The project meeting was held on 28th March,
2019 in Treviso, at CISET International Centre of Studies on the Tourism Economy (which was
set up in 1991, as a result of a partnership between Ca’ Foscari University Venice, the Veneto
Region and the Italian Touring Club) on the initiative of ATLAS Adriatic Cultural Tourism
Laboratories, a project approved under the first call for standard plus projects Interreg VA Italy
- Croatia CBC Programme 2014-2020, (Juraj Dobrila University of Pula, Faculty of Economics
and Tourism “Dr. Mijo Mirković”, Pula which is a partner on the project ATLAS, Adriatic
Cultural Tourism Laboratories). The initiative offered to the participants the opportunity to
develop important aspects for the realisation of their ideas, in a dynamic and stimulating
environment, with experts coming from CISET - Ca' Foscari University of Venice, university
professors and tourism and culture professionals. Participants had to present a sustainable
innovative idea applicable to the culture and tourism sector, with particular reference to the
development and enhancement of cultural and natural heritage. The ideas had to include and
develop activities specifically related to one of the following topic areas:
• Experiental tourism - Innovative proposals of experiential tourism linked to the traditions
of the territory;
• Digital tourism - Territorial and/or tourist valorisation of ideas through smart and ICT
applications;
• Accessible tourism - Territorial and/or tourist valorisation of ideas having as the main focus
the accessibility of cultural heritage sites and/or addressing a wider spectrum of target
groups less considered by the standardised tourism offer (people with disabilities, elderly
people, families) in order to develop also a new and diversified audience;
• Communication and Marketing - Communication and marketing activities for new travel
modes, access to sites, integration of the overall chain of excellence (Unioncamere Veneto,
2019).
The Event was opened to operators of cultural tourism, representatives of civil society, creative
people, ICT experts, project managers, video makers, start uppers, students, etc. from the
eligible area of the Italy-Croatia programme1, working as a team to gradually contribute to the
realisation of the most diverse ideas in order to redesign the cultural tourism offer and launch
innovative promotional actions. All those who had an idea (product or service) and want to
learn how to develop it in a short time in a multicultural and multidisciplinary environment.
1Eligible areas of the Italy-Croatia programme are 25 Provinces in Italy: Udine, Gorizia, Trieste, Pordenone, Venice, Padua, Rovigo, Ferrara, Ravenna, Forlì-Cesena, Rimini, Pesaro and Urbino, Ancona, Macerata, Ascoli Piceno, Fermo, Teramo, Pescara, Chieti, Campobasso, Brindisi, Lecce, Foggia, Bari, Barletta-Andria-Trani; 8 counties in Croatia: Istarska, Primorsko-goranska, Ličko-senjska, Zadarska, Šibensko-kninska, Splitsko-dalmatinska, Dubrovačko-neretvanska, Karlovačka.
51st International Scientific Conference on Economic and Social Development – Rabat, 26-27 March 2020
140
Individuals or teams made up of at least two members and a maximum of five members were
eligible to apply for the Event. After online registration, the Evaluation Commission, having
verified the formal correctness of the applications and the presence of the eligibility
requirements, examine and evaluate the proposal and define the ranking of the proponents at
their own unquestionable judgement, maximum of 35 ideas. A Mash-up event is structured in
three phrases which facilitate idea breakdown for the purposes of a higher quality idea
evaluation and development. The first phase concerns the presentation of the "raw" idea and its
features, the area in which it could be applied and the possibilities of developing other
characteristics that may be important for the further improvement of ideas. Each idea in this
phase can be subject to questions for the purposes of a more detailed explanation and
recognition of a possibility for development. In this phase, one’s own presentational and
communication skills are identified, i.e. the ability of an individual or a team to present the
important characteristics of an idea within a specific time period. After the first presentation,
the idea is evaluated by the jury made up of 6 experts in the field of tourism, entrepreneurship,
technology, economics and tourism and management. The second phase relates to further
development of the initially presented idea, with professional mentorship and students as
facilitators for additional questions and clarification. Mentors are specialists from the CISET
International Centre of Studies on the Tourism Economy, university professors and tourism
experts. Ideas are selected according to 4 defined topics and participants are grouped together
in teams and have the opportunity to exploit the synergies between their different skills to
develop a real innovative solution to redesign the cultural tourism offer. This phase is
considered as important due to the revision itself of one’s own idea, which is presented again
before the mentorship, facilitators and team which have ideas within the same topic area,
additional questions are asked, and the idea is elaborated in line with each particular business
plan element, with special attention to the approach of design thinking, brainstorming and
learning by doing. Based on an analysis of the listed components, proposals are given for
further development or modification of the idea, i.e. further activities which represent a
possibility to transform the idea into a successful innovation. Following the completion of the
second phase, the idea can no longer be considered as “raw”, i.e. it now has an added value and
we can call it “the idea of added value”. The third phase commences with a repeated
presentation of modified ideas before the initial jury, with emphasis on imperfections of the
initial idea and improved characteristics of the idea, which represents a potential for
development of a successful innovation in a specific field. It is the moment when the idea is
revised among your captured users in a multicultural and inspirational environment. The
questions which contribute to the revision and further development of the idea can be posed,
not only by jury members, but also by all event participants – direct, who are involved in the
evaluation process through their own ideas and indirect, i.e. passive event participants. This is
where a multidimensional significance of this phase emanates from, i.e. revision of the idea
from the aspect of different fields. After each of the stated phases, every idea is evaluated by
the jury and mentor (in the second phase) according to the criteria for assessment of
successfulness of the idea listed in Table 1.
Table following on the next page

51st International Scientific Conference on Economic and Social Development – Rabat, 26-27 March 2020
141
Table 1: Criteria for assessment of successfulness of the idea
SCORE CRITERIA PITCH FACILITATION METHODOLOGY SCORE RANGE
OBJECTIVES
Satisfying a need/necessity detected by the business and/or destination environment.
What is the idea? What are the key challenges faced by the idea? What are the objectives and expected results?
0-5
INNOVATION Innovation level/originality
What is the innovative aspect of the idea? 0-5
SKILLS
Quality and skills of the team. Who are the team members?
What skills and competences are ensured by the team? What external skills are needed?
0-5
TARGET
Social, environmental or cultural impact produced and/or expected with respect to the objectives defined.
What are the targets? Which target needs are satisfied by the idea?
0-5
BUSINESS MODEL
Technical feasibility and economic sustainability. What is the competitive advantage and value proposition of the
idea? What economic sources are needed?
0-5
PROGRAMME AREA
Scalability/replicability. What is the replicability of the idea in general and in the
programme’s area? 0-5
Source: Innovative ideas competition on tourism “Mash-up ATLAS rewards innovative ideas
for cultural tourism” Regulation, 2019, Unioncamere Veneto
The importance of each Mash-up event phase is reflected in the process of idea evaluation
which, in the composition of the evaluation structure, often represents a very complex
procedure. Due to the nature of the idea itself, idea evaluation is most often conducted by means
of determination of the value of the attributes with which the ideas are, more or less,
successfully described, as well as by ranking of the ideas according to the overall attribute
value. However, it is normally difficult to determine which attributes and when they need to be
evaluated. Franke et al. (2009) propose evaluation of technological, strategic, market and
consumer-oriented, organisational and product-oriented attributes. Miyashita et al. (2009) are
fixed on evaluation through four attributes: feasibility, usefulness, innovation and efficiency.
In Mounarath et al. (2011) we find a proposal for evaluation based on: innovations, creativities,
user acceptance, market potential and technical feasibility, while in Kim et al. (2011) we come
across evaluation of economic, ecological and experiential values. The process of idea
evaluation for the purposes of product development represents an estimate of how good is the
idea and how much it is within the domain of the overall set goal (innovation) or partial goals
(development, production, marketing, finances, management, market, product) (Feyzioglu,
Buyukozkan, 2005) according to certain criteria, both as a single idea and in relation to other
ideas (Stevanović, 2012). According to Aagard (2012), ideas are examined, during which
process the values of previously defined attributes for idea evaluation are assessed. From the
idea evaluation process, it is expected that, in a maximally consistent way, provide idea ranking
mechanisms, based on existing knowledge, experience and predictions of technological, market
and social trends. The main goal of idea evaluation is rejection of low-potential ideas and
creation of subgroups (clusters) from a certain group of ideas in which they are ranked
(Stevanović, 2012). To make the evaluation process effective we should be aware of the context
in which evaluations are taking place. By context we understand values, rules of the game,
cultural impacts, social milieu etc. within which the process is taking place (Rebernik, Bradač,
2013). As can be seen from Table 1, six criteria are determined for assessment of how successful
an idea is: objectives, innovation, skills, target, business model and programme area, which are
handed out to assessors with additional explanations in pitch facilitation methodology.
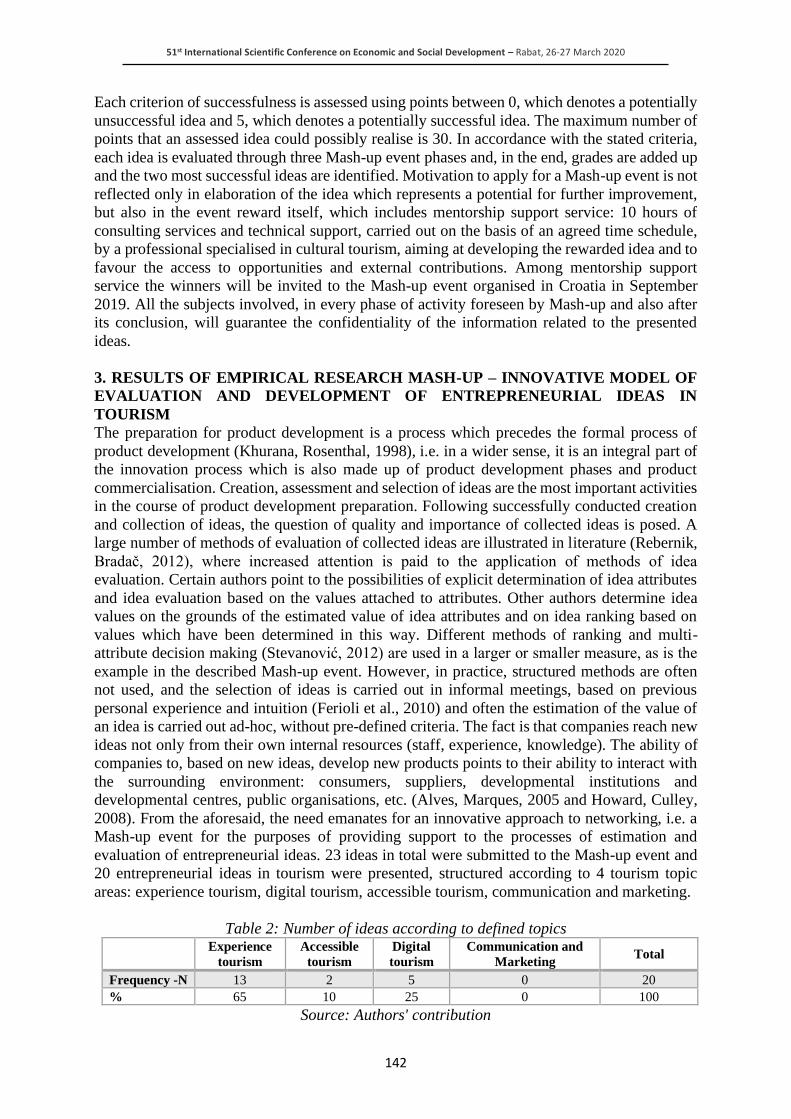
51st International Scientific Conference on Economic and Social Development – Rabat, 26-27 March 2020
142
Each criterion of successfulness is assessed using points between 0, which denotes a potentially
unsuccessful idea and 5, which denotes a potentially successful idea. The maximum number of
points that an assessed idea could possibly realise is 30. In accordance with the stated criteria,
each idea is evaluated through three Mash-up event phases and, in the end, grades are added up
and the two most successful ideas are identified. Motivation to apply for a Mash-up event is not
reflected only in elaboration of the idea which represents a potential for further improvement,
but also in the event reward itself, which includes mentorship support service: 10 hours of
consulting services and technical support, carried out on the basis of an agreed time schedule,
by a professional specialised in cultural tourism, aiming at developing the rewarded idea and to
favour the access to opportunities and external contributions. Among mentorship support
service the winners will be invited to the Mash-up event organised in Croatia in September
2019. All the subjects involved, in every phase of activity foreseen by Mash-up and also after
its conclusion, will guarantee the confidentiality of the information related to the presented
ideas.
3. RESULTS OF EMPIRICAL RESEARCH MASH-UP – INNOVATIVE MODEL OF
EVALUATION AND DEVELOPMENT OF ENTREPRENEURIAL IDEAS IN
TOURISM
The preparation for product development is a process which precedes the formal process of
product development (Khurana, Rosenthal, 1998), i.e. in a wider sense, it is an integral part of
the innovation process which is also made up of product development phases and product
commercialisation. Creation, assessment and selection of ideas are the most important activities
in the course of product development preparation. Following successfully conducted creation
and collection of ideas, the question of quality and importance of collected ideas is posed. A
large number of methods of evaluation of collected ideas are illustrated in literature (Rebernik,
Bradač, 2012), where increased attention is paid to the application of methods of idea
evaluation. Certain authors point to the possibilities of explicit determination of idea attributes
and idea evaluation based on the values attached to attributes. Other authors determine idea
values on the grounds of the estimated value of idea attributes and on idea ranking based on
values which have been determined in this way. Different methods of ranking and multi-
attribute decision making (Stevanović, 2012) are used in a larger or smaller measure, as is the
example in the described Mash-up event. However, in practice, structured methods are often
not used, and the selection of ideas is carried out in informal meetings, based on previous
personal experience and intuition (Ferioli et al., 2010) and often the estimation of the value of
an idea is carried out ad-hoc, without pre-defined criteria. The fact is that companies reach new
ideas not only from their own internal resources (staff, experience, knowledge). The ability of
companies to, based on new ideas, develop new products points to their ability to interact with
the surrounding environment: consumers, suppliers, developmental institutions and
developmental centres, public organisations, etc. (Alves, Marques, 2005 and Howard, Culley,
2008). From the aforesaid, the need emanates for an innovative approach to networking, i.e. a
Mash-up event for the purposes of providing support to the processes of estimation and
evaluation of entrepreneurial ideas. 23 ideas in total were submitted to the Mash-up event and
20 entrepreneurial ideas in tourism were presented, structured according to 4 tourism topic
areas: experience tourism, digital tourism, accessible tourism, communication and marketing.
Table 2: Number of ideas according to defined topics Experience
tourism
Accessible
tourism
Digital
tourism
Communication and
Marketing Total
Frequency -N 13 2 5 0 20
% 65 10 25 0 100
Source: Authors' contribution

51st International Scientific Conference on Economic and Social Development – Rabat, 26-27 March 2020
143
As can be seen in Table 2, the topic of experience tourism represents the most attractive topic
for the development of ideas, i.e. as much as 65% of the total ideas were submitted under this
topic. Experience tourism and interpretation today represent the basis for tourism destination
sustainable development, as memorable experiences are exactly what people bring back from
their travel and the process of creation of that experience and emotion in tourism are two
important components in story creation. Modern tourist experiences have increasingly been
intended for tourists who are looking for possibilities to, as much as possible, participate in
direct delivery of experiences. The evaluation of ideas contained three phases of evaluation of
the presented ideas. The first and third evaluation phases were conducted by the same experts
in the field of tourism, entrepreneurship, technology, economics and tourism and management
according to the same evaluation criteria. Evaluation is thus subject to statistical processing. By
analysing the dominant value, i.e. the value of the variable which appears most frequently in
the first and third phases of idea evaluation, as can be seen in Table 3, we can conclude that, in
the first evaluation phase, most ideas were given grade 17 (Mo=17.67) and, in the third phase,
most ideas were given grade 21 (Mo=21.57) out of the maximum number of points, 30.
Table 3: Comparison of grades in the first and third phases of evaluation SCORE 1st EVALUATION 3rd EVALUATION
11 1 1
12 0 0
13 0 0
14 0 0
15 2 2
16 1 2
17 5 2
18 3 3
19 2 2
20 1 0
21 2 4
22 2 1
23 0 2
24 1 1
Source: Authors' contribution
By comparing the dominant values, an increase in the idea grade was noted (dominant values)
in the third phase of evaluation, as opposed to the first evaluation phase. It is presumed that the
ideas in the second phase under the influence of mentors and facilitators were reviewed,
elaborated and redesigned for the purposes of further development. We therefore believe that it
was reasonable to test the connection between the first and third evaluation phases using the
differentiation test for two small dependent samples, by setting the hypotheses:
• H0: there is no difference in average grade in the first and third idea evaluation phases
• H1: there is a difference in average grade in the first and third idea evaluation phases
Table following on the next page
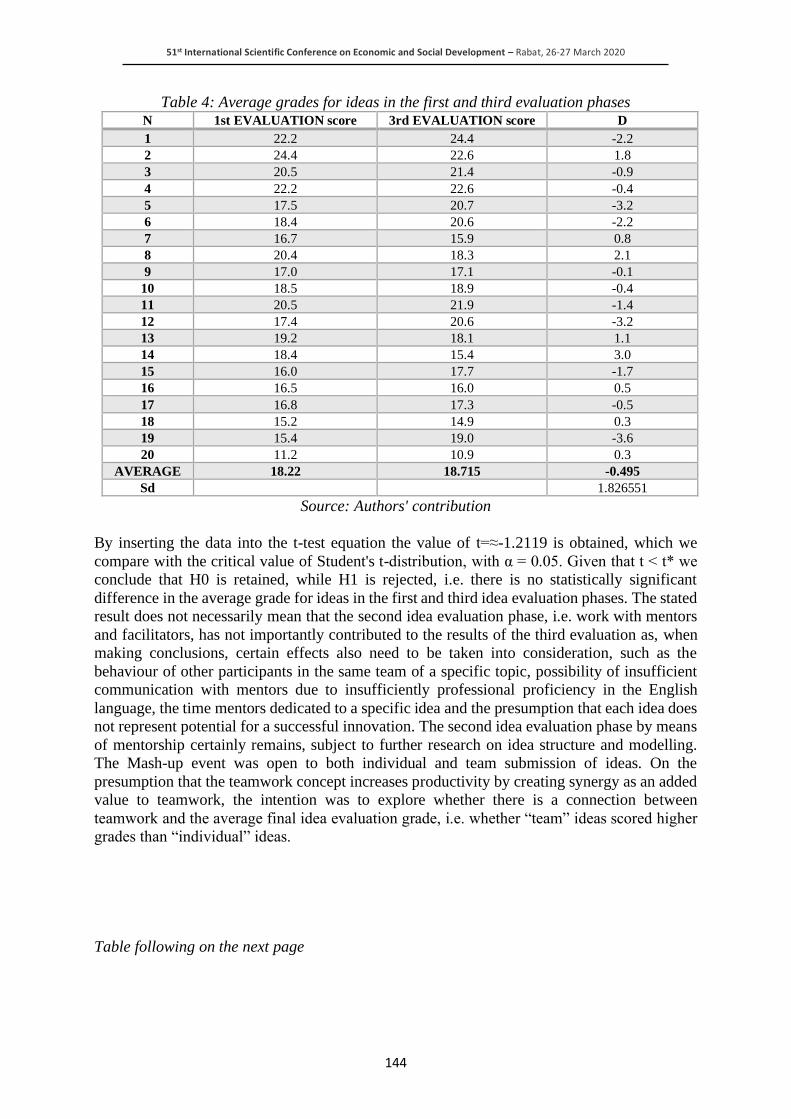
51st International Scientific Conference on Economic and Social Development – Rabat, 26-27 March 2020
144
Table 4: Average grades for ideas in the first and third evaluation phases N 1st EVALUATION score 3rd EVALUATION score D
1 22.2 24.4 -2.2
2 24.4 22.6 1.8
3 20.5 21.4 -0.9
4 22.2 22.6 -0.4
5 17.5 20.7 -3.2
6 18.4 20.6 -2.2
7 16.7 15.9 0.8
8 20.4 18.3 2.1
9 17.0 17.1 -0.1
10 18.5 18.9 -0.4
11 20.5 21.9 -1.4
12 17.4 20.6 -3.2
13 19.2 18.1 1.1
14 18.4 15.4 3.0
15 16.0 17.7 -1.7
16 16.5 16.0 0.5
17 16.8 17.3 -0.5
18 15.2 14.9 0.3
19 15.4 19.0 -3.6
20 11.2 10.9 0.3
AVERAGE 18.22 18.715 -0.495
Sd 1.826551
Source: Authors' contribution
By inserting the data into the t-test equation the value of t=≈-1.2119 is obtained, which we
compare with the critical value of Student's t-distribution, with α = 0.05. Given that t < t* we
conclude that H0 is retained, while H1 is rejected, i.e. there is no statistically significant
difference in the average grade for ideas in the first and third idea evaluation phases. The stated
result does not necessarily mean that the second idea evaluation phase, i.e. work with mentors
and facilitators, has not importantly contributed to the results of the third evaluation as, when
making conclusions, certain effects also need to be taken into consideration, such as the
behaviour of other participants in the same team of a specific topic, possibility of insufficient
communication with mentors due to insufficiently professional proficiency in the English
language, the time mentors dedicated to a specific idea and the presumption that each idea does
not represent potential for a successful innovation. The second idea evaluation phase by means
of mentorship certainly remains, subject to further research on idea structure and modelling.
The Mash-up event was open to both individual and team submission of ideas. On the
presumption that the teamwork concept increases productivity by creating synergy as an added
value to teamwork, the intention was to explore whether there is a connection between
teamwork and the average final idea evaluation grade, i.e. whether “team” ideas scored higher
grades than “individual” ideas.
Table following on the next page
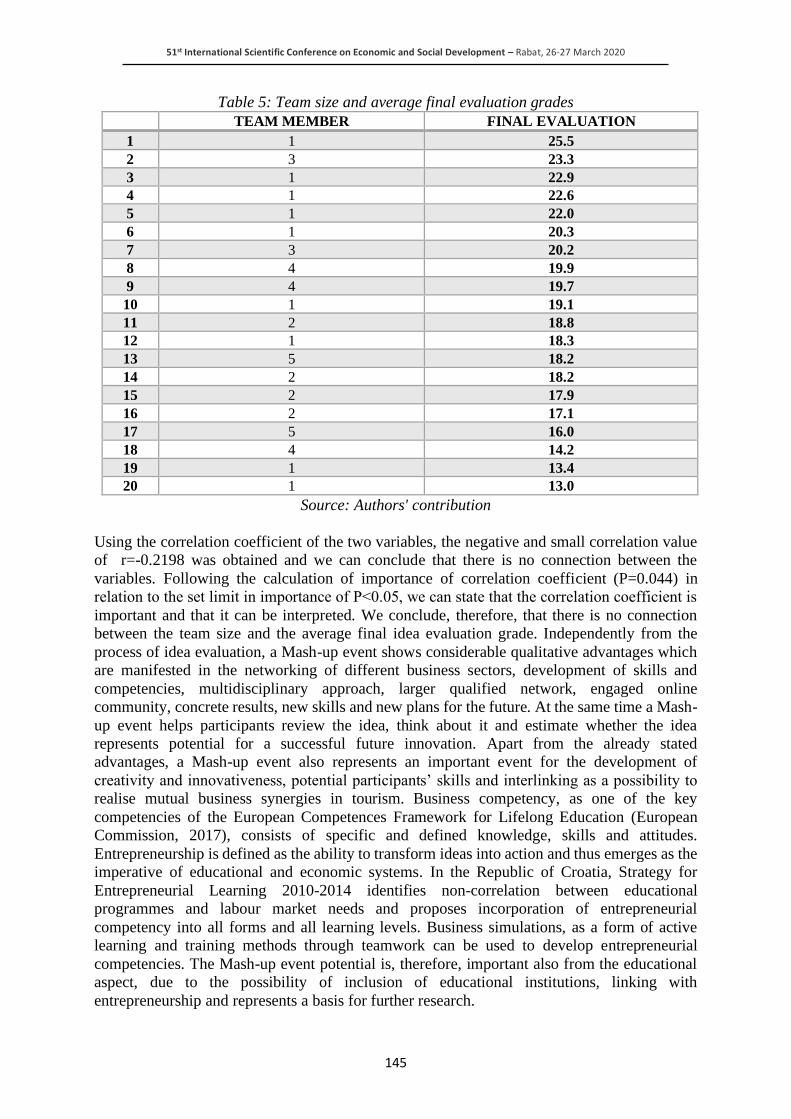
51st International Scientific Conference on Economic and Social Development – Rabat, 26-27 March 2020
145
Table 5: Team size and average final evaluation grades
TEAM MEMBER FINAL EVALUATION
1 1 25.5
2 3 23.3
3 1 22.9
4 1 22.6
5 1 22.0
6 1 20.3
7 3 20.2
8 4 19.9
9 4 19.7
10 1 19.1
11 2 18.8
12 1 18.3
13 5 18.2
14 2 18.2
15 2 17.9
16 2 17.1
17 5 16.0
18 4 14.2
19 1 13.4
20 1 13.0
Source: Authors' contribution
Using the correlation coefficient of the two variables, the negative and small correlation value
of r=-0.2198 was obtained and we can conclude that there is no connection between the
variables. Following the calculation of importance of correlation coefficient (P=0.044) in
relation to the set limit in importance of P˂0.05, we can state that the correlation coefficient is
important and that it can be interpreted. We conclude, therefore, that there is no connection
between the team size and the average final idea evaluation grade. Independently from the
process of idea evaluation, a Mash-up event shows considerable qualitative advantages which
are manifested in the networking of different business sectors, development of skills and
competencies, multidisciplinary approach, larger qualified network, engaged online
community, concrete results, new skills and new plans for the future. At the same time a Mash-
up event helps participants review the idea, think about it and estimate whether the idea
represents potential for a successful future innovation. Apart from the already stated
advantages, a Mash-up event also represents an important event for the development of
creativity and innovativeness, potential participants’ skills and interlinking as a possibility to
realise mutual business synergies in tourism. Business competency, as one of the key
competencies of the European Competences Framework for Lifelong Education (European
Commission, 2017), consists of specific and defined knowledge, skills and attitudes.
Entrepreneurship is defined as the ability to transform ideas into action and thus emerges as the
imperative of educational and economic systems. In the Republic of Croatia, Strategy for
Entrepreneurial Learning 2010-2014 identifies non-correlation between educational
programmes and labour market needs and proposes incorporation of entrepreneurial
competency into all forms and all learning levels. Business simulations, as a form of active
learning and training methods through teamwork can be used to develop entrepreneurial
competencies. The Mash-up event potential is, therefore, important also from the educational
aspect, due to the possibility of inclusion of educational institutions, linking with
entrepreneurship and represents a basis for further research.
51st International Scientific Conference on Economic and Social Development – Rabat, 26-27 March 2020
146
4. DISCUSSION AND CONCLUSION
Innovativeness is the key element of individual development, but also of overall economic
development, and it is necessary to facilitate and encourage the creation of an innovative
climate and provide support to entrepreneurs. Contributions to the innovative climate and to the
potential for development of innovations is manifested in networking, i.e. Mash-up events, as
“an environment which is abundant with creative people is an excellent place for the
development of entrepreneurial ideas” (Pupavac, 2015). Mash-up events represent the crucial
part of the integrated mechanism from creativity to innovation and of the development of
entrepreneurship, i.e. a relevant component in the phase of preparation for product
development, whose basis is networking and their goal is idea evaluation and development as
a potential successful innovation. The methodology of the proposed Mash-up event reflects in
three idea evaluation phases; of which each represents an extremely important step towards the
development of ideas. Although by testing the statistical importance of the difference in idea
average grades in the first and third evaluation phases the result was reached of nonexistence
of the said difference and the presumption that the second evaluation phase, i.e. mentorship, did
not contribute significantly to the results generated in the third phase (while other effects should
be also taken into consideration), qualitative advantages were noted of each of the mentioned
phases. The second idea evaluation phase certainly remains subject to further research and idea
structure and modelling and work with mentors in smaller groups is proposed for the purposes
of considerably more time needed for idea testing and development. The Mash-up event
qualitative advantages are evident in networking of participants from different and same sectors
for potential future cooperation, multidisciplinary approach, idea revision and estimate as future
successful innovation, development of participants’ skills and competencies, new plans for the
future or reflection on creation of new ideas which, after the event itself, participants confirmed.
Accordingly, it is proposed that the qualitative importance of a Mash-up event be confirmed
using the survey method, i.e. to establish which out of the listed advantages contributes most to
the qualitative importance of the event. Finding a good idea is merely the first step in the
creation of a successful entrepreneurial story. It rarely happens that a successful business is
born only as a result of an excellent idea. What actually happens much more frequently is a
series of trials and errors before we reach a product on which we can build a successful business
(Delić et al., 2014). This very fact points to the need to organise a stimulating and creative
environment for revision, evaluation and development of entrepreneurial ideas in tourism and
other fields. Mash-up events can be an incentive for development to different target groups,
from creative individuals alone, beginner entrepreneurs, to micro, small to medium-sized and
large entrepreneurships, as well as to the academic community for the purposes of linking of
theory and practice and a platform for further research. The Mash-up event which is described
in this paper was primarily directed towards the tourism sector and development of
entrepreneurship in tourism; however, depending on the defined topic areas, it can also cover
various other interesting fields. According to research, big differences between “winners” and
“losers” in the markets most often occur due to the difference in the quality of conduct of
analyses during the preparation for product development (Stevanović, 2012). This is where the
need for networking emerges, i.e. the need for quality testing of development of an idea into
innovation. Publishing of the results of this, as well as other research work on idea development,
has as its goal dissemination of knowledge about this, extremely important, field and,
ultimately, development of entrepreneurship and entrepreneurial competencies, which
represents one of the key competencies of the European Competences Framework for Lifelong
Education.
51st International Scientific Conference on Economic and Social Development – Rabat, 26-27 March 2020
147
ACKNOWLEDGEMENT: Presented ATLAS Mash Up 2019 is an initiative of ATLAS Adriatic
Cultural Tourism Laboratories, project approved under the first call standard plus projects
Interreg VA Italy - Croatia CBC Programme 2014-2020.
LITERATURE:
1. Aagaard, A. (2012). Idea management in facilitation of pharmaceutical front end
innovation, Institute of leadership and strategy, University of Southern Denmark,
International Journal of Technology Policy and Management 12 (4), p. 373-386.
2. Alves, J. et.al. (2005). Building creative ideas for successful new product development. In
9th European conference on creativity and innovation, Lodz, Polonia, pp. 363-383.
Available at: https://www.researchgate.net/profile/Irina_Saur/publication/228732515_
Building_creative_ideas_for_successful_new_product_development/links/5645140608ae4
51880a8b1c4/Building-creative-ideas-for-successful-new-product-development.pdf
(2019-08-01)
3. Amine Chatti, M. et al. (2009). SMashup Personal Learning Environments, Proceedings of
2nd Workshop Mash-Up Personal Learning Environments (MUPPLE'09). Workshop in
conjunction with 4th European Conference on Technology Enhanced Learning (EC-TEL
2009): Synergy of Disciplines Nice, France, pp. 6-14.
4. Bahtijarević-Šiber, F., Sikavica, P., Pološki Vokić, N. (2008). Suvremeni menadžment.
Zagreb: Školska knjiga
5. Delić, A. et al. (2014). Osmislite i provjerite svoju poduzetničku ideju. Vodič, Sveučilište
J.J. Straossmayera u Osijeku, Ekonomski fakultet u Osijeku. Available at:
https://www.hup.hr/EasyEdit/UserFiles/Osijek/Publikacija_Osmislite%20svoju%20ideju.
pdf (2019-07-23)
6. European Commission (2017). Developing key competences for all throughout life.
Available at: https://ec.europa.eu/education/sites/education/files/document-library-docs/
factsheet-key-competences-lifelong-learning_en.pdf (2019-07-25)
7. Ferioli, M. et al. (2010). Understanding the rapid evaluation of innovative ideas in the early
stages of design. In International Journal of Product Development. 12 (1), pp. 67-83.
8. Feyzioglu, O., Buyukozkan, G. (2005). Evaluation of New Product Development Projects
using Artificial Intelligence and Fuzzy Logic, World Academy of Science, Engineering and
Technology 11, pp. 363-369
9. Franke, S. et.al. (2009). Managing early phases of innovation processes and the use of
methods within empirical results from an industry survey. In International conference on
engineering design, ICED'09, the 17th International Conference on Engineering Design 1,
Design Processes, Stanford University, Stanford, CA, USA, pp. 193-204. Available at:
https://www.designsociety.org/publication/28531/Managing+Early+Phases+of+Innovatio
n+Processes+and+the+Use+of+Methods+within+Empirical+Results+From+an+Industry+
Survey (2019-08-06)
10. Glasser, W. (1997). Teorija kontrole. Zagreb: Alineja
11. Howard, T., Culley, S., Dekoninck, E. (2008). Idea generation in conceptual design.
International Design Conference – Design 2008, Dubrovnik. Available at:
https://pdfs.semanticscholar.org/66cf/63c580291aa061dcfa7c44e5f0024946cbc2.pdf
(2019-07-30)
12. Jakovljević, M., Radman Peša, A., Čovo, P. (2012). Integrirani organizacijski model
kreativnosti i inovativnosti (OMKI): primjenjivost na mala i srednja poduzeća u Republici
Hrvatskoj, Ekonomska misao i praksa 1, 2012., str. 24.
13. Available at: https://hrcak.srce.hr/file/124623 (2019-08-01)

51st International Scientific Conference on Economic and Social Development – Rabat, 26-27 March 2020
148
14. Jarvis, M., T., Gauntlett, L., and Collins, H. (2011). Are Mash-Ups the Future for Online
Learning Platforms? Psychology A-Level Students' Judgements about VLE and MUPPLE
Interfaces, Bournemouth University Research Online. Available at:
https://www.researchgate.net/publication/258050294_USING_MASHUP_TO_CREATE_
A_NEW_PLATFORM_FOR_TEACHING_ENGLISH_IN_THE_E-
LEARNING_ENVIRONMENT (2019-08-09)
15. Khurana, A., Rosenthal, S.R. (1998). Towards holistic "front ends" in new product
development. Journal of product innovation management, 15 (1), pp. 57-74.
16. Kim, S.Y. et.al. (2011). E3 value concept for a new design paradigm. In International
conference on engineering design, ICED11, Technical University of Denmark,
Copenhagen, pp. 314-322. Available at:
17. https://www.designsociety.org/publication/30482/E3+VALUE+CONCEPT+FOR+A+NE
W+DESIGN+PARADIGM (2019-08-06)
18. Matković, G. (2016). Što je zaliha ideja veća, to je inovacija izglednija“, Lider 2016.,
11.2016. URL: https://lider.media/znanja/sto-je-zaliha-ideja-veca-je-inovacija-izglednija/
(2019-08-02)
19. Ministarstvo gospodarstva, rada i poduzetništva, (2010) Strategija učenja za poduzetništvo
2010.- 2014., Zagreb, 2010.
20. Available at: http://www.hzz.hr/UserDocsImages/Strategija_ucenja_za_poduzetnistvo_
2010-2014.pdf (2019-08-01)
21. Miyashita, T., Satoh, D. (2009). A improvement method of conceptual design ideas using
data envelopment analysis. In International conference on engineering design, ICED'09, the
17th International Conference on Engineering Design 1, Design Processes, Stanford
University, Stanford, CA, USA, pp. 13-22. Available at:
https://www.designsociety.org/download-publication/28721/a_direction_of_ideas_in_
conceptual_design_using_data_envelopment_analysis (2019-08-02)
22. Mounarath, R., Lovallo, D., Dong, A. (2011). Choosing innovation: How reasoning affects
decision errors. In International conference on engineering design, ICED11, Proceedings
of the 18th International Conference on Engineering Design (ICED 11), Impacting Society
through Engineering Design 7: Human Behaviour in Design, Lyngby/Copenhagen,
Denmark, Technical University of Denmark, pp. 54-63. Available at:
https://www.designsociety.org/publication/30662/CHOOSING+INNOVATION%3A+HO
W+REASONING+AFFECTS+DECISION+ERRORS (2019-08-02)
23. Pupavac, D. (2015). Kreativnost kao temelj poduzetništva, Zbornik radova Međimurskog
veleučilišta u Čakovcu 6(1), str. 68. Available at: https://hrcak.srce.hr/140615 (2019-08-03)
24. Rouse, M. (2016). Definition mash-up. Available at: https://whatis.techtarget.com/
definition/mash-up (2019-07-28)
25. Rebernik, M., Bradač, B. (2013). Module 4: Idea evaluation methods and techniques, EU
project Creative Trainer, University of Maribor, Faculty of Economics and Business,
Institute for Entrepreneurship and Small Business Management. Available at:
http://coherencepisa.df.unipi.it/docs/lectures/Module_idea_evaluation_final%20LEISCHI
NG.pdf (2019-08-03)
26. Soukhoroukova, A., Spann, M., Skiera, B. (2010). Sourcing, filtering and evaluating new
product ideas: An empirical exploration of the performance of idea markets, Journal of
product innovation management 29(1). Available at: https://www.ecm.bwl.uni-
muenchen.de/publikationen/pdf/idea_markets.pdf (2019-08-04)
27. Srića, V. (2010). Hrvatska 2020. Zagreb: Profil
28. Stevanović, M. (2012). Idea selection in product development, PhD thesis, University of
Zagreb, Faculty of mechanical engineering and naval architecture, Zagreb

51st International Scientific Conference on Economic and Social Development – Rabat, 26-27 March 2020
149
29. Stevanović, M., Marjanović D., Štorga M. (2012). Decision support system for idea
selection. U: 12th International Design Conference Design – Design 2012,3, Dubrovnik,
pp. 1951-1960. Available at: https://bib.irb.hr/datoteka/582075.Stevanovic_et_al_2012_-
_Decision_Support_System_for_Idea_Selection.pdf (2019-07-31)
30. Unioncamere Veneto (2019). Innovative ideas competition on tourism “Mash-up ATLAS”
rewards innovative ideas for cultural tourism Regulation
31. Wild, F., Mödritscher, F., Sigurdarson, S. (2008). Designing for change: Mash-up Personal
Learning Environments. In: Magoulas, George D. ed. E-Infrastructures and Technologies
for Lifelong Learning: Next Generation Environments. IGI Global, Idea Group Publishing,
pp. 126–149.
51st International Scientific Conference on Economic and Social Development – Rabat, 26-27 March 2020
150
ZERO WASTE CONCEPT IN TOURISM
Daniela Soldic Frleta
Faculty of Tourism and Hospitality Management, University of Rijeka, Croatia
Dora Zupan
Croatia
ABSTRACT
Tourists, residents as well as the accommodation and catering facilities generate large amounts
of waste and therefore have large impact on the environment. Given that high quality
environment is very often main motive for tourists to visit certain destinations, waste handling
in context of environment protection is of a major concern. In addition, it is in the interest of
the destination management and particularly of the stakeholders providing tourism products
and services to optimize the use of resources and to make their business as efficient and effective
as possible. Therefore, concepts that seek to address current challenges of conserving
resources and biodiversity, as well as preserving the quality of health and life in general, are
increasingly in the focus of interest. In addition to analysing previous researches on this topic,
pilot survey was conducted on the attitudes and habits of (potential) tourists related to waste
management. Moreover, it was examined how well the respondents were familiar with the
concepts of zero waste, sustainable development, waste management, recycling and the circular
economy, and what is their perception on the possible impact of zero waste initiatives on the
environment and personal tourism experience. Apart from the survey results, this paper
provides insights on tourism businesses that are operating according to the zero waste concept
and on how this concept impacts their business.
Keywords: Circular economy, Sustainable development, Tourism, Waste management, Zero
Waste
1. INTRODUCTION
With the increased pressure of human activities on environmental capacities, the awareness of
environment protection has emerged as well as increased tendency to harmonize industrial
development with environmental capacity. The common understanding of waste as a substance
at the very end of the consumer cycle has been recently increasingly questioned, and ways are
being sought for how resources can be reused or converted before being thrown into landfills.
Industry is the major producer of waste, and tourism is no exception to it (Dileep, 2007). Given
that waste management is one of major concerns of many destinations, there is increasing
number of new measures focusing on the handling waste effectively as well as concepts aiming
for its minimisation. Zero waste initiatives are one of the examples given that this concept
promotes waste mitigation by avoiding unnecessary packaging, and sees the waste (that is
nevertheless produced) as a potentially valuable reusable resource. Tourism generates large
amounts of waste, especially in tourism destinations facing high seasonality which makes its
management more complicated. In that cases tourism waste varies seasonally, very often is
generated in sensitive areas and putting pressure on waste management facilities during peak
season and damaging high nature value resources. (Styles et al., 2017). Although the generation
of waste in tourism and hospitality is inevitable, there are ways to reduce its amount and to
manage it in an adequate manner, thereby reducing the negative effects of waste disposal on
the environment. Waste from accommodation has similar characteristics to mixed household
waste (diverse mix of materials, including organic and hazardous materials) that can give rise
51st International Scientific Conference on Economic and Social Development – Rabat, 26-27 March 2020
151
to significant environmental impacts upon disposal (Styles et al., 2017Zero waste initiatives
encourage reusing (and repurposing) resources and thus contribute to a circular economy which
is based on the circulation of resources, that is, their reuse and their utility maximization, as
opposed to a linear process in which resources are quickly discarded. The positive effects of
zero waste concept on hotel businesses have also been evident, since its implementation
generate many positive results: less produced waste; more collected sorted waste; less water
and energy consumption; higher hotel occupancy on an annual basis; higher business efficiency
and higher guest satisfaction. Furthermore, in order to have a greater positive environmental
impact, apart from the businesses, all the residents need to be involved and to participate in
appropriate waste management. Hence, the environmental sustainability becomes a key
consideration in policy-making, since more responsible consumption and utilization in daily
life concern both health and quality of life (Oh and Lee, 2013). To ensure the successful waste
management, not only the provision of infrastructures by local government is needed, but also
understanding public concerns, knowledge and behaviour (Babaei et al., 2015). As Laor et al.
(2018) underlined, the public participation on waste separation process strongly affects the
success of household recycling programs. In that context it is necessary to investigate residents’
attitudes as well as habits when it comes to the waste management at home as well as while
travelling. Therefore, aiming to understand residents' knowledge, awareness and concerns
towards waste management, a pilot survey was conducted. It was examined how well the
respondents were familiar with the concepts of zero waste, sustainable development, waste
management, recycling and the circular economy, their tendency for waste separation, energy
and water savings, as well as what is their perception on the possible impact of zero waste
initiatives on the environment and personal tourism experience.
2. LITERATURE BACKGROUND
In recent decades, achieving greater efficiencies in waste management is in the focus of
academic discussion on climate change (Ezeah et al., 2015). Solid waste management is a
critical, complex and multi-dimensional challenge for the world in general and for the
accommodation sector in particular (Skordilis, 2004; Denafas et al., 2014). Tourism, on the one
hand is highly dependent on the environment quality, and on the other, activities related to
tourism sometimes generate just the opposite output - decrease the quality of the environment
and consequently reduce its attractiveness to tourists (Piipo et al., 2014). Veleva et al. (2017)
explain that “zero waste” tends to eliminate or reduce waste and is in a correlation with circular
economy. Furthermore, they associate circular economy with designing products and services
so they can be repurposed or recycled into new products and fostering collaborations to ensure
high rates of source separation. Greyson (2007) promotes precycling as actions taken now in
order to prepare the current resources to become future resources, rather than wastes
accumulating in the biosphere. Tourism is of undeniable importance for the economy, but it
also generates some negative effects, i.e. escalating amounts of waste. Therefore, further
research is needed to address these issues properly. Literature review of the scientific papers
published in journals indexed in the Web of Science and Scopus on this topic indicate that there
is increasing interest for researching the effects of circular economy, efficient waste
management and zero waste concept in the last decade. However, a closer look to the literature
reveals that the research of these topics in relation to tourism has been assessed only to a limited
extent and there is a need for more systematic and theoretical analyses of this insufficiently
explored issue.
2.1. Circular economy
Circular economy is characterized as a regenerative economy, which aims to keep products,
components and materials at their highest level of utility and value (Pamfilie et al., 2018).

51st International Scientific Conference on Economic and Social Development – Rabat, 26-27 March 2020
152
Corona et al. (2019) perceive circular economy as a sustainable economic system where the
economic growth is decoupled from the resources exploitation, through the reduction and
recirculation of natural resources. Ellen MacArthur Foundation (2015) describes circular
economy as an economic system that is restorative and which aims to maintain the utility of
products, components and materials and therefore retain their value. The concept is based on
the idea that human systems can mirror natural processes to restore natural capital to the
biosphere and utilize materials in closed loops (Veleva et al., 2017). Hence, it includes, but is
not limited to sustainable eco-design, energy and materials efficiency measures as well as
strategies defined within so called 3R’s waste hierarchy: reduce, reuse, recycle (European
Environment Agency, 2016). When it comes to tourism context, Manniche et al. (2017)
highlighted that there is lack of researches of the importance and role of circular economy in
hospitality although its application to the hotel sector can bring the environmental and financial
benefits (Florido et al., 2019). Elia et al. (2017) emphasize the need for standardized indicators
for moving from linear to circular practices. Radwan et al. (2010) came to the conclusion that
it is necessary for hoteliers to educate and train staff on how to reduce and recycle waste and
also to involve customers in the hotel's waste recycling programme. Waste minimization
through products’ redesign as well as changing societal patterns through education and training,
and purchasing with eco-intelligence is widely considered environmentally and economically
efficient, as well as cost effective long term approach to manage waste during the life cycle of
a product (Remolador, 2011).
2.2. Zero Waste
For the Zero Waste International Alliance (2018) term zero waste represents all resources
conservation by implementing responsible production, consumption, reuse, and recovery of
products, packaging, and materials without burning and with no discharges to land, water, or
air that threaten the environment or human health. The findings of Ezeah et al. (2015) research
indicate that a variety of locally-based measures need to be implemented to enhance sustainable
development. Otherwise, improper management of waste can lead to undesired environmental,
economic and social impacts, i.e. increases in greenhouse gas emission, land degradation,
resource deprivation, surface and groundwater pollution, loss of biodiversity and the loss of
aesthetic value of tourism locations (Ezeah et al. 2015). The management of solid waste tends
to be particularly problematic when it comes to island tourism destinations due to their specific
climatic conditions, land mass and topography, financial restraints, changing consumption
patterns, transient population, (in some cases even poor planning) and seasonal variations in
solid waste quantity and composition (Willmott and Graci, 2012). Krausz (2012) argues that
strict “zero waste to landfill” policy with diversion from landfill as a primary goal, does not
consider the total waste generated and does not address the issue of over-consumption so as a
result, companies rely predominantly on recycling and waste-to-energy methods of disposal.
Song et al. (2014) also found that waste reduction efforts have been focused mostly on
recycling. Ghisellini et al. (2016) note that despite its numerous business benefits, developing
a “zero waste” strategy is challenging, because it requires an engagement of different
stakeholders across the supply chain. Moreover, tourism stakeholders are often facing barriers
to reducing waste, mainly due to the lack of information and guidelines, time and space
constraints and finance issues (United Nations Environment Programme, 2003). Pubule et al.
(2015) sought for the best options for bio-waste management in the Baltic States and concluded
that the optimal solution should be based on specific environmental, economic, technical, and
social criteria identified for local conditions. Piippo at al. (2014) concluded that zero waste
proposal might improve the image of Lapland as a sustainable destination. Rico et al. (2019)
demonstrate that the average carbon footprint of a tourist in Barcelona is much higher than the
value for a citizen of Barcelona.
51st International Scientific Conference on Economic and Social Development – Rabat, 26-27 March 2020
153
Moreover, Pablo-Romero et al. (2017) confirmed an increasing positive relationship between
the hospitality sector electricity consumption and overnight stays in Spanish provinces. Veleva
et al. (2017) noticed that waste does not only endanger human health and the environment, but
it also represents a double penalty for businesses – it demonstrates inefficient production
processes and increases the costs for disposal. Florido et al. (2019) stated that tourism acts as a
living laboratory, where tourists and company staff experience new habits and more sustainable
forms of organization, which will have not only a great social impact but also impact in terms
of greater profitability and competitiveness.
3. ZERO WASTE HOTEL – GOOD PRACTICE EXAMPLE
In order to find out the main effects of the zero waste concept implementation in tourism an in-
depth interview was conducted with the representative of the Hotel Rifiuti Zero® (Eng. Zero
Waste Hotel). The Hotel Rifiuti Zero® project started in 2012. Antonino Esposito, hotel
consultant, reflecting on the large amount of waste produced by the tourism, decided to apply
the Zero Waste strategy. He started with the Hotel Rifiuti Zero® protocol development. The
idea behind the project Hotel Rifiuti Zero® is to combine hospitality and sustainability, respect
and conservation. Majority of the Zero Waste Hotels network members are located in Italy. The
strategy is geared towards facilities such as hotels, farmhouses, restaurants and bars in tourist
resorts that are keen to ensure sustainability and, at the same time, increase the business volume
thanks to the steady rise of so called "green travellers". Through staff training, adequate supplier
selection and customer communication, these facilities are able to achieve an optimum
management system minimizing the environmental impact through a 40% reduction in waste
produced and an annual decrease of 15-20% of electricity and water consumption. Joining the
Hotel Rifiuti Zero® project is funded by the participating institutions, which typically achieve
return on investment after the first year of membership. Membership fee depends on the facility
type (hotel, restaurant...), the size, average number of visitors, and the level of investments
made (steam cleaning machines, ecological detergents, sanitized water dispensers, dispensers
for elimination of single-dose, etc.). However, the annual average membership fee is between
2.000 and 5.000 euros. Hotel Rifiuti Zero is able to reduce waste production by implementing
different activities:
• Installations of Zero Waste Dumpsters
• Reduction of residual waste
• Reduction in the production of plastic
• Elimination of unit-dose packaging (sugar, soap...) and disposable products
• Setting up a dry garden (an arid garden populated by cactus and other species with the
minimum water requirement)
• Using water dispensers in the areas reserved for staff
• Preparation of a "Zero waste" menu with local products and ingredients (in accordance with
the 0 miles policy)
• Implementation of the "Chef's Garden"
• Composting
• Collection of corks
• Purchase of cleaning products with low environmental impact
• A steam engine usage for final cleaning (less usage of the polluting detergents)
• Arrangements with suppliers resulting with packaging reduction
• Using the "returnable" boxes for fruits and vegetables
• Informing and enhancing guests’ awareness and involvement.
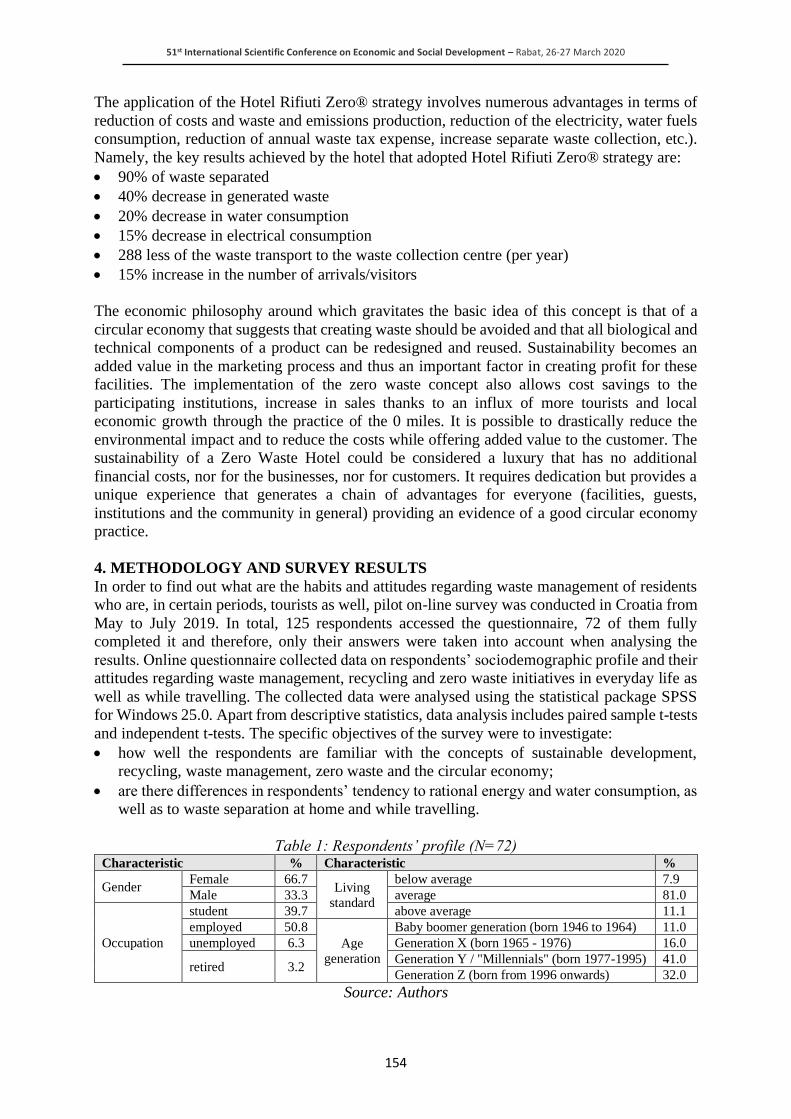
51st International Scientific Conference on Economic and Social Development – Rabat, 26-27 March 2020
154
The application of the Hotel Rifiuti Zero® strategy involves numerous advantages in terms of
reduction of costs and waste and emissions production, reduction of the electricity, water fuels
consumption, reduction of annual waste tax expense, increase separate waste collection, etc.).
Namely, the key results achieved by the hotel that adopted Hotel Rifiuti Zero® strategy are:
• 90% of waste separated
• 40% decrease in generated waste
• 20% decrease in water consumption
• 15% decrease in electrical consumption
• 288 less of the waste transport to the waste collection centre (per year)
• 15% increase in the number of arrivals/visitors
The economic philosophy around which gravitates the basic idea of this concept is that of a
circular economy that suggests that creating waste should be avoided and that all biological and
technical components of a product can be redesigned and reused. Sustainability becomes an
added value in the marketing process and thus an important factor in creating profit for these
facilities. The implementation of the zero waste concept also allows cost savings to the
participating institutions, increase in sales thanks to an influx of more tourists and local
economic growth through the practice of the 0 miles. It is possible to drastically reduce the
environmental impact and to reduce the costs while offering added value to the customer. The
sustainability of a Zero Waste Hotel could be considered a luxury that has no additional
financial costs, nor for the businesses, nor for customers. It requires dedication but provides a
unique experience that generates a chain of advantages for everyone (facilities, guests,
institutions and the community in general) providing an evidence of a good circular economy
practice.
4. METHODOLOGY AND SURVEY RESULTS
In order to find out what are the habits and attitudes regarding waste management of residents
who are, in certain periods, tourists as well, pilot on-line survey was conducted in Croatia from
May to July 2019. In total, 125 respondents accessed the questionnaire, 72 of them fully
completed it and therefore, only their answers were taken into account when analysing the
results. Online questionnaire collected data on respondents’ sociodemographic profile and their
attitudes regarding waste management, recycling and zero waste initiatives in everyday life as
well as while travelling. The collected data were analysed using the statistical package SPSS
for Windows 25.0. Apart from descriptive statistics, data analysis includes paired sample t-tests
and independent t-tests. The specific objectives of the survey were to investigate:
• how well the respondents are familiar with the concepts of sustainable development,
recycling, waste management, zero waste and the circular economy;
• are there differences in respondents’ tendency to rational energy and water consumption, as
well as to waste separation at home and while travelling.
Table 1: Respondents’ profile (N=72) Characteristic % Characteristic %
Gender Female 66.7
Living
standard
below average 7.9
Male 33.3 average 81.0
Occupation
student 39.7 above average 11.1
employed 50.8
Age
generation
Baby boomer generation (born 1946 to 1964) 11.0
unemployed 6.3 Generation X (born 1965 - 1976) 16.0
retired 3.2 Generation Y / "Millennials" (born 1977-1995) 41.0
Generation Z (born from 1996 onwards) 32.0
Source: Authors
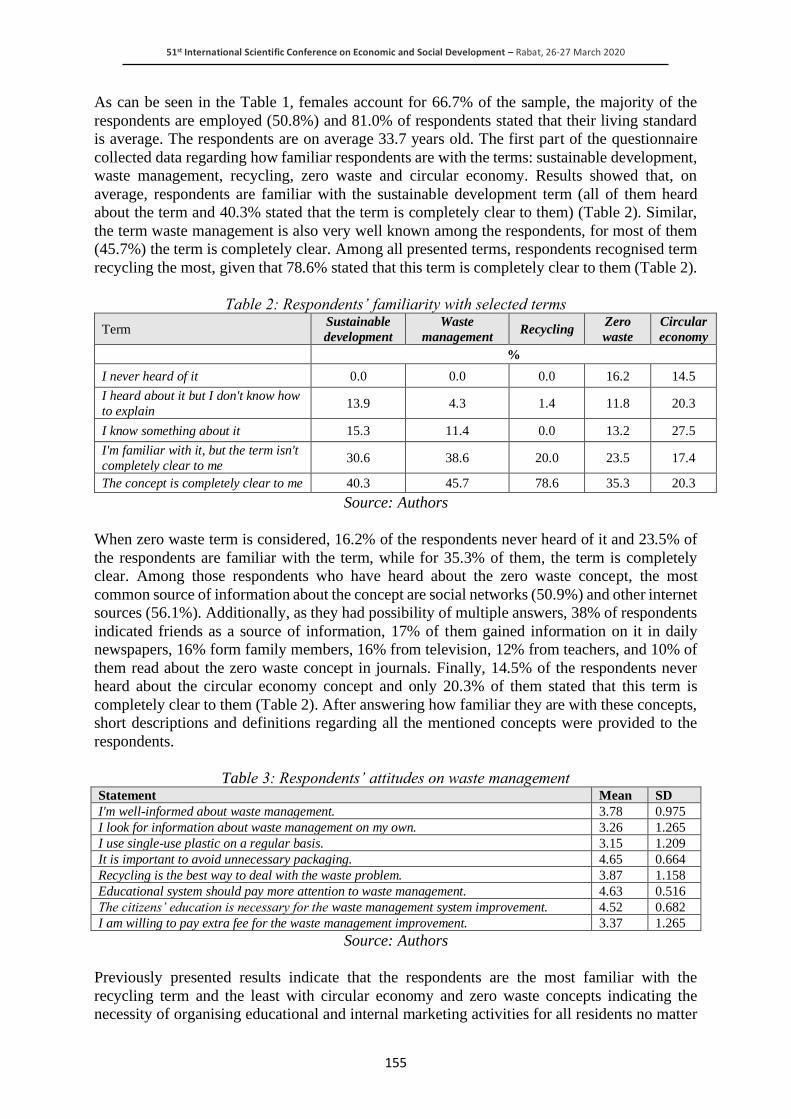
51st International Scientific Conference on Economic and Social Development – Rabat, 26-27 March 2020
155
As can be seen in the Table 1, females account for 66.7% of the sample, the majority of the
respondents are employed (50.8%) and 81.0% of respondents stated that their living standard
is average. The respondents are on average 33.7 years old. The first part of the questionnaire
collected data regarding how familiar respondents are with the terms: sustainable development,
waste management, recycling, zero waste and circular economy. Results showed that, on
average, respondents are familiar with the sustainable development term (all of them heard
about the term and 40.3% stated that the term is completely clear to them) (Table 2). Similar,
the term waste management is also very well known among the respondents, for most of them
(45.7%) the term is completely clear. Among all presented terms, respondents recognised term
recycling the most, given that 78.6% stated that this term is completely clear to them (Table 2).
Table 2: Respondents’ familiarity with selected terms
Term Sustainable
development
Waste
management Recycling
Zero
waste
Circular
economy
%
I never heard of it 0.0 0.0 0.0 16.2 14.5
I heard about it but I don't know how
to explain 13.9 4.3 1.4 11.8 20.3
I know something about it 15.3 11.4 0.0 13.2 27.5
I'm familiar with it, but the term isn't
completely clear to me 30.6 38.6 20.0 23.5 17.4
The concept is completely clear to me 40.3 45.7 78.6 35.3 20.3
Source: Authors
When zero waste term is considered, 16.2% of the respondents never heard of it and 23.5% of
the respondents are familiar with the term, while for 35.3% of them, the term is completely
clear. Among those respondents who have heard about the zero waste concept, the most
common source of information about the concept are social networks (50.9%) and other internet
sources (56.1%). Additionally, as they had possibility of multiple answers, 38% of respondents
indicated friends as a source of information, 17% of them gained information on it in daily
newspapers, 16% form family members, 16% from television, 12% from teachers, and 10% of
them read about the zero waste concept in journals. Finally, 14.5% of the respondents never
heard about the circular economy concept and only 20.3% of them stated that this term is
completely clear to them (Table 2). After answering how familiar they are with these concepts,
short descriptions and definitions regarding all the mentioned concepts were provided to the
respondents.
Table 3: Respondents’ attitudes on waste management Statement Mean SD
I'm well-informed about waste management. 3.78 0.975
I look for information about waste management on my own. 3.26 1.265
I use single-use plastic on a regular basis. 3.15 1.209
It is important to avoid unnecessary packaging. 4.65 0.664
Recycling is the best way to deal with the waste problem. 3.87 1.158
Educational system should pay more attention to waste management. 4.63 0.516
The citizens’ education is necessary for the waste management system improvement. 4.52 0.682
I am willing to pay extra fee for the waste management improvement. 3.37 1.265
Source: Authors
Previously presented results indicate that the respondents are the most familiar with the
recycling term and the least with circular economy and zero waste concepts indicating the
necessity of organising educational and internal marketing activities for all residents no matter
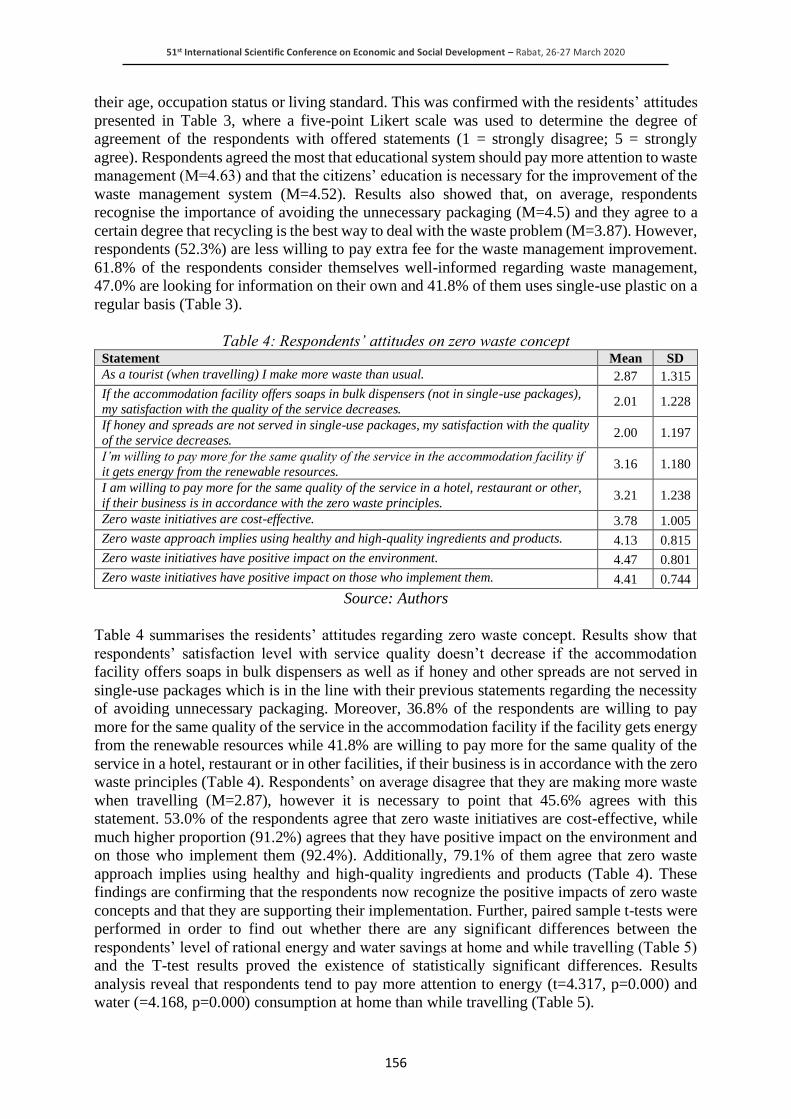
51st International Scientific Conference on Economic and Social Development – Rabat, 26-27 March 2020
156
their age, occupation status or living standard. This was confirmed with the residents’ attitudes
presented in Table 3, where a five-point Likert scale was used to determine the degree of
agreement of the respondents with offered statements (1 = strongly disagree; 5 = strongly
agree). Respondents agreed the most that educational system should pay more attention to waste
management (M=4.63) and that the citizens’ education is necessary for the improvement of the
waste management system (M=4.52). Results also showed that, on average, respondents
recognise the importance of avoiding the unnecessary packaging (M=4.5) and they agree to a
certain degree that recycling is the best way to deal with the waste problem (M=3.87). However,
respondents (52.3%) are less willing to pay extra fee for the waste management improvement.
61.8% of the respondents consider themselves well-informed regarding waste management,
47.0% are looking for information on their own and 41.8% of them uses single-use plastic on a
regular basis (Table 3).
Table 4: Respondents’ attitudes on zero waste concept Statement Mean SD
As a tourist (when travelling) I make more waste than usual. 2.87 1.315
If the accommodation facility offers soaps in bulk dispensers (not in single-use packages),
my satisfaction with the quality of the service decreases. 2.01 1.228
If honey and spreads are not served in single-use packages, my satisfaction with the quality
of the service decreases. 2.00 1.197
I’m willing to pay more for the same quality of the service in the accommodation facility if
it gets energy from the renewable resources. 3.16 1.180
I am willing to pay more for the same quality of the service in a hotel, restaurant or other,
if their business is in accordance with the zero waste principles. 3.21 1.238
Zero waste initiatives are cost-effective. 3.78 1.005
Zero waste approach implies using healthy and high-quality ingredients and products. 4.13 0.815
Zero waste initiatives have positive impact on the environment. 4.47 0.801
Zero waste initiatives have positive impact on those who implement them. 4.41 0.744
Source: Authors
Table 4 summarises the residents’ attitudes regarding zero waste concept. Results show that
respondents’ satisfaction level with service quality doesn’t decrease if the accommodation
facility offers soaps in bulk dispensers as well as if honey and other spreads are not served in
single-use packages which is in the line with their previous statements regarding the necessity
of avoiding unnecessary packaging. Moreover, 36.8% of the respondents are willing to pay
more for the same quality of the service in the accommodation facility if the facility gets energy
from the renewable resources while 41.8% are willing to pay more for the same quality of the
service in a hotel, restaurant or in other facilities, if their business is in accordance with the zero
waste principles (Table 4). Respondents’ on average disagree that they are making more waste
when travelling (M=2.87), however it is necessary to point that 45.6% agrees with this
statement. 53.0% of the respondents agree that zero waste initiatives are cost-effective, while
much higher proportion (91.2%) agrees that they have positive impact on the environment and
on those who implement them (92.4%). Additionally, 79.1% of them agree that zero waste
approach implies using healthy and high-quality ingredients and products (Table 4). These
findings are confirming that the respondents now recognize the positive impacts of zero waste
concepts and that they are supporting their implementation. Further, paired sample t-tests were
performed in order to find out whether there are any significant differences between the
respondents’ level of rational energy and water savings at home and while travelling (Table 5)
and the T-test results proved the existence of statistically significant differences. Results
analysis reveal that respondents tend to pay more attention to energy (t=4.317, p=0.000) and
water (=4.168, p=0.000) consumption at home than while travelling (Table 5).

51st International Scientific Conference on Economic and Social Development – Rabat, 26-27 March 2020
157
Table 5: Respondents’ tendency for energy and water consumption savings
Tendency for
At home While travelling Gap
score t
Sig. (2-
tailed) Mean SD Mean SD
Energy savings 3.76 0.813 3.34 0.845 0.42 4.317 0.000
Water consumption savings 3.71 1.080 3.29 1.008 0.42 4.168 0.000
Note: 1 = I'm not paying attention to rational energy/water consumption at all; 5 = I am very
careful about rational energy/water consumption; Gap score= mean score at home -
respective mean score while travelling
Source: Authors
Additionally, the results of performed paired sample t-tests show significant differences
between the respondents’ tendency to separate waste at home and while travelling and staying
in tourism destination. It was found that when it comes to all waste categories, respondents tend
to separate them more at home in comparison to the situation when they are travelling and
staying in tourism destinations (Table 6).
Table 6: Respondents’ tendency to separate waste
Tendency to separate
At home While travelling Gap
score t
Sig. (2-
tailed) Mean SD Mean SD
PET plastic (bottles...) 4.17 1.086 3.44 1.412 0.73 4.059 0.000
other plastic 3.68 1.216 2.95 1.337 0.73 4.266 0.000
hazardous waste 4.19 1.171 3.40 1.582 0.75 4.774 0.000
paper 3.94 1.076 2.94 1.424 1.00 5.069 0.000
metal 3.46 1.330 2.68 1.401 0.78 4.888 0.000
glass 3.98 1.184 3.13 1.486 0.85 5.024 0.000
compost / organic waste 3.32 1.468 2.63 1.311 0.69 3.200 0.002
Note: 1 = I never separate waste; 5= I always separate waste; Gap score= mean score at
home - respective mean score while travelling
Source: Authors
As seen in the Table 6, respondents at home and while travelling tend to separate the most PET
plastic, while they separate the least organic (food) waste. 52% of respondents always separate
PET plastic at home and only 3% never does it. In comparison, while staying in a destination
and travelling, 29% of respondents always separate PET packaging and 16% never. Large
number of the respondents (58.3%) stated that the main reason for not separating the waste lies
in the fact that there are no appropriate containers available nearby. Research findings also
indicated that none of the respondents visited or stayed at a zero waste hotel or other zero waste
facility. Despite this, 54% of them heard about zero waste facilities/stores, out of which 21%
sometimes make purchases at zero waste store in their city. Additionally, 49.2% of the
respondents had participated on a project/seminar or a workshop related to sustainable
development and for 88% of them that experience encouraged them for eco-friendlier choices
in everyday life. On the other side, only 4.8% of the respondents participated in zero waste
project or event. This is mostly due to the fact that majority of respondents never heard about
this kind of project or event (63.3%), didn’t have time (20.0%) and/or project/event was too far
away (23.3%). More than 80% of the respondents expressed their willingness to participate in
projects, seminars or workshops regarding sustainable development and/or zero waste
initiatives if they get the opportunity. These findings indicate that respondents are aware of the
importance of getting knowledge and being involved in all activities aiming to mitigate effects
of everyday living (including travelling) on the environment. Given the fact that this was a pilot
research, authors are aware of its limitations in terms of generalization of the results. This study
has considered only the attitudes of a small number of Croatian residents hence, to validate the

51st International Scientific Conference on Economic and Social Development – Rabat, 26-27 March 2020
158
findings, more research needs to be conducted across a greater range of cities worldwide.
Additionally, it is recommended to extend the number of the questionnaire items in order to
cover wider range of the residents’ habits regarding waste management and perceptions of
possible zero waste initiative impacts on the environment, businesses and personal tourism
experiences.
5. CONCLUSION
This paper analyses the zero waste concept in relation to sustainable tourism development and
the circular economy. In that context, in addition to analysing previous researches on this topic,
pilot survey was conducted on the attitudes and habits of (potential) tourists related to waste
management. The research results showed that the respondents are very familiar with the
concepts of recycling, waste management and sustainable development, and to a lesser extent
with the concepts of zero waste and circular economy. This might be explained by the fact that
these latter are new concepts and need to be promoted more actively through different activities,
i.e. educational system, workshops, seminars etc. The survey findings also showed that the
respondents are more likely to separate waste in their home in comparison to the times they are
travelling and staying in tourism destinations. In both cases, they usually separate hazardous
waste and PET plastic, while they rarely separate the organic, biodegradable waste or food
waste. Additionally, respondents are stating that they are caring less about water and energy
consumption savings while travelling. Nevertheless, a high proportion of respondents believe
that it is important to avoid unnecessary packaging and does not consider waste reduction
initiatives to diminish satisfaction with the service quality. The respondents are supportive of
zero waste concepts and environmentally responsible businesses, given the fact that they are
willing to pay more for their services. However, still, they aren’t conducting accordingly,
particularly while travelling. This is an issue that needs to be addressed in order to make all
participants in tourism activities to be more aware of consequences of their behaviour. This
study results indicates that zero waste initiatives in tourism and hospitality can indeed
contribute to the sustainable development. Tourism and hospitality are facing major challenges
in terms of the need to reduce costs; ensure energy security; meet market and guest expectations,
increase competitiveness, comply with changing regulations and legislation, seize financing
opportunities, reduce environmental impact, meet the sustainability criteria, etc. As seen from
the Hotel Rifiuti Zero® example, zero waste initiatives as well as implementation of the circular
economy principles have proven to be a good way to mitigate the negative effects, as well as to
achieve economic and social benefits in the context of sustainable tourism development.
ACKNOWLEDGEMENT: The authors would like to express gratitude to Ms. Ilaria
Mastromano, communication manager of the Hotel Rifiuti Zero® who provided us with
valuable insights on zero waste strategy implementation in tourism.
LITERATURE:
1. Babaei, A.A., Alavi, N., Goudarzi, G., Teymouri, P., Ahmadi, K., Rafiee, M. (2015).
Household recycling knowledge, attitudes and practices towards solid waste management.
Resour Conser Recycl, 102: (Suppl C), 94-100.
2. Corona, B., Shen, L., Reike, D., Rosales Carreón, J., Worrell, E. (2019). Towards
sustainable development through the circular economy—A review and critical assessment
on current circularity metrics. Resources, Conservation and Recycling, 151.
doi:10.1016/j.resconrec.2019.104498
3. Denafas, G. et al. (2014). Seasonal Variation of Municipal Solid Waste Generation and
Composition in Four East European Cities. Resources, Conservation and Recycling, 89, 22-
30.
51st International Scientific Conference on Economic and Social Development – Rabat, 26-27 March 2020
159
4. Dileep, R.P. (2007). Tourism and Waste Management: A Review of Implementation of
“Zero Waste” at Kovalam. Asia Pacific Journal of Tourism Research, 12(4), 377-392.
https://doi.org/10.1080/10941660701823314
5. Elia V., Grazia, M., Tornese, F. (2017). Measuring circular economy strategies through
index methods: A critical analysis, Journal of Cleaner Production, 142, 2741-2751.
6. Ellen MacArthur Foundation (2015). Circularity Indicators: An Approach to Measuring
Circularity. Retrieved 12.02.2020. from https://www.ellenmacarthurfoundation.org/assets/
downloads/insight/Circularity-Indicators_Project-Overview_May2015.pdf
7. European Environment Agency (2016). Circular economy in Europe: Developing the
knowledge base. Retrieved 13.02.2020. from https://www.eea.europa.eu/publications/
circular-economy-in-europe
8. Ezeah, C., Fazakerley, J. and Byrne, T. (2015). Tourism Waste Management in the
European Union: Lessons Learned from Four Popular EU Tourist Destinations. American
Journal of Climate Change, 4, 431-445. http://dx.doi.org/10.4236/ajcc.2015.45035
9. Florido, C., Jacob, M. and Payeras, M. (2019). How to Carry out the Transition towards a
More Circular Tourist Activity in the Hotel Sector. The Role of Innovation. Administrative
Sciences, 9 (2), 47. https://doi.org/10.3390/admsci9020047
10. Ghisellini P., Cialani, C., and Ulgiati, S. (2016). A review on the circular economy: the
expected transition to a balanced interplay of environmental and economic systems, Journal
of Cleaner Production, 114, 11-32.
11. Greyson, J. (2007). An economic instrument for zero waste, economic growth and
sustainability, Journal of Cleaner Production, 15, 1382-1390.
12. Krausz, R. (2012). All for naught? A critical study of zero waste to landfill initiatives (PhD
thesis). Lincoln University, New Zealand: [R. Krausz]
13. Laor, P., Suma, Y., Keawdounglek, V., Hongtong, A., Apidechkul, T. and Pasukphun, N.
(2018). Knowledge, attitude and practice of municipal solid waste management among
highland residents in Northern Thailand. Journal of Health Research, 32(2), 123-131.
https://doi.org/10.1108/JHR-01-2018-013.
14. Manniche, J., Topsø Larsen K., Brandt Broegaard R., and Holland, E. (2017). Destination:
A Circular Tourism Economy: A Handbook for Transitioning toward a Circular Economy
within the Tourism and Hospitality Sectors in the South Baltic Region (1st ed.). Denmark:
Centre for Regional and Tourism Research. Retrieved 11.02.2020. from
http://urn.kb.se/resolve?urn=urn:nbn:se:lnu:diva-77708
15. Oh, J., Lee, H. (2013). Exploring Residents' Attitudes in Multifamily Housing Toward Food
Waste Zero-Emission System with Fermentation and Extinction Technology. Journal of
Korean Society of Environmental Engineers, 35(5), 321-333.
16. Pablo-Romero, M., Pozo-Barajas, R. and Sánchez-Rivas, J. (2017). Relationships between
tourism and hospitality sector electricity consumption in Spanish provinces (1999–2013).
Sustainability, 9(4), 480. https://doi.org/10.3390/su9040480
17. Pamfilie, R., Firoiu, D., Croitoru, A.G. and Ionescu, G.H.I. (2018). Circular Economy –A
New Direction for the Sustainability of the Hotel Industry in Romania? Amfiteatru
Economic, 20(48), 388-404.
18. Piippo, S., Juntunen, A., Kurppa, S., Pongrácz, E. (2014). The use of bio-waste to revegetate
eroded land areas in Ylläs, Northern Finland: Toward a zero waste perspective of tourism
in the Finnish Lapland. Resources, Conservation and Recycling, 93, 9-22.
19. Pubule. J., Blumberga, A., Romagnoli, F., Blumberga, D. (2015). Finding an optimal
solution for biowaste management in the Baltic States. Journal of Cleaner Production, 88,
214-223. http://dx.doi.org/10.1016/j.jclepro.2014.04.053
20. Radwan, H.R., Jones, E. and Minoli, D. (2010). Managing Solid Waste in Small Hotels.
Journal of Sustainable Tourism, 18, 175-190.
51st International Scientific Conference on Economic and Social Development – Rabat, 26-27 March 2020
160
21. Remolador, M.A. (2011). Guide to Greening Hotels through Waste Management & Green
Purchasing. Retrieved 12.02.2020. from http://nerc.org/documents/green_hotels_guide.pdf
22. Rico, A. et al. (2019). Carbon footprint of tourism in Barcelona. Tourism Management, 70,
491–504.
23. Skordilis, A. (2004). Modelling of Integrated Solid Waste Management Systems in an
Island. Resources, Conservation and Recycling, 41, 243-254.
24. Song, Q., Li, J. and Zeng, X. (2015). Minimizing the increasing solid waste through zero
waste strategy, Journal of Cleaner Production, 104, 199-201.
25. Styles D., Schönberger H., Galvez Martos J. L. (2017). Best Environmental Management
Practice in the Tourism Sector. Luxembourg: Publications Office of the European Union.
Retrieved 23.01.2020. from https://op.europa.eu/en/publication-detail/-/publication/
731280a0-df78-11e5-8fea-01aa75ed71a1/language-en
26. United Nations Environment Programme (2003). A Manual for Water and Waste
Management: What the Tourism Industry Can Do to Improve Its Performance. Retrieved
25.01.2020. from http://www.unep.fr/shared/publications/pdf/WEBx0015xPA-Water
Waste.pdf
27. Veleva, V., Bodkin, G. and Todorova, S. (2017). The need for better measurement and
employee engagement to advance a circular economy: Lessons from Biogen's "Zero Waste"
journey, Journal of Cleaner Production, 154, 517-529. doi: 10.1016/j.jclepro.2017.03.177
28. Willmott, L. and Graci, S.R. (2012). Solid Waste Management in Small Island Destinations:
A Case Study of Gili Trawangan, Indonesia. TEOROS, Special Issue, 71-76.
29. Zero Waste International Alliance (2018). Retrieved 11.02.2020. from http://zwia.org/zero-
waste-definition/

51st International Scientific Conference on Economic and Social Development – Rabat, 26-27 March 2020
161
PREDICTION OF FINANCIAL HEALTH OF BUSINESS ENTITIES OF
SELECTED SECTOR USING IN05 AND VERIFICATION OF ITS
PREDICTIVE ABILITY THROUGH ROC
Dusan Karpac
Department of Economics, Univerzitna 1, 010 26 Zilina, Slovakia
University of Zilina, The Faculty of Operation and Economics of Transport and
Communications
Viera Bartosova
Department of Economics, Univerzitna 1, 010 26 Zilina, Slovakia
University of Zilina, The Faculty of Operation and Economics of Transport and
Communications
Filip Rebetak
Department of Economics, Univerzitna 1, 010 26 Zilina, Slovakia
University of Zilina, The Faculty of Operation and Economics of Transport and
Communications
ABSTRACT
Forecasting business failure is a worldwide known term, in a global notion, and there is a lot
of prediction models constructed to compute financial health of a company and, by that, state
whether a company inclines to financial boom or bankruptcy. A healthy financial management
of a business entity is very important for the proper operation of the business, and it is therefore
very important to know how to assess financial health and to anticipate possible problems that
will be easier to eliminate in advance. Globalized prediction models compute financial health
of companies, but the vast majority of models predicting business failure are constructed solely
for the conditions of a particular country or even just for a specific sector of a national
economy. Predictive models can indicate whether an entity tends to prosper or bankruptcy, and
so we can assess the financial health of the business. This paper provides a description of the
index IN05, discusses its application to a sample of 266 Slovak subjects and points to its
prediction in the given field. The verification of the ability to forecast bankruptcy or financial
stability has been evaluated through ROC analysis.
Keywords: Specificity, Financial prediction, ROC curve
1. INTRODUCTION
The term "enterprise financial health forecasting" is widely known in the world, but the
intensity of how different countries are addressing this issue is uneven. Business entities in our
country forecast their financial stability only in a minimalist way, mainly because the conditions
for the Slovak market have so far not designed a general model of prediction that is fully
applicable to any entity, regardless of the sector in which it operates. In view of this, it is
necessary at least to verify which models are suitable for use in a particular sector, and that fact
was the main reason for us to write this study. Since the Slovak and Czech economies are very
similar to each other, we have chosen to use the IN05 model from Ivan and Inka Neumaier.
Evaluation of efficiency is an integral part of rational behavior of units that aims to survive in
a competitive environment in a long-term (Balcerzak et al, 2018; Zapletalova, 2017). Every
corporation has an economic and moral responsibility to its stockholders to perform well
financially (Janoskova and Krizanova, 2017). However, the number of bankruptcies in Slovakia
has been growing for several years without an apparent macroeconomic cause. To prevent a
rapid denigration and to prevent the outflow of foreign capital, various efforts are being

51st International Scientific Conference on Economic and Social Development – Rabat, 26-27 March 2020
162
zealously implemented. Robust analysis using conventional bankruptcy predictive tools has
shown that existing models are adaptable to local conditions, particularly local legislation
(Kliestik et al, 2018; Ljungholm, 2017). Financial hardship is the financial state of an enterprise
when an enterprise has serious payment problems that cannot be resolved otherwise than by
radically changing its operating or financial activity (Vagner, 2016; Rowlands and Kabongi,
2017). Bankruptcy is a situation where an enterprise is unable to pay its debts and ultimately
fails to meet its obligations. Bankruptcy is a condition that ends all business and economic
activities, so it is also referred to as economic death (Moharrampour, Esfandiyari and
Asgarzadeh, 2014). This study shows how IN05 indexes sample entities to bankrupt and
prosperous businesses, and through the ROC analysis we verify the ability to properly
redistribute these businesses.
2. LITERATURE REVIEW
In order to ensure the best financial health of an enterprise, we can predict it, i.e. to predict how
the funds and the total assets of an enterprise should be treated in the short or long term for their
most efficient use. In order to identify the level of financial health of the company, prediction
models, also called early warning systems, are used. It assesses the health of the company on
the basis of complex characteristics, both in terms of past and current developments, as well as
in terms of the future development of the entity. Paul Joseph Fitzpatrick, in 1932, first published
a study comparing the development of indicators in solvent and insolvent businesses. He
pointed out that the development of selected business indicators - indicators long before the
serious economic difficulties that usually result in insolvency - begin to differ in the endangered
enterprises. Later, Merwin, Beaver and Altman dealt with this issue. These are considered to
be the founders of forecasts and predictions of the financial health of business entities
(Valaskova, Kliestik and Kovacova, 2018; Evans, 2018). In a more recent study, the
interdependence of sovereign default risk and banking fragility in Russia was investigated,
using credit default swaps as a proxy for default risk (Cygler and Sroka, 2017; Biker and
Sedliacikova, 2018). Predictive models are constructed around the world by authors from
different countries. In Slovakia, Chrastinova and Hurtosova are the most known authors (Kral
and Janoskova, 2015; Kliestikova, Misankova and Kliestik, 2017). Also in Slovakia very
important author in the area of predictions is Gundova (2014). In the neighboring Czech
Republic, there are also several representatives of the area of financial crisis predictions.
Absolutely best known are the spouses Inka and Ivan Neumaiers or Kislingerova (Durica,
Podhorska and Durana, 2019; Vagner, 2017). In the Czech Republic, there is also significant
author, doing research and working in the prediction of bankruptcy area, Ruckova (2008).
3. METHODOLOGY
ROC analysis was developed as a standard methodology to quantify the ability of the signal
receiver to correctly distinguish objects of interest from the background noise in the system. In
the area of financial risk forecasting, ROC analyzes the correct distribution of subjects and
compares two categorization algorithms, one of which is considered to be a comparative
element. (Fawcett, 2006; Machek, 2014). The base reallocation we used is based on the
Commercial Code and evaluates financial health under the following conditions: Equity /
Liabilities <0.04; Current assets / short-term liabilities <1; Negative EAT. Business entities that
met all three conditions simultaneously were included in the class of non-prosperous subjects
and others were designated as prosperous businesses. The sample of entities we have selected
consists of 266 businesses in the IT area. Data analysis reported 236 prosperous and 30 non-
prosperous companies, and this was considered a standard benchmark in verifying prediction
models.

51st International Scientific Conference on Economic and Social Development – Rabat, 26-27 March 2020
163
Model index IN05 from Ivan and Inky Neumaiers is the last among their indexes and was
created as an update of the IN01 index in 2004. The shape of this index is as follows [21]:
IN05 = 0,13X1 + 0.04X2 + 3,97X3 + 0,21X4 + 0,09X5 (1)
Where:
X1 = total assets / external capital, X2 = EBIT / interest expense, X3 = EBIT / total assets,
X4 = revenues / total assets, X5 = current assets / short-term external resources
The classification of the resulting values: IN05> 1.6 symbolizes a healthy financial situation of
the company; 0,9 <IN05 ≤ 1,6 neutral zone of unallocated results and if IN05 ≤ 0,9 unhealthy
financial situation of the company. Since ROC analysis compares two sorting algorithms of
subjects into two categories, we have modified the distribution of IN05 index as follows: if
IN05> 1,25 symbolizes a healthy financial situation of the company; and if IN05 ≤ 1,25
unhealthy financial situation of the company. The class of enterprises, which according to IN05
should be labeled as average, has been redistributed exactly in half, which means that we have
put its middle value in the scoring interval for businesses in the gray zone, and it has been used
as the threshold for determining the prosperity of entities.
4. RESULTS
For the purpose of the paper we calculated the financial standing of each company through the
selected model. The results were compared to the definition of the company in crisis according
to the Slovak legislation and by the confusion matrix of the prediction model we got the
parameters evaluating the predictability of the selected model. These data are presented in the
following Table 1.
Table 1: Ranking success rate ratings for IN05
Type I error 0,00%
Type II error 30,51%
Sensitivity 69,49%
Specificity 100,00%
Accuracy 72,93%
AUC 84,7%
Source: processed by the authors
In Table 1 we can see that error of II. type, consisting of the false denomination of 72 enterprises
for non-prospering, amounts to 30.51%. This is due to the fact that the 72 subjects that were
mistakenly identified were in the section of 236 healthy business entities and therefore the
number of incorrectly marked enterprises ultimately did not cause such a large percentage of
error of second kind. The overall accuracy of the model has been reduced and evaluated to
72.93%, but despite the overall accuracy of the model, the standard element evaluating its
classification capability is the AUC area.
Figure following on the next page
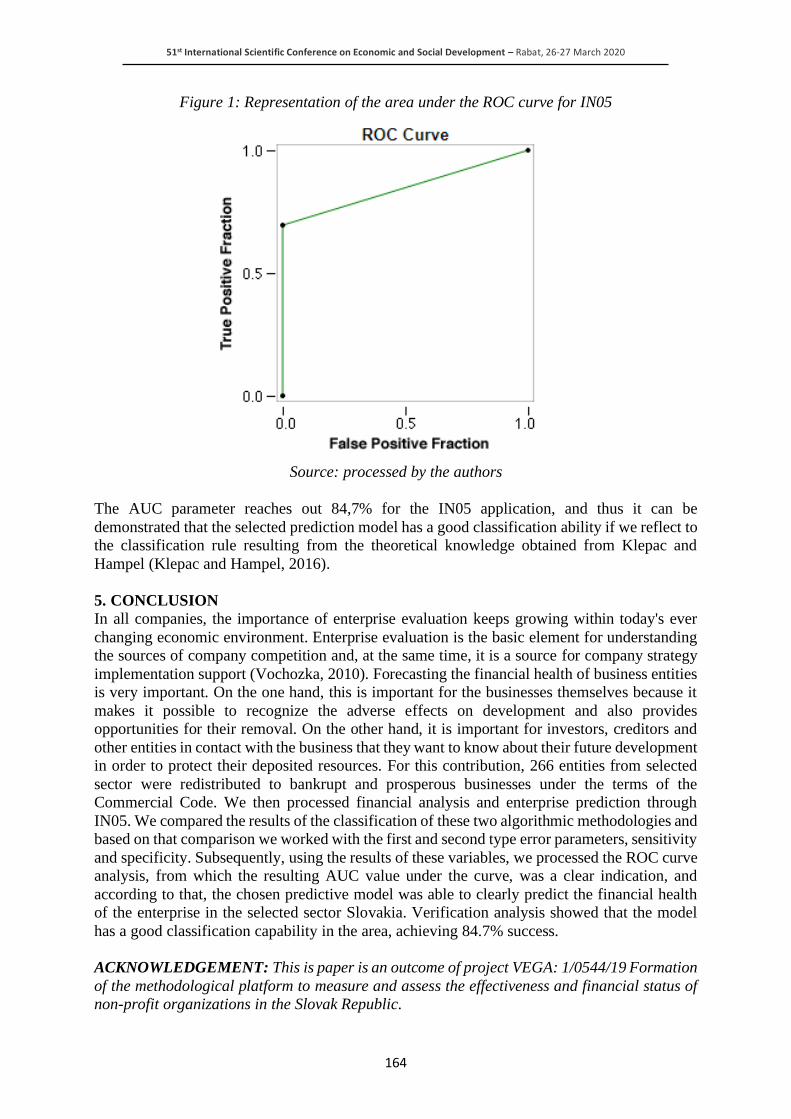
51st International Scientific Conference on Economic and Social Development – Rabat, 26-27 March 2020
164
Figure 1: Representation of the area under the ROC curve for IN05
Source: processed by the authors
The AUC parameter reaches out 84,7% for the IN05 application, and thus it can be
demonstrated that the selected prediction model has a good classification ability if we reflect to
the classification rule resulting from the theoretical knowledge obtained from Klepac and
Hampel (Klepac and Hampel, 2016).
5. CONCLUSION
In all companies, the importance of enterprise evaluation keeps growing within today's ever
changing economic environment. Enterprise evaluation is the basic element for understanding
the sources of company competition and, at the same time, it is a source for company strategy
implementation support (Vochozka, 2010). Forecasting the financial health of business entities
is very important. On the one hand, this is important for the businesses themselves because it
makes it possible to recognize the adverse effects on development and also provides
opportunities for their removal. On the other hand, it is important for investors, creditors and
other entities in contact with the business that they want to know about their future development
in order to protect their deposited resources. For this contribution, 266 entities from selected
sector were redistributed to bankrupt and prosperous businesses under the terms of the
Commercial Code. We then processed financial analysis and enterprise prediction through
IN05. We compared the results of the classification of these two algorithmic methodologies and
based on that comparison we worked with the first and second type error parameters, sensitivity
and specificity. Subsequently, using the results of these variables, we processed the ROC curve
analysis, from which the resulting AUC value under the curve, was a clear indication, and
according to that, the chosen predictive model was able to clearly predict the financial health
of the enterprise in the selected sector Slovakia. Verification analysis showed that the model
has a good classification capability in the area, achieving 84.7% success.
ACKNOWLEDGEMENT: This is paper is an outcome of project VEGA: 1/0544/19 Formation
of the methodological platform to measure and assess the effectiveness and financial status of
non-profit organizations in the Slovak Republic.

51st International Scientific Conference on Economic and Social Development – Rabat, 26-27 March 2020
165
LITERATURE:
1. Balcerzak P., Kliestik T., Streimikiene D., Smrcka L. (2018). Non-Parametric Approach to
Measuring the Efficiency of Banking Sectors in European Union Countries, Acta
Polytechnica Hungarica. 51-70.
2. Bikar M., Sedliacikova M. (2018). The change of the trajectory towards growing economy:
The evidence from Russia. Ekonomicko-manazerske spektrum. 26-36.
3. Cygler J., Sroka W. (2017). Competition Disadvantages: the Case of the High Tech
Companies. Inzinerine Ekonomika-Engineering Economics. 494-504.
4. Durica M., Podhorska I., Durana P. (2019). Business failure prediction using cart-based
model: A case of Slovak companies. Ekonomicko-manazerske spektrum, 51-61.
5. Evans O. (2018). Improved financial performance without improved operational efficiency:
The case of Nigerian firms. Forum Scientiae Oeconomia, 25-39.
6. Fawcett T. (2006). An introduction to ROC analysis. Pattern Recognition Letters. 861-874.
7. Gundova P. (2014). Verification of the selected prediction methods in Slovak companies.
In: Acta Academica Karviniensia. 26-38.
8. Janoskova K., Krizanova A. (2017). Comparison of selected internationally recognized
brand valuation methods, Oeconomia Copernicana. 99-110.
9. Klepac V., Hampel D. (2016). Prediction of bankruptcy with SVM classifiers among retail
business companies in EU. Universitatis Agriculturae et Silveculturae Mendelianae
Brunensis. 627-634.
10. Kliestik T., Misankova M., Valaskova K., Svabova L. (2018). Bankruptcy prevention: new
effort to reflect on legal and social changes, Science and Engineering Ethics. 791-803.
11. Kliestikova J., Misankova M., Kliestik T. (2017). Bankruptcy in Slovakia: international
comparison of the creditor´s position. Oeconomia Copernicana. 221-237.
12. Kral P., Janoskova K. (2015). Condition of acceptability of project risk in management of
the project portfolio. In: 15th International Scientific Conference on Globalization and its
Socio-Economic Consequences, Rajecke Teplice. 345-352.
13. Ljungholm D. P. (2017). The Social Ontology of Institutions: A Reassessment,
Contemporary Readings in Law and Social Justice. 132–138.
14. Machek O. (2014). Long-term predictive ability of bankruptcy models in the Czech
Republic: evidence from 2007-2012. In: Central European Business Review. 14-17.
15. Moharrampour M., Esfandiyari S., Asgarzadeh A. (2014). Evaluating the Bankruptcy
prediction models. In: Applied mathematics in Engineering, Management and Technology.
620 – 633.
16. Rowlands D., Kabongi D. K. (2017). Military Expenditures, Alliance Membership, and
Fiscal Restraint, Geopolitics, History, and International Relations. 55–79
17. Ruckova P. (2008). Financni analyza – metody, ukazatele, vyuziti v praxi. 2. edition. Praha:
GRADA Publishing, 120.
18. Vagner L. (2016). Controlling as a competitiveness tool in the global market. In: 16th
International Scientific Conference on Globalization and its Socio-Economic
Consequences. 2260-2266.
19. Vagner L. (2017). Facility Management as a Partner of Cost Controlling at Costs
Optimization in the Selected Enterprise. In: 17th Annual Conference on Finance and
Accounting. 621-629.
20. Valaskova K., Kliestik T., Kovacova M. (2018). Management of financial risks in Slovak
enterprises using regression analysis. Oeconomia Copernicana, 105–121.
21. Vochozka M. (2010). Development of methods for comprehensive evaluation of business
performance. Politicka ekonomie. 675-688.
22. Zapletalova S. (2017). Competitive strategies of the SMEs: Empirical evidence from the
Czech Republic, Forum Scientiae Oeconomia. 9-26.

51st International Scientific Conference on Economic and Social Development – Rabat, 26-27 March 2020
166
EARNINGS MANAGEMENT PHENOMENON
Susana Cristina Rodrigues Aldeia
Portucalense University, Portugal
ABSTRACT
The main goal of this paper is to understand better the earnings management phenomenon, in
particular, to perceive the process, it means, the concept, motivations and used techniques. For
this purpose, it makes the issue's theoretical analysis. The results show that the concept is
comprehensive. Several definitions lead to common conclusions, and it seeks to distort the
company's accounts truth; it means, a deceptive practice. It happens due to the current
accounting system' characteristics, in particular, to the standards' flexibility and discretionary
that allows to financial information's preparers the selection between several criteria to record
the companies' economic transactions. This arbitrariness leads to manipulations in the
financial standards elements as in the incomes, expenses, assets and liabilities.
Keywords: Earnings Management, Creative Accounting, Financial Information, Financial
Fraude
1. INTRODUCTION
Earnings management continues to be a topic with international relevance, due to the impact of
it in the financials’ information quality and as a consequence in the economic decisions of the
users (Carp and Georgescu, 2019). The literature designates this phenomenon by various
names, between them: "earnings management", "income smoothing", "accounting hocus-
popus", "the numbers game", "aggressive accounting", "creative accounting", between others1.
The proof of this is the number of studies that continue to be published to study this
phenomenon in the most varied aspects (Otomasa et al., 2020, Cai et al., 2020, Choi et al., 2019,
Bo and Zhang, 2019, Mangala and Isha, 2019, Levine and Smith, 2019, Seunghan, 2019, Carp
and Georgescu, 2019, Beyer et al., 2019). Over time, the public has become familiar with the
various international financial scandals, such as Enron, Adelphia Communications, Global
Crossing, WorldCom, Parmalat and other more recent cases. These successive cases cause
incalculable damage to the credibility of the accounting profession, as well as undermine the
confidence that must be present in the financial markets (Vallejo, 2008). In response to these
accounting scandals and the 2008 financial scandal, the United States Congress passed the
Sarbanes-Oxley Act and the Dodd-Frank Act. Those Acts require companies to introduce
policies designed by clawbacks, to prevent this type of practice (Levine and Smith, 2019).
2. THE EARNINGS MANAGEMENT’S FRAMEWORK
2.1. Framework
The literature sees the earnings management phenomenon as a traditionally Anglo-Saxon
phenomenon due to the standards' flexibility. Nevertheless, in the last decades, it presents a
world dimension. Authors consider that if different accounting professionals prepare the
financial statements of the same company, for the same period, each accountant will obtain
different results, according to its accounting standards' interpretation (Larraz, 1997). In
literature, it is possible to find many definitions of earnings management. They present
differences as for its range, but all agree that it shows a distorted picture of company accounts.
1 https://eds.a.ebscohost.com/eds/detail/detail?vid=6&sid=995140d1-1b3a-4447-b29f-1235dd93a4e6%40sdc-v-sessmgr03&bdata=JkF1dGhUeXBlPWlwLGNvb2tpZSxzaGliLHVpZCZsYW5nPXB0LXB0JnNpdGU9ZWRzLWxpdmUmc2NvcGU9c2l0ZQ%3d%3d#AN=119214054&db=ers

51st International Scientific Conference on Economic and Social Development – Rabat, 26-27 March 2020
167
The different points of view provide different perceptions about the theme, allowing to conclude
it is possible to study this issue in the most different optics. It also is possible to research in the
different analysis approaches, such as academic, accounting, economic, financial, legally. The
authors that study it agree that it shows a different image of the real, due to different interests.
Because of it, it is possible to conclude it is a kind of fraud because it changes reality. It is a
phenomenon generalized, it there is in all kind of company and country, and it is prevalent. On
the other hand, it constitutes a misleading practice. It tends to induce the users to decisions
based on false accounting information, it changes the accounting values, making a makeup that
allows obtaining the desired and planned image of the entity's financial position and different
of the right and real image. It can be understood as the intention to occult information, in all the
times it is not given to users additional information. Some authors use the concept to describe
the process whereby the experts use its knowledge about the accounting rules to manipulate the
figures reflected in the company's accounts (Salas et al., 1996). The Spanish doctrine uses the
term "contabilidad creativa" when talks about earnings management. To the (Dimitris Chorafas,
2007) this expression is inappropriate in a sense gives by Fra Luca Pacioli. The practice of
exchanging values in the corporate records to hide losses or any other practice to make up the
financial position is corrupt, and it can make to show abysmal results.
2.2. Motivations and techniques
According to Lequericaonandia (2001), the motivations to commit fraud or irregularities are
varied, and it depends on the three factors: who deceives, of the means and techniques used to
amend the annual accounts; and, who is deceiving with the accounting changes. The agency
theory explains this behaviour, considering there is a set of factors derived from contractual
relationships within the company and the economic regulation process. Those factors give
motivation to the agent to adopt a certain attitude. There is an extensive empirical literature that
highlights the factors that determine the agent's choice between different accounting
alternatives. The agent tries to maximize its utility, and this search reflects the accounting
criterion selection to apply. Researchers conclude that contracts existing and potential, explicit
and implicit, between creditors and company, create incentives for management to change
results. Morón (2009) considers the companies' main goals to resort to the earnings
management: the desire to improve the corporate image; and on the other hand, the interest into
evidence the company accounts' stability over the time, or instead, the show a financial position
degraded image. Since the late seventies that the research relates to the motivations to realize
practices, discretionary focuses primarily on the incentives created by management
compensation contracts, debt contracts and the economic regulation's process. Nevertheless,
recent literature invokes other motivations to this phenomenon, between them: negotiations
with unions, to influence the shareholders' perceptions relative to the company's management,
the necessity to obtains external financing, and the costs of preparing financial information. In
the management compensation contracts, the determination of the managers' salary dependent
on an incentive plan that increases when increase the results presented. Because of this, it is
most probable that the administration with incentive plans chose accounting criteria that include
in the published profit the future periods' benefits. The positive accounting theory defends the
companies that have a direction to make economic decisions, have schemes of the retribution
sustained in the disclosed result and, because of this direction use accounting methods which
give rise to more significant benefit or anticipation thereof of the same. They need to establish
a mechanism to motivate the acting who manages and not ignore the companies' interests
(Blasco, 2002). Nevertheless, there are other forms of executive retribution, such as stock
options, and that it increased, significantly, in the ninety decades. Those incentives generate
plus stimulus to companies administrations to turn over more value to the stakeholders;
consequently, it increases the accounting manipulation risk (Vallejo, 2008).

51st International Scientific Conference on Economic and Social Development – Rabat, 26-27 March 2020
168
Another motivation to manipulate the financial statements is related to the use of the debt
contracts, as an object to limit wealth transfers from the bondholders to shareholders. How more
significant is the ratio of the companies' net debt, there is more probability that the
administration select the accounting procedures that allows to input incomes of the future
periods to the actual one (Blasco, 2002). Another motivation to manipulate the financial
statements is related to the use of the debt contracts, as an object to limit wealth transfers from
the bondholders to shareholders. How more significant is the ratio of the companies' net debt,
there is more probability that the administration select the accounting procedures that allows to
input incomes of the future periods to the actual one (Blasco, 2002). The debt contracts based
on accounting often restrict the possibility of the company to pay dividends or to emit additional
debt. The pacts that restrict the company to emit additional debt, frequently, require the
sustainability of the minimum ratio of the asset or maximum debt. Thus, the actions on the
accounting that increase the profit will increase/decrease those ratios, respectively. The debit
contracts impose restrictions on investment decisions, financing, and dividends because they
limit the agent's capacity to make decisions that can to increase the possibilities of the
insolvency of the company (Lequericaonandia, 2001). Relatively to the cost derived from the
politic process or the economic regulation, the research in this area assumes that the biggest
companies are politically more sensitive than the smaller ones; and that they support the highest
wealth transfers than the smaller companies (Blasco, 2002). On the economic regulation
process, the governmental organisms regulate the economic activity of a lot of companies and
activity sectors, transferring or pulling out resources, by setting tariffs, monitoring monopolistic
conduct. Regulated companies are interested in presenting lower results, with the goal of to can
obtain higher transfers of wealth in its favour, fewer taxes, higher subventions, and others
(Lequericaonandia, 2001). The selection between the different accounting standards can be
conditioned by the costs to obtain and prepare the information, in particular, the case the
appliance of criteria with higher application costs. To Lequericaonandia (2001), this
phenomenon occurs due to two reasons. First, there is a strong asymmetry of information
between the company's internal and external; it makes difficult the detection, from abroad, the
manipulation practices. Second, the accounting legal framework favours the appearance of
those practices when it gives different possibilities to record the economic operations, and the
financial information preparer will choose the one that best satisfies each moment its interests.
The existence of accounting principles that allow the introduction of subjective criteria
propitiates financial information manipulation. The discussion about earnings management has
a particular focus on the impact that may have overstock investor decisions. Those procedures
make relevant changes in the financial statements, may mislead decision-making. According to
Salas et al. (1997), the most used techniques to make up financial data are the increase or
decrease of the income and expenses, the variation on the assets and liabilities, and finally the
reclassification of these accounting items. Those changes promote several financial
consequences: a) variation on financial statements, it means the higher/lower profit or financial
position; b) the manipulation of the financial information additional, the auditing report and
management report, with the consequences of the changing of the financial ratios, between them
liquidity, indebtedness, financial independence or profitability; c) and finally, as the
consequence of the last the company's value variation (Salas et al., 1997). Salas et al. (1996)
consider technics can adopt different forms: 1) the choice between different accounting
methods; 2) some accounting movements implies a relevant estimations content; 3) it can be
recorded artificial transactions to manipulate the financial position's values and to occult, the
benefits between accounting periods and allowing the obtaining the desired corporate image;
4) in some cases, it can occur the change of accounting criteria from one period to the next.

51st International Scientific Conference on Economic and Social Development – Rabat, 26-27 March 2020
169
2.3. Some solutions
A long time ago that the financial world questions the veracity and impartiality of the financial
statements, and because of this regulatory authorities discuss alternatives in order to avoid the
earnings management phenomenon (Naser, 1993). Madueño and Sánchez (2000) consider that
the economic reality is unique, and the information's user does not change the reality's
representation, the fact that accounting regulation allows multiple alternative criteria represents
an imperfect state of legislation. Therefore, the same authors demand a precise definition of
concepts and a consistent attitude of the legislator in the face of this uncertainty (Madueño and
Sánchez, 2000). Morón (2009) defends that the conceptual framework should avoid such
situations. Regulators of accounting standards and the accounting profession itself can combat
earnings management effectively. Therefore Salas and Sobrevias (2004) and Blasco (2002)
present mechanisms that they consider pertinent to combat this phenomenon.
Table 1: Mechanism to combat earnings management
Source: Salas and Sobrevias (2004) and Blasco (2002)
3. CONCLUSION
This research seeks to understand better the earnings management process, in particular, to
know the concept, motivations and used technics. This phenomenon is characterized as present
a distorted picture of the company's financial situation, taking into account the different
interests of the managers. As it changes the accounts' reality and can induce the financial
information users wrongly, it is a fraud at the financial dimension. There are several reasons to
directors decide to manipulate financial statements, between them, the desire of the
improvement the corporate image showing stability over time, incentives created by the
administration compensation contract, negotiations with unions, to give a misleading
perception to shareholders in order to influence its economic decisions, to limit the wealth's
transfer to holders of debt contracts.
1When selecting accounting criteria, regulation should reduce the number of options, the accounting flexibility
leave margin to directors to manipulate the business' accounts;
2The good governance' codes must reinforce the auditing committee's role to watch over of truth of financial
statements and avoid the manipulation attempt;
3
Auditors must adopt a clear and firm posture when there are signs of creativity. This attitude increases
credibility of the financial statements and reduce the possibility to change the record information in the
accounting;
4The governance structure and the entity's internal control system have an important role to avoid a
discretionary accounting actuation;
5Publicize situations of abuse by entities, companies represented in the capital markets will consider the effects
in its public image, and because of it will not be incentives to make aggressive accounting operations;
6As consequence of the unreal transactions, the accounting regulation should favor the interpretation of the
faithful image as substance in the form;
7Regulatory bodies should not allow certain specific treatment by some companies outside the accounting
standard;
8Listed companies should be required to present their accounts corrected for auditors' non-conformities, as is
the case in many countries;
9Strengthening the ethics' codes of company directors and of accounting professionals, so as not to accept
earnings management in the accounts.
51st International Scientific Conference on Economic and Social Development – Rabat, 26-27 March 2020
170
The mechanism used to manipulate the financial information boils down to, essentially, the
increase or the decrease of incomes/expenses and assets/liabilities. The accounting regulation
flexibility allows the financial accounts' preparers to choose between available accounting
criteria, according to its interest.
LITERATURE:
1. BEYER, A., GUTTMAN, I. & MARINOVIC, I. 2019. Earnings Management and Earnings
Quality: Theory and Evidence. Accounting Review, 94, 77-77-101.
2. BLASCO, M. A. V. 2002. Reflexiones en torno a la contabilidad creativa Técnica contable.
3. BO, L. & ZHANG, D. 2019. A Temporal Analysis of Expectation Management: Evidence
from Public Management Earnings Forecasts. Journal of Accounting & Finance (2158-
3625), 19, 102-102-124.
4. CAI, G., LI, W. & TANG, Z. 2020. Religion and the Method of Earnings Management:
Evidence from China. Journal of Business Ethics, 161, 71-71-90.
5. CARP, M. & GEORGESCU, I. E. 2019. The Influence of Audit Opinion on the Degree of
Real Earnings Management. The Case of Romanian Listed Companies. Audit Financiar,
17, 666-666-679.
6. CHOI, J. H., CHOI, S., MYERS, L. A. & ZIEBART, D. 2019. Financial Statement
Comparability and the Informativeness of Stock Prices About Future Earnings.
Contemporary Accounting Research, 36, 389-389-417.
7. DIMITRIS CHORAFAS 2007. La ética de los negocios le agrega valor a las revelaciones
financieras IFRS, valor razonable y gobierno corporativo ECOE Ediciones.
8. LARRAZ, J. L. G. 1997. La falsedad contable en el código penal Estudios de contabilidad
y auditoría: En homenaje a Don Carlos Cubillo Valverde.
9. LEQUERICAONANDIA, M. B. V. 2001. Alteraciones y manipulaciones de la
contabilidad. Universidad de Valladolid. Facultad de Ciencias Económicas y
Empresariales.
10. LEVINE, C. B. & SMITH, M. J., 2019. Clawbacks and Earnings Management. Journal of
Management Accounting Research, 31, 129-129-151.
11. MADUEÑO, M. C. & SÁNCHEZ, H. M. 2000. Algunas reflexiones sobre la contabilidad
creativa Técnica contable.
12. MANGALA, D. & ISHA 2019. Do Corporate Governance Characteristics Constrain
Earnings Management? - The Role of Board, Audit Committee and Ownership Structure in
Indian Corporate Sector. IUP Journal of Accounting Research & Audit Practices, 18, 7-7-
32.
13. MORÓN, M. T. H. 2009. ¿Puede el marco conceptual contener el avance de la Contabilidad
Creativa? Técnica económica: administración y dirección de empresas, 177, 22-32.
14. NASER, K. 1993. Creative Financial Accounting: Its Nature and Use, Londres, Prentice
Hall
15. OTOMASA, S., SHIIBA, A. & SHUTO, A., 2020. Management Earnings Forecasts as a
Performance Target in Executive Compensation Contracts. Journal of Accounting, Auditing
& Finance, 35, 139-139-167.
16. SALAS, J. O. A., BLAKE, J. & GUTIÉRREZ, S. M. 1996. La contabilidad creativa en
España y en el Reino Unido: un estudio comparativo VII Encuentro de profesores
universitarios de contabilidad : Barcelona, 5 a 8 de junio de 1996 / coord. por Departament
de Comptabilitat, Vol. 1, 1996 (Ponencia y comunicaciones sobre contabilidad financiera).
Barcelona.
17. SALAS, J. O. A., GUTIÉRREZ, S. M. & BLAKE, J. 1997. La Contabilidad Creativa
Partida doble.

51st International Scientific Conference on Economic and Social Development – Rabat, 26-27 March 2020
171
18. SALAS, J. O. A. & SOBREVIAS, E. O. 2004. Propuestas para combatir la contabilidad
creativa. Universia Business Review.
19. SEUNGHAN, N. 2019. The Role of Accruals in the Prediction of Future Earnings. Journal
of Accounting & Finance (2158-3625), 19, 164-164-188.
20. VALLEJO, G. J. R. 2008. Las normas internacionales de contabilidad y la contabilidad
creativa. Cuadernos de contabilidad, 9, No 24, 251-301

51st International Scientific Conference on Economic and Social Development – Rabat, 26-27 March 2020
172
FORMULATION OF MOTIVATION POLICY IN A GENERAL
EDUCATION ORGANIZATION APPLYING PERSONNEL
MARKETING TECHNOLOGIES
Elena V. Kolnik
Novosibirsk State University of Economics and Management, NSUEM
Novosibirsk, Russia
Yuliya A. Masalova
Novosibirsk State University of Economics and Management, NSUEM
Novosibirsk, Russia
ABSTRACT
Under present conditions, a well-built motivation policy of the organization becomes an
important element of the personnel management system. The article describes the main stages
of motivation policy formulation in the education institution using marketing technologies.
Based on their priority interests, the segmentation of teaching staff was carried out. The
motivation profile of teachers was build, and the degree of involvement and satisfaction was
assessed. The level of general education teachers’ motivation is identified. It is concluded that
personnel marketing technologies help improve the motivation policy that contributes to the
retention of qualified personnel and increase of their efficiency.
Keywords: motivation policy, personnel marketing, job satisfaction, employee engagement,
motivation
1. INTRODUCTION
The system of market relations ensures that all services, including educational, must be
provided to consumers taking into account their quality requirements. Considering the client's
wishes becomes a key element of the marketing approach in management. Personnel
management in educational organizations is no exception. In this kind of organizations an
entrepreneurial marketing approach prevails in working with teaching staff, when working
conditions, work itself, and jobs are regarded as products sold on the market. However, it is
necessary to consider specific features of the educational institution that distinguish it from a
commercial organization, and fundamentally affect the motivational work with the teaching
staff. In our opinion, personnel marketing technologies based on market thinking in the
formulation of motivation policy of a general education institution meets the requirements of
the time, and will significantly increase its effectiveness.
2. THE ESSENCE OF MOTIVATION POLICY
Conducting scientific research primarily involves studying and understanding the theoretical
and methodological foundations of the object of this research. In this regard, we considered the
views of various scientists on work motivation, analyzed the concept of "policy", which has a
very wide meaning and encompasses all the activities, a comparison of the definitions of HR
policy, as, in the opinion of some researchers, the motivation policy is part of personnel policy.
We studied different interpretations of the concept of motivation policy, which gave us the
opportunity to formulate our own definition of motivation policy. Motivation policy on the one
hand, is an objective activity of coordinating the interests of all parties of the motivation
process, on the other, it is a purposeful process of formation and management of labour
motivation, including a system of principles, norms and rules that define the main directions,
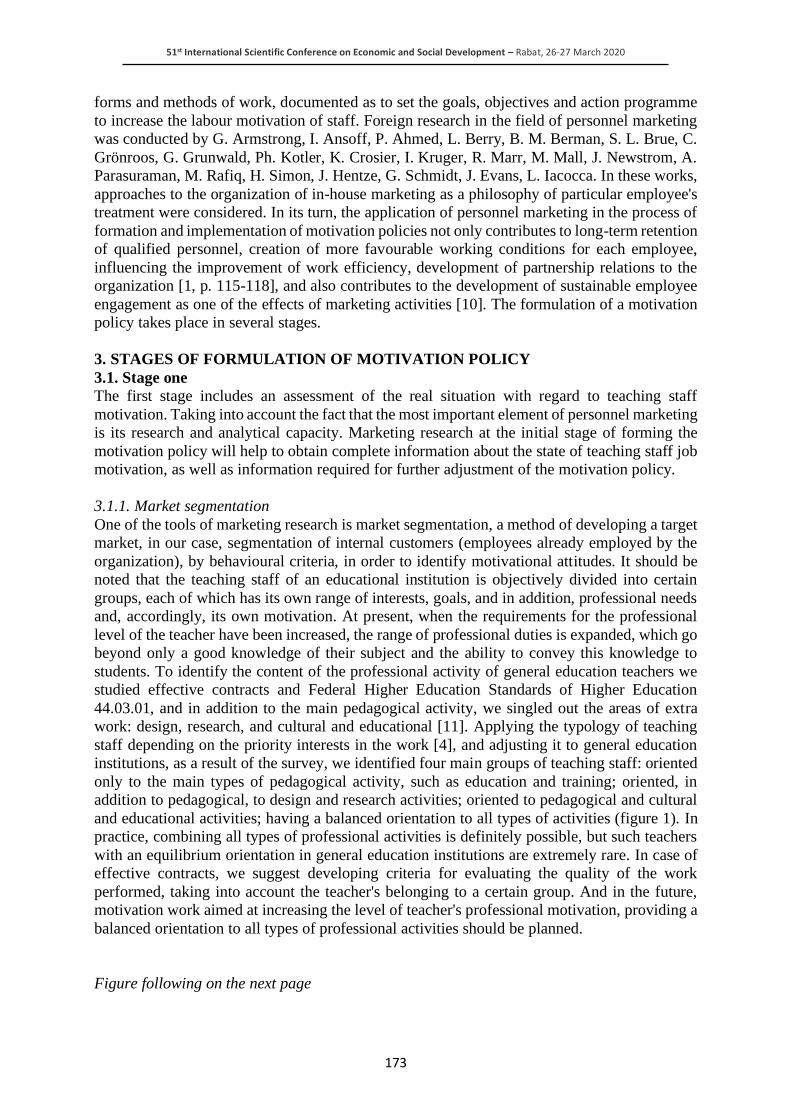
51st International Scientific Conference on Economic and Social Development – Rabat, 26-27 March 2020
173
forms and methods of work, documented as to set the goals, objectives and action programme
to increase the labour motivation of staff. Foreign research in the field of personnel marketing
was conducted by G. Armstrong, I. Ansoff, P. Ahmed, L. Berry, B. M. Berman, S. L. Brue, C.
Grönroos, G. Grunwald, Ph. Kotler, K. Crosier, I. Kruger, R. Marr, M. Mall, J. Newstrom, A.
Parasuraman, M. Rafiq, H. Simon, J. Hentze, G. Schmidt, J. Evans, L. Iacocca. In these works,
approaches to the organization of in-house marketing as a philosophy of particular employee's
treatment were considered. In its turn, the application of personnel marketing in the process of
formation and implementation of motivation policies not only contributes to long-term retention
of qualified personnel, creation of more favourable working conditions for each employee,
influencing the improvement of work efficiency, development of partnership relations to the
organization [1, p. 115-118], and also contributes to the development of sustainable employee
engagement as one of the effects of marketing activities [10]. The formulation of a motivation
policy takes place in several stages.
3. STAGES OF FORMULATION OF MOTIVATION POLICY
3.1. Stage one
The first stage includes an assessment of the real situation with regard to teaching staff
motivation. Taking into account the fact that the most important element of personnel marketing
is its research and analytical capacity. Marketing research at the initial stage of forming the
motivation policy will help to obtain complete information about the state of teaching staff job
motivation, as well as information required for further adjustment of the motivation policy.
3.1.1. Market segmentation
One of the tools of marketing research is market segmentation, a method of developing a target
market, in our case, segmentation of internal customers (employees already employed by the
organization), by behavioural criteria, in order to identify motivational attitudes. It should be
noted that the teaching staff of an educational institution is objectively divided into certain
groups, each of which has its own range of interests, goals, and in addition, professional needs
and, accordingly, its own motivation. At present, when the requirements for the professional
level of the teacher have been increased, the range of professional duties is expanded, which go
beyond only a good knowledge of their subject and the ability to convey this knowledge to
students. To identify the content of the professional activity of general education teachers we
studied effective contracts and Federal Higher Education Standards of Higher Education
44.03.01, and in addition to the main pedagogical activity, we singled out the areas of extra
work: design, research, and cultural and educational [11]. Applying the typology of teaching
staff depending on the priority interests in the work [4], and adjusting it to general education
institutions, as a result of the survey, we identified four main groups of teaching staff: oriented
only to the main types of pedagogical activity, such as education and training; oriented, in
addition to pedagogical, to design and research activities; oriented to pedagogical and cultural
and educational activities; having a balanced orientation to all types of activities (figure 1). In
practice, combining all types of professional activities is definitely possible, but such teachers
with an equilibrium orientation in general education institutions are extremely rare. In case of
effective contracts, we suggest developing criteria for evaluating the quality of the work
performed, taking into account the teacher's belonging to a certain group. And in the future,
motivation work aimed at increasing the level of teacher's professional motivation, providing a
balanced orientation to all types of professional activities should be planned.
Figure following on the next page
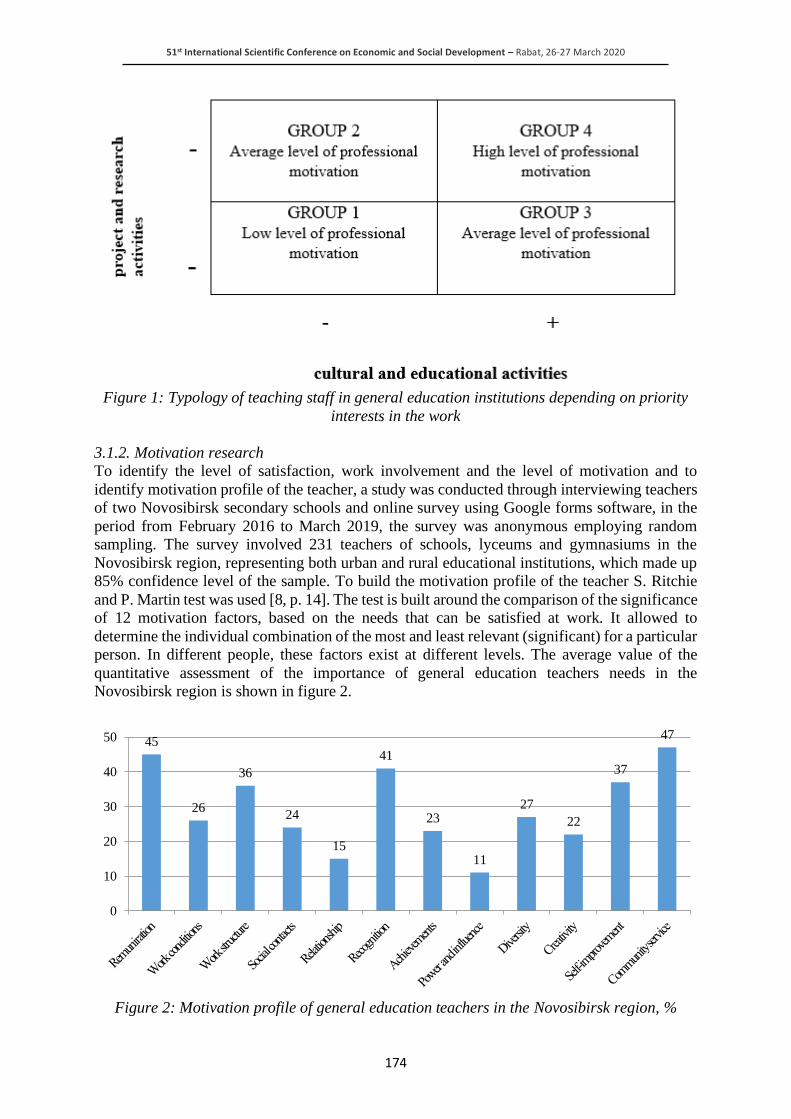
51st International Scientific Conference on Economic and Social Development – Rabat, 26-27 March 2020
174
Figure 1: Typology of teaching staff in general education institutions depending on priority
interests in the work
3.1.2. Motivation research
To identify the level of satisfaction, work involvement and the level of motivation and to
identify motivation profile of the teacher, a study was conducted through interviewing teachers
of two Novosibirsk secondary schools and online survey using Google forms software, in the
period from February 2016 to March 2019, the survey was anonymous employing random
sampling. The survey involved 231 teachers of schools, lyceums and gymnasiums in the
Novosibirsk region, representing both urban and rural educational institutions, which made up
85% confidence level of the sample. To build the motivation profile of the teacher S. Ritchie
and P. Martin test was used [8, p. 14]. The test is built around the comparison of the significance
of 12 motivation factors, based on the needs that can be satisfied at work. It allowed to
determine the individual combination of the most and least relevant (significant) for a particular
person. In different people, these factors exist at different levels. The average value of the
quantitative assessment of the importance of general education teachers needs in the
Novosibirsk region is shown in figure 2.
Figure 2: Motivation profile of general education teachers in the Novosibirsk region, %
45
26
36
24
15
41
23
11
27
22
37
47
0
10
20
30
40
50
51st International Scientific Conference on Economic and Social Development – Rabat, 26-27 March 2020
175
Thus, teachers are predominately motivated by the factors of demand for interesting community
service, high salary with a good set of perks and benefits, and recognition of merits, successes
and achievements. Influence, power, leadership, and long-term stable relationships are the least
significant factors of incentives. The important information that is to be obtained when
formulating a motivation policy is the degree of employees satisfaction with their work, since
satisfaction is what retains an employee, both in the organization [9, p. 10], and in the profession
in general. The level of teacher's satisfaction was identified through the method of components
of job satisfaction, using the working model of the structure of job satisfaction, Ivanova T. Yu
[2, p. 2-15], and taking into account the peculiarities of pedagogical work in general education
institutions. The questionnaire of job satisfaction components, containing 18 questions, allows
to assess the degree of job satisfaction with regard to 6 components: satisfaction with the
teaching profession, salary, working conditions and organization, team, management, work
content and achievements. When analyzing the answers of respondents it may be noted that
most pedagogical workers are dissatisfied with a relatively low prestige of the profession, size
of reward, level of workload at work and a reward system, thus this factors can be defined as
major issues. At the same time, the information about staff satisfaction is not sufficient for a
complete analysis of the existing motivation policy of a general education organization. Since
satisfaction shows only the strength of the staff attachment to the organization, while
engagement is the desire to make personal efforts, to make a contribution as a member of the
organization to achieve its goals [9, p. 11]. It should be emphasized that the degree to which
employee's values (satisfaction structure) coincide with the organization's values is a measure
of their involvement. According to L. I. Sokolova, a high level of involvement is characterized
by the person's unconditional motivation to fully devote themselves to work or actions in the
interests of the organization. To obtain the information on the prevailing level of pedagogical
staff involvement, the method of sociological survey was used, applying L. Sokolova's
involvement assessment method. The questionnaire developed by the author is basic and can
be adjusted to certain conditions and groups of employees of a particular organization. Having
previously corrected the questions proposed by the author, revised and supplemented them in
accordance with the object of the study, taking into account the specific features of the general
education organization, a questionnaire for teachers of general education organizations,
containing twenty-five questions, was compiled. One part of the questions is aimed at
calculating the indicator of staff general satisfaction, the other aimed at their involvement. The
obtained data were processed using the method of statistical processing of the results of
observations [9, p. 51]. A study conducted in March 2019 revealed a specific correlation
between the ratio of satisfaction and engagement indicators. Thus, the data obtained indicate
that the average teacher engagement rate of 74% is higher than the average teacher satisfaction
rate of 72%. It is necessary to note the fact, stated in numerous studies, that most teachers work
for the love of their work. Summing up the aforesaid, it can be argued that the teacher's
awareness of the meaning and public utility of their activities, commitment to the teaching
profession has a great influence on their involvement. Based on the data obtained, it is possible
to conduct a quantitative and qualitative analysis (the result of which showed the zone of
involvement (60-79%) – the zone of development [3]) and determine the guidelines for further
work. Further, taking into account the fact that motivation is one of the tools for managing
satisfaction and engagement, we will track the achieved level of motivation of general education
teachers using the methodological tools for analyzing job motivation of L. G. Milyaeva [7, pp.
443-449]. We will estimate the individual levels in the context of the analyzed work motives
using the formula:
(1)

51st International Scientific Conference on Economic and Social Development – Rabat, 26-27 March 2020
176
where JM
IL is a level of labour motivation;
perception
iR - data on perception ratings;
- data on expectation ratings.
Analysis of the survey results revealed that the achieved level of job motivation of teachers is
equal to 0.75 and is acceptable. Given that motivation is one of the important components of
pedagogical activity, the acceptable level of labour motivation, which is below the average
value, indicates certain motivation issues in general education. As a result of the study, it was
concluded that the lowest levels of job motivation were revealed by the following parameters:
decent financial reward meeting the basic needs of the teacher and their family members (0,63);
fair level of financial reward corresponding to the teacher individual performance (0,62); the
ability to obtain higher financial reward depending on the results of work (0,60); bonuses for
teachers performance (0,66). This suggests that the decrease in the overall level of job
motivation of teachers is influenced by labour motives related to teachers’ remuneration issues.
Thus, identifying and considering the individual characteristics of teachers, their professional
preferences, level of satisfaction, involvement and motivation, when building motivational
work, will affect the success of motivation policy in general.
3.2. Stage two
At the second stage of motivation policy formulation, the key directions, goals and tasks of
motivational work are determined. First of all, taking into account the results of the study of
motivation, teachers job satisfaction and marketing research of the team, we determine the goal
of motivation policy, since the goal reveals its main directions. At this stage, the content of
internal marketing is determined, which is designed to build the loyalty of internal customers,
and which will help determine whom we are going to retain, what to expect from the personnel
involvement and satisfaction. Let's assume that the goal is to retain highly qualified talented
employees, therefore, a retention policy will be outlined, or the goal is to attract young
professionals, employing a recruitment policy, or the goal is to increase the labour activity of
older employees. In each case, different approaches, tools and methods of motivational
influence will be applied. At the same time, it should be noted that different types of motivation
policy can be applied together, since there may be several subgoals. In addition, each
educational institution has its own priorities. An educational institution may specialise in the
development of children's creativity (school drama studio, drawing, dancing classes, school
newspaper, TV, etc.), another may specialise in scientific activities for both students and
teachers (publication of articles, teaching materials and manuals, active participation in
scientific conferences, development of innovative educational programmes, etc.), in the third,
special attention is paid to physical development (different sports activities, school sport
competitions, participation in city, regional competitions, etc.), etc. But in any case, the main
purpose of motivation policy of the educational institution is to increase the level of teachers
professional motivation. Thus, to achieve the fulfillment of both the main and additional goals
of the motivation policy it is necessary to check for their compliance with the goals, needs and
expectations of employees, considering the results of marketing research.
3.3. Stage three
Then, at the third stage of motivation policy formation, the main principles of motivation policy
are determined. To achieve the greatest effect, we suggest sticking to the following principles:
• the principle of compliance implies the correlation of goals and objectives of the motivation
policy with the organization strategic goals;
51st International Scientific Conference on Economic and Social Development – Rabat, 26-27 March 2020
177
• the principle of targeting reveals the need for an individual approach that takes into account
the personal characteristics of employees, their professional needs and preferences;
• the principle of flexibility and dynamism involves adjusting the motivation policy to the
situation both outside and inside the organization, reacting and adapting to the changes;
• the principle of consistency shows the need for motivation management at all functional
levels of the management system;
• the principle of openness is the availability of information about the organization's
motivation policy;
• the principle of transparency implies the presence of feedback provided by the operational
interaction of management with employees.
It should be emphasized that the use of marketing tools provides customer orientation, which
means that an organization defines each employee as a customer. This allows an organization
to take into account the individual needs of each employee, balancing them with the needs of
the organization itself. In this case, the principle of targeting is applied. With orientation to the
"internal consumer" – the staff – an organization not only increases the professional motivation
of the teacher, but also can use it as a tool for managing the quality of professional activity.
3.4. Stage four
The fourth stage involves the development of plans and measures to increase the job motivation
level. At this stage, the concept of partnership marketing is used, focused on building long-term
customer loyalty (i.e. a benevolent attitude to the employer organization, maintaining long-term
employment) [5, pp. 76-82], based on close interaction, while obtaining mutual benefits. This
approach represents an employment relationship from the point of view of mutual satisfaction
of the expectations of employees and the employer, where both parties participate in activities
that include a constant desire to benefit each other. In other words, the programme of motivation
policy is aimed at mutual beneficial satisfaction of the needs of all participants of the motivation
process, using an individual approach in order to increase the strengths depending on the
preferences of each. It should be noted that the teaching staff have a high level of loyalty, but
this does not mean that the teacher will be involved. However, when the goals of an educational
institution coincide with the goals of an employee, the teacher develops a sustainable
involvement, expressed in a certain interest and attitude to the implementation of the goals of
education as a whole. In this regard, it is necessary to study the values, needs, expectations and
motivations of the teaching staff, because for each individual employee, even within the same
profession, there is an individual set of motivating factors, with their own priorities and power.
To identify the balance between the needs of an educational organization and professional needs
of the teaching staff, namely, to determine the degree of consideration of individual needs of
teachers in accruals of incentive payments, it is necessary to calculate a special rate of
implementation of the motivational function of wages – the professional needs satisfaction
quotient (S.Q.) according to the formula:
S.Q. = PN / (T – Tincompl.), (2)
where S.Q. is a professional needs satisfaction quotient;
PN stands for the number of professional needs (in our case, defined by S. Ritchie and P. Martin
[8, p. 14]);
T is the number of tasks specified in a contract, the performance of which contributes to the
satisfaction of professional needs;
Tincompl. is the number of tasks that are not performed by teachers for any reason.
51st International Scientific Conference on Economic and Social Development – Rabat, 26-27 March 2020
178
In the course of processing the results of the survey and performing calculations, the
professional needs satisfaction quotient of general education organizations teachers who
participated in the study was calculated, which equals 2, this indicator corresponds to the
average level. It should be emphasized that 25% of respondents have a satisfaction quotient of
6, which is the lowest level. Note that the high level corresponds to a quotient of one, and the
low level (in this study) is equal to six.
3.5. Stage five
So, the development of the motivation policy of the educational institution is followed by the
fifth stage of approval. We emphasize that one of the technological errors of the management
process is that in most cases a motivation policy has been developed, but not been
communicated to the staff. Meanwhile, interaction between the management of the educational
institution and the personnel should promote mutual understanding and perception of the
importance and significance of the work [6, pp. 44-52]. Establishing internal communications
as a marketing tool will allow to identify the opinion of the teaching staff and, finally, to adjust
the developed motivation policy with subsequent control of its implementation.
3.6. Stage six
Finally, at the sixth stage, employees are familiarized with the document that defines the
motivation policy of the institution. However, this should not be a one-time event, but a
systematic ‘advertising’ of the educational organization's motivation policy. In this case a
marketing tool called ‘Internet marketing’ is implemented, when ‘Motivation policy’ is
published on the organization's website; motivation policy branding (positioning), involves the
creation, development and maintaining constant communication with internal customers
(personnel), using high-quality motivational work and the level of satisfaction and involvement
of teachers, enhancing professional motivation.
4. CONCLUSION
Against the background of educational reforms aimed at solving the strategic task of ensuring
the quality of education at all levels of the educational system, it is possible to achieve high
efficiency of an educational institution through the purposeful development of a motivation
policy. Thus, the result of the use of methodical recommendations on development of secondary
general education organization motivation policy using marketing technologies, will increase
the involvement and commitment of a teacher, increase the productivity of the working process
in general, and as a result improve the quality of professional activity.
LITERATURE:
1. Boldyreva I. V. (2012). Evolution of ideas about staff marketing. [Evolyuciya predstavlenij
o marketinge personala.] Vestnik VGU. Seriya: Ekonomika i upravlenie. (Bulletin of VSU.
Series: Economics and management.), 2012 (No. 2.), pp. 115-118.
2. Ivanova T. Yu. (2012) Structure and diagnostics of job satisfaction: development and
testing of the methodology. [Struktura i diagnostika udovletvorennosti trudom: razrabotka
i aprobatsiya metodiki.] Organizatsionnaya psikhologiya (Organizational psychology),
2012 (Vol. 2. No. 3.), pp. 2-15.
3. Kirillov, L. Personnel involvement as a success factor in crisis [Vovlechennost' personala
kak faktor uspekha kompanii v usloviyakh krizisa] Corporate management Internet project.
Retrivied 16.05.2019 from
https://www.cfin.ru/anticrisis/methodical_material/consultants/employee_engagement.sht
ml
51st International Scientific Conference on Economic and Social Development – Rabat, 26-27 March 2020
179
4. Masalova Yu. A. (2006). Formation of motivation of the teaching staff of the University,
focused on the quality of the educational process Dokt. Diss. [Formirovanie motivatsii
professorsko-prepodavatel'skogo sostava vuza, orientirovannoi na kachestvo
obrazovatel'nogo protsessa Doc. Diss.]. Irkutsk, 2006
5. Masalova Yu. A. (2016). Research on the involvement of the University's faculty.
[Issledovanie vovlechennosti professorsko-prepodavatel'skogo sostava universiteta.]
University management: practice and analysis (Universitetskoe upravlenie: praktika i
analiz), 2016 (No. 1 (101)), pp. 76-82.
6. Masalova Yu. A. (2017) Research of qualitative characteristics of the teaching staff of
Russian universities [Issledovanie kachestvennykh kharakteristik professorsko-
prepodavatel'skogo sostava rossiiskikh vuzov]. University management: practice and
analysis (Universitetskoe upravlenie: praktika i analiz), 2017 (No. 2 (108)), pp. 44-52.
7. Milyaeva L. G. (2016) New aspects of the study of labour motivation of the organization's
personnel [Novye aspekty issledovaniya trudovoi motivatsii personala organizatsii].
Modern research and development (Sovremennye nauchnye issledovaniya i razrabotki),
2016 (No. 7), pp. 443-449.
8. Richie S. (1999) Motivation Management. Gower Publishing Ltd. (Russ. ed.: Richie S.
(2004) Upravlenie motivatsiei: Ucheb. posobie dlya vuzov. Seriya «Zarubezhnyi
uchebnik». Moscow: UNITY-DANA
9. Sokolova L. I. (2009) Formation of a subsystem for measuring and analyzing staff
satisfaction and involvement in the processes of the quality management system of an
educational organization [Formirovanie podsistemy izmereniya i analiza udovletvorennosti
i vovlechennosti personala v protsessy sistemy menedzhmenta kachestva obrazovatel'noi
organizatsii] Tambov, Tamb. state tech. university publishing house.
10. Vanyan M. N. (2012) Formation and development of long-term mutually beneficial
relationships with employees in corporate systems of personnel marketing Dokt. Diss.
[Formirovanie i razvitie dolgosrochnykh vzaimovygodnykh otnoshenii s rabotnikami v
korporativnykh sistemakh marketinga personala] Krasnodar
11. Website of Federal state educational standards of higher education. Retrieved 12.04.2019
from http://fgosvo.ru/fgosvo/92/91/4/94
51st International Scientific Conference on Economic and Social Development – Rabat, 26-27 March 2020
180
THE PARTNER LOANS' MULTIDISCIPLINARY ANALYSIS -
PORTUGUESE'S CASE STUDY
Susana Cristina Rodrigues Aldeia
Portucalense University, Portugal
ABSTRACT
This paper seeks to understand the framework of the loans from partners to the company in a
multidisciplinary overview. In particular, it studies the accounting and taxation treatment of
the loans from members to societies. For this purpose, it researches several data sources of
Portugal: Portuguese Accounting Standards (Sistema de Normalização Contabilística - SNC),
Value Added Tax (Imposto sobre o Valor Acrescentado - IVA), Corporate Income Tax (Imposto
sobre o Rendimento das Pessoas Coletivas - IRC). The results show that, in the accounting
domain, loans from business owners to entity meet the requirements to be considered financial
liabilities. The financial position's statement presents it in the second element. Under the
lending contract, the lender can receive interest or not. In the case of income receipt, it is
subject to taxation in the beneficiary's sphere, and it constitutes a financial expense the
borrower's realm. This operation is VAT exempt, according to article 9º. In the CIT, the
interests are tax expense under some circumstances predicted in the tax law. The paper presents
some limitations because it is restricted to Portugal jurisdiction; it could be interesting to
analyse it in other countries.
Keywords: Partner Loans, VAT, Corporate Income Tax, Accounting
1. INTRODUCTION
According to Canas (2011), the "suprimento" is a mechanism that allows exceeding the lack of
capital and the economic insufficiency of the companies, replacing capital entries (Pereira,
2018). This figure appears with the approval of Decree-Law no. 262/86 of 2 September,
therefore, this is not a new mechanism and tends to have more relevance in times of financial
difficulties. The Portuguese lawmaker, recently, introduces an essential option for commercial
entities using this type of contracts. The Decree-law 79/2017, of 30 June allows Portuguese
companies to increase the entities' social capital using this figure, in moments of financial
distress to companies it can represent a good option for both sides. On the one hand, for the
business that has to challenge to obtain the traditional credit; thus, it can be a solution for
treasury problems. On the other hand, for a partner, it can be an opportunity to obtain financial
income, the interest, if it is stipulated.
2. THE PARTNER LOANS’ ON PORTUGUESE JURISDICTION
2.1. In Commercial Law
The Portuguese Commercial Law predicts the possibility of the business partners to loan money
to the company. This prediction is present in article 243 until 245 of the Commercial Companies
Code – Código das Sociedades Comerciais (CSC). In article 243, the Portuguese legislator
calls this juridical figure as "Contrato de Suprimento” and defines as the contract that allows to
partners lend money or other fungible things to the entity. The company have the requirement
to return the same quantity of the same kind and quality. Pereira (2018) evidences the second
modality as the one by which the partner agrees with the company the deferral of its credits on
it. Cordeiro (2007) considers that this contract has the characteristics of the loan contract,
according to article 1142 of Civil Law, although the differences in the contract's form.
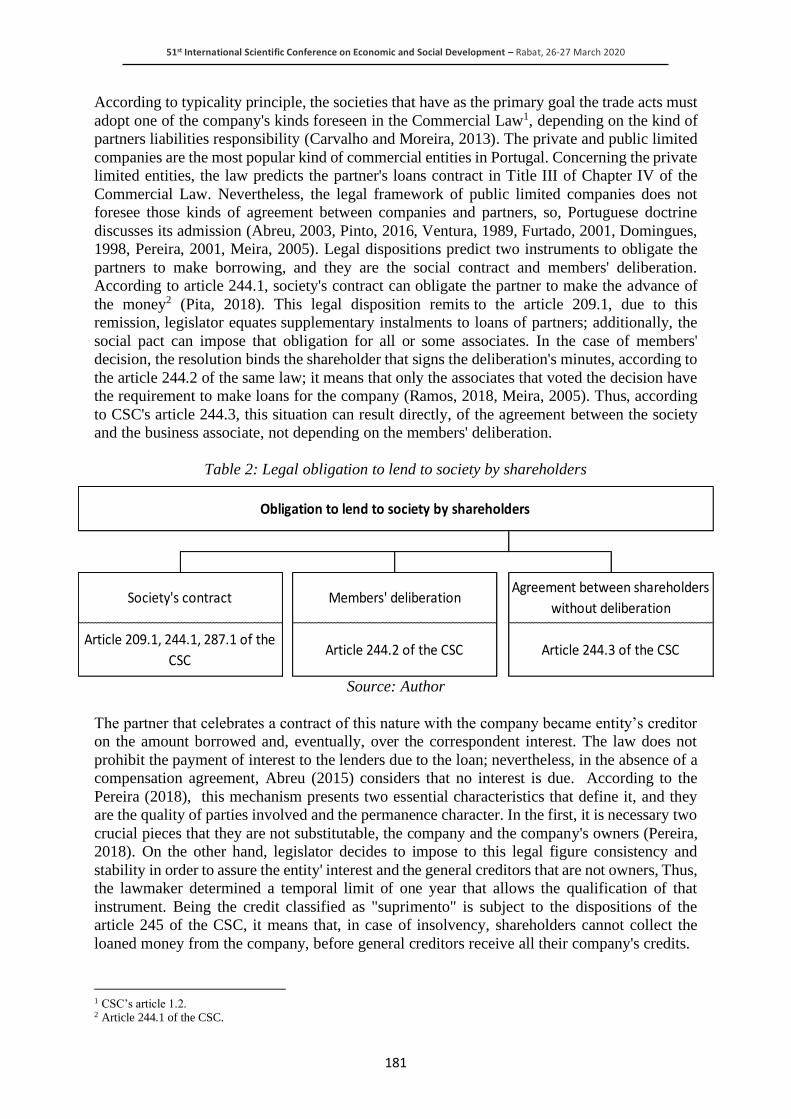
51st International Scientific Conference on Economic and Social Development – Rabat, 26-27 March 2020
181
According to typicality principle, the societies that have as the primary goal the trade acts must
adopt one of the company's kinds foreseen in the Commercial Law1, depending on the kind of
partners liabilities responsibility (Carvalho and Moreira, 2013). The private and public limited
companies are the most popular kind of commercial entities in Portugal. Concerning the private
limited entities, the law predicts the partner's loans contract in Title III of Chapter IV of the
Commercial Law. Nevertheless, the legal framework of public limited companies does not
foresee those kinds of agreement between companies and partners, so, Portuguese doctrine
discusses its admission (Abreu, 2003, Pinto, 2016, Ventura, 1989, Furtado, 2001, Domingues,
1998, Pereira, 2001, Meira, 2005). Legal dispositions predict two instruments to obligate the
partners to make borrowing, and they are the social contract and members' deliberation.
According to article 244.1, society's contract can obligate the partner to make the advance of
the money2 (Pita, 2018). This legal disposition remits to the article 209.1, due to this
remission, legislator equates supplementary instalments to loans of partners; additionally, the
social pact can impose that obligation for all or some associates. In the case of members'
decision, the resolution binds the shareholder that signs the deliberation's minutes, according to
the article 244.2 of the same law; it means that only the associates that voted the decision have
the requirement to make loans for the company (Ramos, 2018, Meira, 2005). Thus, according
to CSC's article 244.3, this situation can result directly, of the agreement between the society
and the business associate, not depending on the members' deliberation.
Table 2: Legal obligation to lend to society by shareholders
Source: Author
The partner that celebrates a contract of this nature with the company became entity’s creditor
on the amount borrowed and, eventually, over the correspondent interest. The law does not
prohibit the payment of interest to the lenders due to the loan; nevertheless, in the absence of a
compensation agreement, Abreu (2015) considers that no interest is due. According to the
Pereira (2018), this mechanism presents two essential characteristics that define it, and they
are the quality of parties involved and the permanence character. In the first, it is necessary two
crucial pieces that they are not substitutable, the company and the company's owners (Pereira,
2018). On the other hand, legislator decides to impose to this legal figure consistency and
stability in order to assure the entity' interest and the general creditors that are not owners, Thus,
the lawmaker determined a temporal limit of one year that allows the qualification of that
instrument. Being the credit classified as "suprimento" is subject to the dispositions of the
article 245 of the CSC, it means that, in case of insolvency, shareholders cannot collect the
loaned money from the company, before general creditors receive all their company's credits.
1 CSC’s article 1.2. 2 Article 244.1 of the CSC.
Obligation to lend to society by shareholders
Society's contract Members' deliberationAgreement between shareholders
without deliberation
Article 209.1, 244.1, 287.1 of the
CSCArticle 244.2 of the CSC Article 244.3 of the CSC
51st International Scientific Conference on Economic and Social Development – Rabat, 26-27 March 2020
182
2.2. In Accounting Law
According to the Conceptual Framework of the Portuguese Accounting Law - Sistema de
Normalização Contabilística (SNC) - financial statements represent financial effects of
company's transactions, wherefore, the accounting rules aggregate these operations in classes,
in accordance with its characteristics. The elements of financial statements represent these
classes. The asset, liability and equity typify the financial position's elements; on the other hand,
the incomes and expenses represent the income statement's elements. Paragraph 49 of the
Conceptual Framework exhibit the legal concept of the balance sheet's elements, between them,
the liability's definition. This concept has underlying the definition of IASB Conceptual
Framework; thus, liability is a present obligation of the entity arising from a past event, the
settlement of which is expected to result in an outflow from the entity of resources embodying
economic benefits. The partner's loan respects classification of liability, the society has a
present engagement with the shareholder due to a past occurrence, that will imply a resource's
exit. As it was, already explained, this kind of contract assumes different perspectives, taking
into account its particularities, its specificities imply particular attention in accounting
recognition. If the lending has a term less them one year, it is not a contract of "suprimento", so
it will be a current liability on the financial statement, the company should pay it in the next
twelve months. In the case of the term of payment occur in more than one year, it obeys the
legal concept of "suprimento", so in the financial accounts, it assumes the non-current position.
This mechanism predicts the possibility of pay interest to the lender. In the company's sphere,
the partner's right can configure an expense or an asset. According to the Conceptual
Framework, the expense is the decrease in future economic benefits during the accounting
period. It occurs over the form of outflows, or assets depreciation, or occurrence of liabilities,
that result in a decrease of equity and not being related with results distribution to capital
owners. So, the payment of loan compensation most of the times congregates the characteristics
of the expense, so, the income statement presents information about it. Nevertheless, the
Portuguese Accounting and Financial Reporting Standard 10 - Norma Contabilística e de Relato
Financeiro (NCRF), predicts that the entity must capitalize the borrowing costs when directly
imputed to acquisition or construction of an asset that needs time to conclude for the use or
selling. It means that, if the equity's owners loan money to a company to help the company to
acquire or construct a thing that will be classified as an asset in the future, the interest paid will
be recognized as an asset, also. In this case, this amount of interest, when capitalized, will be
subject to the depreciation according to the imposed accounting rules to the main asset. Taking
into consideration the Ordinance 218/2015 of July 23 that institutes the Portuguese Accounts
Code - Código de Contas (CC) - the mechanism's occurrence implies an accounting record in
the account 253 - Equity Participants. In the same time that the interest payment implies a
registration on the class of financial expenses, in particular, 691 - Supported Interest. In the
case that the borrow supports de acquisition or construction of assets that qualify in the future,
it needs to transfer the amount, the value paid of interest will not be represented in the spending's
account (691) but in the investments account. The ordinance 220/2015, of July 24 imposes a
mandatory application of financial statements models to entities subjects to the Portuguese
Accounting Law. The detail level of financial information required depends on the corporation's
dimension. So, this legal disposition presents several models according to the company's kind.
So, if equity owner loans money to the company, and it is expected to receive in the operational
period or in a term less one year, the borrow's information will be held in the current liability -
Passivo Corrente, in particular in obtained financing - Financiamentos Obtidos. By the other
hand, if it is expected receive the money in more than one year, it means it is qualified as
"suprimento", the lending's information will be held in the non-current liability - Passivo Não
Corrente, in particular, in the item obtained financing - Financiamentos Obtidos.

51st International Scientific Conference on Economic and Social Development – Rabat, 26-27 March 2020
183
Image 1: Statement's part of financial position
Source: Attachment 1 of the Ordinance 220/2015, July 24
2.3. In Tax Law
In Value Add Tax sphere, the financial operations’ benefits of an exemption predict on article
9 of the VAT Code. The Directive 2006/112/EC of the 28 November 2006 approved by the
Council of the European Union (2006), imposes this exemption and legislator transposes to
Portuguese Jurisdiction (Roriz et al., 2015). According to article 1.1.a) of Portuguese IVA
Code, the onerous goods' transfer and the provision of the services are subject to tax when these
operations happen in national territory and make by a IVA taxpayer. Article 4º of the same law
clarifies that the one operation is services provision if it is not a transfer of goods, an intra-
community acquisition or the importation of a good, it means that it has a residual framework.
Despite the general principle about which the tax is settled over all onerous services’ operations,
the VAT Code's article 9.27 foresees the operations related to the banking activity are tax-free,
it means that they are subject to tax but exempt (Palma, 2011b). Thus, the loan made by the
partner to the company is VAT exempt due to this legal disposition (OCC, 2016). On the other
hand, the payment of interest constitutes an inherent and resultant consequence of the main
operation, the loan, so, it must be considered that the interest payment enjoys of the same
exemption of the principal transaction (Palma, 2011a). In the Corporate Income Tax domain,
the payment of interest represents a tax expense relevant for the determination of the corporate
income tax's base. Nevertheless, it needs to have a document to support the transaction and the
accounting record (APECA, 2018). Although in the accounting dimensions, there is no limit of
the rate interest to pay to shareholders, in the tax domain is not happens the same. According
to the article 23-A.1.m) of the CIT, is not accepted as fiscal expenses the amount of interest that
exceed the limits imposed by law, in particular, the Ordinance 274/2014 (Ministério das
Finanças, 2014). This legal document imposes two limits, one for large companies and another
for small and medium-sized. In the first case, is subject to an interest rate of 2% added the
Euribor rate, this means that if the company pay more than this limit, the difference that exceeds
will not be accepted as tax expenditures. In the second case, the limit rate is 6% added to the
Euribor rate. In the domain of Income Tax Natural Persons, the loans devolution at the nominal
value not represents an operation with gain, so it is not subject to taxation.
51st International Scientific Conference on Economic and Social Development – Rabat, 26-27 March 2020
184
However, the article 10.1.h) of the IRS Code forecasts the onerous cession of the partners' loans
as a tax transaction in the part of the gain. The article 49 of the same law determines the
acquisition value, for tax purposes, it means that it is the loan's nominal value. The positive
difference between the nominal value of the loan and the cession value is subject to taxation
according to the article 72.1.C) of the IRS Code, it means that it is taxed by an autonomous tax
rate of 28%, although the beneficiary can opt for the inclusion with the other tax incomes. The
law imposes withholding under the receipt of interest, and it means that entity when pays this
kind of income needs to withhold an autonomous rate of 28%, second article 71.1.a) of the IRS
Code.
3. CONCLUSION
According the Portuguese commercial law shareholders can lend money to the company, this
operation can have the status of "suprimento" if the loan has a return term higher than one year.
This mechanism renders the partner creditor of the company with particular specificity,
because, if it collects the condition to be qualified as "suprimento" represents that in case of
insolvency the members can not receive the money without the other creditors receive all theirs
debts. In accounting domain, the loan is recognized as a liability, that according to the return
term will be presented in the financial position statement as current or non-current liability, if
it is less or more than one year, respectively. On the other hand, most of the times, the interest
regarding the concept of expenditure; however, it can be considered as an asset if it observes
the conditions of the NCRF 10. In the taxation realm, legislator determines some particularities
about it. First, the VAT Code exempts the partner's loan, taking into consideration the European
Union's Council Directive, second, the IRS Code does not determine any taxation to the return
of the borrowing, if the return value is the same that the nominal amount. In the company's area,
the interest paid is also a tax expense, when recorded in the accounting area as a spending.
LITERATURE:
1. ABREU, J. M. C. D. 2003. Suprimentos. Estudos em Homenagem ao Prof. Doutor Raúl
Ventura. Coimbra: Coimbra Editora.
2. ABREU, J. M. C. D. 2015. Curso de Direito Comercial, Coimbra, Almedina.
3. APECA 2018. IRC/IRS - Juros de suprimentos T18060074 (CF47573 ) / 2018-06-04.
https://www.apeca.pt/infordoc_ct_new/index.php?e=1: Associação Portuguesa de
Empresas de Contabilidade e Administração.
4. CANAS, M. G. D. S. M. 2011. O Contrato de Suprimento como (nova) forma de
financiamento societário. Master, Instituto Universitário de Lisboa.
5. CARVALHO, M. M. & MOREIRA, S. 2013. Direito das Sociedades Comerciais (Capítulo
I). Sumários desenvolvidos das aulas de Direito para a Economia e Gestão. In:
UNIVERSIDADE DO MINHO (ed.). Braga, Portugal.
6. CORDEIRO, A. M. 2007. Manual de Direito das Sociedades - das Sociedades em especial,
Coimbra, Almedina.
7. COUNCIL OF THE EUROPEAN UNION 2006. Council Directive 2006/112/EC of the 28
November 2006 on the common system of value added tax. Official Journal of the
European Union 11.12.2006, L 347.
8. DOMINGUES, P. T. 1998. Do Capital Social, Noção, Princípios e Funções, Coimbra,
Coimbra Editora.
9. FURTADO, P. 2001. Curso de direito da sociedades Coimbra, Almedina.
10. MEIRA, D. A. 2005. O Contrato de Suprimento Enquanto Meio de Financiamento da
Sociedade. Revista de Ciências Empresariais e Jurídicas / Review of Business and Legal
Sciences., 139- 166.

51st International Scientific Conference on Economic and Social Development – Rabat, 26-27 March 2020
185
11. MINISTÉRIO DAS FINANÇAS 2014. Portaria n.º 279/2014. Diário da República n.º
251/2014, Série I de 2014-12-30.
12. OCC 2016. PT16044 - IVA - Isenções 01-01-2016. https://www.occ.pt/pt/noticias/iva-
isencoes/: Ordem dos Contabilístas Certificados.
13. PALMA, C. C. 2011a. Enquadramento das Operações Financeiras em Imposto sobre o
Valor Acrescentado, Coimbra, Almedina, Coleção Cadernos IDEFF.
14. PALMA, C. C. 2011b. Introdução ao Imposto sobre o Valor Acrescentado, Coimbra,
Almedina.
15. PEREIRA, J. A. 2001. O Contrato de Suprimento, Coimbra, Coimbra Editora.
16. PEREIRA, R. V. 2018. O aumento do Capital Social por incorporação de suprimentos.
Master Degree, Universidade Católica Portuguesa.
17. PINTO, A. M. 2016. Cessão de créditos de suprimentos, prestações acessórias pecuniárias
e prestações suplementares. E depois do Código das sociedades comerciais em comentário.
1ª ed. Coimbra: Almedina.
18. PITA, M. A. 2018. Curso Elementar de Direito Comercial, Lisboa, Áreas Editora.
19. RAMOS, M. E. 2018. Direito Comercial e das Sociedades entre as Empresas e o Mercado,
Coimbra, Almedina.
20. RORIZ, J., PEREIRA, L., ESTEVES, L. F. & BASTOS, R. 2015. IVA (Revisão ao Código),
OCC.
21. VENTURA, R. 1989. O contra de suprimento no Código das Sociedades Comerciais. O
Direito, 121, Janeiro-Março.
51st International Scientific Conference on Economic and Social Development – Rabat, 26-27 March 2020
186
FAIR TRADE: A CRITIC IN ETHICS
Essakhi Adam
University of Abdelmalek Essaadi, National School of Management
Tangier, Morocco
ABSTRACT
The notion of FAIR TRADE is a concept that has been widely debated and criticized, not only
for the many failed experiments but also for the very inconsistency of its ethical claims. If FAIR
TRADE is the process by which the social and economic disparency between the rich and the
extremely poor is readjusted via the process of introducing ethical standards in the trading
between the two, then this very process has been proven to not only place a substantial financial
stress on the poor farmers with the cost and time consuming process of earning the FAIR
TRADE brand, it has also been shown that the revenue expected from this process doesn’t
necessarily end up in these farmers hands, while at the same time placing the normal farmers
in a competitive disadvantage, all in the name of providing a false sense of moral relief for
consumers. The ethical concern deepens as political agendas are often enforced on these
farmers in the name of sustainable development policies that falls short in most cases by
focusing on a bigger picture objective while neglecting the day to day lives and sacrifices of
these farmers. The most apparent result of these problems is the money trail which seems to
completely disappear after the initial trade, the fact is studies has shown that the farmers
affiliated with the FAIR TRADE movement have not shown an increase of wealth or betterment
of lifestyle, rather the associations in charge of the farmers are constantly seen a nest of
corruption and financial scandals, as the mission of inspecting and auditing the trade and it's
results is rarely seen to its end.
Keywords: Ethical, FAIR TRADE, Farmers
1. INTRODUCTION
This study analyses the claim that Fairtrade is ethical trading. It starts with a brief outline of
Fairtrade and sets out the basic ethical criteria to be used. These are then expanded and extended
as fuller details of the operation of Fairtrade are presented. Fairtrade is a commercial brand. Its
owners, the Fairtrade Foundation, have been very successful in persuading customers of their
genuine ‘ethical trading’, and that by buying Fairtrade goods they are giving producers a fair
price, dealing fairly with them, and giving money to poor producers in the Third World. It has
had considerable support, and has received gifts of time, money, marketing and preferential
trading opportunities from private individuals, firms and public bodies. The retail turnover in
the UK alone was close to 800 million pound in 2009. For a fee, the Fairtrade Foundation gives
companies in the developed world – coffee processors and packers or supermarket chains for
instance – a license to use the brand, 85% of the income of the UK Fairtrade Foundation can be
traced to this single licensing operation, with the remaining 14% coming from donations and
government grants (Fairtrade UK, 2009). At least 70% of this license income is spent in the
UK, mainly on promoting the brand. The accounts are not clear on how or where the rest is
spent, but it appears to be spent by the Fairtrade organization, some of it for administration and
control of standards by The Fairtrade Labelling Organizations International, rather than being
given to farmers in the Third World. The money intended for the Third World is an entirely
separate income stream, which does not pass through the Fairtrade organization. The product
must be produced by Fairtrade-certified suppliers in the Third World, nearly always members
of a cooperative. These suppliers must meet a range of political standards to be certified. For
coffee, the star product, there are typically several levels involved: the farmers themselves, the

51st International Scientific Conference on Economic and Social Development – Rabat, 26-27 March 2020
187
primary cooperatives which do the assembly and processing, and the secondary or tertiary
cooperatives which export on behalf of the primary cooperatives. The exporting cooperative is
paid a price 10% higher than the world price for any coffee that, first, meets the Fairtrade
standards and, second, is sold with the Fairtrade brand. The higher price is termed the ‘social
premium’ and may be spent by the exporting cooperative on business expenses including the
costs of meeting Fairtrade standards, or on social projects like health, education. Some
cooperatives pass on cash to farmers, giving them a higher price. A significant aspect is the
minimum price, which gives the exporting cooperatives a price above the world price when the
world price collapses, as it does from time to time. These price commitments apply to the
exporting cooperatives only, not to the primary cooperatives or to farmers, and they cover only
goods sold under the Fairtrade brand, which may be a small part of the product meeting the
standards, and a small part of the cooperative’s turnover. This analysis covers the Fairtrade
system as a whole, from farmer to consumer, including cooperatives, importers, packers,
wholesalers, supermarkets and cafes. It covers the Fairtrade Foundation UK and the umbrella
organization, the Fairtrade Labelling Organizations International. It also covers those advocates
of Fairtrade who do not have any financial interest in it, but give money, time, effort, and
preferential trading opportunities to it and who publicize it. These include firms, politicians,
public servants.
2. ETHICAL CRITERIAS
The ethical approach used to analyses FAIRTRADE is the Utilitarian one of the greatest good
for the greatest number, as is normal in dealing with public money. This uses the hedonic
calculus, applying resources where they produce the greatest marginal utility. Two sets of
ethical criteria are derived from the Utilitarian principles which will be used throughout the
analysis. The first set derives from the concept of personalized impact, the same amount of
money no matter how small will have a different impact on different socio-economic classes.
The lower class as referred to by many, can be made 5 euro worse off as they may not be able
to buy a mosquito net or buy enough food to keep the children alive in the season before the
harvest. The middle class may suffer only a minor inconvenience for the same amount of 5
euros. And the rich and the high class, a loss of 5 euro would not be noticed at all more or less.
This is standard economics. These criteria mean that it is not sufficient to prove that some
farmers benefit from Fairtrade: any meaningful analysis must also cover other Fairtrade
farmers, and non-Fairtrade farmers. These criteria are applied at two levels: it is asked whether
the money should be given to Fairtrade at all, and it is asked whether, once the money has been
given to Fairtrade, is it spent in such a way as to maximize its impact. The criteria may be
applied by comparing the impact of Fairtrade with the impact of alternative ways of delivering
aid or charity to the Third World, using as a standard either giving money directly to a Third
World government or giving it to one of those charities which guarantees that all donations are
spent in the Third World. The second set of criteria, Unfair Trading, includes two relevant
principles that both centers around the truth: It is unethical to lie to a customer about a product
and it is unethical to withhold or fail to give consumers important information about a product,
information that is likely to cause the average consumer to make a different purchasing
decision. Under the Utilitarian approach lying on the product may cause the allocation of money
in a way that increases death and destitution, as in the first criterion – a derived wrong.
Secondly, there is a cost when donors realize that their money has been used for purposes that
they had not intended. Thirdly, the use of lies and suppression of evidence damages the
efficiency of markets, and can collapse these markets entirely, causing widespread public harm.
To the extent that this happens in the charitable sector, there is a risk that the public may stop
giving money to all charities. And risk is an economic cost.

51st International Scientific Conference on Economic and Social Development – Rabat, 26-27 March 2020
188
This is recognized by legislators: both lying and failing to give relevant information to
customers would constitute the criminal offence of Unfair Trading throughout the EU under
Directive 2005/29/EC on Unfair Commercial Practices (European Commission, 2005).
3. THE FINANCIAL TRAIL
With Fairtrade, customers pay a higher price in the belief that nearly all the extra will go to the
intended beneficiaries. The Fairtrade Foundation’s basic guarantee is, ‘A fair and stable price
to farmers for their products’ (Fairtrade Foundation, 2011). A reasonable consumer might
assume from this that 80% of the extra amount paid went in higher prices to the farmers, in
such a way as to get the greatest good for the greatest number. This section examines what
actually happens to the money. First it asks how much reaches the exporting cooperative, half
way up the marketing chain. Then it asks what happens to this money: how much goes in added
costs to the Fairtrade cooperatives; how much is spent on social projects; how much goes in
extra money to Fairtrade farmers; and what harm is caused to non-Fairtrade farmers.
3.1. The exporting cooperatives
In practice, retailers, wholesalers and manufacturers are free to charge whatever they wish for
Fairtrade products. Fairtrade does not monitor or control how much extra they charge. It is
almost never possible for a customer to determine how much extra is charged, because retailers
almost never sell identical Fairtrade and non-Fairtrade products side by side. There are
differences in brand, quality, origin, etc. which make price comparisons impossible. Very
occasionally it is possible to calculate how much extra is paid. For example, Valkila,
Haaparanta and Niemi (2010, p. 266) were able to get information not normally available on
coffee sales, and found that consumers in Finland paid considerably more for Fairtrade certified
coffee than for alternatives, but that only 11.5% of the extra paid went to the exporting country.
The amount reaching the farmer is not calculated. Kilian, Jones, Pratt and Villalobos (2006)
talk of US Fairtrade coffee getting 5 dollars per pound extra at retail, of which the exporting
cooperative would have received 10c, or 2%. Mendoza and Bastiaensen (2003, p. 38) calculated
that in the UK only 1.6% to 18% of the extra charged for Fairtrade reached the producers for
one product line. It appears that the cost of operating the Fairtrade organizations in the rich
countries is of the order of 75% to 100% of the gross amount of extra money reaching the Third
World. There are also some unavoidable costs to processors, wholesalers and retailers in
handling Fairtrade. That is to say, the absolute maximum proportion of the donations reaching
the Third World would be 50% to 60%, in an ideal world where nobody charged higher mark-
ups. This is consistent with the fact that Fairtrade charges wholesalers a fee of 3%, and 1.53%
of the retail price reaches exporters as extra payment. These proportions would be considered
unacceptably low by many donors. That is to say much of the extra price paid, the donation,
goes as extra profit in rich countries, which is unethical under the Death and Destitution criteria,
and there is a failure to disclose this, which is unethical under the Unfair Trading criteria. The
Fairtrade system requires importers to:
• Pay the minimum price set by Fairtrade,
• Pay a premium price
• Provide credit for pre-financing so that Fairtrade cooperatives can pay cash on delivery,
• Enter into long-term contracts.
However, Companies are in a position to say, ‘We will buy your Fairtrade coffee but we will
pay you less than the proper price. If you refuse, we will buy from another Fairtrade
cooperative, and you will have to sell at an even lower price, the world commodity price. As
you know, there is three times as much Fairtrade certified coffee available as the market will
take.’ It is difficult for the cooperative to refuse.

51st International Scientific Conference on Economic and Social Development – Rabat, 26-27 March 2020
189
There is evidence that companies do this, sometimes paying the full Fairtrade price, but
demanding a higher quality (Raynolds, 2009, p. 1089; Valkila, Haaparanta, & Niemi, 2010, p.
264; Valkila, 2009). There is also a failure to provide the credit. Importers may pay cash on
delivery, or pay late, or just not honor their contracts if world prices move against them. (Utting,
2009, p. 139; Valkila, 2009, pp. 3022-3; Raynolds, 2009, p. 1089). The mainstream traders
sometimes provide better credit to farmers at significantly lower interest rates (Valkila, 2009,
pp. 3022-3). The Fairtrade requirements on long term contracts are not strictly enforced (Reed,
2009, pp. 12, 21). These evasions are mentioned by some of the most enthusiastic supporters
of Fairtrade, but they do not give details or discuss them, and appear not to have investigated
them to find out how common they are. This is surprising as the evasions could make the whole
system unusable. The ethical problems raised are, first, the failure to control these problems
effectively, second, the failure to admit to the problems, and, third, adopting a system where
these problems arise – they do not arise with normal charity to the Third World.
3.2. Ethical implications
It has been shown that a small amount of the extra amount that consumers pay for Fairtrade
gets even as far as the exporter. In a few cases it may be as much as half; in many cases it is
much less. Much of the extra price paid, the donation, goes either in higher profit in rich
countries, or in the Fairtrade organizations’ administration costs and their cost of collecting
donations. This is unethical under the Death and Destitution criteria. It is likely that Fairtrade
sales would be much lower if this were known by consumers. However, the extra amount
consumers pay for Fairtrade products is almost universally concealed by retailers and the costs
of the Fairtrade organizations and the amount reaching the Third World has not been disclosed.
This is Unfair Trading and unethical. The criterion that relevant information should not be
concealed requires that a pack of Fairtrade coffee, should have the label ‘This pack costs 5 euros
more than an equivalent pack of non-Fairtrade coffee. A maximum of .34 of this reaches the
Third World. Even those retailers who feel that they, and their supply chain, are beyond
reproach, and that it is acceptable that only half the extra money paid reaches the Third World
in their particular operation, are under an ethical obligation to give this information. If they
were to disclose their figures, they would put pressure on others to do the same, so there would
no longer be firms pocketing 90% to 99% of the extra price charged. Similarly, all charities
have to publish their accounts. Many reputable ones publish them in great detail: they hope to
drive out those charities that spend nearly all their revenue on collecting more revenue, that
spend almost nothing on the intended beneficiaries, that are incompetent and dishonest. That is
to say they are acting according to the Ethical Trading criteria. Fairtrade, on the other hand, has
been set up in such a way that most of the money donated does not even enter their accounting
system, and it is not possible to find out what it is spent on.
3.3. The farmer
Fairtrade monitors the price paid to exporters. It does not control what happens to the money,
nor does it monitor how much reaches the farmer. There can be no evidence for the claim,
‘Fairtrade guarantees a fair price for the producer’. Some of the extra money is spent on meeting
the Fairtrade criteria for certification, sometimes a large proportion (Utting, 2009, p. 139;
Valkila and Nygren, 2009; Valkila, 2009, pp. 3022-3; Berndt, 2007). The exporting
cooperatives, the primary cooperatives and the farmers all have to reach these criteria. They
have to meet the criteria for all they produce, whatever proportion they manage to sell as
Fairtrade branded. Obviously, they would prefer to sell all they produce at the higher Fairtrade
price, but the world market for the brand is about a third of the quantity produced, so two thirds
is sold, unbranded, at the commodity price (Kilian, Jones, Pratt, & Villalobos, 2006). Some
cooperatives struggle to sell 10% to 15% of their total production as Fairtrade, so their added

51st International Scientific Conference on Economic and Social Development – Rabat, 26-27 March 2020
190
costs are higher than their added income. Nothing is left for social projects or for the farmers.
Presumably they hope to sell more in future and make a profit. Others manage to sell most of
their output as Fairtrade so the social premium is higher than the extra costs, but even here the
cooperative management may say, ‘It’s not worth the trouble, Fairtrade’’ (Berndt, 2007, p. 27).
Fairtrade Labelling Organizations International figures do not show that any money goes to
farmers. Workers on Fairtrade plantations may do no better: tea workers in Kenya and India
may get a thermos flask every few years as their payoff from Fairtrade (Bahra, 2009a) (Bahra,
2009b). However, researchers suggest that some farmers have demanded to receive cash, rather
than have the money put into underperforming social projects. Some Fairtrade employees claim
that Fairtrade Labelling Organizations International is wrong. Martin Hill, Director of
Commercial Relations, Fairtrade Foundation UK, spoke at the European Coffee Symposium
(2009), and said that all the Fairtrade Premium was passed on to farmers at farm gate - not just
to the cooperative exporter, nor spent on business and production expenses, or on social
projects. Any extra money not spent on achieving certification and business expenses may be
spent on social projects. Some of the social projects are building local schools, clinics, or
baseball fields. Some of the projects are community (44% of expenditure on social projects),
education (14%), environment (1%), health (10%), women’s programs (5%) and others (25%)
(Fairtrade Labelling Organizations International, 2010). It is acceptable within the Fairtrade
ethos that all the extra money is spent in this way and that none is passed on to farmers. Fairtrade
does not control what the cooperatives do with the money or measure its impact. There is almost
no published information by researchers on what extra money individual cooperatives get, and
how much money they spend on each activity. There have been very few attempts at measuring
the impact but, even if one ignores the methodological problems with these, it is not possible
to take a small number of case studies of selected successful cooperatives, nearly all producing
coffee, and to generalize the results to 3000 producers supplying thousands of products. There
is no reason to assume that projects organized by cooperatives will have a greater impact than
ones delivered by those aid organizations or governments which have a strong professional skill
base, backup, resources and experience. Most aid projects also have economies of scale as they
aim to help all farmers in a district, province, or country, not just the few hundred Fairtrade
farmers. Agricultural economics and marketing interventions at sector level, industry level or
crop level, for instance, typically help millions of people, and can be low-cost: high-impact.
The Fairtrade projects are not low-cost: high-impact. There is a worry that the benefits of social
projects may accrue mainly to the families of committee members and managers of the
exporting cooperative, less to the families of committee members and managers of primary
cooperatives, and least to the farmers.
4. POLITICAL OBJECTIVES
The failures of Fairtrade arise from the fact that the headline objective advertised to customers,
‘A fair and stable price to farmers for their products’ (Fairtrade Foundation, 2011), is not the
main objective of many of its founders and managers. The main objective was political and
could not be achieved using tried and tested methods of getting charity from the donor to
farmers. The adoption of market-based delivery of charity has meant that businesses in rich
countries and cooperatives in poor countries could take most of the money donated. It has also
made it impossible to monitor and control what happened to the donations. Because farmers are
coerced into selling through cooperatives, they are tied to possibly inefficient buyers, and
cannot sell to the buyers offering the best price package. This marketing system has also
increased opportunities for corruption. Theft and corruption can make markets inefficient, so
that less and less of the retail price reaches the farmer and price signals are obscured. Markets
sometimes collapse as a result. For this reason, both governments and financial organizations
try to set up marketing systems which minimize the opportunity and temptation to steal: they
51st International Scientific Conference on Economic and Social Development – Rabat, 26-27 March 2020
191
nurse them into existence and then tend them carefully. Reducing the temptation and
opportunity is more important than detecting and punishing theft, which both governments and
financial organizations find difficult. The ethical aim is not just to protect individuals from theft,
but to protect everyone using the market, directly or indirectly. The Fairtrade system provides
more opportunities for theft than normal marketing systems. It uses the same retailers,
wholesalers, packers, importers and commodity markets as the normal system. The big increase
in the possibility of corruption arises because payments are not linked to observable product
quality, but are a subsidy. If there is a subsidy of, say, 10% of the total price, then market
intermediaries can steal anything up to 10% and still leave the intended recipients slightly better
off and afraid to complain in case they lose the rest as well. For example, subsidized credit
schemes often mean that farmers have to bribe the credit officer, bringing the true cost in line
with the moneylenders’ interest rate.
5. CONCLUSION
This paper set out several Utilitarian ethical criteria: that it is unethical to increase Death and
Destitution, and that it is unethical to use Unfair Trading practices, both because it permits the
increase of Death and Destitution, and because it could damage the credibility of charities. An
alternative use of the donations would be to send it to the Third World, to help the very poor,
those on the verge of starvation, in which case it would cut Death and Destitution. Instead, a
minimum of 50% of the donation stays in rich countries and in some cases more than 99% does.
Much of the money that does reach the Third World goes on the costs of Fairtrade conformity
and certification. Most of the rest goes on social projects. There is no evidence from studies
that these benefit the Third World. There is no evidence that Fairtrade gives what they promise,
‘A fair and stable price to farmers for their products’. Fairtrade concentrates on the relatively
rich, and there is reason to believe that it harms other farmers. It can be argued that this system
is only possible because the Fairtrade industry makes false claims and suppresses significant
information, which constitutes Unfair Trading. This has created the very effective marketing
situation where consumers, supporters and volunteers are given the freedom to fantasize about
what Fairtrade achieves.
LITERATURE:
1. ADB. (2010). Asian Development Bank and Vietnam: Fact Sheet. Retrieved June 14, 2010,
from http://www.adb.org/Documents/Fact_Sheets/VIE.pdf
2. Aranda, J., & Morales, C.: 2002, Poverty Alleviation through Participation in Fair Trade
Coffee: The Case of CEPCO, Oaxaca, Mexico. Retrieved from
http://www.colostate.edu/Depts/Sociology/FairTradeResearchGroup
3. Audebrand, L., & Pauchant, T.: 2009, ‘Can the Fair Trade Movement enrich Traditional
Business Ethics? An Historical Study of its founders in Mexico’, Journal of Business Ethics,
87, 343-353.
4. Bahra, P.: 2009a, ‘Fairtrade is struggling to change practices on tea estates and tackle
abuses. The Times January 2.
5. Bahra, P.: 2009b, ‘Tea workers still waiting to reap Fairtrade benefits’, The Times January
7.
6. Bassett, T.: 2009, ‘Slim pickings: Fairtrade cotton in West Africa’, Geoforum, 41, (1), 44-
55.
7. Berndt, C. E.: 2007, Is Fair Trade in coffee production fair and useful? Evidence from Costa
Rica and Guatemala and implications for policy. Washington DC.: Mercatus 65 Policy
Series, Policy Comment 11, Mercatus Centre, George Mason University.

51st International Scientific Conference on Economic and Social Development – Rabat, 26-27 March 2020
192
8. Boersma, F. V.: 2002, Poverty Alleviation through Participation in Fair Trade Coffee
Networks: The Case of UCIRI, Oaxaca, Mexico. Retrieved from
http://www.colostate.edu/Depts/Sociology/FairTradeResearchGroup
9. Boersma, F.: 2009, The urgency and necessity of a different type of market: the perspective
of producers organized within the Fair Trade market. Journal of Business Ethics, 86, 51-61.
10. Bowbrick, P.: 1988, ‘Are price reporting systems of any use?’ British Food Journal,90 (2)
65-69 March/April.
11. Bowbrick, P.: 1992, The Economics of Quality, Grades and Brands. London: Routledge.
12. Fairtrade Foundation.: 2008, ‘Response to Adam Smith Institute Report’, Fairtrade
Foundation Press Release, Feb 23.
13. Fairtrade Foundation.: 2009, ‘Press Statement in response to Times article, “Tea workers
still waiting to reap Fairtrade benefits”', World News from One World UK, January 7.
14. Hill, M.: 2009, European Coffee Symposium, October 9. Retrieved from
http://www.griffithsspeaker.com/Fairtrade/Who%20is%20telling%20the%20truth%204.w
mv
15. Jacquiau, C. ( 2006 ). Les Coulisees du Commerce Équitable. Paris: Mille et Une Nuits.
16. Jacquiau, C. (2007). Max Havelaar ou les ambiguïtés du commerce équitable: Pourquoi le
Sud rue dans les brancards. Monde Diplomatique September.
17. Johannesen, S.: 2008, Producing and Consuming Narratives for Fairtrade. Masters thesis
Norwegian University.
18. Jones, S., & Bayley, B.: 2000, Fair Trade: Overview, Impact, Challenges Study to Inform
DFID’s Support to Fair Trade. Oxford: Oxford Policy Management,.
19. Kilian, B., Jones, C., Pratt, L., & Villalobos, A.: 2006, ‘Is Sustainable Agriculture a Viable
Strategy to Improve Farm Income in Central America? A Case Study on Coffee’, Journal
of Business Research, 59 (3), 322–330.
20. Lamb, H. S. (2006). Trade audits do detect sales of non-certified coffee [REPLY]. Financial
Times, September 13.
21. Lamb, H.: 2008, ‘Fairtrade is Fair *Reply to Peter Griffiths, Fairtrade isn't Fair, Prospect
Aug 2008+’. Prospect, September.
22. Lamb, H.: 2008, Fighting the Banana Wars and other Fairtrade battles. London: Rider
Books.
23. Luetchford, P.: 2006, ‘Relations between Coffee Cooperatives and Alternative Trade
Organizations—A View from Costa Rica’. In D. Lewis, & D. Mosse, Development Brokers
and Translators: the Ethnography of Aid and Agencies Bloomfield, CT: Kumarian Press,
pp. 127-148,.
24. Lyon, S.: 2009, ‘What Good Will Two More Trees Do?’ The Political Economy of
Sustainable Coffee Certification, Local Livelihoods and Identities’, Landscape Research,
34, No. 2, 223–240, April.
51st International Scientific Conference on Economic and Social Development – Rabat, 26-27 March 2020
193
FORTHCOMING REFORM OF UNIVERSITY HOSPITAL FINANCING
AND POSSIBILITIES FOR EFFICIENCY IMPROVEMENT IN LATVIA
Mara Petersone
Riga Technical University, Latvia
Karlis Ketners
BA School of Business and Finance, Latvia
Ingars Erins
Riga Technical University, Latvia
ABSTRACT
One of the main parts of the health sector is university hospitals, as providers of highly
professional tertiary health care services as well as knowledge transfer system for any level of
health service providers. Creation of a fair and effective system of financing of in-patient care
is a significant part of health financing policy reform and the payment model has a direct impact
on health services delivery. Starting in 2014 Latvia introduced equalized payments by
diagnosis-related groups (DRGs) to pay a flat rate for average costs. This created cost shifting
and other negative provider behaviours included misclassification of treatment without clinical
justification. This leads to the necessity for the government to monitor and evaluate activity
against baselines and regulate compliance to achieve the policy intent of the payment system.
In terms of managing risk, there is a need to define national-level financing policy, to establish
an effective overall cost-control mechanism. The purpose of this article is to identify the main
determinants of the university hospital behaviour and based on international experience
propose payment system model taking into consideration Latvian university ‘tertiary’ hospital
needs. As the empirical basis for research statistical data of National Health Service and
interviews. In the paper comparative analysis, empirical analysis, statistical data processing
including the deductive and synthesis methods are used. Main challenges identified include
insufficient data in health care institutions, interference from interest groups, the need to adjust
payments to separate capital costs and depreciation and teaching tasks in university hospitals.
Lessons for health care financing policy reforms include the continuation of specific financing
model to facilitate access to knowledge and provider decision autonomy in university hospitals
in Latvia.
Keywords: Health financing reform, Health policy, Hospital financing, Latvian health care
services
1. INTRODUCTION
The main challenge of modern times for the Latvian health care system is the need to solve
large-scale problems of reducing mortality and raising the salaries of medical staff as well as
immediate investment in tertiary hospitals and regional hospitals. The cessation of economic
growth and the prospect of slow economic development pose an imperative for health care to
search for more efficient ways of organizing medical care and using available resource
potential. Achievement of targets for increasing wages without increasing government funding
for health means the need to raise funds to solve this problem by undertaking measures to save
resources and develop different sources to pay for medical services. Hospital sector (in-patient
health care provision) financing is one of the important issues for any health care financing
51st International Scientific Conference on Economic and Social Development – Rabat, 26-27 March 2020
194
reform. In general, we can summarise that there are three main directions of the reform. First –
strategic purchasing as health service purchaser reform, including assurance of public interest
in population health and efficiency optimizing the cost-effective provision of healthcare
services. In the scientific literature, outcomes of such reform are analysed by Klasa et al. (2018)
and previously by Hurst (1991), Schieber (1995), Busse et al. (2017). Strategic purchasing can
be defined as the process of allocating pooled funds to health care providers, whether within an
NHS system with a purchaser-provider split (i.e. England), through contracts with insurance
funds as in social insurance (i.e. Germany), and in more market-based systems (i.e.
Netherlands) (Greer et al., 2016). Contracting of health service providers (a process that
specifies what is purchased) is synonymous with purchasing and exclude situations in which
individual patients do the purchasing of their own care (Figueras et al., 2005). Strategic
purchasing, often called commissioning in the United Kingdom (UK), goes beyond mere
purchasing, contracting on price and quantity, or reimbursement of providers (Klasa et al.,
2018). Contracting in the Baltic States also was introduced and strategic purchasing
implementation provides an opportunity to revise the selective contracting criteria so that they
would better respond to changes in the health care delivery system and population needs, but
also to further prioritize providers with a higher quality of care (Habicht et al., 2018). The
second direction is – improvement of quality of care and establishing health pathways in a
public health service (Holla et al., 2016). This also includes encouraging higher standards of
quality of care by adopting pay-for-performance schemes for all levels of care. And the third
direction is the implementation of the system of payments for in-patient care in combination
with an increase of accountability and management organization. One of the management
organization directions during the last two decades New Public Management (NPM) has been
seen as one ‘solution’ to the many vicissitudes facing public hospitals in order to promote
economic effectiveness. According to Mattei et al. (2013) New Public Management revolves
around the creation of competition through privatization, quasi-markets and service contracts
for achieving greater efficiency. One of the key elements in the NPM reform movement has
been a call for decentralization of decision-making towards political and non-political
institutions and actors. However decision making does not guarantee any direct effects for
economic efficiency. Thus Pirozek et al. (2015) characterized corporate governance after the
hospital reform, but demonstrated that the fact that the hospital's legal form had no influence
on economic results. Successful management in the form of adjusted economic results is only
associated with the private type of facility ownership, but the size of the hospital, the size of the
supervisory board and the medical qualifications of the senior manager had no statistically
verifiable influence on the efficiency of the hospital management, though we did record certain
developments as a result of the transformation process. The economic results that were reported
were significantly distorted by the operating subsidies from the founder. As for Latvian health
care provision smaller hospitals and some bigger regional hospitals are usually owned by
municipalities, while larger tertiary hospitals (university hospitals) and specialized (mono-
profile) hospitals (e.g. psychiatric hospitals) are owned by the state. Hospitals became either
non-profit-making state or municipal limited liability companies but were never fully
privatized. Almost all dental practices, pharmacies and several sanatoria (spas) were privatized.
In addition, there has been a small increase in the number of private hospitals since 1993,
however, they usually have very few beds and provide mostly non-contracted care. Scientific
literature accepts the general assumption that teaching hospitals (university clinical hospitals)
tend to reveal a different structure of services providing less of basic and more of highly
specialized care, management and organization of resources and therefore, the presence of
teaching status has been acknowledged as a very important determinant of efficiency
(Votápková et al., 2013). Since 1990s (Wiley, 1992) reforms in the financing of hospital
services in European countries and other OECD countries reveals a commitment to a common
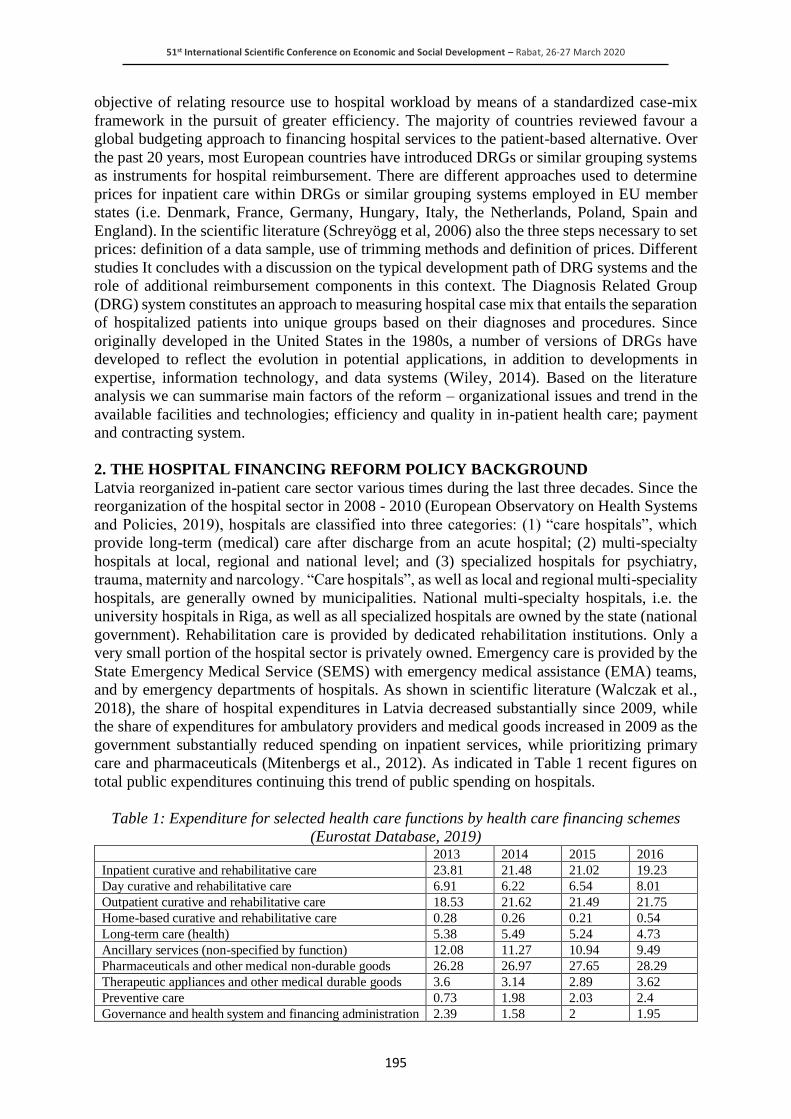
51st International Scientific Conference on Economic and Social Development – Rabat, 26-27 March 2020
195
objective of relating resource use to hospital workload by means of a standardized case-mix
framework in the pursuit of greater efficiency. The majority of countries reviewed favour a
global budgeting approach to financing hospital services to the patient-based alternative. Over
the past 20 years, most European countries have introduced DRGs or similar grouping systems
as instruments for hospital reimbursement. There are different approaches used to determine
prices for inpatient care within DRGs or similar grouping systems employed in EU member
states (i.e. Denmark, France, Germany, Hungary, Italy, the Netherlands, Poland, Spain and
England). In the scientific literature (Schreyögg et al, 2006) also the three steps necessary to set
prices: definition of a data sample, use of trimming methods and definition of prices. Different
studies It concludes with a discussion on the typical development path of DRG systems and the
role of additional reimbursement components in this context. The Diagnosis Related Group
(DRG) system constitutes an approach to measuring hospital case mix that entails the separation
of hospitalized patients into unique groups based on their diagnoses and procedures. Since
originally developed in the United States in the 1980s, a number of versions of DRGs have
developed to reflect the evolution in potential applications, in addition to developments in
expertise, information technology, and data systems (Wiley, 2014). Based on the literature
analysis we can summarise main factors of the reform – organizational issues and trend in the
available facilities and technologies; efficiency and quality in in-patient health care; payment
and contracting system.
2. THE HOSPITAL FINANCING REFORM POLICY BACKGROUND
Latvia reorganized in-patient care sector various times during the last three decades. Since the
reorganization of the hospital sector in 2008 - 2010 (European Observatory on Health Systems
and Policies, 2019), hospitals are classified into three categories: (1) “care hospitals”, which
provide long-term (medical) care after discharge from an acute hospital; (2) multi-specialty
hospitals at local, regional and national level; and (3) specialized hospitals for psychiatry,
trauma, maternity and narcology. “Care hospitals”, as well as local and regional multi-speciality
hospitals, are generally owned by municipalities. National multi-specialty hospitals, i.e. the
university hospitals in Riga, as well as all specialized hospitals are owned by the state (national
government). Rehabilitation care is provided by dedicated rehabilitation institutions. Only a
very small portion of the hospital sector is privately owned. Emergency care is provided by the
State Emergency Medical Service (SEMS) with emergency medical assistance (EMA) teams,
and by emergency departments of hospitals. As shown in scientific literature (Walczak et al.,
2018), the share of hospital expenditures in Latvia decreased substantially since 2009, while
the share of expenditures for ambulatory providers and medical goods increased in 2009 as the
government substantially reduced spending on inpatient services, while prioritizing primary
care and pharmaceuticals (Mitenbergs et al., 2012). As indicated in Table 1 recent figures on
total public expenditures continuing this trend of public spending on hospitals.
Table 1: Expenditure for selected health care functions by health care financing schemes
(Eurostat Database, 2019) 2013 2014 2015 2016
Inpatient curative and rehabilitative care 23.81 21.48 21.02 19.23
Day curative and rehabilitative care 6.91 6.22 6.54 8.01
Outpatient curative and rehabilitative care 18.53 21.62 21.49 21.75
Home-based curative and rehabilitative care 0.28 0.26 0.21 0.54
Long-term care (health) 5.38 5.49 5.24 4.73
Ancillary services (non-specified by function) 12.08 11.27 10.94 9.49
Pharmaceuticals and other medical non-durable goods 26.28 26.97 27.65 28.29
Therapeutic appliances and other medical durable goods 3.6 3.14 2.89 3.62
Preventive care 0.73 1.98 2.03 2.4
Governance and health system and financing administration 2.39 1.58 2 1.95
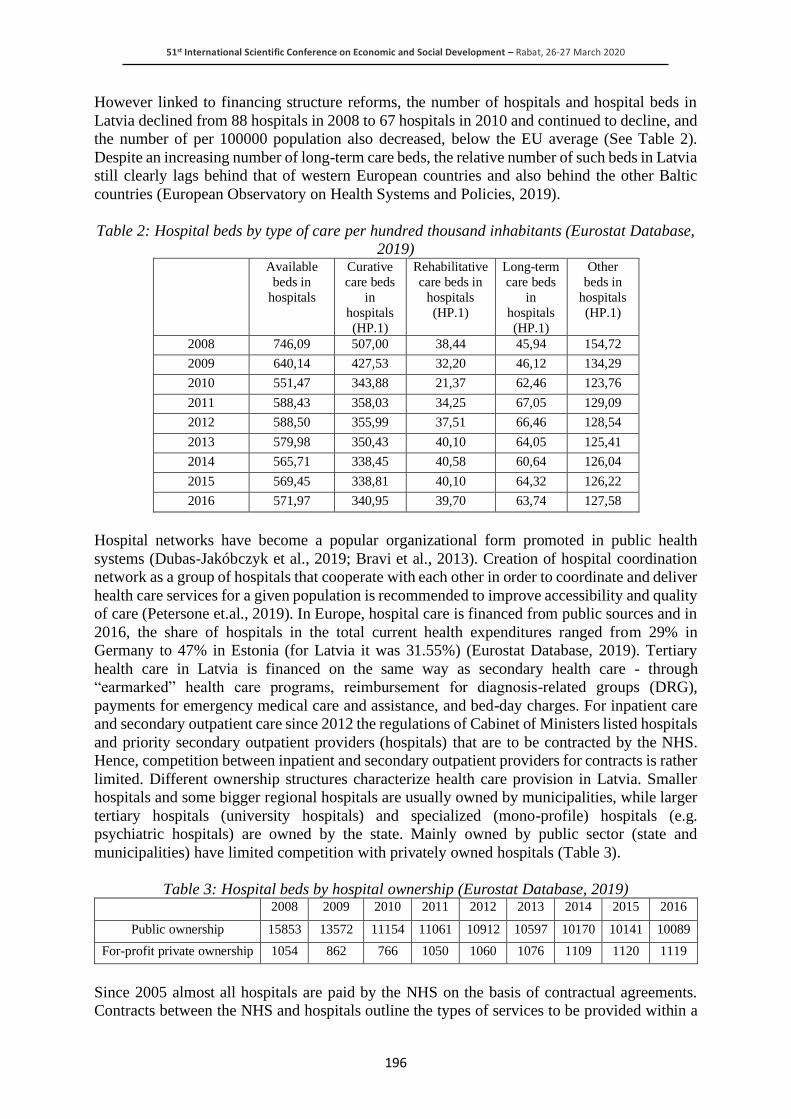
51st International Scientific Conference on Economic and Social Development – Rabat, 26-27 March 2020
196
However linked to financing structure reforms, the number of hospitals and hospital beds in
Latvia declined from 88 hospitals in 2008 to 67 hospitals in 2010 and continued to decline, and
the number of per 100000 population also decreased, below the EU average (See Table 2).
Despite an increasing number of long-term care beds, the relative number of such beds in Latvia
still clearly lags behind that of western European countries and also behind the other Baltic
countries (European Observatory on Health Systems and Policies, 2019).
Table 2: Hospital beds by type of care per hundred thousand inhabitants (Eurostat Database,
2019) Available
beds in
hospitals
Curative
care beds
in
hospitals
(HP.1)
Rehabilitative
care beds in
hospitals
(HP.1)
Long-term
care beds
in
hospitals
(HP.1)
Other
beds in
hospitals
(HP.1)
2008 746,09 507,00 38,44 45,94 154,72
2009 640,14 427,53 32,20 46,12 134,29
2010 551,47 343,88 21,37 62,46 123,76
2011 588,43 358,03 34,25 67,05 129,09
2012 588,50 355,99 37,51 66,46 128,54
2013 579,98 350,43 40,10 64,05 125,41
2014 565,71 338,45 40,58 60,64 126,04
2015 569,45 338,81 40,10 64,32 126,22
2016 571,97 340,95 39,70 63,74 127,58
Hospital networks have become a popular organizational form promoted in public health
systems (Dubas-Jakóbczyk et al., 2019; Bravi et al., 2013). Creation of hospital coordination
network as a group of hospitals that cooperate with each other in order to coordinate and deliver
health care services for a given population is recommended to improve accessibility and quality
of care (Petersone et.al., 2019). In Europe, hospital care is financed from public sources and in
2016, the share of hospitals in the total current health expenditures ranged from 29% in
Germany to 47% in Estonia (for Latvia it was 31.55%) (Eurostat Database, 2019). Tertiary
health care in Latvia is financed on the same way as secondary health care - through
“earmarked” health care programs, reimbursement for diagnosis-related groups (DRG),
payments for emergency medical care and assistance, and bed-day charges. For inpatient care
and secondary outpatient care since 2012 the regulations of Cabinet of Ministers listed hospitals
and priority secondary outpatient providers (hospitals) that are to be contracted by the NHS.
Hence, competition between inpatient and secondary outpatient providers for contracts is rather
limited. Different ownership structures characterize health care provision in Latvia. Smaller
hospitals and some bigger regional hospitals are usually owned by municipalities, while larger
tertiary hospitals (university hospitals) and specialized (mono-profile) hospitals (e.g.
psychiatric hospitals) are owned by the state. Mainly owned by public sector (state and
municipalities) have limited competition with privately owned hospitals (Table 3).
Table 3: Hospital beds by hospital ownership (Eurostat Database, 2019) 2008 2009 2010 2011 2012 2013 2014 2015 2016
Public ownership 15853 13572 11154 11061 10912 10597 10170 10141 10089
For-profit private ownership 1054 862 766 1050 1060 1076 1109 1120 1119
Since 2005 almost all hospitals are paid by the NHS on the basis of contractual agreements.
Contracts between the NHS and hospitals outline the types of services to be provided within a

51st International Scientific Conference on Economic and Social Development – Rabat, 26-27 March 2020
197
year and specify the annual budget. The size of hospital budgets depends on the estimated unit
cost of the service (including both running costs and depreciation of capital) and the estimated
volume of services. The budgets are hard budgets that shift the entire risk for exceeding the
budget onto the provider side. If the provider exceeds the estimated volume, the NHS does not
reimburse the provider for the additional activity. In practice, university hospitals running into
financial deficits, which have to be compensated for by the owners - the state, local
governments.
Table 4: Main financial indicators for university hospitals (Cross-Sectoral Coordination
Centre, 2019) Hospital Return on equity,
(ROE), %
Return on assets
(ROA), %
EBITDA, % Share of own
funds on balance
sheet
Children's Clinical
University Hospital
-0.03 0 6.06 0.13
Paul Stradins Clinical
University Hospital
0.05 0.01 4.31 0.18
Riga East Clinical
University Hospital
- -2.66 4.7 -0.13
Riga psychiatry and
Narcology Centre
0.08 0.03 3.95 0.39
Average 0.03 -0.66 4.76 0.14
Until 2010 Latvia used a mix of case-based payments and per diem payments (European
Observatory on Health Systems and Policies, 2019). Case-based payments covered about 50%
of inpatient admissions, for which hospitals received a flat rate tariff per case, depending on the
primary diagnosis of patients and/or the medical interventions performed, with adjustments for
the actual length of stay and the number and type of interventions performed. For the remaining
50% of patients, hospitals were reimbursed on a per diem basis, sometimes at a reduced rate if
patients exceeded the average length of stay of similar patients in other hospitals. However, in
order to improve budget control, a global budget system was introduced in 2010. Since then,
the size of the annual global budget per hospital is calculated by multiplying the forecast
number of patients (the number of patients treated in the previous year with certain adjustments)
within each “health care programme” with a corresponding patient tariff and summing up the
results. As it was mentioned above the hospitals bear the financial risk of running over budget
if they have higher costs, even if they treat more patients or provide more services. The owners
of hospitals, i.e. the state or municipalities, generally jump in to save hospitals when debts have
reached a certain level. In practice, hospitals often provide more services that are covered by
their budget. Emergency hospitals receive an additional budget for emergency room and
admission services. The size of this budget depends on the number of available specialists on
duty. One of the detected problems also is a between-hospital acute inpatient transfer is a patient
who is admitted to one hospital for acute inpatient care and is then transferred to another
hospital for the continuation of the same episode of care. There are risks of inappropriate
transfers, especially when using per case payments. One type of inappropriate transfer would
be when it is not necessary but is rather due to a clinical error. A second type is a transfer for
financial reasons (the hospital might refer to a complicated and expensive patient in order to
avoid financial pressure). At the initial stage it could be recommended to set neutral payment
rates, defining transfer guidelines, defining referral rules and guidelines, and sample auditing
on the basis of pattern analysis of routine inpatient data. Abovementioned raise necessity for
reform of the hospital payment system is high up on the policy agenda.
51st International Scientific Conference on Economic and Social Development – Rabat, 26-27 March 2020
198
3. PAYMENT SYSTEM REFORMATION DIRECTIONS
Across Europe there are a limited number of the provider payment methods in use: salary, per
capita payment (capitation), the fee for service (FFS), per diem, line-item budget, global budget,
case-based (DRG), pay for performance (P4P). The mode of payment creates powerful
incentives affecting provider behaviour and the efficiency, equity and quality outcomes of
health finance reforms. Cabinet Regulation No. 555 of 28 August 2018, Procedures for the
Organising and Payment of Health Services (Latvijas Vestnesis, 2018), prescribe health
services, which are paid from State budget resources. At the same time, the National Health
Service's home page also publishes a list of state chargeable manipulation, which details the
content and service tariffs of the State-paid service basket. As regards the methodology for
calculating tariffs, it is explained that the process of calculating national chargeable health
services tariffs is continually improving. Health services tariffs are designed to cover the actual
costs of service providers, including each element (pay, mandatory national social insurance
contributions, medical products, expenses related to patient catering (hospital), overheads and
indirect production costs (expenses related to patient maintenance for payment of services, risk
payments, for the purchase of materials, energy resources, water and inventory), administrative
expenditure and depreciation costs. The Service shall carry out an analysis annually, assessing
whether the payments made to service providers cover the actual costs of service providers,
including an element cut. DRG introduction allows agreeing with the hospital on the number
of patients and the amounts of interventions and manipulations, as well as on the structure of
diseases and medical technologies. The DRG system makes the hospital an active participant
in the decision-making process, allows to plan targets and includes mechanisms for delegation
of power to the institutional level and responsibility for determining the composition of medical
assistance to a particular patient with a specific disease. Currently, medical treatment
institutions are not bound to direct the payment received for depreciation for the purchase of
new equipment, so in most cases, the medical treatment institution uses it to cover other items
(including the provision of higher remuneration for medical practitioners). Based on interviews
with policymakers and representatives of health care institutions it can be recommended to
include in the per case payment includes all the hospital’s costs – clinicians’ salaries,
equipment, drugs, building maintenance, insurance, but to exclude one important type of cost
is excluded – the cost of capital. There could be separate budgets for capital assets (such as the
hospital site, buildings, and large items of equipment. In parallel, work is being done to improve
the accounting of services of DRG, so that the value of the group is closer to actual costs. As
detected through the study, the NHS, in cooperation with clinical university hospitals, shall
continue to work to make payments for DRG services at their cost in the future. At the same
time, solutions will be sought, as will be examined and certified in advance by the cost accounts
of the medical treatment institution, in order to assess whether the division of indirect costs is
provided by the methodology developed by the NHS. Authors also recommends to continue
improvement of financing of tertiary care taking into consideration the special status of
university hospitals in relation to the complexity of the services to be provided and the special
conditions for payment is specified in Section 54.1, Paragraph two of the Medical Treatment
Law (Latvijas Vēstnesis, 1997): “The increased coefficient specified in the regulatory
enactments shall be applied to the University Hospital from State budget funds for the paid
health services”. It has already provided additional funding of €2.8 million from the information
report “On the implementation of the health reform measures for 2019” to the measure “To
compensate the costs of Level V medical facilities by revising the daily bed rate” by gradually
offsetting from 2019 the payments for hospital health services as part of the calculation of
groups associated with diagnosis (DRG services). services) in order to be determined according
to the costs of these hospitals, taking into account that the most complex and cost-intensive
medical treatment in university hospitals are concentrated.
51st International Scientific Conference on Economic and Social Development – Rabat, 26-27 March 2020
199
Under the current approach in Latvia, payment rates are partially based on estimated actual
costs of care in a previous period, as reported by service providers. Improved methods of cost
estimation should be introduced. Use of standard costs rather than actual average costs could
be recommended for high-volume case types for which the best method of care has been
specified using a care pathway model.
4. CONCLUSION
Main factors of the hospital reform in Latvia are organizational issues and trend in the available
facilities and technologies; efficiency and quality in in-patient health care; payment and
contracting system. Tertiary health care in Latvia is financed on the same way as secondary
health care - through “earmarked” health care programs, reimbursement for diagnosis-related
groups (DRG), payments for emergency medical care and assistance, and bed-day charges.
Main challenges identified include insufficient data in health care institutions, interference from
interest groups, the need to adjust payments to reflect capital costs and depreciation and
teaching tasks in hospitals. After the development of clinical guidelines and pathways, the main
priority would be more complete implementation of the DRG system of hospital payments.
Authors also recommend continuing improvement of financing of tertiary care taking into
consideration the special status of university hospitals in relation to the complexity of the
services to be provided and the special conditions for payment. Through the coefficient system
also the transfer of knowledge to young practitioners and medical students should be
considered. It can be recommended to include in the per case payment includes all the hospital’s
costs – clinicians’ salaries, equipment, drugs, building maintenance, insurance, but to exclude
one important type of cost is excluded – the cost of capital. There could be separate budgets for
capital assets (such as the hospital site, buildings, and large items of equipment. The main
feature of initial payment system reform could be changing the financing principles for a pre-
defined scope of services. However, it will be important to closely monitor its effects, adjust
the payment model when needed and to embed it into a more comprehensive strategy for the
future development of the hospital sector in Latvia.
ACKNOWLEDGEMENT: This work has been supported by the European Regional
Development Fund within the Activity 1.1.1.2 “Post-doctoral Research Aid” of the Specific Aid
Objective 1.1.1 “To increase the research and innovative capacity of scientific institutions of
Latvia and the ability to attract external financing, investing in human resources and
infrastructure” of the Operational Programme “Growth and Employment”
(No.1.1.1.2/VIAA/2/18/330).
LITERATURE:
1. Bravi, F., Gibertoni, D., Marcon, A., Sicotte, C., Minvielle, E., Rucci, P., Angelastro, A.,
Carradori, T. and Fantini, M.P. 2013. “Hospital network performance: A survey of hospital
stakeholders’ perspectives”. Health policy, 109 (2), 150-157.
2. Busse, R., Figueras, J., Robinson, R. and Jakubowski, E. 2007. “Strategic purchasing to
improve health system performance: key issues and international trends”. HealthCare
papers, 8, 62-76.
3. Cross-Sectoral Coordination Centre 2019. Databases and Annual Reports. Profitability and
financial stability indicators. Available at: www.valstskapitals.gov.lv/en/databases-and-
annual-reports/profitability-and-financial-stability-indicators-/ (Accessed 19 June 2019).
4. Dubas-Jakóbczyk, K., Kowalska-Bobko, I. and Sowada, C. 2019. “The 2017 reform of the
hospital sector in Poland–the challenge of consistent design”. Health Policy, 123 (6), 538-
543.
51st International Scientific Conference on Economic and Social Development – Rabat, 26-27 March 2020
200
5. European Observatory on Health Systems and Policies. 2019. Online HiT for Latvia –
HSPM. Available at: https://www.hspm.org/countries/latvia08052014 (Accessed 19 June
2019).
6. Eurostat Database. 2019. Available at: https://ec.europa.eu/eurostat/data/database
(Accessed 19 May 2019).
7. Figueras, J., Robinson, R. and Jakubowski, E. 2005. Purchasing to improve health systems
performance. McGraw-Hill Education (UK).
8. Greer, L.S.; Wismar, M. and Figueras, J. 2016. Strengthening health system governance:
better policies, stronger performance. McGraw Hill Education/Open University Press.
9. Habicht, T., Habicht, J. and Van Ginneken, E. (2015) “Strategic purchasing reform in
Estonia: Reducing inequalities in access while improving care concentration and quality”.
Health Policy, 119 (8), 1011-1016.
10. Holla, A., Rabie, T. S. and Sales, L. 2016. Prospects for Health Sector Reform in Latvia.
World Bank. Available at: http://www.vmnvd.gov.lv/uploads/files/585933cb1d0d4.pdf
(Accessed 19 June 2019).
11. Hurst, J. W. 1991. “Reforming health care in seven European nations”. Health Affairs, 10
(3), 7-21.
12. Klasa, K., Greer, S. L. and Van Ginneken, E. 2018. “Strategic purchasing in practice:
comparing ten European countries”. Health Policy, 122 (5), 457-472.
13. Latvijas Vēstnesis. 1997. Medical Treatment Law. Latvijas Vēstnesis, 167/168 (882/883),
01.07.1997. Available at: https://likumi.lv/ta/id/44108 (Accessed 19 June 2019).
14. Latvijas Vestnesis. 2018. Cabinet Regulation No. 555 of 28 August 2018, Procedures for
the Organisation and Payment of Health Services. Latvijas Vēstnesis, Nr.176 (6262),
05.09.2018. Available at: https://likumi.lv/ta/id/301399 (Accessed 19 June 2019).
15. Mattei, P., Mitra, M., Vrangbæk, K., Neby, S. and Byrkjeflot, H. 2013. “Reshaping public
accountability: Hospital reforms in Germany, Norway and Denmark”, International Review
of Administrative Sciences, 79 (2), 249-270.
16. Mitenbergs, U., Taube, M., Misins, J., Mikitis, E., Martinsons, A., Rurane, A. and Quentin,
W. 2012. “Health Systems in Transition. Latvia”. Health, 14 (8).
17. Pētersone, M., Ketners, K., Krieviņš, D., Kreicberga, I. and Eriņš, I. 2019. “Developing A
Comprehensive Model for Forthcoming Reforms of University Hospitals”. Management
Theory and Studies for Rural Business and Infrastructure Development, 41 (2), 197-212.
18. Pirozek, P., Komarkova, L., Leseticky, O. and Hajdikova, T. 2015. “Corporate governance
in Czech hospitals after the transformation”. Health Policy, 119 (8), 1086-1095.
19. Schieber, G. J. (1995) “Preconditions for health reform: experiences from the OECD
countries”. Health Policy, 32 (1-3), 279-293.
20. Schreyögg, J., Stargardt, T., Tiemann, O. and Busse, R. 2006. “Methods to determine
reimbursement rates for diagnosis related groups (DRG): a comparison of nine European
countries”. Health care management science, 9 (3), 215–223.
21. Votápková, J. and Šťastná, L. 2013. “Efficiency of hospitals in the Czech Republic”.
Prague Economic Papers, 4, 524-541.
22. Walczak, R., Piekut, M. and Kludacz-Alessandri, M. 2018. “Health Care Spending
Structures in Poland, Latvia, Lithuania and Estonia over the Years as Compared to other
EU Countries”. Foundations of Management, 10, DOI:10.2478/fman-2018-0005
23. Wiley, M. M. 2014. “Diagnosis related groups (DRGs): Measuring hospital case mix”.
Wiley StatsRef: Statistics Reference Online, 2014.
24. Wiley, M.M. 1992. “Hospital financing reform and case-mix measurement: an international
review”. Health care financing review, 13 (4), 119-33.
51st International Scientific Conference on Economic and Social Development – Rabat, 26-27 March 2020
201
THE ROLE OF TNCS AS INNOVATIVE LEADERS IN THE GLOBAL
ECONOMY
Kovtun Olga
Novosibirsk State University of Economics and Management, Russia
Lihovitskaya Darya
Novosibirsk State University of Economics and Management, Russia
ABSTRACT
In the modern world there are continuous processes of globalization, technological
development, the political situation is changing; international economic relations are in
constant modification and development. The activities of the strong transnational corporations
(TNCs), whose economic power exceeds the potential of many states, are qualitatively changing
the very system of the world economy managing. By the beginning of the 21st century, a kind
of “trio rule” turned out: in addition to national governments, TNC super firms and
international economic organizations, which determine the rules of the game on the world
stage, influence world economic relations. At the same time, TNCs, having a large number of
diverse resources and capabilities, are successfully implementing innovative strategies, thereby
enhancing their impact on the social and economic development of the countries of the world
and not only on the host country, but also on the recipient countries. This kind of influence is
based on the successful implementation of innovative technologies and the degree of presence
in international value chains; as a result, an increasing number of goods and services are
becoming international. In such a situation, it is TNCs that need to maximize the use of scientific
and technological achievements to ensure their competitiveness in the world market, which in
the future will have an impact on the future of the global economy. As a result of the study, the
innovative activity of Russian multinational companies was analyzed using the example of
Gazprom, Lukoil, Rosneft companies. And a qualitative and quantitative assessment of the large
business innovative component was given.
Keywords: transnational company, innovative activity, technological development
1. INTRODUCTION
Currently, a large number of business entities are located in the Russian Federation, among
which transnational companies occupy an important place. They, with their integrated structure
and high concentration of capital, play an important role in the development of the country's
economy: budget revenues increase, additional jobs are organized, new technologies and
management styles are introduced. Multinational corporations (TNCs) possessing a large
number of resources (material, human, financial, informational) and opportunities successfully
implement innovative strategies, thereby enhancing their impact on the social and economic
development of the countries of the world, not only on the home country, but also on the
countries recipients. This kind of influence is based on innovation and the degree of presence
in international value chains, so an increasing number of goods and services are becoming
international. In the modern world there are continuous processes of globalization,
technological development, the political situation is changing, the world economy itself is in
constant motion and development, which in turn directly affects the development and prospects
of transnational companies.

51st International Scientific Conference on Economic and Social Development – Rabat, 26-27 March 2020
202
2. APPROACHES TO TNE NATURE OT MODERN TNCS AND THEIR ROLE IN THE
SYSTEM OF ESTABLISHMENT INNOVATIONS IN THE GLOBAL ECONOMY
In the current trends of business internationalization, transnationalization of production and
capital, the leading position in the economy is held by multinational companies, international
not only in scope, but also in the composition of capital, the so-called transnational corporations
(TNCs). In scientific communities, there is no single approach to the definition of a
transnational corporation, however, all authors highlight the international character of their
activities as the main feature.
Table 1: the Essence of approaches to the determination of TNCs
Scientists Approach to the determination of TNCs
G. M. Velyaminov TNCs - a set of independent organizations with a common
economic goal, based in different countries, but managed from
a single center.
M. M. Boguslavsky TNC takes legal plurality, which serves the interests of their
owners.
V. G. Ermolaeva A multinational corporation is a combination of centralized
leadership with a certain degree of independence of legal
entities and structural divisions (branches, representative
offices, subsidiaries) located in it and located in different
countries
E. V. Lensky and V. A.
Tsvetkov
TNCs are enterprises (financial and industrial associations)
that own or control production or service complexes located
outside the country in which these corporations are based,
having an extensive network of branches and departments and
occupying a leading position in the production and sale of a
particular product [8].
J. Galbraith The main purpose of opening branches abroad is to service
products, increase sales through related services and active
promotion of products.
S. Khymer, C. Kindleberger In the conditions of monopolization of product markets, the
company seeks to use a new form of competition, highlighting
the manufactured product in a special group (due to its special
positioning). Due to this, the general laws of competition will
not apply to this product.
It is worth noting that, firstly, the studied approaches pay attention to various features of TNCs,
which is caused by the complexity and multi-aspect of the studied concept. Secondly,
representatives of various areas are united by the idea of the monopolistic nature of the activities
of such companies, as well as the competitive advantages obtained by virtue of
transnationalization. Thirdly, TNCs, being subjects of the world economy, have a significant
impact on the organization of the world economy. It is they who largely shape the structure and
dynamics of the global economy, control most of the research and development, influence labor
migration and facilitate the exchange of experience between different countries. Thus,
transnational corporations are characterized, on the one hand, by establishing an international
production system based on the spraying of production units across many countries, and on the
other hand, their penetration into advanced manufacturing sectors, the rapid development of
which requires large investments and the attraction of highly qualified personnel.
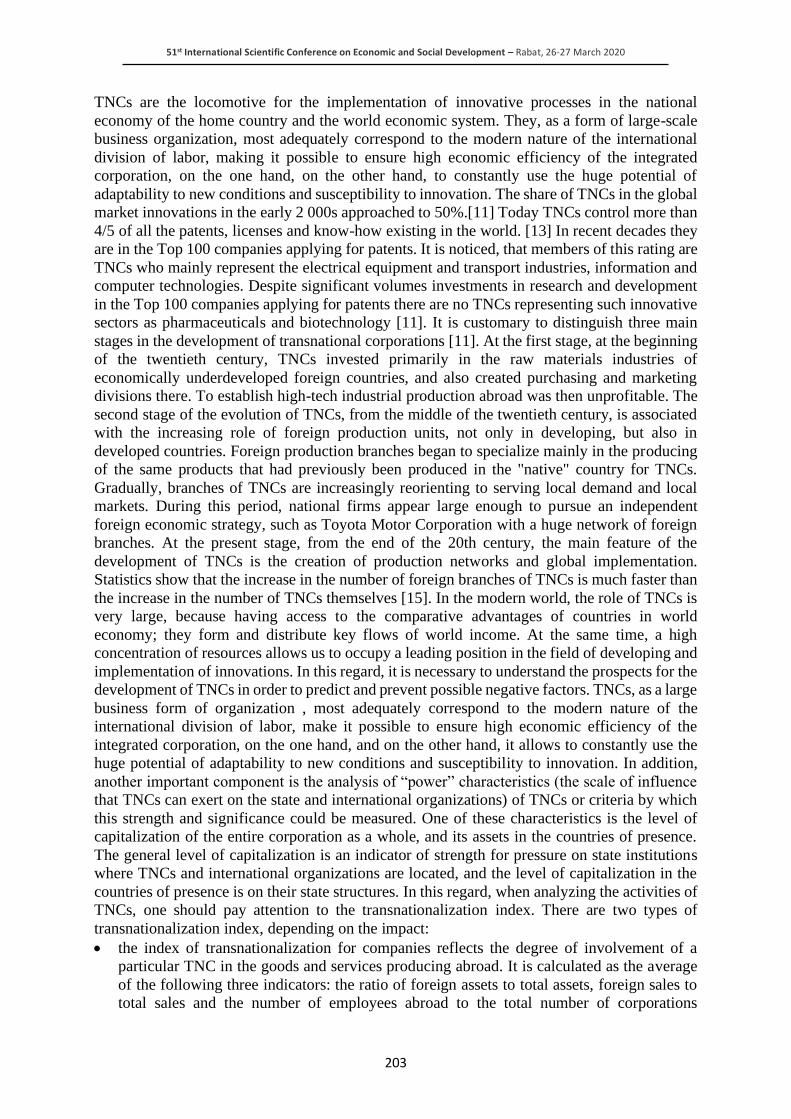
51st International Scientific Conference on Economic and Social Development – Rabat, 26-27 March 2020
203
TNCs are the locomotive for the implementation of innovative processes in the national
economy of the home country and the world economic system. They, as a form of large-scale
business organization, most adequately correspond to the modern nature of the international
division of labor, making it possible to ensure high economic efficiency of the integrated
corporation, on the one hand, on the other hand, to constantly use the huge potential of
adaptability to new conditions and susceptibility to innovation. The share of TNCs in the global
market innovations in the early 2 000s approached to 50%.[11] Today TNCs control more than
4/5 of all the patents, licenses and know-how existing in the world. [13] In recent decades they
are in the Top 100 companies applying for patents. It is noticed, that members of this rating are
TNCs who mainly represent the electrical equipment and transport industries, information and
computer technologies. Despite significant volumes investments in research and development
in the Top 100 companies applying for patents there are no TNCs representing such innovative
sectors as pharmaceuticals and biotechnology [11]. It is customary to distinguish three main
stages in the development of transnational corporations [11]. At the first stage, at the beginning
of the twentieth century, TNCs invested primarily in the raw materials industries of
economically underdeveloped foreign countries, and also created purchasing and marketing
divisions there. To establish high-tech industrial production abroad was then unprofitable. The
second stage of the evolution of TNCs, from the middle of the twentieth century, is associated
with the increasing role of foreign production units, not only in developing, but also in
developed countries. Foreign production branches began to specialize mainly in the producing
of the same products that had previously been produced in the "native" country for TNCs.
Gradually, branches of TNCs are increasingly reorienting to serving local demand and local
markets. During this period, national firms appear large enough to pursue an independent
foreign economic strategy, such as Toyota Motor Corporation with a huge network of foreign
branches. At the present stage, from the end of the 20th century, the main feature of the
development of TNCs is the creation of production networks and global implementation.
Statistics show that the increase in the number of foreign branches of TNCs is much faster than
the increase in the number of TNCs themselves [15]. In the modern world, the role of TNCs is
very large, because having access to the comparative advantages of countries in world
economy; they form and distribute key flows of world income. At the same time, a high
concentration of resources allows us to occupy a leading position in the field of developing and
implementation of innovations. In this regard, it is necessary to understand the prospects for the
development of TNCs in order to predict and prevent possible negative factors. TNCs, as a large
business form of organization , most adequately correspond to the modern nature of the
international division of labor, make it possible to ensure high economic efficiency of the
integrated corporation, on the one hand, and on the other hand, it allows to constantly use the
huge potential of adaptability to new conditions and susceptibility to innovation. In addition,
another important component is the analysis of “power” characteristics (the scale of influence
that TNCs can exert on the state and international organizations) of TNCs or criteria by which
this strength and significance could be measured. One of these characteristics is the level of
capitalization of the entire corporation as a whole, and its assets in the countries of presence.
The general level of capitalization is an indicator of strength for pressure on state institutions
where TNCs and international organizations are located, and the level of capitalization in the
countries of presence is on their state structures. In this regard, when analyzing the activities of
TNCs, one should pay attention to the transnationalization index. There are two types of
transnationalization index, depending on the impact:
• the index of transnationalization for companies reflects the degree of involvement of a
particular TNC in the goods and services producing abroad. It is calculated as the average
of the following three indicators: the ratio of foreign assets to total assets, foreign sales to
total sales and the number of employees abroad to the total number of corporations

51st International Scientific Conference on Economic and Social Development – Rabat, 26-27 March 2020
204
employed: the share of assets abroad in the total assets of TNCs; the share of sales abroad
in the total sales of this TNC; the share of personnel abroad in the total number of staff in
this corporation.
• the transnationalization index for countries estimates the importance of foreign
multinationals for a particular country. It is calculated as the sum of four values: the share
of foreign direct investment in all capital investments within the country; the ratio of foreign
direct investment in the country to the country's GDP; the share of branches of foreign
corporations in the country's GDP; the share of employees in these branches in the total
number of employees in the country [15].
If we compare American TNCs with European ones, we can see a pattern: due to the size of the
US market, the degree of transnationalization of their multinationals will be much lower than
that of European TNCs, whose market in their native country is very limited. [14] In addition,
the tax system of the United States and Europe is important. For European TNCs, for example,
German, it is much more cost-effective to export production to developing Asian countries. In
order to encourage TNCs to start operations in the country, governments offer them some
benefits, for example, tax, government subsidies, weak labor or environmental laws. An
example is the American company General Electric, which has moved its full-cycle factories to
Mexico, Singapore and South Korea, thereby reducing its manufacturing costs. It is worth
noting an important role of TNCs in the process of direct foreign investment (FDI). Foreign
direct investment, as defined by the IMF, is an investment whose purpose is to obtain continued
interest from a legal entity - a resident of one economic system in a company resident in another
economic system. Long-term interest implies the existence of a long-term relationship between
a direct investor and a foreign company and a significant degree of investor’s influence on the
organization’s management. So a TNC investment cycle is as a determined period from an
investment idea initiation to investment product implementation resulting in an economic,
social, ecological development level of a new quality or modernization of technology and
management system [12]. Interest in FDI in this scientific research is due to the fact that they
are most directly associated with TNCs as their structures. The objectives of such investments
are far from unambiguous, they are not only, and sometimes not so much in receiving super-
profits by obtaining cheap labor, raw materials and sales markets, as in order to fully or partially
monopolize any market or country as a whole and increase political arguments pressure on the
state. Nevertheless, at the moment, it is TNCs that act as the locomotive of the movement of
world FDI. Despite some negative impact of the global crisis, the scale of FDI inflows remains
significant (Figure 1) [2].
Figure following on the next page
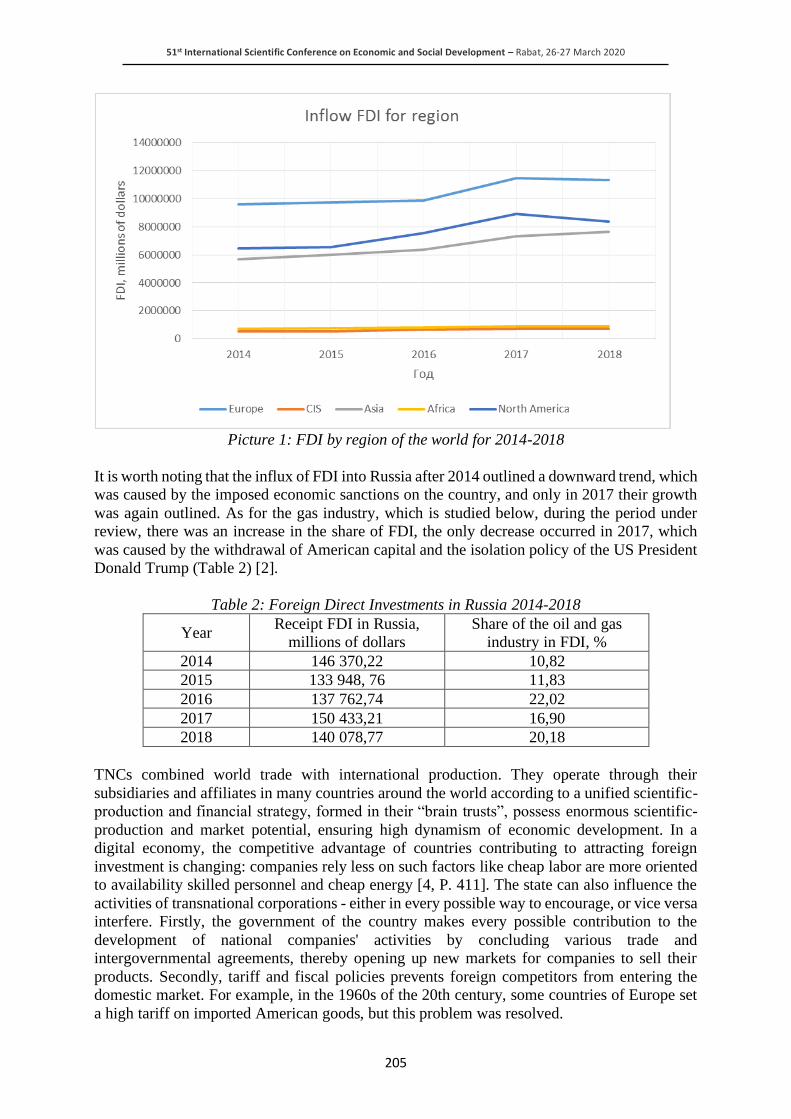
51st International Scientific Conference on Economic and Social Development – Rabat, 26-27 March 2020
205
Picture 1: FDI by region of the world for 2014-2018
It is worth noting that the influx of FDI into Russia after 2014 outlined a downward trend, which
was caused by the imposed economic sanctions on the country, and only in 2017 their growth
was again outlined. As for the gas industry, which is studied below, during the period under
review, there was an increase in the share of FDI, the only decrease occurred in 2017, which
was caused by the withdrawal of American capital and the isolation policy of the US President
Donald Trump (Table 2) [2].
Table 2: Foreign Direct Investments in Russia 2014-2018
Year Receipt FDI in Russia,
millions of dollars
Share of the oil and gas
industry in FDI, %
2014 146 370,22 10,82
2015 133 948, 76 11,83
2016 137 762,74 22,02
2017 150 433,21 16,90
2018 140 078,77 20,18
TNCs combined world trade with international production. They operate through their
subsidiaries and affiliates in many countries around the world according to a unified scientific-
production and financial strategy, formed in their “brain trusts”, possess enormous scientific-
production and market potential, ensuring high dynamism of economic development. In a
digital economy, the competitive advantage of countries contributing to attracting foreign
investment is changing: companies rely less on such factors like cheap labor are more oriented
to availability skilled personnel and cheap energy [4, P. 411]. The state can also influence the
activities of transnational corporations - either in every possible way to encourage, or vice versa
interfere. Firstly, the government of the country makes every possible contribution to the
development of national companies' activities by concluding various trade and
intergovernmental agreements, thereby opening up new markets for companies to sell their
products. Secondly, tariff and fiscal policies prevents foreign competitors from entering the
domestic market. For example, in the 1960s of the 20th century, some countries of Europe set
a high tariff on imported American goods, but this problem was resolved.

51st International Scientific Conference on Economic and Social Development – Rabat, 26-27 March 2020
206
American TNCs simply built their finished goods factories in the EU. A similar situation
developed at the same time between Japan and the United States, the so-called "car wars". All
attempts to block the entry into the American market with the help of customs duties on
Japanese cars only contributed to the construction of Japanese plants in the United States. It is
quite important to mention that the first Japanese automobile company to go this way was
Honda [1]. Thus, the presence of TNCs makes national companies pay more attention to the
technological process of production, production relations, product quality, and finance the
advanced training of their employees [9]. For example, Russian TNCs' corporate social policy
makes an important contribution to economic development in by providing high-quality
educational, medical and other services to its employees and by implementing programs, the
business creates high educational and social patterns and consumption standards that are
transmitted through employees and members of their families to society.[10, P. 242] All this
contributes to the new types of products and technologies development, the introduction of new
management styles. Most importantly, as a result of the TNCs’ activities, institutions are
imported (both formal and informal) - those “game's rules” (labor and antitrust laws, tax
principles, contracting practices, etc.) that have been formed in developed countries [7]. TNCs
objectively strengthen the influence of countries exporting capital on countries importing it. As
an example, we can cite the situation that developed in the Czech Republic in the 90s of the last
century. German companies actually established control over the Czech economy, make it
"stronger" compared to even the time of the fascist Germany capturing in 1938-1944 [6]. Since
transnationalization increases both the average profit and the reliability of its receipt, holders
of TNC shares can count on high and stable incomes. Highly skilled workers serving at TNK
enterprises benefit from the formation of the global labor market by moving from country to
country and not being afraid to remain without work. Transnationalization reduces economic
risks for corporations, but increases them for host countries. The fact is that transnational
corporations can quite easily transfer their capital between countries, leaving a country
experiencing economic difficulties and leaving for more prosperous ones. Naturally, under
these conditions, the situation in the country from which TNCs abruptly withdraw their capital
becomes even more difficult, since disinvestment (mass withdrawal of capital) leads to
unemployment and other negative phenomena for the national economy. Host countries are
inclined to believe that profits earned by multinationals are excessively large. Receiving taxes
from TNCs, they are convinced that they could receive much more if transnational corporations
did not declare their profits in countries with low taxation. The same opinion about TNCs as
“negligent taxpayers” is often shared by the tax authorities of the “parent countries”. The fact
is that a significant share of international trade (about 30%) consists of intra-company flows of
TNCs, and the goods and services sale of one TNC unit to another is often carried out not at
world prices but at conditional intra-company transfer ones. These prices can be deliberately
understated or overstated in order, for example, to divert profits from countries with high taxes
and transfer them to countries with liberal taxation. In addition to tax losses, countries exporting
capital, with the development of transnational corporations, lose control over the activities of
big business. TNCs often put their interests above the interests of their country, and in crisis
situations, TNCs easily “change their face”.
3. INNOVATIVE DEVELOPMENT ON THE EXAMPLE OF THE RUSSIAN PJSC
GAZPROM
Currently, more and more Russian companies are approaching the concept of "transnational
corporations." Of course, they are not so large-scale in their structure and large in degree of
influence, and also do not have a large spread by types of industries, unlike their foreign
“colleagues”. According to the version of Fortune Global 500, only four Russian corporations
occupying 49, 63, 115 and 205 places in the list formed by them.

51st International Scientific Conference on Economic and Social Development – Rabat, 26-27 March 2020
207
They are: PJSC Gazprom (almost 112 billion dollars), PJSC NK Lukoil (93 billion dollars),
PJSC Rosneft (72 billion dollars) and PJSC Sberbank (49 billion dollars), respectively. [5]
Russian TNCs are characterized by one sector of the economy in which they occupy leading
positions, while many domestic corporations belong to the primary industries. One of such
TNCs can rightfully be considered PJSC Gazprom. Let us analyze the innovative activity of the
company over the past five years. To do this, we collect and systematize information from the
financial statements of the company. Based on the information collected, we calculate the
indicators of enterprise innovative activity of the (Table 3). These indicators are characterized
by a high degree of accuracy and a minimum number of influencing subjective factors, since
they are calculated on the basis of official and constantly updated data of the financial
statements of the enterprise. Due to the fact that indicators are calculated by year for the period
under consideration, it is also necessary to calculate the average value of each indicator for the
analyzed period.
Table 3: Indicators of innovative activity of PJSC Gazprom 2014 - 2018
Year
The new
technologies'
level
development
The new
products'
degree
development
The share of
material
resources for
research and
development
The degree of
company's
provision
with
intellectual
property
The share of
investment
in
innovative
projects
2014 0,01 0,01 0,05 0,17 0,23
2015 0,01 0,09 0,17 0,65 0,36
2016 0,01 - 0,09 0,03 0,97 0,17
2017 0,01 0,10 0,04 0,72 0,27
2018 0,01 0,20 0,04 0,77 0,22
Среднее 0,01 0,06 0,07 0,66 0,25
For the direct calculation of the integral indicator of company's innovative development it is
necessary to assign weighting factors in accordance with the importance and influence of
indicators on the final indicator. The sum of the weighting factors of all indicators should not
exceed one. To assign weighting factors when calculating the integral indicator of innovative
development of PJSC Gazprom, an expert method was chosen (Table 4).
Table 4: Weighting factors for calculating the integral indicator
Indicators Weight Ratio
The new technologies' level development 0,2125
The new products' degree development 0,125
The share of material resources for research and development
0,1
The degree of company's provision with
intellectual property 0,1875
The share of investment in innovative
projects 0,375
Total 1
We calculate the integral indicator of the company's innovative development, using the average
values of indicators for the period under review and the assigned weight coefficients.
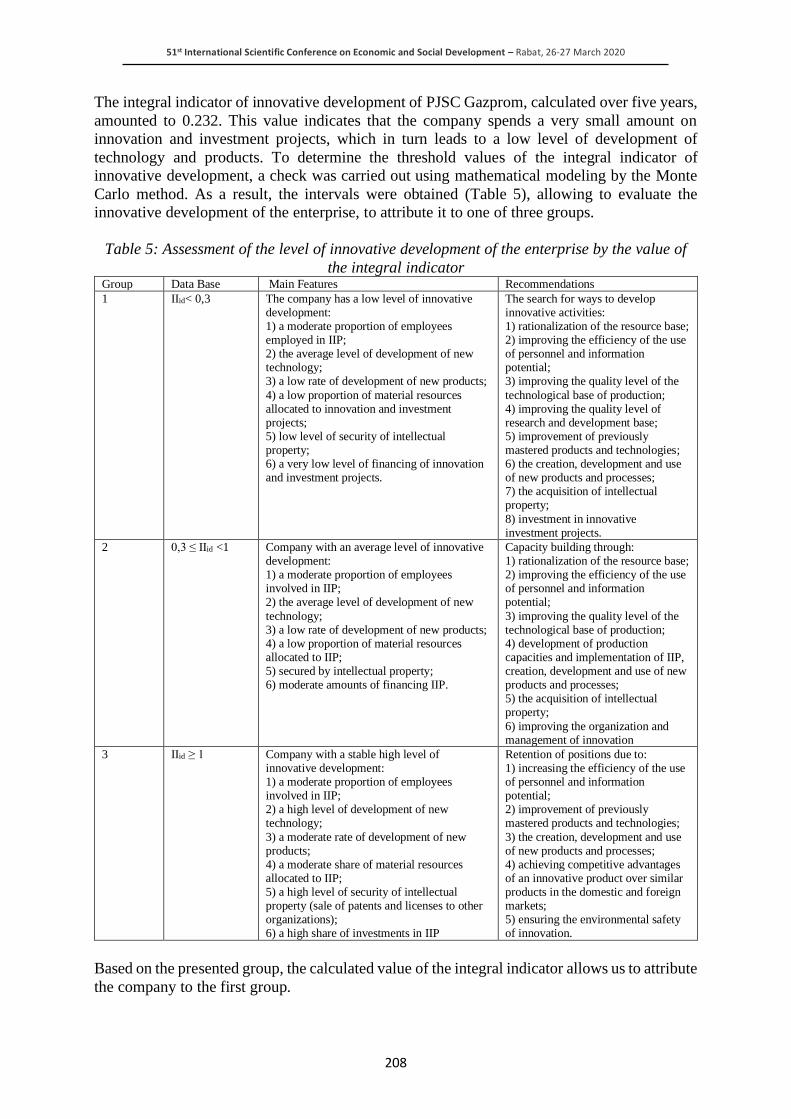
51st International Scientific Conference on Economic and Social Development – Rabat, 26-27 March 2020
208
The integral indicator of innovative development of PJSC Gazprom, calculated over five years,
amounted to 0.232. This value indicates that the company spends a very small amount on
innovation and investment projects, which in turn leads to a low level of development of
technology and products. To determine the threshold values of the integral indicator of
innovative development, a check was carried out using mathematical modeling by the Monte
Carlo method. As a result, the intervals were obtained (Table 5), allowing to evaluate the
innovative development of the enterprise, to attribute it to one of three groups.
Table 5: Assessment of the level of innovative development of the enterprise by the value of
the integral indicator Group Data Base Main Features Recommendations
1 IIid< 0,3 The company has a low level of innovative development: 1) a moderate proportion of employees employed in IIP; 2) the average level of development of new technology; 3) a low rate of development of new products;
4) a low proportion of material resources allocated to innovation and investment projects; 5) low level of security of intellectual property; 6) a very low level of financing of innovation and investment projects.
The search for ways to develop innovative activities: 1) rationalization of the resource base; 2) improving the efficiency of the use of personnel and information potential; 3) improving the quality level of the
technological base of production; 4) improving the quality level of research and development base; 5) improvement of previously mastered products and technologies; 6) the creation, development and use of new products and processes; 7) the acquisition of intellectual property;
8) investment in innovative investment projects.
2 0,3 ≤ IIid <1 Company with an average level of innovative development: 1) a moderate proportion of employees involved in IIP; 2) the average level of development of new
technology; 3) a low rate of development of new products; 4) a low proportion of material resources allocated to IIP; 5) secured by intellectual property; 6) moderate amounts of financing IIP.
Capacity building through: 1) rationalization of the resource base; 2) improving the efficiency of the use of personnel and information potential;
3) improving the quality level of the technological base of production; 4) development of production capacities and implementation of IIP, creation, development and use of new products and processes; 5) the acquisition of intellectual property;
6) improving the organization and management of innovation
3 IIid ≥ 1 Company with a stable high level of innovative development: 1) a moderate proportion of employees involved in IIP; 2) a high level of development of new technology;
3) a moderate rate of development of new products; 4) a moderate share of material resources allocated to IIP; 5) a high level of security of intellectual property (sale of patents and licenses to other organizations); 6) a high share of investments in IIP
Retention of positions due to: 1) increasing the efficiency of the use of personnel and information potential; 2) improvement of previously mastered products and technologies;
3) the creation, development and use of new products and processes; 4) achieving competitive advantages of an innovative product over similar products in the domestic and foreign markets; 5) ensuring the environmental safety of innovation.
Based on the presented group, the calculated value of the integral indicator allows us to attribute
the company to the first group.

51st International Scientific Conference on Economic and Social Development – Rabat, 26-27 March 2020
209
4. CONCLUSION
It is worth noting that TNCs, being an active participant in the global economy, contribute to
the regulation of international economic relations, are leading in terms of investment, research
and patents, and also have great potential for influence on government and international
structures due to the large transnationalization and amount of resources. However, Russian
companies, in particular, PJSC Gazprom, prefer to use foreign equipment and technologies,
rather than create their own. It is also worth noting the lack of effectiveness of the current
Russian legislation governing company's innovation activity; the high cost of introducing and
mastering innovations; long-term innovation investments; lack of a modern technological base
for the introducing of developments; lack of qualified personnel capable to manage effectively
the innovation process at the company level; the need for the company to have an appropriate
organizational structure for managing promising technological development necessary for the
effective coordination of innovation; difficulties with an innovative product making marketing
research in an unstable domestic economic situation. Along with these measures, it is necessary
to strengthen antitrust control of TNCs [3].
LITERATURE:
1. Bodyienkova V.S., Desyatnichenko D.Y., Kondyukova E.S. The influence of transnational
corporations on the world economy. Economic relations. - 2017. – Vol. 7. - No. 3. - P. 269-
278.
2. Central Bank of Russia, official website [Electronic document] URL:
https://www.cbr.ru/statistics/macro_itm/svs/
3. Chirikhin S.N., Sysoeva L.I. Behavioral approach to the analysis of the state of competition
in commodity markets. Bulletin of NSUEM. - 2017. - No. 3. - P. 311-328.
4. Efremov V.S., Vladimirova I.G. International companies: the scope, structure and
development trends. Economics: yesterday, today, tomorrow. 2018. Vol. 8. No. 10 A. - P.
400-412.
5. Fortune Global 500 Official Website [Electronic Document] URL:
https://fortune.com/global500/
6. Kalugina N.N., Mikhailov A.B., Ilyina E.V. The place of TNCs in the world economy and
the need for state regulation of their activities. Russian Journal of Entrepreneurship. - 2010.
– Vol. 11. - No. 3. - P. 17-23.
7. Kovtun O.I., Angelskaya E.A. Institutional approach in world trade: the role and importance
of informal institutions. Center for Innovative Technologies and Social Expertise -2019. -
No. 4 (1). -P. 355-368.
8. Lensky E. V., Tsvetkov V. A. Transnational financial-industrial groups and interstate
economic integration: reality and prospects. M.: AFP Weekly "Economics and Life", 1998.
- P. 266.
9. Maximov I.O., Filatov S.A., Kovtun O.I. The interaction of domestic TNCs and socio-
economic systems of Russian society: an aspect of a social contract. Management Issues.
2017. No5 (48). - P. 67-76.
10. Maximov I., Kotun O., Ivanenko M. The role of corporations’ social contracts in the
Russian society development. Economic and Social development: 49th International
Scientific Conference on Economic and Social development. - “Building Resillient Society”
/ Book of Proceedings. - Zagreb, December 13-14, 2019. - P. 236-243.
11. Mykhailyshyn L.I., Svirskyi V.S. Current trends of transnationalization of economic
activity: innovative aspect. Marketing and management of innovations. – Vol. 2. – 2017. –
P. 204-210.

51st International Scientific Conference on Economic and Social Development – Rabat, 26-27 March 2020
210
12. Nawan A., Intarahumnerd P. Interaction between host countries’ innovative systems and
investment strategies of transnational corporations: a case-study of US-based conglomerate.
Institutions and Economics. No 5(2) – P. 131-154.
13. UNCTAD, Official Website [Electronic Document] URL:
https://unctad.org/en/Pages/Home.aspx
14. Ulyanov A.O. Influence of transnational corporations on the development of innovations in
the global economy. Baikal Research Journal. 2013. No5. - P. 19-26.
15. World Investment Report 2015. Transnational Corporations and the Internationalization of
R&D / United Nations. New York; Geneva, 2015. - P. 1-6.
16. Yashin S.N., Schekoturova S.D. Application of the methodology for assessing the
effectiveness of innovative development of an enterprise using the example of PJSC
Ruspolimet. Finance and Credit. 2016. No47 (719). - P. 27-46
51st International Scientific Conference on Economic and Social Development – Rabat, 26-27 March 2020
211
THE APPLICATION GIS AND REMOTE SENSING DATA TO THE
DEVELOPMENT OF A MULTISCALE SOIL INFORMATION SYSTEM
Anna Pavlova
Novosibirsk State University of Economics and Management, Russia
Siberian Federal Scientific Center for Agrobiotechnology, Russia
ABSTRACT
Today an ever more active development of technologies to obtain, store, process and provide
information about soil resources using geographic information systems and remote sensing
data. Time series of remote sensing data can be created to monitor changes in landscapes at
local to regional scales. Land-cover change detection techniques are based on the comparison
of sequential land cover maps derived from remote sensing data or other sources for the same
area. For every sampling unit of the maps, the land cover categories at the two dates are
compared. Application areas of remote sensing are very wide in the Earth environmental
monitoring and process studies of the Earth systems into atmosphere, ocean, soils, land use.
The best known are SOTER, EUROPEAN SOIL DATABASE, Canadian SOIL INFORMATION
SERVICE (CANSIS). The Soil Geographic Database of Russia contains the Geographic
Database and Specialized Attributive Database. Than system was realized on two levels
(coverages) (the Soil Map of the RSFSR on a scale of 1: 2.5 M; COVERAGE 2 is the digital
map of the administrative division of Russia at a scale of 1: 1 M). On these soil maps the
contours are strongly generalized. Regional soil information system need to be developed. In
article we offered the multiscale soil geographic information system developed on the example
of the Novosibirsk region. This system contains a geodatabase and a soil attributive database,
using a variety of sources: cartographic maps and literature, field data, as well as remote
sensing data - Sentinel 2, Landsat 8, aerial images from unmanned aerial vehicle. Geodatabase
developed with GIS ArcGIS 10.6.
Keywords: soil database, remote sensing data, geodatabase, land assessment, geographic
information systems
1. INTRODUCTION
Global and national soil-geographic information systems for soil resource assessment and
management, agroecological zoning and sustainable land management are being actively
developed. World Food and Agriculture Organization of the United Nations [1-3]. The joint
work of FAO and UNESCO resulted in the development of the first global soil database, which
was used to monitor climate change, address food challenges and study soil degradation. At the
same time this card had the small scale 1:5000000 (1:5 million scale), contained the description
on 4931 soil to contours and combinations of various types of soils (4331 mapping units
consisting of soil associations, with are mixstures of different soil types). However, the small
scale of such a map does not allow it to be used for management decisions of agricultural
enterprises (but low resolution ot this map is not sustainable for land management decisions at
field). This map has been used for expert assessment of the degree of soil degradation, later
referred to as the GLASOD Map. The GLASOD Map also had a fine scale (1:10 million scale).
The modern version of the digital soil map of the world GlobalSoilMap .net is presented as a
GRID model, has a higher spatial resolution of 90 m (a grid resolution of 90 by 90 m). This
map is used for digital soil mapping and for modelling and predicting changes in soil properties
[4]. A number of countries have established new types of national soil information networks.
A distinctive feature of such systems is the integration of various data sources obtained from
remote sensors, field measurements, Internet resources, cartographic sources, etc.
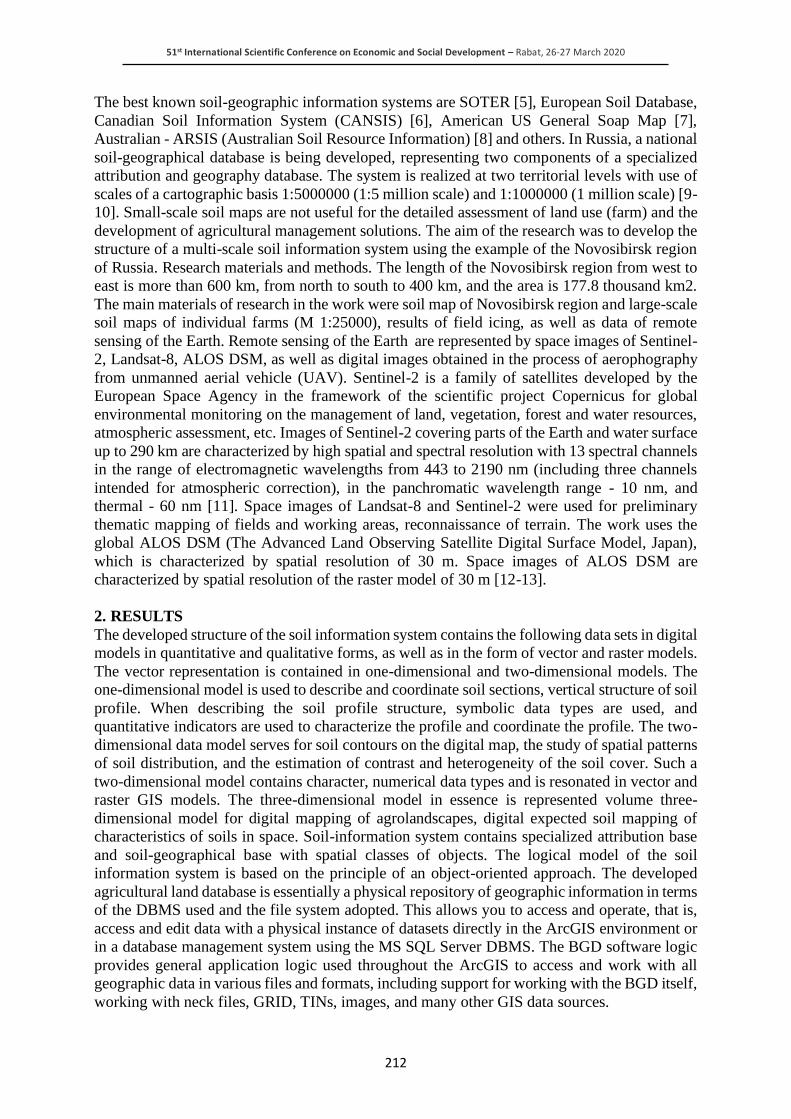
51st International Scientific Conference on Economic and Social Development – Rabat, 26-27 March 2020
212
The best known soil-geographic information systems are SOTER [5], European Soil Database,
Canadian Soil Information System (CANSIS) [6], American US General Soap Map [7],
Australian - ARSIS (Australian Soil Resource Information) [8] and others. In Russia, a national
soil-geographical database is being developed, representing two components of a specialized
attribution and geography database. The system is realized at two territorial levels with use of
scales of a cartographic basis 1:5000000 (1:5 million scale) and 1:1000000 (1 million scale) [9-
10]. Small-scale soil maps are not useful for the detailed assessment of land use (farm) and the
development of agricultural management solutions. The aim of the research was to develop the
structure of a multi-scale soil information system using the example of the Novosibirsk region
of Russia. Research materials and methods. The length of the Novosibirsk region from west to
east is more than 600 km, from north to south to 400 km, and the area is 177.8 thousand km2.
The main materials of research in the work were soil map of Novosibirsk region and large-scale
soil maps of individual farms (M 1:25000), results of field icing, as well as data of remote
sensing of the Earth. Remote sensing of the Earth are represented by space images of Sentinel-
2, Landsat-8, ALOS DSM, as well as digital images obtained in the process of aerophography
from unmanned aerial vehicle (UAV). Sentinel-2 is a family of satellites developed by the
European Space Agency in the framework of the scientific project Сopernicus for global
environmental monitoring on the management of land, vegetation, forest and water resources,
atmospheric assessment, etc. Images of Sentinel-2 covering parts of the Earth and water surface
up to 290 km are characterized by high spatial and spectral resolution with 13 spectral channels
in the range of electromagnetic wavelengths from 443 to 2190 nm (including three channels
intended for atmospheric correction), in the panchromatic wavelength range - 10 nm, and
thermal - 60 nm [11]. Space images of Landsat-8 and Sentinel-2 were used for preliminary
thematic mapping of fields and working areas, reconnaissance of terrain. The work uses the
global ALOS DSM (The Advanced Land Observing Satellite Digital Surface Model, Japan),
which is characterized by spatial resolution of 30 m. Space images of ALOS DSM are
characterized by spatial resolution of the raster model of 30 m [12-13].
2. RESULTS
The developed structure of the soil information system contains the following data sets in digital
models in quantitative and qualitative forms, as well as in the form of vector and raster models.
The vector representation is contained in one-dimensional and two-dimensional models. The
one-dimensional model is used to describe and coordinate soil sections, vertical structure of soil
profile. When describing the soil profile structure, symbolic data types are used, and
quantitative indicators are used to characterize the profile and coordinate the profile. The two-
dimensional data model serves for soil contours on the digital map, the study of spatial patterns
of soil distribution, and the estimation of contrast and heterogeneity of the soil cover. Such a
two-dimensional model contains character, numerical data types and is resonated in vector and
raster GIS models. The three-dimensional model in essence is represented volume three-
dimensional model for digital mapping of agrolandscapes, digital expected soil mapping of
characteristics of soils in space. Soil-information system contains specialized attribution base
and soil-geographical base with spatial classes of objects. The logical model of the soil
information system is based on the principle of an object-oriented approach. The developed
agricultural land database is essentially a physical repository of geographic information in terms
of the DBMS used and the file system adopted. This allows you to access and operate, that is,
access and edit data with a physical instance of datasets directly in the ArcGIS environment or
in a database management system using the MS SQL Server DBMS. The BGD software logic
provides general application logic used throughout the ArcGIS to access and work with all
geographic data in various files and formats, including support for working with the BGD itself,
working with neck files, GRID, TINs, images, and many other GIS data sources.
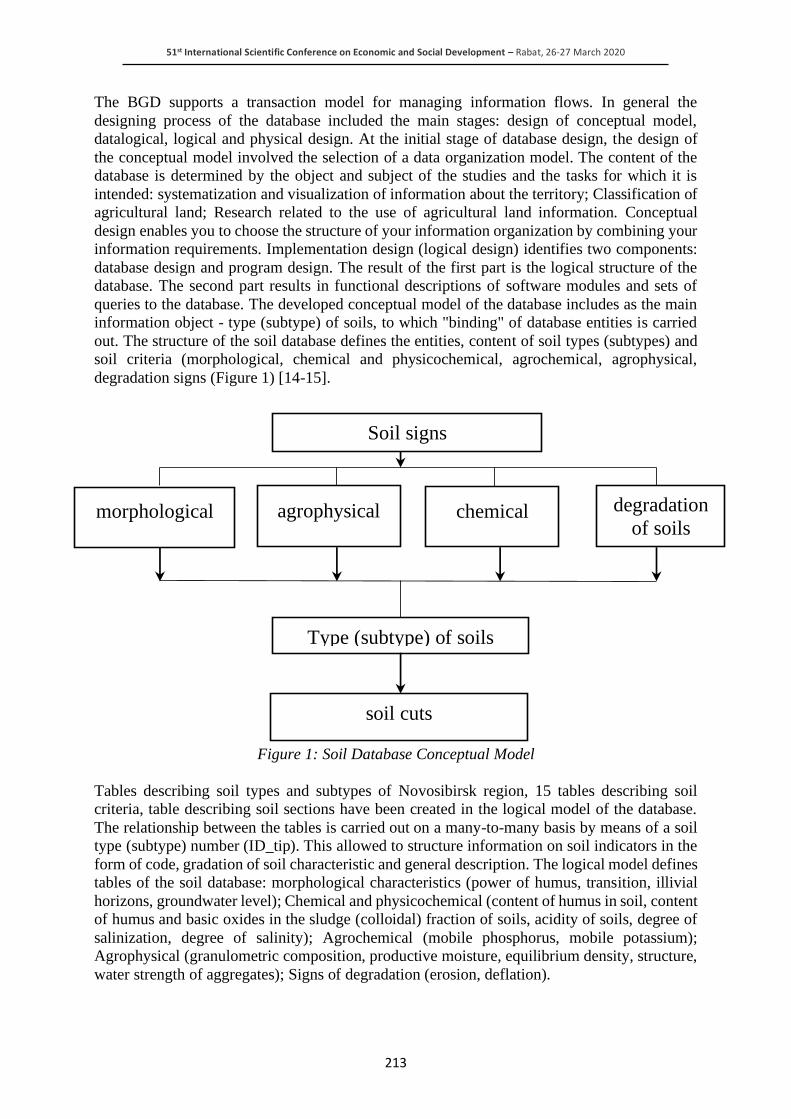
51st International Scientific Conference on Economic and Social Development – Rabat, 26-27 March 2020
213
The BGD supports a transaction model for managing information flows. In general the
designing process of the database included the main stages: design of conceptual model,
datalogical, logical and physical design. At the initial stage of database design, the design of
the conceptual model involved the selection of a data organization model. The content of the
database is determined by the object and subject of the studies and the tasks for which it is
intended: systematization and visualization of information about the territory; Classification of
agricultural land; Research related to the use of agricultural land information. Conceptual
design enables you to choose the structure of your information organization by combining your
information requirements. Implementation design (logical design) identifies two components:
database design and program design. The result of the first part is the logical structure of the
database. The second part results in functional descriptions of software modules and sets of
queries to the database. The developed conceptual model of the database includes as the main
information object - type (subtype) of soils, to which "binding" of database entities is carried
out. The structure of the soil database defines the entities, content of soil types (subtypes) and
soil criteria (morphological, chemical and physicochemical, agrochemical, agrophysical,
degradation signs (Figure 1) [14-15].
Figure 1: Soil Database Conceptual Model
Tables describing soil types and subtypes of Novosibirsk region, 15 tables describing soil
criteria, table describing soil sections have been created in the logical model of the database.
The relationship between the tables is carried out on a many-to-many basis by means of a soil
type (subtype) number (ID_tip). This allowed to structure information on soil indicators in the
form of code, gradation of soil characteristic and general description. The logical model defines
tables of the soil database: morphological characteristics (power of humus, transition, illivial
horizons, groundwater level); Chemical and physicochemical (content of humus in soil, content
of humus and basic oxides in the sludge (colloidal) fraction of soils, acidity of soils, degree of
salinization, degree of salinity); Agrochemical (mobile phosphorus, mobile potassium);
Agrophysical (granulometric composition, productive moisture, equilibrium density, structure,
water strength of aggregates); Signs of degradation (erosion, deflation).
soil cuts
agrophysical
Type (subtype) of soils
degradation
of soils
Soil signs
morphological chemical

51st International Scientific Conference on Economic and Social Development – Rabat, 26-27 March 2020
214
Fugure 2: Logical Database Model
Figure 3: Soil Criteria Tables in a Specialized Soil Database
The soil-geographical database will burn sets of spatial classes of objects: soils of the region,
soils of the farm, soil sections, field observations (content of mobile elements of phosphorus,
potassium and reserves of productive moisture).
Figure following on the next page
Таблица Power ID … ID_tip
Таблица Goriz ID … ID_tip
Table Gran ID Code Gradation Criterion ID_tip Note
Table Glina ID …
ID_tip
Table рН
ID
…
ID tip
Table
bulk
ID
Table ID
…
ID_tip
Table ID
…
ID tip
ТаблицаMoisture
ID
…
ID tip
ТаблицаMoisture
ID
…
ID_tip
Table Moisture
ID
…
ID tip
Table Phosphorus
ID
…
ID_tip
Table Moisture
ID
…
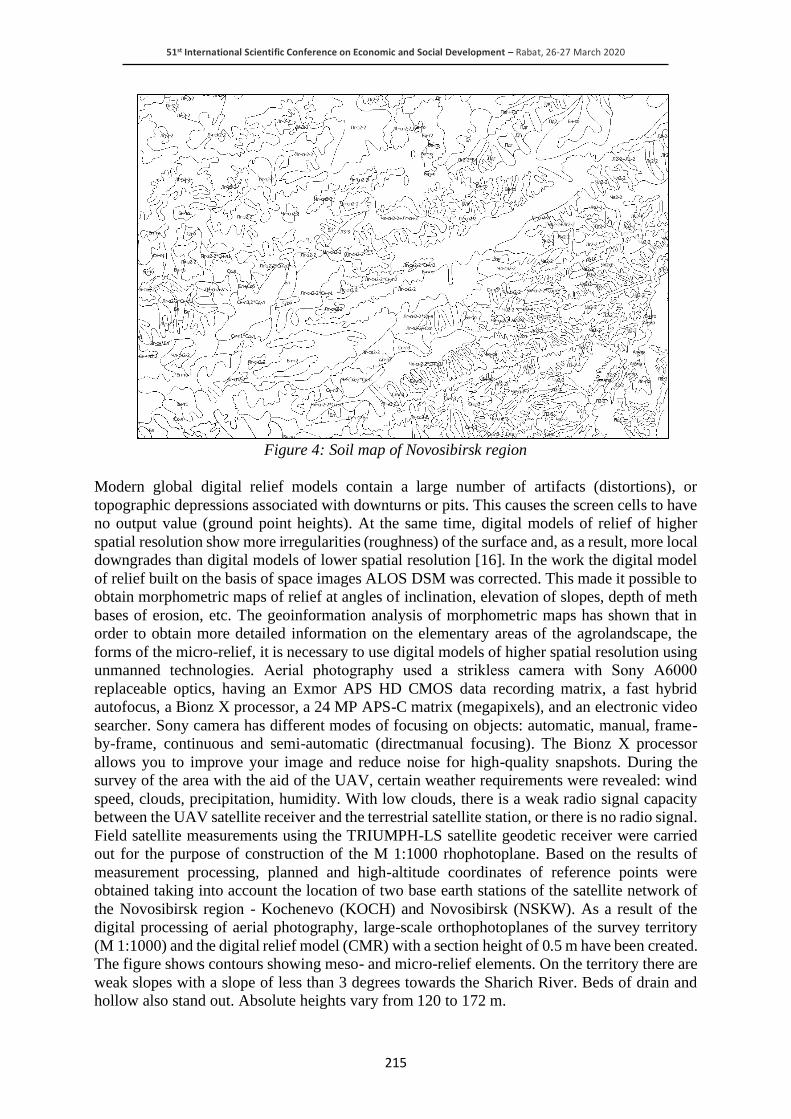
51st International Scientific Conference on Economic and Social Development – Rabat, 26-27 March 2020
215
Figure 4: Soil map of Novosibirsk region
Modern global digital relief models contain a large number of artifacts (distortions), or
topographic depressions associated with downturns or pits. This causes the screen cells to have
no output value (ground point heights). At the same time, digital models of relief of higher
spatial resolution show more irregularities (roughness) of the surface and, as a result, more local
downgrades than digital models of lower spatial resolution [16]. In the work the digital model
of relief built on the basis of space images ALOS DSM was corrected. This made it possible to
obtain morphometric maps of relief at angles of inclination, elevation of slopes, depth of meth
bases of erosion, etc. The geoinformation analysis of morphometric maps has shown that in
order to obtain more detailed information on the elementary areas of the agrolandscape, the
forms of the micro-relief, it is necessary to use digital models of higher spatial resolution using
unmanned technologies. Aerial photography used a strikless camera with Sony А6000
replaceable optics, having an Exmor APS HD CMOS data recording matrix, a fast hybrid
autofocus, a Bionz X processor, a 24 MP APS-C matrix (megapixels), and an electronic video
searcher. Sony camera has different modes of focusing on objects: automatic, manual, frame-
by-frame, continuous and semi-automatic (directmanual focusing). The Bionz X processor
allows you to improve your image and reduce noise for high-quality snapshots. During the
survey of the area with the aid of the UAV, certain weather requirements were revealed: wind
speed, clouds, precipitation, humidity. With low clouds, there is a weak radio signal capacity
between the UAV satellite receiver and the terrestrial satellite station, or there is no radio signal.
Field satellite measurements using the TRIUMPH-LS satellite geodetic receiver were carried
out for the purpose of construction of the M 1:1000 rhophotoplane. Based on the results of
measurement processing, planned and high-altitude coordinates of reference points were
obtained taking into account the location of two base earth stations of the satellite network of
the Novosibirsk region - Kochenevo (KOCH) and Novosibirsk (NSKW). As a result of the
digital processing of aerial photography, large-scale orthophotoplanes of the survey territory
(M 1:1000) and the digital relief model (CMR) with a section height of 0.5 m have been created.
The figure shows contours showing meso- and micro-relief elements. On the territory there are
weak slopes with a slope of less than 3 degrees towards the Sharich River. Beds of drain and
hollow also stand out. Absolute heights vary from 120 to 172 m.
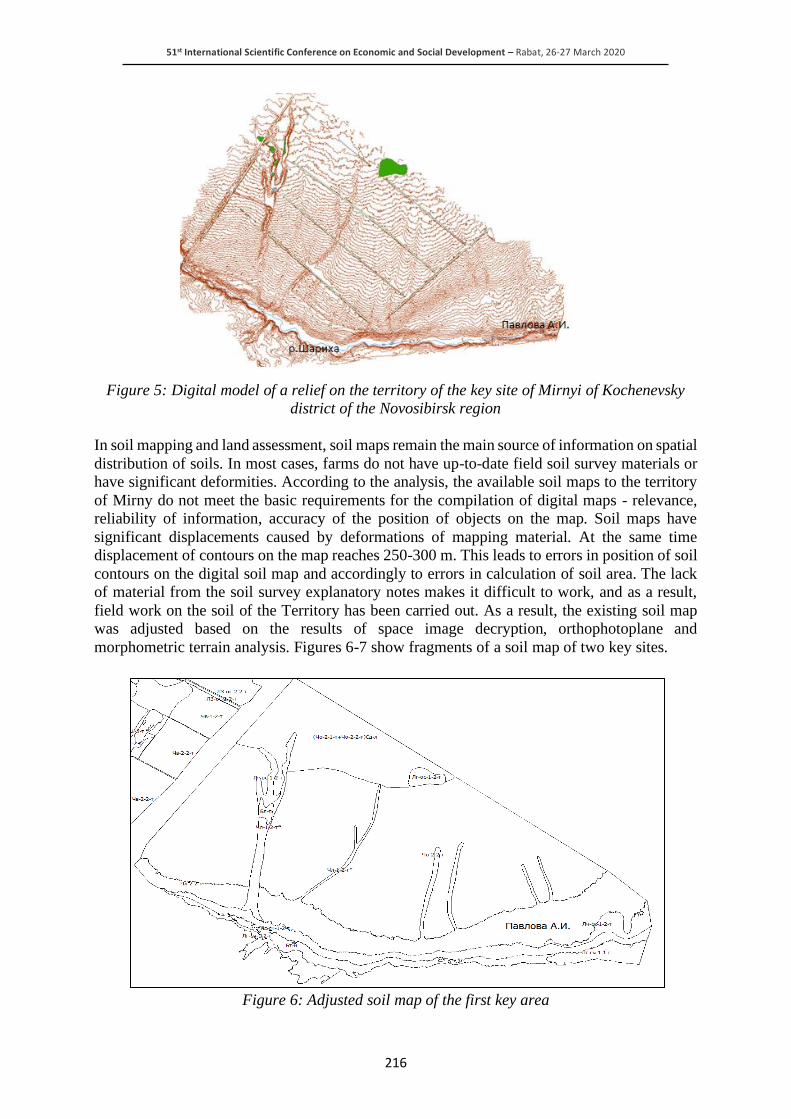
51st International Scientific Conference on Economic and Social Development – Rabat, 26-27 March 2020
216
Figure 5: Digital model of a relief on the territory of the key site of Mirnyi of Kochenevsky
district of the Novosibirsk region
In soil mapping and land assessment, soil maps remain the main source of information on spatial
distribution of soils. In most cases, farms do not have up-to-date field soil survey materials or
have significant deformities. According to the analysis, the available soil maps to the territory
of Mirny do not meet the basic requirements for the compilation of digital maps - relevance,
reliability of information, accuracy of the position of objects on the map. Soil maps have
significant displacements caused by deformations of mapping material. At the same time
displacement of contours on the map reaches 250-300 m. This leads to errors in position of soil
contours on the digital soil map and accordingly to errors in calculation of soil area. The lack
of material from the soil survey explanatory notes makes it difficult to work, and as a result,
field work on the soil of the Territory has been carried out. As a result, the existing soil map
was adjusted based on the results of space image decryption, orthophotoplane and
morphometric terrain analysis. Figures 6-7 show fragments of a soil map of two key sites.
Figure 6: Adjusted soil map of the first key area
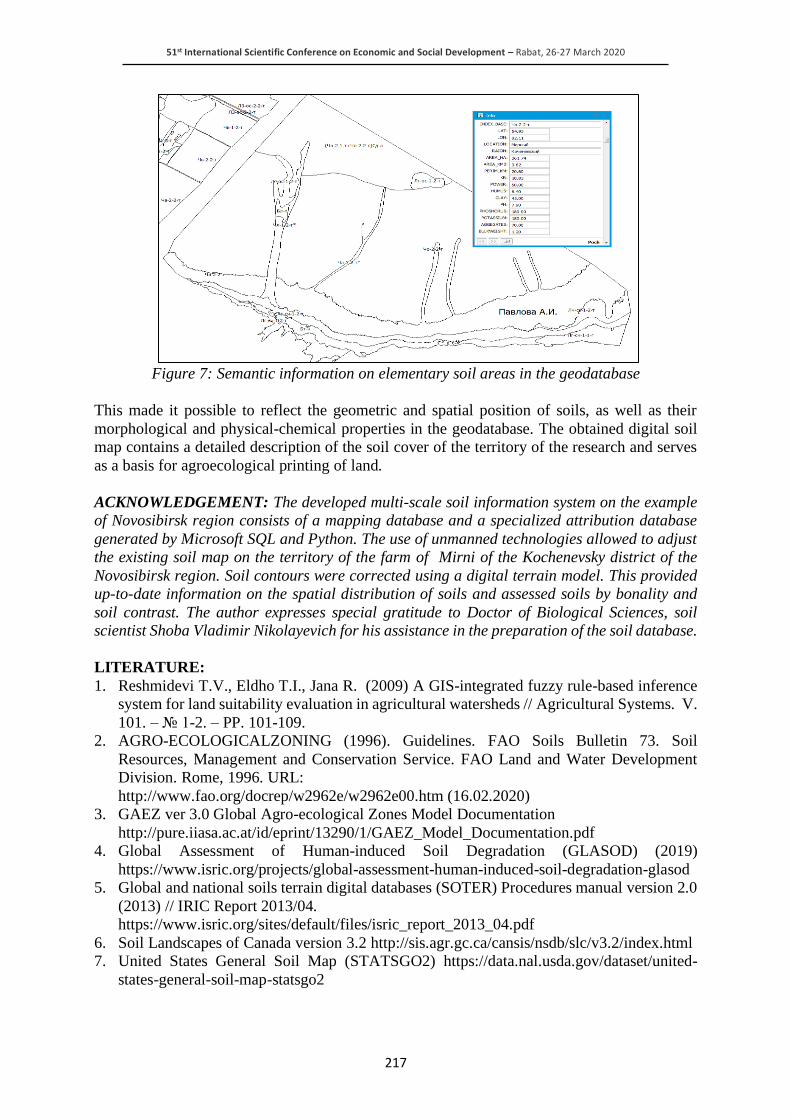
51st International Scientific Conference on Economic and Social Development – Rabat, 26-27 March 2020
217
Figure 7: Semantic information on elementary soil areas in the geodatabase
This made it possible to reflect the geometric and spatial position of soils, as well as their
morphological and physical-chemical properties in the geodatabase. The obtained digital soil
map contains a detailed description of the soil cover of the territory of the research and serves
as a basis for agroecological printing of land.
ACKNOWLEDGEMENT: The developed multi-scale soil information system on the example
of Novosibirsk region consists of a mapping database and a specialized attribution database
generated by Microsoft SQL and Python. The use of unmanned technologies allowed to adjust
the existing soil map on the territory of the farm of Mirni of the Kochenevsky district of the
Novosibirsk region. Soil contours were corrected using a digital terrain model. This provided
up-to-date information on the spatial distribution of soils and assessed soils by bonality and
soil contrast. The author expresses special gratitude to Doctor of Biological Sciences, soil
scientist Shoba Vladimir Nikolayevich for his assistance in the preparation of the soil database.
LITERATURE:
1. Reshmidevi T.V., Eldho T.I., Jana R. (2009) A GIS-integrated fuzzy rule-based inference
system for land suitability evaluation in agricultural watersheds // Agricultural Systems. V.
101. – № 1-2. – PP. 101-109.
2. AGRO-ECOLOGICALZONING (1996). Guidelines. FAO Soils Bulletin 73. Soil
Resources, Management and Conservation Service. FAO Land and Water Development
Division. Rome, 1996. URL:
http://www.fao.org/docrep/w2962e/w2962e00.htm (16.02.2020)
3. GAEZ ver 3.0 Global Agro-ecological Zones Model Documentation
http://pure.iiasa.ac.at/id/eprint/13290/1/GAEZ_Model_Documentation.pdf
4. Global Assessment of Human-induced Soil Degradation (GLASOD) (2019)
https://www.isric.org/projects/global-assessment-human-induced-soil-degradation-glasod
5. Global and national soils terrain digital databases (SOTER) Procedures manual version 2.0
(2013) // IRIC Report 2013/04.
https://www.isric.org/sites/default/files/isric_report_2013_04.pdf
6. Soil Landscapes of Canada version 3.2 http://sis.agr.gc.ca/cansis/nsdb/slc/v3.2/index.html
7. United States General Soil Map (STATSGO2) https://data.nal.usda.gov/dataset/united-
states-general-soil-map-statsgo2
51st International Scientific Conference on Economic and Social Development – Rabat, 26-27 March 2020
218
8. Soil and Landscape Grid of Australia
//https://www.clw.csiro.au/aclep/soilandlandscapegrid/ProductDetails-SoilAttributes.html
9. Soil-geographical database of Russia (2010) V.A. Rozhkov, I.O. Alyabina, V.M.
Kolesnikov, etc.//Soil science. № 1. - S. 3-6.
10. Technologies and Standards of Information System of Soil and Geographical Database of
Russia (2015) // O.M. Golozubov, V.A. Rozhkov, I.O. Alyabina, etc.//Soil Science. № 1. -
S. 3-13.
11. Sentinel-2. The operational Copernicus optical high resolution land mission. (2015) URL:
http://esamultimedia.esa.int/docs/s2-data_sheet.pdf (date of appeal 25.01.2020)
12. Precise Global DEM Generation By ALOS PRISM / T. Tadono, H. Ishida, F. Oda, S. Naito,
K. Minakawa, H. Iwamoto // ISPRS Annals of the Photogrammetry, Remote Sensing and
Spatial Information Sciences. Vol. II-4. P.71-76.
13. Validation of AW3D Global DSM Generated from ALOS PRISM (2016) / J. Takaku, T.
Tadono, K. Tsutsui K., M. Ichikawa // ISPRS Annals of the Photogrammetry, Remote
Sensing and Spatial Information Sciences / Vol.III-4. P.25-31
14. Pavlova A.I., Kalichkin V.K. Databases for Agroecological Land Assessment
(2018)//Siberian Journal of Agricultural Science. № 1. - Т.48. - P 80-88.
15. Creation of geodata bases for land assessment and grouping (2018) / VK.. Kalichkin, A.I.
Pavlova, V.N. Shoba, A.V. Kalichkin //State and prospects of scientific support of the
agricultural complex of Siberia: a collection of scientific articles dedicated to the 190th
anniversary of the experimental business in Siberia, the 100th anniversary of agricultural
science in Omsk Priirtyshand the 85 anniversary of EDUCATION. FSBNU "Omsky ANC"
- Omsk: Ed. IP Maksheva E.A.. - P 122-125.
16. Pavlova A.I., Pavlov A.V. (2018) Analysis of methods of correction of digital models of
relief built according to satellite data // Autometry. T.54. No. 5. Page 25 – 32.

51st International Scientific Conference on Economic and Social Development – Rabat, 26-27 March 2020
219
WILL FRESH GRADUATES EXPERIENCE DIFFERENT STYLES OF
MENTORING WHEN THEY ENTER LABOUR MARKET
Gabriela Kalinova
Slovak University of Technology in Bratislava
Vazovova 5, 811 07 Bratislava, Slovak Republic
ABSTRACT
People are different regarding their work engagement, inner motivation, professional
performance results. On other hand they behave very similar within specific roles regardless
of the type of organization they work for. Based on this phenomenon our paper is focused on
research of University and Industry interface, sustainable employability of engineering
graduates. A hypothesis was determined for this purpose: Both parties, University teachers and
corporate managers are using the same competences, communication patterns and kinds of
behaviour at the time they perform the role of mentor. Comparison came from two key premises
(1) Undergraduate engineering education is focused on student-centred learning and teaching
style, (2) Corporate development programs are consistent with Mentorship Pipeline strategy.
The research was carried out on one side at University of Technology in Bratislava and on
other side at international producer of clay blocks, facing bricks and clay roof tiles located in
Czech and Slovak Republic. Comparison analysis was realized inside the University was
through questionnaire survey. As a methodological basis was used European Mentoring &
Coaching Council competence categories further elaborated into list of Core Mentor’s
Competences appropriate to student-centred teaching environment. Survey was carried out in
cooperation with teachers from seven University’s faculties. Corporate philosophy regarding
the status of managers as mentors represents four core values, Competence Model and the HR
program “The Roadmap for Future Corporate Leaders”. To be able to confirm our hypothesis
the correlation with adapted EMCC mentors’ competences was accomplished. The intention
was to structure recommendation into three areas. (a) For University – systemic changes
toward teachers’ duties and responsibilities, measures of teaching performance, didactical
method, flexible schedule. (b) For company – proposal for redesign assessment criteria
regarding needed competences for future mentors. (c) For a common alignment University and
company – proposal for joint activities focused on target group of future mentors.
Keywords: Best-Place-to-Work, Mentorship, Student-Centred Learning, University-Industry
Alignment
1. INTRODUCTION
University and corporate interface, strong, lasting relationship based on mutual benefits and
collaboration focused on synergy of values for both organisations significantly determine
sustainable work employability of engineering graduates, how successful they enter the labour
market. The be able to analyse the level of mentorship-oriented interface between these both
organizations it was necessary to find out the compliances and diversities of characteristics.
The Table 1 bellow shows the results of a comparison of these characteristics:
• HR principles and rules
• Key competences
• Processes and programs
• Main focus/ strategy and tactics
• Formal versus informal approach
• Types of key initiatives/ events

51st International Scientific Conference on Economic and Social Development – Rabat, 26-27 March 2020
220
• Parties involved
• Time frame.
University Environment (Teacher/
doctorand in the role as mentor)
Corporate Environment (Manager/
employee in the role of mentor)
Reputation
Quality of curricula
Educational process
Focus on knowledge
Focus on personal life/ growth
Informal mentoring approach
On voluntary basis
Time formal: study period
Sustainable competitiveness
Corporate knowledge transfer
Product/ services and sales process
Focused on experience
Focused on career path
Formal mentoring approach
On corporate rules basis
Time frame: employment’s contract
Table 1: Characteristics of mentorship – oriented interface
People are different regarding their activities engagement, inner motivation, professional
performance results. On other hand they behave very similar within specific roles regardless of
the type of organisation they work for. Based on this phenomenon mentor’s core competences
were selected as characteristic for further research. Finally, a hypothesis was determined for
our paper: Both parties, university teachers and corporate managers are using the same
competences, communication patterns and kinds of behaviour at time they perform the role of
mentor. Our research come from these two key premises: (1) undergraduate engineering
education is focused on student-centred learning and teaching styles, level of didactical
competences of teacher are in accordance with this requirement, (2) corporate culture and
values, managers development programs and successor planning procedures are consistent with
Best-Place-to-Work and Mentorship Pipeline long-term competitive ability strategy. The
intention was to structure recommendations into three areas: a) for university systemic changes
towards student-centred learning regarding relationship between teachers and students and to
strengthen the use of collaborative educational methods, b) for company to adapt some
principles or rules into current development scheme to provide employees and managers with
opportunity to assume authority and responsibility for their role of mentor and support
individual efforts for self-insight, b)c) for university and company collaboration – to choose a
theoretically verified concept for designing joint development program focused on mentoring
skills which will support, elevate and protect the interests of both organisation.
2. THEORETICAL AND INSTITUTIONAL PLATFORM FOR THE RESEARCH
PLAN
Over the years several studies have shown the importance of mentorship. Ehrich et al. (2004)
conducted a meta-review analysis of more than 300 research – based articles on mentoring in
(mainly) education. Mentorship is a “developmental process of open dialogue that aims to
achieve both individual and organisational change thought shared understanding and
suspending judgement within a relationship of mutual learning in which differences that exist
are perceived as integral to learning, growth and development” (Clutterbuck, et al. 2017). The
relationship based on mutual trust is critical precondition. Conversations between mentor and
mentee are more than transactional. They may operate at all seven levels of dialogue, as
described elsewhere by one of the editors (Megginson and Clutterbuck, 2005) – social,
technical, tactical, strategic, for self-insight, for behaviour change and integrative (work and
life). The stated research hypothesis has been tested on one side in Slovak University of
Technology (University teacher as mentor) and on other side in multinational producer of clay
blocks, facing bricks and clay roof tiles located in Czech and Slovak republic (manager as
51st International Scientific Conference on Economic and Social Development – Rabat, 26-27 March 2020
221
mentor). The reason for selecting these two organisations was the fact that this university is
preparing students directly for job positions of this company. Company consists of 10
manufactories, HR department and Share Service Centre and is a part of an international
supplier of innovative building materials and infrastructure solutions. Corporate philosophy of
this company represents four core values: Customer, Challenge, Collaboration, and People.
Regarding engineering graduates as potential future employees, the most relevant statements
are:
• We approach our work with a positive attitude and focus, while putting our best efforts to
accomplish our goals, we proactively search for tasks that need to be done.
• We actively support and participate in collaborative work to ensure tangible performance
results.
• We provide people with opportunity to assume authority and responsibility for their work.
• We recognize that every employee’s capability is important to our organisation, and support
individual efforts for personal development.
This corporate’s core value guarantees continuous professional development for engineering
graduates which will be capable of addressing complex working task in a sustainable way.
Employee’s development program and successor’s planning procedures are embedded in an
official company’s document “The Roadmap for future corporate leaders“. This document is
divided into four so called development phases starting from Local Talent Management
(“Warm-up“) phase, then International Talent Management (“Run-way“) phase followed by
Successors (“Take-off” phase), and finally Mentors (“Launch-control Mode“) phase.
Employees involved in first phase are specialists or managers at operational level of
management. While succession planning is obviously important, company’s belief is that talent
management must encompass a far broader range of employees. Selection procedure is
designed foremost in relation to business objectives, additionally includes six complementary
components: (1) Learning Agility, (2) Personal Attitudes, (3) Inner Drivers /Self-motivation,
(4) Positive Attitudes to the Values of Company, (5) Multilanguage’s Agility, and (6) Change
Agility. Participants involved into second phase are managers at different levels of
management, which demonstrated potential for further professional growth in accordance with
business long-term objectives within the succession planning. Participants involved into third
phase of management development are employees working in the positions of specialists and /
or managers at different levels of management which are included into succession plans for
higher position (current or completely new). Participants involved into fourth phase are
employees on the key position as specialists or managers at higher management level. Slovak
University of Technology (STU) in Bratislava is a modern educational and scientific institution
[4]. Since its foundation in the year 1937 more than 159.000 students have graduated. In
average, 12.000 students’ study at the STU every year. At present, the STU consists of seven
faculties based in Bratislava and Trnava. All the faculties provide a study in accredited study
programmes within the complex system of a bachelor, master and PhD. study. Faculties realize
credit system compatible with the European credit transfer system enabling mutual mobility of
students within European Union member countries and a larger European space. In the area of
scientific and research activities the STU successfully joints European Union programmes. In
February 2017 The Scientific Board of STU established the need to reform existing education
programs, and practices to better prepare engineering students for confronting sustainable
issues. Students need not only intellectual development but also learner-centred environment
and active methods integrated into engineering curricula (STU, 2019).

51st International Scientific Conference on Economic and Social Development – Rabat, 26-27 March 2020
222
3. RESEARCH AND METHODOLOGY
Quantitative method of collection data was used and research was guided by different
approaches for university environment and company environment.
• University environment:
Step 1. Based on European Mentoring and Coaching Council (EMCC) competence frame/
categories the task was to specify adequate mentor’s competences according student-
centred learning environment and to design questionnaire. Step 2. To conduct a
questionnaire survey on a sample of university teacher (Assoc. Prof.) and doctorands
(Ph.D.). Step 3. To assess following null and alternative hypothesis: H0: There is no
statistically significant link between a teacher category Assoc. Prof. and category doctorand
Ph.D. regarding mentor competences. H1: There is a statistically significant relationship
between teacher category Assoc. Prof. and category doctorand Ph.D. regarding mentor
competences. Step 4. To formulate the results of the target research hypothesis and to
discuss possibilities and conditions for alignment of mentoring styles between STU and
selected analysed company.
• Company environment:
Step 1. To find out company’s corporate philosophy in relation to mentoring (source:
Corporate four core values). Step. 2. To assess goals and structure of development scheme
for employees and managers as future mentors (source: HR document “The Road for future
corporate leaders”). Step 3. To propose extension or supplement of current version of this
document by training and coaching programs focused to mentorship topics. Step 4. To
formulate the results of the target research hypothesis and to discuss possibilities and
conditions for alignment of mentoring styles between selected analysed company and STU.
Comparison analysis inside STU was realized by use of questionnaire survey. As a
methodological basis was used European Mentoring and Coaching Council (EMCC, 2015)
competence framework. The purpose of the competence framework is to provide a description
of a mentor/coach at four distinct levels of development in order to help mentors/coaches
understand their level of development. The competence indicators are examples of behaviours
or principles of the coaching profession that meet the eight competence categories. Clutterbuck
(2017) describes these 8 competences: 1. Understanding self, 2. Commitment to self-
development, 3. Managing the Contract, 4. Building the Relationship, 5. Enabling Insight and
Learning, 6. Outcome and Action Orientation, 7. Use of Models and Techniques, 8. Evaluation.
As a part of early stages of our research (Step 1. University environment) these competence
framework/ indicators were further elaborated into list of Seven Core Mentor’s Competences
appropriate to student-centred teaching environment to evaluate behaviours of mentor of
university teacher (Assoc. Prof. and Ph.D. categories): 1. Consistency/Personal Integrity
(Demonstrating Confidence and Energy, Demonstrating Credibility, Demonstrating
Conviction, and Taking Ownership for Leading the Dialogue), 2. Relating (Building Trust,
Rapport and Mutual Values, Using Acknowledgement, Showing Empathy and Respect,
Establishing Common Rules and Communication Process and Structure), 3. Insight
(Developing Multiple Channels of Information, Using Principle of Networking and Linking,
Considering the Various Implications and Scenarios, Assessing the Integrity of Legitimacy,
Credibility, Relationship, Needed Resources and Personal Commitment), 4. Probing/Drawing
Out (Using Hierarchy of Open Questions, Avoiding Multi-Tasking, Using Appropriate
Phrasing, Encouraging the Speaker to explore and clarify his/her Thinking, 5. Listening
(Paraphrasing, Suspending Judgement, Physical Attending, Using adequate Pace, Silence,
Patience, Pauses, Attuning to Feelings, Expressing Empathy, Reducing Physical and Mental
Distractions, Using verbal and non-verbal Acknowledgement, and Summarizing, 6. Aligning
(Requesting Clarification, Reflecting Feelings, Keeping Dialogue Interactive, Appealing to

51st International Scientific Conference on Economic and Social Development – Rabat, 26-27 March 2020
223
Both Rational and Emotional Mind, Monitoring Level of Attentiveness and Engagements,
Describing and Checking Common Understanding, Linking the Differences of Views,
Demonstrating Positive Attitude, and Checking for Feedback, 7. Tracking (Verifying Personal
Readiness, Concerns about Loss of Control, Exploring the Decision-making Process, Need for
Support, Agreement on Time-schedule, Milestones, Summarizing the Very Next Steps, Events,
Sharing and Aligning Responsibilities for Follow-up). The survey sample of participants was
composed of two categories of teacher – 36 in the category of Assoc. Prof. and 16 in the
category Ph.D. participated in the survey. Each survey participant had the opportunity to
evaluate themselves on a five-level scale (less than 20%, 21-40%, 41-60%, 61-80%, more than
81%). The main focus (step 2 University environment) was to analyse the outputs from a
questionnaire survey on a sample of two categories of university teachers. The result is
numerically in the Table 2 and Table 3.
Core Competence 20% 40% 60% 80% 100%
Consistency/Personal Integrity 0 0 7 29 0
Relating 0 1 11 24 0
Insight 0 7 14 15 0
Probing/Drawing Out 0 3 10 23 0
Listening 0 0 6 30 0
Aligning 0 5 12 19 0
Tracking 0 14 15 7 0
Table 2: Core Competences of Assoc. Prof.
Core Competence 20% 40% 60% 80% 100%
Consistency/Personal Integrity 0 4 5 7 0
Relating 0 2 9 5 0
Insight 0 0 16 0 0
Probing/Drawing Out 0 4 3 9 0
Listening 0 0 6 10 0
Aligning 0 6 4 6 0
Tracking 0 3 8 5 0
Table 3: Core Competences of Ph.D.
Subsequently, the graphical representation Figure 1, and Figure 2 provided clearly the starting
points for more in-depth analysis.
Figure 1: Core Competences of Assoc. Prof.
0
1
7
3
0
5
14
7
11
14
10
6
12
15
29
24
15
23
30
19
7
Consistancy/Personal Integrity
Relating
Insight
Probing/Drawing Out
Listening
Aligning
Tracking
Core Competences of Assoc. Prof.
20% 40% 60% 80% 100%

51st International Scientific Conference on Economic and Social Development – Rabat, 26-27 March 2020
224
Figure 2: Core Competences of Ph.D.
The university teacher category Assoc. Prof. proves to be as very strong in the competences
Consistency/Personal Integrity and Listening. On other hand, competence Tracking is clearly
underdeveloped and also the competences Insight and partly Aligning needs to be supported.
The university teacher’s category Ph.D. is characterized by a relatively even distribution of
frequencies among the scales. This phenomenon is due to very individual development level
based on age and length of working relationship with at the University. The competence
Listening proves to be as very strong, competences Relating and Tracking are characterized by
a normal distribution of frequencies. The need for support shows up in competence Insight and
also on an individual basis for Probing/ Drawing out and Aligning. As a highest priority for
further development must be seen the competence Consistency/ Personal Integrity. For both
target groups are identically competences Listening (very strong) and Insight (medium weak).
As very different between category Assoc. Prof. and category Ph.D. are competences
Consistency/Personal Integrity (very strong versus very individual), Aligning (weak versus
very individual) and Tracking (very weak versus normal distribution). This part of the analysis
can be concluded by summarizing the development needs:
• For both university teacher categories Assoc. Prof. and Ph.D.: competence Insight,
• For university teacher category Assoc. Prof.: competence Tracking and competence
Aligning (by the use of sub-group training methods and team-coaching),
• For university teacher category Ph. D.: competence Consistency/Personal Integrity and
Aligning (by the use of individual training methods and coaching).
Core Competence Assoc. Prof. Ph.D.
Consistency/Personal Integrity 76% 64%
Relating 73% 64%
Insight 64% 60%
Probing/Drawing Out 71% 66%
Listening 77% 73%
Aligning 68% 60%
Tracking 56% 63%
Average 69% 64%
Table 4: Core competences of teacher (both categories)
4
2
0
4
0
6
3
5
9
16
3
6
4
8
7
5
0
9
10
6
5
Consistancy/Personal Integrity
Relating
Insight
Probing/Drawing Out
Listening
Aligning
Tracking
Core Competences of Ph.D.
20% 40% 60% 80% 100%

51st International Scientific Conference on Economic and Social Development – Rabat, 26-27 March 2020
225
Figure 3: Core competences of teachers (both category)
Step 3 was focused on assessment of null and alternative hypothesis. For statistical testing of
the null hypothesis the Pearson chi-square test (x2) was used. We followed these steps (Turner,
2014):
a) Compilation of a contingency table for observed frequencies (O) and subsequently for
expected frequencies I according to the formula Ei = ri x ci / I, while ri – sum of rows, ci –
sum of columns, i – the sum of all elements
b) The choice of the level of alpha signatures to be tested is 5% (p = 0.05)
c) Determining the number of degrees of freedom dF, formula dF = (r-1) x (c-1)
(for dF = 1, the tabular value is 3.84)
d) Calculation of the Chi-square cut-off value at the selected significance level.
e) Calculation of Chi square χ2 = ∑ i (Oi −Ei- 0,05)2/Ei
f) Comparison of the calculated Chi-square value with the Chi-square table value at the
selected significance level.
Contingency table for observed frequencies (O) on the question of the relationship between the
teacher and his / her mentoring competences:
Observed frequencies Yes Non Total
Teachers (Ph.D.) 16 4 20
Teachers (Assoc. Prof.) 36 19 55
Total 52 23 75
Table 5: Contingency table for observed (O) frequencies
Specification of a dependent and independent variable: Independent variable: job position
(teacher with Ph.D., Associate Professor). Dependent variable: mentor competence.
Formulation of hypothesis: H0: There is no statistically significant link between a teacher
Ph.D./Assoc. Prof. and mentor competences. H1: There is a statistically significant relationship
between the teacher Ph.D./Assoc. Prof. and mentor competences.
76% 73%64%
71%77%
68%
56%64% 64% 60%
66%73%
60% 63%
0%10%20%30%40%50%60%70%80%90%
Core Competences of Teachers
Assoc. Prof. Ph.D.

51st International Scientific Conference on Economic and Social Development – Rabat, 26-27 March 2020
226
Observed frequencies Yes Non Total
Teachers (Ph.D.) 13,87 6,13 20
Teachers (Assoc. Prof.) 38,13 16,87 55
Total 52 23 75
Table 6: Contingency table for expected (E) frequencies
Determination of the number of degrees of freedom dF by relation: 𝑑𝐹 = (2 − 1) × (2 − 1)
𝑑𝐹 = 1
To determine the table value for the corresponding Chi-square at the number of degrees of
freedom: Tabulated Chi-square (0.05) = 3.84. Decision: Since the tabulated Chi-square value
(3.84) is higher than the calculated value (1,387), we can conclude that we do not have sufficient
evidence to reject the hypothesis H0. So, we say that in the research sample there is no
relationship between variables, job position and mentor competence. The research inside the
company was intended to find out company’s readiness to employ Slovak University of
Technology (especially Faculty of Civil Engineering) engineering graduates and during their
adaptive phase and subsequent continuous development to apply the mentoring style they
experienced during their university studies. The analytical part of the research was based on
survey of corporate values and HR document called “The Roadmap for future corporate
leaders” with the focus to competence development programs for the role of mentor. A series
of workshops was organized in each plant and at all departments in the headquarter. After then
a round table took place with representatives from all sections, i.e. production, marketing, sales,
share services centre, controlling and finance, HR, and top management. As additional sources
for research were internal company`s rules and guidelines, processes and procedures regarding
HR issues, mainly towards Competence models, Talent Management, Succession Planning.
Also, concepts Personal and Employer Branding, People Pipeline created a link for our thoughts
and suggestions. As the result of step 2 (company environment) it was found, that there is a
need to invoke desired emotional responds, new quality of personal responsibility and
consciously work to reduce the impact of biases, especially saliency bias, negativity bias, and
confirmation bias. Among other identified support needs was fears of loss control and
understanding perspectives and align on the solution.
4. RESULTS AND DISCUSSION
To strengthen the justness of research hypothesis the proposal is to adapt and extent company’s
HR development program “The roadmap for future corporate leaders” and allow managers to
develop their competences in following areas:
• In the first phase – Local Talent Management (Self-determination and personal growth):
Effective mentorship is based on the practicality how the mentor is able to advice alignment
with mentee toward a shared vision. The most problematic misalignments are from fear and
assumptions. The aim is to strengthen the confidence, courage and skill to effectively
engage in mentorship and overcome regret aversion.
• In the second phase – International Talent Management (Socio-communication Aspect of
Mentorship): The single biggest problem in communication is the illusion that it has taken
place. Peoples’ brain cause communication breakdowns – they are subject to listening filters
and biases. The aim is to consolidate the cognitive ability, harmonize the factual, social and
emotional contexts regarding mentor´s role and rising awareness toward own biases.
• In the third phase – Successors (Brief Mentoring Dialogue): To the key characteristics of
mentoring dialogue belongs making the communication partner/mentee feel “heard”,
adding values with good questions, tailoring a common solution and positioning yourself

51st International Scientific Conference on Economic and Social Development – Rabat, 26-27 March 2020
227
as an ally. The aim is to help the mentor to inspire mentee to “aspire” for what he/she truly
wants. To experience dialogue based on subsequence of the steps (Objectives/Needs –
Current Situation – Level of Satisfaction – Future Needs – Personal Readiness - Tracking
Path).
In relation to research results at the Slovak University of Technology a development program
has been designed as follow:
• For both categories Assoc. Prof. and Ph.D. (The Power of Insight): The power of the mentor
competence Insight is the foundation upon which the power of all other core competences
are built. Without information – a lot of good, reliable information regarding mentees – the
mentors cannot develop this kind of competence. Insight is the power to see into a mentees’
situation – beyond the obvious. Indicators can be prior information provided by a mentee
or by other individuals inside university environment or also from his/her personal zone,
private life. It is also important to assess the integrity of the information obtained.
• For the category Assoc. Prof. (Maintaining Relationship and Tracking): Asserting mentors’
perspective to guide or reframe mentees’ thinking can be mentoring relationship mentees’
motivational traits. These has a decisive importance for development of mentor’s
competence Tracking which provides a roadmap to uncover and address mentee’s
misalignment needed to reach to reach agreement on the right course of action.
• For the category Ph.D. (Mentor Personal Integrity): To strengthen the competence
Consistency/Personal Integrity is needed to reframe junior mentors’ seeing their current
situation from a different perspective. Showing a contrast can help them to be aware of their
own thinking to make new cognitive connections and gain new perspective. Thinking about
people’s thinking means to become passionate about improving mentor’s competence to
pay attention not pay attention thinking about, but the way thinks.
5. CONCLUSION
The paper was dedicated to contribute to all three parties, i.e. Slovak University of Technology,
selected company from the construction industry and engineering graduates with the aim to
improve common sustainable development. It could be concluded that company’s core values
positively support the hypothesis that “both parties, university teachers and corporate managers
are using the same competences, communications patterns and kinds of behaviour at the time
they perform the role of mentor”. Based on our research company’s HR development program
The Roadmap for Future Corporate Leaders will be adapted and extended with three modules
that will by gradually included in the phases Local Talent Management, International Talent
Management and Successors. This will invoke the desired emotional responds and new quality
of personal responsibility employees and managers in the role of mentor. Development program
for Slovak University of Technology teachers and doctorand has been designed to integrate
mentoring into active – teaching methods. For category Assoc. Prof. the mental transition from
technical and professional skills (as expert/ individual contributor) to interpersonal and
behavioural skills (as mentor) will strengthen their ability to use the power of insight, keeping
dialogue with students interactive, appealing to both rational and emotional mindset and
demonstrate positive attitude. For the category doctorands (Ph.D.) the main task was to create
a standard regarding their consistency and personal integrity which will cover answers to
following the questions:
• How to understand the role of mentor?
• What kind of core initiatives are involved to the role of mentor?
• What competences are needed for this role?
• How can be assessed and develop these competences?
• What are the person’s inner motivators to perform this role?
51st International Scientific Conference on Economic and Social Development – Rabat, 26-27 March 2020
228
The development program for doctorands are also focused how to struggle with own thinking
about mentees’ thinking, misalignments and to provide awareness towards cognitive dissonance
and confirmation bias. In order to practical verification of the research results the pilot project
is now in the ready stage, the selection process of 15 participants has been already performed.
Learning agility is one of the defining components of potential (Silzer, Church, 2009) and
therefore the selection criteria were the key factors to get the teachers with willingness and
capability to learn. Based on model of learning agility (Eichinger, Lombardo, Capretta, 2010)
the approach of the following four facets of learning agility was used as assessment tool: (1)
Mental Agility, (2) People Agility, (3) Change Agility, and (4) Results Agility. Finally each of
selected teachers actively participated in our research questionnaire survey. This project will
take place in the period May - July this year. EMCC competence framework elaborated into list
of Seven Core Mentor’s Competences represents theoretically verified concept for aligning
mentorship understanding and related development programs. This will support the fulfilment
of students’ expectations according more learner-centred environment and also will contribute
to a comparable mentor style whether at university or at the future employer.
ACKNOWLEDGEMENT: The paper was created as part of the KEGA project 019STU-4/2018
The Process of Integrating Mentoring and Coaching into Teaching at Technical Universities.
LITERATURE:
1. Clutterbuck, D. A. et al. (2017). The SAGE Handbook of Mentoring. SAGE Publications
Ltd; 1 edition. p. 241-242. ISBN 978-1412962537.
2. Ehrich, L. C. et al. (2004). Formal Mentoring Programs in Education and Other
Professions: A Review of the Literature. Educational Administration Quarterly 40. 4. p.
518-540.
3. Eichinger, R. W., Lombardo, M. M., and Capretta, C. C. (2010). FYI for learning agility.
Minneapolis: Lominger International: A Korn/Ferry Company. p.19. ISBN 978-
1933578217.
4. EMCC. (2015). EMCC Competence Framework V2. p. 2. Retrieved 10.10.2019 from
https://www.emccouncil.org/wp-content/uploads/2018/10/EMCC-competences-framewor
k-v2-EN.pdf
5. Megginson, D., and Clutterbuck, D. (2005). Techniques for Coaching and Mentoring.
Routledge Taylor & Francis. p.17-18. ISBN 978-0-7596-5297-2. Retrieved 10.12.2019
from https://www.davidclutterbuckpartnership.com/wp-content/uploads/Diversity-book-
sample-chapter.pdf
6. Silzer, R., and Church, A. H. (2009). The pearls and perils of identifying potential.
Industrial and Organizational Psychology, 2. p. 377–412. ISSN 1754-9426
7. STU. (2019). Slovak University of Technology in Bratislava. Retrieved 11.11.2019 from
https://www.stuba.sk/english.html?page_id=132
8. Turner, G. (2014). Is it statistically significant? The chi-square test. Retrieved 11.12.2019.
Retrieved from
http://www.ox.ac.uk/media/global/wwwoxacuk/localsites/uasconference/presentations/P8
_Is_it_statistically_significant.pdf
51st International Scientific Conference on Economic and Social Development – Rabat, 26-27 March 2020
229
RURAL HOUSEHOLD DECISION TO PARTICIPATE IN OFF FARM
WORK: USING A DOUBLE HURDLE MODEL
Hussein N. Nassoro
Institute of Finance Management, Tanzania
ABSTRACT
Rural Household decision to engage in off farm work, passes through two stages, firstly is the
decision to participate and secondly is the extent or intensity of participation. Using the
Tanzania national panel survey data, this study investigated factors determining household
labour decision on whether to participate or not and intensity of participation using a double
hurdle model. A likelihood ratio test confirmed that indeed participation is a two stage decision.
Analytical results have shown that, marital status, land quality, farm size, level of farm output
and household size are important variables that influence the decision to participate in off farm
work. In addition, age, the dummy variable of male gender, marital status and land quality
were the main determinants of the intensity of participation in off farm work. These factors
should be considered in designing a rural development policy that focuses on promotion of off
farm activities.
Keywords: Double hurdle model, off farm work, logit, Tanzania
1. INTRODUCTION
A long held view that farming is the only economic activity of the rural household has begun
to change owing to proliferation of off farm works. Available literature is showing an increasing
trend in off farm activities ((Maliyamkono and Bagachwa, 1990; Ellis and Mdoe, 2004;
Mduma, 2006; Dimeva and Sen, 2010). Importantly is that, a significant amount of income is
generated from these activities (URT, 2010, Barrette et al., 2001). Literature indicates that,
about 50 percent of rural household income is generated from the off farm activities (Ellis and
Mdoe 2004, Mduma 2006). This income has a low level of risk covariance compared to farm
income and there is a possibility of using this source to purchase agricultural inputs and improve
household welfare. Given the significance of the income, there is a possibility of using off farm
activities as a potential pathway towards poverty reduction. Because of that, rural household
labour allocation decision has become a major research topic. Researchers and development
experts are particularly interested to understand factors which are affecting household decision
to participate in off farm work. Apparently, most of the research studies which were done in
this topic in Tanzania have modelled participation in off farm work as a single decision. This
approach, preclude the possibility of having household which are willing to participate but have
not participated yet due to various factors. In reconciling the fact, this study applies the double
hurdle model to investigate household labour decision on whether to participate or not and
extent of participation. In estimating these factors, the study applies the dataset from the
National Panel Survey (NPS wave 1) collected by the National Bureau of Statistics. The layout
of this paper covers issues related to rural household characteristics with a farm household
model, methodology with details on an econometric approach, double hurdle model and
estimation techniques. Finally, the analytical results are presented together with a discussion.
The paper ends up with a conclusion and policy recommendations.
2. CHARACTERISTICS OF RURAL HOUSEHOLD
According to literature rural households make simultaneous decisions related to production and
consumption (Udry and Bardhan, 1999, Singh et al., 1986). Such decisions are considered to
be non-separable (Reardon and Corral, 2001, De Janvry and Sadoulet, 2001, Escobar, 2001).

51st International Scientific Conference on Economic and Social Development – Rabat, 26-27 March 2020
230
Separation property is derived from twin assumptions of utility maximization and complete
markets. It implies that the marginal productivity of inputs is derived solely from plot
characteristics and the prices of farm produce. In this context, households are assumed to derive
their production decisions as if they are risk –neutral profit maximizing firms. This is contrary
to a situation in which factor demand is derived by the household characteristics and marginal
productivities are not equated across household and production is not optimized. This theory
lacks empirical relevance in a developing country such as Tanzania, where the behavior of farm
households is different from what is prescribed (Mduma, 2006, Ahituv and Kimhi, 2002,
Kimhi, 2001, Woldehanna, 2000). This argument is supported by Udry and Bardhan, (1999,)
who argue that a separation property is more useful as a benchmark for comparison, rather than
a basis, for empirical work. Thus, it would be better to represent rural households by a non-
separable Farm Household Model. This model has been extensively applied by numerous
studies to rural households’ labour allocation behavior (Mduma, 2006, Ahituv and Kimhi, 2002,
Kimhi, 2001, Woldehanna, 2000). In fact, a non-separability scenario reinforces the relevance
of analyzing determinants of off farm labour supply among the Tanzanian rural households.
2.1. A Farm Household Model
On the basis of the description given above, this study adopts the model developed by Becker
(1965), in which a household is described as production unit and a utility maximizer. Based on
the model, decisions are made by a single person who is the head of the household consistent
with studies done by Mduma (2006); Woldehanna (2000), Matshe and Young (2004) and Kimhi
and Ahituv (2002). This household has the choice of engaging in both farm production and off
farm activities or choosing just one activity. This is achieved through a combination of capital
goods, raw materials and labour to produce useful commodities. The rural household is
endowed with labour 𝑙𝑙 (being total hours) which can be allocated for working (allocated on
farm production, off farm activities) and leisure. In Equation 3.1 below W represents the off
farm wage rate, F stands for farm hours that are spent by a respective household, T is the total
household labour hours, L stands for leisure time, and M represent the hours spend on off farm
work. P is the price of consumption goods, while PF represents the price of farm outputs, (Q)
is the column for the vector of prices of other farm inputs, and X is the column for the vector
of other inputs quantities. The letter A stands for non-labour income, such as remittances, which
is a common phenomenon in developing countries. In this regard, it is important to point out
that farm production (Q) is using farm labour, human capital (K) and other farm inputs denoted
as the X vector above. In this context, a household seeking to maximize utility function is
expressed as below.
1.1
Subject to
AFKXQPwMXrPq F ++=+ ),,('
(1.2)
,MLFT ++= (1.3)
,0F ,0L 0M
),,( LqUU =

51st International Scientific Conference on Economic and Social Development – Rabat, 26-27 March 2020
231
2.1.1. Household Optimal Conditions
Based on the equations expressed above, a Lagrangian equation is generated. This equation is
used to derive Kuhn-Tucker first order conditions while incomes are the major constraints
facing the household.
0' =− kXkF rQP, for all inputs (1.4)
K= 1…………., K
,0−w1.5 (1.6)
,0'
− FFQP 1.7 (1.8)
,0'
=− pU q and
From the above equations and i are Lagrange multipliers for the household income and
time allocation. Solving equation (5) and (6) yield the following conditions:
w
p
U
U
L
q=
'
'
, (1.9)
This equation suggests that the marginal rate of substitution between leisure and the
consumption is equal to the ratio between price of the goods and the wage rate. In addition, we
also derive that
wQP FF ='
The value of the marginal product of labour is equal to the off farm wage rate. Our derivations
are based on the assumption of interior solutions, such that an increase in the price of farm
output or an increase in on-farm labour productivity would induce more supply of labour for
farm production and less for off farm works, and vice versa. However, this will be determined
by a number of factors.
3. METHODOLOGY
In order to model household participation in off farm work, this study applies reported hours
allocated for off farm work by each particular household in the NPS dataset (2008/9). The
dataset comprises households who were asked whether they participated in off farm work, or
not, in a week that preceded the survey. In this case they reported positive and zero hours. The
zero hours in the data set may signify a corner solution (voluntary decision) or inhibition factors
(involuntary decision). The inhibition factors may range from personal disability, low level of
education or relevant skills, and even remuneration attached to off farm work. Even if farm
households are willing to participate in off farm work, several factors, such as rationing in the
labour market and transaction costs related to search costs, information and other costs as
elaborated earlier, may inhibit their participation (Woldehanna et al.,2000; Blundel and Meghir,
1987). Therefore, a household may have been a potential participant, but didn’t engage in off
farm work due to some reasons that were prevailing at that specific period. However, in the
absence of those factors, a household can participate in off farm work.
,0)( =−wM
,0)( ' =− FHF QPF
0' =− LU
51st International Scientific Conference on Economic and Social Development – Rabat, 26-27 March 2020
232
This means that the decision to participate and the intensity of participation are two distinct
decisions that are made by the household separately. Such household decisions are considered
to be latent. A decision to participate or not will involve weighing between the net benefits of
engaging in off farm work and the expected transaction costs (including what will be lost from
farm production).
3.1. Econometric Approach
Determination of the household behaviour in allocating labour in off farm work is problematic
if a standard regression analysis is used (Matshe and Young, 2004). The zero hours reported
may imply a censoring effect, which would warrant application of a Tobit model. However, the
Tobit model will combine the two decisions (participation and intensity) as a one hurdle.
Another option is to analyze the two decisions separately using a Probit or logit model.
However, there is a risk of estimating a non-random sample if this approach is used. To
circumvent these problems this study adopts a double hurdle model, which is capable of
capturing such behavioral aspects.
3.2. A Double Hurdle Model
The assumptions of this model facilitate measurement of the two latent decisions related to
participation and the number of hours or intensity of participation in off farm work. Since it
was established by Crag 1971, the model has been widely applied in consumer preference
literature. However, subsequently it has been found to be useful in labour allocation studies
(Woldehanna et al., 2000, Matshe and Young, 2004). Other studies which have applied the
model include: Teklewold et al. (2006), IFPRI, (2011), Setsofias et al., (2013), and Asfaw et
al., (2010). Amsalu et al. (2013) applied the model in analyzing off farm labour supply decisions
in Ethiopia. Asfaw at el. (2010) used an augmented double hurdle model to analyse the
determinants of the intensity of variety adoption conditional on overcoming seed access
constraints. Woldehanna et al., (2000) used the model to analyse the off farm work decisions
of Dutch cash crops farms and agenda 2000 CAP reforms. Matshe and Young (2004) applied a
double hurdle to analyse off farm labour allocation decisions in small-scale rural households in
Zimbabwe. Details of the model are presented below, whereby the two latent dependent
variables are expressed with their set of exogenous variables;
IXy += 11
**
1 (1.10)
This a participation equation
222
**
2 += Xy (1.11)
This is equation measures intensity of participation (hours of work)
Where **
1y = latent variable related to the decision to participate, while 2 and I represents
the error term in the equations above. **
2y = latent variable that captures the latent variable
related to off farm hours
= hurdle regressor,. If 01 =y then 12 =y and if 11 =y then 02 =y
If the error term is normally distributed, then the first hurdle will correspond to the Probit or
logit model (Matshe and Young, 2004).
21 & XX
51st International Scientific Conference on Economic and Social Development – Rabat, 26-27 March 2020
233
From the second hurdle **
22 yy = if .
And
0**
2 =y Otherwise
Thus, the second hurdle yields a Tobit model1. The first equation (hurdle) is independent of the
second hurdle, thus there is a possibility of observing zero hours of work. However, zeros in
the second hurdle do not necessarily mean that an individual does not participate in off farm
work; rather, it may reflect a failure of either of the hurdles2 (the first or second). In view of
that, observed time or hours of work is an outcome of the interaction between the first and
second decision hurdles3.
(1.12)
jjijj xy +=*
(1.13)
2,1=j Showing the first and second hurdle
If is restricted to being equal to zero, the model collapses to the independent Craggy model.
If the assumption is made that the probability of participating in off farm work is 1, then a Tobit
model is nested within the independent double model.
3.3. Dependent Variable
Engagement in off farm work is a matter of probability, such that it may 1 or 0. Thus, it is a
dichotomy variable which takes a value of 1 if a household is engaging in off farm activities
and 0 for non-participant. Similarly, Mduma (2006), Dimeva and Sen (2010) have considered
participants and non-participants as a dichotomy variable. However, given that we are applying
a double hurdle model, this study uses reported hours spent on off farm work to present
participants and non-participants. This approach is similarly used by Cameron and Trived
(2010) to estimate a double hurdle model.
1Most commonly this occurs when the dependent variable is zero for a substantial part of the population, but positive (with many different outcomes) for the rest of the population (Verbeek, 2008). 2 In modeling zeros in the dependent variable there are basically two scenarios, the first is related to a case in which the zero is genuine, reflecting a corner solution (which may permit application of the Tobit model for estimation). This may be further disaggregated into a double hurdle model (accounted for by the fact that the first decision may influence the second) and other is the two part, or sequential, model). Sometimes the zeros are non-observable responses which motivates application of the sample selection model, commonly known as Heckman. 3The Hurdle model assumes that both decisions (participation and intensity) are made simultaneously.
0**
2 y
*
2
*
1 yyy =
( ) ),0(2,1 N

51st International Scientific Conference on Economic and Social Development – Rabat, 26-27 March 2020
234
3.4. Key Independent Variables
There are a number of factors that determine participation in off farm work in Tanzania. Those
attributes have been applied in different studies to explain household decisions to participate in
the activities (Mduma, 2006; Woldehanna, 2000; Matshe and Young, 2004; Huffman, 1984).
These factors are derived from the theoretical exposition which argues that participation in off
farm activities is a function of incentives. As documented in different studies, these factors can
be classified into the following categories: individual and household characteristics, farm
characteristics, location factors, barriers to income diversification and risks factors4 (Barrett at
al., 2001; Abdulai and Crolerees, 2001; Woldehanna and Oskam, 2001; De janvry and Sadoulte,
2000; Reardon et al.’ 2007)5. Mduma (2005) analysed the determinants of off farm
employment in Tanzania and considered a set of variables such as individual characteristics,
household characteristics and community variables, which are closely related to those presented
above.
3.5. Estimation Approach
The analysis started with the descriptive statistics to characterize the variables prior to
estimation of the double hurdle model. We understand that, due to a censoring effect, the
Ordinary Least Square would not yield consistent estimates. Therefore, a maximum likelihood
estimator was selected, consistent with Cameron and Trived (2010). However, a maximum
likelihood estimator works under the assumption that errors in the hurdle equations are normally
distributed an homoskedastic6 ),0( 2 . Estimation of the model without due consideration over
how the error term is distributed run risks of inconsistent estimates. Therefore, in this study, we
were compelled to carry out a test of normality. Analytical results revealed that the error term
was not normally distributed. In order to circumvent this problem, the Box Cox transformation
approach, developed by Yen (1993), was adopted. The principle behind this is the relaxation of
the normality assumption of the dependent variable. This method has been applied by
numerous studies. For instance, the study by Yen et al., (1995), which investigated the
determinants of Crawfish consumption in South Louisiana using a generalized limited
dependent variable model that accounted for both participation and consumption decisions,
applied the Box Cox transformation. Abrevaya (2002) computed fitted values and marginal
effects in the Box Cox regression model. Bai et al., (2010) applied the approach prior to
estimating the determinants of household preferences to dine out.
The transformation of the dependent variable is as shown below:
(1.14)
Y = off farm hours spent by a household per week. λ = unknown parameter
Several functional forms are embedded in the transformation, as shown below.
4Mishra and Morehat (1999) consider factors such as educational level, age of the operator, off farm income, household net worth, leverage, farm size, farm diversification, management skills and location as the major determinants of off farm
investment. In this particular study, a list of factors that appear to have a theoretical and empirical relevance to theTanzanian context and how they influence off farm participationare described. 6When the error term is not normally distributed and homoskedastic, computation of the log likelihood function will be
incorrect under the model, as it will not reflect the true distribution of dependent variables iy given ix and the derived
estimators will be incorrect (Verbeek, 2008)
1)(
)( −=
YY

51st International Scientific Conference on Economic and Social Development – Rabat, 26-27 March 2020
235
The likelihood function of the Box Cox model can be derived as;
( )
( )
−
−
−
+
+−= −
=
I
i
T
i
i
i
T
ii
yi
i
ii
y
BXy
iy
P
BXyi
pZ
PBX
zLi
i
'
1
21
2
''
0
'
'
0
1
1
,
1
(1
(1.15)
The likelihood function is maximized with respect to the key variables that explain participation
in off farm work. The Box Cox transformation leads to a richer model which includes the linear
and log –linear models as special cases (Cameron and Thrived, 2010) Thus, we express the
transformed dependent variable as:
(1.17)
The expression can yield three outcomes,
1),( −= yyg i if , (1.18)
yyg i ln),( =if , (1.17)
yyg i
11),( −=
if 1−= (1.18)
Off farm labour supply is measured by the number of hours that a household reported as having
engaged in off farm work in a week that preceded the survey. According to the NPS report,
(2010) data collection was done from October 2008 to October 2009; the period coincides with
the crop production season in most of the areas which experience either uni-modal or bimodal
rainfall patterns. Therefore, the reported hours of household off farm labour supply may reflect
how they allocate labour resources between different economic activities (anticipating an
interior solution). This study started the analysis by first transforming the dependent variable,
following the Box Cox approach. Given various transformation approaches, we adopted the
theta method, which entails transformation on the right hand side of the equation. The generated
theta value was applied in subsequent transformations of the dependent variable. The Box Cox
transformation is guided by a strong assumption of the normal distribution pattern of the
dependent variable. Thereafter, a distribution pattern of the variable was established, based on
the degree of skew-ness, which was found to be very low, approximately zero (0), signifying a
normal distribution pattern, which provided leeway for subsequent estimations. The
transformed dependent variable was then applied in the double hurdle model, as previously
discussed.
iii BXy
yg i
++=−
'1
),(
1=
0=
−=−
=
=−
=
11
1
0)(
1)1()(
ify
ifyIn
ify
y
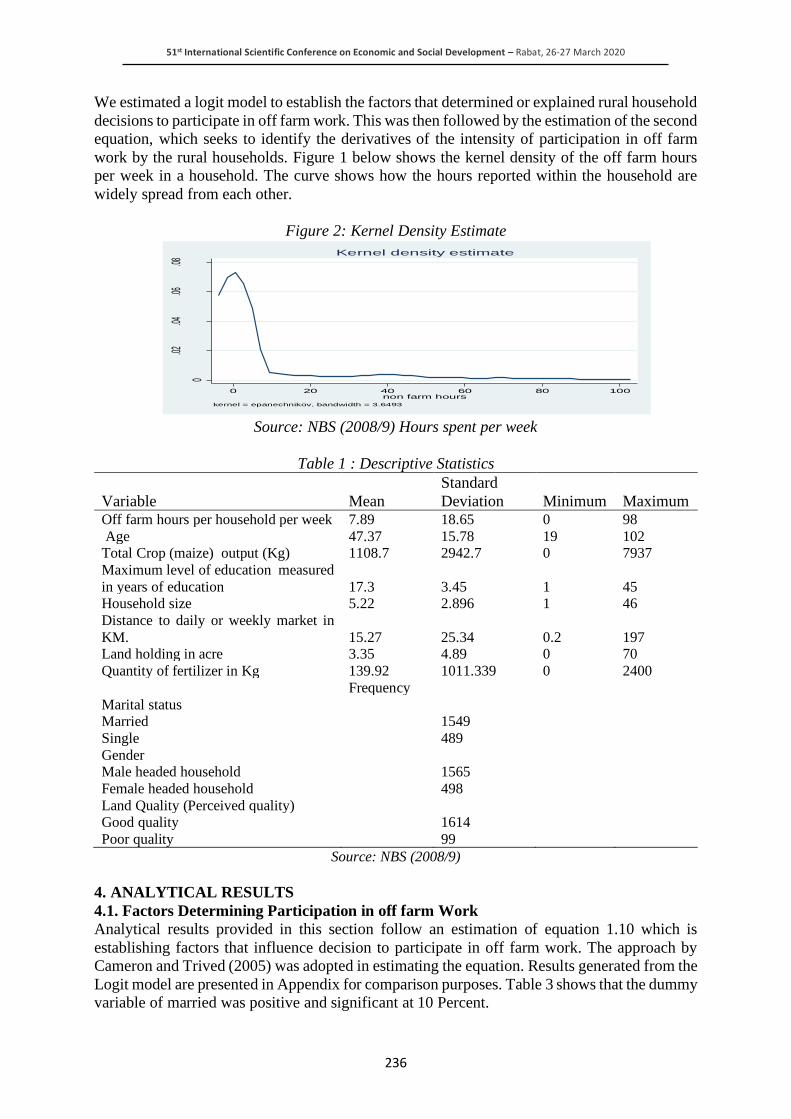
51st International Scientific Conference on Economic and Social Development – Rabat, 26-27 March 2020
236
We estimated a logit model to establish the factors that determined or explained rural household
decisions to participate in off farm work. This was then followed by the estimation of the second
equation, which seeks to identify the derivatives of the intensity of participation in off farm
work by the rural households. Figure 1 below shows the kernel density of the off farm hours
per week in a household. The curve shows how the hours reported within the household are
widely spread from each other.
Figure 2: Kernel Density Estimate
Source: NBS (2008/9) Hours spent per week
Table 1 : Descriptive Statistics
Variable Mean
Standard
Deviation Minimum Maximum Off farm hours per household per week 7.89 18.65 0 98
Age 47.37 15.78 19 102 Total Crop (maize) output (Kg) 1108.7 2942.7 0 7937
Maximum level of education measured
in years of education 17.3 3.45 1 45 Household size 5.22 2.896 1 46
Distance to daily or weekly market in
KM. 15.27 25.34 0.2 197 Land holding in acre 3.35 4.89 0 70
Quantity of fertilizer in Kg 139.92 1011.339 0 2400
Frequency Marital status Married 1549 Single 489 Gender Male headed household 1565 Female headed household 498 Land Quality (Perceived quality) Good quality 1614 Poor quality 99
Source: NBS (2008/9)
4. ANALYTICAL RESULTS
4.1. Factors Determining Participation in off farm Work
Analytical results provided in this section follow an estimation of equation 1.10 which is
establishing factors that influence decision to participate in off farm work. The approach by
Cameron and Trived (2005) was adopted in estimating the equation. Results generated from the
Logit model are presented in Appendix for comparison purposes. Table 3 shows that the dummy
variable of married was positive and significant at 10 Percent.
0
.02.04
.06.08
Dens
ity
0 20 40 60 80 100non farm hours
kernel = epanechnikov, bandwidth = 3.6493
Kernel density estimate

51st International Scientific Conference on Economic and Social Development – Rabat, 26-27 March 2020
237
This suggests that whether a head of the household is married or not is an important factor
determining participation in off farm work. As it appears, households with married couples
were likely to participate in off farm work. This phenomenon may be attributed to the fact that
households with married couples may divide their labour between off farm and on farm more
easily, given the available manpower to oversee both activities. This study asserts that a
household undertaking crop production on infertile land (degraded) is more likely to seek off
farm work in order to ensure survival ( driven by the fact that agricultural income will be
relatively low and may be exposed to intermittent food shortages). Thus, the hypothesis is
attested in this study by including a dummy variable that captured soil quality. The analytical
results showed a positive coefficient, which was significant at 5 percent. Thus, the null
hypothesis was rejected, suggesting that good quality land has a positive influence on the
decision to participate in off farm work. Probably, there is a positive linkage between the farm
production and off farm work when the land is of a relatively higher quality. If this assertion
holds, then households with fertile land are more likely to seek off farm work given that they
have sufficient food produced from the farm. Surprisingly, area under cultivation showed a
positive sign, which is highly significant. Probably participants of off farm work opt to hire
labour from the market in order to continue with on farm activities. There is a possibility that
households with relatively large farm areas to use off farm wage to hire labour from the market.
Off farm work may generate cash income which may be reinvested in farm production
consistently with Anríquez and Daidone (2008), who observed similarly that, households are
utilizing the opportunities of the non-farming sector to generate cash income which is re-
invested to purchase farm inputs. However, Anríquez and Daidone warned on the need to
undertake a thorough analysis before this is concluded for well-designed rural development
policy. Other studies which have examined the determinants of off farm work are such; De
Janvry and Sadoulet (2001) and Matshe and Young (2003), who have observed that land area
under cultivation was one of the household assets which may influence participation in off farm
activities. Greater access to land is said to reduce participation in off farm work (De Janvry and
Sadoulet, 2001, Matshe and Young 2003, Escobal, 2001).
Table 2: Double Hurdle Model Analytical Results –Decision to Participate or Not Participation Coefficient Standard Erro T
Age 0.5469694 0.291921 1.87
Dummy (marital status) -0.1506434 0.165447 -0.91
Dummy of gender 0.0994655 0.077165 1.29
Dummy of soil quality 0.9063689 0.389175 2.33**
Farm size -0.000054 0.000119 -0.45
Amount of fertilizer 0.1957155 0.0395 4.95***
Total crop output -0.000489 -0.00012 -3.97***
Max education -14.51297 5.649298 -2.57**
Household size -0.1933996 0.048581 -3.98***
Age squared -0.007339 0.000712 -1.03
Max education squared 0.4677316 0.183207 2.53**
Distance to a market -0.0072242 0.005123 -1.41
Cons 111.6489 43.8404 2.55**
Source: NBS (2008/9); ***= Highly significant at 1 percent and **=significant at 5 percent
The coefficient for total agricultural output was shown to be negative, which was significant
and consistent with the theory that higher agricultural output will be inversely proportional to
off farm work or income.

51st International Scientific Conference on Economic and Social Development – Rabat, 26-27 March 2020
238
Thus, relatively higher agricultural output had a negative effect on the decision to participate in
off farm work. High agricultural output may ensure that the household had sufficient food.
This situation may reduce the chances of the household to seek off farm work in order to ensure
survival. The effect of education of the household head was examined for how it affected the
decision to participate in off farm work and the corresponding levels of intensity. The results
depicted a coefficient with a negative sign, which was significant (see also Escobal 2001). This
was contrary to assertion that education fosters participation in off farm work. This was a
departure from what had been observed by Woldehanna et al. (2000) that agricultural education
had no effect at all on off farm work decisions. Woldehanna et al.(2000)s’ findings are in
contrast to Sumner (1982), De Janvry and Sadoulet (2001) and Yunez-Naude and Taylor
(2010). The negative influence of education on off farm work may probably suggest that rural
households seek off farm work simply to ensure survival. The increase in human capital
(education) ensures that a household stands a better chance of increasing the level of farm
productivity. If that is the case, then a household would not be obliged to seek off farm
activities. The coefficient of household size displayed results which were contrary to the
existing assertion that large family size had a relatively higher marginal utility of income and a
strong desire to participate in off farm work (Woldehanna, et al., 2000). However, given that
the coefficient was not statistically significant, this study failed to derive any inference about
how the variable affected the decision to participate in off farm activities. There was no
indication that a nearby market (daily or weekly) influenced the decision to participate in off
farm work, as suggested by the insignificant coefficient, as was similarly found by Escobal,
(2001).
4.2. Factors Determining Intensity of Participation.
As highlighted earlier there is a possibility that, the Tobit model may be nested in the
independent hurdle model. In view of that, in the second stage of determining the intensity of
participation, a Tobit model is estimated as well for the purpose of undertaking a test of nested
models. Analytical results suggest that there some variables which were not significant in the
first hurdle but they have significant influence in the second hurdle. This is a testimony that,
these variables can’t be combined and estimated by a single equation such as Tobit as it may
end up generating ambiguous results (Matshe and Young 2003). Nevertheless, a likelihood
ratio test conducted, rejected the Tobit model as a nested model. This led to a conclusion that,
the participation and intensity of off farm work are two different decisions.
Table 3: Double Hurdle Model Analytical Results –Participation Intensity
Participation Coefficient
Standard
Error t Age -0.0019771 0.0061561 -0.32 Dummy (marital status) 0.0626109 0.0568085 1.1 Dummy of gender -0.1198746 0.051792 -2.13** Dummy of soil quality 0.2460991 0.1116458 2.2** Farm size 0.0000238 7.65E-06 3.11** Amount of fertilizer 0.0090992 0.0030761 2.96** Total crop output 6.50E-06 5.39E-06 1.21 Max education 0.215897 0.192346 1.21 Household size -0.0031172 5.61E-03 -0.56 Age squared 0.0000965 0.000551 1.75 Max education squared -0.007178 5.36E-03 -1.34 Distance to a market 0.000355 0.0007209 0.49 Cons 5.818505 4.06E-01 14.33***
Source: NBS (2008/9); ***= Highly significant at 1 percent and **=significant at 5 percent.
Wald Chi-Square (12) = 65.23 Prob> Chi-Square =0.000, PseudoR2=0.2864, Log
likelihood=-48736.705
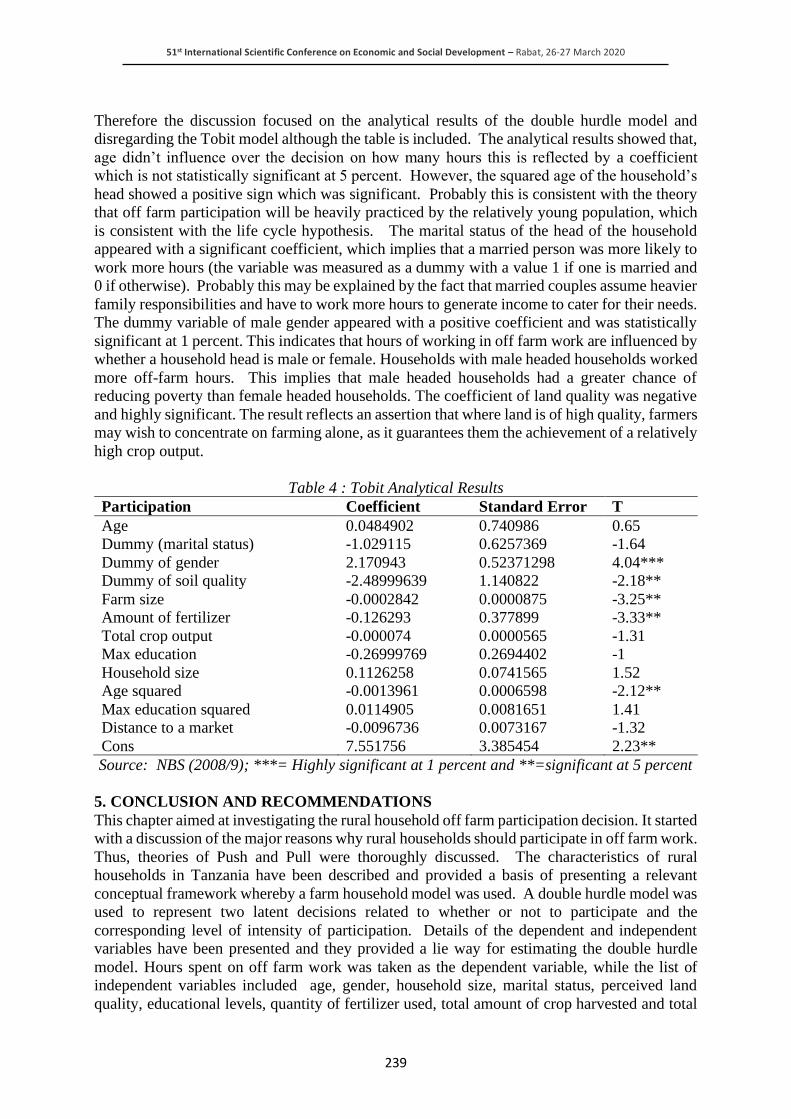
51st International Scientific Conference on Economic and Social Development – Rabat, 26-27 March 2020
239
Therefore the discussion focused on the analytical results of the double hurdle model and
disregarding the Tobit model although the table is included. The analytical results showed that,
age didn’t influence over the decision on how many hours this is reflected by a coefficient
which is not statistically significant at 5 percent. However, the squared age of the household’s
head showed a positive sign which was significant. Probably this is consistent with the theory
that off farm participation will be heavily practiced by the relatively young population, which
is consistent with the life cycle hypothesis. The marital status of the head of the household
appeared with a significant coefficient, which implies that a married person was more likely to
work more hours (the variable was measured as a dummy with a value 1 if one is married and
0 if otherwise). Probably this may be explained by the fact that married couples assume heavier
family responsibilities and have to work more hours to generate income to cater for their needs.
The dummy variable of male gender appeared with a positive coefficient and was statistically
significant at 1 percent. This indicates that hours of working in off farm work are influenced by
whether a household head is male or female. Households with male headed households worked
more off-farm hours. This implies that male headed households had a greater chance of
reducing poverty than female headed households. The coefficient of land quality was negative
and highly significant. The result reflects an assertion that where land is of high quality, farmers
may wish to concentrate on farming alone, as it guarantees them the achievement of a relatively
high crop output.
Table 4 : Tobit Analytical Results
Participation Coefficient Standard Error T
Age 0.0484902 0.740986 0.65
Dummy (marital status) -1.029115 0.6257369 -1.64
Dummy of gender 2.170943 0.52371298 4.04***
Dummy of soil quality -2.48999639 1.140822 -2.18**
Farm size -0.0002842 0.0000875 -3.25**
Amount of fertilizer -0.126293 0.377899 -3.33**
Total crop output -0.000074 0.0000565 -1.31
Max education -0.26999769 0.2694402 -1
Household size 0.1126258 0.0741565 1.52
Age squared -0.0013961 0.0006598 -2.12**
Max education squared 0.0114905 0.0081651 1.41
Distance to a market -0.0096736 0.0073167 -1.32
Cons 7.551756 3.385454 2.23**
Source: NBS (2008/9); ***= Highly significant at 1 percent and **=significant at 5 percent
5. CONCLUSION AND RECOMMENDATIONS
This chapter aimed at investigating the rural household off farm participation decision. It started
with a discussion of the major reasons why rural households should participate in off farm work.
Thus, theories of Push and Pull were thoroughly discussed. The characteristics of rural
households in Tanzania have been described and provided a basis of presenting a relevant
conceptual framework whereby a farm household model was used. A double hurdle model was
used to represent two latent decisions related to whether or not to participate and the
corresponding level of intensity of participation. Details of the dependent and independent
variables have been presented and they provided a lie way for estimating the double hurdle
model. Hours spent on off farm work was taken as the dependent variable, while the list of
independent variables included age, gender, household size, marital status, perceived land
quality, educational levels, quantity of fertilizer used, total amount of crop harvested and total

51st International Scientific Conference on Economic and Social Development – Rabat, 26-27 March 2020
240
area under cultivation for each household. The analytical results have shown that, marital status,
land quality, farm size, level of farm output and household size are important variables that
influence the decision to participate in off farm work. In addition, age, the dummy variable of
male gender, marital status and land quality were the main determinants of the intensity of
participation in off farm work. The study has further confirmed that, the decision to participate
passed through two hurdles. Variables that determined the intensity to participate or number of
hours to work in off farm work include: age of the household’s head which has showed a
positive sign which was significant. The married couples are more likely to work hours. Male
headed households are more likely to work more hours compared to their counterpart female
headed households while the coefficient of land quality was negative and highly significant,
reflecting that where land is of high quality, farmers may wish to concentrate on farming alone,
as it guarantees them the achievement of a relatively high crop output.
LITERATURE:
1. Abdulai, A. and A. CroleRees. (2001). Constraints and Income Diversification Strategies:
Evidence from Southern Mali. Food Policy Vol. 26, No. 4, pp. 437-452.
2. Abrevaya, J. (2002). Computing Marginal Effects In The Box–Cox Model. Econometric
Reviews. Vol. 21, No. 3, Pp. 383–393, 2002.
3. Ahituv, A. and Kimhi, A. (2002). ‘Off-Farm Work and Capital Accumulation Decisions of
Farmers over the Life Cycle’, The Journal of Development Economics, Vol. 68 (2002):
329-353.
4. Alobo S (2012). “Determinants of Rural Household Income Diversification in Senegal and
Kenya”. Lund University, Sweden.
5. Amsalu, B. Kindie, G. Belay, K. and Chaurasia, S.P.R. (2013) Off-Farm Labor Supply
Decision of Adults in Rural Ethiopia: Double Hurdle Approach. Journal of Agricultural
Economics and Development Vol. 2(4), pp. 154-165.
6. Anríquez, G. and Daidone, S. (2008).Linkages between Farm and Non-Farm Sectors at the
Household Level in Rural Ghana. A Consistent Stochastic Distance Function Approach.
The Food and Agriculture Organization. Ghana.
7. Asfaw, S., Shiferaw, B., Simtowe, F. & Haile, M. B. (2010). Agricultural Technology
Adoption, Seed Access Constraints and Commercialization in Ethiopia. Journal of
Development and Agricultural Economics Vol. 3(9), 436-447.
8. Bai, J. T.I Wahl, B.T. Lohmar, and Huang, J. (2010). Food Away From Home in Beijing,
Effects of Wealth, Time and Free Meals. China Economic Review 21:432-441.
9. Baltagi, B. (2008). Econometric Analysis of Panel Data. New York: John Wiley & Sons.
10. Bardhan, P.andUdry, C. (1999). Development Microeconomics. Oxford University Press.
11. Barrett R. B. and Reardon T. (2000) Asset, Activity, and Income Diversification among
African Agriculturalists. Some Practical Issues. Michigan State University.
12. Barrett, C.B., Reardon, T. and Webb, P. (2001). Nonfarm Income Diversification and
Household Livelihood Strategies in Rural Africa: Concepts, Dynamics, and Policy
Implications. Food Policy, 26(4), 315-331.
13. Becker, G.S.(1965). A Theory of the Allocation of Time. The Economic Journal. Vol. 75.
No 299. Pp 493-517.
14. Blundell, R. and Meghir, C. (1987) Bivariate Alternatives to the Univariate Tobit Model,
Journal of Econometrics, 34, 179-200.
15. Cameron, A.C. and Trivedi P.K. (2010) Micro-econometrics Using Stata Revised Edition.
Stata Press, 706 pages. Original Edition (2009).
16. Cragg, J.G., 1971. Some Statistical Models for Limited Dependent Variables with
Applications To The Demand For Durable Goods. Econometrica 39, 829–844.

51st International Scientific Conference on Economic and Social Development – Rabat, 26-27 March 2020
241
17. De Janvry, A., Sadoulet, E., 2001. Income Strategies among Rural Households in Mexico:
The Role of Off-Farm Activities. Journal of World Development. 29, 467–480.
18. Deaton, A (1997) The Analysis of Household Surveys. A Micro-econometric Approach to
Development Policy. The Baltimore, MD, Johns Hopkins University Press.
19. Dimova, R. and Sen, K. (2010). Is Household Income Diversification a means of Survival
or Accumulation? A Panel Data Evidence from Tanzania. World Poverty Institute, The
University of Manchester, Brooks.
20. Ellis, F. and Allison, E.H. (2004). Livelihood Diversification and Natural Resources
Management. Working Paper No. 6, Livelihood Support Programme, FAO, Rome.
21. Escobal, J. (2001). The Determinants of Non farm Income Diversification in Rural Peru.
Journal of World Development. Vol.29 No 3. 497-508.
22. IFPRI (2011). Cereal production and technology adoption in Ethiopia. IFPRI discussion
paper. 2011.
23. IMF (2009): Tanzania: The Story of an African Transition. Washington DC: IMF.
24. Johnston, B. F., and Mellor, J. W. (1961). The Role of Agriculture in Economic
Development. The American Economic Review, 51(4), 566–593.
25. Jones, A. M. (1989). A double Hurdle Model of Cigarette Consumption. Journal of Applied
Econometrics. Vol 4. No. 1. 23-29.
26. Kabede, T. A. (2001).Farm Household Technical Efficiency: A stochastic Frontier
Analysis, A Study of Rice Producers in Mardi, Watershed in the Western Development
Region of Nepal. Unpublished Msc Thesis Submitted to Department of Economics and
Social Science Agricultural University.
27. Karamagi, I.J.(2002) . Examining and Economic Technical Efficiency: Empirical
Applications Using Panel Data from Alberta’s Dairy Farms. A Unpublished PhD Thesis
Submitted to the Faculty of Graduate Studies and Research in Partial Fulfillment of the
Requirements for the Degree of Doctor of Philosophy. Department of Rural Economy.
Edmonton, Alberta, Canada.
28. Kibaara, W. B. (2005), Technical Efficiency in Kenyan’s Maize Production: An
Application of the Stochastic Frontier Approach, Department of Agricultural and Resource
Economics, Colorado State University, USA. Unpublished Master Thesis.
29. Kilic, T., Carletto, C., Miluka, J. and Savastano, S. (2009). Rural Nonfarm Income and its
Impact on Agriculture: Evidence from Albania. Agricultural Economics, 40(2),139-160.
30. Lajos, Z. B, Bojnec S. fertő, I and Latruffe, L. (2010). The Impact of Non-Farm Income on
the Investment in Agriculture: Evidence From Hungary and Slovenia. Paper Presented in
118th EAAE Seminar on “Rural Development: Governance, Policy Design and Delivery”
Ljubljana.
31. Lanjouw J.O and Lanjouw P. (1997) Rural Nonfarm Employment. An Update, Washington
D.C Unprocessed Policy Research Department, the World Bank
32. . Lay, A. and Schuler D. (2007). Income Diversification and Poverty in a Growing
Agricultural Economy; The Case of Ghana. Kiel Institute for the World Economy.
University of Gottingen.
33. Lien, G., Kumbhakar, S.C. and Hardaker, J.B. (2010). Determinants of Off-farm Work and
its Effects on Farm Performance: The case of Norwegian Grain Farmers. Agricultural
Economics, 41: 577-586.
34. Lire, E. (2003) Income Diversification in Zimbabwe. Welfare Implications from Urban And
Rural Areas. FCND Discussion Paper. International Food Policy Research Institute.
35. Maertens, M. (2008) Horticulture Exports, Agro-industrialization and Farm- nonfarm
linkages with the smallholder farm sector: Evidence from Senegal. LICOS. Centre for
Institutions and Economic Performance. Centre of Excellence. Discussion Paper 214/2008.
36. Mathenge M.K. And Tschirley, D (2007) Off Farm Work And Farm Production Decision.
51st International Scientific Conference on Economic and Social Development – Rabat, 26-27 March 2020
242
37. Evidence From Maize Producing Households In Rural Kenya. Paper Submitted For The
SAE Conference 2007 On Economic Development In Africa. St. Catherine College,
University Of Oxford- Uk.
38. Matshe, I.A. and Young, T. (2004). Off-Farm Labour Allocation Decisions in Small-Scale
Rural Households in Zimbabwe. Journal of Agricultural Economics 30 (2004) 175–186.
39. Mishra, A. and Goodwin, B. (1997); Farm Income Variability and the Supply of Off-Farm
Labor. American Journal of Agricultural Economics, 1997, vol. 79, issue 3, pages 880-887.
40. Modigliani, F., 1986. Life Cycle, Individual Thrift, and the Wealth of Nations. American
Journal of Economics. Rev. 76, 297–313.
41. Mduma, J.K. (2006). Rural Off farm Employment and its Effects on Adoption of Labour
Intensive Soil Conserving Measures in Tanzania. Development Economics. Peter Lang.
Vol.54.
42. Mduma John K. And P. Wobst (2005). Determinants of Rural Labor Market Participation
in African Studies Quarterly Volume 8, Issue 2 Spring Tanzania.
43. Pfeiffer, L., L´opez-Fledman, A.,and Taylor, J.E., 2009. Is Off-Farm Income Reforming
The Farm? Evidence from Mexico. Journal of Agriculture Economics. 40, 125–138.
44. Reardon T. (1997). Using Evidence of Household Income Diversification to Inform Study
Of Rural Non- Farm Labor Market In Africa. World Development, 25 (5) 735-748.
45. Reardon, T. and Corral, L (2001). Rural Non-Farm Income in Nicaragua, Journal of World
Development 29(3) Pp. 427-441.
46. Reardon, T. E, Crawford & V. Kelly (1994):”Links between Non-farm Income and Farm
Investment in African Households: Adding the Capital Market Perspective,” American
Journal of Agricultural Economics, Vol. 76 (December): 1172-1176.
47. Richard, T.J., and Jeffrey, S.R. (1998). Economic Performance of Alberta Dairy. Staff Paper
No. 98-102, Department of Rural Economy, University of Alberta.
48. Stevenson, R.E. (1980), "Likelihood Functions for Generalized Stochastic Frontier
Estimation", Journal of Econometrics, 13, 57-66.
49. Singh, I. Squire, L. and Strauss. J. (1986). Agricultural Household Models: Extensions,
Applications and Policy. John Hopkins University Press, Baltimore.
50. Schultz, T. W. (1964). Transforming traditional agriculture. New Haven, Connecticut: Yale
University Press.
51. Shi X., Heerink, N., & Qu, F. (2007). Choices between Different Off-Farm Employment
Subcategories: An Empirical Analysis for Jiangxi Province, China. China Economic
Review, 18(4), 438-455.
52. Singh, I., Squire, L. and Strauss, J., 1986. Agricultural Household Models. Extensions,
Applications and Policy. The World Bank, The Johns Hopkins University Press, Baltimore,
MD.
53. Smith, K.R., 2002. Does Off-Farm Work Hinder Smart Farming? Agricultural Outlook,
Economic Research Service/Usda, September, 28– 30.
54. Smitha, D.R. Gordon, A.Meadows,K. and Zwick, K (2001). Livelihood Diversification in
Uganda: Patterns and Determinants of Change Across Two Rural Districts. Journal of Food
Policy 26 (2001) 421–435.
55. Sumner,D.A.(1982). The Off Farm Labour Supply of Farmers. American Journal of
Agricultural Economics. Vol. 64: No.3.3 Pp499-509.
56. Teklewold, H., Dadi, L., & Dana, N. (2006). Determinants of Adoption of Poultry
Technology: A Double Hurdle Approach. Livestock Research for Rural Development,
18(3), 40-43.
57. URT (2012). Ministry of Agriculture, Food Security and Cooperatives, Agricultural census
sample survey. Tanzania.
51st International Scientific Conference on Economic and Social Development – Rabat, 26-27 March 2020
243
58. URT (2013). National Agricultural Policy. The Ministry of Agriculture Food Security and
Cooperative, United Republic of Tanzania.
59. Verbeek, M. (2008). A Guide to Modern Econometrics. Third Edition. RSM Erasmus
University, Rotterdam, John Wiley & Sons Ltd.
60. Weir S. &Knight,J. (2000). "Adoption and diffusion of agricultural innovations in Ethiopia:
the role of Education," CSAE Working Paper Series 2000-05, Centre for the Study of
African Economies, University of Oxford.
61. Woldehanna, T. (2000a). Economic Analysis and Policy Implication of farm and off-farm
employment: A Case Study in the Tigray Region of Northern Ethiopia. Mansholt Studies
18 and PhD Thesis. Agricultural Economics and Rural Policy Group, Wageningen
University.
62. Woldehanna, T., and Oskam, A. (2001). Off-farm employment and income inequality: The
implication for poverty reduction strategy. Ethiopia. Journal of Economics. 4, 41–57.
63. Woldehanna, T., Oude Lansink, A., Peerlings, J., (2000b). Off-Farm Work Decisions on
Dutch Cash Crop Farms and the 1997 and Agenda 2000 CAP Reforms. Journal Of
Agricultural Economics. 22, 163–171.
64. World Bank (2008).Small Enterprise Growth and the Rural Investment Climate: Evidence
from Tanzania. Agriculture and Rural Development Unit, Africa Region.
65. World Bank (2009) Climate Volatility and Poverty Vulnerability in Tanzania. The World
Bank.
66. World Bank (2015) What Drives Local Food Prices? Evidence from the Tanzanian Maize
Market. Policy Research Working Paper 7338.
67. Yang, D. T. (1997) “Education and Off-Farm Work,” Economic Development and Cultural
Change, 45(3): 613-632.
68. Yen, S. (1993). Working Wives and Food Away from Home. The Box- Cox Hurdle Model.
American Journal of Agricultural Economics. Volume 75, Issue 4, Pp 884-895. Yen, S.T.
(1995) Alternative Transformations in a Class of Limited Dependent Variable Models-
Alcohol Consumption by US Women. Journal of Applied Economics, 2, 258–262.
69. Yunez-Naude, A. and Taylor, J.E. (2010). The Determinants of Non Farm Activities and
Incomes of Rural Households in Mexico, with emphasizes on education. Journal of World
Development. Vol. 29. No3. 561-572.
51st International Scientific Conference on Economic and Social Development – Rabat, 26-27 March 2020
244
THE ROLE OF 'ORIENT' AS 'OTHER' IN EUROPE’S VISUAL
COMMUNICATION STRATEGIES
Ilze Loza
Art Academy of Latvia, Latvia
Vidzeme University of Applied Sciences, Latvia
ABSTRACT
The globalization processes throughout the world have fostered an amalgamative intertwining
of cultural and religious systems. The affluence of visual communication, such as
advertisements, print media, and the arts, into a region, can be indicators of shifting identity
and an acknowledgment of growing diversity. Particularly sensitive ethical issues in design
today are racial stereotypes and the reflection of religious ethical standards, notably, reflection
of Islamic culture. Consequentially, in global visual politics, the controversial role owned by
the “veil”, means different things to different people. In the 21st century, particularly in Europe
veiling/unveiling becomes a symbol of visual cultural performance and identity matter, that
marks communities of race and religion in popular culture. The veil has become a symbol of
“cultural sovereignty”, visual expression of identity, embodied in interactive participatory
performance. The research paper explores the meaning of the “veil” in visual communication
systems in the European region. The cultural differences between Eastern and Western culture
structures conduct implications in visual communication strategies as the same design
communication intend can be applied to different means of content and, vice versa, the same
content can be 'designed' in different ways. The reflection and comprehension of immersion in
cross-cultural conversations and fresh perspective to “orient” as “other” is the keynote to
nowadays reality. This paper considers the interactions between design and visual
communication and cultural and religious systems.
Keywords: Eastern and Western culture, Globalisation, Veil, Visual Communication
1. CROSS CULTURAL INTERACTIONS
This article analyses visual politics, the impact of Islamic culture on visual communication
strategies in 21st century Europe and the influence of cross-cultural interactions. The interaction
between the principles of culture, religion and visual politics as a result of 21st-century
globalization and migration processes as well as contemplate visual communication strategies
in Europe and visual global politics directions. Globalization at the end of the 20th century and
the beginning of the 21st-century experience digital revolution and breakthroughs in
information and communication technologies have drawn nations closer together and have
enabled producers of mass media artifacts to rapidly transmit their messages to a global
audience. The global processes and migration are leading disparate human groups to integrate
to a point that national and local boundaries and the traditional concept of a community rooted
in a geographic area may lose their meaning. Haque, is the book Advertising in Developing and
Emerging Countries: The Economic, Political and Social Context stated that "globalization in
today’s world clearly has implications for every conceivable arena of human endeavor,
especially for cultural products and commodities where they are accessible to people as part of
a global market" (Haque 2016, 19). The past half-century has witnessed a growth in scholarship
and course offerings on topics concerning cross-cultural, international communications and
visual communication, furthermore, Thatcher expounding “researchers simply do not know
how and what is happening” (Thatcher et al. 2007,125). Such rapid cross-cultural fluctuations
call for new approaches that reach beyond the confines of any predetermined, localized frames,
and/or sets of cultural understandings, including consideration of meanings that are to be found
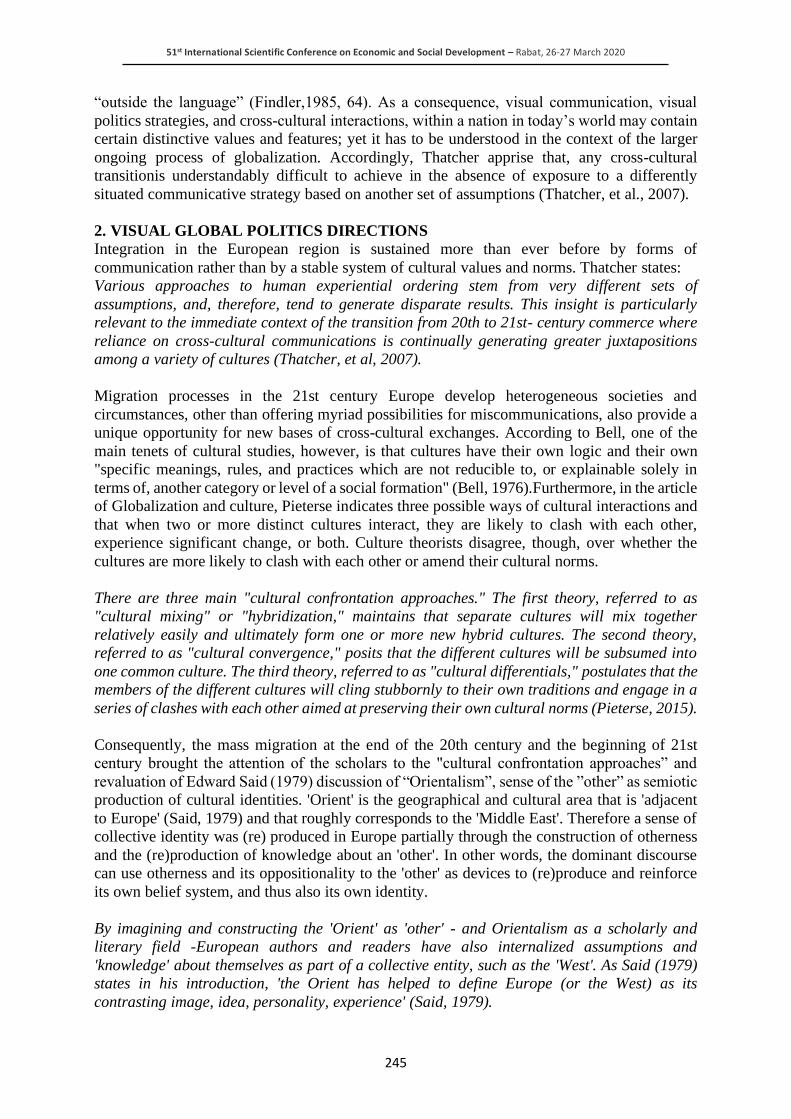
51st International Scientific Conference on Economic and Social Development – Rabat, 26-27 March 2020
245
“outside the language” (Findler,1985, 64). As a consequence, visual communication, visual
politics strategies, and cross-cultural interactions, within a nation in today’s world may contain
certain distinctive values and features; yet it has to be understood in the context of the larger
ongoing process of globalization. Accordingly, Thatcher apprise that, any cross-cultural
transitionis understandably difficult to achieve in the absence of exposure to a differently
situated communicative strategy based on another set of assumptions (Thatcher, et al., 2007).
2. VISUAL GLOBAL POLITICS DIRECTIONS
Integration in the European region is sustained more than ever before by forms of
communication rather than by a stable system of cultural values and norms. Thatcher states:
Various approaches to human experiential ordering stem from very different sets of
assumptions, and, therefore, tend to generate disparate results. This insight is particularly
relevant to the immediate context of the transition from 20th to 21st- century commerce where
reliance on cross-cultural communications is continually generating greater juxtapositions
among a variety of cultures (Thatcher, et al, 2007).
Migration processes in the 21st century Europe develop heterogeneous societies and
circumstances, other than offering myriad possibilities for miscommunications, also provide a
unique opportunity for new bases of cross-cultural exchanges. According to Bell, one of the
main tenets of cultural studies, however, is that cultures have their own logic and their own
"specific meanings, rules, and practices which are not reducible to, or explainable solely in
terms of, another category or level of a social formation" (Bell, 1976).Furthermore, in the article
of Globalization and culture, Pieterse indicates three possible ways of cultural interactions and
that when two or more distinct cultures interact, they are likely to clash with each other,
experience significant change, or both. Culture theorists disagree, though, over whether the
cultures are more likely to clash with each other or amend their cultural norms.
There are three main "cultural confrontation approaches." The first theory, referred to as
"cultural mixing" or "hybridization," maintains that separate cultures will mix together
relatively easily and ultimately form one or more new hybrid cultures. The second theory,
referred to as "cultural convergence," posits that the different cultures will be subsumed into
one common culture. The third theory, referred to as "cultural differentials," postulates that the
members of the different cultures will cling stubbornly to their own traditions and engage in a
series of clashes with each other aimed at preserving their own cultural norms (Pieterse, 2015).
Consequently, the mass migration at the end of the 20th century and the beginning of 21st
century brought the attention of the scholars to the "cultural confrontation approaches” and
revaluation of Edward Said (1979) discussion of “Orientalism”, sense of the ”other” as semiotic
production of cultural identities. 'Orient' is the geographical and cultural area that is 'adjacent
to Europe' (Said, 1979) and that roughly corresponds to the 'Middle East'. Therefore a sense of
collective identity was (re) produced in Europe partially through the construction of otherness
and the (re)production of knowledge about an 'other'. In other words, the dominant discourse
can use otherness and its oppositionality to the 'other' as devices to (re)produce and reinforce
its own belief system, and thus also its own identity.
By imagining and constructing the 'Orient' as 'other' - and Orientalism as a scholarly and
literary field -European authors and readers have also internalized assumptions and
'knowledge' about themselves as part of a collective entity, such as the 'West'. As Said (1979)
states in his introduction, 'the Orient has helped to define Europe (or the West) as its
contrasting image, idea, personality, experience' (Said, 1979).
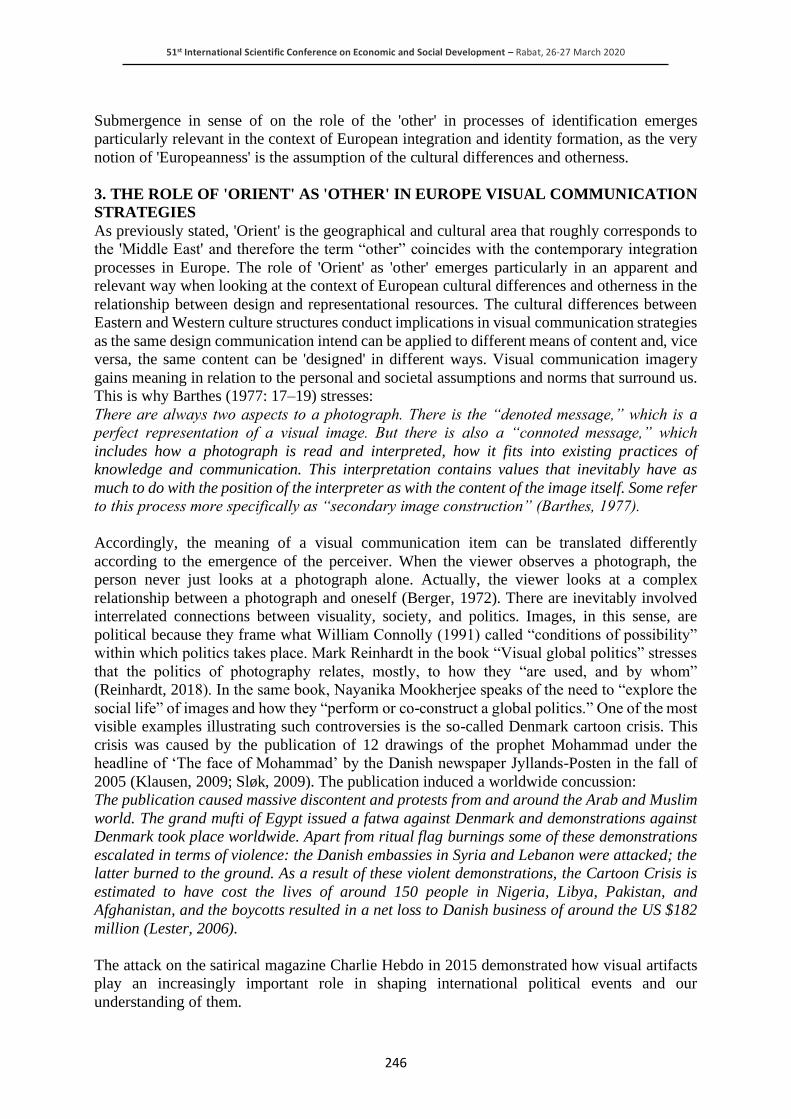
51st International Scientific Conference on Economic and Social Development – Rabat, 26-27 March 2020
246
Submergence in sense of on the role of the 'other' in processes of identification emerges
particularly relevant in the context of European integration and identity formation, as the very
notion of 'Europeanness' is the assumption of the cultural differences and otherness.
3. THE ROLE OF 'ORIENT' AS 'OTHER' IN EUROPE VISUAL COMMUNICATION
STRATEGIES
As previously stated, 'Orient' is the geographical and cultural area that roughly corresponds to
the 'Middle East' and therefore the term “other” coincides with the contemporary integration
processes in Europe. The role of 'Orient' as 'other' emerges particularly in an apparent and
relevant way when looking at the context of European cultural differences and otherness in the
relationship between design and representational resources. The cultural differences between
Eastern and Western culture structures conduct implications in visual communication strategies
as the same design communication intend can be applied to different means of content and, vice
versa, the same content can be 'designed' in different ways. Visual communication imagery
gains meaning in relation to the personal and societal assumptions and norms that surround us.
This is why Barthes (1977: 17–19) stresses:
There are always two aspects to a photograph. There is the “denoted message,” which is a
perfect representation of a visual image. But there is also a “connoted message,” which
includes how a photograph is read and interpreted, how it fits into existing practices of
knowledge and communication. This interpretation contains values that inevitably have as
much to do with the position of the interpreter as with the content of the image itself. Some refer
to this process more specifically as “secondary image construction” (Barthes, 1977).
Accordingly, the meaning of a visual communication item can be translated differently
according to the emergence of the perceiver. When the viewer observes a photograph, the
person never just looks at a photograph alone. Actually, the viewer looks at a complex
relationship between a photograph and oneself (Berger, 1972). There are inevitably involved
interrelated connections between visuality, society, and politics. Images, in this sense, are
political because they frame what William Connolly (1991) called “conditions of possibility”
within which politics takes place. Mark Reinhardt in the book “Visual global politics” stresses
that the politics of photography relates, mostly, to how they “are used, and by whom”
(Reinhardt, 2018). In the same book, Nayanika Mookherjee speaks of the need to “explore the
social life” of images and how they “perform or co-construct a global politics.” One of the most
visible examples illustrating such controversies is the so-called Denmark cartoon crisis. This
crisis was caused by the publication of 12 drawings of the prophet Mohammad under the
headline of ‘The face of Mohammad’ by the Danish newspaper Jyllands-Posten in the fall of
2005 (Klausen, 2009; Sløk, 2009). The publication induced a worldwide concussion:
The publication caused massive discontent and protests from and around the Arab and Muslim
world. The grand mufti of Egypt issued a fatwa against Denmark and demonstrations against
Denmark took place worldwide. Apart from ritual flag burnings some of these demonstrations
escalated in terms of violence: the Danish embassies in Syria and Lebanon were attacked; the
latter burned to the ground. As a result of these violent demonstrations, the Cartoon Crisis is
estimated to have cost the lives of around 150 people in Nigeria, Libya, Pakistan, and
Afghanistan, and the boycotts resulted in a net loss to Danish business of around the US $182
million (Lester, 2006).
The attack on the satirical magazine Charlie Hebdo in 2015 demonstrated how visual artifacts
play an increasingly important role in shaping international political events and our
understanding of them.

51st International Scientific Conference on Economic and Social Development – Rabat, 26-27 March 2020
247
This incident also showed unsettling relation of culture and politics, especially when cultural
activities in civil society become immerse in global politics. As follows, visual communication
strategies and visual artifacts become inconsequential and harmless to some, a form of freedom
of expression for others, extremely offensive to another. Consequentially, in global visual
politics, the controversial role owned by the “veil”, means different things to different people.
In the 21st century, particularly in Europe veiling/unveiling becomes a symbol of visual cultural
performance and identity matter, that marks communities of race and religion in the popular
culture. The veil has become a symbol of “cultural sovereignty”, visual expression of identity,
embodied in interactive participatory performance. Following poster visually promote
considerations to the previous statements:
Figure 3: West/East. Both Sides of Intolerance
Source: www.adsoftheworld.com
In 2002, the agency "Master" created a media campaign "West/East. Both Sides of
Intolerance"(Figure 1). The poster depicts the face of two women cheek to cheek, one with her
eyes covered and the other with her eyes uncovered. The poster reads "West/ East – Both sides
of intolerance". Under the theme of tolerance, it shows that what we believe about each other
across the West/ East divide is often based on an unwillingness to really find out about each
other. The poster was created by Marcos Rene, Patricia Papp, and Luis Trevisani. Question of
identities—as in ‘identity politics’, which the first known use is Goffman, (1963: 123–5), is a
matter of personal self-understanding, identity is always political because declarations of
identity always made on the verge of demanding membership (Goffman,1963). Roland Bleiker
in the book “Visual Global Politics” wrote:Following poster visually promote considerations to
the previous statements:
Significant implications follow because veiling is not just a private issue but a highly political
one. Some states enforce a mandatory practice while others have banned it – using female
bodies and their visual appearance as political markers of culture or of secularism respectively
(Bleiker, 2018).
The ban of the full-face Islamic veil in public places was introduced on 11 April 2011. France
became the first European country to ban the full-face Islamic veil in public places. Under the
ban, no woman, French or foreign, is able to leave their home with their face hidden behind a
veil without running the risk of a fine. France the largest Muslim minority in Western Europe,
about five million Muslims, only about 2,000 women wear full veils (BBC, 2018).

51st International Scientific Conference on Economic and Social Development – Rabat, 26-27 March 2020
248
According William A. Callahan veil produces essentialized self–other relations in Western
society:
The guiding image of the veil is of a woman wearing a burqa, a black garment that covers the
face and the body, somewhere in the Middle East. Such visual cultural performances produce
essentialized self–other relations, which in turn evoke other sites of identity/difference: race,
ethnicity, religion (Callahan, 2018).
As a response to states enforced mandatory practice caused a backlash within some part of
Western society members. Two young women, who call themselves “NiqaBitch,” protested the
veil bans through a video of themselves walking around Paris dressed in niqab that covered
their faces and upper bodies, along with hot pants and high heels that displayed their bare legs
(Figure 2).
Figure 4: NiqaBitch
Source: www.theguardian.com
The video shows how they got “thumbs up” support from many on the street, and even a request
for a fan photo from the policewoman guarding France’s Ministry of Immigration and National
Identity. Here timing was crucial – when the law went into effect a few months later, the same
policewoman would be obliged to fine them for the same veiling activity (Malik, 2010). Memac
Oglivy and SHE (Saudi Heroines Empowering a Nation) collaborated with director Omar Hilal
for an evocative film that challenges perceptions of Saudi, Arab and Muslim women. Film
advertisement ‘How Well Do You Know Her?’ calling out globally for the tolerance of cultural
differences and acceptance of the veil. Film advertisement created within the category: Public
Interest, NGO, challenges perceptions of the veil as a tool of oppression. Social advertisement
‘How Well Do You Know Her?’ sought to challenge negative stereotypes by focusing on
women’s achievements (Figure 3).
Figure 5: How Well Do You Know Her?
Source: www.adsoftheworld.com)
Featured advertisement avoiding any confrontations, deliberately keeping historical tendency
of modesty of the displayed person keeping traditions of Islamic restrained style when it comes
to visualization of the female figure. In the Islamic culture, gender roles, particularly women’s
roles, is a sensitive topic in visual communication, strongly influenced by religion. Publicizing
female images in the Middle East amounts to being irreligious and disrespectful; images of

51st International Scientific Conference on Economic and Social Development – Rabat, 26-27 March 2020
249
Arab women in advertising seemingly violate long-held traditions within the Islamic private
and public spheres (Kraidy 2006). Therefore, even if the advertisement “How Well Do You
Know Her?” was launched in February 2018, communication strategy didn’t achieve attention
in the global visual politic scene. In comparison, there are appearances of visual communication
systems in the Europe region displaying aggressive and confrontational approaches when it
comes to the veiling/unveiling issues. The example below depicts print advertisement called
“Burka”, created by the advertising agency “Grabarz & Partner”, Germany, December 2007
(Figure 4).
Figure 6: Burka
Source: www.adsoftheworld.com
The veil also became a site of art, fashion, satirical activism. “Princess Hijab” uses graffiti art
“to spark debates about fundamentalism and feminism” by drawing veils with a black marker
pen on fashion posters in the Paris Metro (Christafis 2010). Advertisements combine the
Eastern with the Western in a startling way. The images seem to call attention to the binaries
that are used to justify Western “liberation” and Eastern “oppression,” expressed by the
sexualized bodies of Western advertising and the Islamic veil, and also suggest the damaging
effects of advertising images (Chrisafis, 2010). The precise artifact is important for culture
theorists for the impact of global communication as similar art performances took a place in the
past but never before had drawn international attention towards the visual communication of
the symbolism of the Veil. Guerrilla niqab art has been exhibited from New York to Vienna,
sparking debates about feminism and fundamentalism (Figure 5).
Figure 7: Guerrilla niqab
Source: www.theguardian.com

51st International Scientific Conference on Economic and Social Development – Rabat, 26-27 March 2020
250
Another example of satirical activism is Hussein Chalayan's provoking "Burka" show
(Misanthrope, 2010). In 1997 Hussein Chalayan, fashion designer and professor at the
University of Applied Arts Vienna crossed the line between performance art and fashion in his
show "Burka" (Figure 6). The performance challenged ideas of modesty, identity, and
femininity, challenging taboos of Western and Eastern societies.
Figure 8: Burka show
Source: ilikecatsmorethanpeople.blogspot.com
Hussein Chalayan's provoking 'Burka' show in 1997 detained press attention, nevertheless,
didn’t emerge to the visual symbol of the Veil politics as “Princess Hijab” or “NiqaBitch” did
even if appears much more provoking and controversial than the two latter ones.In 2013, the
Italian brand “Diesel” launched an advertising campaign called “I Am Not What I Appear To
Be” designed by Nicola Formichetti (Candice, 2013). The advertisement as a part of the new
"Diesel Reboot" campaign, which seeks to "baptize a new era of energy, bravery, and bold
iconography at Diesel." Diesel’s visuals featuring a tattooed, a topless white woman wearing a
redesigned denim burqa (Figure 7).
Figure 9: Diesel Reboot
Source: www.dailylife.com.au

51st International Scientific Conference on Economic and Social Development – Rabat, 26-27 March 2020
251
Many Muslim women spoke out, mainly against the advertisement, but others, including a
female Muslim marketing consultant Ameena Meer, who advised Diesel, said the idea was to
make people question assumptions and stereotypes.
This was to challenge that idea that when you see a woman in a burqa, or niqab or even hijab,
that you assume certain things about her (Religion News Service, 2013).
There are inevitably involved interrelated connections between visuality, society, and politics.
Images, in this sense, are political because they frame what William Connolly (1991) called
“conditions of possibility” within which politics takes place (Connolly, 1991). Mark Reinhardt
in the book “Visual global politics” stresses that the politics of photography relates, mostly, to
how they “are used, and by whom" (Reinhardt, 2018). In the same book, Nayanika Mookherjee
speaks of the need to “explore the social life” of images and how they “perform or co-construct
a global politics" (Mookherjee, 2018).Shruti Parekh in an article for MTV Desi, comments on
“Diesel” advertisement campaign:
This image would mean something drastically different if it was created by Muslim women, and
if the woman was actually a Muslim model in the context of a fundamentalist Islamic regime. It
might be radical, bold, and subversive. It might actually be an empowered assertion of women's
sexuality. If created and released in drastically different context, this ad might be less offensive
and even "empowering" (Jha, 2013).
In response to the “Diesel” advertisement campaign, a non-profit organization, Media Literacy
Project (MLP) offered a counter-ad emphasizing Islamic value, Muslim women’s modesty, and
power. The counter-adverts is a deconstruction of the original Diesel ad and intended to start
conversations about modesty, Islam, women, and the media. MLP collaborated with Afia
Fitriati to create the text, “I don’t need to be naked to be free” (Figure 8) MLP stressed that,
taking one’s clothes off does not equal to freedom, rather making woman sexual tools for
advertisers (Project, 2013).
Figure 10: I don’t need to be naked to be free
Source: newmexicomercury.com
The 21st century is bringing the shifting edge of visual culture distribution, which is not only
owned by powerful media conglomerates that generate and distribute discourses, genres, and
styles of communication. Rather, communication of visions and cultural discourses is also
created by social media users, photographers, artists, and designers - found within and across
global flows of semiotic commodities which are responsible for shaping and reshaping or
producing and reproducing transnational visual identities.
51st International Scientific Conference on Economic and Social Development – Rabat, 26-27 March 2020
252
4. CONCLUSION
The reflection and comprehension of immersion in cross-cultural conversations and fresh
perspective to “Orient” as “other” is the keynote to nowadays reality. From the research, above,
implies, the ethics of graphic design and visual communication are closely related to
globalization processes and intercultural influences. Particularly sensitive ethical issues in
design today are racial stereotypes and the reflection of religious ethical standards, notably,
reflection of Islamic culture. Visual communication both - forms and reflects our social life,
activities are widely affected by intercultural processes; new types of ethical values are present
in the 21st century based on the interaction of different nationalities in the proximate space.
Mass migration from Middle East regions to European countries influencing the way society
responds and reflects on ethically sensitive topics of Islamic culture. One of the most visible
and controversial symbols of Islamic culture in Western society’s is the veil (niqab, burka).
Consequentially, in global visual politics, the controversial role owned by the “veil” means
different things to different people. In the 21st century, particularly in Europe veiling/unveiling
becomes a symbol of visual cultural performance and identity matter, that marks communities
of race and religion in popular culture. The appearance of visual communication systems in
Europe region displaying an aggressive and confrontational approach when it comes to the
veiling/unveiling issue, as an example is a print advertisement called “Burka”, created by
advertising agency “Grabarz & Partner”, Germany December 2007. The veil also became a site
of performance art, fashion item, subject of social activism as shown in examples "niqabitch",
graffiti art of “Princess Hijab”, Hussein Chalayan's “Burka” show. In conclusion, globalization
is a new stage in the development of social relations, in which politics, economy, culture, and
ecology are united in a single interdependence network that influences every society and
individual person. Further research will be conducted for a doctoral degree in the History of
Arts, the Art Academy of Latvia: “Influence of Globalisation and Islamic Culture on the
European Advertising Design 21st Century.”
ACKNOWLEDGEMENT: This research was supported by Art Academy of Latvia.
LITERATURE:
1. Barthes, R., 1977. Image, Music, Text. London: Fontana Press.
2. Bell, D., 1996. The cultural contradictions of capitalism. New York: Basic Books.
3. Berger, J., 1972. Ways of Seeing. London: Penguin Books.
4. Bleiker, R., 2018. Visual Global Politics. First edition ed. London: Routledge.
5. Bleiker, R., 2018. Visual Global Politics. First edition ed. London: Routledge.
6. Callahan, A., 2018. Culture . In: R. Bleiker, ed. Visual Global Politics. London: Routledge,
pp. 82-88.
7. Callahan, W. A., 2018. Culture. In: R. Bleiker, ed. Visual Global Politics. London:
Routledge, p. 81.
8. Chalayan, H., (2010). Hussein Chalayan - Burka (1996) Retrieved 25.01.2020. from
http://ilikecatsmorethanpeople.blogspot.com/2010/11/hussein-chalayan-burka-1996.html
9. Connolly, W. E., 1991. Identity/Difference: Democratic Negotiations of the Political
Paradox. Ithaca, NY: Cornell University Press.
10. Findler, R., 1985. Reason and spontaneity: A new solution to the problem o f fact and value.
The Modern Schoolman, March , Volume 66(Issue 3), pp. Pages 236-238.
11. Formichetti, N., (2013). Diesel ad campaign features tatooed woman in Niqab Retrieved
25.01.2020. from http://www.dailylife.com.au/dl-people/dl-entertainment/diesel-ad-camp
aign-features-tatooed-woman-in-niqab-20130911-2tj84.html
12. Goffman, E., 1963. Stigma. New York: Simon and Schuster.
51st International Scientific Conference on Economic and Social Development – Rabat, 26-27 March 2020
253
13. Grabarz & Partner. (2007). Burka Retrieved 16.01.2020. from
https://www.adsoftheworld.com/media/print/burka
14. Haque, S., 2016. Introduction. In: E. C. Alozie, ed. Advertising in developing and emerging
countries : the economic, political and social context.. London: Routledge, p. 19.
15. Jha, R., 2013. Diesel's New Ad Campaign Features A Model Who Is Both Topless And In
A Burqa.
16. Klausen, J., 2009. The Danish cartoons and modern iconoclasm in the cosmopolitan Muslim
diaspora. Harvard Middle Eastern and Islamic Review, Volume 8.
17. Kraidy, M. M., 2006. Islamic Popular Culture, Common Ground News Service.
18. Lester, R., 2006. Cartoon crisis will not damage Danes. Marketing Week, 29(6).
19. Marcos, R., Patricia P., & Luis T. (2005). West/East. Both Sides of Intolerance Retrieved
10.01.2020. from https://www.adsoftheworld.com/media/print/west_vs_east
20. Marcos, R., Patricia, P. & Luis, T., 2005. Ads of the world
21. Media Literacy ProjectPrint. (2013). Counter-Ad to Diesel’s Affront to Muslim Women
Retrieved 5.02.2020. from http://newmexicomercury.com/blog/comments/counter_
22. Millar, A., 2013. A “Topless Burka-Clad Model” and Radical Islamic Fashion.
23. Mirzoeff, N., 1999. An Introduction to Visual Culture. New York: Routledge.
24. Mookherjee, N., 2018. Memory. In: Visual Global Politics. London: Routledge, pp. 201-
208.
25. Nesrine, M. (2010). 'NiqaBitch' unveil themselves in Paris Retrieved 10.01.2020. from
https://www.theguardian.com/commentisfree/2010/oct/07/niqabitch-niqab-debate
26. Nesrine, M., 2010. 'NiqaBitch' unveil themselves in Paris. [Online]
27. NiqaBitch, 2010. NiqaBitch shakes Paris.
28. Ogilvy. (2018). How Well Do You Know Her? Retrieved 15.01.2020. from
https://www.adsoftheworld.com/media/film/she_how_well_do_you_know_her
29. Pieterse, J. N., 2015. Globalisation and Culture: Global Mélange. Lanham: Rowman &
Littlefield Publishers.
30. Princess Hijab. (2010). Cornered – Princess Hijab, Paris's elusive graffiti artist Retrieved
20.01.2020. from https://www.theguardian.com/artanddesign/2010/nov/11/princess-hijab-
paris-graffiti-artist
31. Reinhardt, M., 2018. Violence. In: Visual Global Politics. London: Routledge, pp. 321-327.
32. Religion News Service, 2013. Diesel Burqa Ad: Islamophobic Or Empowering.
33. Said, W. E., 1979. Orientalism. New York: Pantheon Books.
34. Sløk, C., 2009. Here I Stand: Lutheran stubbornness in the Danish Prime Minister’s Office
during the cartoon crisis. European Journal of Social Theory, 12(2), p. 231–248.
35. Thatcher Barry B., 2007. Web Site Analysis across Cultures: An Inquiry into Intercultural
Values and Web Site Design. Linguistic and Cultural Online Communication

51st International Scientific Conference on Economic and Social Development – Rabat, 26-27 March 2020
254
MEDIA INDUSTRY IN A POST-INDUSTRIAL SOCIETY: MEDIA
INDUSTRY REVENUE CONVERGENCE AND BLURRED
BOUNDARIES IN MEDIA SECTOR
Josko Lozic
University North, Varazdin/Koprivnica, Croatia
ABSTRACT
The aim of this paper is to point out the changes brought about by post-industrial society and
the way in which income within individual industries is calculated. The "old" media industries
used the method of calculating income as other industries created during the development of
classical capitalism in the 20th century. The development of the internet and post-industrial
society has directly influenced the development of "new" media industries. The digitization of
the production process has enabled the convergence of different sectors of the media industry
and the distribution of content on the Internet. Digitization, convergence of media sectors and
distribution of content online have enabled media corporations to define themselves in other
industrial sectors as the "blurred boundaries" of industries. The incomes of the classical media
industry can no longer be precisely divided into individual media sectors. The gaming industry
was created in the middle of the last century, but it is only fully developing its production and
distribution on the Internet. The revenue generated in the old media industry will be compared
to the revenue of the gaming industry as a new media industry. Post-industrial society and the
blurred boundaries of corporations and industry require a redefinition of how the media
industries are calculated.
Keywords: blurred border, convergence, gaming industry, old media industry, post-industrial
society
1. INTRODUCTION
The digitalization of production process and the development of the Internet have enabled the
development and transformation of all types of industries. The media industry was one of the
first industries to be pressured by the changes dictated by digital technology. The digitalisation
of media content was so dramatic that it shook the foundations laid with the invention of the
printing press. Media production was closely linked to the classical economic paradigm that
could be applied to all forms of manufacturing industries. In this context, we define the
manufacturing industry as a form of manufacturing activity as described by Marx, that is, we
are talking about a model of productive capitalism. The end of the 20th century will mark the
end of a social era in which the model of productive capitalism is coming to an end, and the
development of social relations in the 21st century is analysed as a post-industrial period or
post-modern society. Classical productive capitalism is being transformed into metacapitalism,
creating a whole new business paradigm for analysing income, costs and profits generated
within existing business organizations. Post-industrial society is developing new forms of
media content consumption, which is a direct consequence of the digitalisation and convergence
of business systems. The common feature of all these processes lies in the blurred boundaries
of the business reach of media corporations as well as the blurred boundaries of social structures
that consume particular types of media content.
2. DIFFERENTIATION BETWEEN “OLD” AND “NEW” MEDIA INDUSTRY
Media encompass all goal-orientated technical means or instruments for the procurements of
information in print, visual, or auditory forms as well as the organizational and institutional
entities behind them that generate and provide this information (Wirtz 2011: 15).

51st International Scientific Conference on Economic and Social Development – Rabat, 26-27 March 2020
255
The media industry is not monolith but rather a conglomerate of different industries that have
the creation of mediated content as a common activity (Kung 2008: 1). Terminology is
important, but like mercury, it’s slippery. The term “media industry” covers a huge slice of
territory ranging over print, sound, screen, and digital bits in space, in Venus as various as
corporate communications, advertising, web sites, novels, films, recordings, and music being
shared person to person Internet (Hilmes 2009: 1). Companies that are engaged in cable
television […]. Companies now compete with one another across markets and in different
industries in the media economy (Albarran 2010: 3). The old media industries used the financial
methodology of calculating revenue and costs like all other industries. The sectors of the media
industry referenced by Kung, as well as other scholars, are divided into four basic categories:
broadcasting, publishing, film and entertainment and advertising. The development of the
Internet, the digitization of production and distribution of content, and in particular the
convergence of media platforms, marked the end of existing forms of the media industry, which
peaked at the end of the 20th century. What is meant by “new media” varies somewhat, but
generally it includes the Internet, video and computer games, and mobile devices including
iPods, PDAs, and telephones. (Marshall 2009: 81). Technology has become the word most
closely assisted with new media (Hendricks 2010: 5). New media are based on computing
technologies, use digital information, and usually involve connection to an open digital
communication network. New media products combine different types of content, often involve
communication, and can be products of service (Kung 2008: 10). The “new media” industry
has changed the fundamental paradigm of the old media industry. The mass media that
produced and distributed content from one place was replaced by multiple focal points that
produced and broadcast content. The media corporations that controlled the media market could
no longer control the distribution of content on platforms that appeared on the Internet. This
has irreversibly affected the economics of the media industry and not the methodology for
calculating the revenues, expenses and expenses of business activities in the media industry.
3. VIDEO GAMING INDUSTRY
The video game industry is opening up completely new segments of media industry research.
While research in the old media industry was more focused on media ownership, quality of
media content and aspects of the political economy of the media, new media industry research
focused on convergence of media platforms, technological development and distribution of
content as a basis for generating revenues for media industries. Old media industries have
developed specific development techniques for each segment of the media industry. The entire
development, production and distribution infrastructure was closed within the media
organization. A production model known as productive capitalism with an emphasis on winning
and defending an existing market segment. The new media industry uses an open organization
model and creates an ecosystem within which it develops completely new segments of the
media industry. The new model implies completely new forms of distribution and the Internet
as a core infrastructure. Publishing was among the first media industries to be hit by new
production models. Digitization and development based on the use of Internet distribution have
completely changed the business paradigm. The distribution of digital copies and the use of
zero marginal cost effects have paved the way for a completely new business concept (Lozić
2019: 125-136). The foundations have been laid to build a new media industry. Within that, the
video game industry began to grow rapidly. The video games software industry appears to be
one of the most innovative labs for the coming digital economy: it is developing and
experimenting new digital services (online, offline and mobile) that manage to reach a growing
share of the population, across all demographics (De Prato et.al 2014). Video games is a specific
kind of digital entertainment in which the gamer interacts with a digital interface and is faced
with challenges of various kinds, depending on the plot of the game (Zackarssion, Wilson 2012:

51st International Scientific Conference on Economic and Social Development – Rabat, 26-27 March 2020
256
5). Although video games are software, they are more than software, and too often they and
their producers remain lumped into the same categories as software developers. Assumptions
are made about what compromises a game and its production process, which continues to hold
the video game industry and the art of game production back from its full potential (O’Donnell
2012: 30). Video games, as an evolution of the analogical game, as a digitalization of the game,
have become the most relevant contemporary emergent cultural form, in terms of consumption
and business volume (Escribano 2012: 201). Video games occupy a (pop) cultural niche
competing most directly with the movie and music industries for the consumer’s time and
money[...] (although the so-called serious games space is starting to makes its mark more
clearly (Egenfeldt-Nielsen et.al 2016: 16). Those days, a mobile game is typically one of three
things (Manning, Buttfield-Addison 2017: 4): a) a simple game, with carefully chosen
interactions, graphics, and controlled complexity, because the game design was best supported
by these facets; b) a much more complex affair, available for anything ranging from specialized
mobile game consoles to smartphones; and c) a mobile port of a game that debuted on a console
of PC. In an era where Angry Birds is a household name, mobile gaming becomes more than a
pastime activity. It’s a serious 21 st century industry that spans markets, continents and cultures
(Alegre 2018). Although video games were introduced in the 20th century, their exponential
growth only emerged with the development of fast internet. Video game revenue is rising
sharply with the Generation Z, but only with the Generation of Y does it become a global
phenomenon. This is why we link them to the development of a post-industrial society in which
the barriers between genders, generations and social statuses that are found within the video
game industry are breaking down. The phenomenon of video games can be analysed from a
number of different perspectives. These include enjoyment, socializing, collaborating,
competing, seeking recognition, escaping from routine and other reasons (Liu 2017).
Researchers increasingly believe that understanding online-game player behaviour is crucial to
the success of online-game providers (Liu, Chang 2016). Ip et.al. (2008) explores the
correlation between playing time and school performance. Frequent gamers (measured as those
who spend, on average, more than two hours per day playing games) are less likely to obtain
higher marks across all subject disciplines than non- or infrequent gamers (Ip et.al 2008).
Simulation games imitate realistic scenarios in life, sports, and economics. Strategy games
require a global view, for instance when managing an economy while fighting rivals. Action
games need game-play virtuosity as the gamer controls every move of the counter that usually
can kill and can be killed. Role-playing games are rooted in pen-and-paper role-playing games
and therefore have many creative and social aspects as the gamer creates and develops a
character while interacting with real or digital others (Braun et.al.) The internet population is
expected to reach approximately 746 million by 2020, and a large number of consumers
expected to get introduced to using digital platforms (Simon 2016). The number of active video
gamers worldwide increases every year as access to a variety of games and gaming platforms
increases with new technologies. Statista estimates 2.21 billion gamers worldwide in 2017 with
an estimate of 2.73 billion by 2021 (HKExnews).
4. BLURRING BOUNDARIES IN MEDIA INDUSTRY
Hamel and Prahalad are among the first to mention the term blurring boundaries at the end of
the last century. They assume that there are no longer firm boundaries on the scope of
organizations' business activities. Unless there are firm limits on coverage, revenue from core
activities cannot be precisely defined. Some industries are more “structured” than others, in the
rules of competition are more clear-cut […]. Deregulation, globalization, fundamental
breakthrough in science, and the strategic importance of information technology are blurring
boundaries in a wide variety of industries (Hamel and Prahald 1996). Technological advances
are rapidly blurring traditional industry boundaries and enabling competition between various
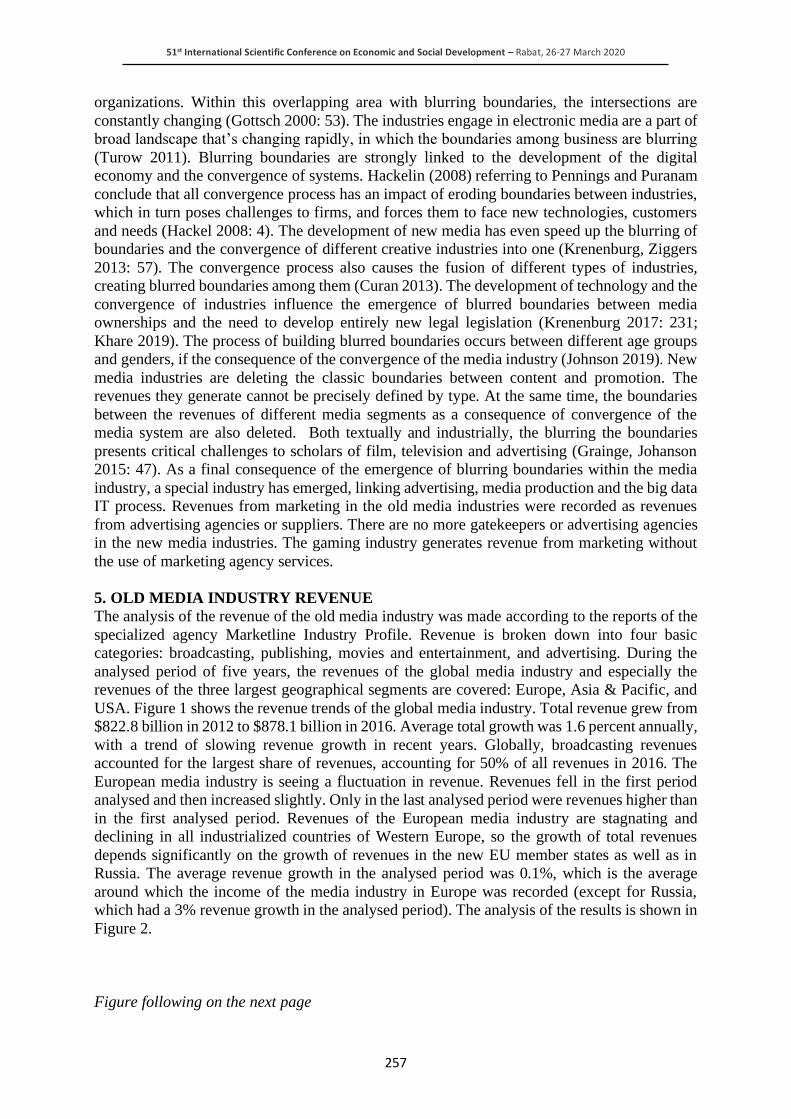
51st International Scientific Conference on Economic and Social Development – Rabat, 26-27 March 2020
257
organizations. Within this overlapping area with blurring boundaries, the intersections are
constantly changing (Gottsch 2000: 53). The industries engage in electronic media are a part of
broad landscape that’s changing rapidly, in which the boundaries among business are blurring
(Turow 2011). Blurring boundaries are strongly linked to the development of the digital
economy and the convergence of systems. Hackelin (2008) referring to Pennings and Puranam
conclude that all convergence process has an impact of eroding boundaries between industries,
which in turn poses challenges to firms, and forces them to face new technologies, customers
and needs (Hackel 2008: 4). The development of new media has even speed up the blurring of
boundaries and the convergence of different creative industries into one (Krenenburg, Ziggers
2013: 57). The convergence process also causes the fusion of different types of industries,
creating blurred boundaries among them (Curan 2013). The development of technology and the
convergence of industries influence the emergence of blurred boundaries between media
ownerships and the need to develop entirely new legal legislation (Krenenburg 2017: 231;
Khare 2019). The process of building blurred boundaries occurs between different age groups
and genders, if the consequence of the convergence of the media industry (Johnson 2019). New
media industries are deleting the classic boundaries between content and promotion. The
revenues they generate cannot be precisely defined by type. At the same time, the boundaries
between the revenues of different media segments as a consequence of convergence of the
media system are also deleted. Both textually and industrially, the blurring the boundaries
presents critical challenges to scholars of film, television and advertising (Grainge, Johanson
2015: 47). As a final consequence of the emergence of blurring boundaries within the media
industry, a special industry has emerged, linking advertising, media production and the big data
IT process. Revenues from marketing in the old media industries were recorded as revenues
from advertising agencies or suppliers. There are no more gatekeepers or advertising agencies
in the new media industries. The gaming industry generates revenue from marketing without
the use of marketing agency services.
5. OLD MEDIA INDUSTRY REVENUE
The analysis of the revenue of the old media industry was made according to the reports of the
specialized agency Marketline Industry Profile. Revenue is broken down into four basic
categories: broadcasting, publishing, movies and entertainment, and advertising. During the
analysed period of five years, the revenues of the global media industry and especially the
revenues of the three largest geographical segments are covered: Europe, Asia & Pacific, and
USA. Figure 1 shows the revenue trends of the global media industry. Total revenue grew from
$822.8 billion in 2012 to $878.1 billion in 2016. Average total growth was 1.6 percent annually,
with a trend of slowing revenue growth in recent years. Globally, broadcasting revenues
accounted for the largest share of revenues, accounting for 50% of all revenues in 2016. The
European media industry is seeing a fluctuation in revenue. Revenues fell in the first period
analysed and then increased slightly. Only in the last analysed period were revenues higher than
in the first analysed period. Revenues of the European media industry are stagnating and
declining in all industrialized countries of Western Europe, so the growth of total revenues
depends significantly on the growth of revenues in the new EU member states as well as in
Russia. The average revenue growth in the analysed period was 0.1%, which is the average
around which the income of the media industry in Europe was recorded (except for Russia,
which had a 3% revenue growth in the analysed period). The analysis of the results is shown in
Figure 2.
Figure following on the next page
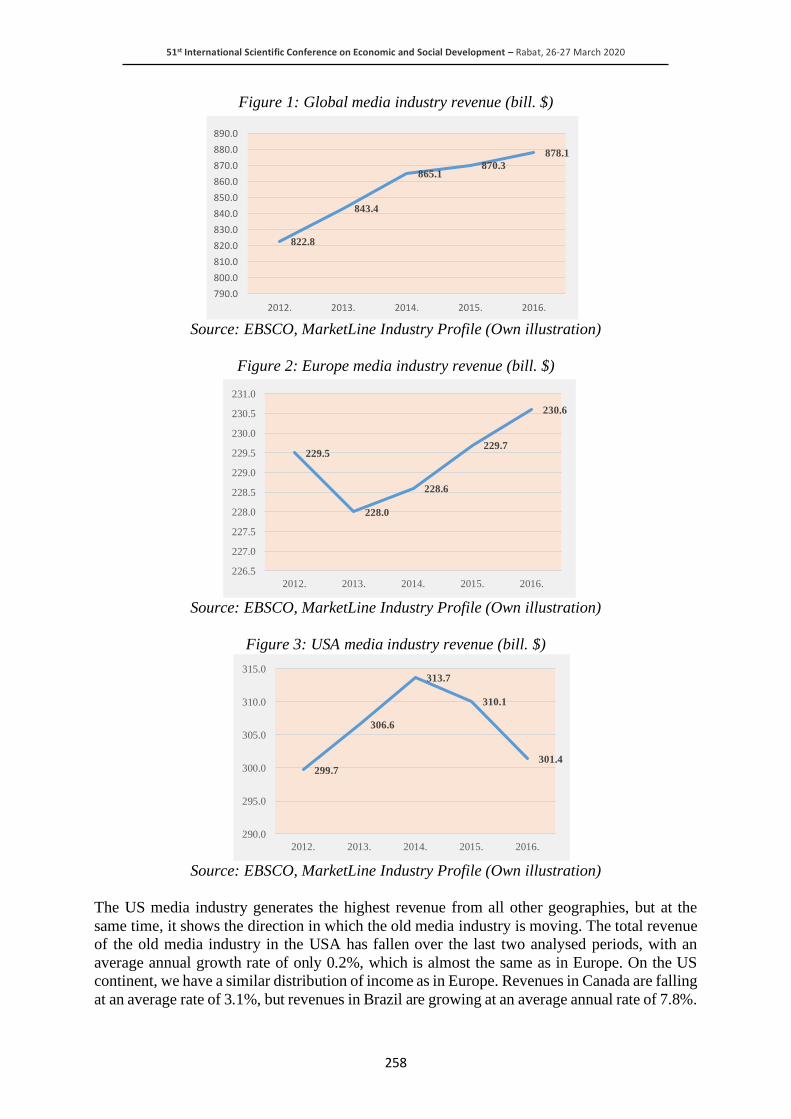
51st International Scientific Conference on Economic and Social Development – Rabat, 26-27 March 2020
258
Figure 1: Global media industry revenue (bill. $)
Source: EBSCO, MarketLine Industry Profile (Own illustration)
Figure 2: Europe media industry revenue (bill. $)
Source: EBSCO, MarketLine Industry Profile (Own illustration)
Figure 3: USA media industry revenue (bill. $)
Source: EBSCO, MarketLine Industry Profile (Own illustration)
The US media industry generates the highest revenue from all other geographies, but at the
same time, it shows the direction in which the old media industry is moving. The total revenue
of the old media industry in the USA has fallen over the last two analysed periods, with an
average annual growth rate of only 0.2%, which is almost the same as in Europe. On the US
continent, we have a similar distribution of income as in Europe. Revenues in Canada are falling
at an average rate of 3.1%, but revenues in Brazil are growing at an average annual rate of 7.8%.
822.8
843.4
865.1870.3
878.1
790.0
800.0
810.0
820.0
830.0
840.0
850.0
860.0
870.0
880.0
890.0
2012. 2013. 2014. 2015. 2016.
229.5
228.0
228.6
229.7
230.6
226.5
227.0
227.5
228.0
228.5
229.0
229.5
230.0
230.5
231.0
2012. 2013. 2014. 2015. 2016.
299.7
306.6
313.7
310.1
301.4
290.0
295.0
300.0
305.0
310.0
315.0
2012. 2013. 2014. 2015. 2016.
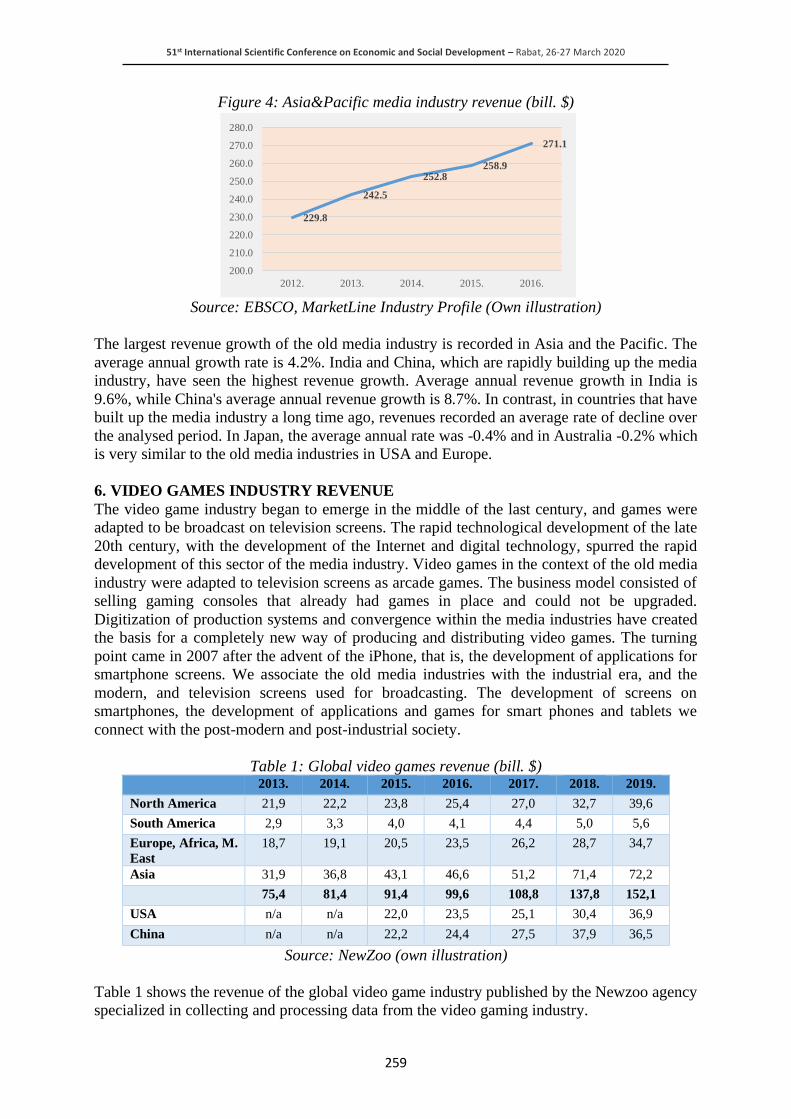
51st International Scientific Conference on Economic and Social Development – Rabat, 26-27 March 2020
259
Figure 4: Asia&Pacific media industry revenue (bill. $)
Source: EBSCO, MarketLine Industry Profile (Own illustration)
The largest revenue growth of the old media industry is recorded in Asia and the Pacific. The
average annual growth rate is 4.2%. India and China, which are rapidly building up the media
industry, have seen the highest revenue growth. Average annual revenue growth in India is
9.6%, while China's average annual revenue growth is 8.7%. In contrast, in countries that have
built up the media industry a long time ago, revenues recorded an average rate of decline over
the analysed period. In Japan, the average annual rate was -0.4% and in Australia -0.2% which
is very similar to the old media industries in USA and Europe.
6. VIDEO GAMES INDUSTRY REVENUE
The video game industry began to emerge in the middle of the last century, and games were
adapted to be broadcast on television screens. The rapid technological development of the late
20th century, with the development of the Internet and digital technology, spurred the rapid
development of this sector of the media industry. Video games in the context of the old media
industry were adapted to television screens as arcade games. The business model consisted of
selling gaming consoles that already had games in place and could not be upgraded.
Digitization of production systems and convergence within the media industries have created
the basis for a completely new way of producing and distributing video games. The turning
point came in 2007 after the advent of the iPhone, that is, the development of applications for
smartphone screens. We associate the old media industries with the industrial era, and the
modern, and television screens used for broadcasting. The development of screens on
smartphones, the development of applications and games for smart phones and tablets we
connect with the post-modern and post-industrial society.
Table 1: Global video games revenue (bill. $) 2013. 2014. 2015. 2016. 2017. 2018. 2019.
North America 21,9 22,2 23,8 25,4 27,0 32,7 39,6
South America 2,9 3,3 4,0 4,1 4,4 5,0 5,6
Europe, Africa, M.
East
18,7 19,1 20,5 23,5 26,2 28,7 34,7
Asia 31,9 36,8 43,1 46,6 51,2 71,4 72,2
75,4 81,4 91,4 99,6 108,8 137,8 152,1
USA n/a n/a 22,0 23,5 25,1 30,4 36,9
China n/a n/a 22,2 24,4 27,5 37,9 36,5
Source: NewZoo (own illustration)
Table 1 shows the revenue of the global video game industry published by the Newzoo agency
specialized in collecting and processing data from the video gaming industry.
229.8
242.5
252.8258.9
271.1
200.0
210.0
220.0
230.0
240.0
250.0
260.0
270.0
280.0
2012. 2013. 2014. 2015. 2016.
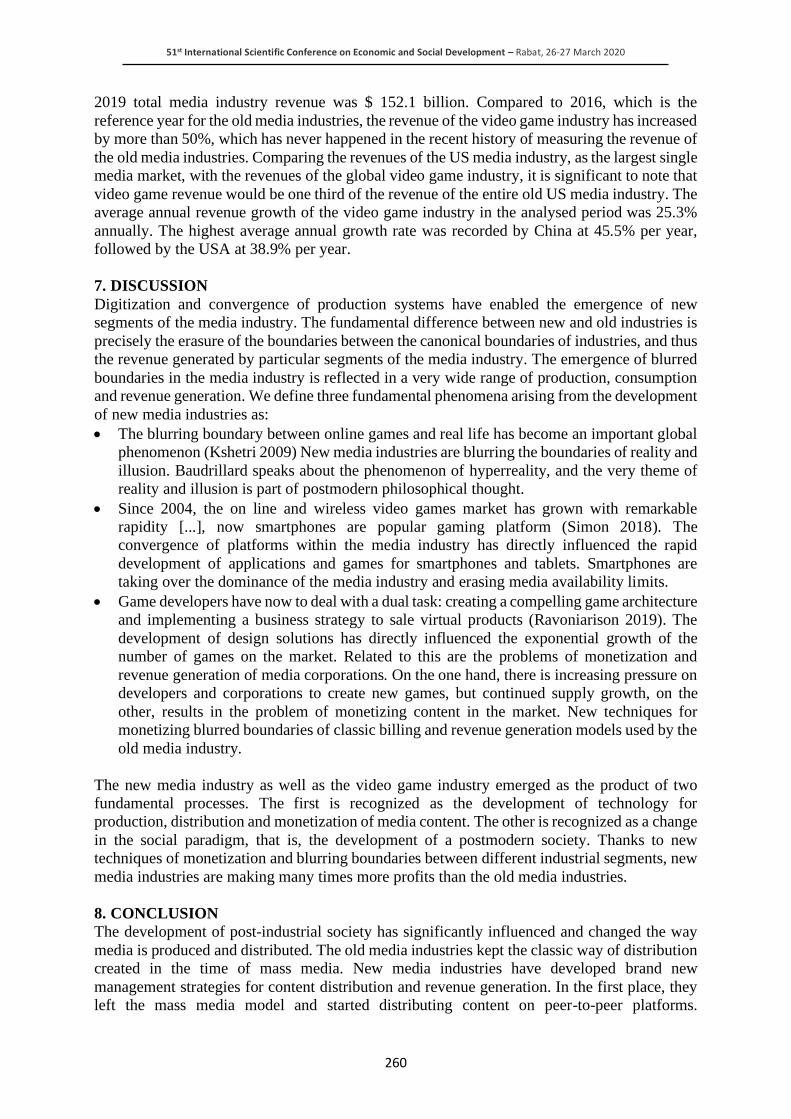
51st International Scientific Conference on Economic and Social Development – Rabat, 26-27 March 2020
260
2019 total media industry revenue was $ 152.1 billion. Compared to 2016, which is the
reference year for the old media industries, the revenue of the video game industry has increased
by more than 50%, which has never happened in the recent history of measuring the revenue of
the old media industries. Comparing the revenues of the US media industry, as the largest single
media market, with the revenues of the global video game industry, it is significant to note that
video game revenue would be one third of the revenue of the entire old US media industry. The
average annual revenue growth of the video game industry in the analysed period was 25.3%
annually. The highest average annual growth rate was recorded by China at 45.5% per year,
followed by the USA at 38.9% per year.
7. DISCUSSION
Digitization and convergence of production systems have enabled the emergence of new
segments of the media industry. The fundamental difference between new and old industries is
precisely the erasure of the boundaries between the canonical boundaries of industries, and thus
the revenue generated by particular segments of the media industry. The emergence of blurred
boundaries in the media industry is reflected in a very wide range of production, consumption
and revenue generation. We define three fundamental phenomena arising from the development
of new media industries as:
• The blurring boundary between online games and real life has become an important global
phenomenon (Kshetri 2009) New media industries are blurring the boundaries of reality and
illusion. Baudrillard speaks about the phenomenon of hyperreality, and the very theme of
reality and illusion is part of postmodern philosophical thought.
• Since 2004, the on line and wireless video games market has grown with remarkable
rapidity [...], now smartphones are popular gaming platform (Simon 2018). The
convergence of platforms within the media industry has directly influenced the rapid
development of applications and games for smartphones and tablets. Smartphones are
taking over the dominance of the media industry and erasing media availability limits.
• Game developers have now to deal with a dual task: creating a compelling game architecture
and implementing a business strategy to sale virtual products (Ravoniarison 2019). The
development of design solutions has directly influenced the exponential growth of the
number of games on the market. Related to this are the problems of monetization and
revenue generation of media corporations. On the one hand, there is increasing pressure on
developers and corporations to create new games, but continued supply growth, on the
other, results in the problem of monetizing content in the market. New techniques for
monetizing blurred boundaries of classic billing and revenue generation models used by the
old media industry.
The new media industry as well as the video game industry emerged as the product of two
fundamental processes. The first is recognized as the development of technology for
production, distribution and monetization of media content. The other is recognized as a change
in the social paradigm, that is, the development of a postmodern society. Thanks to new
techniques of monetization and blurring boundaries between different industrial segments, new
media industries are making many times more profits than the old media industries.
8. CONCLUSION
The development of post-industrial society has significantly influenced and changed the way
media is produced and distributed. The old media industries kept the classic way of distribution
created in the time of mass media. New media industries have developed brand new
management strategies for content distribution and revenue generation. In the first place, they
left the mass media model and started distributing content on peer-to-peer platforms.

51st International Scientific Conference on Economic and Social Development – Rabat, 26-27 March 2020
261
Postmodern society is characterized by blurred boundaries in all segments of activity, so this
only spilled over to the consumption of content in the media industry. Blurred boundaries in
the video game industry mean deleting boundaries between age groups, genders, professional
orientations, marital status, living conditions and the like. New management strategies, in line
with new circumstances within the media market, are developing new ways of generating
revenue tailored to blurred boundaries in all segments of the social life and media industries.
LITERATURE:
1. Albarran, A.B. (2010). The Media Economy.Routlegde. Taylor & Francis Group.
2. Alegre, M. (2018). “Why Mobile Games Are More Important To Your Brand Than You
Thought”. Forbes. https://www.forbes.com/sites/forbestechcouncil/2018/09/05/
why-mobile-games-are-more-important-to-your-brand-than-you-thought/#45b7f4651
22; [20.01.2020.]
3. Braun, B.; Stopfer, J.M.; Müller, K.W.; Beutel, M.E.; Egloff, B. (2016), “Personality and
video gaming: comparing regular gamers, non-gamers, and gaming addicts and
differentiating between game genres”, Computers in Human Behavior. Vol. 55, pp. 406-
412.
4. Curan, C.S. (2013). The Anticipation of Converging Industry: A concept Applied
Nutraceuticals and Functional Foods. Spinger.
5. De Prato, G.; Feijoo, C.; Simon, J.P. (2014) “The Road to E-Services: Online and Mobile
Games as Enablers”. (eds), Beak, Y. et al. Trends and Application of Serious Gaming and
Social Media, Gaming Media and Social Effects. Springer Science Business Media
Singapore
6. Egenfeldt-Nielsen, S.; Smith, J.H.; Tosca, S.P. (2016) Understanding Video Games: The
essential Introduction, Third Edition, Routledge, Taylor & Francis Group.
7. Escribano, F. (2012) „Gamification as the Post-Modern Phalanstere: Is the Gamification
Playing with Gamification?“, (eds.) Zackarssion, P.; Wilson, L. T.(eds) (2012) The Video
Game Industry: Formation, Present State and Future, Taylor & Francis.
8. Gottsch, C. (2000). Business Strategy in Online Industry: Market and Network Strategy in
Multi-layered Industry. Deutcher- Universitats Verlag.
9. Grainge, P.; Johnson, C. (2015). Promotional Screen Industries. Routledge. Taylor &
Francis Group.
10. Hacklin, F. (2008). Management of Convergence in Innovation: Strategies and Capabilities
for Value Creation Beyond Blurring Industries Boundaries. Physica-Verlag. Springer.
11. Hamel, G.; Prahalad, C.K. (1996). Competing for the future. Harvard Business School
12. Hendricks, J.A. (2010). The Twenty-first century media industry: Economic and
Managerial Implication in the Age of New Media. Lexington books.
13. Hilmes, M. (2009). “Nailing Mercury: The Problem of Media Industry Historiography”.
(eds.) Holt, J.; Perren, A. Media Industries: History, Theory, and Method. Wiley-Blackwell.
A John Wiley & Sons, Ltd., Publication, p.21-33.
14. HKExnews (2018), “Number of active video gamers worldwide from 2014 to 2021 (in
millions)”, Statista, available at: www.statista.com/statistics/748044/number-videogamers-
world/ [20.01.2020.]
15. Ip, B.; Jacobs, G; Watkins, A. (2008). “Gaming frequency and academic performance”,
Australasian Journal of Educational Technology. Vol. 24, No. 4, pp. 355-373.
16. Johnson, D. (2019). Transgenerational Media Industries: Adults, Children, and the
Reproduction of Culture. University of Michigan Press. Ann Arbor.
17. Khare. S. “Blurring Boundaries”. https://www.linkedin.com/pulse/blurring-boundaries-
subhash-khare. [21.01.2020.]
51st International Scientific Conference on Economic and Social Development – Rabat, 26-27 March 2020
262
18. Kranenburg, Van H. (2017) “Summary and Best Practices”. (ed.). Kranenburg, Van H.
Innovation Policies in the European News Media Industry: A Comparative Study. Springer.
19. Kranenburg, Van H.; Ziggers, G.W. (2013). “Dynamic Competition and Ambidexterity”.
(eds). Towse, R.; Handke, C. Handbook on the Digital Creative Economy. Edward Elgar
20. Kshetri, N. (2009). “The Evolution of the Chinese Online Gaming Industry”. Journal of
Technology Management in China. Vol. 4 No. 2, 2009., pp. 158-179.
21. Kung, L. (2008). Strategic Management in the Media: Theory and Practice. Sage.
22. Liu, C. (2017). “A model for exploring gamers flow experience in online games”.
Information Technology & People, Vol. 30 No. 1, pp. 139-162.
23. Liu, C.C.; Chang, I.C. (2016), “Model of online game addiction: the role of computer-
mediated communication motives”, Telematics and Informatics, Vol. 33 No. 4, pp. 904-
915.
24. Lozić, J. (2019). „Zero marginal cost in magazine industry: Changing of cos paradigm in
“new” magazine industry. 44th International Scientific Conference on Economic and Social
Development. ESD Conference Split., p.p. 125-136.
25. Manning, J.; Buttfield-Addison, P. (2017). Mobile Game Development with Unity: Build
Once, Deploy Anywhere, O'Relly
26. Marketline Industry Profile, EBSCO. [22.01.2020.]
27. Marshall, P.D. (2009). “New Media as Transformed Media Industry”. (eds.) Holt, J.; Perren,
A. Media Industries: History, Theory, and Method. Wiley-Blackwell. A John Wiley &
Sons, Ltd., Publication, p.81-89.
28. Newzoo. Global Games Market Report. https://newzoo.com/solutions/standard/market-
forecasts/global-games-market-report/ [22.01.2020.]
29. O'Donnell, C. (2012) „This is Not a Software Industry“, Zackarssion, P.; Wilson, L. T.
(eds), The Video Game Industry: Formation, Present State and Future, Taylor & Francis.
30. Ravoniarison, A. (2019). Mobile Games: Players’ experiences with in-app purchases.
Journal of Research in Interactive Marketing Vol. 13 No. 1, 2019., pp. 62-78.
31. Simon, J.P. (2016). “Catching a rising star. techno-platforms study of companies with high
market capitalisation (HICAP) running global digital platforms”, available at:
https://ec.europa.eu/jrc/en/publication/how-catch-unicorn-exploration-universe-tech-
companies-high-market-capitalisation?search https://ec.europa.eu/jrc/en/publication/how-
catch-unicorn-case-studies?search [20.01.2020.]
32. Simon, J.P. (2018). “Triggering the emergence of digital ecosystems: the role of mobile and
video games in emerging economies.” Digital Policy, Regulation and Governance. Vol.
20., No. 5, pp. 449-478.
33. Turow, J. (2011). Media Today: An Introduction to Mass Communication. 4th edition.
Routledge. Taylor & Francis Group.
34. Wirtz, B.W. (2011). Media and Internet Management. Gabler Verlag, Springer Fachmedien
Wesbaden GmbH.
35. Zackarssion, P.; Wilson, L. T.(eds). (2012). The Video Game Industry: Formation, Present
State and Future. Taylor & Francis.
51st International Scientific Conference on Economic and Social Development – Rabat, 26-27 March 2020
263
PRICE RISK AND ITS IMPACT ON PRICE DECISION-MAKING AND
PRICING OF A COMPANY
Anna Kubjatkova
University of Zilina, Slovakia
Jana Kliestikova
University of Zilina, Slovakia
Lubica Gajanova
University of Zilina, Slovakia
ABSTRACT
The most common impulse for buying a product for the customer is mainly its price. The price
of a product indicates its quality and the quality of the company itself. What the price of the
product itself will be the result of the efforts of many managers who have to choose between
different pricing methods and practices. It is these practices and pricing methods that depend
on the success of the company and its ability to adapt to market changes, with the right price
of the product covering costs and ensuring a certain amount of profit. The main objective of
this work is to analyze the price risk of a company when considering the production of two
potential products. The aim was to determine, on the basis of calculations, which product would
have a lower price risk, ie the production of which product would be less risky for the company
and therefore more advantageous. In this work the methodology of mutual comparison and
analysis of price risk of individual potential products of the company was used. After
performing this analysis, we compared the price risks of these products, which we quantified
based on price risk indicators. As a given indicator we used the decrease of risk and the
necessary volume of sales. As a result of the previous analysis, we suggested that the company
would naturally choose a product with a lower price risk. Based on the methods used,
companies can choose the version where the price risk for the enterprise is the lowest when
considering the production of a product.
Keywords: Price, Price risk, Pricing
1. INTRODUCTION
Everything has a price in the market as well as in the economy itself. This depends primarily
on demand and supply. In particular, it is very important that the prices of the companies
themselves are set in such a way as to make the business and the success of these companies on
the market as efficient as possible. Each company should set its pricing in order to avoid as far
as possible the potential risks arising mainly from incorrect price decisions (Rajnak et al., 2007).
Businesses are no longer operating on the market just to make a profit, they have to realize that
they have a certain duty to the company and therefore their business must be ethically correct
because they influence social events. Therefore, pricing and its process must also be ethical in
order for the company to be represented as a reliable business entity and respected by its
customers (Sroka, Szanto, 2018). In a market environment, the customer is currently key to the
company's long-term survival and success. It is also essential for companies to constantly strive
not only to attract potential customers, but especially to maintain and strengthen their
cooperation with existing customers. Therefore, it is necessary to think about both groups of
customers when pricing, not only the customers whom the company wants to win at this price
51st International Scientific Conference on Economic and Social Development – Rabat, 26-27 March 2020
264
(Nadanyiova, 2013). When pricing companies, they must take into account the fact that the
price of a product primarily reflects the quality of the product itself or the company. To
determine the price, companies often conduct market research on the quality requirements of
the customers themselves for the product. The research of requirements and customer
satisfaction with a certain quality level of the product at a certain price is therefore an essential
part of the price decision-making process of the company and later the pricing itself (Valaskova,
Krizanova, 2008). Companies need to set goals that they want to achieve to get the right price.
Company goals are just one of a number of other questions that a business must answer.
Establishing the right and most advantageous price for a business is a lengthy process whereby
the price should respect the needs of customers, withstand the pressure of competition and
ensure the highest possible income for the company (Kita et al., 2010). To be able to achieve
its goals and meet its expectations, the company needs a sophisticated pricing strategy.
Appropriate and detailed pricing strategy allows the company to get the lead. In the case of a
company with limited resources, to optimize it is advantageous to develop a pricing strategy
especially to maintain a competitive advantage. (Nwachukwu, Hieu Fadeyi, 2018)
2. PRICE DECISION-MAKING
Generally, we understand the price decision-making of various business activities that result in
a specific pricing in the company. These activities include the collection, sorting and evaluation
of various information, whether internal or external to the enterprise. In particular, it means
information about the effects that affect prices in general and specific pricing practices for
products and services (Jankok et al., 2007). It is a fact that price decision-making is difficult
and complex, not to mention that it has a long time horizon. From setting business goals,
through product or service development, distribution channel solutions and various phases to
pricing and customer communications, this process is also demanding in terms of personnel and
expertise. This is also a difficult process in terms of monitoring and investigating behavioral
aspects of price decision making, so this process cannot be considered as simple (Valaskova,
Bartosova, Kubala, 2019). There are a large number of factors in price decision-making in the
business environment that can have a significant impact on this process. As the basic
characteristic tells us, the information the company works with is very important. Equally
essential is the target group of customers for whom the product is intended. The specific market
segment in which the products or services will be offered is also important in determining their
price. Competition is also a significant factor that also affects price decisions. Competitors'
behavior may influence the company's behavior and proce- dure in price formation (Rajnak,
2002). We know several pricing approaches in price decision-making. Cost-oriented pricing is
most commonly used in the Slovak Republic. The main idea is to cover costs and ensure a
minimum profit by establishing a gross margin. Demand-oriented pricing considers the value
perceived by the customer as the basis, not the seller's costs, as a previous approach.
Competitive pricing takes into account, in particular, competitors' prices. The company
basically follows the prices of competitors and thus does not use the possibility of setting its
own pricing strategy (Lipianska, Hasprova, 2016). In particular, price decisions are related to
the determination of the price of new products entering the market, to price changes caused by
a change in demand or production costs, or by an effort to boost demand. Similarly, these
decisions relate to price changes caused by competition and, in particular, competitive price,
and also to the formation of optimal price relations of products within a given price level on the
basis of their cost and price relationships. Price decisions in introducing new products have an
impact not only on the manufacturer, but also on customers and their purchasing behavior in
the private and non-private brands (Valaskova, Kliestikova, Krizanova, 2018). All factors, both
internal and external, must be taken into account in the context of price decisions. In addition
to the above, it should be noted that not only a particular market segment and a specific target
51st International Scientific Conference on Economic and Social Development – Rabat, 26-27 March 2020
265
group is crucial, because, for example, infrastructure design, logistics flows or established
transport systems influence the pricing decision making process (Krizanova, 2008). Many of
the economic factors involved in price decision-making are easier to quantify from a
methodological point of view and are therefore more often studied, studied and taken into
account (Caryl, Kral, Siekelova, Horak, 2019). The price decision process and pricing in an
enterprise are often exposed to limited resources and information. The fact that, in general,
terrestrial resources are not infinite contributes to the fact that continuous economic growth is
not sustainable for the future. All company decisions, including in pricing, must work with this
idea. (Popp, Olah, Fekete, Lakner, Mate, 2018)
3. PRICE RISK
An integral part of any business is a certain risk. Generally, it can be defined as an activity with
which material or physical damage or loss and consequently a disadvantage is associated. It is
most often associated with business failure, which will result in a negative economic result, ie
a loss. Risk involves some form of responsibility for the consequences of a selected business
decision, ie a certain risk option. The success rate of this business decision in terms of the results
achieved affects the position and rating of the decision-maker, ie the accountable manager. That
is why it is important for businesses to take into account all possible risks that might arise.
Companies should be able to assess the risk and learn how to handle it so that they can react
appropriately and manage it (Varcholova, Korzeniowski, 2002). When making price decisions,
there may be a risk that is mainly caused by the purchasing power of the customer. Whether a
customer decides to buy or not directly affects the market presence. There are other factors that
influence the risk arising from price decisions. These include, for example, relations with
suppliers, the success of competition, the prices of substitution products and the current
situation, whether on the domestic or foreign market. The company is not able to anticipate
changes in these factors when they occur, they have to face them (Lipianska, Hasprova, 2016).
Price risk is a part of business risk and can be characterized as a possibility to achieve a worse
result in business activity than expected result. This worse result may occur because of a
decrease, increase or change in price of the product or service. Price changes can cause various
consequences. Increasing the price of a product often results in a decrease in sales volume.
Conversely, if the price is lowered, it is possible to have an impact on the amount of profit,
namely its reduction and the like (Kufelova, 2017). In dealing with risk, businesses can
generally apply different pricing decisions. If the risk can be identified in a timely manner, it is
best for the company to avoid it completely by restricting activities in risk areas. If the risk
cannot be completely avoided, it can be reduced by taking measures that could prevent major
losses such as insurance. Companies may also create a financial reserve in advance from
previous earnings periods to cover possible losses in a risky business. Equally, companies can
diversify this risk, shifting part of the risk to other entities and thereby reducing the imminent
loss (Rajnak, 2002). Determining price risk for a company is a time-consuming process, and
the approach to risk itself should address all aspects in this area. From quantitative identification
and modeling to the development of techniques for practical application, this process must
include a modern and open approach from management (Belas, Smrcka, Gavurova, Dvorsky,
2018). Price risk quantification for companies is based on price changes and is therefore a
complex process where businesses can use the company's intelligent computing systems to
provide a fast and accurate data base (Tuffnell, Kral, Siekelova, Horak, 2019). In price decision
making, companies can use a large number of systems, predictive algorithms or databases of
various data and similar models and indicators in addition to intelligent computing to determine
and price a particular representative of a product portfolio or a specific product. Each company
can therefore choose one of the methods used according to its needs and market conditions
(Bourke, Kovacova, Kliestikova, Rowland 2019).
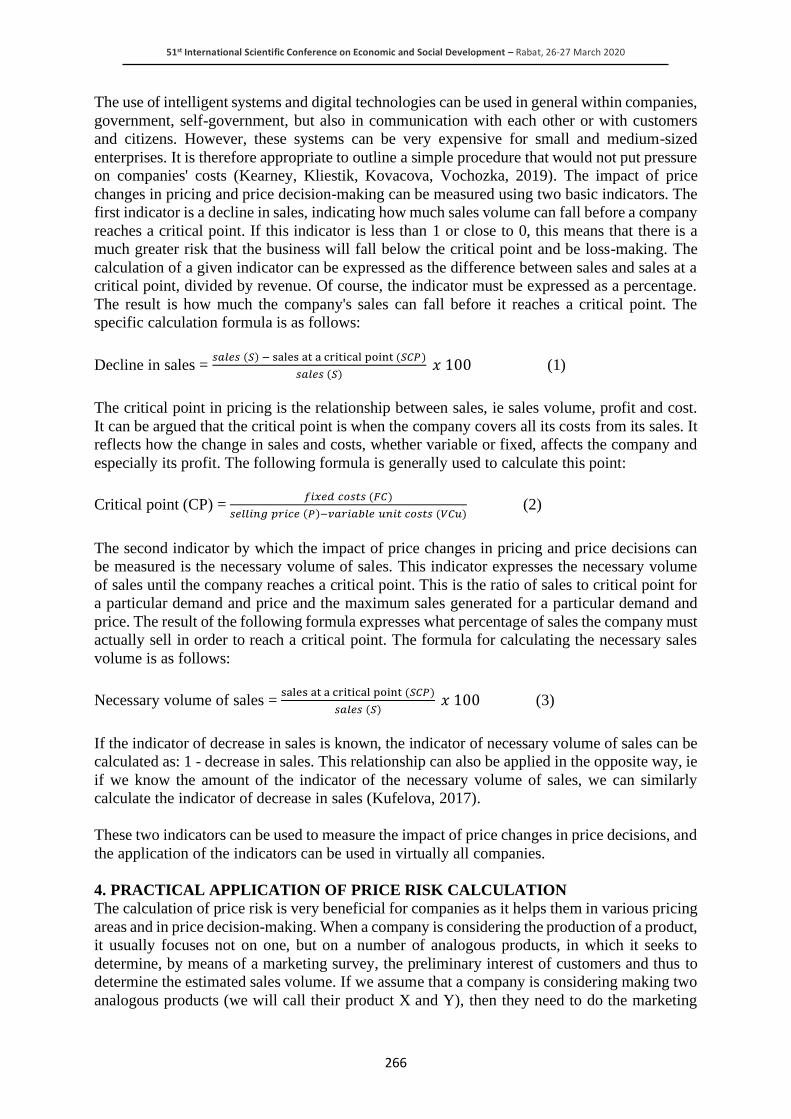
51st International Scientific Conference on Economic and Social Development – Rabat, 26-27 March 2020
266
The use of intelligent systems and digital technologies can be used in general within companies,
government, self-government, but also in communication with each other or with customers
and citizens. However, these systems can be very expensive for small and medium-sized
enterprises. It is therefore appropriate to outline a simple procedure that would not put pressure
on companies' costs (Kearney, Kliestik, Kovacova, Vochozka, 2019). The impact of price
changes in pricing and price decision-making can be measured using two basic indicators. The
first indicator is a decline in sales, indicating how much sales volume can fall before a company
reaches a critical point. If this indicator is less than 1 or close to 0, this means that there is a
much greater risk that the business will fall below the critical point and be loss-making. The
calculation of a given indicator can be expressed as the difference between sales and sales at a
critical point, divided by revenue. Of course, the indicator must be expressed as a percentage.
The result is how much the company's sales can fall before it reaches a critical point. The
specific calculation formula is as follows:
Decline in sales = 𝑠𝑎𝑙𝑒𝑠 (𝑆) − sales at a critical point (𝑆𝐶𝑃)
𝑠𝑎𝑙𝑒𝑠 (𝑆) 𝑥 100 (1)
The critical point in pricing is the relationship between sales, ie sales volume, profit and cost.
It can be argued that the critical point is when the company covers all its costs from its sales. It
reflects how the change in sales and costs, whether variable or fixed, affects the company and
especially its profit. The following formula is generally used to calculate this point:
Critical point (CP) = 𝑓𝑖𝑥𝑒𝑑 𝑐𝑜𝑠𝑡𝑠 (𝐹𝐶)
𝑠𝑒𝑙𝑙𝑖𝑛𝑔 𝑝𝑟𝑖𝑐𝑒 (𝑃)−𝑣𝑎𝑟𝑖𝑎𝑏𝑙𝑒 𝑢𝑛𝑖𝑡 𝑐𝑜𝑠𝑡𝑠 (𝑉𝐶𝑢) (2)
The second indicator by which the impact of price changes in pricing and price decisions can
be measured is the necessary volume of sales. This indicator expresses the necessary volume
of sales until the company reaches a critical point. This is the ratio of sales to critical point for
a particular demand and price and the maximum sales generated for a particular demand and
price. The result of the following formula expresses what percentage of sales the company must
actually sell in order to reach a critical point. The formula for calculating the necessary sales
volume is as follows:
Necessary volume of sales = sales at a critical point (𝑆𝐶𝑃)
𝑠𝑎𝑙𝑒𝑠 (𝑆) 𝑥 100 (3)
If the indicator of decrease in sales is known, the indicator of necessary volume of sales can be
calculated as: 1 - decrease in sales. This relationship can also be applied in the opposite way, ie
if we know the amount of the indicator of the necessary volume of sales, we can similarly
calculate the indicator of decrease in sales (Kufelova, 2017).
These two indicators can be used to measure the impact of price changes in price decisions, and
the application of the indicators can be used in virtually all companies.
4. PRACTICAL APPLICATION OF PRICE RISK CALCULATION
The calculation of price risk is very beneficial for companies as it helps them in various pricing
areas and in price decision-making. When a company is considering the production of a product,
it usually focuses not on one, but on a number of analogous products, in which it seeks to
determine, by means of a marketing survey, the preliminary interest of customers and thus to
determine the estimated sales volume. If we assume that a company is considering making two
analogous products (we will call their product X and Y), then they need to do the marketing

51st International Scientific Conference on Economic and Social Development – Rabat, 26-27 March 2020
267
research. Upon execution, the company assumes that the sales volume of product X is 6232
units and product Y is 5964 units. Of course, the fixed production costs for both products are
the same amount of 8235 €. The selling price of product X is 26,34 € each and the variable cost
is 6,20 € each. For Y, the selling price is 22,85 € per piece and the variable cost is 8,36 € per
piece. Price risk indicators can be used to determine which product would be more profitable
for the company, ie which product would have lower price risk. For the calculation of the given
indicators it is necessary to determine the critical point (CP) in pricing for both products, while
the information for the calculation of this point is available according to the formula. To
calculate the decline in sales as the first indicator of price risk, it is necessary to determine sales,
using the general formula as a multiple of the estimated sales quantity and the selling price per
piece. Subsequently, the sales in critical point (SCP) can be determined by multiplying the
critical point (CP) by the selling price (P) per piece, according to the formula (2) above. After
partial calculations, we substitute the components into formula (1) and calculate the decrease
in sales for individual products. The result of this indicator can be interpreted verbally as a
situation by how much revenue from the sale of a particular product can fall until the company
reaches sales at a critical point. Calculation of the second indicator of price risk, which is the
necessary volume of sales, according to formula (3), we already have all the necessary
information that we have obtained from the previous calculations. The procedure is clear, we
substitute the given variables into the formula, or the given result can also be obtained by
subtracting the calculated amount of the decrease in sales from 1. The result is the same in the
case of substituting into the formula or difference (1 - decrease in sales). This indicator tells us
how much volume a particular product has to sell before reaching a critical point. The results
for products X and Y are shown in the following table:
Table 1: Price risk indicators for products X and Y
Indicators Products X Y
Critical point (CP) 409 € 569 €
Sales 164 151 € 136 278 €
Sales at a critical point (SCP) 10 773 € 13 002 €
Decline in sales 93 % 90 %
Necessary volume of sales 7 % 10 %
Source: processed by the authors
Table 1 shows that the company will be less risky to produce and sell product X, while its
expected sales volume in € may fall by up to 93% and only 7% of its possible sales are sufficient
and the company reaches a critical point. For this reason, we can say that the production of this
product will be less risky for the company because its price risk is lower.
5. CONCLUSION
Based on previous calculations and analysis, it can be said that companies can use this process
to favor the production of the product with the lowest price risk. In particular, companies
considering the production of a new product and having a large number of alternatives to decide
on can benefit from this process. This will enable them to simplify their choices, particularly in
terms of minimizing price risk.
ACKNOWLEDGEMENT: This paper is an output of scientific project VEGA no. 1/0718/18:
The impact of psychographic aspects of pricing on the marketing strategy of companies across
products and markets.
51st International Scientific Conference on Economic and Social Development – Rabat, 26-27 March 2020
268
LITERATURE:
1. Belas, J., Smrcka, L., Gavurova, B., Dvorsky, J. (2018). The Impact of Social and Economic
Factors in the Credit Risk Management of SME. Technological and Economic Development
of Economy, 1215–1230.
2. Eilis, B., Kovacova, M., Kliestikova, J., Rowland, Z. (2019). Smart Industrial Internet of
Things Devices, Services, and Applications: Ubiquitous Sensing and Sensory Data,
Predictive Analytics Algorithms, and Cognitive Computing Technologies. Journal of
Entrepreneurship Management and Innovation, 50–56.
3. Jankok, M. et al. (2007). Ceny a cenova strategia. Bratislava: MIKA – Consult.
4. Kearney, H., Kliestik, T., Kovacova, M., Vochozka, M. (2019). The Embedding of Smart
Digital Technologies within Urban Infrastructures: Governance Networks, Real-Time Data
Sustainability, and the Cognitive Internet of Things. Geopolitics, History, and International
Relations, 98–103.
5. Kita, J. et al. (2010). Marketing. Bratislava: Iura Edition.
6. Krizanova, A. (2008). The Current Possition and Perspecives of the Integrated Transport
Systems in Slovak Republic. Eksploatacja i Niezawodnosc-Maintenance and Reliability,
25-27.
7. Kufelova, I. (2017). Ceny a cenove rozhodovanie. Bratislava: Wolters Kluwer.
8. Lipianska, J., Hasprova, M. (2016). Cenove rozhodovanie v marketingu – praktikum.
Bratislava: Ekonom.
9. Nadanyiova, M. (2013). The Possibility of Introducing the CRM System in Railway
Company Cargo Slovakia. 17th International Conference on Transport Means, 87-92.
10. Nwachukwu, Ch., Hieu, V. M., Fadeyi, O. (2018). Influence of strategy formulation drivers
on strategic performance. Ekonomicko-manazerske spektrum, 15-25.
11. Popp, J., Olah, J., Fekete, MF., Lakner, Z., Mate, D. (2018): The Relationship Between
Prices of Various Metals, Oil and Scarcity. Energies, 1-19.
12. Rajnak, M. et al. (2007). Cenove rozhodovanie. Bratislava: Sprint.
13. Sroka, W., Szanto, R. (2018). Corporate Social Responsibility and Business Ethics in
Controversial Sectors: Analysis of Research Results. Journal of Entrepreneurship,
Management and Innovation, 111-126.
14. Tuffnell, C., Kral, P., Siekelova, A., Horak, J. (2019). Cyber-Physical Smart Manufacturing
Systems: Sustainable Industrial Networks, Cognitive Automation, and Data-Centric
Business Models. Economics, Management, and Financial Markets, 58–63.
15. Valaskova, K., Bartosova, V., Kubala, P. (2019). Behavioural Aspects of the Financial
Decision-Making, Organizacija, 22-32.
16. Valaskova, K., Kliestikova, J., Krizanova, A. (2018). Consumer Perception of Private Label
Products: An Empirical Research. Journal of Competitiveness, 149-163.
17. Valaskova, K., Kramarova, K., Kollar, B. (2015). Theoretical Aspects of a model of credit
risk determination- Credit risk. Advances in Education Research, 401-406.
18. Valaskova, M., Krizanova, A. (2008). The Passenger Satisfaction Survey in the Regional
Integrated Public Transport System. Promet-Traffic & Transportation. 401-404.
19. Varcholova, T., Korzeniowski, L. (2002). Podnikatelske riziko. Bratislava: Ekonom.

51st International Scientific Conference on Economic and Social Development – Rabat, 26-27 March 2020
269
THE RELATIONSHIP BETWEEN TERRITORIAL COHESION AND
REGIONAL COMPETITIVENESS IN THE EUROPEAN UNION
Lela Tijanic
Juraj Dobrila University of Pula
Faculty of Economics and Tourism “Dr. Mijo Mirković”, Croatia
Ines Kersan-Skabic
Juraj Dobrila University of Pula
Faculty of Economics and Tourism “Dr. Mijo Mirković”, Croatia
Daniel Tomic
Juraj Dobrila University of Pula
Faculty of Economics and Tourism “Dr. Mijo Mirković”, Croatia
ABSTRACT
Territorial cohesion, as one of the important goals of the European Union cohesion policy,
represents research interest important also in perspectives of the future 2021-2027 cohesion
policy. It focuses on strengthening territorial potentials, balanced development, which can be
observed through competitiveness factors, even though the connection between territorial
cohesion and competitiveness still provokes different discussions with confronting conclusions.
Regarding diversified structure of European regions and the differences in its competitiveness
results, there are also studies about the adequate cohesion policy implementation which will
improve European competitiveness and other development goals such as territorial cohesion.
The aim of this paper is to present the relationship between territorial cohesion and regional
competitiveness in the European Union, through investigating the results of the latest European
Regional Competitiveness Index. Theoretical part of the paper will be focused on the definition,
the background and the role of the territorial cohesion, as well as on the connection between
territorial cohesion and regional competitiveness. More detailed analysis and interrelations
will be performed on the sample of European NUTS 2 regions, in order to present the
characteristics which should be included in managing territorial cohesion. Regional
competitiveness results are correlated with the chosen indicators of territorial cohesion. There
can be seen that competitiveness results are connected with different determinants of territorial
cohesion, but the estimated influences regarding specific determinants have shown ambiguous
nature. A polycentric pattern of development should be improved by observing the differences
between capital city regions and the rest of the country together with the untapped regional
potentials of regions that are at the same time facing competitiveness hurdles.
Keywords: regional competitiveness, NUTS regions, territorial cohesion
1. INTRODUCTION
Through its cohesion policy, the European Union (EU) aims to achieve economic, social and
territorial cohesion. The third dimension is relatively new and it has become important
especially with the strategy Europe 2020, but also with the EU enlargements when arises a need
to consider the evolution of the European territory due to new, diversified countries that join
the integration. The territorial cohesion is focused on: (1) „the capitalisation of the strengths of
the each territory so they can best contribute to the sustainable and balanced development of
the EU as a whole, (2) managing concentration because cities have both positive and negative
51st International Scientific Conference on Economic and Social Development – Rabat, 26-27 March 2020
270
impacts - intensifying innovation and productivity at the same time as pollution and social
exclusion, (3) better connecting territories (people should be able to live wherever they want,
with access to public services, efficient transport, reliable energy networks and broadband
internet throughout the territory), (4) developing cooperation between countries and regions
(the EU Strategy for the Baltic Sea Region and the EU Strategy for the Danube Region are
examples of new, macro-regional approach), (5) fostering urban-rural linkages“ (European
Commission, 2020b). On the other hand, the EU is focused to achieve high level of
competitiveness on the integration, national but also on the regional level. These two terms
cohesion and competitiveness can be observed as two parallel development paths, but also as
two opposite processes - because if the EU will put more emphasize and efforts on cohesion, it
can represent burden for the developed regions to become more competitive. With the rise of
competitiveness, the development gap between countries and regions can widen. The aim of
this paper is to present the relationship between territorial cohesion and regional
competitiveness in the EU, through investigating the results of the latest European Regional
Competitiveness Index (RCI). Regional competitiveness results will be analyzed and then
compared with the chosen indicators of territorial cohesion. This relationship will be also
empirically estimated. The paper contributes to previous researches on territorial cohesion and
discussions about the connection between cohesion and competitiveness by its research
approach, including the novel database of the RCI which will be used in order to estimate the
relationship in question. The next section presents literature review. In the third section the
main results of the RCI are synthesized with emphasis on parts important for investigating and
measuring territorial cohesion. Empirical estimation of the relationship between territorial
cohesion and regional competitiveness in the EU is presented in the fourth section, while final
section gives concluding remarks.
2. LITERATURE REVIEW
Territorial conditions are important in socioeconomic development which is presented in
numerous studies and implementations of public policies, through activities of international
organisations such as the World Bank and the Organisation for Economic and Co-operation and
Development (Szlachta, 2017). This is also confirmed in cohesion policy of the EU and regional
development policy doctrine. Cohesion in the framework of the EU cohesion policy is observed
from an economic, social and territorial point of view. Elissalde and Santamaria (2014) explain
the term of territorial cohesion as a set in the continuation of the policy known as “economic
and social cohesion in the EU”. This term refers to main aim of regional policy - reduction of
imbalances between regions and countries within the EU to create better living conditions for
all citizens of the EU. The term “territorial cohesion” considers the diversity of European
societies and nations, but also points on the need to avoid straining links between European
territories. The notion of territorial cohesion appeared at first in the Amsterdam treaty (1997)
and (officially as a pillar of the cohesion) was included as part of the Lisbon treaty (2009) - the
last treaty that regulates the EU functioning. Strengthening the territorial dimension of the
Europe 2020 strategy and other EU and national policies, promotion of practical ways of
applying the territorial approach are recognized as opportunities to improve the effects of the
Europe 2020 strategy’s implementation (Böhme, Doucet, Komornicki, Zaucha and Świątek).
New instruments have been introduced to achieve territorial cohesion objective in the 2014-
2020 programming period (Medeiros, 2016). It is seen that the concept of territorial cohesion
is accompanied with the higher possibilities to act on regional and local level. The development
of cohesion policy, including territorial cohesion as one of the goals, was described through the
cohesion reports. The EU has published 7 cohesion reports and in the newest one (2019), the
European Commission points that territorial cohesion comprises various issues which are
central to cohesion policy, and „among these are the environmental dimension of sustainable
51st International Scientific Conference on Economic and Social Development – Rabat, 26-27 March 2020
271
development and the use of flexible functional geographies for territorial development“
(European Commission, 2017, p. 96). Medeiros (2016, 2019) highlights the growing
importance of territorial cohesion with the inclusion in Lisbon treaty and elaborates on the
challenges to present territorial cohesion as understandable and measurable concept. He
explains that territorial analysis is complex, involves interrelated elements of territory.
Therefore, in defining the concept, the author identifies different dimensions and components
of territorial cohesion, which should also be connected with economic and social aspects. In
measuring territorial cohesion in a given territory these dimensions and components can be
linked to related indicators. The definition of territorial cohesion as “the process of promoting
a more cohesive and balanced territory by supporting the reducing of socioeconomic territorial
imbalances, promoting environmental sustainability, reinforcing and improving the territorial
cooperation/governance processes, reinforcing and establishing a more polycentric urban
system” (Medeiros, 2016, p. 26), he suggest as possible to construct of a Territorial Cohesion
Index, based on four aggregated indexes (socioeconomic, environmental sustainability,
morphologic polycentricity and territorial governance/cooperation) (Medeiros, 2016, 2019).
More about challenges in defining, measuring and implementation of territorial cohesion can
be found in Jouen (2008), ESPON (2013), Hanell (2015), Medeiros (2018) and Zaucha and
Böhme (2020). Territorial dimension of the cohesion is clearly connected with regional
characteristics and regional disparities, which is important for EU cohesion policy
interventions. Territorial imbalances challenge the economic, social and territorial cohesion
within Europe (ESPON, 2006). Fratesi and Perucca (2018, p. 265) found the
„complementarities between different territorial assets of regions and the impact of EU regional
policy: Cohesion Policy effectiveness is higher when investments are focused on the assets
complementary to those already abundant in the region“. Here can be also seen the need to
observe potential of territorial capital, the tangible and intangible assets of an area (OECD,
2001), as a basis for future growth and cohesion. Dudek and Wrzochalska (2019) in their
research found differences in the intensity of support of EU cohesion policy tools per capita in
favour of urban regions. They also provide theoretical differences in regional policies oriented
towards competitiveness vs. sustainability. Crescenzi, De Filippis and Pierangeli (2014) analyse
financial allocations of different polices (regional, rural development and agricultural policies)
in the EU to investigate their coordination and synergies with the territorial cohesion. Among
other conclusions, the authors have shown the importance of appropriate “place-based”
allocation mechanisms. Regional specific characteristics and their disparities can be analysed
through competitiveness factors. But, the competitiveness improvement of the EU (weaker)
regions and at the same time strengthening the competitiveness of the EU integration,
sometimes represent contradictory policy goals. In the Second Cohesion Report, where
territorial cohesion is highlighted as important in promoting balanced development, this is
confirmed with the explanation that concentrations in stronger regions may implicate greater
efficiency and production in the short term in the EU but this can also lower the productive
potential of less developed regions, with implication for the longer-term competitiveness
(Medeiros, 2019). Mikuš, Kukoč and Jež Rogelj (2019) also warn on the conflict between
cohesion and competitiveness objectives. Policies that foster competitiveness and put it into
“the macro concept with spatial implication result in planning and implementation of
inappropriate measures and instruments intended to encourage the balanced territorial
development of the EU. From this arises a conflict of cohesion and competitiveness, coupled
with long-term consequences for the most vulnerable areas” (Mikuš, Kukoč and Jež Rogelj,
2019, p. 143). Szlachta (2017) indicated the shift from cohesion to the competitiveness issues
especially after Europe 2020. The connection between territorial cohesion and regional
competitiveness is explained in Elissalde and Santamaria (2014, p. 28), as the two sides of the
purpose of regional policies (“guaranteeing the European citizens comparable access to services
51st International Scientific Conference on Economic and Social Development – Rabat, 26-27 March 2020
272
whatever the place of residence; territorial cohesion” and “supporting growth potential of the
European territory in a regional framework; regional competitiveness”). They also discuss the
definition of regional competitiveness, from competition of territory to wider definition that
comprises different factors such as those relating to the initial economic and social structure
(specialisation, cooperation among players, collective learning abilities etc.), to geographical
location (e.g. accessibility), and resources available. Callois (2018) investigates the issues of
cohesion and competitiveness but he focuses on the export competitiveness. On the example of
French regions he found there is no “one best way” of development inside the region or on the
country level. Both, cohesion or competitiveness, are important for economic performance, but
mixing both strategies may not be the effective way to promote development. Local context
and macroeconomic framework influence on both observed concepts. Bourdin (2018) presents
the dilemma between equity and competitiveness and estimates the spatial expression of
convergence and regional growth in the EU. He has demonstrated two scenarios which “show
that the political choices between equity and competitiveness have a profound impact on
territorial development. These choices in structural funding investment produce very different
economic and spatial configurations” (Bourdin, 2018, p. 17). The author highlights that
different pre-determined and random factors can influence the dynamics of regional growth and
convergence. ESPON (2006) confirms that European competitiveness depends on contributions
from regions, cities and rural areas and that rich regional diversity (unique set of potentials and
challenges for development) has to be targeted with suitable policy instruments to achieve
development goals. The same study recognizes that modern strategic objectives try to improve
the cohesion and the competitiveness, attractiveness for investments and the liveability.
Different territorial types, e.g. cities, rural areas, areas with specific characteristics (coastal
areas, islands, mountain areas, outermost regions, border regions, cross-border, transnational
regions), should be included in this observations and represent important segment in
investigating territorial cohesion. Žitkus (2015) warns that regional competitiveness is more
complex term than its dimension on national level. Fratesi and Senn (2009) have created the
framework of regional competitiveness factors by grouping these factors in: macroeconomic
factors; institutional and cultural factors; factors of spatial regional organization; factor of
relations. One of the most complex studies on measuring regional competitiveness in the EU is
the publication of the European Commission “The EU Regional Competitiveness Index” that
recognizes the importance of territorial competitiveness in sustainable economic progress
(Annoni and Dijkstra, 2019). This study produces detailed data on competitiveness factors
across EU regions. The main results of the latest study are presented in the next section, before
estimating the relationship between territorial cohesion and regional competitiveness in the EU,
which is conduced based on the mentioned comprehensive and valuable database.
3. THE EU REGIONAL COMPETITIVENESS INDEX
The EU has published 4 issues (2010, 2013, 2016, 2019) of the EU RCI report and in the last
one (published in 2019) it observes the performance of 268 regions at NUTS 2 (NUTS =
Nomenclature of Units for Territorial Statistics) level, across 28 EU Member States (Annoni
and Dijkstra, 2019). This studies allow regions to monitor and assess their development over
time and in comparison with other regions, to see how the regions score in different
competitiveness strengths and weakness, important also for public investments. The
contribution of these publications is in measuring competitiveness factors at the sub-national
level which is more suitable and reliable than the national one. This measuring implies on
inequalities and monitors the performance on lover levels. It can enable researches to determine
the opportunities to strengthen regional specificities which can also represent potential or
obstacles in achieving territorial cohesion. “The RCI is a unique, comparable and transparent
tool for national and local decision-makers responsible for regional development strategies, in
51st International Scientific Conference on Economic and Social Development – Rabat, 26-27 March 2020
273
particular in the context of cohesion policy” (Annoni and Dijkstra, 2019, p. 3). Its importance
is also recognized in preparations for the new EU cohesion policy programs for the 2021-2027,
in identifying regional assets and focusing investments (European Commission, 2019). Index
encompasses determinants and indicators that measure a region’s long-term potential and can
be connected with the sustainability (capacity to provide attractive environment in short and
long term), productivity and well-being. It is calculated based on 11 dimensions of
competitiveness, which are represented with pillars grouped into three sub-indexes: basic
(enabling aspects of competitiveness), efficiency (intermediate aspects) and innovation factors
(most cutting-edge factors of competitiveness) to assess the “ability of a region to offer an
attractive and sustainable environment for firms and residents to live and work” (Annoni and
Dijkstra, 2019; European Commission, 2020a). It applies differentiated weighting scheme to
regions based on their different stages of development, which assigns more relevance to specific
characteristics that are more relevant to observed territories at particular stage of development
(Annoni and Dijkstra, 2019). Results from the last report show the north-west, south-east divide
across the EU. The capital/metropolitan regions perform strongly in many parts of the EU thus
confirming the polycentric pattern. In most of the countries, capital regions have the highest
results but with the (usual) exceptions in the Netherlands, Italy and Germany. Utrecht represents
best-performing region in Netherland, Lombardia is the best-performing Italian (highly
productive) region, while in Germany the top position has Oberbayern region. Capitals or large
metropolitan areas that also have high competitiveness have used opportunities of
agglomerating economies, connectivity of economic activities and human capital attraction.
The gaps between the capital region and the rest of the country are stable according to the
research over the last (10) years, in some countries chasing regions have been catching-up, but
the results show significant variability within countries (Annoni and Dijkstra, 2019; European
Commission 2020a). ”Monitoring the evolution of the capital and or metropolitan gaps is
particularly important for cohesion policy whose main mission is to help regions catch up and
reduce geographical disparities” (European Commission 2020a). Confirmed variations within
and between the countries can have significant influence on territorial cohesion. The most
competitive regions are regions of Stockholm, Utrecht and London with its wide commuting
zone on the second position. Five Greek regions (Voreio Aigaio, Anatoliki Makedonia - Thraki,
Dytiki Makedonia, Dytikii Ellada and Notio Aigaio), one Romanian (Sud-Est), one Bulgarian
region (Severozapaden) and the Spanish autonomous city of Melilla on the north coast of Africa
with the French outermost regions of Guyane and Mayotte are the least competitive NUTS 2
regions in the EU (Annoni and Dijkstra, 2019). Here can be seen that regions with specific
characteristics, such as outermost regions (but also other typologies with specificities), deserve
special attention in investigating (territorial) cohesion and competitiveness. More in-depth
analysis of regional competiveness factors in the last EU RCI has shown that higher variability
is seen in the “innovation group” features because of significant differences in the innovative
capacity of regional economies across and within countries, in comparison with “basic group”.
It is concluded that high levels of index (as an aggregate measure) can “be achieved if above-
average levels are reached across all 11 pillars... Good performances correspond to group of
factors acting in unision” (Annoni and Dijkstra, 2019, p. 10). This implies on the need to
develop different competitiveness areas to achieve success that can also be observed as
determinants of higher territorial cohesion. RCI database enables to define comparative
strengths (and weaknesses) of regions based on the given results with respect to its peers.
Furthermore, the results of the study have shown that territorial competitiveness is important
for a region’s economic development and that low regional competitiveness is connected with
higher income inequality. The most competitive region (Stockholm) has low level of inequality,
even though this is not the case with all most competitive regions (Annoni and Dijkstra, 2019).

51st International Scientific Conference on Economic and Social Development – Rabat, 26-27 March 2020
274
All of this can be connected with the goal of the territorial cohesion, which is interesting to
investigate in more detail and this is the main motivation for the next section.
4. DATA, METHODOLOGY AND RESULTS
In this section we will discuss methodological issues, describe the data and present the model
which will be used to empirically explore the relationship between territorial cohesion and
regional competitiveness in the EU. The relevance of territorial cohesion, based on different
competitiveness pillars (territorial competitiveness determinants), in explaining the regional
competitiveness (measured by the mentioned index) will be tested, where we will apply
standard statistical tools to reveal potential nexus between the variables of interest. Data for the
RCI for 268 regions at a NUTS 2 level across all EU member countries and for 11 groups of
territorial competitiveness determinants (competitiveness pillars that capture concepts of great
importance for productivity and long-term socioeconomic perspective), are collected from the
European Commission’ s publication and database (Annoni and Dijkstra, 2019). Data
(un)availability is a major obstacle in achieving more (time) extensive research on a cross-
country base for most of the data needed because calculations are obtained on the different
methodological scale across the years. Therefore, the focus of this study will be the results from
the latest publication, with the most comprehensive presentations of the results so far, i.e. for
the year 2019. For that purpose, data are presented as: regional competitiveness index as RCI
and 11 (groups of) determinants of territorial competitiveness as x variable ranging from 1 to n
as institutions (x1), macroeconomic stability (x2), infrastructure (x3), health (x4), basic education
(x5), higher education and lifelong learning (x6), labour market efficiency (x7), market size (x8),
technological readiness (x9), business sophistication (x10) and innovation pillars (x11). Territorial
cohesion is observed based on competitiveness determinants (as mentioned before), so in order
to relate the cohesion from those 11 pillars of competitiveness to the RCI index we first
calculated the divergence i.e. deviation based on the Medeiros (2018). Following his
methodological approach, we estimated cohesion index for each of 11 competitiveness
determinants as through the standardisation process (first step) in which we evaluated the bias
from the distribution standard deviation of x index in the territorial unit of NUTS 2 to a
distribution average of x for a distinct competitiveness determinant. By applying the so-called
direct relation within the normalisation process (second step) in identifying the variable (as
(present value – minimum value) / (maximum value – minimum value)) we obtained territorial
cohesion index for each of the 11 competitiveness determinants with the value that fits between
0 and 1, suggesting that the lower the value – the deviation is lower – hence the cohesion is
greater, and vice versa. In the third step, we also calculated the arithmetic average of the values
for each competitiveness pillar. Though we found variations in the values of each pillar, the
arithmetic average (ranging from 0.24 for macroeconomic stability, labour market efficiency
and business sophistication to 0.40 for institutions) suggested relatively low deviation for all
pillars, therefore greater cohesion between the NUTS 2 regions for the year 2019. Next, we
wanted to confront these pillars to our main variable RCI index. In that sense, we calculated the
correlation coefficients for all observed groups of competitiveness determinants (pillars)
against the RCI index. Though, the correlation nexus between the original values of all
determinants of competitiveness against the RCI index was quite strong and positive (results
available upon request), we found that the calculated indexes are in fact negative and weakly
correlated (ranging from -0.02 for infrastructure to -0.41 for health) to the RCI index. These
correlation results suggest that there exists a negative statistical relationship between evaluated
variables in the year 2019, meaning that some of the pillars could have been decreasing the
cohesion and therefore general competitiveness. To test such statement, we went further and
estimated the causal model.
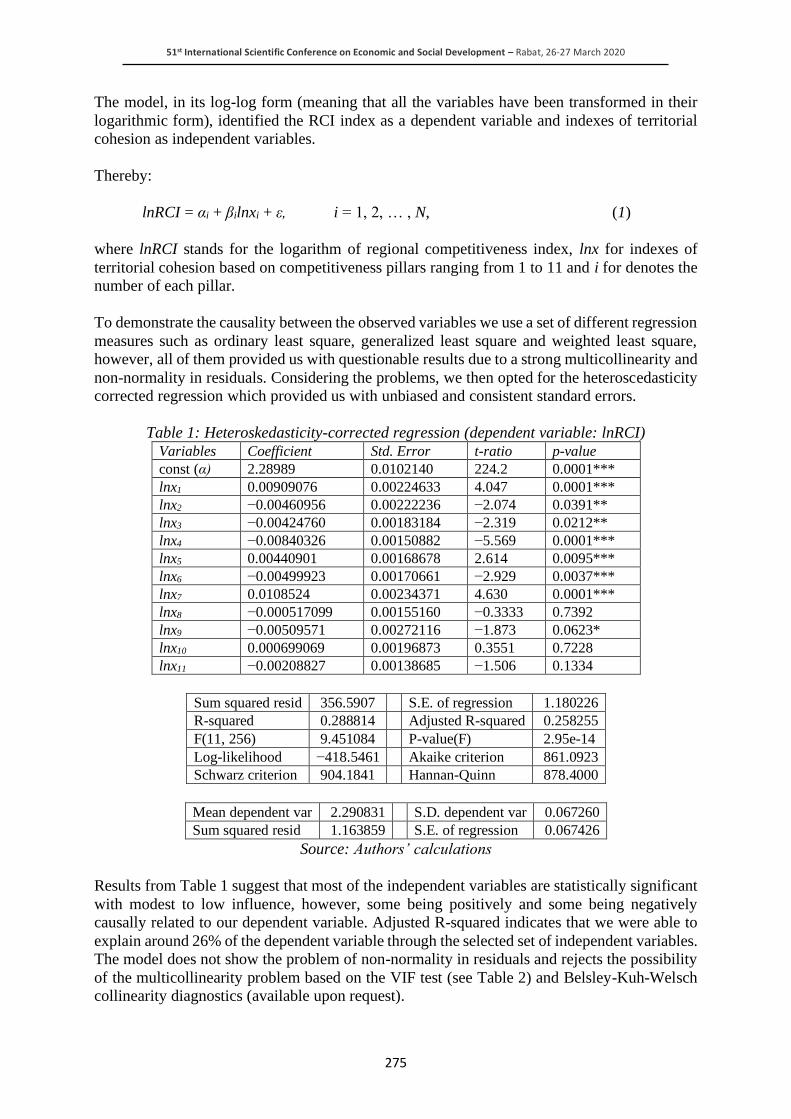
51st International Scientific Conference on Economic and Social Development – Rabat, 26-27 March 2020
275
The model, in its log-log form (meaning that all the variables have been transformed in their
logarithmic form), identified the RCI index as a dependent variable and indexes of territorial
cohesion as independent variables.
Thereby:
lnRCI = αi + βilnxi + ε, i = 1, 2, … , N, (1)
where lnRCI stands for the logarithm of regional competitiveness index, lnx for indexes of
territorial cohesion based on competitiveness pillars ranging from 1 to 11 and i for denotes the
number of each pillar.
To demonstrate the causality between the observed variables we use a set of different regression
measures such as ordinary least square, generalized least square and weighted least square,
however, all of them provided us with questionable results due to a strong multicollinearity and
non-normality in residuals. Considering the problems, we then opted for the heteroscedasticity
corrected regression which provided us with unbiased and consistent standard errors.
Table 1: Heteroskedasticity-corrected regression (dependent variable: lnRCI)
Variables Coefficient Std. Error t-ratio p-value
const (α) 2.28989 0.0102140 224.2 0.0001***
lnx1 0.00909076 0.00224633 4.047 0.0001***
lnx2 −0.00460956 0.00222236 −2.074 0.0391**
lnx3 −0.00424760 0.00183184 −2.319 0.0212**
lnx4 −0.00840326 0.00150882 −5.569 0.0001***
lnx5 0.00440901 0.00168678 2.614 0.0095***
lnx6 −0.00499923 0.00170661 −2.929 0.0037***
lnx7 0.0108524 0.00234371 4.630 0.0001***
lnx8 −0.000517099 0.00155160 −0.3333 0.7392
lnx9 −0.00509571 0.00272116 −1.873 0.0623*
lnx10 0.000699069 0.00196873 0.3551 0.7228
lnx11 −0.00208827 0.00138685 −1.506 0.1334
Sum squared resid 356.5907 S.E. of regression 1.180226
R-squared 0.288814 Adjusted R-squared 0.258255
F(11, 256) 9.451084 P-value(F) 2.95e-14
Log-likelihood −418.5461 Akaike criterion 861.0923
Schwarz criterion 904.1841 Hannan-Quinn 878.4000
Mean dependent var 2.290831 S.D. dependent var 0.067260
Sum squared resid 1.163859 S.E. of regression 0.067426
Source: Authors’ calculations
Results from Table 1 suggest that most of the independent variables are statistically significant
with modest to low influence, however, some being positively and some being negatively
causally related to our dependent variable. Adjusted R-squared indicates that we were able to
explain around 26% of the dependent variable through the selected set of independent variables.
The model does not show the problem of non-normality in residuals and rejects the possibility
of the multicollinearity problem based on the VIF test (see Table 2) and Belsley-Kuh-Welsch
collinearity diagnostics (available upon request).
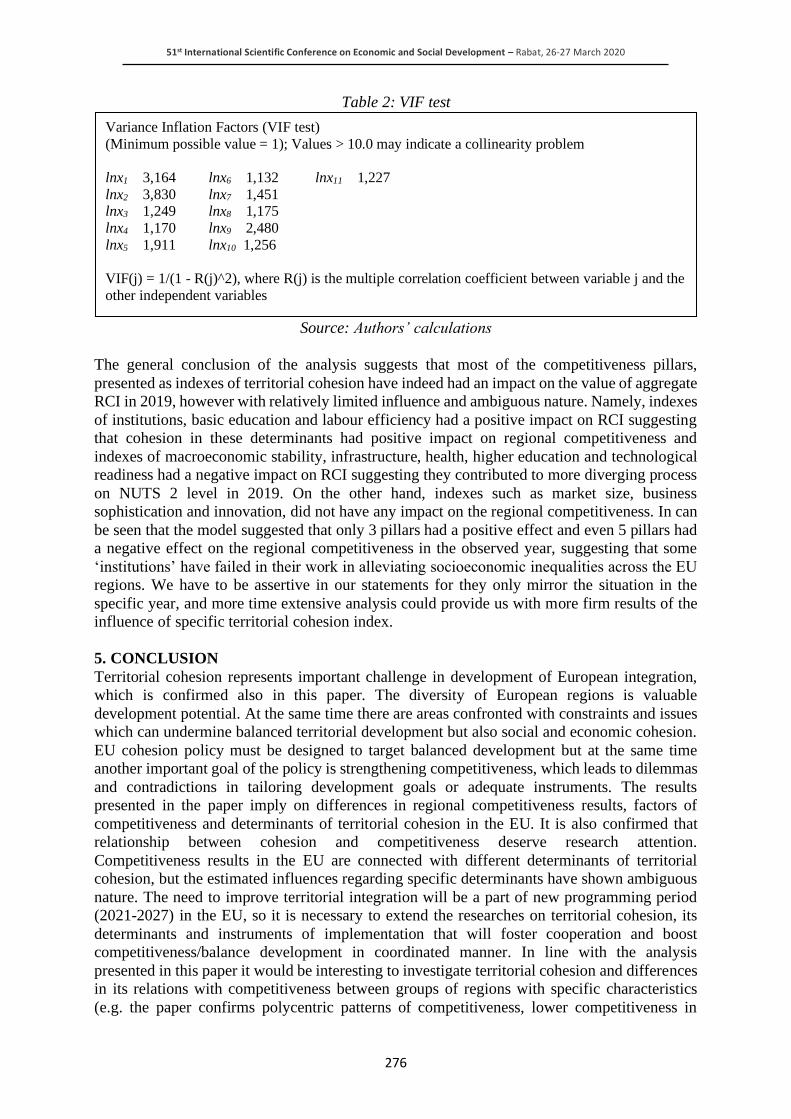
51st International Scientific Conference on Economic and Social Development – Rabat, 26-27 March 2020
276
Table 2: VIF test
Source: Authors’ calculations
The general conclusion of the analysis suggests that most of the competitiveness pillars,
presented as indexes of territorial cohesion have indeed had an impact on the value of aggregate
RCI in 2019, however with relatively limited influence and ambiguous nature. Namely, indexes
of institutions, basic education and labour efficiency had a positive impact on RCI suggesting
that cohesion in these determinants had positive impact on regional competitiveness and
indexes of macroeconomic stability, infrastructure, health, higher education and technological
readiness had a negative impact on RCI suggesting they contributed to more diverging process
on NUTS 2 level in 2019. On the other hand, indexes such as market size, business
sophistication and innovation, did not have any impact on the regional competitiveness. In can
be seen that the model suggested that only 3 pillars had a positive effect and even 5 pillars had
a negative effect on the regional competitiveness in the observed year, suggesting that some
‘institutions’ have failed in their work in alleviating socioeconomic inequalities across the EU
regions. We have to be assertive in our statements for they only mirror the situation in the
specific year, and more time extensive analysis could provide us with more firm results of the
influence of specific territorial cohesion index.
5. CONCLUSION
Territorial cohesion represents important challenge in development of European integration,
which is confirmed also in this paper. The diversity of European regions is valuable
development potential. At the same time there are areas confronted with constraints and issues
which can undermine balanced territorial development but also social and economic cohesion.
EU cohesion policy must be designed to target balanced development but at the same time
another important goal of the policy is strengthening competitiveness, which leads to dilemmas
and contradictions in tailoring development goals or adequate instruments. The results
presented in the paper imply on differences in regional competitiveness results, factors of
competitiveness and determinants of territorial cohesion in the EU. It is also confirmed that
relationship between cohesion and competitiveness deserve research attention.
Competitiveness results in the EU are connected with different determinants of territorial
cohesion, but the estimated influences regarding specific determinants have shown ambiguous
nature. The need to improve territorial integration will be a part of new programming period
(2021-2027) in the EU, so it is necessary to extend the researches on territorial cohesion, its
determinants and instruments of implementation that will foster cooperation and boost
competitiveness/balance development in coordinated manner. In line with the analysis
presented in this paper it would be interesting to investigate territorial cohesion and differences
in its relations with competitiveness between groups of regions with specific characteristics
(e.g. the paper confirms polycentric patterns of competitiveness, lower competitiveness in
Variance Inflation Factors (VIF test)
(Minimum possible value = 1); Values > 10.0 may indicate a collinearity problem
lnx1 3,164 lnx6 1,132 lnx11 1,227
lnx2 3,830 lnx7 1,451 lnx3 1,249 lnx8 1,175
lnx4 1,170 lnx9 2,480
lnx5 1,911 lnx10 1,256
VIF(j) = 1/(1 - R(j)^2), where R(j) is the multiple correlation coefficient between variable j and the
other independent variables

51st International Scientific Conference on Economic and Social Development – Rabat, 26-27 March 2020
277
outermost regions etc.). Another suggestion goes in line with the more particle analysis on the
sub-pillar competitiveness level. Policy processes in the field of territorial development should
be connected with territorial capital so its role in strengthening territorial cohesion can also
motivate future researches.
ACKNOWLEDGEMENT: This paper is a result of scientific project "The Determinants and
Challenges of Competitiveness" supported by the Faculty of Economics and Tourism "Dr. Mijo
Mirković", Juraj Dobrila University of Pula. Any opinions, findings, and conclusions or
recommendations expressed in this paper are those of the authors and do not necessarily reflect
the views of the Faculty of Economics and Tourism "Dr. Mijo Mirković" Pula."
LITERATURE:
1. Annoni, P., Dijkstra, L. (2019). The EU Regional Competitiveness Index 2019.
Luxembourg: Publications Office of the European Union. Retrieved 1.02.2020. from
https://ec.europa.eu/regional_policy/en/information/maps/regional_competitiveness/.
2. Böhme, K., Doucet, P., Komornicki, T., Zaucha, J., Świątek, D. (2011). How to strengthen
the territorial dimension of ʻEurope 2020ʼ and the EU Cohesion Policy (Report based on
the Territorial Agenda 2020, prepared at the request of the Polish Presidency of the Council
of the European Union). Warsaw. Retrieved 10.02.2020. from
https://ec.europa.eu/regional_policy/sources/docgener/studies/pdf/challenges2020/2011_te
rritorial_dimension_eu2020.pdf
3. Bourdin, S. (2018). Modeling and Simulation of Cohesion Policy Funding and Regional
Growth Diffusion in an Enlarged European Union. In J.-C. Thill (ed.), Spatial Analysis and
Location Modeling in Urban and Regional Systems. Advances in Geographic Information
Science (pp. 123-141). Berlin Heidelberg: Springer-Verlag.
4. Callois, J.-M. (2018). Revisiting the dilemma between cohesion and openness. Regional
Studies, 52(11), pp. 1464-1476.
5. Crescenzi, R., De Filippis, F., Pierangeli, F. (2014). In Tandem for Cohesion?: Synergies
and Conflicts between Regional and Agricultural Policies of the European Union. Regional
Studies, 49(4), pp. 1-24.
6. Dudek, M., Wrzochalska, A. (2019). Between Competitiveness and Sustainability?
Achievements and Dilemmas of Regional Policy in the Context of Economic Development
of Rural Regions: the Case of Poland. European Journal of Sustainable Development, 8(2),
pp. 299-311.
7. ESPON (2006). Territory matters for competitiveness and cohesion. Facets of regional
diversity and potentials in Europe (ESPON Synthesis Report III). Retrieved 10.02.2020.
from https://www.globalurban.org/ESPON%20Synthesis%20Report.pdf.
8. ESPON (2013). INTERCO – Indicators of Territorial Cohesion. Retrieved 1.02.2020. from
https://www.espon.eu/programme/projects/espon-2013/scientific-platform/interco-
indicators-territorial-cohesion.
9. European Commission (2017). My Region, My Europe, Our Future (Seventh report on
economic, social and territorial cohesion). Luxembourg: Luxembourg: Publications Office
of the European Union. Retrieved 1.02.2020. from
https://ec.europa.eu/regional_policy/sources/docoffic/official/reports/cohesion7/7cr.pdf.
10. European Commission (2019). EU budget: Commission helps prepare new Cohesion
programmes with Regional Competitiveness Index and Eurobarometer. Retrieved
1.02.2020. from https://ec.europa.eu/regional_policy/en/newsroom/news/2019/10/10-07-
2019-eu-budget-commission-helps-prepare-new-cohesion-programmes-with-regional-
competitiveness-index-and-eurobarometer.
51st International Scientific Conference on Economic and Social Development – Rabat, 26-27 March 2020
278
11. European Commission (2020a). European Structural and Investment Funds Data - The
most competitive regions in Europe: capitals take it all. Retrieved 25.02.2020. from
https://cohesiondata.ec.europa.eu/stories/s/yt77-f74u.
12. European Commission (2020b). Territorial cohesion. Retrieved 8.01.2020. from
https://ec.europa.eu/regional_policy/en/policy/what/territorial-cohesion/.
13. Elissalde, B, Santamaria. F. (2014). Territorial Cohesion and Regional Competitiveness:
Defining Key-Notions in the EU's Regional Policy. Social Sciences, Special Issue:
Geographical evidence in changing Europe, 3(4-1), pp. 4-12.
14. Fratesi, U., Perucca, G. (2018). EU regional development policy and territorial capital: A
systemic approach. Papers in Regional Science, 98(1), pp. 265-281.
15. Fratesi, U, Senn, L. (2009). Regional Growth, Connections and Economic Modeling: An
Introduction. In U. Fratesi, L. Senn (eds.), Growth and Innovation of Competitive Region:
The Role of Internal and External Connections. Advances in Spatial Science (pp. 3-27).
Berlin Heidelberg: Springer-Verlag.
16. Hanell, T. (2015). Measuring Territorial Cohesion: A Macro-Regional Approach. In T.
Lang, S. Henn, W. Sgibnev, K. Ehrlich (eds.) Understanding Geographies of Polarization
and Peripheralization. New Geographies of Europe (235-251). London: Palgrave
Macmillan.
17. Jouen, M. (2008). Territorial Cohesion: From theory to practice. Retrieved 10.02.2020.
from
https://institutdelors.eu/wp-content/uploads/2018/01/territorialcohesionjouennejune08.pdf.
18. Medeiros, E. (2016). Territorial Cohesion: An EU Concept. European Journal of Spatial
Development, 60, pp. 1-30. Retrieved 1.02.2020. from
https://archive.nordregio.se/Global/EJSD/Refereed%20articles/refereed60.pdf.
19. Medeiros (2018). How to measure Territorial Cohesion and Cooperation? Retrieved
1.02.2020. from http://www.interact-eu.net/download/file/fid/13305.
20. Medeiros, E. (2019). Measuring Territorial Cohesion. European Structural and Investment
Funds Journal, 7(2), pp. 88-95.
21. Mikuš O., Kukoč M., Jež Rogelj M. (2019). The coherence of common policies of the EU
in territorial cohesion: A never-ending discourse? A review. Agricultural Economics –
Czech, 65(3), pp. 143-149.
22. OECD (2001). OECD Territorial Outlook. Paris: OECD Publishing. Retrieved 1.02.2020.
from https://doi.org/10.1787/9789264189911-en.
23. Szlachta, J. (2017). EU cohesion policy as a requirement to voivodeship development
pathways. Miscellanea Geographica – Regional Studies on Development, 21(2), pp. 68-72.
24. Zaucha, J., Böhme, K. (2020). Measuring territorial cohesion is not a mission impossible.
European Planning Studies, 28(3), pp. 627-649.
25. Žitkus, L. (2015), New Approach to Regional Competitiveness as Instrument of Regional
Development. European Integration Studies, 9, pp. 114-126.

51st International Scientific Conference on Economic and Social Development – Rabat, 26-27 March 2020
279
LINKING TRANSFORMATIONAL LEADERSHIP, SENSE OF
BELONGING AND INTRAPRENEURSHIP
Fahd Slamti
Faculté des Sciences Juridiques, Economiques et Sociales de Salé
Université Mohammed V, Morocco
ABSTRACT
A varied range of factors have been identified to affect intrapreneurial behaviour in
organizations. Among these, the support of top management has been considered to be one of
the decisive factors, if not the most important one. Empirically, few studies have examined the
link between transformational leadership and intrapreneurship at the organizational level. This
research is theoretical; it builds on the extant literature to propose a model based on three
hypotheses about how transformational leadership contributes to the development of a sense of
belonging, and how it affects intrapreneurial behaviour among collaborators. It is also a
question of demonstrating whether the sense of belonging can play a mediating role between
transformational leadership and the development of intrapreneurial capacities.
Keywords: Transformational Leadership, Sense of Belonging, Intrapreneurship
1. INTRODUCTION
Today’s companies live in highly competitive environments. Certainly, it is a new context
characterized by volatility and the rise of civil society where change becomes the only constant.
Companies with financial difficulty or those losing competitiveness facing the growing rise
new entrants are invited to reinvent themselves in order to generate value and regain their lost
balance. In this difficult context, leadership is called upon to play an important role for
organizations, companies in particular. The concept is attracting a lot of interest from
researchers around the world, who have studied its relationship to performance, and are trying
to deepen the knowledge about possible links it may have with notions like creativity,
innovation or resilience. Leadership can be defined as the process through which one person
influences many in order to achieve a shared goal. That said, the concept cannot, in any case,
be reduced to positive personality traits or extraordinary behaviours characterizing the actor:
the leader. It must be emphasized that the dynamic of influence occurs between a person and a
group of individuals in a well-defined context, and its implementation depends on people’s
aspirations in terms of authentic and human values such as exemplarity and consideration.
2. THEORETICAL BACKGROUND
James McGregor Burns, who treated the concept from a purely political angle, stated two types
of leadership: transactional and transformational. According to Burns (1978): « [Transactional
leadership] occurs when one person takes the initiative in making contact with others for the
purpose of an exchange of valued thing. The exchange could be economic or political or
psychological in nature (…) » 1. Thus, the relationship between the leader and the followers is
based on transactions: jobs against votes, grants in exchange for election campaign funding (the
case of politics), bonuses in exchange for achieving objectives (the case of the company), etc.
For Antonakis, Avolio and Sivasubramaniam (2003), « Transactional leadership is an exchange
process based on the fulfillment of contractual obligations and is typically represented as setting
objectives and monitoring and controlling outcomes. » 2.
1 McGregor Burns, J. (1978), Leadership, Harper Collins, p. 8 2 Antonakis, J., Avolio, B., Sivasubramaniam, N. (2003) « Context and leadership: an examination of the nine-factor full-range leadership theory using the Multifactor Leadership Questionnaire », The Leadership Quarterly 14, p. 265
51st International Scientific Conference on Economic and Social Development – Rabat, 26-27 March 2020
280
Bass (1999) emphasizes the exchange relationship and defines transactional leadership as: «
(…) the exchange relationship between leader and follower to meet their own self-interests.
take the form of contingent reward in which the leader clarifies for the follower through
direction or participation what the follower needs to do to be rewarded for the effort. It may
take the form of active management-by-exception, in which the leader monitors the follower’s
performance and takes corrective action if the follower fails to meet standards « 3. For the
author, transactional leadership manifests itself through contingent reward and management by
exception. The first factor means that the leader understands the relationship with followers as
a negotiation through which objectives, rewards (in the case of success) and sanctions (in the
case of failure) are set. As for management by exception, the leader will ensure the commitment
of the teams by relying on two aspects, namely control and correction.
2.1. Transformational leadership
Burns (1978) writes: « [Transformational leadership] occurs when one or more persons engage
with others in such a way that leaders and followers raising one another to higher levels of
motivation and morality. Their purposes, which might have started out as separate but related,
as in the case of transactional leadership, become fused. Power bases are linked not as
counterweights but as mutual support for common purpose » 4. The author focuses attention on
both the complex and powerful nature of transformational leadership. Indeed, the
transformational leader can observe deep motivations among his supporters and wishes to
satisfy noble needs by fully mobilizing individuals. To this end, Burns mentions: « The
transforming leader recognizes and exploits an existing need or demand of a potential follower.
But, beyond that, the transforming leader looks for potential motives in followers, seeks to
satisfy higher needs, and engages the full person of the follower. » 5. Very inspired by Burns’
work, Bernard Bass (1990) will establish one of the most approved leadership models. The
author takes up the distinction between transactional and transformational leader and develops
Burns’ contribution to make it a development process. For Bass, transactional leadership is
based on reward and sanction. It aims the exchange relying on management by objectives. As
for transformational leadership, the leader, oriented towards change, offers a shared vision
advocating management by values. First, it raises the level of awareness of those around him
about the importance of the goals pursued. He then succeeds in convincing them as to the
supremacy of the general interest over the personal one. Finally, he invites them to satisfy
higher needs. The author describes transformational leadership as the process by which a leader
and followers engage in a mutual process of raising their motivation and their morality. Thus,
we can read in his writings: « Transformational leadership refers to the leader moving the
follower beyond immediate self-interests (...).It elevates the follower’s level of maturity and
ideals as well as concerns for achievement, selfactualization, and the well-being of others, the
organization, and society » 6. It is the same idea defended by those who support the concept of
corporate liberation, in particular Getz, who underlines that « Thanks to transformational
leadership, the two parties encourage and pull each other up, in a relationship where the
followers become leaders and where the leader is likely to become a moral leader « 7. According
to Bernard Bass, four factors generate people’s transformation (Table 1). The first factor is
charisma, according to which the leader behaves in an exemplary manner and assumes the role
of model to be followed by the others. Through regular good actions, the leader demonstrates
an irreproachable level in terms of personal and professional ethics, arousing the confidence,
3 Bass, B.M. (1999). « Two Decades of Research and Development in Transformational Leadership », European journal of work and organizational psychology, vol. 8, p. 10 4 Leadership, op. cit., p. 20 5 Leadership, op. cit., p.11 6 « Two Decades of Research and Development in Transformational Leadership », op. cit., p. 11 7 Getz, I. (2016), La liberté, ça marche !, Flammarion, p. 97
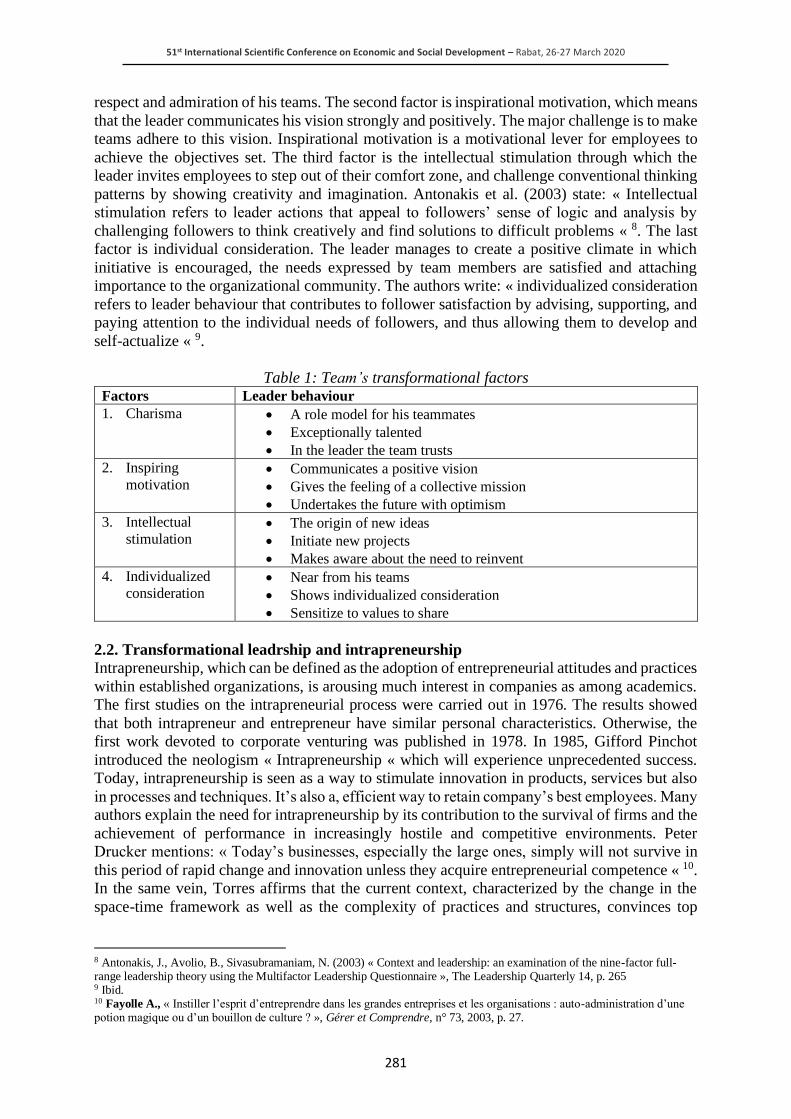
51st International Scientific Conference on Economic and Social Development – Rabat, 26-27 March 2020
281
respect and admiration of his teams. The second factor is inspirational motivation, which means
that the leader communicates his vision strongly and positively. The major challenge is to make
teams adhere to this vision. Inspirational motivation is a motivational lever for employees to
achieve the objectives set. The third factor is the intellectual stimulation through which the
leader invites employees to step out of their comfort zone, and challenge conventional thinking
patterns by showing creativity and imagination. Antonakis et al. (2003) state: « Intellectual
stimulation refers to leader actions that appeal to followers’ sense of logic and analysis by
challenging followers to think creatively and find solutions to difficult problems « 8. The last
factor is individual consideration. The leader manages to create a positive climate in which
initiative is encouraged, the needs expressed by team members are satisfied and attaching
importance to the organizational community. The authors write: « individualized consideration
refers to leader behaviour that contributes to follower satisfaction by advising, supporting, and
paying attention to the individual needs of followers, and thus allowing them to develop and
self-actualize « 9.
Table 1: Team’s transformational factors Factors Leader behaviour
1. Charisma • A role model for his teammates
• Exceptionally talented
• In the leader the team trusts
2. Inspiring
motivation • Communicates a positive vision
• Gives the feeling of a collective mission
• Undertakes the future with optimism
3. Intellectual
stimulation • The origin of new ideas
• Initiate new projects
• Makes aware about the need to reinvent
4. Individualized
consideration • Near from his teams
• Shows individualized consideration
• Sensitize to values to share
2.2. Transformational leadrship and intrapreneurship
Intrapreneurship, which can be defined as the adoption of entrepreneurial attitudes and practices
within established organizations, is arousing much interest in companies as among academics.
The first studies on the intrapreneurial process were carried out in 1976. The results showed
that both intrapreneur and entrepreneur have similar personal characteristics. Otherwise, the
first work devoted to corporate venturing was published in 1978. In 1985, Gifford Pinchot
introduced the neologism « Intrapreneurship « which will experience unprecedented success.
Today, intrapreneurship is seen as a way to stimulate innovation in products, services but also
in processes and techniques. It’s also a, efficient way to retain company’s best employees. Many
authors explain the need for intrapreneurship by its contribution to the survival of firms and the
achievement of performance in increasingly hostile and competitive environments. Peter
Drucker mentions: « Today’s businesses, especially the large ones, simply will not survive in
this period of rapid change and innovation unless they acquire entrepreneurial competence « 10.
In the same vein, Torres affirms that the current context, characterized by the change in the
space-time framework as well as the complexity of practices and structures, convinces top
8 Antonakis, J., Avolio, B., Sivasubramaniam, N. (2003) « Context and leadership: an examination of the nine-factor full-range leadership theory using the Multifactor Leadership Questionnaire », The Leadership Quarterly 14, p. 265 9 Ibid. 10 Fayolle A., « Instiller l’esprit d’entreprendre dans les grandes entreprises et les organisations : auto-administration d’une potion magique ou d’un bouillon de culture ? », Gérer et Comprendre, n° 73, 2003, p. 27.

51st International Scientific Conference on Economic and Social Development – Rabat, 26-27 March 2020
282
management that survival remains closely linked to risk-taking and innovation11 . Thornberry
believes that the more the company grows, becomes bureaucratic and its structures more
complex, the more it moves away from agility, risk-taking and innovation. The author
emphasizes: « Many large companies are seeking ways of reinventing or revitalizing their
entrepreneurial roots. These companies often long for some of the spark, innovation, speed and
risk taking that they once had, but which have slowly eroded under the weight of size,
bureaucracy, complex processes and hierarchy. Corporate entrepreneurship encompasses a set
of activities, attitudes, and actions that are believed to help large companies regain some of this
lost magic « 12. The author considers intrapreneurship as the only way to recover the magic lost
due to bureaucratization and the complexity of practices and structures. Carrier (2000)
considers intrapreneurship as a path likely to support companies in their search for innovation
in a context of globalization and trade liberalization.13 As just mentioned above, the concept of
intrapreneurship refers to entrepreneurial activities carried out within existing companies. This
includes activities such as innovation, business creation, renewal, proactivity and risk taking. 14
Obviously, organizational success requires leaders who can inspire employees and direct their
mindsets towards discovery and exploration, leaders who can build an environment that
encourages innovation and empowers individuals (Stevenson, 2012). Transformational
leadership improves organizational performance relying on his ability to adapt and his great
responsiveness to the external environment. It encourages employees to adapt their actions to
face regular changes of the environment (Su and Baird 2017; Waldman et al. 2004). In addition,
transformational leaders encourage their employees to think unconventionally and to foster new
ideas by involving employees in business projects (Howell and Higgins 1990; Jung et al. 2003).
Transformational leaders also strengthen the intrinsic motivation of the teams by encouraging
them to develop their innovation potential and to change their perception of risk. These leaders
encourage entrepreneurial activities by encouraging their employees to engage in the
development of innovative ideas (Chen et al. 2014; Audenaert et al. 2017). This kind of leaders
provides strong support to employees by developing their autonomy and confidence (Jung et
al. 2008). The managerial literature has studied the impact of transformational leadership on
organizational performance through intrapreneurship. Indeed, many academics have examined
the relationship between this kind of leadership and intrapreneurial behaviours such as
creativity and innovation. Cheung and Wong (2011) confirmed that the positive link between
transformational leadership and creativity is stronger when leaders chose a proximity
management and display high support for employee’s tasks. Sosik, Avolio and Kahai (1997)
studied the impact of transformational leadership on the creativity of 36 work groups using a
decision support system. The authors demonstrate that transformational leadership has direct
and indirect influence on performance. In the same perspective, transformational leaders are
interested in reversals of situations raising the employees creativity to a higher level (Sosik et
al., 1997; Shin and Zhou, 2003, 2007; Gong et al., 2009; Henker et al ., 2015) Several research
studies have focused on the relationship between transformational leadership and innovation.
Schweitzer (2014) confirmed the positive link between leadership and both innovation and
operational capabilities in a situation of strategic alliance. The author studied the impact of
transactional and transformational leadership on intrapreneurial behaviour and concluded that
transformational leadership has a stronger impact on dynamic and operational capacity
11 Torrès, O., « L’entrepreneuriat face à la globalisation », Histoire d’entreprendre: les réalités de l’entrepreneuriat, Éditions Management et Société, 2000, pp. 1-23. 12 Thornberry, N., « Corporate Entrepreneurship: Antidote or Oxymoron? », European Management Journal, Vol. 19, n° 5, 2001, pp. 526-533. Cité par Allali, B., « Avons-nous vraiment besoin d’intrapreneurs dans nos organisations ? ». 13 Carrier, C., « Intrapreneuriat - à la recherche de complice innovant et entreprenant », dans Verstraete, T. (dir.), Histoire d’entreprendre : les réalités de l’entrepreneuriat. Éditions Management et Société, 2000, pp. 199-210. 14 Schmelter, Ralf, René Mauer, Christiane Börsch, et Malte Brettel, Boosting Corporate Entrepreneurship Through HRM Practices: Evidence from German SMEs. Human Resource Management, Vo 49, N°4, 2010, p. 715

51st International Scientific Conference on Economic and Social Development – Rabat, 26-27 March 2020
283
development. For his part, Bass (1985) considers that these leaders, accustomed to change, are
able to identify breakthrough innovations (those with high returns in the medium and long term)
likely to generate constant development. Other studies have also shown that transformational
leadership represents a main lever of innovation, with positive consequences on the degree of
risk taking and creativity within business units. It must be remembered that transformational
leadership manifests itself through several facets, including charisma, intellectual stimulation
and inspiring motivation. First, using their charisma, transformational leaders set an example
for subordinates to duplicate in terms of innovative behaviour (Waldman & Yammarino, 1999).
Second, transformational leaders make the necessary improvements and give concrete
responses to organizational dysfunctions by stimulating creativity and innovation among
subordinates. Thus, using intellectual stimulation, they invite people to participate in the
problems identification, to favor new solutions to the different organizational problems and to
generate new ideas. (Bass, 1985; Avolio et al., 1999; Bass et al., 2003). Third, transformational
leaders try to modify the beliefs of their subordinates by cultivating the feeling of a collective
mission likely to serve the objectives of the organization and to strengthen their intrinsic
motivation to implement innovations (Jansen, Vera and Crossan, 2009 ).
• H1: Transformational Leadership has a positive impact on the development of
Intrapreneurial Capacities.
2.3. The mediating role of the sense of belonging
When people cultivate a sense of belonging, they feel freer to create and innovate. Once aware
of the benefits of this identification, top management show more support to employees going
beyond their job description to come up with new ideas and lead innovative projects. Teams
become so passionate about what they do that they hardly feel the fear of failure. This mindset
represents the DNA of intrapreneurship. The sense of belonging is a lever that strengthens the
motivation and satisfaction of workers. Therefore, top management must ensure that staff feel
proud to belong to the company and want to contribute to its success. Certainly, successful
companies are those capable of developing a sense of belonging among their teams. Beyond its
positive impact on job performance, the sense of belonging improves mental and physical
presence at work, resistance to stress and openness to change. Several studies have confirmed
that transformational leadership has a positive effect on the emotional identification and degree
of involvement of collaborators. Xenikou (2014) conducted a survey of 200 employees working
for a public organization. The results notably showed that charismatic leadership was positively
associated with emotional identification. Zhu et al. (2009) examined the relationship between
transformational leadership and employee professional engagement through the characteristics
of followers (moderator variable). Data collected from 140 collaborators and 48 supervisors
from various industries in South Africa showed that the characteristics of followers moderated
the positive relationship between transformational leadership and professional engagement. For
their part, Sommer et al. (2016) studied the effect of transformational leadership on
organizational resilience during a crisis affecting the health sector. Data collected from 426
team members and 52 leaders made it possible to comment on the influence of the leader’s
behaviour on team member’s resilience, mainly through affective mechanisms. Additionally,
many authors (Avolio and Gardner, 2005; Gooty et al., 2009) agree on the existence of a close
relationship between transformational leadership and resilience and that these two concepts
have a positive impact on organizational performance. In addition to its effect on resilience,
transformational leadership can have an impact on group cohesion. Carron (1982) defines this
cohesion as a dynamic process that is characterized by a group’s tendency to stick together and
remain united in the pursuit of its objectives. Carless, Mann and Wearing (1995) have shown
the effect of transformational leadership on strengthening group cohesion, and therefore a

51st International Scientific Conference on Economic and Social Development – Rabat, 26-27 March 2020
284
positive impact on the Australian banking sector performance. The authors carried out a survey
of 695 middle-managers working in a large Australian bank. The purpose of the study is to
examine the relationship between self-efficacy and transformational leadership, as well as to
show the role of group cohesion as a mediating variable between transformational leadership
and performance. The hypotheses put forward by the three authors were confirmed since the
results showed that self-efficacy significantly predicted transformational leadership and
performance. In addition, group cohesion is confirmed as a significant mediating variable.
• H2: Transformational Leadership contributes positively to instilling a sense of belonging.
• H3: The Sense of Belonging plays a mediating role between Transformational Leadership
and the development of Intrapreneurial Capacities.
Figure 1: The research model proposed
3. CONCLUSION
Research carried out by different authors has attempted to highlight the link that could exist
between the nature of leadership and the triggering of an intrapreneurial dynamic within
companies. As we have reviewed, it has been possible to establish the relationship between
transformational leadership and certain facets of intrapreneurship such as creativity or
innovation. However, we note that there is a considerable lack in managerial literature, either
in relation to the triggering factors or the outputs of the sense of belonging. This theoretical
research is the first in this field, which highlights the role of the sense of belonging as a
mediating variable conditioning the development of intrapreneurial capacities within
companies. The proposed model will be the subject of an in-depth study and will soon be tested
in the Moroccan professional environment.
LITERATURE:
1. Antonakis, J., Avolio, B., Sivasubramaniam, N. (2003) « Context and leadership: an
examination of the nine-factor full-range leadership theory using the Multifactor Leadership
Questionnaire », The Leadership Quarterly 14
2. Avolio, B. J. (1999). Full leadership development: Building the vital forces in organizations.
Thousand Oaks, CA: Sage.
3. Avolio, B. J., Bass, B. M., Jung, D. I. (1999), « Re-examining the components of
transformational and transactional leadership using the Multifactor Leadership
Questionnaire », J. Occup. Organ. Psychol. 72, 441–462.
4. Avolio, B. J., Gardner, W. L. (2005), « Authentic leadership development: Getting to the
root of positive forms of leadership », Leadership Quarterly, 16, 315–338.

51st International Scientific Conference on Economic and Social Development – Rabat, 26-27 March 2020
285
5. Avolio, B. J., Zhu, W., Koh, W., & Bhatia, P. (2004), « Transformational leadership and
organizational commitment: mediating role of psychological empowerment and moderating
role of structural distance », J. Organ. Behav. 25, 951–968
6. Bass, B. M. (1985). Leadership and Performance Beyond Expectations. New York, NY:
Free Press
7. Bass, B. M. (1998), Transformational leadership: Individual, military and educational
impact. Mahwah, NJ: Erlbaum
8. Bass, B. M., Avolio, B. J., Jung, D. I., and Berson, Y. (2003), « Predicting unit performance
by assessing transformational and transactional leadership », J. Appl. Psychol. 88, 207–218
9. Bass, B.M. (1990), Handbook of leadership: A survey of theory and research. New York :
Free Press
10. Bass, B.M. (1999), « Two Decades of Research and Development in Transformational
Leadership », European journal of work and organizational psychology
11. Burns, JM. (1978). Leadership, Harper Collins
12. Carless, S., Mann, L., & Wearing, A. (1995). An empirical test of the transformational
leadership model. Symposium conducted at the Inaugural Australian Industrial and
Organizational Psychology Conference, Sydney, Australia
13. Cheung, M.F. and Wong, C.S. (2011), « Transformational leadership, leader support, and
employee creativity », Leadership & Organization Development Journal, Vol. 32 No. 7, pp.
656-672.
14. Getz, I. (2016), La liberté, ça marche ! Editions Flammarion
15. Gooty, L., Gavin, M, Johnson, P. D, Frazier, M. L., & Snow, D. B. (2009), « In the eye of
the beholder: Transformational leadership, positive psychological capital, and performance
», Journal of Leadership & Organizational Studies, 15, 353-367.
16. Henker, N., Sonnentag, S., and Unger, D. (2015). « Transformational leadership and
employee creativity: the mediating role of promotion focus and creative process
engagement », J. Bus. Psychol. 30, 235–247.
17. Howell, J. M., and Avolio, B. J. (1993). « Transformational leadership, transactional
leadership, locus of control, and support for innovation: key predictors of consolidated-
business-unit performance », J. Appl. Psychol. 78, 891–902.
18. Jansen, J. J. P., Vera, D., & Crossan, M. (2009), «Strategic Leadership for Exploration and
Exploitation: The Moderating Role of Environmental Dynamism », The Leadership
Quarterly, 20, 5-18.
19. Schweitzer, J. (2014), « Leadership and innovation capability development in strategic
alliances », Leadership & Organization Development Journal, Vol. 35 No. 5, pp. 442-469.
20. Shin, S. J., and Zhou, J. (2003), « Transformational leadership, conservation, and creativity:
Evidence from Korea», Acad. Manage. J. 46, 703–714.
21. Sommer, S. A., Howell, J. M., & Hadley, C. N. (2016), « Keeping positive and building
strength: The role of affect and team leadership in developing resilience during an
organizational crisis », Group & Organization Management, 41(2), 172-202.
22. Sosik, J. J., Avolio, B. J., & Kahai, S. S. (1997), « The impact of leadership style and
anonymity on group potency and effectiveness in a GDSS environment », Journal of
Applied Psychology, 82, 89–103.
23. Stevenson, J. E. (2012), « Breaking Away - A New Model for Innovation Leadership »,
Employment Relations Today, 39, 17-25.
24. W. Zhu, B. J. Avolio, and F. O. Walumbwa, « Moderating role of follower characteristics
with transformational leadership and follower work engagement », Group and Organization
Management, vol. 34, no. 5, pp. 590-619, 2009

51st International Scientific Conference on Economic and Social Development – Rabat, 26-27 March 2020
286
25. Xenikou, A. (2014), « The cognitive and affective components of organizational
identification: the role of perceived support values and charismatic leadership», Appl.
Psychol. Int. Rev. 63, 567–588
26. Zacher, H. and Rosing, K. (2015), « Ambidextrous leadership and team innovation »,
Leadership & Organization Development Journal, Vol. 36 No. 1, pp. 54-68.
51st International Scientific Conference on Economic and Social Development – Rabat, 26-27 March 2020
287
ANALYSIS OF THE PAY AMOUNT IN THE RUSSIAN ECONOMY BY
TYPES OF ACTIVITY AND EMPLOYMENT OF HIRED LABOR
L. Fyodorova
Novosibirsk State University of Economics and Management, Russia
ABSTRACT
This article views the level and wages dynamics in the context of aggregated categories of
employed: heads of enterprises and their divisions, specialists, employees engaged in the
preparation and execution of documentation, accounting and maintenance, skilled workers in
industry, construction, transport and related enterprises. The data of the Federal state statistics
service for the period 2005 – 2017 have been used to analyze the statistical information. The
absence of wide differences in the analyzed indicator between the heads of enterprises,
specialists, highly skilled workers and employees has been shown. Taking into consideration
the different nature of the functions performed and the degree of responsibility of different
categories employees for the results of the work performed, the existing relations in the Russian
economy, from an economic point of view, should be assessed as acceptable. Information is
require to analyze deeper and understand clearer the real problems in the field of labour
remuneration, in particular, on the distribution of each category of employees by wage level in
terms of decile groups, just as it is done in General for the economy. A gradual increase of
average monthly nominal pay of the basic employee categories, the tertiary sector presented in
this research by education system has been found out to fall behind the payment criteria amid
a gradual increase of average monthly nominal pay of basic employee categories. The
education sector is observed to have the lowest pay level and slow pay growth among the four
employee categories under consideration: heads of the enterprises, specialists of the
intermediate and advanced qualification, skilled workers. This tendency does not facilitate
solving problems of structural adjustment of the Russian economy and its technological re-
equipment. Current conditions, coupled with an increase of the pay levels of the low income
employee categories, the need for its sustainable growth for all professional and job groups
tends to be relevant. As an institutional pre-condition for pay rising, it is necessary to consider
the application of social standards complying with the modern social standard requirements:
subsistence minimum and the minimum wage depending on it. Existing social standards do not
ensure the reproduction of the ability to work of skilled workers and ordinary employees of
almost all sectors of the economy, as well as a significant proportion of professionals.
Keywords: categories of employees, cost of living, differentiation, minimum labor wage, pay,
salary, types of activity, wage
1. INTRODUCTION
Understanding the issue of inequality existing both in the developed and developing economies
is becoming relevant in recent decades. The extremes consist of recognizing a thorough
differentiation in the income level of the population and well-being as a whole, being quite
acceptable, or, on the contrary, in justifying, the need for radical changes in society, including
political ones, connected with such differentiation. Emerging markets are generally
characterized by various forms of so-called excess inequality in the revenue allocation. Since a
large part of households pay forms a large part of personal income, its amount has a determining
influence on the level of social stratification. Since the 1990s, within the framework of dramatic
reform, Russian economists have been actively studying allocation processes applying to the
realities of the transition economy. Attention has been paid to the analysis of the regulatory
structure in the social sphere, including social standards - the size of the living wage and the
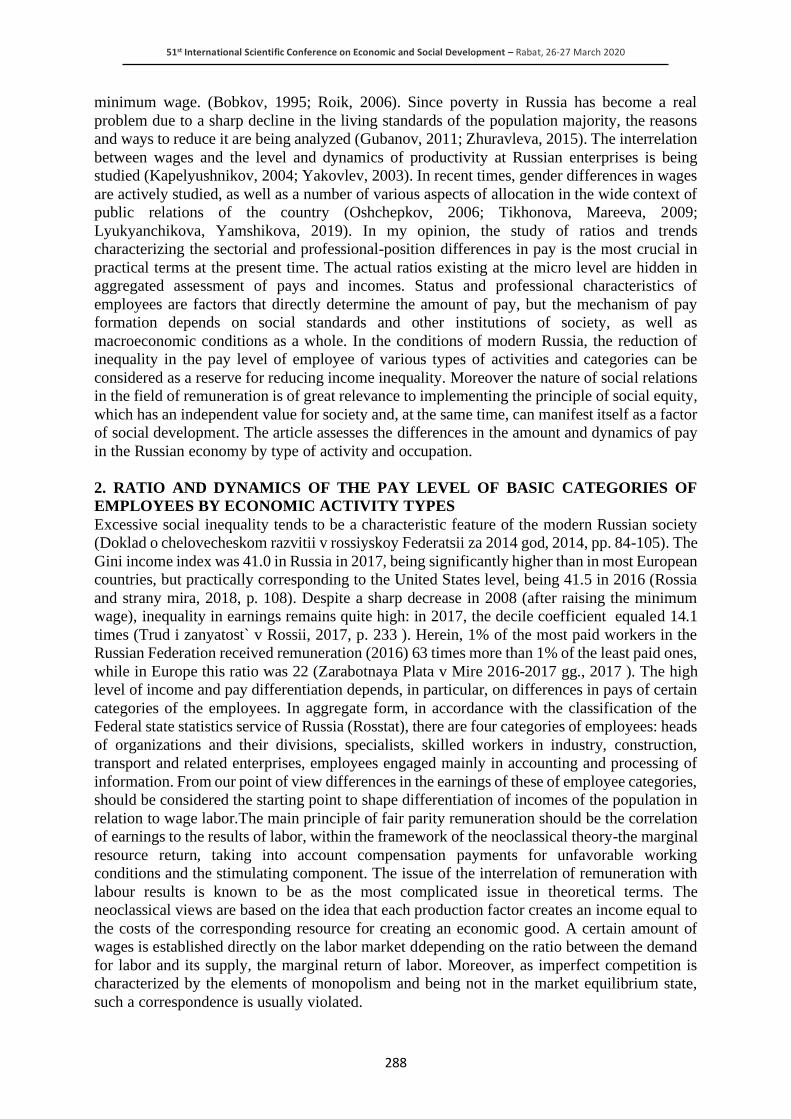
51st International Scientific Conference on Economic and Social Development – Rabat, 26-27 March 2020
288
minimum wage. (Bobkov, 1995; Roik, 2006). Since poverty in Russia has become a real
problem due to a sharp decline in the living standards of the population majority, the reasons
and ways to reduce it are being analyzed (Gubanov, 2011; Zhuravleva, 2015). The interrelation
between wages and the level and dynamics of productivity at Russian enterprises is being
studied (Kapelyushnikov, 2004; Yakovlev, 2003). In recent times, gender differences in wages
are actively studied, as well as a number of various aspects of allocation in the wide context of
public relations of the country (Oshchepkov, 2006; Tikhonova, Mareeva, 2009;
Lyukyanchikova, Yamshikova, 2019). In my opinion, the study of ratios and trends
characterizing the sectorial and professional-position differences in pay is the most crucial in
practical terms at the present time. The actual ratios existing at the micro level are hidden in
aggregated assessment of pays and incomes. Status and professional characteristics of
employees are factors that directly determine the amount of pay, but the mechanism of pay
formation depends on social standards and other institutions of society, as well as
macroeconomic conditions as a whole. In the conditions of modern Russia, the reduction of
inequality in the pay level of employee of various types of activities and categories can be
considered as a reserve for reducing income inequality. Moreover the nature of social relations
in the field of remuneration is of great relevance to implementing the principle of social equity,
which has an independent value for society and, at the same time, can manifest itself as a factor
of social development. The article assesses the differences in the amount and dynamics of pay
in the Russian economy by type of activity and occupation.
2. RATIO AND DYNAMICS OF THE PAY LEVEL OF BASIC CATEGORIES OF
EMPLOYEES BY ECONOMIC ACTIVITY TYPES
Excessive social inequality tends to be a characteristic feature of the modern Russian society
(Doklad o chelovecheskom razvitii v rossiyskoy Federatsii za 2014 god, 2014, pp. 84-105). The
Gini income index was 41.0 in Russia in 2017, being significantly higher than in most European
countries, but practically corresponding to the United States level, being 41.5 in 2016 (Rossia
and strany mira, 2018, p. 108). Despite a sharp decrease in 2008 (after raising the minimum
wage), inequality in earnings remains quite high: in 2017, the decile coefficient equaled 14.1
times (Trud i zanyatost` v Rossii, 2017, p. 233 ). Herein, 1% of the most paid workers in the
Russian Federation received remuneration (2016) 63 times more than 1% of the least paid ones,
while in Europe this ratio was 22 (Zarabotnaya Plata v Mire 2016-2017 gg., 2017 ). The high
level of income and pay differentiation depends, in particular, on differences in pays of certain
categories of the employees. In aggregate form, in accordance with the classification of the
Federal state statistics service of Russia (Rosstat), there are four categories of employees: heads
of organizations and their divisions, specialists, skilled workers in industry, construction,
transport and related enterprises, employees engaged mainly in accounting and processing of
information. From our point of view differences in the earnings of these of employee categories,
should be considered the starting point to shape differentiation of incomes of the population in
relation to wage labor.The main principle of fair parity remuneration should be the correlation
of earnings to the results of labor, within the framework of the neoclassical theory-the marginal
resource return, taking into account compensation payments for unfavorable working
conditions and the stimulating component. The issue of the interrelation of remuneration with
labour results is known to be as the most complicated issue in theoretical terms. The
neoclassical views are based on the idea that each production factor creates an income equal to
the costs of the corresponding resource for creating an economic good. A certain amount of
wages is established directly on the labor market ddepending on the ratio between the demand
for labor and its supply, the marginal return of labor. Moreover, as imperfect competition is
characterized by the elements of monopolism and being not in the market equilibrium state,
such a correspondence is usually violated.
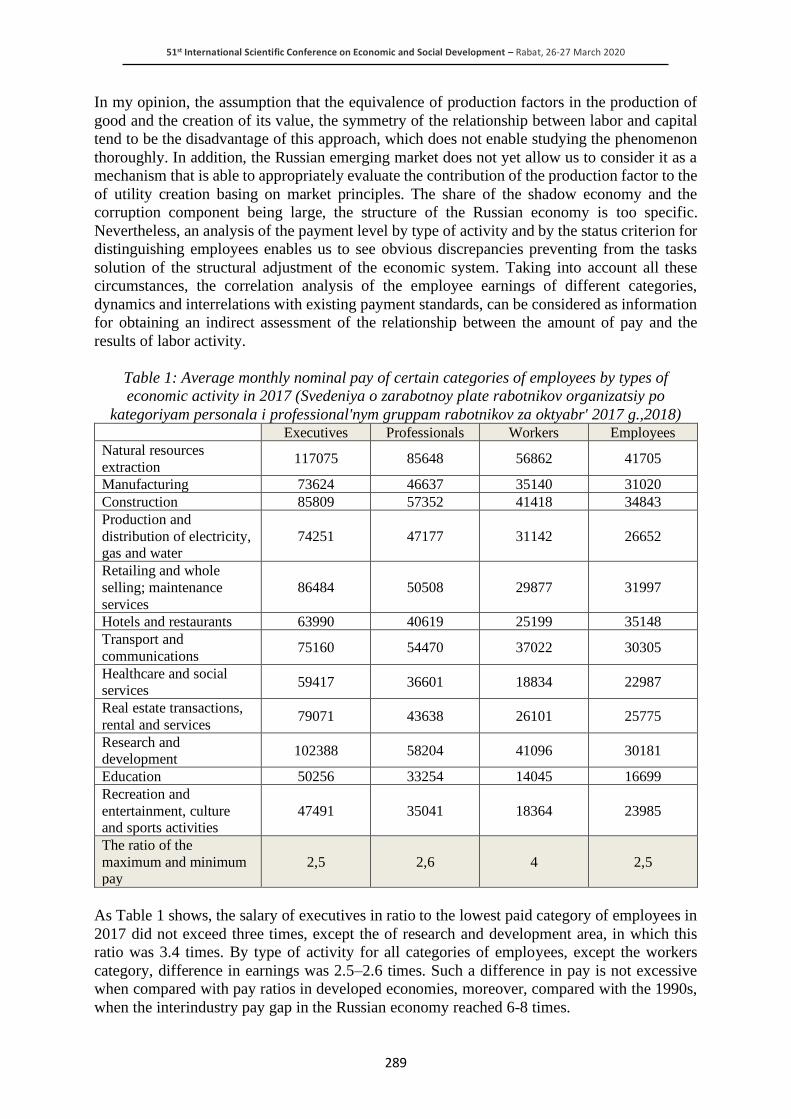
51st International Scientific Conference on Economic and Social Development – Rabat, 26-27 March 2020
289
In my opinion, the assumption that the equivalence of production factors in the production of
good and the creation of its value, the symmetry of the relationship between labor and capital
tend to be the disadvantage of this approach, which does not enable studying the phenomenon
thoroughly. In addition, the Russian emerging market does not yet allow us to consider it as a
mechanism that is able to appropriately evaluate the contribution of the production factor to the
of utility creation basing on market principles. The share of the shadow economy and the
corruption component being large, the structure of the Russian economy is too specific.
Nevertheless, an analysis of the payment level by type of activity and by the status criterion for
distinguishing employees enables us to see obvious discrepancies preventing from the tasks
solution of the structural adjustment of the economic system. Taking into account all these
circumstances, the correlation analysis of the employee earnings of different categories,
dynamics and interrelations with existing payment standards, can be considered as information
for obtaining an indirect assessment of the relationship between the amount of pay and the
results of labor activity.
Table 1: Average monthly nominal pay of certain categories of employees by types of
economic activity in 2017 (Svedeniya o zarabotnoy plate rabotnikov organizatsiy po
kategoriyam personala i professional'nym gruppam rabotnikov za oktyabr' 2017 g.,2018) Executives Professionals Workers Employees
Natural resources
extraction 117075 85648 56862 41705
Manufacturing 73624 46637 35140 31020
Construction 85809 57352 41418 34843
Production and
distribution of electricity, gas and water
74251 47177 31142 26652
Retailing and whole
selling; maintenance
services
86484 50508 29877 31997
Hotels and restaurants 63990 40619 25199 35148
Transport and
communications 75160 54470 37022 30305
Healthcare and social services
59417 36601 18834 22987
Real estate transactions,
rental and services 79071 43638 26101 25775
Research and development
102388 58204 41096 30181
Education 50256 33254 14045 16699
Recreation and
entertainment, culture and sports activities
47491 35041 18364 23985
The ratio of the
maximum and minimum pay
2,5 2,6 4 2,5
As Table 1 shows, the salary of executives in ratio to the lowest paid category of employees in
2017 did not exceed three times, except the of research and development area, in which this
ratio was 3.4 times. By type of activity for all categories of employees, except the workers
category, difference in earnings was 2.5–2.6 times. Such a difference in pay is not excessive
when compared with pay ratios in developed economies, moreover, compared with the 1990s,
when the interindustry pay gap in the Russian economy reached 6-8 times.
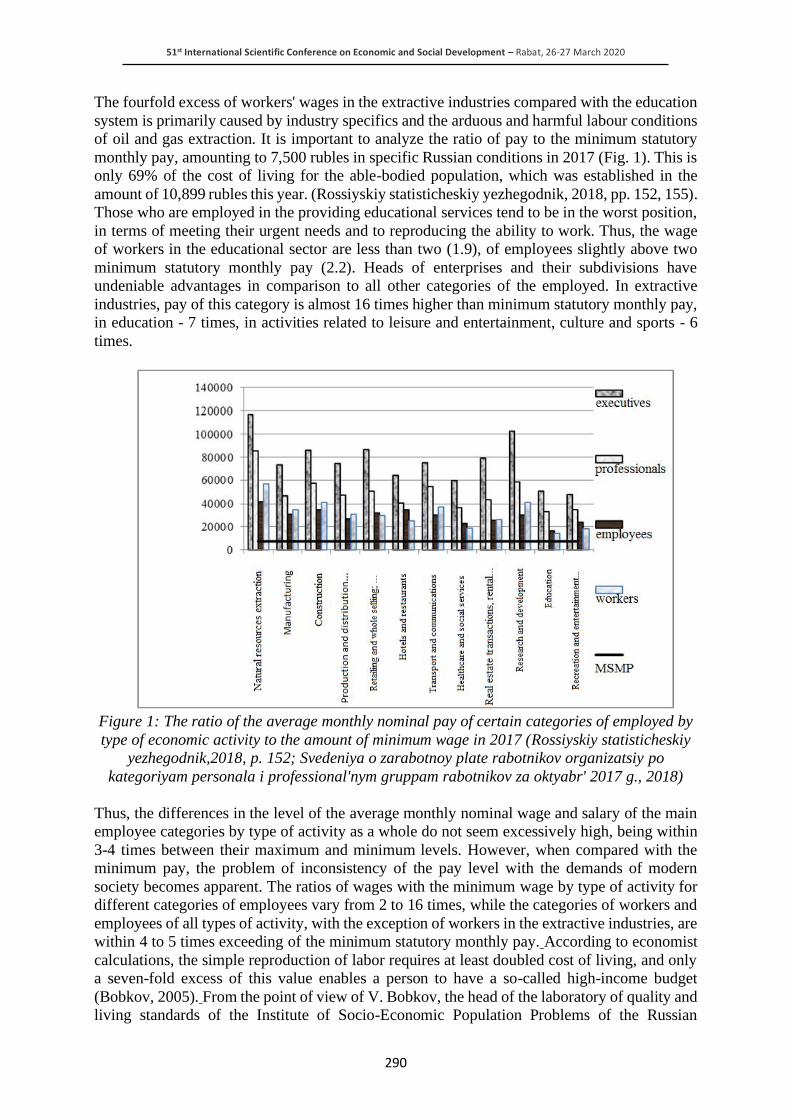
51st International Scientific Conference on Economic and Social Development – Rabat, 26-27 March 2020
290
The fourfold excess of workers' wages in the extractive industries compared with the education
system is primarily caused by industry specifics and the arduous and harmful labour conditions
of oil and gas extraction. It is important to analyze the ratio of pay to the minimum statutory
monthly pay, amounting to 7,500 rubles in specific Russian conditions in 2017 (Fig. 1). This is
only 69% of the cost of living for the able-bodied population, which was established in the
amount of 10,899 rubles this year. (Rossiyskiy statisticheskiy yezhegodnik, 2018, pp. 152, 155).
Those who are employed in the providing educational services tend to be in the worst position,
in terms of meeting their urgent needs and to reproducing the ability to work. Thus, the wage
of workers in the educational sector are less than two (1.9), of employees slightly above two
minimum statutory monthly pay (2.2). Heads of enterprises and their subdivisions have
undeniable advantages in comparison to all other categories of the employed. In extractive
industries, pay of this category is almost 16 times higher than minimum statutory monthly pay,
in education - 7 times, in activities related to leisure and entertainment, culture and sports - 6
times.
Figure 1: The ratio of the average monthly nominal pay of certain categories of employed by
type of economic activity to the amount of minimum wage in 2017 (Rossiyskiy statisticheskiy
yezhegodnik,2018, p. 152; Svedeniya o zarabotnoy plate rabotnikov organizatsiy po
kategoriyam personala i professional'nym gruppam rabotnikov za oktyabr' 2017 g., 2018)
Thus, the differences in the level of the average monthly nominal wage and salary of the main
employee categories by type of activity as a whole do not seem excessively high, being within
3-4 times between their maximum and minimum levels. However, when compared with the
minimum pay, the problem of inconsistency of the pay level with the demands of modern
society becomes apparent. The ratios of wages with the minimum wage by type of activity for
different categories of employees vary from 2 to 16 times, while the categories of workers and
employees of all types of activity, with the exception of workers in the extractive industries, are
within 4 to 5 times exceeding of the minimum statutory monthly pay. According to economist
calculations, the simple reproduction of labor requires at least doubled cost of living, and only
a seven-fold excess of this value enables a person to have a so-called high-income budget
(Bobkov, 2005). From the point of view of V. Bobkov, the head of the laboratory of quality and
living standards of the Institute of Socio-Economic Population Problems of the Russian
51st International Scientific Conference on Economic and Social Development – Rabat, 26-27 March 2020
291
Academy of Sciences, in the current conditions the cost of living should be on average no less
than three times higher than the existing level and should be approximately 35 thousand rubles
(Ivanov, 2019).
3. NFLUENCE OF THE PROFESSIONAL-OFFICIAL STATUS ON THE PAY LEVEL
Implying an increase in the share of the high-tech sector and high-tech industries structural
adjustment tends to be an urgent problem for the Russian economy. A necessary condition for
moving in this direction one should be consider tackling social problems, in particular, the
improvement of the labor payment system, turning into an incentive for better work under
certain conditions. It makes sense to consider the modern economy as a structure that includes
three sectors, depending on the nature of production activity and the type of goods produced.
The primary sector is the extraction of raw materials and their processing, the secondary -
making industrial products, energy and water supply, construction. The service sector can be
considered as the tertiary sector: transport, communications, trade, education, healthcare,
tourism and other services. In addition, this includes services related to production planning
and its arrangement - information technology, research, global marketing, banking and financial
services (if the quaternary sector is not allocated separately). From a theoretical point of view,
labor, regardless of industry specifics, but requiring an employee to have approximately the
same level of qualification, should be evaluated equally by the market. Be it an engineer,
operator or manager. In any case, if the market mechanism works quite efficiently, then a
tendency of the equalizing these levels should manifest it. Fig. 1 - Fig. 4 show the ratio and
dynamics of the pay level of particular professional and position groups of employed within
the framework of activities representing three sectors of the Russian economy. The extracting
sector was the leading one in terms of pay for all four categories of employees in 2017. But, if
the heads of enterprises and their structural divisions in the field of fuel and energy resources
extraction earned 2.1 times more than in education, so the professionals of the two categories
mentioned earned 2.5 and 2.7 times more, respectively, and skilled workers in extractive
industries - 3.1 times more. And the point here is not that the education sector has lagged behind
in hiring highly qualified specialists and skilled workers. The determining factor is that a skilled
worker in the educational sector earns only 25% of the amount the worker in the extractive
industry does, according to 2017. At the same time, the executive’s earnings in the field of
education amounted to only 43% of the executive’s earnings in mining. As for the latter, being
reasonable a significant share of pay is made up of compensation and incentive payments for
harmful working conditions. But wages only one and a half times higher than the current cost
of living and cannot be considered as an adequate assessment of labor of any complexity in the
modern economy, including the education system.
Figure following on the next page

51st International Scientific Conference on Economic and Social Development – Rabat, 26-27 March 2020
292
Figure 2: Dynamics of the average accrued wages of enterprise executives and their
structural divisions by type of economic activity (Trud i zanyatost' v Rossii, 2007, 2009, 2011,
URL; Trud i zanyatost' v Rossii,2013, p. 470; Trud i zanyatost' v Rossii,2015, s.269; Trud i
zanyatost' v Rossii,2017,p. 254; Svedeniya o zarabotnoy plate rabotnikov organizatsiy po
kategoriyam personala i professional'nym gruppam rabotnikov za oktyabr' 2017 g.,2018)
Figure 3: Dynamics of the average accrued wages of highly qualified specialists by type of
economic activity (Trud i zanyatost' v Rossii, 2007, 2009, 2011, URL; Trud i zanyatost' v
Rossii,2013, p. 470; Trud i zanyatost' v Rossii,2015, p.269; Trud i zanyatost' v Rossii,2017,p.
254; Svedeniya o zarabotnoy plate rabotnikov organizatsiy po kategoriyam personala i
professional'nym gruppam rabotnikov za oktyabr' 2017 g.,2018)
Figure following on the next page

51st International Scientific Conference on Economic and Social Development – Rabat, 26-27 March 2020
293
Figure 4: Dynamics of the average accrued payroll of mid-level specialists by type of
economic activity (Trud i zanyatost' v Rossii, 2007, 2009,2011, URL; Trud i zanyatost' v
Rossii,2013, p. 470; Trud i zanyatost' v Rossii,2015, p.269; Trud i zanyatost' v Rossii,2017,p.
254; Svedeniya o zarabotnoy plate rabotnikov organizatsiy po kategoriyam personala i
professional'nym gruppam rabotnikov za oktyabr' 2017 g.,2018)
Figure 5: Dynamics of the average accrued wages of skilled workers in industrial enterprises
of construction, transport, communications and related enterprises by type of economic
activity (Trud i zanyatost' v Rossii, 2007, 2009,2011, URL; Trud i zanyatost' v Rossii,2013, p.
470; Trud i zanyatost' v Rossii,2015, p.269; Trud i zanyatost' v Rossii,2017,p. 254; Svedeniya
o zarabotnoy plate rabotnikov organizatsiy po kategoriyam personala i professional'nym
gruppam rabotnikov za oktyabr' 2017 g.,2018)
One can see the general growth trend in nominal wages, but the rates vary, and therefore the
ratios become different. The gap between the maximum level (extractive industries) and the
minimum level (education) at the beginning and at the end of the period under consideration is
reduced for all categories of employees from 0.4 to 1.0 times, with the exception of highly
qualified specialists, for whom the gap has grown slightly: from 2 5 to 2.6 times. It has equaled
3.4 for intermediate level specialists, workers - 2.8, executives - 2.4 times. The prevailing trend
of reducing differences in the level of wages of the same category of the people employed in
different types of activities is a positive point, since it reflects the smoothing out of unreasonable
intersectorial pay differences in in the Russian economy. From a theoretical point of view, it is
difficult to explain the big differences in the earnings of workers in different activities versus
the smaller differences between top-level professionals and executives, since more complicated
work can be more differentiated in terms of pay.

51st International Scientific Conference on Economic and Social Development – Rabat, 26-27 March 2020
294
However, our previous study, based on the trend identification and determining the reliability
level of the approximation of data series had shown that workers displayed the lowest wage
differentiation by type of activity was observed (according to data of 2013). It was somewhat
lower for professionals, but noticeably higher for representatives of the administrative
apparatus (Fyodorova, 2016). This was caused, in particular, by the fact that the managerial
staff, as compared with workers, has a higher level of education and a specific human capital.
Rregardless the type of activity, the category of intermediate level professionals showed the
highest increase of nominal wages between 2005 and 2017- more than five times, the earnings
of executives and specialists of a higher category increased somewhat more slowly, the wages
of skilled workers increased only three times. Education proved to be a lagging sector for all
categories of the employed, being not appropriate for the development needs of the modern
economy.
4. CONCLUSIONS
1) Analysis of the wage and salary level of the aggregated categories of employed in the
Russian economy according to official statistics has showed no profound differences in this
indicator. The salaries of enterprise executives as the highest paid employees in 2017
exceeded the salaries of the other categories of employees less than two times, and a little
more than three times, being estimated as acceptable ratios from the economic point of
view. A thorough analysis of existing problems in the field of remuneration can be given
on the basis of additional information, in particular, on the allocation of each category of
employees by pay level within the framework of decile groups of the employed by type of
activity.
2) Along with the gradual increase in the nominal wages of the categories of employed under
consideration, there is a lag in the tertiary sector, represented in this study by the education
system. This sphere is characterized by the lowest pay level for all categories of employees
and its slow growth, being inappropriate for the objective set to shape a new technological
structure.
3) Since the existing artificially low social standards do not ensure the reproduction of the
ability to work of skilled workers and ordinary employees of almost all sectors of the
economy, as well as a significant part of professionals, it is relevant, along with raising the
pay level of the lowest paid categories of workers, its steady growth for all professionally -
position groups. The determining institutional prerequisite for pay raising is the
development and application of social standards that meet modern requirements for
economic development.
LITERATURE:
1. Bobkov, V. (1995). Problemy otsenki urovnya zhizni v sovremennoy Rossii. M.: Vseros.
Tsentr urovnya zhizni.
2. Bobkov, V. (2005). Umen'sheniye bednosti: k razrabotke Natsional'noy programmy //
Chelovek i trud. №5. pp. 13-18.
3. Gubanov, S. (2011). Sistemnyy vybor Rossii i uroven' zhizni // Ekonomist. №11. pp. 3-55.
4. Doklad o chelovecheskom razvitii v rossiyskoy Federatsii za 2014 god, (2014). M.:
Analiticheskiy tsentr pri Pravitel'stve Rossiyskoy Federatsii.
5. Zhuravleva, T. (2015). Platit li rossiyskoy gosudarstvo «spravedlivuyu» zarabotnuyu platu:
obzor issledovaniy // Voprosy ekonomiki. №11. pp. 62-84.
6. Zarabotnaya plata v mire 2016-2017: neravenstvo oplaty truda na predpriyatiyakh. (2017).
Moskva. MOT. Retrieved 5.05.2017 from
http://www.ilo.org/moscow/news/WCMS_538290/lang--ru/index.htm
51st International Scientific Conference on Economic and Social Development – Rabat, 26-27 March 2020
295
7. Ivanov, A. (17.09.2019). Prozhitochnyy minimum v Rossii dolzhen byt' 35 tys. rubley v
mesyats. // Svobodnaya pressa: Obshchestvo / Ekonomicheskiy krizis. Retrieved 2.09.2019.
from: https://svpressa.ru/society/article/243839/
8. Kapelyushnikov, R. (2004). Mekhanizmy formirovaniya zarabotnoy platy v rossiyskoy
promyshlennosti // Voprosy ekonomiki. №4. pp. 66-90.
9. Luk'yanchikova, T., Yamshchikova, T. (2016). Teoriya i real'nost' sotsial'nogo neravenstva
// Ekonomist. №11. pp. 28-35.
10. Oshchepkov, A. (2006). Gendernyye razlichiya v oplate truda v Rossii. M.: Ekonomicheskiy
zhurnal VSHE. №4. pp. 590-619.
11. Roik, V. (2006). Utverzhdena novaya potrebitel'skaya korzina: naskol'ko uluchshitsya
zhizn' rossiyan? // Chelovek i trud. №5. pp. 20-21.
12. Rossiya i strany mira. (2018). Stat. sb. M.: Rosstat.
13. Rossiyskiy statisticheskiy yezhegodnik. (2018). Stat. sb. M.: Rosstat.
14. Svedeniya o zarabotnoy plate rabotnikov organizatsiy po kategoriyam personala i
professional'nym gruppam rabotnikov za oktyabr' 2017 g. (statisticheskiy byulleten').
(2018). Moskva. Rosstat.
15. Tikhonova, N., Mareyeva, S. (2009). Sredniy klass: teoriya i real'nost'. M.: Al'fa-M.
16. Trud i zanyatost' v Rossii. (2007). Stat. sb. M.: Rosstat. Retrieved 20.09.2019 from
https://www.gks.ru/bgd/regl/B07_36/Main.htm
17. Trud i zanyatost' v Rossii. (2009). Stat. sb. M.: Rosstat. Retrieved 20.09.2019 from
https://www.gks.ru/bgd/regl/B09_36/Main.htm
18. Trud i zanyatost' v Rossii. (2011). Stat. sb. M.: Rosstat. Retrieved 20.09.2019 from
https://www.gks.ru/bgd/regl/B11_36/Main.htm
19. Trud i zanyatost' v Rossii. (2013). Stat. sb. M.: Rosstat
20. Trud i zanyatost' v Rossii. (2015). Stat. sb. M.: Rosstat
21. Trud i zanyatost' v Rossii. (2017). Stat. sb. M.: Rosstat
22. Fyodorova, L. (2016). Faktory differentsiatsii zarabotnoy platy otdel'nykh kategoriy
rabotnikov v rossiyskoy ekonomike // Vestnik Novosib. un-ta ekonomiki i upravleniya. №4.
pp. 56-66.
23. Yakovlev, R. (2003). Dinamika proizvoditel'nosti truda i zarabotnoy platy v postsovetskoy
Rossii: yest' li vzaimosvyaz'? // Rossiyskiy ekonomicheskiy zhurnal. №9-10. pp. 16-29.
51st International Scientific Conference on Economic and Social Development – Rabat, 26-27 March 2020
296
ASSESSMENT OF MORTGAGE AVAILABILITY FOR THE
POPULATION OF THE RUSSIAN FEDERATION
Lyudmila Rudy
Novosibirsk State University of Economics and Management, Russia
Tatyana Tropnikova
Novosibirsk State University of Economics and Management, Russia
ABSTRACT
The experience of developed countries testifies to the success of mortgage loan mechanisms.
This mechanism allows citizens who do not have sufficient funds for a one-time purchase of
housing, but have a stable income and certain savings, to solve the housing problem. We can
say that the practice of mortgage loans has been formed in the Russian Federation. The
foundations have been laid and the legal framework for its operation has been created. This is
reflected in the dynamics of a number of indicators such as: the number of credit institutions
that provide mortgage loans; the volume and average size of mortgage loans; the mortgage
interest rate and terms; the share of mortgage loans in GDP. But does these facts imply that
mortgage lending has become widespread and affordable for the majority of citizens of the
Russian Federation? To answer this question, the article assesses the availability of mortgage
loans and services to the Russian population in 2001-2019 using the case of the Novosibirsk
region. The most important factors of mortgage loan availability are analyzed on the basis of
the state statistics: income as a source of monthly loan repayment and servicing; savings as a
source of down payments; the price of one square meter in a standard two-room apartment on
the secondary market; the mortgage interest rate; the loan term. The assessment of the
purchased housing is given from the point of view of such indicator as "adequacy of housing",
that is, the ability to meet human needs in accordance with modern society requirements. The
main conclusions of the study are as follows: mortgage loans have become a real way to buy
housing, primarily of economy class. And this is despite the fact that mortgages are still an
expensive option for solving the housing problem. The availability of mortgage loans for
various segments of the population is increasing gradually. There is a considerable potential
for further growth. A large role in the development of mortgages is played by the state, which
considers mortgage loans as a priority way to solve the housing problem.
Keywords: the availability of mortgages; mortgages; factors of mortgage availability
1. INTRODUCTION
In order to assess the availability of mortgage loans for various segments of the Russian
population, it is necessary to determine their 'creditworthiness', i. e. the ability of the population
to take a loan and repay it. On the one hand, this ability depends on average per capita income
as a source of monthly loan repayment. On the other hand, it depends on average per capita
savings as a source of down payment when buying a home. The income of the population
determines, first of all, the availability of mortgages for different strata. And not just that. Such
factors as the price of 1 square meter in the primary and secondary housing markets, the interest
rate and the term of the mortgage loans, the "adequacy" of mortgage housing as the ability to
meet the needs of the population in accordance with modern standards, etc. also have a
significant impact. Let us analyze the impact of these factors on the mortgage lending using the
example of the Novosibirsk region for the period of 2001-2019. The year 2001 was not chosen
for the analysis by chance.
51st International Scientific Conference on Economic and Social Development – Rabat, 26-27 March 2020
297
2001 is linked to the initial stage of mortgage system implementation – Law No. 98-03 "On
mortgage loans in the Novosibirsk region" dated 11.05.2000 was adopted; economic and
institutional framework was developed. The economic foundations of the mortgage lending
include: the formation and development of primary and secondary housing market; the
preponderance of private housing in the structure of the housing stock by forms of ownership;
the decrease in budgetary financing of housing construction; the decline in the volume of free
accommodation provided to the people in the housing waiting lists, low availability of housing
for the majority of the population due to their low income; inability to purchase housing for
those who have a stable income due to the lack of long-term loans. The organizational basis of
the housing mortgage system was laid down by the establishment of the Novosibirsk Agency
for Housing Mortgage Loans JSC as an institute of the secondary housing mortgage market.
The majority stake (70%) belonged to the Housing Construction Fund of The Novosibirsk
Region (state unitary enterprise). The bank granting loans was the Novosibirsk branch of
Sibcontact Commercial Bank JSC. In the Novosibirsk region, first commercial mortgage loans
were extended in September 2001, and by the end of the year only 3 loans were extended
totalling 998 thousand roubles. In 2002, 24 loans were extended amounting to 12 million 735
thousand roubles. In 2003 240 loans were extended amounting to 138 million 677 thousand
roubles. Since 2004, the Novosibirsk branch of Sobinbank and Sibakadembank have become
primary creditors, in addition to Sibcontact. Independent programmes are implemented by
Sberbank, Novosibirsk Vneshtorgbank, and others. Since 01.01.2003, the social mortgage
programme for public sector employees has been implemented in the Novosibirsk region. And
in 2018, the Novosibirsk region enters the list of TOP 20 regions of the Russian Federation by
the volume of mortgage lending, taking the 8th position by the following indicators: the volume
of mortgage loans of 70 billion 494 million roubles; the growth rate of mortgage loans as
compared to 2017 – 51,2%; the share in total volume of loans in Russia – 2.3%[10].
2. CALCULATIONS OF THE MORTGAGE LOANS AVAILABILITY INDICATORS
IN THE NOVOSIBIRSK REGION
The assessment of the mortgage availability can be presented in the form of an algorithm.
• Step 1 – calculation of an average monthly per capita income for decile groups. For this
purpose, the assessment is based on official statistics: income, population, and distribution
of total cash income by decile groups.
• Step 2 – calculation of savings per capita. In reality, the population saves only part of the
income remaining after the deduction of final consumption. Since the saving behaviour of
the population depends on the level of income, it is also advisable to calculate the savings
rate for decile groups. But since official statistics data on savings is not available, let us
assume that savings are distributed in proportion to the income received. At the same time,
we exclude those groups whose average per capita income is below the subsistence
minimum, at/or slightly above it. These groups do not have savings. The savings of the
Novosibirsk region population are represented by cash balances of the population;
investments in securities, foreign currency deposits, and investments in foreign currency.
• Step 3 – Calculation of savings and income required to pay the down payment, repayment
and servicing of the mortgage loan for the purchase of a typical apartment in the
Novosibirsk region secondary housing market.
Here is an example of the calculation for 2001:
• cost of 1 sq. m. in a typical apartment on the Novosibirsk region secondary housing market
amounted to RUB 10,558;

51st International Scientific Conference on Economic and Social Development – Rabat, 26-27 March 2020
298
• the floor area of a standard 2-room apartment, based on the social norm of housing for a
family of 3 people, is taken as 54 sq. m. This corresponds to the standard of the Housing
Federal target programme;
• the market price of this apartment was, respectively, 10,558 roubles x 54 sq. m = 570132
roubles;
• the down payment equal to 30% of the market price of the apartment is 171,039 roubles.
And since the average family consists of 3 people it makes 57,013 roubles per a member;
• the amount of the mortgage loan is 70% or 399,093 roubles for a period of 10 years and the
interest rate is 18%;
• an average monthly loan servicing and repayment on an annuity are equal to 7,191 roubles.
• taking into account that these expenses make up 1/3 of the family's disposable income, we
calculate the required income of 7,191 roubles: 0.33 = 21,791 roubles or 7,264 roubles per
a family member. We compare the required income with the income calculated using
statistical data.
• As the income, we use the average salary for 10 decile groups of employees. The amount
for 2 working family members in the 10th group is 14,438 roubles; 4,813 roubles per a
family member.
• We compare the savings calculated from statistical data with the ones necessary for
accumulating the initial payment for 7 years – 678 roubles per month.
It is obvious that even the 10th decile group as a whole did not have the income necessary for
monthly payments to repay and service the loan. Its income constitutes 67% of the required
amount. It also could not accumulate the amount needed for the down payment. We will make
calculations to determine the availability of mortgage loan for the population of the Novosibirsk
region in 2001-2019 and sum them up in a table.
Table following on the next page
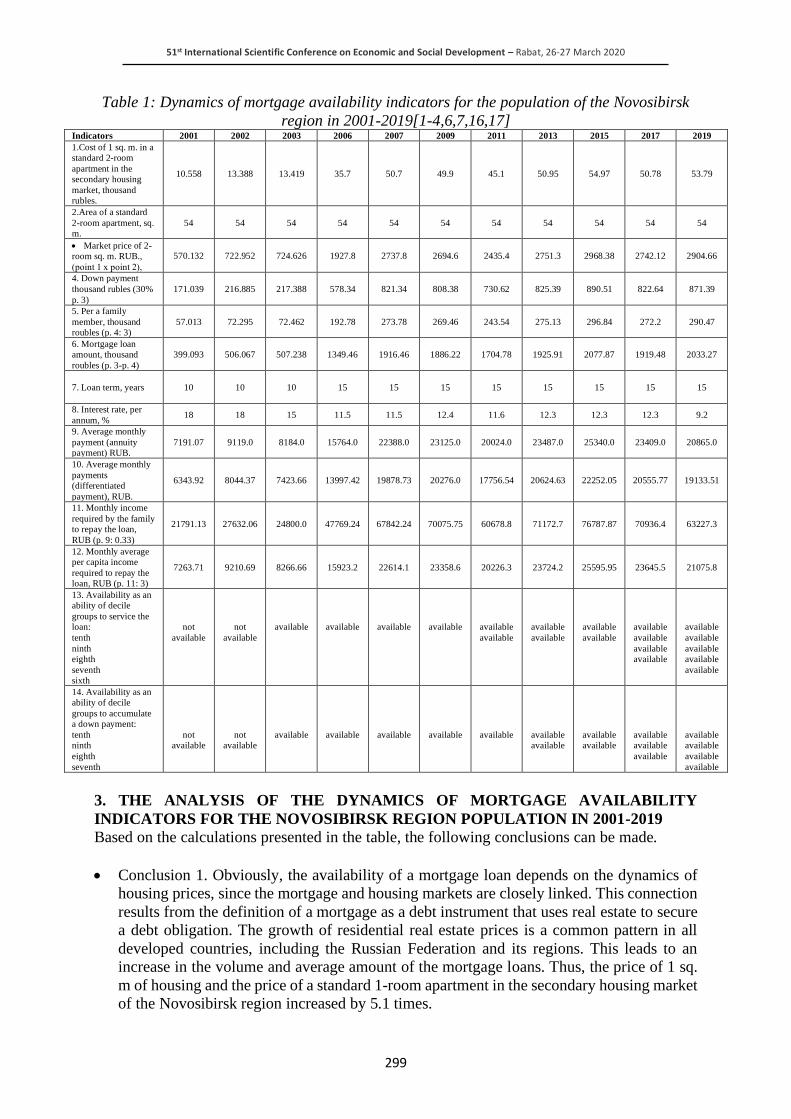
51st International Scientific Conference on Economic and Social Development – Rabat, 26-27 March 2020
299
Table 1: Dynamics of mortgage availability indicators for the population of the Novosibirsk
region in 2001-2019[1-4,6,7,16,17] Indicators 2001 2002 2003 2006 2007 2009 2011 2013 2015 2017 2019
1.Cost of 1 sq. m. in a
standard 2-room
apartment in the
secondary housing
market, thousand
rubles.
10.558 13.388 13.419 35.7 50.7 49.9 45.1 50.95 54.97 50.78 53.79
2.Area of a standard
2-room apartment, sq.
m.
54 54 54 54 54 54 54 54 54 54 54
• Market price of 2-
room sq. m. RUB.,
(point 1 х point 2),
570.132 722.952 724.626 1927.8 2737.8 2694.6 2435.4 2751.3 2968.38 2742.12 2904.66
4. Down payment
thousand rubles (30%
p. 3)
171.039 216.885 217.388 578.34 821.34 808.38 730.62 825.39 890.51 822.64 871.39
5. Per a family
member, thousand
roubles (p. 4: 3)
57.013 72.295 72.462 192.78 273.78 269.46 243.54 275.13 296.84 272.2 290.47
6. Mortgage loan
amount, thousand
roubles (p. 3-p. 4)
399.093 506.067 507.238 1349.46 1916.46 1886.22 1704.78 1925.91 2077.87 1919.48 2033.27
7. Loan term, years
10 10 10 15 15 15 15 15 15 15 15
8. Interest rate, per
annum, % 18 18 15 11.5 11.5 12.4 11.6 12.3 12.3 12.3 9.2
9. Average monthly
payment (annuity
payment) RUB.
7191.07 9119.0 8184.0 15764.0 22388.0 23125.0 20024.0 23487.0 25340.0 23409.0 20865.0
10. Average monthly
payments
(differentiated
payment), RUB.
6343.92 8044.37 7423.66 13997.42 19878.73 20276.0 17756.54 20624.63 22252.05 20555.77 19133.51
11. Monthly income
required by the family
to repay the loan,
RUB (p. 9: 0.33)
21791.13 27632.06 24800.0 47769.24 67842.24 70075.75 60678.8 71172.7 76787.87 70936.4 63227.3
12. Monthly average
per capita income
required to repay the
loan, RUB (p. 11: 3)
7263.71 9210.69 8266.66 15923.2 22614.1 23358.6 20226.3 23724.2 25595.95 23645.5 21075.8
13. Availability as an
ability of decile
groups to service the
loan:
tenth
ninth
eighth
seventh
sixth
not
available
not
available
available
available
available
available
available
available
available
available
available
available
available
available
available
available
available
available
available
available
available
14. Availability as an
ability of decile
groups to accumulate
a down payment:
tenth
ninth
eighth
seventh
not
available
not
available
available
available
available
available
available
available
available
available
available
available
available
available
available
available
available
available
3. THE ANALYSIS OF THE DYNAMICS OF MORTGAGE AVAILABILITY
INDICATORS FOR THE NOVOSIBIRSK REGION POPULATION IN 2001-2019
Based on the calculations presented in the table, the following conclusions can be made.
• Conclusion 1. Obviously, the availability of a mortgage loan depends on the dynamics of
housing prices, since the mortgage and housing markets are closely linked. This connection
results from the definition of a mortgage as a debt instrument that uses real estate to secure
a debt obligation. The growth of residential real estate prices is a common pattern in all
developed countries, including the Russian Federation and its regions. This leads to an
increase in the volume and average amount of the mortgage loans. Thus, the price of 1 sq.
m of housing and the price of a standard 1-room apartment in the secondary housing market
of the Novosibirsk region increased by 5.1 times.
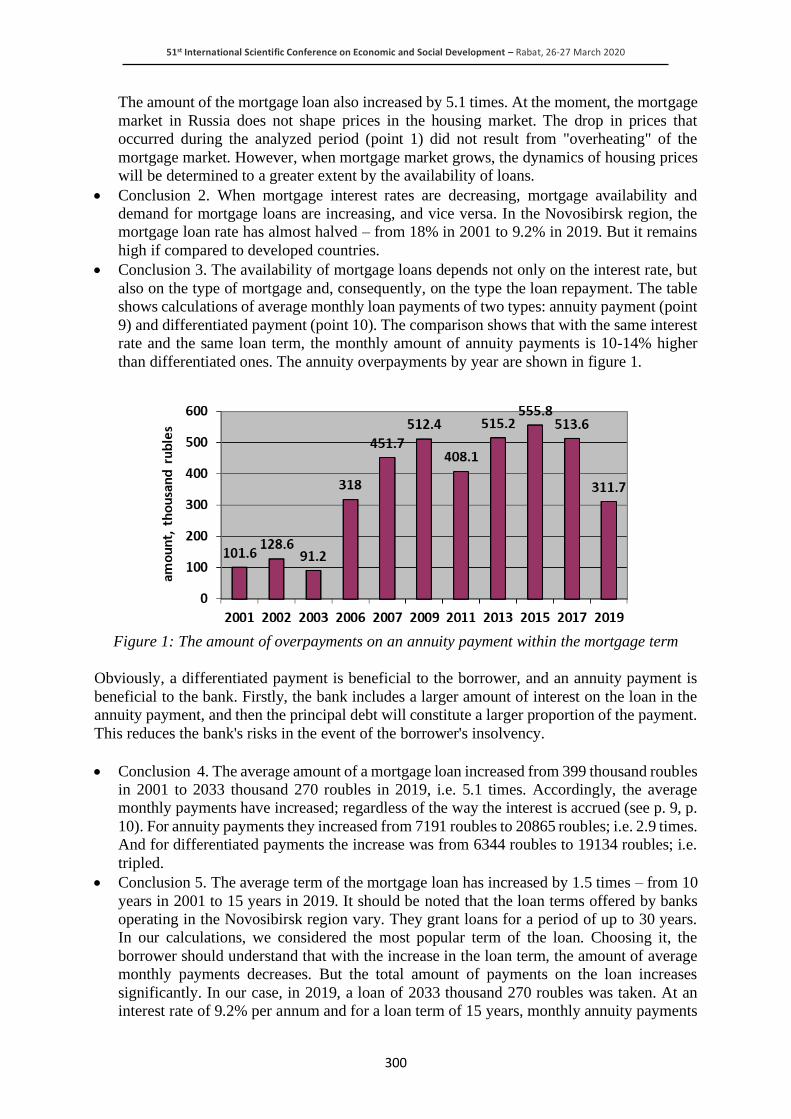
51st International Scientific Conference on Economic and Social Development – Rabat, 26-27 March 2020
300
The amount of the mortgage loan also increased by 5.1 times. At the moment, the mortgage
market in Russia does not shape prices in the housing market. The drop in prices that
occurred during the analyzed period (point 1) did not result from "overheating" of the
mortgage market. However, when mortgage market grows, the dynamics of housing prices
will be determined to a greater extent by the availability of loans.
• Conclusion 2. When mortgage interest rates are decreasing, mortgage availability and
demand for mortgage loans are increasing, and vice versa. In the Novosibirsk region, the
mortgage loan rate has almost halved – from 18% in 2001 to 9.2% in 2019. But it remains
high if compared to developed countries.
• Conclusion 3. The availability of mortgage loans depends not only on the interest rate, but
also on the type of mortgage and, consequently, on the type the loan repayment. The table
shows calculations of average monthly loan payments of two types: annuity payment (point
9) and differentiated payment (point 10). The comparison shows that with the same interest
rate and the same loan term, the monthly amount of annuity payments is 10-14% higher
than differentiated ones. The annuity overpayments by year are shown in figure 1.
Figure 1: The amount of overpayments on an annuity payment within the mortgage term
Obviously, a differentiated payment is beneficial to the borrower, and an annuity payment is
beneficial to the bank. Firstly, the bank includes a larger amount of interest on the loan in the
annuity payment, and then the principal debt will constitute a larger proportion of the payment.
This reduces the bank's risks in the event of the borrower's insolvency.
• Conclusion 4. The average amount of a mortgage loan increased from 399 thousand roubles
in 2001 to 2033 thousand 270 roubles in 2019, i.e. 5.1 times. Accordingly, the average
monthly payments have increased; regardless of the way the interest is accrued (see p. 9, p.
10). For annuity payments they increased from 7191 roubles to 20865 roubles; i.e. 2.9 times.
And for differentiated payments the increase was from 6344 roubles to 19134 roubles; i.e.
tripled.
• Conclusion 5. The average term of the mortgage loan has increased by 1.5 times – from 10
years in 2001 to 15 years in 2019. It should be noted that the loan terms offered by banks
operating in the Novosibirsk region vary. They grant loans for a period of up to 30 years.
In our calculations, we considered the most popular term of the loan. Choosing it, the
borrower should understand that with the increase in the loan term, the amount of average
monthly payments decreases. But the total amount of payments on the loan increases
significantly. In our case, in 2019, a loan of 2033 thousand 270 roubles was taken. At an
interest rate of 9.2% per annum and for a loan term of 15 years, monthly annuity payments

51st International Scientific Conference on Economic and Social Development – Rabat, 26-27 March 2020
301
amount to 20,865 rubles; and the total amount of payments to repay the loan is 1,722,430
roubles. With a loan term of 25 years, monthly annuity payments amount to 17,342 roubles,
and the total amount of payments to repay the loan is 3,169,330 roubles. At an interest rate
of 12.3% and for a loan term of 15 years, monthly annuity payments amount to 24,796
roubles, and the total amount of payments to repay the loan is 2,430,010 roubles. With a
loan term of 25 years, monthly annuity payments amount to 21,867 roubles, and the total
amount of payments to repay the loan is 4,526,830 roubles. Thus, the increase in total loan
payments with increasing terms is less noticeable as the interest rate of the loan decreases.
Therefore, when the interest rates are high, it is advisable to increase the loan term.
• Conclusion 6. The availability of a mortgage loan is also determined by the amount of the
down payment (point 4). It directly determines the amount of the mortgage loan (point 5).
We can say that the "loan/collateral" ratio at the moment of the mortgage extension reflects
the ability of the borrower to save money. The greater the share of own funds invested into
the purchase of housing, the greater the motivation of the borrower to repay the loan, so that
this housing is not lost.
In the analyzed period, the Novosibirsk Agency for Housing Mortgage Loans JSC for the
Novosibirsk region, its successor Dom. RF. Mortgage Agent and the majority of banks that
have their own mortgage programmes in the Novosibirsk region, followed the standard scenario
– a down payment of 30% of the apartment price, 70% mortgage loan. However, some banks
lessened the requirements for the borrower and provided a mortgage loan with a lower down
payment (10-20%) and even without it. This approach has gradually become quite widespread,
and at the beginning of 2019 in Russia, the share of loans with a down payment of 10-20% in
the total volume of loans granted reached 43.3% [8]. It may seem that a lower down payment
is beneficial to both the borrower and the lender. This allows the lender to increase the loan
portfolio, and makes it easier for the borrower to access a mortgage loan. But in reality, loans
with a lower down payment are characterized by an increased level of risk for both the borrower
and the lender. The borrower is more likely to experience a temporary decrease in income and
will have difficulty repaying the loan. The lender increases possible losses in the event of the
borrower's insolvency.
• Conclusion 7. The calculations show that the availability of mortgage loans for the
population of the Novosibirsk region is gradually increasing. This is especially noticeable
since 2013. This conclusion is confirmed by our calculations made on the basis of other
methods [12, 13]. In 2001-2002, the mortgage option under consideration was not available
even to a family with a salary in the 10th decile group. In 2003-2009, such a family could
afford a mortgage. Since 2011, the availability of mortgage loans has been growing and in
2019, a family with a salary in the 6th decile group could purchase a standard 2-room
apartment with a mortgage. Its income is to exceed 60 thousand roubles. This is the evidence
that mortgages are still an expensive solution to the housing problem. Families with
incomes in 8-10th decile groups can and will most likely consider other options for
improving housing conditions [14, 15].
• Conclusion 8. Calculations show that the availability of a mortgage loan in terms of the
ability of the population to accumulate a down payment is also growing (p. 14). In 2001-
2002, even a family with a salary in the 10th decile group could not do this. In 2003-2011,
such a family could accumulate the down payment required to purchase a standard 2-room
apartment. Since 2013, the availability of the mortgage loan has been growing, and in 2019,
representatives of 7-9th decile groups could afford it. At the same time, the availability of
mortgage loans is increasing against the background of falling real income of the population
over the past few years. Is there a contradiction? It is believed that the stabilization of the
51st International Scientific Conference on Economic and Social Development – Rabat, 26-27 March 2020
302
housing prices, as well as the reduction in the mortgage interest rate played a significant
role in the growth of affordability. But it is too early to say that the mortgage lending have
become mass and affordable.
Let us evaluate the housing purchased with a mortgage in terms of its "adequacy". "Adequate"
is the housing that meets modern standards of society. Modern society recognizes the right to
adequate housing as basic rights. The size of housing is regarded as a quantitative assessment
of its adequacy. Adequate housing is a housing of the adequate size. Its sufficiency can be
determined by a number of indicators: average floor area/home size per 1 person; number of
families in one residential unit; number of people in one room or number of rooms per 1 person,
etc. In this case:
• One family acquires separate, isolated housing, and this corresponds to average European
standards.
• There are 18 square meters per a family member. This corresponds to the average floor area
per 1 person in the Novosibirsk region in 2001-2003. In 2018, the average floor area per 1
person in the Novosibirsk region was 25.2 sq. m. Thus, the indicator of average floor area
per 1 person in the purchased apartment is lower than the average for the Novosibirsk
region. And is not comparable to the international minimum standard of 30 sq. m. per
person.
• The occupancy density of the apartment is expressed in formula K=n-1, where k is the
number of rooms and n is the number of family members. Thus, there are 0.67 rooms per 1
family member, with the minimum international standard of 1 room per 1 family member
in a separate apartment or house. It is obvious that the purchased apartment can not be
considered as adequate housing. It does not meet the requirements of society at the moment
and will not be able to meet them in 15 years [13]. This is the evidence that with existing
high housing prices, demand is primarily affected by the family income. And factors that
are important in other situations, such as family composition, level of housing, lose their
importance.
4. CURRENT SITUATION IN THE MORTGAGE MARKET
The general trend in the development of the mortgage market of the Russian Federation and
Novosibirsk region is the growth of mortgage loans volume over the whole period considered.
The Russian financial market has not yet faced mortgage crises, although the crisis situation
was observed in 2009-2010. This is evidenced by the following factors: the decrease in the
volume of mortgage lending; increase in the mortgage interest rate; increase in the volume of
overdue debt and its share in the total debt on mortgage lending; decrease in the volume of
refinanced mortgage lending due to increased risks, etc. However, it was caused by external
factors – the global financial crisis that began in the US mortgage market []. Some signs of a
crisis situation were observed after 2014 in connection with economic sanctions against the
Russian Federation. However, this situation did not change the overall positive dynamics in the
development of the Russian mortgage market. The growth of mortgage lending has been
particularly noticeable since 2013. In 2013-2019, the volume of the mortgage loan portfolio
increased by 3.65 times – from 2.0 to 7.3 million roubles. The share of mortgage loans in the
total portfolio of loans to individuals increased from 27.8% to 42.8% [8]. And there is a
significant potential for further growth of the mortgage lending. Despite the growth in the
volume of housing and communal services, their share in 2019 was less than 7% of Russia's
GDP. While in emerging markets this share is 10-30% of GDP, and in developed countries it is
more than 100%. The activities of the Russian Federation Central Bank and the state, which
considers mortgages as a priority way to improve the living conditions of the population
contributes to the growth of the mortgage market and ensure its balance.

51st International Scientific Conference on Economic and Social Development – Rabat, 26-27 March 2020
303
Thus, the Central Bank's policy is directed against the massive reduction of requirements for
borrowers by banks: providing loans with a low down payment and a high debt load. Weak
lending standards increase risks, lead to significant losses in the banking sector, and severe
social consequences if the borrower loses their home. In this regard, the Russian Federation
Central Bank is already applying macroprudential regulations aimed at reducing the share of
mortgage loans with a down payment of 10 to 20%. This includes an increased risk ratio that
affects the capital adequacy of a credit institution. The higher the risk ratio, the more capital is
to be reserved for the provision of credit and the less profitable such lending is. This activity
during 2019 led to a decrease in the share of loans with a down payment of 10-20% down to
35.7%, but it is still high [8]. The Central Bank's policy is aimed at reducing the share of
borrowers who have simultaneous debts on loans. The higher the borrower's debt load, the more
likely it is that over the long term of the mortgage loan, they will face a temporary decrease in
income and will experience difficulties with servicing the loan. As of 01.09.2019, the share of
mortgage borrowers having other outstanding debts was 46%. Among them are those who take
out a consumer loan as a down payment on a mortgage. A consumer loan taken three months
prior to the mortgage loan may indirectly prove it. However, the share of such borrowers is
insignificant and it does not exceed several percent of the loan [11]. In this regard, the Central
Bank instructed the banks to calculate the indexes of the individual's debt load for all newly
granted loans in accordance with a more conservative approach from 01.10.2019. It
macroprudential regulations may be applied to limit the debt load. The state's activities are
primarily aimed at creating general conditions for economic stabilization: to decrease the level
of inflation to the target numbers; to lower unemployment, etc. This should lead to an increase
in the real income of the population, which have not grown much over the past few years. Great
hopes are placed on the Housing and Urban Environment national projects, availability and
massafication of the mortgage loans being one of their priorities; on the Demographics project,
the implementation of which also creates the possibility of further improvement of housing
conditions for young families and families with children. So, from 01.01.2020, the "maternity"
capital programme provides for payments of 466 thousand roubles for the birth of the first child;
an increase in the "maternity capital", allowance paid by the state for the birth of the second
child. It can be used as a down payment when taking a mortgage loan. In addition, a part of the
mortgage loan is written off with the birth of the third child and subsequent children; a part of
the down payment can be subsidized at the expense of the budget funds. The state should
promote competition in the mortgage market. The mortgage market in Russia is highly
concentrated. So, in 2018, 85% of all mortgage loans and 87% of mortgage debt accounted
were granted by 5 banks: Sberbank, VTB, Gazprombank, Rosselkhozbank, DeltaCredit.
DeltaCredit is the only private bank in this list, and the state owns a part of the capital of the
other 4 [10]. It seems that these and other measures will increase the availability of mortgage
loans and increase the demand for them.
5. CONCLUSION
The sustainable development of the economy, accompanied by an increase in real income and
a decrease in the mortgage interest rate, will certainly contribute to the growth in the demand
for mortgage loans. The state, recognizing the housing market as the main financial instrument
for providing housing for the population, deliberately stimulates the demand for mortgage loans
even for those whose income does not allow them to do so, meaning low-income citizens and
large families. However, "excessive" demand for housing and communal services can have a
significant negative impact not only on the financial sector, but also on construction, on
industries that depend on consumer demand, and as a result – on the economy as a whole and
will lead to severe social consequences.

51st International Scientific Conference on Economic and Social Development – Rabat, 26-27 March 2020
304
Therefore, both the Central Bank of the Russian Federation and government agencies must
ensure a balanced development of the mortgage market.
LITERATURE:
1. Average nominal wage for 10 percent groups of employees by type of economic activity.
(2019). Federal state statistics service. In Russian. Retrieved 20.01.2020 from
https://www.gks.ru/bgd/regl/b11_36/IssWWW.exe/Stg/d2/08-26.htm
2. Average price of 1 square meter of the total apartment area in the housing market, rouble,
secondary housing market, Novosibirsk region. (2019). Federal state statistics service. In
Russian. Retrieved 31.01.2020 from https://www.gks.ru/dbscripts/cbsd/DBInet.cgi
3. Average prices and price changes for 1 square meter of total apartment area in the
Novosibirsk region (2019). Federal state statistics service. In Russian. Retrieved
31.01.2020 from https://gks.ru/region/docl1150/IssWWW.exe/Stg/d010/i011730r.htm
4. EMISS. (2019). State statistics. In Russian. Retrieved 31.01.2020 from
https://fedstat.ru/indicator/33999
5. Housing affordability in Russia's largest urban anglomerations in 2019 [Dostupnost' zhil'ja
v krupnejshih gorodskih anglomeracijah Rossii v 2019 godu]. (2019). Fond Institut
jekonomiki goroda (City economics Institute) Moscow. In Russian. Retrieved 20.01.2020
from http://www.urbaneconomics.ru/sites/default/files/dostupnost_zhilya_v_17_gorodskih
_aglomerciyah_v_rossii_v_2019_g.pdf
6. Indicators of the mortgage housing market. Weighted average rate on housing loans in the
Novosibirsk region, in roubles, provided to resident individuals, % (by the 30 largest banks).
(2019). Central Bank of the Russian Federation. The region statistics. In Russian. Retrieved
31.01.2020 from https://www.cbr.ru/statistics/pdko/Mortgage/
7. Information about the housing (mortgage) lending market in Russia.(2016). Statistical
digest (online version). Central Bank of the Russian Federation. (No. 3. 2011-2015). In
Russian. Moscow Retrieved 31.01.2020 from https://www.cbr.ru/Collection/Collection/
8. File/15725/Stat_digest_mortgage_03.pdf
9. Measures taken by the Bank of Russia to ensure a balanced development of mortgage
lending. Report for public consultation. (2019). Central Bank of the Russian Federation. In
Russian. Moscow. Retrieved 31.01.2020 from http://www.cbr.ru/content/document/
file/94935/consultation_paper_191217.pdf
10. Monitoring and evaluating the situation on the housing market and mortgage lending,
building target forecast indicators for the development of the housing sector [Monitoring i
ocenka situacii na rynke zhil'ja i ipotechnogo zhilishhnogo kreditovanija, postroenie
celevyh prognoznyh pokazatelej razvitija zhilishhnoj sfery]. (2018). Fond Institut
jekonomiki goroda (City economics Institute) Moscow. In Russian. Retrieved 20.01.2020
from http://www.urbaneconomics.ru/sites/default/files/dostupnost_zhilya_i_zhilishchnye
_balansy.pdf
11. Mortgage lending in 2018: hold on to the maximum (2019). Analytical data. International
Group of Agencies RAEX. RAEX-Analytics LLC. (April 17, 2019). Moscow. In Russian.
Retrieved 31.01.2020 from https://raex-a.ru/media/uploads/bulletins/pdf/2019_ipoteka_
bul.pdf
12. Review of financial stability. Information and analytical material. (2019). Bank of Russia.
No. 2. Moscow. In Russian. Retrieved 31.01.2020 from http://www.cbr.ru/collection/
collection/file/25489/ofs_19-02.pdf
13. Rudi Lyudmila, Tatyana Tropnikova. (2019). HOUSING AFFORDABILITY AS THE
MOST SIGNIFICANT SOCIAL-ECONOMIC INDICATOR. 49th International Scientific
Conference on Economic and Social Development – "Building Resilient Society". Book of
Proceedings. Zagreb, pp. 359-370.
51st International Scientific Conference on Economic and Social Development – Rabat, 26-27 March 2020
305
14. Rudy L. Yu., Klyueva I. S. (2019). Qualitative characteristics of the housing stock of the
Novosibirsk region: trends of changes [Kachestvennye harakteristiki zhilishhnogo fonda
Novosibirskoj oblasti: tendencii izmenenij]. Vestnik of NSUEM (Bulletin of NSUEM). (No.
4), pp. 220-232.
15. Rudy L. Yu., Tropnikova T. A. (2014). Assessment of housing affordability for the
population of the Novosibirsk region [Ocenka dostupnosti zhil'ja dlja naselenija
Novosibirskoj oblasti]. Vestnik Tomskogo gosudarstvennogo universiteta (Bulletin of
Tomsk State University). (No. 388). pp. 188-193.
16. Rudy, L. Yu., Tropnikova, T. A. (2019). Creating demand in the residential real estate
market in Canada: modern trend [Formirovanie sprosa na rynke zhiloj nedvizhimosti
Kanady: sovremennye tendencii] Vestnik of NSUEM (Bulletin of NSUEM). (No. 4), pp. 320-
331.
17. Social status and standard of living of the Russian population - 2015. (2015). Federal state
statistics service. In Russian. Retrieved 31.01.2020 from https://www.gks.ru/bgd/regl/
b15_44/Main.htm
18. Socio-economic situation of the Novosibirsk region (January - July 2019). (2019).
Territorial body of the Federal state statistics service for the Novosibirsk region. In
Russian. Retrieved 20.01.2020 from https://novosibstat.gks.ru
51st International Scientific Conference on Economic and Social Development – Rabat, 26-27 March 2020
306
ENTERPRISE INTEGRATION AND MARKET PERFORMANCE
RESULTS
Sofia Lyubyashenko
Novosibirsk State University of Economics and Management, Russia
ABSTRACT
The ongoing integration processes in industry markets are the basis for their transformation in
the direction of rigid oligopolistic structures. The growth of concentration in industries in
Russia and other countries is dictated by the need to find ways to improve the competitiveness
of enterprises. The article describes the processes of concentration of production as a result of
grouping of enterprises in industry and international markets; formation of coalitions to
coordinate activities in the market. The regularities of combining firms into strategic groups
are revealed. The article presents the results of analysis of the relationship between the level
of concentration and profitability of the industry in different ways of grouping enterprises. It is
proved that the best performance of the industry can be achieved within the framework of a
structure with a higher level of concentration.
Keywords: Concentration, oligopoly, efficiency, strategic group, cartel
1. INTRODUCTION
The patterns of development of material production sectors in the Russian economy based on
market principles are almost identical to trends in developed countries. A number of objective
factors (the desire to enter international markets, take a leading position and others) have led to
a revision of the paradigm of general downsizing of enterprises and the thesis about the
necessity of competitive "struggle", as an attribute of the market, between manufacturers. The
empirical reality is that the institutional organization of the economy is increasingly being
modified in the direction of forming large corporate structures, associations, financial and
industrial associations, including interstate ones, by integration and coordination of the
activities of market participants on the supply side. The concentration of Russian industry
exceeded not only the European level, but also the level of the USA and South Korea. For
comparison, in Germany, ten integrated business groups (IBG) account for 15% of industrial
output, in the USA - 27%, in South Korea - 32%. The thesis that the market structure determines
the behavior of enterprises, and in turn the results of the functioning of the market, has been
repeatedly tested by Russian and foreign economists. The theory of industrial organization
focuses on identifying the relationship between the level of structural concentration and the
profitability of the industry. Most theorists agree that increasing concentration, as a rule, leads
to the monopoly power of enterprises and the loss of public welfare. However, the
transformation of a highly concentrated market into a monopoly is possible only under certain
conditions, such as high entry barriers. Therefore, the problem of the result of market activity
is more complex than it appears in the framework of microeconomic theory.
2. GLOBALIZATION AND TRENDS OF TRANSFORMATION OF RUSSIAN AND
FOREIGN MARKETS
The concentration growth trend in the industries of Russia and other countries is explained by
the need to increase the competitiveness of enterprises. Large corporations that have the ability
to use economies of scale, flexibility of the production base, introduce innovations and carry
out investment processes, including innovations, usually operate successfully in world markets.
The desire to maximize profits leads to the formation of various kinds of coalitions and indicates
a continuous restructuring of Russian industry.
51st International Scientific Conference on Economic and Social Development – Rabat, 26-27 March 2020
307
Currently, even large companies do not remain completely independent. In this regard, there is
a growing tendency to conclude strategic alliances, to move to “organized” markets, which are
a higher form of evolutionary development of markets. Determining the level of concentration
in the context of coordination remains a difficult task in Russia and other European countries.
Official concentration indices do not reflect the real level, since they do not allow fixing the
informal relations of rivals. An interesting task is to determine the relationship between the
level of concentration and industry performance [10]. What are the reasons for the growth of
concentration and integration of enterprises in the industry of Russia and other countries? In
recent decades, the economies of industrialized countries have changed a lot since the modern
world is undergoing a process of profound transformation. Among scholars of various fields,
the concepts of creating a new “information society”, “mass consumer society”, “new industrial
society”, etc., are put forward, and each of them affects the process of globalization. This
concept is used to characterize various processes, such as global economic, political and cultural
integration, the unification of the world economy into a single market. On this basis, a single
global network market economy is formed [8, 15]. The views on the causes of globalization are
debatable. Historians connect this process with the development of capitalism. Economists see
the cause of globalization in the transnationalization of financial markets and the rapid growth
of international trade. Political scientists emphasize the spread of democratic organizations.
There are information technology approaches to explain the processes of globalization. The
development of information technologies contributes to the acceleration of this phenomenon
[8]. The rapid transformation of the economic systems of different countries requires modern
firms to review management concepts and methods. The large role of concentration of
production and integration of enterprises is not only preserved, but also acquires a qualitatively
new significance. A previous understanding of these processes seems limited in the new
changing environment. Improving the competitiveness of enterprises is the main factor in the
transformation of markets in the direction of increasing concentration [13, 14, 16]. Mergers and
acquisitions of firms by combining assets are not always successful and often lead to lower
economic performance of organizations and markets. Therefore, the issue of finding the most
optimal form of enterprise integration that can improve the performance of enterprises and
markets remains relevant. Numerous results of empirical studies indicate that the concentration
level of a large number of traditional industry markets has reached its critical value. New
markets associated with high technology require new approaches. Concentration research
remains an important task when trying to answer the question - which market structure is the
best? In the modern theory of management, researchers are interested in market structures that
contain elements of competition and cooperation. As a rule, these are oligopolistic markets [3,
4]. A modern form of enterprise integration is the formation of strategic groups on an informal
basis with the aim of coordinating activities on the market. The coalition (strategic groups)
combines enterprises on the basis of the similarity of strategies: the same areas of product
diversification, the number and types of distribution channels, product quality, volume and
direction of investment, level of fixed costs and dynamics of changes in marginal costs. The
fundamental motive for grouping enterprises is the desire to maximize profits. The formation
of coalitions requires certain market conditions, namely a high level of concentration. Such a
combination allows firms to achieve greater stability in the market than in autonomous
functioning, while maintaining legal independence. Obviously, this method of integration is not
traditional and requires new approaches to management, both from the state and from the
managerial staff of firms. Full control over the activities of integrated firms without legal
registration of mergers and acquisitions can be achieved with the help of thoughtful
management. At Sheresheva M.Yu. such a phenomenon is called “quasi-integration”, “when
there is control over the management of assets of legally independent companies in the absence
of control over property” [19, p. 63].
51st International Scientific Conference on Economic and Social Development – Rabat, 26-27 March 2020
308
We are interested in the integration of this kind from the standpoint of the efficiency of
enterprises and industries, their sustainability, as well as the application of antitrust regulation
measures. It is important to determine the principles for combining firms in a coalition. While
maintaining a legally autonomous position, the key prerequisite for the sustainability of
strategic groups is the motivation of each participant to act in a coordinated manner in order to
achieve greater profitability. The stability of coalitions is also determined by the stability of
demand, the height of entry barriers to the market, the number of sellers, and the fear of
punishment for violating the agreement. The ongoing integration processes in industry markets
are the basis for their quality transformations. Intercompany interaction in a coalition should be
considered as cooperation of partners based on trust. However, cases are not excluded when
cooperation involves a certain restriction on the autonomy of partners and is associated with an
unequal distribution of costs and benefits. That is, oligopolistic cooperation does not exclude
conflicts related to power, control, dependence, competition and unequal exchange. The
opportunistic behavior of firms entails large costs of organizing penalties for breach of
agreements. The probability of violation of agreements will be low if the benefits of cooperation
in the coalition are higher than from autonomous functioning. Therefore, to achieve the stability
of the coalition, it is necessary to find ways and mechanisms of the optimal distribution of
production volumes, profits and costs [3, 5, 7].
3. EMPIRICAL EVIDENCE. PRINCIPLES OF ASSOCIATION OF FIRMS IN THE
COALITION
A study of the relationship between the level of concentration and the results of market
functioning, the determination of the laws governing the formation of strategic groups, was
carried out in the building bricks market of Novosibirsk. Cost data and demand functions were
used. According to the methodology for calculating the concentration level described in
previous publications, an analysis of the industry profit =
=0
1
)()(k
k
kk QПQП indicator was
carried out on the building brick market in the Novosibirsk Region for all values of the
coalitions number (k0 is a variable) and for different composition of enterprises forming a group
(the set is Ik (k0), k=1(1)k0) [8]. If the industry is represented by 7 enterprises, the number of
coalitions is 6. The number of options for grouping enterprises into a coalition, even taking into
account the restrictions imposed by the permissible level of market concentration, can be quite
substantial. The analysis of the maximum values of industry profit depending on these
parameters allows us to interpret the patterns of the coalition formation [1, 2]. Industry output
and product price were taken as constant values (200 million units, 2200 rubles). Table 1 shows
the results of the industry operation (profit, ATC , HHI), depending on the number of coalitions
and the composition of enterprises in them.
Table following on the next page
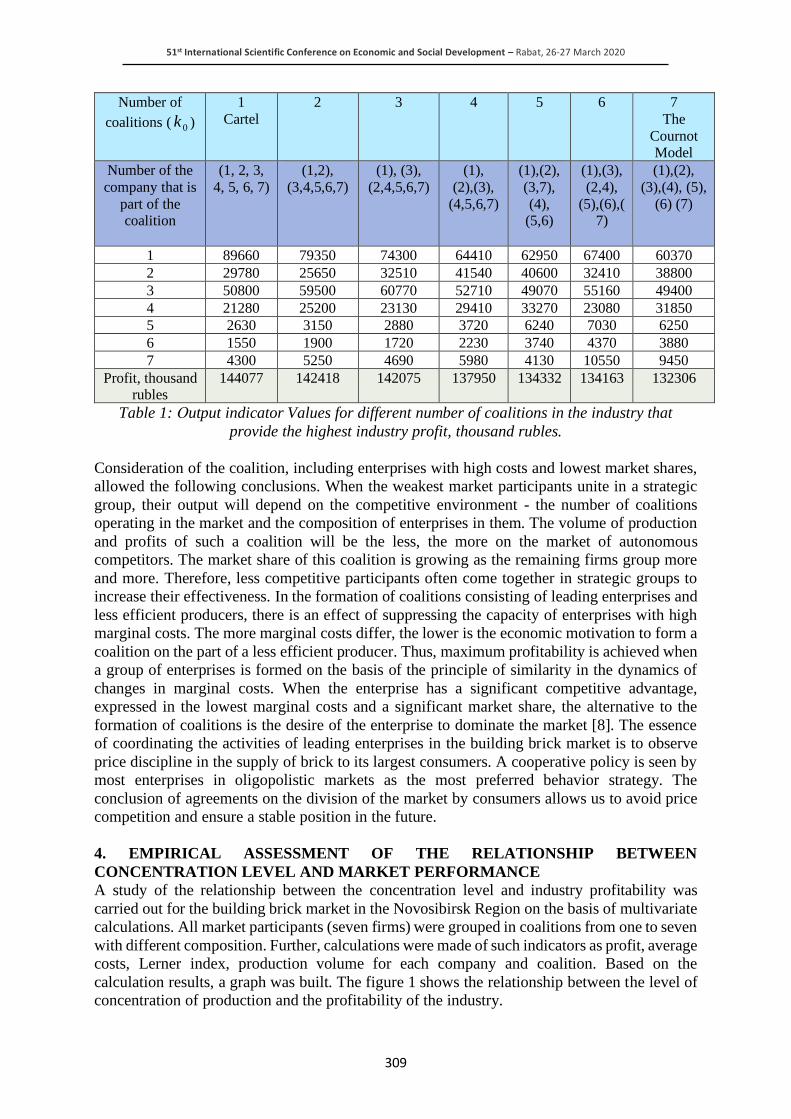
51st International Scientific Conference on Economic and Social Development – Rabat, 26-27 March 2020
309
Number of
coalitions ( 0k )
1
Cartel
2 3 4 5 6 7
The
Cournot Model
Number of the
company that is
part of the coalition
(1, 2, 3,
4, 5, 6, 7)
(1,2),
(3,4,5,6,7)
(1), (3),
(2,4,5,6,7)
(1),
(2),(3),
(4,5,6,7)
(1),(2),
(3,7),
(4), (5,6)
(1),(3),
(2,4),
(5),(6),(7)
(1),(2),
(3),(4), (5),
(6) (7)
1 89660 79350 74300 64410 62950 67400 60370
2 29780 25650 32510 41540 40600 32410 38800
3 50800 59500 60770 52710 49070 55160 49400
4 21280 25200 23130 29410 33270 23080 31850
5 2630 3150 2880 3720 6240 7030 6250
6 1550 1900 1720 2230 3740 4370 3880
7 4300 5250 4690 5980 4130 10550 9450
Profit, thousand rubles
144077 142418 142075 137950 134332 134163 132306
Table 1: Оutput indicator Values for different number of coalitions in the industry that
provide the highest industry profit, thousand rubles.
Consideration of the coalition, including enterprises with high costs and lowest market shares,
allowed the following conclusions. When the weakest market participants unite in a strategic
group, their output will depend on the competitive environment - the number of coalitions
operating in the market and the composition of enterprises in them. The volume of production
and profits of such a coalition will be the less, the more on the market of autonomous
competitors. The market share of this coalition is growing as the remaining firms group more
and more. Therefore, less competitive participants often come together in strategic groups to
increase their effectiveness. In the formation of coalitions consisting of leading enterprises and
less efficient producers, there is an effect of suppressing the capacity of enterprises with high
marginal costs. The more marginal costs differ, the lower is the economic motivation to form a
coalition on the part of a less efficient producer. Thus, maximum profitability is achieved when
a group of enterprises is formed on the basis of the principle of similarity in the dynamics of
changes in marginal costs. When the enterprise has a significant competitive advantage,
expressed in the lowest marginal costs and a significant market share, the alternative to the
formation of coalitions is the desire of the enterprise to dominate the market [8]. The essence
of coordinating the activities of leading enterprises in the building brick market is to observe
price discipline in the supply of brick to its largest consumers. A cooperative policy is seen by
most enterprises in oligopolistic markets as the most preferred behavior strategy. The
conclusion of agreements on the division of the market by consumers allows us to avoid price
competition and ensure a stable position in the future.
4. EMPIRICAL ASSESSMENT OF THE RELATIONSHIP BETWEEN
CONCENTRATION LEVEL AND MARKET PERFORMANCE
A study of the relationship between the concentration level and industry profitability was
carried out for the building brick market in the Novosibirsk Region on the basis of multivariate
calculations. All market participants (seven firms) were grouped in coalitions from one to seven
with different composition. Further, calculations were made of such indicators as profit, average
costs, Lerner index, production volume for each company and coalition. Based on the
calculation results, a graph was built. The figure 1 shows the relationship between the level of
concentration of production and the profitability of the industry.
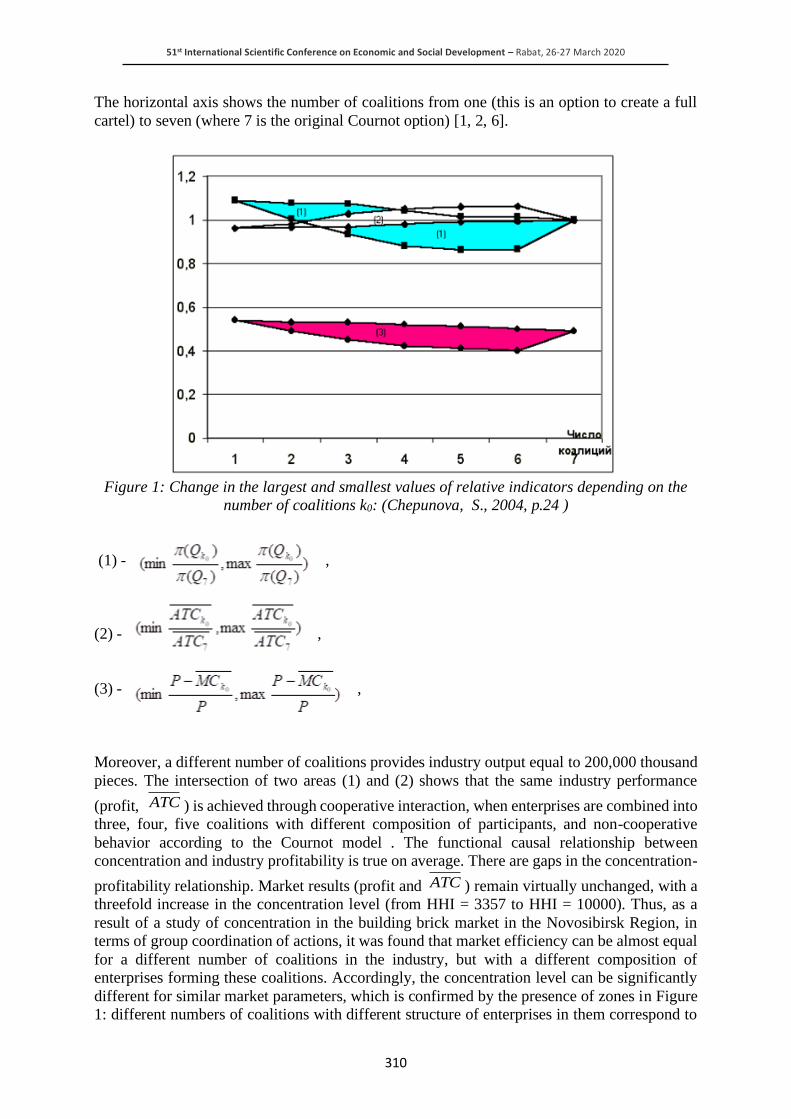
51st International Scientific Conference on Economic and Social Development – Rabat, 26-27 March 2020
310
The horizontal axis shows the number of coalitions from one (this is an option to create a full
cartel) to seven (where 7 is the original Cournot option) [1, 2, 6].
Figure 1: Change in the largest and smallest values of relative indicators depending on the
number of coalitions k0: (Chepunova, S., 2004, p.24 )
(1) - ,
(2) - ,
(3) - ,
Moreover, a different number of coalitions provides industry output equal to 200,000 thousand
pieces. The intersection of two areas (1) and (2) shows that the same industry performance
(profit, ATC ) is achieved through cooperative interaction, when enterprises are combined into
three, four, five coalitions with different composition of participants, and non-cooperative
behavior according to the Cournot model . The functional causal relationship between
concentration and industry profitability is true on average. There are gaps in the concentration-
profitability relationship. Market results (profit and ATC ) remain virtually unchanged, with a
threefold increase in the concentration level (from HHI = 3357 to HHI = 10000). Thus, as a
result of a study of concentration in the building brick market in the Novosibirsk Region, in
terms of group coordination of actions, it was found that market efficiency can be almost equal
for a different number of coalitions in the industry, but with a different composition of
enterprises forming these coalitions. Accordingly, the concentration level can be significantly
different for similar market parameters, which is confirmed by the presence of zones in Figure
1: different numbers of coalitions with different structure of enterprises in them correspond to

51st International Scientific Conference on Economic and Social Development – Rabat, 26-27 March 2020
311
the same values of relative indicators. It is established that the equal level of concentration in
the industry with a varying number of coalitions and the composition of enterprises in them
demonstrate varying market activity results. An analysis of the results of the calculations allows
us to state that an industry structure with a higher concentration level may be more effective
than a structure with a lower concentration level. In the context of the organizational cartel, the
volume of output is distributed among the participants most effectively (the lowest level of
average costs per unit of goods produced is ensured). In addition, an increase in costs at one of
the enterprises (or several) leads to a redistribution of output in favor of enterprises with the
lowest marginal costs. However, with the full integration of participants into the cartel, full
compensation for the reduction in industry output is not carried out, but only a part of it. The
conclusions are identical with regard to the mechanism of interaction within coalitions [11, 13].
Thus, a positive aspect of the cooperative strategy of enterprise behavior is the focus on
minimizing costs, which leads to resource savings. In addition, the greatest stability of the
enterprise and the market structure is achieved. Without government intervention, a high level
of industry profitability is ensured. A negative effect could be the threat of supply restriction
and price inflation. However, as Leibenstein noted in his work, relying on empirical studies of
other authors, the losses from monopolization for a country do not exceed several percent of
GNP, and in most cases less than 1 percent [18, p. 478-481]. That is, if the costs of the monopoly
are lower than those of competitors, the effect of cost savings may be higher than the effect of
overpricing. In addition, the positive effect of coordination of actions can be kept with the help
of state regulation, for example, through taxation of excess profits. This mechanism is able to
restrain price growth and ensure production volumes at a level that meets the interests of not
only firms, but also consumers.
5. CONCLUSION
Thus, an analysis of the relationship between the level of concentration and the profitability of
the industry for various options for grouping enterprises (subject to the effect of identity)
allowed us to conclude that the best performance of the industry can be achieved within a
structure with a higher level of concentration. Consequently, the classification of markets,
including “dangerously concentrated,” on the basis of such a legal guideline as the level of
concentration can lead to undesirable economic consequences [17]. This provision should be
taken into account in antitrust practices so that the rule of competition law would not contradict
the objective processes of the concentration growth and would not interfere with the required
competitiveness level of domestic enterprises and especially in world markets [9, 12]. Thus, it
is necessary to change priorities in antitrust policy. A more important task than assessing the
real level of concentration is to evaluate the performance of the industry at the appropriate level
of concentration. The aim of regulation should be precisely to increase the efficiency of the
industry, and not to maintain concentration at a level not related to the effectiveness of its work.
Therefore, it is necessary to revise the norms of antitrust legislation regarding the establishment
of the boundaries of the concentration level. They should be differentiated by industry, type of
market, take into account the size of production, the nature of the technology, type of product.
LITERATURE:
1. Chepunova, S. N. (Lyubyashenko S. N.) (2004). Assessment of structural concentration
and market performance: Abstract. dis. ... the economy. sciences'. Novosibirsk.
2. Chepunova, S. N. (Lyubyashenko S. N.). (2004). Assessment of the level of structural
concentration and the results of market functioning. The dissertation of the candidate of
economic sciences. Novosibirsk.
3. Lyubyashenko, S. N. & Mamonov, V. I. (2013). Market concentration in the conditions of
grouping of enterprises and economic efficiency. Vestnik of NSUEM. Novosibirsk.
51st International Scientific Conference on Economic and Social Development – Rabat, 26-27 March 2020
312
4. Lyubyashenko, S.N. & Mamonov, V.I. (2015) Regional development trends and dynamics
of production concentration. Antitrust and competition protection in the Russian
Federation: the economic content and essence of public law regulation Collection of articles
of the III All-Russian Scientific and Practical Conference. Penza.
5. Lyubyashenko, S.N. & Mamonov, V.I. (2015). The relevance of applying the grouping
method in assessing the effectiveness of enterprises and markets. In the book: We continue
the traditions of Russian statistics. Russian Statistical Congress. 2015. Р. 39-40.
6. Lyubyaschenko, S.N. & Mamonov, V.I. (2013). Market concentration and economic
performance / Modern research on social problems (electronic scientific journal). 2013. No.
7. Retrieved 19.02.2020 from https://elibrary.ru/item.asp?id=21156775
7. Lyubyashenko, S. N. (2006). Evaluation of the level of economic concentration and the
results of market functioning // Scientific and Technical Gazette of St. Petersburg State
Polytechnic University. Economic sciences. St. Petersburg: SPbSPU. № 6. P. 275.
8. Lyubyashenko, S. N. (2019). Methodological aspects of assessing the market structure:
concentration and efficiency. Economic and Social Development 49th International
Scientific Conference on Economic and Social Development. Development – "Building
Resilient Society" Book of Proceedings Zagreb, 468-475. Retrieved 20.01.2020 from
https://www.esd-conference.com/upload/book_of_proceedings/Book_of_Proceedings_
esdZagreb2019_Online.pdf
9. Lyubyashenko, S.N. (2009). Trends in structural concentration in industries in a crisis //
Science. Industry. Defense. Proceedings of the X All-Russian Scientific and Technical
Conference. Edited by: Levina V.E., Mishneva V.I. 2009. P. 244-247.
10. Lyubyaschenko, S.N. (2013). Globalization as a cause of transformation of the structure of
Russian industry // North-East Asia Academic Forum. China, 2013. Harbin University of
Commerce.
11. Lyubyashenko, S.N. (2013). Optimization of the results of enterprises in the context of
increased integration in industry markets // The state of the financial system after an
epidemic of moral hazard: monograph / team of authors; edited by A.Y. Rymanova.
Novosibirsk: NSTU Publishing House, 2013 . Р. 154.
12. Lyubyashenko, S.N. (2013). Oligopolies and sustainable development in the context of
globalization. In the collection: Challenges of the modern world. Reports of the
international scientific-practical conference. 2013. Р. 113-118.
13. Lyaskin G.G.(2015). History of Economic Thought. The module-problem course /
Novosibirsk, 2015.
14. Lyaskin G.G. (2013). Economy. The module-problem course / Novosibirsk. 2013.
15. Lyaskin G.G. (2001). Formation of antitrust policy in the transition economy of Russia:
Federal and regional aspects. The dissertation for the degree of candidate of economic
sciences / Kemerovo State University. Kemerovo.
16. Tatarenko V.I., Lyaskin G.G. (2012). World Economy and International Economic
Relations. Novosibirsk, 2012.
17. Mamonov, V. & Lyubyashenko, S. & Borodin, V. (2012) Dynamics of structural
concentration and its influence on the performance of industrial enterprises. Vestnik of
NSUEM. Novosibirsk. Р. 87-93.
18. Scherer, F. & Ross, D. (1997). Industrial Market Structure and Economic Performance.
[Translated from English] M.: Infra-M. 697 p.
19. Sheresheva, M. (2010) Forms of network interaction between companies / Publishing
House of the State University Higher School of Economics. - Moscow.

51st International Scientific Conference on Economic and Social Development – Rabat, 26-27 March 2020
313
THE BRAIN DRAIN OF PEOPLE FROM SLOVAKIA
Martina Chrancokova
Institute for Forecasting, Centre of Social and Psychological Sciences, Slovakia
Faculty of National Economy of the University of Economics in Bartislava, Slovakia
[email protected]; [email protected]
Gabriel Weibl
Faculty of Social and Economic Sciences, Comenius University in Bratislava, Slovakia
Dusana Dokupilova
Institute for Forecasting, Centre of Social and Psychological Sciences, Slovakia
ABSTRACT
The word ‘migration’, is used frequently at the present. Unfortunately, many people relate to
this word negatively. This paper will portray the voluntary and legal migration of Slovaks, from
their smaller and landlocked Central European EU member state. It borders Poland, Ukraine,
Hungary, Austria, and Czechia. The mobility habits of Slovak citizens has changed since the
accession of the country to the EU in 2004. This paper will explore the reasons why so many
Slovaks choose to leave their home country with the vision to study and later live abroad.
Despite serious economic repercussions, the Slovak government has yet to address this
recurring trend, although recently some initiatives sprang out with the aim of encouraging
Slovaks to return. At the same time, most recently, the Slovak diaspora became an unsuspected
target for the highest Slovak governmantel officials, who referred to them as second class
citizens and questioned their right to vote in the February 2020 elections. Data collected for
this study originates predominantly from Eurostat and OECD reports as well as from a case
study of Slovak undergraduate students enrolled in a social science programme between 2016
– 2018 at the Comenius University in Bratislava in terms of their possible future employment
abroad. Although students are rather conservative in terms of their estimates of working abroad
after their graduation, one third of them actually wish to work and live abroad indefinately.
Their imagined destinations partly confirm the top ten study destinations abroad, although the
scores are clearly higher for the UK, the US and Canada in comparisson to the remaining seven
contries on the top 10 list.
Keywords: Slovak migration, brain drain, knowledge management, student mobility EU,
Slovakia
1. INTRODUCTION
The word migration is used commonly today. Most people associate it with illegal migration,
hence the word migration gained a negative connotation. Many Slovaks associate this word
with illegal crossings and misbehaving migrants or even with criminal activities. However, this
article concerns voluntary migration, more precisely the migration of Slovaks, about their
voluntary departure abroad. Inter EU migration mobility is not as closely monitored or as
widely publicised as migration from developing countries, especially in comparison to migrants
crossing the Mediteranean. There is no accurate data, which would record the number of
Slovaks migrating to live abroad. Databases such as Eurostat and OECD contain only data on
Slovak students studying abroad. Since this article is interested in brain drain from Slovakia,
the focus was mainly on student flows, in the study destinations and types of study. The main
focus was on the movement of Slovaks to the other V4 countries (Hungary, Poland and the
51st International Scientific Conference on Economic and Social Development – Rabat, 26-27 March 2020
314
Czech Republic), but also to other countries. Since the European databases only offered data
since 2013, data was analyzed with descriptive statistics and was sufficient to sketch a picture
of Slovak migration. Many Slovaks seek academic degrees from abroad, especially from
Western European countries or countries where English is the first language (The USA, Canada,
Australia and New Zealand), however, the whole degree studies are seldom recorded. This
study also offers an insight to Slovak students perceptions of living and working abroad after
graduation.
2. THEORIES ABOUT MIGRATION
Most of the research on migration focuses on the evaluation of the migration flow, the reasons
behind and the factors determining the scale of the migration. Research on international
migration has increased since the mid 1990s. Russell King termed this era as the era of
migration (King, 2008). The causes of increased migration are: developments in transportation
and also in information technology and others. The foundations of migration theories were
created by neoclassical economists, who regard the move for work as the main reason behind
migration (Todaro, 1980). Massey (1993) stated, that the neoclassical theory focuses and is
concerned with the income differences, especially in wages. They consider the main reason for
migration is to maximize income. On the other hand, the so called neo-economists of migration
offer a different view of migration as they don’t consider the households, instead the
individuals, when it comes to migration (Stark, 1996). Another important theory of migration
is the concept of push and pull factors of mobility. It is based on the relationnship and interplay
between the two principles, which act simultaneously. Lee (1972), is one of the main scholars,
who argues that it is especially the push factors which cause people to leave their country of
origin. Some of the push factors are: dire economic situations in home countries, low living
standards, ethnic unrest, violent conflicts, political discrimination, growing population density
and so on. In the case of student migration it is the combination of perception of the scarcity of
work opportunities after completing a degree, especially if one wants to remain in the chosen
study fields, combined with the low income, scarcity of work opportunities, low living
standards and dissatisfaction with the political situation in home countries (Chrančová, 2016;
Weibl, 2015). These are matched and reinforced by a plethora of pull factors, such as: higher
salaries, higher living conditions, better prospects in terms of new employment, positive
experiences with migrants, greater sense of personal and political freedom, or the relative
proximity of the migration destination from the home countries. Another concept is the world
systems theory. The stronger the institutional systems, the more sought after the individual
country as a migration destination. There is also a theory concerning work; the theory of dual
labor market. It is based on the idea of Piore (1979), according to which the migration is not
caused by push factors but by the pull factors of the receiving countries (scarcity in labor force).
We agree with King (2008) and Boris Divinsky (2009) in that in reality there isn’t any unifying
and systemic theory, which would offer a compact view on the issue of migration, its causes,
dynamics nor effects. The preference is to consider the combination of several approaches and
theories with the aim of utilising to a greater extent their advantages in order to extract the most
relevant and exact conclusions. In this project we will examine the flow of migration: the brain
drain and brain circulation. Brain circulation concerns mostly developing countries. In terms of
the brain drain, the stress is on the exchange of knowledge and technology between the country
of origin and the country of destination, which is further focus of this research. There is a reason
why the focus should be on theories about human capital. Currently, the definition by G.S.
Becker (1967) is the most favored, which understands human capital as utilisation of one's
abilities, knowledge and skills with matching motivations. The focus is on the tacit knowledge,
which is un-measurable with quantitative methods. Tacit knowlege is primarily revealed
through face-to-face interviews as a thorough examination of experiences, reasons and

51st International Scientific Conference on Economic and Social Development – Rabat, 26-27 March 2020
315
relflections and making sense of them all. The well known idea of Polanyi in this regard is that
“we know more than we are able to say” (Perraton, Tarrant, 2007: 354). Williams and Baláž
(2010) offered another categorization of tacit knowledge as: embrained, embodied, encultured
and embedded. This categorization served as a base for this research on the types of tacit
knowledge acquired by Slovak migrants and returnees.
3. SLOVAK MIGRATION FLOWS FROM SLOVAKIA FOR EDUCATION
The most up-to-date information published on Slovak migration originates form the Institute of
financial policy, which states that Slovakia is facing a significant brain drain alongside the
country's demographic deficit. Based on the registrations of compulsory health insurances there
was a significant decrease in number of people residing in Slovakia, 300 000 people within the
last 15 years, which is approximately 5% of the population. The steepest decline of insured
people occurred during the time of joining of the EU. The numbers dropped between 2004 –
2005 by more than 200 000 individuals. The situation has consolidated since then, and annually
15 000 Slovaks leave the country, which accounts for 3% of the population. During the last 15
years half of the Slovak migrants were below the age of 30 (MFSR, 2017). Since obtaining data
on legal Slovak migration is unrealistic nowadays, European databases, in particular from
Eurostat and OECD was used for data analysis. Between the years 2010 – 2013 according to
this, every 10th university graduate left Slovakia, which represented cca. 12 – 14% of the
graduates. These were mostly medical graduates and students who had completed technical
degrees at Slovak universities. This is considered as a loss in terms of the country’s investment
in education (MFSR, 2017). According to Eurostat data in 2013, as many as 32 078 Slovak
students went abroad to complete their university education. This data also includes the short
time study exchanges. For comparison in 2017 it was only 523 fewer Slovak students. Data
show that the short study visits have become increasingly attractive as the number of student
study visits rose from 409 in 2013 to 736 students in 2017. While the Bachelor degree studies
are the most attractive in terms of volume, from 2014 to 2017 the number fell by 1094 students.
Both, the MA and the PhD programmes recorded an increase of 102 students in the case of MA
and of 142 in the case of PhD studies between 2013 and 2017, see Table 1 for the data and
Figure 1, for the visual illustration.
Figure 1: Migration flows of Slovaks for education in foreign in year 2017
Source: Eurostat, 2020
736
1651812018
2283
2017
short bachelor master doctoral

51st International Scientific Conference on Economic and Social Development – Rabat, 26-27 March 2020
316
Table 1: Migration flows of Slovaks for education
Type of education 2 013 2 017
Short 409 736
Bachelor 17 612 16 518
Master 11 916 12 018
Doctoral 2 141 2 283
Sum 32 078 31 555
Source: Eurostat, 2020
The further analyzes focuses in particular on studies concerning the Bc, Master and PhD. The
top 10 study destination countries of Slovak students were selected for consideration and
recorded in the following tables. Trends were followed in terms of country enrolments as well
as the top 10 positions of the individual l0 countries. Data for the last 5 years shows that the
order of countries has not changed in the bachelor study. The most visited country for the Bc
was Czechia where 11 472 students studied in the year 2017. The second most popular country
was the United Kingdom, where the number of students is significantly lower at 1 295. The
third most popular study destination was Hungary which attracted 1211 students, followed by
Austria with 571 students and Poland with 528 students. The remaining top 10 countries are
Denmark, the Netherlands, Germany, France and Italy. Interestingly, the top 5, except the UK,
were all Slovak neighboring countries. Table 3 shows in detail the top 10 study destination
countries for the Bachelor between 2013 -2017 followed by Table 4 which contains the MA
degree seekers. Other countries in which Slovak students studied bachelor's degrees were Spain,
Switzerland, Belgium, Croatia, Finland, Norway, Ireland, Greece, Sweden and Iceland.
Table 2: Slovak migration flows of students for bacherol education
No. GEO/TIME 2013 2014 2015 2016 2017
1 Czechia 13 396 12 667 12 015 11 747 11 472
2
United
Kingdom 954 976 1 056 1 101 1 295
3 Hungary 1 577 1 519 1 228 1 291 1 211
4 Austria 606 640 628 594 571
5 Poland 63 69 81 375 528
6 Denmark 103 157 273 407 499
7 Netherlands 183 207 255 271 314
8 Germany 251 251 279 274 262
9 France 118 104 102 114 97
10 Italy : 123 102 80 72
Source: Eurostat, 2020
Similarly to the Bc students, Czechia was the most popular country for the Slovak MA students
in 2017 with 9 141 enrollements. The second most popular MA study destination was Hungary,
which attracted a significantly lower number of Slovak students, only 583, but the following
two countries, Germany and Austria had similar numbers of MA students from Slovakia to
Hungary, with 532 and 450 students. The UK was in fifth position with 267 MA students and
the remaining countries, positions 6 – 10, were identical with the Bc destinations. They were:
Poland, Denmark, France, the Netherlands and Italy, so the top 10 countries have not changed
in this case. See Table 3 for more details.

51st International Scientific Conference on Economic and Social Development – Rabat, 26-27 March 2020
317
Table 3: Slovak migration flows for master education
No. GEO/TIME 2013 2014 2015 2016 2017
1 Czechia 9 185 9 216 9 119 8 937 9 141
2 Hungary 711 678 559 616 583
3 Germany 595 631 652 618 532
4 Austria 464 372 426 462 450
5
United
Kingdom 280 285 244 212 267
6 Poland 54 57 90 130 215
7 Denmark 76 103 146 183 197
8 France 177 210 190 160 165
9 Netherlands 87 91 118 123 123
10 Italy 82 69 74 72 69
Source: Eurostat, 2020
Czechia, perhaps not surprisingly, is the number one country with 1 842 Slovak doctoral
students in 2017 and the trend has been steadily increasing since 2013 with an annual increase
of approximately 50 students. The UK was the second most popular study destination for the
Slovak PhD students, with a considerably lower number to that of Czechia. There were only 93
enrolments in the UK, followed by 64 students in Austria, then 60 students in Hungary and 59
in Switzerland. The actual numbers are given in Table 4 below.
Table 4: Slovak migration flows for doctoral education
No. GEO/TIME 2012 2013 2014 2015 2016 2017
1 Czechia : 1 697 1 759 1 766 1 809 1 842
2
United
Kingdom : 87 72 71 82 93
3 Austria : 95 64 66 61 64
4 Hungary : 70 86 71 81 60
5 Switzerland 31 36 38 41 48 59
6 France : 32 36 35 37 35
7 Netherlands : 19 17 17 18 20
8 Spain : 4 : : 10 17
9 Sweden : 13 15 13 15 15
10 Poland : 2 10 10 11 14
Source: Eurostat, 2020
Figure 2 shows the number of doctoral studies of Slovaks to European countries. Although in
2015 there was a slight decrease in this amount to the previous year, the study of PhD degree
abroad is a growing trend. While in 2013 there were only 2 139 PhD Slovak students, in 2017
it was already 2 283 students.
Figure following on the next page

51st International Scientific Conference on Economic and Social Development – Rabat, 26-27 March 2020
318
Figure 2: Doctoral studies of Slovaks to European countries
Source: Eurostat, 2020
The goal of this article is to showcase in greater detail trends in the flow of Slovak higher
education students abroad between the years 2010 - 2013, in particular to the V4 partners and
the other European countries, as they attract the most Slovak youth as study destinations. The
data revealed that from those Slovaks who studied in foreign countries, most of them study in
Czechia which in future predisposes this country to become a favourite employment
destination. Most of these foreign enrolments, 24 300 students, were in 2013 and although this
number decreases every year, the rate of decline is very slow as in 2017 22 478 Slovaks still
studied there. The second significant study destination within the V4 countries is the flow of
students to Hungary. It peaked in 2013 when 2 436 individuals left Slovakia for Hungary and
the trend since has been downward, because by 2017 it was down to 1 885 Slovak citizens who
emigrated to Hungary. Finally, the third stream of migration of Slovaks within the V4 is that to
Poland, While in 2013 it was only 119 emigrants by 2017 this number rose to 757. Thus, Poland
is increasingly becoming more attractive to Slovak students. The annual migration data is
shown in Figure 3. The attractiveness of the V4 countries as study destinations lies in the close
geographical proximity of the V4 countries to Slovakia, good neighborhood relations and the
ease of communication due to the language efficiency when it comes to Czechia and to some
degree Hungary and Poland also.
Figure following on the next page
21392162 2155
2242
2283
2050
2100
2150
2200
2250
2300
2013 2014 2015 2016 2017
Doctoral studies of Slovaks to European countries

51st International Scientific Conference on Economic and Social Development – Rabat, 26-27 March 2020
319
Figure 3: Migration flows of Slovaks to countries V4
Source: Eurostat, 2020
4. QUALITATIVE DATA
This paragraph is based on a narrow sample of Slovak undergraduate social science students in
their first study semester, between the years 2016 – 2018 at the Comenius Uinverstiy in
Bratislava. Their Bc study programme was mostly delivered in English, so their English
language proficiency was at B2 average. Following the earlier mentioned statistical data,
information here relates to the likelihood of future migration for work. Data originates from an
online surveys and follow up face-to-face interviews. The survey was completed by first year
students in 2016, 2017 and 2018 in their first semester of study and the interviews were
conducted during the second semester. The topics of the online survey were: the likelihood of
students working abroad after they finished their studies in Slovakia; their preferred country of
employment abroad; and their preferred time spent working abroad. These questions were then
further discussed in the interviews in order to gain greater clarity and understanding of students’
rationale, thinking and calculations in regards to their future employment. There were in total
185 responses to the online survey during the three year data collection period and in total 96
interviews were conducted. Not all students agreed to take part in the interview part of the study.
Data initially revealed, that there wasn’t any clear likelihood of students working abroad (online
survey), however the interviews helped to explain, that students were mostly pragmatic and
rational in their responses in regards to their likelihood of being able to find work and
employment abroad, so the expectations and the likelihood were medium. On the scale of 0 to
10, where 0 meant 'very small', 5 meant 'medium' and 10 equalled 'very big', the average score
ended up being 5.7. Students further explained, that if it wasn’t the likelihood of the
employment questioned, but the wishes, aspirations or dreams in this regard, then they would
be more inclined and positive towards this idea. This is because, the likelihood to work abroad
would depend on many factors and the perception is, that it is difficult to secure a job in the
foreign country, partly because of being foreigner and being less competitive as the degrees
from Western universities are worth more. Moreover, for many students the prospect of
employment after their finished their university studies seems to be an issue for the far distant
future. Students’ preferred future employment abroad would be subjet of the interplay of a
variety of push and pull factors, for example wanting to earn a fair amount of money for their
work, which would most likely incline them towards Austria, Germany, Czechia or to the UK
as opposed to staying in Slovakia.
5,502 5,482
5,045
4,077 3,955
93 106 113 178 341264 350 463 465 493
0
1,000
2,000
3,000
4,000
5,000
6,000
0 1 2 3 4 5 6
Czechia Slovakia Hungary Slovakia Poland Slovakia
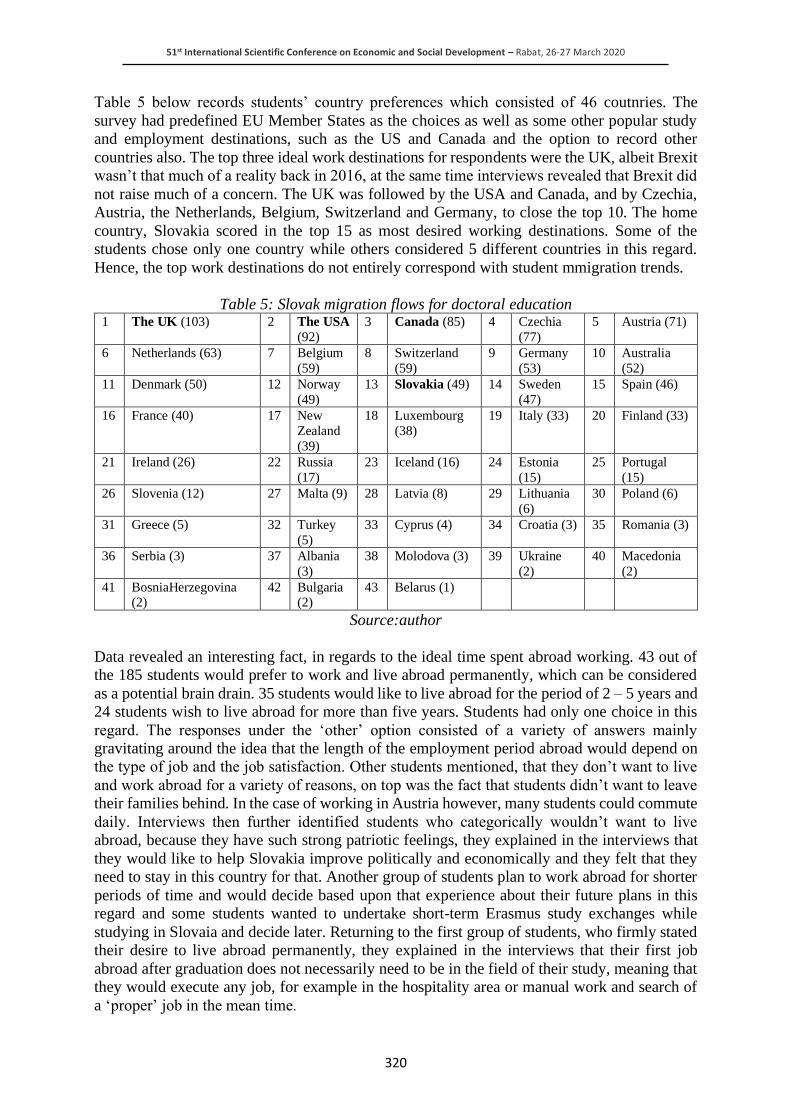
51st International Scientific Conference on Economic and Social Development – Rabat, 26-27 March 2020
320
Table 5 below records students’ country preferences which consisted of 46 coutnries. The
survey had predefined EU Member States as the choices as well as some other popular study
and employment destinations, such as the US and Canada and the option to record other
countries also. The top three ideal work destinations for respondents were the UK, albeit Brexit
wasn’t that much of a reality back in 2016, at the same time interviews revealed that Brexit did
not raise much of a concern. The UK was followed by the USA and Canada, and by Czechia,
Austria, the Netherlands, Belgium, Switzerland and Germany, to close the top 10. The home
country, Slovakia scored in the top 15 as most desired working destinations. Some of the
students chose only one country while others considered 5 different countries in this regard.
Hence, the top work destinations do not entirely correspond with student mmigration trends.
Table 5: Slovak migration flows for doctoral education 1 The UK (103) 2 The USA
(92)
3 Canada (85) 4 Czechia
(77)
5 Austria (71)
6 Netherlands (63) 7 Belgium
(59)
8 Switzerland
(59)
9 Germany
(53)
10 Australia
(52)
11 Denmark (50) 12 Norway
(49)
13 Slovakia (49) 14 Sweden
(47)
15 Spain (46)
16 France (40) 17 New
Zealand
(39)
18 Luxembourg
(38)
19 Italy (33) 20 Finland (33)
21 Ireland (26) 22 Russia
(17)
23 Iceland (16) 24 Estonia
(15)
25 Portugal
(15)
26 Slovenia (12) 27 Malta (9) 28 Latvia (8) 29 Lithuania
(6)
30 Poland (6)
31 Greece (5) 32 Turkey
(5)
33 Cyprus (4) 34 Croatia (3) 35 Romania (3)
36 Serbia (3) 37 Albania
(3)
38 Molodova (3) 39 Ukraine
(2)
40 Macedonia
(2)
41 BosniaHerzegovina (2)
42 Bulgaria (2)
43 Belarus (1)
Source:author
Data revealed an interesting fact, in regards to the ideal time spent abroad working. 43 out of
the 185 students would prefer to work and live abroad permanently, which can be considered
as a potential brain drain. 35 students would like to live abroad for the period of 2 – 5 years and
24 students wish to live abroad for more than five years. Students had only one choice in this
regard. The responses under the ‘other’ option consisted of a variety of answers mainly
gravitating around the idea that the length of the employment period abroad would depend on
the type of job and the job satisfaction. Other students mentioned, that they don’t want to live
and work abroad for a variety of reasons, on top was the fact that students didn’t want to leave
their families behind. In the case of working in Austria however, many students could commute
daily. Interviews then further identified students who categorically wouldn’t want to live
abroad, because they have such strong patriotic feelings, they explained in the interviews that
they would like to help Slovakia improve politically and economically and they felt that they
need to stay in this country for that. Another group of students plan to work abroad for shorter
periods of time and would decide based upon that experience about their future plans in this
regard and some students wanted to undertake short-term Erasmus study exchanges while
studying in Slovaia and decide later. Returning to the first group of students, who firmly stated
their desire to live abroad permanently, they explained in the interviews that their first job
abroad after graduation does not necessarily need to be in the field of their study, meaning that
they would execute any job, for example in the hospitality area or manual work and search of
a ‘proper’ job in the mean time.

51st International Scientific Conference on Economic and Social Development – Rabat, 26-27 March 2020
321
Few students mentioned that even though they would like to live abroad for good, their job
position would have to be secured while still in Slovakia, they would search for the right job
extensively prior to departure. Figure 4 captures students’ preferred time spent living abroad
after graduation.
Figure 4: Ideal time spent working abaraod
5. CONCLUSION
Based on these analyzes, we can say that the study abroad is remaining and becoming an
increasingly attractive for Slovak students. The analysis showed that the most popular study
destinations are the V4 countries (Czech Republic, Hungary and Poland). The most important
flow of Slovak students for education is the Slovak - Czech flow. In 2017, up to 22 478 Slovak
students officially left for Czechia. This flow can be considered the most important brain drain,
since Czechia was the number one study destination for both, undegradauate and postgraduate
students in all types of degrees (Bc., Master, PhD.), who completed their whole degree outside
of Slovakia. Czechia came first and was followed by Hungary and Poland. The UK and Austria
were often among the top 10 countries and some of the strongest reason for the latter two
choices was the wish to improve foreign language skills, however, in the case of Czechia the
language factor is different, it is the enabler or is easier integration. Many Slovak citizens speak
Czech and vice versa, so study at Czech universities does not require learning an additional
foreign languge. On top, the joined historical legacy of Czechoslovakia, and the convenient
geographical distance of Czechia to Slovakia, similarity of culture which is also to a large extent
true in the cases of Poland and Hungary, the V4 student migration.
51st International Scientific Conference on Economic and Social Development – Rabat, 26-27 March 2020
322
In terms of the brain drain, it is arguably important to monitor student migration together with
the preferences of students in terms of their future career. This should be done for both, students
who study abroad and also for those studying in Slovakia. This can offer a more comprehensive
picture about the brain drain. Qulitative study on a smaller and isolated sample revealed a firm
aspiration of approximately one quarter of students wishing to live abroad permanently. The
Slovak government could create more favourable conditions to retain students and to mitigate
the large numbers of Slovaks studying abroad as they represent a serious brain drain to Slovakia,
which is ongoing and runs the danger of becoming chronic, when paired with the country’
demographic deficit.
ACKNOWLEDGEMENT: This research was supported by the VEGA grants No. 2/0151/19
and 2/0002/18.
LITERATURE:
1. Becker, G. S. (1967). Human capital and the personal distribution of income: An analytical
approach (No. 1). Ann Arbor, Mich.: Institute of Public Administration.
2. Divinský, B. (2009). Migračné trendy v Slovenskej republike po vstupe krajiny do EÚ.
IOM-Medzinárodná organizácia pre migráciu. Bratislava.
3. Eurostat (2019). Mobile students from abroad enrolled by education level, sex and country
of origin. Retrieved 31.01.2020 from
http://appsso.eurostat.ec.europa.eu/nui/show.do?dataset=educ_uoe_mobs02&lang=en.
4. Chrančoková, M. (2016). Gaining Knowledge Through the Migration of Slovak Migrants -
Motives, Benefits, and Risks of Their Migration. In: Procedings of 14th International
Scientific Conference, Czech Republic. Silesian University in Opava, School of Business
Administration in Karviná, 258-266.
5. King, R. (2008). Atlas lidské migrace. Praha: Mladá Fronta. pp. 192. ISBN 8020417060.
6. Lee, E. S. (1972). Eine Theorie der Wanderung. In Regionale Mobilität: elf Aufsätze, 115-
129.
7. Massey, D. S. et al. (1993). Theories of international migration: a review and appraisal.
Population and development review, vol. 19, no. 3, pp. 431-466.
8. Perraton, J. a Tarrant, I. 2007. What does tacit knowledge actually explain? Journal of
economic methodology, vol. 14, no. 3, pp. 353-370.
9. Piore, M. J. (1981). Birds of Passage: Migrant Labor and Industrial Societies. Publication
and Development Review, vol. 7, no. 3, 527-529.
10. Stark, D. (1996). Recombinant property in East European capitalism. American journal of
sociology, vol. 101, no. 4, 993-1027.
11. Todaro, M. P. (1980). International Migration in Developing Countries: A Survey.
Population and Economic Change in Developing Countries. Chicago: University of
Chicago Press, 361-402.
12. MFSR. (2017). Odliv mozgov po slovensky. Ministry of Finance of the Slovak Republik.
Retrieved 09.01.2017 from https://www.mfsr.sk/sk/media/komentare-ifp-uhp/odliv-
mozgov-po-slovensky-januar-2017.html.
13. Weibl, G. (2015). Cosmopolitan identity and personal growth as an outcome of international
student mobility at selected New Zealand, British and Czech universities. Journal of
international Mobility, Vol. 1, 31-44.
14. Williams, A. M. & V. Baláž (2008). International Migration and Knowledge. New York:
Routledge.
51st International Scientific Conference on Economic and Social Development – Rabat, 26-27 March 2020
323
ECONOMIC THEORY AND THE CONSTRUCTION OF REALITY
Maxim Petrenko
Novosibirsk State University of Economics and Management
Kamenskaya str., 52/1, Novosibirsk, Russia
ABSTRACT
This article is devoted to the adequacy of economic theories of the reality of social and
economic development. The author shows the scholastic nature of many scientific
constructions, the speculative nature of economic models. Criticism of neoclassical theory and
a number of others from the standpoint of the theory of economic constructivism is given. The
article discusses the impact of the economic worldview of scientists on the nature and
development of social and economic processes. Economic theory is not only a construct in itself,
but also capable of constructing an independent reality. The practical activities of economists
are always tied to one or another theory. The creation of social and economic reality in
accordance with the principles of the vision of theoreticians increases the credibility of
economic theory, since it creates the illusion of an objective reflection created by theory.
Keywords: construct, economic consciousness, economic theory, rationality, social reality
1. INTRODUCTION
We can't call the current state of economic theory prosperous. And the topic of crisis in
economic science is heard from quite often. Main accusations are pushed towards the
neoclassical theory because it's considered to be one of the most influential ones. It's no
coincidence that the word "mainstream" is associated with neoclassics which stresses on
distribution of the limited resources within the competing agents. It is thought to be that the
participants of social-economical interaction are aiming towards optimization of their behavior,
minimization of the cost and increasing of utility, and that all helps them to mediate economic
market. Besides that, a lot of theorists of economy have been criticizing the neoclassical theory
for years for its isolation from reality and for its passion to create only the schemes of models.
Swedish economist Lars Pålsson Syll said: "Its main result, so far, has been to demonstrate the
futility of trying to build a satisfactory bridge between formalistic-axiomatic deductivist models
and real world target systems" (Pålsson Syll, 2010).
2. CRITICISM OF NEOCLASSICAL THEORY
Economists grudgingly admit the importance of mental and cultural factors in explanation of
economical behavior, because it puts a doubt on the rational model itself as an instrument of
explanation of how the market functions. The economy is becoming more broad for
interpretation and frequently it's not able to predict the future of economical cataclysms, rises
and falls since it all comes from a number of assumptions that are not taken from the real world
but from a psychological pursuit of regulations of knowledge. As Alan P. Kirman wrote: "We
have wound up in the weird position of developing models that unjustifiably claim to be
scientific because they are based on the idea that the economy behaves like a rational individual,
when behavioural economics provides a wealth of evidence showing that the rationality in
question has little or nothing to do with how people behave" (Kirman, 2009). Severe criticism
of neoclassical theory also exists among economists. Representatives of behavioral economics
and the institutional theory were particularly successful in this, purporting a more realistic
reflection of economic reality. Scientists studying economic behavior, experts in the field of
marketing and advertising psychology are much closer to daily practice and quite clearly see
the discrepancy between the theoretical design and empirical reality.
51st International Scientific Conference on Economic and Social Development – Rabat, 26-27 March 2020
324
According to their opinion, theoretical valuations are used to achieve a spurious streamlining
of economic behavior (Kroeber-Riel, 1971). Professional economists become increasingly
aware of the need to explore and take into account mental and cultural factors, the impact of
which on economic behavior is impossible to deny.
3. ECONOMIC FIELD IN TERMS OF SOCIOLOGY
In his time, P. Bourdieu convincingly showed that economic theory and, above all,
neoclassicism in many ways is a typical product of scholastic thought and confuses reality with
its model. Economic theory is nothing more than a projection of scientists' practical
assumptions into the world of theory, the universalization of their own predispositions to
calculation. (Lebaron, 2004). These mind games, as a rule, do not reflect the activities of people
or firms, whose behavior is very far from the logic of theoretical reasoning, if only because a
person is by nature an irrational being driven by passions, drives, emotions, etc. It would be
erroneous to assume that economic behavior and economic structure are radically different from
any other type of social action and the rest of the social world. Economic forms of social
interaction are just a special case of social contacts observed in public life. At the heart of both
the economic and any other field, there are the inherent interests and ideas for people that exist
at the level of both physical and mental. Nevertheless, people tend to isolate the economy into
something separate, to contrast it with other areas of society. The isolation of the economy is a
property and a characteristic of consciousness. The opposition of the economy to politics, law
and culture is carried out primarily on the mental level, and therefore exists in the form of
subjective representations. The autonomy of the economic field is not characterized by the field
itself, but by the consciousness that this field singled out. Moreover, this consciousness, like
any other, is basically mythological, which was shown by K. Jung and K. Levi-Strauss.
Autonomization of economic reality and endowing it with unique properties of development
and functioning are associated with the spread in society of a special kind of faith, specific value
orientations that contribute to the construction of a special symbolic space with its own rules of
the game and perception rules that are imposed by the "uninitiated". Formed at the level of
consciousness and fixed with the help of economic theory, the economic field is propagated as
an autonomous and objective reality. The reproduction of theoretical, practical, and ideological
ideas that arose on the basis of economic theory only strengthens and supports the fiction of
such autonomy. Individuals involved in the process of inclusion in it are brought up on the
corresponding perception patterns and begin to think, perceive reality with the basics of
economic theory as it was constructed. Under the influence of interpretations and knowledge
about money, credit, labor, economic reality is reproduced and more and more begins to seem
objective, and economic theory adequately reflective it.
4. CRITICISM OF RATIONALITY AS A PRECONDITION FOR ECONOMIC
ANALYSIS
Acting as another construct, economic theory claims to be universal, actively interferes with its
research methods, based on the rational behavior of the individual, in related social sciences.
Even institutional theories, the theory of bounded rationality, that criticize neoclassic for
distortion of reality, construct such a social space in which rationalism, which in economic
theory acquires the character of a total context, remains the starting point. Prominent economist,
specialist in the field of institutional economics, professor of Behavioural and Institutional
Economics Morris Altman does not abandon rationality, as a premise of analysis, and
fundamental postulates of neoclassic theory. In his opinion, the evidence demonstrating that
individuals do not behave neoclassically does not undermine economic theory (Altman, 2008).
The "normal" behavior of an economic subject is seen by economists of different schools in the
same way in the context of rationality.
51st International Scientific Conference on Economic and Social Development – Rabat, 26-27 March 2020
325
The only difference is the recognition of different degrees of rationality. In any case, rationality
serves as a global center of knowledge, a starting point, a standard; the behavior of the subject
is judged by the degree of remoteness or approximation to rationality. As emphasized by
Herbert Simon, economics, whether normative or positive, is not just a study of the distribution
of limited resources, but a study of the rational distribution of limited resources (Simon, 1978).
The discourse of economic theory itself necessarily postulates the existence of a total context,
a total original meaning, through the involvement of which all sorts of individual events and
phenomena can only get their own meaning. Economic theory, as another metanarrative, seeks
to pre-enter any economic action or thought in the framework set from the outside. It is obvious
that rationality, as a total context that underlies all economic theories, is selective, artificial, and
is taken not from the real economic world, but from the inherent propensities of economic
scientists to organize the observed reality and the desire to find some hidden regularity in it.
What is overlooked is the fact that the so-called laws of social development are nothing more
than the connection that our minds make to the observable world of phenomena. Claiming the
role of a total context, rationality and other important methodological postulates of economic
theory construct such a system of scientific knowledge that initially undermines the idea of the
objectivity of knowledge, because it imposes its own matrix, coordinate system, perception
scheme, its own vision and division of the world into the studied objects of the economic field.
At the same time, theorists are not always aware of this fact, although economists often do not
know when their theories are effective. Economic theory is not physics; therefore, it always has
a "prescientific" character (Kling, 2020).
5. IDEOLOGICAL ORIENTATION OF ECONOMIC THEORY
Becoming the next metanarrative, economic theory has demonstrated its ideological orientation
and began to influence objectively on the formation of human behavior, began to construct a
new reality according to external parameters. Marxism has taken a similar path at the time. At
the stage of its emergence, it not only reflected the real class structure of society and the state
of the class struggle, but rather influenced on the real nature of social relations. Stating the
objective nature of class relations, constructing non-existent laws of social development,
Marxism exerted a tremendous influence on the consciousness of the lower classes of society,
helping to shape the very idea of the working class (Bourdieu, 1984) and the corresponding
type of thinking, followed by a vision of reality according to Marxist postulates. As well as
Marxism, economic theory, implementing own constructs into the mass consciousness,
objectively contributes to the construction of such standards of economic behavior which were
initially set by economic theorists as basic and attributed to people as if they had them from the
moment of their birth. The economic theory, introducing own designs into mass consciousness,
objectively promotes construction of such standards of economic behavior which were initially
set by economists-theorists as initial, basic and attributed to people as if they had them from the
moment of their birth. It is no accident that attempting to minimize costs on the part of the
producer in accordance with the laws of economic behavior led in the late XX - early XXI
centuries to a sharp decline in the quality of products in Russia. The legitimization of dishonest
forms of competition has occurred. Consumer fraud, hiding information, setting traps have
become morally justified by the tasks of the business. However, the construction of economic
theory, its sometimes subjective interpretation of reality does not mean that this mental
formation does not reflect reality, especially since the theory, like any scheme of perception, is
able to generate and reproduce this reality. Approaching the ideal type in Weber's
understanding, economic theory, in fact, normalizes its studied space and thereby subordinates
the social structure to its own logic. Playing an important role in the construction of modern
national economies, economic theory creates a system of preferences, demonstrating and
enforcing some economic institutions and judging and rejecting others.
51st International Scientific Conference on Economic and Social Development – Rabat, 26-27 March 2020
326
In this regard, the scientific economic Outlook largely develops the economic policy being
pursued. "The ideas of economists, both when they are right and when they are wrong, are more
powerful than is commonly understood. Indeed, the world is ruled by little else than the theories
of economists and political philosophers Practical men who believe themselves to be quite
exempt from any intellectual influences are usually the slaves of some defunct economist" -
wrote the famous economist John Keynes (Keynes, 1936). It is not by chance that in Russia E.
Gaidar acted in two qualities at once: as a scientist-expert and as a politician-reformer at the
same time. Therefore, economic theory does not so much explain reality as it constructs it,
justifies it, legitimizes it, and along with it legitimizes the policy pursued in accordance with
this theory, and therefore anticipates it, demonstrating brilliant heuristic abilities, which
contributes to its spread and popularity. Arnold Kling writes: "Economists have always had
their biases about which sorts of theories seemed reasonable; some of these biases are
idiosyncratic, as when one economist is inclined to believe that labor demand responds very
little to a change in wage rates and another is inclined to believe that labor demand responds a
great deal. But going forward, biases are likely to increasingly be driven by political viewpoints
rather than by other considerations" (Kling, 2020). The nature and the direction of economic
decisions made by the government always depends on the perception of the state of affairs in
the economy, the identification of the most significant variables that are placed in an abstract
model. Depending on which theoretical scheme will include what is seen there will be made a
specific decision. Russia`s dominant ideology of economic liberalism sets the tone to the policy
of the government. As a result, there is a refusal to introduce a vertical scale of taxation, hard
monetary policy, etc., with all the ensuing social consequences. In modern science, an
understanding of constructivism is gradually revealing the nature of the economic theory. V.
Popkov, actively working in this direction, defines the economic constructivism as "a deliberate
construction of economic reality in accordance with axiological preferences of a social subject
(individual or collective) that considers a structural and parametric interaction of a subject and
an object based on the principles of self-comprehension, ambivalence, circularity and cyclic
causality" (Popkov, 2017). While supporting the overall direction of this kind of research, it
should be noted that the choice in favor of a particular economic theory is not accidental, but
depends on many factors, among which values and intellectual aesthetics should be highlighted.
Only with a change in the system of preferences do scientists-economists begin to lean towards
other scientific theories, which in turn determine the fashion for a particular doctrine and,
having spread in a wide intellectual environment, stimulate the types of social and economic
activities corresponding to the chosen theory. It was economic theory and its neoclassic that
played an important role in the victory of the values of neoliberalism, which were the result of
work on the production and distribution of intellectual products of a predominantly economic
nature. By imposing on society the principles of the vision of the economic field, economic
theory has awakened a corresponding belief in the scientific and objective nature of its own
postulates. By convincing people that they are constantly thinking about maximizing their own
utility, and money is the main guide in the pursuit of winning, economic theory, first of all
neoclassical, has achieved a significant approximation of man to the type of homo economicus,
as the initial postulate of its theory, thus providing the necessary correspondence to the theory
of empirical reality. People were offered, and later they adopted the type of personality that was
declared as the original. People convinced themselves that they were rational economic utility
maximizers and they perceived the economic theory as an adequate reflection of the reality of
the economic field. The appeal of the economic theory and the belief in its science are due to
attempts to explain some moments of life. These moments of life can be significant enough for
an individual or become significant in the transition to bourgeois society. It is not a coincidence
that the appearance of economic theory in its modern form overlapped chronically with the
period of the emergence and establishment of capitalism.

51st International Scientific Conference on Economic and Social Development – Rabat, 26-27 March 2020
327
In the Middle Ages, collective consciousness prioritized the thought of God and other entities.
And money was not perceived as a value that it is perceived now. At that time such
constructions like the economic theory never occurred to thinkers. Speculative philosophy
developed in a completely different direction. We can observe the same in the ancient world
where the level of development of money relationships was very high, but the pursuit for
personal enrichment was not a basic value. Therefore, in social thought, there was a clear
demarcation of the types of activity depending on what it was directed at: for itself or for the
public good. Aristotle considered economics as a goal-oriented activity for creating wealth
contrasting economics with chrematistics and the art of enrichment. And wealth accumulation
is an end in itself. Aristotle said that chrematistics was related to economics, but it was not
economics: the main difference is that chrematistics aimed at exploitation (Aristotle,1983). The
ancient philosopher also noted the influence that the vision of the world had an impact on
economic activity. According to Aristotle, chrematistics contributed to the emergent of these
ideas about unlimited wealth. Protestant morality, changing attitudes towards work, the
rationality of consciousness and new types of thinking of people became decisive factors of
constructing a new scientific theory that complied with the way people thought in the New Age.
In that way, Max Weber was right connecting the origin and development of modern society
with Reformation, the emergent of the Protestant ethic and the spirit of capitalism (Weber,
2001). Economic theory, as a product of the New Age, has absorbed the basic values and
aspirations of the bourgeoisie. It was a reflection of new life principles, with a new emphasis.
It was not a reflection of empirical reality. But the principles of knowledge, which should ensure
the impartiality of scientific research, were taken from the real world. In this respect, economic
theory could look like a reflection of reality.
6. CONCLUSION
The economic theory was the product of the era and reflected the principles of vision and
division of the world. And therefore, the theory found the strength to construct reality with its
subsequent reflection. That's the reason why the economic theory, considering its quality of
being a basic principle of construction for economic relationships and society in general, never
had an irrational side to it. It occurred in particular historical circumstances and certain
conditions. In that case, the theory can reflect and interpret reality created by itself. It can
replicate a belief and that mental attitudes constructed by itself. As a regular construct, the
economic theory can claim the role of an objective interpreter of reality. That’s the reason why
the theory can predict a lot being strengthening its position in the world. However, the
predictive, explanation and interpretation abilities are not equated. So, let the economic theory
be sort of metaphysical creation which is accumulated by its own creation of well-organized
habitual rituals and capable of such abilities as self-reflection and prediction.
LITERATURE:
1. Altman, M. (2008). Behavioral Economics, Economic Theory and Public Policy. SSRN
Electronic Journal, 5(1). Retrieved 29.02.2020 from
https://papers.ssrn.com/sol3/papers.cfm?abstract_id=1152105
2. Aristotle (1983). Politics. Works. vol. 4. Moscow, Thought [Mysl] Publ. pp. 376-644. (In
Russian).
3. Bourdieu, P. (1984). Espace social et genèse des "classes". Actes de la Recherche en
Sciences Sociales. 52/53. pp. 3-14. Retrieved 29.02.2020 from
https://www.persee.fr/doc/arss_0335-5322_1984_num_52_1_3327
4. Keynes, J.M. (1936). The General Theory of Employment, Interest and Money. London:
Macmillan (reprinted 2007).
51st International Scientific Conference on Economic and Social Development – Rabat, 26-27 March 2020
328
5. Kirman, A. (2009). Economic theory and the crisis. VOX CEPR Policy Portal. 14
November. Retrieved 29.02.2020 from https://voxeu.org/article/economic-theory-and-
crisis
6. Kling, A. (2020). How Effective is Economic Theory? National Affairs, 42. Retrieved
29.02.2020 from https://www.nationalaffairs.com/publications/detail/how-effective-is-
economic-theory
7. Kroeber-Riel, W. (1971). Constructs and empirical basis in theories of economic
behavior. Theory and Decision, 1. pp. 337–349.
8. Lebaron, F. (2004). Sociology of Pierre Bourdieu and economic sciences. Journal of
Sociology and Social Anthropology. vol. 7. no. 5. pp. 144-152. Retrieved 29.02.2020 from
http://www.lebaron-frederic.fr/medias/files/moscou.pdf
9. Pålsson Syll L. (2010). What is (wrong with) economic theory? Real-world economics
review. issue 55. pp. 23-57. Retrieved 29.02.2020 from
http://www.paecon.net/PAEReview/issue55/Syll55.pdf
10. Popkov, V. (2017). Theory of Economic Constructivism. Economic thought. History,
Philosophy, and Methodology. (In Russian). Retrieved 29.02.2020 from
http://etdiscussion.worldeconomicsassociation.org/wp-content/uploads/2017/10/Popkov-
09-Oct-17.pdf
11. Simon, H.A. (1978). Rationality as Process and as Product of Thought. American Economic
Review. vol. 68, issue 2, pp. 1-16.
12. Weber, M. (2001). The Protestant ethic and the spirit of capitalism. London; New York:
Routledge.
51st International Scientific Conference on Economic and Social Development – Rabat, 26-27 March 2020
329
GLOBAL FINANCIAL CRISIS AND ITS IMPACT ON NIGERIAN
ECONOMY
Ayuba A. Aminu
Department of Business Administration, University of Maiduguri, Nigeria
Yahaya Yunusa Malgwi
Bursary Department, University of Maiduguri, Nigeria
ABSTRACT
The paper examined the impact of global economic crisis on the Nigerian economy and traced
the causes of global financial meltdown not only to the United States but spread to all parts of
the world. The Nigerian policy makers said that, there is no problem in the Nigerian capital
market as shareholders are getting dividends and bonuses until capital market was badly
affected when it witnessed the lowest level of shares deals as against a remarkable drop in the
volume transactions and value in 2008 and again when market capitalization had dropped
drastically was time when the government finally accepted there was a financial crisis. The
paper also identifies the causes of Global financial Crisis, impact of Global Financial
Meltdown on Nigerian Capital Market and the impact of financial meltdown on Nigerian
Economy. Based on the existing findings, the study recommend that Nigeria need to adjust
government spending to the reality of time and should go back to backward integration through
agriculture to encourage export rather than depending on import.
Keywords: Global Financial crisis, Global Financial meltdown, Capital market, Economy
1. INTRODUCTION
Global financial meltdown is said to have originated from US and the crises is not restricted to
the United States Financial markets only but spread all over the world from London to Tokyo,
Seoul to Sydney, Sao Paulo to Moscow, Bombay to Frankfurt, and generally from Europe to
Africa. Capital market all over the world has been experiencing some level of economic
depression since the global recession started. However, the origin of the problem was said to
be credit crunch that started globally and institutional investors were then pulling out in other
to service their facilities elsewhere and then stock price went down and even developed capital
markets began to experience global financial meltdown. But Nigerian policy makers went to
extent of saying that it will not affect our economy because of their myopic thinking or either
they did not understand the global financial crises or they underestimated its magnitude and
thought that the financial crisis is only in the developed nations. The Policy makers said that
there is no problem in the Nigerian capital market as shareholders are getting dividends and
bonuses until capital market was badly affected when it witnessed the lowest level of 10.65
billion shares worth N134.4 billion in 197,213 deals as against the preceding a total of 17.4
billion shares valued at N169.64 billion in 249,937 deals indicating a remarkable drop in the
volume transactions and value in 2008 and again when market capitalization had dropped from
N12 trillion to less than N9 trillion that was time when the government finally accepted there
was a financial crisis. The Nigerian Stock Exchange, the regulator of the Nigerian Capital
Market has witnessed unprecedented turbulence since April, 2008 with a downward slide of the
stocks on the market which affected the banking sector extremely making capital market experts
and regulatory authorities to be worried of the situation. Such turbulence has never been
experienced in the history of the Nigerian capital market operations. The global financial crises
brought about the liquidity squeeze in the capital market and if allowed to continue the Nigerian
economy will suffer which can lead to inability of people investing in the capital market.

51st International Scientific Conference on Economic and Social Development – Rabat, 26-27 March 2020
330
The other crisis which has not manifested yet is on currency crisis and hope that currency crisis
will not happen. But in a situation where major currencies begin to lose confidence in the Dollar
as a reserve currency then we might have another new historic era global currency crisis. It is
in view of the above, this paper addresses the causes and impact of global financial crisis
associated with Nigerian capital market and the economy.
2. GLOBAL FINANCIAL MELTDOWN
The phenomenon called financial meltdown as it is sometimes referred to as credit crunch or
financial crises has different meanings. Financial crises according to (Kindleberger and Aliber,
2005, Laeven and Valencia, 2008) include stock market crashes and the bursting of other
financial bubbles, currency crises, and sovereign defaults. However, there are some economic
theories that explained financial crises to include; World systems theory which explained the
dangers and perils which industrial nations faces at the end oil crisis of 1973 while Coordination
games is a mathematical approach to modelling financial crises that emphasized that positive
feedback on dramatic changes in asset values in response to small changes in economic
fundamentals between market participants' decisions (Krugman, 2008). Minsky’s theorised that
financial fragility levels move together with the business cycle while Herding and Learning
models explained that asset purchases by a few agents encourage others to buy too, not because
the true value of the asset increases when many buy (which is called "strategic
complementarity"), but because investors come to believe the true asset value is high when they
observe others buying (Avery and Zemsky, 1998, Chari and Kehoe, 2004, Cipriani and Guarino,
2008). This financial crisis had its roots from United States has put many countries into financial
mess. No economy is really totally immune to the state of flux that became the lot of the global
economy by the closed of the third quarter of 2008. Since then, economic managers, financial
experts and economists, especially those in the worst hit, have been characterizing the
phenomenon in various ways. The argument is that many scholars, public policy analysts and
financial experts are confused as to who between the industrialized nations and the emerging
developing economies, will bear the brunt of the global phenomenon. The world economy has
suffered and is still suffering because of the global financial meltdown. The major sectors of
the economy mostly hit by the crunch are: capital market, financial institutions and
employment. These are all essential factors that need attention. The issue of concern here is
that, the credit crunch has lead to the collapse of the world stock markets. This is because
according the global stock market Fact book released in 2008, non of the developed market
exchange featured on the list of the world’s top 25 performing exchanges as at the end of 2007
(Ekungayo; 2008). World financial firms had, towards the end of October 2008, lost about $2.8
trillion as a result of the crisis (Shah, 2008). In a similar development, global tax payers have
spent about $8 trillion in order to revamp the worlds ailing banks. These amounts will increase
as the crisis spreads into the real economy. The supreme mortgage in the US has equally
suffered similar damages. Some of them had to be bought out by the government of US this
could be explained by the US treasury’s takeover of Fannie Mac and Freddle Mac in September,
2008 in the employment sub-sector, one hundred and fifty nine thousand (159,000) jobs were
lost as a result of the crisis. This is because the lay offs resorted to by the banks in the US and
Europe City group, for example, announced 900 jobs cuts globally in the middle of April 2008,
UBS also revealed a job cut of 900 banking staff in London and Wachovia the 4th largest bank
in the United States dropped 500 workers following the financial meltdown (Uzor, 2008). These
actions have led to an increase in unemployment rate. For instance, the rate of unemployment
in the US rose from 5.7% in July to 6.1% in August, 2008 (October Economic Report, 2008).
As the credit crunch continues to take its toils, government of the affected countries saw the
need to work out bail out packages that could cushion the effects. According to George W.
Bush of the United States initiated a $700 billion bail out plan.

51st International Scientific Conference on Economic and Social Development – Rabat, 26-27 March 2020
331
The package is for combined purposes such as direct equity investment, bank debt guarantee
and purchases of troubled assets. The intention is to revamp the economy after the collapse of
its banking and insurance sub-sectors. The US government is of the belief that the plan will not
only minimize the effect of the crisis but will also serve as a means to protect the interest of the
depositors and other US tax payers. It was estimated that in US alone, investors lost about one
trillion dollars and stock market across Asia fell sharply with some of them losing over 4% of
their values, (BBC News, 2008). In further attempts to bail out financial institutions globally,
governments of the countries in the European Union (EU) have pledged a total of $2.5 trillion
to guarantee bank debts and purchase equity states. Some of the specific national policies of the
affected countries according to October Economic Report (2008) was guarantee bank debt and
inject money into financial institution. Of these countries include UK, Germany, Spain and
France. These plans according to the report became necessary because of the growing fear s
that the effects of the crunch are fast and degenerating to all other countries of the world. Since
it is growing and degenerating to Nigeria among other developing world, what plan and or
provision do we have to either avoid it or take advantage of the crisis when possible?
3. CAUSES OF GLOBAL FINANCIAL CRISIS
Avgouleas (2008) enumerated the causes of the financial crisis as: breakdown in underwriting
standards for subprime mortgages; flaws in credit rating agencies’ assessments of subprime
Residential Mortgage Backed Securities (RMBS) and other complex structured credit products
especially Collaterized Debt Obligations (CDOs) and other Asset-Backed Securities (ABS);
risk management weaknesses at some large at US and European financial institutions; and
regulatory policies, including capital and disclosure requirements that failed to mitigate risk
management weaknesses. While Soludo (2008) enumerated the causes of the financial crisis as
follows:
• False assumption of ever increasing housing prices, leading to sub-prime mortgage lending
• Continued fall in house prices and borrowers inability to refinance, thus leading to defaults
• Investment banks exposure through leveraging
• With crash of structured products and mortgage market, consumer loans and mortgage
market distress, led to counter- party risk
• Rising illiquidity
• Banks stopped lending and recalled some of their loans; potential financial instability
• Stock markets burst
• Pressure on banks to raise capital
• Huge write-downs
• Ratings downgraded
Other causes are:
• Poor economic management
• Mortgage burst in the USA
• Corruption
• Inflation
4. IMPACT OF GLOBAL FINANCIAL MELTDOWN ON NIGERIAN CAPITAL
MARKET
The effects of the financial meltdown could be seen from different sectors of the economy. One
of the major segments of the economy hit by the credit crunch is the Nigerian Stock Exchange
(NSE). The Nigerian Stock Exchange Index has suffered persistent decline in share values over
the past years due to over supply by those divesting and lack of demand.
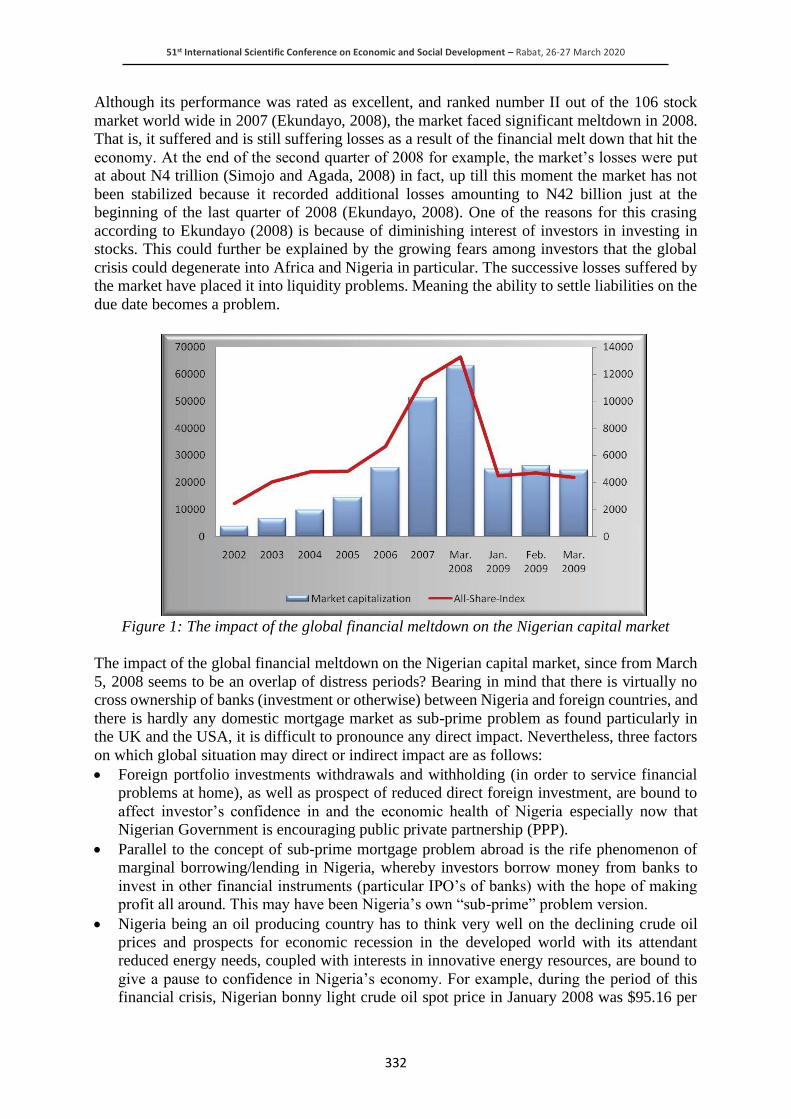
51st International Scientific Conference on Economic and Social Development – Rabat, 26-27 March 2020
332
Although its performance was rated as excellent, and ranked number II out of the 106 stock
market world wide in 2007 (Ekundayo, 2008), the market faced significant meltdown in 2008.
That is, it suffered and is still suffering losses as a result of the financial melt down that hit the
economy. At the end of the second quarter of 2008 for example, the market’s losses were put
at about N4 trillion (Simojo and Agada, 2008) in fact, up till this moment the market has not
been stabilized because it recorded additional losses amounting to N42 billion just at the
beginning of the last quarter of 2008 (Ekundayo, 2008). One of the reasons for this crasing
according to Ekundayo (2008) is because of diminishing interest of investors in investing in
stocks. This could further be explained by the growing fears among investors that the global
crisis could degenerate into Africa and Nigeria in particular. The successive losses suffered by
the market have placed it into liquidity problems. Meaning the ability to settle liabilities on the
due date becomes a problem.
Figure 1: The impact of the global financial meltdown on the Nigerian capital market
The impact of the global financial meltdown on the Nigerian capital market, since from March
5, 2008 seems to be an overlap of distress periods? Bearing in mind that there is virtually no
cross ownership of banks (investment or otherwise) between Nigeria and foreign countries, and
there is hardly any domestic mortgage market as sub-prime problem as found particularly in
the UK and the USA, it is difficult to pronounce any direct impact. Nevertheless, three factors
on which global situation may direct or indirect impact are as follows:
• Foreign portfolio investments withdrawals and withholding (in order to service financial
problems at home), as well as prospect of reduced direct foreign investment, are bound to
affect investor’s confidence in and the economic health of Nigeria especially now that
Nigerian Government is encouraging public private partnership (PPP).
• Parallel to the concept of sub-prime mortgage problem abroad is the rife phenomenon of
marginal borrowing/lending in Nigeria, whereby investors borrow money from banks to
invest in other financial instruments (particular IPO’s of banks) with the hope of making
profit all around. This may have been Nigeria’s own “sub-prime” problem version.
• Nigeria being an oil producing country has to think very well on the declining crude oil
prices and prospects for economic recession in the developed world with its attendant
reduced energy needs, coupled with interests in innovative energy resources, are bound to
give a pause to confidence in Nigeria’s economy. For example, during the period of this
financial crisis, Nigerian bonny light crude oil spot price in January 2008 was $95.16 per

51st International Scientific Conference on Economic and Social Development – Rabat, 26-27 March 2020
333
barrel and rose to $146.15 in the first week of July 2008 before closing in October 17, 2008
at $76.24 per barrel. On October 21, 2008 the NYMEX West Texas intermediate crude oil
for November delivery closed down $3.36 at $70.89 per barrel. In this respect, it will look
as if Nigerian capital market began to see decline in oil prices.
The labour and employment sector of the economy is also one of the sectors that have impacted
by the financial crisis. The old saying that, if the mother is sick, the child is also sick, there are
fears that the lay offs and other related jobs cuts in the US and UK as a result of the credit
failure would escalate into Africa and Nigeria in particular. The job cuts announced by some
major companies in US and UK constitute a threat to Nigerian workers.
5. IMPACT OF FINANCIAL MELTDOWN ON NIGERIAN ECONOMY
• Commodity prices collapse (especially oil price)
• Revenue contraction (possible burst syndrome)
• Declining capital inflows in the economy
• De-accumulation of foreign reserves and pressure on exchange rate
• Limited foreign trade finances for banks—credit lines may dry-up for some banks.
• Capital market downturn, divestment by foreign investors with attendant tightness and
possible second round effects on the balance sheet of banks by increasing provision for bad
debt and decrease in profitability
• Counter party risks vis-à-vis external reserves but CBN has taken measures to safeguard the
reserves.
However, impact of financial meltdown has been felt by Nigerian populace in terms of:
• Increasing prices of basic commodities - foodstuffs
• Raising transport cost
• Nigerian banks cannot provide even soft loans to companies to enhance production neither
has the ability to finance SME”s
• Increase rate of unemployment through retrenchment and downsizing
• Reduce fixed deposit interest rate from 13% in January 2009 to about 5% in March 2009
not commensurate with leading rate,
• Crude Oil prices falling (Affecting Federal Government revenue)
• Currency devaluation (Naira loosing heavily against major currencies)
The financial crisis forced some organizations and companies in Nigeria to take negative
measures to ensure sustainability by reducing the workforce through down seizing,
retrenchment or sacked which led to unemployment.
6. MEASURES TAKEN BY NIGERIAN GOVERNMENT TO CURTAIL GLOBAL
FINANCIAL CRISIS
All over the world stock markets have fallen beyond expectation, large financial institutions
have collapsed and many more are at the point of collapse and various governments in even
developed countries have had to come up with one rescue measures or packages that can bail
out the financial mess in the world economy. Ajakaiye and Fakiyesi (2009) stated that some of
the policy measures already in place to reduce the problem of the global financial crisis in
Nigeria are as follows:
1) reduction in the monetary policy rate (MPR) from 10.25% to 9.75%;
2) reduction in the cash reserve requirement (CRR) for banks from 4% to 2%; and

51st International Scientific Conference on Economic and Social Development – Rabat, 26-27 March 2020
334
3) cutting the liquidity ratio from 40% to 30%. In addition, the CBN has given a directive to
banks that they have the option to restructure the already crystallised margin loans up to
2009; inter-bank lending facilities to banks are expanded and extended up to 360 days. The
same goes for discount window facilities, which have been expanded as well.
Other measures by Nigerian Government according to Soludo (2008) as policy adjustments
taken to forestall any unforeseen or uncertain circumstances that may arise from the
international financial markets:
• Presidential Steering Committee on Global Economic Crisis January 16, 2009
• Presidential Advisory Team on capital market set up (Aug. 2008) to deliberate on measures
to reverse the declining fortunes of the Nigerian capital market.
• SEC, NSE and all capital market operators reduced fees by 50%.
• NSE reviewed trading rules and regulations.
• 1.0 per cent maximum downward limit on daily price
• movement and 5.0 per cent on upward movement. This has been harmonized to 5 % either
way from end-October 2008.
• SEC released guidelines/rules on market makers.
• Strict enforcement of NSE’s listing requirement with zero tolerance for infractions.
• NSE de-listed 19 moribund companies.
• Rules on share buy-back have been released, with a limit of 15.0%.
• Central Bank has reacted by the following measures:
• Reduction of the MPR from 10.25 per cent to 9.75 per cent
• Reduction in Cash Reserve Requirement (CRR) from 4.0per cent to 2.0 per cent
• Reduction of Liquidity Ratio from 40 .0 per cent to 30.0 percent
• Directive to banks that they have the option to restructure margin loans up to 2009
• Expanded lending facilities to banks up to 360 days
• Introduced expanded discount window facility
• Stopped Liquidity Mopping-up since September 2008
7. CONCLUSION
The global financial crisis is causing a serious set back in the world economy and many
speculators are saying that worst is yet to come. One can conclude that Nigerian Capital Market
is in uncertain economic condition as a result of the domestic financial crisis. Our capital market
is in an unprecedented situation as shareholders and prospective investors have lost confidence
in the market, our banks and other financial institutions are under difficult conditions struggling
to survive while Oil and Gas sector continues to live in confusion about the fluctuating world
oil prices and foreign reserve situations remains in a glimpse and the exchange rate of dollar to
Naira is unpredictable. What is left for Nigeria is to adjust government spending to the reality
of time and should go back to backward integration through agriculture to encourage export
rather than depending on import.
LITERATURE:
1. Ajakaiye, O and Fakiyesi, T (2009). Global Financial Crisis Discussion Series Paper 8:
Nigeria. Overseas Development Institute. London
2. Avgouleas, E. (2008) ‘Financial Regulation, Behavior Finance, and the Financial Credit
Crisis in Search of a New Regulatory Model’ Retrieved from http;//papers.ssrn.com on
20/11/08.
3. Bazza M. I. (2009) “Global financial crises causes, effect and remedies for sustainable
growth and development” COE AZARE.
51st International Scientific Conference on Economic and Social Development – Rabat, 26-27 March 2020
335
4. Crotty, J. (2008) “Structural Causes of the Global Financial Crisis: A Critical Assessment
of the ‘New Financial Architecture’” Political Economy Research Institute (PERI)
University of Massachusetts Amherst Working paper no. 180 September.
5. Davies, E. P. (1992) Debt, Financial Fragility and Systemic Developing Countries,
Colorado West View press, USA.
6. Ekundayo, K. (2008) “World Financial Crisis” WFE holds Financial Standard, Wednesday,
October 22, 2008.
7. Global Financial Crisis: www.http://brooking.edu/media/files/re/papers/2008/11.
8. Handbook, Global money publication. Htt./mews.bbc.co.uk.
9. Global Financial Crisis. RMS International. Search Take – Home - Value 3/3 internet
materials
10. http://www.cnn.com/2008/POLITICS/09/17/stiglitz.crisis/index.html
11. http://www.odi.org.uk/
12. http://www.bbc.co.uk/
13. Kindleberger.C.P., and Aliber, R. (2005), Manias, Panics, and Crashes: A History of
Financial Crises, 5th ed. Wiley,
14. Mtango, E. E. E. (2008) “African Growth, Financial Crisis and Implications for TICAD IV”
GRIPS-ODI-JICA joint seminar: African Growth In The Changing Global Economy paper
presented by Ambassador of Tanzania and Dean of the African Diplomatic Corps in Japan
retrieved from www.google.com on 24/11/08.
15. NES (1999). Globalization and Nigeria’s Economic Development, Proceedings of one Day
seminar, Lagos.
16. Omoh, G. (2008) Credit Crunch Nigeria’s foreign reserves Risk; New York Oxford
University Press.
17. Schifferes, S. (2008) “Credit Crunch costs $1 trillion” BBC Science Monograph Series
No.1.
18. Soludo, C.C. (2006). Can Nigeria be China of Africa? Lecture at Founder’s Day.
19. Soludo, C. C. (2006). Law Institutions and Nigeria’s Quest to join the first World Talks in
Italy. Daily Trust, Monday, October 13, 2008.
20. Uzor, E. S. (2008) “Global Financial Crisis: Emerging value declines”. The Guardian,
Thursday October 2, 2008.
21. Wikipedia (2006). G-20 Major Economies, free encyclopedia.
22. Wikipedia (2008) ‘Subprime Mortgage Crisis’ retrieved from
http://en.wikipedia.org/wiki/subprimemortgage.crisis on 20/10/08.
23. World Bank 1994. Adjustment in Africa, Reforms, Results and Road Ahead, Oxford
University Press.
24. Wray, Randall (2007) “Lessons from the Subprime Meltdown,” Levy Institute Working
Paper No. 522.
51st International Scientific Conference on Economic and Social Development – Rabat, 26-27 March 2020
336
AXIOLOGICAL BASIS OF ENTREPRENEURIAL ACTIVITY
Natalya Rubtsova
Novosibirsk State University of Economics and Management, Novosibirsk, Russia
ABSTRACT
Currently, business activities are most often studied in economic and legal aspects. At the same
time, the axiological analysis provides an analysis of the social features of entrepreneurial
activity, which allows us to show the importance of this activity for the development of society
in a market economy. In addition, through the prism of axiological analysis, it is possible to
study the basic legal principles of business activities and, above all, the freedom of its
implementation, which can be understood not only as a principle, but also as an independent
value, a public good. Moreover, the very concept of law as freedom in the framework of the
libertarian approach corresponds to the special emphasis of the principle of business freedom
in the system of business law principles. In addition, the axiological analysis will be incomplete
without mentioning the social responsibility of business, which can be considered as a special
type of legal responsibility. Social responsibility of business is understood as voluntary social
obligations imposed on an entrepreneur in relation to a certain social assistance and
participation in social support programmes by the state and society.
Keywords: axiology, business activities, freedom, responsibility
1. INTRODUCTION
Traditionally, business activities are studied from the standpoint of economic and legal analysis.
In recent years, the analysis of the business activities concept and characteristics has not lost its
popularity in the legal literature, which is due to the great importance of this category both in
science and in practice. At the same time, the debatable nature of the study of particular features
of business activities has not changed, since the position of the legislator in this issue remains
largely unchanged, which means that the scientific analysis being conducted and the proposals
being made to amend the current legislation regulating business activities are still relevant. At
the same time the harmonious development of society as a coherent integrated system is
impossible without the development of social relationships and entrepreneurial activities, since
social activities contribute to the development of the welfare state. The axiological approach to
business activities became possible when business activity was considered as a public good.
The economic analysis of law proposed by R. Posner [32] makes it possible to justify the value
of business activities not only for entrepreneurs themselves, but also for the entire society, as it
contributes to the development of market relations. In addition, business activities is the basis
for balancing public and private interests.
2. THE PROBLEM OF ECONOMIC AND LEGAL DEFINITION OF BUSINESS
ACTIVITIES
In Russia, the legal definition of business activities is fixed, which is abstract from the legal
viewpoint, since it lists the principle features of business activities. According to article 2 of the
Russian Federation Civil Code, the business activity shall be an independent activity, performed
at one's own risk, aimed at systematically deriving a profit from the use of the property, the sale
of commodities, the performance of work or the rendering of services. Persons engaged in
business activities shall be registered in this capacity in conformity with the law-established
procedure, unless otherwise stipulated by the Civil code of the Russian Federation [9].
However, most of these features require the application of special regulations that regard or do
not regard a particular type of activity as entrepreneurship.
51st International Scientific Conference on Economic and Social Development – Rabat, 26-27 March 2020
337
The norms, defining business activities in the legislation of the CIS countries, in particular,
Kazakhstan, Kyrgyzstan [23], Belarus, [22] also have abstract character. For example, in
Kazakhstan, entrepreneurship is defined as an independent, initiative activity of citizens,
oralmans and legal entities aimed at obtaining net income through the use of property,
production, sale of goods, performance of works, provision of services, based on the right of
private property (private entrepreneurship) or on the right of economic management or
operational management of a state enterprise (state entrepreneurship). Entrepreneurial
activity is carried out on behalf of, for the risk and under the property responsibility of the
entrepreneur [8]. However, in most European countries, there is usually no legal definition of
business activity, and casuistic methods are used to determine the characteristics of
entrepreneurship. Accordingly, the features of this type of activities are characterized through
the analysis of the entity that carries out this activity - the business person. Thus, the
Commercial code of France defines the subjects of commercial activities - business people -
and establishes a list of certain types of business activities (article L110-1) [10]. Also, the
business entity is defined casually in the Uniform commercial code of the United States [34].
German legislation uses a broader approach in determining the nature of business activities,
since it both establishes a list of the types of business activities and gives the definition of a
business person [7]. All of the above definitions contain, first of all, economic features of
entrepreneurship, which, being stipulated by the legal definition, become legal features.
However, abstract definitions also contain formal legal features, such as the need to register
business entities. Such registration is required in Russia, Kazakhstan, Kyrgyzstan, and Belarus.
3. THE NECESSITY OF BUSINESS ACTIVITIES AXIOLOGICAL ANALYSIS
All the definitions of entrepreneurial activity analyzed above do not contain norms that define
the meaning of this activity. Meanwhile business activity can be understood in broader terms:
as part of the culture, a particular kind of a manufacturing business. And from this perspective,
the axiological approach to business activities becomes mostly significant. Axiology as a theory
of values (from others-Greek. ἀξία — value; ancient Greek. λγγος — the word) has been known
since ancient times. So, it was Socrates who formulated a value approach by asking the question
"What is good?": "The value of a man is not in his strength and capacity for violence in the
name of power, but in his mind, in his understanding of the good for the Polis and the possession
of political virtue" [27]. First of all, axiological analysis is associated with the study of
evaluative concepts [15]. For example, in private law relations, such concepts are
reasonableness, conscientiousness, and materiality, which are the subject of numerous studies.
Thus, good faith is considered as the main evaluation category in English [17] and American
law [20]. It is difficult to overestimate the significance of evaluation concepts. Such concepts
ensure the completeness and dynamism of civil legislation, cover ethical phenomena in law,
"guide the judicial bodies to assess the actual situation specifically, taking into account the
peculiarities of a each situation, and elaborate the general formula of the law" [1]. When
analyzing certain legal aspects regulating business activities, researchers also turn to the
analysis of the main evaluation categories of private law. At the same time, the essence of
business activity itself has an axiological basis and, first of all, is determined by the special
significance of business activity. Therefore, the value approach to business activity can be
reduced to the analysis of moral and ethical qualities, as well as the general personal values of
a businessperson. Thus, in 1912, the Russian Union of Industrialists and Entrepreneurs
approved 7 principles of doing business in Russia, based on ethical requirements aimed at
achieving the public good, and not only the narrow goals of entrepreneurs themselves ("be
honest and truthful", "love and respect the person", "be purposeful", etc.) [10], and in 2004, at
the final plenary session of the VIII World Russian People's Council, the "Code Of Moral
Principles And Rules Of Management" was adopted, which emphasizes that "management is a
51st International Scientific Conference on Economic and Social Development – Rabat, 26-27 March 2020
338
socially responsible activity" [11]. However, the importance of entrepreneurial activities for
society on a broader scale does not depend solely on the subjective qualities of the entrepreneurs
themselves. Accordingly, the axiological approach to understanding the essence of business
activities became possible just when business activities were regarded not just as a profit-
generating activity, but as an activity that carries the public good. This, in turn, is related to the
attitude of the state to the individual's free economic activity.
3.1. Elements of axiological analysis of business activities
As N. Nenovsky emphasizes, the lack of a value approach does not allow us to identify the true
role of law in the socio-cultural process, "purely human, personal aspects of the law" [26, p.
34]. According to the theory of value pluralism by I. Berlin, society is constantly confronted
with a values conflict, because values are not only incompatible, but also incommensurable [5,
p. 2-3], which means that values can not be generalized and are incomparable in their
significance. Indeed, the values of individual entrepreneurs can be understood in a utilitarian
way, as a direction of business activity, and can be reduced to making a profit. However, even
in this case such private utilitarianism has a positive impact on the achievement of a public
good: increase in employment, increase in production, and others. At the same time, another
American philosopher R. Dworkin emphasizes that the majority of the central normative
concepts (such as duty, responsibility, and justice) are interpretative concepts, and R. Dworkin
reffers to the concepts, that are opposite to interpretative ones, as "critical concepts" [14, p.
166]. According to R. Dvorkin, any value categories are subject to additional interpretation.
The objectives of entrepreneurial activities are diverse: from the utilitarian objective of making
a profit to the public objective of generating a social good, which can cause competition and
even create a conflict of social objectives, given the high stratification of society and the role
of business entities in this society. As N. S. Bondar notes, social contradictions themselves are
"normal", and, recognizing the fact of their existence, it is necessary not to absorb them, but to
offer "effective legal means of resolving them" [6, p. 33-34]. In particular, the Constitutional
Court of the Russian Federation has repeatedly given a judicial and legal assessment of the
necessity to find a balance between public and private interests. The conflict of social objectives
in the context of entrepreneurial activities is particularly evident in the need to maintain social
justice declared by the state. If we understand the purpose of entrepreneurial activities only as
a profit making, then it is difficult to imagine entrepreneurship in a social context. The concept
of social entrepreneurship has appeared in science and practice relatively recently. The
development of social entrepreneurship is associated with the creation of the Ashoka
international non-profit organization in the United States in 1980 [32, p. 7], which is aimed at
promoting social entrepreneurship. The main activities of the organization are to provide
financial and professional assistance, to unite the community of social entrepreneurs so that
they interact, help each other and bring their ideas to a higher level, to promote the creation of
infrastructure and financial systems necessary to support and expand the private sector and to
spread social innovation on a global scale [13]. The following criteria for the definition of social
entrepreneurship can be listed: the social objective of the activity, the focus on addressing the
social issues, the existence of a business model and economic stability [32, p. 17]. Ya. S.
Grishina defines social entrepreneurship as the activities of business entities, regardless of
ownership and legal form, aimed at integrating the social and economic effect in order to
address the social and property needs of citizens in socially-required goods, contributing to the
solution or smoothing of critical social problems [18, p. 389]. The term itself, at the first glance,
is paradoxical, since entrepreneurship is associated with profit-making, which usually excludes
participation in the implementation of social projects that are not aimed at obtaining material
benefits. However, eventually, any business initiative is connected in one way or another to the
solution of social problems.

51st International Scientific Conference on Economic and Social Development – Rabat, 26-27 March 2020
339
The social objective by itself indicates the well-being of entrepreneurs and the usefulness of
their activities in general for society. Therefore, it is impossible to oppose the well-being of an
entrepreneur to the social goals of their activities. Entrepreneurial activity is a priori useful for
society, i.e. it is simultaneously social and pursues not only the private interests of individuals,
but also the interests of the whole society (in fact, public interests). As R. Posner notes,
eventually, the principle of wealth maximization rewards and encourages traditional
benefactors and abilities associated with economic progress [30, p. 69]. The interpretation of
the "public interest" category has been repeatedly given by the Constitutional Court of the
Russian Federation. Most often, this interest is equated with the state interest based on the
implementation of public functions, but in some cases, the general social nature of the public
interest is also emphasized.
3.2. Features of social entrepreneurship
Social tasks of an entrepreneur are manifested in various aspects of entrepreneurial activities,
in particular, in the framework of public-private partnership, which is aimed primarily at
solving problems of public importance. A lot of countries have adopted special legislation on
social entrepreneurship [21]. For example, in 2011, Spain, Greece and Ecuador, which
commited themselves to a social economy, adopted laws on social economy and social
entrepreneurship. In 2012, similar laws were adopted in Mexico and Slovenia, and in 2013 – in
the UK and Portugal [18, p. 7]. The United States demonstrate a broad approach to
understanding social entrepreneurship. In particular, the Social Enterprise Alliance defines
social enterprise as an activity or strategy that creates decent jobs for the most needy [29].
Moreover, social enterprises are not limited to organizations that serve the disabled, or even
social service organizations. A lot of environmental organizations are social enterprises. At the
national level, the Nature protection service can be an example of cause related marketing,
when it approves and licenses the use of its name on products [12]. Furthermore, a number of
studies emphasize the innovative component of social entrepreneurship [2, p. 11]. The social
policy of EU states, which is primarily targeted to support socially vulnerable segments of the
population, requires the understanding of the special status of social entrepreneurship, which
traditionally includes the protection and support of socially vulnerable citizens within a
narrower framework. Thus, if in the United States social entrepreneurship is included in the
market economy and is an integral part of it, in European countries such entrepreneurship is
associated with the support of certain segments of the population – socially unprotected citizens,
and is a part of the "social economy" theory [25, p. 23-24]. It is the European approach to
understanding social entrepreneurship that has been developed in Russia, where there is no
special legislation on social entrepreneurship. Only the Federal law of 26.07.2019 No. 245-FZ
"On Amendments To The Federal Law" on the development of small and medium businesses
in the Russian Federation" legally established the concept of social entrepreneurship, which is
understood as entrepreneurial activity aimed at achieving socially useful goals, contributing to
the solution of social problems of citizens and society and carried out in accordance with the
conditions provided for in part 1 of article 24.1 of the Federal law "On The Development Of
Small And Medium Businesses In The Russian Federation". Among these conditions there is
an employment of some categories of population (disabled, pensioners, children from
orphanages, large families, the poor and some other less socially protected layers of the
population), ensuring the implementation produced by the citizens from among the above
categories of goods (works, services), implementation of activities for production of goods
(works, services) intended for the above-mentioned citizens, providing conditions helping them
to overcome or compensate limitations of their activity, as well as opportunities to participate
on an equal basis with other citizens in society. The above-mentioned Law clearly defines the
scope of social entrepreneurship, since these acts are aimed at implementing certain objectives

51st International Scientific Conference on Economic and Social Development – Rabat, 26-27 March 2020
340
– providing subsidies and other state support measures. Meanwhile, the area of social
entrepreneurship should cover all areas of public activities. In fact, any business should address
social problems. Any business activity, stipulated by article 2 of the Russian Federation Civil
Code, is socially oriented, since it is associated with the achievement of socially significant
goals (production, performance of works, provision of services). In general, such activities
contribute to the development of a market economy and the creation of jobs. In our opinion,
there is no contradiction between the social attitude and the main goal of business activity –
profit-making.
3.3. Features of business's social responsibility
Modern axiological analysis of business activity is unimaginable without studying the features
of business's social responsibility, which is expressed in voluntary and conscious acceptance
by entrepreneurs of increased obligations in the social sphere and participation in the
implementation of social support programmes [4, p.69]. The main argument to justify the need
for social responsibility of business is the fact that the business under the conditions of market
economy is an integral part of public life, so the very existence of business is impossible without
the support of society [3]. This means that the economic interests of business and the social
interests of society do not confront each other, but are consistent with each other, even
interdependent. Accordingly, business, in addition to generating wealth, is also responsible for
social issues, in addition to its economic and legal responsibilities. This includes businesses'
ethical requirements and discretionary or philanthropic activities benefiting society. In other
words, increasing corporate social responsibility "means changing corporate behavior in order
to reduce harm and increase benefits for society" [24, p. 2]. Such responsibility is often referred
to as a special type of social responsibility, emphasizing that positive responsibility is ensured
exclusively by moral standards adopted in society [4, p. 52]. Indeed, first of all, business social
responsibility is not based on state coercion. However, in our opinion, the main argument
proving special nature of such responsibility should be based on a broader understanding of
responsibility, since in the context of business' social responsibility, it is an issue of positive
responsibility. The concept of positive responsibility in law is disputed by some authors. And
even supporters of such responsibility see its place in the system of legal responsibility in
different ways. Let us turn to the analysis of positive responsibility in the context of
entrepreneurial activities. Carrying out business activities in complience with the legal
requirements implies positive responsibility of the entrepreneur, since legal responsibility can
be positive when it is provided for by regulatory legal relations. Moreover, legal regulation can
be based both on the entrepreneur's sense of duty and on motivating business to perform socially
significant functions. For example, employing people with disabilities for certain types of
economic activities may provide tax benefits for the business entities. This is the context in
which social entrepreneurship is interpreted by the Russian legislation. At the same time, social
entrepreneurship in the context of this Law is narrowly understood, since it involves the
implementation of business activities only towards socially unprotected population groups
defined in the Law (pensioners, disabled people, large families, graduates of orphanages, and
some others). As we can see, the axiological aspect of the business activity study also affects
the legal principles of this activity, among which the principle of freedom of business activity
is highlighted. This principle is polysemical and can be studied through the prism of not only
legal and economic, but also axiological features, which allows us to see the manifestation of
transparency guarantees in this principle. In this broad sense, business freedom has a special
economic, social, and legal value. The concept of freedom of business activity is actively
considered by many researchers. So, F. Hayek recognizes the priority of economic freedom
over the state [19]. The same position is held by M. Friedman, who notes that the state is to
provide economic freedom only when the market cannot regulate such freedom by itself [17, p.
51st International Scientific Conference on Economic and Social Development – Rabat, 26-27 March 2020
341
50-51]. Basically, the term "freedom" has an evaluative character. Moreover, representatives of
the libertarian approach to understanding of the law directly link the right to freedom. So, V. S.
Nersesyants points to the axiological foundations of understanding law through the category of
freedom [28, p. 70]. Freedom of business activities is most often expressed in a system of
benefits for the participants of business activities themselves, since it belongs to people in the
natural course of things. Thus, an entrepreneur realizes their creative abilities and motivations
for entrepreneurship. However, this principle is valuable not only for the participants of
business relations, but also for the whole society, since it is the basic characteristic of a market
economy, which, as we know, cannot exist without the free exercise of entrepreneurship.
4. CONCLUSION
Thus, the traditional economic and legal study of business activities is supplemented by an
axiological analysis that should not be limited only to the study of certain categories of business
evaluation. Within this approach the legal aspects of social entrepreneurship, as well as the
characteristics of the social responsibility of the entrepreneur should be studied. At the same
time, social responsibility has a positive character and expresses the particular importance of
entrepreneurship not only for the business actors, but also for the whole society. Axiological
analysis not only justifies the social significance of entrepreneurial activities, but also allows
polysemically interpret the legal principles of business.
LITERATURE:
1. Alekseev, S.S. (1999). Law: an ABC book-theory-philosophy: Experience in complex
research [Pravo: azbuka-teorija-filosofija: Opyt kompleksnogo issledovanija]. Moscow:
Statut.
2. Alter, S.K. (2007). Social Enterprise Typology. Virtue Ventures LLC. Nov. 27.
3. Arguments for and against Social Responsibility of Business. Retrieved from
https://accountlearning.com/arguments-social-responsibility-business/
4. Ayurova, Moskovskaya. (2015). Social responsibility of business – concept and connection
with law [Social'naja otvetstvennost' biznesa – ponjatie i svjaz' s pravom]. In T.Ya.
Khabrieva, A.V. Gabov, Yu.A. Tikhomirov, Pravo i social'noe razvitie: novaja
gumanisticheskaja ierarhija cennostej (Law and social development: New Humanistic
Hierarchy of Values). Moscow: NITS INFRA-M.
5. Berlin I. (1990). The crooked timber of humanity: chapters in the history of ideas. London:
John Murray.
6. Bondar N.S. (2017). Jekonomicheskij konstitucionalizm Rossii: ocherki teorii i praktiki
[Economic constitutionalism of Russia: essays on theory and practice] Moscow: Norma,
NITS INFRA-M.
7. Bürgerliches Gesetzbuch. Retrieved from https://www.gesetze-im-internet.de/bgb/BJNR
001950896.html#BJNR001950896BJNG000302377
8. Business code of the Republic of Kazakhstan. Retrieved from
http://adilet.zan.kz/rus/docs/K1500000375
9. Civil code of the Russian Federation. Retrieved from
http://www.consultant.ru/cons/cgi/online.cgi?rnd=B2C0780C51A9A9169DD3A3871208
BC17&base=LAW&n=340325&dst=4294967295&cacheid=35143974863E68B0CF2F83
ABE17FC387&mode=rubr&req=doc#24t38dcmmcn
10. Code de commerce. Retrieved from
https://www.legifrance.gouv.fr/affichCode.do?idArticle=LEGIARTI000027012105&idSe
ctionTA=LEGISCTA000006133171&cidTexte=LEGITEXT000005634379&dateTexte=2
0200119
51st International Scientific Conference on Economic and Social Development – Rabat, 26-27 March 2020
342
11. Code of ethical principles and rules in managing. Retrieved from
https://mospat.ru/archive/2004/02/6353/
12. Coleman, Mark Pomerantz. Social Entrepreneurship in the Northwest. Symposium on
Social Entrepreneurship US Association for Small Business and Entrepreneurship. Annual
Conference January 2003. Retrieved from http://www.socialenterprisemagazine.org
13. Drayton B. The power of new ideas. Success Stories New business Portal: social
entrepreneurship. Retrieved from http://www.nb-forum.ru/interesting/stories/bill-dreyton-
sila-novyh-idey.html#ixzz4tdvHRI9k; electronic portal "Ashoka"
https://www.ashoka.org/en/about-ashoka
14. Dworkin R. (2011). Justice for hedgehogs. London: Belknap Press, pp. 166.
15. Forji, Amin George. The correlation between law and behaviour as pillars of human
society. Retrieved from
https:// helda.helsinki.fi/bitstream/handle/10138/157880/Article_correlation_btw_law_and
_behaviour.pdf?sequence=1.
16. Friedman M. (2006). Capitalism and freedom (translated from English). Moscow: New
publishing house.
17. Giles Paul, Walling Emily. Good faith in English law What does it mean? Retrieved from
https://www.eversheds-sutherland.com/documents/services/construction/Construction
GoodfaithinEnglishlaw.pdf
18. Grishina, Ya.S. (2016). Conceptual model of legal support for Russian social
entrepreneurship [Konceptual'naja model' pravovogo obespechenija rossijskogo
social'nogo predprinimatel'stva]. (Doctoral dissertation). Moscow.
19. Hayek, F. A., (1960). The Constitution of Liberty. Chicago: University of Chicago Press.
20. Houh, Emily. (2005). The Doctrine of Good Faith in Contract Law: A (Nearly) Empty
Vessel? Faculty Articles and Other Publications. Paper 103.. Retrieved from
http://scholarship.law.uc.edu/fac_pubs/103
21. Jacques, Defourny, Nyssens, Marthe. (2010). Concepts of social enterprise and social
entrepreneurship in Europe and the United States: Convergences and divergences. Journal
of Social Entrepreneurship. Vol. 1(Issue 1). pp. 32-53.
22. Law of the Republic of Belarus "On entrepreneurship in the Republic of Belarus". Retrieved
from https://belzakon.net/Законодательство/Закон_РБ/199/2123
23. Law of the Republic of Kyrgyzstan "On protection of entrepreneurs rights". Retrieved from
https://online.zakon.kz/Document/?doc_id=30256788#pos=14; -53
24. Melé, Domènec. Corporate Social Responsibility Theories. The Oxford Handbook of
Corporate Social Responsibility Edited by Andrew Crane, Dirk Matten, Abagail
McWilliams, Jeremy Moon, and Donald S. Siegel. Retrieved from
https://dl.bsu.by/pluginfile.php/66247/mod_resource/content/1/Corporate_Social_Respons
ibility_Theories.pdf. P. 2.
25. Monzón, José Luis, Campos, Rafael Chaves Ávila. (2012). The social economy in the
European Union. Belgium.
26. Nenovsky, N. (1987). Law and values. (Translated from Bulgarian). Moscow: Progress.
27. Nersesyants, V. S. (1977). Socrates. Moscow: Nauka publishing house.
28. Nersesyants, V. S. (2015). General theory of law and state: Textbook for universities.
[Obshhaja teorija prava i gosudarstva:Uchebnik dlja vuzov]. Moscow: Norma: NITS
INFRA-M.
29. Nonprofit Enterprise and Self-Sustainability Team (NESsT). Retrieved from
http://www.nesst.org/
30. Posner, R. A. (2017). Utilitarianism, Economics and legal theory [Utilitarizm, jekonomika
i teorija prava] Izvestija vuzov Jurisprudence. (Universities' news. Law), (No. 3.), pp. 46-
89.

51st International Scientific Conference on Economic and Social Development – Rabat, 26-27 March 2020
343
31. Smooth, N.Yu. et al. (2017). The image of a social entrepreneur is Russia and Kazakhstan.
View of SAP M.G. Smooth Gulbekyan, V. L. Weiner, E. I. Frolova. Astana
32. Social entrepreneurship in Russia and in the world. Editor Moskovskaya, A.A. (2011).
Moscow: Publishing house of the Higher school of Economics. P. 7.
33. The club of Orthodox entrepreneurs. Retrieved from
http://kpp-russia.ru/club/dokumenty/sem-principov-vedeniya-del-v-rossii-1912-g/
34. U. S. Uniform Trade Code Retrieved from https://www.law.cornell.edu/ucc/2/2-104

51st International Scientific Conference on Economic and Social Development – Rabat, 26-27 March 2020
344
EXPERIENCE IN REFORMING TEACHER TRAINING SYSTEMS IN
EUROPE (EXAMPLE OF GERMANY AND FRANCE)
Natalya Nos
Novosibirsk State University of economics and management, Russia
Uiliia Ostrovaya
Novosibirsk State University of economics and management, Russia
ABSTRACT
The article analyzes the features of teacher training in Europe. The integration processes that
started back in the 20th century affected all spheres of life, including education. It is with the
process of modernization of education that the concept of “Europeanization of education” is
associated, which has come into use and has been actively used since the signing of the
Maastricht Agreement in 1993, when the European Union received legal authority in
implementing the educational policy of European countries. Western European teacher
training systems have also undergone profound reform. However, it should be noted that the
process of Europeanization of teacher training systems is slower than in other areas. This is
primarily due to national traditions that have evolved over several centuries. The Bologna
Declaration, which gave the name to the process of harmonization of educational systems,
became the fundamental document of integration for European countries in the field of higher
education. The main concept of this strategy was the concept of “unity in diversity,” which
embodies the ideological meaning of the European integration process in the field of education.
The authors of the article give some general trends in the Europeanization of teacher education,
which contribute to some harmonization in this area. The authors will consider in detail the
system of teacher training in two European countries: in Germany and in France.
Keywords: education, European countries, Europeanization of education, teacher training,
“unity in diversity”
1. INTRODUCTION
More recently, teacher training systems in European countries have undergone global changes.
This is mainly due to the processes of integration in various areas of human existence. Despite
the fact that teacher training is currently a priority in the European Union, the process of
integration of European teacher training systems is slower than in other areas of higher
education, which is primarily associated with national traditions that have developed over the
centuries. Thus, the unique two-phase German system of pedagogical education with its
university and practical training was not easily subjected to the reform process.
The situation was similar with the training of teachers in France, where before the reform
processes there were several ways to get the teaching profession. In Germany and France,
countries with unique historical experience in developing teacher training across Europe, there
have been recent active adaptations of examples of effective teacher training. Despite the
structural diversity in the field of teacher training in European countries, some general trends
that allow us to talk about the Europeanization of teacher education can be distinguished.
2. THE SYSTEM OF TEACHER EDUCATION IN GERMANY
Looking back at the history the teachers for higher levels of the German school system have
always been educated at universities. Teachers of elementary schools and elementary grades of
secondary schools did not reach university preparation until 1970.

51st International Scientific Conference on Economic and Social Development – Rabat, 26-27 March 2020
345
They studied at teacher training colleges and even before that, in seminaries for teachers. During
the 20th century, “lower” teachers received more academic education and training, while
“higher” teachers maintained their traditional high academic status and received even more
pedagogical and didactic elements [7]. Looking at these events, it becomes obvious that various
types of primary teacher education were integrated to the university. In the past 20 years teacher
training in Germany has undergone fundamental changes, which is related to the creation of a
common European Higher Education Area and the introduction of a two-cycle system
consisting of Bachelor's and Master's degrees. This in fact means a complete revolution of the
German university system.
2.1. Modernization in Teacher Education
But the Bologna process has changed the system of teacher training education in Germany - but
in each of the 16 federal states in a different way, so that there are currently a variety of different
models of teacher education [1]. This is due to the fact that teacher education lie in the hand of
our 16 „Länder“, that means: the 16 states Germany as a federal state consists of. The Ministries
of Education and Cultural Affairs of the German states are responsible for teacher training and
regulate it through study regulations and examination regulations. As a result of the Bologna
process, there are different levels of reform in the German states when Introduction of
bachelor's and master's programs that qualifies for a teaching position. For a long time,
Germany was a leader in teacher training compared to other countries. In no other country
students do not need so much time before they begin to teach yourself. When the educated
teachers enter teaching a position they are much too old: 26-30 years. In many cases they are
even older. In addition, German teacher education programs differ by secondary school type.
There are special training programs for teaching positions for primary schools, integrated
secondary schools and high schools, vocational schools and special schools. The PISA results
as well as the educational analysis of the OECD and the Bologna Agreement of 1999 were
decisive for the reform discussion in the area of teacher training. During this time, a large
number of scientific publications on the situation of teacher training as well as a whole series
of commission reports on the topic of the reform of teacher training appeared in Germany. But
the inclusion of teacher education in the reform process is especially problematic from a
German perspective, which is due to national and cultural contexts. Therefore, despite the
ongoing reforms, she continues to maintain her two-tier teacher training system. The first stage
is university training, which ends with the First state exam. The second stage is additional
practical preparation phase as trainee teachers (Referendariat). The future teachers are trained
in special „teacher training seminars“ by special teacher trainers, who have to be experienced
teachers. The second phase ends with the Second State Examination, the final stage of teacher
training in Germany. Upon passing this final examination, teachers can teach at state schools
or private schools. The contents of the first and second phase are not really accorded to one
another. It should be noted that teachers and teacher education is part of the public sector
organized by state agencies. Therefore, after the first and the second phases, the state
examination is taken, which enables the teaching profession. And many federal states want to
maintain this two-phase approach in the future in order to maintain civil servant status for
teachers.
2.2. Teacher training models in Germany
In Germany there is no common teacher education but a wealth of different teacher education
models that differ not only from state to state, but from university to university. Various study
structures have different lengths of the courses result. This article describes two different
models of teacher training: the integrated model and the consecutive model. The integrated
model of teacher training provides for the professional orientation from the first semester and
51st International Scientific Conference on Economic and Social Development – Rabat, 26-27 March 2020
346
corresponds to the traditional form of teacher training, which dominated for several years in
Germany. Graduates who have completed the First State Examination for the teaching
profession can apply for the second phase Referendariat - practical preparation phase. At the
end of second phase the students have to pass the Second State Examination. After that the
examined teacher has to apply for a teacher position at a certain type of school. For several
years now, the consecutive model of teacher training with the Bachelor-Master-Structure has
been implemented at many universities in Germany. This organizational form corresponds to
the basic idea of a tiered study structure. The 6 semesters-bachelor’s course is polyvalent, so
that after that students can also take master’s courses that have nothing to do with the teaching
profession and are geared towards other professional fields. The course with the professional
goal of teaching is followed by a master’s degree. The Master of Education enables candidates
to apply for induction service as trainee teachers. The practical preparation phase ends with a
state examination, the final stage of teacher training in Germany. Upon passing this final
examination teachers can teach at public or private schools. Compared to the integrated model
of teacher training the university degree no longer provides for a state examination according
to the consecutive model. Instead, the first phase of teacher training ends with a master's thesis
or a master's exam, which is recognized as the First state exam by the state examination office
for teaching positions at schools. This is an important change in the field of teacher education
for many years. The organization of the examination is now the responsibility of the university
and not of the State Examination Board as before. Defying the diversity of realized models must
be said that the teacher training programs have a modular structure in all 16 German states. The
changes that are currently taking place in the second phase are the shortening of the induction
service. Now the duration of the second phase varies between 18 and 24 months. Also worth
mentioning is the cooperation of the induction service with the universities. One can speak of
better cooperation between First and Second phase of teacher education, which was formerly
regarded as the most important disadvantage. In addition, the practical components in the course
have been increased. Up until now, the problem of teacher training was mainly that the students
had no opportunity to get in touch with the school during the university phase of the training.
And then when the future teachers are in front of a school class in the Second phase, they
experience the so-called “practical shock”. For that reason many universities have introduced a
practical semester in the first phase of training, which will allow future teachers to get enough
practical experience to go through the second phase - the induction service. In this way, the
knowledge acquired during the First phase in practice. This makes the teaching degree more
practical, which is appreciated by many educational researchers. This makes the teaching
education more practical, which is positively evaluated by researchers. Another feature of
teacher training is the introduction of a fundamentally new practical phase on the “professional
suitability and professional aptitudes” of future teachers. This phase has already become a
prerequisite for university admission in many federal states of Germany. It should be noted that
the idea to make entrance to the teaching profession in Germany “selective” exists as much as
the teaching profession itself [3]. Thus, many universities in recent years have introduced a
fundamentally new type of practice, during which future students will be able to get acquainted
with school life from the perspective of a teacher and, based on the experience gained, make a
choice regarding their future profession. Like Prof. Dr. Dorit Bosse (University of Kassel)
emphasizes that not everyone is suitable for the teaching profession. The fact that the aspect of
suitability is particularly important for teacher training is due to the increased demands on the
teaching profession. Especially teachers have a formative influence on young generation and
the role play not only the specialist knowledge, but also the personality of the teacher. This type
of practice under the new law on teacher training allows universities to choose their students
more than before [5]. As another practical element, the “orientation practice”, that is used to
check the suitability and professional aptitudes for the teacher profession.

51st International Scientific Conference on Economic and Social Development – Rabat, 26-27 March 2020
347
This type of practice is completed in the first academic year of the bachelor's degree. So one
can say that teaching students have to complete different kinds of practices both before and
during their studies. But Prof. Dr. Dorit Bosse (University Kassel) warns that so much school
and teaching practice is not per se effective in learning [1]. Important factors for the
effectiveness of the practical phases are coaching, mentoring and inclusion of individual
resources of the students. Only then the future teachers can be better prepared for the teaching
profession. In conclusion, it should be said that teacher training in Germany has undergone
fundamental changes. The standard period of study for teaching students was considerably
reduced. Different models of teacher training are implemented; new practical phases are
introduced, which can be assessed positively. But this variety of models that have been
implemented does not have to be seen as a disadvantage, but as an opportunity that can lead to
better-trained teachers.
3. FROM THE HISTORY OF TEACHER TRAINING IN FRANCE
At the end of the 20th century - the beginning of the 21st century in Europe, the system of
teacher training is changing. Each country seeks to study innovative experience in reducing
existing training models to a single system, as well as to improve teaching technologies. France
is a leading country in the field of education, so it is especially interesting to consider the
existing system of teacher training. Teacher education in France is one of the most important
public policy priorities. The requirements for teacher training in the country are extremely strict,
which explains the large number of highly qualified specialists in the country. Teacher
education in France lasted 4 years for primary and secondary school teachers. In the secondary
education system, a separate qualification is required for each academic unit. The first two years
the future teacher spends at the university, developing the necessary theoretical base either in
the subject that he will teach in high school, or in all the main areas of primary school. After
graduation, future teachers spend another two years at university schools. («Les instituts
universitaires de formation des maîtres»). In France, the university teacher training institutes
were training establishments for public education professionals (primary and secondary
teachers, principal education advisers). They were replaced by the higher schools of teaching
and education, then by the national higher institutes of teaching and education. Teacher training
in France at teacher training institutes consisted of several equally important blocks for
successful learning:
1. academic knowledge - Usually the first two years of study at the university are devoted to
their preparation;
2. educational knowledge - A thorough study of science, familiarity with various teachings
and theories;
3. educational technologies and methods - Students not only study each method in detail, but
also learn to apply it in practice;
4. child psychology - Classes are usually held in the form of a group discussion under the
guidance of an experienced psychologist. Students receive the necessary knowledge about
the features of the child’s development and together look for a way out of a difficult
situation: for example, they decide how to help a shy student adapt in the classroom or how
to work with a multinational group of children.
Teacher training in France necessarily included practical exercises. For two years, future
teachers regularly conducted classes at the school with which the institute cooperates. An
individual mentor from among the most experienced teachers helped prepare the lesson. The
last semester for those who receive teacher training in France took place in the practice of
continuing education. Only if successful will the student be allowed to take final exams.

51st International Scientific Conference on Economic and Social Development – Rabat, 26-27 March 2020
348
3.1. Modernization in Teacher Education (MEEF masters in France)
Nowadays professional training for future teachers is organized within Higher national
institutes of teaching and education ("MEEF masters-Métiers de l`enseignement, de l`éducation
et de la formation"). The training is also organized over 2 years, these courses combine
fundamental theoretical knowledge and practical work. In France there are 32 higher national
institutes of teaching and education. They replace the higher schools of pedagogical studies.
They welcome all future teachers who can work in kindergarten, elementary school, college or
lyceum. Higher national institutes of teaching and education also train future senior education
advisers, as well as students destined for other educational professions, including adult training.
The higher national institutes of teaching and education organize vocational training: the MEEF
masters (teaching, education and training professions), in 2 years after the license. For example,
the National School of Agricultural Training in Toulouse is a public institution of higher
agricultural education which reports to the Ministry of Agriculture and Food, and which
provides initial and continuous training in all teachers and education staff of agricultural
technical education establishments. It should be noted that the “MEEF master” makes it
possible to prepare for the teaching competition corresponding to a specific professional choice:
exercising the profession of teacher in middle or high school, becoming a school teacher, etc.
Three of the four degrees offered allow to prepare for teaching competitions corresponding to
the different teaching professions that it is possible to practice:
• 1st degree to become a school teacher,
• 2nd degree to teach in middle and high school (general, technological and professional)
• "educational supervision" to exercise the profession of senior education adviser
• "training practices and engineering" does not prepare for competitions but opens up to other
training professions: engineering of digital approaches to pedagogy, training engineering
for specialized audiences, training of trainers, etc.
3.1.1. The training course for specialized education
A new standard of learning for future teachers of first and second degrees and principal
education advisor was implemented at the start of the 2019 school year. It defines the content
of the training delivered within Higher national institutes of teaching and education and
provides 800 hours of teaching and training. It must be said that from 2022, the competition
will be organized at the end of Master 2. The 1st year (Master 1) will include an observation
and practical training course in schools for 4 to 6 weeks. The future teachers of the first degree
and the second degree follow, according to the mention chosen, a significant volume (45 to
55% at least) of lessons in fundamental knowledge (reading, writing, knowing how to count,
respecting others, etc.), teaching and learning strategies, general pedagogy and classroom
management, reflective practice and research, etc. Based on the work-study program, the 2nd
year (Master 2) includes a part-time responsibility internship (paid). A new training standard
for future teachers of first and second degrees and educational senior advisor was implemented
at the start of the 2019 school year. It defines the content of the training delivered within Higher
national institutes of teaching and education and provides 800 hours of teaching and
pedagogical supervision outside internship, over 2 years. It should be noted that the Higher
National Institutes of Professorship and Education do not prepare for aggregation. Sometimes
they offer modules for preparation for external aggregation and, as part of teacher training, for
internal aggregation. On the other hand, to become an associate professor, students who have
won the aggregation competition benefit from training and an adapted course in Higher national
institutes of teaching and education aimed at acquiring the skills necessary for exercise of the
profession.
51st International Scientific Conference on Economic and Social Development – Rabat, 26-27 March 2020
349
4. CONCLUSION
Current global development is characterized by the rapid innovation process. Fundamental
reform affects all areas of life in society, requiring the renewal of all social institutions and
systems, including education. Having analyzed the features of teacher training in Germany and
France, we can draw the following conclusions:
• firstly, an increase in the practical component of the teacher training process;
• secondly, there is the opportunity to make teaching practice in one of the European
countries, which corresponds to the principle of the Bologna Declaration on student
mobility;
• the introduction of a fundamentally new practical phase on the “professional suitability and
professional aptitudes” of future teachers.
Based on the analysis, it can be said that some common trends can be noted in the European
teacher training systems, which helps to achieve some harmonization of teacher education.
However, the specific characteristics that are inherent in national systems continue to persist
and impede the integration process. European institutes plan long-term work to provide
conditions for further rapprochement of teacher education systems in the context of the Bologna
process.
LITERATURE:
1. Bosse, D. Zur Situation der Lehrerbildung in Deutschland. In: Reform der Lehrerbildung in
Deutschland, Österreich und der Schweiz. Teil I: Analysen, Perspektiven und Forschung.
2012. – S. 11-23.
2. Labazina Lyudmila Nikolaevna. The modern system of teacher training in France: Dis. ...
cand. ped Sciences: 13.00.08: Yaroslavl, 1999 166 c. RSL OD, 61: 00-13 / 31-3 2.
3. Nos N.I. Europeanization of teacher education. Questions of pedagogy. 2018. No. 7. p. 76-
78.
4. Ostrovaya Y.S. Practical direction of traning future teachers in France. // Actual problems
of humanitarian and natural sciences. - 2016. - № 9. - С. 213-216.
5. Reintjes, Ch., Bellenberg, G. Überprüfung der Eignung für den Lehrerberuf durch
Selbsterkennung, Beratung und Praxiserleben? In: Reform der Lehrerbildung in
Deutschland, Österreich und der Schweiz. Teil I: Analysen, Perspektiven und Forschung.
2012. - S. 187-207.
6. Semenova Yu.I. Professional teacher training in France // Higher education in Russia. -
2009. - No. 10. - S. 126 - 132.
7. Terhart E. Conflicting Concepts of Modernization in Teacher Education: Teacher Education
Policies in Germany. In: Teacher Education Policies in the European Union, edited by
European Network on Teacher Education Policies. S. 65-73. Lisbon.

51st International Scientific Conference on Economic and Social Development – Rabat, 26-27 March 2020
350
THE CONCEPT OF TRUST WHEN INTEGRATING LABOR
MIGRANTS INTO SMALL FAMILY BUSINESSES
Pal Zoltan Bite
Széchenyi University’s Doctoral Program in Management (SzEEDSM),
Doctoral School of Regional Sciences and Business Administration, Hungary
Marta Konczosne Szombathelyi
Széchenyi University’s Doctoral Program in Management (SzEEDSM),
Doctoral School of Regional Sciences and Business Administration, Hungary
Zoltan Baracskai
Széchenyi University’s Doctoral Program in Management (SzEEDSM),
Doctoral School of Regional Sciences and Business Administration, Hungary
ABSTRACT
The operation in small family businesses is based on trust. Existence of trust in transactions
lowers cost of such transactions, as it allows financial agreements to be less dependent on
formal regulations and facilitates investment and innovations. Trust supports the capability of
creating the extra added value originating from the family tradition and the reduction of
administrative costs. Between native people trust can be relatively easily achieved, as they have
the same language, background and origin. However, when it comes to the integration of
employees from different cultures this is not the case. Relevance of this topic comes from the
fact that small family businesses are essential drive for our economy, however in most cases
they face difficulties to benefit from labor migration. It is an accepted fact that on national level
labor migration is positive. However, the challenges and the possible benefits of global labor
migration on small family businesses have not been investigated in detail. The authors of this
paper present an educational concept that includes the different attitudes of a non-native or
labor migrant employee. Trust is one thing difficult to learn and to understand. We conclude
as the focal point of this the research the education on understanding the cultures and the
habits. The proposition is that within a small (family) business labor migrants can only be
employed when trust between the owners the native employees and the labor migrant employee
exists. To achieve this trust education of all employees in understanding the different cultures
is needed. We present the different education methodologies of our concept.
Keywords: Family Business, Labor migrant, Trust
1. INTORDUCTION
Family business is defined as being owned and managed by family members (Sharma,
Chrisman and Chua, 1997). Firms are usually led by family members across generations
(Miller, Steier and Miller, 2003). Family businesses are one of the most widespread
organisations globally, almost all firm’s started in this business form. (Lee, 2006). The majority
of family firms is in the range of small and medium size enterprises. Gagné Sharma and
DeMasis (2014) concluded, that SME size family businesses are both conceptually and
qualitatively different from the others mainly due to the influence of the family members.
Every family in business has a story to tell, a legend to live up to a tragedy to lament (Hamilton,
Cruz and Jack, 2017). Such elements not only shape the narratives that are shaped by members
of a family but have an influence on the career opportunities of the employees. The integration
of labor migrant employees in small family businesses is often a burden difficult to get over.
The problem we deal in this research is the concept of trust.

51st International Scientific Conference on Economic and Social Development – Rabat, 26-27 March 2020
351
Although it is a widely accepted fact that on national level labor migration is a positive
phenomenon, however, the challenges and the possible benefits of global labor migration on
small family businesses have not been investigated in detail. There is a gap in scholar literature
in our current understanding about this new trend.
2. THEORETICAL BACKGROUND
Family in business broadly relates to members of a family that engage in the foundation,
management and continuity of one or several family businesses. Entrepreneurial behavior can
be influenced by inherent characteristics of the management, such as age and tenure, as well as
by the degree of family influence in the firm, as indicated by the number of generations involved
in the business (Kellermanns et al, 2008). The attitude towards innovation is often an
overlooked characteristic. Previous articles (Pittino et al, 2013) have highlighted, that the
innovation literature virtually ignores the role of the family dimension in innovative strategies
and outcomes (Craig, Moores, 2006). The family business literature also devotes rather limited
attention to the analysis of innovation processes. As highlighted by Kraus, Harms, Fink (2011).
It is possible to recognize innovation in family business as a nascent stage that undergoing
significant development (De Massis, Frattini and Lichtenthaler, 2013). We will present, that
innovation is a key factor, where labor migrants can do their contribution to. On the other hand
one of the most researched fields within family businesses is the field of trust. There is a large
number of studies focusing on the impact of trust on performance and highlight, that trust is a
main competitive advantage of family businesses (Corbetta and Salvato, 2004). The capability
of creating the extra added value originating from the family tradition. In the existing literature,
this is defined as follows: Existence of trust in transactions lowers cost of such transactions, as
it allows financial agreements to be less dependent on formal regulations and facilitates
investment and innovations (Petrakis, Costis 2015). We conclude this fact as essential for SME
size family businesses to increase the firm’s performance. The reason behind this finding is
rooted in the human behavior and the client-supplier relation. Clients aim to select a supplier,
where the cost-benefit ratio is sufficient, and the risk of failure is minimized (EC 2010). Risk
of failure can be minimized using strict terms of references or based on personal relationship
between client and supplier. The literature (Kachaner, Stalk and Bloch 2012) highlights, that
during good economic times, family-run businesses don’t earn as much money as companies
with a more dispersed ownership structure but when the economy slumps, family business far
outshine their peers. The simple conclusion to be found in the literature is that family businesses
focus on resilience more than performance. We identify the chances for an SME size family
business to compete is the personal relationship building; and personal relationships to clients
strongly depends on the quality of employees. Trust in the family business literature has been
discussed so far, it has been used to explain the firm's performance. In our paper the main focus
is on trust between family and non-family or in some cases even labor migrant non-native
employees. The need for this research is underlined by the fact, that in recent years family
businesses has gone through an institunalization process, where not only business operation and
management was involved, but organizational culture as well. Based on a study (Evren 2017),
we found, that change int he organizational culture is a crucial issue and due to the lack of trust
family members are afraid of losing decisional power. This resistance of the family members
is burden in the overall process, and a burden in the evolution of the firm itself. Contents of
trust determine the family member’s perception of the employee’s trustworthiness in family
businesses. Azizi et al (2017) states, that family firm’s owners and managers must take steps to
strengthen the perception of the non-family employees to have positive attitudes, there is a need
for family members to get familiar with the requirements of trustworthiness and they need to
focus on what to demand, how to achieve a positive trustworthiness perception in order to pave
the road for the desired long term development for the firm.
51st International Scientific Conference on Economic and Social Development – Rabat, 26-27 March 2020
352
Sharma and Carney (2012) concluded, that family businesses have large growth potential as
they have the habit of developing intangible assets such as social capital trust and tacit
knowledge. Trust in general occurs when none of the parties expects the other to harm or abuse
(Rousseau et al 1998). Trust has an affective and a cognitive basis. Cognitive trust can be
achieved through integrity, credibility, responsibility, reliability and competence (Ribere and
Sitar 2010). Cognitive trust between family members and non-family employees in a family
can be achieved when development programs of the firm are focusing on the cognitive attitudes.
However, when it comes to non-native or labor migrant employees’ culture is the main factor
towards integrity. In this paper we, present why understanding the culture is important to
achieve cognitive trust.
3. ACTUALITY OF THE RESEARCH
The goal of this research is to examine how cognitive trust between family members and labor
migrant employees can be achieved. The reason we focus this research on labor migrants is
given by the fact that migrants accounted for 70% of the increase in the workforce in Europe
over the past ten years. Migrants fill important niches both in fast-growing and declining sectors
of the economy. There are several positive aspects in connection with labor migration such as
a) it boosts the working-age population, b) migrants arrive with skills and contribute to human
capital development of receiving countries or c) migrants also contribute to technological
progress and drive innovation. The question remains: how to maximize the benefits of migration
for SME size family businesses. The need for this research is underlined by the fact that the
rapid population ageing increases demand for migrants to make up shortfalls in the workforce.
The literature defines the direction of migration as coming from the Central / Eastern region of
Europe flowing towards the Northern and Western part (Friberg, Eldring, 2013). Another
source states, that in Europe the scope of labor mobility greatly increased within the EU/EFTA
zones following the EU enlargements of 2004 and 2007. This added to labor markets’
adjustment capacity. Recent estimates suggest that as much as a quarter of the asymmetric labor
market shock – that is occurring at different times and with different intensities across countries
– may have been absorbed by migration within a short period of time (Jauer et al, 2014). Central
Europe suffers from a significant asymmetric labor shock: the English-speaking generation is
leaving, and there is a significant migration from Eastern Europe, the Middle East and Asia. To
conclude there are few major challenges for Central European family businesses: a) the local
employee market is drying up as highly skilled, English speaking employees increasingly look
for jobs elsewhere. b) this asymmetry of migration must be balanced with labor migrant
workforces. Furthermore, beside overcoming labor shortage on the local labor market we see
significant advantages why a family business shall consider the integration of labor migrant
employees: a) innovations through exchange of culture b) support in understanding the needs
of new or undeveloped markets c) local knowledge increases the credibility of the firm and the
trust in foreign markets d) cost-effective work force
4. PROPOSITION
The objective of the research is to justify the hypothesis if understanding of the culture leads to
achieve cognitive trust in an SME size family business between family member and labor
migrant employee and to define the necessary educational concept. The study focuses on
Vibrocomp’s case and general educational concept. Vibrocomp is a family owned SME in the
engineering consultancy sector. The firm was founded in 1992 and remained a two-man firm
until 2002. The next generation took over the firm in 2002 and turned it into a globally known
multinational firm. The successful generational change in leadership that resulted in this
significant growth of the firm is not included in this paper, however, could be topic of a future
research.

51st International Scientific Conference on Economic and Social Development – Rabat, 26-27 March 2020
353
Built on the family knowledge, the firm currently deals with governments all over the world:
Hungary, EU (Brussels), Romania, Serbia, Shenzhen (China), Dubai, Federal UAE, and the
Qatar Royal Family. The language and the habits are different, but the goals are the same:
support their achievements in reducing pollution and increasing the well-being of residents,
hence maintaining the economic growth. In the following we present how to overcome the
differences mainly originating from the different culture of the labor migrants. It can be stated,
that on an SME size traditional conflicts between countries do play a significant role, which the
management must be aware of. In our case study we identified three reasons for the integration
of labor migrants. a) if a firm is entering foreign market, even if close to the home country b)
the start of larger expansion process: the firm expanded to 3 new countries in 2 new regions
outside the home continent. c) the employment of labor migrants in the home country due to
labor shortage. When a firm is small and only present on the national market in most cases it is
or at least it used to be enough to have native employees. Every firm must grow, expand in
order to grant long term success and to be an attractive employer. In the investigated case, when
Romania became part of the European Union the decision was made to open a subsidiary to
serve the Romanian market. With the opening the number of employees immediately increased
by +20% as new employees from Romania joined the firm. Family members being afraid from
the changes, required all employees to speak beside Romanian also the native language of the
firm. The official communication in the firm remained the native language of the family. Driven
by the fact, that the whole firm still speaks the common native language of the family no
dedicated development trainings were designed to meet the requirements of being a
multicultural bi-national firm. Only the manager received training in the culture and habits of
the new country. The basic educational concept was enough for one country but had to be
further developed when the firm started its larger expansion process. In our case the firm
continuously opened new subsidiaries as follows: 1. Dubai, UAE, 2. Shenzhen, China, 3. Doha
Qatar. During this expansion not only, employees from different countries but from
significantly different religions, habits, political background and time-zones joined. Hard skills
are the technical expertise and knowledge needed for a job. Soft skills are interpersonal
qualities, also known as people skills, and personal attributes that one possesses (Robles, 2012).
As employer, one considers soft skills as very important attribute in job applicants. The firm
introduced an innovative integration program. Main innovations of the educational concept
were a) the integration program was mandatory for the new employees as well as for the existing
ones; b) skills like ethics or knowledge about different cultures religions have been included
and trained as a hard skill. As long employees from different cultures are located in different
countries and/or continents communication between the employees is mostly limited to written
communications. Personal interaction between employees from different cultural origin is
limited to division leaders and the management. In their case mentoring was applied to have
even better understanding of the different culture originated decision processes. Nowadays as
described earlier it is not necessary anymore to be present on the international market to face
the challenges of integrating employees from different cultures. As a reason of migration all
firms at some stage have to start to employ non-native employees. Focal points of the
educational concept are a) differentiated career development for native and labor migrants b)
include the culture in the development of all employees c) provide consulting and mentoring to
increase the possibility of labor migrants to be leaders in their respective field and being
accepted by the native employees d) change the official communication from the native
language to English, giving support to all those who have difficulties e) introduce global trends
and local values into the project-based approach. The above-mentioned educational concept
will result in cognitive trust between family members and employees.

51st International Scientific Conference on Economic and Social Development – Rabat, 26-27 March 2020
354
Based on this cognitive trust we propose a successful integration of labor migrants even on an
SME size family business level. Furthermore, the archived cognitive trust will result in
employees willing to stay longer at the firm which reduces the time and the cost spent on
acquisitions.
5. PROPOSED RESEARCH METHOD
In this paper we presented the problem and a case study based concept to solve the problem. In
this chapter we will present the proposed research method to a) to prove the hypothesis b) to
generalize the concept. In most academical research the main question is to consider whether
sampling is needed. In some cases, it is possible to conduct the research on every group
member. In our case it is impossible to have an analysis of every SME size family business. We
plan to generalize the concept based on a sample research. In our case the entire population will
be reduced to samples with the following attributes: a) Hungarian Firms b) Firms with
employees less than 100. The second research question is to conduct a) semi structured
interviews with the owners/managers of the sampled companies or b) prepare a questionnaire-
based survey. The main advantages of semi-structured interviews are: they are carried out with
an open framework to allow focused, bi-directional conversational. Semi structured interviews
are a good tool to give and receive information. Questions are not formulated ahead; the semi-
structured interview starts with general questions. Questions on the focal points are created
during the semi-structured interview, in a way to allow flexibility for both parties. The main
disadvantage comes from this flexibility, as it might lessen reliability and honesty, while
answers are difficult to analyze and compare. A secondary disadvantage is the high time and
cost of the survey and tend to have a geographical limitation. Opposite to semi structured
interviews web-based surveys are cost effective. Those surveys are practical and an easy way
to gather data. The survey can be put on a website or sent directly to the target sample group.
Results are already in an electronic format, which allows easy analysis without digitizing data
first and are quickly collected and evaluated with online tools provided by the survey host.
Web-based surveys have no geographical limitations, online one can distribute the questions to
anyone, anywhere in the world. However, the necessity of this opportunity must be reconsidered
when defining the target sample group. It is an important aspect to consider cultural differences
when conducting cross-national research. Web-based surveys can be designed to allow
respondents to maintain their anonymity. With this type of questionnaire results can be expected
based on the most honest answers, where sometimes sensitive data is included. Respondents
will often answer more truthfully, based on the literature research has shown that having a
researcher present can lead to less honest and more socially desirable answers. Respondents,
willing to answer can take their time to. A point of discussion is the length of the questionnaire
some literature state, that asking as many questions as possible is an advantage, however the
authors believe to keep individual questionnaires short, straight to the point, where respondents
are willing to focus on the answers. Among the disadvantages of web-based surveys is the lack
of conscientious responses, there is no tool to be sure respondents have thought the question
through before responding. The only way to overcome this disadvantage is to make the
questions simple and the survey short. Furthermore, there is the disadvantage of differences in
the interpretation of the questions. compared to personal interviews the researcher here has no
possibility to explain the questionnaire and ensure full understanding. Respondents might not
understand the meaning of some questions; hence results can be very subjective. Furthermore,
if the researcher is not present it is hard to capture emotional responses or feelings of the
targeted individuals. As with most research, bias is an issue. Proclivities lead to inaccuracies in
the result data, caused by the imbalance of respondents who see the topic in an overly positive
or negative light. Pre-screening with a few indirect questions will remove those results from the
database.

51st International Scientific Conference on Economic and Social Development – Rabat, 26-27 March 2020
355
Based on the above we will continue the research with a web-based questionnaire. The
questionnaire will consist of of a quantitative (firm’s performance, career development training
budget allocations) and a qualitative (educational concepts, cultural habits, willingness of cross-
cultural employment) part. Quantitative methods use numbers for interpreting data (Maki,
2004). Large numbers of cases can be analysed using the quantitative approach, and this type
of design is deductive in nature, often stemming from a preconceived hypothesis (Patton, 2002).
Results can be generalized, and situations make this type of assessment expandable. Although
assessment can be carried out with the rigor of traditional research, including a hypothesis and
results that are statistically significant, this is not a necessary component of programmatic
outcomes-based assessment. It is not essential to have a certain sample size unless the scope of
your assessment is on the institutional level. On the other hand, according to Denzin and
Lincoln (2011), qualitative research is multimethod in focus, involving an interpretive,
naturalistic approach to its subject matter. Upcraft and Schuh (1996) states, that qualitative
method is the detailed description of situations, events, people, interactions, and observed
behaviours, the use of direct quotations from people about their experiences, attitudes, beliefs,
and thoughts. Qualitative assessment is focused on understanding how people make meaning
of and experience their environment or world (Patton, 2002). Qualitative assessment is narrow
in scope and only applicable to specific situations and experiences. This type of approach is not
recommended for generalization to broad situations. Different from quantitative research,
qualitative research employs the researcher as the primary means of data collection. In opposite
to quantitative assessment, the qualitative approach is inductive, leading to the development or
creation of a theory rather than the testing of a preconceived theory or hypothesis. To verify
our concept, we defined a method to measure and to evaluate the success of career planning
and development in SME size family business. We plan to apply the mixed approach in order
to verify our proposition.
6. LIMITATIONS, FUTURE RESEARCH
The research conducted so fare is based on the findings of a case study from a Hungarian family
owned SME. However due to the setup: 2 main shareholders from the same family, the size:
currently about 50 employees in 4 different countries and the sector: engineering consultancy
the authors believe that the findings can be generalized for similar companies. In the future
questionnaire-based research as described above will be conducted in order to generalize the
concept.
7. CONLCUSION
The focus of this research is on labor migrants given by the fact that migrants accounted for
70% of the increase in the workforce in Europe over the past ten years. Due to the current lack
of workforce SME size family businesses are facing the challenges of employing labor migrants
from different countries and cultures. Family businesses are based on trust, trust is one thing
difficult to learn and to understand. Within a small (family) business labor migrants can only
be employed when trust between the owners the native employees and the labor migrant
employee exists. Cognitive trust can be achieved through integrity, credibility, responsibility,
reliability and competence. Cognitive trust between family members and non-family employees
in a family can be achieved when development programs of the firm are focusing on the
cognitive attitudes. We conclude as the focal point of this the research the education on
understanding the cultures and the habits. The authors have presented based on a case study,
how to achieve cognitive trust in an SME size family business between family member and
labor migrant employee. The presented differentiated educational concept in understanding the
culture resulted in cognitive trust between family members and employees. Based on it a
successful integration of labor migrants even on an SME size family business level is possible.

51st International Scientific Conference on Economic and Social Development – Rabat, 26-27 March 2020
356
Furthermore, the archived cognitive trust will result in employees willing to stay longer at the
firm which reduces the time and the cost spent on acquisitions. In the future questionnaire-
based research as described above will be conducted to generalize the concept.
LITERATURE:
1. Craig, J. B. L and Moores, K. (2006). A 10-year longitudinal investigation of strategy,
systems and environment on innovation in family business. Family Business Review, Vol.
19, No. 1, pp.1–10.
2. De Massis, A., Frattini, F. and Lichtenthaler, U. (2013). Research on technological
innovation in family business: present debates and future directions, Family Business
Review, Vol. 26, No. 1, pp. 10–31.
3. EC Expert Group Report (2010). Risk management in the procurement of innovation.
Concepts and empirical evidence in the European Union. EUR 24229 EN Directorate-
General for Research European Research Area
4. Friberg, J.H. and Eldring, L. (2013). Labour migrants from Central and Eastern Europe in
the Nordic countries. Patterns of migration, working conditions and recruitment practices.
Tema Nord 2013: 570 © Nordic Council of Ministers 2013.
http://dx.doi.org/10.6027/TN2013-570
5. Hamilton, E. E., Cruz, A. F. and Jack, S. L. (2017). Re-framing the status of narrative in
family business research: Towards an understanding of families in business. Journal of
Family Business Strategy 8 (2017) 3–12
6. Jauer, J., Liebig, T., Martin, J. and Puhani, P. (2014). Migration as an Adjustment
Mechanism in the Crisis? A Comparison of Europe and the United States, OECD Social,
Employment and Migration Working Papers, No. 155, OECD Publishing, Paris,
http://dx.doi.org/10.1787/5jzb8p51gvhl-en.
7. Kachaner, N., Stalk, G. and Bloch, A. (2012). What You Can Learn from Family Business,
Harward Business Review, November 2012
8. Kellermanns, F. W., Eddleston, K. A., Barnett, T. and Pearson, A. (2008). An Exploratory
Study of Family Member. Characteristics and Involvement: Effects on Entrepreneurial
Behaviour in the Family Firm. Family Business Review, Volume 21(1): 1–14.
9. Kraus, S., Harms, R. and Fink, M. (2011). Family business research: sketching a research
field, International Journal of Entrepreneurship and Innovation Management, 13(1): .32–
47.
10. Maki, F. (2004). The empire of capital and the remaking of centre-periphery relations. Third
World Quarterly 25(1):149-168.
11. Miller, D., Steier, L. and Le Breton-Miller, I. (2003). Lost in time: Intergenerational
succession, change, and failure in family business. Journal of Business Venturing, 18(4),
513–531. http://dx.doi.org/10.1016/S0883-9026(03)00058-2.
12. Patton, M. Q. (2002). Qualitative Research & Evaluation Methods, Sage Publications
13. Petrakis, P. E. and Costis, P. C. (2015). The Role of Knowledge and Trust in SMEs. Journal
of the Knowledge Economy , 6(1): 105–124.
14. Pittino, D., Visintin, F.,. Bau', M. and Mazzurana, P. (2013). Collabourative technology
strategies and innovation in family business’, Int. J. Entrepreneurship and Innovation
Management, Vol. 17, Nos. 1/2/3: 8–27.
15. Robles, M. M. (2012). Executive Perceptions of the Top 10 Soft Skills Needed in Today’s
Workplace. Business and Professional Communication Quarterly, 75(4): 453-465.
https://doi.org/10.1177/1080569912460400
16. Sharma, P., Chrisman, J. J. and Chua, J. H. (1997). Strategic management of the family
business: Past research and future challenges. Family Business Review, 10(1), 1–35.
http://dx.doi.org/10.1111/j.1741-6248.1997.00001.x.

51st International Scientific Conference on Economic and Social Development – Rabat, 26-27 March 2020
357
17. Upcraft, M.L., Schuh, J.H. (1996). Assessment in student affairs: A guide for practitioners.
San Francisco: Jossy-Bass

51st International Scientific Conference on Economic and Social Development – Rabat, 26-27 March 2020
358
ANALYSIS OF THE IMPACT OF MARKETING ONLINE AND
OFFLINE COMMUNICATION CHANNELS ON CUSTOMER
PURCHASING BEHAVIOR
Peter Jucha
University of Zilina, Zilina, Slovakia
Simona Jaculjakova
University of Zilina, Zilina, Slovakia
Dominik Laitkep
University of Zilina, Zilina, Slovakia
Tatiana Corejova
University of Zilina, Zilina, Slovakia
ABSTRACT
At present, marketing communication is important in the business sector, leading to the
necessary promotion of businesses and their products or services, as well as to the acquisition
of potential customers. Among other things, appropriate marketing communication can lead to
a better position of the company among other market participants and increase sales and profit.
In the theoretical part of the article we focused on defining the business sector and marketing
communication, which is divided into online and offline forms of communication channels. We
focused on the different forms of communication and the different types of communication
channels currently used by businesses. We compared their positives and negatives as well as
different ways of using them and their impact on potential customers. In the analysis of the
current situation, we dealt with secondary research, which was focused on online and offline
marketing communication and communication channels in the business environment. From the
online environment, the paper focuses mainly on social networks, influencers and business
presentations via websites. From the offline environment, the article focuses on classic ads in
magazines, newspapers, billboards, television and radio. The practical part was devoted to
primary research, which was focused on the identification of communication channels and to
what extent they influence the purchasing behavior of customers in the Slovak Republic.
Through factor analysis we identified two different factors. The first factor reflects a low degree
of influence on customer buying behavior through influencers, offline advertising, youtube
advertising, and newsletters. The second factor, on the other hand, expresses a high degree of
influence on the social purchasing behavior of customers, the quality of the content of social
contributions as well as the design of the websites of specific companies
Keywords: Marketing, Marketing communication, Offline communication channels, Online
communication channels
1. INTRODUCTION
The business environment can be characterized as the environment surrounding the business
entity and affecting its business activity. Furthermore, it is necessary to emphasize its close
connection with the competitive environment, but also with the governing institutions that
determine the rules and conditions of the business environment (STRÁŽOVSKÁ a kol., 2008).
51st International Scientific Conference on Economic and Social Development – Rabat, 26-27 March 2020
359
When defining the business environment within the European Union, we can talk about the
business environment of the 27 EU Member States, which is influenced by EU legislation,
which implies the effort to create a single internal market (eúsav)2.To promote the business
environment, it is necessary to conduct marketing communications to best promote individual
businesses and their products. Marketing communication is one of the four basic elements of
the marketing mix.x The 21st century is an impulse for market players to accelerate the pace of
innovation and to make full use of all management and marketing tools, including marketing
communication. 3. Marketing communication is an important part of modern marketing, which
currently requires more than just to produce a good product or to attractively evaluate or make
it available to the target consumer. The essence of marketing communication is not only to
inform customers about products, about their utility properties, the area of use etc., but to know
their needs and requirements and to respond appropriately to them.4 For this reason, appropriate
marketing communications can lead to a better position in a given market, bring new potential
customers and also increase sales and profit. Given the focus of the article, it was necessary to
analyze electronic marketing, which is focused on online and offline forms of communication
means of marketing communication. In business practice, interaction often involves offline and
online marketing techniques being used to generate a constant stream of interested recipients
(e.g. website visitors).5 Online marketing refers to certain Internet activities that lead to the sale
of goods or services. The goal of online marketing is to increase traffic to potential customers
on each company's website. In order for online marketing to be carried out correctly, individual
customers must reach the forms of online marketing at the right time on the right device. 6
Subsequently, offline marketing refers to marketing methods that are implemented outside the
Internet. The goal of offline marketing is to engage, generate demand for a product or service
and reach as many potential customers as possible.9 Despite the development of offline
technology, marketing remained unchanged. In the following table no. 1. we can see the most
used online and offline communication channels. 7, 8
Table following on the next page
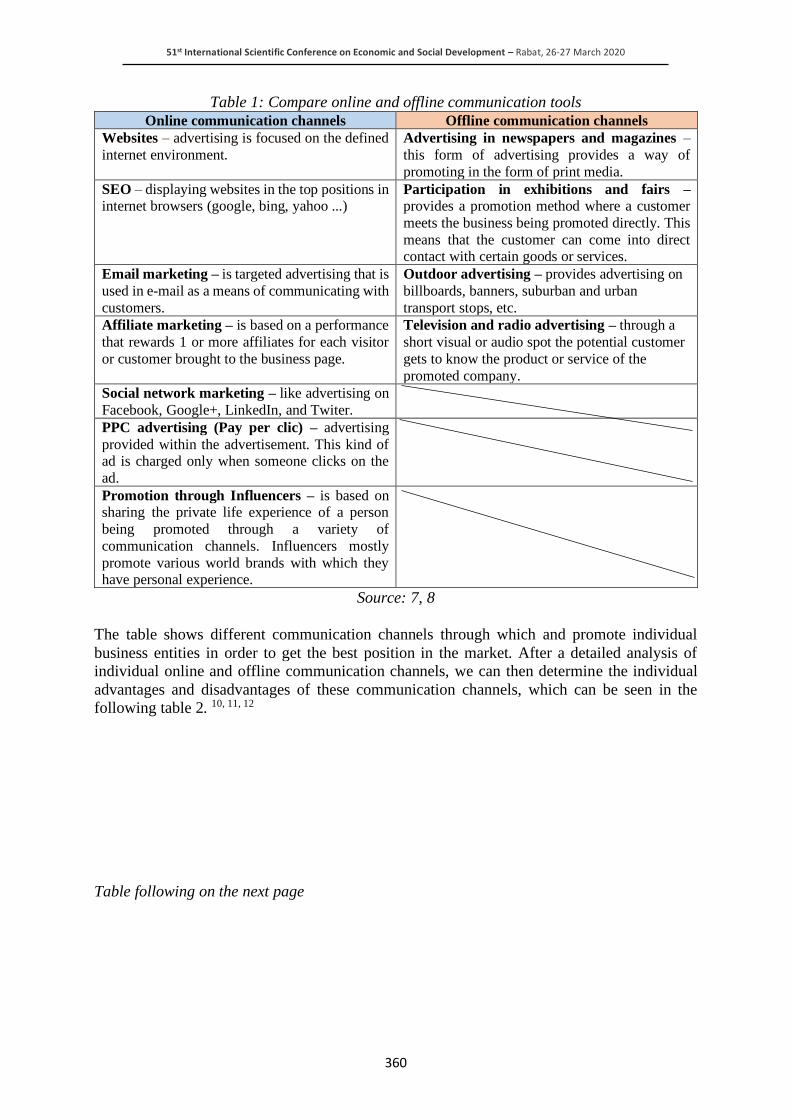
51st International Scientific Conference on Economic and Social Development – Rabat, 26-27 March 2020
360
Table 1: Compare online and offline communication tools
Online communication channels Offline communication channels
Websites – advertising is focused on the defined
internet environment. Advertising in newspapers and magazines –
this form of advertising provides a way of
promoting in the form of print media.
SEO – displaying websites in the top positions in internet browsers (google, bing, yahoo ...)
Participation in exhibitions and fairs –
provides a promotion method where a customer
meets the business being promoted directly. This
means that the customer can come into direct contact with certain goods or services.
Email marketing – is targeted advertising that is
used in e-mail as a means of communicating with
customers.
Outdoor advertising – provides advertising on
billboards, banners, suburban and urban
transport stops, etc.
Affiliate marketing – is based on a performance
that rewards 1 or more affiliates for each visitor
or customer brought to the business page.
Television and radio advertising – through a
short visual or audio spot the potential customer
gets to know the product or service of the
promoted company.
Social network marketing – like advertising on
Facebook, Google+, LinkedIn, and Twiter.
PPC advertising (Pay per clic) – advertising
provided within the advertisement. This kind of ad is charged only when someone clicks on the
ad.
Promotion through Influencers – is based on sharing the private life experience of a person
being promoted through a variety of
communication channels. Influencers mostly
promote various world brands with which they have personal experience.
Source: 7, 8
The table shows different communication channels through which and promote individual
business entities in order to get the best position in the market. After a detailed analysis of
individual online and offline communication channels, we can then determine the individual
advantages and disadvantages of these communication channels, which can be seen in the
following table 2. 10, 11, 12
Table following on the next page
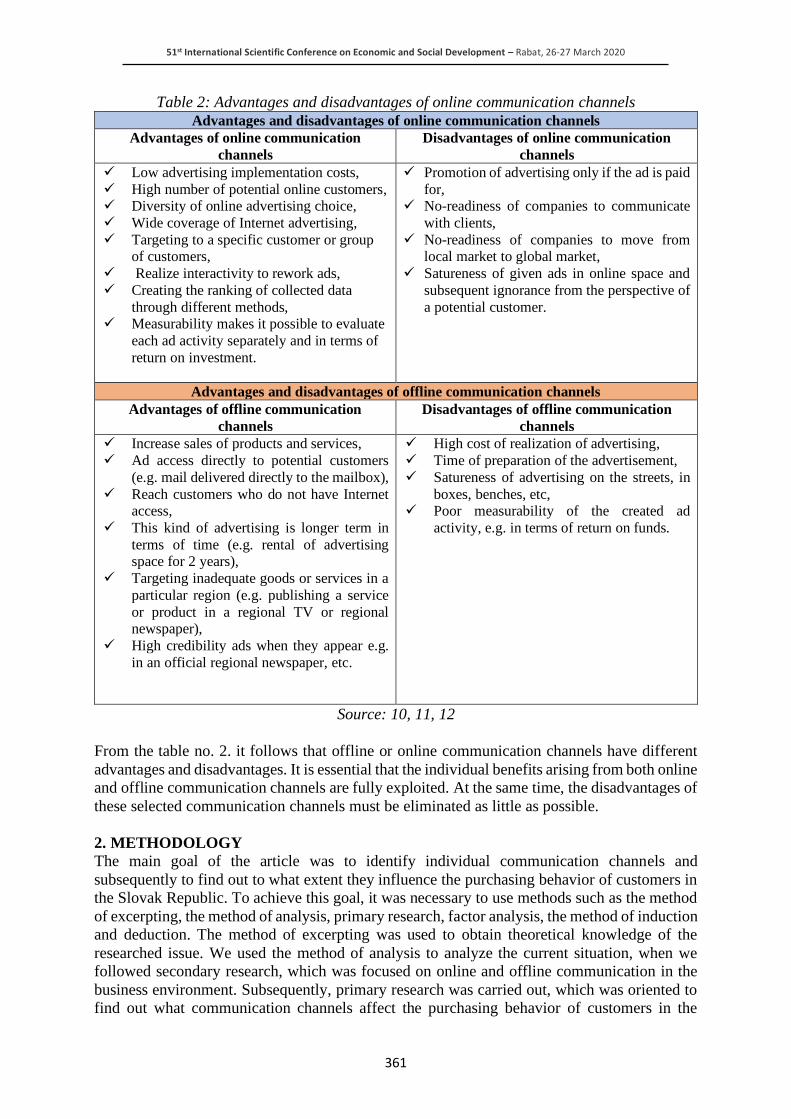
51st International Scientific Conference on Economic and Social Development – Rabat, 26-27 March 2020
361
Table 2: Advantages and disadvantages of online communication channels
Advantages and disadvantages of online communication channels
Advantages of online communication
channels
Disadvantages of online communication
channels
✓ Low advertising implementation costs,
✓ High number of potential online customers, ✓ Diversity of online advertising choice,
✓ Wide coverage of Internet advertising,
✓ Targeting to a specific customer or group of customers,
✓ Realize interactivity to rework ads,
✓ Creating the ranking of collected data
through different methods, ✓ Measurability makes it possible to evaluate
each ad activity separately and in terms of
return on investment.
✓ Promotion of advertising only if the ad is paid
for, ✓ No-readiness of companies to communicate
with clients,
✓ No-readiness of companies to move from local market to global market,
✓ Satureness of given ads in online space and
subsequent ignorance from the perspective of
a potential customer.
Advantages and disadvantages of offline communication channels
Advantages of offline communication
channels
Disadvantages of offline communication
channels
✓ Increase sales of products and services,
✓ Ad access directly to potential customers
(e.g. mail delivered directly to the mailbox),
✓ Reach customers who do not have Internet access,
✓ This kind of advertising is longer term in
terms of time (e.g. rental of advertising space for 2 years),
✓ Targeting inadequate goods or services in a
particular region (e.g. publishing a service
or product in a regional TV or regional newspaper),
✓ High credibility ads when they appear e.g.
in an official regional newspaper, etc.
✓ High cost of realization of advertising,
✓ Time of preparation of the advertisement,
✓ Satureness of advertising on the streets, in
boxes, benches, etc, ✓ Poor measurability of the created ad
activity, e.g. in terms of return on funds.
Source: 10, 11, 12
From the table no. 2. it follows that offline or online communication channels have different
advantages and disadvantages. It is essential that the individual benefits arising from both online
and offline communication channels are fully exploited. At the same time, the disadvantages of
these selected communication channels must be eliminated as little as possible.
2. METHODOLOGY
The main goal of the article was to identify individual communication channels and
subsequently to find out to what extent they influence the purchasing behavior of customers in
the Slovak Republic. To achieve this goal, it was necessary to use methods such as the method
of excerpting, the method of analysis, primary research, factor analysis, the method of induction
and deduction. The method of excerpting was used to obtain theoretical knowledge of the
researched issue. We used the method of analysis to analyze the current situation, when we
followed secondary research, which was focused on online and offline communication in the
business environment. Subsequently, primary research was carried out, which was oriented to
find out what communication channels affect the purchasing behavior of customers in the
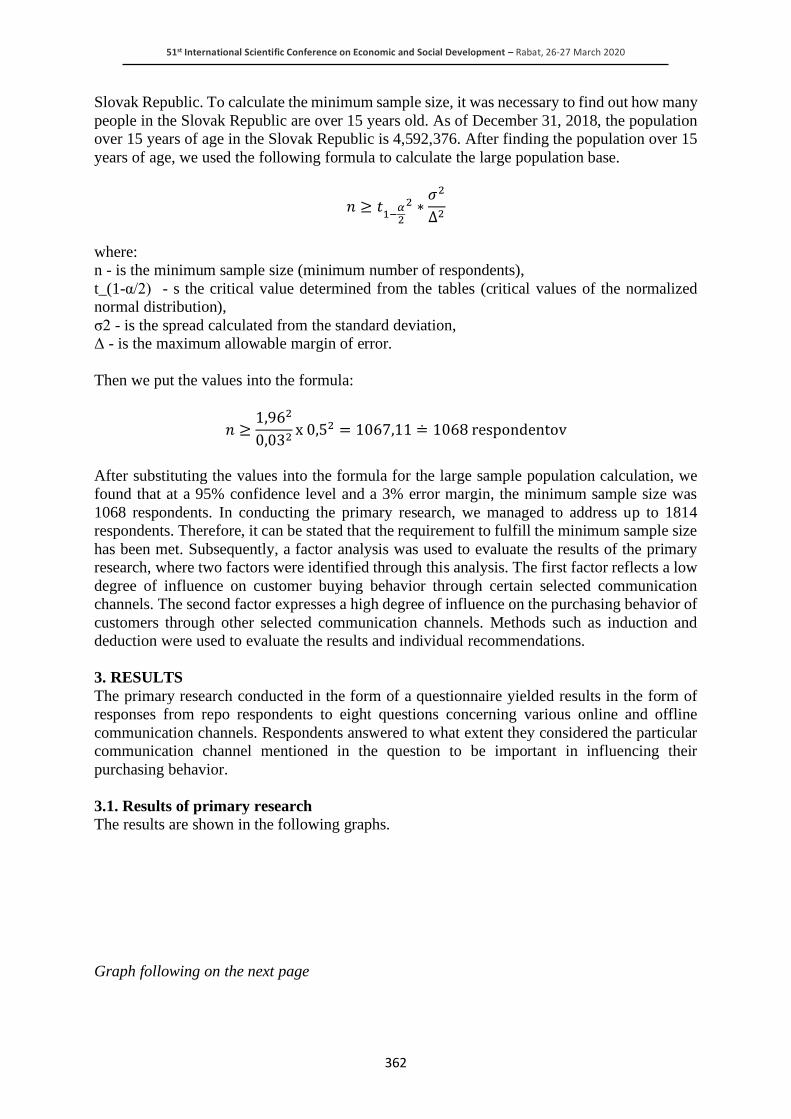
51st International Scientific Conference on Economic and Social Development – Rabat, 26-27 March 2020
362
Slovak Republic. To calculate the minimum sample size, it was necessary to find out how many
people in the Slovak Republic are over 15 years old. As of December 31, 2018, the population
over 15 years of age in the Slovak Republic is 4,592,376. After finding the population over 15
years of age, we used the following formula to calculate the large population base.
𝑛 ≥ 𝑡1−
𝛼2
2 ∗𝜎2
∆2
where:
n - is the minimum sample size (minimum number of respondents),
t_(1-α/2) - s the critical value determined from the tables (critical values of the normalized
normal distribution),
σ2 - is the spread calculated from the standard deviation,
Δ - is the maximum allowable margin of error.
Then we put the values into the formula:
𝑛 ≥1,962
0,032x 0,52 = 1067,11 ≐ 1068 respondentov
After substituting the values into the formula for the large sample population calculation, we
found that at a 95% confidence level and a 3% error margin, the minimum sample size was
1068 respondents. In conducting the primary research, we managed to address up to 1814
respondents. Therefore, it can be stated that the requirement to fulfill the minimum sample size
has been met. Subsequently, a factor analysis was used to evaluate the results of the primary
research, where two factors were identified through this analysis. The first factor reflects a low
degree of influence on customer buying behavior through certain selected communication
channels. The second factor expresses a high degree of influence on the purchasing behavior of
customers through other selected communication channels. Methods such as induction and
deduction were used to evaluate the results and individual recommendations.
3. RESULTS
The primary research conducted in the form of a questionnaire yielded results in the form of
responses from repo respondents to eight questions concerning various online and offline
communication channels. Respondents answered to what extent they considered the particular
communication channel mentioned in the question to be important in influencing their
purchasing behavior.
3.1. Results of primary research
The results are shown in the following graphs.
Graph following on the next page

51st International Scientific Conference on Economic and Social Development – Rabat, 26-27 March 2020
363
Graph 1: The importance of social networks
Source: Author
Graph 2: The importance of quality of the content on social posts
Source: Author
Graph 3: The importance of influencers
Source: Author
257 (14,2%) 269 (14,8%)
498 (27,5%) 505 (27,9%)
284 (15,7%)
0
100
200
300
400
500
600
(1 – Irrelevant , 5 – Important)
Num
ber
of
resp
on
den
ts
Options for answering the question
1. How important do you consider social networks as a inpulse for
purchase of services / goods??
1 2 3 4 5
196 (10,8%)
304 (16,8%)
497 (27,4%)
603 (33,3%)
213 (11,7%)
0
100
200
300
400
500
600
700
(1 - Absolutely no 5 - Absolutely yes)
Nu
mber
of
resp
on
den
ts
Options for answering the question
2. Would the quality content of posts posted on the social network of the
selected business affect your purchasing behavior?
1 2 3 4 5
1077 (59,4%)
325 (17,9%)224 (12,4%)
129 (7,1%)58 (3,2%)
0
200
400
600
800
1000
1200
(1 – Irrelevant , 5 – Important)
Num
ber
of
resp
on
den
ts
Options for answering the question
3. Is it important for you to have an “influencer” associated with
business?
1 2 3 4 5

51st International Scientific Conference on Economic and Social Development – Rabat, 26-27 March 2020
364
Graph 4: The importance of sales actions
Source: Author
Graph 5: The importance of website design
Source: Author
Graph 6: The importance of offline advertising
Source: Author
434 (23,9%)
354 (19,5%)
444 (24,5%)
372 (20,5%)
209 (11,5%)
0
50
100
150
200
250
300
350
400
450
500
(1 - Absolutely no 5 - Absolutely yes)
Num
ber
of
rspon
den
ts
Options for answering a question
4. Are sales actions important for you?
1 2 3 4 5
143 (7,9%)191 (10,59%)
415 (22,9%)
664 (36,6%)
400 (22,1%)
0
100
200
300
400
500
600
700
(1 - Absolutely no 5 - Absolutely yes)
Nu
mber
of
rsp
on
den
ts
Options for answering a question
5. Is website design important for you?
1 2 3 4 5
551 (30,4%)511 (28,2%)
482 (26,6%)
202 (11,1%)
67 (3,7%)
0
100
200
300
400
500
600
(1 - Absolutely no 5 - Absolutely yes)
Num
ber
of
rspon
den
ts
Options for answering a question
6. Is offline advertising important for you?
1 2 3 4 5

51st International Scientific Conference on Economic and Social Development – Rabat, 26-27 March 2020
365
Graph 7: The imortance of youtube business activities
Source: Author
Grpah 8: The importance of newsletter
Source: Author
3.2. Factor analysis
In the next part the data presented in the graphs are processed by factor analysis.
Table following on the next page
785 (43,3%)
414 (22,8%) 385 (21,2%)
173 (9,5%)
56 (3,1%)
0
100
200
300
400
500
600
700
800
900
(1 - Absolutely no 5 - Absolutely yes)
Num
ber
of
rspon
den
ts
Options for answering a question
7. Are youtube business activities important for you?
1 2 3 4 5
866 (47,8%)
379 (20,9%) 387 (21,3%)
132 (7,3%)
49 (2,7%)
0
100
200
300
400
500
600
700
800
900
1000
(1 - Absolutely no 5 - Absolutely yes)
Nu
mber
of
rsp
on
den
ts
Options for answering a question
8. Are newsletters important for you?
1 2 3 4 5
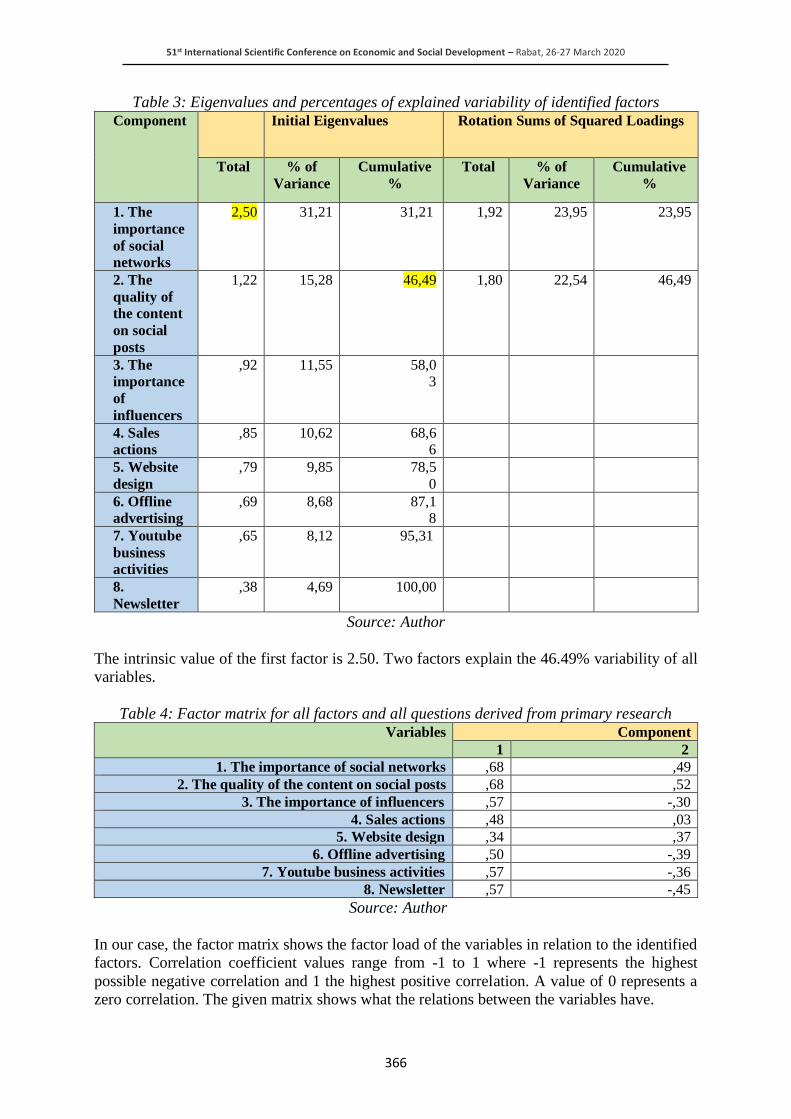
51st International Scientific Conference on Economic and Social Development – Rabat, 26-27 March 2020
366
Table 3: Eigenvalues and percentages of explained variability of identified factors
Component Initial Eigenvalues Rotation Sums of Squared Loadings
Total % of
Variance
Cumulative
%
Total % of
Variance
Cumulative
%
1. The
importance
of social
networks
2,50 31,21 31,21 1,92 23,95 23,95
2. The
quality of
the content
on social
posts
1,22 15,28 46,49 1,80 22,54 46,49
3. The
importance
of
influencers
,92 11,55 58,03
4. Sales
actions
,85 10,62 68,66
5. Website
design
,79 9,85 78,5
0
6. Offline
advertising
,69 8,68 87,18
7. Youtube
business
activities
,65 8,12 95,31
8.
Newsletter
,38 4,69 100,00
Source: Author
The intrinsic value of the first factor is 2.50. Two factors explain the 46.49% variability of all
variables.
Table 4: Factor matrix for all factors and all questions derived from primary research
Variables Component
1 2
1. The importance of social networks ,68 ,49
2. The quality of the content on social posts ,68 ,52
3. The importance of influencers ,57 -,30
4. Sales actions ,48 ,03
5. Website design ,34 ,37
6. Offline advertising ,50 -,39
7. Youtube business activities ,57 -,36
8. Newsletter ,57 -,45
Source: Author
In our case, the factor matrix shows the factor load of the variables in relation to the identified
factors. Correlation coefficient values range from -1 to 1 where -1 represents the highest
possible negative correlation and 1 the highest positive correlation. A value of 0 represents a
zero correlation. The given matrix shows what the relations between the variables have.
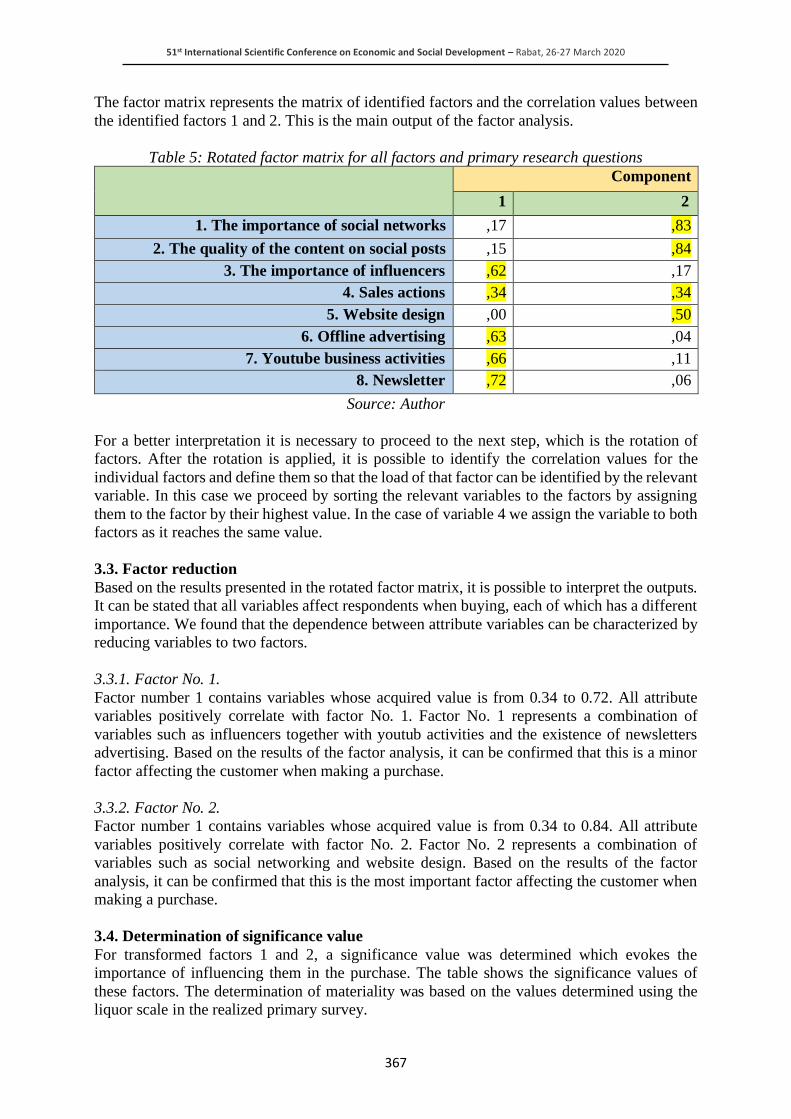
51st International Scientific Conference on Economic and Social Development – Rabat, 26-27 March 2020
367
The factor matrix represents the matrix of identified factors and the correlation values between
the identified factors 1 and 2. This is the main output of the factor analysis.
Table 5: Rotated factor matrix for all factors and primary research questions
Component
1 2
1. The importance of social networks ,17 ,83
2. The quality of the content on social posts ,15 ,84
3. The importance of influencers ,62 ,17
4. Sales actions ,34 ,34
5. Website design ,00 ,50
6. Offline advertising ,63 ,04
7. Youtube business activities ,66 ,11
8. Newsletter ,72 ,06
Source: Author
For a better interpretation it is necessary to proceed to the next step, which is the rotation of
factors. After the rotation is applied, it is possible to identify the correlation values for the
individual factors and define them so that the load of that factor can be identified by the relevant
variable. In this case we proceed by sorting the relevant variables to the factors by assigning
them to the factor by their highest value. In the case of variable 4 we assign the variable to both
factors as it reaches the same value.
3.3. Factor reduction
Based on the results presented in the rotated factor matrix, it is possible to interpret the outputs.
It can be stated that all variables affect respondents when buying, each of which has a different
importance. We found that the dependence between attribute variables can be characterized by
reducing variables to two factors.
3.3.1. Factor No. 1.
Factor number 1 contains variables whose acquired value is from 0.34 to 0.72. All attribute
variables positively correlate with factor No. 1. Factor No. 1 represents a combination of
variables such as influencers together with youtub activities and the existence of newsletters
advertising. Based on the results of the factor analysis, it can be confirmed that this is a minor
factor affecting the customer when making a purchase.
3.3.2. Factor No. 2.
Factor number 1 contains variables whose acquired value is from 0.34 to 0.84. All attribute
variables positively correlate with factor No. 2. Factor No. 2 represents a combination of
variables such as social networking and website design. Based on the results of the factor
analysis, it can be confirmed that this is the most important factor affecting the customer when
making a purchase.
3.4. Determination of significance value
For transformed factors 1 and 2, a significance value was determined which evokes the
importance of influencing them in the purchase. The table shows the significance values of
these factors. The determination of materiality was based on the values determined using the
liquor scale in the realized primary survey.
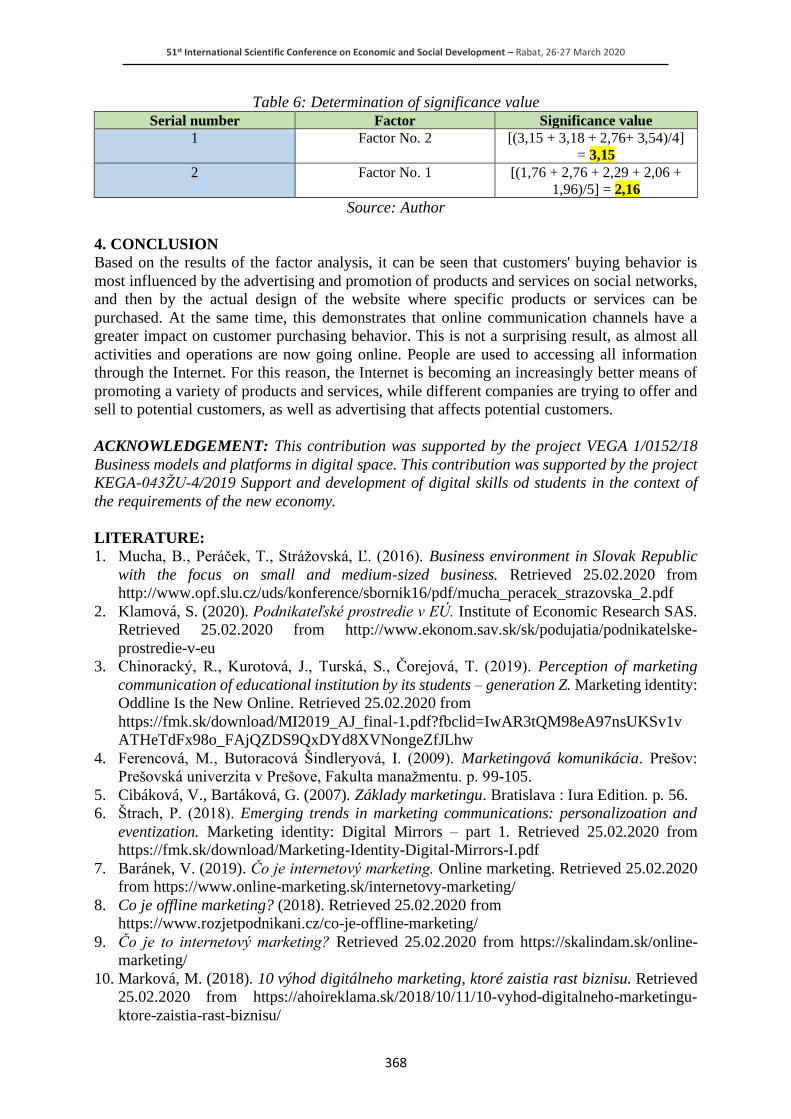
51st International Scientific Conference on Economic and Social Development – Rabat, 26-27 March 2020
368
Table 6: Determination of significance value
Serial number Factor Significance value
1 Factor No. 2 [(3,15 + 3,18 + 2,76+ 3,54)/4]
= 3,15
2 Factor No. 1 [(1,76 + 2,76 + 2,29 + 2,06 +
1,96)/5] = 2,16
Source: Author
4. CONCLUSION
Based on the results of the factor analysis, it can be seen that customers' buying behavior is
most influenced by the advertising and promotion of products and services on social networks,
and then by the actual design of the website where specific products or services can be
purchased. At the same time, this demonstrates that online communication channels have a
greater impact on customer purchasing behavior. This is not a surprising result, as almost all
activities and operations are now going online. People are used to accessing all information
through the Internet. For this reason, the Internet is becoming an increasingly better means of
promoting a variety of products and services, while different companies are trying to offer and
sell to potential customers, as well as advertising that affects potential customers.
ACKNOWLEDGEMENT: This contribution was supported by the project VEGA 1/0152/18
Business models and platforms in digital space. This contribution was supported by the project
KEGA-043ŽU-4/2019 Support and development of digital skills od students in the context of
the requirements of the new economy.
LITERATURE:
1. Mucha, B., Peráček, T., Strážovská, Ľ. (2016). Business environment in Slovak Republic
with the focus on small and medium-sized business. Retrieved 25.02.2020 from
http://www.opf.slu.cz/uds/konference/sbornik16/pdf/mucha_peracek_strazovska_2.pdf
2. Klamová, S. (2020). Podnikateľské prostredie v EÚ. Institute of Economic Research SAS.
Retrieved 25.02.2020 from http://www.ekonom.sav.sk/sk/podujatia/podnikatelske-
prostredie-v-eu
3. Chinoracký, R., Kurotová, J., Turská, S., Čorejová, T. (2019). Perception of marketing
communication of educational institution by its students – generation Z. Marketing identity:
Oddline Is the New Online. Retrieved 25.02.2020 from
https://fmk.sk/download/MI2019_AJ_final-1.pdf?fbclid=IwAR3tQM98eA97nsUKSv1v
ATHeTdFx98o_FAjQZDS9QxDYd8XVNongeZfJLhw
4. Ferencová, M., Butoracová Šindleryová, I. (2009). Marketingová komunikácia. Prešov:
Prešovská univerzita v Prešove, Fakulta manažmentu. p. 99-105.
5. Cibáková, V., Bartáková, G. (2007). Základy marketingu. Bratislava : Iura Edition. p. 56.
6. Štrach, P. (2018). Emerging trends in marketing communications: personalizoation and
eventization. Marketing identity: Digital Mirrors – part 1. Retrieved 25.02.2020 from
https://fmk.sk/download/Marketing-Identity-Digital-Mirrors-I.pdf
7. Baránek, V. (2019). Čo je internetový marketing. Online marketing. Retrieved 25.02.2020
from https://www.online-marketing.sk/internetovy-marketing/
8. Co je offline marketing? (2018). Retrieved 25.02.2020 from
https://www.rozjetpodnikani.cz/co-je-offline-marketing/
9. Čo je to internetový marketing? Retrieved 25.02.2020 from https://skalindam.sk/online-
marketing/
10. Marková, M. (2018). 10 výhod digitálneho marketing, ktoré zaistia rast biznisu. Retrieved
25.02.2020 from https://ahoireklama.sk/2018/10/11/10-vyhod-digitalneho-marketingu-
ktore-zaistia-rast-biznisu/

51st International Scientific Conference on Economic and Social Development – Rabat, 26-27 March 2020
369
11. Prečo má tlačená reclama stale význam aj v dobe online. Retrieved 25.02.2020 from
https://peroutka.sk/preco-ma-tlacena-reklama-stale-vyznam-aj-v-dobe-online/
12. Internetová reclama a užívatelia. SEO: Optimalizácia pre vyhľadávače. Retrieved
25.02.2020 from http://www.seoprojekt.szm.com/Ereklama_uzivatelia.html
13. Vekové zloženie – SR, oblasti, kraje, okresy, mesto, vidiek. (2019). STATdat.
51st International Scientific Conference on Economic and Social Development – Rabat, 26-27 March 2020
370
DETERMINATION OF SOME HEAVY METALS IN VARIETY OF
WATERMELON SAMPLES CULTIVATED IN KAGA LOCAL
GOVERNMENT AREA, BORNO STATE, NIGERIA
Kolo B. G.
Department of Chemistry, University of Maiduguri, Borno state, Nigeria
Shugaba A.
Department of Biochemistry, University of Maiduguri, Borno state, Nigeria
Kagu M.
Govt Girls College, Maiduguri, Borno state, Nigeria
ABSTRACT
The study was conducted to determine the concentration of heavy metals such as (Cd, Pb, Cu,
Ni, Mn, Fe, Zn and Co) in seed, pulp, leaves, stem and root of watermelon (sugar baby and
crimson sweet) from Kaga local government area, Borno State, for the period of three months
(September, October and November). All parameters were analyzed using standard analytical
tools (Atomic Absorption and UV visible smart spectrophotometer).. The result showed that
iron (Fe) has the highest concentration in all the samples analyzed with value (4.38 ±0.03) µg/g
in crimson sweet variety of Ngamdu area followed by Zn with value (1.78 ±1.17) µg/g in soil
sample while lead showed the least concentration with value 0.01 µg/g ±0.001 in watermelon
pulp of Minok agricultural location in all the samples analyzed.. The order of metals
concentration in sugar baby sample were Fe > Zn > Cd > Mn > Ni > Cu > Co > Pb. The order
of concentration in sugar baby samples were Root < Stem < Pulp < Seed < Leaf. Similarly, the
order of metals concentration in crimson sweet sample were Fe > Mn > Ni > Zn > Co > Cu >
Cd > Pb. The order of concentration in crimson sweet sample were Leaf > Pulp > Seed > Root
> Stem. In conclusion, the concentrations of all the parameters analyzed were below the
threshold limits set by world health organization (WHO). Thus, watermelon samples from these
three different locations (Minok, Benisheikh and Ngamdu) from Kaga Local Government Area,)
may not constitute possible health hazard and can be consumed as supplements to the body.
Keywords: Kaga, Heavy metals, soil, watermelon, AAS, Borno, Nigeria
1. INTRODUCTION
Watermelon (Citrullus lunatus) is one of the most cultivated and consumed crops in the world
(Huh et al., 2008). The global consumption of watermelon is greater than any other cucurbit
with China leading in its production followed by Turkey, United States, Iran and Republic of
Korea (Huh et al., 2008). There are over 1,200 varieties of watermelons worldwide with wide
variety of watermelons being cultivated in Africa (Zohary and Hopf, 2000). Watermelon is an
annual plant of the Cucurbitaceae family. The edible fruit is produced on trailing vines that are
more in length. Fruit vary in shape. Watermelon fruits have a thin, firm outer rind, a layer of
white fleshed inner rind that may be up to about one inch thick and an interior edible pulp
containing seeds, a few varieties are actually seedless. Pulp color of most commercial varieties
is some shade of yellow or red (Sackett, 1974). Watermelons have four distinct parts namely,
the rind or peel, the seed, the fleshy white and the fleshy red or pink or yellow parts. The seeds
can be brown, white green, or yellow and a few varieties are actually seedless (Murray et al.,
2005). Watermelon pink flesh part is used to make wine, as ingredients in salads and juices or
just eaten as raw or as sweet juicy treat, while the rind and flesh white part are used as skin
smoothers (Mayo, 2007). The amounts of mineral nutrients in plants vary with species and
genotype, age of plant, site and season and they vary in different organs and tissues of the same
51st International Scientific Conference on Economic and Social Development – Rabat, 26-27 March 2020
371
plant (Pallardy and Theodore, 2008). Watermelon belongs to the gourd family called
Cucurbitaceous and the genus Citrullus. The entire content of watermelon constitutes 96%
water that is very sweet and refreshingly tasty. The outer cover of the fruit is relatively hard
compared to the pulp. The pulp initially is white and changes colour as it matures to ripening.
The seeds are flat, having marginal groove on each side near the base and white black margins
10-15 mm long (Alexander,1981). Heavy metal accumulation in plants depends on plant
species, and the efficiency of different plants in absorbing metals is evaluated by either plant
uptake or soil-to plant transfer factors of the metals. (Covelo et al., 2010). The risk to health
from certain elements in food can be assessed by comparing estimates of dietary exposures with
the Provisional Tolerable Weekly Intakes (PTWIs) and Provisional Maximum Tolerable Daily
Intakes (PMTDIs) recommended by the Joint Expert Committee on Food Additives (JECFA)
of Food and Agriculture Organization (FAO) and World Health Organization (WHO)
programmes on chemical safety (WHO, 1982a,b, 1989a,b, 1993a,b). However, some of the
metals for example Cu, Fe, Mn, Ni and Zn are essential as micronutrients for life processes in
plants and microorganisms, while many other metals like Cd, Cr and Pb have no known
physiological activity (Kar et al., 2007).
1.1. Objectives of the Study
The objective of the study is to determine the concentration of some heavy metals (Cd, Pb, Ni,
Cu, Zn, Co, Fe and Mn) in some variety of watermelon samples.
2. METHODOLOGY
2.1. Sampling Area
Kaga is a Local Government Area of Borno State, Nigeria. Its headquarter is in the town of
Benisheikh. It is located in the Northern part of Borno State 72km away. It has an area of 2,700
km² and a population of 90,015 at the 2006 census. It is one of the sixteen LGAs that constitute
the Borno Emirate, a traditional state located in Borno State, Nigeria. Ngamdu and Mainok are
12km2 and 28km2 away from each other respectively.The major occupation of people in this
area is farming.
Figure following on the next page
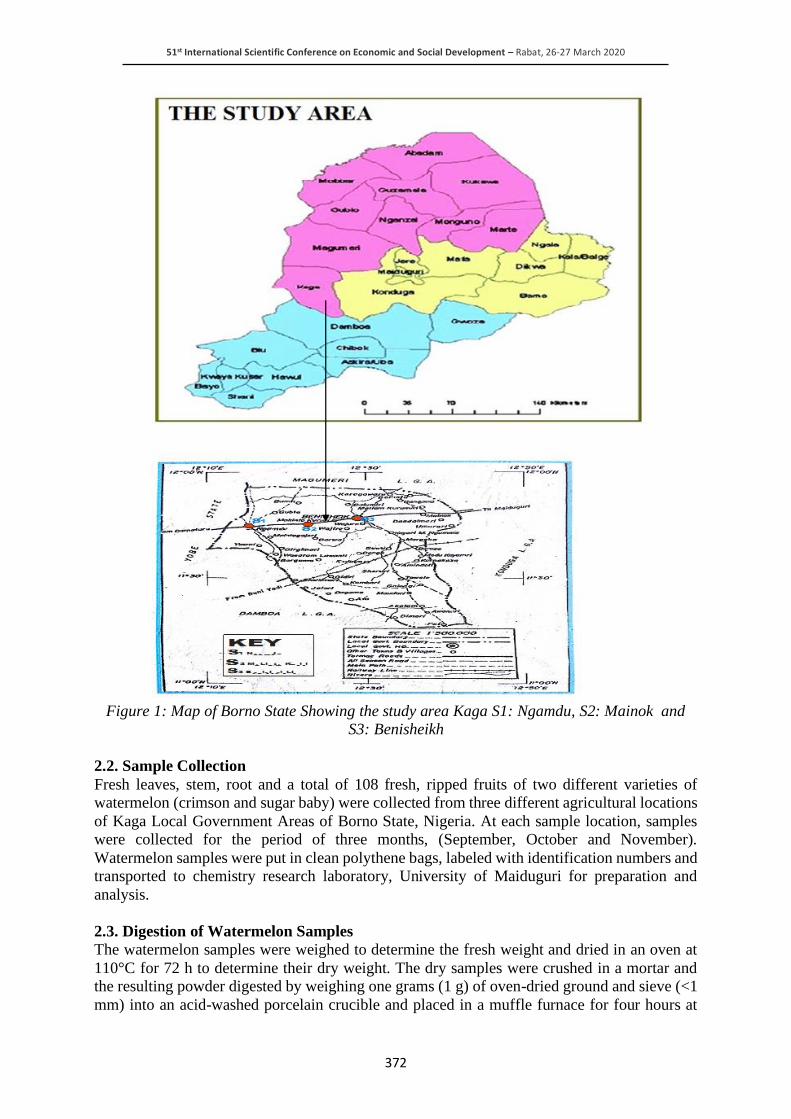
51st International Scientific Conference on Economic and Social Development – Rabat, 26-27 March 2020
372
Figure 1: Map of Borno State Showing the study area Kaga S1: Ngamdu, S2: Mainok and
S3: Benisheikh
2.2. Sample Collection
Fresh leaves, stem, root and a total of 108 fresh, ripped fruits of two different varieties of
watermelon (crimson and sugar baby) were collected from three different agricultural locations
of Kaga Local Government Areas of Borno State, Nigeria. At each sample location, samples
were collected for the period of three months, (September, October and November).
Watermelon samples were put in clean polythene bags, labeled with identification numbers and
transported to chemistry research laboratory, University of Maiduguri for preparation and
analysis.
2.3. Digestion of Watermelon Samples
The watermelon samples were weighed to determine the fresh weight and dried in an oven at
110°C for 72 h to determine their dry weight. The dry samples were crushed in a mortar and
the resulting powder digested by weighing one grams (1 g) of oven-dried ground and sieve (<1
mm) into an acid-washed porcelain crucible and placed in a muffle furnace for four hours at

51st International Scientific Conference on Economic and Social Development – Rabat, 26-27 March 2020
373
500°C. The crucibles were removed from the furnace and cooled. 10 mL of 6 M hydrochloric
acid (HCl) was added covered and heated on a steam bath for 15 minutes. Another 1 mL of
nitric acid (HNO3) was added and evaporated to dryness by continuous heating for one hour to
dehydrate silica and completely digest organic compounds. Finally, 5 mL of 6 M HCl and 10ml
of water were added and the mixture was heated on a steam bath to complete dissolution. The
mixture was cooled and filtered through a Whatman filter paper up to mark with distilled water
(Schirado et al., 2012). Analysis of samples: Determination of Cu, Zn, Co, Mn, Fe, Cd, Ni and
Pb were made directly on each final solution using Perkin-Elmer Analyst 300 Atomic
Absorption Spectroscopy.(AAS)
3. RESULTS
Figure 2 and 3 Present mean concentration of heavy metals in different parts of sugar baby and
crimson sweet samples from Minok agricultural location, Kaga local government area, Borno
State. In the sugar baby sample analyzed iron has the highest concentration. The concentration
of iron 0.84 ± 0.18 µg/g was higher in the leaves and least in the stem of 0.05 ± 0.04 µg/g. Lead
showed the least concentration of 0.02 ± 0.01 µg/g in pulp. The order of metal concentration in
sugar baby sample were Fe > Cd > Ni > Mn > Co > Zn > Cu > Pb. The order of concentration
in sugar baby sample were Root < Stem < Seed < Pulp < Leaf. In crimson sweet sample iron
showed the highest concentration of 0.85 ± 0.21 µg/g in leaves and the least concentration in
pulp of 0.16 ± 0.02 µg/g. Lead showed the least concentration of 0.02 ± 0.01 µg/g in pulp
analyzed. The order of concentration of metals were Fe > Co > Zn > Mn > Ni > Cd > Cu > Pb.
The order of concentration of heavy metals in crimson sweet sample were Leaf > Stem > Root
> Seed > Pulp.
Figure 2: Mean concentration of heavy metals (µg/g) in different parts of watermelon sample
(sugarbaby) from Minok agricultural location
0
0.1
0.2
0.3
0.4
0.5
0.6
0.7
0.8
0.9
1
Seed Pulp Leave Stem Root
con
. (µ
g/g)
PARTS OF WATER MELON
Cd Pb Cu NI Co Mn Fe Zn

51st International Scientific Conference on Economic and Social Development – Rabat, 26-27 March 2020
374
Figure 3: Mean concentration of heavy metals (µg/g) in different parts of watermelon sample
(crimson sweet) from Minok agricultural location
Figure 4 and 5 present mean concentration of heavy metals in different parts of watermelon
sample (sugar baby and crimson sweet) from Benishierk agricultural location, Kaga local
government area, Borno State. In sugar baby sample analyzed iron showed the highest
concentration. The concentration of iron 1.34 ± 0.10 µg/g was higher in the leaves and least in
the pulp of 0.15 ± 0.01 µg/g. Zinc showed the least concentration of 0.12 ± 0.03 µg/g in pulp.
The order of metals concentration in sugar baby sample were Fe > Mn > Co > Ni > Cd > Cu >
Pb > Zn. The order of concentration in sugar baby sample were Pulp < Root < Seed < Stem <
Leaf. In crimson sweet sample iron has the highest concentration. The concentration of iron
0.86 ± 0.12 µg/g is highest in the leaves and least in the stem of 0.13 ± 0.02 µg/g. Lead showed
the least concentration of 0.02 ± 0.01 µg/g in pulp. The order of metals concentration in crimson
sweet sample were Fe > Mn > Ni > Zn > Co > Cu > Cd > Pb. The order of concentration in
crimson sweet sample were Leaf > Pulp > Seed > Root > Stem.
Figure following on the next page
0
0.05
0.1
0.15
0.2
0.25
0.3
0.35
0.4
Seed Pulp Leave Stem Root
con
. (µ
g/g)
PARTS OF WATER MELON
Cd Pb Cu NI Co Mn Fe Zn
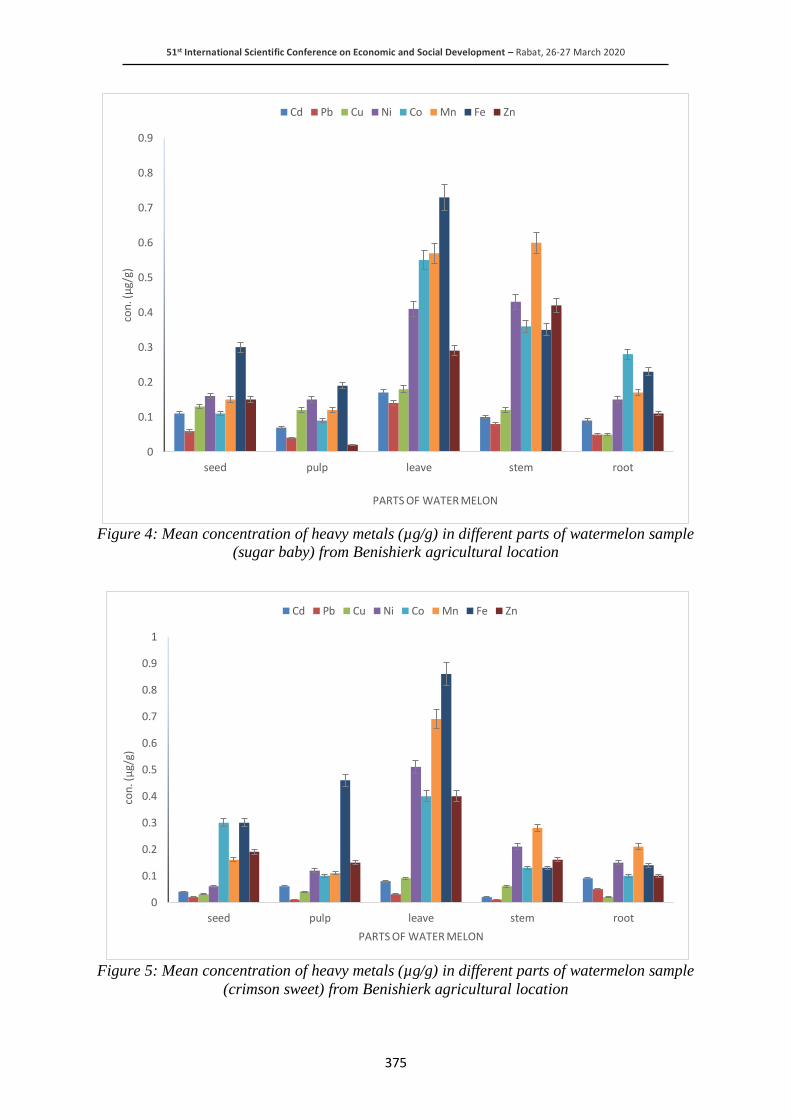
51st International Scientific Conference on Economic and Social Development – Rabat, 26-27 March 2020
375
Figure 4: Mean concentration of heavy metals (µg/g) in different parts of watermelon sample
(sugar baby) from Benishierk agricultural location
Figure 5: Mean concentration of heavy metals (µg/g) in different parts of watermelon sample
(crimson sweet) from Benishierk agricultural location
0
0.1
0.2
0.3
0.4
0.5
0.6
0.7
0.8
0.9
seed pulp leave stem root
con
. (µ
g/g)
PARTS OF WATER MELON
Cd Pb Cu Ni Co Mn Fe Zn
0
0.1
0.2
0.3
0.4
0.5
0.6
0.7
0.8
0.9
1
seed pulp leave stem root
con
. (µ
g/g)
PARTS OF WATER MELON
Cd Pb Cu Ni Co Mn Fe Zn
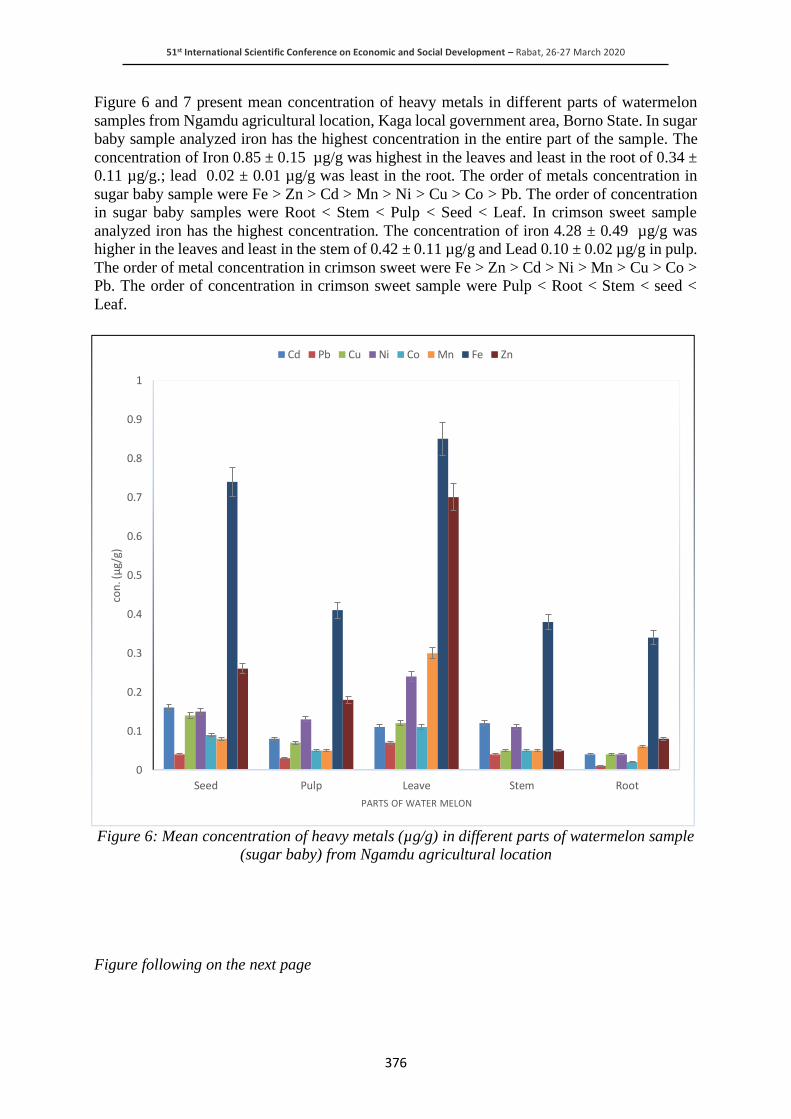
51st International Scientific Conference on Economic and Social Development – Rabat, 26-27 March 2020
376
Figure 6 and 7 present mean concentration of heavy metals in different parts of watermelon
samples from Ngamdu agricultural location, Kaga local government area, Borno State. In sugar
baby sample analyzed iron has the highest concentration in the entire part of the sample. The
concentration of Iron 0.85 ± 0.15 µg/g was highest in the leaves and least in the root of 0.34 ±
0.11 µg/g.; lead 0.02 ± 0.01 µg/g was least in the root. The order of metals concentration in
sugar baby sample were Fe > Zn > Cd > Mn > Ni > Cu > Co > Pb. The order of concentration
in sugar baby samples were Root < Stem < Pulp < Seed < Leaf. In crimson sweet sample
analyzed iron has the highest concentration. The concentration of iron 4.28 ± 0.49 µg/g was
higher in the leaves and least in the stem of 0.42 ± 0.11 µg/g and Lead 0.10 ± 0.02 µg/g in pulp.
The order of metal concentration in crimson sweet were Fe > Zn > Cd > Ni > Mn > Cu > Co >
Pb. The order of concentration in crimson sweet sample were Pulp < Root < Stem < seed <
Leaf.
Figure 6: Mean concentration of heavy metals (µg/g) in different parts of watermelon sample
(sugar baby) from Ngamdu agricultural location
Figure following on the next page
0
0.1
0.2
0.3
0.4
0.5
0.6
0.7
0.8
0.9
1
Seed Pulp Leave Stem Root
con
. (µ
g/g)
PARTS OF WATER MELON
Cd Pb Cu Ni Co Mn Fe Zn
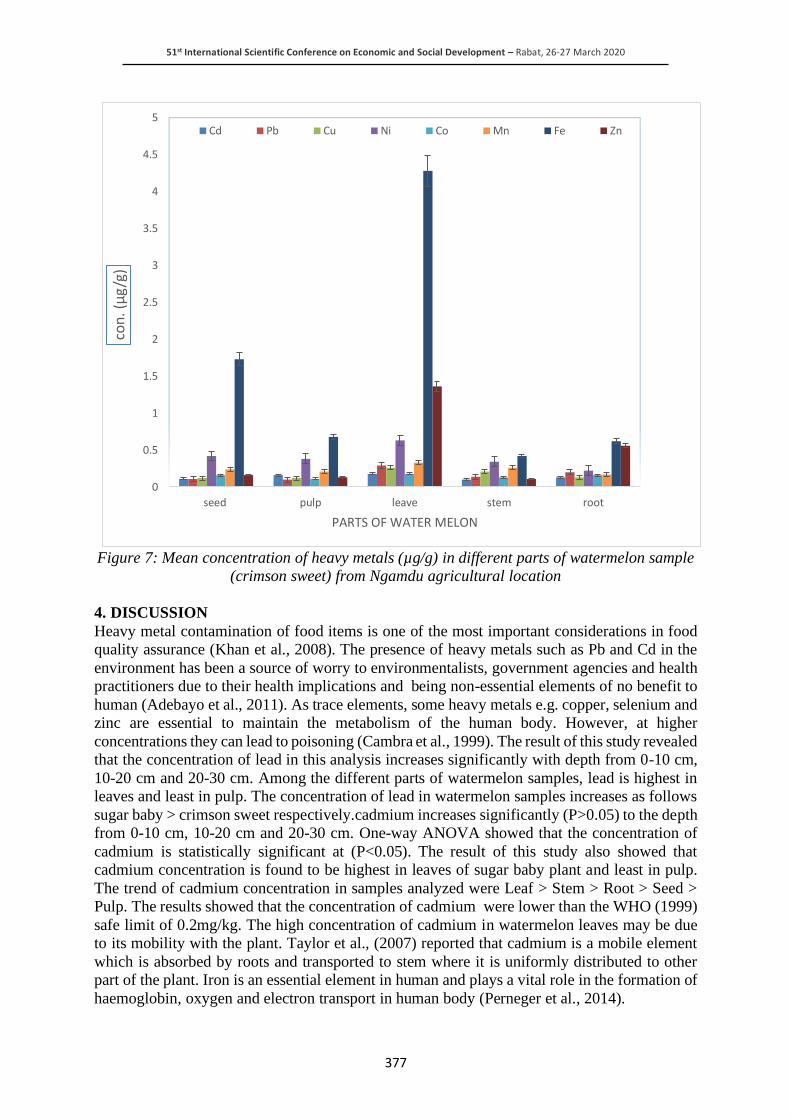
51st International Scientific Conference on Economic and Social Development – Rabat, 26-27 March 2020
377
Figure 7: Mean concentration of heavy metals (µg/g) in different parts of watermelon sample
(crimson sweet) from Ngamdu agricultural location
4. DISCUSSION
Heavy metal contamination of food items is one of the most important considerations in food
quality assurance (Khan et al., 2008). The presence of heavy metals such as Pb and Cd in the
environment has been a source of worry to environmentalists, government agencies and health
practitioners due to their health implications and being non-essential elements of no benefit to
human (Adebayo et al., 2011). As trace elements, some heavy metals e.g. copper, selenium and
zinc are essential to maintain the metabolism of the human body. However, at higher
concentrations they can lead to poisoning (Cambra et al., 1999). The result of this study revealed
that the concentration of lead in this analysis increases significantly with depth from 0-10 cm,
10-20 cm and 20-30 cm. Among the different parts of watermelon samples, lead is highest in
leaves and least in pulp. The concentration of lead in watermelon samples increases as follows
sugar baby > crimson sweet respectively.cadmium increases significantly (P>0.05) to the depth
from 0-10 cm, 10-20 cm and 20-30 cm. One-way ANOVA showed that the concentration of
cadmium is statistically significant at (P<0.05). The result of this study also showed that
cadmium concentration is found to be highest in leaves of sugar baby plant and least in pulp.
The trend of cadmium concentration in samples analyzed were Leaf > Stem > Root > Seed >
Pulp. The results showed that the concentration of cadmium were lower than the WHO (1999)
safe limit of 0.2mg/kg. The high concentration of cadmium in watermelon leaves may be due
to its mobility with the plant. Taylor et al., (2007) reported that cadmium is a mobile element
which is absorbed by roots and transported to stem where it is uniformly distributed to other
part of the plant. Iron is an essential element in human and plays a vital role in the formation of
haemoglobin, oxygen and electron transport in human body (Perneger et al., 2014).
0
0.5
1
1.5
2
2.5
3
3.5
4
4.5
5
seed pulp leave stem root
con
. (µ
g/g
)
PARTS OF WATER MELON
Cd Pb Cu Ni Co Mn Fe Zn
51st International Scientific Conference on Economic and Social Development – Rabat, 26-27 March 2020
378
The concentration of iron in watermelon samples increases as follows crimson sweet > sugar
baby respectively. The iron content in soil and watermelon samples are lower than permissible
unit set by WHO (1996) of 20mg/kg so the levels of iron obtained in this study indicate the
watermelon sample is safe for consumption. One-way ANOVA revealed that there is a
significant difference (p < 0.05) in levels of iron in soil and watermelon sample analyzed. The
maximum amount of copper was observed in Ngamdu location and the minimum amount was
observed in Benisheikh location. In different parts of watermelon samples the highest values of
copper was shown in crimson sweet leaf and the least concentration was observed in sugar baby
seed. The concentrations of copper obtained in this study are lower than the permissible limit
of 10mg/kg set by WHO (1996). Zinc showed the highest concentration in crimson sweet leaf
and the least concentration of zinc was showed in crimson sweet pulp. Deficiency of zinc can
also result from inadequate dietary intake, impaired absorption, excessive excretion or inherited
defects in zinc metabolism (Aggett and Harries (1979). The concentrations of zinc reported in
this study are lower than the permissible limit of 50mg/kg set by W.H.O (1996).
5. CONCLUSION
The results obtained from this study showed that the soils of the three study locations were
observed to be slightly acidic which may have effect on watermelon grown in Kaga local
government area of Borno State. The concentrations of heavy metals and ions were found to be
higher in leaves and low in pulp and a significant (P<0.05) difference in levels of heavy metals
in root, stem, leaves, pulp and seed of watermelon samples analyzed, but however all the analyte
were lower than the WHO standard. Hence, watermelon samples cultivated in Benishiek was
observed to be more polluted than Minok and Ngamdu agricultural locations. Therefore,
consumptions of these watermelons have no health effect on human.
LITERATURE:
1. Adebayo, K.S., Zurera, G. and Odoh, R. (2011). Survey of heavy metal contaminations of
cassava mash and maize corns dried along the highways in some selected states in northern
part of Nigeria. Advance Journal of Applied Science. 2(5): 561-571
2. Aggett p. J. And harries j. T. (1979) review article current status of zinc in health and disease
states. Archives of disease in childhood, 54: 909-917
3. Cambra, K., Matinez, T., Urzelai, A. and Alonso, E. (1999). Risk analysis of farm area near
a lead and cadmium contaminated industrial sites. Journal of Soil Contaminant. 8: 527-
540.
4. Huh Y.C., I. Solmaz, and N. Sari. (2008). Morphological characterization of Korean and
Turkish watermelon germplasm. 1 Cucurbitaceae(2008), Proceedings of the IXth
EUCARPIA meeting on genetics and breeding of Cucurbitaceae (Pitrat M. ed.), INRA,
Avignon (France). May 21-24.
5. Kar D, Sur P, Mandal SK, Saha T, Kole RK (2008). Assessment of heavy metal pollution
in surface water. International Jounal of Environmental Science and Technology5:119-124
6. Khan S., Cao Q., Zheng Y.M., Huang Y.Z. and Zhu Y. G., (2008). Health risks of heavy
metals in contaminated soils and food crops irrigated with wastewater in Beijing, China.
Environmental Pollution 152(3):686–692.
7. Lacatusu, R., M. Dumitru, I. Risnoveanu, C. Ciobanu, Mihela Lungu, S. Carstea, Beatrice
Kovacsovics and Carmen Baciu (1999): Soil Pollution By acid rain and Heavy metals(no
page)
8. Ladipo m. K. And doherty v. F. (2011). African heavy metal levels in vegetables from
selected markets in lagos, nigeria. Journal of food science and technology (issn: 2141-5455)
vol. 2(1): 018-021, january, 2011 available online

51st International Scientific Conference on Economic and Social Development – Rabat, 26-27 March 2020
379
9. Lalor G.C. (2008). Review of cadmium transfers from soil to humans and its health effects
in the Jamaican environment. Science of the Total Environment, 400: 162 – 172.
10. Lei, Y., Korpelainen, H., Li, C. 2007. Physiological and biochemical esponses to high Mn
concentrations in two contrasting Populus cathayana populations. Chemosphere 68: 686-
694.
11. Mayo Foundation for Medical Education and Research. (2007). Antioxidants-Preventing
Disease, Naturally. Mayo Clinic. com. Accessed June 10, 2010.
12. Murray, M.T., Pizzorno, J. and Pizzorno, L. (2005). The condensed encyclopedia of healing
food. ATRIA books, NewYork. Pp 960.
13. Pallardy, G.S and Thiodore, T.K. (2008). Physiology of woody plants. 3rd edition. Elsevier.
Oxford. UK. Pp 261
14. Perneger, Thomas, V., Whelton, W., Paul, K. Michael, J. (2014). Risk of kidney failure
associated with the use of Acetaminophen, Asprin and nonsteroidal Anti-inflammatory
Drugs. Journal of Medicine. 331(25): 1675-1679.
15. Sackett, C. (1974). Watermelons. Fruit and vegetable facts and pointers. United Fresh Fruit
and vegetable association. Alexandria. Pp 242.
16. Schirado, T., Vergara, I. and Schalscha, E.B. (2012). Evidence for movement of heavy
metals in a soil irrigated with untreated wastewater. Journal of Environmental Quality. 15:
9-12.
17. Taylor, M.D. (2007). Accumulation of Cadmium derived from fertilizers in New Zealand
soil. Journal of Science. 208(12): 123-126.
18. WHO. (1996). "The Role of food safety in health and development"- A Report of Whole
Health Organization Expert Committee on Food Safety. Pp 34-100.
19. Zohary, D. and Hopf, M. (2000). Domestication of plants in the old world. 3rd edition.
Oxford University Press.USA. Pp.193-195.

51st International Scientific Conference on Economic and Social Development – Rabat, 26-27 March 2020
380
SOCIAL PROGRAMMING IN THE CONTEXT OF SOCIAL
ECONOMY DEVELOPMENT IN BULGARIA
Venelin Terziev
Russian Academy of Natural History, Moscow, Russia
National Military University, Veliko Tarnovo, Bulgaria
University of Rousse, Rousse, Bulgaria
ABSTRACT
The present work tries to analyze the existence and the development of social enterprises in
Bulgaria. It reviews the possibility for the social programming approach application, aiming
increasing their effectiveness and impact, of the process’s participants as well as of the supplied
services’ users. The group of existing problems is defined and certain possibilities for their
solving are outlined. Specific approaches and toolkit for application in this complex social
process are sought.
Keywords: social programming, development, social effectiveness
1. INTRODUCTION
Lately, the social economy and social entrepreneurship development and encouraging concept
is part of the European Union policy for coping with social exclusion of individuals in
vulnerable state or who has generally fallen into difficult situation. The social economy model
is one of the key tools for achieving socially significant goals within the frames of a sustainable
and including growth; and the social benefits are measured by the integration and employment
of people in unequal state, by the contribution to the process of social inclusion of other people
in vulnerable position, and the economic indicator is expressed through the saved public funds
for social aid on one hand, as well as through the additional funds for compensating the long-
term unemployment’s social cost. What is important in order these to happen, is proper
conditions with maximum wide scope for the social enterprises development to be established
(the vulnerable groups themselves and their problems are diverse and various) and “the answer”
of their needs should be flexible enough in order to be fruitful and effective; not “the way to
the solutions is important” (the way could be diverse, the way the possibilities for various
managerial decisions are diverse and infinite), along which the result is achieved, but the result
itself is important (more successful integration and sustainable overcoming of social exclusion)
(Kumanova, Shabani; Terziev, 2013a; Terziev, 2014).
2. SOCIAL ENTERPRISES IN BULGARIA
The Economic and Social Council of the Republic of Bulgaria (ESC) (2013) considers the social
enterprises in Bulgaria are still unused business model. The existing social enterprises are
predominantly non-governmental organizations, which, applying the relevant legislation,
establish social enterprises which economic activity is directed towards achieving
organization’s social goal and mission. Social enterprises in Bulgaria realize their activity in
various sectors, having most serious participation in: supply of social services; giving work to
disabled people; mediation at finding work for unemployed; ensuring health services; activities
in the field of education, etc. According to unofficial data, more than 85 non-governmental
organizations in Bulgaria already function on the basis of social entrepreneurship principles. In
most cases they render services, and this proposes high economic risk, and they do not realize
profit.
51st International Scientific Conference on Economic and Social Development – Rabat, 26-27 March 2020
381
This type of entrepreneurship’s typological characteristics in Bulgaria do not differ much of the
ones of similar enterprises in the rest of Europe (Kumanova, Shabani):
• First: There is clearly manifested social effect – there is balance between the striving
towards realizing profit and the direct support of certain groups of people’s social status
while realizing the main enterprise’s activity.
• Second: There is clearly defined target group – mainly individuals from socially vulnerable
groups – those, who need help in order to equalize their life and social status with the one
of the rest of the society’s members.
• Third: There is specific purpose of the economic activity – it is directed towards improving
the standard of life, ensuring employment, rendering services and other forms of direct
support aiming the relevant target group’s social isolation overcoming.
The special symbiosis they bear a priori is an important feature of all social enterprises –
between the financial viability and the capability to exercise social impact. Thus they achieve
realization of economic, financial and social goals at the same time, with which they acquire
higher value and worth for the society. Although there is no general information collected about
the existing social enterprises, as well as summarized analysis about the type of the enterprises
and their main fields of activity, an Association of the social enterprises in Bulgaria is
established in the end of 2005, which 26 members, in their development, work off the practices
and strategic directions regarding employment among people in unequal state. The social
enterprises in Bulgaria are of various types, depending on their basic characteristics they could
be classified as follows:
• First – depending on the field they work in, they are:
- Social enterprises as suppliers of social and health services;
- Social enterprises as training and educational organizations;
- Social enterprises as employers of individuals of marginalized groups or of disabled
people;
- Social enterprises that are in production and trade.
• Second – depending on the target groups – the social enterprises are oriented towards:
- Socially vulnerable individuals;
- Individuals with physical or mental disabilities;
- Children and families in risk;
- Young people, who are not integrated in the society (like orphans);
- Ethnic minorities; Women – victims of violence; Elderly people.
• Third – depending on its goals, a social enterprise might have for goal:
- Economic progress – through creating employment and ensuring well-being of the
target groups;
- Labour integration of socially weak or people with disabilities, of marginalized groups;
Business orientation and entrepreneurship; Social protection.
- As it was already mentioned, most often the social enterprises in Bulgaria at present are
connected with the activity of the non-governmental organizations (NGO):
- Non-governmental organizations rendering services to representatives of their members
or to the target groups they have directed their efforts and the services could be
educational, consulting services for individual from the vulnerable social groups, social
or health services, social support, simple medical services, etc.
- In practice, there are also non-governmental organizations that perform economic
activity – they use the profit from the economic activity to finance activities in
fulfillment of the organization’s social mission.
- Another type of organizations that are within the circle of social enterprises are NGO
ensuring employment to people from risk social groups, usually disabled people.

51st International Scientific Conference on Economic and Social Development – Rabat, 26-27 March 2020
382
Non-governmental organizations that create employment and labour force development
are particularly encouraged also by the EU and the donors’ organizations ensured
financing in the recent years. Number of NGOs, whose task is namely to open new work
positions for certain social groups that appear to be their target, could be identified.
Often, this model is connected with the so called “protecting employment”, where the
social enterprise is employer to disabled people - typical example for that are the various
unions and associations of disable people - or the blind, of the deaf, etc.
Another widely known model of non-governmental organization - social enterprise is the one
of the organizations that play the role of mediators between the target group – most often people
with disabilities, and the market. These organizations establish working habits, work
environment and opportunities for people with disabilities to work, and after that mediate for
the sale of what is produced - through bazaars, through special points of sale, etc. The profit is
used for purchase of new materials and developing additional services. Rendering social
services is another model of social enterprise existing within NGO - paid social services are
rendered to outside clients and at the same time, it is supplier of social services for its members,
and this is subsidized by the municipality or the state after a signed contract.
3. SOCIAL PROGRAMMING AS METHOD FOR THE SOCIAL
ENTREPRENEURSHIP DEVELOPMENT
The phenomenon called social programming gained popularity in the modern social-economic
and political environment. In order to throw light upon its essence and significance for the
theory and practice of management in the public sector, we refer to the etymology of the term
“programming”, which roots have ancient Greek origin (“pro”- in advance, before that and
“gramma” - write, mean). Its manifestation in the name “programme” comes from here, which
means “directions”, “notification”, “plan for work, activity, main tasks and goals of a political
party, public organization, public figure, etc.... short exposition of contents... of a study
subject...” (1982; Terziev, 2013a; Terziev, 2014). In its development, the term “programming”
in its classical form has established in Mathematics as combination of methods for developing
algorithm of functioning of a digital computing machine, entire computing process, which aims
optimization of a separate mathematical expression at given mathematical conditions. This term
is key one for the computer field (identified with coding) in the modern world of information
technologies, being applicable in its varieties of linear programming (method for finding the
maximum or minimum of a linear limiting function at the availability of linear limiting
conditions) and non-linear programming (combination of mathematical methods for defining
the greatest and the smallest value of non-linear functions at the availability of limiting
conditions) (1982а; Terziev, 2013a; Terziev, 2014). More, in its wider interpretation, the term
“programming” is connected with a circle of actions in written that express predicting,
foreboding, warning, declaring, proclaiming, prescribing, ordering. The common in this palette
of the term “programming” meanings is that it expresses certain aspect of human activity,
namely the preliminary planning of future actions and activities, noting their limitations. And
namely this aspect differs for its social characteristic, which manifestation is in the necessity of
taking decision on one hand, and on the other – in the elaboration of a programme that expresses
certain prescription, public announcement. In this sense, programming appears to be a process
of elaborating programmes understood as particular model for purposeful activity for achieving
given goal of social-economic and political development in the new world order. The modern
treatment of the term “programming” defines it as a general principle of management, on which
grounds the subject derives its actions by certain means in the direction of the goals, according
the dynamic changes in the environment. Said in other words, on the particular contents,
structure and dynamics of the goal, the actions for its achieving are influenced by the challenges

51st International Scientific Conference on Economic and Social Development – Rabat, 26-27 March 2020
383
of environment, where the system functions, by the extent of knowing them and the
subordination of the subject, his value orientation, priorities, possibilities he has, the chosen
forms and methods for achieving the desired results. This, more than ever, defines the necessity
of alternativeness of decisions and of choosing the optimum variant that contributes to
management by results. On this grounds, the so called programme-targeted approach of
management originates, which manifestation is in the “Planning-Programming-Budgeting-
System” (PPBS) (Terziev, 2013a; Terziev, 2014). Arising in the middle of the 60s in the USA
as system for planning, programming and budgeting, the programme-targeted approach of
management is applied in the American army first. Being based on the idea for accelerating the
processes of unveiling the potential in a system at preliminary set goals, the programme-
targeted approach quickly penetrates in civil life in the end of 60s and the beginning of 70s
(first outside the material, and later in the material sphere) (Due J., Friedlander, 1977). This is
the reason for PPBS to be observed as progress in budgeting and as managerial “miracle”. The
words of the then USA president Johnson are in support of that, according him: “This system
should ensure the execution of the new tasks faster, better and cheaper, opportunity for better
decisions should be generated through more and more quality information... Our decision-
taking process should have the same level as the one connected with armaments and defence.
Shortly and clearly said, we have to exchange our donkey’s carts for trucks and our old guns
for new rockets” (Dickermann und andere, 1971). The thing that makes the approach unique
for application is namely the integration of its three main components - goals, programmes,
programme-targeted structure. And if the goals are connected with the mission (the strategy)
and from here, the necessity of “unity of goals within the frame of an organization and the
ensuring grounds for distributing organizational resources” (1979; Terziev, 2013a), hence
unveiling the organizational potential, then the programmes appear to be the specification of
the ways, along which the resources for realizing the goals have to be used. For that goal, each
programme contains certain tasks, distributed in time and referring to the relevant executors.
From here, each of the PPBS components expresses certain managerial phases. Thus planning
defines the long-term goals, while pointing what is firmly intended to be done. Programming is
connected with the analysis and the ways and possibilities for achieving the goals (elaboration
and selection of alternative programmes) in compliance with the analysis of “expenses-effects
(benefits)” and the application of management’s quantity methods. Said in other words, the
programme is a plan with certain time terms (dates), and this way the time, when what is firmly
intended, would be done, is determined. The budgeting (the financing) is connected with the
choice of the most favourable and the most effective programmes and their including in the
budget of financing and implementing. And as far as the budget is nothing else but a programme
with planned prices, it gives notion how much funds are necessary and when they are to be
ensured in order to ensure possibility to be done what is firmly and at the proper time intended
to be done. Through the system approach, the pointed managerial phases are integrated in a
unified system of interconnected grounds and in certain relation with the financing. This is the
reason for one of the most competent specialists in the field of programme management –
Charles Hitch (former president of the University of California and former assistant secretary
of defense of the USA) to define PPBS as “programme financing”, grounded on the principles
characteristic of modern managerial practice. The following principles are of primary
importance:
• Long-term goals and expected end results;
• Prioritization and sequence of activities and classification of resources in the conditions of
their limitedness;
• Complexity of each problem studying - reviewing each issue or separate field of activity as
system. From here the treating of each system as component of another of higher category
and subduing the goals and tasks of the separate sub-systems to the system’s overall goal;
51st International Scientific Conference on Economic and Social Development – Rabat, 26-27 March 2020
384
• Multivariance of solutions, of the ways and methods for achieving certain goal, which
requires the elaboration of alternative solutions for action;
• Evaluation and comparison of the separate alternatives effectiveness on the grounds of
objective criteria and with the help of system analysis and its toolkit (modeling, economic-
mathematical methods of study and analysis of value, value-effectiveness or value-
usefulness, the method of operational studies, machine and game imitating, etc.);
• Continuity of planning or applying the so called continuous planning horizon and
conduction of the necessary corrections of plans and programmes in the process of their
implementation;
• Combining the programme-targeted approach in management with the programmes
financing in compliance with the extent of achieving the goals.
From here, PPBS ground for functioning is the economic approach application towards each
activity - object of management, management on the basis of system approach and analysis,
financing on programme-targeted basis, which in their essence are three fundamental theoretic-
methodological principles. This is what defines PPBS as managerial concept with specific goals
and tasks. The more significant of them are:
• Specification of the national goals;
• Coordination of the activities at the various levels with these goals;
• Analysis and value evaluation of the possible alternatives for acting;
• Raising the role and effectiveness of control through financing.
And namely, coordinating the activity of the managerial staff and its directing for realization of
the preliminary set goals appears to be the contents of programming. The value evaluation of
the possible alternatives and their analysis as well as raising the role, significance and
effectiveness of control is connected with ensuring the funds, the financing, which is the most
essential element of the system. On this ground, the PPBS positive characteristics are derived
and their manifestation is in:
• The possibility for coordinating the planning and the preparation for budgeting;
• Applying the method of continuous planning horizon, on which ground the subordinating
and centralizing of decisions preparation process becomes possible;
• The conduction of many-year-analysis, which allows evaluation of the advantages and
disadvantages of each possible solution (globally and rationally), and from here the choice
of an adequate to the goals alternative;
• Economic grounding of the taken decisions from point of view of usefulness and expedience
of expenses;
• The bounding of the taken decisions’ fulfillment and their financing, which is manifestation
of the simultaneous economizing and effective use of resources.
It is visible that PPBS presents the budget as declaration of the general policy that defines the
resources necessary for the conclusion of the management final goals. At the same time, the
system reviews the activities as intermediate stage of transforming the resources into services
and usefulness of each programme. And this, in its essence, is manifestation of the dependence
“expenses-effects”, which is in the base of the management by results. Of course, PPBS is not
deprived of weak sides. Regarding the fact that some of the goals and tasks have specific nature,
experts’ opinion is that “the greatest difficulty and the main weak point of the overall system is
that it is difficult to formulate sub-goals that could serve as resulting operative tools of the
current policy out of the general and universally acknowledged culturally specific values as
peace, freedom, security, justice, education and healthcare” (Dickerman).
51st International Scientific Conference on Economic and Social Development – Rabat, 26-27 March 2020
385
Beside the mentioned, from political-juridical point of view, the system widens the possibilities
and prerogatives of executive power, while the ones of the legislative one reduce. And this is
ground for conflict between them. To add to all that, one should take into consideration the
circumstance that PPBS is not bound to the yearly cycle of budget drawing. As a result, it is not
unusual practice to duplicate the decisions taken on the ground of programmes, synthesis of the
various analytical studies and outlining of future goals. But they are not always considered with
the environment’s priorities and changes. Not ranking last, the big document flow and
document turnover create administrative inconveniences and strengthen the bureaucratic
processes. These are the reasons in the end of the 60s and the beginning of 70s PPBS, already
transferred from the American army into the civil structures, to stay at doctrinal and
experimental level in its development. PPBS modified variants leave lasting traces in the
practice of budgeting in the present conditions although it has somewhat lost popularity. It is
adopted for application by the newly accepted member states of NATO, too. The simultaneous
adequate distinguishing of the management phases-planning, programming and budgeting, the
analysis and the proper assessment of their interaction is in support of these states’ choice. It
refers to an intransient worth of PPBS, which is not to be underestimated. Besides that, it
requires special attention regarding the correlation between the revenues and the expenses.
What is particularly considered is the actual price of the transformed resources that are
necessary for achieving the preliminary given results, defined as possibility or executing of an
obligation, which is in support of the management by results, of the role and place of
programming in the management of public processes. And it, the management, applies certain
toolkit for impact upon people, including:
• The hierarchy, organization, where the way of impact (attitude towards power) is
subordination, pressure from above over a person with the help of compulsion, the control
over the distribution of resources and other of that kind;
• Culture as manifestation of worked out and recognized by the society and organizations
groups of values, social norms, formulations and stereotypes of behaviour, rituals, requiring
people to behave in strictly defined manner;
• The market represented by the network of equal in rights relations along the horizontal,
based on the purchase-sale of various goods, of property, of equilibrium in the interests of
seller and buyer. They almost always exist in the live, real economic and social systems.
More important is what is given priority and what is mainly staked on.
And as far as programming is accompanied by the use of the mentioned toolkit of management,
the circumstance that it is what the organization ensures, which in its essence is hierarchical,
with the characteristic relations of power, submission, etc., where there is “systematized,
conscious uniting of the actions of people, who trace the achieving of certain goals” (Terziev,
2014), is in support of the statement that it is a common principle of management. And this,
regarding management oriented towards results. Something more, this organization’s ensuring
through programming could be presented as number of definite components. It’s about:
• Connecting the goal with the possible means for achieving, choosing variant and its
establishing in its capacity of a necessary one;
• Elaboration, reproduction and correction of forestalling algorithm or prototype for actions
that lead to achieving the goal;
• Structuring of these actions in a certain way, giving them expedience and consistency,
without which the actions themselves are just separate, sporadic acts, not connected in a
unified process;
• Communication of the programme with the agents, monitoring of their actions under it.
• From here, programming appears to be an important element in the purposeful systems,
special variety, of which organizational systems appear to be.

51st International Scientific Conference on Economic and Social Development – Rabat, 26-27 March 2020
386
The organizational system in its essence is such a system, which purpose is coordination of the
actions of purposeful parts such as the social groups and personalities, and goal-directing
(means and objects for activity) with the global goal, namely getting certain result (main end
product). Said in other words, programming after certain form and way connects the purposeful
part of the organizational system with the subjects of activity. This way hierarchy, distribution
of the power-efficient and executive functions among the programme’s subjects originates in
the organizational system (1996). One should take into consideration the strong interrelation
among the forms of organizational system and the programming. “The hard” (conditionally
called “administrative-command”) organizational system as a rule defines the relative forms or
programming and the types of programmes from the type directive plan. “The soft” (“liberal-
democratic”) system defines only the general reference points and recommendations for their
achieving. But in practice we can see various symbioses between “hard” and “soft” systems
within the multiform combinations of programming (1996а). This is one of the sides of the
interrelation between the forms of organizational system and the programming. Not to be
underestimated is also the other side, where the manifestation is in the reverse impact of the
programming form and its product-programmes on the organizational system. The elaborated
and fixed in a certain form programme might determine definite form of system. The changes
(corrections) in the programme, as a rule, lead also to relevant changes in the system.
Programming is directly related also to another historically drawn out approach for managerial
impact. The word is about culture. Here also deep interrelation is found, rooted in the essence
of culture. It, the culture, is observed as “specific human method of activity”, as “combination
of sustainable forms of activity”. It is in the base of the life activity of the individual or the
personal culture, the culture of the social group or the class culture, or the culture of society as
a whole. Such an approach is supplemented by the axiological and value essence, which
manifestation is in the fact that culture is observed as “combination of human values”, like all
the things that elevate, cultivate, humanizes life and the human relations. The sociological
approach towards culture finds accelerated development in the recent years, according which it
is understood as “specific, genetically non-descendable combination of means, methods, forms,
samples and reference points for interaction between people and the inhabited environment they
elaborate in their joint life for maintaining certain structures of activity and communication”.
In the sociological approach, culture is observed as “system of collectively adopted values,
beliefs, samples and norms of behaviour, inherent to a certain group of people. Culture - this is
the collective programming of human mind that distinguishes the members of a certain group
from another”. One should take into consideration the fact that the general level and the
characteristics of culture in a society exercise significant influence on the forms and contents
of social programming. Social programming in its cultural expression (aspect) is based on the
fact that only social relations contributing for the human personality progress could create all
necessary “preconditions for “the algorithmic nature of culture” as way for activity, to become
consecutively rational, overcoming the stochastic subjectivity, the elemental uncontrollability
and the preconditions for that, the free human activity constantly to ensure the outcome of these
“algorithms”, the elevation to the methods for activity renewed by the own human manifestation
for creative capabilities”. Here lies the entire manifestation of the social planning essence in
its creative impact upon social reality, ensuring its practice transformation according to the
adequately recognizable values of human world. The approach towards culture as a codified
system (and as a rule, reflected in bearers of various type), samples and norms of behaviour,
activity, communicating and interaction between people, who have regulative and controlling
function in society, deepens the understanding of its interrelation with social programming. The
elaboration of form and way of action, which manifestation is in all the elements in the
programmes, starting from unveiling the goal and finishing with verification of the achieved
results, occurs on the ground of the value orientation of subjects, the rationalizing and the choice
51st International Scientific Conference on Economic and Social Development – Rabat, 26-27 March 2020
387
of the most significant needs and ways for their overcoming. This, in its turn, is connected with
the normative aspect of culture, which through programming gets regulative-managerial
solution. And here is the manifestation of the ambiguous connection between programming and
market with its “invisible hand”. The contradiction between both categories forces at first
glance. Programming with its immanent characteristic towards introducing systematic,
structuring of processes, formalization of the impact upon them, and the market with its classic
feature of elemental interweaving and collision among the various public forces (1996а). At a
deeper going into the essence of these two categories, number of moments that connect them,
immerge. After all, there should be distinction between social programming through market, as
social institute, and the state programming of market economy, and through it the social field,
too. The first one appears as social programming through “the invisible hand of market”,
uncovered yet by Adam Smith. The “invisible hand of market”, programming the egoistic
interests of producers and consumers directs them towards goal that penetrates in their
intentions. Following its own interests, they undertake such actions that serve society’s interests
(1996). In compliance with that, effective social programmes are to prognosticate the benefits
from the investments in one or another component of theirs. The state programmes entirely
financed from the state budget are not effective, neither economically, nor socially as far as
economy as a whole defines the wealth of society by definition. As programme, Adam Smith
expresses that statement in the principle “Laisser faire”, according which the single people and
enterprises are obliged to act in economy without the intervention of state. In the social-
historical development’s practice from that time this condition is not realized in any country in
absolute form. However, the state intervention in economy to the 20th century is “passive”,
incidental and in most cases has the nature of extraordinary measures in times of wars or indirect
regulating through legislation and monetary system (1996а). The system intervention of state
is increasing in the economy and other spheres of social life in the 20th century. One of the
central places in that general trend is occupied by the issue with the correlation between state
regulating and the market self-regulating. Experience outlines three directions (models), while
solving that issue, namely in the USSR and the group of countries from Central and
Southeastern Europe, Central and Southeastern Asia, known as socialistic countries. According
to the recognized terminology, “communist block” to the beginning of the 90s, under the
influence of the Marxist doctrine and its modifications, a model of centralized, directive based
planning of economic and social development that denies the market, is realized. More,
alongside with the process of nationalizing the economy, increasing of the spheres of social life
directly or firmly regulated by the given system was taking place (1996). Number of methods
is found within this model, in particular, the balance and the normative ones, applicable
practically in each form of programming. This model gives also incitement for elaborating the
methodology and the trial for social planning, social design and some other forms of social
programming. In principally different direction - to the 30s, there is practice of “passive”
participation of state in the economy of other countries, where the term “planning”, according
to the F. Polak’s note, is a curse. According to him “... the deep economic crisis during the 30s
came after countless other disasters and shook the very basis of the western system of
production, and it also produced revolution in the economic thought” (Vasilyev, 1999;
Vasilyuk, 1995). This revolution, connected with using the J. Keynes doctrine, supposes
“active” state intervention, including with the help of programming in the economic sphere. In
the beginning of the 30s, projects for state programmes occur, which goal is to reduce
unemployment and to soften the other crisis manifestations (in particular, the “Papen Plan” in
Germany, the “Marquet Plan” and the “Plan for mobilization of economy and for establishing
new social order” in France), the “Programme for Tennessee River Valley Development in the
USA”, etc. (Vasilyev, 1999). Programming starts being actively applied in the activity of single
companies, the Ford factories, the Lockheed Company, etc. (Vasilyev, 1999).
51st International Scientific Conference on Economic and Social Development – Rabat, 26-27 March 2020
388
Programming has special incitement after the Second World War in Western Germany (in
connection with the “Marshall Plan”), in France (State Plan for Development of the National
Economy for 1947-1952), in Japan and in number of other countries (1996а). Controversial
phenomena are observed in the further development of state programming in the countries with
market economy, connected with activating or decreasing the state intervention in certain
social-economic and political situations. As a whole, “the uniting” of market factors with
programming becomes one of the leading trends in social development. Nevertheless, the thesis
“Laisser faire” is not forgotten and thrown away from the political lexicon. It functions as a
principle of the public powers that contain the immanent powers of each country to subordinate
everybody and everything. Practically, perspective and current “business plans”, marketing
projects, programmes for work with the staff and similar ones are elaborated in each company.
Within the frame of programming, technologies like “indicative planning”, “planning-
programming-budgeting” ((PPBS) and others are founded and elaborated. International social
programmes are in elaboration under the aegis of international organizations (UN, UNESCO,
EU, World Labour Organization, etc.), recognizing the market conditions during their
realization. In this complicated structure, even at national level, “the law for planned and
proportional development” is not realized, because of which the system of total state directive
planning is built. It gives its opportunities for an organization for interaction between the
interested participants in the socially significant activities. Programming is mechanism, which
refers to the class of very complicated systems, where the components possess great freedom
of behaviour. The connection among the elements as well as of the system with the
environment, are recognized for flexibility and instability. Order is changed by an element. The
contents and structure of the system are not strictly defined; its limits are not precisely marked.
A lot of things in the system are unclear, indirect, “distorted”. This gives us grounds to define
it as arranged-elemental process. Despite that, the term leaves the layer of political and
ideological reasoning on the subject “to be or not to be” and is introduced for use in the public
management, with the requirement for deep theoretic and methodological revision and
methodological-technological rationalizing, which manifestation is in the elaborated
programmes, as manifestation of the prescribing (deontic) side of human activity.
4. CONCLUSION
The system of social entrepreneurship, still not quite developed, should look for proper
mechanism for improving and for finding relevant place and space in the so “hostile” and
dynamic environment. Market mechanisms push out the existence of such companies in the
periphery of their essence, despite the established institutional mechanisms for their protection.
They harder and harder find or defend their state and focus on activities that are oriented
towards rendering services – which, in general, do not bring great profit and are not very
interesting for the other participant in the market game. Of course, these are activities that are
indisputably necessary for the society for its existence and development and should be tolerated
the relevant way. Basic or significant issue is how and what way they to exist in order to be
maximum useful for the participants and the users of this type of services and how we would
assess their social effectiveness. This is quite complex and multi-aspect issue, which is
undoubtedly part of the process of social programming. Social programming, in its essence, is
a complex process that creates good opportunities to be used in the development of social
entrepreneurship. A detailed and thorough analysis is necessary to be made on the activity up
to the present moment, where to try and find the positives and the negatives of this process’
progressing to the present and then to proceed to applying that programme approach. The
chaotic development of the process up to now, which is characterized with good enough
practices, too, but is mainly regulated by the operating market mechanisms, gives partial result.

51st International Scientific Conference on Economic and Social Development – Rabat, 26-27 March 2020
389
Set goals and tasks have in their base the solving of already existing social problems with
suitable tools and mechanisms. The search for the most reliable and proper for the certain
conditions approach is successful to the extent that it realizes positive intentions, but also
negative from point of view that it does not satisfy them to sufficient extent. The collection and
analysis of sufficiently reliable information is one of the elements, which should be corrected
in time. The actuality of such data is of special significance for taking correct and exact
solutions in this direction. The outlining problems in the functioning of social enterprises in
Bulgaria correspond directly with the differences in the economic development of the relevant
regions in Bulgaria, which is completely natural. From such point of view, differentiated
approach of regional nature should be searched. The accumulation of a number of problems
imposes the search of a solution of such type. The general study of the process is undoubtedly
difficult and long process, but should be conducted in the course of this activity’s development
and at the lack of objective information about it, which should be collected by the state
institutions that are called upon doing that by the law.
LITERATURE:
1. Dickerman D. i dr. tsit. izd. s.144 (Dickerman D. и др. цит. изд. с.144).
2. Dickermann D. und andere. (1971). Das Rationale Budget Kolner Universitats-Verlag
1971, р.137.
3. Due J. and A. Friedlander. (1977). Government Finance Nomewood Illinois, 1977, p.139-
145.
4. Kumanova, M., Shabani, N. Analiz na sotsialnoto predpriemachestvo v Balgariya. Proekt
„Initsiativa za inovatsii v sotsialnata ikonomika” s finansovata podkrepa na Evropeyskiya
sotsialen fond i Republika Balgariya chrez Operativna programa „Razvitie na choveshkite
resursi”, shema „Bez granitsi – Komponent 1”, izpalnyavan ot Sdruzhenie „Znanie” –
Lovech.
5. Rechnik na chuzhdite dumi v balgarskiya ezik. (1982). S. 1982 s. 693.
6. Rechnik na chuzhdite dumi v balgarskiya ezik. (1982а). S. 1982 s. 694.
7. Sotsialnoto predpriyatie i sotsialnoto predpriemachestvo. (2013). Sofiya, 2013. Republika
Balgariya. Ikonomicheski i sotsialen savet. ISS/3/009/2013.
8. Strategie Planning aug Policy (1979). N. Y. 1979, 68.
9. Teoriya i metodika sotsialynoy rabotyi. (1996). M. 1996.
10. Teoriya sotsialynogo rabotyi. (1996а). M.1996.
11. Terziev, Venelin. (2013a). Vazdeystvie na politikite na pazara na truda za osiguryavane
na zaetost. Izdatelstvo „Dema Pres – Ruse“, 2013.
12. Terziev, Venelin. (2014). Vazmozhnosti za povishavane na efektivnostta na sotsialnata
adaptatsiya na voennosluzheshti, osvobodeni ot voenna sluzhba. Izdatelstvo „Primaks“ –
Ruse, 2014.
13. Vasilyev, V. P. (1999). Sotsiologicheskaya problema upravleniya i sotsialynoy zashtita.
Sotsiologicheskie issledovaniya // 1999 №11.
14. Vasilyuk, F. E. (1995). Tipologiya perezhivaniya razlichnyih kriticheskih situatsiy //
Psihologich. Zhurnal. 1995-№5 T. 16, s.104-114.

51st International Scientific Conference on Economic and Social Development – Rabat, 26-27 March 2020
390
ATTITUDES TOWARDS ENVIRONMENTAL PROTECTION
ADOPTED BY THE BUSINESS SUBJECTS IN THE REPUBLIC OF
CROATIA
Ivan Kovac
University of Zagreb, Faculty of Economics and Business, Croatia
Kristina Petljak
University of Zagreb, Faculty of Economics and Business, Croatia
Dora Naletina
University of Zagreb, Faculty of Economics and Business, Croatia
ABSTRACT
The importance of the actions companies undertakes regarding environmental protection was
realized long in the past. Unfortunately, modern solutions regarding limited energy resources,
industry, logistics etc. mostly become also the sources of environmental pollution.
Environmental protection is a significant area and almost no reasonable one doubts, but its
actual implementation in practice is a huge problem. Concerning this, this paper aimed to
analyse attitudes towards environmental protection adopted by the business subjects in the
Republic of Croatia. For this purpose, empirical research was conducted on the sample of
companies which stated their attitudes and everyday activities they perform with the aim of
environmental protection. This research is unique in its kind, as it focuses on the business sector
in the Republic of Croatia.
Keywords: environmental protection, Croatian companies, empirical research, Republic of
Croatia
1. INTRODUCTION
The world today, despite strong development and advancements in science and technology, is
still facing issues like food scarcity and limited drinking water and energy supplies. Although
very intelligent and resourceful, our civilization has been coping with these existential problems
for years, and they remain unsolved, and they are even becoming bigger since pollution
negatively influences the production of healthy food and sources of drinking water. We are
witnessing the ozone layer being damaged, the influence of global warming, the irreversible
pollution of our environment and rapid waste of non-renewable natural resources. It is quite
clear today that the industrial revolution, with its positive changes, has also brought negative
consequences regarding environmental pollution and threat to human health. In this sense, the
20th century is characterized by the concern for the environment at the global, regional, national
and local level (Cardwell, 1984). This extraordinarily negative and alarming trend has been
continued in this century as well, but now these issues grow exponentially. Unfortunately,
modern solutions regarding limited energy resources, industry, logistics etc. mostly become
also the sources of environmental pollution. This is primarily true of the pollution generated
using fossil fuels, which still remain the primary sources of energy throughout the world.
Namely, economic development of any country is conditioned with energy, i.e. its sources. In
line with that, energy bears enormous influence over sustainable development and
environmental protection. It is, therefore, crucial to use more renewable sources for energy
production to reduce its negative impact on the environment.
51st International Scientific Conference on Economic and Social Development – Rabat, 26-27 March 2020
391
One of the main challenges of the modern society regarding the protection of the environment
is connected with the reduction of CO2 emissions and gradual replacement of fossil fuels with
those energy sources that have far less impact on the environment (Mahalingam and Ramesh,
2013). For a long time now, we have found in the literature papers that analyze in detail the
reasons why companies are introducing environmental management and corporate
responsibility (Aguilera et al., 2007). Unfortunately, concern about environmental protection
during the economic crisis has reduced since the media more preoccupied with economic rather
than environmental issues (Carmichael and Brulle 2017). Environmental protection is a
significant area and almost no reasonable one doubts, but its actual implementation in practice
is a huge problem. Consequently, in the literature, we find papers suggesting that expenditures
for environmental protection, which are part of public spending, usually stimulate the economy
of a country in the short-run (Blanchard and Leigh, 2013). However, we also find scientific
papers suggesting that environmental protection expenditure increases costs in some industries
and thus reduce economic activity (Joshi et al., 2000). Despite of all these facts, there is no
alternative to environmental protection. The world realized long ago what catastrophic
consequences environmental pollution could lead to. Therefore, efforts are made to act and
create such a society that will develop without polluting their environment. Attitudes
multinational companies adopt towards environmental protection is essential and their impact
on environmental policy is enormous. In this context, it is necessary to note that trade
globalization has contributed significantly to the growth of awareness of the general public
regarding the social and ecological effects of multinational companies (White, 1999). For all
the reasons mentioned above, the goal of this paper is to examine environmental protection and
its activities which companies conduct to preserve the environment. Regarding the research
methodology, the paper consists of secondary data analysis which bis based on the scientific
paper analysis as well as empirical research data.
2. LITERATURE REVIEW ON ENVIRONMENTAL PROTECTION
Intense industry development brings wellbeing, but it also brings about challenges like pollution
and nature being in danger. These challenges are characterized by the exponential growth of
the issues connected with air pollution, global warming, water and soil pollution (Bagur-
Femenias et al., 2013). If we speak of sustainability and the interconnectedness of economic,
social and ecological aspects of a society’s development, then it is clear that economic growth
and social welfare support environmental care and vice versa (Vos, 2007). But, unfortunately,
many countries even today are trying to achieve rapid economic growth regardless of grave
environmental pollution they are causing along the way. It is understood that such economic
growth at the expense of the environment cannot lead to social welfare. The importance of the
actions companies undertake regarding environmental protection was realized long in the past,
and therefore, data publishing about their efforts has been stimulated and, in some countries, it
has been made obligatory. Namely, long ago, initiatives were started to be prepared for systems,
policies and procedures regarding environmental protection to become institutionalized (Jones
et al., 1998). This has been significantly supported by the guidelines of the international
organization for the ISO 14001 standards, as well as the Eco-management and Audit Scheme
issued by the European Union (EMAS), and with their emergence, the standardization of
corporative practices for environmental protection has been largely improved. When talking
about the standards for reporting on environmental protection, we should first mention the
contribution of the Coalition for Environmentally Responsible Economies (CERES), the ICC
Business Charter for Sustainable Development and the Global Reporting Initiative (GRI),
(Buchholz, 1998). Naturally, their contribution to the development of environmental care
should be observed in the broader sense, with the policy for environmental protection adopted
by the operations management, then the issue of environmental protection through various

51st International Scientific Conference on Economic and Social Development – Rabat, 26-27 March 2020
392
processes of organizational and functional areas and regarding the obligations for the
improvement of ecological efficiency with continuous research of best practices and operations
of re-evaluation etc. After the Rio de Janeiro Summit in 1992, three primary goals for the global
concept of sustainable development were defined. The first goal is related to ecology, i.e.
prevention of environmental degradation and elimination of their risks. The second goal relates
to economy, i.e. satisfying basic material needs of the human civilization with the use of the
techniques and technologies that do not harm the environment. The third goal relates to social
and humanitarian aspects of the human civilization (Bina, 2013). It is directed towards ensuring
social minimum, and the result should be to stop hunger and poverty. Likewise, this goal should
ensure proper health protection, development of the spiritual sphere (the culture), safety and
education. Unfortunately, we are witnesses that little has been done regarding sustainable
development since that summit. There are still significant risks related to environmental
degradation. Due to this fact, green human capital must be present in the companies, to accept
all environmental management practices (Jabbour et al., 2019). This is primarily related to green
manufacturing and green supply chain management. We are still using techniques and
technologies that destroy the environment and are not used for satisfying the basic material
needs of humanity. Quite the opposite, they serve first and foremost the interests of the capital
and maximizing the profit, while destroying and polluting the environment significantly.
Today, there are still countries where many people die of hunger or get ill due to environmental
pollution or lack of drinking water. Some countries, understanding the significance of
environmental protection, and serious consequences certain countries pay due to rapid
economic development, are trying to introduce strict legislation and reduce negative impact
economic development has on the environment. This is especially true of industry and traffic
which represent one of the biggest polluters in most countries. Specific countries (Denmark,
Japan, Netherlands, etc.) mandate that their business subjects publish information on their
environmental impact (Kolk, 2003). In this way, they wish to raise awareness in the economy
regarding environmental protection. On the other hand, in this way, they want to create one of
the mechanisms for encouraging ecological protection as a way of competitive advantage as
opposed to those subjects which do not pay much attention to environmental protection.
According to that, the IRRC (The Investor Research Responsibility Center) has conducted
research, and the results say that most Japanese companies (90%) inform the public on their
goals, achievements and the expenses regarding specifically environmental protection (Metrick,
2001). In general, the world has been trying to stimulate and boost the production of eco-
friendly products with national and international regulations to reduce the negative impact on
the human environment. However, these efforts are still insufficient. Although products and
services of those companies that produce in line with the highest ecological norms are
considered important factors of competitiveness, there are still those companies that are
relatively successful, but their products and services and their products impact the environment
very negatively. It is clear that the process of commitment to ecology in an economy is
necessary, but still too weak and too slow. In line with that, business subjects should behave in
the way that they do not harm the environment. There some authors, that implied a positive link
between employees’ green behaviour and environmental sustainability of a company (Iqbal et
al., 2018). The sustainability of their business is here crucial. In literature, “business
sustainability” is defined as economic, social and ecological efforts a company or an
organization put into implementation and management of the impact of their own network and
the business network on the life and eco-systems of the country (Wagner and Svensson, 2014).
Over time, many methodologies have developed based on different indicators to establish the
levels of sustainable development in a specific country. For this purpose, various indicators are
used, but we will mention only a few of them here: Composite Index of Environmental
Performance (García-Sánchez et al., 2015), Economic Performance Index (IMF, 2013),

51st International Scientific Conference on Economic and Social Development – Rabat, 26-27 March 2020
393
Environmental Performance Index (Esty et al., 2008), etc. Indeed, when establishing the level
of sustainable development in a country, it is necessary to adjust the methodology that would
best reflect the actual state of environmental protection. With the correlation and evaluation of
the acquired indicators, using different statistical analyses, it is possible to ascertain the most
important aspects and the level of sustainable development (Neumann et al., 2018). Regarding
business sustainability, literature offers not only economic, social and ecological components
of sustainable development but also the elements connected with them (Hassini et al., 2012).
Namely, empirical researches propose 20 elements: seven economic, seven social and six
ecological elements. Business sustainability is related to profit and profitability, i.e. if the
benefit does not have to be imperative, the ability to generate profit is a crucial element of
survival and sustainability. Another vital aspect of economic business sustainability is
competitiveness and reputation in society. The studies described in the literature point to the
fact that sustainable business positively influences the reduction of the costs. Therefore, costs
reduction is the third element connected to the economic component of business sustainability.
It is understandable that corporative brand, being the fourth element if the company owns one,
can positively influence all three before-mentioned elements of economic business
sustainability. Of course, we encounter positive spin-offs as well, and they are the fifth element
of the economic aspect of business sustainability. Let us take an example: if a company that is
a good model of sustainable business, is mentioned in this context in the media, it can lead to
reducing the necessary funds allocated for marketing. It is then understandable that financial
benefits and savings can be incorporated in the right decisions related to sustainable business,
and they are the sixth element of the economic aspect of sustainable business. The seventh
element of the economic issue of business sustainability represents the compromise, meaning
that, for example, when acquiring goods, the lowest price is not the most crucial criterion as an
economic component, but rather social and ecological component is taken into account when
making that decision or any other business decision (Wu and Pagell, 2011). As already has been
mentioned, the social component is essential for business sustainability, next to the economic
and ecologic one. The social component comprises of further seven elements. The first element
relates to the importance of organizational support for business sustainability. Namely, business
sustainability is superficial, insignificant and even pointless without the management support,
i.e. the support from the top management. Following it, companies human resource strategies
have to be harmonized with environmental goals to increase the output of sustainable operations
(Teixeira et al., 2016). For successful business sustainability, all the subjects must be devoted
to it, not just those in the company, but the entire business network as well. For the success, it
is not enough that the interested parties are only within the company, but all those direct and
indirect business partners have to be engaged, too, for business sustainability to be possible.
And this is the second important element of the social component in business sustainability.
The third element of the social component implies that for achieving business sustainability,
much time is needed, along with consistency with the long-term perspective. The fourth element
of the social component indicates that sustainable business demands real dedication and
commitment since it is necessary to invest much effort, and its implementation is very complex.
Corporative culture, with its policies, principles, norms and values, represents an essential fifth
element of the social component. It is crucial to integrate sustainability culture with the
companies culture to speed up green programs and reach desired performance (Galpin et al.,
2015). The next element attaches great importance to the company’s reputation. It is clear that
reputation will have a strong negative influence if there is public discontent regarding the efforts
the company makes for business sustainability. This is why the public needs to be acquainted
with all the efforts of the company so the company can further improve its business
sustainability.

51st International Scientific Conference on Economic and Social Development – Rabat, 26-27 March 2020
394
This is the seventh element of the social component in business sustainability. Ecological
aspects of business sustainability deal with the total e-footprint a company and its co-operators
leave in the eco-system. The emission of harmful carbon compounds represents a crucial part
of business sustainability. The evaluation and measuring of carbon footprints is the first element
of the ecological component. It is a crucial measure of greenhouse gases and carbon dioxide
that contribute to global warming. The second element of the environmental component is
climatic changes and global warming, i.e. standardized monitoring and testing of the effects
human activities have on them. Many different initiatives in and outside the company are of
extreme importance for reducing the e-footprint in the environment, which is also the third
element of the ecological component for business sustainability. For instance, companies
collaborative approach to increasing innovation on environment and acceptance them is
fundamental for sustainability (Antonioli et al., 2013). It is essential to understand that business
sustainability has to imply a comprehensive strategy and not just a few isolated efforts and
attempts. In line with that, the programs for the improvement of environmental protection have
to be developed on eternal principles and focus on all that can be used for the welfare of the
environment. These programs for improving ecological protection represent the fourth element
of the ecological component in business sustainability. Product dematerialisation represents one
of the innovative solutions of the ecological component. It is important to understand that
pollution and e-footprint of the existing and future products and services can be minimized
through the manufacturing life-cycle, including recovery and/or recycling. Here should be
mentioned the circular economy, that has the potential to increase sustainable economic growth.
The circular economy is based on reusing processes, recycling and reconditioning (Cleary,
2009). In order to establish the impact of an individual business subject on the environment,
environmental performance indicators have been developed, based on which successfulness
regarding environmental protection can be evaluated. For this purpose, a set of variables has
been created, establishing the actual efficiency and productivity of environmental management
at the specific business subject (Jasch, 2000). There are two main groups of the basic indicators
of environmental activities and performances. The first group is made of the environmental
operational indicators such as environmental site planning, energy consumption, maintenance
of equipment, air pollution control, noise pollution control, water pollution control, waste
pollution control. The second group of the basic indicators of environmental activities and
performances are environmental performance indicators, and it consists of the indicators related
to site environment, regulatory compliance and auditing activity. Many business subjects have
become successful in managing the environment due to the implementation of the ISO 14001
(Environmental Management Systems EMSs). Needless to say, the influence of the introduction
of the ISO 14001 (Environmental Management Systems, - ISO 14001 EMS) is very important
for the successfulness of the business subject. It is very important to understand the broader
context of environmental protection and sustainability in a national economy. Moreover, we
find scientific papers in the literature suggesting that the degree of the environmental
innovation, the degree of recycling and renewable energy use have positive impacts on the
economic growth in a country (Ruiz-Real et al., 2018). It is of great significance to understand
the implications of introducing the ISO 14001 (Environmental Management Systems, - ISO
14001 EMS) on the competitiveness and cost-effectiveness of the economic subject i.e. on its
business successfulness. Literature offers a significant number of papers suggesting how the
implementation of the ISO 14001 (Environmental Management Systems, - ISO 14001 EMS),
leads not only to positive influence on the environment but the implementation also positively
influences many other business segments. There are papers whose findings clearly show how
the introduction of the ISO 14001 (Environmental Management Systems, - ISO 14001 EMS)
can increase customer satisfaction (Hui et al. 2001). It is important to mention that the ISO
14001 implementation also positively influences business reputation, and on the other hand,

51st International Scientific Conference on Economic and Social Development – Rabat, 26-27 March 2020
395
increases profitability of the economic subject (Sambasivan & Fei, 2007). There are authors
that point to the fact the due to the ISO 14001 system, it is possible to intensify customer loyalty,
which is an important element for the business success of any economic subject (Chittaie,
2012). It is a well-known fact that loyal customers ensure the future on the market. Moreover,
literature offers studies that prove how the ISO 14001 system leads to the increase of the market
share, (Tan, 2005). The implementation of this system enables successful environmental
management; the costs are reduced, and the product and service quality are increased since there
is less waste; there are savings in the consumption of raw materials, electricity, water and gas
(Zutshi & Sohal, 2004). It is very important to mention the paper where the authors claim that
it pays to be ecologically aware from the business point of view as well. Namely, they have
tried to prove that if a business subject, for example, reduces the emission of greenhouse gases
successfully, reduces air pollution etc., it influences the costs reduction and the business success
(King & Lenox, 2001). Therefore, the success of a business subject regarding environmental
protection positively reflects on cost reduction and, consequently, positively affects business
successfulness.
3. EMPIRICAL RESEARCH ON ENVIRONMENTAL PROTECTION ADOPTED BY
THE BUSINESS SUBJECTS IN THE REPUBLIC OF CROATIA
After detailed secondary data analysis and following the foreign research streams, the research
instrument (a questionnaire) was designed which investigated attitudes towards environmental
protection, the importance of environmental protection for company strategy and
implementation and certification of environmental management systems in companies. The
primary, empirical research was conducted from May to September 2019 via the Survey
Monkey platform, and the link for the questionnaire was distributed via business emails, sent
to the companies experts in this area.
3.1. Research instrument and sample characteristics
The research was conducted on a sample of 95 companies in the Republic of Croatia. The
respondents were instructed beforehand and familiarized with the goal and purpose of the
research. A base of email addresses of the individuals that work in the companies that are
devoted to environmental protection was created. A questionnaire was designed in the
SurveyMonkey software and the link leading to the questionnaire was forwarded along with the
invitation to participate in the research. The goal of the research was to define the importance
Croatian companies give to environmental protection. The questions in the questionnaire
related to general data about the company (legal form, form of ownership, time on the Croatian
market, total profit in 2018, description of the market the company operates on, the number of
employees, the share of employees with high education). Furthermore, in the questionnaire, the
respondents were asked to express their level of agreement with the statements relating to the
evaluation of the attitude their company holds towards environmental protection. A Likert scale
was used, marked from 1-5, where 1=completely disagree, 2=disagree, 3=neutral, 4=agree,
5=completely agree. Then, the respondents were asked to state their opinion on how important
environmental care was as a determinant of strategy of their company (completely irrelevant,
slightly relevant, neither relevant nor irrelevant, relevant, extremely relevant) and if their
company has implemented and certified the system of quality management, according to the
ISO 9000 norm and the environmental management system, according to the ISO 14001:2004.
At the end of the questionnaire, the respondents were asked to write the name of the department
they work in, their position in the firm, years of experience in the logistics industry and the data
on gender, age and the level of education.
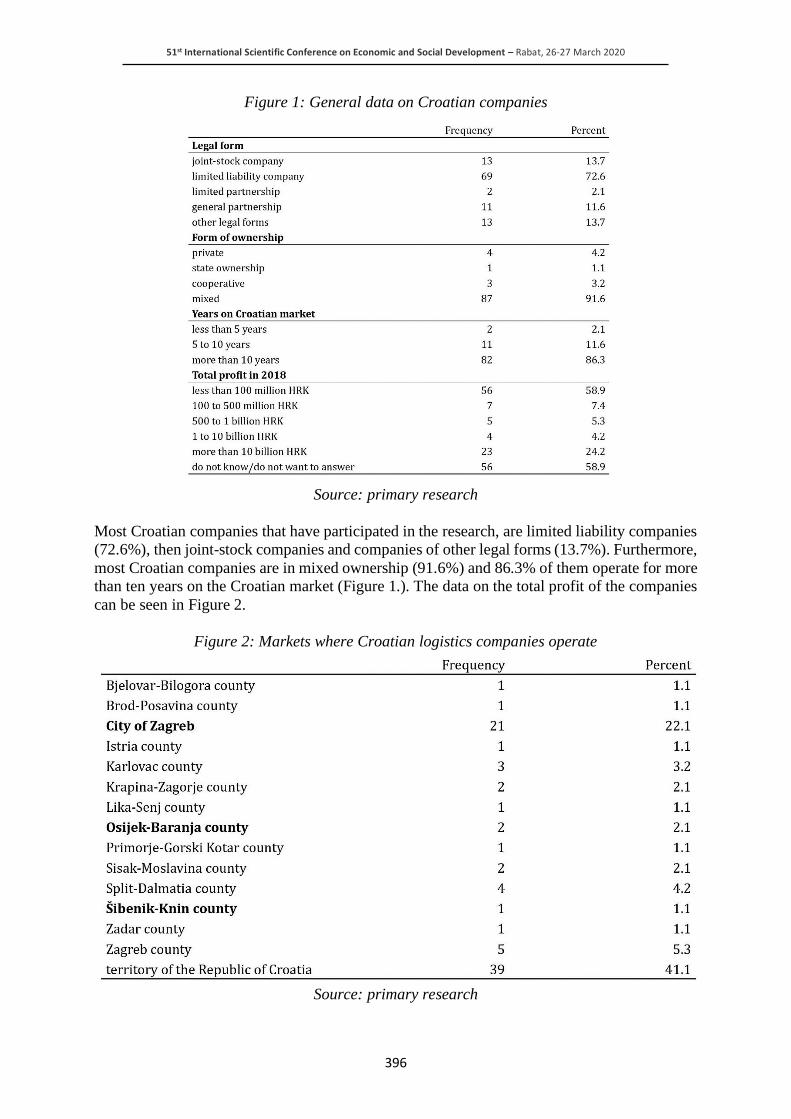
51st International Scientific Conference on Economic and Social Development – Rabat, 26-27 March 2020
396
Figure 1: General data on Croatian companies
Source: primary research
Most Croatian companies that have participated in the research, are limited liability companies
(72.6%), then joint-stock companies and companies of other legal forms (13.7%). Furthermore,
most Croatian companies are in mixed ownership (91.6%) and 86.3% of them operate for more
than ten years on the Croatian market (Figure 1.). The data on the total profit of the companies
can be seen in Figure 2.
Figure 2: Markets where Croatian logistics companies operate
Source: primary research
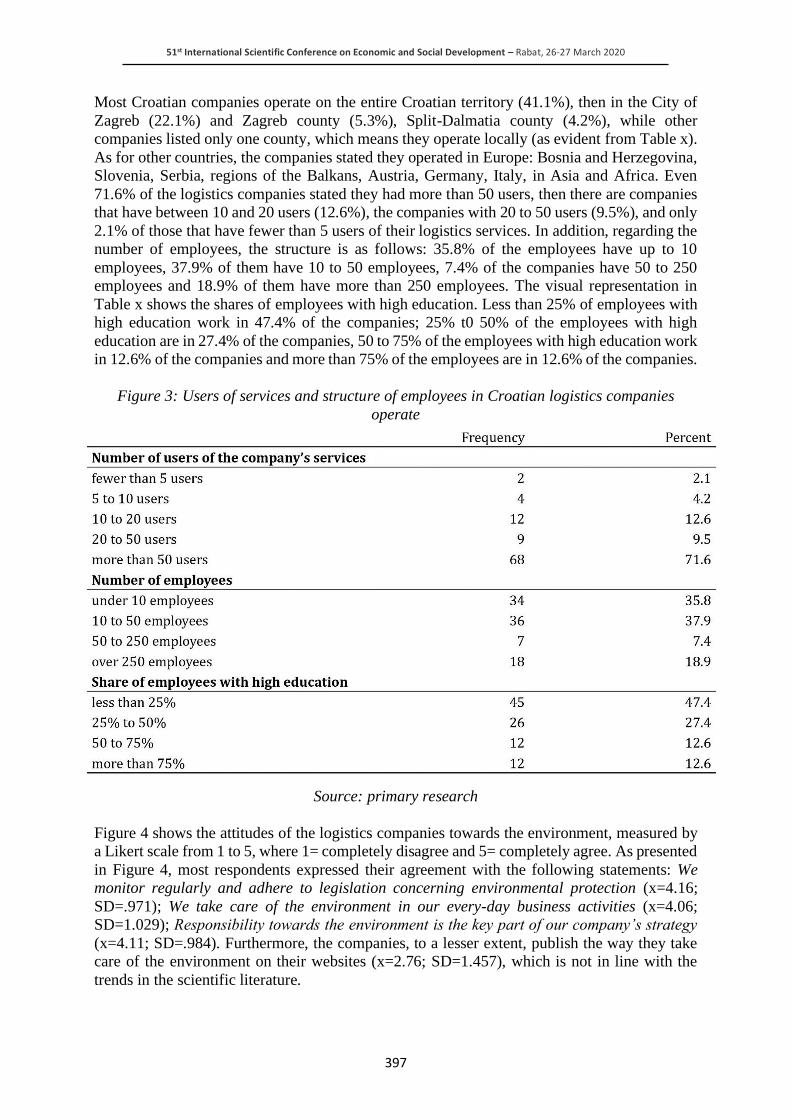
51st International Scientific Conference on Economic and Social Development – Rabat, 26-27 March 2020
397
Most Croatian companies operate on the entire Croatian territory (41.1%), then in the City of
Zagreb (22.1%) and Zagreb county (5.3%), Split-Dalmatia county (4.2%), while other
companies listed only one county, which means they operate locally (as evident from Table x).
As for other countries, the companies stated they operated in Europe: Bosnia and Herzegovina,
Slovenia, Serbia, regions of the Balkans, Austria, Germany, Italy, in Asia and Africa. Even
71.6% of the logistics companies stated they had more than 50 users, then there are companies
that have between 10 and 20 users (12.6%), the companies with 20 to 50 users (9.5%), and only
2.1% of those that have fewer than 5 users of their logistics services. In addition, regarding the
number of employees, the structure is as follows: 35.8% of the employees have up to 10
employees, 37.9% of them have 10 to 50 employees, 7.4% of the companies have 50 to 250
employees and 18.9% of them have more than 250 employees. The visual representation in
Table x shows the shares of employees with high education. Less than 25% of employees with
high education work in 47.4% of the companies; 25% t0 50% of the employees with high
education are in 27.4% of the companies, 50 to 75% of the employees with high education work
in 12.6% of the companies and more than 75% of the employees are in 12.6% of the companies.
Figure 3: Users of services and structure of employees in Croatian logistics companies
operate
Source: primary research
Figure 4 shows the attitudes of the logistics companies towards the environment, measured by
a Likert scale from 1 to 5, where 1= completely disagree and 5= completely agree. As presented
in Figure 4, most respondents expressed their agreement with the following statements: We
monitor regularly and adhere to legislation concerning environmental protection (x=4.16;
SD=.971); We take care of the environment in our every-day business activities (x=4.06;
SD=1.029); Responsibility towards the environment is the key part of our company’s strategy
(x=4.11; SD=.984). Furthermore, the companies, to a lesser extent, publish the way they take
care of the environment on their websites (x=2.76; SD=1.457), which is not in line with the
trends in the scientific literature.
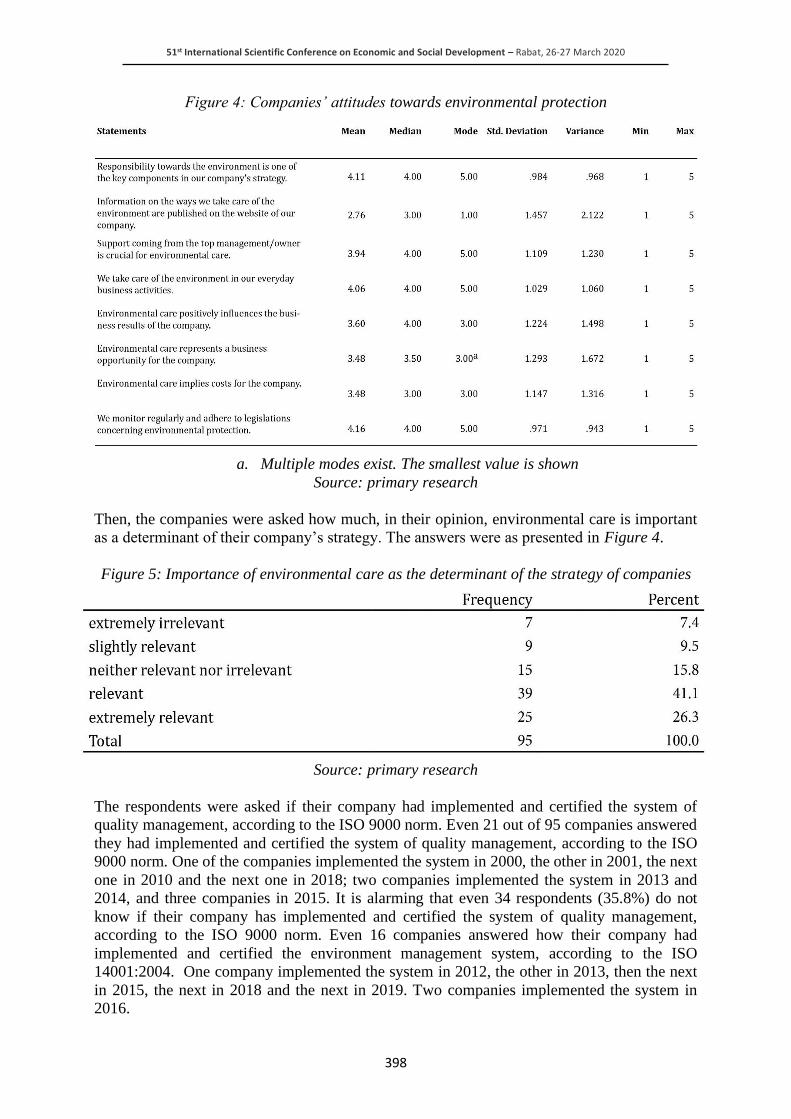
51st International Scientific Conference on Economic and Social Development – Rabat, 26-27 March 2020
398
Figure 4: Companies’ attitudes towards environmental protection
a. Multiple modes exist. The smallest value is shown
Source: primary research
Then, the companies were asked how much, in their opinion, environmental care is important
as a determinant of their company’s strategy. The answers were as presented in Figure 4.
Figure 5: Importance of environmental care as the determinant of the strategy of companies
Source: primary research
The respondents were asked if their company had implemented and certified the system of
quality management, according to the ISO 9000 norm. Even 21 out of 95 companies answered
they had implemented and certified the system of quality management, according to the ISO
9000 norm. One of the companies implemented the system in 2000, the other in 2001, the next
one in 2010 and the next one in 2018; two companies implemented the system in 2013 and
2014, and three companies in 2015. It is alarming that even 34 respondents (35.8%) do not
know if their company has implemented and certified the system of quality management,
according to the ISO 9000 norm. Even 16 companies answered how their company had
implemented and certified the environment management system, according to the ISO
14001:2004. One company implemented the system in 2012, the other in 2013, then the next
in 2015, the next in 2018 and the next in 2019. Two companies implemented the system in
2016.
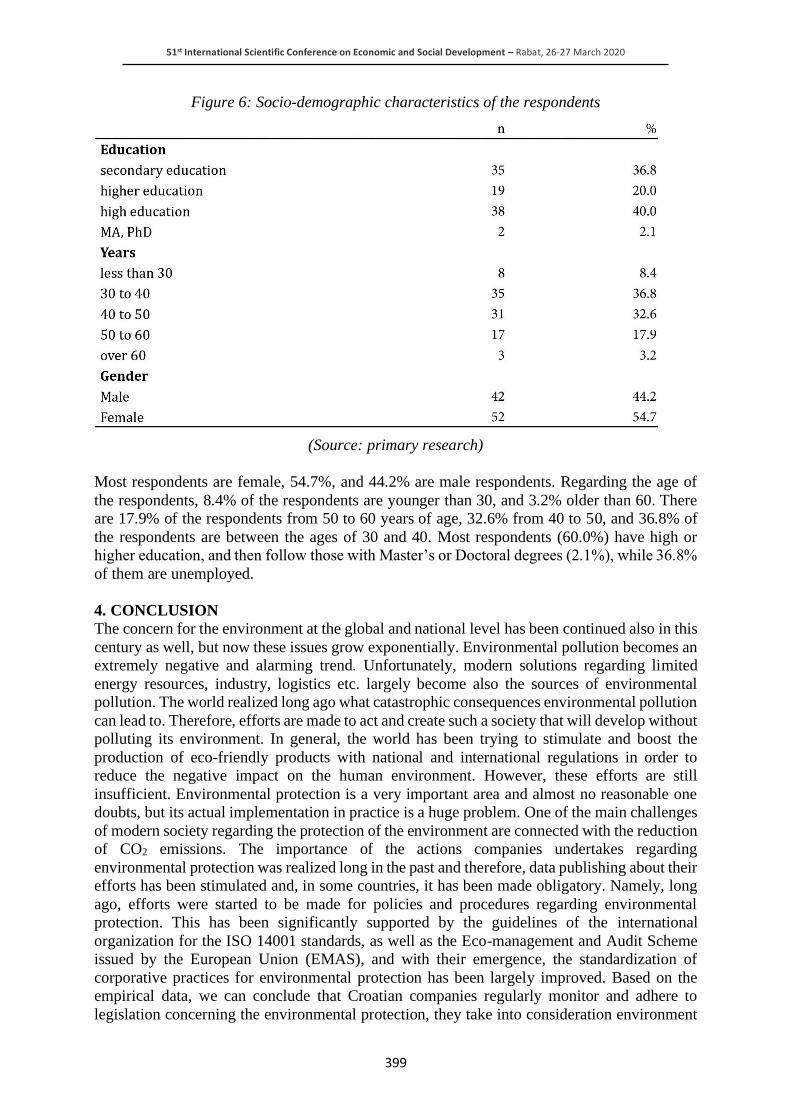
51st International Scientific Conference on Economic and Social Development – Rabat, 26-27 March 2020
399
Figure 6: Socio-demographic characteristics of the respondents
(Source: primary research)
Most respondents are female, 54.7%, and 44.2% are male respondents. Regarding the age of
the respondents, 8.4% of the respondents are younger than 30, and 3.2% older than 60. There
are 17.9% of the respondents from 50 to 60 years of age, 32.6% from 40 to 50, and 36.8% of
the respondents are between the ages of 30 and 40. Most respondents (60.0%) have high or
higher education, and then follow those with Master’s or Doctoral degrees (2.1%), while 36.8%
of them are unemployed.
4. CONCLUSION
The concern for the environment at the global and national level has been continued also in this
century as well, but now these issues grow exponentially. Environmental pollution becomes an
extremely negative and alarming trend. Unfortunately, modern solutions regarding limited
energy resources, industry, logistics etc. largely become also the sources of environmental
pollution. The world realized long ago what catastrophic consequences environmental pollution
can lead to. Therefore, efforts are made to act and create such a society that will develop without
polluting its environment. In general, the world has been trying to stimulate and boost the
production of eco-friendly products with national and international regulations in order to
reduce the negative impact on the human environment. However, these efforts are still
insufficient. Environmental protection is a very important area and almost no reasonable one
doubts, but its actual implementation in practice is a huge problem. One of the main challenges
of modern society regarding the protection of the environment are connected with the reduction
of CO2 emissions. The importance of the actions companies undertakes regarding
environmental protection was realized long in the past and therefore, data publishing about their
efforts has been stimulated and, in some countries, it has been made obligatory. Namely, long
ago, efforts were started to be made for policies and procedures regarding environmental
protection. This has been significantly supported by the guidelines of the international
organization for the ISO 14001 standards, as well as the Eco-management and Audit Scheme
issued by the European Union (EMAS), and with their emergence, the standardization of
corporative practices for environmental protection has been largely improved. Based on the
empirical data, we can conclude that Croatian companies regularly monitor and adhere to
legislation concerning the environmental protection, they take into consideration environment
51st International Scientific Conference on Economic and Social Development – Rabat, 26-27 March 2020
400
in their every-day business activities and put the environmental protection in the heart of their
company’s strategy. It is important to understand that business sustainability must imply a
comprehensive strategy and not just a few isolated efforts and attempts. In line with that, the
programs for the improvement of environmental protection have to be developed on continuous
principles and focus on all that can be used for the welfare of the environment.
LITERATURE:
1. Aguilera, R.V., Rupp, D.E., Williams, C.A. and Ganapathi, J. (2007). Putting the S Back in
Corporate Social Responsibility: A Multilevel Theory of Social Change in Organizations,
Academy of Management Review, 32, pp. 836-863.
2. Antonioli, D., Mancinelli, S. and Mazzanti, M. (2013). Is environmental innovation
embedded within high-performance organisational changes? The role of human resource
management and complementarily in green business strategies, Research Policy, 42(4), pp.
975-988.
3. Bagur-Femenias, L., Llach, J. and Alonso-Almeida, M.M. (2013). Is the adoption of
environmental practices a strategical decision for small service companies? An empirical
approach, Management Decision, 51(1), pp. 41–62.
4. Bieger, T. and Wittmer, A. (2006). Air transport and tourism - Perspectives and challenges
for destinations, airlines and governments. Journal of air transport management, 12(1), pp.
40-46.
5. Bina, O. (2013). The green economy and sustainable development: an uneasy balance?,
Environment and Planning C: Government and Policy, 31, pp. 1023-1047.
6. Blanchard O. and Leigh D. (2013). Growth Forecast Errors and Fiscal Multipliers, in: IMF
Working Paper, no. 1.
7. Buchholz, R. (1998). Principles of Environmental Management: The Greening of Business
(Prentice Hall, New Jersey).
8. Cardwell, L.K. (1984). Between Two Worlds: Science, the Environmental Policy:
Emergence and Dimension. 2nd Ed. Durham NC: Duke University Press.
9. Carmichael, J. and Brulle, R. (2017). Elite cues, media coverage, and public concern: an
integrated path analysis of public opinion on climate change, 2001–2013., Environmental
Politics, 26(2), pp. 232-252.
10. Chittaie, R. (2012). Customer relationship business management and business strategies,
International Journal of Organizational Leadership, 1(1), pp. 13–22.
11. Cleary, J. (2009). Life cycle assessments of municipal solid waste management systems: A
comparative analysis of selected peer-reviewed literature, Environ. Int., 35, pp. 1256–1266.
12. Esty, D. C., Levy, M.A., Kim, C.H., de Sherbinin A., Srebotnjak T. and Mara V. (2008).
2008 Environmental Performance Index. New Haven: Yale Center for Environmental Law
and Policy.
13. Galpin, T., Whittington, J.L. and Bell, G. (2015). Is your sustainability strategy sustainable?
Creating a culture of sustainability, Corporate Governance, 15(1), pp. 1-17.
14. García-Sánchez, I.M., Alexandre das Neves Almeida, Th. and Paes de Barros Camara, R.
(2015). A proposal for a Composite Index of Environmental Performance (CIEP) for
countries, Ecological Indicators, 48, pp. 171-188.
15. Hassini, E., Surti, C. and Searcy, C. (2012). A literature review and a case study of
sustainable supply chains with a focus on metrics, International Journal of Production
Economics, 140(1), pp. 69-82.
16. Hui. I. K., Chan. A. H. S. and Pun. K. F. (2001). A study of the EMS implementation
practices, Journal of Cleaner Production, 9, pp. 269-276.
17. International Monetary Fund. Secretary's Department (2013), International MonetaryFund
Annual Report 2013: Promoting a More Secure and STable no. Global Economy.
51st International Scientific Conference on Economic and Social Development – Rabat, 26-27 March 2020
401
18. Iqbal, Q., Hassan, S.H., Akhtar, S. and Khan, S. (2018). Employee’s green behaviour for
environmental sustainability: a case of banking sector in Pakistan, World Journal of
Science, Technology and Sustainable Development, 15(2), pp. 118-130.
19. Jabbour, C.J.C., Sarkis, J., de Sousa Jabbour, A.B.L., Renwick, D.W.S., Singh, S.K.,
Grebinevych, O. and Godinho Filho, M. (2019). Who is in charge? A review and a research
agenda on the ‘human side’ of the circular economy, Journal of Cleaner Production, 222,
pp. 793-801.
20. Jasch. C. (2000). Environmental performance evaluation and indicators. Journal of Cleaner
Production, 8(1), pp. 79-88.
21. Jones, K., T. Alabaster and J. Walton (1998). Virtual Environments for Environmental
Reporting , Greener Management International, 21, pp. 121-137.
22. Joshi, J., Krishnan, R. and Lavel L., (2000). Estimating the hidden costs of environmental
regulation, The Accounting Review, 76(2), pp. 171-198.
23. King. A. A. and Lenox. M. J. (2001). Does it really pay to be green? An empirical study of
firm environmental and financial performance. Journal of Industrial Ecology, 5(1), pp.
105– 116.
24. Kolk, A. (2003). Trends in Sustainability Reporting by the Fortune Global 250, Business
Strategy and the Environment, 12, pp. 279-291.
25. Mahalingam, S. and Ramesh B. (2013). Experimental and Emission Analysis of Rubber
Seed Oil and Jatropha Oil Blends with Diesel in Compression Ignition Engine, IREME
Journal, 7(5), pp. 955-959.
26. Metrick, C. (2001). Env Reporting Forum IRCC Reports on Corporate Environmental
Performance in Japan’, Retrieved 13.01.2020 from
http://www.listserv.moses.com/pipermail/ env reporting forum/2001/
27. Neumann, K., Anderson, C. and Denich, M.(2018). Participatory, explorative, qualitative
modeling: application of the iMODELER software to assess trade-offs among the SDGs.
Economics: The Open-Access, Open-Assessment E-Journal, 12 (25), pp. 1-19.
28. Ruiz-Real, J.L., Uribe-Toril, J., Valenciano, J.D.P. and Gázquez-Abad, J.C. (2018).
Worldwide Research on Circular Economy and Environment: A Bibliometric Analysis. Int.
J. Environ. Res. Public Health 15, 2699.
29. Sambasivan. M. and Fei. N.Y. (2007). Evaluation of critical success of implementation of
ISO 14001 using analytic hierarchy process (AHP): A case study from Malaysia. Journal
of Cleaner Production, 16, pp. 1424-1433.
30. Tan. L. P. (2005). Implementing ISO 14001: Is it beneficial for firms in newly industrialized
Malaysia? Journal of Cleaner Production, 13(4), pp. 397-404.
31. Teixeira, A.A., Jabbour, C.J.C., de Sousa Jabbour, A.B.L., Latan, H. and De Oliveira, J.H.C.
(2016). Green training and green supply chain management: evidence from Brazilian firms,
Journal of Cleaner Production, 116, pp. 170-176.
32. Vos, R.O. (2007). Defining sustainability: a conceptual orientation, Journal of Chemical
Technology and Biotechnology, 82(4), pp. 334-339.
33. Zutshi. A. and Sohal. A. (2004). Environmental management system adaption by
Australasian organizations: Part 1: Reasons. benefits. and impediments. Technovation,
24(4), pp. 335–357.
34. Wagner, B. and Svensson, G. (2014), A framework to navigate sustainability in business
networks: the transformative business sustainability (TBS) model, European Business
Review, 26(4), pp. 340-367.
35. White, A. (1999), Sustainability and the Accountable Corporation, Environment, 41(8), pp.
30-43.
36. Wu, Z. and Pagell, M. (2011). Balancing priorities: decision-making in sustainable supply
chain management, Journal of Operations Management, 29(6), pp. 577-599

51st International Scientific Conference on Economic and Social Development – Rabat, 26-27 March 2020
402
THE CONCEPT OF ADAPTIVE INFORMATION SECURITY
MANAGEMENT IN DIGITAL ORGANIZATIONS BASED ON THE
ANALYSIS AND MONITORING OF BUSINESS PROCESSES
Zinaida Rodionova
Novosibirsk State University of Economics and Management, Russian Federation
Irbulat Utepbergenov
Institute of information and computational technologies, Republic of Kazakhstan
ABSTRACT
During the large-scale transition to digital economy technologies, the challenges of protection
of information resources are compounded by dynamic changes in business processes due to the
interference of the external environment that directly affect the internal environment of the
organization. External changes include changes caused by the legislation or regulation
documents of superior bodies. Internal changes can be caused by business processes
optimization, joint use of information resources with other enterprises, changes in information
processing technologies, etc. These changes affect all elements of the information security
system: information resources, concept papers, instructions and regulations, configuration of
software and hardware solutions. Information support of the changing business processes
requires new information resources and their security supposes special approach. The article
describes the process of adaptive information security management of a digital organization
on the conceptual level based on the analysis and monitoring of business processes that are
dynamically changing under the influence of external and internal environment. A model of
information security management system designing and development process that meets the
ISO/IEC 27000 family standards with the possibility of implementing adaptation mechanisms
is presented in general way. The methodology, tools and methods of system analysis to be used
in the project on the development and implementation of information security management
system of an organization are suggested. The approach to organization information security
risk management based on the analysis of business processes is presented.
Keywords: business process, concept, digital organization, information security management
1. INTRODUCTION
The steady growth of information security malfunctions, confirmed by numerous foreign and
domestic studies (InfoWatch, SearchInform, PwC, etc.) makes the task of ensuring the
protection of information resources and IT infrastructure a high priority. Thus, the Doctrine of
Information Security of the Russian Federation, approved by the President of the Russian
Federation on 5 December, 2016, puts "protection of information resources both existing and
emerging on the territory of Russia" in the list of four main components of national interests in
the information sphere. The very essence of the modern enterprise activity supposes a change
or a significant modification of the business model, as well as a dynamic change of processes
and technologies throughout the life cycle of a product and/or pro-ject, which makes the use of
the classical information security management system (hereinafter ISMS) not effective. Such
approach does not allow to quickly track and apply these changes to the settings of ISMS, as a
result, the man-agement process is time-consuming, expensive, and poorly formalized. It should
be noted that functioning of an organ-ization in digital environment leads to emergence of new
threats and vulnerabilities for information systems, such as cyber terrorism, confidential
information leakage, the risks of electronic payments, unreliable data networks, the threat of
51st International Scientific Conference on Economic and Social Development – Rabat, 26-27 March 2020
403
"identity theft" due to the use of digital identification, the risks of "Internet of things" and others
that need to be studied and require development of counteractions methods. In addition, greater
attention should be given to the protection of innovations used in producing goods and
providing services [1]. Establishing ISMS of an organization based on the analysis and
monitoring of business processes will ensure its ef-fective adaptation to changes in business
environment and the specific features of generated information resources.
2. USE OF PROCESS APPROACH FOR AN ORGANIZATION INFORMATION
SECURITY MANAGEMENT
All above mentioned allows to conclude that the effective ISMS of an organization can be
created using process ap-proach that is also stated in section 0.2. "Process approach" of
International standard ISO/IEC 27001 "Information technology. Security techniques.
Information security management systems. Requirements." The essence of the process or
system approach is the ability to analyse the system as a whole, not its parts, but its practical
implementation for the purpose of information security management faces with difficulties,
which on the one hand are connected with the lack of a description of clear mechanisms, on the
other with the uncertainty of knowledge sources. The key role in information security
management of an organization is played by the information security man-agement system
(hereinafter ISMS), which is understood as a system that allows establishing, implementing,
operating, monitoring, reviewing, maintaining and improving information assets security to
achieve the strategic goals of an or-ganization. An ISMS design process is described in detail
in the ISO/IEC 27000 family of standards "Information security man-agement systems". To
structure management process, the "Plan-Do-Check-Act" (PDCA) model is adopted [2]. In
accordance with process approach and PDCA model four steps in designing ISMS are defined:
the ISMS estab-lishing; implementing and working of the ISMS; monitoring and review of the
ISMS; update and improvement of the ISMS. Next, we consider in more detail milestones and
stages of the ISMS design project (hereinafter the ISMS project), which supposes application
of system analysis methods.
3. USE OF SYSTEM ANALYSIS METHODS AND TOOLS FOR ISMS DESIGN AND
DEVELOPMENT
Figure 1 shows the business process model "ISMS design and development", made in the
IDEF0 notation of functional modelling. Statement of work, as well as work conditions are
developed in accordance with ISO/IEC 27003 "Information technology - Security techniques -
Information security management systems - Guidance". The methods and tools of system
analysis suggested for the implementation of works related to the design and development of
ISMS, which will formalize the process of creating ISMS and ensure the subsequent adaptation
of the system to changes in the external and internal environment are highlighted in the figure
in bold italics. The work of the first phase of ISMS development begins with the approval of
the guidelines for the launch of the ISMS project. The justification for the implementation of
this project is made by describing the use of ISMS for this organization and drawing up a draft
project plan. To manage an ISMS project ISO 21500 standard "Guidance on project
management" can be used. During the first phase, an organization's priorities for the
development of ISMS are specified and ISMS main objectives are set. The priorities of ISMS
are determined in accordance with the strategy of activities, indicated in "Business Strategy", a
document which can show business objectives graphically in the form of a "Strategic map" [3].
DFD (Data Flow Diagram), methodology of graphic structural analysis can be used to
determine the priority areas of information security of an organization. The model is
recommended to display the priority directions of economic activity of an organization and the
corresponding information systems and information flows.
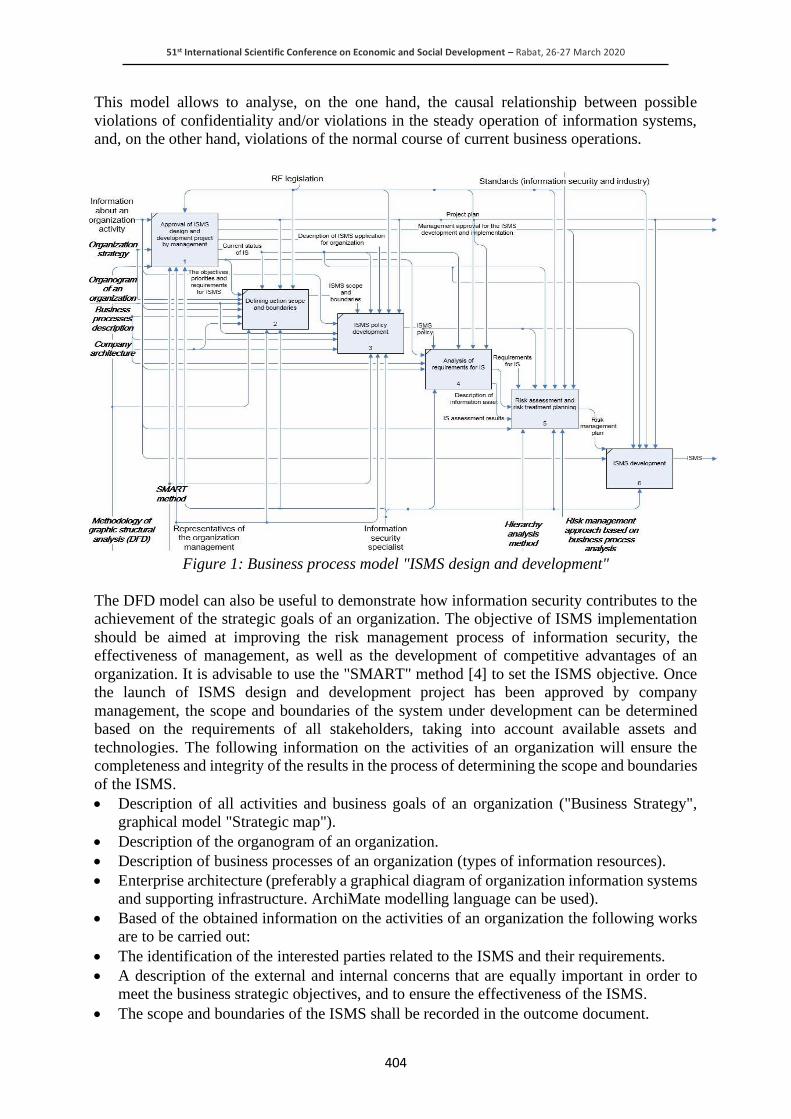
51st International Scientific Conference on Economic and Social Development – Rabat, 26-27 March 2020
404
This model allows to analyse, on the one hand, the causal relationship between possible
violations of confidentiality and/or violations in the steady operation of information systems,
and, on the other hand, violations of the normal course of current business operations.
Figure 1: Business process model "ISMS design and development"
The DFD model can also be useful to demonstrate how information security contributes to the
achievement of the strategic goals of an organization. The objective of ISMS implementation
should be aimed at improving the risk management process of information security, the
effectiveness of management, as well as the development of competitive advantages of an
organization. It is advisable to use the "SMART" method [4] to set the ISMS objective. Once
the launch of ISMS design and development project has been approved by company
management, the scope and boundaries of the system under development can be determined
based on the requirements of all stakeholders, taking into account available assets and
technologies. The following information on the activities of an organization will ensure the
completeness and integrity of the results in the process of determining the scope and boundaries
of the ISMS.
• Description of all activities and business goals of an organization ("Business Strategy",
graphical model "Strategic map").
• Description of the organogram of an organization.
• Description of business processes of an organization (types of information resources).
• Enterprise architecture (preferably a graphical diagram of organization information systems
and supporting infrastructure. ArchiMate modelling language can be used).
• Based of the obtained information on the activities of an organization the following works
are to be carried out:
• The identification of the interested parties related to the ISMS and their requirements.
• A description of the external and internal concerns that are equally important in order to
meet the business strategic objectives, and to ensure the effectiveness of the ISMS.
• The scope and boundaries of the ISMS shall be recorded in the outcome document.

51st International Scientific Conference on Economic and Social Development – Rabat, 26-27 March 2020
405
Any exclusion of an entity from the scope of the ISMS needs to be justified in detail. The next
stage is the establishment of the information security policy. As a rule, the ISMS policy is an
extended version of the organization information security policy, so below we will describe the
process of a general document development. It is advisable to start the development of
information security policy by defining its objective, which can also be formulated through the
SMART method [4]. As a rule, the objective usually reflects the position of the management
on the information assets protection. The primary objective and several supporting objectives,
facilitating its implementation, can be identified. The primary objective of an organization in
the sphere of the information protection is associated with the provision of confidentiality,
integrity and availability of information. The set of strategic information security objectives
and the corresponding indicators of effectiveness can be presented graphically on a strategy
map. It is important to note that the information security strategy map can be developed as a
model for a specific department of the organization (for example, for its information security
department). The design of the information security strategy map seems be more effective
within the framework of a detailed business level strategy maps. Bellow follows the description
of the strategy of the set objectives implementation. The 5 P's of Strategy system, developed by
the Canadian scientist Henry Mintzberg, is a popular approach in the general theory of the
strategic management. CISCO, Gartner, ISACA and other similar approaches and models can
also be used for the business-oriented information security strategies development. For the
efficiency and utility reasons ISO/IEC 27003 recommends that along with the ISMS policy
development stage, the analysis of information security requirements should be carried out.
This development stage begins with the definition of the information security requirements for
the ISMS process. The primary information is usually obtained from the descriptions of
business processes thus allowing to assess the impact of information security incidents on the
business activities. A information security specialist needs to identify how important the
information circulating in each of the business processes is. All the data obtained are recorded
in the Information Security Outcome Document, which shall include: the definition of the main
business processes, functions, entities, information systems and communication networks;
business information assets; classification of the most important business processes and assets;
information security requirements; list of known vulnerabilities; requirements for information
security training and education. It is recommended that the organization identified assets be
detailed and described as follows: the business process name and its description (emphasis on
the activities assiated with the information asset– production, storage, transfer, removal); the
importance of the business process (critical, important, supporting); the owner of the business
process; business processes providing input and output data; ICT; the asset classification. Based
on the information obtained, a preliminary assessment of the information security is made
through the comparison between the current state of the information security and the objectives
of the organization. The ISMS functioning is based on the process of the effective risk
management. The information security threats analysis and risk assessment is a continuous
ongoing process, the baseline data are determined at the initial stage of the ISMS design, then
in the process of its functioning changes in threats and risks are being monitored, their
reanalysis and evaluation being carried out . Guidelines for risk management are provided by
ISO / IEC 27005 standard Information technology - Security techniques - Information security
risk management. Risk management begins with the choice of a risk assessment methodology
[5] and the subsequent risks definition, analysis and assessment in line with the chosen
methodology. Most popular methods of risk assessment include: CRAMM, NIST two-factor
model, RiskWatch, GRIF system, methodology for identifying the urgent threats for the
personal data in the personal data information systems, Taubenberger-Jürjens method, etc. In
accordance with the chosen method, the following activities are to be carried out: identifying
threats and their sources; identifying existing and planned measures and means of control and

51st International Scientific Conference on Economic and Social Development – Rabat, 26-27 March 2020
406
management; identify vulnerabilities; determining the consequences of the loss of
confidentiality, safety, availability, non-repudiation or other violation of the information
security requirements; assessing the impact of incidents occurred; assessing the probability and
level of each risk; compare the level of risk with the criteria of risk assessment and acceptance.
The information obtained is recorded in the risk management plan. As a rule, the data for this
stage are usually collected from the employees and external experts questionnaires and
interviews, carried out during the pre-project survey and follow-up audits, thus complicating
the further update of the information. The authors propose an approach to risk management
based on the analysis of business processes, the feasibility of which is justified in [5]. At the
stage of the ISMS design the final plan for the ISMS implementation through the development
of the organization security system based on the selected risk treatment options is compiled, as
well as the requirements for keeping records and documents, combining ICT security measures,
physical and organizational processes and the development of the specific ISMS requirements.
4. INFORMATION SECURITY RISK MANAGEMENT BASED ON THE BUSINESS
PROCESS ANALYSIS
The analysis of formal models of business processes allows the organization to obtain the
information needed for the execution of a wide range of information security tasks. In particular
an automated approach to the formalization and updating user access rights based on the
analysis of the business process models in EPC notation (Event-Driven Process Chain) is
proposed in [6]. The approach to risk management based on the analysis of the organization
business processes involves the use of a formal business process model as the main source of
information for the threats and vulnerabilities analysis, as well as the further information
security risks assessment. Analysis of the most common methods of risk assessment [5, 7],
allowed us to determine the list of objects and their characteristics necessary foк the desing of
the model of threats and vulnerabilities: the information asset; the department in charge of the
information asset; the information carrier; information system; the user; characteristics of the
user access to the information; data transmission channel; storage resources; processing
technology. This list is not exhaustive and can be extended for the purposes of a specific
methodology of designing a threat and vulnerability model. Figure 2 presents the knowledge
metamodel, including functional, organizational and information models of a business process
and allowing to identify and update the organisation information security risks. The list of
characteristics of users ' access to the information is given in the callouts. The organizational
model defines the list of performers of the business process, scopes their duties and
responsibilities. The amendments to this model following the termination of employment,
transfer to another position, new employments, organizational structure changes, etc. through
the change management process influence the processes of allocation of duties and
responsibility, managing data access, risks, incidents and vulnerabilities. The business process
model will help to increase employees' awareness of information security issues, ensure the
continuity of the business process, and update the access control model. The information model
reflects the organization information systems, their units, functions, users and serves as a data
source for the purposes of the management and monitoring of the information infrastructure
and access rights management.
Figure following on the next page
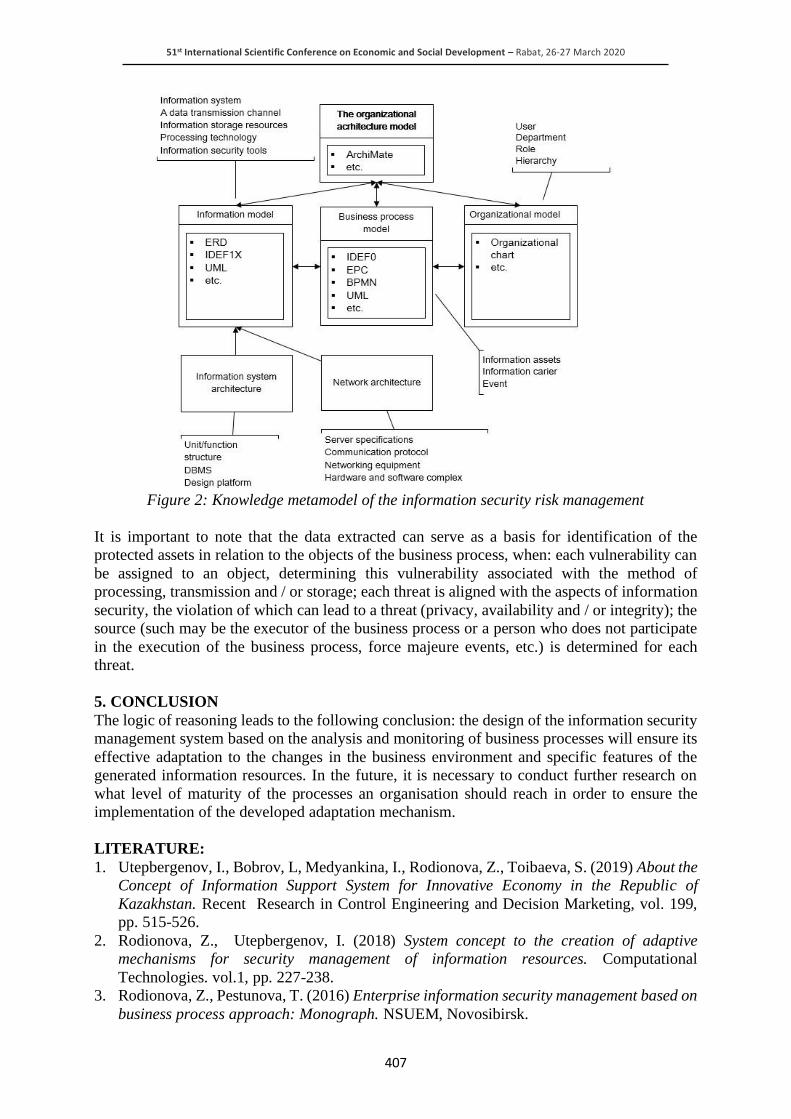
51st International Scientific Conference on Economic and Social Development – Rabat, 26-27 March 2020
407
Figure 2: Knowledge metamodel of the information security risk management
It is important to note that the data extracted can serve as a basis for identification of the
protected assets in relation to the objects of the business process, when: each vulnerability can
be assigned to an object, determining this vulnerability associated with the method of
processing, transmission and / or storage; each threat is aligned with the aspects of information
security, the violation of which can lead to a threat (privacy, availability and / or integrity); the
source (such may be the executor of the business process or a person who does not participate
in the execution of the business process, force majeure events, etc.) is determined for each
threat.
5. CONCLUSION
The logic of reasoning leads to the following conclusion: the design of the information security
management system based on the analysis and monitoring of business processes will ensure its
effective adaptation to the changes in the business environment and specific features of the
generated information resources. In the future, it is necessary to conduct further research on
what level of maturity of the processes an organisation should reach in order to ensure the
implementation of the developed adaptation mechanism.
LITERATURE:
1. Utepbergenov, I., Bobrov, L, Medyankina, I., Rodionova, Z., Toibaeva, S. (2019) About the
Concept of Information Support System for Innovative Economy in the Republic of
Kazakhstan. Recent Research in Control Engineering and Decision Marketing, vol. 199,
pp. 515-526.
2. Rodionova, Z., Utepbergenov, I. (2018) System concept to the creation of adaptive
mechanisms for security management of information resources. Computational
Technologies. vol.1, pp. 227-238.
3. Rodionova, Z., Pestunova, T. (2016) Enterprise information security management based on
business process approach: Monograph. NSUEM, Novosibirsk.

51st International Scientific Conference on Economic and Social Development – Rabat, 26-27 March 2020
408
4. Petrie, J. (2017) Aligning security with changing business strategy, goals and objectives
//IDG CONTRIBUTOR NETWORK. Retrieved 01.09.2019 from
https://www.csoonline.com/article/3231994/aligning-security-with-changing-business-
strategy-goals-and-objectives.html.
5. Rodionova, Z., Pestunova, T., Gorinova, S. (2014) Analysis of information security aspects
based on formal business-process models. Tomsk State University of Control Systems and
Radioelectronics, pp. 150-156.
6. Rodionova, Z. (2015) Design of Algorithms for Automated Access Control Based on
Business Process Approach. Computational Technologies. vol.1, pp. 218-224.
7. Utepbergenov, I, Bobrov, L., Medyankina, I., Rodionova, Z., Toibaeva, S. (2019) About the
Concept of Information Support System for Innovative Economy in the Republic of
Kazakhstan. Recent Research in Control Engineering and Decision Marketing, vol. 199, pp.
515-526.
51st International Scientific Conference on Economic and Social Development – Rabat, 26-27 March 2020
409
THE DYNAMIC OF INDICATORS OF THE FINANCIAL MARKET IN
THE PROCESS OF CYCLICAL DEVELOPMENT IN THE NATIONAL
ECONOMY
Viktor Barkhatov
Institute of Economics of industries, business and administration
Chelyabinsk State University
Chelyabinsk, Russia
Ekaterina Lymar
Institute of Economics of industries, business and administration
Chelyabinsk State University
Chelyabinsk, Russia
Ivan Koptelov
Institute of Economics of industries, business and administration
Chelyabinsk State University
Chelyabinsk, Russia
ABSTRACT
The market economy assumes a cyclical economic development. Many of the scientists have
identified the relationship between the economic and financial cycles. The emergence of
financial markets in the early 20th century gave rise to the theory of financial cycles, which
shape financial ups and downs, like economic cycles. It is necessary to identify and analyze
indicators of financial cycles in the national economy, which make it possible to predict the ups
and downs of the financial and, consequently, economic cycles. The article describes in detail
the indicators characterizing the financial market and having an impact on the financial and
economic cycles. The purpose of the article is to present the results of the analysis of indicators
characterizing the financial market in the process of cyclical development of the national
economy. The present study based on the analysis of eight relative indicators chosen to identify
financial cycles in the Russian economy. The indicators are compiled in such a way as to cover
as widely as possible all areas of the economy that may be affected in the event of General
changes in the financial markets. In turn, information on the joint dynamics of economic
variables in an aggregated form can be collected the basis of factor model. Within the
framework of this approach, a statistically significant correlation between variables can be
considered as a consequence of the influence of common factors on them (in this case, the
phases of the financial cycle).
Keywords: financial crisis, financial cycles, financial markets, financial recovery, national
economy
1. INTRODUCTION
Market economy assumes the circularity of economic development since it involves inflation,
business climate, law of demand, and other factors. The emergence of financial markets in the
early 20th century gave impetus to the development of the theory of financial cycles, which
account for financial ups and downs similarly with economic cycles. Though the theory of
financial cycles is today at its infant stage, it has been rapidly developing since the conceptual
emergence of financial markets and the avowal of their significance for global economy.
51st International Scientific Conference on Economic and Social Development – Rabat, 26-27 March 2020
410
The study is based on the analysis of eight relative indicators selected for identifying financial
cycles in the Russian economy. The indicators are compiled in such a way as to cover as widely
as possible all areas of the economy that may be affected in the event of General changes in the
financial markets.
2. LITERATURE REVIEW
Many economists have spoken about the impact of the financial system on the cyclical nature
of the economy. They identified various indicators of influence and developed methods for
assessing it. A. Gelb pointed to the correlation of indicators of financial markets and phases of
financial and economic cycles. Based on the regression analysis, R. Rajan and L. Zingales argue
that the high degree of development of financial markets contributes to the development of new
enterprises, especially in knowledge-intensive industries, which leads to overall economic and
financial growth. In the early 1990s. R. King and R. Levine considered indicators of financial
development of 77 countries for 1960-1989. their work was based on such indicators as:
financial depth, the share of private banks in loans, credit to private business, the ratio of loans
to private enterprises to GDP, and so on. They calculated significant coefficients for 77
countries and, based on the regression equation, found a strong relationship between them. In
addition to banking indicators, Levine's further research took into account the role of the stock
market in financial development. It was found that the initial level of stock market liquidity,
along with the initial level of development of the credit system, has a positive correlation with
future rates of economic growth, capital accumulation and labor productivity growth. T. Beck
and N. Loayza investigated the impact of the development of financial intermediaries on the
rate of investment savings. Their research did not confirm a stable relationship between these
indicators. However, a statistical relationship was found between the development of financial
intermediaries and GDP. These views confirmed the opinion. J. Schumpeter on financial
development.
3. DYNAMIC OF INDICATORS OF THE FINANCIAL MARKET (1999-2018)
Indicator K1 - the ratio of banks ' requirements to the economy to GDP. This indicator is used
to measure the debt burden at the macro level and is recommended by the Basel III international
standards as a baseline for calculating the credit gap and determining the amount of regulatory
capital. As extensive international practice shows, the creditworthiness of the real sector of the
economy is a reliable harbinger of a full-scale banking and, as a consequence, financial crisis.
The selected variable more correctly reflects changes in the credit load than, for example, the
growth rate of new lending, since, being expressed as a percentage of GDP, the indicator is
normalized by the size of the economy. [1] This suggests that, first, it is not affected by the
natural cyclical demand for loans, and, secondly, it has a more smoothed dynamics than other
similar indicators.
Figure following on the next page
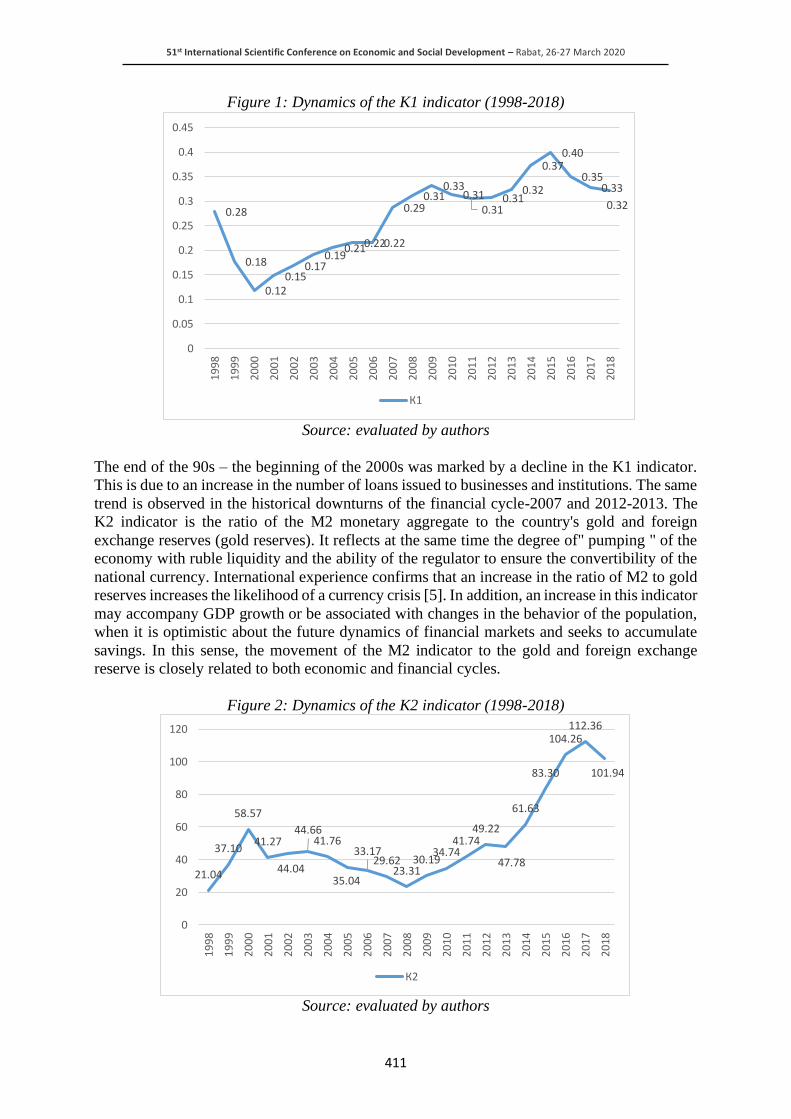
51st International Scientific Conference on Economic and Social Development – Rabat, 26-27 March 2020
411
Figure 1: Dynamics of the K1 indicator (1998-2018)
Source: evaluated by authors
The end of the 90s – the beginning of the 2000s was marked by a decline in the K1 indicator.
This is due to an increase in the number of loans issued to businesses and institutions. The same
trend is observed in the historical downturns of the financial cycle-2007 and 2012-2013. The
K2 indicator is the ratio of the M2 monetary aggregate to the country's gold and foreign
exchange reserves (gold reserves). It reflects at the same time the degree of" pumping " of the
economy with ruble liquidity and the ability of the regulator to ensure the convertibility of the
national currency. International experience confirms that an increase in the ratio of M2 to gold
reserves increases the likelihood of a currency crisis [5]. In addition, an increase in this indicator
may accompany GDP growth or be associated with changes in the behavior of the population,
when it is optimistic about the future dynamics of financial markets and seeks to accumulate
savings. In this sense, the movement of the M2 indicator to the gold and foreign exchange
reserve is closely related to both economic and financial cycles.
Figure 2: Dynamics of the K2 indicator (1998-2018)
Source: evaluated by authors
0.28
0.18
0.120.15
0.170.19
0.210.220.22
0.290.31
0.330.31
0.310.31
0.32
0.370.40
0.350.33
0.32
0
0.05
0.1
0.15
0.2
0.25
0.3
0.35
0.4
0.45
19
98
19
99
20
00
20
01
20
02
20
03
2004
20
05
20
06
2007
20
08
20
09
20
10
20
11
20
12
20
13
2014
20
15
20
16
20
17
20
18
К1
21.04
37.10
58.57
41.27
44.04
44.6641.76
35.04
33.1729.62
23.3130.19
34.7441.74
49.22
47.78
61.63
83.30
104.26112.36
101.94
0
20
40
60
80
100
120
1998
19
99
20
00
20
01
2002
20
03
20
04
20
05
2006
20
07
20
08
20
09
20
10
20
11
20
12
20
13
20
14
2015
20
16
20
17
20
18
К2
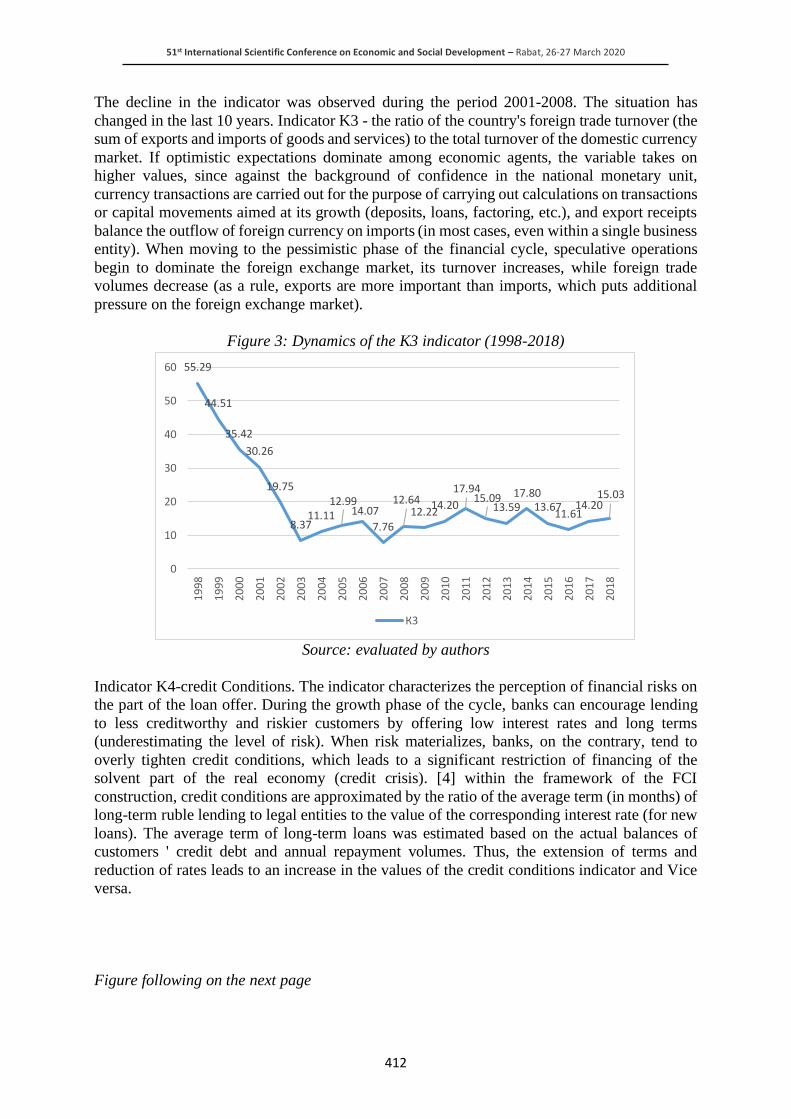
51st International Scientific Conference on Economic and Social Development – Rabat, 26-27 March 2020
412
The decline in the indicator was observed during the period 2001-2008. The situation has
changed in the last 10 years. Indicator K3 - the ratio of the country's foreign trade turnover (the
sum of exports and imports of goods and services) to the total turnover of the domestic currency
market. If optimistic expectations dominate among economic agents, the variable takes on
higher values, since against the background of confidence in the national monetary unit,
currency transactions are carried out for the purpose of carrying out calculations on transactions
or capital movements aimed at its growth (deposits, loans, factoring, etc.), and export receipts
balance the outflow of foreign currency on imports (in most cases, even within a single business
entity). When moving to the pessimistic phase of the financial cycle, speculative operations
begin to dominate the foreign exchange market, its turnover increases, while foreign trade
volumes decrease (as a rule, exports are more important than imports, which puts additional
pressure on the foreign exchange market).
Figure 3: Dynamics of the K3 indicator (1998-2018)
Source: evaluated by authors
Indicator K4-credit Conditions. The indicator characterizes the perception of financial risks on
the part of the loan offer. During the growth phase of the cycle, banks can encourage lending
to less creditworthy and riskier customers by offering low interest rates and long terms
(underestimating the level of risk). When risk materializes, banks, on the contrary, tend to
overly tighten credit conditions, which leads to a significant restriction of financing of the
solvent part of the real economy (credit crisis). [4] within the framework of the FCI
construction, credit conditions are approximated by the ratio of the average term (in months) of
long-term ruble lending to legal entities to the value of the corresponding interest rate (for new
loans). The average term of long-term loans was estimated based on the actual balances of
customers ' credit debt and annual repayment volumes. Thus, the extension of terms and
reduction of rates leads to an increase in the values of the credit conditions indicator and Vice
versa.
Figure following on the next page
55.29
44.51
35.42
30.26
19.75
8.3711.11
12.9914.07
7.76
12.6412.22
14.20
17.9415.09
13.5917.80
13.6711.61
14.2015.03
0
10
20
30
40
50
60
19
98
19
99
2000
20
01
20
02
20
03
20
04
20
05
2006
20
07
20
08
20
09
20
10
20
11
2012
20
13
20
14
20
15
20
16
2017
20
18
К3

51st International Scientific Conference on Economic and Social Development – Rabat, 26-27 March 2020
413
Figure 4: Dynamics of the K4 indicator (1998-2018)
Source: evaluated by authors
The K5 indicator is the ratio of assets to equity in the banking sector (leverage). This indicator
clearly characterizes the cyclical nature of financial intermediaries ' activities. An increase in
leverage means an increase in the scale and risk of banking operations at a time when optimistic
sentiment prevails in the economy. Accordingly, the reduction in the banking sector's assets
relative to its capital indicates the onset of a cyclical downturn in the financial market,
accompanied by the retirement of a significant amount of non-performing loans and the early
withdrawal of a "healthy" part of the assets from the economy. [3] at the same time, as a rule,
the conditions for granting new loans are sharply tightened and the efficiency of banking
activities is reduced.
Figure 5: Dynamics of the K5 indicator (1998-2018)
Source: evaluated by authors
Indicator K6 - the Ratio of the value of shares of joint-stock companies in circulation to the
annual revenue of organizations from the sale of manufactured products. Such indicators of
securities market capitalization are directly related to the business cycle rather than the financial
0.390.52
0.700.86
0.97
1.211.36
1.49
1.50
1.48
1.44
1.71
2.80
1.971.76
1.06
0.99
1.01
1.151.18
1.30
0
0.5
1
1.5
2
2.5
3
1998
19
99
20
00
2001
20
02
20
03
2004
20
05
20
06
2007
20
08
20
09
2010
20
11
20
12
2013
20
14
20
15
2016
20
17
20
18
К4
4.103.70
5.426.10
6.96 7.13
6.87
7.55
7.81
8.36
7.527.39
6.677.23
7.98
8.108.13
9.799.21
8.53
9.07
0
2
4
6
8
10
12
1998
1999
20
00
20
01
20
02
20
03
2004
20
05
20
06
20
07
20
08
20
09
2010
20
11
20
12
20
13
20
14
20
15
2016
20
17
20
18
К5
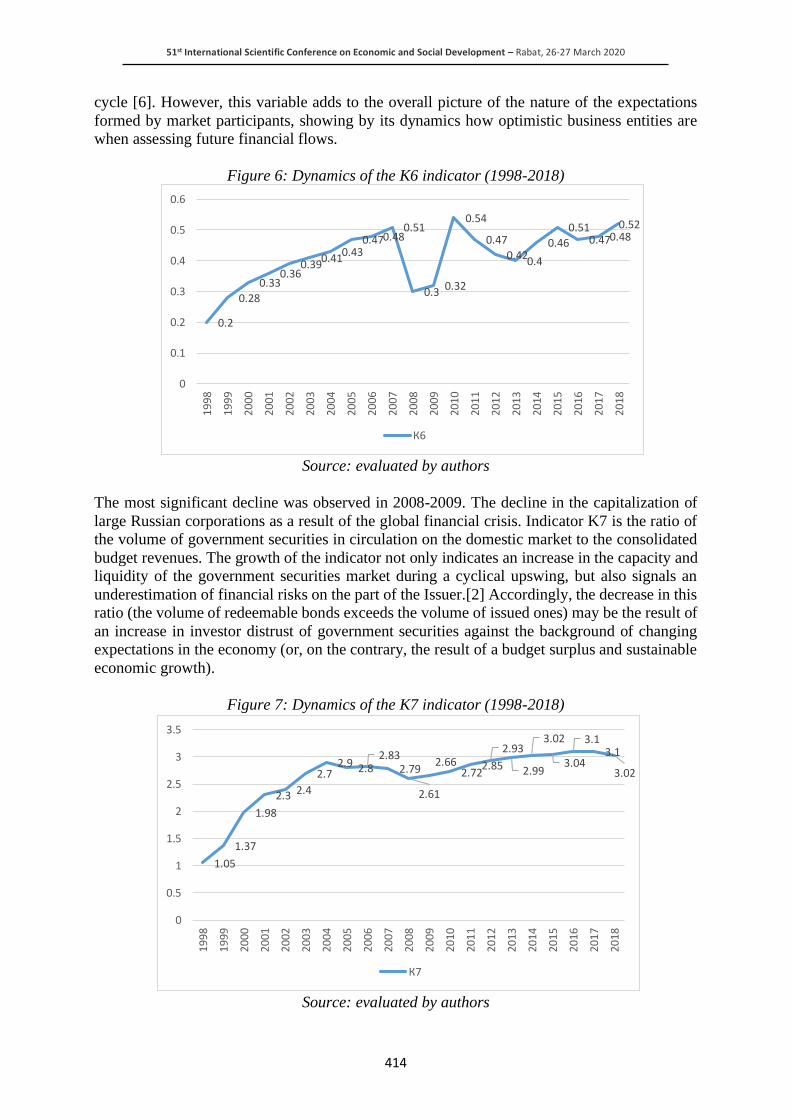
51st International Scientific Conference on Economic and Social Development – Rabat, 26-27 March 2020
414
cycle [6]. However, this variable adds to the overall picture of the nature of the expectations
formed by market participants, showing by its dynamics how optimistic business entities are
when assessing future financial flows.
Figure 6: Dynamics of the K6 indicator (1998-2018)
Source: evaluated by authors
The most significant decline was observed in 2008-2009. The decline in the capitalization of
large Russian corporations as a result of the global financial crisis. Indicator K7 is the ratio of
the volume of government securities in circulation on the domestic market to the consolidated
budget revenues. The growth of the indicator not only indicates an increase in the capacity and
liquidity of the government securities market during a cyclical upswing, but also signals an
underestimation of financial risks on the part of the Issuer.[2] Accordingly, the decrease in this
ratio (the volume of redeemable bonds exceeds the volume of issued ones) may be the result of
an increase in investor distrust of government securities against the background of changing
expectations in the economy (or, on the contrary, the result of a budget surplus and sustainable
economic growth).
Figure 7: Dynamics of the K7 indicator (1998-2018)
Source: evaluated by authors
0.2
0.28
0.330.36
0.390.41
0.430.470.48
0.51
0.30.32
0.54
0.47
0.420.4
0.46
0.510.470.48
0.52
0
0.1
0.2
0.3
0.4
0.5
0.619
98
19
99
20
00
2001
20
02
20
03
20
04
20
05
2006
20
07
20
08
2009
20
10
20
11
20
12
20
13
20
14
20
15
20
16
2017
20
18
К6
1.05
1.37
1.98
2.3 2.4
2.72.9 2.8
2.832.79
2.61
2.662.72
2.85
2.93
2.99
3.02
3.04
3.13.1
3.02
0
0.5
1
1.5
2
2.5
3
3.5
19
98
19
99
20
00
20
01
2002
20
03
20
04
2005
20
06
20
07
20
08
20
09
20
10
20
11
20
12
2013
20
14
20
15
2016
20
17
20
18
К7
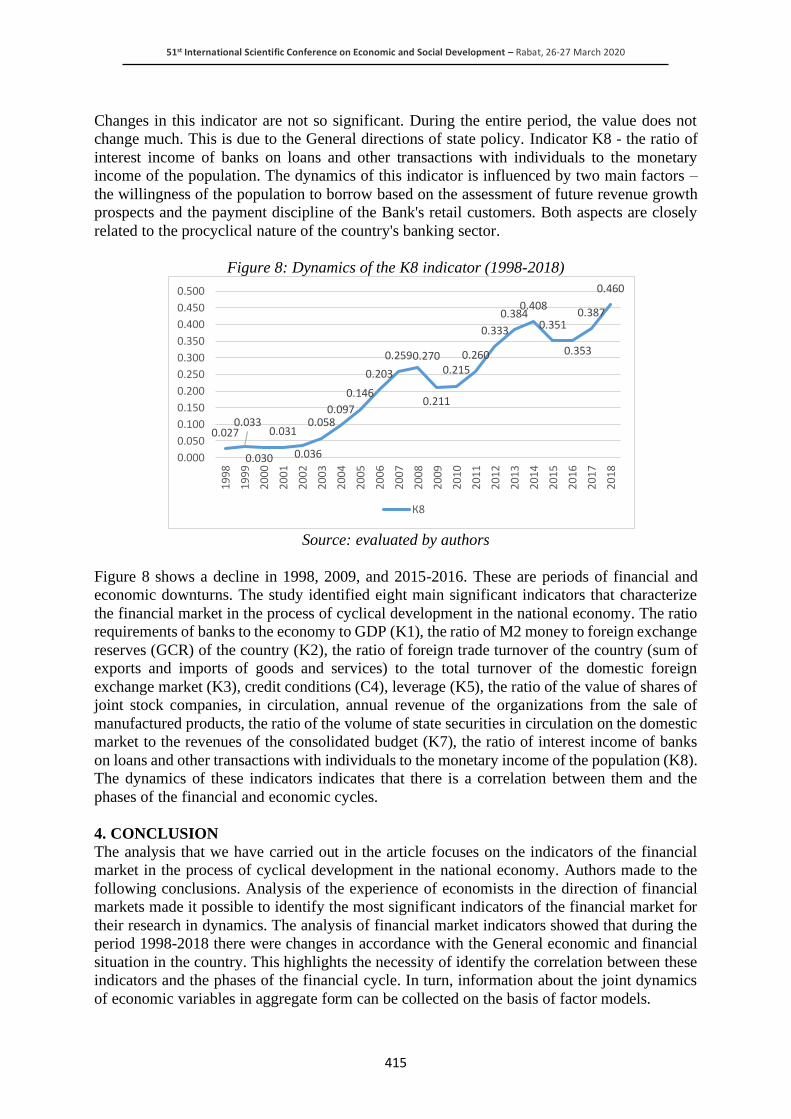
51st International Scientific Conference on Economic and Social Development – Rabat, 26-27 March 2020
415
Changes in this indicator are not so significant. During the entire period, the value does not
change much. This is due to the General directions of state policy. Indicator K8 - the ratio of
interest income of banks on loans and other transactions with individuals to the monetary
income of the population. The dynamics of this indicator is influenced by two main factors –
the willingness of the population to borrow based on the assessment of future revenue growth
prospects and the payment discipline of the Bank's retail customers. Both aspects are closely
related to the procyclical nature of the country's banking sector.
Figure 8: Dynamics of the K8 indicator (1998-2018)
Source: evaluated by authors
Figure 8 shows a decline in 1998, 2009, and 2015-2016. These are periods of financial and
economic downturns. The study identified eight main significant indicators that characterize
the financial market in the process of cyclical development in the national economy. The ratio
requirements of banks to the economy to GDP (K1), the ratio of M2 money to foreign exchange
reserves (GCR) of the country (K2), the ratio of foreign trade turnover of the country (sum of
exports and imports of goods and services) to the total turnover of the domestic foreign
exchange market (K3), credit conditions (C4), leverage (K5), the ratio of the value of shares of
joint stock companies, in circulation, annual revenue of the organizations from the sale of
manufactured products, the ratio of the volume of state securities in circulation on the domestic
market to the revenues of the consolidated budget (K7), the ratio of interest income of banks
on loans and other transactions with individuals to the monetary income of the population (K8).
The dynamics of these indicators indicates that there is a correlation between them and the
phases of the financial and economic cycles.
4. CONCLUSION
The analysis that we have carried out in the article focuses on the indicators of the financial
market in the process of cyclical development in the national economy. Authors made to the
following conclusions. Analysis of the experience of economists in the direction of financial
markets made it possible to identify the most significant indicators of the financial market for
their research in dynamics. The analysis of financial market indicators showed that during the
period 1998-2018 there were changes in accordance with the General economic and financial
situation in the country. This highlights the necessity of identify the correlation between these
indicators and the phases of the financial cycle. In turn, information about the joint dynamics
of economic variables in aggregate form can be collected on the basis of factor models.
0.0270.033
0.030
0.031
0.036
0.0580.097
0.146
0.203
0.2590.270
0.211
0.2150.260
0.333
0.3840.408
0.351
0.353
0.387
0.460
0.000
0.050
0.100
0.150
0.200
0.250
0.300
0.350
0.400
0.450
0.500
1998
19
99
20
00
20
01
2002
20
03
20
04
2005
20
06
20
07
20
08
20
09
20
10
20
11
2012
20
13
20
14
20
15
20
16
20
17
20
18
К8

51st International Scientific Conference on Economic and Social Development – Rabat, 26-27 March 2020
416
Within this approach, a statistically significant correlation between variables can be considered
as a consequence of the influence of common factors on them (in this case, the phases of the
financial cycle).
LITERATURE:
1. Abramov A.E., Radygin A. D., Chernova, M. I. (2014) Regulation of the financial .markets:
models, evolution, efficiency / / Questions of Economics.
2. Alessi, L. Comparing different early warning systems: Results from a horse race
competition among members of the Macro-Prudential Research Network, [Electronic
resource] / L. Alessi, A. Antunes, J. Babecky, S. Baltussen, etc. (2014)– Mode of access:
http://www.ecb.europa.eu/events/pdf/conferences/140623/Vasicek-et-al_Comparing-
Different-Early-Warning-Systems.pdf.
3. Beck T., Levine R., Loayza N. (2000) Finance and Sources of Growth// Journal of Financial
Economics, №58
4. Gelb A. (1989) Financial polices: Growth and efficiency, Working paper no 421, The World
Bank, Washington, DC
5. King R., Levine R. (1993) Finance and Growth: Shumpeter Might Be Right// Quarterly
Journal of Economics,№ 108
6. Plasil, M. (2013) An indicator or the financial cycle in the Czech economy [Electronic
resource] / M. Plasil, J. Seidler, P. Hlavac, T. Konecny. – Mode of access:
http://www.cnb.cz/en/financial_stability/fs_reports/fsr_2013-2014/fsr_2013-
2014_article_i.pdf.
7. Song Shin, H. (2013)Procyclicality and the Search for Early Warning Indicators / H. Song
Shin // International Monetary Fund. – WP/13/258, [Electronic resource] / H. Song Shin. –
Mode of access: https://www.imf.org/external/pubs/ft/wp/2013/wp13258.pdf.
8. Zarubezhnov E.S., Koptelov I.O. (May 2018) Economic growth and analysis of the
country's development through macroeconomic indicators / I. O. Koptelov, E.S.
Zarubezhnov // Bulletin of Chelyabinsk State University.
51st International Scientific Conference on Economic and Social Development – Rabat, 26-27 March 2020
417
QUALITATIVE STUDY OF THE INCLUSIVE COMPETENCE OF
TEACHERS OF VOCATIONAL EDUCATION INSTITUTIONS
Svetlana Kurnosova
Chelyabinsk State University, Chelyabinsk, Russia
Nikolai Kokanov
Chelyabinsk State University, Chelyabinsk, Russia
Tatyana Lushnikova
Chelyabinsk State University
Chelyabinsk, Russia
Linara Battalova
Financial University under the Government of the Russian Federation, Moscow, Russia
Yulia Petrova
South Ural State College, Chelyabinsk, Russia
Elena Martynova
Chelyabinsk State University, Chelyabinsk, Russia
ABSTRACT
The article discusses global prospects for the study of inclusive competence of teachers of
educational organizations of vocational education. The purpose of the paper is to present the
results of the research devoted to the study of the cluster approach to the study of the inclusive
competence of teachers of vocational educational organizations, which gives opportunities for
actualizing the potential of the studied quality.
Keywords: Inclusive education, Inclusive competence, Educational organization, Cluster
approach, Competency building model
1. INTRODUCTION
At the current stage of social development, education becomes one of the essential areas of life,
which is closely intertwined with absolutely all spheres of social existence. The present analysis
of conditions stimulates to find the newest combinations of the high-quality education system
in the Russian Federation: it must correspond to the high level of economic development, social
prescriptions to satisfy the possibilities of constant formation of individual properties of people.
In the National Doctrine of Education of the Russian Federation until 2025, the problem of the
importance of education as one of the global criteria for assessing the mobility of the economy
and society is brought to the first place. The main objective of the current education system is
to meet the needs of individuals at various levels, including the acquisition of the necessary
educational level, the organization of the required level of qualification of an employee in the
direction of his or her professional activity, in demand in the world of professions, as well as
readiness for mobility.

51st International Scientific Conference on Economic and Social Development – Rabat, 26-27 March 2020
418
Statistical data received during the research confirm its relevancy. Experimental work carried
out in Chelyabinsk State University, Chelyabinsk State Academy of Culture and Art in the field
of study of problems of professional development of pedagogical staff showed that the existing
system of continuous professional development of teaching staff is only at the initial level of
formation. About half of the participants in the survey, namely, 48% of university teachers
indicated that even the systematic completion of professional development courses in 3-5 years
does not allow for timely correction of their professional activities in accordance with changes
occurring in the educational system and, consequently, reduces the readiness to apply
innovation in educational activities, including activities in the system of inclusion. At the same
time, the results of this research prove that modern workers in the field of vocational education
are overwhelmingly interested in providing personality-oriented content of professional
development (37%); in the organization of targeted training for the system of continuous
professional development of scientific and pedagogical workers (30%); the creation of system-
forming mechanisms to ensure the natural self-organization of the system of professional
development (28%); coordination of the set of institutions and services of the system of
professional development of scientific and pedagogical workers in terms of values, objectives,
content, methods and forms of their activities (22%); overcoming its closed nature and
increasing dependence on the consumer (16%). Thus, in solving these problems we see the
social and pedagogical level of relevance of the research. The foundation for a change in the
concept of education in the Russian Federation is the sequence of coordinated operations aimed
at developing an inclusive education system, which finds its reflection in the idea of developing
the inclusive competence of teachers in additional vocational education.
2. QUALITATIVE STUDY OF THE INCLUSIVE COMPETENCE OF TEACHERS OF
EDUCATIONAL INSTITUTIONS OF VOCATIONAL EDUCATION
Researching the problem of preparing teachers of educational organizations of professional
education for the design of an inclusive information and educational environment in
chronological order, we will analyze the main periods of its formation, establishing the social
trends that have formed during each of them - the existing conditions in which it is possible to
trace the evolution of academic views on the design of elements of the educational system,
aspects of an inclusive information and educational environment, their relationship with
scientific activity. Ontologically, the problem of preparing teachers of professional educational
organizations for inclusive information and educational activities is directly related to several
social phenomena, which are quite widely covered in various branches of science, including
pedagogy: 1) the transition to an information society; 2) the informatization of education; 3)
the updating of the paradigm of continuing education. As a result of the implementation of these
programs, Russian educational institutions have almost equaled the main number of teaching
staff with inclusive competencies with European educational organizations, as evidenced by
data from various international sociological studies. There has also been a positive trend in
recent years towards implementing an inclusive education system. At this stage of
implementation of joint training of students with conditionally healthy development and with
limited health opportunities, there is an accumulation of information and educational potential
within each educational organization. Progress in this direction is constrained only by the
insufficient number of teachers with specialized training in inclusive education, i.e. the process
of creating and using information and communication technology tools in the educational
process. The profoundly developed philosophical and pedagogical concept of continuing
education was put forward by J. A. Kamensky, who saw "universal education", the inclusion of
all people without exception in culture ("pampedia") as a means of achieving social harmony
and "universal correction of human affairs". Ya.A. Kamensky presented an all-encompassing
holistic picture of human upbringing and self-improvement throughout his life - from the
51st International Scientific Conference on Economic and Social Development – Rabat, 26-27 March 2020
419
"school of birth" to the "school of death". The turn of modern philosophical and pedagogical
thought, and then the turn of special pedagogical research to the problems of continuous
education is associated with the educational consequences of the scientific and technological
revolution. The leading factor that has generated the problem of preparing qualified specialists
for inclusive information and education is the transition to an information society. In the
implementation of the cluster approach can be identified several key points: first, the existence
of a common goal; secondly, the legal framework for joint activities of subjects; thirdly, the
developed mechanisms for interaction between subjects that unite in a cluster; fourthly, the
mechanism of management and, fifthly, compliance with the declared common goals.
Consequently, the cluster approach is based on a partnership of stakeholders and is applied in
research on their competitiveness problems as well as a method of stimulating innovation. The
issue of continuing education can be roughly divided into two main areas. The first relates to
the construction of a system of continuous education as part of social practice (the social and
educational aspect of continuous education); the second relates to the very process of
appropriation by a person of new life, social and professional experience (the psychological and
pedagogical aspect of continuous education). In social and educational practice, the key to the
implementation of continuing education is the continuity of the educational system and the
multiplicity of informal education channels beyond primary education. Historical and
pedagogical analysis of the processes of development of informatization of society and
educational space, the formation of continuous education made it possible to determine the
basis for periodization of the genesis of the problem of preparing students for the design of an
inclusive information and educational environment: 1) degree of expansion (interest and
involvement of subjects and society as a whole); 2) degree of identification of conceptual and
terminological field; 3) degree of conceptual generalization. In the information society, not only
production changes but also the whole way of life and the system of values. The material and
technological base of the information society are various systems based on computer equipment
and computer networks, information technology, telecommunication communication. The
Information Society is a society in which most workers are engaged in the production, storage,
processing and realization of information, especially its highest form - knowledge.
Characteristic features of the information society are: solving the problem of information crisis
(solving the contradiction between information avalanche and information hunger); ensuring
the priority of information over other resources; the main form of development is the
information economy; the society is based on automated generation, storage, processing and
use of knowledge through the latest information technology and technology; information
technologies cover all spheres of human social activity; information technologies cover all areas
of social activity. The complexity and multilevel nature of the inclusive competence of teachers
of educational organizations of professional education require adequate theoretical and
methodological tools for the study of this problem. Such an instrument may be a synthesis of
comparative (general scientific basis), cluster (specific scientific level) and participative
(methodological and technological level) approaches. Combination of approaches that make up
the methodological regulation of the inclusive competence of teachers of educational
organizations of professional education allows: to form a given standard of personality, due to
the integration of Russian education in the European and world community, the development
of inclusive education; to ensure the active involvement of the individual in an inclusive society;
to build a network of subjects preparing teachers for the implementation of inclusive education;
to increase motivation for the teacher in education. The final product of the education system
is a competent specialist, represented by the structure of society, its many characteristics, which
defines the demo culture of the region as part of the social component of its development,
including "a set of socio-psychological attitudes, automatism and habits of consciousness that
form the ways of seeing the world and representing people belonging to a particular socio-
51st International Scientific Conference on Economic and Social Development – Rabat, 26-27 March 2020
420
cultural community", i.e. mentality. Many of these characteristics of society are only indirectly
formed by the education system, which does not diminish the role of the educational cluster in
the regional economy.
3. CONCLUSION
Thus, we believe that the prospect and success of building the inclusive competencies of
educators in professional education organizations as a factor ensuring the implementation of
the crucial needs of the individual in lifelong learning and the quality of inclusive higher
education determine:
1. Integration of andragogical (general scientific level), competency (specific scientific level)
and modular (methodological and technological level) approaches, which make up the
methodological regulation of inclusive competence development of teachers of professional
education organizations.
2. Structural and functional model of inclusive competence development for teachers of
educational organizations, which provides for successful use in conditions of dynamically
developing professional education, which includes target, methodological, substantive,
procedural, functional and practical blocks.
3. A set of organizational and pedagogical conditions, which takes into account the purpose
and content of teachers' professional activities, the prescriptions of an inclusive society and
the regulatory framework of new educational activities, the possibility of andragogical,
competent and modular approaches.
Synthesis of approaches that make up the methodological regulation of the pedagogical concept
of training teachers of educational organizations of professional education to design an
inclusive information and educational environment allows: to form a given standard of
personality, due to the integration of Russian education in the European and world community,
the development of inclusive higher education; to ensure the active involvement of the
individual in an inclusive society; to build a network of subjects of student training.
LITERATURE:
1. Batyshev, S.Ya (1998). The predictive orientation of vocational education (In Russian).
S.Ya. Batyshev. Pedagogy. (No. 6). (p. 45-49.).
2. Bondarevskaya E.V, Kulnevich S.V (1990). Pedagogy: Personality in humanistic theories
and educational systems (In Russian). E.V. Bondarevkaya, S.V. Kulnevich. Rostov:
Creative Center “Uchitel”.
3. Bordovskaya N.V, Rean A.A (2000). Pedagogy: Textbook for high schools. (In Russian)
N.V.B ordovskaya., A.A. Rean. St. Petersburg: Piter.
4. Interactive methods in the system of advanced training of scientific and pedagogical
workers. Information technology in the activities of a modern teacher (2016). (In Russian)
Collection of scientific articles, Chelyabinsk, Chelyabinsk State University.
5. S. A. Kurnosova., N. A. Kokanov (2017). Psychological and pedagogical foundations of
preparing students for the design of an inclusive information educational environment (In
Russian). S.A. Kurnosova, N.A. Kokanov. Materials of the International scientific-practical
conference "Social and pedagogical support for people with disabilities: theory and
practice", Ukraine, Yalta.
51st International Scientific Conference on Economic and Social Development – Rabat, 26-27 March 2020
421
VALUE AND PRICE OF NETWORK COMMUNICATIONS OF
PERSONNEL
Yuri Startsev
Chelyabinsk State University, Chelyabinsk, Russia
Alexander Taradanov
Chelyabinsk State University, Chelyabinsk, Russia
ABSTRACT
Formation of network communications of the personnel occurs on the basis of network
competences of heads, that is their ability purposefully to form networks from workers,
organizing horizontal communications of the necessary quality and quantity in parallel with
the technological communications caused by production processes. Purposeful formation of
horizontal links is actually one of the forms of increasing organizational capital, as it allows
you to save a variety of resources, including time. Thus, there is an increase in the value of
network communications of production personnel as an individual measure for each employee
on the scale of "good-harm" of production communications. When working in the network,
employees also form specific network competencies – their ability to use the technological and
personal horizontal connections between individual subjects and their groups arising in the
production processes to unite into a production network. The effectiveness of information
interaction on network platforms is ensured by performing the main communication functions:
increasing the efficiency of production communications; manifestation of communicative
creativity in individual employees and their groups; easing the space-time constraints of
production processes; using modern humanitarian high-Hume technologies to stimulate
workers. On the network platform there is a convergence of necessary network services:
transmission control data (data must come in the right place at the right time); network security
(with the exception of the leak data with the specific network platform in unwanted directions);
the formation of efficient and affordable network infrastructure; connect to the required
network applications (must be able free connect/disconnect of individual participants and
individual contacts). To manage these processes, systems should function to assess and adjust
the main parameters of these processes: analysis of the effectiveness of mutual contacts;
analysis of communication losses; analysis of transaction costs; assessment of the degree of
satisfaction of its platform participants; analysis of the prospects for individual development of
individual platform participants; analysis of the prospects for the development of the entire
platform; assessment of the degree of attractiveness for external entities. The cost of forming
network connections of personnel is determined by the cost of training / retraining of production
managers and their working time spent on the formation of network competencies of performers
and the creation and maintenance of the network platform.
Keywords: personnel, value, price, network communications
1. INTRODUCTION
Communication as a process of information transfer (communication, exchange of thoughts,
information, ideas, etc.) from one person to another is a mandatory element of human activity
/1/. This is especially true of production activities, when two or more people work together to
achieve a specific result. Moreover, the more complex the activity, the more people are involved
in the production process, the higher the requirements for communication processes by its
participants in terms of the speed of information transmission, the clarity (unambiguity) of the

51st International Scientific Conference on Economic and Social Development – Rabat, 26-27 March 2020
422
transmitted information, the volume, timeliness, accuracy of the address of the arrival of
information, the cost of the transmitted information, etc. A. Cockburn, based on the " theory of
information wealth "/ 2/, leads in his book "Agile Software Development" scheme of interaction
of different ways of communication that people can use in the process of their activities (quoted
by: /3/). At the same time, he argues that the most effective communication process takes place
at a direct meeting of the participants with the possibility of fixing the right moments on
something (usually on paper). In the case of non-personal communication and without fixing
all the main and intermediate results of communication, the effectiveness of communication
decreases rapidly (A. Cockburn calls this process "cool" channel of communication) as the
communication parties lose the ability to feel each other to see gestures and facial expression,
hear the tone and volume of voice, emotions, etc. this eliminates the opportunity to respond to
those request in real time, thus preventing the discussion, which usually generates the most
effective results /4/.
2. RESEARCH
The transition to sustainable communications is accompanied not only by the exchange of
information, but also by other exchanges generated by this exchange (material, energy,
personal, etc.), which contributes to the transformation of communication links into appropriate
production links: production networks as a form of communication of individual workers
engaged in production activities at functionally close workplaces, which increases its
efficiency. At the same time, the analysis of modern scientific approaches to the interpretation
of the concept of production network and its definition allowed to establish, firstly, the lack of
integrity of scientific ideas about the essence of this concept, and, secondly, to formulate a
number of features required for such a definition (its imperative):
• the presence of separate entities with their own interests;
• the presence of real or hypothetical links between these subjects;
• the presence of at least one objective, common to all subjects with a functionally close to
the workplace.
Bases of formation of production networks, follow both from the formulated imperative, and
from the institutional theory of firm as the direction of the economic theory which is not limited
to the analysis only of economic categories, and offers to consider actively in production
processes various non-economic factors, including, public and personal interrelations of
concrete workers in processes of joint activity. Quality of formation of production networks of
the personnel essentially depends on network competences of heads of production representing
specific group of the competences allowing to use spontaneously and inevitably arising
horizontal communications between workers for increase of economic efficiency of production
by Association them in a production network. The peculiarity of this provision is that the
formation of the appropriate behavior of employees is due to the network competencies of
managers, that is, their ability to purposefully form networks of workers, organizing horizontal
connections of the desired quality and quantity in parallel with the technological connections
caused by the production processes. Purposeful formation of horizontal links with the use of
such a tool as the network competence of managers is actually one of the forms of increasing
organizational capital, as it allows to significantly save various resources, including time. Thus,
there is an increase in the value of network communications of production personnel as an
individual measure for each employee on the scale of "good – harm" /5 / production
communications. The psychological background of the Association of workers in production
networks is their transition in their actions from the basic conceptual concept of "struggle for..."
to the basic conceptual concept of " contract for...", which stimulates the development of stable
horizontal links between them, that is, networking.
51st International Scientific Conference on Economic and Social Development – Rabat, 26-27 March 2020
423
Thus, the production network is an organizational incentive for the Association of employees,
as thanks to the "contract of..." allows them to agree on certain working conditions (the amount
of earnings, the fairness of the recognition of contribution to the common cause, creativity,
initiative and creativity). On the basis of a positive assessment of these incentives in the form
of approval by the network, the employee is motivated to work effectively /6, section 2.3/.
3. CONCLUSION
Of course, as history shows, networking is an objective process that takes place without
purposeful actions of managers. However, ignoring this fact by the management system leads
to significant losses of various resources (working hours, downtime, etc.) and actions of outright
restrictionism and, as a consequence, loss of competitiveness of the organization. When
working in the network, employees also form specific network competencies – their ability to
use the technological and personal horizontal connections between individual subjects and their
groups arising in the production processes to unite into a production network. These advantages
of networking and the availability of network competencies of personnel are most effectively
implemented on network platforms-communication tools (virtual, software or instructional, but
not material), which are a system of principles, norms, rules, mechanisms and technologies that
together provide effective information interaction of network participants to create competitive
products. The effectiveness of information interaction on network platforms is ensured by
performing basic communication functions:
• increase the efficiency of production communications (speed and accuracy of message
transmission);
• manifestations of communicative creativity in individual employees and their groups
("work as a dialogue»);
• easing the space-time constraints of production processes (to minimize transaction costs);
• use of modern humanitarian high-Hume technologies to stimulate employees (environment,
behavior, opportunities, beliefs, values, identity, mission)./7/.
The network platform is the part of the technological platform in which the creation of
promising solutions and products provide the above advantages of networking. Therefore the
convergence of necessary network services takes place on the network platform:
• data transfer management (data should come to the right place at the right time);
• network security (preventing data leakage from a particular network platform in undesirable
directions);
• the formation of an efficient and non-burdensome network infrastructure (should be);
• connection of necessary network applications (there should be a possibility of free
connection/disconnection of separate participants and separate connections).
To manage the processes occurring on the network platform, the following systems must
function, allowing to evaluate and adjust the main parameters of the processes:
• analysis of the effectiveness of mutual contacts;
• analysis of communication losses;
• transaction cost analysis;
• assessment of the level of satisfaction of its platform members;
• analysis of the prospects for individual development of individual participants of the
platform.
• analysis of the development prospects of the entire platform;
• assess the degree of attractiveness to external stakeholders.

51st International Scientific Conference on Economic and Social Development – Rabat, 26-27 March 2020
424
Accordingly, the cost of forming network connections of personnel is determined by the cost
of training / retraining of production managers and their working time spent on the formation
of network competencies of performers and the creation and maintenance of the network
platform.
LITERATURE:
1. Communication: a Linguistic encyclopedic dictionary. URL:
https://les.academic.ru/518/Коммуникация accessed 02.10.2019.
2. Daft, R. L. Organizational information requirements, media richness and structural design
/R. L. Daft, R. H. Lengel / / Management Science. - 1986. - No. 32 (5). - Pp. 554-571.
3. Bushmanov, A. What is the most effective communication /A. Bushmanov / URL:
https://agilemasters.ru/2018/06/23/kakaya-kommunikaciya-naibolee-effektivna/
23.06.2018. Date of access: 01.10.2019.
4. Cockburn, A. Agile Software Development / A/ Cockburn. – Addison-Wesley Professional.
- 2001. - 304 p.
5. Taradanov, A. A. Logic of social / A. A. Taradanov. – Chelyabinsk: Publishing House.
Chelyabinsk state University. – 2018 – 132 C.
6. Belkin, V. N. Organizational capital of the enterprise / V. N. Belkin, O. A. Antonova, V. D.
Gorbunov. - Yekaterinburg: Institute of Economics, Ural branch of RAS, 2011. - 164 p.
7. Schwab, K. the Fourth industrial revolution / K. Schwab. - Moscow: "Eksmo", 2016. - 138
p.
51st International Scientific Conference on Economic and Social Development – Rabat, 26-27 March 2020
425
APPENDIX
Four characteristics of the means of communication
According to the theory, the determination of the wealth of possibilities of the means of
communication takes place in accordance with four criteria[5]:
1. Instant feedback capability: communication is considered complete when feedback is
received on the transmitted message. Feedback can also show whether a message has been
correctly understood. Feedback allows you to instantly correct errors when sending a
message[6].
2. Ability to transmit different types of messages: information can be transmitted in different
forms, such as text, audio and/or video messages. The more types involved in the
transmission of a message, the more information will reach the recipient of the message.
3. Diversity of languages used: Daft and Lengel divide languages into two types: high and
low diversity[7]. Languages with a high degree of diversity are not limited in the use of
symbols, convey a wide range of ideas and are open to interpretation, such as natural
languages, music or art. Languages with low diversity include limiting symbols, convey a
narrower range of ideas, are factual, and are not open to interpretation (such as mathematics
or statistics). The richer means of communication, according to the theory, will be those
that use languages of a high degree of diversity.
4. Media focus on the individual: each communication channel has a different degree of focus
on the individual. Thus, the greater this focus, that is, if the communication medium can
convey, for example, personal feelings or emotions, the more information in the message
will be conveyed.
The more of the above characteristics is observed in the communication channel, the more it is
rich in its capabilities. Accordingly, the following types of communication can be
distinguished: personal communication (face-to-face), communication through visual, auditory
or textual means[5].

51st International Scientific Conference on Economic and Social Development – Rabat, 26-27 March 2020
426
METHODOLOGY FOR ASSESSING WORKER’S BEHAVIORAL
OPPORTUNISM IN RUSSIAN CORPORATIONS
Elena Kozlova
Chelyabinsk State University
Chelyabinsk, Br.Kashirinykh St., 129, Russia
Dmitri Pletnev
Chelyabinsk State University
Chelyabinsk, Br.Kashirinykh St., 129, Russia
ABSTRACT
Modern corporations strive to find new tools to improve the efficiency of their activities.
Traditional approaches aimed at reducing costs, modernizing production, improving the
organizational structure are being rethought. One of the new directions in this area is
increasing the productivity of corporation employees by stimulating their involvement and
better motivation and reducing behavioral opportunism. There is a need for a methodology for
assessing the level of behavioral opportunism, combining accuracy and simplicity, for
analyzing the effectiveness of corporate culture development programs, and increasing
employee motivation. At the same time, many different techniques are presented that meet these
requirements only partially. The aim of the study is a comparative analysis of existing methods
for assessing the behavioral opportunism of employees in a corporation and the proposal of an
author's methodology that meets the requirements of accuracy and simplicity. The information
base of the study is scientific publications devoted to the analysis of methods for measuring
behavioral opportunism in a corporation. The study established the interdisciplinary nature of
the problem of behavioral opportunism, summarized the methods for assessing forms of
behavior relevant to behavioral opportunism from economics, sociology, and psychology, and
gave a comparative description of them. An author’s method is proposed, an algorithm for its
application is determined, and a model calculation of the method is carried out on the data
obtained during a local economic experiment. As a result, the possibility and effectiveness of
applying the author’s methodology to the analysis of behavioral opportunism of workers of
corporations are substantiated.
Keywords: assessment methodology, behavioral opportunism, corporation, workers
1. INTRODUCTION
A long-term bilateral contract represents the relationship between employer and employee in a
modern corporation. The incompleteness of existing contracts aggravates the problem of
opportunistic behavior of workers. High costs to the employer accompany such behavior on the
part of workers. This behavior includes not only direct costs but also the costs of opportunity
costs (what a pun!), as well as additional costs caused by the inefficient use of resources. The
hidden nature of the opportunistic behavior of workers leads to problems of its measurement.
An assessment of worker opportunism is necessary to measure the individual and general level
of opportunism in corporations. Determining the level of opportunism allows us to develop
mechanisms to limit it and increase the efficiency of the corporation. The purpose of the article
is to present the results of the development and testing of a methodology for assessing workers'
opportunism.
51st International Scientific Conference on Economic and Social Development – Rabat, 26-27 March 2020
427
2. LITERATURE REVIEW
Opportunism in economics has the classical definition given in (Williamson, 1975). It is self-
interest-seeking behavior with guile. In applied researches, scientists use cunning, duplicity,
deceit markers as an attribute of "guile." Wathne and Heide (Wathne and Heide, 2000)
suggested distinguishing between active and passive forms of opportunism. They based
selection on a different result of their action. In the first case, it is related to wealth creation,
and in the second, about wealth distribution. At the level of concrete manifestations, active
opportunism is opportunism of commission, which involves the use of lying (Lee, 1998),
breaching formal and unformal agreements (Achrol and Gundlach, 1999), altering facts (John,
1984), making false accusation (Jap and Anderson, 2003), exaggerating difficulties (Anderson,
1988), and also using unexpected events to extract concessions from partners (Rokkan, Heide,
and Wathne, 2003). Passive opportunism implies the realization of self-interest through
omission, including through not doing as promised (Jap and Anderson, 2003), hiding
information (Dahlstrom and Nygaard, 1999), telling incomplete truths (Anderson, 1988),
neglecting to fulfill obligations (Lee, 1998). Seggie, Griffith and Jap (Seggie, Griffith, Jap,
2013) conducted an empirical analysis of the differences between active and passive forms of
behavioral opportunism. They identified six possible strategies of an economic agent that
encountered opportunistic behavior on the opposite side of the relationship: passive acceptance,
constructive discussion, venting, neglect, threatened withdrawal, and exit, and examined the
difference in their frequency of use as a reaction to active and passive opportunism. They also
conducted an analysis of tolerance for active and passive opportunism on the part of colleagues.
Based on the analysis, the influence of active and passive opportunism on transaction costs, and
also revealed the long-term adverse effect of opportunism on economic relations are studied.
In (Nagin, Rebitzer, Sanders and Taylor, 2002), hypotheses were tested and confirmed that
individual incentives have a significant impact on the manifestation of opportunism in firms,
while opportunism measured by the difference in the quality of work - a change in the
proportion of spoilage with a relatively simple and monotonous work when workers informed
that are under complete control, recognized as an indicator of opportunism. Several works are
devoted to the cultural characteristics of opportunism (Chen et al., 2002; Furrer et al. 2011;
Johnson, Cullen and Sakano, 1996; Sakalaki, Kazi, & Karamanoli, 2007). (Ganesan et al., 2010)
compared opportunistic and “unethical” behavior, with comparisons also being made in the
context of two behaviors — commission and omission. The crucial area of study of behavioral
opportunism is the analysis of motivations corresponding to it. (Cagne et al., 2010; Posch et al.,
2019). A rather large number of empirical works are presented in this direction, in which
specific survey methods proposed that allow quantifying the motivation of employees. In
(Cordes et al., 2011) proposed analytical tools to explain the relationship between opportunism
and the size of firms. It assumes that opportunism is measured in a natural way and is an
attribute of the company and its employees. Popov and Simonova (Popov, Simonova, 2006)
and (Popov, Ersh, 2016) revealed a direct correlation between the degree of manifestation of
opportunism in the form of using one's official position and the level of wages, as well as an
inverse relationship between its level and shirking. The level of opportunism in the form of
withdrawal can be considered as the ratio of changes in output as a result of employee shirking
to a possible output. Opportunism in the form of negligence and abuse of office assessed as the
ratio of changes in the level of costs as a result of such opportunism to a minimum possible
level of costs. In (Belkin, Belkina, Antonova, 2015), a methodology proposed for assessing the
level of opportunism based on a point system, where one point corresponds to the complete
absence of opportunism in the enterprise, three points mean the average level, and five points
mean a high level. The basis was the results of a sociological survey of employees of enterprises
and an assessment of opportunistic behavior by such indicators as the degree of control at the
enterprise, workload, lateness, breakaway, initiative.

51st International Scientific Conference on Economic and Social Development – Rabat, 26-27 March 2020
428
Assessment of the overall level of opportunism in the enterprise corresponds to the average
score among all indicators. When analyzing the labor opportunism of workers in (Krasikov and
Roshchina, 2018), it is proposed to consider the reasons internal to the person, and highlight
the employee's labor potential and his psychological portrait. The proposed methodology
includes an assessment of five key parameters: emotional intelligence, character traits, general
emotionality, emotional work, and emotional exhaustion. Evaluation of each of the parameters
not only allows to evaluate the opportunism of workers but also have a controlling effect on
these parameters.
Table 1: Existing approaches to opportunism assessment
Source Opportunism markers Kind of measurement
(Seggie, Griffith,
Jap, 2013)
Ten varieties of opportunism,
arranged in two groups
(opportunism by commission
and opportunism by omission)
Indirect measurement thru reaction
on opportunism (passive acceptance,
constructive discussion, venting,
neglect, threatened withdrawal, and
exit)
(Nagin, Rebitzer,
Sanders and
Taylor, 2002)
Share of spoilage / defective
results of work
Changing in behavior under
supervision
(Cordes et al.,
2011)
Profit changes Analytical modeling
(Popov,
Simonova, 2006)
Shirking
Negligence
Malpractice
Quantitative assessment of each
marker
(Belkin, Belkina,
Antonova, 2015)
Degree of control
Workload during the day
Lateness
Shirking
Initiative
Score based on a sociological survey
(Krasikov and
Roshchina, 2018)
Emotional intelligence
Character traits
General emotionality
Emotional work
Emotional exhaustion
Emotional Intelligence Scale
Rammstedt B., John O.P. Scale
Watson D., Clark L. Scale
Grandey A. model
Maslach C., Jackson S. Scale
The methods that developed earlier are oriented either toward a direct assessment of
opportunism at work, or an assessment of the results of its manifestation. In the first case, it
becomes difficult to identify by interrogation methods (respondents can hide their motives and
behavioral patterns, not wanting to appear in an unsightly light, even in the case of anonymous
surveys). In the second case, the complexity of the application determined by the fact that many
factors influence the results of the work, and it is difficult to recognize and distinguish their
change precisely because of opportunism. We need to develop a methodology that does not
have these shortcomings.
3. METHODOLOGY AND DATA
The paper proposes an assessment of opportunism based on revealing during the survey on
behavioral patterns that manifest themselves in virtual but common situations for respondents.
A detailed assessment of the forms of opportunism based on classification (Seggie, Griffith,
Jap, 2013) is used. Questionnaires for respondents includes three blocks: for the analysis of
opportunism and its forms, for identifying factors that can determine differences in the degree

51st International Scientific Conference on Economic and Social Development – Rabat, 26-27 March 2020
429
and forms of manifestation of opportunism, including education, gender, life plans, and the
third part allows to assess the employee’s motivation that dominates. Eleven questions have
been formed to measure opportunism. Each question offers a short case problem situation where
the respondent chooses one of the options for action (from 3 to 5 options). At the same time,
each question presents a variant of the answer characterizing conscientious behavior in favor
of the company and to the detriment of its interests, and the rest formulated in such a way as to
reflect all ten variants of opportunistic behavior from (Seggie, Griffith, Jap, 2013), six for active
opportunism and four for passive (see table 2).
Table 2: Examples of case question to identify different kinds of active and passive
opportunism
Kind of
opportunistic
behavior
Case of an action identifying such a behavior
Lying (C1) In response to a request to work on a weekend, you will refuse to
help, motivating it with your obligations to your family, even if
there are no such obligations
Breaching formal
and unformal
agreements (C2)
During the issuance of the next order to you, tell your immediate
boss that this is not part of your responsibilities, and you do not
have time to fulfill your direct duties
Altering facts (C3) If you will be a witness in the analysis of a situation where your
colleague is accused of being rude to a client, you will come up with
and tell your version of events, possibly “whitewashing” a colleague
(“the client himself first started”)
Making false
accusation (C4)
If at your oversight the novice employee made a mistake and the
bosses became aware of it, you will say that subordinates made a
mistake, but you promise to take control and fix everything
Exaggerating
difficulties (C5)
Indicate that the task turned out to be more difficult than you
thought, and name the rush because of the tight deadlines and ask
them to extend or give you more performers
Using unexpected
events to extract
concessions from
partners (C6)
I will do my work according to the regulations, but tomorrow I will
point out to my superiors the fact of my processing and ask for
compensation
Not doing as
promised (O1)
In the event of a bankruptcy of the company, you will demonstrate
your loyalty to the company and your willingness to give all your
strength to overcome the crisis, at the same time copy all the critical
information, and immediately after the bankruptcy of the company,
contact your competitors with a job offer
Hiding information
(O2)
When planning a business trip, you will take a ticket for the evening
flight in advance, and the return one the next day after negotiations,
citing the fact that these are the cheapest tickets (even if this is not
so, nobody will check you)
Telling incomplete
truths (O3)
If a business partner you know makes a dubious offer to the
company, you will refuse it, but will not tell the authorities about it
Neglecting to fulfill
obligations (O4)
When more and more assignments are given to you, which are not
always related to your direct duties, you will do part of the work
“through the sleeves” - after all, no one will appreciate it ...
C1…C6 – kinds of active opportunism (opportunism by commission);
O1…O4 – kinds of passive opportunism (opportunism by omission).
51st International Scientific Conference on Economic and Social Development – Rabat, 26-27 March 2020
430
In total, the questions contain four answer options for each option of opportunistic behavior.
Thus, evaluating the options for opportunism, we can compare the number of selected specific
options with their maximum number, thereby assessing the proportion of relevant answers on
a scale from 0 to 100%. Also, similarly, one can evaluate the relative frequency of choosing
options for good faith, active and passive opportunism. The following question included in
survey to assess the factors of opportunism: gender, place of primary education, university
specialty, desired salary level, plans to start a family and children, work experience, the image
of an ideal career (specialist/manager/freelancer). To assess the types of motivation, we used
the questionnaire proposed in (Cagne et al., 2010) - the Motivation at Work Scale. It based on
the choice of one of 12 possible answers about the primary motivation at work. These answer
options are associated with four types of motivation: the value of work as a process that gives
pleasure (integrated regulation - Intrins), the value of work as a means of achieving life goals
(identified regulation - Ident), the value of work as a way of self-realization and achievement
of a position in society (introjected regulation - Intro), and the value of work as a means of
earning (external regulation - Ext). Comparison of the results of evaluating opportunism among
different groups of subjects will highlight the differences between them, test hypotheses about
the significance of these differences and, therefore, the significance of the relevant factors. The
focus group consisting of 69 graduate students (Economics, Management, Quality
Management, Customs) (also with work experience) used to test the methodology. An
anonymous survey was conducted, which allowed us to identify the main trends in the
manifestation of opportunism, made it possible to assess the factors, and made it possible to
formulate recommendations for improving the methodology for future research.
4. RESULTS
The survey involved 69 respondents - 2–5 year university students, future economists,
managers, experts in the field of quality management and foreign economic activity. 51% of
the respondents are women and 49% are men. The vast majority of students surveyed (89%)
previously worked, while 42% work regularly. After graduation, students plan to start or
continue their career in large industrial companies (23%), the service sector (23%), in
government institutions (19%), and 22% of respondents expressed a desire to open a business.
Only 7% of respondents postpone their careers because of military service, and 6% do not plan
to work at all after graduation. In the framework of the study, the relative frequency of choosing
a model of employee behavior established - conscientiousness behavior, the opportunism of
commission, the opportunism of omission (Fig. 1). As can be seen, in most cases (71.3%)
respondents prefer various forms of opportunism to conscientious behavior. The frequency of
distributions of the choice of options for opportunistic behavior in the active (C1 - C6) and
passive (O1 - O4) forms shown in Fig. 2. The most common opportunistic behaviors in the
active form are C5 (31.2%) and C6 (38.0%), and in the passive form O3 (23.9%). The most
common opportunistic behaviors in the active form are C5 (exaggerating difficulties, 31.2%)
and C6 (using unexpected events to extract concessions from partners, 38.0%), and in passive
- O3 (telling incomplete truths, 23.9 %).
Figure following on the next page
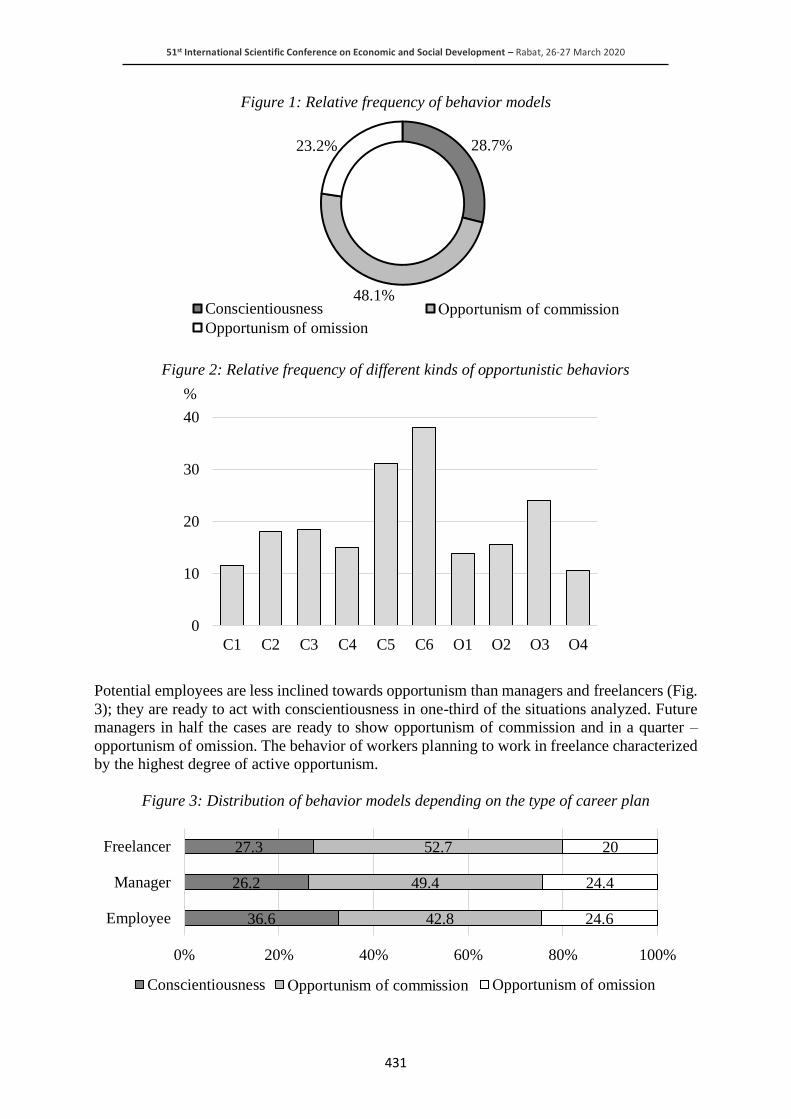
51st International Scientific Conference on Economic and Social Development – Rabat, 26-27 March 2020
431
Figure 1: Relative frequency of behavior models
Figure 2: Relative frequency of different kinds of opportunistic behaviors
Potential employees are less inclined towards opportunism than managers and freelancers (Fig.
3); they are ready to act with conscientiousness in one-third of the situations analyzed. Future
managers in half the cases are ready to show opportunism of commission and in a quarter –
opportunism of omission. The behavior of workers planning to work in freelance characterized
by the highest degree of active opportunism.
Figure 3: Distribution of behavior models depending on the type of career plan
28.7%
48.1%
23.2%
Conscientiousness Оpportunism of commission
Opportunism of omission
0
10
20
30
40
C1 C2 C3 C4 C5 C6 O1 O2 O3 O4
%
36.6
26.2
27.3
42.8
49.4
52.7
24.6
24.4
20
0% 20% 40% 60% 80% 100%
Employee
Manager
Freelancer
Conscientiousness Оpportunism of commission Opportunism of omission

51st International Scientific Conference on Economic and Social Development – Rabat, 26-27 March 2020
432
The influence of the type of motivation on opportunism is almost the same for managers and
workers. External regulation, identified regulation and integrated regulation lead to similar
indicators of the manifestation of opportunism, or its absence, for both workers and managers.
However, managers driven by introjected regulation are generally willing to use opportunism
of commission, while employees are opportunism of commission and opportunism of omission
equally.
Figure 4: Motivation types and behavioral models of managers and employees
As a result of the survey, it was revealed that the form and frequency of the manifestation of
opportunism substantially depend on the motivation of the employee (Fig. 5). The least inclined
towards opportunism are employees for whom the main element of motivation is external
regulation (Ext). The remaining elements of integrated regulation (Intrins), identified regulation
(Ident) and introjected regulation (Intro) lead to the manifestation of opportunism at
approximately the same level. However, regardless of the main motivation, employees are
inclined toward opportunism of commission twice as much as opportunism of omission.
Figure 5: Differentiation of behavior models depending on the type of motivation
0 10 20 30 40 50 60 70
Conscientiousness
Оpportunism of commission
Opportunism of omission
Conscientiousness
Оpportunism of commission
Opportunism of omission
Em
plo
yee
Man
ager
%Ext Intro Ident Intrins
21.8
25.8
23.6
34.2
51.8
49.6
49.1
45.5
26.4
24.6
27.3
20.3
0% 20% 40% 60% 80% 100%
Intrins
Ident
Intro
Ext
Conscientiousness Оpportunism of commission Opportunism of omission
51st International Scientific Conference on Economic and Social Development – Rabat, 26-27 March 2020
433
5. CONCLUSION
Possibility of the practical application of the proposed method for assessing opportunistic
behavior confirmed during the study. The proposed method makes possible to identify
“hypothetical” opportunism (or the tendency of workers to opportunism). This tendency may
not always manifest itself and be noticeable by a supervisor, but from employees involvement
point of view and the results that they show, it will affect on behavior and results. Interest for
further research are:
• deeper analysis and interpretation during the survey of results, including statistical analysis
methods;
• the application of the developed method to assess opportunism of employees in firms of
various industries and sizes;
• verification of the methodology by comparing it with the results obtained using other
methods, as well as using an expert survey of top-managers.
ACKNOWLEDGEMENT: The reported study was funded by RFBR, project number 20-010-
00653.
LITERATURE:
1. Achrol, Ravi S., Gregory T. Gundlach (1999) Legal and Social Safeguards Against
Opportunism in Exchange. Journal of Retailing, 1999 (75 (1)), 107-121.
2. Anderson, E. (1988) Transaction Costs as Determinants of Opportunism in Integrated and
Independent Sales Forces. Journal of Economic Behavior and Organization. 1998 (9(3)),
247-64.
3. Belkin, V., Belkina, N., Antonova O. (2015) Opportunistic behavior of employees of
Russian enterprises. Bulletin of the Chelyabinsk State University. The economy. 2015 (18
(373)), 105 - 113.
4. Cagne, M., Forest, J., Gilbert, M.-H., Aube, C., Morin, E., Malorni, A. (2010) The
Motivation at Work Scale: Validation Evidence in Two Languages. Educational and
Psychological Measurement, 2010 (70(4)), 628–646.
5. Chen, C. C., Peng, M. W., Saparito, P. A. (2002) Individualism, collectivism, and
opportunism: A cultural perspective on transaction cost economics. Journal of
Management, 2002 (28(4)), 567–583.
6. Cordes, C., Richerson, P., Mcelreath, R. and Strimling, P. (2011) How does opportunistic
behavior influence firm size? An evolutionary approach to organizational behaviour.
Journal of Institutional Economics. Cambridge University Press. 2011 (7(1)), 1–21.
7. Dahlstrom, R., Nygaard, A. (1999) An Empirical Investigation of Ex Post Transaction Costs
in Franchised Distribution Channels, Journal of Marketing Research, 1999 (36 (May)),
160-70.
8. Furrer, O., Tjemkes, B. V., Ulgen Aydinlik, A., & Adolfs, K. (2012) Responding to adverse
situations within exchange relationships: The cross-cultural validity of a circumplex model.
Journal of Cross-Cultural Psychology, 2012 (43(6)), 943 – 966.
9. Ganesan, S., Brown, SP., Mariadoss, BJ., Ho, H. (2010) Buffering and Amplifying Effects
of Relationship Commitment in Business-to-Business Relationships. Journal of Marketing
Research, 2010 (47 (April)), 361-73.
10. Jap, S., Anderson E. (2003) Safeguarding Interorganizational Performance and Continuity
Under Ex Post Opportunism. Management Science, 2003 (49 (12)), 1684-1701.
11. John, G. (1984) An Empirical Investigation of Some Antecedents of Opportunism in a
Marketing Channel. Journal of Marketing Research, 1984 (21 (August)), 278-89.

51st International Scientific Conference on Economic and Social Development – Rabat, 26-27 March 2020
434
12. Johnson, J. L., Cullen, J. B., Sakano, T. (1996). Opportunistic tendencies in IJVs with the
Japanese: The effects of culture, shared decision making, and relationship age. The
International Executive, 1996 (38(1)), 79–94.
13. Krasikov O., Roshchina I. (2018) Opportunism and labor opportunism of workers: general
and specific features, causes of manifestation. Tomsk State University Bulletin. Economy.
2018 (42), 119 - 128.
14. Lee, D.-J. (1998) Developing International Strategic Alliances Between Exporters and
Importers: The Case of Australian Exporters. International Journal of Research in
Marketing, 1998 (15 (4)), 335 -48.
15. Nagin, D., Rebitzer, J., Sanders, S., Taylor, L. (2002) Monitoring, Motivation, and
Management: The Determinants of Opportunistic Behavior in a Field Experiment.
American Economic Review, American Economic Association, 2002 (92(4)), 850-873.
16. Popov E.V., Ersh E.V. (2016) Institutions for Decreasing of Employee Opportunism.
Montenegrin Journal of Economics. 2016 (12 (2)). 131-146.
17. Popov, E., Simonova, V. (2006) Forms of Opportunism Between Principals and Agents.
International Advances in Economic Research. 2006 (12), 115–123.
18. Posch, L. Bleier, A., Strohmaier, M. (2017) Measuring motivations of crowdworkers: The
multidimensional crowdworker motivation scale. arXiv:1702.01661v3 [cs.SI] 33 p.
19. Sakalaki, M., Kazi, S., Karamanoli, V. (2007) Do individualists have a higher opportunistic
propensity than collectivists? Individualism and economic cooperation, Revue
Internationale de Psychologie Sociale, 2007 (20), 59–76.
20. Seggie, S., Griffith, D., Jap, S. (2013) Passive and Active Opportunism in
Interorganizational Exchange. Journal of Marketing, 2013 (77(6)), 73-90.
21. Wathne, K., Heide J. (2000) Opportunism in Interfirm Relationships: Forms, Outcomes,
and Solutions. Journal of Marketing, 2000 (64 (October)), 36-51.
22. Williamson, O. (1975) Markets and Hierarchies: Analysis and Antitrust Implications. New
York: The Free Press.
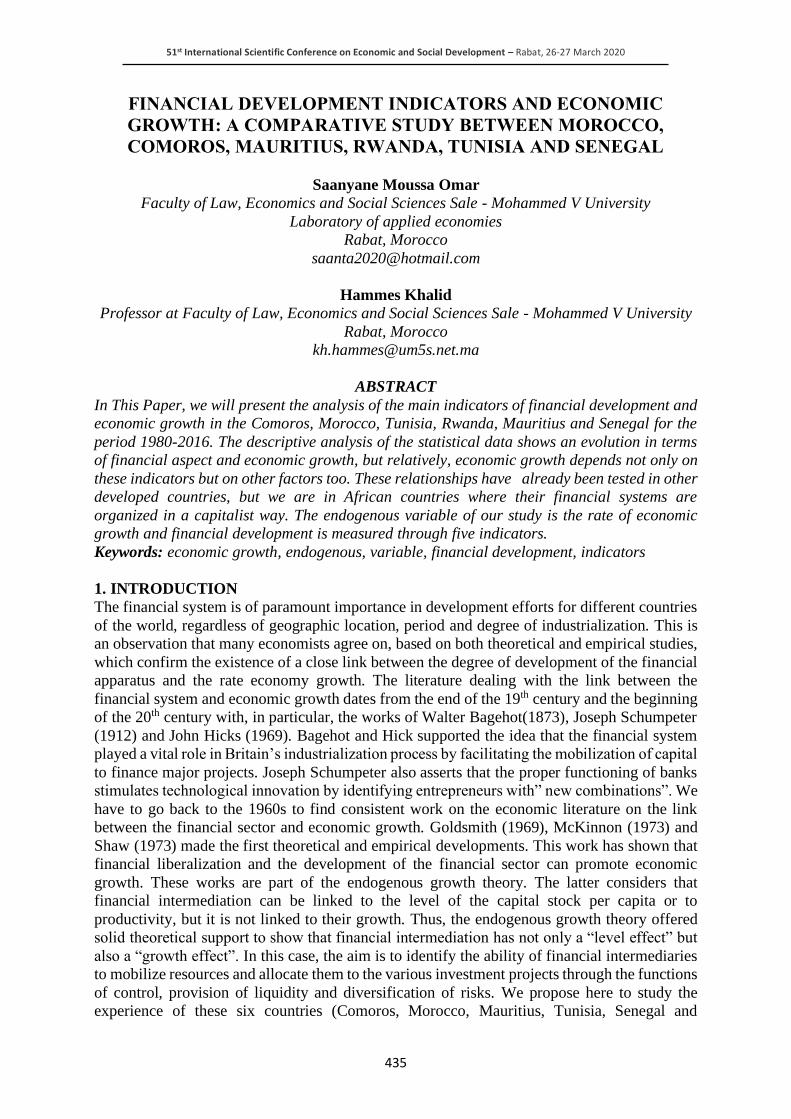
51st International Scientific Conference on Economic and Social Development – Rabat, 26-27 March 2020
435
FINANCIAL DEVELOPMENT INDICATORS AND ECONOMIC
GROWTH: A COMPARATIVE STUDY BETWEEN MOROCCO,
COMOROS, MAURITIUS, RWANDA, TUNISIA AND SENEGAL
Saanyane Moussa Omar
Faculty of Law, Economics and Social Sciences Sale - Mohammed V University
Laboratory of applied economies
Rabat, Morocco
Hammes Khalid
Professor at Faculty of Law, Economics and Social Sciences Sale - Mohammed V University
Rabat, Morocco
ABSTRACT
In This Paper, we will present the analysis of the main indicators of financial development and
economic growth in the Comoros, Morocco, Tunisia, Rwanda, Mauritius and Senegal for the
period 1980-2016. The descriptive analysis of the statistical data shows an evolution in terms
of financial aspect and economic growth, but relatively, economic growth depends not only on
these indicators but on other factors too. These relationships have already been tested in other
developed countries, but we are in African countries where their financial systems are
organized in a capitalist way. The endogenous variable of our study is the rate of economic
growth and financial development is measured through five indicators.
Keywords: economic growth, endogenous, variable, financial development, indicators
1. INTRODUCTION
The financial system is of paramount importance in development efforts for different countries
of the world, regardless of geographic location, period and degree of industrialization. This is
an observation that many economists agree on, based on both theoretical and empirical studies,
which confirm the existence of a close link between the degree of development of the financial
apparatus and the rate economy growth. The literature dealing with the link between the
financial system and economic growth dates from the end of the 19th century and the beginning
of the 20th century with, in particular, the works of Walter Bagehot(1873), Joseph Schumpeter
(1912) and John Hicks (1969). Bagehot and Hick supported the idea that the financial system
played a vital role in Britain’s industrialization process by facilitating the mobilization of capital
to finance major projects. Joseph Schumpeter also asserts that the proper functioning of banks
stimulates technological innovation by identifying entrepreneurs with” new combinations”. We
have to go back to the 1960s to find consistent work on the economic literature on the link
between the financial sector and economic growth. Goldsmith (1969), McKinnon (1973) and
Shaw (1973) made the first theoretical and empirical developments. This work has shown that
financial liberalization and the development of the financial sector can promote economic
growth. These works are part of the endogenous growth theory. The latter considers that
financial intermediation can be linked to the level of the capital stock per capita or to
productivity, but it is not linked to their growth. Thus, the endogenous growth theory offered
solid theoretical support to show that financial intermediation has not only a “level effect” but
also a “growth effect”. In this case, the aim is to identify the ability of financial intermediaries
to mobilize resources and allocate them to the various investment projects through the functions
of control, provision of liquidity and diversification of risks. We propose here to study the
experience of these six countries (Comoros, Morocco, Mauritius, Tunisia, Senegal and

51st International Scientific Conference on Economic and Social Development – Rabat, 26-27 March 2020
436
Rwanda) in terms of financial development by conducting an analysis of some financial
development indicators. In this paper, we present a literature review of the main works that
have dealt with link between financial development and economic growth. Next, we will try to
conduct a quantitative and qualitative analysis of the main indicators of financial development.
2. LITERATURE REVIEW
Studies on the link between financial development and economic growth continue to interest
economists both theoretically and empirically. The analysis of the causal links between finance
and economic growth could be reassembled, at least Schumpeter (1911), but it recognized a
renewed interest from the work of Gurley and Shaw (1955), Granger (1963), Patrick (1966),
Goldsmith(1969),Hicks(1969) and McKinnon(1973) thanks to the introduction of empirical
tests. Theoretically, Patrick (1966) proposes three hypotheses of links between finance and
growth. This is first the so-called “supply leading “hypothesis where it is financial development
that is the source of economic growth. Then, he proposes the opposite hypothesis called
“Demand following” where financial development is a consequence of economic growth.
Finally, the so-called “Stage-of-development” hypothesis states that finance causes economic
growth in less developed economies, but as economies develop, causality reverses, growth
taking over finance. McKinnon went on to test these hypotheses empirically and found that the
causal link from financial development to economic growth is more critical. These results have
had a great influence on the policies pursued by the International Monetary Fund (IMF) and the
World Bank in developing countries in particular with regard to the reforms of the financial
system in these countries. Several studies will later lead to the same results as McKinnon
(1973), such as those of the World Bank (1989), King and Levine (1993, a,b), Pagano (1993),
Neusser and Kugler (1998),Levine and al(2000);Colderon and Liu (2003). In fact, during the
1980s, several developing countries freed their financial systems from internal constraints,
which hampered economic development: Capping of interest rates, high compulsory reserves,
administrative credit allocations, barriers to entry of new banks.
3. ANALYSIS OF THE MAIN FINANCIAL DEVELOPMENT INDICATORS
Among the indices used to determine the performance of financial intermediation in terms of
resource allocation, several studies have focused on the calculation of certain ratios capable of
determining the modalities of the functioning of a modern financial system.
There are six main indicators of financial development:
1. The liquidity ratio measuring the size of financial intermediaries and which corresponds to
money, demand, and term deposits (M2) divided by GDP (M2 / GDP).
2. The ratio of banknotes, coins and cash (M1) divided by M2 (M1 / M2) which tells us about
the ability of a financial system to attract savings and the availability of savings products.
This ratio tends to decrease as the financial systems develop.
3. The ratio of domestic bank credit to GDP (CIB / GDP) which indicates the degree of
participation of the banking system in economic growth.
4. The ratio of banknotes, coins and cash (M1) divided by GDP (M1 / GDP); which measures
the size of a financial system (financial surface). A drop in this ratio reflects better
management of cash by businesses and individuals who are placing their credit balances
better and better.
5. The ratio of credit granted to the private sector (CSP) to GDP (CSP / GDP) which reflects
the control of the crowding out effect of the public sector compared to the private sector.
6. The ratio of quasi money to GDP (QM / GDP), reflecting the increase in monetary savings.
From our calculations relating to the various financial development indicators, the following
results emerge.
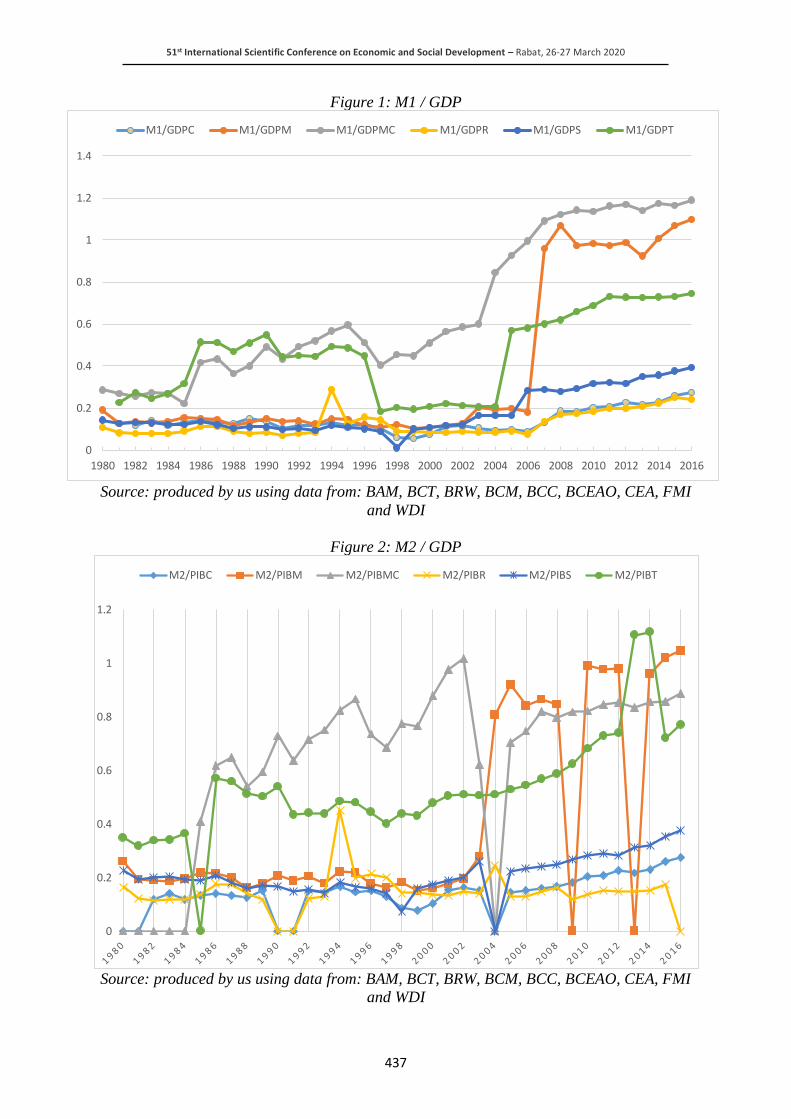
51st International Scientific Conference on Economic and Social Development – Rabat, 26-27 March 2020
437
Figure 1: M1 / GDP
Source: produced by us using data from: BAM, BCT, BRW, BCM, BCC, BCEAO, CEA, FMI
and WDI
Figure 2: M2 / GDP
Source: produced by us using data from: BAM, BCT, BRW, BCM, BCC, BCEAO, CEA, FMI
and WDI
0
0.2
0.4
0.6
0.8
1
1.2
1.4
1980 1982 1984 1986 1988 1990 1992 1994 1996 1998 2000 2002 2004 2006 2008 2010 2012 2014 2016
M1/GDPC M1/GDPM M1/GDPMC M1/GDPR M1/GDPS M1/GDPT
0
0.2
0.4
0.6
0.8
1
1.2
M2/PIBC M2/PIBM M2/PIBMC M2/PIBR M2/PIBS M2/PIBT
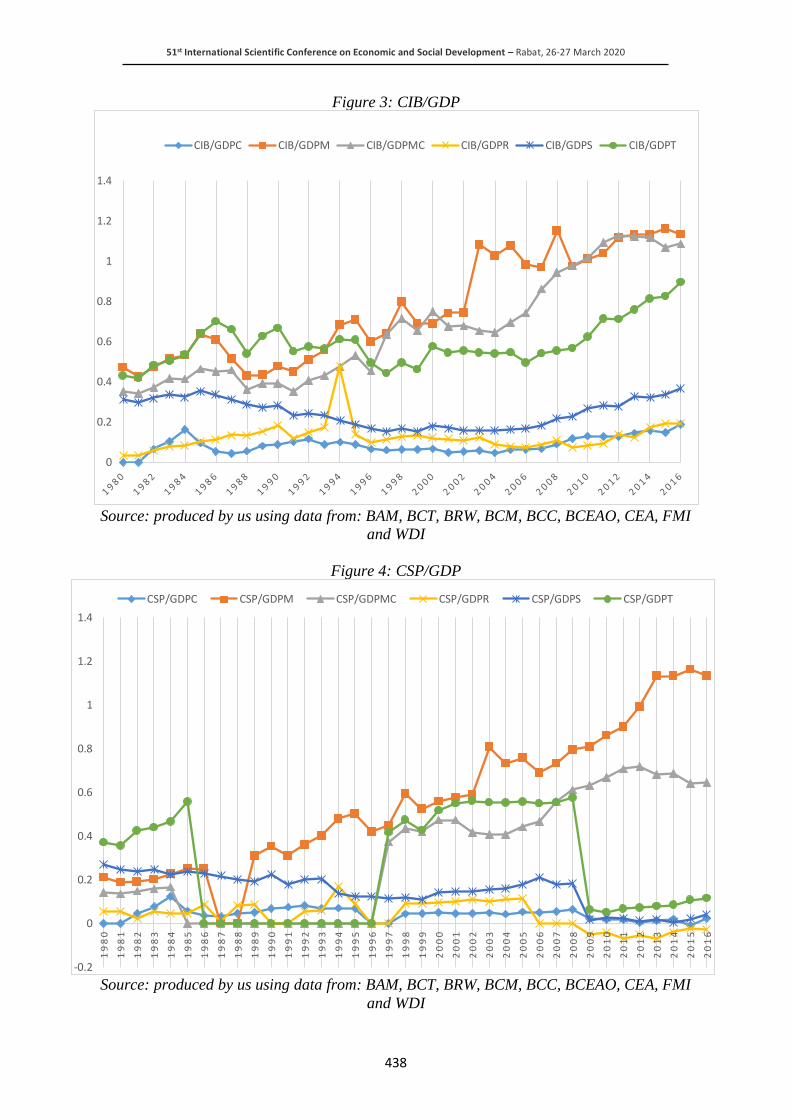
51st International Scientific Conference on Economic and Social Development – Rabat, 26-27 March 2020
438
Figure 3: CIB/GDP
Source: produced by us using data from: BAM, BCT, BRW, BCM, BCC, BCEAO, CEA, FMI
and WDI
Figure 4: CSP/GDP
Source: produced by us using data from: BAM, BCT, BRW, BCM, BCC, BCEAO, CEA, FMI
and WDI
0
0.2
0.4
0.6
0.8
1
1.2
1.4
CIB/GDPC CIB/GDPM CIB/GDPMC CIB/GDPR CIB/GDPS CIB/GDPT
-0.2
0
0.2
0.4
0.6
0.8
1
1.2
1.4
19
80
19
81
19
82
19
83
19
84
19
85
19
86
19
87
19
88
19
89
19
90
19
91
19
92
19
93
19
94
19
95
19
96
19
97
19
98
19
99
20
00
20
01
20
02
20
03
20
04
20
05
20
06
20
07
20
08
20
09
20
10
20
11
20
12
20
13
20
14
20
15
20
16
CSP/GDPC CSP/GDPM CSP/GDPMC CSP/GDPR CSP/GDPS CSP/GDPT
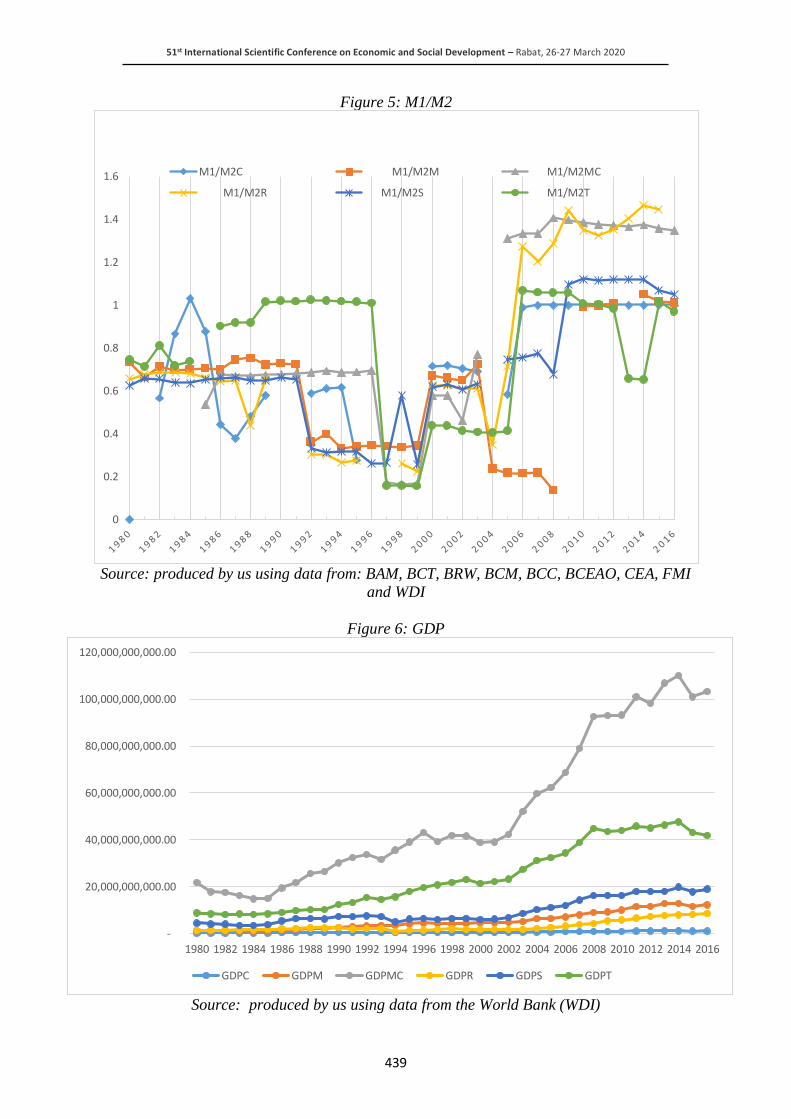
51st International Scientific Conference on Economic and Social Development – Rabat, 26-27 March 2020
439
Figure 5: M1/M2
Source: produced by us using data from: BAM, BCT, BRW, BCM, BCC, BCEAO, CEA, FMI
and WDI
Figure 6: GDP
Source: produced by us using data from the World Bank (WDI)
0
0.2
0.4
0.6
0.8
1
1.2
1.4
1.6 M1/M2C M1/M2M M1/M2MC
M1/M2R M1/M2S M1/M2T
-
20,000,000,000.00
40,000,000,000.00
60,000,000,000.00
80,000,000,000.00
100,000,000,000.00
120,000,000,000.00
1980 1982 1984 1986 1988 1990 1992 1994 1996 1998 2000 2002 2004 2006 2008 2010 2012 2014 2016
GDPC GDPM GDPMC GDPR GDPS GDPT

51st International Scientific Conference on Economic and Social Development – Rabat, 26-27 March 2020
440
Figure 7: QM/GDP
Source: produced by us using data from: BAM, BCT, BRW, BCM, BCC, BCEAO, CEA, FMI
and WDI
NB: The comments of these graphics will be exposed during the presentation of this paper.
4. CONCLUSION
At the beginning of the 1970s, the international economy suffered from a considerable decline
in growth and many countries suffered from deficits in their balance of payments and an
increase in external debt. Financial liberalization then appears to be the solution to cope with
the harmful effects of financial repression and to initiate economic growth. This new financial
policy has been strongly imposed by the IMF and the World Bank to remedy the lag in economic
development in the world. In this paper, we have studied the experience of six African countries,
in this case, Morocco, Tunisia, Rwanda, the Comoros, Mauritius and Senegal by analyzing the
main indicators of financial development. Our objective was to detect the improvements and
shortcomings of the financial systems of these six countries and to measure their financial
development. When interpreting the data relating to financial development indicators, it should
be borne in mind that the density and growth of financial circuits are two factors which
influence each other: if it is true that the systems denser financials tend to boost further growth,
the level of per capita income is also thought to be a key factor in the depth of financial circuits.
LITERATURE:
1. L. Abadie and C. Mercier-Suissa, International Finance: Foreign exchange markets and
financial risk management. Colin, 2011.
2. B. E. Aka, "The Role of Capital Markets in Growth and Economic Development",
University of Auvergne-Clermont-Ferrand I, 2005.
3. B. E. Aka, "The Role of Capital Markets in Economic Growth and Development", Theses,
University of Auvergne - Clermont-Ferrand I, 2005.
-
0.20
0.40
0.60
0.80
1.00
1.20
QM/GDPC QM/GDPM QM/GDPMC QM/GDPR QM/GDPS QM/GDPT

51st International Scientific Conference on Economic and Social Development – Rabat, 26-27 March 2020
441
4. J.-P. Allegret and S. Azzabi, "International financial integration and economic growth in
emerging and developing countries: the channel of financial development", Revue
d'Économie du Développement, p. 27-68, 2014.
5. B. Amable and D. Guellec, "The theories of endogenous growth / The Theories of
Endogenous Growth", Revue d'économie politique, p. 313–377, 1992.
6. R. J. Barro, X. Sala-i-Martin, and F. Mazerolle, Economic growth. McGraw-Hill E:
Ediscience International, 1996.
7. R. J. Barro, "The factors of economic growth", 2000.
8. M. D. Barry, "Financial development and economic growth: theory and evidence from
WAEMU and ECOWAS areas", Theses, University of Franche-Comté, 2012.
9. J.-C. Berthélemy and A. Varoudakis, “Financial development, financial reforms and
growth: a panel data approach”, Revue économique, p. 195–206, 1998.
10. G. Cette, A. Epaulard, and P. Givord, “Productivity growth: the role of institutions and
economic policy”, Economics and Statistics, vol. 419, no 1, p. 3-10, 2008.
11. C. Chavagneux, International political economy. The Discovery, 2010.
12. F. DEISTING, F. MAKHLOUF, and A. NAAMANE, "Financial development, financial
flows and economic growth", Oct-2018.
13. D. de la Croix, T. Baudin, and others, "Economic growth", Catholic University of Louvain,
Institute of Economic and Social Research (IRES), 2015.
14. F. Doligez, J. Bastiaensen, F. Bédécarrats, and M. Labie, "Financial inclusion, a new avatar
of financial liberalization? ", Tiers Monde Review, no 1, p. 9–20, 2016.
15. J. C. Eggoh, "Economic growth and financial development: elements of theoretical and
empirical analysis", Orléans, 2009.
16. H. El Malki, Thirty Years of Moroccan Economy, 1960-1990. National Center for Scientific
Research, 1989.
17. Y. M. Z. Forouheshfar, "Financial sector development, economic growth and demography
in MENA region", Theses, PSL Research University, 2017.
18. M. FOUDEH, "Financial Liberalization, Efficiency of the Financial System and
Macroeconomic Performance", University of Limoges, 2007.
19. M. Frederic and others, "Money, banking and financial markets", New Horizons, 2010.
20. J.-L. Gaffard, Economic growth. Armand Colin, 2011.
21. E. Gelbard, A.-M. Gulde, and R. Maino, "Financial development in sub-Saharan Africa: the
challenges for sustained growth", Revue d'économie financier, no 4, p. 19–42, 2014.
22. P. Granata, K. Kibuuka, and Y. Mascaró, "The cost of financing in Africa: what public
policies to reduce its cost and strengthen financial inclusion? ", Journal of Financial
Economics, Vol. N ° 116, no 4, p. 121-150, 2014.
23. P. Guillaumont, "Openness policy and economic growth: the effects of export growth and
instability", Journal of Development Economics, vol. 1, p. 91–114, 1994.
24. S. G. Jeanneney and K. Kpodar, “Financial development, financial instability and economic
growth”, Economics & forecasting, no 3, p. 87–111, 2006
25. C. I. Jones, Theory of endogenous growth. De Boeck Supérieur, 1999.
26. E. C. Jude, “Financial development, Financial instability and Economic growth: A
reexamination of the relationship”, Revue region et developpement, no 32, 2010.
27. Kangni Kpodor, Syviane Guillomont Jeanneney, "Financial development, financial
instability and economic growth - financial development.pdf". [Online].
28. K. Kpodar, "Financial Development and Growth: Is Sub-Saharan Africa Marginalized? ",
African Development Review, vol. 17, no 1, p. 106–137, 2005.
29. K. Kpodar, "Financial development, financial instability and economic growth:
implications for poverty reduction", Theses, University of Auvergne - Clermont-Ferrand I,
2006.

51st International Scientific Conference on Economic and Social Development – Rabat, 26-27 March 2020
442
30. K. R. Kpodar, "Financial development and the problem of poverty reduction", CERDI,
Studies and Documents, E, 2004.
31. O. Lajili, "Financial liberalization, political openness and economic growth in developing
countries", Theses, University of Toulon, 2015.
32. P.-J. Lehmann, Economics of the financial markets. De Boeck, 2014.
33. C. Mercier-Suissa and L. Abadie, International Finance: Foreign exchange markets and risk
management. Armand Colin, 2011.
34. F. S. Mishkin, Currency, banking and financial markets. Pearson Education France, 2010.
35. S. Morvant-Roux, I. Guérin, M. Roesch, and J.-M. Servet, "Financial inclusion policies,
microfinance and financing of agriculture. », Developing worlds, no 3, p. 9–24, 2010.
36. A. Nsabimana, Organization, regulation and economic efficiency of the financial
intermediation system in Africa. Universal presses de Louvain, 2002.
37. M. Ouni, “Empirical study of the relationship between the monetary and financial system
and economic growth”, University of Neuchâtel, 2011.
38. U. Panizza, Finance and Economic Development, Vol. 3. Graduate Institute of International
Studies and Development, 2012.
39. G. Turunc, “Development of the financial sector and growth: the case of emerging
Mediterranean countries”, Revue Région et développement, no 10, p. 99–120, 1999.
40. M. P. VILLIEU, "Economic Growth and Financial Development: elements of theoretical
and empirical analysis", University of Orleans, 2009.
41. M. O. Williams and M. O. Adedeji, Fiscal Reaction functions in the CFA Zone: An
analytical perspective. International Monetary Fund, 2007.
42. A. Yahyaoui and A. Rahmani, “Financial development and economic growth: Role of the
quality of institutions. ", Panoeconomicus, vol. 56, no 3, 2009.
51st International Scientific Conference on Economic and Social Development – Rabat, 26-27 March 2020
443
CURRENT STATE AND DEVELOPMENT PERSPECTIVES OF CSR
PERFORMANCE IN AZERBAIJAN
Shahla Gahramanova
Azerbaijan State University of Economics (UNEC), Azerbaijan
[email protected]; [email protected]
ABSTRACT
The concept of corporate social responsibility became one of the most discussed ethical
principles to be respected by all businesses in all fields of activities. During recent years,
number of companies asserting commitment to CSR around the world are growing as they
recognize CSR one of the most important principles of ethics and an indicator of sustainable
development. This paper aims to explore the current state of implementation of the concept of
corporate social responsibility by companies in Azerbaijan and tries to analyze trends and
perspectives for the future development of CSR performance in the country. The article
highlights CSR related activities mainly of large companies in Azerbaijan. Increased attention
and support by the government to inspire the development and implementation of CSR actions
is also within the scope of the issues addressed in this study. This research work is developed
on the basis of theoretical literature on CSR, sustainable development and CSR, reports of
international organizations, conference materials, interviews with officials of related agencies,
expert analyses and the authors own observations. Methods include logical reasoning based
on the analysis of scientific literature, statistical and interview data, analysis of reports of
international organizations and data that is publicly available.
Keywords: CSR, corporate strategy, sustainable development, stakeholder orientation, social
investments
1. INTRODUCTION
In modern economic conditions, sustainable development of any business is closely connected
to sustainable development and social well-being of the society as concentration of large
financial and material resources in the hands of a large business enables them to significantly
influence the development of society. Society, on the other hand, understanding the significant
role businesses can play for the public welfare becomes more exacting towards it [business]
calling to act in a socially responsible way in terms of careful use of natural resources and the
environment, creating good working conditions, caring for the labor force, investing in the
development of society at large, etc. XXI century society pays an increasing attention to the
non-financial reputation of businesses. Along with industrial, commercial and economic
indicators, non-financial signs are also becoming increasingly important for stakeholders. In
this connection, impact of Corporate Social Responsibility on the attractiveness of a business
for customers, government, potential investors and partners, and other stakeholders is hardly to
overestimate. In our days, any investor, deciding on a serious step of purchasing shares of a
company, will scrupulously evaluate the full range of risks. Under such conditions, a company
that is attractive in terms of its current commercial and economic indicators, but unstable from
ethical, social or environmental perspectives will not appear such an attractive and competitive
partner for cooperation. Reputation also becomes extremely important from the perspective of
entering in international markets because reputable companies recognized for their responsible
and ethical conduct will not allow themselves to cooperate with those who ignore or are
indifferent to the ethical components of doing business even such a cooperation would seem
economically inviting. Modern business history has faced number of cases when consumer
behavior and pressure from international community forced companies to alter their production
practices, business strategies, and sometimes even their corporate philosophy.
51st International Scientific Conference on Economic and Social Development – Rabat, 26-27 March 2020
444
A good example may serve here global consumer boycott and pressure from international
community that forced Nike to reconsider its standards towards its subcontractors in some Asian
countries; in the early 1990’s due to the malpractice with a focus on low wages and harsh
working conditions of workers in its subcontractor factories located in China, Vietnam and
Indonesia Nike had to take major steps to turnaround their overseas practices. Initially refusing
to be held responsible for the actions of its independent subcontractors the company later had to
modify its policy, code of conduct and environmental responsibilities publicizing a detailed 108-
page report describing the conditions and salary pay of their subcontractor factories abroad.
However, it took the company years to rebuild its reputation and hold a place in the list of top
100 in the global sustainability rankings. CSR is important in building relations with
governmental agencies. World economic (financial) crisis of 2008-2009 demonstrated that
companies who had integrated CSR principles in their activity and proved themselves as ethical
and socially responsible survived the crisis with minimal losses. During the crisis US
government supported several big companies, among them General Motors, Chrysler,
Citigroup, with positive reputation bailing them out from bankruptcy while companies having
proved themselves as unethical by deceiving stakeholders with false financial, economic and
sustainability statements faced court cases with fatal outcomes. As mentioned earlier businesses
in progressive world largely benefits from being socially responsible. Companies in developing
countries who had not yet made CSR principles an integral part of their activity also started to
understand the advantages of being ethical and socially responsible for their sustainability and
positive image in the society. In this connection, businesses in Azerbaijan, particularly big
companies, gradually demonstrate commitment to integration of CSR in their activity.
2. CSR IN MODERN ECONOMIC CONDITIONS
Before examining development and activity of the CSR oriented businesses in Azerbaijan, let
us give a short overview on how the CSR conception is developed worldwide and integrated in
corporate activities of companies. To begin with, we would like to restate that the practice of
conducting responsible and ethical business goes back to the ancient civilizations of both West
and East, particularly after the recognition of monotheist religions calling people to mercy and
help those in need. Some authors even tend to evaluate ancient practices of charity and other
related activities as a predecessor of modern concept of corporate social responsibility.
However, those traditional initiatives were more a question of morality than responsibility and
the movement for the ethicalness and responsibility of business became widespread only in the
late XIX - early XX centuries. As a conception, CSR has around half-century history of
formation and development. Intensive discussions about the social responsibility of enterprises
started after the World War II and as a term CSR was coined by American scientist Howard
Bowen in his book «Social Responsibilities of the Businessman» where he stated that
entrepreneurs carry out responsibility towards the environment they live in and had to
contribute to social development of society surrounding them (Bowen 2013). Decades later, in
1991 Archie Carroll, an American scientist and the author of the CSR Pyramid, supporting the
social responsibility concept of H. Bowen in his article “CSR: Evolution of the Term” (Carroll
1999) emphasised the significance of social responsibility in the sustainable development of
business and society. Modern conception of social responsibility of businesses has shaped under
the influence of certain important factors:
• Increased social awareness and requirements of communities to businesses
By the development of society, the character of requirements posed to businesses also
changes. As stated by W. Shaw, professor of San Jose State University and author of the
book “Business Ethics”, in our days “The list of corporate responsibilities goes beyond such
negative injunctions such as “Don’t pollute,” “Don’t misrepresent products,” and “Don’t
bribe.”
51st International Scientific Conference on Economic and Social Development – Rabat, 26-27 March 2020
445
Included also are affirmative duties like “See that your product or service makes a positive
contribution to society,” “Improve the skills of your employees,” “Seek to hire the
disabled,” “Give special consideration to the needs of historically disadvantaged groups,”
“Contribute to the arts and education,” “Locate plants in economically depressed areas,”
“Improve working conditions.”, etc. (Shaw 2016)
• Industrial disasters and accidents:
- 21 September 2001 explosion at the AZF chemical plant in the French city of Toulouse,
the consequences of which are considered one of the largest technological disasters
(exploded 300 tons of ammonium nitrate that were left in the finished goods warehouse).
According to the official version, the management of the plant is to blame, which did
not ensure the safe storage of explosive substances. All these (and numbers of others)
disasters were a significant hit on reputation and hopefully on conscience of those who
were responsible.
- 19 March 2007 a methane explosion at the Ulyanovskaya colliery in the Kemerovo
region killing 110 people;
- Deepwater Horizon oil spill in April 2010 leading to extensive damage to marine and
wildlife habitats in the Gulf of Mexico;
- And the most latest: Boeing Max 737 accidents taking hundreds of lives which involves
risky design choices and negligent safety assessments
• Major corporate scandals shaking the world economy
Though major companies of the US and some large corporations in other countries had
declared CSR as an integral part of their activities demonstrating commitment to it the
World faced a shock when huge corporations such as WorldCom, Enron, TYCO, Lehman
Brothers, Satyam and many others were found guilty and admitted the fact of deceiving the
public and stakeholders. These massive corporate failures and scandals leading to the
world financial crisis of 2008-2009 clearly demonstrated the after-effects of conducting
unethical business and made the governments and international organizations to reconsider
and modify norms and regulations regulating business activity towards all their
stakeholders. It was also a sign to governments, particularly for super powers such as US to
develop internal regulating mechanisms to track the social activity of companies to see
whether it is a decisive PR company to avoid taxes and other responsibilities or a noble
CSR policy. The crisis also revealed the necessity of making corrections/modification to
the definition of CSR making clear that it cannot be categorized as “voluntary activity”.
• Overall rising international standards
Companies willing and becoming internationally certified have to follow certain
requirements - among them reports on careful use of natural resources, limitations of
pollution permission, other kinds of social and environmental reports. From one side this
certifications contributes to company’s international recognition while apply certain
limitations in the activity: in the capacity of a member the company undertakes certain
obligations to stay within expected behavior norms.
• Other factors
Overall during the last two decades, CSR concept has been given a great attention both
theoretically and empirically. Having gained theoretical recognition and approval by
academicians like A. Carroll, E. Freeman, R. Kotler, M. Schwartz and others CSR is given a
due importance and became an integral part of the sustainable businesses across the globe.
Studies of modern tendencies in the development of CSR conception shows that since more
than 20 years CSR has been integrated in the activity of all modern reputable companies.
Several regulatory documents such as ISO 26000 (particularly), GRI, SA 8000, A 1000, Dow
Jones Sustainability Indices have been developed and now businesses try to build their social
51st International Scientific Conference on Economic and Social Development – Rabat, 26-27 March 2020
446
reporting system and the entire structure of corporate social responsibility according to
standards of these regulating mechanisms. Although general approach toward CSR conception
is still missing most of them concludes that CSR is a voluntary activity conducted by businesses
for the well-being of society. Majority of these definitions doesn’t include or consider
stakeholders while most universally recognized definition stated in ISO 26000 underlines
importance of recognizing expectations of all stakeholders without categorizing CSR as a
voluntary activity. One can conclude from ISO definition that thinking of CSR conception as a
voluntary activity is outdated. If we compare the ISO 2600 definition of CSR established in
2010 against the European Union’s Official Definition of CSR publicized 9 years earlier in the
EU Green Paper we see that the ISO definition avoids the word “voluntary” and brings the
stakeholder perspective on the agenda underlining the importance of recognizing expectations
of all stakeholders.
EU Green Paper definition of CSR: “The voluntary integration of companies’ social and
ecological concerns into their business activities and their relationships with their
stakeholders. Being socially responsible means not only fully satisfying the applicable legal
obligations but also going beyond and investing ‘more’ in human capital, the environment, and
stakeholder relations.”
ISO 2600 definition of CSR: “The responsibility of an organization for the impacts of its
decisions and activities on society and the environment, resulting in ethical behavior and
transparency which contributes to sustainable development, including the health and well-
being of society; takes into account the expectations of stakeholders; complies with current
laws and is consistent with international standards of behavior; and is integrated throughout
the organization and implemented in its relations.”
Based on the foregoing, we can say that having a half-century history of formation and
development, the concept of corporate social responsibility (CSR) has long been recognized as
one of the key components of successful business at various levels, both abroad and in our
country.
3. CURRENT STATE AND DEVELOPMENT PERSPECTIVES OF CSR IN
AZERBAIJAN
The concept of corporate social responsibility is a relatively new phenomenon for Azerbaijani
companies. In its modern perception, CSR in Azerbaijan has become popular since the end of
the first decade of the XXI century though the manifestation of philanthropy was part of
Azerbaijani entrepreneurs at all times in the form of charity, which is considered the
predecessor of CSR. Brief overview of the history of social responsibility and ethicalness of
business in Azerbaijan is given below. Evolution of social responsibility of businesses in
Azerbaijan went through long and contradictory stages. In old times, donating some part of the
wealth to those in need was cultural and religious component of the national thinking. The early
XX century Azerbaijan experienced more systematic form of being socially responsible: clearly
addressed social contributions directed to the development of education, healthcare, art and
architecture, road building and other similar directions. Thanks to social contributions of the
prominent Azerbaijani Maecenas such as Haji Zeynalabdin Tagiyev, Murtuza Mukhtarov, Aga
Musa Nagiyev, Shamsi Asadullayev, Nabat khanum Ashurbeyli and others a significant
progress has been made in the country in the areas of education, healthcare, architecture, music
and other fields. To note that Nobel Brothers are also in the list of Maecenas who contributed
to the well-being of the Azerbaijani society and are glorified among those who laid the
foundation of responsible and ethical business in Azerbaijan.
51st International Scientific Conference on Economic and Social Development – Rabat, 26-27 March 2020
447
Starting from the third decade of XX century Azerbaijan continued its existence [for the next
70 years] as part of the Soviet Union being one of the 15 Soviet Socialist Republics. Changes
in the political system had its impact on the notion of social responsibility by changing and
modifying its character according to the requirements of the existing political regime. The
centrally planned economy of the communist system (so called “Five-Year Plans”) was hardly
conducive to the social development of society though being socially responsible was on the
agenda of soviet ideology. The outline of social responsibility and conducting ethical business
or activity in soviets was different from its modern meaning, first of all because there were no
private business and everything belonged to and ruled by the government. The idea of having
no single poor person in the country and a popular motto “One for all and all for one” was
expecting and encouraging to be ethical and contribute to common good and for the well-being
of the whole nation without discriminating none of its members. Though not named CSR, there
were understanding of social responsibility, safety and harmfulness of production for
environment and people. There were messages with social responsibility content providing
emotional support that were delivered to the minds via the books, slogans, movies and cartoons,
community workdays, collective games and contests. It is difficult now to judge on the degree
of effectiveness and implementation scope of those initiatives though the idea behind was
definitely positive. Soviet animated film called “Gena the Crocodile” where the main hero - the
50-year-old crocodile [Gena] volunteers as a community activist by building houses for
homeless, fighting against manufacturers who carelessly pollutes the environment, particularly
the local lake, may serve an example used in 70th to attract attention to social responsibility.
(https://www.youtube.com/watch?v=lOh330MbTag&t=5s). After the collapse of the Soviet
Union Azerbaijan, gaining its independence in 1991, entered in a new epoch of its existence
with chaotic transformation period extremely complicated by the involvement in the Armenian-
Azerbaijani Nagorno-Karabakh conflict. Experiencing an ongoing war, struggle for protection
of the independence that the country gained after 70 years, the transformation crisis of the
1990s, poor economic conditions, demographic crisis and other challenges neither the
government nor the society or emerging businesses were ready and able to think about social
responsibility in its broad meaning. All these factors suspended the attention of both the
government and the society from sustainable development and social responsibility making
them busy to fight against symptoms of transformation crisis of the 1990s. Accordingly, during
around 15-20 years of long-running and difficult period of state-building process, a systematic
approach to CSR related activities were not given a due attention. More than 60 years long
history of modern CSR concept shows that attention to the social responsibility of businesses
increases in parallel to the economic development of a country or an entire region, i.e. CSR is
paid attention when the economy grows. This was the case in the US, in developed countries of
Europe and Asia. So the reason why CSR concept in post-soviet countries, including
Azerbaijan, became actual only during the last 10 years (almost 20 years later than in developed
countries) can be explained by the conditions mentioned above. However, even after the state
stepped into more stable development period, on the whole, qualitative and rational ideas of
social significance did not always find their due place in the activity of all businesses. Not fully
understanding the philosophy and importance of being socially responsible companies were not
striving integrating CSR in their activity. Giving just a superficial treatment to this important
responsibility by spontaneous events of philanthropic character they were preferring to avoid
their responsibilities to various stakeholders. Having in mind to be liked by the government
rather than to contribute to social well-being and sustainability these philanthropic initiatives
could not last long. From the studied materials, we can conclude that the first serious attempt
of the Azerbaijan Government for the development and promotion of Corporate Social
Responsibility was made in October 2008 as part of the "Azerbaijan Corporate Governance
Project" jointly implemented by the International Finance Corporation (IFC) and the Ministry
51st International Scientific Conference on Economic and Social Development – Rabat, 26-27 March 2020
448
of Economic Development. In 2011 Azerbaijan Corporate Governance Standards was
developed within this project thanks to the joint efforts of the Ministry of Economic
Development and the International Finance Corporation (IFC). Over the past decade, situation
has positively changed and certain improvements are observed in the field of CSR activity
thanks to the attention of government and initiatives taken by some large companies (mostly
banks, mobile operators, oil companies having international cooperation). Government has
repeatedly voiced the importance of being socially responsible calling business people to
consider CSR as an important and serious component of their activity and prioritize contribution
to the well-being of society and environment. With the support of government some regulatory
and encouragement mechanisms (though not comprehensive) have also been developed to name
a few:
• “The Code of Corporate Ethics” developed by the Ministry of Economic Development in
cooperation with IFC;
• Establishment of National CSR Award;
• Reformations carried out by the Council on State Support to NGOs;
• Establishment of the Agency for the Development of Small and Medium-Sized Enterprises;
• Activity of the State Agency for Sustainable development under the Ministry of Economics
and
• Other similar activities.
One of the biggest events underlining the importance of CSR and trying to raise the CSR
awareness of society, businesses, related public associations and media was the First Azerbaijan
Sustainable Development & Corporate Social Responsibility Conference held in Baku on 15
October 2015. Gathering leading governmental and non-governmental organizations from
Azerbaijan and the region, as well as international organizations supporting CSR activity, the
event focused on a comprehensive evaluation of the current situation in the country, including
development opportunities, and promoted dialogue and cooperation among the state and private
sectors. Government initiative to recognize and appreciate companies who runs a sustainable
and ethical business was a positive sign and made a significant impact to encourage businesses
to integrate CSR in their activity. A group of large corporations in Azerbaijan began to integrate
CSR conception in their activity in accordance with international norms and standards
considering interests of various stakeholders such as employees, customers, society and
environment. For several years, considerable attention has been paid by the government to the
development of various sustainable social programs. One of them is establishment of the
National CSR Award the main objective of which is to increase the number and quality of
sustainable Corporate Social Responsibility projects undertaken by entrepreneurial entities in
the country, and to reaffirm the commitment to social responsibility at a larger extent. The first
ceremony of the award took place in January 2019 appreciating the initiatives of seven socially
responsible private businesses: four commercial banks, one mobile operator, one insurance
company and one development centre. Several large national companies whose activity was
surveyed within this research has provided an open social report, which was mainly at the self-
initiative of the companies. Some large companies have already institutionalized CSR and
established their own CSR Committees. Most of them have been implementing sustainable
social projects lasting since several years. For example, since 2008 Bakcell, one of the 3 leading
mobile operators in the country has been running a sustainable project called “Bakcell Stars”
focusing on the creation of opportunities for vulnerable children supporting their integration to
the society and creating for them opportunities for education and employment. In June 2019
Bakcell received an award in the “Corporate Social Responsibility” nomination for its 10 years
long sustainable project. Earlier the company had received the “National CSR Award 2018”.
51st International Scientific Conference on Economic and Social Development – Rabat, 26-27 March 2020
449
Establishment of such initiatives is commendable while there is a need to establish a non-
financial reporting mechanism and a CSR rating agency that has a proper evaluation system
developed according to the requirements of recognized international standards. Currently, the
number of companies in Azerbaijan seeking to improve their CSR reputation has been rising.
However, they need a guidance in developing their CSR strategy and CSR reporting standards.
From this perspective development of national CSR strategy and CSR reporting standards
would increase the credibility and visibility of CSR and provide a guidance for organisations
in building their CSR strategy and reporting system. There are various internationally
recognized standards and guidance on social, environmental and economic responsibilities such
as GRI reporting system, Dow Jones Sustainability Indices (DJSI), SA 8000, ISO 26000,
AAA1000 to name a few. These standards provide comprehensive approach and guidance for
developing national SCR strategies and standards that will integrate universally accepted norms
of socially responsible activity. However, although ready and proved Western CSR standards
will positively influence CSR development in the country it is important that national CSR
standards consider and adapt certain cultural and historical specificities of the nation.
4. SUMMARY
The paper defines the evolution of CSR development in Azerbaijan and specifies the main
period of its development after Azerbaijan gained independence in 1991. First period covers
end of 1990’s and first years of XXI century when the nation became slightly familiar with the
CSR concept in its modern meaning. During this period, there were unsystematic charity
activities by many businesses. Second period covers roughly 2005-2015 noticed with the
acceleration of mostly quantitative development processes with big number of large companies
trying to integrate CSR in their activity. The third period starts since 2015 and can be defined
as the period of gradual understanding the philosophy of CSR concept, with large companies
institutionalizing CSR and attempting to realize it according to the universal standards. One of
the main conclusions made as a result of this research work is that CSR in its modern
understanding is relatively a new notion for Azerbaijan and other post-soviet countries and it
can be assessed as one of the factors delaying its integration in the activity of businesses.
Surveying the activity of large companies and related agencies in the country allows to make
another conclusion - currently CSR is in the process of nationwide integration as it has been a
topic of wide discussions by commercial and non-commercial organizations, state agencies,
public associations, media and society. Media, as well as researchers publish news and articles
about CSR activity in the country. However, majority of these publications tend to criticize
rather than appreciate the CSR initiatives and efforts put by the related agencies and responsible
companies. Establishment of CSR Award by the government is another promising and
important steps for encouraging businesses to more seriously and widely engage in CSR related
activities. Recognition of CSR on the governmental level will definitely boost its integration,
however establishing a CSR rating agency that has a proper evaluation system based on the
requirements of recognized international standards would be more advisable. Establishment of
a non-financial reporting mechanism is another important step in helping businesses to
reconsider their CSR policy and benchmark it with the world practice. The research found that
only some of the large companies whose activities are researched publish CSR report while the
content of the publicized reports are well behind of the existing international standards. It shows
that companies need methodological guidelines and expert support for developing CSR report.
The most important conclusion is connected to the necessity of developing national CSR
strategy and CSR reporting standards in conformity with internationally recognized standards
such as GRI reporting system, Dow Jones Sustainability Indices (DJSI), SA 8000, ISO 26000
while considering and adapting certain cultural and historical specificities.
51st International Scientific Conference on Economic and Social Development – Rabat, 26-27 March 2020
450
LITERATURE:
1. Achieving Sustainable Development through Corporate Social Responsibility. Research
Report by CESD (2013). Available at
http://cesd.az/new/wp-content/uploads/2011/05/CSR_Research_Paper_CESD_KAS.pdf
2. Bakcell receives an award from the Ministry of Economy (2019)
https://www.bakcell.com/en/06/2019/bakcell_award_from_ministry_of_economy_2019
3. Brink A. (2012). Corporate Governance and Business Ethics. SAGE Brief Guide to
Business Ethics series. UK: SAGE Publications.
4. Business Ethics by Annual Editions (2012). Delhi: McGraw-Hill Education.
5. Carroll, Archie. (1999). Corporate social responsibility: Evolution of a definitional
construct. Business & Society. 38. 268-295.
6. Corrporate Social Responsibility (CSR) – Definition, History and Evolution
https://youmatter.world/en/definition/csr-definition/
7. CSR in Azerbaijan: Business in the Society. IMPACT Azerbaijan Magazine. 2012. Issue
14. Available at http://amcham.az/wp-content/uploads/2016/11/impact14.pdf
8. Davis Marc. (2019) U.S. Government Financial Bailouts. Investopedia.
https://www.investopedia.com/articles/economics/08/government-financial-bailout.asp
9. Ferrell O.C., Fraedrick J., Ferrell L. (2018). Business Ethics: Ethical Decision Making and
Cases (12th edition). USA: South-Western Cengage Learning.
10. Gahramanova S. (2019), The Role of the Corporate Social Responsibility in Sustainable
Development of Small and Medium Enterprises in Azerbaijan, Economic and Social
Development: Book of Proceedings, p. 1254-1260
11. How Consumer Behavior Shifts Forced Nike to Become a Leader in Building an Ethical and
Sustainable Supply Chain. https://medium.com/@gjohnston2/abstract-b7019511142e)
12. J. Sullivan. (2009) The Moral Compass of Companies: Business Ethics and Corporate
Governance as Anti-Corruption Tools. IFC publication.
https://www.ifc.org/wps/wcm/connect/topics_ext_content/ifc_external_corporate_site/sust
ainability-at-ifc/publications/publications_handbook_cg-focus7
13. Mercy Ejovwokeoghene Ogbari et al. (2016) Entrepreneurship and Business Ethics:
Implications on Corporate Performance. International Journal of Economics and Financial
Issues, 6(S3) 50-58.
14. Məsuliyyətli Banklarımız (2015) https://banco.az/az/news/mesuliyyetli-banklarimiz
15. National CSR Award was presented to the 2018-year winners (2019) http://ask.org.az/
en/2019/01/31/national-csr-award-was-presented-to-the-2018-year-winners/
16. Porter, M.E., Kramer, R.M. (2006). The link between competitive advantage and corporate
social responsibility. Harvard Business Review, 84 (12), 78-94.
17. Samuel O.Idowu et al (2018) Current Issues in Corporate Social Responsibility. Springer
International Publishing AG 2018
18. Shaw W.H. (2016). Business Ethics: A Textbook with Cases (9th edition). USA:
Wadsworth Cengage Learning.
19. Şirkətlər könüllü olaraq korporativ sosial məsuliyyətli olmağa dəvət edilir (2012)
http://cesd.az/new/?p=4423&lang=az
20. Taylor J., Simpson J. (2013). Corporate Governance, Ethics and CSR. Great Britain: Kogan
Page Limited.
21. The World's Most Reputable Companies For Corporate Responsibility (2018)
https://www.forbes.com/sites/vickyvalet/2018/10/11/the-worlds-most-reputable-compani
es-for-corporate-responsibility-2018/#4d5fb6413371
22. Yerli şirkətlər və korporativ sosial məsuliyyət (2017). Media report available at
https://sia.az/az/news/economy/623367.html
51st International Scientific Conference on Economic and Social Development – Rabat, 26-27 March 2020
451
TRENDS AND CONTRADICTIONS OF ECONOMY GLOBALIZATION
Shafa Guliyeva
Azerbaijan State University of Economics (UNEC)
Baku, Istiqlaliyyat str.6, AZ1001, Azerbaijan
ABSTRACT
Globalization is a manifestation of the modern post-industrial stage of economic and social
development in relations between the countries of the world. The economic self-determination
of countries is inseparably linked with their entry into the world economy, with finding their
place in the globalization processes. Acquiring its own logic, globalization, has an increasing
impact on the economic development of the world's different countries. The main economic
globalization sources are a small group of countries with new industrial economies, and a
larger number of countries are experiencing the contradictory effects of globalization. Arising
from the end of the Cold War and the collapse of the "bipolar" system, globalization creates a
new stable bipolar system between developed and developing countries. At present,
globalization is in a very tense situation with contradictory economic development trends. The
further evolution of globalization requires the identification of its components and making the
globalization controllable on the common interest’s basis of the world community, taking into
account all countries. It should be noted that in these circumstances, the issue of control will
increasingly head to the macro level, because at the national level it is impossible to eliminate
certain subjectivity, and besides, it is much more difficult to cover the entire global picture. It
is quite obvious that globalization is objectively determined by a specific historical situation,
but this does not mean that everything that is happening on the world stage is justified. Some
contradictions are inherent in the very essence of globalization, while others arise against the
background of the aggravation of these contradictions and they should be regulated.
Keywords: contradictory trends, globalization of the economy, globalization processes,
regulated nature, the origins of globalization
1. INTRODUCTION
Globalization is a qualitatively new phase in the history of economic life's internationalization,
the world economy's most significant development cycle on the verge of the XX-XXI ages.
Globalization is the integration of national economies into a single, global system, the
foundation of which is the rapid movement of capital, the new openness of the world to
knowledge, the technological revolution, the contribution of developed industrial countries to
the process of liberalizing the movement of goods and resources, the rapprochement of
communication, the planetary science revolution [1]. The values of the so-called Washington
Consensus form its ideological foundation. Central to this was the Globalization Era thesis. It
was supposed to be a free market victory, eliminating government intervention in the economy
and all the obstacles that the state generated to the movement of goods, resources, and citizens
around the world [2]. Globalization's movements derive primarily from the economy. The main
argument that supports the objective essence of globalization is missed, without taking into
account the economic dimension. The rise of transnational corporations, i.e. technological
globalization and rapidly growing foreign coalescence and money capital movement, has given
the idea of "economic globalization" a qualitatively new meaning. The evolution of
internationalization is reflected in economic globalization, based on the requirements of the
modern stage of productive forces growth. The development of the productive forces has led to
the creation of a vast number of new technologies and the nature of manufactured products,
which has resulted in the economic inefficiency of producing different types of products even
51st International Scientific Conference on Economic and Social Development – Rabat, 26-27 March 2020
452
in large industrialized countries. Due to the growth of the multinational division of labor the
global economy has grown. He initially plays an enormous role in speeding up global economic
growth and increasing its efficiency. In essence, international economic trade is focused on the
comparative advantages of the participating countries in providing different development
factors. Unlike the global economy, however, which was formed based on daily trade of goods
between industries, the basis of the global economy is the international division of labor
between sectors. It involves releasing any ready to consume the product. Therefore, in
comparison to the world economy, the regional or transnational economy, according to famous
American scientist M. Castells ' can operate on a global scale as a single system in real-time'[3].
Deepening internationalization with the advancement of demand globalization lies at the root
of the rising world trade growth rate. Consequently, the reliance of all countries' economies on
the global market is greatly enhanced. The internationalization of production is an objective
and positive process; it increases the productivity of production and helps speed up the
dissemination of scientific and technological advances throughout the world.
Internationalization has created a powerful incentive for international trade in services to grow.
At first, manufacturing was the primary focus of globalization due to its structural features. Yet
globalization has also brought in businesses, due to the obvious economic advantages. The
degree to which the internationalization of production has a positive effect on the economy of
individual countries depends on the position of those countries in the global economy.
Industrialized countries are the major winners here. We will reduce production costs,
manufacture the most competitive, science-intensive goods and export to developing countries
environmentally dirty industries. Many developing countries are raw materials sources and
labor-intensive goods. They turn out to be reliant on advanced states, with lower and
unpredictable revenues. As we see, globalization's disparity creates a paradox between the core
and the periphery of the global economy. The propagation of the Washington Consensus,
coupled with this predominance of the "golden billion" nations, contributed to the rise of the
"end of history" concepts [4]. As G. Kissinger pointed out, "the international order faces a
paradox: its development depends on globalization's progress, but the mechanism of
globalization creates a political reaction, which often operates against its aspirations" [5].
2. GLOBALIZATION OF REGIONALISM
In parallel with the globalization process, a tendency to regionalize the world economy is
emerging, which leads, at first glance, to the separation of the common economic space and the
independence of its parts [6]. In the global economy, globalization and regionalization
complement each other. The current stage of development of the world economic system raises
the complexity of the geo-economic and geopolitical environment being further developed [7].
After the collapse of the USSR in the first years, the main development was unipolar
imperialism, which secured Western countries ' predominance at the head of the United States.
Eventually, China's rapid economic growth and other leading "emerging markets" reversed this
trend of globalization, and new economic poles began to form. Today, "dispersal of world
geopolitical power" is one of the main features of the current global economic and political
configuration [8]. The function of the Integration Units is growing today. Regional economic
alliances, the main ones being the European Union (EU), the North American Free Trade
Association (NAFTA), the Association of Southeast Asian Nations (ASEAN), the Asia-Pacific
Economic Cooperation (APEC), have arisen at different times and reflect different degrees of
regional economic cooperation. In some cases, these are pure agreements of purpose, for others-
trade and customs policy cooperation, and in third-real steps towards economic integration.
Moving on from Z. Bauman, the world's unification and division, globalization and
"territorialization" are intertwined and are different sides of a single process. Therefore, the
word "globalization" together with it can be considered appropriate, which is understood as a

51st International Scientific Conference on Economic and Social Development – Rabat, 26-27 March 2020
453
mechanism that combines globalization and localization trends [9]. Important changes in the
foreign economic policy of developing countries are taking place under the influence of the
internationalization of trade and resources— the barriers to the flow of goods and capital from
one country to another are reduced. The colonial powers ' acquisition of political independence
in the middle and at the end of the 20th century did not lead to their international economic
relations being liberalized. On the opposite, developing countries started pursuing protectionist
policies to protect their industries. We imposed quantitative constraints and high customs duties
on goods, similar to which national industries started to manufacture. Many economists from
different countries have consistently opposed protectionism, though appealing to the principle
of comparative advantages and claiming that this would allow third world states to enter the
world economy more rapidly and achieve economic growth. Nevertheless, developing-country
scientists and experts believe a free play of market forces does not lead to economic equality
across countries. To date, some of the developing countries, such as India, Brazil, South Africa,
Poland, and Turkey, have developed significantly, producing globally competitive industries.
Integration trends have also intensified: there are several hundred integration groups in Latin
America, Asia, and Africa ("common markets," "associations," etc.) in which participants '
economic rapprochement processes take place, duties are mutually reduced, etc. The resulting
difficulties are explained by the general relatively low level of the third world countries '
economic development, the major divergence of national economies ' parameters, political
inconsistencies, etc. Nevertheless, the development of the demand for the new national
industries is a common interest in developing countries. On the one hand, regional integration
is included in the content of globalization, because the direct prerequisites for involving
participants in global processes of rapprochement are the within the context of integration
groups, but on the other hand, integration groups have also been developed as a means of
collective defense against those elements of globalization that can damage national integration
[10].
3. THE MAIN PHENOMENA IN GLOBALIZATION PROCESSES
The economy's globalization is correlated with growing countries ' economic transparency,
liberalization of national trading regimes and capital flows, development of a global financial
market and a global information network. Some fundamentally new phenomena became
inevitable as a result of the globalization processes. First, the world economic community is
transformed into an integrated economic system from a mere set of countries. The further
countries are moving along the path of industrialization, the denser the connection between the
elements of the global system, the more organically national economies enter a single global
economy. When globalization intensifies, economic relations are becoming increasingly
complicated, causing mutual dependency on the economic system [11]. Secondly, national and
world economic relations are beginning to change roles in the context of globalization. In the
past, national economic relations and the most developed national economies in one period or
another had a leading role in determining the nature, forms, and mechanisms of international
relations, as if they were imposing on other countries and the world community as a whole way
of economic communication. But world economic relations acquire defining and leading roles
through the formation of supranational financial markets and distribution structures. Domestic
relations are forced to adjust to global economic realities. Global economies have increasingly
become more powerful over the past decades. The global economy is becoming a common
arena for big business sports. Third, globalization objectively leads to the erosion and
depreciation of the nation-state's regulatory functions which can no longer protect the national
economy from unwanted external economic impacts [12]. International economic processes
develop into non-country, that is, global, almost or wholly unfit for state regulation. National
states are increasingly losing the ability to use traditional macroeconomic regulation levers
51st International Scientific Conference on Economic and Social Development – Rabat, 26-27 March 2020
454
effectively, such as import barriers and export subsidies, the national currency, etc. One has to
deal with the actions of powerful non-state actors in international economic affairs-
transnational corporations (TNCs), transnational banks (TNBs), and investment funds globally.
By reacting, they can negate the expected effect of the actions taken. The state is no longer in
the position of an omnipotent and sovereign arbiter of the fate of its national economy but as
one of the ties in the global economy's complicated process. It should be remembered that the
major factor in China's steady and rapid growth over the last quarter of a century was the
internal change, which effectively combined market reform with targeted state regulatory
activity.
4. THE PLACE AND ROLE OF THE STATE AND TRANSNATIONAL CAPITAL IN
THE GLOBAL WORLD
The key spring of the world economy's growth is the battle of the two largest institutions: the
state and the sector. With the emergence of mega economics, the fight for power shifts mainly
to the realm of finance, and national states and transnational capital are the main actors in this
struggle. At the same time, both are trying to enlist population support, which is necessary under
the democratic government regimes that are developed in most countries. As a buyer, the
population is inclined to support transnational capital, as it sells goods at lower prices and seeks
liberalization of international economic relations. In an age of globalization, states are falling
into a different kind of trap: following a tough course to uphold their sovereignty, they are
constantly competing in the battle for investment capital, turning the ties that connect the state
and nation into an obstacle to political innovation [13]. The State power system is becoming
ever more amorphous. The nation-state is under pressure from above, from globalization, and
from below, owing to the rise of ethnic nationalism and the citizens ' desire to expand their
rights [14]. States aim to control their external economic environment and world markets. The
world market is a source of volatility and states are keen to defend domestic markets against its
sharp fluctuations. As a result, developed countries have well-regulated domestic markets and
an open, unregulated, and hence dysfunctional world market. A paradoxical tendency arose
with the formation of the independent transnational capital. It turned out, along with organizing
the countries ' economic blocs, that the economic situation of small countries can be quite
satisfactory in the mega-economy. The insufficiency of the scale of production within the
context of one country is now balanced by transnational production possibilities, and
transnational integration replaces intra-national output. Examples of small but rich countries,
such as Singapore, Israel, and Hong Kong, are contributing to the increasing striving for
independent development of small countries. Today transnational capital has liberated itself
from nation-state tutelage. He started moving around the world openly searching for the most
lucrative markets. There is enough money that is free from state control and used in various
global operations. If the state could regulate the national currency market under the conditions
of tight financial regulation, while liberalizing the financial markets and easing currency
control, transnational capital was given the opportunity, if desired, to disrupt financial markets
in any country. An integrated international trading and financial structure are being developed,
compared to which individual state systems function as secondary values. In connection with
the growth of globalization processes, the transition from a state-regulated economic system to
a system where TNC-dominated capital markets dominate is becoming ever more apparent.
TNCs also consider foreign exchange transactions as the most lucrative source of profit. In this
case, TNCs only function more coherently and effectively in the same way as individual
speculators do. It creates an incredibly "complicated world order." TNCs favor repression of
national production in an attempt to conquer markets abroad. Extracting high incomes by
manipulating cheap labor and natural resources, major transnational corporations also prefer
spending profits outside of those nations.
51st International Scientific Conference on Economic and Social Development – Rabat, 26-27 March 2020
455
Globalization modifies the previously established system of economic regulation by
influencing the structure of economic growth and the distribution of world productive forces.
Expanding the scope of world economic relations, globalization is undermining the national
state's managerial capabilities, forcing it to reckon with TNCs, the situation in other countries
and the global economy as a whole. This significantly increases the dependence on international
forces in state decisions. It does not, however, exempt him from the tasks associated with
allocating resources and developing the institutions concerned. In the context of globalization,
the state's important role is primarily associated with adjusting market issues and ensuring
social justice. Considering the State-Market relationship as complementing one another, J.
Stiglitz notes: "I always upheld a balanced view of the role of the State, acknowledged the
limitations and failures of the market mechanism, the State, but always assumed that they act
together as partners, and the exact scope of these partnerships are defined differently for
different countries depending on the level of their political and economic development"[15].
5. CHALLENGES AND CONTRADICTIONS OF GLOBALIZATION IN THE
MODERN WORLD
It is quite clear that globalization is an objective mechanism of social development, in its
economic manifestation. The fight against globalization, the desire to curb it, is meaningless.
This does not, however, at all mean that all that happens in the world needs only a good
appraisal. The real globalization processes are inconsistent. Some contradictions are inherent
in the essence of globalization, and some arise because of the complex picture of the modern
world either. We would divide the variety of interpretations of the process of globalization into
two concepts. The first definition is that globalization refers to the process of creating a single
world economy, a single world market for goods, resources and services and, to a certain
degree, labor. An acknowledged international economic relations expert, D. In his famous work
"In Defense of Globalization," Bhagwati writes that globalization "means the integration of
national economies into the global system through foreign trade, foreign direct investment (by
transnational corporations), short-term flows of capital, resource labor, and population
movements, as well as international technology exchange"[16]. Globalization, according to
another definition, is just another term for America's dominant role. The objective process of
globalization is often perceived as synonymous with the artificial planting of the United States
through its "new world order," since it is generated in its present forms by the global expansion
of American capital through transnational corporations and banks with their coverage of most
modern world countries [17]. The US proposed understanding of the new reality is sometimes
referred to as the "ideology of globalism." Globalism is the state's foreign policy, claiming
global influence; now they often speak of globalization concerning the United States [18]. The
creation of international financial organizations following the project proposed by the United
States has led to the management of one of the constituent elements of the world order, namely
financial globalization, by two major institutions: International Monetary Fund (IMF) and the
World Bank [19]. J. On this occasion Stiglitz notes: "Unfortunately, we don't have a world
government responsible for controlling the globalization process for the peoples of all countries.
Instead, we have a system that without a global government can be called global governance,
one in which there is the World Bank, IMF, WTO"[15]. J. Stiglitz concludes his book,
Globalization: Disturbing Trends, with an appeal: "Developed countries need to do their part to
reform the globalization governing international institutions. We have built these structures,
and we have to work to restore them"[15]. Therefore, all of the above indicates that the weak
policies implemented by the IMF and the World Bank on the economies of most developing
countries proved extremely successful for the United States, allowing them to lay the
foundations for new world order. This world order state contains socio-economic threats to
humanity as a whole and requires a radical reform [19].
51st International Scientific Conference on Economic and Social Development – Rabat, 26-27 March 2020
456
Modern world economic transitions mirror a new stage of development associated with a
transition in processes of globalization. The State was the dominant focus of economic
globalization at one time, then a transnational company. Hence another fundamental certainty:
the systemic bifurcation of modern processes of globalization [20], based on the foundations of
a double logic-not just centralization, but also decentralization. The logic of a homogeneously
holistic system matches the principles of industrial globalization, and a post-industrial
civilization corresponds to the logic of a complex heterogeneous system. Homogeneous
integrity takes on the leading role of systemic (integral) quality, and consequently of systemic
unification and hierarchical subordination [21]. Describing the specifics of such a system, K.
Marx pointed out that "its development in the direction of integrity consists precisely in
subordinating to itself all the elements of society or creating from its bodies that are still absent
in it. In this way, the system in the course of historical development turns into integrity." The
specificity of the synergetic economy's heterogeneity lies in the growth of self-sufficiency of
certain global economic system structural units, and the loss on this basis of the systemic quality
of globalization. The global economy is acquiring signs of dissipativity on those premises-
systemic dispersions. The importance of not only globalization's functional nucleus but the
whole system of functional institutions as a whole is devalued. Synergetic concepts form the
basis for the growth of the global system. The global economy begins to develop according to
the logic of economic convergence, on the principle of heterogeneity of its systemic formations.
The structural specificity of the synergetic economy's heterogeneity lies in the formation of
functional entities that are systemically contradictory. Globalization, resulting from the end of
the Cold War and the collapse of the bipolar system, is creating a new yet stable bipolar system
between developed and developing countries. There is a process of denial by another system of
one contradictory heterogeneous system which is even more contradictory and stable. The
deepening of the' golden' billion and' beggarly' abyss is becoming the world economy's main
problem. The cause of poverty, however, is not only associated with globalization but also with
the distance from modern processes. The center of the mega-economy is made up of developed
countries where transnational capital is based and developing countries are the peripheries. The
center focuses largely on humanity's main intellectual, information, and financial resources,
which affect their production. The peripheral countries are mainly engaged in the mass
production of standard goods, agriculture, and mineral extraction and processing. A community
of developed countries predetermines the world economy's structure and pace of development,
and also serves as a natural "heart" concerning the developing economies that make up the
periphery of the global economy. The global risk profile is calculated in such circumstances
primarily by the interaction of a community of developed and developing countries. The
increasing complexity of economic-system relationships has a major impact on the global
economy's risk profile. On the one hand, the increased diversification of trade and investment
ties leads to a fall in systemic risk levels. On the other hand, the spread of the global economy's
crisis signal can take a longer, more complex path and cause no less damage. There are more
systemically significant players and, therefore, the potential for mutual risk multiplication has
increased, and the geography of their contagious distribution has expanded [ 22]. The dynamism
of the global economic development processes does not allow us to talk about the steadiness of
the hierarchy of leadership. At the end of the twentieth century, it was possible to speak about
the unconditional dominance of the world economy's three main centers-the the USA, the
European Union, and Japan. A relative share of global GDP was about three-quarters. However,
their position was reduced to a second at the beginning of the XXI, making room for one new
global economic leader-China. In the global economic system, leadership is automatically
translated into additional gains for the state in terms of economic development. This is a "rent
of scale," that is to say, additional revenue gained by the nation (its residents) by recognizing
the opportunities associated with its place among the world's largest economies.

51st International Scientific Conference on Economic and Social Development – Rabat, 26-27 March 2020
457
However, "scale rent" as a share of potential gain can be useful when combining the advantages
of scale with certain qualitative characteristics and the country becomes a leader not only in
quantitative but also in qualitative indicators of the level of economic, financial and social
development. Such again is called "leadership rent." As you know, most of the "leadership rent"
is extracted from the United States, the largest economy in the world in the last decades. One
of the foundations of US economic power is the ability to issue the world's dominant reserve
currency. The European economy, Japan and China's gains are much lower for different
reasons. In Europe, this is weak economic growth, the high debt burden of several states and
structural problems, the current monetary and financial constraints and the ongoing profound
transformation of the economic system in Japan-the stagnation-deflation trap and demographic
decline, in China. By raising the chances of catching up on growth, the distance between the
leading countries and the big group of countries can be minimized. In this scenario, the main
task is to optimize the positive aspects of integration into the global economy and to neutralize
its negatives. China's experience confirms that implementing financial policies that take into
account the factor of globalization has a positive effect on economic development. Within
emerging market economies, China has become the largest recipient of foreign investment. An
important, but still secondary, condition for economic growth was the growth of merchandise
exports and the inflow of capital from outside. The secret of the "Chinese miracle" is the stable
domestic market expansion due to a systematic increase in the population's standard of living
[23]. In the light of further globalization of world space, the issue of regulation should go to a
greater extent to the macro level, because it is impossible to eliminate a certain subjectivity and
prejudice at the national level [24]. The world market, world economic ties, and organizations
are not just a continuation, their number, of national economic structures.
6. CONCLUSION
Globalization opens up many opportunities but carries serious risks as well. Today, the nature
of globalization is creating an increasingly unstable global environment; the gap between the
global economy's center and periphery is widening. The further evolution of globalization,
based on the common interests of the world community and taking into account all countries
and peoples, should be linked with a democratic and controlled existence. With this option,
concerted efforts can be made to quickly overcome the underdevelopment of the world's
countries, centers of poverty and poverty. This requires an increase in the international financial
organizations ' responsibility to regulate the process of globalization and to observe some of its
facets for the benefit of the integrity of global peace.
LITERATURE:
1. Global Studies: Encyclopedia. M., "Raduga", 2003, p. 181
2. K.Gadzhiev On the inversion of the vector and globalization functions. World Economy
and International Relations, 2015, No. 7, p. 16
3. Castells M. The Information Age. Economics, societies, culture, M., 2000.
4. Fukuyama F. At the “End of History” Still Stands Democracy // Wall Street Journal-2014,
6 June
5. Henry Kissinger on the Assembly of a New World Order. The Wall Street Journal,
29.08.2014
6. V. Obolensky. Globalization of regionalism: challenges and risks for Russia. World
Economy and International Relations, 2015, No. 9, p. 5
7. A. Arkhipov, A. Yelets. Multipolarity of the global economy. Russian Economic Journal,
No. 3, 2014, p. 44
8. Z. Brzezinski. Strategic look. America and the global crisis, M., Astrel, 2012, p. 41
51st International Scientific Conference on Economic and Social Development – Rabat, 26-27 March 2020
458
9. Bauman Z. Glokalizacja czyli komu globalizacja, a komu lokalizacja. Studia sucjologiezne,
1997, no 3 (146), pp 54-68.
10. I. Faminsky. Economic globalization: the basis, components, contradictions, challenges for
Russia. Russian Economic Journal, No. 10, 2000, p. 51
11. A. Golubev. Economics as an organism. Economic Issues, No. 2, 2011, p. 141
12. Y. Shishkov. Is globalization an enemy or an ally of developing countries? World Economy
and International Relations, No. 4, 2003, p. 5
13. Ulrich Beck. The transformation of politics and the state in the era of globalization. Free
thought. No. 7, 2004, p. 3
14. A. Dynkin. The global system at the turn: the path to a new normality. No. 8, 2016, p. 7
15. Joseph E. Stiglitz. Globalization and its discontents. Translation from English, and note
from G. G. Pirogova, M., Thought, 2003, pp. 255, 41, 290
16. Bhagwati D. In Defense of Globalization. Ed. V.L. Inozemtseva. M., Ladomir, 2005, p. 6
17. Trofimenko G.A. On the globalization of international relations. USA - Canada:
Economics, Politics, Culture, No. 6, 2003, p. 75
18. Pyatakov A.N. The Latin American side of global alter globalization. Free Thought, No. 7,
2007, p. 57
19. O.N.Baburina. Financial institutions for managing the new world order or J. Stiglitz’s
arguments “Globalization: disturbing trends”. Finance and Credit, No. 23, 2008, p. 64.70
20. A. Galchinsky. The methodology of complex systems. Ukrainian Economy, No. 8, 2007,
pp. 4-18
21. Marx K., Engels F. Op. 2nd ed. T46, p. 229
22. O. Buklemishev, Yu, Danilov. Economic Leadership and Leadership Rent. World Economy
and International Relations, No. 10, 2015, p. 7
23. S. Menshikov. The global economy as the most important phenomenon of our time.
Economic issues. No. 1, 2004, p. 149
24. D.Ansimov Issues of global regulation. Finance and Credit, No. 7, 2009, p. 80
25. Bogomolov O.T. Anatomy of the global economy. M., Academic Book, 2003, pp. 7-8
51st International Scientific Conference on Economic and Social Development – Rabat, 26-27 March 2020
459
SOCIAL MEDIA COMMUNICATION STRATEGY FOR HEALTH AND
WELLBEING PROVIDERS – MAJOR ELEMENTS THAT KEEP
CONSUMERS ENGAGED
Orindaru Andreea
The Bucharest University of Economic Studies, Romania
Caescu Stefan-Claudiu
The Bucharest University of Economic Studies, Romania
ABSTRACT
As a widespread communication tool, social media has expanded its impact in amazing ways
breaking the frontiers of entertainment towards making a real impact on all types of consumers
in a various range of topics. On the other hand, there is an increasing interest of people
worldwide to care for their health starting from choices in terms of food, physical activity’s
importance in overall wellbeing, towards spiritual choices that determine in the end the quality
of all aspects of people’s lives and ending up with health care providers and how to make wise
choices when choosing such a service. Given this context, evaluating how different actors in
the wellbeing industry use social media communication to communicate unilateral or engage
in two-ways conversations with their consumers can unravel winning social media
communication strategies that lead to a consumers’ increased engagement. In order to discover
the elements of such a social media communication, a research based on content analysis was
developed and its findings are presented in the current study. The results show that emotional
communication and language adaption to consumers’ interests and needs are crucial for
achieving a greater impact. These findings build on the idea that staying permanently in contact
with the consumer generates higher results in any social media communication in the long run.
Keywords: health communication, marketing, social media, strategy, wellbeing
1. INTRODUCTION
As it appears, the only constant of human life on this planet is change, and in the last years,
everything changes faster than ever before. In this setting, the way people communicate has
seen an enormous shift of paradigm, moving towards freedom and power to influence people
wherever you are, whoever you are. On the other side, there is a growing interest in discovering
and implementing a healthstyle with everything that such a lifestyle includes: food, exercise,
mental health and peace of the soul. Given this framework, there is a growing interest and
expansion for the wellbeing industry, and the first choice in terms of information source on this
subject seems to be the internet and, especially, social media networks. For this reason,
discovering the best strategy to communicate on such platforms is of major importance for any
wellbeing provider aiming at developing a strong image and further develop an even stronger
marketing strategy.
2. LITERATURE REVIEW
Social media has become an integrated part of our day-to-day life, and more and more often it
becomes the first choice in terms of gathering information on any subject that might interest us.
When referring to social media coverage, such platforms are used by one-in-three people in the
world, and more than two-thirds of all internet users (Ortiz-Ospina, 2019). When defining social
media, Ventola (2014) refered to it being Internet-based tools that allow individuals and
communities to gather and communicate; to share information, ideas, personal messages,
51st International Scientific Conference on Economic and Social Development – Rabat, 26-27 March 2020
460
images, and other content; and, in some cases, to collaborate with other users in real time. In
this particular context, social media represent a new and challenging environment that
companies need to adapt to when it comes to communicating with consumers, considering their
availability and prevalence (Constantinescu, et al., 2019). This perspective is also confirmed by
Hanna, et al. (2011) who argued that despite the debates in the recent years, this new social
media landscape of communication has also led a new approach in doing business and a new
set of business models, which challenge traditional business operations and processes. When
referring to health-related communication, since health care is such an intimidating service,
Hackworth and Kunz (2010) argue that it is more important for marketer to establish
relationships with their customers, not just marketing services to individuals. In order to build
such relations, a two-way symmetrical communication is typically privileged as the ideal model
of public relations (Hether, 2014). When evaluating the market reality, Shan, et al. (2015) shows
that the process of communicating health-related food-messages to the public has traditionally
been depicted as a 1-way, top-down flow of information in which public authorities and experts
seek to convey objective scientific information to the lay public. But inherent in dialogic
communication is the need for organizations to let go of their expectation of control - which
can be risky, especially for conservative organizations (Hether, 2014), an expectation that has
led many organizations to use social media so far as a 1-way communication tool, neglecting
to embrace the social and interactive capabilities of these platforms (Shan, et al., 2015). Coming
back to the purpose of building a relationship with the customer, such a relationship is based
on trust and honesty, a base that is now easier to build and maintain thanks to social media
networks and other online communities that are available for use by health care providers
(Hackworth, and Kunz, 2010). Moreover, communication practitioners need to engage with the
public to discover their level of knowledge, attitudes, behavior patterns, and information needs
(Shan, et al., 2015). In this context, a pressing issue for public health institutions is to determine
how to strategically get health information across to its target audience (Bannor, et al., 2017).
And social media can prove of great usefulness, taking into account its advantages as Burnett
Heldman et al. (2013) classify them:
• Social media can work best when integrated with traditional public health communication
channels;
• Through social media, we can target and reach diverse audiences;
• Social media allow us to share public health information in new spaces;
• We can listen and collect feedback in real-time;
• Social media permit us to increase direct engagement.
Taking into account these advantages, as social media offer increased opportunities regarding
interactivity compared with more traditional communication channels, they have the potential
to transform the public from passive information recipients to more active and interactive
players in the process of food-related education and intervention (Shan, et al., 2015). This way,
social media platforms provide an important opportunity for physicians to distribute evidence-
based information to counter inaccurate material on the Internet (Ventola, 2014). Despite the
potential of social media to influence public health and generate insights, monitoring and
analyzing the way health-realted messages get across on social media was evaluated as difficult
(Huber, et al., 2020). Such an analisys is needed especially given the big amount of
misinformation promoted on unverified sources as social media platforms. Wang et al. (2019)
show that misinformation, generated intentionally or unintentionally, spreads rapidly. A leading
cause for this effect might relate to the fact that the health communication environment is not
static and has therefore changed significantly over time (Bannor, et al., 2017). First of all, the
communication channels available for the communicators has expanded in reach and range,
including social networking platforms, blogs, microblogs, wikis, media-sharing sites, and
51st International Scientific Conference on Economic and Social Development – Rabat, 26-27 March 2020
461
virtual reality and gaming environments (Ventola, 2014). Second of all, consumer demands
have faced an increase and expansion searching for more and better quality health information,
as well as an increased sophistication of marketing and sales techniques, including the internet
have emerged (Bannor, et al., 2017). In this given context, an increased risk of misinformation
or untrustworthy sources is gaining more and more attention (Wang, et al., 2019). Regardless
of the risks involved in social media communication, wellbeing providers can take advantage
of its entire set of positive outcomes that relate to users’ enabling of achievieng higher
communication results. So, social media platforms’ communication can lead to better results if
they are used for (Burnett Heldman, et al., 2013):
• Listening to social media conversations;
• Engaging with influencers and their conversations;
• Responding to questions or comments received via social media channels;
• Creating opportunities for users to engage with your organization, and for your users to
engage with each other;
• Welcoming and solicit user-generated content;
• Creating opportunities to integrate online and offline engagement;
• Leveraging social media for community engagement.
Even though there is an increasing conversation on how social media is used by health care
providers, there is very little conversation on other types of wellbeing providers that constitute
a growing market and an increasingly reliable source of information for people worldwide. In
this respect, the current paper addresses also wellbeing providers that promote a nutritious
lifestyle, exercising or spiritual and personal growth as major pillars for human health and
growth. In order to address this gap in the literature, the current paper aims to analyze all four
types of wellbeing providers on the market with the research described in the following section.
3. RESEARCH – METHODOLOGY AND RESULTS
Since social media is here to stay and communication on such platforms are growing in terms
of expansion and impact, discovering winning strategies of social media communication for
wellbeing providers can bring impressive outcomes in terms of population’s general health and
wellbeing. With this aim in mind, the current research was developed as one way of analyzing
the communication approach of wellbeing providers from four different areas: nutrition,
physical exercise, spiritual growth and healthcare.
3.1. Research methodology
In order to discover the most common strategy used in social media communication by the
providers of health and wellbeing, a content analysis was developed. For this, for each of those
four categories of wellbeing providers, 3 major actors on the global market with a consistent
presence on social media were identified, as they follow: Skinny Taste, Everyday Health, Fit
Bottomed Girls, My Fitness Pal, Noom, Fitness Blender, Tony Robbins, Grant Cardone,
Deepak Chopra, Apollo Hospitals, Cleveland Clinic, Mayo Clinic. Then, for each of those
actors, the last few longer text-posts were taken out of their Facebook page and were included
in the analysis document. The choice for relating only to Facebook for this research is motivated
by the fact that Facebook accounts for over 45% of monthly social media visits (Omnicore,
2020), making it the most popular social media platform in the present. After gathering all the
content needed to perform pe content analysis, the software AntConc (developed by Laurence
Anthony, it is a corpus analysis toolkit for concordance and text analysis) was used and the
major findings are included in the next section.

51st International Scientific Conference on Economic and Social Development – Rabat, 26-27 March 2020
462
3.2. Main findings and discussion
Based on the corpus built out of social media messages launched by providers from the four
areas of interest (promoters of a healthy nutrition plans, exercise promoters, spiritual and
personal growth specialists and health care providers), the third most common word was ‘you’
(and the ninth most common was ‘your’), proving that a direct approach of the customer of
potential customer is the most preferred strategy of any wellbeing provider. When reviewing
the most common cluster in the analyzed corpus, a confirmation arises of the wellbeing
providers focus on a direct approach of the customer, empowering them to take control over
their destiny (as seen in Figure 1).
Figure 1: Most common clusters including the word ‘you’
Source: Corpus analysis using AntConc
Then, as it was expected, the word ‘healthy’ is among the most frequently used words, except
for linking words or prepositions. One interesting enough finding is that, based on the most
common words (‘do’, ‘know’, ‘get’, ‘make’), we can conclude that all of those wellbeing
providers focus on action and they actually encourage to action. In addition to that, all wellbeing
providers seem to focus on positive words like ‘good’, ‘best’ or ‘great’, maybe as a result of the
motivational side of their Facebook pages. This perspective is also confirmed by the extensive
use of words like ‘passion’, ‘inspire’ or ‘fulfilled’. When looking in the depths of the use of the
word ‘good’ (as seen in Figure 2), an appetite for motivation seems to be present in any
communication of wellbeing providers, leaning most probably on the idea that people lack only
the motivation to get into action based on the knowledge they already have.
Figure following on the next page

51st International Scientific Conference on Economic and Social Development – Rabat, 26-27 March 2020
463
Figure 2: Collocations using the word ‘good’
Source: Corpus analysis using AntConc
But it might seem that wellbeing providers might also slip into believing and arguing that they
do have the best option, an observation based on the collocations in which the word ‘best’ is
used (as seen in Figure 3).
Figure 3: Collocations using the word ‘best’
Source: Corpus analysis using AntConc
Based on further observation of each of those Facebook pages, a few extra points can be made
including the fact that:
• Most of the wellbeing providers us Facebook as a platform to promote any other platform
they use: their own website, or their own Youtube channel;
• Most wellbeing providers focus on also self-promotion, and this is particularly visible in
the case of spiritual and personal growth providers that use extensive and almost aggressive
promotion on their Facebook page (focusing more on promoting their own live events or
books, than on delivering free value);
• Short and impactful messages or titles used together with videos or high-quality photos
seem to be the favorite way of expression on Facebook for wellbeing providers;
• Detailed explanations in simple language seem to also be the approach of most wellbeing
providers for both their Facebook page and other communication platforms they might use;
• The posts frequency tends to be high or very high for each example studied, as an average
of 5-6 posts a day is common on the pages included in this research;
• Wellbeing providers (at least those included in the present research) tend to get involved in
two-way communication with their customers through comments on their posts.
51st International Scientific Conference on Economic and Social Development – Rabat, 26-27 March 2020
464
Based on the results of the current research, it can be argued that a move towards focusing on
customer is more and more visible in any wellbeing provider’s communication approach on
Facebook. The care for the customer and the wish to bring a wide range of information can be
found in every channel subject of this research. This is also confirmed by the fact that each
wellbeing provider shares information also from other areas than their main area of expertise,
proving their belief in holistic approach of wellbeing: exercise experts share spiritual advice
also, health-care institutions also share nutrition and exercise advice and spiritual and personal
growth providers also share advice on meals’ preparation.
4. CONCLUSION
The results of the current paper open a conversation about the winning strategies in social media
communication of wellbeing providers. As these results is far from being an comprehensive
research, this research can be deepened building a more extensive corpus for each of those four
categories of wellbeing providers and getting into the depth of how their communication has
evolved in time, together with expanding the range of providers included in the analysis. The
limits of the current research relate to the subjective flavor added when choosing the wellbeing
providers included in the current analysis. Still, developing a clever and impactful
communication strategy on social media platforms can have major benefits for both the
expansion of wellbeing providers, as well as long-term health for the entire population.
ACKNOWLEDGEMENT: This work was cofinanced from the European Social Fund through
Operational Programme Human Capital 2014-2020, project number POCU/380/6/13/125015
‘Development of entrepreneurial skills for doctoral students and postdoctoral researchers in
the field of economic sciences’.
LITERATURE:
1. Bannor, R., Asare A. K., Bawole, J. N. (2017). Effectiveness of social media for
communicating health messages in Ghana. Health Education, 117(4), pp. 342-371.
2. Burnett Heldman, A., Schindelar, J., Weaver III, J. B. (2013). Social media engagement
and public health communication: implications for public health organizations being truly
‘social’. Public Health Review, 35(1), 13.
3. Constantinescu, M., Orindaru, A., Pachitanu, A., Rosca, L., Caescu, S. C, Orzan, M. C.
(2019). Attitude evaluation on using the neuromarketing approach in social media:
matching company’s purposes and consumer’s benefits for sustainable business growth.
Sustainability, 11, 7094.
4. Hackworth, B. A., Kunz, M. B. (2010). Tweet yourself to better health: how social media
is changing communication in the health care industry. Arden: Allied Academies
International Conference. Academy of Health Care Management. Proceedings, 7(1), 12.
5. Hanna, R., Rohm, A., Crittenden, V.L. (2011). We’re all connected: The power of the social
media ecosystem. Business Horizons, 54, pp. 265–273.
6. Hether, H. J. (2014). Dialogic communication in the health care context: a case study of
Kaiser Permanente’s social media practices. Public Relations Review, 40, pp. 856-858.
7. Huber, J., Woods, T., Fushi, A., Duong, M. T., Eidelman, A. S., zalal, A. R., Urquhart, O.,
Colangelo, E., Quinn, S., Carraso-Labra, A. (2020). Social media research strategy to
understand clinician and public perception of health care messages. JDR Clinical and
Translational Research, 5(1), pp. 71-81.
8. Omnicore. (2020). Facebook by the Numbers: Stats, Demographics & Fun Facts. Available
online at: https://www.omnicoreagency.com/facebook-statistics/ [Accessed on 20th of
February 2020].

51st International Scientific Conference on Economic and Social Development – Rabat, 26-27 March 2020
465
9. Ortiz-Ospina, E. (2019). The rise of social media. Available online at:
https://ourworldindata.org/rise-of-social-media [Accessed on 20th of February 2020].
10. Shan, L. C., Panagiotopoulos, P., Regan, A., De Brun, A., Barnett, J., Wall, P., McConnon,
A. (2015). Interactive Communication with the public: qualitative exploration of the use of
social media by food and health organizations. Journal of Nutrition and Behavior, 47(1),
pp. 104-108.
11. Ventola, C. L. (2014). Social media and health care professionals: benefits, risks, and best
practices. Pharmacy & Therapeutics, 39(7), pp. 491-520.
12. Wang, Y., McKee, M., Torbica, A., Stuckler, D. (2019). Systematic literature review on the
spread of health-related misinformation on social media. Social Science & Medicine, 240,
112552.

51st International Scientific Conference on Economic and Social Development – Rabat, 26-27 March 2020
466
CRISIS MANAGEMENT IN TOURISM – LITERATURE REVIEW
Dora Smolcic Jurdana
Faculty of Tourism and Hospitality Management, University of Rijeka, Croatia
Daniela Soldic Frleta
Faculty of Tourism and Hospitality Management, University of Rijeka, Croatia
Romina Agbaba
Faculty of Tourism and Hospitality Management, University of Rijeka, Croatia
ABSTRACT
Tourism is particularly sensitive to external shocks, which are very often unpredictable and
therefore need to be addressed through effective crisis management processes. In that context,
it is of a great importance to raise awareness among the stakeholders and destination
management as well as to gain knowledge regarding different approaches, models and
strategies that could be used in times of crises. These can be learned from the previous
researches and past practices. This paper provides a literature-based theoretical basis
concerning the crisis management and its application within tourism. Moreover, by reviewing
the literature relating to crisis management, the paper identifies the models that have been
developed in tourism context. Therefore, this paper presents the results of the literature review
whereby scientific papers dealing with crisis management strategies, with an emphasis on those
used in tourism context, were analysed and discussed. Only scientific papers published in
journals indexed in the Web of Science and Scopus in the last decade were included in the
analysis. The review of past research provide an outline of the practical suggestions based on
tourism crisis management past practices and policies. The review findings confirm the
necessity of encouraging tourism destination managers to actively engage in preparing for
eventual crisis situations and developing appropriate management strategies.
Keywords: Crisis management, Literature review, Tourism
1. INTRODUCTION
This paper examines the literature focused on crises and crisis management in tourist
destinations with the aim of gaining better understanding the causes and the circumstances of
different disruptive events, as well as the competencies needed to address them. Given the fact
that literature on crisis management in tourism context is insufficiently explored area, one of
the aims of this study is to get destination managers familiar with for the complexities that
emerge before, during and after crises and disasters. Global tourism industry has been exposed
to different types and ranges of crisis including terrorism (i.e. September 11, 2001 airline-
hijacking, Bombings in Bali in 2002 and 2005, Tunisian beach resort and Paris terrorist attacks
2015…), disease pandemics (i.e. SARS, Avian influenza…), civil unrests (i.e. Israel, Greece,
Turkey, Egypt…), natural disaster (i.e. earthquakes, tsunamis, hurricanes, volcanic eruptions)
as well as a global financial and economic downturn (2008-2010) (Gurtner, 2016). Given the
caused instability and uncertainty when tourism is concerned, each crisis impacts were most
significant at the local or tourism destination level. Since the beginning of mass tourism in the
1960s, such events have an effect on the decision regarding travel, as well as on the destination
choice (Abd El-Jalil, 2013). Crisis can be seen as a turning point that create both, loss and
opportunity.
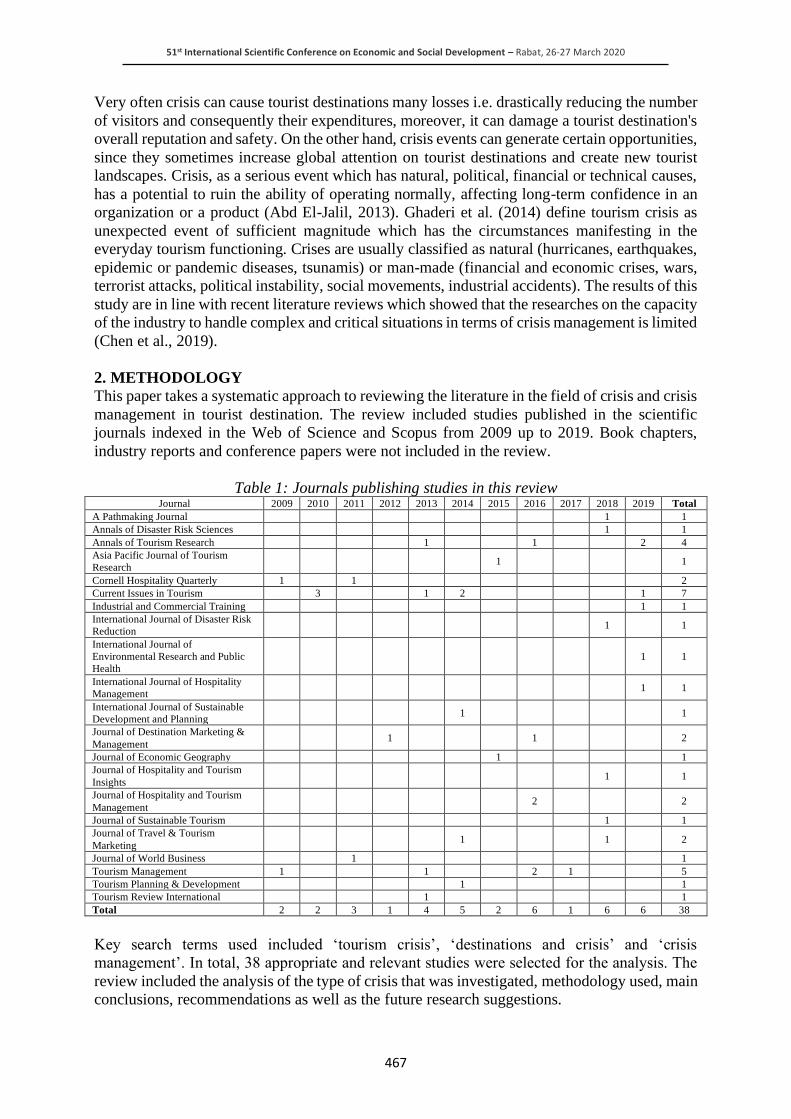
51st International Scientific Conference on Economic and Social Development – Rabat, 26-27 March 2020
467
Very often crisis can cause tourist destinations many losses i.e. drastically reducing the number
of visitors and consequently their expenditures, moreover, it can damage a tourist destination's
overall reputation and safety. On the other hand, crisis events can generate certain opportunities,
since they sometimes increase global attention on tourist destinations and create new tourist
landscapes. Crisis, as a serious event which has natural, political, financial or technical causes,
has a potential to ruin the ability of operating normally, affecting long-term confidence in an
organization or a product (Abd El-Jalil, 2013). Ghaderi et al. (2014) define tourism crisis as
unexpected event of sufficient magnitude which has the circumstances manifesting in the
everyday tourism functioning. Crises are usually classified as natural (hurricanes, earthquakes,
epidemic or pandemic diseases, tsunamis) or man-made (financial and economic crises, wars,
terrorist attacks, political instability, social movements, industrial accidents). The results of this
study are in line with recent literature reviews which showed that the researches on the capacity
of the industry to handle complex and critical situations in terms of crisis management is limited
(Chen et al., 2019).
2. METHODOLOGY
This paper takes a systematic approach to reviewing the literature in the field of crisis and crisis
management in tourist destination. The review included studies published in the scientific
journals indexed in the Web of Science and Scopus from 2009 up to 2019. Book chapters,
industry reports and conference papers were not included in the review.
Table 1: Journals publishing studies in this review Journal 2009 2010 2011 2012 2013 2014 2015 2016 2017 2018 2019 Total
A Pathmaking Journal 1 1
Annals of Disaster Risk Sciences 1 1
Annals of Tourism Research 1 1 2 4
Asia Pacific Journal of Tourism
Research 1 1
Cornell Hospitality Quarterly 1 1 2
Current Issues in Tourism 3 1 2 1 7
Industrial and Commercial Training 1 1
International Journal of Disaster Risk
Reduction 1 1
International Journal of
Environmental Research and Public
Health
1 1
International Journal of Hospitality
Management 1 1
International Journal of Sustainable
Development and Planning 1 1
Journal of Destination Marketing &
Management 1 1 2
Journal of Economic Geography 1 1
Journal of Hospitality and Tourism
Insights 1 1
Journal of Hospitality and Tourism
Management 2 2
Journal of Sustainable Tourism 1 1
Journal of Travel & Tourism
Marketing 1 1 2
Journal of World Business 1 1
Tourism Management 1 1 2 1 5
Tourism Planning & Development 1 1
Tourism Review International 1 1
Total 2 2 3 1 4 5 2 6 1 6 6 38
Key search terms used included ‘tourism crisis’, ‘destinations and crisis’ and ‘crisis
management’. In total, 38 appropriate and relevant studies were selected for the analysis. The
review included the analysis of the type of crisis that was investigated, methodology used, main
conclusions, recommendations as well as the future research suggestions.
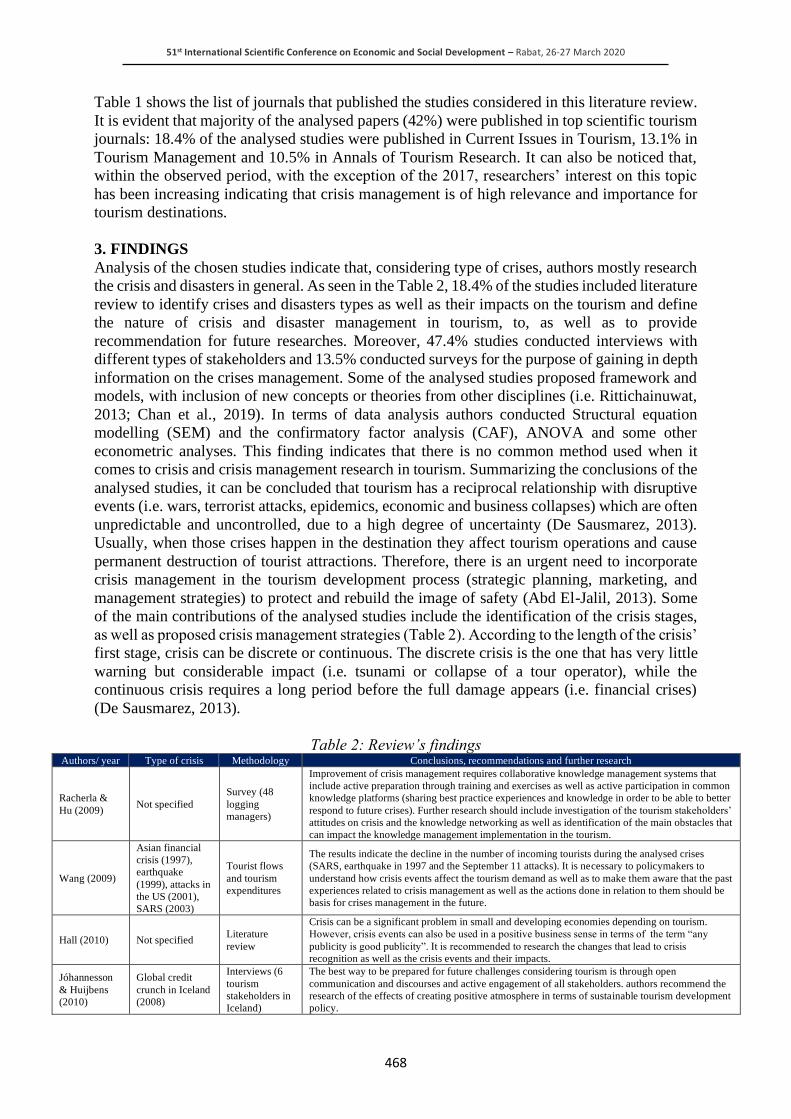
51st International Scientific Conference on Economic and Social Development – Rabat, 26-27 March 2020
468
Table 1 shows the list of journals that published the studies considered in this literature review.
It is evident that majority of the analysed papers (42%) were published in top scientific tourism
journals: 18.4% of the analysed studies were published in Current Issues in Tourism, 13.1% in
Tourism Management and 10.5% in Annals of Tourism Research. It can also be noticed that,
within the observed period, with the exception of the 2017, researchers’ interest on this topic
has been increasing indicating that crisis management is of high relevance and importance for
tourism destinations.
3. FINDINGS
Analysis of the chosen studies indicate that, considering type of crises, authors mostly research
the crisis and disasters in general. As seen in the Table 2, 18.4% of the studies included literature
review to identify crises and disasters types as well as their impacts on the tourism and define
the nature of crisis and disaster management in tourism, to, as well as to provide
recommendation for future researches. Moreover, 47.4% studies conducted interviews with
different types of stakeholders and 13.5% conducted surveys for the purpose of gaining in depth
information on the crises management. Some of the analysed studies proposed framework and
models, with inclusion of new concepts or theories from other disciplines (i.e. Rittichainuwat,
2013; Chan et al., 2019). In terms of data analysis authors conducted Structural equation
modelling (SEM) and the confirmatory factor analysis (CAF), ANOVA and some other
econometric analyses. This finding indicates that there is no common method used when it
comes to crisis and crisis management research in tourism. Summarizing the conclusions of the
analysed studies, it can be concluded that tourism has a reciprocal relationship with disruptive
events (i.e. wars, terrorist attacks, epidemics, economic and business collapses) which are often
unpredictable and uncontrolled, due to a high degree of uncertainty (De Sausmarez, 2013).
Usually, when those crises happen in the destination they affect tourism operations and cause
permanent destruction of tourist attractions. Therefore, there is an urgent need to incorporate
crisis management in the tourism development process (strategic planning, marketing, and
management strategies) to protect and rebuild the image of safety (Abd El-Jalil, 2013). Some
of the main contributions of the analysed studies include the identification of the crisis stages,
as well as proposed crisis management strategies (Table 2). According to the length of the crisis’
first stage, crisis can be discrete or continuous. The discrete crisis is the one that has very little
warning but considerable impact (i.e. tsunami or collapse of a tour operator), while the
continuous crisis requires a long period before the full damage appears (i.e. financial crises)
(De Sausmarez, 2013).
Table 2: Review’s findings Authors/ year Type of crisis Methodology Conclusions, recommendations and further research
Racherla &
Hu (2009) Not specified
Survey (48
logging
managers)
Improvement of crisis management requires collaborative knowledge management systems that
include active preparation through training and exercises as well as active participation in common
knowledge platforms (sharing best practice experiences and knowledge in order to be able to better
respond to future crises). Further research should include investigation of the tourism stakeholders’
attitudes on crisis and the knowledge networking as well as identification of the main obstacles that
can impact the knowledge management implementation in the tourism.
Wang (2009)
Asian financial
crisis (1997),
earthquake
(1999), attacks in
the US (2001),
SARS (2003)
Tourist flows
and tourism
expenditures
The results indicate the decline in the number of incoming tourists during the analysed crises
(SARS, earthquake in 1997 and the September 11 attacks). It is necessary to policymakers to
understand how crisis events affect the tourism demand as well as to make them aware that the past
experiences related to crisis management as well as the actions done in relation to them should be
basis for crises management in the future.
Hall (2010) Not specified Literature
review
Crisis can be a significant problem in small and developing economies depending on tourism.
However, crisis events can also be used in a positive business sense in terms of the term “any
publicity is good publicity”. It is recommended to research the changes that lead to crisis
recognition as well as the crisis events and their impacts.
Jóhannesson
& Huijbens
(2010)
Global credit
crunch in Iceland
(2008)
Interviews (6
tourism
stakeholders in
Iceland)
The best way to be prepared for future challenges considering tourism is through open
communication and discourses and active engagement of all stakeholders. authors recommend the
research of the effects of creating positive atmosphere in terms of sustainable tourism development
policy.
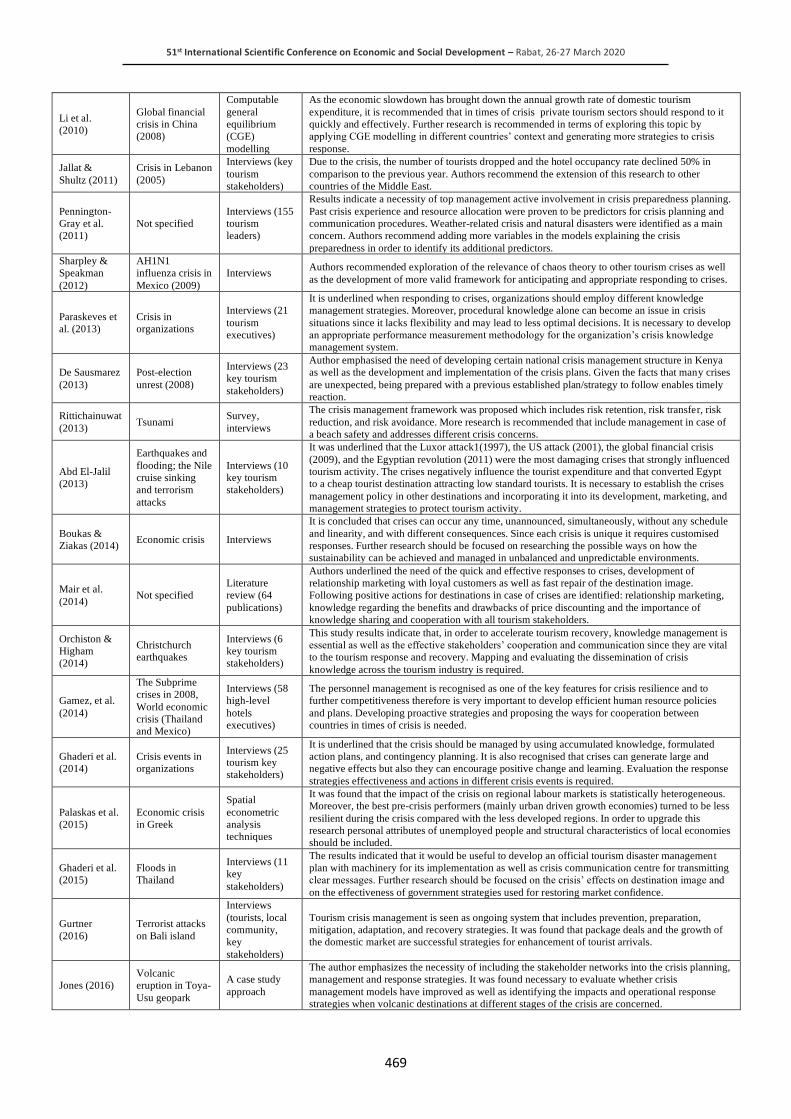
51st International Scientific Conference on Economic and Social Development – Rabat, 26-27 March 2020
469
Li et al.
(2010)
Global financial
crisis in China
(2008)
Computable
general
equilibrium
(CGE)
modelling
As the economic slowdown has brought down the annual growth rate of domestic tourism
expenditure, it is recommended that in times of crisis private tourism sectors should respond to it
quickly and effectively. Further research is recommended in terms of exploring this topic by
applying CGE modelling in different countries’ context and generating more strategies to crisis
response.
Jallat &
Shultz (2011)
Crisis in Lebanon
(2005)
Interviews (key
tourism
stakeholders)
Due to the crisis, the number of tourists dropped and the hotel occupancy rate declined 50% in
comparison to the previous year. Authors recommend the extension of this research to other
countries of the Middle East.
Pennington-
Gray et al.
(2011)
Not specified
Interviews (155
tourism
leaders)
Results indicate a necessity of top management active involvement in crisis preparedness planning.
Past crisis experience and resource allocation were proven to be predictors for crisis planning and
communication procedures. Weather-related crisis and natural disasters were identified as a main
concern. Authors recommend adding more variables in the models explaining the crisis
preparedness in order to identify its additional predictors.
Sharpley &
Speakman
(2012)
AH1N1
influenza crisis in
Mexico (2009)
Interviews Authors recommended exploration of the relevance of chaos theory to other tourism crises as well
as the development of more valid framework for anticipating and appropriate responding to crises.
Paraskeves et
al. (2013)
Crisis in
organizations
Interviews (21
tourism
executives)
It is underlined when responding to crises, organizations should employ different knowledge
management strategies. Moreover, procedural knowledge alone can become an issue in crisis
situations since it lacks flexibility and may lead to less optimal decisions. It is necessary to develop
an appropriate performance measurement methodology for the organization’s crisis knowledge
management system.
De Sausmarez
(2013)
Post-election
unrest (2008)
Interviews (23
key tourism
stakeholders)
Author emphasised the need of developing certain national crisis management structure in Kenya
as well as the development and implementation of the crisis plans. Given the facts that many crises
are unexpected, being prepared with a previous established plan/strategy to follow enables timely
reaction.
Rittichainuwat
(2013) Tsunami
Survey,
interviews
The crisis management framework was proposed which includes risk retention, risk transfer, risk
reduction, and risk avoidance. More research is recommended that include management in case of
a beach safety and addresses different crisis concerns.
Abd El-Jalil
(2013)
Earthquakes and
flooding; the Nile
cruise sinking
and terrorism
attacks
Interviews (10
key tourism
stakeholders)
It was underlined that the Luxor attack1(1997), the US attack (2001), the global financial crisis
(2009), and the Egyptian revolution (2011) were the most damaging crises that strongly influenced
tourism activity. The crises negatively influence the tourist expenditure and that converted Egypt
to a cheap tourist destination attracting low standard tourists. It is necessary to establish the crises
management policy in other destinations and incorporating it into its development, marketing, and
management strategies to protect tourism activity.
Boukas &
Ziakas (2014) Economic crisis Interviews
It is concluded that crises can occur any time, unannounced, simultaneously, without any schedule
and linearity, and with different consequences. Since each crisis is unique it requires customised
responses. Further research should be focused on researching the possible ways on how the
sustainability can be achieved and managed in unbalanced and unpredictable environments.
Mair et al.
(2014) Not specified
Literature
review (64
publications)
Authors underlined the need of the quick and effective responses to crises, development of
relationship marketing with loyal customers as well as fast repair of the destination image.
Following positive actions for destinations in case of crises are identified: relationship marketing,
knowledge regarding the benefits and drawbacks of price discounting and the importance of
knowledge sharing and cooperation with all tourism stakeholders.
Orchiston &
Higham
(2014)
Christchurch
earthquakes
Interviews (6
key tourism
stakeholders)
This study results indicate that, in order to accelerate tourism recovery, knowledge management is
essential as well as the effective stakeholders’ cooperation and communication since they are vital
to the tourism response and recovery. Mapping and evaluating the dissemination of crisis
knowledge across the tourism industry is required.
Gamez, et al.
(2014)
The Subprime
crises in 2008,
World economic
crisis (Thailand
and Mexico)
Interviews (58
high-level
hotels
executives)
The personnel management is recognised as one of the key features for crisis resilience and to
further competitiveness therefore is very important to develop efficient human resource policies
and plans. Developing proactive strategies and proposing the ways for cooperation between
countries in times of crisis is needed.
Ghaderi et al.
(2014)
Crisis events in
organizations
Interviews (25
tourism key
stakeholders)
It is underlined that the crisis should be managed by using accumulated knowledge, formulated
action plans, and contingency planning. It is also recognised that crises can generate large and
negative effects but also they can encourage positive change and learning. Evaluation the response
strategies effectiveness and actions in different crisis events is required.
Palaskas et al.
(2015)
Economic crisis
in Greek
Spatial
econometric
analysis
techniques
It was found that the impact of the crisis on regional labour markets is statistically heterogeneous.
Moreover, the best pre-crisis performers (mainly urban driven growth economies) turned to be less
resilient during the crisis compared with the less developed regions. In order to upgrade this
research personal attributes of unemployed people and structural characteristics of local economies
should be included.
Ghaderi et al.
(2015)
Floods in
Thailand
Interviews (11
key
stakeholders)
The results indicated that it would be useful to develop an official tourism disaster management
plan with machinery for its implementation as well as crisis communication centre for transmitting
clear messages. Further research should be focused on the crisis’ effects on destination image and
on the effectiveness of government strategies used for restoring market confidence.
Gurtner
(2016)
Terrorist attacks
on Bali island
Interviews
(tourists, local
community,
key
stakeholders)
Tourism crisis management is seen as ongoing system that includes prevention, preparation,
mitigation, adaptation, and recovery strategies. It was found that package deals and the growth of
the domestic market are successful strategies for enhancement of tourist arrivals.
Jones (2016)
Volcanic
eruption in Toya-
Usu geopark
A case study
approach
The author emphasizes the necessity of including the stakeholder networks into the crisis planning,
management and response strategies. It was found necessary to evaluate whether crisis
management models have improved as well as identifying the impacts and operational response
strategies when volcanic destinations at different stages of the crisis are concerned.

51st International Scientific Conference on Economic and Social Development – Rabat, 26-27 March 2020
470
Mikulić et al.
(2016)
Short-term risks
for Croatian
tourism (bad
weather, terrorist
attack, natural
disasters)
A panel of
industry experts
using a Delphi
approach
Authors see the strategic crises management as one of the most important part of sustainable
tourism development management. It is underlined that is vital to develop prevention plans for
crisis situations when there is significant demand drops (i.e. in times of economic downturn). It is
recommended to propose different strategies and action plans aiming to reduce the risk occurrence
likelihood or to minimise the effects in case the risks occur.
Boztug et al.
(2016)
Travel
cancelations
Online survey
(887 Australian
residents);
conjoint
analysis
The study confirms that an effective combination of preventive actions (adjusted to the nature of
crisis) have the possibility of reducing travel cancelations. In that context, some effective
approaches are detected, i.e. upgrading the accommodation and providing information updates and
the provision of security devices or security staff. Authors recommended further exploration of
travel cancelations in the context of the business trips.
Choi et al.
(2016) Migration
An online
survey; SEM;
CFA
In order to change eventual negative tourists' perception of a destination, destination management
can employ mass media to disseminate information about actions carried in order to make tourists
feel safer. Replication of this research to understand differences in perceived security forces effects
by long stay visitors and permanent residents is recommended.
Krieger et al.
(2016)
Norovirus
outbreaks on
cruise ships
A between-
subjects
experiment
(169
participants);
an online
survey; a two-
way ANCOVA
Study findings indicate that past experience may influence peoples' perceived safety as well as that
individuals' risk perception is related to their evaluation of the safety and travel decisions.
Replication of the research within different settings, transferring it into a cross-sectional design
and/or incorporating a segmenting approach with analysis of the difference between first-time and
repeated cruise tourists.
Liu & Pratt
(2017) Terrorism
Tourist arrivals
and Global
Tourism Index
(95 countries);
Autoregressive
distributed lag
(ARDL)
Study results reveal that the terrorism influence varies across tourism destinations due to the
different political instability, income levels and tourism intensities. It was found that terrorism does
not have an unfavourable impact on tourism demand in the long run. It is necessary that all tourism
stakeholders collaborate in operationalizing their risk and crisis management plans. Future studies
should include a longer time series and a regional terrorism index covering the spill-over effects.
Khazai et al.
(2018)
The Bohol
earthquake;
tropical cyclone
Haiyan in the
Philippines
(2013)
Interviews (40
key tourism
stakeholders)
Authors underlining that the restoring the destination image and reputation is the key element of
managing tourism destinations recovery after the crisis. Media reports (that sometimes can be
inaccurate) can have a great influence on tourists’ perceptions of destinations that are affected by
certain crisis and present a challenge to the destination marketability and sometimes they can result
in a collateral marketing crisis in neighbouring destinations.
Barbe &
Pennington-
Gray (2018)
Alligator
snatching
(Disney
property), the
mass shooting at
Pulse night club,
Zikavirus
concerns
ANOVA
Authors found that in their crisis communication most hotels are not using Twitter. Additionally, it
was found that given that certain organizations are not responsible for the incidents they may see
that communication is not necessary, or that it will cause an increase in risk perceptions. Further
research should take into consideration a broader timeframe or sites to provide more data, as well
as the crisis communication on multiple platforms.
Kelemen et al.
(2018)
Great East Japan
Earthquake and
Tsunami (2011)
Interviews (22
stakeholders)
Authors indicate that destinations that have experienced crisis or disasters can be experienced in
different ways, however, qualitative interaction between all stakeholders is essential in order to
ensure positive post-disaster visitors’ experiences. Exploring the community resilience in post-
disaster destinations is recommended.
Çakar (2018)
Forest fire
(2008), refugee
crisis (2010),
diplomatic crisis
with Russia
(2015) and the
Netherlands
(2017), a tour bus
accident (2017)
Interviews;
content analysis
Author identifies the stages regarding the tourist destination marketing and management after a
crisis as well as the consolidation crisis management and the implementation of a recovery
program after the crisis is over. Author underlines the need of strategy development to enhance
post-crisis recovery and to minimize or remove the damaging crisis impacts, which could
negatively impact tourists arrivals.
Vargas-
Sanchez
(2018)
Not specified Literature
review
Authors pointed that tourists are more vulnerable than residents, given that tourists are less familiar
with the area and experience the language barrier. Authors found that in a case of tourists
becoming victims of a disaster, in addition of the risk caused by overcrowding, the negative impact
on the destination image multiplies.
Čendo
Metzinger
&Janeš (2018)
Not specified Literature
review
It is concluded that different crisis types require specific ways of communication as well as
different communication strategies. In crisis situations it is necessary to adequately manage the
communication process given that those situations require rapid response and high-quality
communication with all target groups before, during and after a crisis.
Aliperti et al.
(2019) Not specified
Literature
review (113
publications)
Literature review confirmed that crises and disasters cause significant loss and damage when it
comes to tourism destinations. Studies suggest the necessity of contious monitoring of the process
leading to crisis and disaster so that appropriate actions can be identified and adopted. More
studies form the different parts of the word, along with addition of other hazards should be
included in the review analysis.
Chan et al.
(2019)
Kumamoto
earthquake in
Japan
Interviews (11
tourism
stakeholders)
Authors are pointing that tourism contributes differently considering the various disaster phases
however, it is mainly significant when it comes to information provisions, communications and
emergency accommodations for tourists. Widening the proposed framework including a different
disaster-prone destinations (i.e. Japan, Taiwan and Southeast Asia).
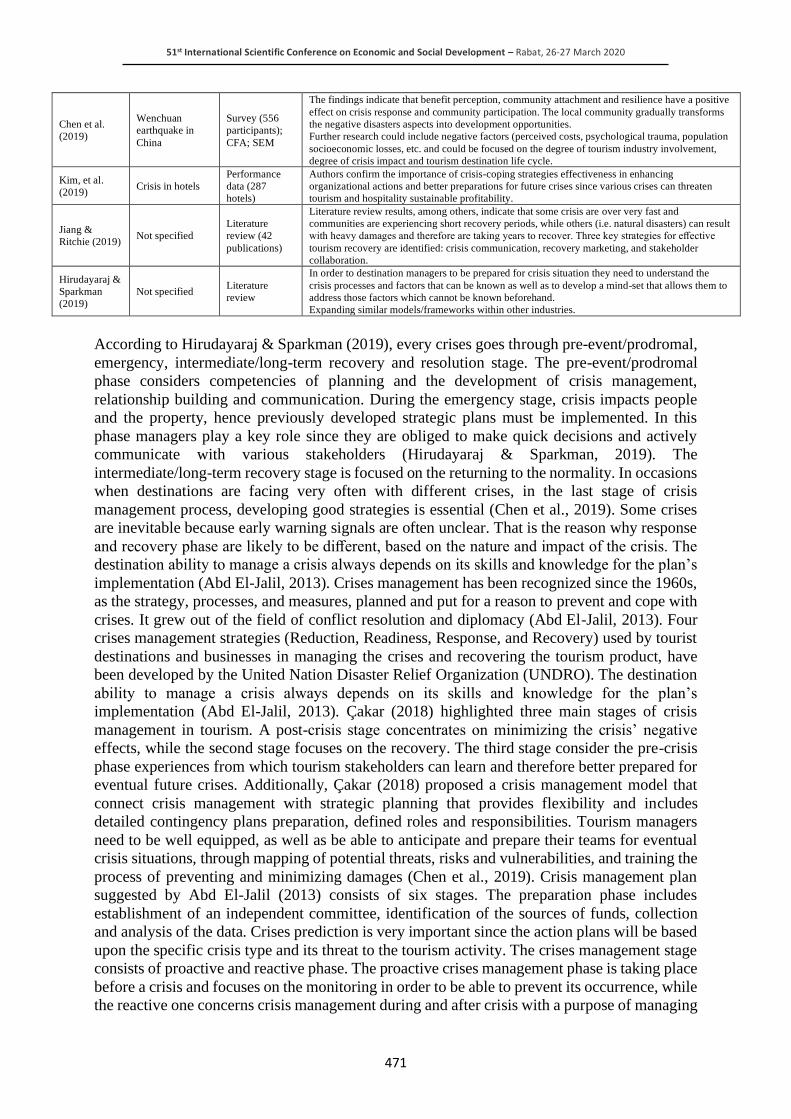
51st International Scientific Conference on Economic and Social Development – Rabat, 26-27 March 2020
471
Chen et al.
(2019)
Wenchuan
earthquake in
China
Survey (556
participants);
CFA; SEM
The findings indicate that benefit perception, community attachment and resilience have a positive
effect on crisis response and community participation. The local community gradually transforms
the negative disasters aspects into development opportunities.
Further research could include negative factors (perceived costs, psychological trauma, population
socioeconomic losses, etc. and could be focused on the degree of tourism industry involvement,
degree of crisis impact and tourism destination life cycle.
Kim, et al.
(2019) Crisis in hotels
Performance
data (287
hotels)
Authors confirm the importance of crisis-coping strategies effectiveness in enhancing
organizational actions and better preparations for future crises since various crises can threaten
tourism and hospitality sustainable profitability.
Jiang &
Ritchie (2019) Not specified
Literature
review (42
publications)
Literature review results, among others, indicate that some crisis are over very fast and
communities are experiencing short recovery periods, while others (i.e. natural disasters) can result
with heavy damages and therefore are taking years to recover. Three key strategies for effective
tourism recovery are identified: crisis communication, recovery marketing, and stakeholder
collaboration.
Hirudayaraj &
Sparkman
(2019)
Not specified Literature
review
In order to destination managers to be prepared for crisis situation they need to understand the
crisis processes and factors that can be known as well as to develop a mind-set that allows them to
address those factors which cannot be known beforehand.
Expanding similar models/frameworks within other industries.
According to Hirudayaraj & Sparkman (2019), every crises goes through pre-event/prodromal,
emergency, intermediate/long-term recovery and resolution stage. The pre-event/prodromal
phase considers competencies of planning and the development of crisis management,
relationship building and communication. During the emergency stage, crisis impacts people
and the property, hence previously developed strategic plans must be implemented. In this
phase managers play a key role since they are obliged to make quick decisions and actively
communicate with various stakeholders (Hirudayaraj & Sparkman, 2019). The
intermediate/long-term recovery stage is focused on the returning to the normality. In occasions
when destinations are facing very often with different crises, in the last stage of crisis
management process, developing good strategies is essential (Chen et al., 2019). Some crises
are inevitable because early warning signals are often unclear. That is the reason why response
and recovery phase are likely to be different, based on the nature and impact of the crisis. The
destination ability to manage a crisis always depends on its skills and knowledge for the plan’s
implementation (Abd El-Jalil, 2013). Crises management has been recognized since the 1960s,
as the strategy, processes, and measures, planned and put for a reason to prevent and cope with
crises. It grew out of the field of conflict resolution and diplomacy (Abd El-Jalil, 2013). Four
crises management strategies (Reduction, Readiness, Response, and Recovery) used by tourist
destinations and businesses in managing the crises and recovering the tourism product, have
been developed by the United Nation Disaster Relief Organization (UNDRO). The destination
ability to manage a crisis always depends on its skills and knowledge for the plan’s
implementation (Abd El-Jalil, 2013). Çakar (2018) highlighted three main stages of crisis
management in tourism. A post-crisis stage concentrates on minimizing the crisis’ negative
effects, while the second stage focuses on the recovery. The third stage consider the pre-crisis
phase experiences from which tourism stakeholders can learn and therefore better prepared for
eventual future crises. Additionally, Çakar (2018) proposed a crisis management model that
connect crisis management with strategic planning that provides flexibility and includes
detailed contingency plans preparation, defined roles and responsibilities. Tourism managers
need to be well equipped, as well as be able to anticipate and prepare their teams for eventual
crisis situations, through mapping of potential threats, risks and vulnerabilities, and training the
process of preventing and minimizing damages (Chen et al., 2019). Crisis management plan
suggested by Abd El-Jalil (2013) consists of six stages. The preparation phase includes
establishment of an independent committee, identification of the sources of funds, collection
and analysis of the data. Crises prediction is very important since the action plans will be based
upon the specific crisis type and its threat to the tourism activity. The crises management stage
consists of proactive and reactive phase. The proactive crises management phase is taking place
before a crisis and focuses on the monitoring in order to be able to prevent its occurrence, while
the reactive one concerns crisis management during and after crisis with a purpose of managing
51st International Scientific Conference on Economic and Social Development – Rabat, 26-27 March 2020
472
its impacts. In the damaging limitations phase, when crisis is over, detailed information on how
it has affected people, facilities, infrastructure, and operations is essential for crises
management team in order to make decisions and decide upon priorities. During the fifth phase,
crises should be well managed by different procedures that will help to recover their negative
consequences in the short and long term. This stage considers tourism activity rehabilitation
and its return to full functioning. The last, learning stage, refers to the experience and
knowledge that can be gained in every stage of crisis management and are useful for managing
crises in the future (Abd El-Jalil, 2013). Based on this study findings, it can be concluded that
there is an increasing number of authors dealing with crisis and crisis management. However,
it is evident that further research should be done focusing on their suggestions and
recommendations presented in this literature review.
4. CONCLUSION
This paper presents the results of the review of the literature concerning crisis and crisis
management in tourist destinations. A total of 38 studies on this topic published in the high
ranking scientific journals indexed in Web of Science and Scopus between 2009 and 2019 were
included in the review. These studies were written on a number of different crisis and disaster
contexts, including weather-related events, natural disasters, economic downturns and other
crisis events. With improved transportation and new emerging markets, tourism continues to
be one of the world's largest and fastest growing industries, however tourism development also
faces a number of challenges among which are different crisis and disaster incidents (Gurtner,
2016). Globally, economic crisis, various terrorist attacks, outbreak of diseases were among
those events that affected travel and tourism. Since tourist destinations are often defenceless
against threats that affect its safety and market perception, it is necessary for them to develop
crisis strategies and contingency plans in response and therefore be prepared in advance (Çakar,
2018). Findings of this literature review indicate the need for further research of this topic given
that many authors are recommending development of effective crisis-coping strategies for a
proactive management of crisis situations in a tourist destination based on previous experiences
related to different types of crisis. This review finding confirms the necessity of encouraging
tourism destination managers to actively engage in preparing for eventual crisis situations and
developing appropriate management strategies. With integration of all community stakeholders,
tourism crisis managers require understanding all the phases of crisis in order to be able to
prevent eventual crisis situations, as well as to effectively manage those that occur.
Comprehensive discounting and promotions, expansion into new regional market sectors,
“package deals”, and the growth of the domestic market, proved to be successful strategies for
stimulating tourist arrivals. Moreover, crisis situations in tourism destination require different
communication strategies and management of the communication process since those situations
require rapid response and high-quality communication with all target groups before, during
and after a crisis (Čendo Metzinger and Janeš, 2018). Adopting some of existing practices will
help tourism destinations to become more prepared for future crisis situations and more flexible
to change. In that way destination management will be able to effectively manage the crisis by
using accumulated knowledge through formulated and contingency action plans in crisis
management process. One of the main limitation of this study lies in the fact that the book
chapters and conference papers were not included in the review as well as that only scientific
papers published in journals indexed in WoS and Scopus were included. Therefore, inclusion
of other type of publications and other databases would provide more information on crisis
management in the tourism context.

51st International Scientific Conference on Economic and Social Development – Rabat, 26-27 March 2020
473
LITERATURE:
1. Abd El-Jalil, S. G. (2013). Crises effects management: A new policy to manage tourism
crises in Egypt. Tourism Review International, 17, 1–17.
2. Aliperti, G., Frey M., Garschagen, M., Hagenlocherb, M.,Sandholzb, S. (2019). Tourism,
crisis, disaster: an interdisciplinary approach. Annals of Tourism Research, 79, 1-5.
3. Barbe, D., Pennington-Gray, L. (2018). Using situational crisis communication theory to
understand Orlando hotels’ Twitter response to three crises in the summer of 2016. Journal
of Hospitality and Tourism Insights, 1 (3), 258-275.
4. Boukas, N., Ziakas, V. (2014). A Chaos Theory Perspective of Destination Crisis and
Sustainable Tourism Development in Islands: The Case of Cyprus, Tourism Planning &
Development, 11 (2), 191-209.
5. Boztug, J. Dolnicar, S., Hajibaba, H. (2016). Preventing tourists from canceling in times of
crises. Annals of tourism research, 60, 48-62.
6. Çakar, K. (2018). Critical success factors for tourist destination governance in times of
crisis: a case study of Antalya, Turkey. Journal of Travel & Tourism Marketing, 35 (6),
786-802.
7. Chan, C. H., Nozu, K., Cheung, T.O.L. (2019). Tourism and natural disaster management
process: perception of tourism stakeholders in the case of Kumamoto earthquake in Japan.
Current Issues in Tourism, 1-22.
8. Chen, X., Li, D., Nian, S., Wu, K., Yang, L., Zhang, H., Zhang, J., Zhang, J. (2019). Two
Sides of a Coin: A Crisis Response Perspective on Tourist Community Participation in a
Post-Disaster Environment. International Journal of Environmental Research and Public
Health, 16 (12), 1-19.
9. Choi, W., Cruz-Milan, O., Simpson, J. J., Simpson, P.M. (2016). Reassurance or reason for
concern: Security forces as a crisis management strategy. Tourism Management, 56, 114 –
125.
10. Čendo Metzinger, T., Janeš, H. (2018). Management of communication processes in crisis
situations. Annals of Disaster Risk Sciences, 2, 151-155.
11. De Sausmarez, N. (2013). Challenges to Kenyan tourism since 2008: crisis management
from the Kenyan tour operator perspective. Current Issues in Tourism, 16 (7-8), 792 - 809.
12. Gamez, A., Ivanova, A., Campiranon, K. (2014). Tourism and economic crisis management
within apec. cases: Phuket (Thailand) and Los Cabos (Mexico). International Journal of
Sustainable Development and Planning, 9 (2), 143-157.
13. Ghaderi, Z., Mat Som, A. P., Henderson, J. C. (2015). When Disaster Strikes: The Thai
Floods of 2011 and Tourism Industry Response and Resilience. Asia Pacific Journal of
Tourism Research, 20 (4), 399–415.
14. Ghaderi, Z., Mat Som, A. P., Wang, J. (2014). Organizational Learning in Tourism Crisis
Management: An Experience from Malaysia. Journal of Travel & Tourism Marketing, 31
(5), 627-648.
15. Gurtner, Y. (2016). Returning to paradise: Investigating issues of tourism crisis and disaster
recovery on the island of Bali. Journal of Hospitality and Tourism Management, 28, 11-
19.
16. Hall, C. M. (2010). Crisis events in tourism: subjects of crisis in tourism. Current Issues in
Tourism, 13 (5), 401–417.
17. Hirudayaraj, M., Sparkman, T.E. (2019). Building leadership capacity: a framework for
disruptive events in tourism. Industrial and Commercial Training, 51 (1), 114-124.
18. Jallat, F., & Shultz, C. J. (2011). Lebanon: From cataclysm to opportunity—Crisis
management lessons for MNCs in the tourism sector of the Middle East. Journal of World
Business, 46 (4), 476–486.
51st International Scientific Conference on Economic and Social Development – Rabat, 26-27 March 2020
474
19. Jiang, Y., Ritchi, B.W. (2019). A review of research on tourism risk, crisis and disaster
management: Launching the annals of tourism research curated collection on tourism risk,
crisis and disaster management. Annals of Tourism Research,79, 1-15.
20. Jóhannesson, G. T., Huijbens, E. H. (2010). Tourism in times of crisis: exploring the
discourse of tourism development in Iceland. Current Issues in Tourism, 13 (5), 419–434.
21. Jones, T.E. (2016). Evolving approaches to volcanic tourism crisis management: An
investigation of long-term recovery models at Toya-Usu Geopark. Journal of Hospitality
and Tourism Management, 28, 31 - 40.
22. Kelemen, M., Lin, Y., Tressider, R. (2018). Post-disaster tourism: building resilience
through community-led approaches in the aftermath of the 2011 disasters in Japan. Journal
of Sustainable Tourism, 26 (10), 1766-1783.
23. Khazai, B., Mahdavian, F., Platt, S. (2018). Tourism Recovery Scorecard (TOURS) –
benchmarking and monitoring progress on disaster recovery in tourism destinations.
International Journal of Disaster Risk Reduction, 27, 75-84.
24. Kim, M., Lee, S.K., Roehl, W. (2019). Effect of hotels’ price discounts on performance
recovery after a crisis. International Journal of Hospitality Management, 83, 74-82.
25. Krieger, J., Liu, B., Pennington-Gray, L. (2016). Tourism crisis management: Can the
Extended Parallel Process Model be used to understand crisis responses in the cruise
industry? Tourism Management, 55, 310 – 321.
26. Li, S., Blake, A., Cooper, C. (2010). China’s tourism in a global financial crisis: a
computable general equilibrium approach. Current Issues in Tourism, 13 (5), 435–453.
27. Liu, A., Pratt, S. (2017). Tourism’s vulnerability and resilience to terrorism. Tourism
Management, 60, 404–417.
28. Mair, J., Ritchie, B. W., Walters, G. (2014). Towards a research agenda for post-disaster
and post-crisis recovery strategies for tourist destinations: a narrative review. Current Issues
in Tourism, 19 (1), 1–26.
29. Mikulić, J., Sprčić Miloš, D., Holiček, H., Prebežac, D. (2016). Strategic crisis management
in tourism: An application of integrated risk management principles to the Croatian tourism
industry, Journal of Destination Marketing & Management, 7, 36-38
30. Orchiston, C., Higham, J.E.S. (2014). Knowledge management and tourism recovery
(de)marketing: the Christchurch earthquakes 2010–2011. Current Issues in Tourism, 19 (1),
64 – 84.
31. Palaskas, T., Psycharis, Y., Rovolis, A., Stoforos, C. (2015). The asymmetrical impact of
the economic crisis on unemployment and welfare in Greek urban economies. Journal of
Economic Geography, 15 (5), 973–1007.
32. Paraskeves, A., Altinay, L., McLean, J., Cooper, C. (2013). Crisis knowledge in tourism:
types, flows and governance. Annals of Tourism Research, 41, 130-152
33. Pennington-Gray, L., Thapa, B., Kaplanidou, K., Cahyanto, I., McLaughlin, E. (2011).
Crisis Planning and Preparedness in the United States Tourism Industry. Cornell Hospitality
Quarterly, 52 (3), 312–320.
34. Racherla, P., Hu, C. (2009). A Framework for Knowledge-Based Crisis Management in the
Hospitality and Tourism Industry. Cornell Hospitality Quarterly, 50 (4), 561–577.
35. Rittichainuwat, B.N. (2013). Tourists’ and tourism suppliers’ perceptions toward crisis
management on tsunami. Tourism Management, 34, 112 – 121.
36. Sharpley, R., Speakman, M. (2012). A chaos theory perspective on destination crisis
management: Evidence from Mexico. Journal of Destination Marketing & Management,
1 (1-2), 67–77.
37. Vargas-Sanchez, A. (2018). Crisis situations in tourist destinations: how can they be
managed? Enlightening Tourism. A Pathmaking Journal, 8 (1), 47-69.

51st International Scientific Conference on Economic and Social Development – Rabat, 26-27 March 2020
475
38. Wang, Y. S. (2009). The impact of crisis events and macroeconomic activity on Taiwan’s
international inbound tourism demand. Tourism Management, 30 (1), 75 – 82.
51st International Scientific Conference on Economic and Social Development – Rabat, 26-27 March 2020
476
HUMAN PERSONAL TIME: APPEALING TO ITS DUALITY AND
HARMONIZATION
Svetlana Sotnikova
Professor at Novosibirsk State University of Economics and Management, Russia
Elena Razomasova
Associate professor, candidate of Economic Sciences at
Novosibirsk State University of Economics and Management, Russia
Elena Mikhailova
Associate professor, candidate of Economic Sciences at
Novosibirsk State University of Economics and Management, Russia
ABSTRACT
Along with the traditional factors of production, time relates to the main economic resource
that contributes to improve the quality of life and human competitiveness in the labor market.
It is not enough for people to eat and dress well, to live in conditions of material comfort. They
also must have time to satisfy their spiritual needs, increase their level of knowledge, expand
their scientific horizons, etc. The digitalization of the economy as a result of the Fourth
Industrial Revolution blurs the boundaries between personal space and working time,
expanding the area of responsibility and obligations of each employee towards related areas.
This process is accompanied by a reduction in the majority of worker’s rest time, especially
free time. An analysis of the structure of the actual use of personal time indicates that the vast
majority of time is spent on labor time, and for this reason present-day employees practically
do not have free time to improve their skills in accordance with dynamically changing market
demand. In article the factors that contribute to filling the paradigm of employee’s personal
time with new socio-economic content are discussed.
Keywords: Personal time, working time, free time, presence at work, work attendance,
modernization, consumer services sphere, social outsourcing
1. INTRODUCTION
The modernization of the Russian economy requires constant adaptation of human resources,
which are its driving force to the dynamically changing demand for their proficiency. It is clear
that each individual, at least, should rationally use personal time for this. Only in this context
we can get a clear answer to such question as: who exactly and how will be carrying out the
modernization? The man’s perception of personal time has been changing on different stages
of cultural and historical development, depending on the peculiarities of sociocultural relations.
In this context, it is no accident that the concept of time is one of the central ones for philosophy1
[Tretyakova L.A., Podvigailo A.A., 2014; Sotnikov N.Z., Sotnikova S.I., Mikhailova E.M.,
2019, pp.1302-1315; Patrushev V.D., 1978; Strumilin S.G., 1957; Klimov N., 1961; Tsvelev
R.I., 1996], psychology [Khokhlova T.P., 2012, p. 19], sociology [Sotnikov N.Z., 2016, pp.
126-135; Vinokurov M.A., Gorelov N.A., 2004], economics [Zanin, 1962; Patrushev, 1966;
Prudenskiy, 1972], as well as in the process of cognition and comprehension of art culture.
1 Regions of Russia: socio-economic indicators, 2017 [Electronic resource] / Federal state statistics service. – URL: https:// www.gks.ru/wps/wcm/connect/rosstat_main/rosstat/ru/ statistics/publications/catalog/doc_1138623506156 (accessed 29.08.2019).
51st International Scientific Conference on Economic and Social Development – Rabat, 26-27 March 2020
477
So, for primitive man's perception of time it was based on the rhythmicity and recurrence of
natural events as a necessary condition for successful life activity. The time models of Antiquity
were focused on the present and carried the idea of infinity of eternity. Time did not have much
value. The ancestral (or dynastic) time of the Middle Ages with more accurate event fixation
and religious interpretations was replaced by reflection over the time, the development of
historical consciousness and thinking in the Renaissance. Masterpieces of Renaissance art
demonstrate man's desire to resist destruction, to overcome time by preserving the present for
eternity. The growing speed of development of urban culture in Modern times determines a
qualitatively different attitude to time. As Zh.V. Gorkaya fairly specifies, «a common urban
time becomes prepotent, independent, autonomous category, the measuring standard the
eventfulness of life» [Dolinin A.Yu., 2009, p. 247]. The anthropocentric nature of centuries-old
ideas about time makes us recall O. Spengler's statement: «:..We ourselves are time» [Prudinsky
G.A.,1972, p. 327]. Modern man is clearly aware of time as an irreparable resource and tends
to draw maximum benefit from its use. The concepts «time as a resource», «time as
opportunities», «time as capital», «non-existent time» and etc. are reflections of contemporary
cultural values. Personal time appears as the most important condition for maintaining the
competitive position of a person in work based on personal interests, improving the quality of
life in a changing socio-economic realities [Sotnikov N.Z., Sotnikova S.I., Mikhailova E.M.,
2019, pp. 1302-1315]. In today's context, personal time cannot be an idle, non-busy time, but
must be filled with activities that promote comprehensive human physical and cultural
development. For this reason, personal time is not only daily temporary resources for working
and meeting physiological needs (sleep, food intake, hygiene), but also individual time
resources for solving everyday issues, maintaining of kinship and friendship communications,
parenting, education and self-education, recreation and recuperation, ensuring the optimal level
of health, self-realization, achieving the current life goals and other needs. In fact, it is a time
of work, a time of spending mental and physical strength, and a time of rest, a time of recovery
of mental and physical strength. Time of work is usually consists of a labor time, an out-of-duty
time and a time of domestic work. Rest time is mainly consists of a free time and a self-service
time. Of course, in some cases it is quite difficult to allocate time of work and rest time in their
«pure form» as various types of activity have different subjective value for people. For example,
the mother's time associated with caring for children, their education, playing with them,
walking, is represented as based on the external form, by the time associated with the
performing of domestic service work during an out-of-duty time. And judging from the content
of the inner feelings of these time expenditures, then it could be one of the kinds of free time
associated with the satisfaction of physical, intellectual and social needs. In this regard, the
focus of the research interest aims to identify the imperative of achieving harmony between
work time and rest time, which contributes to improving the quality of life and human
competitiveness in the labor market. In order to achieve this goal, the following research
problems have been solved: the architectonics of a human's personal time is justified, which
allows to understand its duality; the methodical approach to personal time harmonized taking
into account sociocultural environment is proposed and tested. The scientific novelty consists
in justification of the modern concept of working time, development of theoretical and applied
bases of increasing human’s free time by determining of vectors of an entrepreneurial initiative
in services sector, searching of mutually acceptable models of solutions for consumers and
representatives of small business. The research methodology is based on the theoretical analysis
of the results of scientific works, which present the main points about the dual nature of human's
personal time, work time and rest time of an employee. The research was conducted using
sociological methods. The questionnaire was developed for this purpose (it consisted of three
parts, two of which were aimed at obtaining specific information in accordance with the
working hypothesis, the third part summarized the personal data of respondents) and was posted
51st International Scientific Conference on Economic and Social Development – Rabat, 26-27 March 2020
478
on Google Forms Internet site in December 2018. The first part of the questionnaire allowed us
to consider consumer services in the context of economic opportunities for residents of the
metropolis. The second part focused on the opportunities and potential limitations of
entrepreneurial initiative in the field of consumer services. The subject of the research is the
personal time of the employee.
2. WORKING TIME AS A STRATEGIC RESOURCE FOR THE DEVELOPMENT OF
ECONOMIC ACTORS
In present conditions of formation of the digital economy, of labor-saving and intellectually
capacious nature of scientific and technological progress, business is forced to reduce costs and
to increase competitiveness. «The ability to create and maintain the competitive advantage of
human resources is a vital growth factor of any economic actor» [Sotnikov, 2016, pp.126-135].
Any improvement in organizational competitiveness is ultimately reduced to working time
savings. Working time is becoming one of the main intangible assets of the economy, the means
of achieving high socio-economic results. In this context, Russian companies are beginning to
realize more clearly that working time is an irretrievable, but regulated resource of the
organization. Its effective use is a continuous and purposeful process that creates opportunities
to reduce the influence of stochastic factors determining labor costs for organizational goals,
the rhythm of production and commercial activity, the quality of labor, the cost, the profit.
Working time is «the time during which an employee must performs working duties in
accordance with the rules of internal labor regulations and the terms of an employment contract,
as well as other periods that relate to working time in accordance with the Labor Law, other
federal laws and normative legal acts of the Russian Federation» (article 91) 2. According the
legislation of Russia, other time’s periods include: forced downtime, associated with technical,
economic and other reasons; meal time without leaving the workplace, if separate breaks are
not provided for these purposes; special-purpose breaks for heating; time for breastfeed and
also the prescribed breaks for gymnastics of individual groups of employees. The development
of telecommunications infrastructure, the use of digital information and communication
technologies against the background of rising costs and a shortage of labor significantly changes
the content of the paradigm and the fundamental principles of using the working time. The
virtual space expands in the socio-labor sphere as the informatization and digitalization of the
economy develops. This is accompanied by the spreading of labor processes virtualization, the
increasing the number of virtual workplaces which forms virtual departments in virtual
organizations, the enhancing the role of information computer technologies. Virtualization of
business activity allows an employee to carry out projects and tasks for several employers in a
specific period of time without his physical presence in the organization, without binding himself
to it with the norms of labor legislation. As a result, the institutes of searching for counterparties
and controlling the use of working time, the mechanisms of state regulation of working time
are changing; the number of distractions of employees in performing work tasks, absences in
the workplace is growing. The competitive business environment makes employees to be closer
to potential partners by meeting with them in the regions. For this reason, ideas of self-
organization of labor are becoming more widespread, in which the employee is determined by
the strategic direction of the business, resources are allocated and control criteria are introduced.
«The self-organization of labor is based on independence in the employee's implementation of
his abilities and skills, competencies associated with self-management within the framework of
his labor process, with self-planning of work functions in their specific sequence and in time,
with self-regulation and self-service, self-accounting of the result of labor and self-limitation
according to the conditions cooperation, with self-regulation and self-control, with self-
2 Labor Code of the Russian Federation № 197-FZ, dated 30.12.2001 (as amended on 05.02.2018). http://www.consultant.ru/document/cons_doc_LAW_34683.

51st International Scientific Conference on Economic and Social Development – Rabat, 26-27 March 2020
479
criticism and moral self-stimulation» [Sotnikova, 2013, р.66]. It becomes unimportant for the
manager where the employee is currently located in conditions of de-bureaucratization of the
organization of labor. The main thing is to perform work tasks. The availability of mobile
communications allows the employee, if it necessary, to get access the required information,
and, in turn, he can provide materials in a timely manner by himself. The organization as a
means of achieving business goals exhausts the resources of its development, primarily in the
structural aspect. There is a redistribution of the centers of responsibility, delegating of more
and more rights to subordinate links, which are becoming more autonomous. Organizational
structures focused on achieving synergies among all employees are being replaced by structures
that organizationally support the work and working results of an individual employee.
Therefore the need for flexible placement of the workplaces is growing; the number of remote
employees in the business is increasing. Ultimately, this creates the conditions for the transition
from standard modes of work and rest to flexible working time. Flexible working time as a form
of its organization for an individual employee and their teams allows to self-regulation of the
beginning, ending and total length of the working day within certain limits. Thus, there is a
legal opportunity to independently regulate (establish) an individual mode: changing the time
of arrival and departure from work, from the lunch break; shortening or lengthening the working
day in accordance with the employee’s own needs and production requirements. At the same
time, of course, the full working out of the total number of working hours established by law
during the adopted accounting period (day, week and month) is mandatory (article 102)3. The
spread of flexible working modes allows the employer to increase, on the one hand, the
economic efficiency of business activities by reducing losses due to delays in work and short-
term absence of performers at work with the permission of the administration, rational use of
«dead» time between business meetings outside the organization and, as a result, significant
savings and shortened lead times with serving more customers. On the other hand, making more
complete use of personal resources of each employee achieves the social efficiency of business
activities. It based on taking into account their working capacity during the day, satisfying their
social needs thanks to the optimal combination of work time and time for performing personal
affairs, upbringing children, studying, etc. So, modern Russian organizations, having gained
new opportunities in the use of working time, faced numerous difficulties associated with the
neediness for more technologically advanced searching and processing of information about
working time against the traditional strict hourly monitoring of an employee, time- table
accounting of the presence of employees at the workplace, online monitoring, analysis of
information about the sites they visit and Internet traffic, e-mail control, etc. An objective
necessity has ripened for the transition from hard management of the work's attendance to
harmonize the interests of economic actors with respect to the lack of employees at the
workplace (within the established norms of the labor legislation), from the relationship of
subordination to the partnership as «employer – employee», from the registering the arrival and
leaving time to work to the attendance management. The management of the work's attendance
is the process of risk managing which associated with the absence of employees in the
workplace to ensure business continuity. This process is focused on maintaining the labor
activity of employees by providing them with the access to cooperation mechanisms and
communication support for managing of work efficiency, flexible working time, to stimulating
the performance of functional duties. The main thing in this process is to maintain a balance
between respect and trust for employees, on the one hand, and clear control over the
performance of their functional duties in their absence, on the other. The management of the
work's attendance, therefore, is a combination of techniques and methods of targeted impact on
the performance of functional duties by employees in the event of their physical and / or virtual
3 Labor Code of the Russian Federation № 197-FZ, dated 30.12.2001 (as amended on 05.02.2018). http://www.consultant.ru/document/cons_doc_LAW_34683.
51st International Scientific Conference on Economic and Social Development – Rabat, 26-27 March 2020
480
absence from the workplace. The concept of working time fills with new socio-economic
content which is manifested in increasing of the zone and expanding the range of types of
working time due to time resources associated with the performance of official functions by an
employee during off-hours, for example, discussing work issues on the phone with colleagues
on vacation days, finalizing projects, reports, thinking and writing articles, preparing reports,
urgent tasks on weekends and holidays, etc. «The creative work of most modern employees
extends beyond the usual working day and working week» [Demina, 2011, p.30]. On the one
hand, there is an increase and enrichment of working time; on the other hand, there is a reduction
and impoverishment of the time of non-working and domestic work and rest time. In other
words, the expansion of the market for digital solutions and digital services for management in
modern conditions is accompanied by the disappearance of clearly defined contours, the
boundaries of working time. In this context, it is more important to reach an agreement between
the employer and employees not about their physical presence at the workplace, but about the
avoidance of participation (i.e., real non-participation) in the process of achieving the goals of
the production and commercial system. And exactly, management of the work's attendance
creates the basis for the formation of an updated and unified information space that operates
with technologies for detecting and evaluating anomalies in the use of employee’s free time in
the conditions of economic modernization.
3. FREE TIME AND MODERNIZATION OF THE ECONOMY
The main role of free time is the reproduction of labor force. A rested and healthy employee is
capable of higher labor productivity than not having slept and tired one. This is clear to anyone.
The question of the necessity for free time for each of us disappears by itself. However, such
an explanation of this problem can be only interpreted as a simple reproduction of the labor
force. The modernization process requires a different approach. The labor force should not be
reproduced in an unchanged form, but as the ability to carry out more advanced, progressive
types of work’s activities, which requires special additional training. According to Tsvylev R.I.
[Tsvelev R.I., 1996], the main historical types of social organization of society from agrarian
to industrial, gradually sought service, information status, where the growth of surplus value is
not only due to the active use of extractive industries and subsequent processing of raw
materials, but due to intellectual activity, the growth of the technological level of production
and automation, the advisability of using working time. Intensification of the process of
economic reproduction is achieved due to a significant growth in the economic mobility of the
population, mainly by increasing the living comfort. The traditional Russian mentality consists
in the fact that the individual is completely coalesced with everyday life and, in the future,
becomes unable to change both the type of economic activity and the geographical location of
the application of their efforts. In this context, the problem of free time in the conditions of a
modernized society and economy becomes not at all a personal, but a public problem. The
current state of affairs in this area actually is a brake on modernization. And if so, then it makes
sense to solve the problem only on a large scale, in industrial way, turning the sphere of
consumer services into a kind of socially significant outsourcing by analogy with industry, with
the help of which most of the consumer services will be carried out by professional
organizations outside the household. New classes of society, which formed on the basis of
intellectual and personal differences, stand out in separate sectors of the production of
information and knowledge. Such sectors are the quintessence, the driving force for the
development of progress in the post-industrial economy, where a person is assigned the role of
the carrier of intellectual resources. People whose intellectual and creative abilities allow
creating innovations should have enough time to realize their ideas and concepts. They should
not be distracted by housekeeping or trouser hemming. Modern employees has the opportunity
to carry beyond the majority of social services outside of households and will be able to spend

51st International Scientific Conference on Economic and Social Development – Rabat, 26-27 March 2020
481
more time on themselves, continuing their education, improving their skills and
professionalism, which will invariably lead to an increase in their personal income, growing in
life expectancy, and will change the image of housekeeping once and for all time. In strategic
terms, it is possible to achieve the harmony of work time and rest time in the order to obtain the
effect of social outsourcing by developing an economically feasible strategy for the
development of consumer services sector, which leads to the price and territorial availability of
services to the population.
4. HARMONIZATION OF WORK TIME AND REST TIME: CONSUMER SERVICES
AND ECONOMIC OPPORTUNITIES OF THE POPULATION
According to the Labor Code (Chapter 4, Article 91)4 the normalized working week is 40 hours
in Russia, but it is difficult to find a modern company where these standards are clearly adhered
to. The average working week is about 70 hours in the business enterprise sector. This indicator
of the actual time spent on the implementation of production tasks is taken as a basis in the
research. Additionally, a working urban resident weekly spends for 10 hours in transport
(getting to the office and back), sleeps 42 hours (based on 6 hours a day) and remain free from
direct working obligations about 46 hours a week or 6.6 hours per day. It would seem that this
figure is sufficient, however, during the survey, respondents complained about the absence of
proper rest, the growing of chronic fatigue, lack of personal time to implement their own
projects and plans. What is the reason for the discontent? It turned out that the problem of urban
residents is not in the absence of free time per se, but in its irrational using. The results of
research5 have shown that 50% (41 persons) are constantly experiencing a lack of personal time,
38% (31 persons) regularly have a situation with a lack of personal time, 5% (4 persons) rarely
lack free time, 7% (6 persons) have a lack of personal time to implement their hobbies. Among
the respondents, 71% (58 persons) hold senior management positions, have an university
education and belong to the group of respondents with a high level of income (from 30 to 50
thousand rubles for each family member). 93% (or 46% of the total number of respondents –
38 persons) out of them are respondents who are constantly experiencing a lack of personal
time (according to the answer to question number 1 of the questionnaire), which seems logical.
11% of the total numbers of respondents (9 persons) are persons with university education, but
do not hold senior management positions, with a monthly income level of 20 to 30 thousand
rubles for each family member. The proportion of respondents in this group who are constantly
experiencing a lack of personal time is minimal – 2 persons. 4 respondents have specialized
secondary education and income levels of less than 10 thousand rubles for each family member.
The lack of free time is practically not felt for them. 11 persons have an income level from 15
to 20 thousand rubles for each family member and a regular situation with a lack of personal
time. The conclusion is obvious: respondents with average and high levels of income constantly
or regularly experience a lack of personal time being people with a high degree of professional
employment, which necessitates turning this category of population to paid services in order to
save time and achieve the required level of comfort. At the same time, more than half of each
category of respondents (constantly or regularly experiencing a lack of personal time – 28 and
18 personas respectively) believe that the acquisition of the services that they need allows
eliminating the problem of lack of personal time (question 7: «What is the main reason for you
when choosing a service?»). It serves as a priority factor in making this decision. High-income
respondents pay special attention to the level of quality of services and the ability to have an
acceptable choice of manufacturers.
4 Labor Code of the Russian Federation № 197-FZ, dated 30.12.2001 (as amended on 05.02.2018). http://www.consultant.ru/document/cons_doc_LAW_34683. 5 The survey was conducted among residents of Novosibirsk. 120 persons took part in the survey in total; 82 questionnaires were left for research.
51st International Scientific Conference on Economic and Social Development – Rabat, 26-27 March 2020
482
The percentage of this category in the group of citizens with incomes from 30 to 50 thousand
rubles per family member is 56% (46 persons), in the group with incomes of 20 to 30 thousand
rubles – 8,5% (7 persons). The decisive factor in choosing the necessary services for
respondents with income levels of 15 to 20 thousand rubles per family member is the affordable
price and the proximity of the location of enterprises providing services to their permanent
places of staying (home, work, places of recreation, etc.). In the context of the above question
the correlation of answers of this category of respondents (total 10 persons) was as follows: 8
out of 11 persons in the group (72,7%) bet on an affordable price, and 2 persons (18,2%) – on
the convenience of location relative to their placement. The majority of respondents (63% and
52 persons) answered to the question number 5 «What kind of housework would you refuse if
you had such an opportunity?» in a way, that they would gladly refuse daily cooking, cleaning
and minor repairs. In second place among the undesirable types of domestic work for the
residents of Novosibirsk was repair and improvement of housing – 22% (18 persons). Pet care
is the least of all burdens for citizens, among whom only less than 10% (7 persons) expressed
a desire to transfer this type of housework to the hands over to the professionals. It is obvious
that the caring for pets is not perceived in the context of routine duties, but, on the contrary,
refers to recreational and entertainment hobbies. The answers of the respondents on the question
about the amount of monthly expenses for the purchase of services in the case of their transfer
to professionals were distributed as follows: 60% of respondents (49 persons) spend from 2 to
5 thousand rubles, 24% (20 persons) spend amount from 15 to 20 thousand rubles, only 4% of
respondents spend (and are ready to spend further!) more than 20 thousand rubles. 12% of
respondents spend on the acquisition of five services collected in the questionnaire (cooking
services, cleaning, repair and home improvement, purchase of food and goods, pet care) less
than 2 thousand rubles. The free answer was ignored. Beyond the borders of the survey was a
group of people willing to spend from 5 to 10 thousand rubles every month on the purchase of
necessary services. Thus, there is a situation in which high-income households can afford to
purchase the services they need, spending from 15 to 20 thousand rubles on it. It actually
corresponds to the average monthly wage in the region (on the period of the research – 25401
rubles). This circumstance reflects the actual level of demand for services existing at the time
of the research and leads to the idea of an uneven structure of income of the population in the
city of Novosibirsk. Namely, the share of the well-off category of households prevails over the
average and low-income categories. According to the results of a sample survey of household
budgets, the share of households with the highest incomes region in the rank of five positions
was the most significant at the end of 2017 in the Novosibirsk6. It was 44% of the region’s
residents. As the level of household income decreases, so does the share of their group in the
total amount of monetary income of the population. Thus, the share of the population with
average income holding the fourth and third positions in the ranking was 22,9% and 15,9% for
the circulation period, respectively. Least of all in the Novosibirsk region were households with
low incomes – 6,2%. The service providers target to high- and middle-income consumers what
«deprives a significant portion of the urban population of the opportunity to purchase the
services they need» [Razomasova, 2012] for a commensurate fee and in the desired range.
Every working city dweller constantly faces a dilemma: to independently produce domestic
services for themselves, or, following the principles of outsourcing, to make part of them for
the redistribution of households, entrusting their production to specialized enterprises.
Unfortunately, the choice is not in favor of saving the free time resource. The situation when
an employee is forced to spend a lot of time on self-service every day after the completion of
the working process cannot be considered the norm.
6 Regions of Russia: socio-economic indicators, 2017 [Electronic resource] / Federal state statistics service. – URL: https:// www.gks.ru/wps/wcm/connect/rosstat_main/rosstat/ru/ statistics/publications/catalog/doc_1138623506156 (accessed 29.08.2019).
51st International Scientific Conference on Economic and Social Development – Rabat, 26-27 March 2020
483
When the costs of the so-called «free time» for organizing a public economy for women are
from 3,8 to 4,7 hours a day, and for men from 1,0 to 2.5 hours, it is difficult to apply the concept
of «freedom», or rather talk about the «social slavery» inherited by the modern generation from
the norms of patriarchal farming that have become stronger in the mind.
5. CONCLUSION
Thus, it is possible to put forward a hypothesis according to which the way of reproducing the
services necessary for a modern person by the efforts of the households themselves hinders the
economic development of society as a whole. The patriarchal way of life of Russian society,
which has survived to this day, impedes the creative activity of the individual, forcing everyone
whose purchasing power is lower than the current prices in the consumer services market to
spend all their free time on self-service.
LITERATURE:
1. Demina V.V. The boundaries of the working and leisure time for the employees today //
Journal of Russian entrepreneurship. 2011. № 10 (2). Pp. 30-36.
2. Dolinin A.Yu. Problems of evaluating motivation of the staff of the criminal Executive
system // Applied legal psychology. 2009. №. 2. Pp. 146-150.
3. Khokhlova T.P. Deviance and coping as a continuum of behavioral models in a modern
organization // Service sector: innovation and quality. 2012. № 8. P. 19.
4. Klimov N. Working day in a society that builds communism: monograph. Moscow:
Sotsekgiz, 1961. 240 p.
5. Labor and innovation: a collective monograph / edited by of Dr. Econ. of Sciences, Prof.
S.I. Sotnikova. Novosibirsk: NGUEU, 2013. 172 p.
6. Labor Code of the Russian Federation № 197-FZ, dated 30.12.2001 (as amended on
05.02.2018). http://www.consultant.ru/document/cons_doc_LAW_34683.
7. Labor Economics / edited by M.A. Vinokurov, N.A. Gorelov. Saint Petersburg: Peter, 2004.
656 p.
8. Patrushev V.D. Time as an economic category. Moscow: Thought, 1966. 237 p.
9. Patrushev V.D. Using the aggregate time of society. Moscow: Thought, 1978. 216 p.
10. Prudinsky G.A. Problems of working and non-working time. Moscow: Nauka, 1972. 335
p.
11. Razomasova E.A. Theoretical and methodological foundations for the formation of an
economic mechanism for the development of consumer services: monograph // KNOW
VPO of the Centrosoyuz of the Russian Federation «Siberian University of consumer
cooperation». Novosibirsk: Sibupk, 2012. 236 p.
12. Regions of Russia: socio-economic indicators, 2017 [Electronic resource] / Federal state
statistics service. – URL: https:// www.gks.ru/wps/wcm/connect/rosstat_main/rosstat/ru/
statistics/publications/catalog/doc_1138623506156 (accessed 29.08.2019).
13. Sotnikov N.Z. Conceptual bases of strategic analysis of personnel's business career //
Management in Russia and abroad. 2016. № 4. Pp. 126-135.
14. Sotnikov N.Z., Sotnikova S.I., Mikhailova E.M. Business career personal: modern
management models of russian banking organizations // GCPMED 2018 – International
Scientific Conference «Global Challenges and Prospects of the Modern Economic
Development». 2019. С. 1302-1315.
15. Strumilin S.G. Labor economics: textbook. Moscow: Politizdat, 1957. 347 p.
16. Tretyakova L.A., Podvigailo A.A. Problems of evaluating the effectiveness of PR activities
in Personnel management // Economic analysis: theory and practice. 2014. № 35 (386). Pp.
52-57.

51st International Scientific Conference on Economic and Social Development – Rabat, 26-27 March 2020
484
17. Tsvelev R.I. Post-industrial development. Lessons for Russia. Moscow: Nauka, 1996. 206
p.
18. Zanin V.I. Use and planning of working time. Autoabstract. Novosibirsk: SO AN USSR,
1962. P. 24.
51st International Scientific Conference on Economic and Social Development – Rabat, 26-27 March 2020
485
SOCIAL MEDIA MARKETING AS TOOL OF BUSINESS SUCCESS
Veronika Paurova
University of Zilina, Faculty of Operation and Economics of Transport and Communications,
Department of Economics, Univerzitna 1, 010 26 Zilina, Slovak Republic
Anna Krizanova
University of Zilina, Faculty of Operation and Economics of Transport and Communications,
Department of Economics, Univerzitna 1, 010 26 Zilina, Slovak Republic
Margareta Nadanyiova
University of Zilina, Faculty of Operation and Economics of Transport and Communications,
Department of Economics, Univerzitna 1, 010 26 Zilina, Slovak Republic
ABSTRACT
The current business environment brings many challenges for entrepreneurs. Achieving success
and being a successful business in today's competitive world is not easy at all. It is the reason,
why businesses must constantly work to improve their competitiveness and competitive position.
There are several tools and techniques through which businesses can improve their competitive
position and achieve business success. The present is strongly connected with modern
technologies in all areas. Online technology and social media marketing are closely related to
modern technology, marketing and business success. It is a tool that has been prominent in
recent years and is an integral part of the business. The paper focuses on the background of
social media marketing and business success. The aim of the paper is to point out the
importance of social media marketing as an important tool of business success. The practical
part is focused on the analysis of secondary data that highlights the most important social
media in 2019.
Keywords: business success, marketing, social media
1. INTRODUCTION
Nowadays, it is a time of constant changes. Nowadays, it is a time of constant changes. As a
result of it, it is for companies difficult to long term stay on the market, to compete with
businesses with similar offered services or products. For this reason, it is also difficult for
businesses to progress and become more successful. Each company has its goals defined and
one of the basic goals of each business unit is to achieve prosperity and success. From this basic
goal is derived the overall corporate policy, specific activities and decisions of the company.
The success of the company on the competitive markets crucially depends on competent
managers (Chlebikova et al. 2015). One of the most important activity of managers in achieving
success is decision-making that Valaskova et al. (2019) define as the fact that people choose
from possible alternatives to maximize their expected profits. Considering the advancing and
changing market conditions, it is not easy in general to set the elements that affect the success
and development of a company. Ensuring effective marketing is one of the basic success factors
of a business. The shared economy is the current stage of a continuous development of the
economy and society that is influenced to some extent by digital technologies (Nica and Taylor
2017). One of the most important technologies of the present time has become the social media
that are used by millions people all over the world (Appel 2019). Social media are excellent
tool for promoting relationships with customers (Vries et al. 2012).
51st International Scientific Conference on Economic and Social Development – Rabat, 26-27 March 2020
486
Retailers and consumers are currently expanding their communications through dynamic new
media called social networks (Shareef et al. 2019). In the context of digital technology, social
media and success through effective marketing, social media marketing getting to the front.
Increase in Internet usage had an impact on marketing and it has changed marketing philosophy:
the customer has become the starting point for marketing activities (Nakara et al. 2012). Given
the huge potential of potential audiences who spend a lot of time a day in using social media on
different platforms, it is understandable that marketers have accepted social media as a
marketing channel and tool (Appel et al. 2019). Social media marketing is a type of marketing
that is particularly beneficial through increasing the number of people who favorable social
media. Social media marketing belongs between modern categories in internet marketing.
Businesses use social media marketing to attract customers through social networks. It is
necessary to pay attention to this area, as social media can have a high impact on consumers as
well as the overall business environment. The aim of paper is to point out the importance of
social media marketing as an important tool of business success. The paper consists of two
basic parts. Theoretical part focuses on the definition of basic theoretical knowledge related to
business success and social media marketing. Practical part consists of secondary analysis of
data from Statista aimed at most popular social networks worldwide ranked by number of active
users.
2. THEORETICAL BACKGROUND
There is no one-size-fits-all definition of success. There can be no single factor or set of factors
that will ensure the success of the business. Internal subjects of the company that can ensure
the success but also the failure of the company are administrative subjects such as owners and
founders. In addition, external entities such as stock exchanges, investors, banks, etc. are also
important. The sources of success of business entities include the contribution of individual
customers, performance of operating activities and process and individual products (Veber
2009). According to Krivohlavy (1995) a prosperous enterprise should not make just a profit.
The business should focus on its partners, suppliers, employees, co-workers and all the people
with whom the business comes into contact with the business, not just for economically
expressed final target value for its own benefit. Business success gets a broader and more
complete dimension when the direction and goal of business efforts are generally defined.
According to Srpova and Veber (2012) a set of tangible and intangible factors affects the
success of enterprises, so-called development potential. Development potential includes factors
such as customer satisfaction, innovation, environmental protection and employee motivation.
The success of a business depends on several factors depends on both the external and internal
environment (Szabo and Jankelova 2006). The external business environment is formed by a
group of external factors. These factors have a decisive character with the possibility of minimal
impact, but some of them may present opportunities or limitations for the company. This is the
main reason why these factors need to be constantly monitored and reflected in management
practice (Szabo and Jankelova 2006). A conceptual range requiring a set of actors and ties
representing certain relationships or a set of relationships between the actors who, in practice,
play the role of the source of resources which are, or can potentially contribute, to the success
of the given business entity (Domanska 2018). According to Rypakova et al. (2015) success is
defined by the victory, best in section – a value system. In marketing, 4P is an essential
minimum for successful companies. That is why businesses should take care to effectively
manage and secure their marketing activities. One of the areas of marketing that businesses
should pay increased attention to is marketing within the digital environment, and hence online
marketing. Internet marketing is the use of various Internet services to carry out or support
marketing or broader business activities. So marketing on the Internet is much more than just
advertising.

51st International Scientific Conference on Economic and Social Development – Rabat, 26-27 March 2020
487
Jemala (2008) say that the internet can do without marketing, but modern marketing and
especially e-business without internet do not. Marketing activities on the Internet are many and
broad spectrum, concerning the components of the marketing mix, marketing communication,
public relations and other activities. Among the major marketing activities carried out via the
Internet Jemala (2008) include: e-mail, newsgroups, world wide web (www), search servers,
specialized, professional and educational servers, business presentations, e-commerce servers,
statistical servers and advertising systems, internet connection, internet advertising, e-
commerce, internet marketing research, etc. In the context of Internet marketing, the using of
social media as marketing channels has been widespread in recent years. This is mainly due to
the efficiency to address millions of customers with branded content and engage them in
conversations (Schivinski and Dabrowski 2016). In the context of Business to Customer (B2C),
social media platforms are widely researched. With its developed constructs and concepts social
media becoming an integral part of consumers' modern lives (Iankova et al. 2018). Social media
is a group of tools that allow customers to exchange ideas and opinions, to collect site content,
and to make contacts online (Scott 2010). Social media today is an important part of an
individual in society. Social media is easily available to anyone, who has an access to Internet.
Safko and Brake (2009) define social media as practices, behaviors and activities among
communities of people who concentrate online to share facts, knowledge, opinions and
information using conversation and media. Social media offers an abundance of services on the
Internet. This makes it complicated for companies to know which ones to use and how to use
them. The types of social media include: micro-blogs such as Twitter, Friend Feed and Plurk,
social networks such as LinkedIn, Facebook and Myspace, reviews and ratings such as Amazon,
Trip Advisor and Yelp and video such as Vimeo and YouTube (Karimi and Naghibi 2015).
Social Media is defined in the context of the previous media paradigm. Traditional media such
as newspapers and magazines, television, radio are in one direction static technologies. New
web technology has made it simple for anyone to create and most highly, issue their own
content. A blog position, Youtube video or tweet can be twisted and viewed by millions almost
for free (Saravanakumar and SuganthaLakshmi 2012). In a practical meaning, social media is
a set of software digital technologies that are usually presented as websites and applications
that provide users with a digital environment in which they can send and receive digital
information and over some type of online social network. In this meaning social media can be
understood as the main platforms and their functions such as Instagram, Facebook and Twitter.
In practice and reality, social media can also be perceived as another type of digital marketing
channel that businesses can use to communicate with customers through advertising (Appel et
al. 2019). Social media marketing includes activities like posting text and image updates,
videos, and other content that encourages audience engagement as well as paid social media
advertising. These activities are referred to as social media marketing. Social media marketing
is a type of internet marketing that comprise creating and sharing content on social media
networks in order to achieve branding and marketing goals. Increased communication for
organizations means promoting brand awareness. Brand value managing and building is a
important challenge for managers. It is mainly due to current market environment that is
markedly globalized. Kliestikova and Janoskova 2017). According to Majerova (2014) is
branding a systematic process that is able to confront a competitive advantage in a globalized
market. It is social media that creates a space where businesses can build their brand.
Kliestikova et al. (2019) point out that the basic platform of the optimally built and managed
value of the brand is its coherent identity. Social media marketing is a process that allows
individuals to promote their products or services and websites through online social channels
and social media that may not be available to the public through traditional advertising
channels. Social media marketing also involves listening to the public and establishing public
relations (Weinberg 2009).
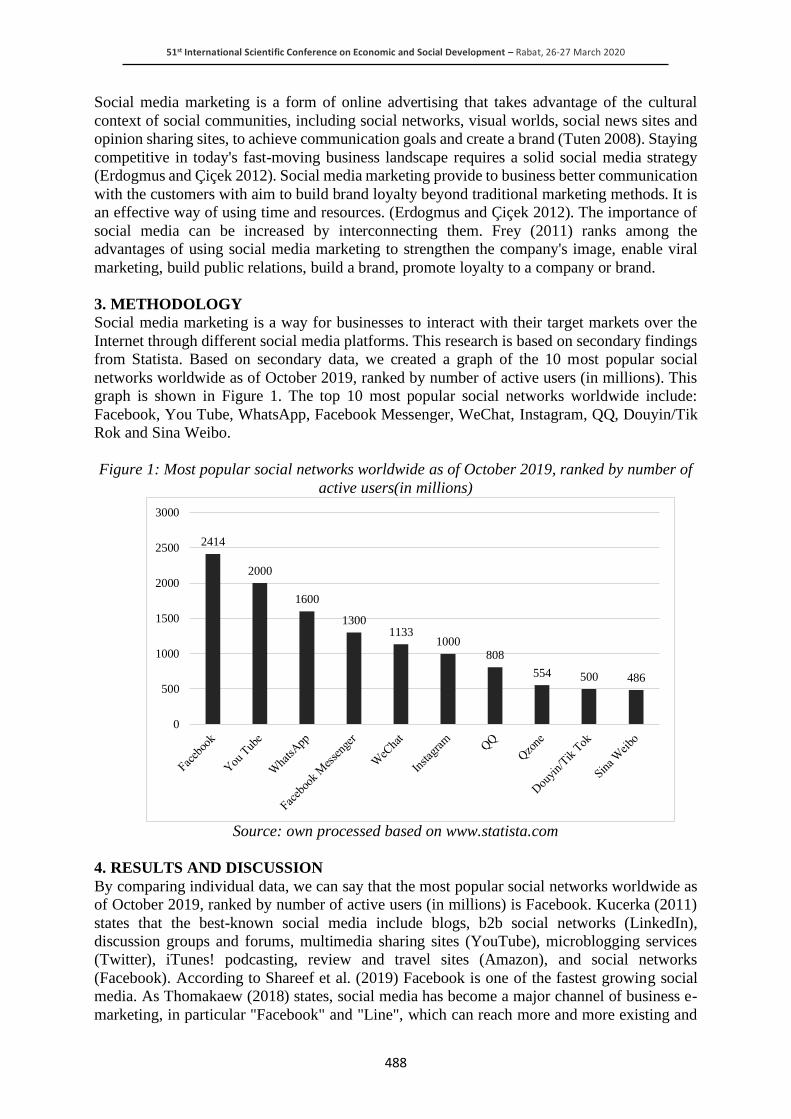
51st International Scientific Conference on Economic and Social Development – Rabat, 26-27 March 2020
488
Social media marketing is a form of online advertising that takes advantage of the cultural
context of social communities, including social networks, visual worlds, social news sites and
opinion sharing sites, to achieve communication goals and create a brand (Tuten 2008). Staying
competitive in today's fast-moving business landscape requires a solid social media strategy
(Erdogmus and Çiçek 2012). Social media marketing provide to business better communication
with the customers with aim to build brand loyalty beyond traditional marketing methods. It is
an effective way of using time and resources. (Erdogmus and Çiçek 2012). The importance of
social media can be increased by interconnecting them. Frey (2011) ranks among the
advantages of using social media marketing to strengthen the company's image, enable viral
marketing, build public relations, build a brand, promote loyalty to a company or brand.
3. METHODOLOGY
Social media marketing is a way for businesses to interact with their target markets over the
Internet through different social media platforms. This research is based on secondary findings
from Statista. Based on secondary data, we created a graph of the 10 most popular social
networks worldwide as of October 2019, ranked by number of active users (in millions). This
graph is shown in Figure 1. The top 10 most popular social networks worldwide include:
Facebook, You Tube, WhatsApp, Facebook Messenger, WeChat, Instagram, QQ, Douyin/Tik
Rok and Sina Weibo.
Figure 1: Most popular social networks worldwide as of October 2019, ranked by number of
active users(in millions)
Source: own processed based on www.statista.com
4. RESULTS AND DISCUSSION
By comparing individual data, we can say that the most popular social networks worldwide as
of October 2019, ranked by number of active users (in millions) is Facebook. Kucerka (2011)
states that the best-known social media include blogs, b2b social networks (LinkedIn),
discussion groups and forums, multimedia sharing sites (YouTube), microblogging services
(Twitter), iTunes! podcasting, review and travel sites (Amazon), and social networks
(Facebook). According to Shareef et al. (2019) Facebook is one of the fastest growing social
media. As Thomakaew (2018) states, social media has become a major channel of business e-
marketing, in particular "Facebook" and "Line", which can reach more and more existing and
2414
2000
1600
13001133
1000808
554 500 486
0
500
1000
1500
2000
2500
3000
51st International Scientific Conference on Economic and Social Development – Rabat, 26-27 March 2020
489
new customers. It also states that social media helps reduce advertising and public relations
costs. In addition, customers can also perceive information about the goods and services they
purchase on demand. Social media has become an important factor for entrepreneurs in the
business sector, as the use of more social media makes businesses more competitive. In
marketing, social networks can be used primarily to building PR and reputation, creating a
community of your supporters, active communication with supporters, content publishing
space, ad campaigns with precise targeting. Through social networks it is possible to
communicate current events - interesting information from internal events in society, important
information - news, announcements, user guides, reviews, and more, surveys and competitions
- consumer surveys and competitions, interesting photos - photos from presentations,
exhibitions, company events and so on video content - information, instructional and reportage
videos. Social and digital media may not have just a positive impact on business. Research
shows that the negative effects of these media also appear. Fielden et al. (2018) have focused
in their research on the production and proliferation of fake social media news. They have
identified and provided empirical evidence on how users validate the information they
encounter on digital content platforms. Ralston et al. (2018) focused on the role of digital media
platforms in the production and consumption of factually dubious content. They performed
analyses and made estimates regarding real versus fake news content type distribution on
Facebook and prevalence of manipulation tactics on social media. Among the advantages of
social media marketing is that it is a two-way communication of the company, thanks to which
they receive feedback, comments and suggestions for improvement from customers. According
to Sajid (2016) there are two advantages of social media that are essential to companies, they
include Cost decrease by decreasing staff time and Increase of probability of revenue creation.
He further states that social media allows companies to: share their skills and information, tap
into the wisdom of their customers and helping clients. Social media is largely used by almost
all and even the businesses despite the fact that hey have started using social media to advertise
and promote themselves. Big brands use the social media to convey their friendly customer
relationship and strong existence (Saravanakumar and SuganthaLakshmi 2012). Social Media
Marketing and more especially Social Networks are becoming increasingly important in
customers’ purchasing decisions, mainly because they maginfy word-of-mouth. They may even
become more important than advertising as a trusted source of information (Karimi and Naghibi
2015). Meanwhile, E-marketing (EM) has emerged as one of the key tools in sustaining an
company´s competitive advantage (Eid and El-Gohary 2013). Social media marketing is
important for increasing website traffic, achieving conversion goals, engaging users and
business leadership, increasing brand awareness, business growth, and community building
goals. Achieving marketing goals on social networks is easy because a billion people are
currently using social media platforms. So it's important that businesses use social media
marketing to grow their business. Social media marketing is important for attracting regular
clients and customers. All social media platforms help to reach targeted customers. That's why
every business should uses unique social media marketing strategies. Social media marketing
is an effective way for businesses of all sizes to reach potential customers. Great social media
marketing can bring a remarkable success to business, create committed brand advocates, and
even lead to sales.
5. CONCLUSION
Social networks are a phenomenon of this time. Advertising on them is an obligation. They can
be a great communication channel for marketing activities to support business. Social media
marketing is for everyone with the right strategy. But it certainly does not need to be
overestimated. This area is constantly evolving. Therefore, it should be an important
complement to other forms of online marketing and overall marketing plan.
51st International Scientific Conference on Economic and Social Development – Rabat, 26-27 March 2020
490
Most popular social networks usually show a high number of user accounts or strong user
engagement. Social networks have a decisive significant social impact due to their constant
presence in the lives of their users. Social media is now an important part of the marketing
strategy. The benefits of using social media are so great that businesses that do not use them in
their business lose marketing opportunities that can lead to success. Social media marketing is
a key element of marketing success. Social media is constantly moving forward and evolving,
so marketers need to keep track of these developments and adapt their marketing strategies and
activitiesorem ipsum dolor sit amet, unum fabulas te pro, commune rationibus cum ex,
maiestatis percip
ACKNOWLEDGEMENT: This paper is an output of scientific project VEGA no. 1/0718/18:
The impact of psychographic aspects of pricing on the marketing strategy of companies across
products and markets.
LITERATURE:
1. Appel, G., Grewal, L., Hadi, R., Stephen, A. T. (2019). The future of social media in
marketing, Journal of the Academy of Marketing Science.
2. Carlson, A., Lee, C. C. (2015). Followership and social media marketing, Academy of
Marketing Studies Journal, 19, 80-101.
3. Domanska, A. (2018). Cooperation between knowledge-based institutions and business:
empirical studies and network theories, Forum Scientiae Oeconomia, 6 (4), 81-94.
4. Eid, R., El-Gohary, H. (2013). The impact of E-marketing use on small business enterprises'
marketing success, Service Industries Journal, 31, 31-50.
5. Çiçek, M., Erdogmus, I. (2012). The Impact of Social Media Marketing on Brand Loyalty,
Procedia - Social and Behavioral Sciences, 58, 1353-1360.
6. Fielden, A., Grupac, M., Adamko, P. (2018). How Users Validate the Information They
Encounter on Digital Content Platforms, The Production and Proliferation of Fake Social
Media News, the Likelihood of Consumer Exposure, and Online Deceptions. Geopolitics,
History, and International Relations, 10 (2), 51–57.
7. Frey, P. (2011). Marketingova komunikace nove trendy 3.0. Praha: Management Press.
8. Chlebikova, D., Misankova, M., Kramarova, K. (2015). Planning of personal development
and succession, Procedia Economics and Finance, 26, 249-253.
9. Iankova, S., Davies, L., Archer-Brown, C., Marder, B., Yau, A. (2018). A comparison of
social media marketing between B2B, B2C and mixed business models, Industrial
Marketing Management, 81, 169-179.
10. Jemala, L. (2008). Podnikatelsky manazment a marketing. Bratislava: STU.
11. Karimi, S., Nafhibi, H. (2015). Social media marketing (SSM) strategies for small to
medium enterprises (SMEs), International Journal of Sales & Marketing Management
Research and Development, 7(4), 11-20.
12. Kliestikova, J., Janoskova, K. (2017). Branding with understanding: how national profile
of consumer influences brand value perception, Marketing and management of innovatons,
3, 149-157.
13. Kliestikova, J., Durana, P., Kovacova, M. (2019). Naked Consumer's Mind Under Branded
Dress: Case Study of Slovak Republic, Central European Business Review, 8(1), 15-32.
14. Krivohlavy, J. (1995). Tajemstvi uspesneho jednani. Praha: Grada Publishing.
15. Kucerka, P. (2011). Nastroje marketingu so zameranim na socialne media, Kniznica, 12 (9),
35-37.

51st International Scientific Conference on Economic and Social Development – Rabat, 26-27 March 2020
491
16. Majerova, J. (2014). Comprehensive Proposal of Activities of Product Brand Policy in
Conditions Specific to Slovak Republic. Paper presented at the 2nd International
Conference on Economics and Social Science, Shenzhen, People's Republic of China, July
29-30, pp. 3-8.
17. Nakara, W., Benmoussa, F-Z., Jaouen, A. (2012). Entrepreneurship and social media
marketing: Evidence from French small business, International Journal of Entrepreneurship
and Small Business, 16, 386 - 405.
18. Nica, E., Taylor, L. (2017). New media technologies, digital sharing, and the neoliberal
economy, Ekonomicko-manazerske spektrum, 11(2), 103-110.
19. Ralston, S., Kliestik, T., Rowland, Z., Vrbka, J. (2018). Are Pervasive Systems of Fake
News Provision Sowing Confusion? The Role of Digital Media Platforms in the Production
and Consumption of Factually Dubious Content, Geopolitics, History, and International
Relations, 10(2), 30–36.
20. Rypakova, M., Stefanikova, L., Moravcikova, K. (2015). Suggestion of green customer
segmentation in Slovakia. Paper presented at th 4th World Conference on Business,
Economics and Management (WCBEM), Ephesus, Turkey, April 30 - May 02. Procedia
Economics and Finance: 26, 359-366.
21. Safko, L., Brake, D.K. (2009). The Social Media Bible. New Jersey: John Wiley & Sons,
Inc.
22. Sajid, S. (2016). Social Media and Its Role in Marketing. Business and Economics Journal,
7, 203.
23. Saravanakumar, M., Sugantha, L. T. (2012). Social Media Marketing. Life Science Journal,
9. 4444-4451.
24. Scott, D.M. (2010). Nove pravidla marketingu a PR. Bratislava: Eastone Books.
25. Shareef, M.A., Mukerji, B., Dwivedi, Y. K., Rana, N. P., Islam, R. (2019). Social media
marketing: Comparative effect of advertisement sources, Journal of Retailing and
Consumer Services, 46, 58-69.
26. Schivinski, B., Dabrowski, D. (2016). The effect of social media communication on
consumer perceptions of brands, Journal of Marketing Communications, 22 (2). 189-214.
27. Srpova, J., Veber, J. (2012). Podnikani male a stredni firmy. Praha: Grada Publishing.
28. Szabo, L., Jankelova, N. (2006). Faktory uspesnosti agrarnych podnikov v Slovenskej
republike. Bratislava: Ekonom.
29. Thomkaew, J., Homhual, P., Chairat, S., Khumhaeng, S. (2018). Social media with e-
marketing channels of new entrepreneurs. Paper presented at the 3rd International
Conference on Applied Science and Technology, Georgetown, Penang, Malaysia, April 10-
12, pp.020147-1-4.
30. Tracy L. T. (2008). Advertising 2.0. – Social Media Marketing in a web 2.0. World.
Westport: Greenwood Publishing Group, Inc.
31. Valaskova, K., Bartosova, V., Kubala, P. (2019). Behavioral aspects of the financial
decision-making, Organizacija, 52(1), 22-32.
32. Veber, J. (2009). Management. Základy, moderní manažerské přístupy, výkonnost a
prosperita. Praha: Management Press.
33. Vries, L., Gensler, S., Leeflang, P. (2012). Popularity of Brand Posts on Brand Fan Pages:
An Investigation of the Effects of Social Media Marketing, Journal of Interactive
Marketing, 26, 83–91.
34. Weinberg, T. (2009). The new community rules: marketing on the social web. Sebastopol,
CA: O´Reilly.

51st International Scientific Conference on Economic and Social Development – Rabat, 26-27 March 2020
492
DATING THE GROWTH CYCLE OF MOROCCO AND ITS
SYNCHRONIZATION WITH THE CYCLES OF THE MAIN TRADING
PARTNERS
Soussi Noufail Outmane
Professor at the Faculty of Economics of Salé,
University Mohammed V, Rabat, Morocco
Abdelghani Bensaid
Doctoral student at the Faculty of Economics Agdal,
University Mohammed V, Rabat, Morocco
ABSTRACT
This work analyses the characteristics of the Moroccan growth cycle and the degree of
synchronization of it with those of France, Spain and the European Union. Two models are
used for dating series: a model based on parametric methods, and another of non-parametric
type. The results identify that in the short and medium term, three cycles illustrate the impact
of cyclical factors on national growth. The study of synchronization with partner countries
shows that the deadlines differ from one period to another, it is stronger during the recent
periods of the study. In addition, over the period studied, the results also indicate that after
2011 the Moroccan economic cycle registered a greater agreement with the growth cycle of the
Spanish economy than with that of the French economy.
Keywords: Dating, Business cycles, Synchronization
1. INTRODUCTION
An economic cycle corresponds to a well-defined period in which we can observe the
succession of several phases linked to the economic activity of a country. These phases are at
the origin of any explanation concerning the evolution of the state of the conjuncture and the
determination of the periodicity of this cycle in time. The various attempts to explain and model
this concept are not new. The first checks date back to David Ricardo in the 19th century when
he analysed the periodic return of the trade and agricultural crises in European countries. Other
factors impacting the growth cycle were born following the industrial, monetary, financial and
technological transformation that the world knew during this century. The Moroccan economy
like that of other countries seems to be a cyclical economy. This result was prescribed by a
study conducted in 2014 by the High Commission for Planning of Morocco, where the authors
showed the characteristics of the Moroccan economic cycle during the period 1998-2012 and
the dating of it. This exercise exclusively concerned the GDP aggregate (in addition to four
other aggregates) to describe the cycle. This intuitive choice seems interesting because the GDP
aggregates all of the wealth created, and it reflects the duality of its economy. Because of the
different endogenous and exogenous crises that have affected developed and developing
economies, this work focuses on the study of economic cycles in four series, that of France,
Spain and the European Union and more precisely, the dating of the fluctuations and the
movement of these cycles with that of Morocco. In addition to the neighbourhood relationship
between Morocco and the European Union. And despite the ongoing diversification of
Morocco's trading partners, the European Union remains the Kingdom's first customer and
supplier, the main source of FDI and the first source of MRE transfers and tourist receipts.

51st International Scientific Conference on Economic and Social Development – Rabat, 26-27 March 2020
493
2. BUSINESS CYCLES: CONCEPT AND THEORY
2.1. Definition of the business cycle
The literature on economic cycles distinguishes two types of cycles, the business cycle, which
traces changes in the level of activity in the economy, generally measured through the GDP
series, and the growth cycle. The latter reproduces the gap between the GDP series and its
underlying long-term trend; turning points (peaks and troughs in the cycle) mark the
acceleration and slowing down of growth. The present study is concerned with this second type
of economic cycle. The aim is to decompose the GDP series into two components: a structural,
non-stationary component (the long-term trend) and another, a stationary cyclical (short- to
medium-term growth cycle). This amounts to expressing the series 𝑌𝑡,, corrected for seasonal
variations, in the following form:
𝒀𝒕 = 𝑻𝒕 + 𝑪𝒕 + 𝜺𝒕
Where 𝑻𝒕 is the trend, 𝑪𝒕 is the growth cycle and 𝜺𝒕 is a random component.
Technically, the underlying trend can be seen as potential GDP. This is obtained when the
national economy experiences full employment. Thus, the economy expands when real GDP
exceeds the underlying trend. In this case, the peak of this cycle corresponds to a situation where
the GDP is above its trend level (the output gap or the output gap reaches its maximum) while
the trough represents a situation where the GDP is at - below (the output gap then reaches its
minimum level), and this is the case where the economy is in recession. The turning points in
the economy are called peaks and troughs. They indicate the highest point respectively the
lowest that the economy can reach in the current economic situation (Fregert and Jonung, 2010).
However, there are several methods of trend-cycle decomposition (statistical tools, filters,
production functions).
2.2. Theoretical approaches to the business cycle
From a theoretical point of view, the first attempt to describe market fluctuations was developed
by Samuelson (1939). His model called multiplier-accelerator is based on rigorous
mathematical approaches. It shows that changes in purchasing power inevitably lead to cyclical
fluctuations. Second, Keynes (1936) emphasized the importance of trying to reach full
employment. In this context, he asserts that there is no guarantee that the goods produced will
be requested by consumers. Unemployment can therefore be a natural cause in the event of a
default in demand, particularly during an economic downturn. Modern business cycle theory is
the basis for two basic assumptions. The first assumes that there are predetermined (exogenous)
factors in the economic cycle responsible for any change in GDP and slightly impact both the
other economic indicators and the (long) assumed duration of the economic cycles. In this case,
no radical change between the following quarters can be observed. The second approach
assumes that there are also random factors that can cause unexpected events that cause the
economic cycle to change course quickly. In this context, Frisch (1933) developed a new model
called propagation-impulse. This model predicts that the economy is constantly exposed to
random disturbances called pulses1. The return to balance and the adaptation of the economy to
these impulses is generally long. Researchers such as (Fregert and Jonung, 2010) estimate that
the duration of cyclical fluctuations is normally between three and eight years. Other
researchers like Juglar (1862), Kuznet (1961) consider a longer cyclical period. These cycles
vary between seven and eleven years.
1 They describe the random events in the economic cycle.

51st International Scientific Conference on Economic and Social Development – Rabat, 26-27 March 2020
494
3. CONCEPT OF DATE OF BUSINESS CYCLES
3.1. Dating growth cycles
Two broad categories of approaches are used to date the economic growth cycle from a time
series, that is, to specify the moments of the peaks and troughs that represent turning points for
each cycle.
1. Parametric type methods, based on non-linear time series models. The most famous model
is that of Markov Switching Models which adapt to the measurement of the characteristics
of economic growth cycles.
2. Non-parametric models which rely on shape recognition algorithms to identify local minima
and maxima of the series in question.
The best known of the non-parametric models is that of Bry and Boschan, implemented in 1971
as a continuation of the work of the NBER. This algorithm, extended to quarterly data by
Harding and Pagan, makes it possible to detect potential peaks and troughs in a quarterly series
over a given interval. Thus, a quarter is identified as a peak (trough) if it is a maximum
(minimum) during the two quarters preceding and following the quarter considered, thus the
phases last at least two quarters and five quarters for the cycles. Easier to implement than
parametric methods, it is the Bry and Boschan model that was adopted by this study.
3.2. Method for dating turning points
The first step concerns the decomposition of the GDP series (chained prices) into two
components, trend and cycle, using the Hodrick-Prescott (HP) filter. Subsequently, the BBQ
method (developed by Bry and Boschan) is applied to the cyclical component (the difference
between the original series and its trend), in order to detect the turning points of the economic
growth cycle and identify the recovery and slowdown phases. For Harding and Pagan (2002),
the BBQ approach is the most reliable for good dating of turning points, meeting the following
two conditions:
• A peak must be followed by a trough and vice versa.
• A phase must last at least two quarters while a complete cycle must last at least five quarters.
For Harding and Pagan, and in quarterly data, a value (𝑌𝑡) is considered to be peak if { 𝑦𝑡 >𝑦𝑡−1 , 𝑦𝑡 > 𝑦𝑡−2 , 𝑦𝑦𝑡 > 𝑦𝑡+1 , 𝑦𝑡 > 𝑦𝑡+2 } whereas it is considered as hollow if { 𝑦𝑡 <𝑦𝑡−1 , 𝑦𝑡 < 𝑦𝑡−2 , 𝑦𝑦𝑡 < 𝑦𝑡+1 , 𝑦𝑡 < 𝑦𝑡+2 }.
3.3. Harding And Pagan Concordance Index
Harding and Pagan proposed an index which measures the degree of agreement between two
cycles (x and y), by calculating the average of the periods during which the two cycles are
simultaneously in the same state of recovery or deceleration.
This index is written as follows:
𝐼𝐶𝑥𝑦 =1
𝑇∑[𝑆𝑥,𝑡𝑆𝑦,𝑡 + (1 − 𝑆𝑥,𝑡)(1 − 𝑆𝑦,𝑡)]
𝑇
𝑡=1
we notice :
• 𝐼𝐶𝑥𝑦: Index of concordance between the economic growth cycles of country x and country
y.
• 𝑇: The number of observations.
• 𝑆𝑥,𝑡: State of the cycle of country 𝑥 at the time "t" / 𝑆𝑥,𝑡 = 1 in the event of recovery, 𝑆𝑥,𝑡 =
0 in the event of a slowdown.
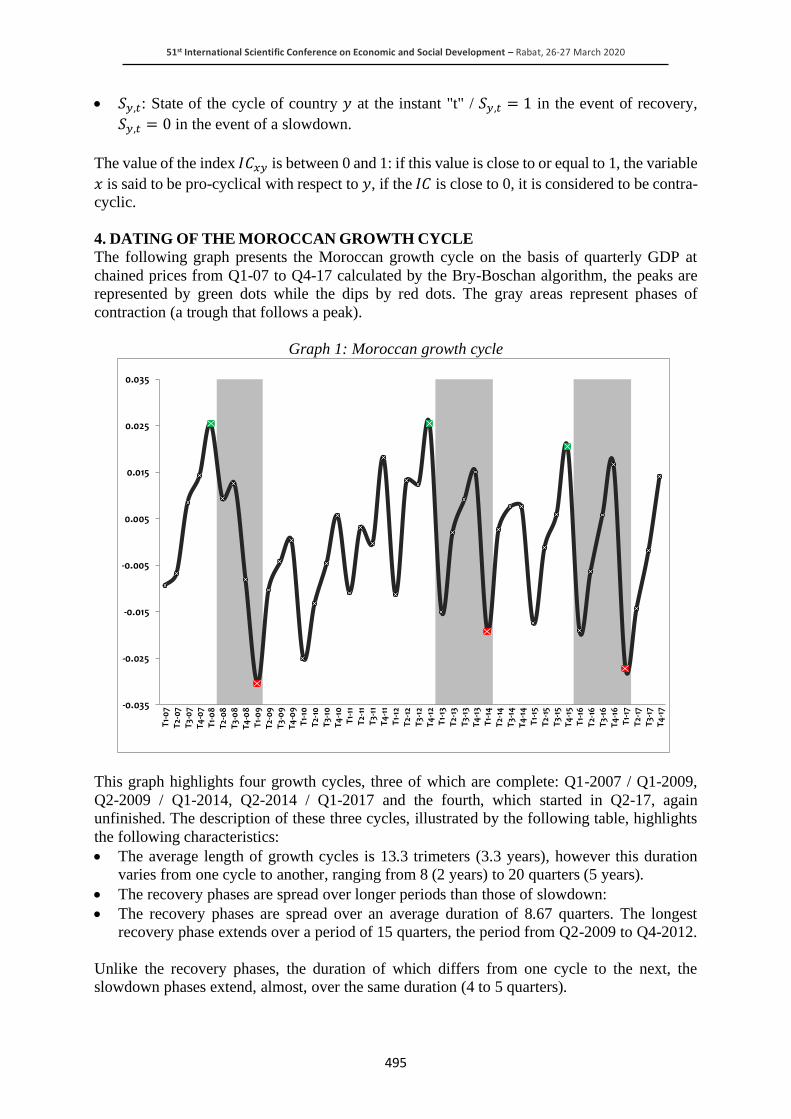
51st International Scientific Conference on Economic and Social Development – Rabat, 26-27 March 2020
495
• 𝑆𝑦,𝑡: State of the cycle of country 𝑦 at the instant "t" / 𝑆𝑦,𝑡 = 1 in the event of recovery,
𝑆𝑦,𝑡 = 0 in the event of a slowdown.
The value of the index 𝐼𝐶𝑥𝑦 is between 0 and 1: if this value is close to or equal to 1, the variable
𝑥 is said to be pro-cyclical with respect to 𝑦, if the 𝐼𝐶 is close to 0, it is considered to be contra-
cyclic.
4. DATING OF THE MOROCCAN GROWTH CYCLE
The following graph presents the Moroccan growth cycle on the basis of quarterly GDP at
chained prices from Q1-07 to Q4-17 calculated by the Bry-Boschan algorithm, the peaks are
represented by green dots while the dips by red dots. The gray areas represent phases of
contraction (a trough that follows a peak).
Graph 1: Moroccan growth cycle
This graph highlights four growth cycles, three of which are complete: Q1-2007 / Q1-2009,
Q2-2009 / Q1-2014, Q2-2014 / Q1-2017 and the fourth, which started in Q2-17, again
unfinished. The description of these three cycles, illustrated by the following table, highlights
the following characteristics:
• The average length of growth cycles is 13.3 trimeters (3.3 years), however this duration
varies from one cycle to another, ranging from 8 (2 years) to 20 quarters (5 years).
• The recovery phases are spread over longer periods than those of slowdown:
• The recovery phases are spread over an average duration of 8.67 quarters. The longest
recovery phase extends over a period of 15 quarters, the period from Q2-2009 to Q4-2012.
Unlike the recovery phases, the duration of which differs from one cycle to the next, the
slowdown phases extend, almost, over the same duration (4 to 5 quarters).
-0.035
-0.025
-0.015
-0.005
0.005
0.015
0.025
0.035
T1-07
T2-07
T3-07
T4-07
T1-08
T2-08
T3-08
T4-08
T1-09
T2-09
T3-09
T4-09
T1-10
T2-10
T3-10
T4-10
T1-11
T2-11
T3-11
T4-11
T1-12
T2-12
T3-12
T4-12
T1-13
T2-13
T3-13
T4-13
T1-14
T2-14
T3-14
T4-14
T1-15
T2-15
T3-15
T4-15
T1-16
T2-16
T3-16
T4-16
T1-17
T2-17
T3-17
T4-17
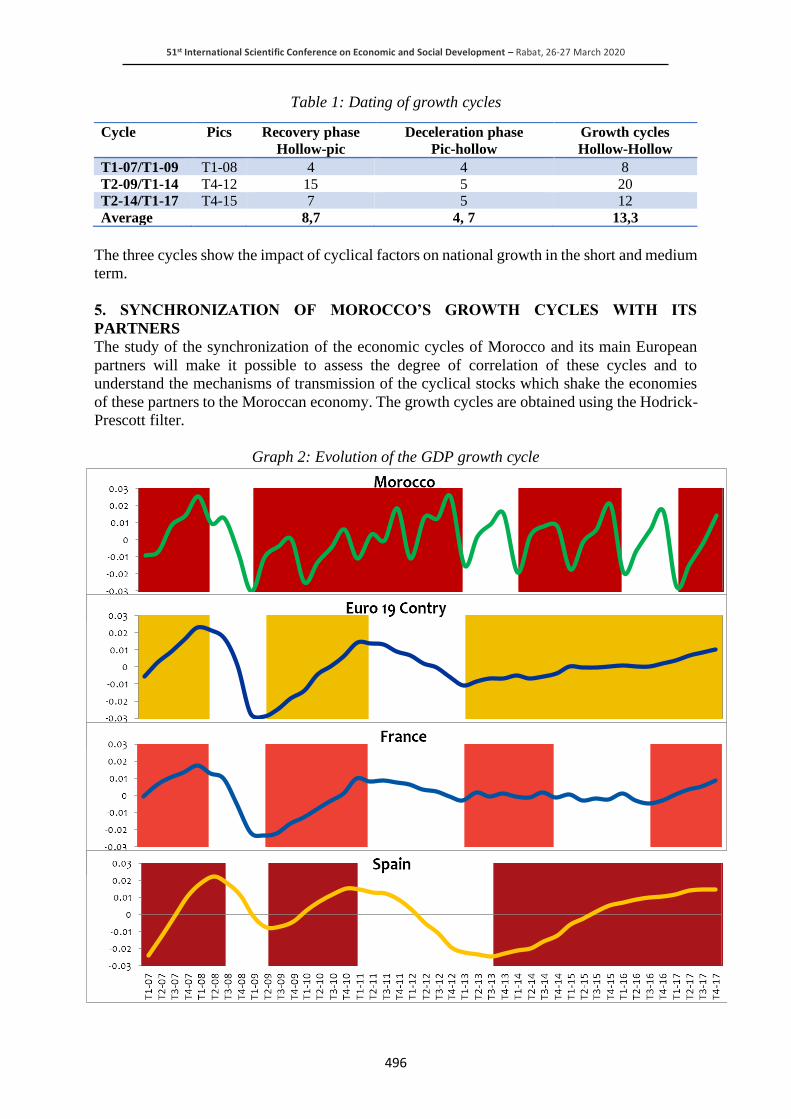
51st International Scientific Conference on Economic and Social Development – Rabat, 26-27 March 2020
496
Table 1: Dating of growth cycles
The three cycles show the impact of cyclical factors on national growth in the short and medium
term.
5. SYNCHRONIZATION OF MOROCCO’S GROWTH CYCLES WITH ITS
PARTNERS
The study of the synchronization of the economic cycles of Morocco and its main European
partners will make it possible to assess the degree of correlation of these cycles and to
understand the mechanisms of transmission of the cyclical stocks which shake the economies
of these partners to the Moroccan economy. The growth cycles are obtained using the Hodrick-
Prescott filter.
Graph 2: Evolution of the GDP growth cycle
Cycle Pics Recovery phase
Hollow-pic
Deceleration phase
Pic-hollow
Growth cycles
Hollow-Hollow
T1-07/T1-09 T1-08 4 4 8
T2-09/T1-14 T4-12 15 5 20 T2-14/T1-17 T4-15 7 5 12
Average
8,7 4, 7 13,3

51st International Scientific Conference on Economic and Social Development – Rabat, 26-27 March 2020
497
The economic growth cycle in Morocco shows, compared to its main partners, the following
characteristics:
• Greater volatility of the cycle and its phases;
• A correspondence with the phases of the growth cycle of the European partners over two
periods (T1-07 / T1-11), (T2-14 / T4-15) and two decoupling periods of (T2-11 / T1-14)
and (T1-16 / T1-17).
The findings from the previous graph are corroborated by the concordance index which
measures the degree of correspondence between Morocco’s growth cycles with its main
European partners and between the latter’s economic cycles. The following three tables
represent the value of this index for the entire period 2007-2017 and for two sub-periods 2007-
2010 and 2011-2017.
Table 2: Degree of synchronization of economic cycles (Harding and Pagan index of
concordance) Partners periods Morocco France Spain
France
2007-2017 0,58 - -
2007-2010 0,94 - -
2011-2017 0,37 - -
Spain
2007-2017 0,60 0,79 -
2007-2010 0,88 0,94 -
2011-2017 0,44 0,70 -
E.U
2007-2017 0,60 0,88 0,91
2007-2010 0,94 1.00 0,94
2011-2017 0,41 0,81 0,89
For the period 2007-2010, we see that there was an average degree of agreement of around 60%
between the growth cycle of the Moroccan economy and those of the economic growth of the
EU, France and Spain. This synchronization, stronger during the 2007-2010 period (88% to
94%), fell to a remarkably low level (37% to 44%) during the 2011-2017 period. The index also
shows that, during the period 2011-2017, the Moroccan economic cycle registers a more
important agreement with the growth cycle of the Spanish economy than that of the French
economy (44% against 37%), unlike the 2007-2010 period when this agreement was greater
with the cycle of the French economy than with the cycle of the Spanish economy (94% against
88%).
6. CONCLUSION
The previous analysis shows that the Moroccan growth cycle has shown, since 2011, a less
pronounced synchronization with that of its main European partners: 0.37 to 0.44 during the
period 2011-2017, against 0.88 to 0.94 over the 2007-2010 period. This dropout is attributed,
essentially, to the resilience of the Moroccan economy in the face of the financial and economic
crisis that struck the Kingdom’s first economic partner in 2008 and had a heavy impact on its
economy. The resilience factors of the Moroccan economy are mainly the following:
• Increased product diversification which has enabled the emergence of new high-growth and
technology-intensive professions, such as the automobile, whose share in exports doubled
between 2007 and 2017, from 12 to 24% . This productive dynamic was accompanied by a
diversification of business partners. The EU remains, of course, the main destination for
Moroccan exports; however, its share continues to decline in favor of new markets. For
example, exports to Africa doubled between 2007 and 2017 (from 5% to 10%).

51st International Scientific Conference on Economic and Social Development – Rabat, 26-27 March 2020
498
• The conduct of a counter-cyclical macroeconomic policy, supporting domestic demand, has
helped to mitigate the effects of the financial crisis. Thus, the Moroccan economy registered
an upward growth trend which reached 4% during the 2008-2016 period, a growth level
exceeding that of the main competitors in the MENA region.
LITERATURE:
1. AIMAR, F. BISMANS et C. DIEBOLT (2010), Le cycle économique : une synthèse,
Association Française de Cliométrie, Working Paper, no 4.
2. BANQUE MONDIALE (2019), Statistic Division, WDI Database.
3. BAXTER, M. et R.G. K ING (1999), Measuring Business Cycles: Approximate Band-Pass
Filter For Economic Time Series, The Review of Economics and Statistics, 83(4) : 575-
593.
4. BENTOGLIO, G., J. F AYOLLE et M. L EMOINE (2002), La croissance européenne
perturbée par un cycle de courte période, Économie et Statistique, 359-360 ; 83-100.
5. BERNANKE, B.S. (2004), The Great Moderation, Remarks at the Meetings of the Eastern
Economic Association, Washington, DC, February 20, 2004.
6. BEVERIDGE, S. et C. R. N ELSON (1981), A New Approach to the Decomposition of
Economic Time Series into Permanent and Transitory Components, Journal of Monetary
Economics, 7(2) : 151-174.
7. BOURBONNAIS, R. (2009), Économétrie, Dunod, 7 e édition.
8. BOUTHEVILLAIN, C. (1996), Les cycles des grands pays industrialisés. Des croissances
plus proches mais des zones déphasées, Économie et Statistique, 298(août) : 71-91.
9. BRY, G. et C. BOSHAN (1971), Cyclical Analysis of Times Series: Selected Procedure
and Computer Programs, Cambridge MA: NBER.
10. BURNS, A. F. et W. C. M ITCHELL (1946), Measuring Business Cycle, New York, NBER.
11. CETTE, G. (1997), Écart de positionnement dans le cycle économique : quelques
évaluations pour l’économie française, Bulletin de la Banque de France, 38(février) :
91-104.
12. CHRISTIANO, L.J. et T. J. FITZGERALD (2003), The Pass Band Filter, International
Economic Review, 44(2) : 435-465.
13. DOKO, F. et S. SANOU (2004), Modèles MS-VAR et analyse du cycle des prix des matières
premières : cas du cacao, Mémoire de groupe de travail, République de Côte d’Ivoire.
14. FATHI, E. (2009), Décrire le cycle économique en Tunisie, Économie et Prévision, (3) :
75-92.
15. FERRARA, L. (2009), Caractérisation et datation des cycles économiques en zone euro,
Revue Économique, 60(3) : 703-712.
16. HODRICK, R. et E.C. PRESCOTT (1997), Postwar U.S. Business Cycles: An Empirical
Investigation, Journal of Money, Credit, and Banking, 26 : 1-16.
17. NDONGO, O. et Y. FRANCIS (2006), Datation du cycle du PIB camerounais entre 1960
et 2003, MPRA.
18. OKUN, A.M. (1962), Potential GNP: Its Measurement and Significance, in Proceedings
Business and Economic Statistics Section of the American Statistical Association, p. 89-
104.
51st International Scientific Conference on Economic and Social Development – Rabat, 26-27 March 2020
499
RISK IN SOCIAL PRACTICES: «NORMALIZATION» AND
«HABITUALIZATION»
Svetlana Ilynykh
Novosibirsk state University of Economics and Management, Russia
Svetlana Rovbel
Novosibirsk State University of Economics and Management, Russia
Elena Naumova
Novosibirsk State University of Economics and Management, Russia
Evgeniya Komf
Novosibirsk State University of Economics and Management, Russia
ABSTRACT
In the article, the author considers scientific approaches to understanding risk. Risk is an
uncertainty that is rooted in the very structure of the world's existence. Risk becomes an
inevitability. Scientists distinguish three approaches to the nature of risk: objective, subjective,
and objective-subjective. According to the concept of objective risk, the uncertainty and
instability inherent in this world constantly generate risk and are the natural cause of risk. The
concept of subjective risk relates risk exclusively to the decision-maker, their values, and their
physiological and psychological capabilities. Risk can only occur where there is a specific
action or activity of a person who can predict future situations. In the concept of objective-
subjective risk, the latter is considered as a combined phenomenon. The author of the article
develops the idea of the objective-subjective nature of risk, according to which the risk is not
always manageable and «normalized». «Normalization» of risk has the property of constancy.
Because of this, often a person can not quite adequately assess how risky a particular life
strategy is. The risk becomes habitualized. The author provides this idea with the results of an
empirical study on the example of consumer practices and health-saving practices. The risk of
consumer practices is determined by factors such as gender, age, education, status, and income.
These factors may affect different consumer behavior patterns in different ways. It turned out
that the least risky group is the middle – income group. When implementing consumer behavior,
they are guided by their experience, carefully approach both the choice of goods and services,
and the assessment of their quality. Affluent buyers trust manufacturers, retailers, and the
primary group's opinion. In traditional consumer practices, lower-income individuals
demonstrate higher risk strategies. In contrast, high-income individuals are more in risk with
alternative consumer practices. The practice of health care in the event of onset of symptoms
were both out risk assessment and habitualization.
Keywords: risk, uncertainty, risky strategies, consumer behavior, health saving practices,
income
1. INTRODUCTION
Risk research has become quite relevant in many scientific sphere at the present time. This is
due to the fact that structural and functional changes in Russian society increase the dominance
of social risks. As a result, there is a need for complex interdisciplinary researches of this
51st International Scientific Conference on Economic and Social Development – Rabat, 26-27 March 2020
500
phenomenon. Increasing scientific interest in the study of risk as a special branch of social
knowledge is associated with the processes of social and political modernization. Modern
society is rapidly transforming. Social practices can’t successfully develop into legitimate
institutions. In this regard, there is a need to manage social risks. In this sense, sociology allows
us to say that risk management as an activity has its own methodological foundations and it’s
own conceptual pragmatics. It seems to us that the main task is to systematize and develop an
integrated approach to determining social risks that affect the life of an individual, the activities
of an organization, and the functioning of society. Here is important to pay attention to the
problems of variability and to evaluate possible strategies for social action in the process of
managing social risks.
2. CHAPTER TWO
Regarding the theoretical justification of the problem, it’s worth noting that in General, risk as
a subject of research of scientists appeared relatively recently. The Western founders of the risk
theory should include А.Giddens (Giddens 2002), N. Luhmann (Luhmann 1991), M.Douglas,
A.Wildavsky (Douglas, Wildavsky 1982), D. P. Piscione (Piscione 2014), N. Pidgeon, R. E.
Kasperson and P. Slovik (Pidgeon, Kasperson, Slovik 2003), A. Chavoshian and K. Takeuchi
(Chavoshian, Takeuchi 2013), R. W. Perry and E. Quarantelli (Perry, Quarantelli 2005) etc.
Douglas Hubbard (Hubbard 2009) suggests considering the distinction between risk and
uncertainty. According to G. Bohmann, "the concept of risk has recently made a dizzying career
in the field of social theory" (Behmann 2010: 27). This is partly due to the fact that the entire
world community is experiencing a huge destabilization of social systems, whether it’s the
economy, the social sphere, health care or education. The fact that interest in risk is increasing
in the scientific community may indicate the processes of changing public consciousness.
Scientists are interested not only in the nature of the risk, its typology, but also in how the
potential for risks can be eliminated. In sociology, the research of risk is of interest, since it’s
necessary to study not just uncertainty, but uncertainty, which is unavoidable as an attribute
element of natural and social reality. This means that risk as a derivative of uncertainty is
strengthened in the existence of the world. Risk becomes an inevitability. Risk is present as a
synonym for being. The ability to manage this uncertainty and inevitability, as well as the
amount of this uncertainty, is dependent on the decisions of the person, on the moral norms
adopted when achieving the goals. In this case, we can agree with Y. A. Zubok that " risk is a
category that reflects, first, the characteristics of the living conditions of social actors in a state
of transition from a situation of uncertainty to a situation of certainty (or Vice versa); secondly,
the very activity in these conditions, when there is a reasonable choice when assessing the
probability of achieving the expected result, failure or deviation from the goal, taking into
account the existing moral and ethical standards». U. Beck (Beck 2007, 2010, 2015) and K. J.
Arrow (Arrow 1987, 2011) defined risk through a situation of uncertainty resulting from either
a lack or an overabundance of information. According to U. Beck (Beck 2007, 2010, 2015),
society, on the one hand, is highly developed in scientific and technical and economic aspects.
But on the other hand, individuals are almost completely left to themselves in the matter of
overcoming fears and insecurities generated by a variety of risk factors. The researched
problems in the aspect of sociology require a brief analysis of the nature of risk. V. I. Zubkov
identifies three main approaches to determining the nature of risk: objective, subjective, and
objective-subjective (Zubkov 2003:68-69). According to the concept of objective risk, the
uncertainty and instability inherent in this world constantly generate risk and are the natural
(genetic) cause of risk. The concept of subjective risk relates risk exclusively to the decision-
maker, their values, and their physiological and psychological capabilities. Risk can only occur
where there is a specific action or activity of a person who can predict future situations. In the
concept of objective-subjective risk, the latter is considered as a combined phenomenon.

51st International Scientific Conference on Economic and Social Development – Rabat, 26-27 March 2020
501
According to N. Luhmann (Luhmann 1991), risk is subjective, since it’s always associated with
the choice of certain alternatives and the calculation of the probability of their result. At the
same time, the amount of risk is objective, since it is a form of qualitative and quantitative
expression of real uncertainty as an essential characteristic of the world around us and its
elements. Thus, speaking about the nature of risk, we can assume that it has an objective-
subjective nature. This means that, on the one hand, risks can be "transparent for observation".
But, on the other hand, they can’t be completely controlled and controlled, since the subjective
factor is included. As a result, we can agree with the opinion of K. Lau that "behind the risk
there are always previously unknown and unrecoverable completely complex structures of
reality" (Ustyantsev 2006: 35). So, from the point of view of sociology, risk, due to it’s
objective-subjective nature, isn’t always manageable. When studying the problem of risk, it’s
necessary to pay attention to such a factor as" normalization " of risk. This is about changing
the perception of risk. It becomes, though still a complex phenomenon, but at the same time
commonplace. The line between crisis and everyday, normal life dissolves. There is a
"normalization" of risk. From this point of view," normalization "of risk is essentially
equivalent to"normalization". One of the remarkable statements of P. Sztompka (Sztompka
2000) is that when we are talking about an economic, political, environmental, social crisis, we
are increasingly referring to a durable, long-term, permanent, chronic situation. Increasingly,
the crisis is seen as something normal, typical, and we would even be surprised if such a crisis
suddenly disappeared. Zygmunt Bauman (Bauman 2001) associates "normalization" of risk
with the fate of a person. In his opinion, unreliability is a widespread feature of modern
conditions. It’s a cumulative experience of uncertainty about a person's position, rights, and
availability of means of livelihood, uncertainty about continuity and future stability, and
insecurity for a person's physical body, personality, and their continuities – property, social
environment, and community. The scientist develops the idea that nowadays riskiness is not a
matter of choice, because it is the very fate. Risk acquires a state of "normalization" due to the
fact that it has become permanent in modern society. Immanuel Wallerstein (Wallerstein 2001)
convincingly points out that we live in a universe of uncertainty, the only greatest advantage of
which is the constancy of this uncertainty. This constancy arises from the fact that risk turns
out to be the reverse side, the shadow of any action, that is, an element of human existence
itself. The concept of "habitus" introduced by P. Bourdieu (Bourdieu 1998), defined as a set of
social relations, a system of individual attitudes, and orientations, is essential for understanding
the "normalization" of risk. Habitus allows explaining the riskological behavior of an
individual. The process of social construction of reality according to P. Berger and T. Lukman
(Berger Luckmann 1995) is also important, including in relation to risk-taking behavior. It’s
worth noting that in order to reduce the" normalization " of risk, it’s important to form a strategy
of goal-oriented behavior (Weber 1990), according to which the meaningfulness of social action
is at the forefront. This is a kind of activist model of social action that excludes simple
replication of social norms. Weber's theory of social action encourages us to think about what
we prefer in a particular situation, in relationships with people, in life, including in a situation
of risk. Let's sum up the interim results. In sociology, risk is understood as uncertainty that has
an objective-subjective nature. We have little control over risk, so it’s difficult to manage it.
But at the same time, it should be noted that in society there is a "normalization" of risk, which
has the property of constancy. Because of this, often a person can’t quite adequately assess how
risky a particular life strategy is. We will illustrate this postulate with empirical examples.
3. CHAPTER THREE
In sociology, the risks of consumer behavior are actively investigated. Here is an example of a
consumer study presented by O. V. Tkachenko (Tkachenko 2017). The authors presents the
results of a sociological study "Consumer behavior of the population of Volgograd in the
51st International Scientific Conference on Economic and Social Development – Rabat, 26-27 March 2020
502
situation of choosing and purchasing pharmaceutical products and services". The sample is
multi-stage: zoned, random mechanical, quota, statistical error doesn’t exceed 4.1% (N=614).
The authors believes that 89.1% of consumers constantly face current and potential risks. At
the same time, there are three types of consumer positions in relation to danger and risk. The
first position is the lack of understanding of the potential danger and negative consequences of
their actions, which lead to the loss of human potential components. It’s detected by 8.2% of
respondents. The second position is expressed in the recognition of certain risks by consumers
and in an active position only if a large amount of money is lost. 47.9% of respondents were
identified here. The third position is typical for 43.8% of consumers who understand the
potential danger, are concerned about their well-being, have a negative experience of risk
situations, don’t want to risk their physical condition and financial well-being, and are guided
by an active consumer position. As you can see, about 90% assess their life in the context of
emerging risks. This confirms the idea of persistent risk. 8.2% and 47.9% of respondents can
be attributed to those for whom risks have become a “normal” state. Either they are not at all
concerned about the risks, or they experience inconvenience only financially. Although 43.8
respondents are more proactive, they still understand the potential danger of risks. Implicit
"normalization" of risks, one way or another, takes place. Many factors influence the risky
model of consumer behavior: gender, age, education, status, income. Without considering all
the factors, we dwell only on a few. As for age, O.V. Tkachenko associates risks in consumer
behavior with long distribution conditions, lack of commodity consumption, which affected the
desire of Russians to satisfy only basic needs. The lack of skills of judicious assessment and
decision making in consumer choice is manifested in the inability of a number of categories of
the population to navigate in the relative abundance of goods. The connection between risky
consumer behavior and the respondent's income is also interesting. It turned out that the least
risky group is the middle – income group. When implementing consumer behavior, they are
guided by their experience, carefully approach both the choice of goods and services, and the
assessment of their quality. Wealthy buyers trust manufacturers, distribution networks, and
primary group opinion. Low-income buyers display the “high acceptable risk” strategy, since,
when they evaluate the quality of modern goods and services low, they focus only on price
when choosing them. In other words, the lower the income, the more risky the consumer
strategy the respondent uses. However, the authors found another interesting feature that links
consumer strategies, income levels, and risks. To verify the hypothesis that for a group of
consumers in alternative consumer practices, the latter are endowed with signs of status,
prestige, and risk, the author conducted an empirical study in July 2017 in Novosibirsk on the
topic "Alternative practices of food consumption". The method of in-depth interview based on
a sample of available cases was used. We note that such studies are practically absent in
sociology. The task of empirical study of alternative practices of food consumption is seen as
possible at various levels: quantitative (representative research) and qualitative (focus group,
in-depth interview, and others). The first of them is a classic representative survey, which aims
to detect mass forms of consumer behavior and respondents ' opinions about the whole complex
of the consumer sphere. The second level of research of alternative consumer practices is in an
in-depth interview, which makes it possible to track individual consumption processes based
on the analysis of narratively recorded interactions. The description of social interactions in the
context of consumer practices, of course, will not represent the representativeness of this type
of behavior, but will allow you to determine the features of alternative consumer practices.
Alternative consumption practices are associated with a preference for a healthy diet in the form
of a raw food diet. A healthy diet, a healthy lifestyle is, of course, one of the values. However,
values can have a contradictory nature and turn into their opposite. Hence the risk. We point
out that the risk of consumption is due to the fact that supporters of a food system that
completely excludes the use of any food that has been subjected to temperature treatment, use

51st International Scientific Conference on Economic and Social Development – Rabat, 26-27 March 2020
503
products that contain pathogenic bacteria, etc. Many vegetables, fruits, and berries may well
contain traces of fertilizers that are destroyed only by heat treatment. Alternative consumption
practices as risky (in the above aspect) are directly correlated with income levels. The fact is
that this group of consumers uses expensive food products, if necessary, orders them in foreign
countries. According to one of the respondents, "it’s much cheaper to eat regular food than "live
food". The respondents surveyed by the authors had a high level of income and owned one or
more businesses. It’s worth noting that according to the typology of social behavior (M. Weber),
this type of consumer behavior is value-rational. In our view, in this context, it contributes to
the "normalization" of risk. By correlating with the O.V. study Tkachenko, we can say: in
traditional consumer practices, lower-income individuals demonstrate higher risk strategies; in
contrast, high-income individuals are more at risk with alternative consumer practices. As for
environmental behavior in relation to one's health, the theory of habitualization is clearly visible
here. We can also cite the results of an empirical study that illustrates health-saving practices
and habitualized risk in behavior with regard to one's health. We conducted a study of the
opinion of residents of Novosibirsk. The study was conducted under the author's guidance in
June 2019 (N=771, of which 399 are women and 372 are men). A questionnaire was used. The
sample is formed by a three-stage selection of territories. Health-saving practices were tested
using a series of questions, one of which was the following: "What will You do when symptoms
appear?". Different answers were offered to this question, which involved contacting
specialists, self-treatment, and passive refusal of treatment. While self-medication was treated
not only from the perspective of self-selection of medicines, but also appeal to virtual means of
obtaining information in case of illness (the Internet). If there is no significant risk, more than
40% of respondents in both groups choose one of the methods of self-treatment – the
independent choice of drugs in the pharmacy. It’s significant that 9.8% of women and 13.7%
of men will turn to the Internet for information. In this case, the virtualization of modern society
is one of the major health risks. Less than a third of respondents (28.4% and 24.5%,
respectively) will go to a medical institution, and about one in ten respondents will call a doctor.
The passive method" I will do nothing " is chosen by 6% of women and 12.6% of men. The
presented health-saving practices in the event of symptoms of the disease are both risk-based
and habitualized. At the same time, you can also see respondents with purposeful behavior that
deliberately reduces the risks of the disease.
4. CONCLUSION
Sum up. Risk as an object of sociology has a significant interest, since it’s directly related to
the preservation of the life of the entire social system. Risk can be considered as a measure of
possible losses in the social system. It’s important to keep in mind that risks are difficult to
manage, constant, and"normalized". In order to avoid risk, it is important to form a goal-
oriented type (according to M. Weber) of consumer behavior. Empirical research of risks on
the example of consumer behavior shows that they are predetermined by a set of factors such
as gender, age, status, education, income level, etc. At the same time, these factors may have
different effects on different models of consumer behavior. This thesis allows us to suggest that
by taking risks under control and managing them, we can thereby improve the quality of life as
a whole.
LITERATURE:
1. Arrow, K.J. (1987) The Demand for Information and the Distribution of Income //
Probability in the Engineering and Information Sciences. 1:3-13.
2. Arrow, K.J. (2011) Credit Instruments and Information in General Equilibrium // P. Bridel
(ed.) General Equilibrium Analysis: A Century after Walras. Abington, U.K. and New
York: Routledge. Ch. 10:102-108.

51st International Scientific Conference on Economic and Social Development – Rabat, 26-27 March 2020
504
3. Bauman, Z. (2001) The individualized society. Polity.
4. Beck, U. (2010) World at Risk. Cambridge: Polity Press
5. Beck, U. (2007) Power in the Global Age. Cambridge: Polity Press
6. Beck, U. (2015) Emancipatory Catastrophism: What does it mean to Climate Change and
Risk Society? // Current Sociology.. 63 (1): 75–88.
7. Berger, P., Lukman, T. (1995) Social design of reality. Treatment on sociology of
knowledge. М.
8. Bourdieu, P. (1998) Structure, habitus, practice. Journal of Sociology and Social
Anthropology. 1(2): 44-59.
9. Behmann, G. (2010) Modern society: risk society, information society, knowledge society.
Moscow: Logos.
10. Chavoshian, A., Takeuchi, K. (2013) Floods: From Risk to Opportunity. (IAHS Red Book
Series). International Association of Hydrological Science.
11. Douglas M., Wildavsky A. (1982) Risk and culture: An essay on selection of technological
and environmental dangers. Berkeley, CA: University of California Press
12. Frolova, S.M., Golub, Yu.G. (2011) Risk as an integral component of the everyday life of
modern society. Personality in the modern world: life strategies, values, risks: materials of
a scientific-practical conference. Saratov: Publishing house «KUBiK»: 69-73.
13. Giddens, А. (2002) Runaway World: How Globalisation Is Reshaping Our Lives. Profile
Books.
14. Hubbard, W.D. (2009) The Failure of Risk Management: Why it’s Broken and How to Fix
lt. John Wiley & Sons, Inc., Hoboken, New Jersey.
15. Ilynykh, S.A. (2017) Consumer behavior: status, riskiness, habitualization. Society:
sociology, psychology, pedagogy. 9: 9-12
16. Kashcheev, S.I. (2011) Risk, freedom, passionarity. Personality in the modern world: life
strategies, values, risks: materials of a scientific-practical conference. Saratov: Publishing
house «KUBiK»: 38-42.
17. Luhmann, N. (1991) Der Begriff Risiko. In: N.Luhmann. Soziologie des Risikos. Berlin;
New York: Walter de Gruyter. S.9–40.
18. Perry, R. W., Quarantelli, E. (2005) What is a Disaster? New answers to old questions
Xlibris, Corp.
19. Pidgeon, N., Kasperson, R. E., Slovik, P. (2003) The Social Amplification of Risk
Cambridge. Cambridge University Press
20. Piscione, D. P. (2014) The Risk Factor: Why Every Organization Needs Big Bets, Bold
Characters, and the Occasional Spectacular Failure. St. Martin's Publishing Group, Dec
23, Business & Economics
21. Strizoe, A.L. (2014) Subjective risks of civilization and culture in an era of global change.
Risks of civilizations and cultures in the global world: Sat. Proceedings of the All-Russian
Scientific Conference. Saratov: Information Center Science: 10-16.
22. Sztompka, P. (red.) (2000) Imponderabilia wielkiej zmiany. Warszawa: PWN.
23. Sztompka, P. (2000) Trauma wielkiej zmiany. Warszawa: ISP PAN.
24. Tkachenko, O.V. (2017) Social risks in the consumer behavior of the population of modern
Russia: regional aspect: author. dis ... Dr. sociol. Volgograd
25. Ustyantsev, V.B. (red.). (2006) Risk society and man: ontological and value aspects.
Saratov: Publishing Center «Science».
26. Ustyantsev V.B., Gobozov I.A., Pigrov K.S. (2012) Society: space, risks, values. Saratov:
Saratov University Press
27. Vasilenko, I.V., Tkachenko, O.V. (2014) Social risk: to the definition of a concept. Bulletin
of the Volgograd State University. Series 7. Philosophy. Sociology and social technology.
3: 32-45

51st International Scientific Conference on Economic and Social Development – Rabat, 26-27 March 2020
505
28. Wallerstein, I. (2001) The end of the world as we know it Social Science for the Twenty-
First Century. Univ Of Minnesota Press; First edition edition
29. Weber, M. (1990) Selected works. M. Progress
30. Yanitsky, O.N. (2003) Sociology of risk. M .: Publishing house LVS.
31. Zubоk Yu.A. (2007) The phenomenon of risk in sociology: the experience of youth research.
M.: Thought
32. Zubkov, V.I. (2003) Sociological risk theory. M.: Publishing House of RUDN.
51st International Scientific Conference on Economic and Social Development – Rabat, 26-27 March 2020
506
DIVERGENCES AND THEIR EVIDENTIAL VALUE IN THE PROCESS
OF MAXIMIZING EARNINGS FROM TRADING OF FINANCIAL
MARKETS
Jan Chutka
University of Zilina, The Faculty of Operation and Economics of Transport and
Communications, Department of Economics
Univerzitna 1, 010 26 Zilina, Slovakia
Ladislav Vagner
University of Zilina, The Faculty of Operation and Economics of Transport and
Communications, Department of Economics
Univerzitna 1, 010 26 Zilina, Slovakia
ABSTRACT
If we start to consider the analysis of financial markets in order to achieve exchange rate gains,
we usually come across a range of tools and methods that offer different approaches to the
issue. One of the most widespread and most widely used is technical analysis, which focuses on
examining historical market data, such as prices and volume, on the basis of which it forms its
predictions of future price development. A separate group of analytical tools of technical
analysis are mathematical indicators that process historical market data based on an exact
mathematical procedure. However, in certain situations there is a conflict between the market
price of the financial asset and the resulting value of the mathematical indicator. These
situations are known as divergences. In our article we focused on the issue of divergences in
order to verify the information ability of divergences in the process of maximizing profits from
trading on financial markets. The first chapter of our paper is focused on processing the
theoretical foundations needed for further research in this field. In the second chapter we
defined the framework of the research itself as selected financial instrument, time frame, kind
of mathematical indicator and other necessary variables. In the third and last chapters we
presented and interpreted the obtained values. We believe this article will be a valuable
contribution in this research area.
Keywords: divergence, technical indicator, earnings maximizing
1. INTRODUCTION
If we become interested in the issue of predicting price movements of financial instruments in
the financial markets, we will come across a wide range of different methods and procedures
that promise guaranteed functionality. A special group of forecasting tools are the so-called
technical indicators. The aim of our contribution will be to verify the functionality of the use of
the RSI and the predicative ability of divergences between the price of the financial instrument
and this indicator. In the first chapter, we will create a theoretical basis for using the RSI and
the divergences themselves. In the second chapter we define the necessary variables for testing.
The third chapter will be devoted to the publication of research results and their interpretation.
We believe that our contribution will be valuable for further research in the field of technical
analysis and financial market trading [4,6,7].

51st International Scientific Conference on Economic and Social Development – Rabat, 26-27 March 2020
507
2. THEORETICAL FRAMEWORK
2.1. RSI technical indicator
RSI or relative power index are classified as oscillators. It is one of the most popular indicators
of technical analysis. The name relative strength index is a bit misleading because it does not
compare the relative strength of the two underlying assets, but the intrinsic strength of one asset
[1,2,3].
Calculation algorithm:
1. Calculation of the opening and closing price difference for each one rising candle (U) and
for the falling candle (D).
U = CLOSEi – CLOSEi-1 … for each growing candle (1)
D = CLOSEi – CLOSEi-1 … for each falling candle (2)
2. Calculation of exponential moving averages from U and D values for a selected time period.
3. RS calculation.
RS = EMA (U) / EMA (D) (3)
4. Quantification of RSI
RSI = 100 – 100 x (1 / 1 +RS) (4)
RSI is characterized as so-called. the following indicator, which means that the price of the
financial asset follows. Its value ranges from 0 to 100. A big advantage of this indicator as well
as most oscillators is that it has the ability to predict potential trend changes. If the value of the
indicator gets close to its margins, there is a very high probability that the market will be
correcting the primary trend (moving against the current trend) and the RSI indicator will again
be closer to the centre of its probability distribution. Most often we can see a graphical form of
visualization of the RSI, which consists of a line that oscillates between 0 and 100. Significant
values of RSI are 70 and 30. These values are interpreted as boundaries that indicate a possible
overbuy or oversold market. The RSI oscillator tries to indicate potential inflection points of
changes in the price development of the financial instrument. It is also important to note that
exceeding the reference level towards the RSI mean is always considered as a strong signal of
potential trend change [1,8,11].
Figure 1: Graphical representation of the RSI
Source: Own processing
2.2. Divergences
Divergence belongs to the technical types of market inputs derived from the indicator. It arises
when there is a discrepancy between the development of the price of the financial instrument
and the value of the indicator [5,9,10]. For the purposes of divergence trading we will use the
RSI (Relative Strength Index) indicator. We know two kinds of divergences, hidden and classic.
Classical divergence (indicated by a red line in the graph) is a reverse input that indicates a
possible trend change. The hidden divergence is a trend and tells us the possible continuation
of the trend (indicated by a blue line in the graph). It is very important to realize that divergence
as such is only an aid to entry and is based on market structure (S / R levels).

51st International Scientific Conference on Economic and Social Development – Rabat, 26-27 March 2020
508
For efficient trading of divergences, we will follow the following rules and characteristics:
• The divergence is only valid after the candle has been closed.
• The divergence that appears below the zero line on the indicator is always traded as a long
position.
• We enter a long position to break through the high candle, where the divergence has been
confirmed.
• The divergence that is created above the zero line on the indicator is always traded as a short
position.
• We enter the short position to break through the low candle, where the divergence was
confirmed.
• If we denote the vertices of the divergence in the graph and the indicator, their lines must
always have a visible slope.
3. THE FRAMEWORK OF THE RESEARCH
Our research will be carried out as follows. We will use RSI with a set time period of 5. The
reason for setting this time period into the indicator calculation is that the indicator with this
setting can respond more quickly and sharply to the price changes of the financial instrument.
Divergences between the price of the financial asset and the RSI of period 5 will be searched
on the US.500 financial asset price chart, which is a CFD derivative of the SP500 futures index
offered by XTB a.s.. For data collection we chose the time interval of price development of this
financial instrument from 1.1.2019 to 31.12.2019. The measurement will be carried out on a
candle price chart of this instrument with a period of one candle formation of 4 hours. We chose
this interval because we consider it to be adequate for the research and because during the
calendar year research will also take into account factors such as seasonality, earnings season
and various other macroeconomic factors. Another reason is that we assume a sufficient
frequency of individual measurements and thus a certain predicative ability of our results. Our
aim will be to identify the frequency of divergence outbreaks in the course of the year and to
check whether they can be considered as an indicator of the inflection point of the price trend
of the financial instrument.
4. RESULTS
During the research we obtained the following measured values:
Table following on the next page
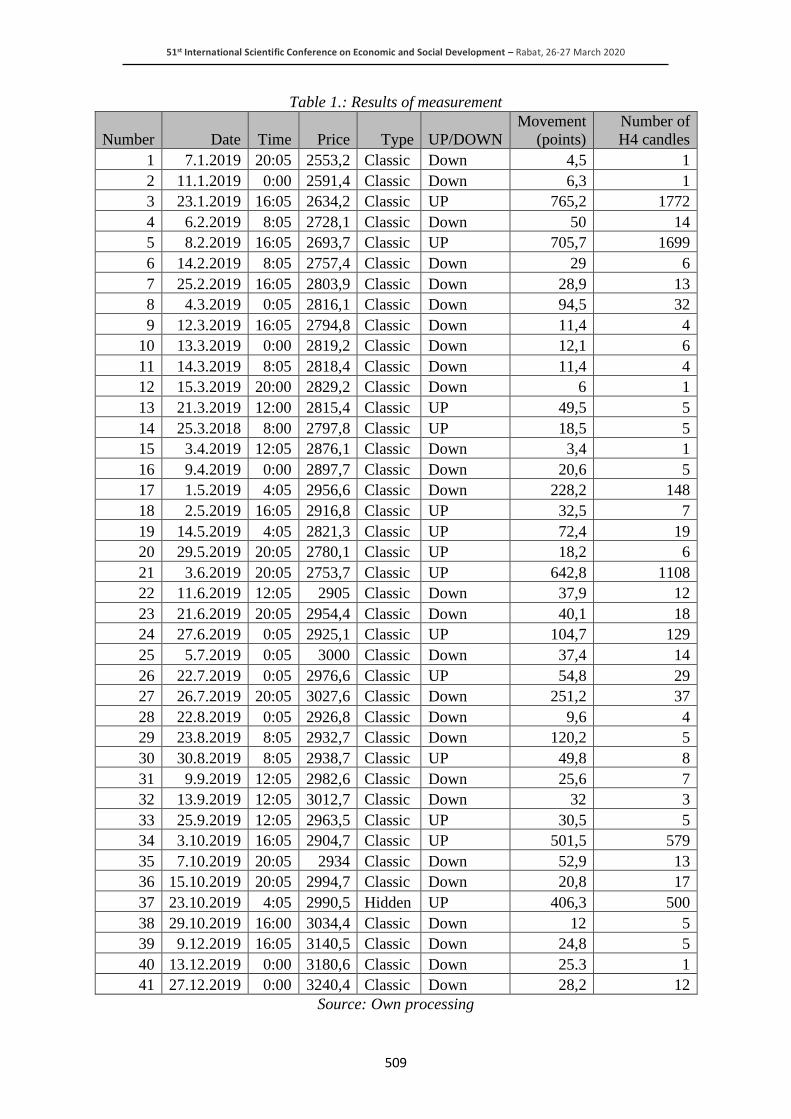
51st International Scientific Conference on Economic and Social Development – Rabat, 26-27 March 2020
509
Table 1.: Results of measurement
Number Date Time Price Type UP/DOWN
Movement
(points)
Number of
H4 candles
1 7.1.2019 20:05 2553,2 Classic Down 4,5 1
2 11.1.2019 0:00 2591,4 Classic Down 6,3 1
3 23.1.2019 16:05 2634,2 Classic UP 765,2 1772
4 6.2.2019 8:05 2728,1 Classic Down 50 14
5 8.2.2019 16:05 2693,7 Classic UP 705,7 1699
6 14.2.2019 8:05 2757,4 Classic Down 29 6
7 25.2.2019 16:05 2803,9 Classic Down 28,9 13
8 4.3.2019 0:05 2816,1 Classic Down 94,5 32
9 12.3.2019 16:05 2794,8 Classic Down 11,4 4
10 13.3.2019 0:00 2819,2 Classic Down 12,1 6
11 14.3.2019 8:05 2818,4 Classic Down 11,4 4
12 15.3.2019 20:00 2829,2 Classic Down 6 1
13 21.3.2019 12:00 2815,4 Classic UP 49,5 5
14 25.3.2018 8:00 2797,8 Classic UP 18,5 5
15 3.4.2019 12:05 2876,1 Classic Down 3,4 1
16 9.4.2019 0:00 2897,7 Classic Down 20,6 5
17 1.5.2019 4:05 2956,6 Classic Down 228,2 148
18 2.5.2019 16:05 2916,8 Classic UP 32,5 7
19 14.5.2019 4:05 2821,3 Classic UP 72,4 19
20 29.5.2019 20:05 2780,1 Classic UP 18,2 6
21 3.6.2019 20:05 2753,7 Classic UP 642,8 1108
22 11.6.2019 12:05 2905 Classic Down 37,9 12
23 21.6.2019 20:05 2954,4 Classic Down 40,1 18
24 27.6.2019 0:05 2925,1 Classic UP 104,7 129
25 5.7.2019 0:05 3000 Classic Down 37,4 14
26 22.7.2019 0:05 2976,6 Classic UP 54,8 29
27 26.7.2019 20:05 3027,6 Classic Down 251,2 37
28 22.8.2019 0:05 2926,8 Classic Down 9,6 4
29 23.8.2019 8:05 2932,7 Classic Down 120,2 5
30 30.8.2019 8:05 2938,7 Classic UP 49,8 8
31 9.9.2019 12:05 2982,6 Classic Down 25,6 7
32 13.9.2019 12:05 3012,7 Classic Down 32 3
33 25.9.2019 12:05 2963,5 Classic UP 30,5 5
34 3.10.2019 16:05 2904,7 Classic UP 501,5 579
35 7.10.2019 20:05 2934 Classic Down 52,9 13
36 15.10.2019 20:05 2994,7 Classic Down 20,8 17
37 23.10.2019 4:05 2990,5 Hidden UP 406,3 500
38 29.10.2019 16:00 3034,4 Classic Down 12 5
39 9.12.2019 16:05 3140,5 Classic Down 24,8 5
40 13.12.2019 0:00 3180,6 Classic Down 25.3 1
41 27.12.2019 0:00 3240,4 Classic Down 28,2 12
Source: Own processing
51st International Scientific Conference on Economic and Social Development – Rabat, 26-27 March 2020
510
In the period we have chosen, we have identified 40 divergences on the price chart and on the
basis of the preset RSI. Of which 39 were classic and one hidden divergence. It can be stated
that, on the basis of established rules, the market reacted to each identified divergence, although
in some cases only by a few points change. 35% of the identified divergences predicted the
inflection point and the change of the current short-term downtrend to the uptrend and the
remaining 65% predicted the change to the downtrend. Based on the analysis of the measured
values, we found that the divergences that predicted the uptrend identified an inflection point
followed by an average of 313.91 points change in the predicted direction. On the other hand,
the divergences that predicted the downtrend identified an inflection point, followed by an
average of only a 30.9 points price response. We can explain such significantly different results
by the fact that during the year 2019 there was a strongly established uptrend and inflection
points on the stock markets, which we identified based on divergences tended to display price
peaks and bottoms of shorter market corrections. If the divergence predicted an uptrend, it was
more likely to succeed because the market tended to continue the established trend that
corresponded to the forecast. Based on the measured data, we can say that the divergence of the
price development of the financial instrument with the preset RSI can be considered as a solid
signal of the change in the market trend. However, it is questionable how effective the tool for
predicting changes in the trend of divergence may be. Although the market has always reacted
to the identified divergences, but in some cases only minimally, and the price change only a
few points. On the other hand, in this way we were able to identify 5 inflection points where
both the primary and secondary trends were unified and the market continued in the long-term
trend. We cannot answer the question to what extent this method is effective because it depends
on the specific business rules, money management and risk management of the particular trader.
5. CONCLUSION
Our paper dealt with the issue of predicting the future development of financial instruments,
namely the use of divergences as the main prediction tool. The aim of our contribution was
verify the functionality of the use of the RSI and the predicative ability of divergences between
the price of the financial instrument and this indicator. In the first chapter, we created a
theoretical basis for using the RSI and the divergences themselves. In the second chapter we
defined the necessary variables for testing. The third chapter was devoted to the publication of
results and their interpretation. We believe that our contribution will be valuable for further
research in the field of technical analysis and financial market trading.
ACKNOWLEDGEMENT: The paper is an output of the science project VEGA 1/0210/19
Research of innovative attributes of quantitative and qualitative fundaments of the
opportunistic earnings modelling.
LITERATURE:
1. Bernstein, J., (1995). The complete day trader, the first edition. New York: McGraw-Hill,
Inc., ISBN 0-07-009251-6.
2. Gavurova, B., Belas, J., Kocisova, K., Kliestik, T., (2017). Comparison of selected methods
for performance evaluation of Czech and Slovak commercial banks. Journal of Business
Economics and Management, Vol. 18, no. 5, pp. 852-876.
3. Chovancova, B., Hudcovsky, J., & Kotaskova, A., (2019). The Impact of Stocks and Bonds
on Pension Fund Performance. Journal of Competitiveness, vol. 11, no. 2, pp. 22-35.
4. Kliestik, T., Misankova, M., Valaskova, K., Svabova, L., (2018). Bankruptcy prevention:
new effort to reflect on legal and social changes. Science and Engineering Ethics, vol. 24,
No 2, pp. 791-803.
51st International Scientific Conference on Economic and Social Development – Rabat, 26-27 March 2020
511
5. Kovacova, M., Kliestik, T., Valaskova, K., Durana, P., Juhaszova, Z., (2019). Systematic
review of variables applied in bankruptcy prediction models of Visegrad group
countries. Oeconomia Copernicana, vol. 10, no. 4, pp. 743-772.
6. Kowo, S.A., Akinbola, O.A., (2019). Strategic leadership and sustainability performance of
small and medium enterprises. Ekonomicko-manazerske spektrum, vol. 13, no. 1, pp 38-50.
7. Siekelova, A., Kollar, B., Weissova, I., (2015). Impact of credit risk management. Procedia
Economics and Finance, vol. 26, pp. 325-331.
8. Sosnowski, T., (2018). Earnings management in the private equity divestment process on
Warsaw Stock Exchange. Equilibrium – Quarterly Journal of Economics and Economic
Policy, vol. 13, no. 4, pp 689-705.
9. Tuffnell, C., Kral, P., Durana, P., Krulicky, T., (2019). “Industry 4.0-based Manufacturing
Systems: Smart Production, Sustainable Supply Chain Networks, and Real-Time Process
Monitoring,”. Journal of Self-Governance and Management Economics, vol. 7, no. 2, pp
7–12.
10. Valaskova, K., Kramarova, K., Kollar, B., (2015). Theoretical Aspects of a model of credit
risk determination- Credit risk. Advances in Education Research, vol. 81, pp. 401-406.
11. Valaskova, K., Zvarikova, K. Prediction of credit risk by selected theoretical rating models.
Advances in Social and Behavioral Sciences, vol. 5, pp. 160-166.
51st International Scientific Conference on Economic and Social Development – Rabat, 26-27 March 2020
512
THE WORLD ECONOMY ON THE EVE OF A NEW CRISIS
Mushfig Feyzullaev
Candidate of Economic Sciences,
Associate Professor at Surgut State University
628400, Tyumen Region, Surgut, 1 Lenin Str., Russia
Ramiz Javadov
Associate professor at Azerbaijan State University of Economics,
Azerbaijan State Economic University
Baku, street Istiqlalliyat-6, post office AZ1001, Azerbaijan
Nazim Hajiyev
Associate professor at Department of Economics and Business management,
Azerbaijan State University of Economics, Baku, Azerbaijan,
Visiting Scholar, Davis Center for Russian and Eurasian Studies,
Harvard University, Boston, USA
[email protected]; [email protected]
ABSTRACT
The article is devoted to the analysis of the processes, trends, and directions of global changes
occurring in the world economy. The retrospective of the development of the theory of crises is
revealed. Various approaches and theories of crises have been studied. A comparison has
carried out on the views of various economic schools in analyzing the causes of economic crises
in the world. The authors collected statistical materials to identify the factors shaping the crisis
situation in world markets. The application of the next global crisis in the forthcoming years
is analyzed. A study was conducted to identify crisis phenomena, to establish the factors, causes
and consequences of global trade wars. The main directions of the development of crisis
phenomena in the world are revealed. The global devaluation processes are analyzed. Possible
variants of negative scenarios of the American-Chinese contradiction in trade issues are
predicted. The impact of the expected next global crisis on the Russian economy is estimated.
Keywords: crisis phenomena, capital flight, trade wars, economic sanctions, devaluation, stock
market
1. INTRODUCTION
Recently, the possibility of starting another global crisis has often been discussed. At the same
time, it is impossible to determine from which region of the world it will begin. The gradual
devaluation of the currencies of developing countries in 2018 resembles 1998. However, the
looming crisis will have a deeper bottom, and its effects are expected to be stronger than those
of previous crises. Thus, three main directions of development of crisis phenomena are formed:
1. As a result of the economic sanctions launched by the United States, world trade felt an
imbalance in many spheres. The consequences of this imbalance will affect the balance of
trade operations, increased protectionism, centrifugal tools, and destabilization of the
currency and stock markets. This is evidenced by the facts of the development of
devaluation processes this year.
2. The confrontation between the USA and China in matters of mutual trade can negatively
affect the economic performance of both countries. The global economy will suffer
particularly if this confrontation leads to a decrease in the growth rate of the Chinese

51st International Scientific Conference on Economic and Social Development – Rabat, 26-27 March 2020
513
economy, which currently ranks first in the world at parity purchasing power ahead of the
United States (see Table 1). A reduction in consumption from China will entail a decline in
world trade, especially in the energy supply industries. That can not but be reflected in the
indicators of Russian-Chinese trade.
3. Over the past 10 years, the US economy has shown its strength in a quick recovery from
the 2008 crisis. During this time, US stock indexes have increased significantly. However,
the main reason for such growth was cheap financial resources in the debt market. This
year, the US Federal Reserve began a gradual increase in lending rates, which led to a rise
in the cost of borrowing in the US market. The continuation of this scenario will lead to an
outflow of money from the stock market and will force the markets to begin a deep
correction to growth. In this case, along with the US market sales around the world will
begin. The emerging markets will be the hardest hit.
Table 1: Rating of countries by GDP (PPP) [1]
№ Country GDP (USA $)
1 China 23 300 782 880 353
2 USA 19 390 604 000 000
3 India 9 448 658 813 549
4 Japan 5 562 821 811 765
5 Germany 4 193 922 741 398
6 Russia 3 749 283 676 766
7 Indonesia 3 242 768 575 868
8 Brazil 3 240 523 597 736
9 Great Britain 2 896 832 821 061
10 France 2 871 263 869 539
2. THEORY
Over the centuries of world economic development, many theories have been developed that
study crisis phenomena. We will analyze the main economic theories explaining the causes of
world economic crises. One of the pioneers of the theory of crises was Jean Charles Sismondi.
According to Sismondi, the cause of the crises was the disproportions in the process of income
distribution. The main trouble according to the author is the poverty of the majority of the
population who do not have the opportunity for adequate consumption [2]. The author of
Capital, Karl Marx, believed that the lack of planning in the development of commodity
production was to blame. Marx criticized the capitalist system, where, in his opinion, there was
a contradiction between public and private interests. The cause of the onset of crisis, he called
the accumulative nature of capital [3]. One of the famous economists of the twentieth century,
John Maynard Keynes linked the emergence of a crisis in the economy with a reduction in
aggregate demand in the country. According to Keynes, this phenomenon causes an increase in
unemployment and leads to a drop in household income. For the first time, Keynes introduced
the concept of investor expectations, as a psychological component in the theory of crises.

51st International Scientific Conference on Economic and Social Development – Rabat, 26-27 March 2020
514
The main cause of the crisis, according to the author, is changes in supply and demand and the
expected decrease in profits [4]. At the same time, such theorists as J. Robinson, J. Hobson
could not associate crisis phenomena with the capitalist mode of development. They attributed
the causes of the crisis to overproduction and under consumption. Joan Robinson proposed to
stimulate consumption in order to avoid the onset of an economic crisis [5]. F. Hayek and L.
Mises have seen the cause of the crisis in poor management, in disproportions in the
development of economic sectors, entrepreneurial risks, etc. [6]. Some theorists also linked the
recurrence of crises with the processes of innovation, the development of scientific and
technological progress. (J. Schumpeter, E. Hansen). The emergence of new technologies is a
stimulating factor for economic growth [7]. Along with foreign authors, a lot of works were
also developed and devoted to the theory of crises by Russian economists. One of the pioneers
of the Russian scientific school in the field of crises was M.I. Tugan-Baranovsky. The author’s
main postulates have been developed through studies of industrial crises. His theory was based
on the analysis of the English economy of the XIX century. He also saw the cause of crises in
overproduction, in the growth of unemployment and the price policy of capitalism [8]. The
particular value among the studies of world crises are the “Kondratieff cycles”, which were put
forward by economist N. D. Kondratyev. He substantiated and proved the existence of long
cycles of crises [9]. According to this theory, a transition to a more developed level occurs
every fifty years in the global economy. Kondratyev formulated features of the cycles, while
also pointing out the existence of upward and downward phases of the wave. Thus, he argued
the dependence of the economy on periods of return on investment, appreciation or depreciation
of the cost of capital. The realities of the world economy became proof of Kondratyev's theory,
and this theory was recognized by the world community [10]. Also among the authors of the
theory of crises can be noted such scholars as P. Samuelson [11], J. Schumpeter, H. Hansen
[12], A. S. Pigu [13], J. Hobson; F. Hayek, L. Mises and others. Jevons [14]. The modern
economists analyzing crisis phenomena, devoting their works to the study of the causes and
factors of the imbalance of economic systems. We can mention J. Sorros [15], B.Sh. Bernanke
[16,17], D. Lipton, O. Blanchard [18,19] L. Leuven, F. Valencia, N. Rubini, B. Rietz and others.
3. THE ANALYSIS OF THE PROBLEM, METHODS AND METHODOLOGY
Let us consider possible scenarios with regard to statistical data in details. In 2018, currencies
of countries such as Venezuela, Turkey, Argentina, Indonesia, South Africa, Russia, Brazil,
India, etc. were subject to strong devaluation movement (see table 2). As can be seen from the
figure, the currency of Venezuela has undergone the greatest devaluation. The main reasons for
which were the decline in the country's Gross Domestic Product, continuing for several years,
high inflation, high unemployment, a double exchange rate. Also an important role was played
by the political situation and unfriendly relations with neighbors, capital outflow and mass
migration of people to neighboring countries [20]. The reasons for the devaluations in other
countries also have an economic basis. For example, the Turkish economy at the same time
with a good growth rate, also had high inflation rates, which in 2018 reached 16% per annum.
Tensions with the United States reinforced the crisis and led to an outflow of capital.
Table following on the next page

51st International Scientific Conference on Economic and Social Development – Rabat, 26-27 March 2020
515
Table 2: TOP-10 of the weak currencies in the last 12 months [21]
Currency currency depreciation against the US dollar,%
Venezuelan Bolivar 99,996
Sudanese pound 63,05
Argentine Peso 53,44
Turkish lira 46,8
Angolan Kwanza 41,35
Liberian Dollar 24,14
Brazilian real 23,89
Iranian real 20,84
Russian ruble 17,99
South African rand 15,22
The US introduction of measures to increase customs’ duties on some Turkish goods and the
backlash of the Turkish authorities scared off foreign investors, most of whom were investors
from the United States. After the sale of Turkish assets by foreign investors, Turkish lira was
subjected to strong pressure, and, as a result, the central bank had to sharply raise the key rate
(see Table 3).
Table 3: Key rates of central banks
Country Bank Rate Effective date
Australia Reserve Bank of
Australia
1.50 02.08.2016
Brazil Central Bank of Brazil 6.50 22.03.2018
Great Britain Bank of England 0.75 02.08.2018
Denmark National Bank of
Denmark
0.05 19.01.2015
Eurozone European Central Bank 0.00 16.03.2016
India Reserve Bank of India 6.50 01.08.2018
Canada Bank of Canada 1.75 24.10.2018
China People's Bank of China 4.35 24.10.2015
Mexico Bank of Mexico 7.75 21.06.2018
New Zealand Reserve Bank of New
Zealand
2.00 11.08.2016
Russia Central Bank of the
Russian Federation
7.50 17.09.2018
USA Federal Reserve
System
<2.25 26.09.2018
Turkey Central Bank of Turkey 24.00 13.09.2018
Switzerland National Bank of
Switzerland
-0.75 15.01.2015
Sweden Bank of Sweden -0.50 11.02.2016
South Africa South African Reserve
Bank
6.50 28.03.2018
Japan Bank of Japan -0.10 03.08.2016

51st International Scientific Conference on Economic and Social Development – Rabat, 26-27 March 2020
516
The Brazilian real depreciated due to capital flight from developing countries after the
devaluation of the Turkish lira. The Russian ruble, which is devalued by periodic jumps, suffers
because of anti-Russian sanctions. Despite the budget surplus, the ruble’s positive trade balance
this year has depreciated by 18%. Given the increase in anti-Russian sentiment in the world,
the new US sanctions measures, as well as global crisis factors, do not hope to strengthen the
Russian currency. In the next few years, the ruble will be under the onslaught of such factors
as capital flight from developing countries, changes in energy prices, the return of foreign debts
by Russian banks and enterprises. These factors may lead to an additional devaluation of the
Russian currency by 10-15%. The confrontation between the United States and China began
with the arrival of a new president Donald Trump in US power. The President of the United
States with the aim of fulfilling election promises began a dangerous protectionist policy. The
main defendant became China. The analysis of the history of relations between these countries
over the past decade shows that the gap in the trade balance has steadily grown in favor of
China. The American economy is notable for its use. The US trade deficit is deficient in 2002.
(see Fig.1). According to data for 2017, the gap between US imports and exports reached $ 800
billion. The main part of which falls to China (see Table 4). Analyzing the dynamics of the US
trade deficit with the People's Republic of China, it is necessary to take into account the
important fact that the main part of this deficit is made up of imports of American products
produced in China. In the early 2000s, many US companies relocated most of their own
production to China to reduce costs. The increase in the US deficit in the trade balance with
China is connected with the quite conscious desire to reduce the cost of production of consumer
goods as competition intensifies. Placement of production in China was due to cheap labor, low
environmental requirements, convenient logistic location, availability of raw materials. Due to
these factors, China has become a place of international expansion of American corporations
[22]. China itself was no less interested in developing these relations. The gradual transfer of
production in the territory of the Middle Kingdom allowed him to gain access to modern
technologies. At the same time, the centrally managed Chinese economy took on the experience
of managing companies with market methods. Over the years of non-stop GDP growth and the
well-being of the population, the Chinese have gained access to new technologies both
officially - by creating joint ventures, and unofficially - by creating their own industries using
foreign licensed programs. Over time, high-quality Chinese brands, not inferior to the originals,
began to crowd out American products around the world, including in the United States. This
is evidenced by the structure of US imports (see Figure 2). The United States will find it very
difficult to reduce the trade deficit with threats and blackmail. It is necessary to ascertain the
fact that the existing deficit in trade relations has much deeper roots and persists for 17 years.
Thus, the main reason for this deficit is structural imbalances in the trade balance of the
American economy. The American economy has a high share of the service sector in the
country's GDP.
Figure following on the next page
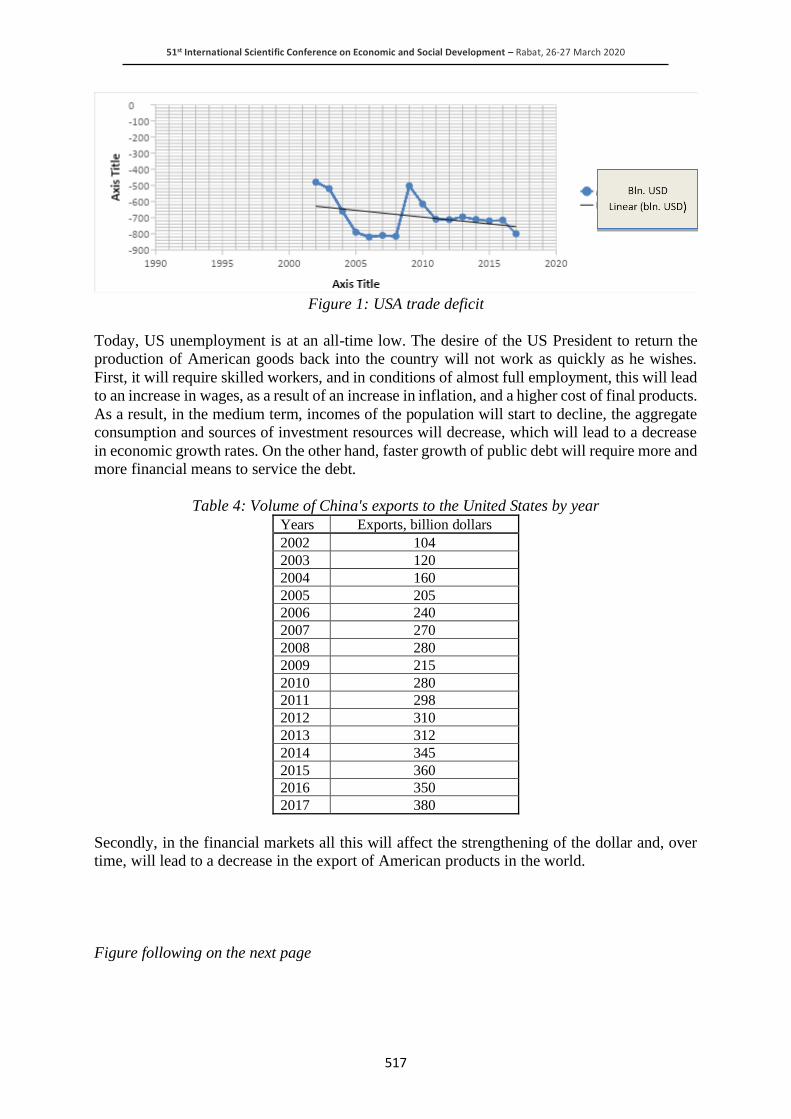
51st International Scientific Conference on Economic and Social Development – Rabat, 26-27 March 2020
517
Figure 1: USA trade deficit
Today, US unemployment is at an all-time low. The desire of the US President to return the
production of American goods back into the country will not work as quickly as he wishes.
First, it will require skilled workers, and in conditions of almost full employment, this will lead
to an increase in wages, as a result of an increase in inflation, and a higher cost of final products.
As a result, in the medium term, incomes of the population will start to decline, the aggregate
consumption and sources of investment resources will decrease, which will lead to a decrease
in economic growth rates. On the other hand, faster growth of public debt will require more and
more financial means to service the debt.
Table 4: Volume of China's exports to the United States by year
Years Exports, billion dollars
2002 104
2003 120
2004 160
2005 205
2006 240
2007 270
2008 280
2009 215
2010 280
2011 298
2012 310
2013 312
2014 345
2015 360
2016 350
2017 380
Secondly, in the financial markets all this will affect the strengthening of the dollar and, over
time, will lead to a decrease in the export of American products in the world.
Figure following on the next page
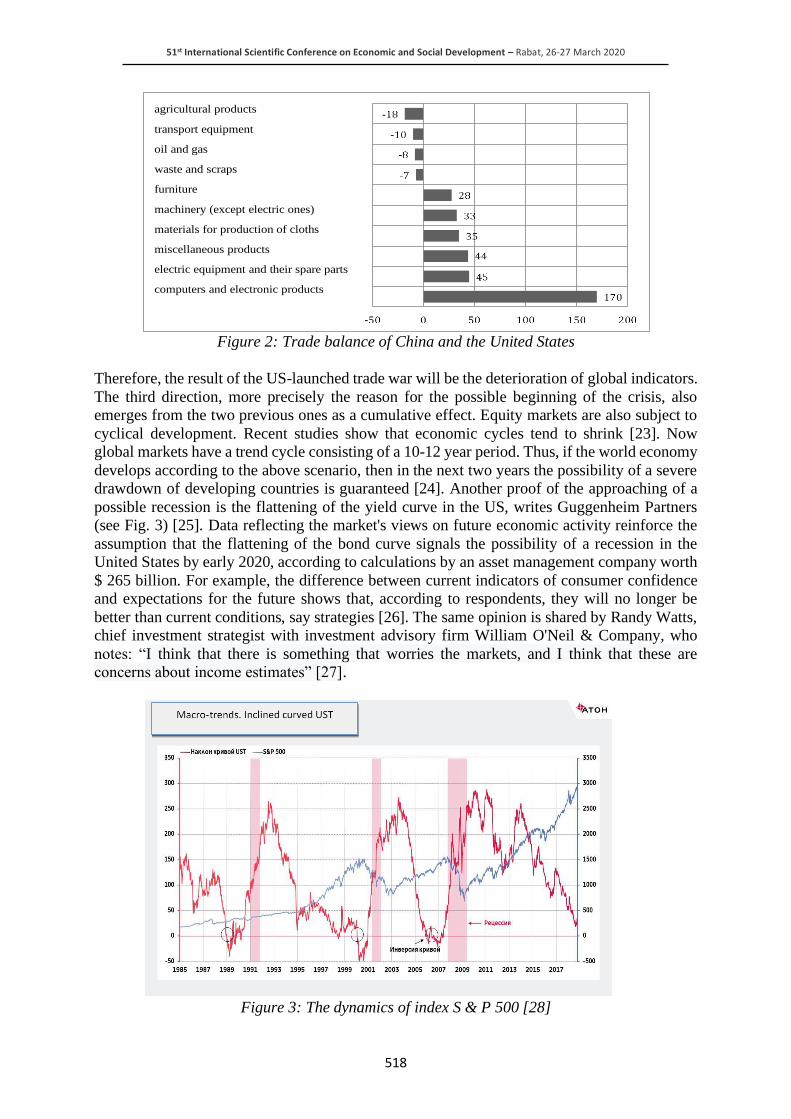
51st International Scientific Conference on Economic and Social Development – Rabat, 26-27 March 2020
518
Figure 2: Trade balance of China and the United States
Therefore, the result of the US-launched trade war will be the deterioration of global indicators.
The third direction, more precisely the reason for the possible beginning of the crisis, also
emerges from the two previous ones as a cumulative effect. Equity markets are also subject to
cyclical development. Recent studies show that economic cycles tend to shrink [23]. Now
global markets have a trend cycle consisting of a 10-12 year period. Thus, if the world economy
develops according to the above scenario, then in the next two years the possibility of a severe
drawdown of developing countries is guaranteed [24]. Another proof of the approaching of a
possible recession is the flattening of the yield curve in the US, writes Guggenheim Partners
(see Fig. 3) [25]. Data reflecting the market's views on future economic activity reinforce the
assumption that the flattening of the bond curve signals the possibility of a recession in the
United States by early 2020, according to calculations by an asset management company worth
$ 265 billion. For example, the difference between current indicators of consumer confidence
and expectations for the future shows that, according to respondents, they will no longer be
better than current conditions, say strategies [26]. The same opinion is shared by Randy Watts,
chief investment strategist with investment advisory firm William O'Neil & Company, who
notes: “I think that there is something that worries the markets, and I think that these are
concerns about income estimates” [27].
Figure 3: The dynamics of index S & P 500 [28]
agricultural products
transport equipment
oil and gas
waste and scraps
furniture
machinery (except electric ones)
materials for production of cloths
miscellaneous products
electric equipment and their spare parts
computers and electronic products

51st International Scientific Conference on Economic and Social Development – Rabat, 26-27 March 2020
519
4. CONCLUSIONS AND RECOMMENDATIONS
Taking into considerations all the above mentioned issues, we can make the following
conclusions. The commenced trade war by the United States, with the participation of the
European Union and China, will undoubtedly influence the development of the world economy
negatively. If this scenario continues, the recession in the United States will begin within a year
and a half or two years. This in turn will lead to a decrease in the growth rates of the economies
of the leading countries of the world. Undoubtedly, this process will also affect the Russian
economy. Firstly, the already low economic growth of Russian GDP will decline further due to
the slowdown in the growth of the global economy; secondly, it will cause cheaper commodities
(energy, ferrous and non-ferrous metals) and low-grade products that Russia exports. In order
to get out of the situation, as well as in order to reduce the influence of external factors, Russia
needs to restore consumer demand. But in the face of a chronic drop in household incomes over
the past five years, it is virtually impossible to increase consumption. Also, hidden
unemployment, lack of sources of investment resources, and a decline in investment activity in
the economy have negative effects. As a result of the author’s own analysis of the article shows,
the number of small and medium-sized businesses continues to decline. In 2018 alone, the
number of organizations that ceased their activities in the country exceeded the newly opened
ones by two times. And the number of activated subjects in the economy fell by 7%. The same
trend was observed in 2017 [29]. Thus, the decline in entrepreneurial activity states the
existence of serious structural problems in the Russian economy. The continuation of this
scenario will lead to the beginning of a recession at the end of 2019 - at the beginning of 2020.
The current structure of the economy is the main limiting factor for growth. Therefore, without
revising the constituent elements and the structure of the country's economic system, it is
impossible to change the existing trend of the Russian market.
LITERATURE:
1. Rating of countries of GDP (PPP). [Electronic resource]. URL:
http: //nonews.co/directory/lists/countries/gdp-ppp. (Date of circulation: 02/20/2019)
2. Blaug M. Sismondi, Jean Charles Leonard // 100 Great Economists Before Keynes = Great
Economists. - SPb .: Economikus, 2008. - p. 274-276. - 352 s.
3. Marx K. Capital. - M .: Publishing house of political literature, 1988. V. 2, p. 159.
4. Keynes J. The General Theory of Employment, Interest and Money - Moscow: Helios ARB
Publishing House, 2012, p. 256.
5. Robinson J. The Euler theorem and the problem of distribution // Milestones in economic
thought. Volume 3. Factor markets / Ed. V. M. Galperin - St. Petersburg: School of
Economics, 2000 - P.59-81 - 489 p.
6. Kapelyushnikov R. Philosophy of the Friedrich von Hayek Market // MEiMO. - 1989. - №
12.
7. Hayek, F. A. Chapter 5. Joseph Schumpeter (1883-1950). Methodological individualism //
The fate of liberalism in the XX century. - M .: IRISSEN, 2009. - 337 p.
8. M.I. Tugan - Baranovsky. Periodic industrial crises. Science, 1997.
9. Kondratyev ND. Large conjuncture cycles and the theory of foresight - M .: Publisher:
Economics, 2002, p. 418.
10. ND Kondratyev: crises and forecasts in the light of the theory of long waves. A look from
the present / ed. L. E. Grinina, A. V. Korotaeva, V. M. Bondarenko. M .: Moscow. ed.
publishing house "Teacher", 2017. - 384 p.
11. Samuelson, P. E., Nordhaus, V. D. Macroeconomics. 18th ed. M .: Williams. 2009 - 585s.
12. Schumpeter, J. Theory of Economic Development. M .: Directmedia Publishing, 2008 -
401с.
13. Pigou, A. C. Industrial Fluctuations. N. Y .: A. M. Kelley, 1967–39 p.

51st International Scientific Conference on Economic and Social Development – Rabat, 26-27 March 2020
520
14. Samuelson P., Nordhaus V. Economics - M .: Publisher: Williams, 2012, 849 c.
15. G. Soros. Soros on Soros. Ahead of changes: translated from English. M.: INFRA-M., 1996.
–336 p.
16. Stewart, James B., “Eight Days: The American Financial System,” The New Yorker
magazine, September 21, 2009. - P 58–81. Summarizing Sept 15–23, 2008 with interviews
by James Stewart of Paulson, Bernanke, Geitner. [Electronic resource]. URL: http:
//www.newyorker.com/reporting/2009/09/21/090921fa_ fact_ stewart. (Date of circulation:
10.10.2018)
17. Remarks for the Federal Reserve [Electronic resource] URL: http://www.white
house.gov/the_press_office/Remarks-By-The-President-and-Ben-Bernanke-atthe-Nomina
tion-of-Ben-Bernanke-For-Chairman-Of-the-Federal-Reserve. (The date of circulation is
12.11.2018)
18. O. Blanshar. Fighting global crisis will last for 10 years. [Electronic resource]. URL:
http://news.dt.ua/ECONOMICS/u_mvf_vvazhayut,_scho_borotba_zi_svitovoyu_krizoyu_
trivatime_10_rokiv-109781.html. (Date of appeal: 12/15/2018)
19. O. Blanshar. Looking back at 2011: four harsh truthes [Electronic resource]. URL: http:
//www.imf.org/external/russian/np/blog/2011/122111r.pdf. (Date of appeal: 10/07/2018)
20. Venezuela devalued the bolivar by 96%. Makarov O., Tkachev I. [Electronic resource].
URL: http: //www.rbc.ru/economics/20/08/2018/ 5b7a9b8a9a7947da66b6 77 04. (Appeal
Date: 02/20/2019)
21. Top 10 devaluations in the world. Ibrayeva A. [Electronic resource] URL: http:
//kursiv.kz/news/finansy/2018-09/top-10-devalvaciy-v-mire. (Date of circulation:
02/20/2019)
22. GDP of the leading countries of the world in 2018. [Electronic resource]. URL: http:
//global-finances.ru/vvp-stran-mira-2018. (Date of circulation: 02/20/2019)
23. The third trade: the opposition of China and the United States is beneficial to Russia.
Atasuntsev A., Makarov O. [Electronic resource] URL:
http://www.rbc.ru/politics/21/06/2018/5b28c7969a79475346d74b2b. (Date of appeal:
03/30/2019)
24. Technical Analysis of the S & P-500 Index for the period 2009-2018 [Electronic resource].
URL: http: //corner.kz/post/tehnicheskij-analiz-indeksa-sandp-500-za-period-2009-2018-
gg-prognozy-rekomendacii. (Date of appeal: 04/07/2019)
25. The UST curve does not lie about the risk of recession, says Guggenheim. [Electronic
resource]. URL: http: //www.finanz.ru/novosti/aktsii/krivaya-UST-ne-lzhet-o-riske-
recessii-govorit-Guggenheim-grafik-1027669971. (Date of appeal: 03/09/2019)
26. Where to Do Business in 2019. And Where to Avoid. URL:
https://www.bloomberg.com/news/articles/2018-10-31/where-to-do-business-in-2019-
and-where-to-avoid. (Date of circulation: 02/20/2019)
27. Tech Drove Stocks Skyward. It’s a different story on the way down. URL:
http://www.nytimes.com/2018/10/31/business/stock-market-tech.html (Date of reference:
02/15/2019)
28. American market: what to expect further? Kaminsky A. [Electronic resource]. URL: http:
//www.aton.ru/ideas/amerikanskiy_rynok_ chego_zhdat_dalshe. (Date of circulation:
February 14, 2019)
29. The number of companies established in the Russian Federation in 2018 decreased by 19%.
[Electronic resource]. URL: http: //www.interfax.ru/business/647533. (Date of circulation:
February 14, 2019)
51st International Scientific Conference on Economic and Social Development – Rabat, 26-27 March 2020
521
MUNICIPAL SOCIAL RESPOSIBILITY
Kristina Afric Rakitovac
Associate Professor at Juraj Dobrila University of Pula, Croatia
Faculty of Economics and Tourism “Dr. Mijo Mirković”, Croatia
Mojca Tavcar Bencic
Agilna agencija, Pula, Croatia
ABSTRACT
The implementation of the concept of social responsibility in urban governance, usually called
as municipal social responsibility (MSR,) is becoming nowadays a challenge and necessity.
Local governments, as key bearers of smart, sustainable and inclusive development, should be
role models and leaders of responsible business. MSR is the key tool for supporting sustainable
competitiveness. Since MSR is a complex and multidimensional concept, the process of its
implementation differs among cities. Besides, while the impact of implementation of corporate
social responsibility in the business sector have been elaborated in many scientific research
studies, the implementation of MSR has been elaborated rarely. The purpose of the paper is to
point out the importance of implementation of MSR into the internal dimensions of urban
governance and towards different external stakeholders. The aim of the paper is to analyse the
contribution of MSR to internal processes and relations with external stakeholders. The paper
presents the results of the empirical multidimensional analysis of the process of implementation
of MSR in the city of Pula, Croatia. The research results contribute to better understanding of
the importance and long-term benefits of implementation of MSR for various stakeholders.
Keywords: municipal social responsibility, urban governance, sustainable cities, sustainable
competitiveness, stakeholders
1. INTRODUCTION
Numerous, complex and long-term effects of the dominant neo-liberal expansionist paradigm
request the creation and implementation of a more responsible development model which will,
while streaming towards economic progress, consider the long-term impact on the quality of
life of different stakeholders, the society at large and the natural surroundings. Cities, with their
variety of stakeholders, are important agents in addressing those challenges. According to
OECD (2020), urbanisation continues to grow all over the world, with 70% of global population
expected to live in cities by 2050. Data from the OECD Metropolitan Database also shows that
the 327 OECD metropolitan areas above 500,000 inhabitants concentrate 63% of GDP. The
implementation of the concept of social responsibility in urban governance, usually called as
municipal social responsibility (MSR), is becoming nowadays a challenge and necessity. Local
governments, as key bearers of smart, sustainable and inclusive development, should be role
models and leaders of responsible business. Local governments are responsible for the creation
of a sound business environment adjusted to sustainability issues. Since MSR is a complex and
multidimensional concept, the process of implementation differs among cities. While the
impact of implementation of corporate social responsibility (CSR) have been elaborated in
many scientific research studies, the impact of MSR have been elaborated rarely. The purpose
of the paper is to point out the importance of implementation of MSR into the internal
dimensions of urban governance and towards different external stakeholders. The aim of the
paper is to analyse the contribution of CSR to internal processes and on relations with external
stakeholders. The paper presents the results of the empirical multidimensional analysis of the
process of implementation of CSR in the city of Pula, Croatia.

51st International Scientific Conference on Economic and Social Development – Rabat, 26-27 March 2020
522
The research results contribute to better understanding of the importance and long-term benefits
of implementation of MSR for various stakeholders (city's employees, business partners,
citizens, etc.).
2. MUNICIPAL SOCIAL RESPONSIBILITY
Cities, as very dynamic economic and social structures, are important stakeholders in the
process of transition towards a more conscious and responsible way of satisfying needs, i.e. a
transition from a linear to a circular economy. Those urban challenges were already recognised
in the document “Our common future” which has invited city governments to promote
sustainable local production and consumption, direct local participation, etc. (WCED, 1987)
ICLEI – Local Governments for Sustainability, as a global network committed to sustainable
urban development, was founded in 1990. Now it is active in more than one hundred countries
and supports more than 1,750 local and regional governments towards urban sustainability, i.e.
climate-change adaptation, nature-based, equitable, resilient and circular development (ICLEI,
2019). The role of local governments in implementing sustainable development (SD) was
confirmed in the subsequent document Agenda 21, adopted, as a non-binding action plan, at the
UN Conference on Environment and Development held in Rio de Janeiro, Brazil in
1992 (UNCED, 1992), as well as in all following documents (RIO+10, RIO+20, etc.). The latest
document, Agenda 2030 for Sustainable Development, sets out a 15-year plan to achieve17
Sustainable Development Goals (SDGs). SDG 11 “Make cities and human settlements
inclusive, safe, resilient and sustainable” is directly related to local governments. Local
authorities are invited on local actions by implementing the needed transitions in the policies,
budgets, institutions and regulatory frameworks. (UN, 2015) OECD estimates that, beyond
SDG 11, an estimated 65% of the 169 targets behind the 17 SDGs will not be reached without
engagement of local and regional governments (OECD, 2020). From the European perspective,
it is important to mention, inter alia, the European Sustainable Cities and Towns Campaign,
which was initiated by the Aalborg Charter in 1994 aimed to support cities all over Europe to
become more sustainable. It was followed by the Basque Declaration from 2016, which invites
local leaders to find innovative ways to collaborate with the civil society in order to meet
sustainability challenges and increase the well-being of its citizens. Until February 2020, it was
endorsed by 514 cities and regions, 171 organisations and 207 individuals. (sustainablecities.eu,
2020) Local governments in EU were invited to implement, in collaboration with relevant
stakeholders, the Strategy Europe 2020: A strategy for smart, sustainable and inclusive growth
(EC, 2010). In the context of the Strategy, smart cities are initiators of sustainable technological
economic growth; sustainable cities are committed to environmental protection through
sustainable production, sustainable consumption, energy efficiency and renewable sources; and
inclusive cities are committed to social integration, justice, fair relations, poverty elimination,
respect of human rights and dignity. The implementation of sustainable development into the
business practice is usually called as corporate social responsibility (CSR). The concept is
usually related to responsible relations of companies towards their internal and external
stakeholders. CSR, as a systematic concept has been developed in the second part of the XX
century. It has been defined by Howard R. Bowen already in 1953 (Carroll. A.B., 2016). Many
authors (Carroll, A.B.1979, 1991; Kotler, P. and Lee, N. 2004, et al.) as well as many
internationals organizations (World Business Council for Sustainable Development, 1998; the
European Commission, 2006 and 2011, et al.) have recognised companies' responsibility
toward the society. Therefore, after almost seventy years, there is no one universal definition
on CSR. The best known is Carroll's, as follows: “Corporate social responsibility encompasses
the economic, legal, ethical and discretional (philanthropic) expectations that society has of
organisations at a given point in time”. It was original defined in 1979, while in 1991 Carroll
presented it in the form of the CSR pyramid (Carroll, A.B., 2016).
51st International Scientific Conference on Economic and Social Development – Rabat, 26-27 March 2020
523
Dahlsrud, A. (2008) has analysed 37 definitions of CSR, proposed by various institutions and
individual authors. He has concluded that observed definitions were consistently referred to
five dimension, i.e. environmental, social, economic, stakeholder and voluntariness. He notes
that CSR definitions are describing a phenomenon, but fail to propose any guidance on how to
manage the challenges related to its implementation. Social responsibility should not be limited
only to the corporate sector, but it should be implemented in the public governance as well. The
paper is focused on the concept of municipal social responsibility (MSR). Local authorities, as
key carriers of smart, sustainable and inclusive development, should be role models and leaders
of responsible business. Besides, local governments are responsible for the creation of a sound
business environment adjusted to sustainability issues. MSR is the key tool for supporting
sustainable competitiveness, i.e. “the ability of cities to keep growing and developing over time
while fostering social cohesion and environmental quality” (Carvalho, L. et al., 2014, p. 4, in:
Van den Berg, L. et al., eds. 2014). Due to MSR is a complex and multidimensional concept,
the process of implementation differs among cities. Besides, while the impact of CSR in the
business sector have been elaborated in many scientific research studies, the implementation of
MSR in urban governance was elaborated rarely. Tetrevova, L. and Jelinkova, M. (2019)
explain that MSR is related to implementation of activities which municipalities perform within
the framework of their independent sphere of competence above the legal requirement in five
socially responsible fields: economic, environmental, ethical, social and philanthropic. Their
research, applied in 25 statutory cities in the Czech Republic, has shown a high intensity of
MSR activities in the field of economic (97%), social (96%) and environmental responsibility
(93%), followed by philanthropic responsibility (71%), while lowest intensity was related to
ethical responsibility (31%). One important element of MSR is transparent reporting on
sustainability issues to all interested stakeholders. García-Sánchez et al. (2013) have detect
three main factors which encourage or limit sustainability reporting: municipal context, internal
features of public entities and political factors. They recognised the need for national policies,
laws or recommendations which will generate similar levels of transparency among local
governments in order to avoid social dilemma, and the accountability process should be focused
on increasing information about the social and environmental actions and impact of a
municipality. Croatia has 128 cities, populated by 54% of all inhabitants. The key documents
related to sustainable urban development are the Strategy of Regional Development of the
Republic of Croatia 2020 and the forthcoming National Development Strategy of the Republic
of Croatia 2030. The impact of MSR in Croatia have not been elaborated yet. The paper presents
the results of the empirical analysis of the impact of MSR in the city of Pula, Croatia. The city
was chosen as a good practice example considering that MSR has been in the process of
implementation since 2008, as one of the first cities in the country.
3. EMPIRICAL RESEARCH
3.1. Research methodology
The city of Pula, Croatia, is the biggest city of one of the most developed regions in Croatia,
the Istria County. According to the latest Census (2011), it has 57.460 inhabitants and it is
ranked eighth in Croatia. In 2019 it was proclaimed as the most successful city in Croatia due
to the highest average income per capita and a very low share of people at risk of poverty. MSR
is based on three pillars: electronic business (e-documentation system, e-kindergartners, e-
invoices, e-consultations, etc.), quality management system and social responsibility. The
quality management system ISO 9001:2008 was introduced in 2009. In 2014 Pula was the first
town in Croatia committed to the Ten principles of the UN Global Compact (until August 2019).
In the same year it has received, as the first city in the world, the certificate IQNet SR 10. A
documented information security management system ISO 27001:2005 was introduced also in
2014. All three standards have been connected in the integrated management system.
51st International Scientific Conference on Economic and Social Development – Rabat, 26-27 March 2020
524
The first Sustainability report (GRI G4) was published in 2014, the second in 2016. From the
environmental responsibility perspective, the city of Pula was one of the first in Croatia which
has implemented a bike-sharing system, already in 2015. From the social responsibility
perspective, the city supports many NGOs, many of them placed in the Community center Rojc.
The aim of the research was to analyse the impact of MSR to internal processes and relations
with external stakeholders. The main research hypothesis was that the implementation of MSR
improves the internal and external business relations. The research has embraced three groups
of respondents: employees, entrepreneurs and citizens. The research instruments were three
separate questionnaires for each group. The empirical research was realised in October 2019.
3.2. Research results
The research results are presented in three parts. The first part is related to opinions of
employees of the city of Pula regarding the impact of MSR. The second part is related to
opinions of entrepreneurs operating in the city of Pula concerning the implementation of MSR
in the urban governance. The third part is related to opinions of citizens living in the city of
Pula regarding the implementation of MSR. The paper presents selected questions and answers.
The first section presents the employees' opinions regarding the implementation of MSR in the
city of Pula. The research instrument was an on-line questionnaire consisting of 27 questions.
It was sent to all 178 employees of the municipal administration. 35 questionnaires, i.e. 19.7%
were correctly fulfilled and elaborated. The first group of questions was related to employees’
opinions on sustainable development and MSR and the impact of their implementation in urban
governance. The first question was related to respondents’ knowledge about the concepts of SD
and CSR. The majority of them, i.e. 91.4% confirmed their acquaintance with both concepts.
When asked about the implementation of MSR, more than a half of them (57.1%) were
acquainted with it and able to give at least one example of implementation, while 40.0% of
respondents were acquainted, but they were not able to mention neither one example. The
proposed examples were related to norms linked on MSR (e.g. IQNet SR-10, ISO norms), the
Code of Ethics, collaboration with NGOs, volunteering as one of the criteria for the city
scholarship; electronic office, etc. The majority of employees (i.e. 80.0% of them) are
acquainted about a person or department responsible for MSR. Then, respondents were asked
to estimate if the decision making process in the city of Pula considers, in a systematic and
documented way, the impact on the economy, the environment and the society. The majority
of respondents, i.e. 57.1% confirmed that, while 40.0 % consider the impact is being evaluated
in an insufficient way. The second group of questions was related to the employees’ opinions
regarding the implementation of MSR in the city of Pula. The statements were based on Ten
principles of UN Global Compact. The arithmetic mean of all answer was 4.24, which indicates
that employees consider the implementation of MSR in the city of Pula as very successful. The
results are presented in the Table 1.
Table following on the next page
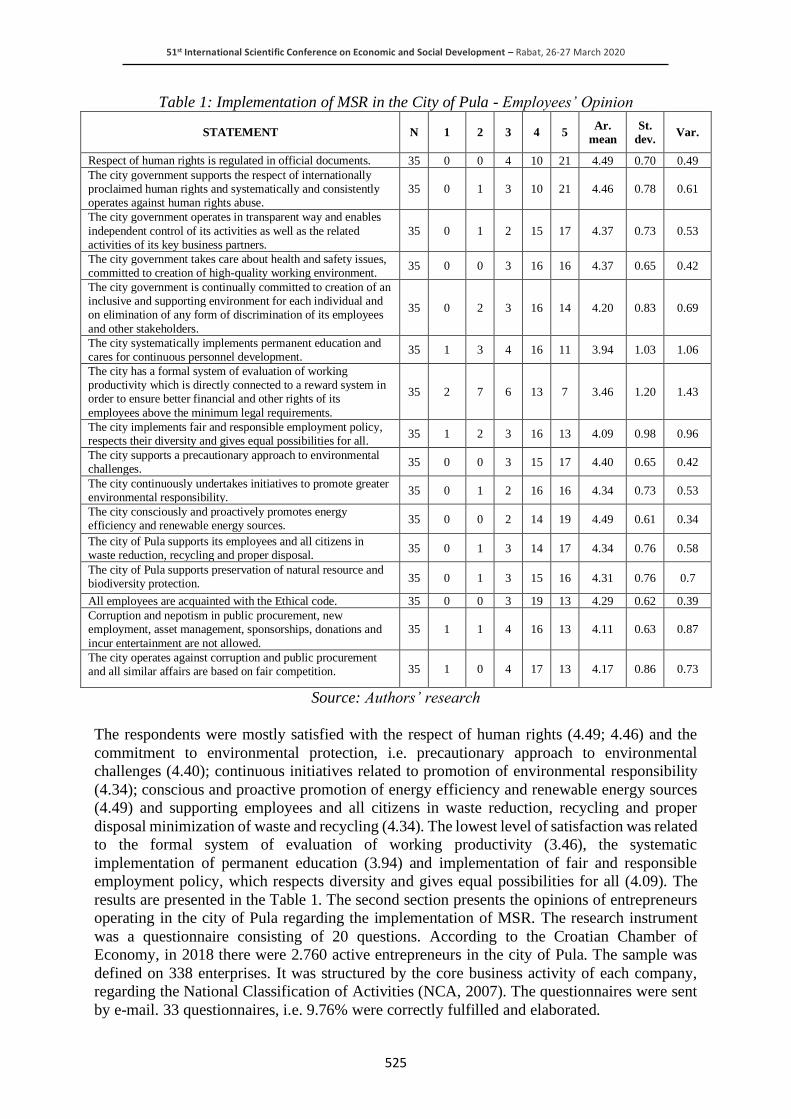
51st International Scientific Conference on Economic and Social Development – Rabat, 26-27 March 2020
525
Table 1: Implementation of MSR in the City of Pula - Employees’ Opinion
STATEMENT N 1 2 3 4 5 Ar.
mean
St.
dev. Var.
Respect of human rights is regulated in official documents. 35 0 0 4 10 21 4.49 0.70 0.49
The city government supports the respect of internationally proclaimed human rights and systematically and consistently operates against human rights abuse.
35 0 1 3 10 21 4.46 0.78 0.61
The city government operates in transparent way and enables
independent control of its activities as well as the related activities of its key business partners.
35 0 1 2 15 17 4.37 0.73 0.53
The city government takes care about health and safety issues, committed to creation of high-quality working environment.
35 0 0 3 16 16 4.37 0.65 0.42
The city government is continually committed to creation of an inclusive and supporting environment for each individual and on elimination of any form of discrimination of its employees
and other stakeholders.
35 0 2 3 16 14 4.20 0.83 0.69
The city systematically implements permanent education and cares for continuous personnel development.
35 1 3 4 16 11 3.94 1.03 1.06
The city has a formal system of evaluation of working productivity which is directly connected to a reward system in order to ensure better financial and other rights of its
employees above the minimum legal requirements.
35 2 7 6 13 7 3.46 1.20 1.43
The city implements fair and responsible employment policy, respects their diversity and gives equal possibilities for all.
35 1 2 3 16 13 4.09 0.98 0.96
The city supports a precautionary approach to environmental challenges.
35 0 0 3 15 17 4.40 0.65 0.42
The city continuously undertakes initiatives to promote greater environmental responsibility.
35 0 1 2 16 16 4.34 0.73 0.53
The city consciously and proactively promotes energy efficiency and renewable energy sources.
35 0 0 2 14 19 4.49 0.61 0.34
The city of Pula supports its employees and all citizens in waste reduction, recycling and proper disposal.
35 0 1 3 14 17 4.34 0.76 0.58
The city of Pula supports preservation of natural resource and biodiversity protection. 35 0 1 3 15 16 4.31 0.76 0.7
All employees are acquainted with the Ethical code. 35 0 0 3 19 13 4.29 0.62 0.39
Corruption and nepotism in public procurement, new employment, asset management, sponsorships, donations and
incur entertainment are not allowed.
35 1 1 4 16 13 4.11 0.63 0.87
The city operates against corruption and public procurement and all similar affairs are based on fair competition. 35 1 0 4 17 13 4.17 0.86 0.73
Source: Authors’ research
The respondents were mostly satisfied with the respect of human rights (4.49; 4.46) and the
commitment to environmental protection, i.e. precautionary approach to environmental
challenges (4.40); continuous initiatives related to promotion of environmental responsibility
(4.34); conscious and proactive promotion of energy efficiency and renewable energy sources
(4.49) and supporting employees and all citizens in waste reduction, recycling and proper
disposal minimization of waste and recycling (4.34). The lowest level of satisfaction was related
to the formal system of evaluation of working productivity (3.46), the systematic
implementation of permanent education (3.94) and implementation of fair and responsible
employment policy, which respects diversity and gives equal possibilities for all (4.09). The
results are presented in the Table 1. The second section presents the opinions of entrepreneurs
operating in the city of Pula regarding the implementation of MSR. The research instrument
was a questionnaire consisting of 20 questions. According to the Croatian Chamber of
Economy, in 2018 there were 2.760 active entrepreneurs in the city of Pula. The sample was
defined on 338 enterprises. It was structured by the core business activity of each company,
regarding the National Classification of Activities (NCA, 2007). The questionnaires were sent
by e-mail. 33 questionnaires, i.e. 9.76% were correctly fulfilled and elaborated.
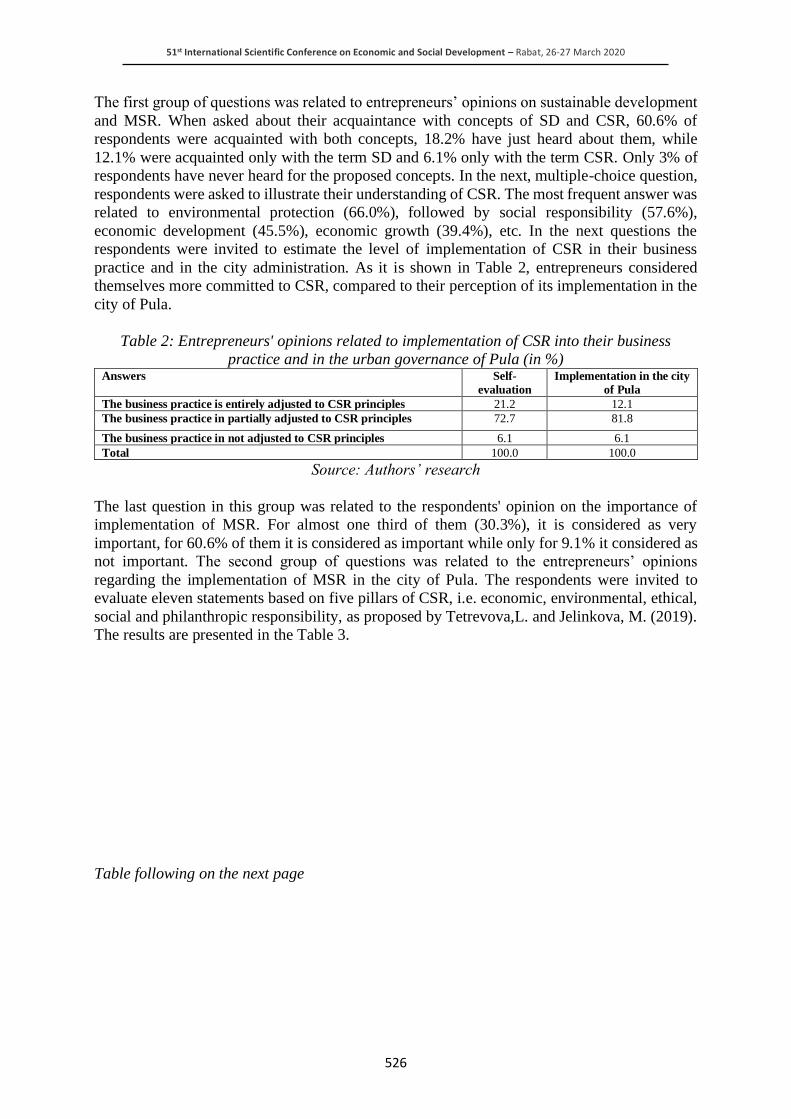
51st International Scientific Conference on Economic and Social Development – Rabat, 26-27 March 2020
526
The first group of questions was related to entrepreneurs’ opinions on sustainable development
and MSR. When asked about their acquaintance with concepts of SD and CSR, 60.6% of
respondents were acquainted with both concepts, 18.2% have just heard about them, while
12.1% were acquainted only with the term SD and 6.1% only with the term CSR. Only 3% of
respondents have never heard for the proposed concepts. In the next, multiple-choice question,
respondents were asked to illustrate their understanding of CSR. The most frequent answer was
related to environmental protection (66.0%), followed by social responsibility (57.6%),
economic development (45.5%), economic growth (39.4%), etc. In the next questions the
respondents were invited to estimate the level of implementation of CSR in their business
practice and in the city administration. As it is shown in Table 2, entrepreneurs considered
themselves more committed to CSR, compared to their perception of its implementation in the
city of Pula.
Table 2: Entrepreneurs' opinions related to implementation of CSR into their business
practice and in the urban governance of Pula (in %) Answers Self-
evaluation
Implementation in the city
of Pula
The business practice is entirely adjusted to CSR principles 21.2 12.1
The business practice in partially adjusted to CSR principles 72.7 81.8
The business practice in not adjusted to CSR principles 6.1 6.1
Total 100.0 100.0
Source: Authors’ research
The last question in this group was related to the respondents' opinion on the importance of
implementation of MSR. For almost one third of them (30.3%), it is considered as very
important, for 60.6% of them it is considered as important while only for 9.1% it considered as
not important. The second group of questions was related to the entrepreneurs’ opinions
regarding the implementation of MSR in the city of Pula. The respondents were invited to
evaluate eleven statements based on five pillars of CSR, i.e. economic, environmental, ethical,
social and philanthropic responsibility, as proposed by Tetrevova,L. and Jelinkova, M. (2019).
The results are presented in the Table 3.
Table following on the next page
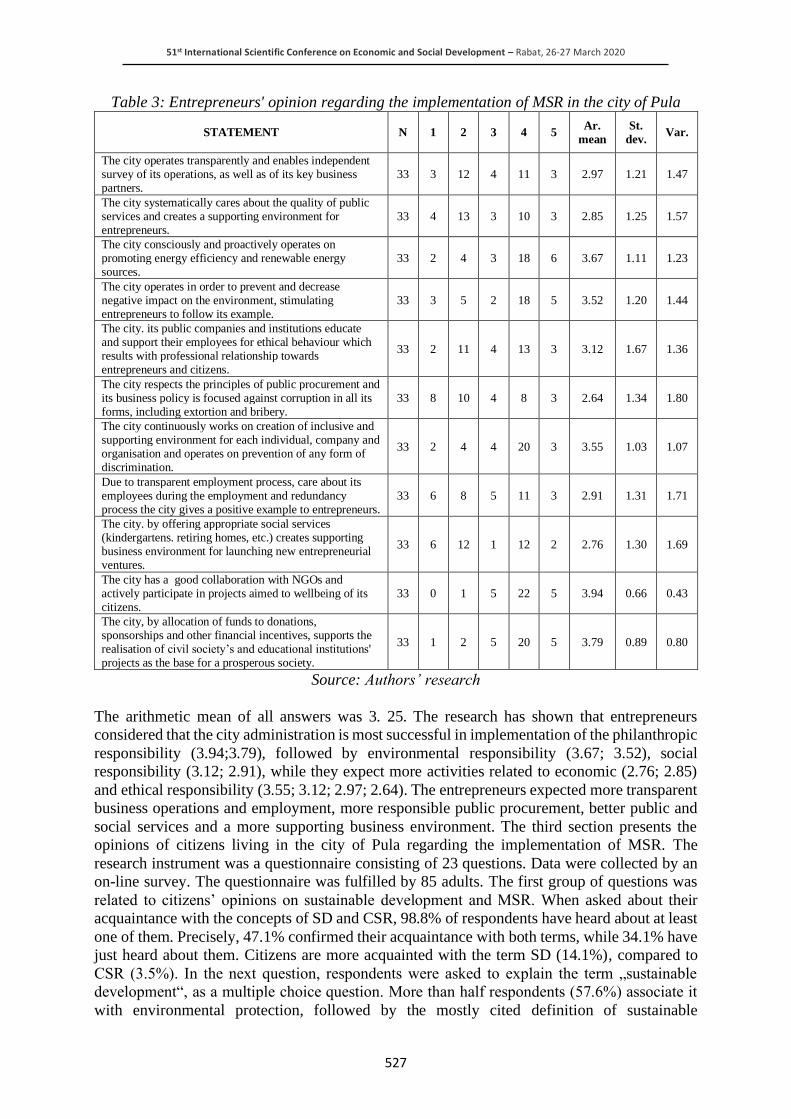
51st International Scientific Conference on Economic and Social Development – Rabat, 26-27 March 2020
527
Table 3: Entrepreneurs' opinion regarding the implementation of MSR in the city of Pula
STATEMENT N 1 2 3 4 5 Ar.
mean
St.
dev. Var.
The city operates transparently and enables independent survey of its operations, as well as of its key business partners.
33 3 12 4 11 3 2.97 1.21 1.47
The city systematically cares about the quality of public services and creates a supporting environment for entrepreneurs.
33 4 13 3 10 3 2.85 1.25 1.57
The city consciously and proactively operates on promoting energy efficiency and renewable energy sources.
33 2 4 3 18 6 3.67 1.11 1.23
The city operates in order to prevent and decrease negative impact on the environment, stimulating entrepreneurs to follow its example.
33 3 5 2 18 5 3.52 1.20 1.44
The city. its public companies and institutions educate and support their employees for ethical behaviour which results with professional relationship towards entrepreneurs and citizens.
33 2 11 4 13 3 3.12 1.67 1.36
The city respects the principles of public procurement and its business policy is focused against corruption in all its forms, including extortion and bribery.
33 8 10 4 8 3 2.64 1.34 1.80
The city continuously works on creation of inclusive and supporting environment for each individual, company and organisation and operates on prevention of any form of discrimination.
33 2 4 4 20 3 3.55 1.03 1.07
Due to transparent employment process, care about its employees during the employment and redundancy process the city gives a positive example to entrepreneurs.
33 6 8 5 11 3 2.91 1.31 1.71
The city. by offering appropriate social services (kindergartens. retiring homes, etc.) creates supporting business environment for launching new entrepreneurial ventures.
33 6 12 1 12 2 2.76 1.30 1.69
The city has a good collaboration with NGOs and actively participate in projects aimed to wellbeing of its citizens.
33 0 1 5 22 5 3.94 0.66 0.43
The city, by allocation of funds to donations, sponsorships and other financial incentives, supports the realisation of civil society’s and educational institutions' projects as the base for a prosperous society.
33 1 2 5 20 5 3.79 0.89 0.80
Source: Authors’ research
The arithmetic mean of all answers was 3. 25. The research has shown that entrepreneurs
considered that the city administration is most successful in implementation of the philanthropic
responsibility (3.94;3.79), followed by environmental responsibility (3.67; 3.52), social
responsibility (3.12; 2.91), while they expect more activities related to economic (2.76; 2.85)
and ethical responsibility (3.55; 3.12; 2.97; 2.64). The entrepreneurs expected more transparent
business operations and employment, more responsible public procurement, better public and
social services and a more supporting business environment. The third section presents the
opinions of citizens living in the city of Pula regarding the implementation of MSR. The
research instrument was a questionnaire consisting of 23 questions. Data were collected by an
on-line survey. The questionnaire was fulfilled by 85 adults. The first group of questions was
related to citizens’ opinions on sustainable development and MSR. When asked about their
acquaintance with the concepts of SD and CSR, 98.8% of respondents have heard about at least
one of them. Precisely, 47.1% confirmed their acquaintance with both terms, while 34.1% have
just heard about them. Citizens are more acquainted with the term SD (14.1%), compared to
CSR (3.5%). In the next question, respondents were asked to explain the term „sustainable
development“, as a multiple choice question. More than half respondents (57.6%) associate it
with environmental protection, followed by the mostly cited definition of sustainable
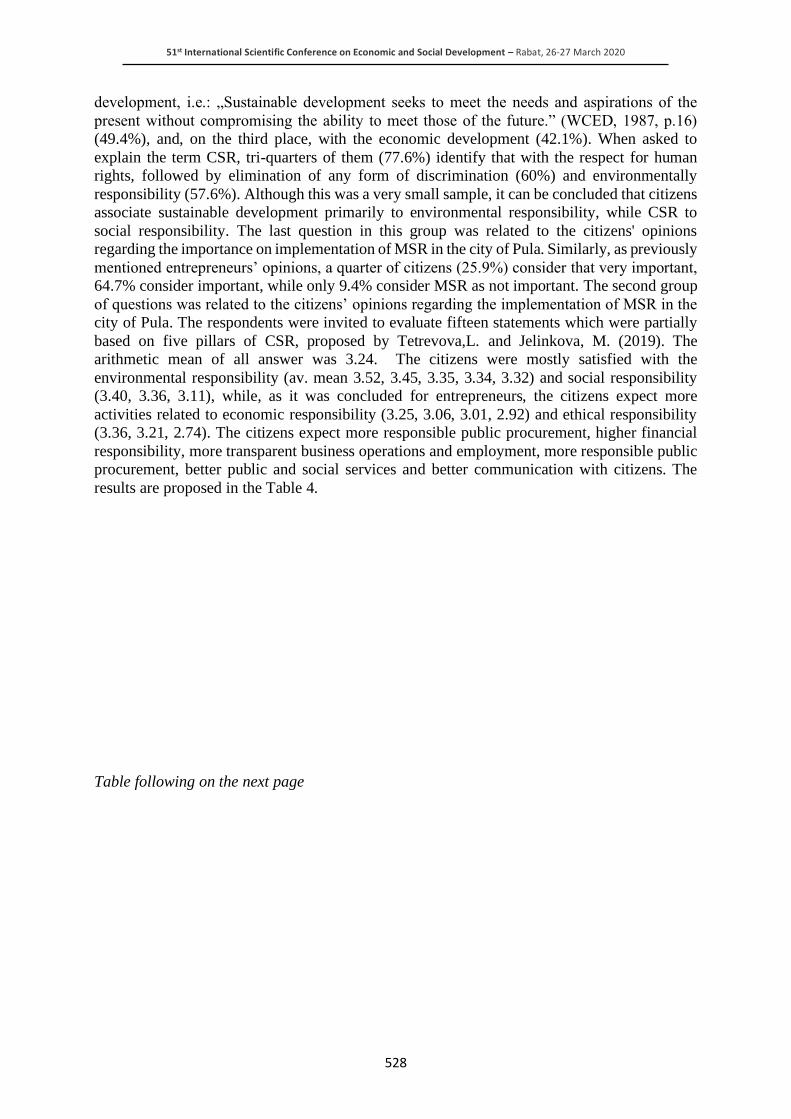
51st International Scientific Conference on Economic and Social Development – Rabat, 26-27 March 2020
528
development, i.e.: „Sustainable development seeks to meet the needs and aspirations of the
present without compromising the ability to meet those of the future.” (WCED, 1987, p.16)
(49.4%), and, on the third place, with the economic development (42.1%). When asked to
explain the term CSR, tri-quarters of them (77.6%) identify that with the respect for human
rights, followed by elimination of any form of discrimination (60%) and environmentally
responsibility (57.6%). Although this was a very small sample, it can be concluded that citizens
associate sustainable development primarily to environmental responsibility, while CSR to
social responsibility. The last question in this group was related to the citizens' opinions
regarding the importance on implementation of MSR in the city of Pula. Similarly, as previously
mentioned entrepreneurs’ opinions, a quarter of citizens (25.9%) consider that very important,
64.7% consider important, while only 9.4% consider MSR as not important. The second group
of questions was related to the citizens’ opinions regarding the implementation of MSR in the
city of Pula. The respondents were invited to evaluate fifteen statements which were partially
based on five pillars of CSR, proposed by Tetrevova,L. and Jelinkova, M. (2019). The
arithmetic mean of all answer was 3.24. The citizens were mostly satisfied with the
environmental responsibility (av. mean 3.52, 3.45, 3.35, 3.34, 3.32) and social responsibility
(3.40, 3.36, 3.11), while, as it was concluded for entrepreneurs, the citizens expect more
activities related to economic responsibility (3.25, 3.06, 3.01, 2.92) and ethical responsibility
(3.36, 3.21, 2.74). The citizens expect more responsible public procurement, higher financial
responsibility, more transparent business operations and employment, more responsible public
procurement, better public and social services and better communication with citizens. The
results are proposed in the Table 4.
Table following on the next page
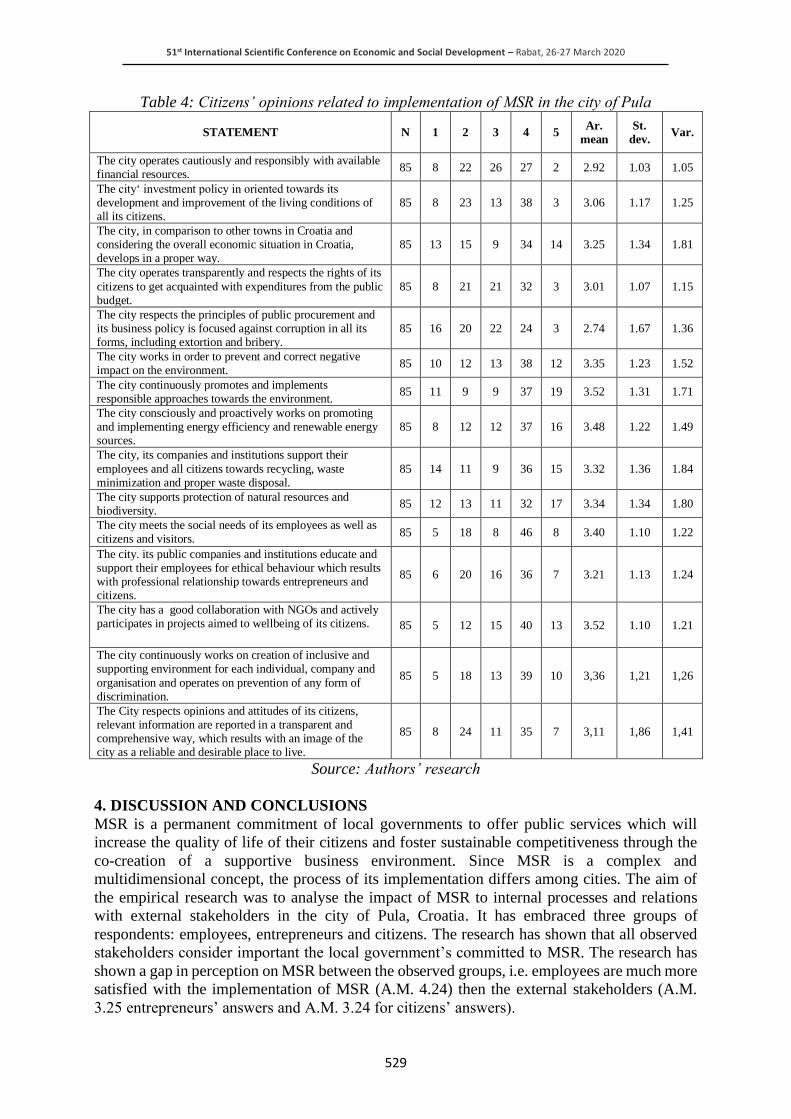
51st International Scientific Conference on Economic and Social Development – Rabat, 26-27 March 2020
529
Table 4: Citizens’ opinions related to implementation of MSR in the city of Pula
STATEMENT N 1 2 3 4 5 Ar.
mean
St.
dev. Var.
The city operates cautiously and responsibly with available financial resources.
85 8 22 26 27 2 2.92 1.03 1.05
The city‘ investment policy in oriented towards its development and improvement of the living conditions of all its citizens.
85 8 23 13 38 3 3.06 1.17 1.25
The city, in comparison to other towns in Croatia and considering the overall economic situation in Croatia, develops in a proper way.
85 13 15 9 34 14 3.25 1.34 1.81
The city operates transparently and respects the rights of its
citizens to get acquainted with expenditures from the public budget.
85 8 21 21 32 3 3.01 1.07 1.15
The city respects the principles of public procurement and its business policy is focused against corruption in all its forms, including extortion and bribery.
85 16 20 22 24 3 2.74 1.67 1.36
The city works in order to prevent and correct negative impact on the environment.
85 10 12 13 38 12 3.35 1.23 1.52
The city continuously promotes and implements responsible approaches towards the environment.
85 11 9 9 37 19 3.52 1.31 1.71
The city consciously and proactively works on promoting and implementing energy efficiency and renewable energy sources.
85 8 12 12 37 16 3.48 1.22 1.49
The city, its companies and institutions support their
employees and all citizens towards recycling, waste minimization and proper waste disposal.
85 14 11 9 36 15 3.32 1.36 1.84
The city supports protection of natural resources and biodiversity.
85 12 13 11 32 17 3.34 1.34 1.80
The city meets the social needs of its employees as well as citizens and visitors.
85 5 18 8 46 8 3.40 1.10 1.22
The city. its public companies and institutions educate and support their employees for ethical behaviour which results with professional relationship towards entrepreneurs and citizens.
85 6 20 16 36 7 3.21 1.13 1.24
The city has a good collaboration with NGOs and actively participates in projects aimed to wellbeing of its citizens. 85 5 12 15 40 13 3.52 1.10 1.21
The city continuously works on creation of inclusive and supporting environment for each individual, company and
organisation and operates on prevention of any form of discrimination.
85 5 18 13 39 10 3,36 1,21 1,26
The City respects opinions and attitudes of its citizens, relevant information are reported in a transparent and comprehensive way, which results with an image of the city as a reliable and desirable place to live.
85 8 24 11 35 7 3,11 1,86 1,41
Source: Authors’ research
4. DISCUSSION AND CONCLUSIONS
MSR is a permanent commitment of local governments to offer public services which will
increase the quality of life of their citizens and foster sustainable competitiveness through the
co-creation of a supportive business environment. Since MSR is a complex and
multidimensional concept, the process of its implementation differs among cities. The aim of
the empirical research was to analyse the impact of MSR to internal processes and relations
with external stakeholders in the city of Pula, Croatia. It has embraced three groups of
respondents: employees, entrepreneurs and citizens. The research has shown that all observed
stakeholders consider important the local government’s committed to MSR. The research has
shown a gap in perception on MSR between the observed groups, i.e. employees are much more
satisfied with the implementation of MSR (A.M. 4.24) then the external stakeholders (A.M.
3.25 entrepreneurs’ answers and A.M. 3.24 for citizens’ answers).
51st International Scientific Conference on Economic and Social Development – Rabat, 26-27 March 2020
530
Employees are probably more acquainted to the city's policies, measures and impacts related to
MSR implementation. Local government should improve the visibility of their activities
through continuous communication with external stakeholders and through annual
sustainability reports. The detected less successful areas should be considered as challenges to
be addressed in a systematic way in the next period. From the employees’ perspective, the
reward system and the activities related to lifelong learning should be improved. From the
entrepreneurs’ perspective, the research has shown that they expect more stringent respect of
principles of public procurement, more efficient anti-corruption measures, better social services
and a more supporting business environment. From the citizens’ perspective, the research has
shown that they expect more stringent respect of principles of public procurement, more
efficient anti-corruption measures and more cautious and more responsible public expenditures.
ACKNOWLEDGEMENT: “This paper is a result of scientific project "The Determinants and
Challenges of Competitiveness" supported by the Faculty of Economics and Tourism "Dr. Mijo
Mirković", Juraj Dobrila University of Pula. Any opinions, findings, and conclusions or
recommendations expressed in this paper are those of the authors and do not necessarily reflect
the views of the Faculty of Economics and Tourism "Dr. Mijo Mirković" Pula."
LITERATURE:
1. Carroll, A. B. (2016). Carroll's pyramid of CSR: taking another look. Internationl Jopurnal
of Corporate Social Responsibility. Retrieved 10.08.2019 from
https://jcsr.springeropen.com/articles/10.1186/s40991-016-0004-6
2. Dahlsrud, A. (2006). How Corporate Social Responsibility is Defined: an Analysis of 37
Definitions. Corporate Social Responsibility and Environmental Management. 15, 1–13.
Wiley InterScience. DOI: 10.1002/csr.132. Retrieved 12.05.2019 from
https://onlinelibrary.wiley.com/doi/epdf/10.1002/csr.132
3. EC (2010). EUROPE 2020: A strategy for smart, sustainable and inclusive growth.
European Commission. Retreved 01.06.2019 from
https://ec.europa.eu/eu2020/pdf/COMPLET%20EN%20BARROSO%20%20%20007%20
-%20Europe%202020%20-%20EN%20version.pdf
4. García-Sánchez, I.M.; Frías-Aceituno, J.V.; Rodríguez-Domínguez, L. (2013).
Determinants of corporate social disclosure in Spanish local governments. Journal of
Cleaner Production 39. pp. 60–72. Retreved 01.06.2019 from
https://www.researchgate.net/publication/264541314_Determinants_of_corporate_social_
disclosure_in_Spanish_local_governments
5. ICLEI (2019). Resilient cities, thriving cities: the evolution of urban resilience. Local
Governments for Sustainability; Bonn, Germany. Retrieved 01.06.2019 from http://e-
lib.iclei.org/publications/Resilient-Cities-Thriving-Cities_The-Evolution-of-Urban-
Resilience.pdf
6. Kotler, P., Lee, N. (2004). Corporate Social Responsibility: Doing the Most Good for Your
Company and Your Cause. Wiley, USA
7. OECD (2020). Achieving the SDGs in cities and regions. Retrieved 20.05.2019 from
http://www.oecd.org/about/impact/achievingthesdgsincitiesandregions.htm
8. Sustainable Cities Platform. Retrieved 10.05.2019 from https://sustainablecities.eu
9. Tetrevova L., Jelinkova M. (2019): Municipal Social Responsibility of Statutory Cities in
the Czech Republic. Sustainability 11(8), 2308; https://doi.org/10.3390/su11082308.
Retrieved 10.06.2019 from https://www.mdpi.com/2071-1050/11/8/2308
10. UN (2015). Transforming our world: the 2030 Agenda for Sustainable Development.
Retrieved 10.05.2019 from
https://www.un.org/ga/search/view_doc.asp?symbol=A/RES/70/1&Lang=E

51st International Scientific Conference on Economic and Social Development – Rabat, 26-27 March 2020
531
11. UN (2000). UN Global Compact. Retrieved 15.06.2019 from
https://www.unglobalcompact.org/
12. UNCED (1992). Agenda 21. United Nations Conference on Environment & Development.
Rio de Janerio, Brazil. Retrieved 02.05.2019 from
https://sustainabledevelopment.un.org/content/documents/Agenda21.pdf
13. Van den Berg, L. et al. (Eds.) (2014). Cities as Engines of Sustainable Competitiveness
European Urban Policy in Practice, Ashgate, Surrey, UK
14. WCED (1987). Report of the World Commission on Environment and Development: Our
Common Future. UN World Commission on Environment and Development. Retrieved
10.05.2019 from https://sustainabledevelopment.un.org/content/documents/5987our-
common-future.pdf
51st International Scientific Conference on Economic and Social Development – Rabat, 26-27 March 2020
532
CONCEPT OF BUSINESS ACCOUNTING AND INTEGRATED
REPORTING
Victor Plotnikov
Novosibirsk State University of Economics and Management «NINH»,
Russian Federation
Olesya Plotnikova
Novosibirsk State University of Economics and Management «NINH»,
Russian Federation
ABSTRACT
The concept of accounting for the facts of economic life that currently dominates in accounting
cannot be considered hopelessly outdated. At least, the model of accounting and accounting
(financial) reporting built on this concept provides information to most stakeholders about
external verifiable indicators that characterize the financial position of an organization.
However, it should be recognized that the concept of accounting for the facts of economic life
no longer meets the needs of the modern market economy, since it does not allow to assess the
quality and stability of financial indicators. There is no element of foresight in this concept,
that is, information about what facts of economic life are expected in the future. The market
approach shifts the focus of accounting from the information needs of owners to a wider circle
of stakeholders, which requires the presentation of such information about value creation
processes, on the basis of which it would be possible to optimally distribute capital among all
participants in market relations and reflect the effects of a combination of external and internal
factors, providing or negatively affecting the sustainable development of the organization. The
formation and development of a new concept - the International Concept of Integrated
Reporting (IIRC) in the development of accounting as an economic science, can be described
as information support for a business model on the processes of creating value in the short,
medium and long term. IIRC is based on a new, truly, promising and progressive approach -
taking into account the transformation of various types of capital in the process of creating
value over time. Therefore, today, with the involvement of a wide range of specialists, the
accounting community faces a fundamental task - using integrated thinking (knowledge and
skills of intellectual capital), to develop a model of accounting (business accounting and
integrated reporting) in order to provide information to financial capital providers and other
stakeholders reflecting threshold values of indicators characterizing the sustainable
development of the business model of creating value over time, taking into account the risks
associated with efficient use of various types of capital, within which the business model creates
value.
Keywords: business model, business accounting, integrated reporting
1. INTRODUCTION
The scholastic question of whether accounting is an economic science is raised only in Russia.
We owe the emergence of such a question to the legacy of the command-administrative
economic system of the Soviet period, when not only accounting, but also economic science,
in general, was almost completely destroyed. Nevertheless, over the past 20 years, economic
science in Russia, which has considerable freedom of thinking in propositions, conclusions, and
proposals, has more than managed to overcome the barriers of instructions and commands
coming from above.

51st International Scientific Conference on Economic and Social Development – Rabat, 26-27 March 2020
533
At the same time, accounting as the most conservative science remains at some intermediate
stage of Russia's economic development. Thus, a certain gap was formed between economic
theory and accounting as a mechanism that forms an empirical basis for theoretical research. In
order to bridge this gap, it is necessary to more decisively use institutional theory approaches
in accounting. In countries with developed market economies, institutional theory has been
largely accepted in accounting studies as the basis of its methodological structure. More
specifically, drawing on various Institutional theory strands such as New Institutional theory
and Old Institutional Economics, complementary with change management theories, a
complete theoretical framework is formulated. This approach intends to grasp - through a deep
understanding of institutions, routines and change, both planned and unplanned and to what
extent accounting change is related to the adoption of Integrated Reporting (Katsikas Е., Rossi
F.M., Orelli R.L., 2017, p.24). Accounting, operating in the economic categories of institutional
theory, should give significance to facts, study these facts and provide an impetus for wider and
more productive research. Accounting science should make clear their understanding and
interpretation to create a conceptual framework for formulating principles and developing rules
or other guidelines for their application in a business accounting system that generates
information for integrated reporting. The International Integrated Reporting Concept (IIRC)
develops new conceptual approaches in accounting as in economic science, more precisely,
draws attention to its individual theoretical aspects, confirming that «accounting is not a
mechanical adherence to a set of rules that a computer can successfully execute, but at the
highest social science» (Hendricksen, p.78). At the same time, both in IIRC and many scientists
emphasize «is that IR makes sense only if it is the result of «integrated thinking» developed
inside the organization—without integrated thinking the process of IR may be little more than
a marketing activity (Katsikas Е., Rossi F.M., Orelli R.L., 2017, p.7). The fundamental IR
concepts identified in IIRC are currently at the stage of their adoption and approval, when more
and more companies around the world recognize the IR hypothesis as a necessary truth, which
allows to more reliably assess the degree of sustainability and development prospects of the
organization. Unfortunately, at the moment, South Africa is the only country in which IR is
mandatory by law (Black Sun - IIRC, 2014, 2015). However, surly, numerous European
countries have legislation on sustainability reporting. This fact can be described as a serious
step towards the recognition of integrated reporting. However, to date, the most difficult task
facing the developers of integrated reporting, in our opinion, is the use of a wide range of non-
financial indicators recommended by IIRC, and their inclusion in the balanced IR system as a
reserve of the value of certain types of capital (human, client, social etc.). To solve this problem,
measurement and quantification of non-financial indicators and their integration with financial
indicators, for example, in an integrated balance sheet, will be required. It is such an integrated
balance that will be more understandable for most investors.
2. CHAPTER CONCEPT OF BUSINESS ACCOUNTING AND INTEGRATED
REPORTING
In the 21st century, global changes in the economy, including those associated with the
formation of the digital economy, are taking place under the conditions of the traditional system
of accounting and financial reporting. Moreover, some accounting researchers argue that the
modern accounting model does not require fundamental changes and is sufficient for practical
use by professional accountants. The current model of current financial statements does not
allow its users to reliably assess the quality and sustainability of the financial results of the
organization’s activities in the future and, as A. Thomas noted, «it is becoming increasingly
obvious that the price of this inability to assess the sustainability of corporate effectiveness is
much higher than the financial consequences of ruining an individual corporations. This
question concerns us all» (Black E., 2009, p. 127).

51st International Scientific Conference on Economic and Social Development – Rabat, 26-27 March 2020
534
Currently, the world professional community is making serious efforts to modernize accounting
and its theory. The most successful attempt, in our opinion, is the development of IIRC, aimed
at creating effective characteristics that describe the economic resources of the organization
when reflecting accounting objects. This concept can be attributed to the most promising
direction in the development of accounting theory and is characterized as of great general
economic importance. Integrated reporting becomes a strategic communication tool for
integrating various points of view on value creation, offering a new understanding of
approaches to sustainable development, corporate governance, as well as all types of capital
(Plotnikov V.S., Plotnikova O.V., 2019). The main content of IIRC can be described as follows.
Existing approaches to business valuation based on actual reporting indicators are inevitably
outdated. In the traditional financial statements there is no reflection of such types of capital as
intellectual capital, client capital, social capital, etc., which significantly reduces the value of
the business in its assessment. The costs of customer-forming activities, for research
(innovative) research, social activities are traditionally included in management expenses and
are recognized as expenses of the period and are charged to the cost of production (works,
services). Therefore, the primary objective of business accounting should be recognized as the
capitalization of the listed costs with their subsequent reflection in the structure of the balance
sheet assets as client capital, intellectual capital, social capital, etc. Capitalization of costs and
their exclusion from the cost of production only through accounting procedures can ensure the
profit growth of commercial organizations, which will affect not only the accounting system,
but also the country's economy. Our proposed concept will require restructuring of both the
theory and the accounting methodology, at least maintaining the priority of double entry and
balance. This will increase the prestige of accounting and make it a true economic science. The
goal of developing a business accounting model and integrated reporting is to provide financial
capital providers and other stakeholders with information reflecting threshold values of
indicators characterizing the sustainable development of the business model and the stages of
its value-creation life cycle over time, taking into account risks associated with the efficient use
of various types capital within which the business model creates its value. Focusing on financial
capital providers making decisions on its distribution and use, the integrated report should
reflect the organization’s business model strategy, which «represents a system of transforming
resources through its commercial activities into products and results aimed at achieving the
organization’s strategic goals and creating value over the short, medium and long term» (ISIR,
2013, p. 4.11). Thus, it is possible to determine the main systemic tasks of business accounting
in a business model, each of which requires solving related tasks:
1. information support of the entry system, i.e. systems for assessing the available stock of
capital for its adequacy for the sustainable development of a business model for creating
value over time;
2. information support of actions in the life cycle of converting resources (capital) into a new
value over time. In essence, this task can be successfully solved in the traditional system of
financial accounting and reporting;
3. information support for the outputs of the business model, i.e. information about what
changes in the cost of various types of capital have occurred or are expected as a result of
actions to create value in the short, medium and long term.
The solution of these problems requires a shift in emphasis from the professional thinking of
accountants to the formation of integrated thinking, which not only determines the ability to
understand the relationship between the various operational and functional units of the
organization and its capital, it is much wider. Integrated thinking is the ability to combine
related economic research that explains the processes of value creation over time and their
importance in ensuring the sustainable development of the organization.
51st International Scientific Conference on Economic and Social Development – Rabat, 26-27 March 2020
535
At the same time, business accounting should become a mechanism of information support,
including business analysis, which acts as a motivational element for confirming or making
decisions of financial capital providers in the allocation of resources necessary to create value
in the short, medium and long term. Therefore, business accounting is an information system
of a business model about the processes of creating value and value growth, reflecting the
measurement of the results of organizations. This system should be based on information on
the forecast and actual capital stocks needed to finance the value creation processes, expressed
quantitatively in the form of liabilities that provide financial support for value creation objects
- economic resources. The result of the functioning of such an information system for reflecting
actions to transform economic resources and liabilities into facts of economic life (the value of
earned income) is the creation of an integrated report reflecting the change in all types of capital
and future prospects. It should be noted that in ISIR, in contrast to the traditional balance sheet
theory, capital is treated as resources, that is, assets of the organization, and not its liabilities.
Therefore, the overall goal of classifying capital stocks for accounting is to create an orderly
capital structure of the organization. Without such a structure, the efficient management of
capital accounts and their alignment with economic benefits are impossible (Plotnikov V.S.,
Plotnikova O.V., 2019). The results of assessing the possibilities of using various types of
capital should be interlinked with the objects of creating value in time. In other words, a balance
should be formed of economic resources (value objects) and obligations (financing of value
creation processes), ensuring the functioning of the business model of value creation in the
future. The identification of value objects and the specification of their assessment imply the
existence of certain criteria, and the criteria themselves depend on the purpose of the
assessment. The objectives of the assessment are interlinked with the identification of objects
accounted for as elements of financial capital. In ISIR, financial capital is interpreted as follows:
«Financial capital is a reserve of funds that: o are available to the organization for use in the
production of goods or the provision of services; o come through financing (debt, equity
financing and grants) or are created as a result of operations or investments» (ISIR, 2013, clause
2.15). This is not an exhaustive list of stock items of financial capital value. However, to speak
of the category of financial capital as a reserve of funds and, first of all, as a reserve of cash is
not entirely correct, since their largest amount is used in the process of creating value in the
short term. The situation is different with cash inflows, which should be used to form a stock
of the value of other types of capital of the organization in the medium and long term. However,
the formation of a reserve of funds for these purposes is also impractical. This will mean the
diversion of funds from circulation. In this case, the reserve of financial capital should be
included in the integrated reporting as an economic resource, that is, «a right that has the
potential to create economic benefits» (СFPFS, p.4.14) and reflect this right as part of the
elements of financial capital in the integrated balance sheet asset. With this approach in mind,
the main task of business accounting of financial capital can be formulated as follows:
assessment of the possibility of forming an economic resource of financial capital to form a
stock of the cost of other types of capital, taking into account the value of these capital for the
organization and the environment. Regarding production capital, the integrated report should
explain what types of assets should be included in the business model in order to increase
operating profit and increase the efficiency of the value creation process over time. The need
and the possibility of attracting additional production capital should be assessed, linking this to
the financing scheme, i.e. using financial capital. In addition, an analysis of the diversion of
production capital from the existing business model is required without prejudice to its
sustainable development and viability, or during their liquidation. The importance of human
capital should be confirmed by an analysis of the key skills and experience of employees using
their abilities to effectively create value. Particular attention should be paid to the ability of
human capital to form intellectual capital, which is a vital component of the business model of
51st International Scientific Conference on Economic and Social Development – Rabat, 26-27 March 2020
536
value creation over time. Of course, intellectual capital is very difficult to form completely,
proceeding only from the possibilities of its own human capital. It is necessary to attract third-
party intellectual capital in the form of patents and patented knowledge, etc. Therefore, the use
of both human and intellectual capital should be linked to the general financing scheme, i.e. use
of financial capital. In the same sequence, one can consider other types of capital (natural,
environmental, social, etc.). The main thing is that the business accounting model reflects the
economic resources of the organization for the formation of the stock of value of all types of
capital. At the same time, business accounting should provide information to financial capital
providers about the sequence of transformation of the right to use cash and other assets into
stocks of the value of certain types of capital. That is why ISIR, when determining users of
integrated reporting, emphasizes that «financial capital providers are interested in the value that
the organization creates for itself. They are also interested in the value that the organization
creates for others when it affects the organization’s ability to create value for itself or relates to
the stated purpose of the organization (for example, an explicit social goal) that affects their
estimates »(ISIR, 2013, p. 2.5). Integrated reporting is the result of integrated thinking that can
reflect and explain information about the processes of value creation in the short, medium and
long term. Integrated thinking, in our opinion, not only determines the ability to understand the
interconnectedness and interdependence between its various operational and functional units
and capitals, it is much broader. Integrated thinking is the ability to combine related economic
research, which is able to explain the processes of value creation over time and their
significance both for the organization and for society as a whole. In this case, we should
consider the process of institutionalization of integrated thinking, which can bridge the gap
between economic theory and accounting theory. We would call this process economic art,
which John N. Keynes defines as «art ... is a system of rules to achieve a given goal» (Keynes,
1899 [1891], p.27-28, 36; The philosophy of economics. An Anthology, 2012, p. 177). Perhaps
that is why the content of the integrated report is determined by leading principles designed to
achieve a balance between financial and non-financial indicators in an integrated balanced
scorecard, rather than standards.
3. CONSLUSION
The design of the business accounting model can be represented in the form of several logically
interconnected stages:
1. Forecasting the use of various types of capital (individually and collectively) to ensure the
sustainable development of the organization’s business model with reflection in the
integrated balance sheet as economic resources (production, human, intellectual, etc.) and
liabilities (facility financing scheme value creation).
2. Assessment of the possibility of using available resources and the need to attract outside
capital, which is reflected in the conversion of economic resources and liabilities into facts
of economic life (assets and liabilities).
3. Reflection of actions on the use of resources within the framework of individual business
models of creating value over time and actions that ensure the increase in the value of
capital.
4. Determination of changes in measuring the value of certain types of capital at the output of
a separate business model.
5. Consolidation and synthesis over time of information on the creation of value and changes
in capital in the whole organization with its reflection in the integrated reporting of the
organization.
The main thing that you need to pay special attention to the developers of the business
accounting model is to provide financial capital providers with information about the

51st International Scientific Conference on Economic and Social Development – Rabat, 26-27 March 2020
537
distribution of resources among the objects of the value creation life cycle in time. Therefore,
at each stage of the life cycle of creating value, key indicators of activity parameters should be
highlighted, expressed as economic resources and obligations involved in the process of
creating value in the short, medium and long term. In fact, we are talking about fixing in time
information about the creation of values throughout the life cycle that forms the value of a
business model.
LITERATURE:
1. Black, E. (2009). Cost issues. Master the latest management, investing and regulation
techniques based on company value. Moscow, Russia: Olymp-Business CJSC.
2. Bhasin, M.L. (2016). Voluntary Reporting of Corporate Governance Information in Annual
Reports: An Empirical Study of an Asian Country. International Journal of Management
Sciences and Business Research, 5(7), 71-95.
3. Black Sun - IIRC, 2014, 2015.
4. СFPFS (Conceptual Framework for the Presentation of Financial Statements). (2018).
Retrieved 15.09.2019 from https://www.minfin.ru/ru/document/?id_4=125979.
5. De Villiers, C., Rinaldi, L. and Unerman, J. (2014). Integrated Reporting: Insights, Gaps
and an Agenda for Future Research, Accounting, Auditing & Accountability Journal, 27
(7), 1042–67.
6. Hendricksen, E.S. (1997). Theory of accounting. Moscow, Russia: Finance and Statistics.
7. Humphrey, C., O‘Dwyer, B. and Unerman, J. (2015). The Rise of Integrated Reporting:
Understanding Attempts to Institutionalize a New Corporate Reporting Framework. The
British Accounting and Finance Association Conference, Manchester, April.
8. ISIR (International Standard for Integrated Reporting). (2013). Retrieved 05.01.2020 from
http://ir.org.ru/attachments/article/94/13-12-08-THE-INTERNATIONAL-IR-
FRAMEWORK.docx_en-US_ru-RU.pdf.
9. Katsikas, Е., Rossi, F.M., Orelli, R.L. (2017). Towards Integrated Reporting Accounting
Change in the Public Sector. SpringerBriefs in Accounting. Springer International
Publishing, Switzerland.
10. Kenys, J.N. (1899 [1891]). The subject and method of political economy. Moscow, Russia:
I.A. Baladin.
11. Plotnikov, V.S., Plotnikova, O.V. (2019). Capitalization stock capitalization model in
integrated reporting. Economic and Social Development. Book of Proceedings 47th
International Scientific Conference on Economic and Social Development, November
Prague: Varazdin Development and Entrepreneurship Agency, 375-382.
12. Plotnikov, V.S., Plotnikova, O.V. (2018). Business Combinations and Consolidated
Financial Statements: A Monograph. Moscow, Russia: INFRA-M.
13. The philosophy of economics. Аn Anthology (2012). Moscow, Russia: Publishing house of
the Gaidar Institute.

51st International Scientific Conference on Economic and Social Development – Rabat, 26-27 March 2020
538
INTERCULTURAL LEARNING THROUGH THE ERAMUS STUDENT
MOBILITY PROGRAMME
Violeta Vidacek-Hains
University of Zagreb, Faculty of Organization and Informatics Varaždin, Croatia
Amalija Parlaj
University of Zagreb, Faculty of Organization and Informatics Varaždin, Croatia
ABSTRACT
The Erasmus Mobility Programme is a European project that provides an opportunity for
higher education students and staff to network and gather professional and social intercultural
competences. Incoming and outgoing students have an opportunity to attend courses at different
universities all over the world. The main goals of this research is to explore the challenges and
benefits for students who have studied in a foreign country. Student feedback is compared to
feedback provided by officers from international relations units in different countries. The
Respondents are 32 incoming Erasmus University students from France, Belgium and Albania
who spent a semester in Croatia, and Croatian outgoing students who participated in Erasmus
Programme in different European countries (Portugal, Spain, Check Republic, Slovakia). For
the purposes of this research a questionnaire (IROQ) linked to student experiences was created.
International relations officers participated in interviews and shared their opinions about the
advantages and challenges of the Erasmus Programme. Student feedback was analyzed in terms
motivation and the goals that students tried to accomplish. Student evaluation of the quality of
the Erasmus Programme was explored. Results showed that students from different countries
positively evaluated the Erasmus Programme. Programme was very useful for students and that
their perception of its quality was high, but there were also some additional issues that could
be improved (such as overlapping classes, financing, ECTS transfer, courses in English
improvement etc.). These results could be used for planning and creating Erasmus preparatory
workshops about student challenges and opportunities. Students’ international experiences
could be valuable information that could be used to create Erasmus mobility.
Keywords: Erasmus Mobility, Students, Communication
1. INTRODUCTION
Globalization in education includes many changes in comparison to previous educational
practice. One of those changes is international student and staff mobility. International student
mobility is a period of learning abroad with formal and non-formal models of education. The
main aim of international student mobility programmes is to include young people and adults
in programmes which will enhance their personal and professional development (European
Parliament Council, 2006, p.p.8 according to Wells, 2014). According to research (İlter, 2016),
student participation in the Erasmus Programme has many benefits, such as the development of
linguistic and cultural competences, broader perception, a higher level to tolerance and a better
understanding of cultural values. Students who participated in the Erasmus Programme reported
a higher level of problem-solving competences and development of their communication
competences. Bryła (2015 a) reported that more than 2/3 of students are generally satisfied with
international student mobility. Students emphasized that they improved their foreign language
skills, made international friendships, developed their intercultural awareness and become more
self-confident. It is interesting that 90% of students with international experience would
recommend international mobility to their friends and peers.

51st International Scientific Conference on Economic and Social Development – Rabat, 26-27 March 2020
539
Student satisfaction and academic achievement depends on the elements of and effective
learning environment within a university. An effective learning environment is an open system
of variable factors that influence the effectiveness of student learning from the perspective of
learners, faculty, administrators and professional staff (Appatova and Prats, 2008). Student
motivation, academic achievement and further career development can be increased by creating
a learning environment in curricula and extracurricular activities (Vermeulen and Schmidt,
2008). Communication and interaction are important parts of student exchange programmes
and not only formal but also informal elements of curriculum can increase student satisfaction
and achievement. Informal communication and student networking are important parts of the
internalizations of HE institutions (Leask, 2009). A specific type of student internalization in
higher education is double degree study. Students with double degree international experience
considered their international experience as an opportunity to build relationships. This research
confirmed the importance of having professional relations with partner universities in double
degree joint programs (Nedelcu and Ulrich, 2014). There are various factors linked to student
satisfaction with international mobility experience. Individual differences in coping styles is
one of them. Hill and Iyer (2010) find differences between students with high and low coping
styles in terms of their satisfaction with their international study abroad experience. Students
who have a more active coping style feel more satisfied with their international experiences in
comparison with students with lower coping skills. The Erasmus student experience is
important not only for study achievement but also for future career development. Students with
Erasmus mobility experience reported that their international mobility had a positive impact on
their academic success, personal development, employment and career (Engel, 2010).
International experience is well recognized by employees and provides a competitive advantage
to students with international mobility experience compared with students with similar
qualification without international experience. Students recognize the benefits of international
experience, such as personal development, growing-up experience, character building and self-
esteem. They emphasize networking as an important part of their private and professional life
(Ferencz et al, eds., 2013). Bryła (2015 b) reported that alumni students who participated in the
Erasmus Programme during studding, considered language skills and tertiary education as most
important factors in their professional career and current job position. The research was
conducted 4-5 year after their Erasmus mobility experience. Majority of them (nearly 70 %)
had additional working abroad experience. Approximately 30% think that Erasmus experience
is highly related to their successful job career. Students choose different counties for their
international experience for different reasons. There are some economic and education criteria
that affected students’ decision about their preferred country. International students from
developed countries consider educational factors as the most important for choosing a country
for their international mobility, while students from non-developed countries evaluated
economic and educational factors similarly important in the process of choosing a country for
their international mobility. The volume of merchandise traded between countries also
determined their choice, which means that better collaboration between countries facilitated
student mobility (Wei, 2013). Some Erasmus students with international experience did not
evaluate the international studying experience as an experience that increased their income and
social status (Teichler and Janson, 2007), while others reported that the intercultural
environment of Spain, Portugal, Lithuania, Turkey and Iran increased their professional
development and concurrency in the competitive labour market (Kumpikaitė et al, 2012).
According to Teichler (2012), European policies need to ensure more quality and intra-
institutional diversity. The number of students that included in international mobility
programmes is growing each year. In the middle of last century, the approximate number of
students that studied abroad was 200,000, while in 2012 this number was more than 2 million
(Wells, 2014).
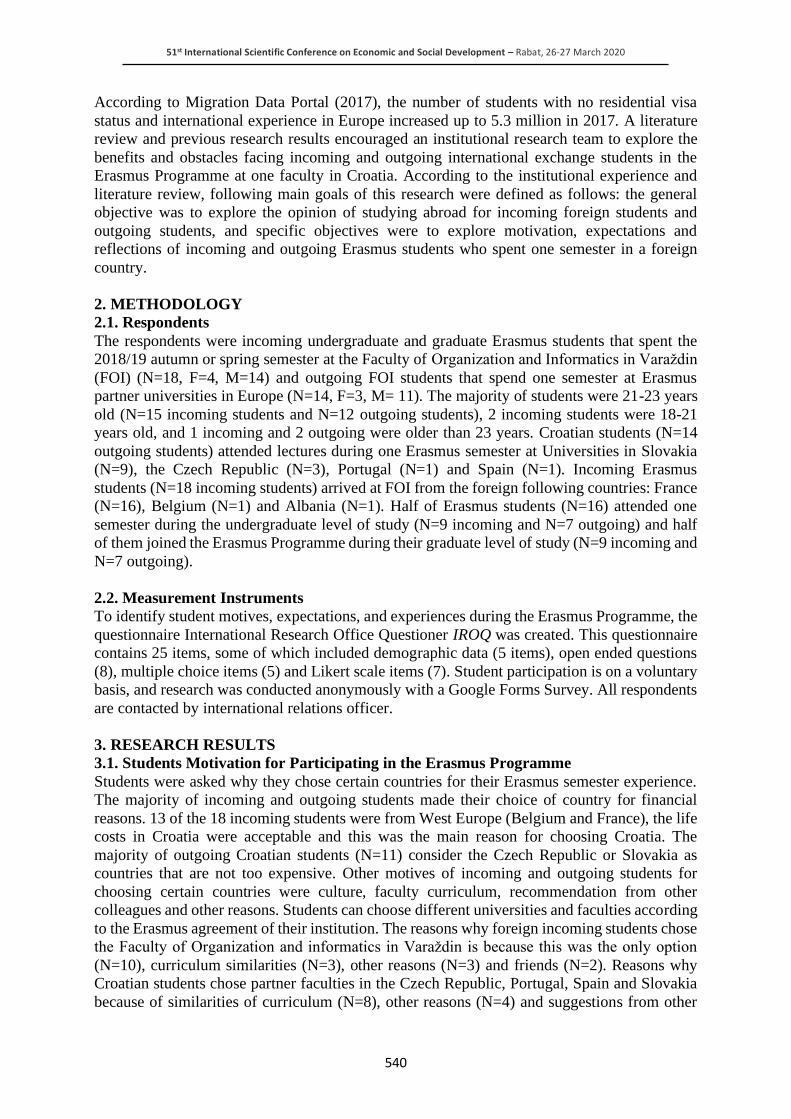
51st International Scientific Conference on Economic and Social Development – Rabat, 26-27 March 2020
540
According to Migration Data Portal (2017), the number of students with no residential visa
status and international experience in Europe increased up to 5.3 million in 2017. A literature
review and previous research results encouraged an institutional research team to explore the
benefits and obstacles facing incoming and outgoing international exchange students in the
Erasmus Programme at one faculty in Croatia. According to the institutional experience and
literature review, following main goals of this research were defined as follows: the general
objective was to explore the opinion of studying abroad for incoming foreign students and
outgoing students, and specific objectives were to explore motivation, expectations and
reflections of incoming and outgoing Erasmus students who spent one semester in a foreign
country.
2. METHODOLOGY
2.1. Respondents
The respondents were incoming undergraduate and graduate Erasmus students that spent the
2018/19 autumn or spring semester at the Faculty of Organization and Informatics in Varaždin
(FOI) (N=18, F=4, M=14) and outgoing FOI students that spend one semester at Erasmus
partner universities in Europe (N=14, F=3, M= 11). The majority of students were 21-23 years
old (N=15 incoming students and N=12 outgoing students), 2 incoming students were 18-21
years old, and 1 incoming and 2 outgoing were older than 23 years. Croatian students (N=14
outgoing students) attended lectures during one Erasmus semester at Universities in Slovakia
(N=9), the Czech Republic (N=3), Portugal (N=1) and Spain (N=1). Incoming Erasmus
students (N=18 incoming students) arrived at FOI from the foreign following countries: France
(N=16), Belgium (N=1) and Albania (N=1). Half of Erasmus students (N=16) attended one
semester during the undergraduate level of study (N=9 incoming and N=7 outgoing) and half
of them joined the Erasmus Programme during their graduate level of study (N=9 incoming and
N=7 outgoing).
2.2. Measurement Instruments
To identify student motives, expectations, and experiences during the Erasmus Programme, the
questionnaire International Research Office Questioner IROQ was created. This questionnaire
contains 25 items, some of which included demographic data (5 items), open ended questions
(8), multiple choice items (5) and Likert scale items (7). Student participation is on a voluntary
basis, and research was conducted anonymously with a Google Forms Survey. All respondents
are contacted by international relations officer.
3. RESEARCH RESULTS
3.1. Students Motivation for Participating in the Erasmus Programme
Students were asked why they chose certain countries for their Erasmus semester experience.
The majority of incoming and outgoing students made their choice of country for financial
reasons. 13 of the 18 incoming students were from West Europe (Belgium and France), the life
costs in Croatia were acceptable and this was the main reason for choosing Croatia. The
majority of outgoing Croatian students (N=11) consider the Czech Republic or Slovakia as
countries that are not too expensive. Other motives of incoming and outgoing students for
choosing certain countries were culture, faculty curriculum, recommendation from other
colleagues and other reasons. Students can choose different universities and faculties according
to the Erasmus agreement of their institution. The reasons why foreign incoming students chose
the Faculty of Organization and informatics in Varaždin is because this was the only option
(N=10), curriculum similarities (N=3), other reasons (N=3) and friends (N=2). Reasons why
Croatian students chose partner faculties in the Czech Republic, Portugal, Spain and Slovakia
because of similarities of curriculum (N=8), other reasons (N=4) and suggestions from other

51st International Scientific Conference on Economic and Social Development – Rabat, 26-27 March 2020
541
students (N=2). The general motivation for student participation at the Erasmus Programme is
very similar in groups of incoming foreign students and outgoing Croatian students. The
majority of incoming and outgoing Erasmus students participated in the Erasmus Programme
because of intercultural learning experience, networking, challenges and skills development.
There are no statistical differences between incoming and outgoing students regarding their
motives for participating in an Erasmus Programme. (X2=3.75, p>0.05, df = 6)
3.2. Students Expectations before Participating at the Erasmus Programme
Being part of Erasmus one semester student exchange programme includes individual students’
differing expectations regarding a new learning environment. Students that come to Croatia as
incoming Erasmus students expect that they will be faced with new cultural experiences (N=7),
improve their language (N=5), meet new people (N=4), have fun (N=5) and other (N=7).
Outgoing Croatian students expect that the best benefit will be to meet new people (N=5) and
to be faced with new cultural experiences (N=3). An interesting fact is that some of them have
no expectations before becoming Erasmus student (N=4) and some have other nonspecific
expectations (N=6).
3.3. Students Feedback after Erasmus Programme Experience
Students’ reflections and impressions after completing an Erasmus semester in a foreign
country illustrated that incoming students had excellent new experience in Croatia (N=9), it
was a good opportunity for them personally (N=3), for their development (N=2) and for other
reasons (N=4). For Croatian students Erasmus is an excellent experience (N=7), they think this
was their best decision (N=2), they would like to recommend Erasmus Programme to other
students (N=2) and have some other feedback (N=3). The majority of students in both groups
reported that the application procedure is not too complicated that they could apply without
problems (N=14 incoming students and N=11 outgoing students). Students reported that they
had no problem with adjusting to a new environment (Graph 1). They estimated that their
adjustment to a new environment was much better (N=7 for incoming and N=11 for outgoing
students) or better (N=6 for incoming and N= 3 for outgoing students) than the average
adjustment. No one single student reported that their adjustment was below the average.
Graph 1: Adjustment of Incoming (N=18) and Outgoing (N=14) Students to the New Cultural
Environment
0 0
56
7
3
11
0
2
4
6
8
10
12
Muchworsethan
average
Worsethan
average
Average Betterthan
average
Muchbetterthan
average
Incoming students
Outgoing students
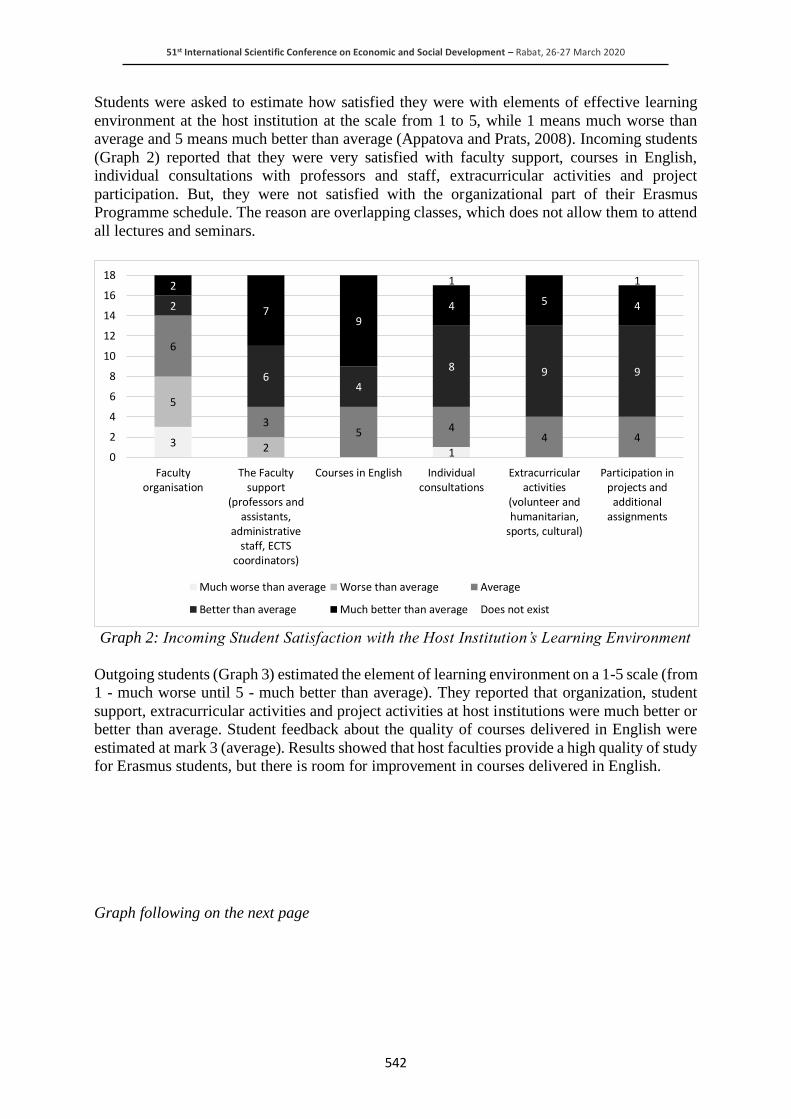
51st International Scientific Conference on Economic and Social Development – Rabat, 26-27 March 2020
542
Students were asked to estimate how satisfied they were with elements of effective learning
environment at the host institution at the scale from 1 to 5, while 1 means much worse than
average and 5 means much better than average (Appatova and Prats, 2008). Incoming students
(Graph 2) reported that they were very satisfied with faculty support, courses in English,
individual consultations with professors and staff, extracurricular activities and project
participation. But, they were not satisfied with the organizational part of their Erasmus
Programme schedule. The reason are overlapping classes, which does not allow them to attend
all lectures and seminars.
Graph 2: Incoming Student Satisfaction with the Host Institution’s Learning Environment
Outgoing students (Graph 3) estimated the element of learning environment on a 1-5 scale (from
1 - much worse until 5 - much better than average). They reported that organization, student
support, extracurricular activities and project activities at host institutions were much better or
better than average. Student feedback about the quality of courses delivered in English were
estimated at mark 3 (average). Results showed that host faculties provide a high quality of study
for Erasmus students, but there is room for improvement in courses delivered in English.
Graph following on the next page
31
5
2
6
35 4
4 4
2
64
8 9 9
2
79
4 5 4
1 1
0
2
4
6
8
10
12
14
16
18
Facultyorganisation
The Facultysupport
(professors andassistants,
administrativestaff, ECTS
coordinators)
Courses in English Individualconsultations
Extracurricularactivities
(volunteer andhumanitarian,
sports, cultural)
Participation inprojects and
additionalassignments
Much worse than average Worse than average Average
Better than average Much better than average Does not exist
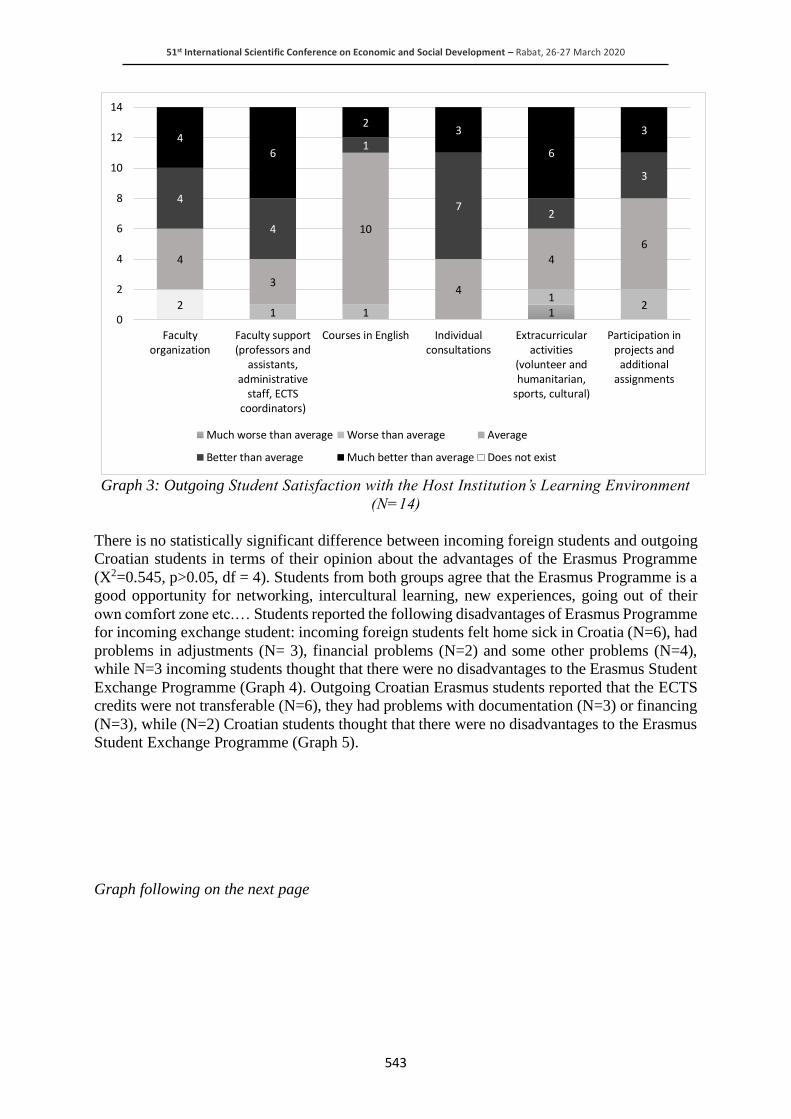
51st International Scientific Conference on Economic and Social Development – Rabat, 26-27 March 2020
543
Graph 3: Outgoing Student Satisfaction with the Host Institution’s Learning Environment
(N=14)
There is no statistically significant difference between incoming foreign students and outgoing
Croatian students in terms of their opinion about the advantages of the Erasmus Programme
(X2=0.545, p>0.05, df = 4). Students from both groups agree that the Erasmus Programme is a
good opportunity for networking, intercultural learning, new experiences, going out of their
own comfort zone etc.… Students reported the following disadvantages of Erasmus Programme
for incoming exchange student: incoming foreign students felt home sick in Croatia (N=6), had
problems in adjustments (N= 3), financial problems (N=2) and some other problems (N=4),
while N=3 incoming students thought that there were no disadvantages to the Erasmus Student
Exchange Programme (Graph 4). Outgoing Croatian Erasmus students reported that the ECTS
credits were not transferable (N=6), they had problems with documentation (N=3) or financing
(N=3), while (N=2) Croatian students thought that there were no disadvantages to the Erasmus
Student Exchange Programme (Graph 5).
Graph following on the next page
12
1 1
12
4
3
10
4
4
6
4
4
1
72
3
4
6
23
6
3
0
2
4
6
8
10
12
14
Facultyorganization
Faculty support(professors and
assistants,administrative
staff, ECTScoordinators)
Courses in English Individualconsultations
Extracurricularactivities
(volunteer andhumanitarian,
sports, cultural)
Participation inprojects and
additionalassignments
Much worse than average Worse than average Average
Better than average Much better than average Does not exist
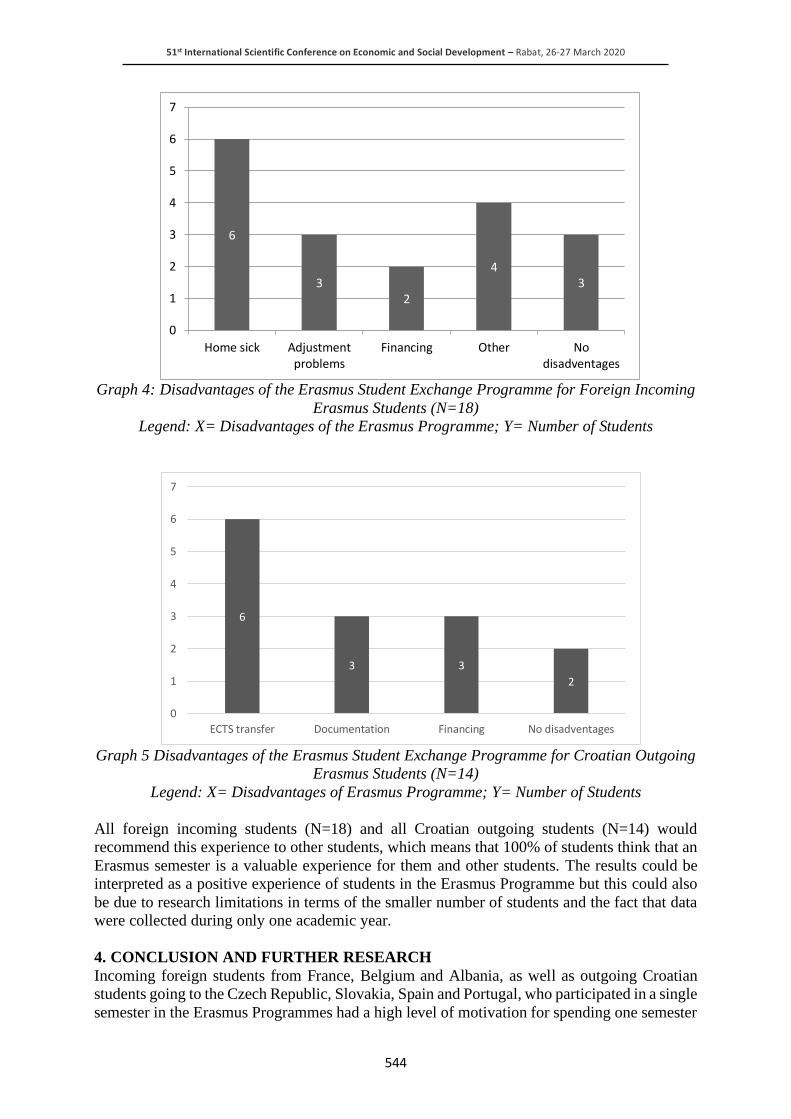
51st International Scientific Conference on Economic and Social Development – Rabat, 26-27 March 2020
544
Graph 4: Disadvantages of the Erasmus Student Exchange Programme for Foreign Incoming
Erasmus Students (N=18)
Legend: X= Disadvantages of the Erasmus Programme; Y= Number of Students
Graph 5 Disadvantages of the Erasmus Student Exchange Programme for Croatian Outgoing
Erasmus Students (N=14)
Legend: X= Disadvantages of Erasmus Programme; Y= Number of Students
All foreign incoming students (N=18) and all Croatian outgoing students (N=14) would
recommend this experience to other students, which means that 100% of students think that an
Erasmus semester is a valuable experience for them and other students. The results could be
interpreted as a positive experience of students in the Erasmus Programme but this could also
be due to research limitations in terms of the smaller number of students and the fact that data
were collected during only one academic year.
4. CONCLUSION AND FURTHER RESEARCH
Incoming foreign students from France, Belgium and Albania, as well as outgoing Croatian
students going to the Czech Republic, Slovakia, Spain and Portugal, who participated in a single
semester in the Erasmus Programmes had a high level of motivation for spending one semester
6
32
43
0
1
2
3
4
5
6
7
Home sick Adjustmentproblems
Financing Other Nodisadventages
6
3 3
2
0
1
2
3
4
5
6
7
ECTS transfer Documentation Financing No disadventages

51st International Scientific Conference on Economic and Social Development – Rabat, 26-27 March 2020
545
abroad. General motivation for participating in the Erasmus Programme in both groups of
student (incoming and outgoing) were intercultural learning, networking, challenges and skill
development. Students chose particular countries because of financial reasons (results
according to previous research done by Wei, 2013), gathering intercultural experience,
curriculum similarities and recommendations from their peers. This particular University was
chosen because of similarities in the curriculum of their home institution. Additionally, for
some incoming foreign students this was the only option. This result can be interpreted in terms
of a potential need for more Erasmus agreements between different partner institutions across
Europe. This is valuable information which can be used for to further improve exchange
programmes and particular events, such as a welcome week, team building etc. According to
students’ experience, the Erasmus Programme has advantages and benefits, such as networking,
intercultural learning, new experiences, and going out of their respective comfort zone. Croatian
students reported disadvantages such as ECTS transfer, documentation and financing. Incoming
foreign students reported that they felt home sick, they had adjustment problems and financial
obstacles. The research could be continued during longer period of time, which might ensure a
clearer picture of advantages and potential problems with Erasmus Programme. Students’
suggestions could be used to improve some elements, such as ECTS credit transfer, financing
and overlapping course schedule. Erasmus students are satisfying with elements of an effective
learning environment, such as faculty organisation, curriculum, project and extracurricular
activities in general, but course schedules need to be improved for incoming foreign Erasmus
students and along with the quality of courses for outgoing Croatian students. Elements of
effective learning environment are an important factor of student satisfaction and are linked to
organisational and communicational elements of studding at higher institutions (Appatova and
Prats, 2008). All incoming and outgoing Erasmus students (100%) will recommend this
experience to their colleagues (100%), what is according to results of previous research (Bryła,
2015). Generally, the Erasmus Programme is valuable experience for all participants and
students, enabling networking, intercultural experience and foreign language competences.
LITERATURE:
1. Appatova V., Prats, H.: (2008). Effective academic environment for under-prepared
college/university learners: listen to student voices. Paper presented at the 16thEAN Annual
Conference Access to Success: The student experience from pre-entry to employment,
Galway, Ireland, 2007.
2. Bryła, P. (2015 a). The Impact of international student mobility on subsequent employment
and professional career: A Large-scale survey among polish former Erasmus students.
Procedia - Social and behavioral sciences, 176, 633-641
3. Bryła, P. (2015 b). Self-reported Effects of and satisfaction with international student
mobility: A large-scale survey among Polish former Erasmus students. Procedia - Social
and behavioral sciences,, 191, 2074-2082
4. Engel, C. (2010). The impact of Erasmus mobility on the professional career: Empirical
results of international studies on temporary student and teaching staff mobility. Belgian
Journal of Geography, 4, 351-363
5. Ferencz, I., Hauschildt, K Garam, I. (eds.) (2013). Mobility windows from concept to
practice. Lemmens Medien GmbH, Bonn, D.
6. Hill, D., Iyer, R. (2010). The moderating effect of coping on student satisfaction with a short
study abroad program. Journal for advancement of marketing education, 17 97-103
7. İlter, B.G. (2016). How do Mobility Programs Increase Foreign University Students,
Intercultural Awareness? Procedia - Social and behavioral sciences, 232, 569-574
51st International Scientific Conference on Economic and Social Development – Rabat, 26-27 March 2020
546
8. Kumpikaitė, V., Ramírez, A.M., Ribeiro, H. N.R. (2012). Students’ Skills Evaluation: An
Intercultural Study. Procedia - social and behavioral sciences, 6224, 208-212
9. Leask, B. (2009). Using formal and informal curricula to improve interactions between
home and international students. Journal of studies in international education, 13, 2, 205-
221
10. Migration data Portal https://migrationdataportal.org/themes/international-students (access
Jan 10th 2020)
11. Nedelcu, A., Ulrich, C. (2014). Are we ready for international students? Our university as
window and mirror. Procedia - Social and behavioral sciences. 142, 90-96
12. Teichler, U., Janson, K, (2007). The professional value of temporary study in another
European country: Employment and work of former Erasmus students. Journal of studies
in international education, 11, 3-4, 486-495
13. Teichler (2012). Diversification? Trends and explanations of the shape and size of higher
education. Higher Education 56, 3, 349-379.
14. Vermeulen, L., Schmidt, H. (2008). Learning environment, learning process, academic
outcomes and career success of university graduates. Studies in higher education, 33, 4,
431-451
15. Wei, H. (2013). An empirical study on the determinants of international student mobility: a
global perspective. Higher education, 66, 1, 105-122
16. Wells, A. (2014). International Student Mobility: Approaches, Challenges and Suggestions
for Further Research. Procedia - Social and behavioral sciences, 143, 19-24
51st International Scientific Conference on Economic and Social Development – Rabat, 26-27 March 2020
547
PRICE FENCES AS A MECHANISM OF COMPANY´S DIFFERENT
PRICING TO CUSTOMERS WITH DIFFERENT WILLINGNESS TO
PAY
Zdenka Vidrova
University of Zilina
Univerzitna 8215/1, 010 26 Zilina, Slovakia
Margareta Nadanyiova
University of Zilina
Univerzitna 8215/1, 010 26 Zilina, Slovakia
Jana Kliestikova
University of Zilina
Univerzitna 8215/1, 010 26 Zilina, Slovakia
ABSTRACT
Price is one of the most important elements of the marketing mix and an important factor
influencing customer buying decisions. Price is an important element for customers to evaluate
the product and its value, but it is not the only element entering the customer's purchasing
decision. Nowadays, producers or sellers use market segmentation for different charging to
customers in various segments. This process is used in the mechanism of price fences. Price
fences are just designed to preserve market segmentation and limit spillover between market
segments. However, it is very important to choose the right pricing strategy such a way, that
the customers do not consider set prices as unfair and pricing discrimination. This situation
can be the reason for complaining, leaving the relationship or switching to a direct competitor.
In addition, prices perceived as unfair negatively impact demand in the marketplace. In this
article, we deal with definitions of basic terms, such as price, price fairness, market
segmentation, which are related to price fences. Then, we focus on the essence of price fences
and describe their basic types - buyer identification fences, purchase location fences, time of
purchase fences and purchase quantity fences. The last part of the paper will be focused on real
examples from practice. We will even point out on extreme example of pricing fence from past
that could be consider as bad and inappropriate and it can be called as price discrimination.
Practical examples can help businesses to avoid such pricing behavior that results in price
discrimination.
Keywords: Differential pricing, Pricing strategy, Price, Price discrimination, Price fences
1. INTRODUCTION
According to Peattie (1995), the price can be the primary criterion for market segmentation. It
is also a key marketing variable, through which a wide range of (not only) marketing goals can
be achieved. For this reason, an enterprise should set the price level for the customer and
individual segments very wisely. It must not be the case that the customer will regard the price
as discriminatory, so it could cause many problems. These statements confirm the importance
of pricing strategy (Chijioke et al., 2018). Cornerstones of a good revenue management strategy
are customer segmentation and the implementation of targeted price strategies for each
segment. Market segments should be kept separate to prevent demand spillover from high
priced segments to low priced segments and the associated revenue loss.
51st International Scientific Conference on Economic and Social Development – Rabat, 26-27 March 2020
548
Tools to restrict customer migration across segments are referred to as fences (Zhang & Bell,
2012). Occasionally, pricing goods and services at different levels across segments is easy
because customers have obvious characteristics that sellers can use to identify them (Nagle &
Müller, 2018). Price fences are the least complicated way to charge different prices to reflect
different levels of value. Unfortunately, while simple to administer, the obvious price fences
sometimes create resentment and are often too easy for customers to get over whenever there
is an economic incentive to do so. Thus, finding a fence that will work in a market, where the
company operates, usually requires some creativity (Krizanova, et al., 2014a; Krizanova et al.,
2014b). For example, many companies segment customers depending on the channel of
purchase: online store versus retail store. These sellers set one price in the retail store, at the
same provide discounts to online purchasers. Customers have two options: the first one is that
they can purchase the product online at lower price with less information and longer processing
times. The second one, they have to pay the higher price, but can interact with a salesperson to
gain more information or expedite service (Zhang & Bell, 2012). Many questions surrounding
fences remain unanswered. These following questions and others are mentioned by Zhang and
Bell (2012), for example, how to choose segmentation variables to divide the single market into
multiple submarkets profitably? What is the difference between fencings in the traditional
marketing sense and fences used for revenue management, or how do marketing managers deal
with customers switching segments? The paper consists of six chapters: Introduction, Basic
definitions, Description of price fences, Basic types of price fences, Price fences in the practice
and Conclusion. In the second chapter Basic definitions we deal with definitions associated
with price fences – such as price and market segmentation. The third chapter Description of
price fences focuses on introduction of the mechanism of price fences. In the forth chapter Price
fences in the practice we provide some examples of real price fences, also that one which can
be consider as price discrimination.
2. BASIC DEFINITIONS
Firstly, we have to define the price, one of the most important elements of marketing mix. The
price is also associated with mechanism of price fences. Price is an important element for
customers to evaluate the product and its value, but it is not the only element entering the
customer's purchasing decision. In a narrow sense, the price represents the amount of money
charged for a particular product (Pajtinkova Bartakova & Gubiniova, 2012). When we talk
about price from customer´s point of view, it is related with perceptions of price fairness. They
represent consumer assessments and associated emotions regarding whether the seller's price,
compared to a comparable other, is reasonable, acceptable, or justifiable. Customers or
consumers can consider the price is unfair, so they have negative attitude toward to provider,
what can be a reason of complaining, leaving the relationship or switching to a direct competitor
(Xia et al., 2004). In addition, prices perceived as unfair negatively impact demand in the
marketplace (Anderson & Simester, 2008). Other important term, which is closely related to
price fences, is market segmentation. It is one of the most important tasks in marketing. Market
segmentation is essential to implement differential pricing, thus to apply price fences
mechanism. Identifying and describing market subgroups in a way, that guides marketing and
sales decision-making, makes the marketing and pricing process much more efficient and
effective (Valaskova et al., 2018). For example, customers who are relatively price insensitive,
costly to serve, and poorly served by competitors, can be charged more than customers who are
price sensitive, less costly to serve, and are served well by competitors. At many companies,
however, segmentation strategy focuses on customer attributes that are not useful for pricing
decisions or creating customer groupings that do not adequately describe differences in
purchase motivations among customers (Popp et al., 2018). There exist various types of
segmentation modelling schemes.

51st International Scientific Conference on Economic and Social Development – Rabat, 26-27 March 2020
549
Unfortunately, in many cases, segmentations seldom assist pricing decisions, especially for
setting different prices that maximize profit from different segments. When segmentation is set
right, only then can a marketer ensure that each different customer subgroup is paying the most
profitable price that the marketer can charge (Sroka & Szanto, 2018). Once a market
segmentation structure has been put in place, firms use various conditions and restrictions to
maintain separation of the price categories. Devices, such as less information, prolonged
purchase processes, and early purchase and refund penalties, will “fence” customers into
different market segments and make it difficult or time consuming for them to migrate from
one market segment to another (Value-based market segmentation, 2016).
3. DESCRIPTION OF PRICE FENCES
A fence is a device that is designed to preserve market segmentation and limit spillover between
market segments (Zhang & Bell, 2012); however, most fences are not perfect and allow some
degree of demand “leakage” from the high-priced market segments to the low-priced segments.
Imposing appropriate fences is also crucial for the success of revenue management (Zhang et
al., 2010). Price fences are fixed criteria that customers must meet to quality for a lower price.
At theaters, museums, and similar venues, price fences are usually based on age (with discounts
for children under 12 years of age and for seniors) but are sometimes also based on educational
status (full-time students get discounts), or possession of a coupon from a local paper
(benefiting locals who know more alternatives). All three types of customers have the same
needs and cost to serve them, but perceive a different value from the purchase (Nagle & Müller,
2018). Rags Srinivasan, management professional with extensive experience in product
strategy, strategic marketing and pricing, claims on his blog following statement about price
fences: Price fences are as bad as say a fence between two countries. But they do serve the same
purpose – to keep the two sides apart (Srinivasan, 2013). Price fences are key components of
segmentation and revenue management. They are designed such that those who can afford and
willing to pay higher prices are not tempted by the lower priced versions (Srinivasan, 2013).
Often a buyer´s relative price sensitivity does not depend on anything immediately observable
or on factors a customer freely reveals. It depends instead on how well informed about
alternatives a customer is and on the personal values the customer places on the differentiating
attributes of the seller´s offer (Zhuravleva et al., 2019). In such cases, the classification of
buyers by segment usually requires an expert salesperson trained in soliciting and evaluating
the information necessary for segmented pricing (Udell et al., 2019). We suggest that
management can look at their particular business situation and decide whether or not fencing is
applicable. If fencing is essential, the manager must consider each of the elements listed in the
taxonomy and then decide which descriptor best fits the situation. The next step is to choose
the optimal fencing decisions (that is, price, inventory and cost devoted to fences) and apply
them to the situation in order to improve the firm's financial results (Ionescu, 2019; Belas et al.,
2018).
4. BASIC TYPES OF PRICE FENCES
There exist various types of price fences. In next paragraphs, we describe following types: buyer
identification fences; purchase location fences; time of purchase fences and purchase quantity
fences. Occasionally, pricing goods and services at different levels across segments is easy
because customers have obvious characteristics that sellers can use to identify them. In this case
we talk about buyer identification fences. Barbers charge different prices for short and long hair
because long hair takes more time to cut. But there exist some exceptions, for example when
barbers during non-peak hours cut children´s hair at a substantial discount, despite the fact that
work with children can be more challenging and time-consuming (Nagle & Müller, 2018). To
customers perceiving different values buy at different locations can be used purchase location

51st International Scientific Conference on Economic and Social Development – Rabat, 26-27 March 2020
550
fences. This type of price fences is common practice for a wide range of products and is often
used by dentists, opticians, and other professionals. They have multiple offices in different parts
of a city, each with a different price schedule reflecting differences in the target clients´ price
sensitivity. Also, many grocery chains categorize their stores by the intensity of competition
and charge lower markups in most intense competition areas (Nagle & Müller, 2018;
Kramarova et al., 2014). Time of purchase fences are used in those situations when customers
in different market segments purchase at different times. It is possible to segment them for
pricing by time of purchase. This type of price fences is usually used by theaters segment. They
segment their markets by offering midday matinees at substantially reduced prices, attracting
price-sensitive viewers who are not employed during the day at times when the theater has
ample excess capacity. On the other hand, less price-sensitive evening visitors cannot so easily
arrange dates or work schedules to take advantage of the cheaper midday ticket prices (Kral et
al., 2019). The last type is called purchase quantity fences. They are useful in the situation when
customers in different segments buy different quantities, so they can be segmented for pricing
with quantity discounts. There are four types of quantity discount tactics: volume discounts,
order discounts, step discounts, and two-part prices. All are common when dealing with
differences in price sensitivity, costs, and competition. Customers who buy in large volume are
usually more price sensitive. They have a larger financial incentive to learn about all
alternatives and to negotiate the best possible deal (Nagle & Müller, 2018).
5. PRICE FENCES IN THE PRACTICE
Using the mechanism of price fences we can see in the nineteenth century yet. We talk about
third-class train travel. Railroad company offered three classes of service – small number of
super premium first class service; moderately priced second class service and really low priced
third class service. Operators removed roofs from the third class cars to prevent those who can
afford second class service from being tempted by the low price of the third class service
(Trebilcock et al., 2003). This extreme example of pricing fence we can consider as bad and
inappropriate and it can be called as price discrimination. Price discrimination is designed to
capture market surplus, which exists when some consumers are willing to pay more than others
for the same product. The main motivation for firms to implement price discrimination policies
is the opportunity to reap large financial gains, but such implementation does not come without
risks (Agrawal & Ferguson, 2007). Despite the risks, various firms implement revenue
management policies that incorporate third degree price discrimination, whereby firms
selectively price higher or lower to different groups of consumers (Wirtz & Kimes, 2007;
Ferguson, 2014). There exist three types of price discrimination, third degree price
discrimination is situation when a firm charges different prices to different customer segments
(Kuo et al., 2016). Even schools and colleges offer their students the same education for
different prices based on their price sensitivities, despite the fact that the official school catalogs
list just one tuition. Most of the students receive substantial discount called "tuition remission
scholarships" obtained by revealing personal information on financial-aid applications. By
evaluating family income and assets, colleges can set tuition for each student that makes
attendance attractive while still maximizing the school's income (Nagle & Müller, 2018;
Valaskova et al., 2019). Deal proneness is another form of self-induced buyer identification-
especially through the use of coupons and sales promotions, a frequent tool of consumer
marketers. Coupons provided by the seller give deal-prone shoppers a way to identify
themselves. Supermarkets and drug stores put coupons in advertising circulars because people
who read those ads are part of the segment that compares prices before deciding where to shop.
Packaged-goods and small appliance manufacturers print coupons and rebate instructions
directly on the packages, expecting that only price-sensitive shoppers will make the effort to
clip them out and use them for future purchases (Nagle & Müller, 2018).

51st International Scientific Conference on Economic and Social Development – Rabat, 26-27 March 2020
551
Colorado ski resorts use purchase location to segment sales of lift tickets. Tickets purchased
slope side are priced the highest and are bought by the most affluent skiers who stay in the
slope-side hotels and condos. Tickets are cheaper (approximately 10 percent less) at hotels in
the nearby town of Dillon, where less affluent skiers stay in cheaper, off-slope accommodations.
In Denver, tickets can be bought at grocery stores and self-serve gas stations for larger discounts
(approximately 20 percent less). These discounts attract locals, who know the market well and
who are generally more price sensitive because the ticket price represents a much higher share
of the local cost for them to ski (Nagle & Müller, 2018; Poliak et al., 2013). Mechanism of one
of price fences types is also using by HotelQuest.com, what is documented on their blog. They
have an opinion, that the company should design and offer such products that combine the hotel
room with fences. These products must meet the needs of each segment and must be priced
appropriately. They use following tactic - consider about two different segments: business
travelers and holiday segment, which are differently sensitive to price. Business travelers are
not so sensitive to price, value flexibility of cancellation and like to have breakfast included in
the price, a hotel could offer a free-cancelation breakfast included plan to attract them. Holiday
segment is very price sensitive, so the hotel may offer a non-refundable no-meals included plan
at a lower rate. In this case, these are two products targeting different segments where the price
difference is defendable and justifiable (The role of rate fences in hotel revenue management,
2017). The whole truth is, that the success of the price differentiation strategy within each
segment lies in the explanation and justification of each price difference. Potential guests need
to feel that they are buying different products when they pay different prices. Rate fences in
hotel revenue management are the elements that create this product differentiation. The essence
lies in the segmentation of customers into appropriate rate categories based on their needs,
behavior, or willingness to pay. Especially rate fences are commonly used in the airline and
hotel industries to force customers into higher-paying or lower-paying groups. Author of the
article also claims that applying fences on the right way can make business more successful and
give the companies a competitive edge (The role of rate fences in hotel revenue management,
2017).
6. CONCLUSION
Market segmentation is one of the most important tasks in marketing. After identifying
particular market segments, they should be separate to prevent demand spillover from high
priced segments to low priced segments, through this way to prevent revenue loss. Tools, which
serve to restrict customer migration across segments, are called as fences. Customers who are
relatively price insensitive, costly to serve, and poorly served by competitors, can be charged
more than customers who are price sensitive, less costly to serve, and are served well by
competitors. At many companies, however, segmentation strategy focuses on customer
attributes that are not useful for pricing decisions or creating customer groupings that do not
adequately describe differences in purchase motivations among customers. On the other hand,
when segmentation is set right, only then can a marketer ensure that each different customer
subgroup is paying the most profitable price that the marketer can charge. We suggest that
management can look at their particular business situation and decide whether or not fencing is
applicable. If fencing is essential, the manager must consider each of the elements listed in the
taxonomy and then decide which descriptor best fits the situation. The next step is to choose
the optimal fencing decisions (that is, price, inventory and cost devoted to fences) and apply
them to the situation in order to improve the firm's financial results. Market segmentation is
essential to implement differential pricing, thus to apply price fences mechanism. Company
should be careful in charging different prices to different segments. Customers can consider
price as unfair and company get into the problem of price discrimination. Answer on this
situation can be complaint, leave the relationship with company or switch to a direct competitor.
51st International Scientific Conference on Economic and Social Development – Rabat, 26-27 March 2020
552
Despite the all of risks, applying fences on the right way can make business more successful
and give the companies a competitive edge.
ACKNOWLEDGEMENT: This paper is an output of scientific project VEGA no. 1/0718/18:
The impact of psychographic aspects of pricing on the marketing strategy of companies across
products and markets.
LITERATURE:
1. Agrawal, V., Ferguson, M. (2007). Optimal customized pricing in competitive settings.
Journal of Revenue and Pricing Management, vol. 6, pp. 212-228.
2. Anderson, E. T., Simester, D. I. (2008). Does demand fall when customers perceive that
prices are unfair? The case of premium pricing for large sizes. Marketing Science, vol. 27,
pp. 492-500.
3. Belas, J., Gavurova, B., Toth, P. (2018). Impact of selected characteristics of SMES on the
capital structure. Journal of Business Economics and Management, vol. 19, no. 4, pp. 592-
608.
4. Chijioke, N., Vu, H. M., Olatunji, F. (2018). Influence of strategy formulation drivers on
strategic performance. Ekonomicko-manazerske spektrum, vol. 12, no. 2, pp. 15-25.
5. Ferguson, J. L. (2014). Implementing price increases in turbulent economies: Pricing
approaches for reducing perceptions of price unfairness. Journal of Business Research, vol.
67, no. 1, pp. 2732-2737.
6. Ionescu, L. (2019). Climate Policies, Carbon Pricing, and Pollution Tax: Do Carbon Taxes
Really Lead to a Reduction in Emissions? Geopolitics, History, and International Relations,
vol. 11, no. 1, pp. 92–97.
7. Kral, P., Valjaskova, V., Janoskova, K. (2019). Quantitative approach to project portfolio
management: proposal for Slovak companies. Oeconomia Copernicana, vol. 10, no. 4, pp.
797-814.
8. Kramarova, K., Gregova, E., Cisko, S. (2014). CHANGES IN THE CORPORATE TAX
IN SLOVAKIA - TAX LICENSE. In J. Stankeviciene, R. Ginevicius, AV. Rutkauskas
(ed.), Proceedings of 8th International Scientific Conference on Business and Management,
pp. 263-271, Location: Vilnius, LITHUANIA.
9. Krizanova, A., Masarova, G., Buc, D., Kolencik, J. (2014). Marketing Research as a Tool
of Customers' Contentment Determination. In G. Lee (ed.), Proceedings of 2nd
International Conference on Economics and Social Science (ICESS), vol. 61, pp. 92-97,
Location: Shenzhen, PEOPLES R CHINA.
10. Krizanova, A., Stefanikova, L., Masarova, G., Rypakova, M. (2014). KEY SUCCESS
FACTORS OF COMPANY'S INTELLIGENCE PROGRAM. In J. Stankeviciene, R.
Ginevicius, AV. Rutkauskas (ed.), Proceedings of 8th International Scientific Conference
on Business and Management, pp. 85-92, Location: Vilnius, LITHUANIA.
11. Kuo, A., Rice, A. H., Fennell, P. (2016). How fitting! The influence of fence-context fit on
price discrimination fairness. Journal of Business Research, vol. 69, no. 8, pp. 2634-2640.
12. Nagle, T. T., Müller, G. (2018). The Strategy and Tactics of Pricing (A Guide to Growing
More Profitably). New York: Taylor & Francis.
13. Pajtinkova Bartakova, G., Gubiniova, K. (2012). Udrzatelny marketingovy manazment.
Bratislava: IAM press.
14. Peattie, K. (1995). Environmental Marketing Management: Meeting the Green Challenge,
Pitman Publishing. London: Pitman.

51st International Scientific Conference on Economic and Social Development – Rabat, 26-27 March 2020
553
15. Poliak, M., Krizanova, A., Semanova, S., Stefanikova, L. (2013). THE IMPACT OF
PROCUREMENT METHOD OF THE TRANSPORT SERVICES TO THE FINANCIAL
REQUIREMENT OF PERFORMANCE CONTRACTING ENTITY. TRANSPORT
PROBLEMS, vol. 8, no. 4, pp. 67-76.
16. Popp, J., Olah, J., Fekete, M. F., Lakner, Z., Mate, D. (2018). The Relationship Between
Prices of Various Metals, Oil and Scarcity. Energies, vol. 11, no. 9, pp. 2392.
17. Srinivasan, R. (2013). The most beautiful price fence. Retrieved 29.02.2020 from
https://iterativepath.wordpress.com/2013/10/27/the-most-beautiful-price-fence/.
18. Sroka, W., Szanto, R. (2018). Corporate Social Responsibility and Business Ethics in
Controversial Sectors: Analysis of Research Results. Journal of Entrepreneurship,
Management and Innovation, vol. 14, no. 3, pp. 111-126.
19. The role of rate fences in hotel revenue management. (2017). Retrieved 29.02.2020 from
http://www.hotelquest.com/rate-fences-revenue-management/.
20. Trebilcock, M., Winter, R. A., Collins, P., Iacobucci, E. M. (2003). The Law and Economics
of Canadian Competition Policy. Toronto: University of Toronto Press.
21. Udell, M., Stehel V., Kliestik, T., Kliestikova, J., Durana, P. (2019). Towards a Smart
Automated Society: Cognitive Technologies, Knowledge Production, and Economic
Growth. Economics, Management, and Financial Markets, vol. 14, no. 1, pp. 44–49.
22. Valaskova, K., Bartosova, V., Kubala, P. (2019). Behavioural Aspects of the Financial
Decision-Making. Organizacija, vol. 52, no. 1, pp. 22-32.
23. Valaskova, K., Kliestikova, J., Krizanova, A. (2018). Consumer Perception of Private Label
Products: An Empirical Research. Journal of Competitiveness, vol. 10, no. 3, pp. 149-163.
24. Value-based market segmentation. (2016). Retrieved 29.02.2020 from
http://theorybiz.com/the-strategy-and-tactics-of-pricing/value-creation-2/1660-value-
based-market-segmentation.html.
25. Wirtz, J., Kimes, S. E. (2007). The Moderating Role of Familiarity in Fairness Perceptions
of Revenue Management Pricing. Journal of Service Research, vol. 9, no. 3, pp. 229-240.
26. Xia, L., Monroe, K.B., Cox, J. L. (2004). The price is unfair! A conceptual framework of
price fairness perceptions. Journal of Marketing, vol. 68, pp. 1-15.
27. Zhang, M., Bell, P. (2012). Price Fencing in the Practice of Revenue Management: An
Overview and Taxonomy. Journal of Revenue and Pricing Management, vol. 11, pp. 146-
159.
28. Zhang, M., Bell, P. C., Cai, G., Chen, X. (2010). Optimal fences and joint price and
inventory decisions in distinct markets with demand leakage. European Journal of
Operational Research, vol. 204, no. 3, pp. 589-596.
29. Zhuravleva, N. A., Cadge, K., Poliak, M., Podhorska, I. (2019). Data Privacy and Security
Vulnerabilities of Smart and Sustainable Urban Space Monitoring Systems. Contemporary
Readings in Law and Social Justice, vol. 11, no. 2, pp. 56–62.
51st International Scientific Conference on Economic and Social Development – Rabat, 26-27 March 2020
554
THE IMPORTANCE OF WELL-TARGETED MARKETING ON
SELECTED BRANDS
David Vrtana
University of Zilina, Faculty of Operation and Economics of Transport and Communication
Department of Economics
Univerzitna 8215/1, 010 26 Zilina, Slovak Republic
Anna Krizanova
University of Zilina, Faculty of Operation and Economics of Transport and Communication
Department of Economics
Univerzitna 8215/1, 010 26 Zilina, Slovak Republic
Juraj Kolencik
University of Zilina, Faculty of Operation and Economics of Transport and Communication
Department of Economics
Univerzitna 8215/1, 010 26 Zilina, Slovak Republic
ABSTRACT
The importance of marketing in the market environment is constantly growing. Nowadays, we
can see a number of brands trying to enforce their communication policy in a competitive
environment in order to best meet the needs of customers. However, there are brands that do
not need to develop an aggressive communication policy and yet can satisfy every customer's
requirement. We also refer to this type of marketing as well-targeted. The article deals with the
issue of Modelleeisenbahn Holding, which owns two successful brands, Roco and Fleischmann.
The peculiarity of these brands is that they do not develop almost any communication policy to
attract new customers. Their main business is the sale of model railways. Therefore, they target
their policy to a specific customer segment whose passion is to create their own model railways.
Based on the above, the article elaborates a model of Freebie marketing, which is meant to sell
one product at a lower price in order to induce the sale of another product usually higher price.
This model is actively covered by Modelleisenbahn Holding GmbH, which attempts to trigger
the sale of another (higher-quality) product in the starting network (usually at a lower price).
He expects the customer to be interested in expanding the purchased set and thus building his
own railway world. The article shows how freebie marketing can boost shopping behavior and
is suitable for targeting a particular segment. The importance of a well-targeted marketing is
also supported by the hardened marketing strategy described in the article. On the basis of all
available data on the company, in the final part of the article the approach is to generalize the
strategy and to point out the importance of well-targeted marketing and its relation to the
communication policy of the company.
Keywords: Communication policy, Customer, Freebie marketing, Well-targeted marketing
1. INTRODUCTION
In order to process the article and highlight the importance of well-targeted marketing, we
decided to work with the Freebie marketing business model. It is a business model whose aim
is to ensure the sale of the second product, which is triggered by the sale of the first product
(Huang, Kuo, Shih, 2017, p. 18-28). Ludbrook also emphasize the importance of applying the
business model in relation to building a business strategy (Ludbrook, Frajtova Michalikova,
51st International Scientific Conference on Economic and Social Development – Rabat, 26-27 March 2020
555
Musova, Suler, 2019, p. 21-26). The article analyzes the company Modelleisenbahn-Holding
GmbH, which focuses on the production of railway models. The company wants to achieve
quality products in the starting network (usually at a lower price) that the customer is interested
in expanding this set and thus building their own railway world. It is here that one can see the
application of the basic elements of Freebie marketing as a business model. Individual railway
models that the customer will buy are significantly more expensive than the price of the starter
set. Consequently, the final form of the model rail will greatly exceed the price of the starting
set. Based on the analyzed and found data, the article describes the communication policy,
which will be part of the generalized marketing strategy. Križanova, Majerova, Kliestik and
Majercak who claim that a marketing strategy can help to strengthen the brand in the market,
is also important (Krizanova, Majerova, Kliestik, Majercak, 2013, p. 105-112).
2. ANALYSIS OF COMPANY
Modelleisenbahn-Holding GmbH is the parent company of the German model railway
manufacturer Fleischmann and the manufacturer of the Austrian railway models Roco. The
Roco brand primarily started the production of mini-tanks, which immediately expanded into
the US. The export was successful for the brand due to its expansion. In addition to the
production of mini-tanks began to produce model trains in scale H0 and N. Railway models
have become so successful for the company that in addition to exports to the US, exports have
expanded to other European countries such as Germany, Spain, Switzerland, Sweden and the
Netherlands. On July 15, 2005, the Roco brand went bankrupt and became part of the
Modelleisenbahn holding on 25 July. In 2008, the second Fleischmann brand also joined and
became, together with Roco, the most successful “siblings” in the model railway world. Both
brands became part of the Modelleisenbahn due to their further development in order to promote
sales. (Fleischmann.de) Modelleisenbahn is constantly striving to achieve economies of scale
through joint development projects, marketing and public procurement through both brands.
However, the essence is that both brands act as separate ones that compete with each other. The
importance of cooperative partnerships, which aim to effectively manage relationships in terms
of cooperation to promote competitiveness in a market environment, can also be seen in this
sense. Modelleisenbahn Holding GmbH has a subsidiary Roco Slovakia s. r. about. based in
Banská Bystrica. The plant currently employs 250 - 499 employees. The subsidiary takes over
a significant part of the canceled plants from the German sister plant Fleischmann. In 2018,
sales in the Slovak subsidiary amounted to € 4,898,243, which represents only a slight decrease
by 0.5% compared to 2017 (Finstat.sk). The general analysis of the initial situation of the
company is also its market penetration on the European and American markets. During 2020,
the company intends to strengthen the range of both brands (Flieschmann and Roco) by
producing more than 500 new models and issuing twenty new redesigns. This means that the
company will support its market penetration, eventually the expansion of the product portfolio
in the European and American market environment. On the US market, the company plans to
offer a steam locomotive S 160 of the US Army from 1945 after the H0 scale at a selling price
of € 504. In addition to the production of models, the company wants to work on the
development of the Next Generation game, which was successful in 2014. On the basis of the
above, it can be argued that the company intends to expand its product portfolio and expand
with existing products to the current markets. The company intends to achieve this by
supporting a communication policy and an appropriate strategy (Register.cz).
2.1. Creating and targeting the product to the customer segment
The company offers a wide portfolio of products to meet the needs of its customers. In
production, the company is committed to the quality of products and attention to detail. The
products are oriented at different price levels. For the purpose of processing the article, the
51st International Scientific Conference on Economic and Social Development – Rabat, 26-27 March 2020
556
product line of railway models and the game "Next Generation" will be considered. The product
portfolio of both brands is very extensive. The brands offer models of locomotives, coaches and
freight wagons, railcars and electric units of railway companies, rails and track accessories
(tunnels, bridges, lights). Buses with wagons represent the main product portfolio. They are
manufactured as realistic models, based on the fleet of individual transport companies in
Europe. Built locally are divided into two categories: hobby and professional. For beginners
model trains and wagons are provided in plastic design in combination with metal elements.
The price of these models ranges from 150 € to 300 €. Limited editions of locomotives and
wagons are produced for professional modelers, the price of which is twice as high. A large
part of the products has already been digitized (lights, noise locomotive). The advantageous
alternative for beginners of modelers is to buy a starter set, which includes a round rail, a switch
with an electric switchboard, a locomotive with three wagons. Starting price ranges from € 199
to € 399. In 2014, the Roco brand produced the railway model game "Next Generation", which
is a customer segment for children aged 6-12. It is the first railway game to bring together
virtual and real worlds together so the child can move with their toy in a new future. The name
Next Generation speaks of a new generation of games that are controlled by a tablet or
smartphone. The game contains virtual tasks that need to be solved in the real world of the game
(through a model train). The new concept of the game combines several elements: the real
model railroad is controlled by the application "Roco Next", which allows for example to
accurately determine the way, solve logical puzzles in different stories. The app can be
downloaded for Apple and Android. The game can be played by one or more players and can
be downloaded in two versions, Detective Tom and Amusement Park. The basic set of the game
is priced at 149 €, for which you can also buy other turnout sets worth 39,90 € and an additional
turnout set worth 19,90 €. In this case, you can see the business model of Freebie marketing.
The customer will not only buy this starter kit, he will want to build his country by buying
additional components. With this game, the company wants to show that it provides fun and
adventure for children. The company claims that it does not provide a simple model of railways
that children build and play with. Monotonous playing wants to break down through a new
game. It wants to provide an interactive gaming experience and show that even a simple model
railroad game can be fun and adventurous by solving various virtual tasks in the real world of
railways. Within the customer segments, the company focuses on specific customers, who
primarily belong to the group of well-targeted marketing. The primary segment for the company
is men aged 40-55 who enjoy the model railways. In this case, they are more like “fanatics” and
passionate collectors. Brands try to support this segment with a variety of images and slogans
(such as "It´s man world", "Forever young") that are specifically targeted to this segment. The
images that are also targeted to this segment also include slogans such as "He just wants to
play" or "So you can convince men to play". Thanks to the offered value, men can feel eternal
youth through trains. (Product catalog, 2015, pp. 5-160) The secondary segment is children
aged 6-12 years, assuming they have a smartphone, tablet or laptop. This segment is associated
with the advent of Next Generation. It is important for the company because of future
investments in building a model railroad, and partners and manufacturers are also using it to
maintain the model railroad as an intergenerational hobby. This is also supported by YouTube
videos with the motto "Best devices inherited through generations."
2.2. Creating and targeting the product to the customer segment
The communication policy of the company is primarily closely oriented. The company uses
low-cost marketing campaigns. They try to communicate via Facebook and YouTube. Both
brands (Roco, Fleischmann) have their own website, where customers can find all important
information not only about news, but also about other products. The website also serves as an
e-shop where customers can order a specific product.
51st International Scientific Conference on Economic and Social Development – Rabat, 26-27 March 2020
557
Through YouTube channels, the company is trying to present its current models, including the
latest in the market. The videos are also focused on demonstrations of various railway lines,
where they try to point out the depiction of reality by model railway. The fact that these videos
are being searched for by customer segments is evidenced by the number of views, which
represents approximately 2,605,533 as of 27/02/2020. and company-held actions or interview-
focused videos with managers. Model railways are a specific product that gives the owner a
sense of uniqueness that he wants to share with other people. It is this feeling that he wants to
emphasize through YouTube channel through which he seeks to reveal his personal world of
trains, including personal experience. The individual videos not only emphasize the passion and
experience of the customer, but can also contribute to the positive promotion of both brands, as
evidenced by the fact that one of these customers has 66,192 views on February 27, 2020.
Another tool used in communication policy is the Facebook social network. In the form of
contributions, the company promotes various novelties and train models. Roco 36 058,
Fleischmann 31 118 and Modelleisenbahn parent company 6 469 numbers. In addition to public
sites, there are closed groups on Modelleisenbahn model railways, where users deal with model
sales, exchange information about exhibitions model rails, counseling and the like. The
approximate number of fans of these closed groups is on average 2 195. Gavurova argue that
social networks can currently influence buying behavior (Gavurova, Bacik, Fedorko, Nastisin,
2018, p. 72-84). On the basis of the above, it can be argued that an enterprise should continue
to use social networks intensively in the future in order to influence Generation Z's purchasing
behavior. Because it is a passion and hobby, it is assumed that customers do not just buy model
railways, but want to build their own country through the purchase of other material things. In
this case, the company uses the current annual catalog as a means of communication. Based on
the above information, it can be argued that the company's communication policy is very narrow
and explicitly specializes only in a well-defined marketing segment. It is sufficient to apply that
form of communication in relation to the company's sales.
2.3. Marketing strategy of company
The definition of individual strategies is based on an analysis of available information from
previous chapters. The identified strategies for Modelleisenbahn Holding GmbH can be divided
into two primary groups:
• Strategy focused on the customer - both brands (Roco, Fleischmann) since their inception
focused on producing quality models according to realistic model. Their primary values
were reliability, creativity and providing high added value to the customer. The quality of
the models depends on their manual craftsmanship based on the technical skills of qualified
employees. This was the primary strategy from the very beginning of both companies.
During that time, they tried to primarily provide value to the customer through rail models,
where the customer could buy additional accessories, models, so that his "railroad country"
could grow, and so they contributed to customer satisfaction. In the period after 2000 there
was already a generation Z on the market, which no longer saw the sense of "playing" with
model railways. It is a generation that is mainly influenced by technological progress.
(Koníčková, 2016) In 2005 and 2008, both brands became part of Modelleisenbahn Holding
GmbH and tried to come up with a strategy to help them strengthen their market position.
So they came up with a new product, which also carried a new strategy in an effort to apply
modern technologies to the model railroad game and thus enhance the gaming experience
(“Next Generation”). The company assumes that this combination is very appealing
especially for the secondary segment, as the game provides digital access to the game
interface that children have been using since young age. The company defines its mission
as: “return of model railways to children's rooms”. The main objective is to strengthen the
market leader position in the rail sector and thus contribute to the expansion of international
51st International Scientific Conference on Economic and Social Development – Rabat, 26-27 March 2020
558
sales. The company wants to provide its customers with a real rail model through which it
seeks to expand its target audience by appealing to the younger generation (the secondary
segment) from which it wants to build a base of passionate modelers in the future. The
company wants to achieve this goal mainly by digital technology. If the company focuses
primarily on the Z generation and provides them with a “hobby” associated with modern
technology, this will be a prerequisite for expanding the target audience, an approach to
building new passionate modelers, which will later lead to expanding international sales to
meet the strategic goal (Annual report, 2015, p. 3-5). An essential element of this strategy
is the primary focus on the customer in order to achieve overall marketing performance. In
addition, it can be influenced by a number of external factors (Kramarova Gregova, Cisko,
2014, p. 263-271).
• Innovation strategy - since Roco and Fleischmann have become part of Modelleeisenbahn
Holding GmbH, innovation has also been introduced. Both brands participated in the
development of innovation. Z21 - control of the locomotive from the real driver's
perspective “smartRail”, which was launched in 2012. This strategy should also primarily
provide value to the customer in order to enhance the unique gaming experience. Through
this system, the customer can control the game with his model railroad via smartphone or
tablet. The company, in collaboration with both brands, plans to continue to expand product
innovations that have been introduced through excellent manufacturing structure, precise
manufacturing methods and the use of modern technology. Digitization of model railways
is also part of the innovation strategy. Through digitization, the company wants to
continuously bring and improve new model operations such as motion, lighting and noise.
As mentioned in the previous strategy, the company is trying to focus its activities on the
younger segment. As it is now assumed that a tablet, laptop or PC is already being used in
everyday routine, Modelleisenbahn Holding GmbH is approaching to support and
strengthen both segments through various innovative strategies. The main objective of the
innovation strategy is to ensure a unique position in the industry. The uniqueness of the
implementation of the innovation strategy is emphasized by Milward (Milward, Popescu,
Frajtova Michalikova, Musova, Machova, 2019, 37-43). In connection with the innovation
strategy, the company has built an excellent production structure. Its aim is to create
European networks and global public procurement, while constantly striving to integrate
new technologies into production processes, aiming to continually increase leadership in
the interactive model rail world. However, the question is to what extent the strategy can
also be applied to the environment. Moravcikova claims that the application of the
principles of environmental marketing can strengthen the competitive position on the
market (Moravcikova, Krizanova, Kliestikova, Rypakova, 2017). Based on the information
gathered, it can be argued that working with data is important for the correct implementation
of these strategies. Kovacova et. al. they claim that the use and processing of data is very
time and cost intensive for businesses (Kovacova et. Al, 2019, p. 126-132). Therefore, the
company should try to build its own database of customers with efficient use of data
(Graessley, Scott, Suler, Kliestik, Kicova, 2019, p. 23-29).
Based on previous strategies it is possible to proceed to generalization of marketing strategy.
The company strives to target its products to a well-targeted segment, which is also reflected in
the targeted application of communication policy tools. By continually improving their
products, we approach the satisfaction of luxury needs of customers (hobbies, hobbies). The
main principles of generalization of the strategy are: targeting a narrow segment, low-cost
marketing campaigns, product improvement, meeting luxury needs (hobbies, hobbies), the
price corresponds to the quality of the product.

51st International Scientific Conference on Economic and Social Development – Rabat, 26-27 March 2020
559
The implementation of the marketing strategy should be part of the applied business model of
Freebie marketing. This should lead to the fulfillment of the basic objectives of the strategy and
thus strengthen the position of the company in the global market environment. Andrijauskiene,
Dumciuviene agrees with this. (Andrijauskiene, Dumciuviene, 2018, p. 47-67.)
3. DISCUSSION
The above-mentioned Freebie marketing strategies and concepts are popular in the market
today. One of the areas where similar strategies are used in the form of microtransactions and
supplements are computer and mobile games. After purchase or free download, the games then
require real money for character improvement or land development to continue working. Some
microtransactions are necessary to use the basic features of the game (eg Payday, Metal Gear).
A different case is The Sims 4, which offers extensions and add-ons as a standalone product to
the game. Based on the above, it is possible to see the form of application of the Freebie
marketing business concept. Nadanyiova also speaks about its importance and importance,
which claims that it can help in the correct application of CRM (Nadanyiova, 2013, p. 87-92).
A different market in which the strategy can be used is toys that offer collections and a large
number of accessories in conjunction with technological improvements to products. Mattel
offers in the Barbie or HotWheels collections accessories to the basic product (doll, toy car) a
large number of accessories such as. Barbie dream House, clothes, doll cars, Barbie friends,
HotWheels track construction components, HotWheels car collections, various launch pads and
more. In addition to these brands, this group may also include the Lego brand, which is also
based on the functioning of the so-called. Freebie Marketing. As mentioned in the previous
chapters, the application of the Freebie marketing principles is currently widespread. Brands
using this concept can strengthen their market position, gain a competitive advantage and
achieve higher profits. Based on the information and findings, it is possible to bring your own
topics to the discussion. The first is the incorporation of “Real Station Simulation”, focusing on
the primary segment. The company could develop a new application that simulates the real
operation of the railway station. The application should be linked to the model railway. The
company would provide 5 universal types of railway stations (4-track, 2-track, cargo station, 6-
track and 8-track). One application will be available for each type of station to simulate its real
operation. In order to function properly, the user must purchase a railway station package
containing switches, track and signal. After purchasing a railway station package, you can
download the app. The company can provide higher added value to these users because the user
will be able to create a simulation of the operation of a railway station in the comfort of their
home where they could build a train path. This proposal can effectively meet the goals of the
above mentioned innovation strategy of the company, which, according to Valaskova and
Kramarova, can strengthen the overall marketing performance of the company (Valaskova,
Kramarova, 2015, p. 834-844). Another topic for discussion is marketing support for the
development of railway cafes. Nowadays, there are cafes where a train will deliver a drink to
customers. Some cafes are developed in more countries such as the Czech Republic, Germany
or Austria. The point is, however, that the owner of these cafes is another business. In order to
build and strengthen the community, we suggest that the company create similar cafes as their
environment resembles a real image of the train's interior. Cafes emphasize that the customer
can experience a stylish atmosphere right on the train, which never misses. As the company
focuses on producing quality and innovative products, these cafes could be furnished in a
stylish, contemporary and designed especially for the middle class of people. In his personal
opinion, “product development” can intensively help to improve the company's marketing
performance, making it not only more popular among its segments, but could build a new
customer base in the form of attracting Generation Z.

51st International Scientific Conference on Economic and Social Development – Rabat, 26-27 March 2020
560
In this support it is possible to see interconnectivity marketing processes. According to
Alexandr, this is an important part of building the overall strategy of the company (Alexander,
2018, p. 96-105).
4. CONCLUSION
The analytical and discussion part of the article showed that Modelleisenbahn Holding GmbH
provides its products with high quality and added value to the customer. The company is a
typical example of well-targeted marketing, as it does not seek to apply communication policy
tools massively, but only to a selected segment. This segment also targets its products. The
primary segment includes men aged 40-50 years who are fond of modeling and building their
own railways, or who work as drivers. In particular, the application of communication policy
instruments should focus on the hobby factor that characterizes the primary segment.
Communication policy tools should also be used intensively by the enterprise in relation to the
secondary segment, as there is a general assumption that the primary segment will not be
sufficient for the enterprise in the future. Therefore, it should exploit all the technological and
innovative opportunities offered to the global market. In this way, the business should also
strongly influence the purchasing behavior of the Z generation. However, it is important to
perceive consumer attitudes. Those under the influence of various factors can also influence
brand perception (Valaskova, Kliestikova, Krizanova, 2018, p. 149-163). In the primary
segment, it wants to make the customer get a greater gaming experience through the innovative
Z21 system. For the secondary segment, he wants to return the model railroad to children's
rooms through the Next Generation model game. Through both brands, the company wants to
continuously expand its presence in international markets and thus achieve a leading position
in the industry. He wants to achieve this with his innovative activity, through which he tries to
connect modern technologies with model railways. By using the above tools, the company can
also strengthen its brand, which is irreplaceable in building the overall marketing strategy of
the company (Majerova, Kliestik, 2015, p. 546-552).
ACKNOWLEDGEMENT: This paper is an output of scientific project VEGA no. 1/0718/18:
The impact of psychographic aspects of pricing on the marketing strategy of companies across
products and markets.
LITERATURE:
1. Alexandrova, M. (2018). A principal component analysis of project portfolio management
practices. Ekonomicko-manazerske spectrum, p. 96-105.
2. Andrijauskiene, M., Dumciuviene, D. (2018), National culture as a determinant of firms’
innovative performance. Forum Scientiae Oeconomia, p. 47-67.
3. Annual report. The Modelleisenbahn Group. (2015). Retrieved 27.02.2020 from
https://www.spielwarenmesse.de/uploads/tx_dkdtoyfairepb/11__-
_The_company_2015__Modelleisenbahn_Muenchen_GmbH_.pdf
4. Gavurova, B., Bacik, R., Fedorko, R., Ludovit Nastisin, L. (2018). The Customer´s Brand
Experience in the Light of Selected Performance Indicators in the Social Media
Environment. Journal of Competitiveness, p. 72 – 84.
5. Graessley, S., Suler, P., Kliestik T., Kicova, E. (2019). Industrial Big Data Analytics for
Cognitive Internet of Things: Wireless Sensor Networks, Smart Computing Algorithms,
and Machine Learning Techniques. Analysis and Metaphysics, p. 23–29.
6. Huang, KL., Kuo, CW., Shih HJ. (2017). Advance selling with freebies and limited
production capacity. Omega-International Journal of Management Science, p. 18-28.
7. Finstat.sk Average revenue. Retrieved 25.2.2020 from http://www.finstat.sk/31581820

51st International Scientific Conference on Economic and Social Development – Rabat, 26-27 March 2020
561
8. Fleischmann.de Information about company. Retrieved 25.02.2020 from
http://www.fleischmann.de/en/aboutus/history/index.html
9. Konickova, J. (2016). Aká je generácia Z?. Retrieved 27.02.2020 from
https://eduworld.sk/cd/jaroslava-konickova/325/aka-je-generacia-z
10. Kovacova, M., Kliestik T., Pera, A., Grecu J., Gheorghe G. (2019). Big Data Governance
of Automated Algorithmic. Decision-Making Processes, Review of Contemporary
Philosophy, p. 126–132.
11. Kramarova, K., Gregova, E., Cisko, S. (2014). CHANGES IN THE CORPORATE TAX
IN SLOVAKIA - TAX LICENSE. Conference: 8th International Scientific Conference on
Business and Management. Location: Vilnius, LITHUANIA
12. Krizanova, A., Majerova, J., Kliestik, T., Majercak, P. (2013). Theoretical Aspects of Brand
Building in Seafood Industry. NAŠE MORE, p. 105-112.
13. Ludbrook, F., Frajtova Michalikova, K., Musova, Z., Suler, P. (2019). Business Models for
Sustainable Innovation in Industry 4.0: Smart Manufacturing Processes, Digitalization of
Production Systems, and Data-driven Decision Making. Journal of Self-Governance and
Management Economics, p. 21–26.
14. Majerova, J., Kliestik, T. (2015). Brand valuation as an immanent component of brand value
building and managing. Conference: 4th World Conference on Business, Economics and
Management (WCBEM) Location: Ephesus, Turkey.
15. Milward, R., Popescu, G. H., Frajtova Michalikova, K., Musova, Z., Machova, V. (2019).
Sensing, Smart, and Sustainable Technologies in Industry 4.0: Cyber-Physical Networks,
Machine Data Capturing Systems, and Digitized Mass Production. Economics,
Management, and Financial Markets, p. 37–43.
16. Moravcikova, D., Krizanova, A., Kliestikova, A., Rypakova, M. 2017. Green Marketing as
the Source of the Competitive Advantage of the Business. Sustainability.
17. Nadanyiova, M. (2013). The Posibility of Introducting the CRM System in Railway
Company Cargo Slovakia. Conference: 17th International Conference on Transport Means
Location: Kaunas Univ Technol, Kaunas, Lithuania
18. Product catalog. (2015). Retrieved 25.2.2020 from
http://www.elektrickevlacky.cz/documents/RO2015.pdf
19. ROCO – SLOVAKIA, spol. s r. o. Register. Retrieved 27.2.2020 from
http://www.registeruz.sk/cruz-public/domain/accountingentity/show/163253
20. The Number of looks. (2013). Retrieved 27.2.2020 from
https://www.youtube.com/watch?v=GlSuz5XyffA
21. Valaskova, K., Kliestikova, J., Krizanova, A. (2018). Consumer Perception of Private Label
Products: An Empirical Research. Journal of Competitiveness, p. 149-163.
22. Valaskova, K, Kramarova, K. (2015). ANALYSIS OF A MARKET PERFORMANCE IN
THE EUROPEAN UNION AND SLOVAKIA. Conference: 15th International Scientific
Conference on Globalization and its Socio-Economic Consequences. Location: Rajecke
Teplice, Slovakia

51st International Scientific Conference on Economic and Social Development – Rabat, 26-27 March 2020
562
DIRECTIONS AND PROBLEMS OF INVESTMENT ACTIVITY IN THE
NOVOSIBIRSK REGION
Vyacheslav Markelov
Vice-President of the Novosibirsk Chamber of Commerce and Industry,
Associate Professor at Novosibirsk State University of Economics and Management,
Candidate of Technical Sciences
Novosibirsk, Russia
ABSTRACT
The paper assesses the state of the investment climate in the Novosibirsk region and compares
the situation in this area with neighbouring regions and the Russian Federation as a whole.
Regional legislation and measures of state support to enterprises are analysed. Promising
areas of investing activity are considered in detail, such as modernization, expansion or
construction of production facilities in the field of biotechnology and biopharmaceuticals;
modernization, expansion or construction of socially significant objects in the field of
education, culture, physical culture and sports, health care; modernization, expansion or
development of transport and logistics infrastructure; modernization, expansion or
establishment of machinery and equipment production. The results are summarized in the
establishment of innovative infrastructure and Park projects, such as Scientific and
Technological Park of Novosibirsk Akademgorodok, the science and technology Park of
Biotechnologies, Innovative Medical Technology Center. The innovative infrastructure created
in higher education institutions, as well as children's technoparks, is considered separately.
Favorable conditions for the development of innovations in the Novosibirsk region will
facilitate effective development of regional innovative clusters: information technology,
biopharmaceutical, biotechnologies and biomedicine, medical technology clusters. Along with
the development of the Siberian Science Polis, the establishment of clusters covering the areas
of agriculture, mechanical engineering, metallurgy, instrument-making and new materials is
promising. Thus, the goal of the Siberian metallurgical and machine-building cluster of
additive digital technologies and productions is to create a digital production of metal products
using additive technologies based on its own production of additive machines, including 3D
printers, and powder materials. However, despite the progress made, there are a number of
challanges to improve the investment performance. A set of measures is proposed in this
direction: organizational, legislative, marketing. In particular, public authorities responsible
for attracting investments should collaborate more closely with Chambers of Commerce and
Industry.
Keywords: investing activities, innovations, package projects, modernization, cluster
1. INTRODUCTION
A lot of RF regions are currently facing the challenge of finding new ways and mechanisms of
attracting investment into the development of infrastructure complexes. The success of a
particular region in attracting investment has become dependent not only on objective factors,
such as the volume of the consumer market, availability of raw materials, and geographical
location, but also on the investment climate created by the executive authorities of the RF
subjects. In the Novosibirsk region, as in other regions, it is essential to create conditions for
active participation of business in the implementation of investment projects. A carefully
designed investment policy, both at the federal and regional levels, is one of the most important
components of the country's successful economic development. In addition to tax revenue on
the invested capital, the economy benefits in the form of new jobs, implementing social

51st International Scientific Conference on Economic and Social Development – Rabat, 26-27 March 2020
563
programs, etc. Novosibirsk region is one of the industrial regions of the Russian Federation,
located in the Siberian Federal Okrug. The region is characterized by the following: equal
distance from the Eastern and Western country borders, poor mineral resource base, high
diversification of economic sectors (see Fig.1), the development of high-tech industries and a
powerful scientific and educational complex, the Central trade and logistics infrastructure for
the mega region, which is home to 13 million people.
Figure 1: Structure of the gross regional product of the Novosibirsk region in 2018 and plans
for 2030, %
Source: Information and analytical website of the Novosibirsk region http://econom.nso.ru
In recent years, the region has shown a substantial growth rate of the gross regional product,
which is ahead of the overall growth rate over the country (Fig.2).
Figure 2: Dynamics of the gross regional product, %
Source: Information and analytical website of the Novosibirsk region http://econom.nso.ru
2. INVESTING ACTIVITIES
The strong physical obsolescence of the technological equipment in the region makes it
essential to further stimulate the investment process and optimize the investment structure.
Against the background of increasing the competition in Russian regions for the financial
resources, as well as taking into account the high cost of borrowed funds for the development
0 5 10 15 20 25
Hotels, financesReal estate
ConstructionEducation
Healthcare and medicineAgriculture and stockbreeding
Public administration and social securityWholesale and retail trade
Transport and communicationsIndustrial production
Science
%
2018
2030 (plan)
90
95
100
105
110
2010 2011 2012 2013 2014 2015 2016 2017 2018 2019
chan
ges
in %
in
rel
atio
n t
o t
he
pre
vio
us
year
year
Novosibirsk regionRF
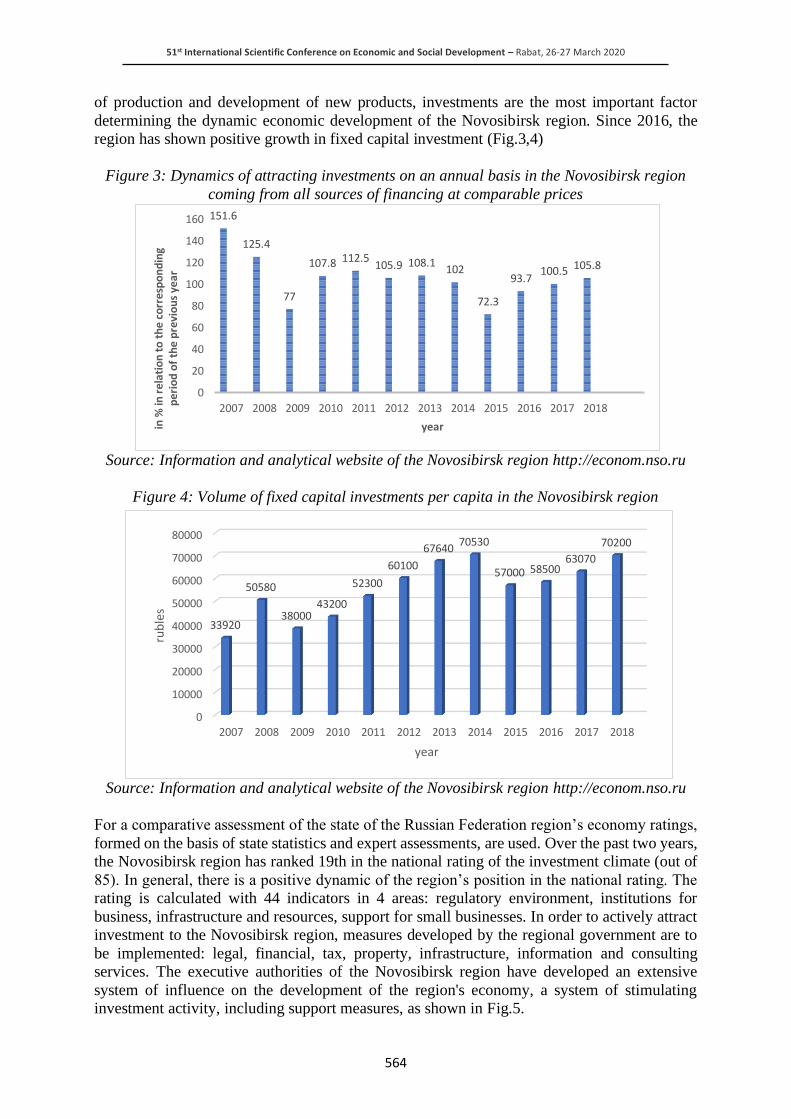
51st International Scientific Conference on Economic and Social Development – Rabat, 26-27 March 2020
564
of production and development of new products, investments are the most important factor
determining the dynamic economic development of the Novosibirsk region. Since 2016, the
region has shown positive growth in fixed capital investment (Fig.3,4)
Figure 3: Dynamics of attracting investments on an annual basis in the Novosibirsk region
coming from all sources of financing at comparable prices
Source: Information and analytical website of the Novosibirsk region http://econom.nso.ru
Figure 4: Volume of fixed capital investments per capita in the Novosibirsk region
Source: Information and analytical website of the Novosibirsk region http://econom.nso.ru
For a comparative assessment of the state of the Russian Federation region’s economy ratings,
formed on the basis of state statistics and expert assessments, are used. Over the past two years,
the Novosibirsk region has ranked 19th in the national rating of the investment climate (out of
85). In general, there is a positive dynamic of the region’s position in the national rating. The
rating is calculated with 44 indicators in 4 areas: regulatory environment, institutions for
business, infrastructure and resources, support for small businesses. In order to actively attract
investment to the Novosibirsk region, measures developed by the regional government are to
be implemented: legal, financial, tax, property, infrastructure, information and consulting
services. The executive authorities of the Novosibirsk region have developed an extensive
system of influence on the development of the region's economy, a system of stimulating
investment activity, including support measures, as shown in Fig.5.
151.6
125.4
77
107.8 112.5105.9 108.1
102
72.3
93.7100.5 105.8
0
20
40
60
80
100
120
140
160
2007 2008 2009 2010 2011 2012 2013 2014 2015 2016 2017 2018
in %
in r
elat
ion
to
th
e co
rres
po
nd
ing
per
iod
of
the
pre
vio
us
year
year
0
10000
20000
30000
40000
50000
60000
70000
80000
2007 2008 2009 2010 2011 2012 2013 2014 2015 2016 2017 2018
33920
50580
3800043200
52300
60100
6764070530
57000 5850063070
70200
rub
les
year

51st International Scientific Conference on Economic and Social Development – Rabat, 26-27 March 2020
565
Figure 5: System of stimulating measures of investment activities in the Novosibirsk region
Source: Compiled by the author
The peculiarities of the region serve as a justification for the development of two areas in which
investment activities should be built:
1. High-tech, innovative industries with a high share of added value in the price of
manufactured products, which is not affected by the transport component.
2. Industries producing goods and services that will be consumed within the region.
Promising areas of investment activity in the region are indicated modernization, expansion or
creation of production facilities: innovative products and services, new materials and
technologies; medical devices; in the field of biotechnologies and Biopharmaceuticals; food
and processing industry; modern building materials and construction structures; in the field of
mining; in the field of wood processing; machinery and equipment. As well as the
modernization, expansion or creation of transport and logistics infrastructure; in the field of
education, culture, physical culture and sports, and health care.
3. INNOVATIONS
Another rating that characterizes the region's position is the Rating of Innovative Development
of Russian Regions. The Novosibirsk region occupies a leading position in the Russian
Federation in terms of the main characteristics of the scientific potential, but the region lags far
behind Moscow, St. Petersburg, Moscow, Samara and Nizhny Novgorod regions in terms of
the number of advanced technologies used in production. This fact is confirmed by the fact that
the expenses for technological innovations of organizations by types of innovative activities per
capita in 2018 amounted to only 2900 rubles, while in the country this figure amounted to
10,000 rubles, and in the leading regions (Moscow, the Moscow region, Tatarstan, KHMAO) -
20-30 thousand rubles. A significant gap between the high scientific and technical potential and
the low susceptibility of the region's production system to innovation is one of the specific
problems of the Novosibirsk region's development. Technological lag of industrial enterprises,
insufficient funds for R&D financing and related technological risks, low labour productivity
and the shortage of a highly qualified personnel hinder the active introduction of new
competitive technologies into production. The insufficient development of the mechanisms of
new technologies commercialization and transfer and developments is also a limiting factor.
Figures 6 and 7 illustrate the difference in investment into the innovative development by
region.
Target programmes
•Credit support
•State guarantees and subsidies for repayment of interest on loans and leasing payments
•Provision of technological infrastructure (technoparks, business incubators, technology support centers)
Agencies
•Compensation of expenses for technical re-equipment, R & D, development of business plans, patenting
•Infrastructure development of investment sites (industrial parks)
Funds
•Benefits and preferences
•Information support (consulting centers, websites, congress activities)
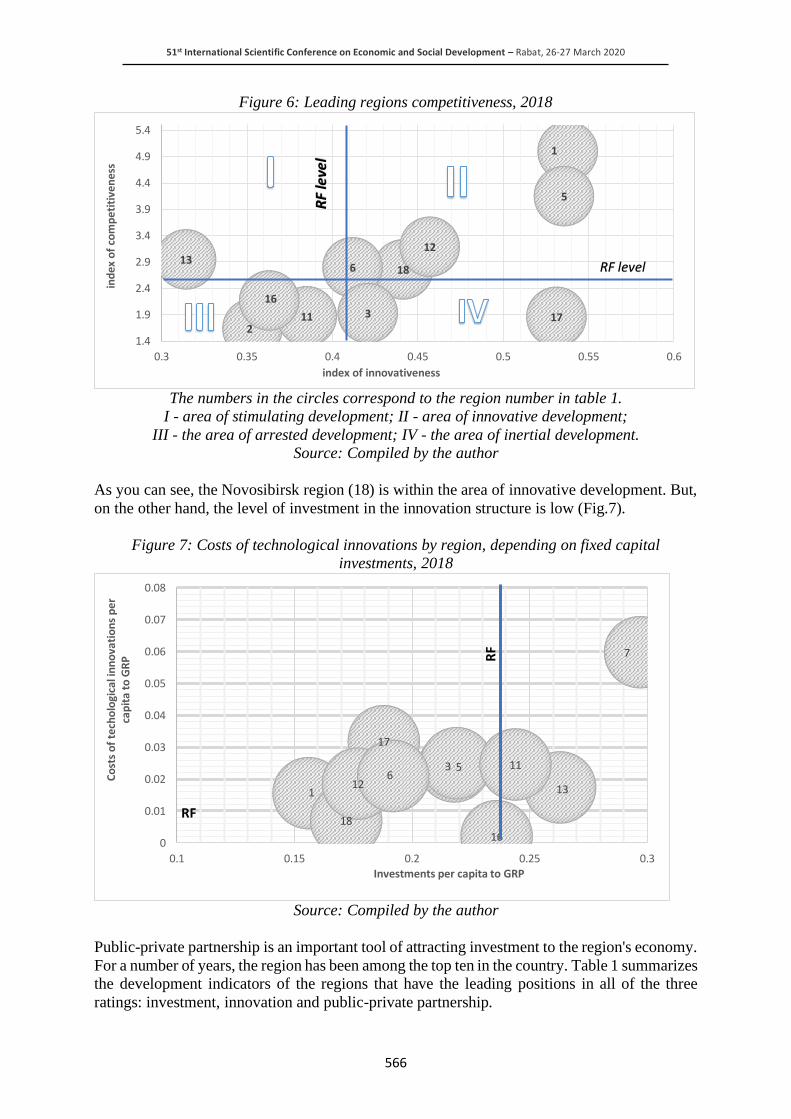
51st International Scientific Conference on Economic and Social Development – Rabat, 26-27 March 2020
566
Figure 6: Leading regions competitiveness, 2018
The numbers in the circles correspond to the region number in table 1.
I - area of stimulating development; II - area of innovative development;
III - the area of arrested development; IV - the area of inertial development.
Source: Compiled by the author
As you can see, the Novosibirsk region (18) is within the area of innovative development. But,
on the other hand, the level of investment in the innovation structure is low (Fig.7).
Figure 7: Costs of technological innovations by region, depending on fixed capital
investments, 2018
Source: Compiled by the author
Public-private partnership is an important tool of attracting investment to the region's economy.
For a number of years, the region has been among the top ten in the country. Table 1 summarizes
the development indicators of the regions that have the leading positions in all of the three
ratings: investment, innovation and public-private partnership.
1
18
17
5
211
12
16
136
3
1.4
1.9
2.4
2.9
3.4
3.9
4.4
4.9
5.4
0.3 0.35 0.4 0.45 0.5 0.55 0.6
ind
ex o
f co
mp
etit
ive
nes
s
index of innovativeness
RF level
RF
leve
l
1
5
18
17
16
7
136
12
3 11
0
0.01
0.02
0.03
0.04
0.05
0.06
0.07
0.08
0.1 0.15 0.2 0.25 0.3
Co
sts
of
tech
olo
gica
l in
no
vati
on
s p
erca
pit
a to
GR
P
Investments per capita to GRP
RF
RF

51st International Scientific Conference on Economic and Social Development – Rabat, 26-27 March 2020
567
Table 1: The indicators of the regional development. (Compiled by the author according to
the Rating of innovative development of the RF subjects https://www.hse.ru/primarydata/rir;
Regions of Russia. Socio-economic indicators.
No
Region
GRP
billion
rubles
Inves
tmen
ts
bil
lion r
uble
s
Cost
s of
tech
nolo
gic
al
innovat
ions
bil
lion r
uble
s
Com
pet
itiv
enes
s
index
2015
Innovat
ive
dev
elopm
ent
index
2017
1 Moscow 1,5724,909 2,485,176 249,579 5 0.5378
2 Tambov region 300,554 106,230 5,797 1.03 0.3532
3 Kaluga region 417,065 91,138 10,401 2.19 0.4207
4 Moscow region 3,802,953 945,424 136,923 4.1 0.4616
5 Saint Petersburg 3,866,402 852,923 94,160 3.95 0.5356
6 Republic of Bashkortostan 1,396,411 267,929 29,252 2.94 0.4118
7 Republic of Tatarstan 2,114,176 629,731 126,908 3.98 0.5375
8 Perm region 1,191,101 243,613 36,915 2.52 0.3971
9 Nizhny Novgorod region 1,260,219 259,393 95,618 2.61 0.4957
10 Samara region 1,349,886 264,989 42,524 3.24 0.4167
11 Ulyanovsk region 340,639 82,924 8,328 1.88 0.3850
12 Sverdlovsk region 2,142,514 378,662 39,781 3.47 0.4570
13 Khanty-Mansi
Autonomous Okrug
3,511,127 930,721 61,623 3.07 0.3143
14 Krasnoyarsk region 1,882,315 421,780 61,568 2.98 0.4124
15 Irkutsk region 1,192,080 318,787 26,776 3.03 0.3551
16 Kemerovo region 1,058,113 248,665 2,225 1.85 0.3630
17 Tomsk region 511,025 96,223 16,337 2.37 0.5312
18 Novosibirsk region 1,140,863 197,114 8,122 2.52 0.4414
Retrieved from https://www.gks.ru/folder/210/document/13204
Science and innovation retrieved from https://www.gks.ru/folder/14477
Regional competitiveness index - Russia's growth poles (AV RCI-2015 retrieved from
https://av-group.ru)
4. PARK PROJECTS
It is necessary to preserve the strengths of the Novosibirsk region, namely a favourable
environment for innovations. The major priority of the Novosibirsk region innovation policy is
to reduce the significant gap between the high scientific and technical potential of the region
and the existing low susceptibility of its production system to innovation in the region, as well
as the development of innovation infrastructure, providing significant competitive advantages
of the region. Park projects of the Novosibirsk region serve as a foundation for the innovative
infrastructure. There is a successful experience in developing state and non-state park projects
in the Novosibirsk region. To provide comfortable conditions for investors and innovative
firms, the infrastructure of the largest Park projects will be further developed in the Novosibirsk
region: Scientific and Technological Park of the Novosibirsk Akademgorodok (hereinafter-
Academpark); Scientific and Technological Park for biotechnologies in the science centre of
Koltsovo, Novosibirsk region; Innovative Medical and Technological Centre (IMTC); Medical
Industrial Park. Academpark is a complex science and technology Park with a unique
infrastructure that creates the best conditions for the establishment and development of
innovative companies.

51st International Scientific Conference on Economic and Social Development – Rabat, 26-27 March 2020
568
The area of constructed objects exceeds 100 thousand square meters. Academpark has 209
residents and created about 5 thousand jobs. In 2015, Academpark was recognized as the most
successful technopark in Russia. The innovation infrastructure network, created in higher
education institutions, contributes to the training of highly professional personnel with unique
experience in commercialization of scientific projects, increasing the number of students
employed by organizations that carry out innovative activities. Innovative infrastructure of
higher education institutions includes: two technoparks, more than 100 test laboratories, 12
collective centers, 10 business incubators, 10 engineering centers, and 4 technology transfer
centers. On the basis of the innovative infrastructure of higher education institutions, almost
250 projects are being implemented in various fields, including architecture and construction,
communications, low-temperature plasma and nanofilm synthesis, optics and molecular
physics, nanostructure research methods, instrumentation and geoinformatics. In the
Novosibirsk region, the children's technological parks will be further developed under the brand
name Quantorium within the the agreement with ASI (Agency for Strategic Initiatives). Since
2015, the region has been developing the Children's Technopark in Akademgorodok, as well as
school and municipal children's technoparks. In addition, resource centres for engineering
competencies, STEM centers, NSU STEM laboratory, centres for youth innovative creativity
were established. When developing innovative infrastructure and parks, the main problem is to
attract private investors.
5. CLUSTERS
The availability of favourable conditions for the development of innovations in the Novosibirsk
region will facilitate effective development of innovative territorial clusters in the region. Park
projects are regarded as a good venue for clusters, for example, Novosibrsk Academpark,
Biotechpark, Medtechnopark, Medical Industrial Park. The Novosibirsk region is an example
of one of the best practices for the development of innovative clusters in Russia. The
implementation of the cluster policy contributes to the competitiveness growth of each
individual participant and the entire cluster as a whole by realizing the potential for effective
interaction between cluster participants, related to expanding the access to innovations,
technologies, modern management methods, the latest equipment, specialized services and
highly qualified personnel, increasing opportunities for attracting investment and entering
international markets, as well as reducing transaction costs. In the process of innovation system
transformation in the Novosibirsk region and implementation of federal initiatives in the area
of cluster policy in the region the Siberian Science Polis - Innovative cluster of information and
biopharmaceutical technologies of Novosibirsk region - has been established. It was included
into the List of pilot innovative territorial clusters of the Russian Federation. The major trends
of the Siberian Science Polis development are:
• the development of the cluster's innovation and production infrastructure;
• the support of R&D in cooperation with international companies, research institutes and
world-class universities;
• ensuring technological leadership in the cluster's areas;
• the development of universities and human capital;
• the creation of a complete added-value chain within the cluster by developing cooperation,
including with neighbouring regions;
• the improvement the investment climate and actively attracting investors.
Along with the development of the Siberian Science Polis, the establishment of clusters
specialized in agriculture, mechanical engineering, metallurgy, instrument-making and new
materials is promising. The following clusters are currently undergoing the stage of institutional
design and programmes development: cluster of agricultural machinery manufacturers,
51st International Scientific Conference on Economic and Social Development – Rabat, 26-27 March 2020
569
machinery and equipment producers, first grain cluster; Siberian metallurgical and machine-
building cluster of additive digital technologies and production of the Novosibirsk region.
Thus, the goal of the latter is to launch a digital production of metal products using additive
technologies based on its own production of additive machines, including 3D printers, and
powder materials.
6. CONCLUSION
The implementation of these measures is aimed at achieving the following results by 2022:
• 12th place in the National Rating of the Investment Climate;
• 4th place in the rating of public-private partnership development;
• 35 residents of existing Park projects in the Novosibirsk region;
• 7 institutional clusters in the region;
• 35 municipalities of the Novosibirsk region that have implemented a tourist navigation
system;
• listing of the region in the rating of innovative regions of Russia, developed by the
Association of innovative regions of Russia, in the "strong innovators" group;
• the share of organizations that implement technological innovations in the total number of
organizations in the Novosibirsk region is 7.7%.
In our view, to ensure a breakthrough economic development based on the most important
competitive advantages of the Novosibirsk region, namely knowledge, technologies, and
competencies, the regional government programmes should be supplemented with the
following proposals:
1. The regional government should more clearly define the priorities and goals of its
investment policy, focusing on competitive areas in the region. Update the investment
strategy of the Novosibirsk region up to 2030. To set a target of increasing investment into
fixed capital as a proportion of GRP up to 27%, the share of fixed capital investment per
capita to 100 thousand rubles.
2. As additional support measures:
• to adopt a regional law on investment tax deduction;
• to increase the capitalization of the regional industry fund, established to support
investment activities in the industrial sector;
• to reduce the tax rate under the simplified tax system for certain categories of taxpayers.
3. The regional government should colloborate more actively with investors and interested
organizations. Actively cooperate with the Chamber of Commerce and Industry in finding
and attracting investors.
4. To introduce new tools of attracting investment, namely:
• to implement the ideology of integrated development of the territory with the advanced
infrastructure development and coordination of schedules and volumes of investment
into industry and infrastructure projects.
• to implement the principle of urgency, return on investment, and profitability of private
investments in infrastructure profitability due to budget participation in payments for
infrastructure, taking into account the growth of budget revenues from the
implementation of territory's integrated development projects (Tax Increment Financing
mechanism).
• to implement the principle of delegating responsibility to private investors for the
development and operation of infrastructure within the framework of life cycle
contracts.

51st International Scientific Conference on Economic and Social Development – Rabat, 26-27 March 2020
570
• to implement opportunities to attract long-term institutional investors to infrastructure
development in the framework of territory's integrated development and life cycle
contracts.
• to attract investors to implement projects that stimulate the development of demand in
the macroregion, taking into account the forecast of long-term results of the
implementation of territory's integrated development projects.
LITERATURE:
1. Markelov, V. A. (2013). Public-private partnership as a tool for innovative development of
the region's economy. [Gosudarstvenno-chastnoe partnerstvo kak instrument
innovacionnogo razvitija jekonomiki regiona]. Institucional'naja transformacija
jekonomiki: uslovija innovacionnogo razvitija. (Institutional transformation of the
economy: conditions for innovative development). Collection of articles based on the
materials of the III International scientific conference (pp. 92-107)
2. Melnikov, V. V. (2012). Content of innovation and scientific and technical policy of the
state in the construction of the national innovation system [Soderzhanie innovacionnoj i
nauchno-tehnicheskoj politiki gosudarstva pri postroenii nacional'noj innovacionnoj
sistemy] TERRA ECONOMICUS. (Volume 10. - No. 4. - pp. 47-61).
3. Rating of innovative development of regions. Retrieved from https://issek.hse.ru/rir
4. Regional competitiveness index - Russia's growth poles. Retrieved from https://av-group.ru
5. Regions of Russia. Socio-economic indicators. Retrieved from
https://www.gks.ru/folder/14477
6. Science and innovation. Retrieved from
https://www.gks.ru/folder/14477https://www.gks.ru/folder/210/document/13204

51st International Scientific Conference on Economic and Social Development – Rabat, 26-27 March 2020
571
MANAGEMENT OF NON-PROFIT ORGANIZATIONS
Zuzana Rosnerova
University of Zilina, Faculty of Operation and Economics of Transport and Communications,
Department of Economics
Univerzitna 1, 010 26 Zilina, Slovak Republic
Dagmar Hraskova
University of Zilina, Faculty of Operation and Economics of Transport and Communications,
Department of Economics
Univerzitna 1, 010 26 Zilina, Slovak Republic
ABSTRACT
The article is focused on the management of non-profit organizations. Since these organizations
are entities operating in the non-profit sector, we work with the assumption of a different way
of managing a non-profit organization than that which is applicable in the private sector to
businesses. The method of management adapts in particular to the mission and objective of the
non-profit organization. The main aim of the article was to specify differences in the activities
of individual areas of management of non-profit organizations. The first part of the article is
devoted to the theoretical aspects of the issue. In the next part of the article we focused on the
analysis of management, dividing it into partial sections. In our opinion, non-profit
organizations should conduct management on the basis of separate management sections. We
divided the management sections as follows: the personnel management section, the strategic
management section, the project section and the financial management section. For each
management area, we specified important activities that should be undertaken in that
management area. We consider this kind of management to be advantageous over “general”
management, which would have to solve all kinds of problems at once. If management were to
be divided into management areas according to the subject of management, the difficulty of
solving problems for the manager would be eliminated. The greatest advantage is that when
dividing the management into individual sections is responsible for a given section of a
particular manager, who has management of the section in their competence. As non-profit
organizations address very many issues, they are the main reason why general management
should be divided into sections and entrusted to the appropriate manager. At that time, the
management process will become more transparent, with each manager addressing issues for
his or her department.
Keywords: management of non-profit organizations, personnel management, strategic
management, project management, financial management and fundraising
1. INTRODUCTION
The success of non-profit organizations is conditioned by internal processes that take place
inside the organization. The most important process in this respect is management, which is
understood as the management of a non-profit organization as an independent entity on the
market. The future direction of the organization is subject to a number of decisions and it is
clear that the functioning of a non-profit organization is not too easy. The non-profit
organization must first of all respect its mission under which the reason for the non-profit
organization originated. The whole existence of a non-profit organization must follow its
mission during its “life”. The management of the non-profit organization, which is responsible
for the functioning of the non-profit organization and the results it achieves in the given market,
51st International Scientific Conference on Economic and Social Development – Rabat, 26-27 March 2020
572
comes to the forefront. Management as a comprehensive management system is desirable for a
non-profit organization, because these types of organizations arise not on the market for making
profit but for providing beneficial services to the target entities. The provision of services of
general interest takes place in various areas - in particular in the areas of health care, education,
culture and sports… The following hypothesis has been established for the issue - the non-profit
organization management should not act as one section, but it should be branched into several
sections. If only one manager is at the head of a non-profit organization, we consider this to be
a shortage factor, because one person cannot solve all problematic issues in a non-profit
organization. In our opinion, the management as such should be divided into partial sections
and each section would be represented by a separate manager who would be responsible for the
section entrusted to it. We see the main advantage in a more precise analysis of the problems
that arose and in a more effective solution.
2. THEORETICAL BACKGROUND OF THE SEARCH ISSUE
The term "non-profit organization" refers to an organization that is set up to provide public
benefit services in various areas of the economy. In connection with the issue of non-profit
organizations we encounter various other terms such as. non-profit sector, third sector,
volunteering, independent sector, non-profit organizations or private non-profit sector. In
particular, the not-for-profit sector refers to a substantial distinction that distinguishes
commercial and profitable organizations from non-profit organizations, where profit and
commercial organizations are primarily aimed at making a profit. On the other hand, there are
non-profit organizations that have no primary profit-making goal. While they can make a profit,
this profit is reused for the operation of a non-profit organization and through it non-profit
organizations finance their activities. In general, the profit is used by a non-profit organization
to fulfill its mission and its primary objective is to provide public benefit services. By the third
sector we mean the space that exists between the public sector, which represents the state or
self-government, and the private sector, which is represented by enterprises and also the market.
The fact is that non-governmental non-profit organizations provide services that the state does
not or does not want to provide, and also these activities are not sufficiently interesting for the
private sector because they are not very profitable (Rektorik, 2001). Volunteering is understood
in particular as the principle on which non-profit organizations operate. Ie. that a large part of
the organization's activities are organized and implemented through volunteers, although there
are also paid employees in this sector. The independent sector refers to the independence of the
sector from the state or private sector. However, this independence can be considered relative,
as non-profit organizations are often subsidized by the state and also by the private sector. Non-
governmental organizations are non-governmental organizations, so their establishment and
functioning are not subject to the decisions of the state or state authorities. In the private
nonprofit sector we can include organizations that are created as private but provide services
that are aimed at meeting public objectives (Cibakova et al., 2013). The basic features of non-
profit organizations according to Salamon and Anheier consist of five points:
1. have a formal structure - they are some extent formalize, institutionalize,
2. have a private character - they are separate from the state administration,
3. are non-profit-making - they are not intended to generate profits that should be redistributed
among owners. Eventual profit is returned to the organization and reused to ensure its
operation.
4. they are self-governing - ie they are independent of government control,
5. are voluntary - their activity is based on the activity of volunteer workers (Salamon et al.,
1997).
51st International Scientific Conference on Economic and Social Development – Rabat, 26-27 March 2020
573
The areas of activity of non-profit organizations are as follows:
• culture, monument protection, art,
• research and education. Data and technology research has been analyzed by Whittle et al.
(Whittle et al., 2019).
• health care and social services,
• environmental protection, environmental education. Environmental protection was further
elaborated by Csaba et al. (Fogarassy et al., 2018).
• protection of human rights,
• community development,
• work with children and youth,
• recreation, sports, physical education,
• others (eg support of the non-profit sector, its public relations, information services, support
of donation and volunteering) (minv).
3. SPECIFICS OF MANAGEMENT IN NON-PROFIT ORGANIZATIONS
Management is an important element of today's organizations. As we look at management as a
process of management and direction of the organization, whose task is to meet the set goals,
we can say that from management depends in many ways on the success and progress of a
particular subject. Every manager in an organization who wants to manage his or her
subordinates and achieve the set goals should focus on modern methods and techniques in their
managerial practice (Kmecova, 2018). Management as a stand-alone process is used in several
areas in today's economies. It has its place in companies, state or self-governing institutions and
non-profit organizations use management as well. In each area, management has certain specific
features. If we compare management in a private company, that is, in a company and
management in a non-profit organization, we would find some differences. The non-profit
organization in its management process draws up its own plans, strategies, makes decisions,
accepts people, rewards and motivates employees or performs controls. As we have already
mentioned, management activities in non-profit organizations are distinguished from
commercial enterprises that aim to generate profits (Sedlak, 2008). The primary difference is
the relationship with workers in organizations. In companies whose primary objective is to
make a profit, employee remuneration and motivation come first. For non-profit organizations,
this is primarily motivation. Within a non-profit organization, we can say that workers are
motivated primarily by helping others and feeling satisfied in the performance of their work.
An employee in a commercial enterprise works mainly because of his remuneration, which is
the strongest factor in his motivation. For non-profit organizations, mainly volunteers work,
and private enterprises do the work of their employees. The management of non-profit
organizations carries out activities aimed at motivating its members. Their motivation, as we
have already mentioned, is determined through the mission of a non-profit organization, where
its employees are pleased to help others and this activity fulfills them internally - help to others,
being useful for others, or simply helping where is the aid much needed and desirable for the
other party. The policy of recruiting volunteers in a non-profit organization is closely linked to
its mission, and it is through this that non-profit organizations seek to recruit volunteers to carry
out their activities and activities (Brozmanova Gregorova, 2012). The follow figure show the
basic differences between business and non-profit organization by objective, employee
relationship and motivation elements.
Table following on the next page

51st International Scientific Conference on Economic and Social Development – Rabat, 26-27 March 2020
574
Table 1: Basic differences between business and non-profit organization by objective,
employee relationship and motivation elements BUSINESS NON-PROFIT ORGANIZATION
Primary goal: Making Profit Primary goal: Provision of Public
Benefit Services
Employee Relationship by Remuneration and
Motivation Employee Relationship By Motivation
Motivation factor by Salary Motivation factor By Misson of
Organization
Source: self-processing
Non-profit organization management is characterized by the following specific features:
• non-profit organizations have more complex goal system
• non-profit organizations are undergoing different phases of organizational development. A
very important factor to which the development of an organization is subject is a change in
market conditions. Changes in the market environment are reflected in quantitative
indicators and this issue is described in more detail by Hudakova et al. In her publication
(Hudakova et al., 2018).
• personnel management is more complex due to the personnel structure that is made up not
only of paid employees but also of volunteers, civilians, workers, field workers, etc.
• the accent is placed on the financial side of the non-profit organization, since it is more or
less dependent on external sources and combines the sources of funding so that the non-
profit organization is not dependent on one source of funding. Ie. it should have more
resources to finance its activities. When comparing the way in which businesses are
financed, they can monitor their financial performance through various indicators. On the
basis of these, the company is able to assess its economic situation and through the results
it can solve a specific way of financing, eg. obtaining a loan (Salaga et al., 2015).
• non-profit organizations also need to address marketing issues, in particular pricing,
relationship building, communication and distribution, and marketing is a specific area of
governance in a non-profit organization,
• change management, conflict resolution and decision-making - at each in order to do this,
the non-profit organization must take into account the specific situation, with particular
emphasis on its mission (Majtan, 2005 and Majduchova, 2009).
Management in a non-profit organization must take into account the following aspects:
1. Mission - under the mission we understand a clearly defined idea and direction of the non-
profit organization, the reason - why the non-profit organization was established and for
what purpose.
2. Drawing up a strategic plan - it is the creation of a long-term plan and strategy, the
formulation of the main priorities and objectives.
3. Organizational structure: the non-profit organization must determine the type of
organizational structure, the distribution of competences among workers and the allocation
of responsibilities are important.
4. Organs and people in the organization: it is the specification of the job description for the
workers, the way of motivation, education and valuation of the workers and the creation of
good working or interpersonal relationships (Butora, 1995).
5. Legislative obligations - knowing and adhering to legal norms related to non-profit
organization is very important.
6. Systems: record keeping is essential, information flow and communication are of great
importance.

51st International Scientific Conference on Economic and Social Development – Rabat, 26-27 March 2020
575
7. Financial management: the emphasis is on budgeting, fundraising as a form of fundraising,
accounting, closing of accounts and checking of posted facts are important. According to
Michalski et al. the effectiveness of the non-profit organization should be assessed in the
context of risk. This is assessed on the basis of the debt-to-property relationship of the
organization. (Michalski et al., 2018).
8. Programming: programs include a set of activities to ensure the organization's mission.
9. Relationships with the community: the primary element is communication, monitoring of
community needs, responsiveness to identified needs of the target group and provision of
services. Issues related to the target group are also addressed by Olah et al. in his paper
(Olah et al., 2018).
10. Evaluation: it is a continuous evaluation of the activities of the organization at regular
intervals, whether the tasks are fulfilled, and also the effectiveness of people's work in the
non-profit organization is evaluated.
Follow figure shows factors to be taken into account by management of non-profit organization.
Figure 1: Factors to be taken into account by management of non-profit organization
Source: self-processing
4. ANALYSIS OF TYPES OF MANAGEMENT IN NON-PROFIT ORGANIZATIONS
Analysis of types of management in non-profit organizations
In order for a non-profit organization to have high-level management, it is necessary to divide
the entire management area into partial parts, which would be represented by the following
sections. These individual sections of management participate in building the overall quality of
management as a separate area in the organization. The quality of management thus depends
on the level of the following management sections:
1. personnel management,
2. strategic management,
3. project management,
4. financial management.
4.1. Personnel management
This area of management is in charge of people, who can be said to be the most important entity
that determines the success of a non-profit organization and it is people who are the building
pillar of a non-profit organization. It is the human factor that depends on the whole functioning
of the non-profit organization, because one is responsible for all activities that take place in the
non-profit organization. Through the way of managing a non-profit organization as a “living
organism”, one is also responsible for the quality of the services provided by the non-profit
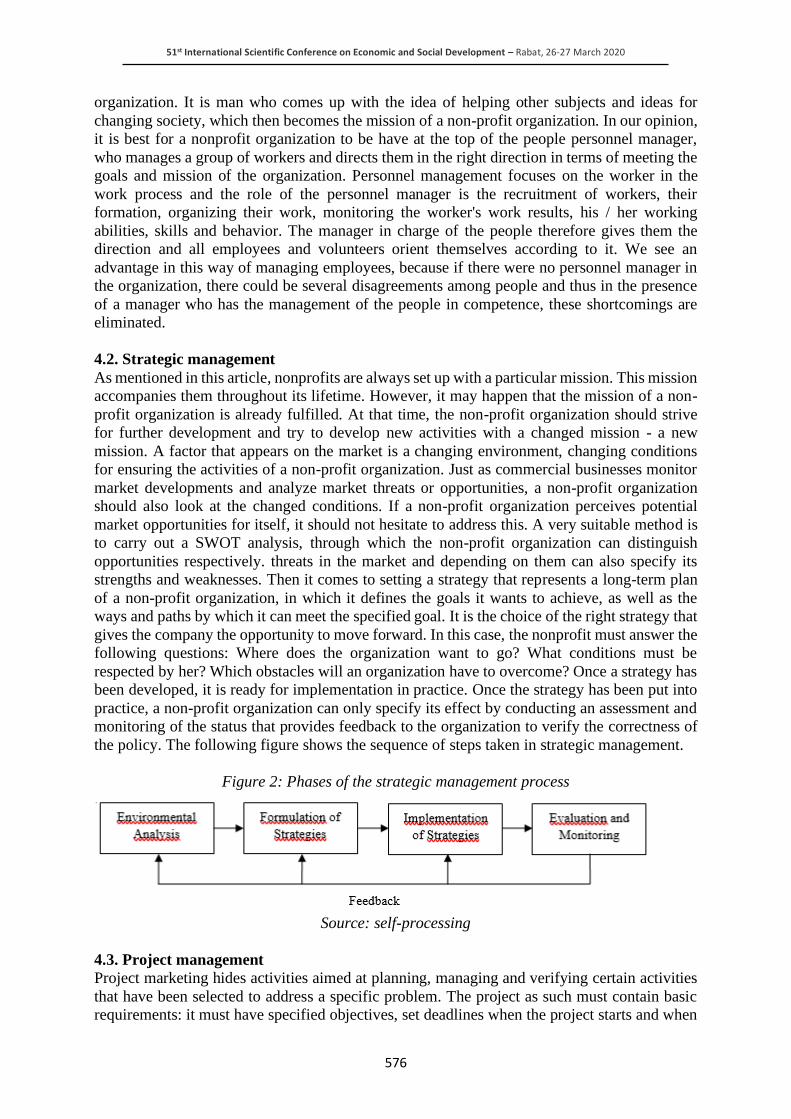
51st International Scientific Conference on Economic and Social Development – Rabat, 26-27 March 2020
576
organization. It is man who comes up with the idea of helping other subjects and ideas for
changing society, which then becomes the mission of a non-profit organization. In our opinion,
it is best for a nonprofit organization to be have at the top of the people personnel manager,
who manages a group of workers and directs them in the right direction in terms of meeting the
goals and mission of the organization. Personnel management focuses on the worker in the
work process and the role of the personnel manager is the recruitment of workers, their
formation, organizing their work, monitoring the worker's work results, his / her working
abilities, skills and behavior. The manager in charge of the people therefore gives them the
direction and all employees and volunteers orient themselves according to it. We see an
advantage in this way of managing employees, because if there were no personnel manager in
the organization, there could be several disagreements among people and thus in the presence
of a manager who has the management of the people in competence, these shortcomings are
eliminated.
4.2. Strategic management
As mentioned in this article, nonprofits are always set up with a particular mission. This mission
accompanies them throughout its lifetime. However, it may happen that the mission of a non-
profit organization is already fulfilled. At that time, the non-profit organization should strive
for further development and try to develop new activities with a changed mission - a new
mission. A factor that appears on the market is a changing environment, changing conditions
for ensuring the activities of a non-profit organization. Just as commercial businesses monitor
market developments and analyze market threats or opportunities, a non-profit organization
should also look at the changed conditions. If a non-profit organization perceives potential
market opportunities for itself, it should not hesitate to address this. A very suitable method is
to carry out a SWOT analysis, through which the non-profit organization can distinguish
opportunities respectively. threats in the market and depending on them can also specify its
strengths and weaknesses. Then it comes to setting a strategy that represents a long-term plan
of a non-profit organization, in which it defines the goals it wants to achieve, as well as the
ways and paths by which it can meet the specified goal. It is the choice of the right strategy that
gives the company the opportunity to move forward. In this case, the nonprofit must answer the
following questions: Where does the organization want to go? What conditions must be
respected by her? Which obstacles will an organization have to overcome? Once a strategy has
been developed, it is ready for implementation in practice. Once the strategy has been put into
practice, a non-profit organization can only specify its effect by conducting an assessment and
monitoring of the status that provides feedback to the organization to verify the correctness of
the policy. The following figure shows the sequence of steps taken in strategic management.
Figure 2: Phases of the strategic management process
Source: self-processing
4.3. Project management
Project marketing hides activities aimed at planning, managing and verifying certain activities
that have been selected to address a specific problem. The project as such must contain basic
requirements: it must have specified objectives, set deadlines when the project starts and when
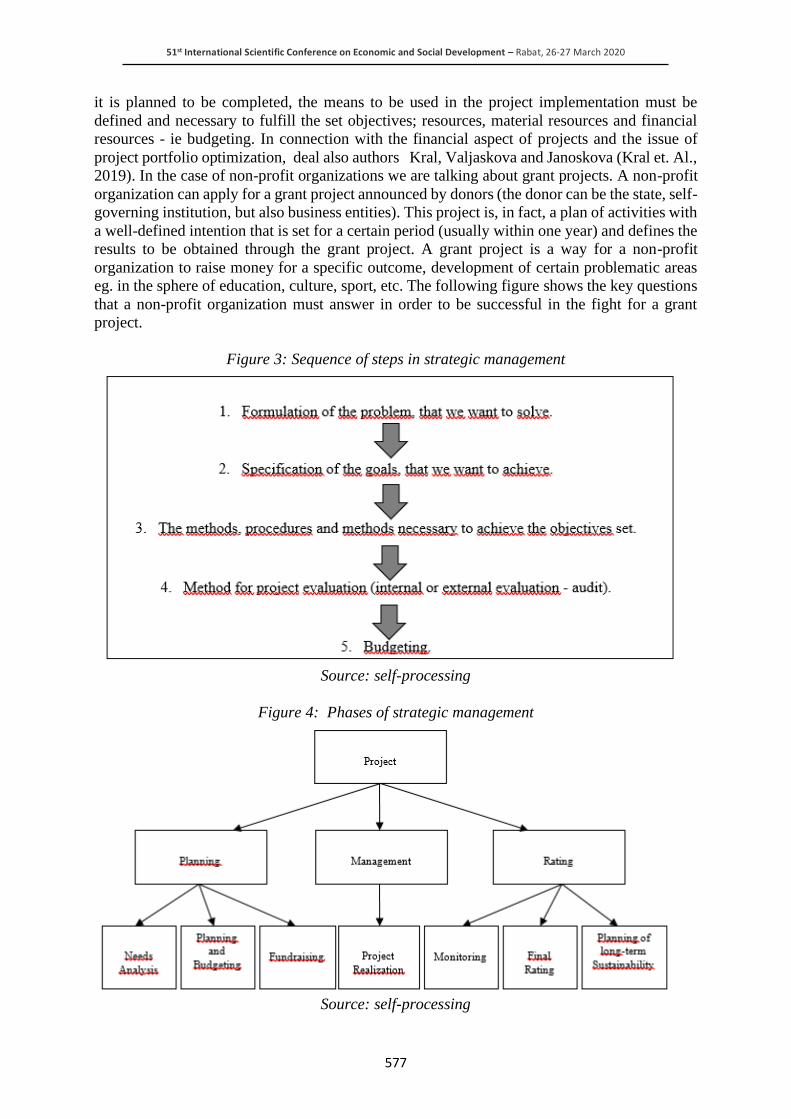
51st International Scientific Conference on Economic and Social Development – Rabat, 26-27 March 2020
577
it is planned to be completed, the means to be used in the project implementation must be
defined and necessary to fulfill the set objectives; resources, material resources and financial
resources - ie budgeting. In connection with the financial aspect of projects and the issue of
project portfolio optimization, deal also authors Kral, Valjaskova and Janoskova (Kral et. Al.,
2019). In the case of non-profit organizations we are talking about grant projects. A non-profit
organization can apply for a grant project announced by donors (the donor can be the state, self-
governing institution, but also business entities). This project is, in fact, a plan of activities with
a well-defined intention that is set for a certain period (usually within one year) and defines the
results to be obtained through the grant project. A grant project is a way for a non-profit
organization to raise money for a specific outcome, development of certain problematic areas
eg. in the sphere of education, culture, sport, etc. The following figure shows the key questions
that a non-profit organization must answer in order to be successful in the fight for a grant
project.
Figure 3: Sequence of steps in strategic management
Source: self-processing
Figure 4: Phases of strategic management
Source: self-processing

51st International Scientific Conference on Economic and Social Development – Rabat, 26-27 March 2020
578
4.4. Financial management and fundraising
As we mentioned several times, a non-profit organization is an organization where profit is not
the primary goal of its existence. But even a non-profit organization can make a profit, which
is then used to finance it. Financial management is of great importance when deciding on the
finances of a non-profit organization and how to finance it. The financial management of a non-
profit organization ensures financial management, which consists of several phases. The first
phase is financial planning, whose task is to identify the financial needs of a non-profit
organization. The financial planning then depends on the budgeting, which is based on the
organization's plan for the next period. Part of the planning phase is fundraising planning, which
means the acquisition of financial, but also various other means (eg material) to ensure the
operation of a non-profit organization. But mostly fundraising is about getting financial
resources. It is a carefully planned, organized and strategically oriented activity of non-profit
organizations whose aim is to identify the sources of funding and subsequently raise funds to
meet the specific needs of the non-profit organization. Once the non-profit organization has
obtained the necessary funds, the issue of managing these financial resources comes to the fore
and must be handled in a truly sensible way, since the resources are very limited. It is also true
that all activities that a non-profit organization funds must by carefully record and keep
accounts. Accounting for non-profit organizations is very important, as all financial operations
must be justified and registered by the non-profit organization. The final phase of financial
management is represented by the preparation of statements and final reports for donors, ie
entities that have provided it with financial resources. In connection with the evaluation of
financial activity, raiting is used, described in more detail by Valaskova and Zvarikova
(Valaskova, Zvarikova, 2014). In the event that the financial situation of the organization is not
the best, it is justified to address the state of the financial situation through bankruptcy models,
also pointed out by the authors Svabova, Durica and recommend focusing on in-depth statistical
analysis of data (Svabova, Durica, 2019). There are several ways of financing non-profit
organizations. These may be funds obtained from the state, from private entities (businesses
and entrepreneurs), from individual donors, funds obtained from foundations, or from funds
obtained from their own activities - from the achieved profit. The issue of ways of financing
non-profit organizations will be discussed in another of our publications. The following table
shows financial management issues in a non-profit organization.
Table 2: Basic issues of financial management in non-profit organization
Basic Issues of Financial Management in Non-profit Organization
1. What do we want to realize? Project
2. What do we need to implement the project? Budget - Project costs
3. From whom do we get the funds? Budget - Project Revenue
Resources
4. How do we get funds from the source? Fundraising methods/
Forms of support
5. What do we offer for this? Equivalent
Source: self-processing
This analysis provides the types of management that non-profit organizations should pay
attention to. The main reason why non-profit organizations should set up individual sections of
management is to eliminate any shortcomings in the event that the non-profit organization's
management functions as one general unit. Therefore, we propose to divide the management
into partial areas, and for each area should work one manager who would be in charge of the
51st International Scientific Conference on Economic and Social Development – Rabat, 26-27 March 2020
579
management of the section. We analyzed four basic areas of management specifying the issues
that should be addressed in each section of management. In the future, we would also like to
address the issue of analyzing the ways financing which non-profit organizations can use. The
established hypothesis has been verified, namely that non-profit organizations are
characterized by certain management specificities that distinguish them from private
enterprises.
5. CONCLUSION
Non-profit organizations are becoming an important part of the national economies. Their
contribution lies mainly in the provision of services of general interest in various areas of the
economy. Non-profit organizations justify their creation by a mission, which is an expression
of the purpose for which a non-profit organization is established. During its activities, a non-
profit organization has to deal with many issues, a very important area is the area of
management, which is addressed in our article. In our publication, we came to the conclusion
that it would be of great benefit to non-profit organizations to break down management into
partial sections, headed by managers who would be in charge of a specific section of
management. The greatest advantage is seen in the elimination of shortcomings that would be
present if the non-profit organization had a “general” section of management that would solve
all problematic issues in the organization. Therefore, we recommend to divide the management
in non-profit organizations individually into basic sections - the personnel management section,
the strategic management section, the project management section and the financial
management section. Each of these sections would be represented by a specific manager and
he would be responsible for the level of that section with respect to his competencies. There are
a lot of questions to solve in non-profit organizations and therefore we see an advantage
especially if each section is dealt with separately. As changes in the market and in society at
large in the economy take place, people's needs are constantly changing, and therefore the
activities of non-profit organizations need to be adapted to the changing conditions of society.
Since non-profit organizations are focused on providing community service that we consider to
be a reflection of the standard of living for the target groups within their remit, clearly the
activity of non-profit organizations is very important to the standard of living of the specific
communities, to whitch are the services provides. Management of nonprofit organizations,
given the large number of activities it deals with, we consider it to be a key means for properly
fulfilling the mission of the nonprofit organization.
ACKNOWLEDGEMENT: The paper is an output of the science project VEGA 1/0544/19
Formation of the methodological platform to measure and assess the effectiveness and financial
status of non-profit organizations in the Slovak Republic.
LITERATURE:
1. Brozmanova Gregorova, A. A. et al. (2012). Dobrovolnictvo na Slovensku: Vyskumne
reflexive. Bratislava: Iuventa.
2. Butora, M., Fialova, Z. (1995). Neziskovy sektor a dobrovolnictvo na Slovensku. Bratislava:
SAIA-SCTS a FOCUS.
3. Cibakova, V, Benova, E, Neubauerova, E. (2013). Ekonomika verejného sektora.
Bratislava: IURA Edition.
4. Fogarassy, C., Neubauer, E., Mansur, H., Tangl, A., Olah, J., Popp J. (2018) The main
transition management issues and the effects of environmental accounting on financial
performance – with focus on cement industry. Administratie si Management Public, 31,
52-66.
51st International Scientific Conference on Economic and Social Development – Rabat, 26-27 March 2020
580
5. Hudakova, M., Masar, M., Luskova, M., Patak, M., R. (2018). The Dependence of
Perceived Business Risks on the Size of SMEs. Journal of Competitiveness, 10(4), 54–69.
6. Olah, J., Sadaf, R., Mate, D., Popp, J. (2018). The influence of the management success
factors of logistics service providers on firms’ competitiveness. Polish Jounal of
Management Studies, 17(1), 175-193.
7. Kmecova, I. (2018). The processes of managing human resources and using management
methods and techniques in management practice. Ekonomicko-manazerske spektrum, 12(1),
44-54.
8. Kral, P., Valjaskova, V., Janoskova, K. (2019). Quantitative approach to project portfolio
management: proposal for Slovak companies. Oeconomia Copernicana, 10(4), 797-814.
9. Majduchova, H. (2009). Neziskové organizácie. Bratislava: Sprint dva.
10. Majtan, M. et al. (2005) Manazment. Bratislava: Sprint.
11. Michalski, G., Blendiger, G., Rozsa, Z. et al. (2018). Can We Determine Debt To Equity
Levels In Non-Profit Organisations? Answer Based On Polish Case. Inzinerine Ekonomika-
Engineering Economics, 29(5), 526–535.
12. MINV. (2020). Informacie o registrovani neziskovych organizacii. Retrieved 12.02.2020
from https://www.minv.sk/?informacie-o-registrovani-neziskovych-organizacii.
13. Rektorik, J. (2001). Organizace neziskoveho sektoru. Zaklady ekonomiky, teorie a rizeni.
Praha: EKOPRESS.
14. Salaga, J., Bartosova, V., Kicova, E. (2015). Economic Value Added as a measurement tool
of financial performance. Procedia Economics and Finance, 26, 484-489.
15. Salamon, M., L., Anheier, K., H. (1997). Defining the nonprofit sector: A Cross-national
Analysis. Manchester: Manchaster University Press.
16. Sedlak, M. (2008). Základy manažmentu. Bratislava: Iura Edition.
17. Svabova, L., Durica, M. (2009). Being an outlier: a company non-prosperity sign?
Equilibrium – Quarterly Journal of Economics and Economic Policy, 14(2), 359-375.
18. Valaskova, K. Zvarikova K. (2015). Prediction of credit risk by selected theoretical rating
models. Advances in Social and Behavioral Sciences, 5, 160-166.
19. Whittle, T., Gregova E., Podhorska, I., Rowland, Z. (2019). Smart Manufacturing
Technologies: Data-driven Algorithms in Production Planning, Sustainable Value Creation,
and Operational Performance Improvement. Economics, Management, and Financial
Markets, 14(2), 52–57.
51st International Scientific Conference on Economic and Social Development – Rabat, 26-27 March 2020
581
THEORETICAL BACKGROUND OF SIMPLE ACCOUNTING AND
COMPARISON OF THE USE OF SIMPLE ACCOUNTING IN THE
CONDITIONS OF SLOVAK REPUBLIC AND CZECH REPUBLIC
Filip Rebetak
University of Žilina, Žilina, Slovakia
Dusan Karpac
University of Žilina, Žilina, Slovakia
Viera Bartosova
University of Žilina, Žilina, Slovakia
ABSTRACT
The study deals with the content, structure and reporting ability of simple accounting
statements exclusively in the conditions of the Slovak and Czech Republic. The aim of the study
is to analyze the theoretical-legislative analysis and to assess the content, structure and
reporting ability of simple accounting statements. Based on the results, we recommend that
entities use reporting in business practice and suggest ways to improve the current situation.
Objects of inquiry are entities that deal with the system of simple accounting. The subject of the
survey is simple accounting and reporting of business entities. The paper is based on the
theoretical part of accounting, main and auxiliary accounting books, simple accounting
records, accounting units and comparison of accounting conditions in the Slovak Republic and
the Czech Republic. The practical part shows the analytical part, which compares the content,
structure and the ability to report simple accounts in Slovakia and the Czech Republic.
Keywords: Simple accounting, Accounting unit, Book of receivables and liabilities
1. INTRODUCTION
The globe is made of mixed economies in which countries vary, where there are developed and
developing countries. We are dealing with accounting every day. We do not have to be
accounting units either. Every household is in some way an accounting unit. Monthly
Accountant checks revenue and expenses. It monitors enough cash to pay a repayment if it has
a loan from the bank for housing or the cost of a passenger car. She cares for her property. It
rebuilds, restores and invests, because he knows that he will return his value in the future. The
objective of each entity is to evaluate its assets, so businesses and entrepreneurs should try to
do that (Alshehhi et al. 2017; Radisic & Dobromirov 2017; Kliestik et al. 2018). Accounting is
an essential part of the information system of accounting units. Information that an entity can
obtain from accounting serves as a basis for routine, operational decision-making, but also for
decision-making in the future. Trends in the ever-changing international economy are driven
by general trends such as internationalization, the strengthening of globalization and
glocalization, steady growth in international competition, corporate attempts to outsource and
reduce the number of suppliers, research, development and innovation, shortening product life
cycles, shifting to time-based competition, and changes in customer buying habits and supply
chain strategies, which can all be seen in accounting (Olah et al. 2018; Cygler & Sroka, 2017;
Kliestik et al. 2018). Accounting is one of the oldest methods of keeping records, the subject of
which are records of economic activity. Each entity must decide at the beginning of its business
how it will maintain its accounting.
51st International Scientific Conference on Economic and Social Development – Rabat, 26-27 March 2020
582
It is up to them whether to be a natural person or a legal person. The law determines which
accounting units can carry simple or double-entry bookkeeping. Accounting information helps
accounting units to plan, decide, and control business processes. Businesses have a need to have
a credible overview of their receivables and liabilities to business partners as well as to the state.
The state is accountable for accounting and the result of this management is a normative
adjustment in the form of a chart of accounts and binding billing procedures with a possible
choice of available solutions (Baulina & Klyushin 2017). Simple Accounting deals with income
and expenditure tracking, what is also referred to as a cash principle. This result in a difference
in revenue and expenditure is the result of the management. It is accounting, which is the
essence of monitoring cash flows (Slosarova 2012).
2. THEORETICAL BACKGROUND
The literature offers several definitions of accounting. Accounting is a method of recording
economic activity through accounts, an internally structured system of information and data in
value terms. Accounting is a closed, internally structured system of information used to identify,
measure and evaluate business activity. It provides monetary information about the financial
position and profitability of the entity. It is the most comprehensive economic information
system, which accurately and reliably provides economic information on the status of individual
items of assets, as well as on revenues and costs, or more precisely income and expenses that
result in profit or loss. Another important task of accounting is to provide the basis for the
calculation of the income tax base and the tax liability of the entity (Rybicka & Rybicki 2018).
General accounting principles and principles include the prudence principle in which the
valuation of assets and liabilities should take into account risks and uncertainties. The financial
statements shall show only those profits that have actually been achieved. However, losses will
be reflected in the financial statements even if their amount is not exactly identifiable at the
reporting date. The principle of historical accounting is based on the valuation of assets at cost.
The implementation principle is based on the assumption that the revenue is not necessarily
connected with the receipt of funds, it arises from the moment of dispatch of the products.
Furthermore, it is the principle of the factual connection of the reported data with the relevant
period, clarity of information, inter-company comparability and relevance of the reported
information (Vojtovic 2016). The principle of consistency between accounting periods is based
on methods of economic operations and valuation. This means that items in statements should
remain the same not only within, but also between, accounting periods. They must ensure
comparability and continuity. Another principle is the materiality principle, which requires the
financial statements to contain quantitative information that is material to the entity's potential
decisions. The principle of objectivity of accounting information means changes in assets and
liabilities and these changes should not be accounted for until they have been objectively
identified. The last principle is the priority of content over form, which means that transactions
should be published in accordance with their economic substance (Sadaf et al. 2018). An entity
that accounts in the single entry bookkeeping accounts in the books and in the cash book, in the
receivables and payables book, and in auxiliary books. In the single entry accounting system,
the financial statements include a statement of revenue and expenditure and a statement of
assets and liabilities. The Moneybook is the general ledger. It contains information on cash and
bank balances, income in the accounting period, expenditures in the accounting period, interim
items that capture movements of funds that are not yet revenue or expenditure in the accounting
period (Brabenec 2010).
3. METHODOLOGY
The elaboration of this article required some methodology and methods to be used. Methods of
analysis and synthesis were used for gathering information, decomposing it into groups and
51st International Scientific Conference on Economic and Social Development – Rabat, 26-27 March 2020
583
gradually clustering and merging relevant information into a coherent form. The description
method was used to describe the accounting situation in each country concerned. Meeting the
goal of the article based on its title required a method of comparison for comparing simple
accounting in Slovakia and the Czech Republic.
4. RESULTS
The Commercial Code requires entrepreneurs to keep accounts in the scope and manner
established by a special law. The Act on Accounting provides for the scope, manner and
demonstration of bookkeeping, as well as the scope, content and provability of the financial
statements (Hraskova & Bartosova 2014). Accounting is an economic discipline that provides
the information needed for decision making. The basis of accounting is presented as a process
of systematically recording economic phenomena, which provides data on the economic
activity and economic relations of accounting units, relations with the state, municipalities,
higher territorial units and the public body in order to give a true and fair view. Accounting is
considered one of the oldest methods of evidence (Bastincova 2001; Gavurova et al. 2017).
Since 2016, the Amendment to the Act on Accounting has brought several changes for
accounting units in the Czech Republic. Some of these changes stemmed from the obligation
to introduce European legislation into Czech legislation. Other changes responded to the
requirements of practice. It is precisely in the latter group that the introduction of simple
accounting is again the case. This adjustment was also based on social demand for simple
bookkeeping. The demand was mainly from very small accounting units that were not primarily
established for business purposes and are predominantly socially beneficial. They are so small
that they do not have sufficient capacities to allow them to keep double-entry bookkeeping. It
would be for them financially and also administratively demanding. That's why they wanted a
simple accounting that is not so demanding (Kucera 2016). Many bookkeepers do not consider
simple bookkeeping for accounting, and therefore they like when the Act on Accounting (Act
No. 563/1991 Coll.) Was abolished as of 31 December 2003. However, some types of
accounting units may continue to use simple accounting because Section 38a of the Act allows
civil associations, churches, religious organizations and hunting communities to meet the limit,
and that they have had to receive up to CZK 3,000,000 per year. Since 2004, individuals have
had to go to tax records if they have not led double-entry bookkeeping. Since simple accounting
has begun to be taken into account since 2016, they have also regulated the types of entities that
can use it. The law on accounting again returns the concept of a monetary journal, which is one
of the books of simple bookkeeping. Other are the book of receivables and liabilities, auxiliary
books on other assets (financial assets, long-term assets, inventories and valuables). Cash and
cash receipts and receipts actually received, paid and interim items (transfers between the bank
account and the cashier or vice versa) will be recorded in the cash register as in the past cash,
bank, savings and credit cooperatives. Simple accounting does not allow you to charge in the
marketing year, the accounting period is the same as the calendar year. Within six months after
the end of the accounting period, an overview of assets and liabilities and a summary of revenue
and expenditure is required. The Decree is intended to provide accurate accounting items,
bookkeeping and simple accounting methods. Accounting entities continue to exercise their
obligation under Sections 29 and 30 at the end of the accounting period, to inventory assets,
and to determine the real estate status. The funds also include funds in cash and accounts,
inventories of liabilities and receivables as well as ancillary books. A record is made of the
inventory carried out, which becomes an accounting record and the accounting entity has the
obligation to prove the inventory for a period of five years after its execution (Fabova, 2008).
In modern history, simple bookkeeping appears in the Accounting Act in 1991. The Accounting
Act defined the requirements for both simple and double-entry bookkeeping. The then simple
accounting was designed for individuals, contributory organizations, political parties and
51st International Scientific Conference on Economic and Social Development – Rabat, 26-27 March 2020
584
churches. As of 1 January 2004, the Act on Accounting was amended. Simple bookkeeping has
been canceled and replaced by tax records. The tax records are governed by the Income Tax
Act. Their purpose is to establish the tax base. Tax records were for individuals. Entrepreneurs
can keep it in the scope of simple bookkeeping. The term "double-entry bookkeeping" has been
replaced by "accountancy". In Slovakia, simple bookkeeping remained and, in addition, tax
records were introduced in 2009 (Fabova, 2012). Moneybook is the most important book in
simple bookkeeping. In the journal, the accrual is accounted for in the time sequence of events
that represent the income or expense of the cash. The cash register must include information on
income, cash and cash balances, in cash and on bank accounts. The moneybook also accounts
for interim items. Interim items are similar to the "money on the way" account in double-entry
bookkeeping, that is to transfer funds between the treasury and the account or between accounts.
If an entity uses a foreign currency, it accounts for a currency box or a foreign currency account.
An entity receiving cash payments is required to keep daily sales records and charge them in
the cash log at least once a month. Cashbook entries allow you to determine the income tax
base after the end of the tax period. The second mandatory book of simple bookkeeping is the
book of claims and liabilities. The Book of Receivables and Liabilities includes a record of
receivables and payables to other entities. This book distinguishes receivables and payables
from business relationships, advances granted and received, receivables and payables from
advances granted and received, and other possible liabilities and receivables. This book allows
you to obtain all information regarding individual debtors and creditors, liabilities and
receivables. An ancillary book is used by an accounting entity only if it is used for it (Kaletova
2002). A non-current intangible and tangible fixed asset, financial asset, inventory and
valuables are to be recorded in the asset auxiliary's book. In the statement of income and
expense, income and expense are classified as main and economic activity, including aggregate
items, and their difference is recognized at the balance sheet date of the current accounting
period and at the balance sheet date of the previous accounting period or at any other time to
which the income statement and expenditures. Equally, asset and liability items are also
included in the statement of assets and liabilities, including aggregate items, and their difference
to the balance sheet date of the current accounting period and to the balance sheet date of the
prior period, or to the date when the statement of assets and liabilities is prepared. Both the
statement of assets and liabilities and the statement of income and expense are compiled in
monetary units of the Czech currency and individual items are reported in thousands of Czech
money units (Balcerzak 2017). After reading the literature, we have come to the conclusion that
the content of accounting documents, the opening of accounting books is the same as in
Slovakia and in Bohemia. The cash register must contain at least a summary of the cash and
bank accounts broken down into revenue and expenditure, a statement of revenue subject to
income tax, income tax exempted or exempt from income tax, a statement of expenditure
income tax which is not subject to income tax, or are exempt from income tax, a breakdown of
revenue and expenditure broken down by special legislation, and a breakdown of income and
expense on interim items. The entity may decide on the next breakdown of the moneybook. The
organization of a journal entry must be made in an appropriate, transparent and comprehensible
manner. The explanatory notes to this system must be attached (stamping of columns,
numbering of accounting documents). The cash book must contain the sum of the income and
expense at least at the end of each calendar month and at the time of closing the cash book. The
cash-book is an accounting record and must bear the name "Moneybook", the year or period
for which it is kept, the number of letters numbered, the signature of the person responsible for
keeping the cash register and also the signature of the person responsible for the accounting.
The balance of cash and interim items is obligatorily transferred to the journal in the following
year (Adamikova 2014).
51st International Scientific Conference on Economic and Social Development – Rabat, 26-27 March 2020
585
5. CONCLUSION
The aim of the paper was to assess the content, structure and reporting ability of simple
accounting statements on the basis of a theoretical and legislative analysis and propose
possibilities for improving the current state. We have split the accounting units, which should
be charged in the system of simple and double-entry bookkeeping. For small and medium-sized
businesses, to account for a simple bookkeeping system, and for large businesses we have
designed a system of double-entry accounting. The proposal is also to keep book-keeping on
the basis of records through the proportion of expenditure on taxable income, so-called lump-
sums. This registration is very simple and usually does not require the assistance of an external
accountant. Based on the theoretical knowledge from the Slovak and the Czech Republic, we
believe that all entities should endeavor to effectively control their assets, liabilities, revenues
and expenditures. They should be interested in investing so they can optimize tax returns. By
having control over their activities, they will also be successful.
ACKNOWLEDGEMENT: This is paper is an outcome of project VEGA: 1/0544/19 Formation
of the methodological platform to measure and assess the effectiveness and financial status of
non-profit organizations in the Slovak Republic.
LITERATURE:
1. Adamikova, M. (2014). Uctovna zavierka podnikatelov uctujucich v sustave jednoducheho
uctovnictva za rok 2014. In Dane a uctovnictvo v praxi : mesacnik plny informacii z oblasti
dani, prava a uctovnictva, 19, 43 – 55.
2. Alshehhi, Y.Z., Olah, J. (2017). Sectorial analysis: Growth accounting of secondary
industries, Network Intelligence Studies. 5, 39-45.
3. Balcerzak, A.P., Kliestik, T., Streimikiene, D., Smrcka, L. (2017). Non-Parametric
Approach to Measuring the Efficiency of Banking Sectors in European Union Countries.
Acta Polytechnica Hungarica. 14, 51-70.
4. Bastincova, A. (2001). Danovo uznatelne vydavky v jednoduchom uctovnictve fyzickych
osob od A po Z. Bratislava: Verlag Dashofer.
5. Baulina, O.A., Klyushin, V.V. (2017). Methodical bases of formation of investment policy
of enterprises of construction materials industry. Ekonomicko-manazerske spektrum, 11, 1-
12.
6. Brabenec, T. (2010). Certain important aspects of cost contribution arrangements in
financial management. World Academy of Science, Engineering and Technology. 43, 921-
932.
7. Cygler, J., Sroka, W. (2017). Competition Disadvantages: the Case of the High Tech
Companies. Inzinerine Ekonomika-Engineering Economics, 28, 494-504.
8. Fabova, Z. (2008). Nove jednoduche uctovnictvo podnikatelov. In Manazment, mzdy a
financie: casopis pre ekonomov, podnikatelov, podniky a organizacie, 15, 90 – 140.
9. Fabova, Z. (2012). Penazne prostriedky v jednoduchom uctovnictve. In Dane a uctovnictvo
v praxi: mesacnik plny informacii z oblasti dani, prava a uctovnictva, 17, 47 – 54.
10. Gavurova, B., Packova, M., Misankova, M., Smrcka, L. (2017). Predictive potential and
risks of selected bankruptcy prediction models in the Slovak business environment. Journal
of Business Economics and Management, 18, 1156-1173.
11. Hraskova, D., Bartosova, V. (2014). Emergent Approach to Management of the Transport
Company. Advances in Social and Behavioral Sciences, 5, 92-96.
12. Kaletova, V. (2002). Pohladavky v jednoduchom uctovnictve. In Danovy a uctovny poradca
podnikatela, 8, 13 – 46
51st International Scientific Conference on Economic and Social Development – Rabat, 26-27 March 2020
586
13. Kliestik, T., Kovacova, M., Podhorska, I., Kliestikova, J. (2018). Searching for Key Sources
of Goodwill Creation as New Global Managerial Challenge. Polish Journal of Management
Studies, 17, 144-154.
14. Kliestik, T., Misankova, M., Valaskova, K., Svabova, L. (2018). Bankruptcy prevention:
new effort to reflect on legal and social changes. Science and Engineering Ethics, 24, 791-
803.
15. Kucera, P. (2016). Jednoduche ucetnictvi v roce 2016, In: Novela zakona o ucetnictvi číslo
221/2015 Sb.
16. Olah, J. Judit, Zeman, Z., Balogh, I., Popp, J. (2018). Future challenges and areas of
development for supply chain management. Logforum, 14, 127-138.
17. Radisic, M., Dobromirov, D. (2017). Statistical analysis of price returns of regional stock
market indices. Transformations in Business & Economics, 3, 175-184.
18. Rybicka, K., Rybicki, P. (2018). Chosen aspects of it systems in management and
accounting in companies under globalization. Ekonomicko-manazerske spektrum. 12, 57-
66.
19. Sadaf, R., Oláh, J., Popp, J., Máté, D. (2018). An Investigation of the Influence of the
Worldwide Governance and Competitiveness on Accounting Fraud Cases: A Cross-
Country Perspective. Sustainability. 10, 588, 1-11.
20. Slosarova, A. (2012). Zaklady uctovnictva. Bratislava : Ekonom.
21. Vojtovic, S. (2016). The Impact of The Structural Funds on Competitiveness of Small and
Medium-Sized Enterprises. Journal of Competitiveness, 8, 30 – 45. DOI:
10.7441/joc.2016.04.02

51st International Scientific Conference on Economic and Social Development – Rabat, 26-27 March 2020
587
THE IMPORTANCE OF TIME MANAGEMENT IN NON-PROFIT
ORGANIZATIONS
Emilia Gresakova
University of Zilina, Slovakia
Darina Chlebikova
University of Zilina, Slovakia
ABSTRACT
One of the most challenging issues faced by nonprofit managers is improving organizational
efficiency. Another challenge for leading nonprofit organizations is managing limited resources
in a competitive social services industry to meet growing service requirements. To meet the
growing demands of their constrained constituencies, nonprofit leaders could implement
effective time management practices to ensure organizational success. Although there is
extensive literature on organizational efficiency, there was limited data available specifically
for non-profit organizations, especially regarding time management training. The purpose of
this article was to identify the perception of time management and the use of effective time
management strategies. The study findings revealed statistically significant relationships
between the TMPI score and selected demographic data. The findings revealed that leaders
perceived the use of time, demographic characteristics, attitudes and time management
strategies were factors in the introduction of effective time management techniques to improve
the organization's success and efficiency. The results provided a framework for nonprofit
managers to adopt time management - strategies that could improve the funding of research
efforts and organizational success and efficiency. The results revealed why some nonprofit
implementation managers are not implementing effective time management strategies to
expand funding opportunities and improve individual and organizational growth and success.
This research focuses on the lack of knowledge about the effective use of time management
strategies in non-profit organizations. The current study has attempted to provide a realistic
analysis of how leaders perceive timing and effective time management strategies that affect
organizational success. Focusing on nonprofit groups could be a missing link to help nonprofit
leaders to increase the effectiveness of the organization.
Keywords: Disturbances, Non-profit organizations, Stressors, Time management
1. INTRODUCTION
The importance of efficient time use is unique to the non-profit sector because of the likelihood
of reduced funding. Time management is a discipline that deals with the organization of time.
It is very important in this type of management to set clear goals of its activities and set
priorities, ie. to define what is important for us in terms of work or personal activity and how
much time and resources we are willing to devote to this activity and last but not least to
eliminate unnecessary activities. Efficient use of time means following certain rules and being
maximally focused on your work. Among the most recommended principles that, will help
managers to better organize their working time are setting clear goals so that managers know
what and when to pay attention to them, they must clearly set goals. To analyze the time spent
to effectively set up time management, managers must first discover what they spend their time
on, then they can reduce the tasks that hold them back and address those that move the business
forward. Using the TO-DO letter helps if all the jobs are registered can systematically move
from job to job and fulfill their plan.

51st International Scientific Conference on Economic and Social Development – Rabat, 26-27 March 2020
588
Prioritizing is effectively assigning importance to the task list. It is a good idea to assign an
estimated time to perform the task in addition to the priority. Work organization needs to be
done in the performance of all things logical system, which will be based on organization. The
delegation says that manager's time is precious. It is necessary to use its potential for important
things. The less important ones need to be shifted to other people. The use of seemingly
unproductive time also plays a major role in time management. If you're traveling to work,
check your emails quickly. Arrange a meeting with your business partner during lunch and
make phone calls while waiting at the office. Even if they are trivial, they can ultimately have
a huge impact on your productivity. There is a great deal of literature on the effective use of
time management techniques, but there are no strategies for strictly developed strategies for
non-profit managers. There is a need for effective research into the time management strategy
in the non-profit sector. The basis of the research problem is to identify various effective
management strategies that could be used by nonprofit managers to positively influence the
success and effectiveness of the organization.
2. TIME MANAGEMENT STRATEGIES
Time management strategies are designed to better schedule time, prioritize, use technology,
organize your workspace, manage your lists, know which projects are important and complete,
and projects that unnecessarily distract attention. O'Brien also recommended several tactics in
implementing strategies (Allan, 2015). First, by keeping a diary managers can evaluate how
time is spent (Bartosova & Kral, 2016) and eliminate those time losses that do not affect the
mission of the organization. Secondly, working during the most productive times of the day,
then managers can effectively accomplish important tasks and reduce distractions at work.
Third, using productivity-enhancing technologies, managers have much more opportunity in
the 21st Century to increase their work efforts. The technology includes mobile phones, updated
software, personal digital assistants and similar devices. Another recommended strategy
recommended by (Valaskova, et al., 2019) is to organize the workspace by organizing
everything in place and keeping the most used items accessible. The goal was to organize the
task lists into five lists in order: projects, other actions, waiting, calendar and sometimes /
maybe. The list of projects focuses on the vision and other actions the following steps are listed
in the priority list. The waiting list depends on other tasks to complete, while the calendar list
is time meetings. The list sometimes / maybe contains items that are not ready for the project
list. Other strategies include understanding what is important, setting realistic completion dates.
In managing several ongoing projects, employees should assess the tasks depending on their
importance and addressing less important tasks later to be more efficient. (Allan, 2015).
2.1. ABC prioritization
This technique is generally used in prioritizing, but at the same time, by describing the internal
context of business processes, it is possible to know and understand their patterns and their real
impact on business activities. The method is based on the philosophy of the percentages of
important and less important tasks. This division is based on analogies of inventory
management (Tziner, 2015). Using ABC letters, managers should divide individual tasks into
three groups, depending on their importance in achieving their goals. Many managers work
according to the principle: stick to the most important tasks of group A. Tasks of type A include
very important tasks that determine the success of a business. These tasks include personnel
and strategic tasks that are both important and urgent at the same time. They represent up to
15% of the scale of total tasks, but account for up to 65% of the results. Type B tasks include
important tasks but can be delegated. They have a 20% share in the scope of the activity and in
the results.

51st International Scientific Conference on Economic and Social Development – Rabat, 26-27 March 2020
589
The latest type C tasks are the least important, routinely correct tasks that can be immediately
delegated, according to experts' experience, accounting for about 65% of all tasks, but only
15% of the results (Belas et al., 2018).
2.2. Eisenhower principle
The Eisenhower principle represents a technique called after former US President D.
Eisenhower. It is based on the assertion that importance always takes precedence over urgency.
In practice, there can be four combinations of the importance and urgency of work tasks. The
tasks are divided into four quadrants (Salaga et al., 2015). In the first quadrant, there are tasks
that managers need to address immediately and deal with in person. The second quadrant are
tasks that can wait. However, they become a problem if sooner or later they become urgent and
then the manager has to deal with them himself. They can therefore be partially delegated. In
addition to the advantage of gaining employee time, these tasks can become opportunities for
personal development and greater motivation of subordinates. The third quadrant represents the
tasks that the manager should delegate, but as they need to be done in the shortest time possible,
he usually performs them himself. The fourth quadrant represents tasks often found on the
manager's desk. The tasks of this category should be taken appropriately by the manager. They
are often not so important that subordinate workers deal with them (Gresakova & Chlebikova,
2018).
2.3. Delegation
Delegation of tasks is at the heart of every management and is usually defined as handling
things through other people. A manager who is unable to delegate tasks cannot actually manage.
The basis for the delegation of tasks is the principle that each task should be equipped with the
lowest-ranking job, which still has the necessary expertise to deal with it. Delegating tasks
assumes that the entity trusts the worker to whom it delegates tasks. A worker must therefore
meet the conditions laid down for the performance of his duties. On the other hand, the manager
should give the opportunity to demonstrate competence and credibility (Carol et al., 2019). The
problem arises when the knowledge causes of the manager's lack of management knowledge
are combined with subjective notions of delegation. At that time, the manager is unable to
delegate tasks and tends to interfere with everything (these are the leaders overloaded with the
operation). We often meet this type of managers in small companies, where the company owner
is also an executive manager. His “personal” relationship with the company and his strong
financial involvement prevent him from sufficiently trusting his employees, leading to his
overloading. The fear of delegation is not justified. Effective control mechanisms can prevent
major damage. The absence of delegation can cause organizations to do much more damage
(Gresakova & Chlebikova, 2019).
2.4. Helicopter view
The helicopter view structures the tasks and the time to perform them into six levels, which
should help from a “perspective” to decide priorities. We know 6 baseline levels: Baseline level
1 represents activities that are performed operationally as they occur. Level 2 is based on the
question of what needs to be done immediately, comparing the priorities (in terms of objectives
and not what seems to be more important, less laborious, etc.). Level 3 represents activities to
be done in the coming hours. With a view to longer-term objectives, the actions to be addressed
today are selected. Level 4 represents activities that need to be done in the next few days or
weeks. Level 5 represents what is to be achieved in the coming months. The actual perspective
translates into long-term projects, deciding on the priorities of current work goals and on the
work-life balance. Level 6 characterizes what is desirable to achieve as an element of the wider
environment. The ability to see not only above the present but also above itself is required.
51st International Scientific Conference on Economic and Social Development – Rabat, 26-27 March 2020
590
What we want to achieve as a company, team, family, etc (Kushlev et al. 2016). Not everyone
is capable of seeing at all levels, but knowing one's own weaknesses is the first step towards
eliminating them. Every manager and entrepreneur needs the ability to see at all levels. These
skills can be trained (Covey, 2014).
2.5. S.O.R.U.Z.
In defining the tasks to be accomplished, a very effective tool for managers is the S.O.R.U.Z
method, whose name is derived from the initial letters of the sub-steps it consists of. Partial
steps of the method are: summary of tasks, estimation of time for individual activities, reserve
time, prioritization, feedback control. Summing up tasks means that managers should first
summarize all the meetings and activities that await them during the day. Be sure to include the
rest of the days in these activities. Do not overload and certainly do not overestimate your
strength (Janoskova & Kral, 2019). If you have already summarized all the meetings and
activities you should manage during the day, estimate how much time you will need for each
of these activities. In doing so, build on your previous experience. Managers should be able to
plan with a view to resolving operational issues and keep some time from the working day for
unforeseen events. The time margin should be between 20 and 50 percent of normal working
time. At least count on 20 percent. Once you have set the reserve time, take a close look at the
task list for the next day and prioritize it. Schedule the most important tasks for the part of the
day you are performing best. Also, consider whether you could delegate some less important
tasks to others. Method S.O.R.U.Z. is terminated by retrospective control. This should always
be done at the end of working hours. Try to summarize whether your daily plan was realistic or
not at all at your pace. Then move any unfinished tasks or new appointments to the next day,
and try again to create a new plan adjusted for more time or better priorities (Knoblauch et al.,
2012).
2.6. Elephant technique
The elephant technique is used when an extensive task needs to be addressed, e.g. to develop a
new product, to learn a foreign language, etc., we are often intimidated by its size and therefore
we will not start to solve it. The aid is in splitting the task into small parts that will be solved
every day, or a week. If necessary ("consuming an elephant", it can not be done at once, but in
regular doses yes). Routine work within each individual part loses the fear of the size of the
whole because we have already decided how to manage the whole. The size of the task is not
the only problem with this technique. However, there may be problems of a different nature. If
we divide the whole - problem into smaller parts, it will make it easier to solve complex tasks,
but we lose the sense of connection with the whole (Kundelis & Legenzova, 2019).
2.7. Eat the frog first
"Frog Eating" means that you have to perform the worst or extremely important task as the first
thing in the morning before all other tasks. Once you "eat" your "frog", you can be sure that the
worst is behind you, so you are likely to have a positive attitude about the rest of your day. An
inherent task is a task that managers should focus all your attention on: a call to a demanding
client or cost estimates that you need to create for an elusive project (Kmecova, 2018). The
worst task is the task you are postponing because it is difficult or simply boring. This can be an
extensive project survey or a large amount of paper. (Knoblauch et al. 2012) recommend that
managers should embark on the 'ugliest' frog. Furthermore, they should focus on the second,
slightly less problematic "frog". After dealing with "frogs", they can start working on other
"normal" tasks that day. At the same time, they claim they can prioritize your "frogs" and
"regular" tasks using ABCDE. First, managers create a list of tasks that you need to do the
following day. Then mark them with letters.
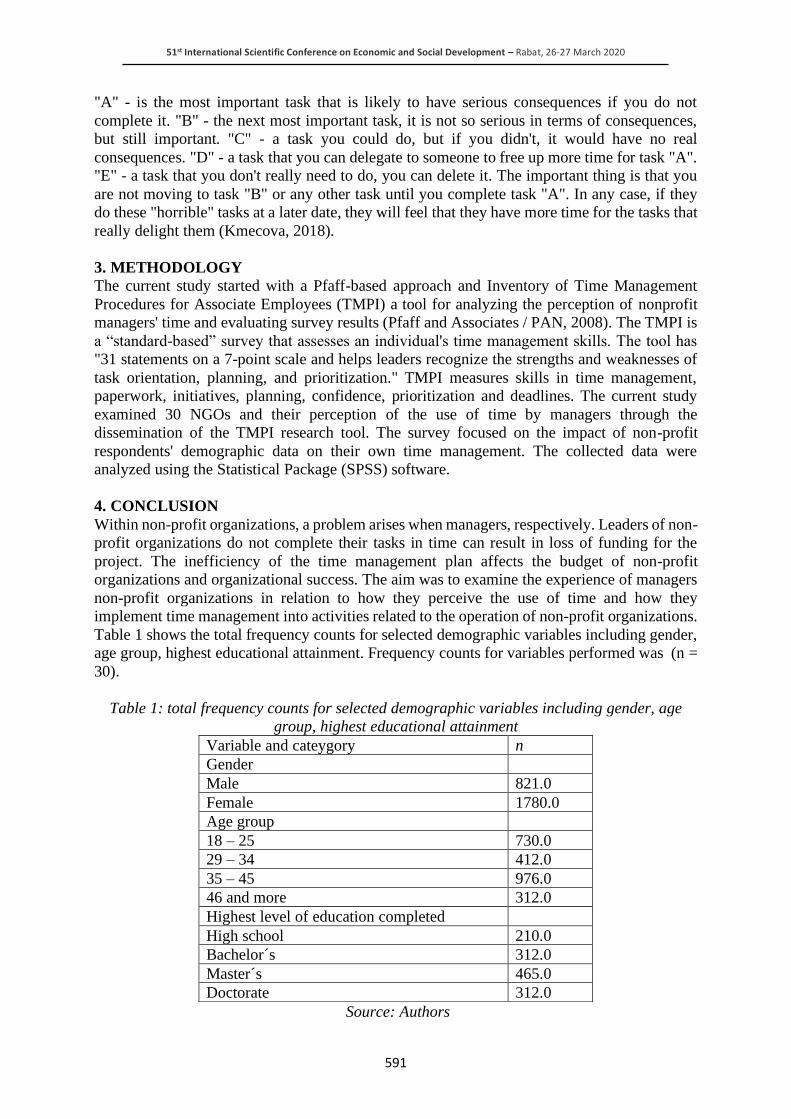
51st International Scientific Conference on Economic and Social Development – Rabat, 26-27 March 2020
591
"A" - is the most important task that is likely to have serious consequences if you do not
complete it. "B" - the next most important task, it is not so serious in terms of consequences,
but still important. "C" - a task you could do, but if you didn't, it would have no real
consequences. "D" - a task that you can delegate to someone to free up more time for task "A".
"E" - a task that you don't really need to do, you can delete it. The important thing is that you
are not moving to task "B" or any other task until you complete task "A". In any case, if they
do these "horrible" tasks at a later date, they will feel that they have more time for the tasks that
really delight them (Kmecova, 2018).
3. METHODOLOGY
The current study started with a Pfaff-based approach and Inventory of Time Management
Procedures for Associate Employees (TMPI) a tool for analyzing the perception of nonprofit
managers' time and evaluating survey results (Pfaff and Associates / PAN, 2008). The TMPI is
a “standard-based” survey that assesses an individual's time management skills. The tool has
"31 statements on a 7-point scale and helps leaders recognize the strengths and weaknesses of
task orientation, planning, and prioritization." TMPI measures skills in time management,
paperwork, initiatives, planning, confidence, prioritization and deadlines. The current study
examined 30 NGOs and their perception of the use of time by managers through the
dissemination of the TMPI research tool. The survey focused on the impact of non-profit
respondents' demographic data on their own time management. The collected data were
analyzed using the Statistical Package (SPSS) software.
4. CONCLUSION
Within non-profit organizations, a problem arises when managers, respectively. Leaders of non-
profit organizations do not complete their tasks in time can result in loss of funding for the
project. The inefficiency of the time management plan affects the budget of non-profit
organizations and organizational success. The aim was to examine the experience of managers
non-profit organizations in relation to how they perceive the use of time and how they
implement time management into activities related to the operation of non-profit organizations.
Table 1 shows the total frequency counts for selected demographic variables including gender,
age group, highest educational attainment. Frequency counts for variables performed was (n =
30).
Table 1: total frequency counts for selected demographic variables including gender, age
group, highest educational attainment
Variable and cateygory n
Gender
Male 821.0
Female 1780.0
Age group
18 – 25 730.0
29 – 34 412.0
35 – 45 976.0
46 and more 312.0
Highest level of education completed
High school 210.0
Bachelor´s 312.0
Master´s 465.0
Doctorate 312.0
Source: Authors
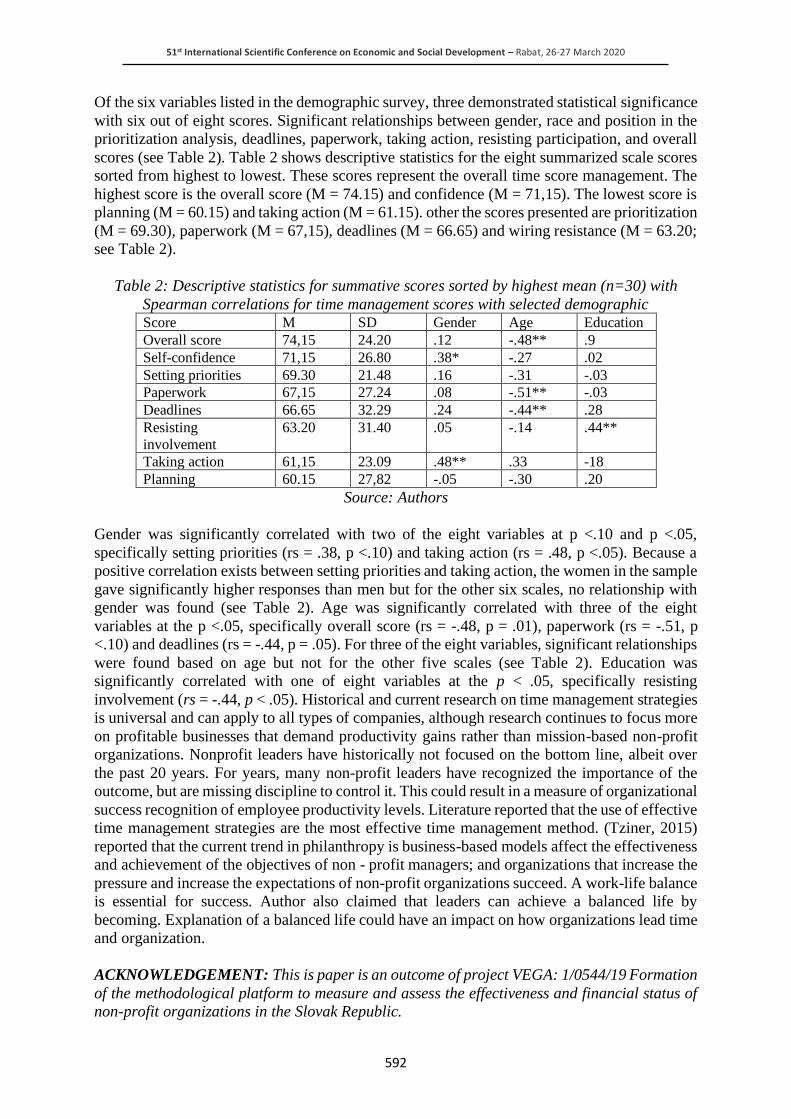
51st International Scientific Conference on Economic and Social Development – Rabat, 26-27 March 2020
592
Of the six variables listed in the demographic survey, three demonstrated statistical significance
with six out of eight scores. Significant relationships between gender, race and position in the
prioritization analysis, deadlines, paperwork, taking action, resisting participation, and overall
scores (see Table 2). Table 2 shows descriptive statistics for the eight summarized scale scores
sorted from highest to lowest. These scores represent the overall time score management. The
highest score is the overall score (M = 74.15) and confidence (M = 71,15). The lowest score is
planning (M = 60.15) and taking action (M = 61.15). other the scores presented are prioritization
(M = 69.30), paperwork (M = 67,15), deadlines (M = 66.65) and wiring resistance (M = 63.20;
see Table 2).
Table 2: Descriptive statistics for summative scores sorted by highest mean (n=30) with
Spearman correlations for time management scores with selected demographic Score M SD Gender Age Education
Overall score 74,15 24.20 .12 -.48** .9
Self-confidence 71,15 26.80 .38* -.27 .02
Setting priorities 69.30 21.48 .16 -.31 -.03
Paperwork 67,15 27.24 .08 -.51** -.03
Deadlines 66.65 32.29 .24 -.44** .28
Resisting
involvement
63.20 31.40 .05 -.14 .44**
Taking action 61,15 23.09 .48** .33 -18
Planning 60.15 27,82 -.05 -.30 .20
Source: Authors
Gender was significantly correlated with two of the eight variables at p <.10 and p <.05,
specifically setting priorities (rs = .38, p <.10) and taking action (rs = .48, p <.05). Because a
positive correlation exists between setting priorities and taking action, the women in the sample
gave significantly higher responses than men but for the other six scales, no relationship with
gender was found (see Table 2). Age was significantly correlated with three of the eight
variables at the p <.05, specifically overall score (rs = -.48, p = .01), paperwork (rs = -.51, p
<.10) and deadlines (rs = -.44, p = .05). For three of the eight variables, significant relationships
were found based on age but not for the other five scales (see Table 2). Education was
significantly correlated with one of eight variables at the p < .05, specifically resisting
involvement (rs = -.44, p < .05). Historical and current research on time management strategies
is universal and can apply to all types of companies, although research continues to focus more
on profitable businesses that demand productivity gains rather than mission-based non-profit
organizations. Nonprofit leaders have historically not focused on the bottom line, albeit over
the past 20 years. For years, many non-profit leaders have recognized the importance of the
outcome, but are missing discipline to control it. This could result in a measure of organizational
success recognition of employee productivity levels. Literature reported that the use of effective
time management strategies are the most effective time management method. (Tziner, 2015)
reported that the current trend in philanthropy is business-based models affect the effectiveness
and achievement of the objectives of non - profit managers; and organizations that increase the
pressure and increase the expectations of non-profit organizations succeed. A work-life balance
is essential for success. Author also claimed that leaders can achieve a balanced life by
becoming. Explanation of a balanced life could have an impact on how organizations lead time
and organization.
ACKNOWLEDGEMENT: This is paper is an outcome of project VEGA: 1/0544/19 Formation
of the methodological platform to measure and assess the effectiveness and financial status of
non-profit organizations in the Slovak Republic.
51st International Scientific Conference on Economic and Social Development – Rabat, 26-27 March 2020
593
LITERATURE:
1. Allan, D. (2015). Getting things done. The art of stress-free productivity. Bratislava:
Piatkus, 318 s. ISBN 978-034-940-894-1.
2. Bartosova, V., Kral, P. (2016). A Methodological Framework of Financial Analysis Results
Objectification in the Slovak Republic. In 3rd International Conference on Business and
Economics (ed.), Proceedings of Social and Behavioural Sciences, pp.189-197, Location:
MALAYSIA.
3. Belas, J., Gavurova, B., Toth, P. (2018). Impact of selected characteristics of SMES on the
capital structure. Journal of Business Economics and Management, vol.19, no.4, pp. 592-
608.
4. Carol, T., Lazaroiu, G., Grecu, I., Grecu, G. (2019). The Social Sustainability of Citizen
centered Urban Governance Networks: Sensor-based Big Data Applications and Real-Time
Decision-Making. Geopolitics, History, and International Relations vol. 11, no.2, pp. 27–
33.
5. Covey, S. R. (2014). Najdolezitejsie veci ako prve. Bratislava: Eastone Books, ISBN 978-
80-8109-257-2.
6. Gresakova, E., Chlebikova, D. (2018). Time management in the manager´s work.
Norristown: International business information management association (ed.), Proceedings
of the 33rd International Business Information Management Association Conference, pp.
5776-5782, Location: Seville, SPAIN.
7. Gresakova, E., Chlebikova, D. (2019). Delegation as the time management tool in the
manager´s work. Norristown: International business information management association
(ed.), Proceedings of the 33rd International Business Information Management Association
Conference, pp. 9717-9720, Location: Granada, SPAIN.
8. Janoskova, K., Kral, P. (2019). An In-Depth Analysis of the Summary Innovation Index in
the V4 Countries. Journal of Competitiveness, vol. 11, no.2, pp. 68–83.
9. Kmecova, I. (2018). The processes of managing human resources and using management
methods and techniques in management practice. Ekonomicko-manazerske spektrum,
vol.12, no.1, pp. 44-54.
10. Knoblauch, J., et al. (2012). Time management. Mejte svuj cas pod kontrolou. Praha:
GradaPublishing. 208 s. ISBN 978-80-247-4431-5.
11. Kundelis, E., Legenzova, R. (2019). Assessing impact of base erosion and profit shifting on
perfomrance of subsidiaries of multinational corporations in Baltic countires. Equilibrium
– Quarterly Journal of Economics and Economic Policy, vol.14, no.2, pp. 277-293.
12. Kushlev, K., Proulx. J., Dunn, E.W., (2016). Silence Your Phones: Smartphone
Notifications Increase Inattention and Hyperactivity Symptoms. In: 34th annual
chiconference on human factors in computing systems, pp. 1011-1020. ISBN:978-1-4503-
3362-7.
13. Pfaff and Associates/Performance Assessment Network. (2008). Time management
practices inventory (TMPI). Retrieved July 30, 2008, from
http://www.pantesting.com/products/pfaff/tmpi.asp
14. Salaga, J., Bartosova, V., Kicova, E. (2015). Economic Value Added as a measurement tool
of financial performance. Procedia Economics and Finance, vol. 26, pp. 484-489.
15. Tziner, A. (2015). Workstress and turnover intentions among hospital physicians: The
mediating role of burnout and work satisfaction. Journal of work and organizational
psychology-revista de psicologia del trabajo y de las organizaciones, pp. 207-213.
16. Valaskova, K., Bartosova, V., Kubala, P. (2019). Behavioural Aspects of the Financial
Decision-Making. Organizacija, vol. 52, no. 1, pp. 22-32.
51st International Scientific Conference on Economic and Social Development – Rabat, 26-27 March 2020
594
SOCIAL EFFECTIVENESS AS METER IN THE DEVELOPMENT OF
SOCIAL ECONOMY
Venelin Terziev
Russian Academy of Natural History, Moscow, Russia
National Military University, Veliko Tarnovo, Bulgaria
University of Rousse, Rousse, Bulgaria
ABSTRACT
The present work reviews the social effectiveness of the processes as a basic element for social
development. It tries to analyze the term from all its dimensions and to search for its
applicability in the assessment of social impact. It reviews the accumulated experience and tries
to give particular solutions in this direction. It searches for possibilities for defining criteria
for social effectiveness. Social economy being turned to satisfying certain necessities of people,
who are from the vulnerable groups, searches for answer to social effectiveness of these
processes. Finding meters (system of criteria indicators), which to assess this process is a
possibility that is expected to give good results.
Keywords: social programming, development, social economy, social effectiveness
1. INTRODUCTION
Speaking about effectiveness as a key term for each social-economic activity, traditionally the
stress is put on the economic effectiveness, which manifestation is in the subordination
“expenses-effects (benefits)”. And as far as each social activity is conducted with more and
more limited resources, the approach is to be as if towards economic activity. More, such an
activity is considered to be “each purposeful activity, where the limited resources are distributed
and combined among alternatives, while maximizing the effect or minimizing the expenses is
possible” (Stankevich, 1998). The correlation between expenses and benefits of a given
resource or combination of resources for achieving given, preliminary defined goal stands out
in the foreground, and on this basis, the rationalizing of managerial decisions. In this sense, the
subordination “expenses-effects” could be used as “method for planning; tool for taking
decisions and environment for historic documenting of the taken decisions” (Semerdzhiev,
2007). This fundamental principle that characterizes the economic effectiveness is one of the
sides for studying the activity effectiveness. But each activity according its nature is social and
defines the necessity of social effects measurability. On this ground in the recent years it is
more and more often spoken about the so called social effectiveness. In contrast to the economic
one, social effectiveness does not bear so much direct nature; it appears to be more complex
category and difficultly lends itself to one-dimensional expressing (Terziev, 2014).
2. MEASURING OF SOCIAL EFFECTIVENESS
There is certain accumulated experience on measuring social effectiveness within the frame of
the prognosticated assessment in the foreign practice from the social consequences of the
scientific-technical projects and the economic and social programmes. This way, an
independent stream of studies in the field of assessing of “social impacts” (SIA-Social Impact
Assessment) or more specifically said, the integral social consequences at the realization of
various development projects and programmes is built in the beginning of the seventies in the
USA. The business and political circles in the USA realize that each technological break-
through brings “unplanned” losses of ecologic, social, psychological nature, which turn in the
end of the day in indirect economic loss. In the field of scientific-technical development - at the
level of the companies as well as at the level of national programmes, reorganization of the

51st International Scientific Conference on Economic and Social Development – Rabat, 26-27 March 2020
595
whole methodology for planning and management is conducted. And, if earlier it is oriented
only towards purely economic criteria for effectiveness, then at present, the social,
psychological and other conseciences are also taken into consideration at the implementation
of scientific-technical projects, yet at the stage of taking decision for their elaboration and
realization. Thus the necessity of complex assessment of the various categories of impact of
technics and technology upon the society arises (1996). The evaluation of the social impact
from the scientific and technical projects and programmes in the USA is defined in an
independent stream after a mandatory procedure on assessing their ecological impacts is
established by an Act for policy towards the environment in 1969. (1996). All state projects
that could exercise significant impact upon the environment as well as the projects of the private
companies and entities that require special state sanction are put under ecological expertise. An
impressive example for the use of increased ecological requirements at the realization of
programmes for economic development in the USA is the organization of the elaboration and
realization of the project for the oil pipeline through Alaska in the middle of the seventies
(1996). The project’s planning has been conducted during the entire period of building,
operation and dismantling of the pipeline after the deposit’s exhaustion. We should note that
the whole complicated multi-level mechanism for the programme’s management is formed and
functions on the ground of the economic legislation in power in the USA and of special
legislative decrees and agreements. That defines the specific of the form of that management
mechanism, where its separate parts and elements presented by the state authorities, the
companies-owners, the specialized companies, are connected with each other in a unified
organizational system of two- and multi-party agreements and contracts. From the positions of
the long-term interests of the nation the project is recognized as highly effective and proper.
The formulation of the problem of social effectiveness is considered in sociology and economy
for debatable for a long time. Until present, no general definition of the term “social
effectiveness” is found synonymously either. There is high enough number of works of
monographic nature, where the authors try to study social effectiveness from the various types
of activities, including the managerial one. After all, most of the authors develop the term for
social effectiveness, the criteria and methods for its assessment towards the goals for the public
production. The monograph of the Bulgarian scientist M.Markov could be considered classic
work on the problem with the social effectiveness. According to him, effective is what leads to
result, to effect (from Latin effectus - an act, performance, and afficio – to act, to perform) –
effective means efficient (Markov, 1982). A popular model for assessing appears to be the
subordination “resources-expenses-result”, which characteristic feature is the separation of the
role of resource ensuring and the expenses for raising the managerial activity effectiveness. The
following three factors are defined in R. Likert’s model for effective organization (Terner,
1985; 1996a).
• Internal organizational factors, including in their composition the organization’s formal
structure, the economic structure and the social policy, the staff’s professional-qualification
structure;
• Intervenient variables such as the human resources, the organizational climate, the methods
of taking decisions, the level of trust towards the management, the methods for stimulating
and the motivation for acting;
• Result variables such as growth or drop of labour productivity and the revenues, extent of
satisfying the consumers’ demand, etc.
With such an approach, effectiveness comes as result of complicated interaction among various
factors, among which the domination position is of the human one and the social-ecological
factors. The approach, according which effectiveness is evaluated according to the extent of
protection of the balanced interests of the state and society.

51st International Scientific Conference on Economic and Social Development – Rabat, 26-27 March 2020
596
The work of the government apparatus could be recognized as effective only in the case it
successfully solves the problem for optimal protection of the interests of people, social groups
and each individual. In this dual task, the most important side is the term effectiveness of the
government apparatus. According to that approach, effectiveness is widening the possibilities
for active civil life of each civilian, of the society and the effectiveness of state. It is determined
by a well functioning system for state bodies’ activity, from their ability to realize state interests
in a legal way, to implement the state policy for social and public development. Another point
of view is the one that connects the effectiveness of state activity with the availability of the
lack of optimal paradigm for administrative-political management. The word goes about the
confrontation of the traditional technocratic paradigm for political management and the new
one – the participative one. As a whole, authors connect directly the effectiveness of state
activity with the presence of bureaucracy in it, which actually serves the society (1996; Terner,
1985; 1996a). And this is the bureaucracy, which: is found under the real control of society;
expresses the interests for social progress; is minimal according its quantity and quality
parameters. This statement is based on the internal contradiction of bureaucracy among the
wide social goals, because of which it originates and its narrowly corporative interests that tend
to dominate. According to the opinion of some authors, the criteria for the social management
effectiveness are concluded in the following:
• In the extent of correspondence of the directions, the contents and the results from the
activity of managerial structures and from the parameters of its that are defined by the
functions and the status;
• In the legitimacy of decisions and actions that corresponding to the managerial structures
and the users (the recipients, the beneficiaries);
• In the reality of influence of managerial activity upon the state and the development of the
objects for managing;
• In the depth of reporting and expressing in managerial decisions and actions upon the
particular and complex needs, interests and goals of people;
• In the nature and the volume of direct and “reverse” relations with the beneficiaries, or said
in other words – in the democratism of activity;
• In the extent of authority of decisions and actions of the managerial structures;
• In the fairness and expedience of information transferred to the managerial structures and
the beneficiaries;
• Influence of managerial activity towards the external environment.
Each act, each social phenomenon or feature, including social effectiveness, is characterized by
quantity and quality sides. And although these two sides of the object exist in inseparable unity
and interconnection, they are, anyway, different characteristics of the surrounding social
environment. It is accepted in the scientific literature the quality side form the received result
(effect) to be indicated with the term “criterion”, and the quantity one - with the term “indicator
for effectiveness”. In other studies, slightly different interpretation of the term “criterion for
social effectiveness” is suggested, reviewing it from the point of view of the interrelation
between the quantity and the quality definiteness of the studied and evaluated object. From
quantity side, criterion appear to be method, tool, sample measure for movement towards the
desired result, and from quality one, as possibility for separating of “positive sides, forms of
that movement in space and time”. Unity of meaning is observed in the understanding of the
term “criterion” in all pointed approaches despite all differences. Besides that, their synthesis
gives us new, deeper understanding for the social nature of social effectiveness. Thus, “the
indicator for effectiveness” (the quantity criterion), fixes the objectified and integral, mainly
quantity expressed (for example, from point of view of the natural volume of social goods and
the time interval for their ensuring), the evaluation of the achieved by the social system of any
51st International Scientific Conference on Economic and Social Development – Rabat, 26-27 March 2020
597
rank. “The criterion for effectiveness” (the quality criterion), is focused to a greater extent on
studying the internal mechanisms for achieving the given result, including in itself the extent
of limitedness and the so called activation of the human factor as condition for self-
development, effective activity, social cost of the achieved, the extent of its limitedness, etc.
This distinction is significant and important for elaborating the system for evaluation of social
effectiveness. Whatever quantity expresses the effectiveness of the functioning and progressing
social system, it always appear to be result of the actions of all factors of the system in their
combination, presented as integrative resultativity. It is important to emphasize that whatever
extraordinarily effective the activity of the separately taken factors is in the social system, its
high effectiveness could be ensured only by the relevant quality of the system social interaction.
It originates as its irrevocable organic feature, serves as general algorithm and universal
motivating mechanism for the activity for all the factors in a certain system. The connection
between economic and social effectiveness has complicated nature. The methodological
principle, according which the realization of the social programme is obliged to become catalyst
for effective economic development is usually in the base of the economic effectiveness growth.
The funds spend by the society for satisfying the social needs, are returned in the end in the
form of raising the social and labour activity. The realization of social management in this
system appears to be in the end of the day one of the subordinated factors for reaching economic
effectiveness. The attempt to explain the impact of the economic factor for achieving integral
social effectiveness similar way suffers simplifying approach inevitably. It is already
recognized that the classic criterion (the correlation “expenses-profit”) is obviously insufficient
at certain nature of social effectiveness. Another approach is necessary, with which help the
activeness of social activities could be evaluated. The extent of achieving social effectiveness
is defined by the position of movement towards socially significant strategic goal, which
meaningfully uncovers as state of maximum full realization of individual’s needs and self-
realization of his natural powers, said in other words, his personality. Individual’s wealth as a
supreme value for society becomes ending in itself for the social development. From here, the
projective goal of each development originates usually as requirement for determining the full
wealth and the free comprehensive development of all members of society, whose realization
is, after all, in creating just for the individual circumstances of life and creative work. More,
number of important methodics specifying are to be made. The notion for social effectiveness
as result, evaluated from the positions of getting closer to the socially significant goal, should
obligatory be correlated to the changes that correspond to the general line of progressive
development of the social system, i.e. with its gradual transition from less to more thorough
existence. We can note that before comparing each achieved social result with the expenses, it
is necessary to clear the significance of the fact itself of achieving this result, mainly from point
of view of its correspondence to the goals of social development. It is also important to consider
the time interval necessary for achieving the set goal. The significance of that specifying about
the understanding of the basic principle of social effectiveness and its criteria emphasizes
expressively the particular attempt for social policy. The American scientist D. Rotblat
emphasizes that a fundamental reconsidering of the principle of effective social policy was
made in the USA in the thirties (Terner, 1985; 1996a). The government’s measures on widening
the insurance funds for unemployment and increasing the number of social aid receivers, who
are initially reviewed as completely progressive, in long-term plan manifest more and more
their inefficiency as far as they have weak impact upon human resource improvement.
Experience shows that “ensuring well-being without suggesting viable alternatives” for
development of the individual and his initiative, becomes restraint in the social development as
far as raises “reproduction of the culture of poverty from one generation to another”. It is
obvious that the evaluation for the social activeness of the conducted activities could radically
change to the same extent, to which the time element allows more precise unveiling of the
51st International Scientific Conference on Economic and Social Development – Rabat, 26-27 March 2020
598
streamline for social development. So to say, the inclusion of people, who need social support,
in the process of labour, bringing perspective from economic as well as social point of view
result appears to be more effective than giving aids directed to short-term “smoothing” of social
tensions in society. The review of the problem with the social effectiveness according to the
notions for social development and its ideal raise additional difficulties. In these cases, when
social effect is difficult to be measured in quantity, the extent for getting closer to the goal, to
the realization of these values, suggested by it could serve as the only reliable criterion for its
evaluation. The predominantly consistent side of the terms “social effect” and “social
effectiveness” are reviewed in number of works. As a rule, the authors of publications agree
that social effect is definite social result, purposeful activity conducted in life by economic
decisions. More, in some cases it is understood like “something, connected with the
development of the individual”, which “forms new features in the image of life and activity as
individual as well as collective, evidencing raising of social activity, supports the universal
development of personality and the forming of a new type of worker”. In other cases it is treated
as “result corresponding to the goals of social development”. In third cases, it is reviewed as
“stage for raising the social-psychological and sanitary-hygiene comfort of the individual”. The
last cases, actually, concern not the social result as such but the effectiveness, i.e. the correlation
between the result and the goal, the initial and the consecutive state of social comfort (1996;
1996a). The suggested definitions allow outlining the essential differences between the terms
“social effect” and “social effectiveness”. The first reflects a conclusion for reaching certain,
quantity or quality evaluable results from the social activity in independent meaning. In the
second case there is correlation of these results with the measure or the extent of realization of
the normatively set goal or ideal for social development. This measure for the social effect
evaluation in turn serves as an important direction for this quality side of social activity,
integrated in its system organization. Thanks to it the social effectiveness itself is achieved.
This social activity immanent effectiveness - the constitutive quality characteristic could be
defined as principle for social effectiveness. It is immediately connected with the criteria for
social effectiveness as concrete quality indications and determinants of the meanings, on which
base, as original “zero points for reporting”, social activity is assessed as effective or
ineffective. Reviewing the indications that distinguish social effectiveness from the result, they
correlate it either with the goals, or with the needs. It should be noted that “most effective at
equal other conditions, would turn activity, where the goal to a maximum extent expresses
human needs”. Alongside, the issue about the concrete social results (effects) from its
managerial impact is not set although it is presented in the given context as very significant.
The point is that the review of the issue with the social effectiveness and the contents of that
term itself, is an inseparable from the concrete analysis of the normatively or ideologically set
goals of social development as well as of the needs (expectations, interests, ideals) of the
various social subjects. It seems social effectiveness could not be thought of within the
categories of an abstract social good or only in the form of the social system movement towards
certain ultimately generalized goal of social development. The social object and this is the
object of management, towards which the term for social effectiveness falls, is complicated
enough for its structure. It embraces the whole combination of exiting in society social
connections and relations. The goals for social management themselves concern inevitably the
whole “space” of these connections and relations, including the social system (socium) is an
integer, social groups (communities) and the separate individuals (personalities). Coming from
that and the effectiveness from the social-managerial activity, it is to be considered, in the
aggregate evaluation, about the development of all sides, aspects and components of the social
system. Obviously, the reviewed above correlation of the effective social activity with the social
progress’s goals, indicates one of the important moments of the social relation and inter-
subordination between the all-system, social-group and individually-personal dimensions of

51st International Scientific Conference on Economic and Social Development – Rabat, 26-27 March 2020
599
social activity, of the aggregate and as a rule long-lasting nature of its manifestation. Reviewing
the issue of the social-economic effectiveness from the target complex programmes, it is
concluded that “the main purpose of the estimate and the evaluation of social effectiveness
within the program-targeted method is ground of the adopted planning-managerial decisions”
(Terziev, 2013). Considering the necessity of prognosticating the social consequences from the
economic activities that are to be estimated in their effectiveness general evaluation, number of
authors note that because of this “the sustainable quality or (although serial) subordinations
between production-technical and the social changes among the characteristics of the mapped
out undertakings and indicators that reflect the corresponding target norms” (1999; 2000). Some
authors associate social effectiveness of economy with the problem of effectiveness. In
economy and sociology, debatable appears to be even the issue about the legality of this term,
such as “social effectiveness” (in contrast to the more or less clear economic maximum of
production at minimum expenses). The scientists, who consider this term for legal, try to give
it a more precise definition. In particular, the criterion for social effectiveness for solving ripen
social problems in minimal time-terms and minimal expenses for society. The given definition
bears debatable nature because the elaboration of criterion for optimality in the social sphere
would also significantly move forward the understanding of the criterion for social
effectiveness no matter what final formulation this term would get (1999; 2000). The
formulation of the issue about social activity optimality as integral criterion for its effectiveness
is perspective namely because the complexity of each social object, its dependence by a lot of
variables and also, by the availability of multi-vector internal system discrepancies. We have
to take into consideration that optimization in mathematical theory for the optimal processes is
called the process of choosing the better variant out of the possible ones, taking the system, the
object, to the best of the possible (optimal) state, process, where the quantity characteristic of
the most desired feature of the object is maximized and the opposite, the least wanted is
minimized. The issue about the criteria for optimality (the optimum) appears to be important
theoretic result for the optimization of national economy. In the most general form, the criteria
for optimality in economy are defined as special economic and mathematic models that express
public attitudes. Said in other words, they are special variety of formalization of the economic
development goals in analytic shape and in this sense, presumptively set function. The problem
about the correlation of the problems on optimality and effectiveness also appears to be
debatable. One group of economists identifies them actually, and others try to separate these
terms. Here purposeful research work is necessary. For the present, one thing is clear:
unconditional relation exists between the criteria for optimality and effectiveness, and there the
theoretic clearness in certain regard allows us to achieve significant success in the objective
evaluation of consequences from the realization of plans, programmes, projects and decisions.
It is obvious that, for example, social effectiveness could be thought of narrowly pragmatically,
as for the best result in solving urgent social problem. The strategic and long-term consequences
of the undertaken measures are estimated within a wide social approach. Certain discrepancies
and contradictions might arise among these approaches. In these conditions, the task for
achieving joint social effectiveness is to be predominantly formulated as a task on optimization
of the social-managerial activity. Social and economic effectiveness have two-way appearance.
Regarding each bearer of a certain kind of labour, it refers as part of the genera, immediately
public labour. Regarding the product of each certain labour, it manifests as characteristic or
feature possible to satisfy increasing demand. Economic effectiveness brings its criteria for
evaluation of results from the labour towards solving the issue of how much the achieving of
the received effect for social effectiveness costs, whom and how this effect serves. Coming
from there, it could be suggested that in contrast to the criterion for economic effectiveness, the
criterion that certifies the social effectiveness is not realized only within the given “closed”
system of social action, rather has set in appearance norm-ideal nature.
51st International Scientific Conference on Economic and Social Development – Rabat, 26-27 March 2020
600
This significantly complicates the evaluation for social effectiveness of each institute for
management, as far as it forces it to keep into consideration in its field “the internal
environment” of its activity, where results could be correctly evaluated and measured.
Furthermore, the measuring is unique with the quality of the given social-managerial system as
well as with “the external environment”, which is within the sphere of its control. But even
though, it is a task of norm goals, from which the integral evaluation for social effectiveness is
derived. It is expedient to emphasize the differences and the interrelation between the categories
effectiveness and quality. Criterion for effectiveness is the correlation expenses and result, and
criterion for quality – the correlation between the effect and the goals, the goals and the funds
for achieving them. An expression of the effectiveness principle is less expenses – greater
result. The principle for quality manifestation is the highest level for achieving the goal at
rational and optimal use of the available funds. Obviously, reviewing the principle for social
effectiveness this way, the latter is accepted from the positions of quality of social activity, and
not as correlation “expenses-effects“. The problems of activity’s social effectiveness are
reviewed directly in the particular management. The social consequences from the managerial
activity in broad sense of the word are clarified by the already mentioned American system for
evaluation of social consequences - SIA (Social Impact Assessment). American authors include
to them the economic one in the narrow sense of the word, the political ones, cultural and
psychological impacts. From point of view of the one, who is subject of impact, social subjects
and organizations distinguish. Such are the society, social groups, social-territorial
communities, the individuals. From organization-structural point of view, the impacts on the
activity of the managerial bodies, ministries, branches, companies are analyzed (1999; 2000).
From the point of view of impact’s spatial scale, the consequences for the state, the region, the
district, the municipality, the territorial unit are analyzed – the population of the object of impact
or the particular target group of beneficiaries. In the narrow sense of the word, under social
impact we understand the impact upon employment, the opening of new job positions, of
education and training, self-training, of health and quality of life, of communicating within the
social groups and among them, of social solidarity and social segregation within the local
territorial community. In this case, the task consists in answering the questions who benefits
and who loses if the supposed action takes place, in what social expenses find expression and
how they are distributed. In order to assess the managerial decisions’ social effect, we need to
have criteria, which allow us to add social consequences to the goods or to the expenses. In
other words, the availability of certain standards and value reference points is supposed.
Actually, the procedure finishes with defining what some authors call “target” or “necessity’s”
effectiveness, i.e. the effectiveness understood in norm-ideal dimension. The mentioned
experience allows us to realize number of simple truths, without considering which one cannot
proceed to creating socially significant programmes and projects, namely:
• Before proceeding to the implementation of any managerial decision, it is necessary to
evaluate its social sense, hence its expedience, too;
• As far as there are no universal criteria for social effectiveness, each concrete managerial
decision should be accompanied by giving proof of the expected from it social effect and
defining criteria for its assessment;
• The interpretation of social effect depends on the scale of managerial decision, by the level
of reviewing the subjects that experience the impact of the innovation, by the motives and
the pursued goals, as well as by the time interval, in the course of which the expected result
is expected to occur;
• It is important to distinguish the social effect in the broad and the narrow sense of the word,
that subordination exists between them. The grounding of managerial decisions increases if
the notion of social effect brings complex nature and includes economic, social,
psychological, socio-cultural and other significant consequences;
51st International Scientific Conference on Economic and Social Development – Rabat, 26-27 March 2020
601
• Assessing the supposed social effect, it is necessary to orient ourselves towards certain value
standards that allow us to deliberately judge for the social “value”. For the social
“succession of decisions”. Such evaluation is possible only in case of comparing the social
effect of the expected from several alternative decisions.
The problem of social effectiveness of management started being actively studied in the end of
the sixties and the beginning of the seventies of the last century. Before that it is connected with
the development of the theory for the social development, which puts the question not only
about the economic but also for the social effect from the managerial activity. The issue with
the effectiveness of the managing system, as effectiveness from the activity of the subject of
managing or the managing sub-system, is necessary to focus on the following questions: what
is the contribution of the managerial system in solving one or other socially significant tasks?
What is its participation in achieving the goals standing in front of the particular organization?
Primal criterion appears to be the extent of impact of the managed sub-system. But as far as the
managing system is relatively independent and functions as an overall complex, it is possible
and due to define one more group of criteria. It is formulated on the ground of the primal
criterion and gives answer to the questions connected with the internal state of the management
system, with its ability to act with increasing level of effectiveness. Alongside the evaluation
of the management system effectiveness in the general aspect, it is possible and due to define
the effectiveness of the main management components – the functions, the functional structures
and the technologies. Effectiveness could be reviewed not only as a phenomenon from the
economic sphere. Something more, it appears to be relatively independent social phenomenon.
The review of the multistage structure of the elements, value criteria snd indicators is in its
base. The efficiency of the social programmes and measures, the activity of the various groups
of the population, the social consequences from the realization of economic, scientific and
technical projects are fixed in them. The indicators for social effectiveness are reviewed as tools
for evaluation the realization of the interests and needs of society, the state, the staff and the
individuality. Effectiveness, as social phenomenon, appears in the shape of the quality-quantity
characteristic for maximum development of human resources, forms of social life activity and
management of society, while considering the minimum social, political, economic and moral
expenses. This approach allows us to review social effectiveness as universal approach for
expressing the extent of efficiency of the positive and the negative functioning in the
development of social institutes and processes. Furthermore, the broadly understood principle
for social effectiveness gets out of the limits of the given correlation as far as it considers and
integrates yet few more important dimensions of the social activity effectiveness. The word
goes about its orientation for achieving socially significant, normatively set goals for
development of the object for social management, the assessment for the sequence and the
actual extent for getting closer to the searched public interest in the order of system’s “self-
development”, the orientation towards the managerial activity’s quality. These aspects for
measuring the social effectiveness are to find their reflection in the building of the general
model or principle for social effectiveness in a law-governed way. The analysis of the problem
of social effectiveness shows that, in the course of science’s forming and development, it
naturally receives the necessary attention in the context of the various management systems. In
particular, we should emphasize the significance of this context regarding the system for state
and local governance of the social spheres of society. The public nature of these systems infers
their limiting in its activity for social effect and its determining characteristic of social
effectiveness in the broad range of social needs and goals. Because of these, the state
governance system’s social effectiveness objectively requires the application of poly-modal
multi-parameter approach towards its measuring. Substantial appears to be also the connection
of the whole complex of social and effective state governance with the social safety of the state
51st International Scientific Conference on Economic and Social Development – Rabat, 26-27 March 2020
602
as a whole, and also of each region and territory in its independence. Defining the social
programmes effectiveness’s complex evaluation, it is expediently to note the following:
• The social programmes effectiveness evaluation is to be reviewed on the background of the
quality and quantity indicators: the quantity indicator is expressed in natural volume of
social goods as well as in the material expenses for getting them, and the quality indicator
or criterion is expressed in the internal mechanisms of achieving the given result, the quality
of organizational and governance system, the system norms and values, the norms of law,
on which ground the activity in a certain social system is considered effective or not;
• Evaluating the programmes should consider also their economic and social effectiveness.
The economic effectiveness is expressed in the fact that the social programme realization
itself is obliged to become a catalyst for effective economic development. The funds spent
by society for satisfying the social needs should in the end return in the form of raised social
and labour activity;
• The extent of reaching social effectiveness is defined by the position of movement towards
socially significant goal, which consistently reveals as state of maximum full realization of
individual’s needs and as self-realization of his essential powers, said in other words, his
personality, which is realized before all, in creating worthy for the person conditions for
living and development.
In case of complexity or possibility of calculating the economic effectiveness, weight in
evaluating appears to be the optimality in achieving the social effect. It should be considered
that the results from the programmes are correlated either to the goals of the programme’s
creators, or with the needs of the ones, towards whom the programmers are directed. The
highest effectiveness in the given case is achieved by the programmes, where the goals of the
programme’s leaders and organizers most fully express the programme subjects’ needs
(Terziev, 2013).
3. CONCLUSION
We review social effectiveness within the broad social approach at defining social effectiveness
because of the extreme complexity of the reporting and evaluating the strategic and the long-
term consequences from the social measures, we review social effectiveness from the conducted
by the state programmes narrowly practically. And this means highest results when solving
particular social problem. The social programmes effectiveness evaluation in the given case
concludes to the task of optimization of the social governing activity in the process of solving
particular social programmes through the programme approach. And this more than ever
requires the defining of criteria for social programmes effectiveness and on this ground, the
application of proper evaluating methods. Social economy is turned to satisfying certain needs
of people, who are in a difficult situation and searches answer for the social effectiveness of
such a process. The most difficult and complicated task, in all that, is finding measurements
(system of criteria indicators) to evaluate that process. The lack of these will lead to not very
sharp and exact evaluation and from there taking proper and exact decisions – connected with
preventive, correcting or following actions. All that is connected with giving new meaning to
the activities and actions in this whole social process in the course of its development. The
complexity comes from the fact that there is obvious lack of sharp statistical data to support this
analysis.
LITERATURE:
1. Markov, M. (1982). Tehnologiya i effektivnosty sotsialynogo upravleniya. Per. s bolg. M.
1982.
2. Osnovyi sovremennogo sotsialynogo upravleniya. (1999). M. 1999.

51st International Scientific Conference on Economic and Social Development – Rabat, 26-27 March 2020
603
3. Osnovyi sovremennogo sotsialynogo upravleniya: teoriya i metodologiya. (2000). M. 2000.
4. Semerdzhiev, Ts. (2007). Strategiya: sreda resursi sposobnosti planirane. S. 2007, s.214.
5. Stankevich, V. (1998). Yohanes Gerber edin ot sazdatelite na nemskata mikroikonomika na
vaorazhenite sili S. UI Stopanstvo, 1998, s.98.
6. Teoriya i metodika sotsialynoy rabotyi. (1996a). M. 1996.
7. Teoriya sotsialynogo upravleniya, K., 1996.
8. Terner, Dzh. (1985). Struktura sotsiologicheskoy teorii. M. 1985.
9. Terziev, Venelin. (2013). Vazdeystvie na politikite na pazara na truda za osiguryavane na
zaetost. Izdatelstvo „Dema Pres – Ruse“, 2013.
10. Terziev, Venelin. (2014). Vazmozhnosti za povishavane na efektivnostta na sotsialnata
adaptatsiya na voennosluzheshti, osvobodeni ot voenna sluzhba. Izdatelstvo „Primaks“ –
Ruse, 2014.
51st International Scientific Conference on Economic and Social Development – Rabat, 26-27 March 2020
604
INTERNATIONALIZATION, CONCENTRATION AND BUSINESS
SUCCESS OF RETAILERS: THE CASE OF CROATIA
Ivan Kovac
University of Zagreb, Faculty of Economics and Business, Croatia
ABSTRACT
The aim of this paper is to investigate the effects of concentration of the Croatian retail market
on individual market players. The author's focus is to determine the extent to which differences
in the concentration of the retail market in the Republic of Croatia are related to differences in
productivity and business results of Croatian retail companies. The paper starts from the basic
assumption that differences in market share have a statistically significant influence on
differences related to the business result of retailers in the Republic of Croatia. The results of
the research confirm a significant correlation between the size of the market share of retailers
and their business performance. Namely, the results of the research show that there is a
statistically significant difference between the five groups of retailers, grouped by different
market shares, when it comes to gross profit per employee. The paper also presents the basic
limitations of the research as well as recommendations for future research.
Keywords: retail, market concentration, internationalization, Croatian retail market
1. INTRODUCTION
On the wings of internationalization and globalization, whose development started to accelerate
at the beginning of the 1980s, there begins a strong global expansion of the leading retail
companies outside their home countries. The desire to grow, on one hand, and fierce
competition on the domestic market on the other, in most cases represents the main motives of
retail market players for entering the international market. For a long time, the literature has
been gathering different researches highlighting internationalization and concentration as two
key trends in retail industry (Tordjman, 1995). Undoubtedly, internationalization and
concentration have largely determined the structure and dynamics of today’s global retail
market (Dawson, 2006). We are witnessing the retail becoming a highly globalized industry
with strong and fast dynamics of changes and challenges. Namely, this industry is characterized
by the emergence of new forms of retail on one hand, and the rising expectations and demands
set by the consumers on the other. Due to the strong movement of retail companies on the
international markets, some of them have become extremely big and powerful (Burt et al.,
2003). Naturally, in conditions of retail internationalization, global players in retail industry
have to consider specificities of certain local markets and special habits and expectations of the
consumers. Today, retail industry is a very important economic sector that is in many countries
characterized by intensive dynamics of growth and so, it is becoming even greater and stronger
generator of the GDP and added value. Most of all, it is becoming an economic branch that
provides employment for more and more people (Bronnenberg and Ellickson, 2015). It is the
intense competition on the domestic market that is considered by many authors to be one of the
main reasons for internationalization of their business i.e. exit of retailers onto new markets,
outside their domestic boundaries (Papadopoulos and Martin Martin, 2011). In this strong
process of internationalization of retail i.e. business exit of the leading retail companies outside
their primary market, we can encounter a really small number of exceptions that are not
following this modern trend of expanding onto international markets (Treadgold, 1991). One
of them is The Kroger Co., (USA), the third largest retail company in the world and the only
one in the first ten companies in the world that does not operate outside its home country. This
company proves that it is possible to be successful in retail without internationalizing your

51st International Scientific Conference on Economic and Social Development – Rabat, 26-27 March 2020
605
business. However, the size and the purchasing power of a country like the USA where this
successful retail giant operates have to be taken into consideration. The success of the leading
retail companies on a new market depends on many different factors. More recent studies
suggest that, besides to other factors, the attention should be given to the speed of the very
market internationalization, format diversification etc. (Hoppner and Griffith, 2015). Today, we
are witnesses of an intensive and aggressive expansion of the leading global retail companies
that spread to many countries worldwide by using different (multiple) store formats (Shi, et. al.,
2018.). Many of these global players are successful in their campaigns to conquer foreign
markets and are characterized by the general approach of globalization and internationalization.
But, under no means should we forget those that are for any reasons unsuccessful (Swoboda et
al., 2018). Bearing in mind that modern retail is characterized by internationalization and
concentration, along with the fast changes and great challenges they bring. Namely, today’s
global retailers are often facing slow economies in the countries they operate in and are dealing
with demands that are becoming more and more specific regarding shopping options or social
experience related to these options (Smith et al., 2018). Due to the fact that the retail market in
the Republic of Croatia has been facing important changes in recent years, this paper analyzes
the processes of retail market concentration and changes conected with them.
2. LITERATURE OVERVIEW
Over the years, the literature has been offering many papers that investigate the connection
between the level of internationalization of certain companies and their business success.
Assuredly, the authors offer many different opinions, be it from the theoretical point of view,
or from the practical aspects of this important phenomenon in retail (Hitt et al., 2006.). In
general, the literature offers perspectives from different authors that clearly suggest how
internationalization in business brings the benefits and costs to the business subject. Those
authors who highlight the benefits mostly point to economies of scale and scope (Caves, 1971).
Some other authors, in the context of the advantages of internationalization, list other benefits
as well, like, for example, operative flexibility, knowledge development and the advantages of
organizational learning (Chang, 1995). On the other hand, some other scientists have pointed
out how internationalization brings costs. This is mainly related to the difficulties in managing
and coordinating different activities connected with doing business in more than one country
(Gomes and Ramaswamy, 1999). It is understandable that high level of business
internationalization leads to the increased costs of processing the information. Namely, in order
for such a company to be successful, it should focus on the specificities of each market
regarding, for example, the logistics, local consumers, trade regulations etc. (Sundaram and
Black, 1992). The literature, as previously mentioned, offers quite a number of papers, mostly
from the area of international business and strategic management, and focusing on the research
of the relationship between the level of internationalization of the individual business subjects
and their business performance. Opposite to that, there are much fewer theoretical and empirical
papers that scientifically analyse internationalization–performance, I–P and the relationship
between business success and internationalization of business subjects. However, it is important
to point out that the findings of those scientific researches do not show the consensus regarding
a clear contribution of business internationalization of retail companies to their business
success. Moreover, such and similar results related to this important topic we can also find in
the researches dealing with the international business and strategic management. Some papers
show the results that support positive connection between internationalization and business
performance of retail companies (Etgar and Rachman-Moore, 2008). On the contrary, there are
papers that suggest internationalization have negative influence on the business success of
retailers (Mohr and Batsakis, 2014). But, above all, it is interesting to note more recent results
of the studies dealing with this topic.
51st International Scientific Conference on Economic and Social Development – Rabat, 26-27 March 2020
606
In this context, the paper presenting the ideas of the undulating relationship between
internationalization and business success of retail companies based on theoretical and empirical
analyses, should be mentioned (Dimitrova et al., 2019). Namely, the authors come to the
conclusion that internationalization first has a negative impact, then a positive one, then again
assumes negative influence on business performance of the retailers over a longer period of
time. Moreover, the same authors suggest that the two variables, the expansion of the foreign
market and format diversification in retail, moderate the relationship between
internationalization and business success of retail companies. The growth of foreign market
builds up the S-curve relationship between internationalization and business performance,
while the format diversification in retail does exactly the opposite. It is understandable that
internationalization and globalization of the retail market has the consequence of the arising
concentration of this market globally, and locally. Namely, the leading retail chains, in the
conditions of expanding onto international market, have achieved fast growth. It has especially
been evident in the EU, where the leading (foreign) retailers have had a far bigger growth rate
that it has been the average growth on the level of retail as industry (Dawson, 2006). If we want
to simplify the defining of the concentration as a market phenomenon, then we could say that
the retail market is characterized by a high concentration if there are few retail companies with
high market shares. Opposite to that, the market is less concentrated if there are many business
subjects operating there with each having only a small share. On the global scale, in 2017, the
first ten retail companies generated 31.6% of the revenue of the top 250 biggest retailers in the
world (Deloitte, 2019), while their concentration in 2016 was 30.7%. In other words, the
concentration grew in 2017 in relation to 2016. Internationalization and globalization on the
global retail market, generally speaking, have the consequence of higher concentration on the
market, with all their advantages and disadvantages for the economy in general, the retail
companies and the consumers. Retail chains, due to their extremely strong business activities
and big market shares, have created considerable market power. They have built an especially
dominant position regarding food retail (Lloyd et al., 2015). The process of retail market
concentration has the phases of lower and higher intensity, but it has been taking place
continuously for almost three decades. It is interesting to note that this process of concentration
on the specific market has been in progress according to an almost well-tried recipe. Namely,
retail chains come to the specific market and achieve fast and above-average growth and therein
market concentration in several ways. They achieve it through organic growth, acquisition or
mergers, depending on the specificities of individual markets and the risks related to them. In
that way, those retail companies become dominant in the channel of distribution in relation to
other companies, and especially in relation to the manufacturers. Their strong negotiating
position in relation to their suppliers enables them to obtain lower purchase prices and costs
rationalization in general, which creates preconditions for a more rational and successful
business. Pursuant to that, due to their privileged position, their business is characterized by a
higher productivity in relation to their rivals on the market. Generally, they grow faster and
have a strong accumulation that enables them to invest in new technologies and to implement
innovations into their business. It has been long known that new technologies and above all,
innovations are among the most important factors of development of the economy and the
companies individually (Kosala, 2015). Many studies confirm the importance, but also the
necessity of innovations in retail, particularly those related to the continual introduction of new
formats in retail (Reinartz et al., 2011). Namely, many researches show that understanding the
current phases of the life cycle of certain formats in retail is of great significance (Klein and
Schmitz, 2016; Maruyama et al., 2016). Today, we are witnessing the situation in which leading
companies in retail strive to continuously develop retail formats in order to remain successful
on this extremely demanding and competitive market (Hino, 2014). Introduction and
development of new retail formats is becoming one of the key determinants of modern retail

51st International Scientific Conference on Economic and Social Development – Rabat, 26-27 March 2020
607
that especially concerns food retail. This process did not start yesterday, it has been running for
years, and lately, it has intensified. In line with that, it is clear that with products and retail
formats, there are different phases through which a retail format goes through during its life
cycle. Moreover, the studies have shown that retailer market concentration can have a
significant influence on macro-economic movement in the entire economy of a country.
Namely, the researches conducted in Japan suggest how retail market concentration, especially
the discounts (rebates on the amount of goods procured from the supplier), connected with the
volume of the purchased goods by the biggest retailers, has led to deflation of about 0.1%
annually during „ the lost decades “ (Ojima et. al., 2018).
3. RESEARCH AND METHODOLOGY
The primary aim of this research paper was to investigate the influence of the concentration of
the Croatian retail market on individual market players i.e. on their productivity and business
results. Namely, the literature offers papers that prove a direct correlation between market
concentration and business success i.e. profitability of the retailers (Hovhannisyan and Bozic
2016; Rickert et. al., 2018). In line with these facts and for the purpose of this research, 36
leading retail firms in Croatia have been chosen. The criterium for isolating the leading firms
was their market share. The author of this paper first and foremost wanted to answer the
question of to what extent the differences in concentration of the Croatian retail market are
linked to the differences in productivity and business result of the retailers that operate on this
market. Since the concentration growth trend has been recorded on the Croatian retail market,
it was imperative to look into the influence of market concentration growth on retailers that
have smaller market shares (local and independent firms). The paper starts out with the basic
assumption that on the Croatian retail market, the differences in market shares of the retailers
have important impact on the differences in their productivity. Moreover, the assumption is that
the differences in market share have a statistically significant influence on the differences linked
to the very business results of the retailers in the Republic of Croatia. Following the above-
mentioned, the main assumption (hypothesis, H) of this research is: the market share of the
retailers in the Republic of Croatia has a statistically significant influence on their business
results (gross result per employee). The research was conducted on the sample of 36 leading
general retailers of fast-moving consumer goods that mostly deal with food, beverage and
sanitary products for households in the Republic of Croatia. The data collected for the period
from 2014 to 2018 was processes by the SPSS 20 software package. The research was carried
out during the mid - 2019. The data was acquired from the analysis of the financial reports of
the leading Croatian retailers available on the Croatian Financial Agency (FINA) website.
AZTN (Croatian Agency for Market Regulation) also provided valuable data. The leading
business subjects in the sample were divided into five strata, and the criterion for calculating
the market share was their total revenue. The division into five strata is presented in Table 1:
the retailers with the market share of up to 1%, the retailers with 1% – 5%, the retailers with
5% - 10%, the retailers with 10% - 20% and lastly, those with the market share of over 20%.
The retailers were divided into the strata based on the average market share in the period from
2014 – 2018. In this way, the consistency of the elements of the market share was able to be
maintained for every stratum in the sample throughout the five targeted years, with the aim of
providing a clear analysis of the fast-moving consumer goods retail market (primarily food,
beverage and sanitary products) in Croatia. In the analysed sample, the first stratum are those
retailers that own more than 20% of the fast-moving consumer goods retail market (food,
beverage and sanitary products) in Croatia. In this stratum, there is only one retailer, Konzum,
the biggest retail chain in Croatia. The average market share of Konzum from 2014 to 2018 was
30%. However, we deem it necessary to further explain the business trends connected with not
just Konzum, but the business group it belongs to as well.

51st International Scientific Conference on Economic and Social Development – Rabat, 26-27 March 2020
608
Today, Konzum belongs to the "Forte nova" Group (the former Agrokor Group) that has been
undergoing a turbulent phase over the last couple of years, due to business restructuring and the
ownership scheme.
Table 1: Research sample
Concentracion of
retailers
Number of retailers Structure of the
sample (%)
Total share in retail
(%)
> 20% 1 2,80% 30,00%
10% - 20% 2 5,60% 20,90%
5% - 10% 3 8,30% 23,20%
1% - 5% 8 22,20% 16,40%
< 1% 22 61,10% 9,40%
Total 36 100% 100%
Source: Author's calculation
After a relatively long period of over-borrowing and inefficient business decisions, the creditors
and investors (with the help of the government and a special law passed – Lex Agrokor) took
over the Group, which inevitably had further negative consequence on the activities of Konzum
as one of the biggest subjects in the Group. In such circumstances, Konzum faced a strong
decrease of revenue in 2016 and 2017. Therefore, the market share of Konzum dropped
significantly in the analysed period (2014 – 2018). Namely, the share held by Konzum on the
fast-moving consumer goods retail market in Croatia in 2014 was 32.27 %, while in 2018, its
share dropped to 23.38% (Table 2). In the five-year-period, the market shares of Konzum
dropped by 27.5% i.e. 8.89 percentage points. We think that this happened for the above-
mentioned reasons which had influenced the structure and the concentration of the fast-moving
consumer goods retail market in the Republic of Croatia. But, Konzum has also lost a portion
of the market due to the growing influence of other retailers that are becoming its main
competitors (Lidl, Plodine, Kaufland, Spar, Tommy). There are two retailers with the share
between 10 and 20% in the second stratum of the sample, occupying the average 20.9 % of the
entire analysed market. Then follows the stratum with the share between 5 and 10% with three
retailers whose average share on the fast-moving consumer goods retail market in the analysed
period was 23.2 %. Eight retailers belong to the stratum with the market share of 1 – 5%, which
is 16.4% of the entire market. The last stratum in the sample are the firms with the market share
below 1% (19 retailers). Their average market share in the analysed period was 9.4% of the
total market turnover. Table 1 shows that the three leading retailers held the average of 50.9%
of the fast-moving consumer goods retail market in the Republic of Croatia for the observed
period from 2014 – 2018. It is very important to note that, in the same period, the average
market share of the six leading retailers on the same market was 74.1%. Table 2 shows in detail
the movement of the concentration of the fast-moving consumer goods market in the Republic
of Croatia for the period from 2014 – 2018. The Table 2 also shows that the concentration of
the first six retailers was mildly dropping by several percentage points in 2016 compared to the
previous year. It is also evident that the concentration of the six subjects remains almost
unchanged in 2017. But, in 2018, the six leading retailers on the fast-moving consumer goods
retail market in Croatia began to increase their market concentration again. This trend is in line
with a similar concentration trend found in the research by the Croatian Agency for Market
Regulation (AZTN, 2018). This research shows that in 2017, the first five top retailers owned
a little under 2/3 of the Croatian market, while the top ten retailers held just over 4/5 of the
entire retail market of the listed products in Croatia.
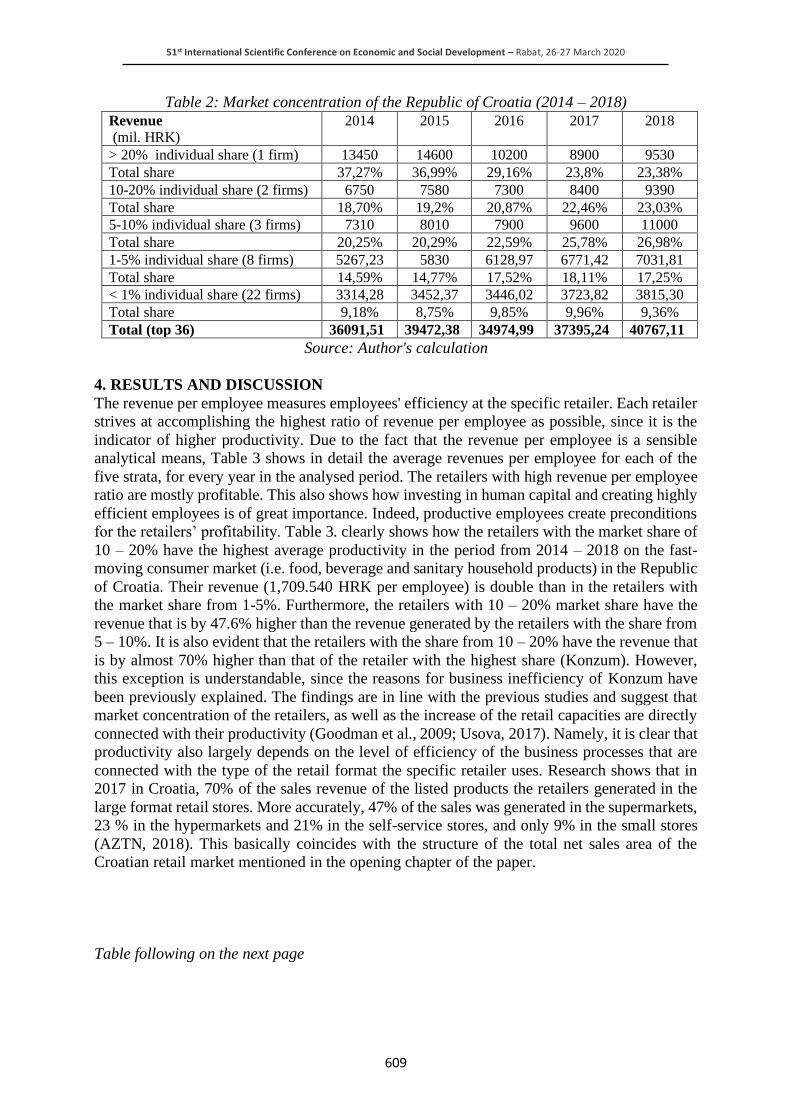
51st International Scientific Conference on Economic and Social Development – Rabat, 26-27 March 2020
609
Table 2: Market concentration of the Republic of Croatia (2014 – 2018)
Revenue
(mil. HRK) 2014 2015 2016 2017 2018
> 20% individual share (1 firm) 13450 14600 10200 8900 9530
Total share 37,27% 36,99% 29,16% 23,8% 23,38%
10-20% individual share (2 firms) 6750 7580 7300 8400 9390
Total share 18,70% 19,2% 20,87% 22,46% 23,03%
5-10% individual share (3 firms) 7310 8010 7900 9600 11000
Total share 20,25% 20,29% 22,59% 25,78% 26,98%
1-5% individual share (8 firms) 5267,23 5830 6128,97 6771,42 7031,81
Total share 14,59% 14,77% 17,52% 18,11% 17,25%
< 1% individual share (22 firms) 3314,28 3452,37 3446,02 3723,82 3815,30
Total share 9,18% 8,75% 9,85% 9,96% 9,36%
Total (top 36) 36091,51 39472,38 34974,99 37395,24 40767,11
Source: Author's calculation
4. RESULTS AND DISCUSSION
The revenue per employee measures employees' efficiency at the specific retailer. Each retailer
strives at accomplishing the highest ratio of revenue per employee as possible, since it is the
indicator of higher productivity. Due to the fact that the revenue per employee is a sensible
analytical means, Table 3 shows in detail the average revenues per employee for each of the
five strata, for every year in the analysed period. The retailers with high revenue per employee
ratio are mostly profitable. This also shows how investing in human capital and creating highly
efficient employees is of great importance. Indeed, productive employees create preconditions
for the retailers’ profitability. Table 3. clearly shows how the retailers with the market share of
10 – 20% have the highest average productivity in the period from 2014 – 2018 on the fast-
moving consumer market (i.e. food, beverage and sanitary household products) in the Republic
of Croatia. Their revenue (1,709.540 HRK per employee) is double than in the retailers with
the market share from 1-5%. Furthermore, the retailers with 10 – 20% market share have the
revenue that is by 47.6% higher than the revenue generated by the retailers with the share from
5 – 10%. It is also evident that the retailers with the share from 10 – 20% have the revenue that
is by almost 70% higher than that of the retailer with the highest share (Konzum). However,
this exception is understandable, since the reasons for business inefficiency of Konzum have
been previously explained. The findings are in line with the previous studies and suggest that
market concentration of the retailers, as well as the increase of the retail capacities are directly
connected with their productivity (Goodman et al., 2009; Usova, 2017). Namely, it is clear that
productivity also largely depends on the level of efficiency of the business processes that are
connected with the type of the retail format the specific retailer uses. Research shows that in
2017 in Croatia, 70% of the sales revenue of the listed products the retailers generated in the
large format retail stores. More accurately, 47% of the sales was generated in the supermarkets,
23 % in the hypermarkets and 21% in the self-service stores, and only 9% in the small stores
(AZTN, 2018). This basically coincides with the structure of the total net sales area of the
Croatian retail market mentioned in the opening chapter of the paper.
Table following on the next page

51st International Scientific Conference on Economic and Social Development – Rabat, 26-27 March 2020
610
Table 3: Revenue per employee in the period 2014-2018 Variables Market share 2014 2015 2016 2017 2018 Mean
Revenue
per
employee
(000 HRK)
> 20% individual
share (top1) 1131,58 1158,55 886,96 848,67 1011,78 1007,51
10-20% individual
share
(2 firms) 1674,55 1738,38 1575,65 1686,05 1873,08 1709,54
5-10% individual
share (3 firms) 1199,6 1089,32 1037,84 1213,97 1250,59 1158,26
1-5% individual
share
(8 firms) 757,26 788,99 771,37 804,13 801,17 784,58
< 1% individual
share
(22 firms) 773,6 765,98 739,69 795,24 783,95 771,69
Total (top 36) 1107,32 1108,24 1002,3 1069,61 1144,11 1086,32
Source: Author's calculation
As has already been mentioned, the main assumption of the research is imbedded in the starting
hypothesis (H): the market share of the retailers in the Republic of Croatia has a statistically
significant influence on their business results (gross/net result per employee). Starting from all
of the above-mentioned facts, we assume that the differences connected with the market shares
of the retailers have a statistically significant influence on the differences regarding their
business success on the Croatian market. We think that there are (statistically) significant
differences in the business result (gross/net revenue per employee) between the Croatian
retailers depending on the percentage of the market share they hold.
Table 4: Gross profit per employee in the period 2014-2018 Variables Market share 2014 2015 2016 2017 2018 Mean
Gross profit
per
employee
(000 HRK)
> 20% (top1) 14,3 23,81 -160,87 -376,67 -29,73 -105,83
10-20%
(2 firms) 39,91 68,33 89,77 98,8 29,94 65,35
5-10%
(3 firms) -6,77 -9,9 -1,83 4,99 10,99 -0,5
1-5%
(8 firms) 21,25 26,03 28,21 36,51 35,53 29,51
< 1%
(22 firms) 14,63 22,46 20,8 25,5 28,33 22,34
Total (top 36) 16,64 26,15 -4,78 -42,7 15,01 2,06
Source: Author's calculation
The main part of the research is conceptualized in such a way that dependent variable represents
the average values of the gross profit per employee of the analysed Croatian retailers in the
period from 2014 – 2018. The gross profit here represents the value gained from subtracting
the costs of goods sold from the total business income. Contrary to that, the independent joint
variable is the market share of the analysed business subjects, being the main measure of the
market concentration. In line with that, Table 4 provides a detailed representation of the
movement of the gross profit per employee for the analysed period, taking into consideration
their market share. Since the main goal of this paper was to investigate the influence of the
Croatian retail market concentration on individual market players i.e. their business results, the
one-way analysis of variance – ANOVA has been used.

51st International Scientific Conference on Economic and Social Development – Rabat, 26-27 March 2020
611
The aim was to determine whether the differences in market share have a statistically significant
impact on the differences connected with the gross profit per employee. We have used
descriptive indicators to present the variables of measurement.
Table 5: Descriptive indicators for gross profit per employee (000 HRK) Variables Market share N Mean Minimum Maximum Std.Dev. Standard
Error
Gros profit
per
employee
(000 HRK)
> 20% 1,00 -105,83 -105,83 -105,83
10-20% 2,00 65,35 26,94 103,76 54,32 38,41
5-10% 3,00 -0,50 -34,99 48,94 43,92 25,36
1-5% 8,00 29,51 4,66 48,70 15,05 5,32
< 1% 22,00 22,35 -11,17 131,14 31,10 6,63
Total (top 36) 36,00 20,86 -105,83 131,14 38,07 6,35
Source: Author's calculation
Table 5 clearly shows that the highest gross profit per employee (M = 65 350 HRK) is generated
by the retailers with the market share of 10 – 20%. These are the same retailers that also
generated the highest revenue per employee. The retailers with the share of over 20% and those
with the share of 5 – 10% generated loss (negative gross profit per employee). The reason for
this negative result of Konzum ( >20%) has already been explained. The other strata of the
retailers (with 5 – 10% share) with the negative gross profit per employee is dominated by two
foreign retail chains (Kaufland and Spar), that have been operating at a loss ever since they
entered the Croatian market (some ten years ago).
Table 6: Values of F-statistics
Effect
Univariate Tests of Significance for TOTAL Sigma-restricted parameterization
Effective hypothesis decomposition
SS Degr. of Freedom
MS F p
Intercept 58,95 1 58,950 0,063666 0,802458
CATEGORIES 22024,77 4 5506,194 5,946652 0,001135
Error 28703,88 31 925,932
Source: Author's calculation
The results acquired with the one-way analysis of variance ANOVA (Table 6) confirm that the
differences in market share have a statistically significant influence on the differences
connected with the business results of the Croatian retailers. Namely, the research findings
suggest that, among the five strata of the retailers grouped according to different market shares,
there is statistically significant difference in the gross profit per employee (F = 5,946 ; p < 0,01).
To confirm the acquired results, we used the Post hoc test (Scheffe). Based on the test results,
we can conclude that there is the largest statistically significant difference between the retailers
that have over 20% market share and with all other groups except those who have 10 – 20%
market share. The results of the research are in line with the results found in the literature which
also support the direct correlation between the market concentration and business success of
the retailers (Hovhannisyan and Bozic 2016; Rickert et al., 2018).
5. CONCLUSION
The processes of globalization, internationalization and concentration of the global economy
are clearly reflected in the movements in retail globally and in Croatia likewise. These processes
have undoubtedly had much influence in determining the structure and the dynamics of the
changes on the Croatian retail market. Namely, the retail in the Republic of Croatia is
characterized by the emergence of new types of retail on one hand, and the growing

51st International Scientific Conference on Economic and Social Development – Rabat, 26-27 March 2020
612
expectations and demands placed before the retailers by the customers on the other. We are the
witnesses of how the Croatian retail market has become internationalized and concentrated,
defined by strong and fast changes and considerably great challenges. The main research focus
of this paper was to look into the influence of the concentration of the Croatian retail market on
the specific market players i.e. their productivity and business results. The author of the paper
primarily wanted to explore the differences in the market share of the Croatian retailers and
how these differences are connected with the differences in their productivity and especially
with the differences in their business results. Therefore, 36 retail firms dealing with the fast-
moving consumer goods (mostly food, beverage and sanitary household products) were
selected. The research included the selected Croatian retailers in the period from 2014 – 2018.
It was important to investigate the influence of the growth of the market concentration on the
business activity of the leading market players, but also the influence of the market
concentration on the retailers with the smaller market share (local and independent retailers).
The paper starts out from the main assumption that on the Croatian retail market, the differences
in the market share of the retailers have a statistically significant influence on the differences
connected with the very business result of the retailers in the Republic of Croatia (gross profit
per employee). Based on the conducted research and the analyses, the results confirm that the
differences in the market share on the Croatian retail market have a statistically significant
influence on the differences connected with the very business results of the retailers. The
findings suggest that there is a statistically significant difference regarding the gross profit per
employee among the five strata of the retailers, grouped according to the different market
shares. The basic limitations to this study concern the unavailability of a more detailed data on
the retailers operating in Croatia. The research was conducted based on an insufficient number
of indicators of the gross profit per employee, which can lead to a simplified conclusion. With
this in mind, future research should encompass more indicators such as: the net result per
employee), ROE (return on equity), ROA (return on total assets), the inventory turnover, etc.
They should also include comparative analyses concerning the market concentration of the
specific NUTS 2 regions in Croatia and also in relation to other EU members, which would be
a logical and scientifically meaningful comparison.
LITERATURE:
1. AZTN, Croatian Agency for Market Regulation (Agencija za zaštitu tržišnog natjecanja),
(2018). Prikaz tržišta trgovine na malo mješovitom robom, pretežno hranom, pićima i
higijenskim proizvodima za domaćinstvo u Republici Hrvatskoj u 2018. Retrieved
12.02.2020 from http://www.aztn.hr/ea/wp-content/uploads/2019/07/PRIKAZ-STANJA-
TRGOVINA-2018.pdf.
2. Bronnenberg, B.J. and Ellickson, P.B. (2015). Adolescence and the Path to Maturity in
Global Retail. Journal of Economics Perspectives, 29(4), pp. 113-134.
3. Burt, S., Dawson, J. and Sparks, L. (2003). Failure in International Retailing: Research
Propositions. International Review of Retail, Distribution and Consumer Research, 13(4),
pp. 355-373.
4. Caves, R. E. (1971). International corporations: The industrial economics of foreign
investment. Economica, 38(149), pp. S-6.
5. Chang, S. J. (1995). International expansion strategy of Japanese firms: capability building
through sequential entry. Academy of Management Journal, 38(2), pp. 383–407.
6. Dawson, J. (2006). Retail Trends in Europe. In Kraft, M., Mantrala, M. K. (Eds.), Retailing
in the 21st Century (pp. 41-58). Berlin: Springer.
7. Deloitte, Global Powers of Retailing 2019, Retrieved 17,01,2020 from
https://www2.deloitte.com/content/dam/Deloitte/global/Documents/Consumer-Business/
cons-global-powers-retailing-2019.

51st International Scientific Conference on Economic and Social Development – Rabat, 26-27 March 2020
613
8. Dimitrova, B., Kim, S. and Smith, B. (2019). Performance of International Retailers:
Empirical Evidence of an S-Curve Relationship, Journal of Global Marketing, 32(3), pp.
154-176.
9. Etgar, M. and Rachman-Moore, D. (2008). International expansion and retail sales: an
empirical study. International Journal of Retail & Distribution Management, 36(4), pp.
241-259.
10. Gomes, L. and Ramaswamy, K. (1999). An empirical examination of the form of the
relationship between multinationality and performance. Journal of International Business
Studies, 30(1), pp. 173-187.
11. Goodman, C., Kachur, S.P., Abdulla, S., Bloland, P. and Mills, A. (2009). Concentration
and drug prices in the retail market for malaria treatment in rural Tanzania. Health
Economics, 18(6), pp. 727-742.
12. Hino, H. (2014). Shopping at different food retail formats. European Journal of Marketing,
48(3/4), pp. 674 -698.
13. Hitt, M. A., Tihanyi, L., Miller, T. and Connelly, B. (2006). International Diversification:
Antecedents, Outcomes, and Moderators. Journal of management, 32(6), pp. 831–867.
14. Hoppner, J. J. and Griffith, D. A. (2015). Looking back to move forward: A review of the
evolution of research in international marketing channels. Journal of Retailing, 91(4), pp.
610-626.
15. Hovhannisyan, V. and Bozic, M. (2016). The effects of retail concentration on retail dairy
product prices in the United States. Journal of Dairy Science, 99(6), pp. 4928-4938.
16. Klein, A., Schmitz, G. (2016). Main-format dominance in consumers’ FMCG cross-format
shopping patterns. Journal of Retailing and Consumer Services, Vol. 30, pp. 105-115.
17. Kosała, M. (2015). Innovation Processes as a Stimulant of Internationalisation Process of
Firms. Entrepreneurial Business and Economics Review, 3(2), pp. 65-84.
18. Lloyd, T. A., McCorriston, S. and Morgan, C. W. (2015) Experience of food infation across
the EU, In McCorriston, S. (ed.), Food Price Dynamics and Price Adjustment in the EU.
Oxford: Oxford University Press.
19. Maruyama, M., Wu, L. and Huang, L. (2016). The modernization of fresh food retailing in
China: The role of consumers. Journal of Retailing and Consumer Services, Vol. 30, pp.
33-39.
20. Mohr, A. and Batsakis, G. (2014). Intangible assets, international experience and the
internationalisation speed of retailers. International Marketing Review, 31(6), pp. 601-620.
21. Ojima, M., Shino, J. and Ueda. K. (2018). Retailer Market Concentration, Buyer-
Sizediscounts and Inflation Dynamics, The Japanese Economic Review, 69(1), pp. 101-127.
22. Papadopoulos, N. and O. Martin Martin. 2011. International market selection and
segmentation: Perspectives and challenges, International Marketing Review, 28(2), pp. 183-
200.
23. Reinartz, W., Dellaert, B., Krafft, M., Kumard, V. and Varadarajan, R. (2011). Retailing
Innovations in a Globalizing Retail Market Environment. Journal of Retailing, 87(1), pp.
53-66.
24. Rickert, D., Schain, J.P. and Stiebale, J. (2018). Local market structure and consumer
prices: Evidence from a retail merger. DICE Discussion Paper, 1-47; 280;
http://hdl.handle.net/10419/173247.
25. Shi, Y., Lim, J. M., Weitz, B. A. and France, S. L. (2018). The impact of retail format
diversification on retailers’ financial performance. Journal of the Academy of Marketing
Science, 46(1), pp. 147-167.
26. Smith, B., Rippe, C. B. and Dubinsky, A. J. (2018). India’s lonely and isolated consumers
shopping for an in-store social experience. Marketing Intelligence & Planning, 36(7), pp.
722-736.

51st International Scientific Conference on Economic and Social Development – Rabat, 26-27 March 2020
614
27. Sundaram, A. K. and Black, J. S. (1992). The environment and internal organization of
multinational enterprises. Academy of Management Review, 17(4), pp. 729-757.
28. Swoboda, B., Morbe, L. and Hirschmann, J. (2018). International strategy’s effects on
retailers’ local implementation and performance. International Business Review, 27(3), pp.
642-653.
29. Tordjman, A. (1995). European Retailing: convergences, differences and perspectives. In
P.J. McGoldrick, P.J., Davies, G. (Eds.) International Retailing (pp. 17-42). London:
Pitman Publishing.
30. Treadgold, A.D. (1991). The emerging internationalization of retailing: Present status and
future challenges, Irish Marketing Review, 5(2), pp. l-27.
31. Usova, N.V. (2017). Identification of consumer development trends in a major city: a
market-based approach. R-economy, 3(1), pp. 50-58.
51st International Scientific Conference on Economic and Social Development – Rabat, 26-27 March 2020
615
TAXATION OF LUXURY GOODS
Maris Juruss
Riga Technical University
Kalnciema str. 6, Riga, Latvia
Janis Brizga
University of Latvia
Raiņa bulvāris 19, Rīga, Latvia
Liga Gasune
Riga Technical University
Kalnciema str. 6, Riga, Latvia
Valerijs Skribans
Riga Technical University
Kalnciema str. 6, Riga, Latvia
ABSTRACT
Countries are engaged in a tax competition that leads to a reduction of the budget revenue. The
aim of this research is to evaluate taxation of the luxury goods, to evaluate their potential
distributional effect and types of goods to be taxed. Results demonstrate that tax on luxury
goods could be used to compensate the reduction of tax revenues. The tax on luxury goods
would reduce the regressive tax burden of consumption taxes. However, there is a need for
more studies of what goods could be considered a luxury as well as how to organize tax
administration in open markets.
Keywords: consumption tax, luxury goods, tax on luxury goods, the tax burden
1. INTRODUCTION
Due to globalization, countries have been engaged in a tax competition that leads to a reduction
of the tax burden in order to attract investors and make taxpayers more competitive. As a result,
state budget revenues are falling. It needs to be compensated by an increase of other taxes. The
most popular taxes are taxes on consumption, such as excise taxes or environmental taxes.
However, such opportunities are limited by the purchasing power of consumers and the
expansion of the illicit market. Environmental taxes cannot significantly contribute to the state
revenues and in many cases have an adverse effect on low-income earners (Juruss & Brizga,
2017). In 2014, taxes on labour in OECD countries constituted the largest tax revenue share
with total amount 59.9% (taxes on income and profit accounted for 33.7% and social security
contributions accounted for 26.2%). The revenue share coming from taxes on goods and
services was 32.6% (consumption taxes amounted to 30.5%). This proportion has not
significantly changed for the last 35 years, there were only some changes on components of the
tax burden on labour - tax burden on income and profit from 1980 to 2009 decreased and
simultaneously tax burden on social security contributions increased (OECD, 2016). In
addition, one of the challenges facing the world is income inequality. For example, average
GINI coefficient of income inequality in OECD countries in the mid-1980s was 0.29 but by
2013 it had increased in 17 of 22 OECD countries by 10% to 0.32 (OECD, 2015).
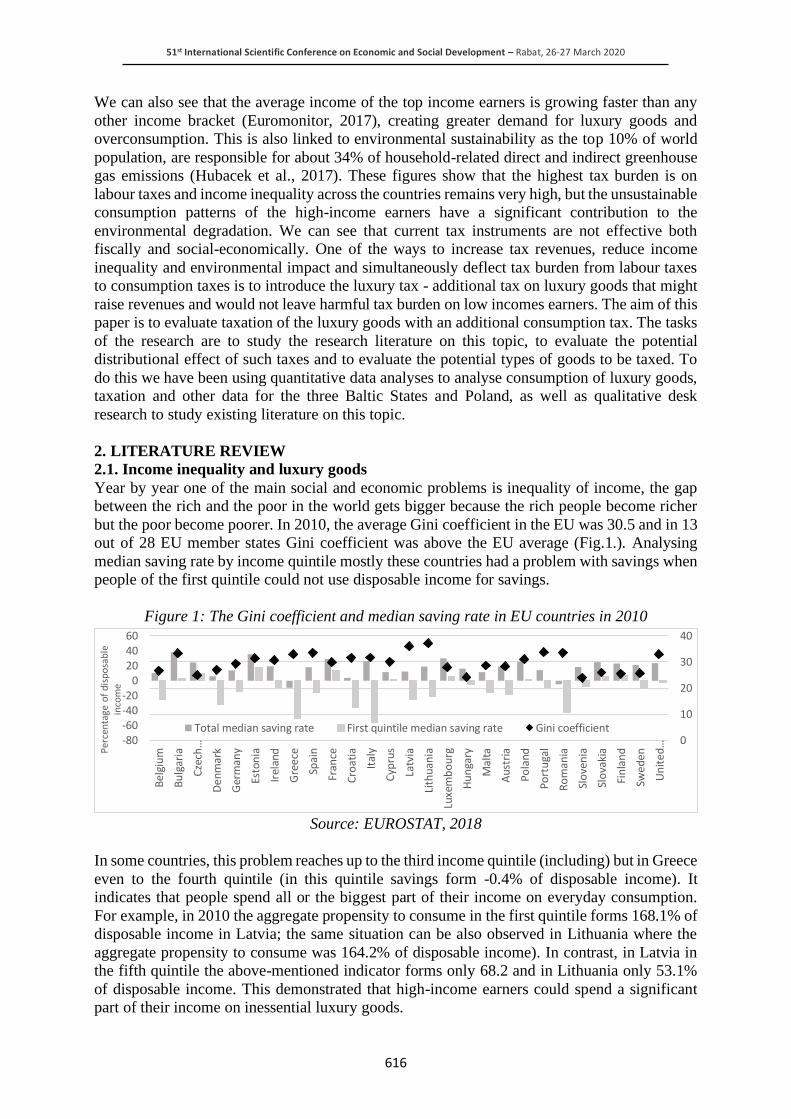
51st International Scientific Conference on Economic and Social Development – Rabat, 26-27 March 2020
616
We can also see that the average income of the top income earners is growing faster than any
other income bracket (Euromonitor, 2017), creating greater demand for luxury goods and
overconsumption. This is also linked to environmental sustainability as the top 10% of world
population, are responsible for about 34% of household-related direct and indirect greenhouse
gas emissions (Hubacek et al., 2017). These figures show that the highest tax burden is on
labour taxes and income inequality across the countries remains very high, but the unsustainable
consumption patterns of the high-income earners have a significant contribution to the
environmental degradation. We can see that current tax instruments are not effective both
fiscally and social-economically. One of the ways to increase tax revenues, reduce income
inequality and environmental impact and simultaneously deflect tax burden from labour taxes
to consumption taxes is to introduce the luxury tax - additional tax on luxury goods that might
raise revenues and would not leave harmful tax burden on low incomes earners. The aim of this
paper is to evaluate taxation of the luxury goods with an additional consumption tax. The tasks
of the research are to study the research literature on this topic, to evaluate the potential
distributional effect of such taxes and to evaluate the potential types of goods to be taxed. To
do this we have been using quantitative data analyses to analyse consumption of luxury goods,
taxation and other data for the three Baltic States and Poland, as well as qualitative desk
research to study existing literature on this topic.
2. LITERATURE REVIEW
2.1. Income inequality and luxury goods
Year by year one of the main social and economic problems is inequality of income, the gap
between the rich and the poor in the world gets bigger because the rich people become richer
but the poor become poorer. In 2010, the average Gini coefficient in the EU was 30.5 and in 13
out of 28 EU member states Gini coefficient was above the EU average (Fig.1.). Analysing
median saving rate by income quintile mostly these countries had a problem with savings when
people of the first quintile could not use disposable income for savings.
Figure 1: The Gini coefficient and median saving rate in EU countries in 2010
Source: EUROSTAT, 2018
In some countries, this problem reaches up to the third income quintile (including) but in Greece
even to the fourth quintile (in this quintile savings form -0.4% of disposable income). It
indicates that people spend all or the biggest part of their income on everyday consumption.
For example, in 2010 the aggregate propensity to consume in the first quintile forms 168.1% of
disposable income in Latvia; the same situation can be also observed in Lithuania where the
aggregate propensity to consume was 164.2% of disposable income). In contrast, in Latvia in
the fifth quintile the above-mentioned indicator forms only 68.2 and in Lithuania only 53.1%
of disposable income. This demonstrated that high-income earners could spend a significant
part of their income on inessential luxury goods.
-80-60-40-20
0204060
Bel
giu
m
Bu
lgar
ia
Czech…
Den
mar
k
Ger
man
y
Esto
nia
Irel
and
Gre
ece
Spai
n
Fran
ce
Cro
atia
Ital
y
Cyp
rus
Latv
ia
Lith
uan
ia
Luxe
mb
ou
rg
Hu
nga
ry
Mal
ta
Aus
tria
Po
land
Port
uga
l
Ro
man
ia
Slo
ven
ia
Slo
vaki
a
Fin
lan
d
Swed
en
United
… 0
10
20
30
40
Per
cen
tage
of
dis
po
sab
le
inco
me
Total median saving rate First quintile median saving rate Gini coefficient
51st International Scientific Conference on Economic and Social Development – Rabat, 26-27 March 2020
617
Inequality and luxury goods have existed for centuries (Som & Blanckaert, 2015); however,
there is no one clear definition of luxury. One of the most commonly used definitions is that
luxury goods are goods for which the usage or display of a particular branded product provides
status or prestige to its owner along with any functional utility (Grossman & Sharpiro, 1988).
Status symbols the goods are providing, of course, are important not only for the high-income
earners; however, they have more means to satisfy these needs. In different cultures,
consumption patterns can be different, which are influenced by various factors, for example, in
Arab culture individual’s exhibit an affiliation-oriented nature whereby collective interests and
family and group values are set as a priority compared to one’s private life. In any case, in Arab
culture, strong religion and culture boundaries exist and consumers do not purchase luxury
products due to poor lifestyle, social status and low salary. However, Arab consumers are
willing to buy conspicuous products that demonstrate social rank (Farah & Fawaz, 2016). In
the luxury goods industry, different risk factors should be considered, like smuggling and
counterfeiting. Luxury brands are one of the main targets for counterfeiting. It is an expanding
and increasingly important issue in contemporary markets that have an impact on luxury
branded goods. Counterfeiting is a really huge issue to luxury brands’ products because then
they become more common and luxury brands lose its status, quality and uniqueness compared
of other brands (Gistri et al., 2009). The quality, materials and high price are the major factors
that make luxury brands so luxury. Most people use luxury brands because it delivers the
highest sentimental and ideational value and fulfils their needs of self-esteem. In addition,
luxury brands serve to provide respect and recognition from others and demonstrate person’s
achievements in life (Scholz, 2014). It will be optimal to find out those goods that are consumed
primarily to display the owner's wealth and these defined goods charge the luxury tax (Griffith,
2003). Nowadays, luxury goods refer both to luxury for personal use and are the aggregation
of designer apparel and footwear (ready-to-wear), luxury bags and accessories (including
eyewear), luxury jewelry and watches, and premium cosmetics and fragrances, as well as
typical luxury goods as expensive cars, travel and leisure services, boating and yachts, fine art
and collectables, and fine wines and spirits. Global luxury goods sales have been growing by
4% in constant terms reached USD 954 billion in 2017 (Euromonitor, 2018). The fastest
growing luxury goods markets are in the Asia Pacific, the Middle East and Africa. Top five
luxury goods markets are USA, China, Japan, Germany and United Kingdom. In Germany
market size of luxury goods grows rapidly because German consumers’ the perception of luxury
consumption has improved and they have started to increase their spending on personal luxury
goods. (Shane, 2017). Luxury cars remain the cornerstone of the industry with sales accounting
for almost 53% of all global luxury goods sales in 2017, followed by designer clothing and
footwear (13%), fine wines/champagne and spirits (7%), luxury jewellery and watches (7%)
(Euromonitor, 2018). The healthy and sustainable living is also becoming the new wealth
symbol. It is becoming increasingly important also for luxury brands to increase their social-
ecological stances. The world’s 100 largest luxury goods companies generated sales of USD
212 billion in the financial year 2015. The total average luxury goods annual sales for a top 100
companies in 2015 was USD 2.1 billion. In 2015, the biggest average size of companies by
luxury goods sales (in the amount of USD 6.3 billion) was luxury goods companies that sell
multiple luxury goods (companies with substantial sales in more than one product sector). The
least average size of companies by luxury goods sales was apparel and footwear companies
(USD 1 billion) (Deloitte, 2017). In 2015, LVMH Moët Hennessy Louis Vuitton S.E. took the
first place in the sales ranking of Top 100 luxury goods companies and this company’s luxury
goods sale grew by 15.2%. Compagnie Financière Richemont SA and The Estée Lauder
Companies Inc ranked second and third and their sales grew by 6.4 and 4.5% accordingly
(Deloitte, 2017) (Table 1).

51st International Scientific Conference on Economic and Social Development – Rabat, 26-27 March 2020
618
Table 1: Profile of top 5 luxury product sectors in 2015
No Question Number of
companies
Luxury goods sales growth compared
to the previous fiscal year, %
1. Apparel and footwear 41 4.4
2. Bags and accessories 10 13.4
3. Cosmetics and fragrances 10 6.5
4. Jewellery and watches 28 2.0
5. Multiple luxury goods 11 10.8
Source: Deloitte, 2017
2.2. Classification of luxury goods taxes
Taxing luxury goods is not a new idea. One of the biggest booms in taxing luxuries was after
the First World War. At that time the main purpose of these taxes was to raise additional
resources for destroyed economies. However, the purpose of the luxury tax is not only fiscal
but also to repress undesirable and extravagant expenditure and improve income equality.
Nevertheless, luxury taxes could take different forms, e.g. of differentiated income tax, property
taxes or consumption-based taxes, e.g. differentiated value-added tax or tax on specific products
(chocolate, luxury brands, jewelry and watches etc.) (See Table 2.).
Table 2: Principles of luxury taxation
Base Over-income Wealth Extra-consumption
Type of tax Income tax
Property taxes
Value-added tax
Excise duty
Import duty
Other consumption taxes
Examples Progressive personal
income tax (wage,
dividend, interest) Taxes on gambling
The progressive real
estate tax
Progressive vehicles taxes (luxury cars,
yachts etc.)
Capital tax
Differentiated value-added tax
Tax on specific products
(chocolate, luxury brands, jewellery, watches, etc.)
Source: by the authors
The idea behind the luxury tax is that the most remote from necessity must be the most heavily
taxed (Orain, 2010). It could be luxury cars (Beijing Review, 2013) which account for the most
of the luxury expenditures. In European countries it is common to use taxes if they’re connected
with good and luxury life, for example, paintings, musical instruments, furniture, etc., what
people actually do not need as the main necessity. In France photographs, jewellery, antiques,
sporting games, mechanical pianos, motor cars, billiard tables, perfumes, sculptures, yachts,
silk underwear, liqueurs, watches, etc. were believed to be obvious luxuries. General articles
such as clothing became a luxury when the price exceeded a certain sum. Other countries had
also included a miscellaneous assortment of additional excise taxes (Bogart, 1919). It could be
also as a tax on aggregate professional sports player salary expenditures above a specified level
(Kaplan, 2004). It is rational to collect taxes according to different consumption models because
the consumption tax on luxury goods is aimed at consumption at a higher level than usual and
it does not affect consumption of everyday products. However, tax on luxury goods
consumption is an ineffective solution to narrow down the gap between the rich and the poor
both in the short and the long term. Tax on luxury goods can have an effect on people with
middle income if they buy luxury products thus such a tax can affect relatively poor (Beijing
Review, 2010). Therefore, target groups of the luxury tax can differ and some of the affordable
luxuries, e.g. chocolate is already taxed in many countries with excise duty.
51st International Scientific Conference on Economic and Social Development – Rabat, 26-27 March 2020
619
3. METHODS
The reason for the introduction of luxury tax should be not only to raise additional state
revenues but also to ensure social economic and environmental impact. As there is still very
high inequality in many countries (OECD, 2015), luxury taxes would be as one of the tools for
redistribution. There are two directions of taxation of luxury: taxing income or expenditure. As
rich persons buy luxury goods more, it would be logical to tax income of rich persons more or
apply progressive income tax. Another option is to tax expenses of rich behaviour or in other
words apply a luxury tax on consumption of rich progressively. There are indirect taxes – value-
added tax, excises or others, which are paid by taxpayers (traders, producers) and therefore tax
burden is actually passed to persons purchasing the specific goods. Real estate or other property
like exclusive luxury cars, yachts or any other such property could be taxed as well. To
understand the impact of taxes a method of assessment of consumption tax burden, which was
developed by Jurušs and discussed in his doctoral theses, can be used (Jurušs, 1999). The
method is based on the theory of consumption by John Maynard Keynes, particularly to a
concept of the marginal propensity to consume (MPC). The method is described in more detail
in a publication about tax policy impact on income inequality in Latvia (Jurušs, 2016). This
method allows to describe the nature of changes of tax burden depending on the level of income,
however, in practice, there might be limitations, exceptions and anomalies affecting
consumption and income. For example, there may be cases where an individual's behaviour is
different for various reasons, and thus a particular case may also have a different result. The
results may be affected also by other factors such as illegal economic trends (Jurušs, 1999).
This method can be applied in practice to compare tax burden of various income level (or
quintile groups) by observation of disposable income and consumption. Particularly,
consumption tax burden on a specific level of income can be calculated by the following
formula:
Tcn = Tca (Cn /Ca) / (In / Ia) (1)
where:
Tcn – consumption tax burden on a specific level of income,
Tca – average consumption tax burden,
Cn – consumption of specific level of income,
Ca – average consumption,
In – income of specific level of income,
Ia – average income.
In the case study to create a methodology for luxury tax estimation model, consumption tax
burden estimation was used. Data from the Central Statistical Bureau about income and
expenditures of one person in a household by quintile was used for this model (CSP, 2017) and
consumption tax revenue in Latvia (Eurostat, 2017). The methodology consists of three steps:
• The first step is to find out the current tax burden (before) of consumption tax according to
the data on consumption tax revenue by quintile and by income and expenditure;
• Second step – to determinate luxury expenditure and then find out the tax burden (after) of
luxury tax;
• Finally – estimate the impact on the tax burden of luxury tax by quintile before and after
luxury expenditure determination.
4. RESULTS
In this case study, the tax burden on consumption by income quintile groups with and without
luxury tax in the Baltic States (Estonia, Latvia, and Lithuania) and Poland is analysed.

51st International Scientific Conference on Economic and Social Development – Rabat, 26-27 March 2020
620
The luxury expenditure was determined by determination of the difference between the
expenditure of fourth and fifth quintile. Then the luxury tax at the rate of 10% was applied (as
an additional tax to general consumption taxes). Fig. 2 shows changes in the tax burden of
consumption taxes before and after determination of luxury expenditure. In this case study
applying the luxury tax of 10%:
Figure 2: The tax burden on consumption without luxury tax and with luxury tax by income
quintile groups in the Baltic States and Poland (2010)
Source: author’s calculations (based on data from EUROSTAT, 2010)
• In Estonia, the consumption tax burden in the fourth quintile increased by 2.2% and in the
fifth quintile by 2.5%. Tax revenue on production and imports increased by 9%;
• In Latvia, the consumption tax burden in the fourth quintile increased by 1.9% and in the
fifth quintile by 2.3%. In this case study, the biggest tax revenue from production and
imports increase was in Latvia (12%);
• In Lithuania, the consumption tax burden increased by 2% (in the fourth quintile) and by
1.6% (in the fifth quintile). Revenue from taxes on production and imports increased by
9%;
• In Poland, the consumption tax burden increased by 1.6% (in the fourth quintile) and by
2.7% (in the fifth quintile) and revenue from taxes on production and imports increased by
8%.
5. DISCUSION
Economic growth involves two aspects of sustainability. One of them is the need to use
increasing quantities of resources to produce higher growth. The second aspect - during growth
there is an additional problem of maintaining a balance between the consumption of the rich
and the poor. If the economy grows rapidly, some groups of the population have more than
proportionate rise in income and this leads to an increased production of luxury goods. Since
the production of luxury goods often requires more resources, it may reduce not only the
production of necessary goods but also total production. When an economy experiences initial
growth, the high-income earners utilize the growth opportunity better than the low-income
earners, leading to increased income inequality.

51st International Scientific Conference on Economic and Social Development – Rabat, 26-27 March 2020
621
This inequality increases the demand for luxury goods. The resultant change in the resource
allocation may threaten the sustainability of the consumption level of the poor (Datta, 2014).
Luxury tax could help diminishing these misbalances, but it is necessary to continue the
discussion and study whether and for which goods a luxury tax should be introduced. The tax
and terms of the tax may vary between developed and developing countries. The main purpose
of the luxury tax is not the fiscal, but rather distributional aspects and drive for more sustainable
consumption patterns by taxing non-essential goods. However, the risk of growing illegal
markets should be taken into account, as additional taxes will increase prices and people will
want to buy it illegally or in other markets. In this respect, international cooperation and access
would be required, for example, at the European Union level. A practical solution could be to
increase VAT on specific goods. Most countries use both income taxes and expense taxes, e.g.
VAT and excise taxes. Therefore, there are options to choose one or the other way to apply a
differentiated higher tax to particular goods affecting some of the social groups. The luxury tax
is one of these options. It is possible to avoid both income and expense taxes, and therefore tax
evasion argument is not so important when considering one or the other approach. In addition,
income taxes related to labour supply, which means they have a more significant impact on
economic growth. A luxury tax on consumption could be politically easier to approve.
Moreover, luxury goods are not essential commodities and their demand is inflexible, so price
changes would have less effect on their consumption, thus ensuring more revenue to the state
budgets. Literature analysis and our case study shows that the additional tax on luxury goods
could be one of the alternatives to compensate the reduction of income tax revenues due to tax
competition in the global market. The additional tax burden on luxury goods would reduce the
regressive tax burden caused by consumption taxes because such luxury taxes would affect the
rich persons. However, there is no clear unified understanding, which products, services, and
lifestyles could be considered as a luxury (Wiedmann et al., 2009). A direct implication is that
luxury taxes are inefficient tools for achieving distributive objectives (Kaplow, 2011). The
expenditures by households are different because poor households’ expenditure is based on
their needs but richer households can afford more luxury goods. If most consumption taxes
were levied on luxury goods, it would be necessary to conclude that they are fundamentally
redistributive (Beramendi & Rueda, 2007). Another remedy, if only applied in time, is the
imposition of excise taxes instead of tariffs on luxury goods. The luxury tax for goods that are
not produced at home functions just like a tariff that is collected on imported goods. However,
the luxury tax has equal impact on foreign and home production; inefficient domestic
production is not stimulated but at the same time, there are no barriers to efficient domestic
production that could compete with the world market (Harberger, 1990). Income inequality is
caused by unemployment, emigration and demographic change. However, a significant impact
on income inequality is created by an unfair tax policy and an inefficient system of revenue
redistributions, social transfers and benefits that are unable to offset the adverse effects of the
unfair tax policy. Persons with lower incomes spend proportionally a much bigger part of their
income on consumption than persons with higher income, which means that persons with low
income have the heaviest consumption tax burden (Jurušs, 2016). Therefore, changes in
taxation principles are vitally important to create fair tax policy and minimise income
inequality.
6. CONCLUSION
Commodity taxes must be combined with the application of other taxes and depend on, for
example, the existence of a proportional or linear income tax or a progressive or non-linear
income tax, including taxation of luxury goods. If governments use proportional or linear
taxation, taxation of commodity goods at lower rates than luxury goods, have a positive effect
on equity but have unclear efficiency effect.
51st International Scientific Conference on Economic and Social Development – Rabat, 26-27 March 2020
622
However, in case of optimal non-linear income taxation, commodity taxes should be uniform,
even if there are people with limited income (Boadway & Song, 2016). However, there is also
the view that commodity taxes would not be the right policy tool to separate entertainment and
other goods. Commodity taxes can be used for efficiency reasons in order to stimulate labour
supply and thus offset the distortions of the income tax on labour supply (Bastani et al., 2016).
There is a need for further studies to better understand some of the aspects of taxing luxury
goods and how it could affect inequality, tax administration and state revenue:
1) First, there is a need to draw a clear line which goods and when we can identify as a luxury,
as there are social and cultural differences among countries;
2) Second, there is a need for more in-depth studies to understand which taxes are best to use
as well as how to organize tax administration in open markets if there is no common tax
harmonization;
3) Third, the methodology should be developed for luxury tax’ estimation models per specific
luxury goods.
ACKNOWLEDGEMENT: Participation in the conference was funded by European Regional
Development Fund (ERDF), Measure 1.1.1.5 “Support to international cooperation projects
in research and innovation of RTU”. Project No. 1.1.1.5/18/I/008. The research has been
prepared by the experts of Riga Technical University, University of Latvia and was partly
supported by the European Social Fund Operational Programme “Growth and Employment”,
Post-doctoral Research project “Developing new tools for the Sustainability Assessment of the
Bioeconomy”.
LITERATURE:
1. Bastani, S., Blomquist, S., Micheletto, L. (2016). Optimal commodity taxation with varying
quality of goods. Research in Economics, Volume 70, Issue 1, Pages 89-100, ISSN 1090-
9443, https://doi.org/10.1016/j.rie.2015.11.005.
2. Beijing Review (2010). Is a Luxury Goods Consumption Tax Useful? 53(25), 46.
3. Beijing Review (2013). Tax on Luxury Cars. 56 (24), 11.
4. Beramendi, P. & Rueda, D. (2007). Social democracy constrained: indirect taxation in
industrialized democracies. British Journal of Political Science, 37(4), 619-641. DOI:
10.1017/S0007123407000348
5. Boadway, R.& Song, Z. (2016). Indirect taxes for redistribution: Should necessity goods
be favored? Research in Economics, Volume 70, Issue 1, Pages 64-88, ISSN 1090-9443,
https://doi.org/10.1016/j.rie.2015.06.002.
6. Bogart, E. L. (1919). Luxury taxes. The Bulletin of the National Tax Association, 4(9), 237-
239.
7. CSP (2017). General statistic. Central Statistical Bureau in Latvia. Retrieved from:
http://www.csb.gov.lv/
8. Datta, D. (2014). Economic growth and the problem of balancing consumption between
rich and poor. Economic Analysis and Policy 44, 85-94. DOI: 10.1016/j.eap.2014.02.002
9. Deloitte (2017). The fourth Global Powers of Luxury Goods 2017. The new luxury
consumer. Retrived from:
https://www2.deloitte.com/content/dam/Deloitte/global/Documents/consumer-industrial-
products/gx-cip-global-powers-luxury-2017.pdf
10. Euromonitor (2017). Consumer Expenditure by Income.
11. Euromonitor (2018). The world market for luxury goods.
12. Eurostat (2010, 2018). Eurostat database. European Commission. Retrieved from:
http://ec.europa.eu/eurostat/web/main

51st International Scientific Conference on Economic and Social Development – Rabat, 26-27 March 2020
623
13. Eurostat (2017). Tax revenue. Retrieved from: http://ec.europa.eu/eurostat/statistics-
explained/index.php/Tax_revenue_statistics#Database
14. Farah, M. F., & Fawaz, R. S. (2016). A Comparison of the Influence of Personal and
Cultural Values on the Consumption of Luxury Goods across Arab Regions: Levant versus
Gulf. Contemporary Management Research, 12(2), 139-167. doi:10.7903/cmr.15067
15. Gistri, G., Romani, S., Pace, S., Gabrielli, V., & Grappi, S. (2009). Consumption practices
of counterfeit luxury goods in the Italian context. Journal of Brand Management, 16(5-6),
364-374. DOI:10.1057/bm.2008.44.
16. Griffith, T. D. (2003). Progressive taxation and happiness. BCL Rev., 45, 1363.
17. Grossman, G.M. & Sharpiro, C. (1988). Counterfeit-product trade. The American
Economic Review, 78, 59-75.
18. Harberger, A. C. (1990). Principles of taxation applied to developing countries: what have
we learned. World Tax Reform: Case Studies of Developed and Developing Countries, 25-
46.
19. Hubacek, K., Baiocchi, G., Feng, K., Castillo, R.M., Sun, L. and Xue, J. (2017). Global
carbon inequality. Energy, Ecology and Environment, 2(6), pp.361-369.
20. Jurušs, M. (1999). Nodokļu sistēmas teorētiskie pilnveidošanas aspekti. (in English:
Theoretical aspects of tax system development). Doctoral theses. Riga: RTU.
21. Jurušs, M. (2016). Tax policy impact on income inequality in Latvia. Daugavpils
Universitātes 58. Starptautiskās zinātniskās konferences rakstu krājums, 100.
22. Juruss, M., Brizga, J. (2017). Assessment of the Environmental Tax System in Latvia.
NISPAcee Journal of Public Administration and Policy, 10(2), pp.135-154.
23. Kaplan, R. A. (2004). The NBA luxury tax model: A misguided regulatory regime. Columbia
Law Review, 104(6), 1615-1650.
24. Kaplow, L. (2011). The theory of taxation and public economics. Princeton University
Press.
25. OECD (2015). In it Together: Why Less Inequality Benefits All, OECD Publishing, Paris.
http://dx.doi.org/10.1787/9789264235120-en
26. OECD (2016). Revenue Statistic 2016, OECD Publishing, Paris.
http://dx.doi.org/10.1787/9789264283183-en
27. Orain, A. (2010). Progressive indirect taxation and social justice in eighteenth-century
France: Forbonnais and Graslin's fiscal system. The European Journal of the History of
Economic Thought, 17(4), 659-685.
28. Scholz, L. (2014). Brand management and marketing of luxury goods. Anchor Academic
Publishing (aap_verlag).
29. Shane, N. (2017). The Country-of-Origin Effect and its Potential Impact on How German
Consumers Perceive Chinese Luxury Goods.
30. Som, A., & Blanckaert, C. (2015). Luxury: concepts, facts, markets and strategies. John
Wiley & Sons, Incorporated, Singapore.
31. Wiedmann, K., Hennigs, N., & Siebels, A. (2009). Value-based segmentation of luxury
consumption behavior. Psychology and Marketing, 26(7), 625-651.
DOI:10.1002/mar.20292
51st International Scientific Conference on Economic and Social Development – Rabat, 26-27 March 2020
624
TESTING THE IMPACT OF GLOBAL FINANCIAL CRISIS ON
GLOBAL TRADE INTEGRATION
Ahliman Abbasov
Azerbaijan State University of Economics, Azerbaijan
ABSTRACT
The end of the Cold War, technological progress and vast trade liberalization intensified the
global trade integration since the end of 1980s. But the rapid growth of global trade halted as
the global financial crisis erupted in 2008. Some researches claim that post-crisis rising
protectionism and cyclical factors have been the main reason behind the slow growth of global
trade since the financial crisis. Cyclical factors are the ones that have ocurred in relation with
2008-2009 crisis and had only short-term impact on the global trade level. But some also point
out the role of structural changes of global economy on the weakened world trade. This paper
estimates the role of 2008-2009 financial crisis on the weakening of global trade integration
using Panel ARDL model. The estimation results reflects that the global financial crisis had
both short run and long run negative impact on trade globalization. But the long impact of
financial crisis have been much stronger than its short run impact on trade integration.
Keywords: Crisis, Financial, Global, Impact, Integration, Trade
1. INTRODUCTION
The end of Cold War, technological progress and liberalization of trade policies intensified the
integration of global trade since the end of 1980s. This process of rapid trade globalization
played an important role on the economic development of many countries. Liberalization of
global trade policies caused the expansion of global supply chains and gradual change of
geographical location of global production. But the onset of global financial crisis in 2008
halted the decades of rapid growth of global trade integration. The growth rate of global trade
had been around 7 per cent until the begining of the global financial crisis, it reduced to 3 per
cent during 2008-2014, and decreased even further during 2015-2016. Two decades until the
global financial crisis global trade growth had been almost 2 times higher than the global output
growth. But global trade and output started to grow by similar rates after the Great Recession.
Some researches claim that post-crisis rising protectionism and other cyclical factors have been
the main reason behind the slow growth of global trade. Cyclical factors are the ones that have
ocurred in relation with 2008-2009 crisis and had only short-term impact on the global trade
level. But some authors also point out the role of structural changes of global economy on the
weakened world trade. Defenders of this view claim that as a result of trade policy liberalisation,
technological advancement, rapid expansion of global value chains and deepening globalization
of developing countries from mid 1990s until mid 2000s global trade experienced its
unprecedented development period. But as this processes have come close to its full capacity,
world trade will not show its initial high growth pace without any fundamental changes in
technology. In this paper, I aim to evaluate the role of 2008-2009 financial crisis on slow global
trade growth. I use panel data regression with 41 countries and period of 2000-2016. The next
section presents the model and data of the regression. 3rd section presents the methodology of
the estimation. Results are discussed in the 4th section. Last section makes the concluding
statements.
2. MODEL AND DATA
To evaluate the impact of global financial crisis on global trade integration the following panel
regression model has been used:
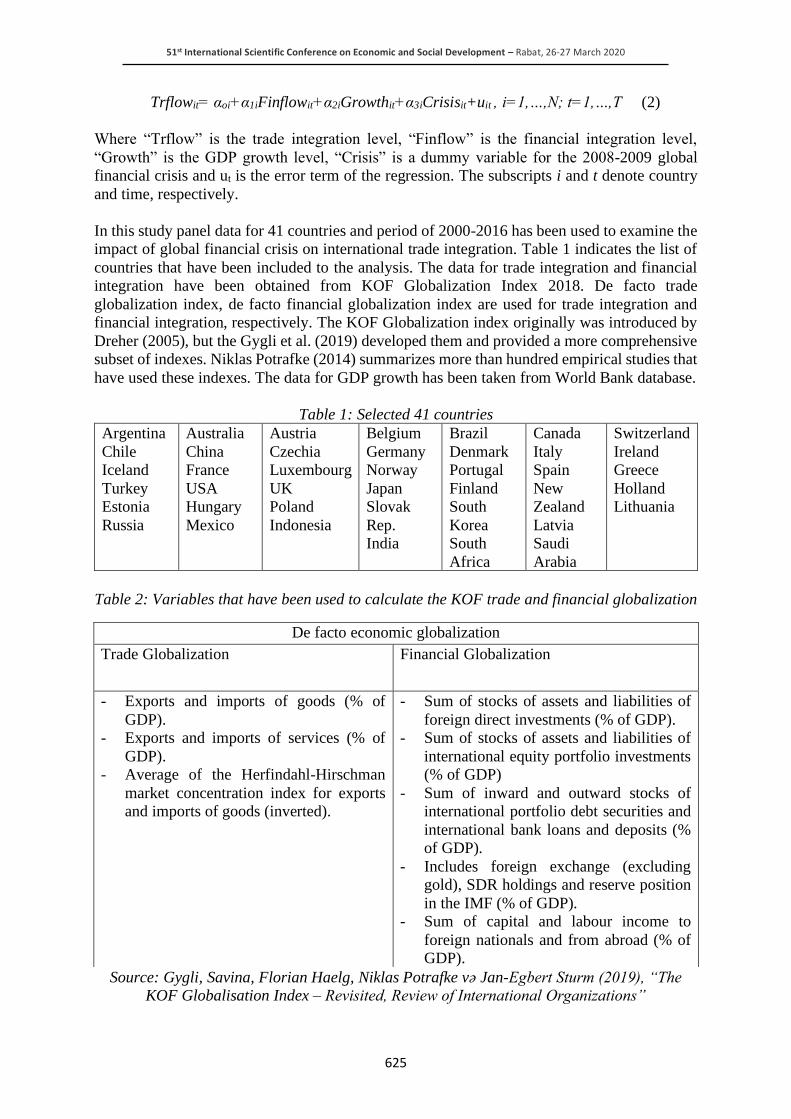
51st International Scientific Conference on Economic and Social Development – Rabat, 26-27 March 2020
625
Trflowit= αoi+α1iFinflowit+α2iGrowthit+α3iCrisisit+uit , i=1,…,N; t=1,…,T (2)
Where “Trflow” is the trade integration level, “Finflow” is the financial integration level,
“Growth” is the GDP growth level, “Crisis” is a dummy variable for the 2008-2009 global
financial crisis and ut is the error term of the regression. The subscripts i and t denote country
and time, respectively.
In this study panel data for 41 countries and period of 2000-2016 has been used to examine the
impact of global financial crisis on international trade integration. Table 1 indicates the list of
countries that have been included to the analysis. The data for trade integration and financial
integration have been obtained from KOF Globalization Index 2018. De facto trade
globalization index, de facto financial globalization index are used for trade integration and
financial integration, respectively. The KOF Globalization index originally was introduced by
Dreher (2005), but the Gygli et al. (2019) developed them and provided a more comprehensive
subset of indexes. Niklas Potrafke (2014) summarizes more than hundred empirical studies that
have used these indexes. The data for GDP growth has been taken from World Bank database.
Table 1: Selected 41 countries
Argentina
Chile
Iceland
Turkey
Estonia
Russia
Australia
China
France
USA
Hungary
Mexico
Austria
Czechia
Luxembourg
UK
Poland
Indonesia
Belgium
Germany
Norway
Japan
Slovak
Rep.
India
Brazil
Denmark
Portugal
Finland
South
Korea
South
Africa
Canada
Italy
Spain
New
Zealand
Latvia
Saudi
Arabia
Switzerland
Ireland
Greece
Holland
Lithuania
Table 2: Variables that have been used to calculate the KOF trade and financial globalization
Source: Gygli, Savina, Florian Haelg, Niklas Potrafke və Jan-Egbert Sturm (2019), “The
KOF Globalisation Index – Revisited, Review of International Organizations”
De facto economic globalization
Trade Globalization Financial Globalization
- Exports and imports of goods (% of
GDP).
- Exports and imports of services (% of
GDP).
- Average of the Herfindahl-Hirschman
market concentration index for exports
and imports of goods (inverted).
- Sum of stocks of assets and liabilities of
foreign direct investments (% of GDP).
- Sum of stocks of assets and liabilities of
international equity portfolio investments
(% of GDP)
- Sum of inward and outward stocks of
international portfolio debt securities and
international bank loans and deposits (%
of GDP).
- Includes foreign exchange (excluding
gold), SDR holdings and reserve position
in the IMF (% of GDP).
- Sum of capital and labour income to
foreign nationals and from abroad (% of
GDP).
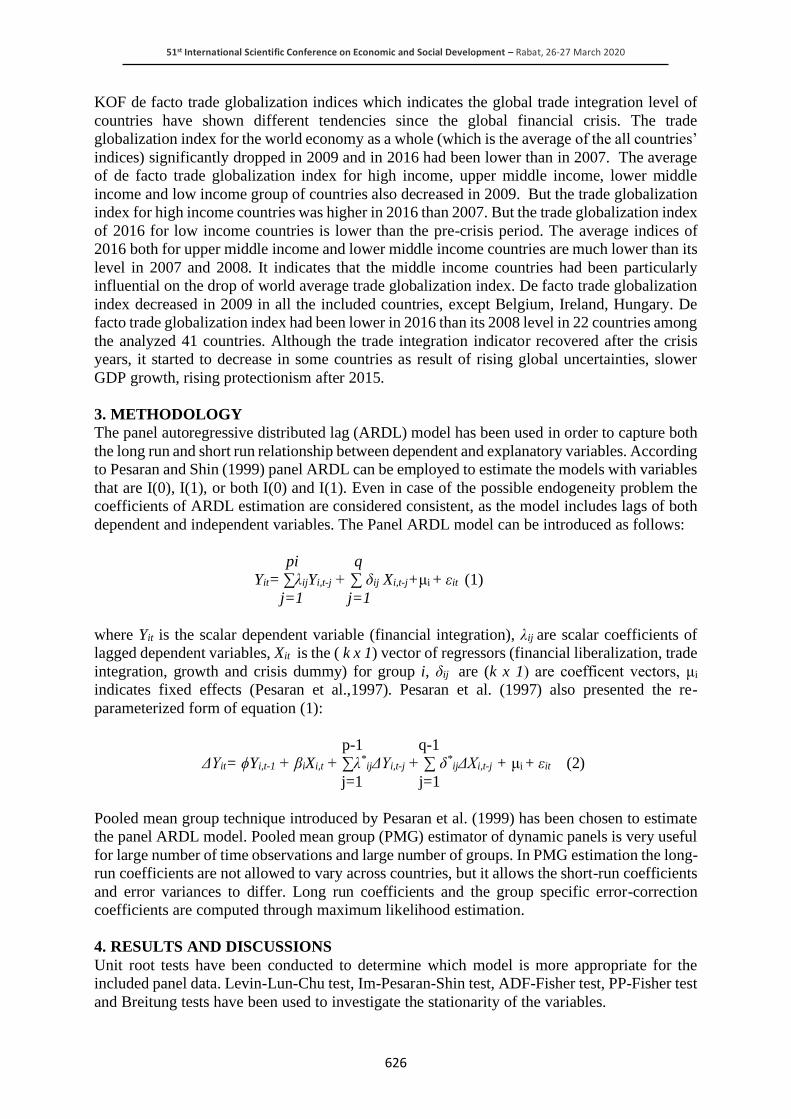
51st International Scientific Conference on Economic and Social Development – Rabat, 26-27 March 2020
626
KOF de facto trade globalization indices which indicates the global trade integration level of
countries have shown different tendencies since the global financial crisis. The trade
globalization index for the world economy as a whole (which is the average of the all countries’
indices) significantly dropped in 2009 and in 2016 had been lower than in 2007. The average
of de facto trade globalization index for high income, upper middle income, lower middle
income and low income group of countries also decreased in 2009. But the trade globalization
index for high income countries was higher in 2016 than 2007. But the trade globalization index
of 2016 for low income countries is lower than the pre-crisis period. The average indices of
2016 both for upper middle income and lower middle income countries are much lower than its
level in 2007 and 2008. It indicates that the middle income countries had been particularly
influential on the drop of world average trade globalization index. De facto trade globalization
index decreased in 2009 in all the included countries, except Belgium, Ireland, Hungary. De
facto trade globalization index had been lower in 2016 than its 2008 level in 22 countries among
the analyzed 41 countries. Although the trade integration indicator recovered after the crisis
years, it started to decrease in some countries as result of rising global uncertainties, slower
GDP growth, rising protectionism after 2015.
3. METHODOLOGY
The panel autoregressive distributed lag (ARDL) model has been used in order to capture both
the long run and short run relationship between dependent and explanatory variables. According
to Pesaran and Shin (1999) panel ARDL can be employed to estimate the models with variables
that are I(0), I(1), or both I(0) and I(1). Even in case of the possible endogeneity problem the
coefficients of ARDL estimation are considered consistent, as the model includes lags of both
dependent and independent variables. The Panel ARDL model can be introduced as follows:
pi q
Yit= ∑λijYi,t-j + ∑ δij Xi,t-j+μi + εit (1)
j=1 j=1
where Yit is the scalar dependent variable (financial integration), λij are scalar coefficients of
lagged dependent variables, Xit is the ( k x 1) vector of regressors (financial liberalization, trade
integration, growth and crisis dummy) for group i, δij are (k x 1) are coefficent vectors, μi
indicates fixed effects (Pesaran et al.,1997). Pesaran et al. (1997) also presented the re-
parameterized form of equation (1):
p-1 q-1
ΔYit= ϕYi,t-1 + βiXi,t + ∑λ*ijΔYi,t-j + ∑ δ*
ijΔXi,t-j + μi + εit (2) j=1 j=1
Pooled mean group technique introduced by Pesaran et al. (1999) has been chosen to estimate
the panel ARDL model. Pooled mean group (PMG) estimator of dynamic panels is very useful
for large number of time observations and large number of groups. In PMG estimation the long-
run coefficients are not allowed to vary across countries, but it allows the short-run coefficients
and error variances to differ. Long run coefficients and the group specific error-correction
coefficients are computed through maximum likelihood estimation.
4. RESULTS AND DISCUSSIONS
Unit root tests have been conducted to determine which model is more appropriate for the
included panel data. Levin-Lun-Chu test, Im-Pesaran-Shin test, ADF-Fisher test, PP-Fisher test
and Breitung tests have been used to investigate the stationarity of the variables.
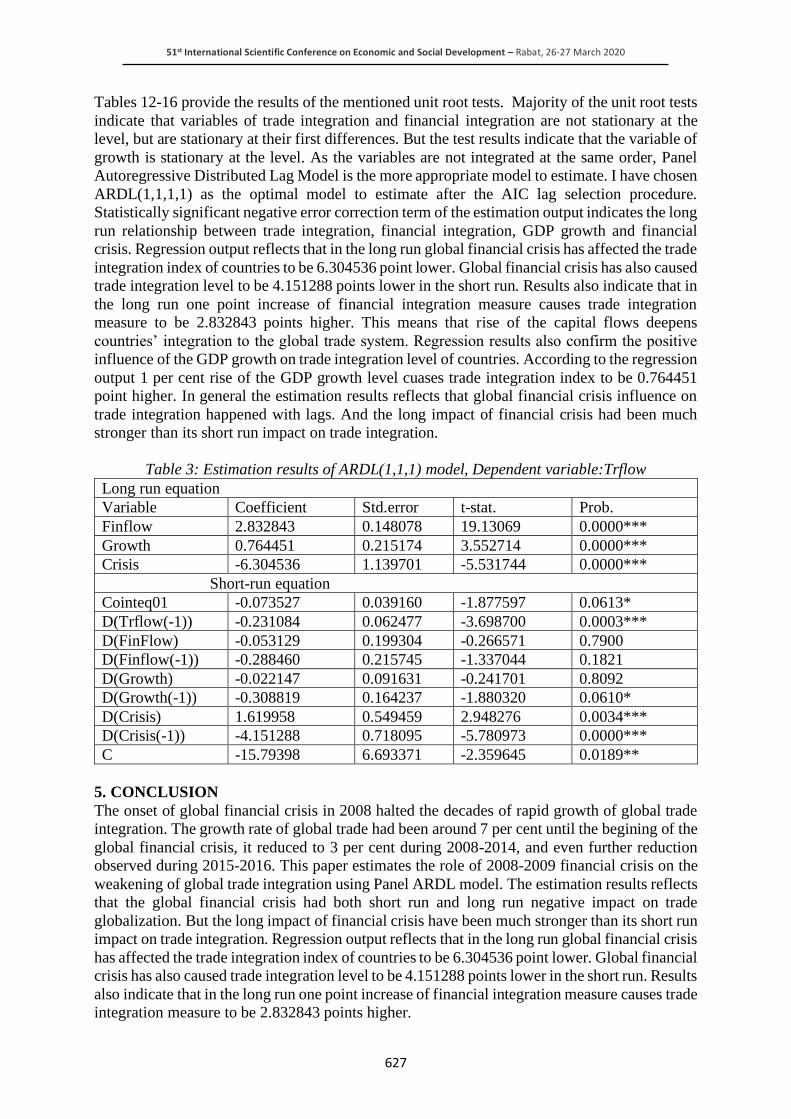
51st International Scientific Conference on Economic and Social Development – Rabat, 26-27 March 2020
627
Tables 12-16 provide the results of the mentioned unit root tests. Majority of the unit root tests
indicate that variables of trade integration and financial integration are not stationary at the
level, but are stationary at their first differences. But the test results indicate that the variable of
growth is stationary at the level. As the variables are not integrated at the same order, Panel
Autoregressive Distributed Lag Model is the more appropriate model to estimate. I have chosen
ARDL(1,1,1,1) as the optimal model to estimate after the AIC lag selection procedure.
Statistically significant negative error correction term of the estimation output indicates the long
run relationship between trade integration, financial integration, GDP growth and financial
crisis. Regression output reflects that in the long run global financial crisis has affected the trade
integration index of countries to be 6.304536 point lower. Global financial crisis has also caused
trade integration level to be 4.151288 points lower in the short run. Results also indicate that in
the long run one point increase of financial integration measure causes trade integration
measure to be 2.832843 points higher. This means that rise of the capital flows deepens
countries’ integration to the global trade system. Regression results also confirm the positive
influence of the GDP growth on trade integration level of countries. According to the regression
output 1 per cent rise of the GDP growth level cuases trade integration index to be 0.764451
point higher. In general the estimation results reflects that global financial crisis influence on
trade integration happened with lags. And the long impact of financial crisis had been much
stronger than its short run impact on trade integration.
Table 3: Estimation results of ARDL(1,1,1) model, Dependent variable:Trflow
Long run equation
Variable Coefficient Std.error t-stat. Prob.
Finflow 2.832843 0.148078 19.13069 0.0000***
Growth 0.764451 0.215174 3.552714 0.0000***
Crisis -6.304536 1.139701 -5.531744 0.0000***
Short-run equation
Cointeq01 -0.073527 0.039160 -1.877597 0.0613*
D(Trflow(-1)) -0.231084 0.062477 -3.698700 0.0003***
D(FinFlow) -0.053129 0.199304 -0.266571 0.7900
D(Finflow(-1)) -0.288460 0.215745 -1.337044 0.1821
D(Growth) -0.022147 0.091631 -0.241701 0.8092
D(Growth(-1)) -0.308819 0.164237 -1.880320 0.0610*
D(Crisis) 1.619958 0.549459 2.948276 0.0034***
D(Crisis(-1)) -4.151288 0.718095 -5.780973 0.0000***
C -15.79398 6.693371 -2.359645 0.0189**
5. CONCLUSION
The onset of global financial crisis in 2008 halted the decades of rapid growth of global trade
integration. The growth rate of global trade had been around 7 per cent until the begining of the
global financial crisis, it reduced to 3 per cent during 2008-2014, and even further reduction
observed during 2015-2016. This paper estimates the role of 2008-2009 financial crisis on the
weakening of global trade integration using Panel ARDL model. The estimation results reflects
that the global financial crisis had both short run and long run negative impact on trade
globalization. But the long impact of financial crisis have been much stronger than its short run
impact on trade integration. Regression output reflects that in the long run global financial crisis
has affected the trade integration index of countries to be 6.304536 point lower. Global financial
crisis has also caused trade integration level to be 4.151288 points lower in the short run. Results
also indicate that in the long run one point increase of financial integration measure causes trade
integration measure to be 2.832843 points higher.

51st International Scientific Conference on Economic and Social Development – Rabat, 26-27 March 2020
628
This means that rise of the capital flows deepens countries’ integration to the global trade
system. Regression results also confirm the positive influence of the GDP growth on trade
integration level of countries. According to the regression output 1 per cent rise of the GDP
growth level cuases trade integration index to be 0.764451 point higher. In general the
estimation results reflects that global financial crisis influence on trade integration happened
with lags. And the long impact of financial crisis had been much stronger than its short run
impact on trade integration.
LITERATURE:
1. Axel Dreher. (2006). Does Globalization Affect Growth? Evidence from a new Index of
Globalization. Applied Economics, 38(10), 1091-1110.
2. Cristina Constantinescu, Aaditya Mattoo & Michele Ruta. (2015), The Global Trade
Slowdown: Cyclical or Structural?, IMF Working Paper
3. Jarkko Jääskelä, Thomas Mathews , (2015), Explaining the Slowdown in Global Trade,
Reserv Bank of Australia
4. Michael Francis, Louis Morel, (2015) The slowdown in Global trade , Bank of Canada
Review
5. Michael Mussa, (2000), Factors Driving Global Economic Integration, Presented in Jackson
Hole, Wyoming at a symposium sponsored by the Federal Reserve Bank of Kansas City on
“Global Opportunities and Challenges,”
6. Niklas Potrafke. (2015). The Evidence on Globalization. The World Economy, 38(3), 509-
552.
7. Pesaran, M. H., & Shin, Y. (1999). An Autoregressive Distributed Lag Modelling Approach
to Cointegration Analysis. In Strom, S. (Ed.), Chapter 11 in Econometrics and Economic
Theory in the 20th Century the Ragnar Frisch Centennial Symposium (pp. 371-413).
Cambridge University Press, Cambridge.
8. Pesaran, M. H., Shin, Y., & Smith, R. P. (1997). Pooled estimation of long-run relationships
in dynamic heterogeneous panels, University of Cambridge, Department of Applied
Economics.
9. Pesaran, M. H., Shin, Y., & Smith, R.P. (1999). Pooled mean group estimation of dynamic
heterogeneous panels. Journal of the American Statistical Association, 94(446), 621-634.
10. Przemyslaw Wozniak, Malgorzata Galar, (2018) Understanding the Weakness in Global
Trade, European Comission Economic Briefs 033
11. Savina Gygli, Florian Haelg, Niklas Potrafke, & Jan-Egbert Sturm. (2019). The KOF
Globalisation Index – Revisited. Review of International Organizations.
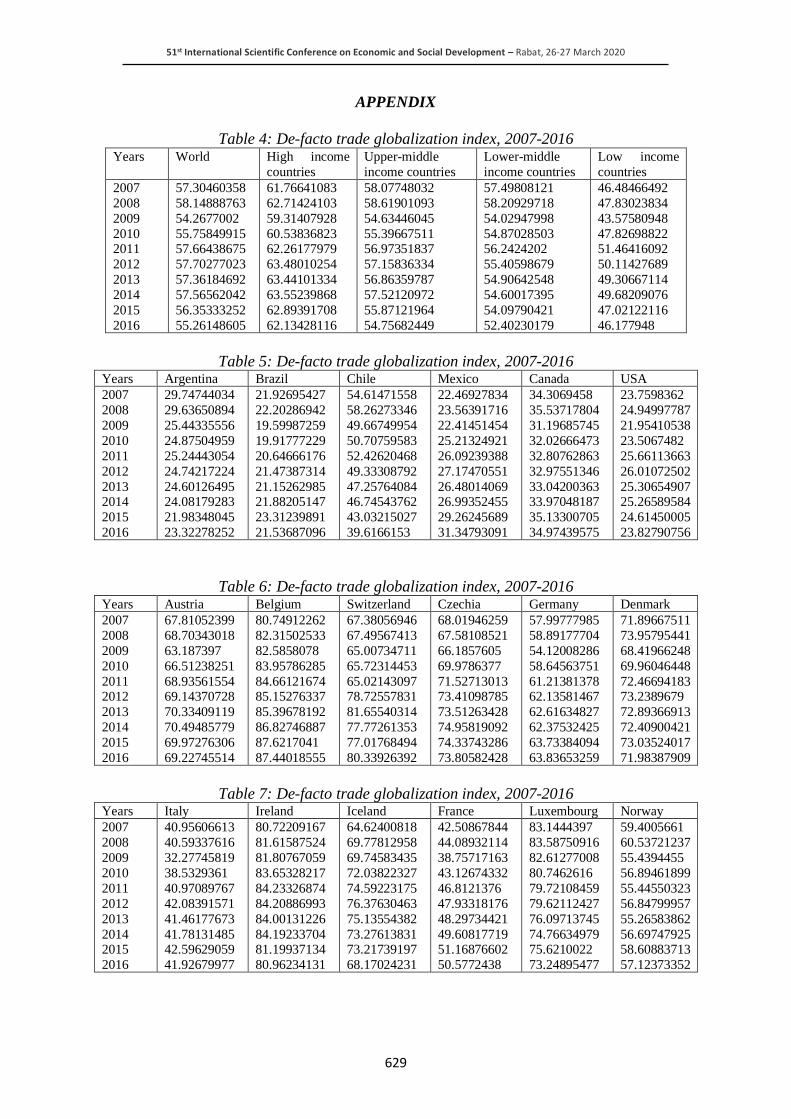
51st International Scientific Conference on Economic and Social Development – Rabat, 26-27 March 2020
629
APPENDIX
Table 4: De-facto trade globalization index, 2007-2016 Years World High income
countries
Upper-middle
income countries
Lower-middle
income countries
Low income
countries
2007
2008
2009
2010 2011
2012
2013
2014
2015
2016
57.30460358
58.14888763
54.2677002
55.75849915 57.66438675
57.70277023
57.36184692
57.56562042
56.35333252
55.26148605
61.76641083
62.71424103
59.31407928
60.53836823 62.26177979
63.48010254
63.44101334
63.55239868
62.89391708
62.13428116
58.07748032
58.61901093
54.63446045
55.39667511 56.97351837
57.15836334
56.86359787
57.52120972
55.87121964
54.75682449
57.49808121
58.20929718
54.02947998
54.87028503 56.2424202
55.40598679
54.90642548
54.60017395
54.09790421
52.40230179
46.48466492
47.83023834
43.57580948
47.82698822 51.46416092
50.11427689
49.30667114
49.68209076
47.02122116
46.177948
Table 5: De-facto trade globalization index, 2007-2016 Years Argentina Brazil Chile Mexico Canada USA
2007
2008
2009
2010
2011
2012
2013 2014
2015
2016
29.74744034
29.63650894
25.44335556
24.87504959
25.24443054
24.74217224
24.60126495 24.08179283
21.98348045
23.32278252
21.92695427
22.20286942
19.59987259
19.91777229
20.64666176
21.47387314
21.15262985 21.88205147
23.31239891
21.53687096
54.61471558
58.26273346
49.66749954
50.70759583
52.42620468
49.33308792
47.25764084 46.74543762
43.03215027
39.6166153
22.46927834
23.56391716
22.41451454
25.21324921
26.09239388
27.17470551
26.48014069 26.99352455
29.26245689
31.34793091
34.3069458
35.53717804
31.19685745
32.02666473
32.80762863
32.97551346
33.04200363 33.97048187
35.13300705
34.97439575
23.7598362
24.94997787
21.95410538
23.5067482
25.66113663
26.01072502
25.30654907 25.26589584
24.61450005
23.82790756
Table 6: De-facto trade globalization index, 2007-2016 Years Austria Belgium Switzerland Czechia Germany Denmark
2007
2008
2009
2010
2011 2012
2013
2014
2015
2016
67.81052399
68.70343018
63.187397
66.51238251
68.93561554 69.14370728
70.33409119
70.49485779
69.97276306
69.22745514
80.74912262
82.31502533
82.5858078
83.95786285
84.66121674 85.15276337
85.39678192
86.82746887
87.6217041
87.44018555
67.38056946
67.49567413
65.00734711
65.72314453
65.02143097 78.72557831
81.65540314
77.77261353
77.01768494
80.33926392
68.01946259
67.58108521
66.1857605
69.9786377
71.52713013 73.41098785
73.51263428
74.95819092
74.33743286
73.80582428
57.99777985
58.89177704
54.12008286
58.64563751
61.21381378 62.13581467
62.61634827
62.37532425
63.73384094
63.83653259
71.89667511
73.95795441
68.41966248
69.96046448
72.46694183 73.2389679
72.89366913
72.40900421
73.03524017
71.98387909
Table 7: De-facto trade globalization index, 2007-2016 Years Italy Ireland Iceland France Luxembourg Norway
2007
2008
2009
2010
2011
2012
2013
2014 2015
2016
40.95606613
40.59337616
32.27745819
38.5329361
40.97089767
42.08391571
41.46177673
41.78131485 42.59629059
41.92679977
80.72209167
81.61587524
81.80767059
83.65328217
84.23326874
84.20886993
84.00131226
84.19233704 81.19937134
80.96234131
64.62400818
69.77812958
69.74583435
72.03822327
74.59223175
76.37630463
75.13554382
73.27613831 73.21739197
68.17024231
42.50867844
44.08932114
38.75717163
43.12674332
46.8121376
47.93318176
48.29734421
49.60817719 51.16876602
50.5772438
83.1444397
83.58750916
82.61277008
80.7462616
79.72108459
79.62112427
76.09713745
74.76634979 75.6210022
73.24895477
59.4005661
60.53721237
55.4394455
56.89461899
55.44550323
56.84799957
55.26583862
56.69747925 58.60883713
57.12373352
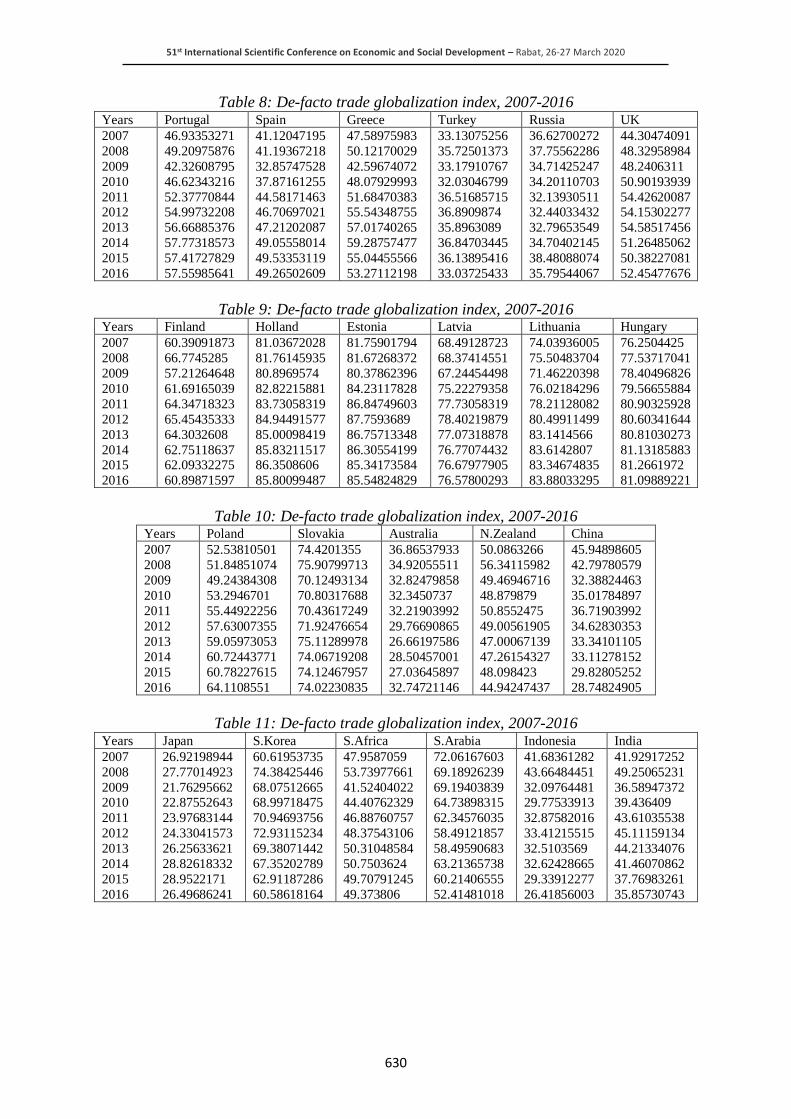
51st International Scientific Conference on Economic and Social Development – Rabat, 26-27 March 2020
630
Table 8: De-facto trade globalization index, 2007-2016 Years Portugal Spain Greece Turkey Russia UK
2007
2008
2009
2010
2011 2012
2013
2014
2015
2016
46.93353271
49.20975876
42.32608795
46.62343216
52.37770844 54.99732208
56.66885376
57.77318573
57.41727829
57.55985641
41.12047195
41.19367218
32.85747528
37.87161255
44.58171463 46.70697021
47.21202087
49.05558014
49.53353119
49.26502609
47.58975983
50.12170029
42.59674072
48.07929993
51.68470383 55.54348755
57.01740265
59.28757477
55.04455566
53.27112198
33.13075256
35.72501373
33.17910767
32.03046799
36.51685715 36.8909874
35.8963089
36.84703445
36.13895416
33.03725433
36.62700272
37.75562286
34.71425247
34.20110703
32.13930511 32.44033432
32.79653549
34.70402145
38.48088074
35.79544067
44.30474091
48.32958984
48.2406311
50.90193939
54.42620087 54.15302277
54.58517456
51.26485062
50.38227081
52.45477676
Table 9: De-facto trade globalization index, 2007-2016 Years Finland Holland Estonia Latvia Lithuania Hungary
2007
2008
2009
2010
2011
2012
2013
2014 2015
2016
60.39091873
66.7745285
57.21264648
61.69165039
64.34718323
65.45435333
64.3032608
62.75118637 62.09332275
60.89871597
81.03672028
81.76145935
80.8969574
82.82215881
83.73058319
84.94491577
85.00098419
85.83211517 86.3508606
85.80099487
81.75901794
81.67268372
80.37862396
84.23117828
86.84749603
87.7593689
86.75713348
86.30554199 85.34173584
85.54824829
68.49128723
68.37414551
67.24454498
75.22279358
77.73058319
78.40219879
77.07318878
76.77074432 76.67977905
76.57800293
74.03936005
75.50483704
71.46220398
76.02184296
78.21128082
80.49911499
83.1414566
83.6142807 83.34674835
83.88033295
76.2504425
77.53717041
78.40496826
79.56655884
80.90325928
80.60341644
80.81030273
81.13185883 81.2661972
81.09889221
Table 10: De-facto trade globalization index, 2007-2016 Years Poland Slovakia Australia N.Zealand China
2007
2008
2009
2010
2011
2012
2013
2014
2015
2016
52.53810501
51.84851074
49.24384308
53.2946701
55.44922256
57.63007355
59.05973053
60.72443771
60.78227615
64.1108551
74.4201355
75.90799713
70.12493134
70.80317688
70.43617249
71.92476654
75.11289978
74.06719208
74.12467957
74.02230835
36.86537933
34.92055511
32.82479858
32.3450737
32.21903992
29.76690865
26.66197586
28.50457001
27.03645897
32.74721146
50.0863266
56.34115982
49.46946716
48.879879
50.8552475
49.00561905
47.00067139
47.26154327
48.098423
44.94247437
45.94898605
42.79780579
32.38824463
35.01784897
36.71903992
34.62830353
33.34101105
33.11278152
29.82805252
28.74824905
Table 11: De-facto trade globalization index, 2007-2016 Years Japan S.Korea S.Africa S.Arabia Indonesia India
2007
2008
2009 2010
2011
2012
2013
2014
2015
2016
26.92198944
27.77014923
21.76295662 22.87552643
23.97683144
24.33041573
26.25633621
28.82618332
28.9522171
26.49686241
60.61953735
74.38425446
68.07512665 68.99718475
70.94693756
72.93115234
69.38071442
67.35202789
62.91187286
60.58618164
47.9587059
53.73977661
41.52404022 44.40762329
46.88760757
48.37543106
50.31048584
50.7503624
49.70791245
49.373806
72.06167603
69.18926239
69.19403839 64.73898315
62.34576035
58.49121857
58.49590683
63.21365738
60.21406555
52.41481018
41.68361282
43.66484451
32.09764481 29.77533913
32.87582016
33.41215515
32.5103569
32.62428665
29.33912277
26.41856003
41.92917252
49.25065231
36.58947372 39.436409
43.61035538
45.11159134
44.21334076
41.46070862
37.76983261
35.85730743

51st International Scientific Conference on Economic and Social Development – Rabat, 26-27 March 2020
631
Table 12: Results of unit root tests of “Trflow” variable Individual effects
Individual linear trends
None
Method Prob. Method Prob. Method Prob.
Levin,Lu and Chu t 0.0005 Levin,Lu and Chu t 0.0000 Levin,Lu and Chu t 0.9888
İm,Pesaran və Shin w-stat. 0.5867 Breitung t-stat. 0.4425 ADF-Fisher Chi-square 0.9982
ADF-Fisher Chi-square 0.3711 İm,Pesaran and Shin w-stat. 0.0073 PP-Fisher Chi-square 0.9590
PP-Fisher Chi-square 0.2967 ADF-Fisher Chi-square 0.0139
PP-Fisher Chi-square 0.0003
Table 13: Results of unit root test for the 1st difference of “Trflow” variable Individual effects
Individual linear trends
None
Method Prob. Method Prob. Method Prob.
Levin,Lu and Chu t 0.0000 Levin,Lu and Chu t 0.0000 Levin,Lu and Chu t 0.0000
Im,Pesaran and Shin w-stat 0.0000 Breitung t-stat. 0.0000 ADF-Fisher Chi-square 0.0000
ADF-Fisher Chi-square 0.0000 Im,Pesaran and Shin w-stat 0.0000 PP-Fisher Chi-square 0.0000
PP-Fisher Chi-square 0.0000 ADF-Fisher Chi-square 0.0000
PP-Fisher Chi-square 0.0000
Table 14: Results of unit root tests for “Finflow” variable Individual effects
Individual linear trends
None
Method Prob. Method Prob. Method Prob.
Levin,Lu and Chu t 0.0000 Levin,Lu and Chu t 0.0000 Levin,Lu and Chu t 0.9811
Im,Pesaran and Shin w-stat 0.0000 Breitung t-stat. 0.3341 ADF-Fisher Chi-square 1.0000
ADF-Fisher Chi-square 0.0000 İm,Pesaran və Şin w-stat 0.2244 PP-Fisher Chi-square 1.0000
PP-Fisher Chi-square 0.0000 ADF-Fisher Chi-square 0.2450
PP-Fisher Chi-square 0.7029
Table 15: Results of unit root test for the 1st difference of “Finflow” variable Individual effects
Individual linear trends
None
Method Prob. Method Prob. Method Prob.
Levin,Lu and Chu t 0.0000 Levin,Lu and Chu t 0.0000 Levin,Lu and Chu t 0.0000
Im,Pesaran and Shin w-stat 0.0000 Breitung t-stat. 0.0000 ADF-Fisher Chi-square 0.0000
ADF-Fisher Chi-square 0.0000 Im,Pesaran and Shin w-stat 0.0000 PP-Fisher Chi-square 0.0000
PP-Fisher Chi-square 0.0000 ADF-Fisher Chi-square 0.0000
PP-Fisher Chi-square 0.0000
Table 16: Results of unit root tests for “Growth” variable Individual effects
Individual linear trends
None
Method Prob. Method Prob. Method Prob.
Levin,Lu and Chu t 0.0000 Levin,Lu and Chu t 0.0000 Levin,Lu and Chu t 0.0000
Im,Pesaran and Shin w-stat 0.0000 Breitung t-stat. 0.0000 ADF-Fisher Chi-square 0.0000
ADF-Fisher Chi-square 0.0000 Im,Pesaran and Shin w-stat 0.0000 PP-Fisher Chi-square 0.0000
PP-Fisher Chi-square 0.0000 ADF-Fisher Chi-square 0.0000
PP-Fisher Chi-square 0.0000