ECONOMIC AND SOCIAL CHANGES:
193
1 (25) 2013 THE RUSSIAN ACADEMY OF SCIENCES INSTITUTE OF SOCIO-ECONOMIC DEVELOPMENT OF TERRITORIES OF RAS ECONOMIC AND SOCIAL CHANGES: FACTS, TRENDS, FORECAST
-
Upload
khangminh22 -
Category
Documents
-
view
2 -
download
0
Transcript of ECONOMIC AND SOCIAL CHANGES:

1 (25) 2013
THE RUSSIAN ACADEMY OF SCIENCES
INSTITUTE OF SOCIO-ECONOMIC DEVELOPMENT OF TERRITORIES OF RAS
ECONOMIC AND SOCIAL
CHANGES:FACTS, TRENDS, FORECAST
The journal is published according to the decision of RAS economic institutions’ administration in the North-West federal districtInstitute of Socio-Economic and Energy Problems of the North Komi scientific centre
of the Ural RAS department (Komi Republic)
Institute of Economics of Karelian scientific centre of RAS (Karelia Republic)
G.P. Luzin Institute of Economic Problems of Kola scientific centre of RAS (the Murmansk Oblast)
Institute of Socio-Economic Development of Territories of RAS (the Vologda Oblast)
and according to the decision of St. Petersburg State University of Engineering and Economics
administration
and other RF regionsInstitute of Social and Economic Research of Ufa Science Centre of RAS (Bashkortostan Republic)
Institute of Economics, the Research of the Ural RAS department (the Sverdlovsk Oblast)
The decision of Presidium of the Higher Attestation Commission of the Russian MES (№6/6, dated
19.02.2010) the journal is included in the list of leading scientific editions, recommended for publication
of the main results of dissertations for the degree of Doctor and Candidate of Sciences.
Editorial council:
RAS academician V.L. Makarov (Moscow, Russia)
RAS academician V.V. Ivanter (Moscow, Russia)
RAS academician V.V. Okrepilov (St. Petersburg, Russia)
RAS academician A.I. Tatarkin (Yekaterinburg, Russia)
Belarus NAS academician P.A. Vityaz (Minsk, Belarus)
Belarus NAS academician P.G. Nikitenko (Minsk, Belarus)
RAS corresponding member V.N. Lazhentsev (Syktyvkar, Russia)
Professor J. Sapir (Paris, France)
Doctor of Economics, professor S.D. Valentey (Moscow, Russia)
Doctor of Economics, professor D.A. Gaynanov (Ufa, Russia)
Doctor of Economics, professor A.E. Dayneko (Minsk, Belarus)
Doctor of Economics, professor V.A. Ilyin (Vologda, Russia)
Professor M. Kivinen (Helsinki, Finland)
Doctor of Sociology, professor I.V. Kotlyarov (Minsk, Belarus)
Doctor of Economics, professor S.V. Kuznetsov (St. Petersburg, Russia)
Doctor of Economics, professor F.D. Larichkin (Apatity, Russia)
Doctor of Economics, professor I.A. Maksimtsev (St. Petersburg, Russia)
Doctor of Technics, professor A.V. Putilov (Moscow, Russia)
Doctor of Technical Sciences Yu.Ya. Chukreev (Syktyvkar, Russia)
Doctor of Technics, professor A.I. Shishkin (Petrozavodsk, Russia)
Doctor, professor Zhang Shuhua (Beijing, China)
Professor Wu Enyuan (Beijing, China)
Chief editor – V.A. Ilyin
Editorial board:
Doctor of Economics, professor L.A. Anosova
Doctor of Economics, professor A.G. Vorobyov
Doctor of Economics, professor E.S. Gubanova
Ph.D. in History K.A. Gulin (deputy chief editor)
Ph.D. in Economics K.A. Zadumkin,
Ph.D. in Economics G.V. Leonidova
Ph.D. in Economics M.F. Sychev (deputy chief editor)
Ph.D. in Economics S.V. Terebova
Doctor of Economics T.V. Uskova, Doctor of Economics A.A. Shabunova
© ISEDT RAS, 2013ISSN 2307-0331
Internet address: http://esc.vscc.ac.ru
Opinions presented in the articles can differ from the editorial board’s point of view
Authors of the articles are responsible for the material selected and stated.

CONTENT
FROM THE CHIEF EDITOR
Ilyin V.A. Page unturned ................................................................................................... 5
DEVELOPMENT STRATEGY
Glazyev S.Yu., Fetisov G.G. On the strategy of sustainable development
of Russia’s economy .................................................................................. 18
Povarova А.I. Regional budget for 2013 – 2015: stability or survival? ............................... 29
Vasilyev A.M. Comprehensive approach to arranging marine economy
in the Western Arctic ................................................................................. 47
Aliyev A.B. Innovation factors in the country’s economic security management system .... 56
Milashevich Ye.А. Framework of harmonization and unification of external economic
relations between the Republic of Belarus and the Russian Federation
in the context of Russia’s accession to WTO .............................................. 65
BRANCH-WISE ECONOMY
Chayka L.V. Spatial aspects of electric power industry development
in Russia’s European North ...................................................................... 72
Nemkovich Ye.G., Kurilo A.Ye. Transformation of machine building
of the Republic of Karelia ......................................................................... 85
Avetisyan I.A. The problems of financing of higher education in modern Russia .............. 94
SOCIAL DEVELOPMENT
Tikhomirova V.V. Methodology and mechanisms of funding the social welfare system
in the Northern regions ...........................................................................107
Shabunova A.A., Morev M.V. Vologda residents’ notions of happiness .............................119
Kondakova N.A. Health and living conditions of the rising generation ............................131

YOUNG RESEARCHERS
Popov A.V. Ty pology of employees as a tool of labour behaviour management ................141
Mironenko N.V. Tools for state regulation of the region’s agriculture ..............................154
Mazilov Ye.A. Industrial policy as a mechanism of regional development ........................164
Gisin L.M. Influence of capital and costs on the evaluation of transfer prices ..................171
Ilyin P.V. Foreign experience of technology transfer and its application in Russia .......... 180
Information about authors ........................................................................................... 186
Requirements to manuscripts ....................................................................................... 190
Subscription information .............................................................................................. 192
Vladimir A. ILYIN Doctor of Economics,
Professor, Honoured
Scientist of the Russian
Federation, Director of
ISEDT RAS, Chairman
of the Public Chamber
in the Vologda Oblast
Page unturnedThe year has passed since the presidential candidate and the RF
Prime Minister Vladimir V. Putin spoke at the conference of the
Russian Union of Industrialists and Entrepreneurs on February 9,
2012. In his speech Vladimir V. Putin clearly identified the main
causes of high social tension in the country, perhaps, for the first time
since 2000:
“…what was going on in Russia in the 1990s. We have spoken a
great deal about this, and we know that business back then amounted to
nothing more than slicing up the state-owned pie”;
“…certainly, we need to turn this page as well… We need to close this
period. There are different ways to do this. We need to discuss them with
society and with experts, but we must do so in such a way that society
agrees with the resolution of problems dating back to the 1990s, including
patently unfair privatization and auctions of all kinds”;
“…what we absolutely have to do is ensure public legitimacy of the
institute of private property and public trust in business. Otherwise we
will not be able to develop a modern market economy, let alone create a
healthy civil society” “…key steps should be taken in 2012”1.
The first ten months of Vladimir Putin’s presidency have passed,
and it can be noted that there were no specific instructions aimed at
solving one of the most fundamental problems of modern Russian
society – socially unfair privatization of state property. They were
given neither in the first President’s Executive Orders (dated on May
7, 2012) nor in his Address to the Federal Assembly (12 December
2012).
In the Address to the Federal Assembly Vladimir V. Putin noted
that “the high degree of offshore investments and ownerships in
the Russian economy is an absolute fact” and “we are to strive for
offshore transparency”. But no variants to “close” the problems
of the 1990s were given for the society to discuss, which dealt with
“patently unfair privatization and auctions of all kinds”.
1 The speech of V.V. Putin at the conference of the Russian Union of Indu-
strialists and Entrepreneurs, February 9, 2012.Official site of V.V. Putin. Available
at: http://premier.gov.ru/events/news/18052/
5Economic and social changes: facts, trends, forecast 1 (25) 2013
FROM THE CHIEF EDITOR

Page unturned
Unfair privatization of the 1990s became
the basis for the formation of an oligarchic
and corrupt system of the state, which brought
up the modern political elite and led to an
unprecedented income inequality among
Russia’s citizens. In Russia, 1% of oligarchs
and large owners account for about 40% of
national income, while 1% of the richest
people in the United States accounts for 8% of
national income. Thus, inequality degree is 5
– 10 times higher in Russia than in the USA2.
According to one renowned politician,
“…the state power in Russia was forcing against
Russia speaking on behalf of Russia during the
last decades”3.
During the 1990s, existing oligarchic clans extracted minerals in Russia and appropriated most of the resource rents. And only in 2002, on the RF President Vladimir Putin’s initiative a mineral extraction tax (MET) was imposed and tariffs on export were increased. This resulted in a 4.2-fold increase of the federal budget revenues
in 2011 as compared with 2000 (in constant prices), and the share of mineral extraction tax and foreign economic activity revenues in the budget increased from 20% to 58.7%4.
At the same time, the government
continued to retreat under the pressure of
the oligarchs and international financial
speculators.
Thus, the last restrictions on foreign
exchange regulation were canceled in Russia
in 2006, which dramatically accelerated the
capital outflow from the country5.
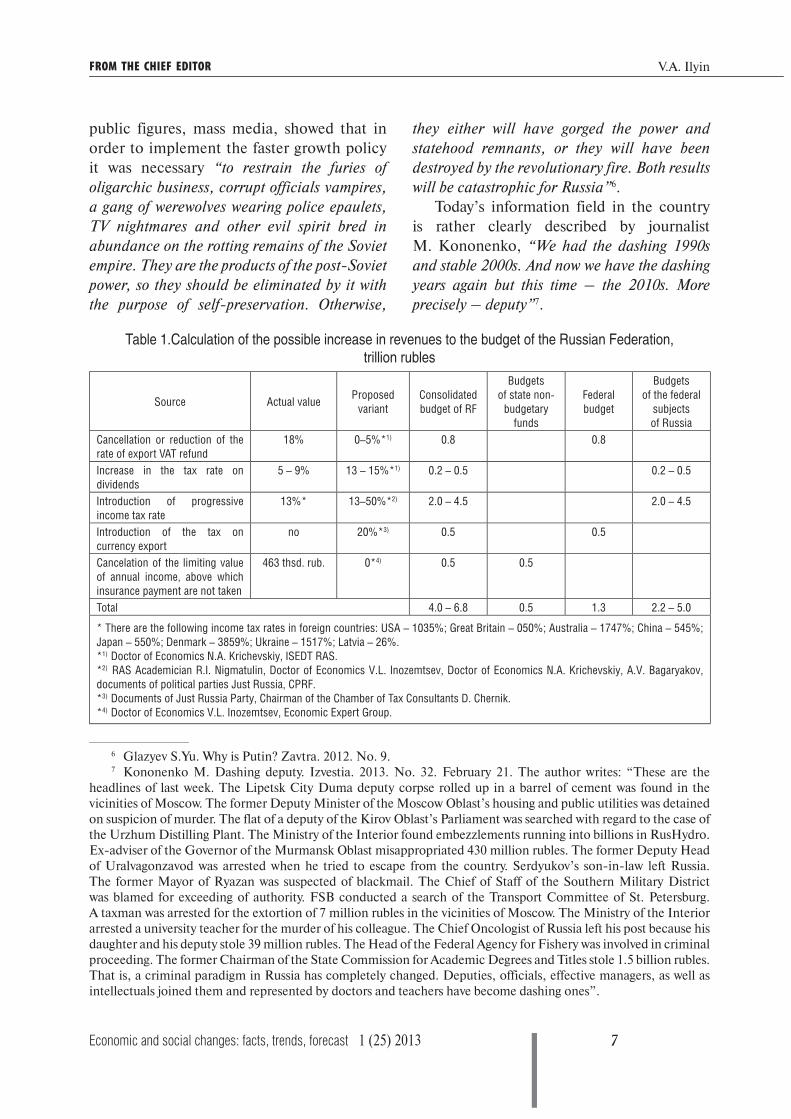
According to experts, federal and regional
budgets lose up to 50% of tax revenues due
to different legal ways to avoid taxes of large
corporations and the political elite (tab. 1).
A serious analysis of the current situation
in the country before the elections to the
State Duma in December 2011 and the
presidential elections in March 2012 in the
conditions of the formation of a new political
cycle, conducted by numerous experts,
2 Yashina G.А. Progressive taxation: “pros and cons”. Federal Internet Edition “Capital of the country”.
Available at: http:www/kapital rus.ru/articles/article/1770343 ShevchenkoМ. Financial triumphs. Zavtra. 2012. No. 37.4 Mineral Extraction Tax (MET) was imposed on January 1, 2002 instead of the payments for the right to use
subsurface resources, deductions for the replacement of the mineral raw material base, excise duty on oil and stable
gas condensate, the share of which was about 80% in the structure of resource payments. Mineral extraction tax was
aimed at the maximum simplification of tax collection for the state.
In fact, the events leading up to the imposition of mineral extraction tax were different. S.S. Gubanov describes
them in his article “System choice of Russia and standard of living” as follows (The Economist, 2011. No. 11. P.
355): “1998 August default marked the full system crash of unlimited power of private-oligarchic property. The
distribution of power began to be noticeably revolutionized. The fall of reactionary reformers’ cabinet concealed the
threat to the basis of the oligarchic property. The question had an edge to it who will win: will oligarchs win Russia
or Russia beat oligarchs? Without waiting for the irreversible turn of scales, the comprador clan of oligarchs decided
to sacrifice the secondary things to save their major priority – the predominance of their personalized property.
They agreed to split their revenue with the state; thus, the system of extremely unusual, hybrid sate and oligarchic
partnership was developed, when the system domination continued to belong to the oligarchic property, but its
revenues were partially privatized and partially nationalized. The social contract between the parties came into effect
in 2001 along with the mechanism of mineral extraction tax formalized in legislation. Since then, the partial bite
of taxes from export and raw material rent to the state budget, i.e. currency and budgetary nationalization, became
the encumbrance for oligarchic property. Increasing the budget due to raw material export and petrodollars, the
government acquired an opportunity to support domestic demand through budget expenditures and their indexing,
and an oligarchic clan retained his property and comprador capital power at its disposal”. 5 According to the Central Bank of RF, the net capital outflow from Russia by the private sector and individuals
amounted to 30.2 billion dollars in 2006 and 62 billion in 2007 (2008 – 164, 2009 – 72.2, 2010 – 56.3, 2011 – 111.9
billion dollars). Thus, at the end of 2011, the volume of cross-border transfers (3.6 trillion rubles) was equal to 62%
of own territorial budgets revenues of RF (5.8 trillion rubles), and it was 2.6 times higher than the public debt of
Russia (1.4 trillion rubles).
6 1 (25) 2013 Economic and social changes: facts, trends, forecast
they either will have gorged the power and
statehood remnants, or they will have been
destroyed by the revolutionary fire. Both results
will be catastrophic for Russia”6.
Today’s information field in the country
is rather clearly described by journalist
M. Kononenko, “We had the dashing 1990s
and stable 2000s. And now we have the dashing
years again but this time – the 2010s. More
precisely – deputy”7.
public figures, mass media, showed that in
order to implement the faster growth policy
it was necessary “to restrain the furies of
oligarchic business, corrupt officials vampires,
a gang of werewolves wearing police epaulets,
TV nightmares and other evil spirit bred in
abundance on the rotting remains of the Soviet
empire. They are the products of the post-Soviet
power, so they should be eliminated by it with
the purpose of self-preservation. Otherwise,
Table 1.Calculation of the possible increase in revenues to the budget of the Russian Federation,
trillion rubles
Source Actual valueProposed
variant
Consolidated
budget of RF
Budgets
of state non-
budgetary
funds
Federal
budget
Budgets
of the federal
subjects
of Russia
Cancellation or reduction of the
rate of export VAT refund
18% 0–5%*1) 0.8 0.8
Increase in the tax rate on
dividends
5 – 9% 13 – 15%*1) 0.2 – 0.5 0.2 – 0.5
Introduction of progressive
income tax rate
13%* 13–50%*2) 2.0 – 4.5 2.0 – 4.5
Introduction of the tax on
currency export
no 20%*3) 0.5 0.5
Cancelation of the limiting value
of annual income, above which
insurance payment are not taken
463 thsd. rub. 0*4) 0.5 0.5
Total 4.0 – 6.8 0.5 1.3 2.2 – 5.0
* There are the following income tax rates in foreign countries: USA – 10 35%; Great Britain – 0 50%; Australia – 17 47%; China – 5 45%;
Japan – 5 50%; Denmark – 38 59%; Ukraine – 15 17%; Latvia – 26%.
*1) Doctor of Economics N.А. Krichevskiy, ISEDT RAS.
*2) RAS Academician R.I. Nigmatulin, Doctor of Economics V.L. Inozemtsev, Doctor of Economics N.А. Krichevskiy, А.V. Bagaryakov,
documents of political parties Just Russia, CPRF.
*3) Documents of Just Russia Party, Chairman of the Chamber of Tax Consultants D. Chernik.
*4) Doctor of Economics V.L. Inozemtsev, Economic Expert Group.
6 Glazyev S.Yu. Why is Putin? Zavtra. 2012. No. 9.7 Kononenko M. Dashing deputy. Izvestia. 2013. No. 32. February 21. The author writes: “These are the
headlines of last week. The Lipetsk City Duma deputy corpse rolled up in a barrel of cement was found in the
vicinities of Moscow. The former Deputy Minister of the Moscow Oblast’s housing and public utilities was detained
on suspicion of murder. The flat of a deputy of the Kirov Oblast’s Parliament was searched with regard to the case of
the Urzhum Distilling Plant. The Ministry of the Interior found embezzlements running into billions in RusHydro.
Ex-adviser of the Governor of the Murmansk Oblast misappropriated 430 million rubles. The former Deputy Head
of Uralvagonzavod was arrested when he tried to escape from the country. Serdyukov’s son-in-law left Russia.
The former Mayor of Ryazan was suspected of blackmail. The Chief of Staff of the Southern Military District
was blamed for exceeding of authority. FSB conducted a search of the Transport Committee of St. Petersburg.
A taxman was arrested for the extortion of 7 million rubles in the vicinities of Moscow. The Ministry of the Interior
arrested a university teacher for the murder of his colleague. The Chief Oncologist of Russia left his post because his
daughter and his deputy stole 39 million rubles. The Head of the Federal Agency for Fishery was involved in criminal
proceeding. The former Chairman of the State Commission for Academic Degrees and Titles stole 1.5 billion rubles.
That is, a criminal paradigm in Russia has completely changed. Deputies, officials, effective managers, as well as
intellectuals joined them and represented by doctors and teachers have become dashing ones”.
7Economic and social changes: facts, trends, forecast 1 (25) 2013
FROM THE CHIEF EDITOR V.A. Ilyin

Page unturned
Russian mass media is full of facts reflecting
the conflict between different groups of the
political elite8.
It seems that, when the staff of the
Government was formed, the President of
Russia excessively trusted people allowing
some of them, who did not explicitly or
implicitly support his policy thesis stated
not only in his well-known articles but in his
decrees dated May 7, 2012, to be included in
the Government.
What other reasons can explain the fact
that the Government did not build the funds
into the budget for 2013 and 2014 – 2015 to
implement the decrees dated May 7, 2012 on
the main points of modernizing the economy of
the country: increase in the salaries of teachers
and doctors since 2013; modernization of the
social sphere; the core funding of a military-
industrial complex was postponed for a period
after 2015.
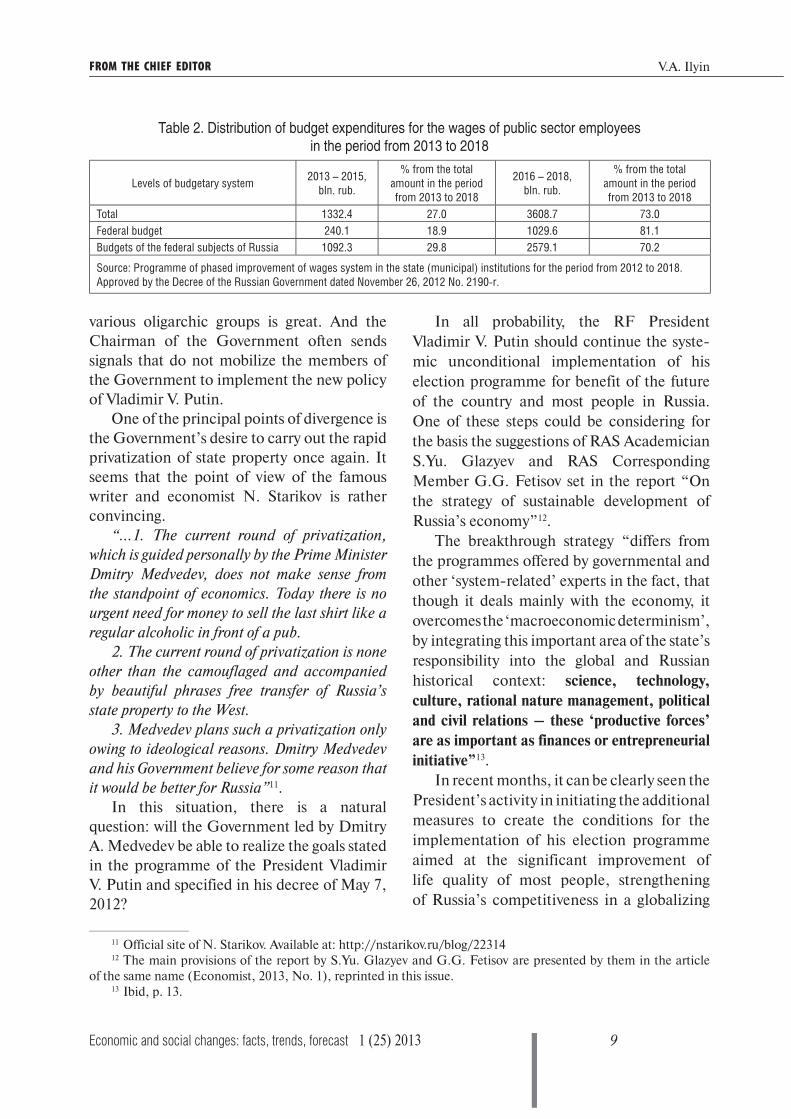
More than 70% of budget expenditures
on implementing the presidential decrees to
raise wages of public sector employees for the
period from 2013 to 2018 fall on the period
from 2016 – 2018 (tab. 2).
“Citizens of Russia will feel very quickly
the mistakes, which were not corrected by the
Duma, because the tasks to raise the wages of
state employees set by the President are not
secured with the real financing; it appears that
there is a hole in the regional budgets, which
can be covered by nothing. Therefore, it will
be not an increase in the wages of regions’ state
employees but a profanation”9.
“Some commentators explain the retreat
in financing of the social sphere by excessive
appropriations for rearmament. This is a delu-
sion: the Ministry of Finance treats the defense
industry not much better than education. Besides
that about a quarter of more than twenty trillion
promised for eight years falls on the three-year
period, and the Ministry of Finance shifted a
part of this money to the following budgetary
cycle replacing them by the loans of commercial
banks during the current cycle.
The federal budget adopted in the third
reading does not solve any problem: at best, it
cowardly moves them for the indeterminate
future. I’m not talking about the fact that it is
plain folly to throw out money saved due to the
castration of necessary expenses into formally
security Western bonds. Throwing hundreds of
billion rubles of our common resource rents into
this maelstrom as before is only a little bit wildly
than burning them”10.
In recent years, the most part of budget
funding was shifted onto the lower levels.
Governmental budget compels a significant
part of the regional budgets to increase the
national debt up to a critical point, increase
commercial loans, and thus, it tightens a debt
stranglehold.
Unfortunately, the increase in the role
of federal budget is not provided in years to
come.
All these and many other facts show that
the Government of Dmitry A. Medvedev
works in harness as “circular firing squad”,
because the influence of elite groups holding
8 See, for example, media reports: “Disputed assessments on the case of Khodorkovsky: Dmitry Medvedev –
he is “absolutely harmless” for the society; Vladimir Putin – “a thief should sit in jail”, he has “blood on his hands”
“(RIA-news, Grani.RU), “Letter of O. Golodets criticizing the Dima Yakovlev Law was sent to Vladimir Putin at
the request of Dmitry Medvedev” (Interfax, December 26, 2012); “Vladimir Putin noted the worsening economic
indicators and the lack of distinct strategy for the economic development of the country till 2018 at the enlarged
session of the Government of the Russian Federation (Rossiyskaya Gazeta, January 13, 2013); “Dmitry Medvedev
decided not to return “the winter time” despite the pre-election Putin’s promise (Gazeta.RU, February 7, 2013),
etc.9 Dmitrieva О. Citizens of Russia will feel very quickly the mistakes, which were not corrected by the Duma.
Kommersant FM, 19.11.2012. Available at: http://kommersant.ru/doc/206805510 Privalov А. On ostrich budget. Expert. 2012.No. 47. November 21.
8 1 (25) 2013 Economic and social changes: facts, trends, forecast
various oligarchic groups is great. And the
Chairman of the Government often sends
signals that do not mobilize the members of
the Government to implement the new policy
of Vladimir V. Putin.
One of the principal points of divergence is
the Government’s desire to carry out the rapid
privatization of state property once again. It
seems that the point of view of the famous
writer and economist N. Starikov is rather
convincing.
“…1. The current round of privatization,
which is guided personally by the Prime Minister
Dmitry Medvedev, does not make sense from
the standpoint of economics. Today there is no
urgent need for money to sell the last shirt like a
regular alcoholic in front of a pub.
2. The current round of privatization is none
other than the camouflaged and accompanied
by beautiful phrases free transfer of Russia’s
state property to the West.
3. Medvedev plans such a privatization only
owing to ideological reasons. Dmitry Medvedev
and his Government believe for some reason that
it would be better for Russia”11.
In this situation, there is a natural
question: will the Government led by Dmitry
A. Medvedev be able to realize the goals stated
in the programme of the President Vladimir
V. Putin and specified in his decree of May 7,
2012?
In all probability, the RF President
Vladimir V. Putin should continue the syste-
mic unconditional implementation of his
election programme for benefit of the future
of the country and most people in Russia.
One of these steps could be considering for
the basis the suggestions of RAS Academician
S.Yu. Glazyev and RAS Corresponding
Member G.G. Fetisov set in the report “On
the strategy of sustainable development of
Russia’s economy”12.
The breakthrough strategy “differs from
the programmes offered by governmental and
other ‘system-related’ experts in the fact, that
though it deals mainly with the economy, it
overcomes the ‘macroeconomic determinism’,
by integrating this important area of the state’s
responsibility into the global and Russian
historical context: science, technology, culture, rational nature management, political and civil relations – these ‘productive forces’ are as important as finances or entrepreneurial initiative”13.
In recent months, it can be clearly seen the
President’s activity in initiating the additional
measures to create the conditions for the
implementation of his election programme
aimed at the significant improvement of
life quality of most people, strengthening
of Russia’s competitiveness in a globalizing
Table 2. Distribution of budget expenditures for the wages of public sector employees
in the period from 2013 to 2018
Levels of budgetary system2013 – 2015,
bln. rub.
% from the total
amount in the period
from 2013 to 2018
2016 – 2018,
bln. rub.
% from the total
amount in the period
from 2013 to 2018
Total 1332.4 27.0 3608.7 73.0
Federal budget 240.1 18.9 1029.6 81.1
Budgets of the federal subjects of Russia 1092.3 29.8 2579.1 70.2
Source: Programme of phased improvement of wages system in the state (municipal) institutions for the period from 2012 to 2018.
Approved by the Decree of the Russian Government dated November 26, 2012 No. 2190-r.
11 Official site of N. Starikov. Available at: http://nstarikov.ru/blog/2231412 The main provisions of the report by S.Yu. Glazyev and G.G. Fetisov are presented by them in the article
of the same name (Economist, 2013, No. 1), reprinted in this issue.13 Ibid, p. 13.
9Economic and social changes: facts, trends, forecast 1 (25) 2013
FROM THE CHIEF EDITOR V.A. Ilyin

Page unturned
world, creation of all the necessary conditions
for inviolable sovereignty of the Russian
Federation.
Apparently, this is only the beginning of
painful purification of various power federal
and regional elite clans from all the kinds of
corrupt officials, immoral persons in political
and economic life of the country.
The solution of the main problem of the
early 1990s – unfair privatization – and it is the
base in large part of political clans, will require
system measures for not only “convincing”
the members of the Government, but also
improving moral climate in the country; and
it should be done without destroying the
capacity of the state, more than 45 million
electors of Vladimir V. Putin voted for this.
The President Vladimir V . Putin could
not turn over the page of unfair privatization
in 2012. It is 2013. We waited for a longer
time. But the RF President Vladimir V. Putin
should not stop, it is necessary to pull this
thorn out of the soul of a Russian citizen.
We must turn over the page!
It should be noted that the long sociological
monitoring shows the evolution of citizens’
estimates of political leaders, including the
Head of the state. The Editorial Board of the
Journal regularly publishes the results of this
monitoring that concerns the dynamics of
the changes in the population’s approval of
the President of the Russian Federation, the
Prime Minister, governmental institutes and
political parties.
If we compare the approval ratings of the
President Vladimir V. Putin in 2007, at the end
of his second term, and the approval ratings of
the President Dmitry A. Medvedev in 2011,
during the last year of his presidency, we can
see that Dmitry A. Medvedev lost from 25% to
30% of people who approved his activity as the
Head of the state (tab. 3). That is an objective
evaluation of his activities in the period from
2008 to 2011 by the region’s population.
Тable 3. Dynamics of the approval index of the RF President among different social groups in the Vologda
Oblast
Category Dec. 2007
(V.V. Putin)
Dec. 2011*(D.А. Medvedev)
Downward change
in index,
in points
Total population 163.5 116.0 47.5
20% with the highest income 170.2 130.0 40.2
Women 166.2 121.5 44.7
With specialized secondary education 168.5 119.8 48.7
60% with average income 170.5 118.8 51.7
Aged under 30 164.5 118.3 46.2
Aged over 55 167.8 118.1 49.7
With secondary and incomplete secondary education 158.7 115.8 42.9
Aged 30 – 55 160.5 113.5 47.0
With higher and incomplete higher education 164.2 112.8 51.4
Men 160.4 109.1 51.3
20% with the lowest income 149.6 96.7 52.9
* Ranked by December 2011.
A more detailed information is given below, in the diagrams (P. 16- 19).
10 1 (25) 2013 Economic and social changes: facts, trends, forecast

152.
0
132.
211
6.0
111.
611
7.0
125.
612
2.6
118.
811
8.7
126.
3
153.
316
3.5
80100
120
140
160
180
119.
911
1.2
112.
411
8.9
109.
111
0.7
108.
116
0.4
154.
8
129.
1
147.
711
5.2
80100
120
140
160
180
131.
512
4.7
123.
712
5.5
121.
911
4.3
121.
513
4.7
155.
515
2.1
166.
213
3.8
80100
120
140
160
180Dec
. 07
Dec
. 08
Dec
. 09
Apr
. 12
June
12
Aug
. 12
Dec
. 10
Dec
. 11
Feb.
12
Oct
. 12
Dec
. 12
Feb.
13
Fig.
1. P
opul
atio
n of
the
Volo
gda
Obl
ast
Fig.
2. M
en
Fig.
3. W
omen
Dyn
amic
s of
the
appr
oval
inde
x of
the
RF
Pres
iden
t am
ong
men
and
wom
en
Dyn
amic
s of
the
RF
Pres
iden
t’s a
ctiv
ity a
ppro
val i
ndex
*
Dec
. 07
Dec
. 08
Dec
. 09
Apr
. 12
June
12
Aug
. 12
Dec
. 10
Dec
. 11
Feb.
12
Oct
. 12
Dec
. 12
Feb.
13
Dec
. 07
Dec
. 08
Dec
. 09
Apr
. 12
June
12
Aug
. 12
Dec
. 10
Dec
. 11
Feb.
12
Oct
. 12
Dec
. 12
Feb.
13
Pres
iden
t of R
F –
V. P
utin
(May
7, 2
000
–M
ay 6
, 200
8)
Elec
tion
ofRF
Pre
side
nt
D. M
edve
dev
(May
7, 2
008)
Elec
tion
of
RF P
resi
dent
V.
Put
in
(Mar
ch 4
, 201
2)
Inau
gura
tion
ofRF
Pre
side
nt
V. P
utin
(M
ay 7
, 201
2)
Pres
iden
t of R
F –
V. P
utin
(May
7, 2
012
– re
cent
tim
e)
Th
e R
F P
resi
den
t’s
acti
vity
ap
pro
val
ind
ex h
as f
ixed
at
the
leve
l o
f 1
26
.3
po
ints
in
Fe
bru
ary
20
13
ex
ceed
ing
the
fig
ure
s fo
r th
e p
revi
ous
mo
nth
s in
20
12
an
d D
ecem
ber
20
11
.
Th
e R
F P
resi
den
t’s
acti
vity
ap
pro
val
ind
ex a
mo
ng
th
e m
en o
f th
e re
gio
n
has
in
crea
sed
in
Feb
ruar
y 2
01
3 a
nd
fixe
d
at
the
hig
hes
t le
vel
for
the
wh
ole
m
easu
rem
ent
per
iod
(1
19
.9
po
ints
).
Th
e R
F P
resi
den
t’s
acti
vity
ap
pro
val
amo
ng
wo
men
has
im
pro
ved
fo
r th
e
rece
nt
mo
nth
s:
the
rele
van
t in
dex
fixe
d
at
the
leve
l o
f 1
31
.5
po
ints
exce
edin
g t
he
fig
ure
s o
f th
e p
revi
ous
mea
sure
men
ts.
* T
he
bal
ance
of
po
siti
ve a
nd
neg
ativ
e re
spo
nse
s h
as b
een
mar
ked
by
a ye
llow
do
tted
lin
e (i
nd
ex is
equal
to
10
0 p
oin
ts)
Ind
ex a
bo
ve 1
00
po
ints
in
dic
ates
th
e p
red
om
inan
ce
of
po
siti
ve r
esp
on
ses
ove
r n
egat
ive
on
es (
gre
en),
in
dex
bel
ow
10
0 p
oin
ts –
th
e o
pp
osi
te s
ituat
ion
(re
d).
11Economic and social changes: facts, trends, forecast 1 (25) 2013
FROM THE CHIEF EDITOR V.A. Ilyin
Page unturned
135.
011
8.3
115.
711
4.9
118.
112
3.9
123.
211
5.2
129.
016
7.8
151.
215
6.1
80100
120
140
160
180
120.
912
0.8
114.
012
2.6
160.
5
154.
814
9.8
131.
911
3.5
105.
811
7.2
123.
9
80100
120
140
160
180
121.
212
2.4
118.
313
2.8
152.
2
167.
8
152.
913
0.4
118.
111
2.4
118.
313
4.7
80100
120
140
160
180
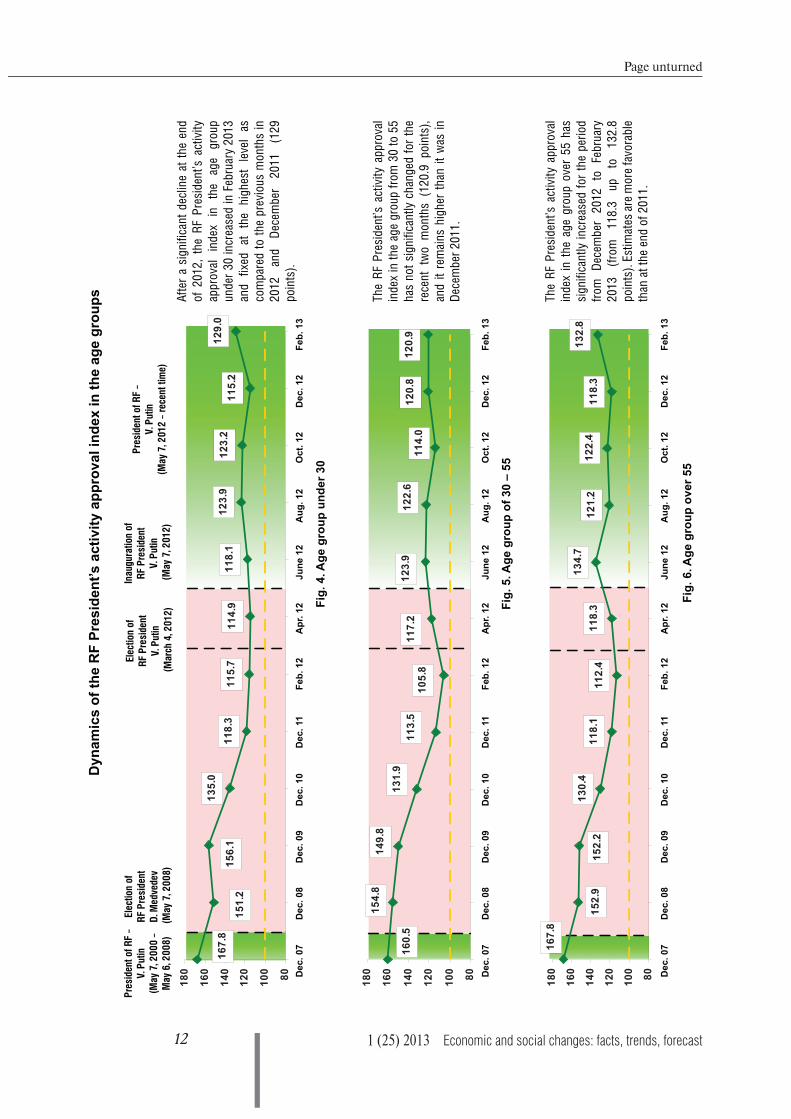
Fig.
4. A
ge g
roup
und
er 3
0
Fig.
5. A
ge g
roup
of 3
0 –
55
Fig.
6. A
ge g
roup
ove
r 55
Dec
. 07
Dec
. 08
Dec
. 09
Apr
. 12
June
12
Aug
. 12
Dec
. 10
Dec
. 11
Feb.
12
Oct
. 12
Dec
. 12
Feb.
13
Dec
. 07
Dec
. 08
Dec
. 09
Apr
. 12
June
12
Aug
. 12
Dec
. 10
Dec
. 11
Feb.
12
Oct
. 12
Dec
. 12
Feb.
13
Dec
. 07
Dec
. 08
Dec
. 09
Apr
. 12
June
12
Aug
. 12
Dec
. 10
Dec
. 11
Feb.
12
Oct
. 12
Dec
. 12
Feb.
13
Dyn
amic
s of
the
RF
Pres
iden
t’s a
ctiv
ity a
ppro
val i
ndex
in th
e ag
e gr
oups
Pres
iden
t of R
F –
V. P
utin
(May
7, 2
000
–M
ay 6
, 200
8)
Elec
tion
ofRF
Pre
side
nt
D. M
edve
dev
(May
7, 2
008)
Elec
tion
of
RF P
resi
dent
V.
Put
in
(Mar
ch 4
, 201
2)
Inau
gura
tion
ofRF
Pre
side
nt
V. P
utin
(M
ay 7
, 201
2)
Pres
iden
t of R
F –
V. P
utin
(May
7, 2
012
– re
cent
tim
e)
Aft
er a
sig
nif
ican
t d
eclin
e at
th
e en
d
of
2012,
the
RF
Pre
sid
ent’
s ac
tivi
ty
app
rova
l in
dex
in
th
e ag
e g
roup
un
der
30 i
ncr
ease
d i
n F
ebru
ary
2013
and
fi
xed
at
th
e h
igh
est
leve
l as
com
par
ed t
o t
he
pre
vio
us
mo
nth
s in
2012
and
D
ecem
ber
2011
(129
po
ints
).
Th
e R
F P
resi
den
t’s
acti
vity
ap
pro
val
ind
ex in
th
e ag
e g
roup
fro
m 3
0 t
o 5
5
has
no
t si
gn
ific
antl
y ch
ang
ed f
or
the
rece
nt
two
m
on
ths
(120.9
p
oin
ts),
and
it
rem
ain
s h
igh
er t
han
it
was
in
Dec
ember
2011.
Th
e R
F P
resi
den
t’s
acti
vity
ap
pro
val
ind
ex i
n t
he
age
gro
up
ove
r 55 h
as
sig
nif
ican
tly
incr
ease
d f
or
the
per
iod
fro
m
Dec
ember
2012
to
Febru
ary
2013
(fro
m
118.3
up
to
132.8
po
ints
). E
stim
ates
are
mo
re fav
ora
ble
than
at
the
end
of
2011.
12 1 (25) 2013 Economic and social changes: facts, trends, forecast

130.
212
9.2
125.
014
1.7
164.
216
7.9
149.
8
129.
111
2.8
109.
912
3.5
132.
8
80100
120
140
160
180
127.
712
2.8
118.
711
1.8
117.
811
8.8
119,
813
6.8
157.
114
6.2
168.
512
6.1
80100
120
140
160
180
120.
810
2.4
112.
211
3.9
116.
710
4.5
115.
813
0.4
149.
214
5.9
108.
8
158.
7
80100
120
140
160
180 Dec
. 07
Dec
. 08
Dec
. 09
Apr
. 12
June
12
Aug
. 12
Dec
. 10
Dec
. 11
Feb.
12
Oct
. 12
Dec
. 12
Feb.
13
Dec
. 07
Dec
. 08
Dec
. 09
Apr
. 12
June
12
Aug
. 12
Dec
. 10
Dec
. 11
Feb.
12
Oct
. 12
Dec
. 12
Feb.
13
Dec
. 07
Dec
. 08
Dec
. 09
Apr
. 12
June
12
Aug
. 12
Dec
. 10
Dec
. 11
Feb.
12
Oct
. 12
Dec
. 12
Feb.
13
Fig.
7. S
econ
dary
and
inco
mpl
ete
seco
ndar
y ed
ucat
ion
Fig.
8. S
peci
aliz
ed s
econ
dary
edu
catio
n
Fig.
9. H
ighe
r and
inco
mpl
ete
high
er e
duca
tion
Dyn
amic
s of
the
RF
Pres
iden
t’s a
ctiv
ity a
ppro
val i
ndex
in th
e ed
ucat
ion
grou
ps
Pres
iden
t of R
F –
V. P
utin
(May
7, 2
000
–M
ay 6
, 200
8)
Elec
tion
ofRF
Pre
side
nt
D. M
edve
dev
(May
7, 2
008)
Elec
tion
of
RF P
resi
dent
V.
Put
in
(Mar
ch 4
, 201
2)
Inau
gura
tion
ofRF
Pre
side
nt
V. P
utin
(M
ay 7
, 201
2)
Pres
iden
t of R
F –
V. P
utin
(May
7, 2
012
– re
cent
tim
e)
Th
e R
F P
resi
den
t’s
acti
vity
ap
pro
val
ind
ex am
on
g th
e p
eop
le w
ho
h
ave
hig
her
an
d
inco
mp
lete
h
igh
er
educa
tio
n
has
n
ot
sig
nif
ican
tly
chan
ged
fo
r th
e re
cen
t tw
o m
on
ths
(130.2
p
oin
ts).
E
stim
ates
ar
e m
ore
favo
rable
th
an a
t th
e en
d o
f 2011.
Aft
er
a sh
arp
d
eclin
e in
D
ecem
ber
2012,
the
RF
Pre
sid
ent’
s ac
tivi
ty
app
rova
l in
dex
am
on
g
the
peo
ple
wh
o h
ave
seco
nd
ary
and
in
com
ple
te
seco
nd
ary
educa
tio
n h
as s
ign
ific
antl
y
incr
ease
d (f
rom
102.4
up
to
120.8
po
ints
) in
ear
ly 2
013 e
xcee
din
g t
he
fig
ure
s o
f th
e p
revi
ous
mea
sure
-
men
ts.
Th
e te
nd
ency
to
im
pro
ve t
he
esti
ma-
tes
of
the
RF
Pre
sid
ent’
s ac
tivi
ty
amo
ng
th
e p
eop
le w
ho
hav
e sp
ecia
-
lized
se
con
dar
y ed
uca
tio
n,
wh
ich
beg
an i
n A
ug
ust
2012,
con
tin
ued
in
Febru
ary
2013.
Th
e ap
pro
val
ind
ex
reac
hed
127.7
po
ints
an
d e
xcee
ded
the
fig
ure
s o
f D
ecem
ber
2011.
13Economic and social changes: facts, trends, forecast 1 (25) 2013
FROM THE CHIEF EDITOR V.A. Ilyin

Page unturned
99.6
113.
7
88.5
96.3
100.
8
149.
6 129.
4
145.
2
96.7
101.
297
.8
124.
3
80100
120
140
160
180
139.
014
1.0
133.
013
2.4
170.
216
3.4
151.
614
8.4
130.
012
0.1
134.
012
7.4
80100
120
140
160
180
131.
812
0.3
121.
512
6.9
170.
515
6.8
156.
013
2.8
118.
811
0.7
118.
312
8.5
80100
120
140
160
180Dec
. 07
Dec
. 08
Dec
. 09
Apr
. 12
June
12
Aug
. 12
Dec
. 10
Dec
. 11
Feb.
12
Oct
. 12
Dec
. 12
Feb.
13
Dec
. 07
Dec
. 08
Dec
. 09
Apr
. 12
June
12
Aug
. 12
Dec
. 10
Dec
. 11
Feb.
12
Oct
. 12
Dec
. 12
Feb.
13
Dec
. 07
Dec
. 08
Dec
. 09
Apr
. 12
June
12
Aug
. 12
Dec
. 10
Dec
. 11
Feb.
12
Oct
. 12
Dec
. 12
Feb.
13
Fig.
10.
20%
with
the
low
est i
ncom
e
Fig.
11.
60%
with
ave
rage
inco
me
Fig.
12.
20%
with
the
high
est i
ncom
e
Dyn
amic
s of
the
RF
Pres
iden
t’s a
ctiv
ity a
ppro
val i
ndex
in th
e in
com
e gr
oups
Pres
iden
t of R
F –
V. P
utin
(May
7, 2
000
–M
ay 6
, 200
8)
Elec
tion
ofRF
Pre
side
nt
D. M
edve
dev
(May
7, 2
008)
Elec
tion
of
RF P
resi
dent
V.
Put
in
(Mar
ch 4
, 201
2)
Inau
gura
tion
ofRF
Pre
side
nt
V. P
utin
(M
ay 7
, 201
2)
Pres
iden
t of R
F –
V. P
utin
(May
7, 2
012
– re
cent
tim
e)
Th
ere
was
a s
ligh
t d
eclin
e in
th
e R
F
Pre
sid
ent’
s ac
tivi
ty a
pp
rova
l in
dex
in
the
gro
up
co
veri
ng
2
0%
o
f p
eop
le
wh
o h
ave
the
hig
hes
t in
com
es i
n t
he
reg
ion
in
th
e p
erio
d f
rom
Dec
ember
20
12
to
Fe
bru
ary
20
13
(f
rom
1
41
do
wn
to
1
39
p
oin
ts).
A
t th
e sa
me
tim
e, th
ese
esti
mat
es re
mai
n m
ore
op
tim
isti
c as
co
mp
ared
to
th
e p
revi
-
ous
mea
sure
men
ts.
Th
e R
F P
resi
den
t’s
acti
vity
ap
pro
val
ind
ex i
n t
he
gro
up
co
veri
ng
20
% o
f
peo
ple
wh
o h
ave
the
low
est
inco
mes
in
the
reg
ion
h
as
sig
nif
ican
tly
incr
ease
d (
up
to
99
.6 p
oin
ts),
but
it
rem
ain
s lo
wer
th
an t
he
neu
tral
lev
el.
Th
e R
F P
resi
den
t’s
acti
vity
ap
pro
val
ind
ex i
n t
he
gro
up
co
veri
ng
60
% o
f
peo
ple
wh
o h
ave
aver
age
inco
mes
in
the
reg
ion
(fr
om
12
0.3
up
to
13
1.8
po
ints
) in
Feb
ruar
y 2
01
3 a
s co
mp
a-
red
to
th
e p
erio
d o
f tw
o m
on
ths
ago
,
and
it
ex
ceed
ed
the
fig
ure
s o
f th
e
pre
vio
us
mea
sure
men
ts.
14 1 (25) 2013 Economic and social changes: facts, trends, forecast

Table 1. Estimation of power activity (How do you assess the current activity of..?)
Vertical power
structure
Approval,
in % to the total number of respondentsDynamics
indices,Feb. 2013
to Dec. 2011
Dynamics
indices,
Feb. 2013
to Dec. 2012Dec.
2011
Feb.
2012
Apr.
2012
June
2012
Aug.
2012
Oct.
2012
Dec.
2012
Feb.
2013
The President of the RF 51.7 47.3 50.3 54.5 53.7 50.9 53.3 55.5 1.07 1.04
The Chairman of the
Government of the RF52.9 52.6 51.7 49.5 48.5 47.1 48.3 47.9 0.91 0.99
The Governor of the
Vologda Oblast41.9 37.7 37.7 44.7 45.3 43.6 42.5 43.0 1.03 1.01
Vertical power
structure
Disapproval
in % to the total number of respondentsDynamics
indices,
Feb. 2013
to Dec. 2011
Dynamics
indices,
Feb. 2013
to Dec. 2012Dec.
2011
Feb.
2012
Apr.
2012
June
2012
Aug.
2012
Oct.
2012
Dec.
2012
Feb.
2013
The President of the RF 35.7 35.7 33.3 28.9 31.1 32.1 34.6 29.2 0.82 0.84
The Chairman of the
Government of the RF32.7 32.0 33.1 31.5 34.5 32.8 35.9 34.4 1.05 0.96
The Governor of the
Vologda Oblast6.1 33.8 32.6 31.8 32.7 33.7 35.4 33.8 0.94 0.95
Notes. Hereinafter, it is pointed out: green – improvement; yellow – without changes; red – change for the worse.
* The polls are held six times a year in Vologda, Cherepovets, and in eight districts of the oblast (Babayevsky
District, Velikoustyugsky District, Vozhegodsky District, Gryazovetsky District, Kirillovsky District, Nikolsky
District, Tarnogsky District, Sheksninsky District). The method of the survey is a questionnaire poll by place of
residence of respondents. The volume of a sample population is 1500 people aged from 18 and older. The sample is
purposeful and quoted. Representativeness of the sample is ensured by the observance of the proportions between
the urban and rural populations, the proportions between the inhabitants of settlements of various types (rural
communities, small and medium-sized city), age and sex structure of the adult population of the region. Sampling
error does not exceed 3%.
The coefficient of change shows the ratio of data for February 2013 to December 2011 and December 2012.
The results of the ISEDT RAS polls are available at www.vscc.ac.ru
As in the previous issues, we publish the results of the recent public opinion monitoring
of the state of the Russian society *.
The following tables show the dynamics of some parameters of social well-being and
socio-political sentiments in the Vologda Oblast for the period from December 2011 to
February 2013.
15Economic and social changes: facts, trends, forecast 1 (25) 2013
FROM THE CHIEF EDITOR V.A. Ilyin

Page unturned
Table 2. What party expresses your interests?
Party
In % to the total number of respondentsDynamics
indices,
Feb. 2013
to Dec. 2011
Dynamics
indices,
Feb. 2013
to Dec. 2012
Dec.
2011
Elections for
the State
Duma 2011,
fact
Feb.
2012
Apr.
2012
June
2012
Aug.
2012
Oct.
2012
Dec.
2012
Feb.
2013
United Russia 26.1 33.4 26.0 28.3 31.9 31.4 26.6 30.4 30.5 1.17 1.00
KPRF 13.4 16.8 10.1 11.4 10.0 9.5 10.4 12.2 9.7 0.72 0.80
LDPR 9.2 15.4 9.1 9.5 7.7 6.7 6.8 7.2 6.3 0.68 0.88
Just Russia 13.9 27.2 10.2 8.2 4.6 5.6 5.5 5.5 5.3 0.38 0.96
Other 4.6 – 3.1 3.2 2.8 2.3 2.4 3.5 3.5 0.76 1.00
No party 23.9 – 25.7 28.6 31.5 33.2 36.1 32.5 35.3 1.48 1.09
It’s difficult
to answer 9.0 – 15.8 10.8 11.6 11.1 12.3 8.7 9.3 1.03 1.07
Table 3. Estimation of social condition
In % to the total number of respondentsDynamics
indices,
Feb. 2013
to Dec. 2011
Dynamics
indices,
Feb. 2013
to Dec. 2012
Dec.
2011
Feb.
2012
Apr.
2012
June
2012
Aug.
2012
Oct.
2012
Dec.
2012
Feb.
2013
What would you say about your mood in the last days?
Usual condition, good mood
64.2 62.9 63.4 69.0 71.3 69.0 68.0 66.6 1.04 0.98
Feeling stress, anger, fear, depression
30.2 33.5 30.2 23.4 23.3 25.5 26.5 30.5 1.01 1.15
What statement, in your opinion, suits the current occasion best of all?
Everything is not so bad; it’s difficult to live, but it’s possible to stand it
78.6 74.9 76.5 77.3 73.2 77.5 79.9 75.5 0.96 0.94
It’s impossible to bear such plight
14.1 18.1 16.8 13.6 17.0 15.6 13.7 16.1 1.14 1.18
Consumer Sentiment Index
85.6 89.8 90.1 93.4 92.3 91.7 91.7 92.3 1.08 1.01
What category do you belong to?
The share of people who consider themselves to be poor and extremely poor
41.9 43.2 43.6 45.0 44.2 44.1 47.0 45.9 1.10 0.98
The share of people who consider themselves to have average income
42.2 44.9 46.5 45.3 43.4 44.7 43.4 44.3 1.05 1.02
jAs in the previous issues, we publish the journal articles rating in this one.
16 1 (25) 2013 Economic and social changes: facts, trends, forecast

* A
cco
un
t o
f th
e si
te’s
vie
win
g h
as b
een
car
ried
out
sin
ce 2
00
9, D
ecem
ber
, 1
2.
The
first
ten
art
icle
s, p
ublis
hed
in 2
01
0-2
01
3, a
cco
rdin
g t
o t
he
freq
uency
of
thei
r vi
ewin
g f
or
the
rece
nt
12
mo
nth
s (M
arc
h 2
01
2 —
Feb
rua
ry 2
01
3)
Rating
Artic
le
Tota
l tim
eof
read
ing
for t
he re
cent
12
mon
ths,
m
inut
es
Tota
l tim
e of
read
ing,
fo
r the
who
le
acco
untin
g pe
riod*
, m
inut
es
Num
ber
of v
iew
s fo
r th
e w
hole
ac
coun
ting
perio
d
Num
ber
of v
iew
s fo
r the
rece
nt
12 m
onth
s
Num
ber
of v
iew
s fo
r the
rece
nt
3 m
onth
s
Aver
age
time
of v
iew
ing
for t
he w
hole
ac
coun
ting
perio
d*,
min
utes
Issu
eRe
leas
e da
teAu
thor
s
1
Ag
ricu
lture
of
the
Vo
log
da
Obla
st o
n t
he
eve
of
Russ
ia’s
ac
cess
ion
to
th
e W
orl
d
Trad
e O
rgan
isat
ion
69
57
69
57
20
72
07
15
13
4N
o.2
1Ju
ne
20
12
An
ish
chen
ko N
iko
lay
Ivan
ovi
ch
Ivan
ova
Mar
ina
Nik
ola
yevn
a
Bilk
ov
Val
enti
n A
leks
eyev
ich
2
Mo
der
niz
atio
n o
f th
e R
uss
ian
eco
no
my
as
the
imp
erat
ive
of
the
coun
try’
s p
rosp
ecti
ve
inn
ova
tive
dev
elo
pm
ent
45
59
51
39
18
51
50
32
8N
o.1
6
Aug
ust
20
11
Ko
nd
ako
v Ig
or
An
ato
lyev
ich
3T
hre
ats
to t
he
reg
ion
’s e
con
om
ic s
ecuri
ty
and
th
e w
ays
to o
verc
om
e th
em1
48
23
16
91
60
66
14
20
No
.14
Ap
ril 2
01
1U
sko
va T
amar
a V
ital
yevn
a
Ko
nd
ako
v Ig
or
An
ato
lyev
ich
4Fi
scal
fed
eral
ism
an
d in
ter-
bud
get
rel
atio
ns
in t
he
Russ
ian
Fed
erat
ion
14
21
27
71
19
99
16
14
No
.13
Febru
ary
20
11
Ave
tisy
an Ish
khan
Art
ash
ovi
ch
5
Met
ho
do
log
y o
f th
e co
mp
arat
ive
esti
ma-
tio
n o
f th
e sc
ien
tifi
c an
d t
ech
nic
al p
ote
nti
al
of
the
reg
ion
10
81
34
96
18
35
48
19
No
.12
Dec
ember
20
10
Zad
um
kin
Ko
nst
anti
n A
leks
eyev
ich
Ko
nd
ako
v Ig
or
An
ato
lyev
ich
6D
emo
gra
ph
ic
pro
ble
ms
of
the
Rep
ublic
of
Bel
arus
and
th
eir
solu
tio
ns
10
70
13
70
98
76
23
14
No
.16
A
ug
ust
20
11
S
hak
ho
tko
Lyu
dm
ila P
etro
vna
7
Th
e p
ost
-cri
sis
eco
no
mic
d
evel
op
men
t
and
pro
spec
ts o
f in
no
vati
on
act
ivit
y in
th
e
Tom
sk O
bla
st
10
55
12
60
45
34
32
8N
o.1
5Ju
ne
20
11
Mya
kota
Eka
teri
na
Ale
ksan
dro
vna
Vo
robyo
v A
leks
and
r G
rig
ory
evic
h
Puti
lov
Ale
ksan
dr
Val
enti
no
vich
Zh
igan
ov
Ale
ksan
dr
Nik
ola
yevi
ch
8
Top
ical
issu
es o
f th
e im
pro
vem
ent
of
inte
r-
go
vern
men
tal
dea
ling
s in
th
e sy
stem
o
f
loca
l g
ove
rnm
ent
68
86
88
43
43
81
6N
o.1
9M
arch
20
12
Usk
ova
Tam
ara
Vit
alye
vna
Pec
hen
skay
a M
ariy
a A
leks
and
rovn
a
9
Ass
essm
ent
of
the
crit
ical
th
resh
old
valu
es
of
the
ind
icat
ors
o
f th
e st
ate
of
Russ
ian
so
ciet
y an
d t
hei
r use
in
th
e so
cio
-
eco
no
mic
dev
elo
pm
ent
man
agem
ent
62
66
26
30
30
11
21
No
. 2
2A
ug
ust
20
12
Gla
zyev
Ser
gey
Yury
evic
h
Lo
koso
v V
yach
esla
v V
enia
min
ovi
ch
10
Mig
rato
ry p
roce
sses
as
m
irro
red
by
the
tran
sfo
rmat
ion
s: b
ord
er r
egio
ns
in R
uss
ia5
50
81
13
71
84
22
No
.14
Ap
ril
20
11
Mik
hel
Eg
or
Ale
ksan
dro
vich
Kru
tova
Oxa
na
Ser
gey
evn
a
17Economic and social changes: facts, trends, forecast 1 (25) 2013
FROM THE CHIEF EDITOR V.A. Ilyin

18 1 (25) 2013 Economic and social changes: facts, trends, forecast
Glazyev S.Yu., Fetisov G.G.
On the strategy of sustainable development of Russia’s economy *The article contains the main provisions of the authors’ report on the economic development strategy
and presents a system approach to the analysis of the state and prospects of Russia’s economic
development in the conditions of worldwide instability. Furthermore, the article considers the proposals
for the implementation of an integrated system of government policy measures aimed at the development
and modernization of economy on the advanced structural and technological basis, the implementation
of which will enhance economic growth rates and promote the transition to innovation development.
Sergey Yu. GLAZYEVRAS Academician
On the methodology of elaboration and implementation of the priority development strategy
The transition of economy to innovation
development, the enhancement of investment
activity and other measures of curing ‘black oil
addiction’ have been constantly decilared
at the top governmental levels and in the
programme documents of state authorities.
However, it is already clear that these measures
are impossible to implement in time without a
sound economic policy.
We are convinced that the goals of transition
to innovation-driven development and the
recovery of investment activity should be and
can be achieved within 5 – 10 years. And the
tasks of economy modernization, connected
with the establishment of competitiveness and
DEVELOPMENT STRATEGY
Gleb G. FETISOVRAS Corresponding Member
* The article has been reprinted from the journal “Economist”, 2013, issue No.1 with the permission of the editorial board.

19Economic and social changes: facts, trends, forecast 1 (25) 2013
S.Yu. Glazyev, G.G. FetisovDEVELOPMENT STRATEGY
the characteristics of real economy, the above
mentioned approach is still used to justify the
estrangement of the state from handling the
tasks of economic development. This approach
results in systematic errors in economic
forecasting, incorrect formulation of reform
goals and failures in achieving the declared
objectives, simplification of the structure and
deterioration of the technological level of
economy, loss of its integrity and its break up
into fragments, absorbed by better organized
external entities1.
Judging by the forecasts of global economic
changes and the analysis of the state of the
economy, the perspective directions of its
development and measures for their imple-
mentation should be clearly defined, and the
necessary conditions should be created. At that
the main attention should be focused on the key
issues that can’t be handled in the framework
of market fundamentalism policy.
State and prospects of development in the conditions of structural changes in the global economy
The restoration of pre-crisis production
volume is not yet accompanied by the
modernization and elimination of structural
impediments to the country’s further economic
development. The growth without development,
which took place in the pre-crisis decade on the
basis of production and technology potential
left after the 1990s reforms, has exhausted
itself completely and its revival can’t be long-
lasting and sustainable. This is proved by the
experience of post-crisis industrial production
recovery, which in manufacturing industry
branches is characterized by a very rapid growth
of prices given a slow revival of production, the
volume of which has not reached the pre-crisis
level.
For overcoming the structural constraints
to economic growth, it is necessary to boost
investment and innovation activity on the basis
of priority development of the new technological
mode, which is possible only with maintaining
progress at the world level, can be implemented
gradually over the next 15 – 20 years, with the
first results of high-tech modernization to be
expected in 3 – 5 years already.
We would like to point out that socio-
economic policy should be primarily aimed at
achieving significant results, and not only
creating favourable conditions for modernization
relying on the actions of market mechanism. In
all the importance of institutional reforms,
the key condition of successful economic
development consists in the creation of
technologically advanced processing industry
with powerful export potential, consisting of
high-tech and innovation-active companies,
which get the bulk of their revenue from the
sales of high-tech products.
In order to achieve significant success in
carrying out the necessary structural and
technological modernization, the policy and
government management of economic
development should be carried out syste-
matically, pragmatically and creatively, without
artificially narrowing down the field of possible
measures by far-fetched rules, the theoretical
substantiation and practical applicability
of which in Russian conditions is highly
doubtful. In particular, it concerns the following
untenable requirements: sterilization of oil and
gas budget revenues and ‘excessive’ money
supply; removal of export duties; the state’s
renunciation of the ownership of enterprises
or their shares; the rejection of well-known
instruments of prices regulation, currency
exchange regulation and target-oriented
lending policy. It is necessary to abandon many
other principles of market fundamentalism
that are based on the superficial conviction
of its adherents that economy seeks the ideal
state of market balance, in which maximum
efficiency is achieved through the optimal use
of resources. And although theory and practice
long ago proved the inconsistency between
the axioms this approach is based on and,
consequently, the conclusions made hereto and

20 1 (25) 2013 Economic and social changes: facts, trends, forecast
On the strategy of sustainable development of Russia’s economy
average annual GDP growth rate at the level
not lower than 8%, industrial output – 10%,
investments in fixed capital – 15%, R&D
funding – 20%.
The necessity for the growth rates increase
is conditioned not by a desire to ‘catch up’ with
other countries, but by the logic of creating the
basic prerequisites for intensification of
investment and innovation processes for
implementing structural and technological
modernization in order to expand the socio-
economic development opportunities in the
long-term. At that, the singularity of the
current situation consists in the fact that, due
to the relatively high savings rate, the volume
of capital investment can be increased 1.5-fold
without reducing the level of consumption.
But the investment breakthrough is hampered
by the fact that the state and business export
hundreds of billions of dollars, accumulating
them in almost profitless Western financial
instruments, given the fact that business then
borrows them at the world market under 6 – 9%
per annum.
The policy of economic modernization and
development should proceed from a clear
understanding of the structural changes and
prospects of global socio-economic deve-
lopment, revealing national competitive
advantages, the promotion of which can
ensure the sustainable and rapid growth of
production under the emerging new wave of
economic recovery. Measures for overcoming
the consequences of the global crisis should
be coordinated with the strategic objectives of
socio-economic development.
When evaluating the global economic
development prospects, one should understand
the structural component of the crisis, which is
determined by the change of technological
modes and their corresponding long waves of
economic growth. The way out of this crisis
is connected with the ‘storm’ of innovations,
paving the way for the establishment of the new
technological mode.
At that, not only the technological structure
of the economy, but also its institutional system
will change, as well as the list of leading firms,
countries and regions. Those will thrive,
who will be the first to enter the path of the
new technological mode and catch up with
its new productions in the early stages of its
development. And, vice versa, along with the
formation of new technological paths, entering
them will become more and more expensive.
At present, the new technological mode in
its development is shifting from the ‘embryonic’
phase to the phase of growth. Its expansion is
constrained by a small scale and continuing
adjustment of relevant technologies, as well
as the unpreparedness of socio-economic
environment to their wide application.
However, despite the crisis, the expenses on the
development of state-of-the-art technologies
and the scope of their application are growing
in the advanced countries with a rate of
about 35% a year. Stock indices of high-tech
companies grow faster than average. According
to estimates, the crisis will end up with the
flow of a large part of the capital, remaining
after the collapse of financial bubbles, into the
productions of the new technological mode2.
After the structural adjustment (which will
last for 3 – 7 years) of the economies in the
leading countries on the basis of the new mode,
a new long wave of economic growth will begin.
At the same time, the balance of negative and
positive effects will be determined by the growth
rate of new productions, which compensate
for the compression of obsolete parts of the
economy.
The peculiarity of Russian economy,
impeding its modernization, is its technological
heterogeneousness, which manifests itself in
the considerable differentiation in the
profitability indicators of different economic
sectors. In market conditions, the low yield of
the majority of industries in manufacturing,
including its high-tech sector, hampers
economic modernization.

21Economic and social changes: facts, trends, forecast 1 (25) 2013
S.Yu. Glazyev, G.G. FetisovDEVELOPMENT STRATEGY
Overcoming this barrier is impossible
without active state policy. Delay in the
transition to such a policy leads to the increasing
backwardness of Russia’s economy concerning
the dynamics of establishing the new
technological mode, the development of which
will determine the development of the world
economy in the 20-year perspective.
The volume of national wealth that Russia
possesses, its available scientific-production,
personnel and intellectual potential allow using
the opportunities, which opened in the
conditions of the global crisis, for a breakthrough
to the new wave of economic growth. It is this
period of the global structural crisis that gives
the lagging countries a chance to work an
‘economic miracle’, i.e. a fast leap to the level
of developed countries through the priority
development of key industries and factors of
the new technological mode. This, as the world
experience of overcoming similar structural
crises in the 1970s and 1930s proves, requires
a powerful impetus of fixed capital renovation
on a fundamentally new technological basis.
For staying on the crest of the new wave of
economic growth, investments in the
development of productions of the new
technological mode should increase annually
not less than 1.5-fold, while the share of R&D
expenditures should reach 4% of GDP.
It is necessary to point out that the level of
investment and innovation activity required for
successful development, as a minimum, twice
exceeds the available capabilities of the current
financial and investment system. In our
opinion, the headstrong policy of quantitative
limitation of money supply (monetary base)
on the part of the Central Bank was the main
impediment to the development of Russian
economy during the post-Soviet period.
This monetary policy artificially narrowed
down the possibilities of the financial sphere
on the funding of capital accumulation, also
by attracting the savings of population and
enterprises, while the accumulation ratio
remained 1.5 times less than the savings
rate. These capabilities did not meet the
requirements of modernization of the real
sector, the profitable part of which in the
absence of the mechanism of refinancing from
internal sources refocused on the external
loaning sources, and the remaining part shifted
to the fixed capital decumulation.
The policy of ‘excessive’ revenues sterilization
actually meant the exchange of the state’s cheap
long-term money for expensive short-term loans
of foreign banks. Net loss from such a policy was
measured in tens of billions of dollars a year, not
to mention the loss of profits from the artificial
freezing of investment and innovation activity.
The restrictive policy of the Bank of Russia
leads to the exclusion of Russian banks from the
loan market and traps the country’s financial
system into foreign dependency. The gap
between the external and internal rates on the
money market causes domestic borrowers to
shift toward foreign credit sources. It is followed
by the continuing increase of external debt
and the involvement of the national financial
system in a vicious circle of inequitable external
economic exchange.
As it was mentioned earlier, the restrictive
monetary policy was accompanied by taking
abroad a significant part of budget revenues
from export duties. Meanwhile, if the budget
surplus provided by export revenues were directed
to the goals of modernization, development of
advanced innovation technologies existing in
Russia’s scientific-technological environment,
enhancement of development institutions and
stimulation of investment activity, then by the
onset of the global crisis the economy would
form the advancing structures of the new
technological mode, capable of preventing
capital depreciation and enhancing economic
growth. In this case, it could not only be
possible to avoid capital flight and the crisis
compression of production, but also to attract
international investment in the development of
new perspective niches for the sales of domestic
products in the world market.
22 1 (25) 2013 Economic and social changes: facts, trends, forecast
On the strategy of sustainable development of Russia’s economy
Unfortunately, we missed these opportunities
– the inflow of petrodollars has been redirected
to support American financial pyramids, while
the expenditures for the development of
Russia’s economy remained significantly below
world standards.
The results of the policy carried out in the
pre-crisis period indicate that the mechanism
of market self-organization can not provide the
rate of accumulation required for economic
modernization. In the absence of the state
policy of stimulating progressive technological
shifts, Russia’s economy was used as a donor of
the U.S. financial system, while continuing to
stagnate due to the lack of investments, which
was compensated only to a small extent by
direct foreign investments and long-term loans.
Under the crisis, financial authorities had
to change their policy by resorting to
unprecedented monetary emission in order to
save the banks and corporations that have
found themselves in the grip of external debt.
And although since then the refinancing
of commercial banks has become the main
channel of monetary emission, the extent
and timing of loan resources granting are
not adequate for the transition to sustainable
economic growth.
At present, the total amount of collateral
that is accepted by the Bank of Russia (the
Lombard list), is about 3.5 trillion rubles, which
is less than 10% of the banking system assets.
This limits the banks’ capacity to refinance
the economy crediting, forming the difference
between long-term and short-term rates, which
sharply reduces the enterprises’ demand for
loans, since the rates exceed the profitability
level of many economic sectors, generally
increasing the level of system risks (interest,
credit and exchange risks) in the country’s
financial system. Today, even top Russian
borrowers pay 10 – 12% per annum on loans
and more, which puts them in a worse position
compared to international corporations, which
pay from 1 to 2 – 3% per annum for attracting
financial resources.
Under all the global crisis scenarios,
Russia’s economic development opportunities will
depend not so much on external factors, as on
internal economic policy. By implementing the
following measures, Russia could substantially
improve its position in the world economy,
having achieved:
– priority formation of a new technological
mode and economic revival in the long wave of
its growth;
– considerable enhancement of domestic
banking and investment system efficiency;
– economic stabilization and creation of
a sustainable development zone in EurAsEC
and in case of favourable political conditions
– in CIS as well.
Priority directions of development policyFrom the science and technology viewpoint,
the priorities must comply with the perspective
guidelines of formation of the new technological
mode. From the macroeconomic viewpoint, they
should give an impetus to the growth of demand
and business activity. From the structural and
reproduction viewpoint, main productions
should, from a certain point, enter their own
development path of extended reproduction,
serving as ‘engines of growth’ for the economy.
From the socio-economic viewpoint, their
implementation should be accompanied by
the expansion of employment, increase of
actual wages and salaries and improvement of
employees’ qualifications, the general growth
of public welfare.
Science and technology forecasting allows
pointing out the key directions of forming the
new technological mode: biotechnology, based
on the achievements of molecular biology and
genetic engineering, nanotechnology, artificial
intelligence systems, global information
networks and integrated high-speed transport
systems. These should be supplemented by the
spheres that bear the new technological mode
and that are the major consumers of its products:
space technology, manufacture of construction
materials with predetermined properties,
23Economic and social changes: facts, trends, forecast 1 (25) 2013
S.Yu. Glazyev, G.G. FetisovDEVELOPMENT STRATEGY
aircraft industry, nuclear industry, solar power
engineering. Reserves in atomic, space-rocket,
aircraft and other science-intensive industries,
in molecular biology, genetic engineering and
nanotechnologies provide Russia with actual
opportunities for priority development of
the new technological mode and chances for
leadership in the respective areas of formation
of a new long wave of economic growth.
Naturally, when choosing the priorities, one
should not only proceed from breakthrough
technologies the country possesses, but also
take into account its current position in the
global division of labour. A significant part
of the domestic industry, including high-tech
branches, will, in the foreseeable future, work
for the needs of extraction and processing of
raw materials.
Agriculture, services sector, especially
housing and utilities and transport, as well as
education, health care and public administration
possess huge reserves for technological
modernization.
The formation of a new technological mode
will be accompanied by the intellectualization
of production, transition to the continuous
innovation process in most industries, and
lifelong education in most professions. There
will be a shift from the mass consumption
society to the society of development, in
which paramount importance will be attached
to scientific-technological and intellectual
potential, as well as life quality and environment.
Energy and material consumption of GDP will
reduce sharply.
The consumption structure will be
dominated by information, education, medical
services. It implies that science, education and
health care, being the basic branches of the new
technological mode, will play a crucial part in
economic modernization.
Key issues of the long-term economic
development strategy should comprise:
• establishment of the strategic planning
system, capable of identifying the prospective
directions of economic growth, as well as
directing the activities of state development
institutions for their implementation;
• provision of macroeconomic conditions
necessary for the priority growth of the new
technological mode;
• formation of institutions aimed at finan-
cing the projects for creation and development
of production-technological complexes of the
new technological mode and the spheres of
consumption of their products.
Creation of a strategic planning systemStrategic planning methodology envisages
a system of long-, medium - and short-term
forecasts of socio-economic development, the
choice of technological-economic development
priorities, their implementation mechanism
and tools, which involve a system of long-term
concepts, medium-term programmes and
indicative plans, institutions organizing the
related activities, as well as methods of control
and measures of responsibility for achieving the
necessary results.
In accordance with the system approach,
the documents on socio-economic, sectoral
and territorial strategic planning should make
up a single complex and they should be
developed on a common methodological basis
for ensuring coordination and hierarchical
integration of the elements of the strategic
planning system.
At the federal level, such a system might
include the following documents:
– the long-term (25 – 50 years) forecasts,
which provide various scenarios of economic
development depending on the options of
changes in external and internal objective
factors, as well as the options of socio-economic
policy;
– the medium-term (10 – 12 years) socio-
economic development concept coordinated
with the general scheme of production forces
development and distribution that determine
the main goals, tasks and priorities of the
country’s socio-economic development, the
composition of state target programmes of
different levels;
24 1 (25) 2013 Economic and social changes: facts, trends, forecast
On the strategy of sustainable development of Russia’s economy
– the indicative plan of socio-economic
development for a three-year period that sets
development indicators and measures for their
achievement (the term ‘indicative’ means that
the indicators of this plan serve as guidelines
for non-governmental authorities, but are
compulsory for all state power bodies, also
when determining the directives for state
representatives in the companies’ managing
bodies); medium-term state programmes:
federal, regional and branch-wise, that are
coordinated in investment issues as well, and
that ensure the achievement of the set goals;
– annual budgets and three-year budget
plans (on a sliding basis), which are formed on
the basis of the target indicators set in a concept,
indicative plan and medium-term programmes.
It is also necessary to establish standards of
responsibility for the achievement of planned
results and the use of the necessary tools of
macroeconomic policy, in addition: to set
the legal norms of economic responsibility of
organizations and management responsibility
of the leadership for the performance of target
development indicators established by the
government.
This requires the adoption of the efficient
federal law ‘On the state strategic planning’ that
determines the development procedures and
the status of planning documents, which need
to be taken into account when planning the
budget, monetary policy and making other
managerial decisions. The implementation
of development strategy should include active
industrial policy, which supports the expansion
of core branches of the new technological mode
and enhances ‘points of growth’.
All the main sections of the unified strategic
planning system should reflect spatial
peculiarities. This will allow additional
restrictions of potential economic growth
to be revealed and also the measures on its
enhancement to be developed through the
optimization of the regional structure of the
economy3.
The coordinated system of regional policy
institutions requires appropriate legislative
framework. First of all it is necessary to finalize
and adopt the RF spatial development concept,
which would form the system of spatial priorities,
and marked the place of territorial development
strategies and programmes in the system of
strategic management. Besides, it is necessary
to finalize and adopt a federal law on the regional
policy, which should stipulate the following
points: a hierarchical system of coordinated
levels, institutions and powers of the regional
policy (Federation – federal district – federal
subject – municipality); a common normative
and legal framework for drafting and approval
of planning and forecasting documents on the
regional development, which allows different
levels to retain their independence while
remaining the structural elements of a single
management system; the mechanisms for
monitoring the implementation of coordinated
obligations and ensuring the liability of the
subjects of management.
Maintenance of macroeconomic environment for sustainable development
Macroeconomic conditions promoting the
successful development of economy are
stipulated by the requirements of its fundamental
modernization on the advanced technological
basis. They include: extended reproduction at
the promising directions of the new technological
mode; the maintenance of favorable price
proportions for this purpose; the formation of
the system of support of innovation activity;
creation of the mechanisms providing long-term
crediting of investment projects.
To implement the above conditions, the
state uses the tools of fiscal, monetary,
antimonopoly and pricing policy.
The orientation of fiscal policy toward
development objectives stipulates the reduction
of tax burden on all kinds of innovation and
high-tech activities, as well as the priority
allocation of budget funds for supporting the
productions that are crucially important for the
establishment of the new technological mode.

25Economic and social changes: facts, trends, forecast 1 (25) 2013
S.Yu. Glazyev, G.G. FetisovDEVELOPMENT STRATEGY
Along with budget revenue sources
mobilization for boosting innovation activity,
it is necessary to expand the financial
opportunities of enterprises: to give them
the rights for capital assets revaluation at
the replacement cost and for establishing
accelerated depreciation standards for
machinery and equipment; to restore the
accumulation accounts for depreciation
deductions and establish obligatory control
over their proper use; to exempt the enterprises
from paying property tax on the assets side of
the acquired fixed capital during the first three
years of their usage; to set standards for the
recovery of profits tax paid in the current period
in the part of funds, allocated for technological
re-equipment.
The main reason for constant shortage of
funds for development purposes consists in the
fact that financial policy is oriented toward the
available resources of the state budget, which
are insufficient for maintaining the current
socio-economic stability and carrying out
structural and technological modernization
at the same time. The latter problem can be
solved only through the development of bank
loaning. The loan fund has been created for this
purpose, it is a tool of the RF Central Bank,
which, at present, is not used for implementing
the country’s socio-economic policy. Its active
application and the development of credit
requires extensive use of targeted refinancing of
commercial banks in line with the objectives of
budgetary, industrial and structural policy along
with significant increase in the role of internal
sources of money supply.
Monetary policy instruments should ensure
adequate money supply for the extended
reproduction and sustainable development of
the economy.
In order to eliminate artificial limitations of
the monetary policy conducted by the RF
Central Bank, its functions should be expanded
and completed with the objectives of stimulating
economic development, investment activity and
promoting employment, as it is done in many
developed and successfully developing countries.
The theory of economic development and
the practice of developed countries justify the
expediency of a comprehensive approach to the
formation of money supply linked to economic
development objectives and the tasks of
budgetary, industrial and structural policy
relying on the internal sources of money
supply and mechanisms of credit institutions
refinancing, provision with current liquidity,
expansion of opportunities for creating ‘long
money’, ensuring the direction of liquidity into
priority spheres.
The terms, on which commercial banks gain
access to the RF Central Bank refinancing,
should be linked with the obligations on using
credit resources for the financing of industrial
enterprises taking into account the priority
directions of economic development. This
will create efficient money supply mechanisms
focused on the crediting of the real sector of
economy and promote investments in the
priority directions of its development. This can
be effected by using a combination of certain
methods of the RF Central Bank’s money
supply formation. Such well-known methods
have been tested and employed by developed
countries and include indirect (refinancing
secured on bonds, bills of exchange and
other liabilities of solvent enterprises) and
direct (co-financing of state programmes,
provision of state guarantees, provision of
loans to development institutions) methods.
Accordingly, the refinance rate should not
exceed the average profit ratio of manufacturing
industry, and the timing of loans should
comply with a typical duration of an R&D
and production cycle in the real sector of the
economy (3 – 7 years) 4.
The main funding source of economic
modernization and growth should be found in
the issuing mechanism of providing refinancing
to commercial banks by the Central Bank under
their claims to the enterprises of the real sector
26 1 (25) 2013 Economic and social changes: facts, trends, forecast
On the strategy of sustainable development of Russia’s economy
and with regard to the increasing demand for
financing in the priority directions of developing
economy. The refinancing of commercial banks
and development banks by the Central Bank
should provide the banking sector with current
liquidity and the opportunities of forming
‘long-term money’, and it should provide the
state with a source of long-term crediting of
priority development directions.
Using such tools as the refinance rate, the
Lombard list of the RF Central Bank,
development corporations, state guarantees
on the loans taken by enterprises for
implementing priority investment projects,
and subsidizing interest rates, the government
can selectively influence monetary and credit
flows, providing the extended reproduction
of enterprises, as well as creating favourable
conditions for the growth of economic activity
in the priority directions of development. The
RF Central Bank should become a lender of
last resort, which will require great work on
the monitoring of the borrowers’ solvency, and
which will also demand higher requirements
to the performance of banks in analyzing and
selecting investment projects.
In order to avoid the pumping of unsecured
money into the economy, the RF Central Bank
can refinance commercial banks on the security
of long-term corporate bonds and promissory
notes of enterprises with the adjustment
coefficient of 50%, and under the guarantees of
the government and regional authorities – with
the adjustment coefficient of 70 – 80%, which
would make the sale of these debt obligations by
the banks unprofitable. Under this condition,
the Lombard list of the RF Central Bank can be
significantly expanded, including the promissory
notes of solvent enterprises operating in priority
directions of establishing the new technological
mode according to the list, approved by the
RF government, the collaterals of sponsoring
agencies of federal target programmes, as well
as the bonds of development institutions and
state-owned corporations.
We think that the admission of foreign
securities and foreign assets of Russian banks
as the collateral for lombard and other loans of
the RF Central Bank should be gradually
abandoned.
It is also expedient to stop the refinancing
of banks against the pledge of debt financial
instruments that do not direct investments in
fixed capital and innovations. We consider it
useful to establish the limit of financial and
credit leverage not only for banks, but also for
non-banking companies, limiting it to a double
value for the latter.
When calculating the liquidity, capital
adequacy and other indicators, the RF Central
Bank should not consider the obligations of
foreign states and non-residents to be more
reliable and liquid, than the similar obligations
of Russia and its residents.
For expanding the resource base of the
banking system it is expedient to cancel the
reservation of long-term deposits of natural
persons, subject to obligatory insurance: now
there is a ‘double encumbrance’. In addition,
the RF Central Bank could provide banks
with unsecured loans in the amount equal to
the part of population’s funds represented by
fixed-term deposits in rubles, provided that
the banks will use these loans for crediting
investments in the fixed capital of industrial
enterprises, which will promote the creation
of ‘long money’ sources.
The policy of development should include
another important element, which is the long-
term stabilization of the real exchange rate of
ruble. Otherwise, it will not be possible to
reduce the interest rates and extend the lending
of the real sector of the economy because the
banks might transfer credit resources on the
exchange market trying to gain super-profits
on the ruble devaluation. It is reasonable to
ensure the constant adjustment of the nominal
ruble exchange rate in proportion to the relative
decrease in its purchasing power.

27Economic and social changes: facts, trends, forecast 1 (25) 2013
S.Yu. Glazyev, G.G. FetisovDEVELOPMENT STRATEGY
At the same time, one should avoid excessive
pressure on the ruble exchange rate on the part
of the participants of foreign trade, as well as
the speculative capital.
For enhancing the sustainability and power
of the Russian currency and finance system, the
use of its own currency should be expanded,
supporting the expansion of national financial
institutions on the markets already explored
by Russia.
For expanding the use of rubles in international
settlements, the share of payments in rubles
should be consistently increased in foreign
trade, including in the export of raw materials,
metals, military equipment; it is also necessary
to ensure the ruble export crediting of Russian
goods, and reduce the cost of exchange
operations for the national currencies of the
states that are closely integrated with Russia
economically. The last task can be solved with
the help of the CIS Interstate Bank, which, due
to its correspondent relations with the central
banks of the CIS states, reduces manifold
the transaction costs of currency exchange
operations.
The expansion of the domestic market through
the creation of the Customs Union and,
subsequently, the EurAsEC common economic
space is an important direction of the develop-
ment strategy. The creation of integration
associations expands the development oppor-
tunities of the national economy, enhances
its resistance to external shocks, increases the
scale of activities and competitive advantages
of enterprises. Implementing a common anti-
crisis strategy, the EurAsEC states raise their
chances of overcoming the crisis and entering
the path of accelerated development.
It should be pointed out that the proposed
policy of money circulation does not imply the
abandonment of inflation targeting. It stipulates
the establishment of guidelines and, if neces-
sary, restrictions concerning the price index,
exchange rate fluctuations, interest rates,
the dynamics of money supply at the levels
necessary for ensuring economic modernization
and development.
The implementation of these measures will
provide the necessary level of money supply for
the recovery of investment and innovation
activity for modernization and economic
development. Unlike the current issuers of
world currencies, the crisis that Russia is
experiencing is not caused by the excess of
money supply and related financial bubbles,
but it is a structural crisis, caused by the
low efficiency and resource dependence of
the economy, complicated by its constant
insufficient monetization. Experiencing
an acute lack of investment and credit, the
country’s economy have been working flat out
for a long time. In order to recover the domestic
market, enhance innovation and investment
for modernization and priority development,
it needs a substantial increase in monetization
level, and the expansion of loaning and the
capacity of the banking system.
It should be pointed out that an important
measure of ensuring economic security is to
abandon the practice of employing major
foreign rating agencies, which proved their
partiality, bias and prejudice, for evaluating the
borrowers’ reliability. The regular shift of their
ratings in favor of American companies and
underrating of the companies of developing
countries trigger off the destabilization of the
latter, artificially downgrade their investment
attractiveness, entail enormous unjustified
losses and pose a threat to the national financial
systems. Obviously, the Bank of Russia should
use only the ratings of the Russian agencies,
as well as the results of its own monitoring,
including the refinancing of banks and their
implementation of prudential regulation
standards. The performance standards should
be set up for rating agencies, the ratings’
evaluation standards should be determined and
the development of domestic rating agencies
promoted.

28 1 (25) 2013 Economic and social changes: facts, trends, forecast
On the strategy of sustainable development of Russia’s economy
It is expedient to establish a rating agency
under EurAsEC that uses the model of sample
economy without budget deficit and balance of
payments, with a steadily low refinance rate
and a reliable mechanism of financial market
regulation. It is also necessary to create
domestic financial infrastructure as related
to consulting, audit, valuation and other
analytical organizations. For these purposes, it
is advisable to introduce the mandatory use of
their services by state-owned companies.
* * *
The breakthrough strategy differs from the
programmes offered by governmental and
other ‘system-related’ experts in the fact, that
though it deals mainly with the economy, it
overcomes the ‘macroeconomic determin-
ism’, by integrating this important area of the
state’s responsibility into the global and Rus-
sian historical context: science, technology,
culture, rational nature management, political
and civil relations – these ‘productive forces’
are as important as finances or entrepreneurial
initiative.
We are sure that only the policy, which con-
siders all the complexity of the modern world
and raises development issues with scientific
responsibility and diligence, can lead the coun-
try and each of its residents to success.
Therefore, the breakthrough strategy con-
cerns everyone. But its drafting and implemen-
tation is the ultimate priority of the top state
authorities in the first place. A swift break-
through to the advanced development level is
the only way to save and strengthen Russia in
the world where no one can be guaranteed a
bright future.
1 Glazyev S.Yu. (ed.) Market essentials. Moscow: “Ekonomika”, 2004; Glazyev S.Yu. Lessons of another Rus-
sian revolution: collapse of liberal utopia and a chance for ‘economic miracle’. Moscow: Publishing house “Eko-
nomicheskaya gazeta”, 2011.2 Perez C. Technological revolutions and financial capital: the dynamics of bubbles and golden ages. Moscow:
Delo, 2011.3 Fetisov G.G. Monetary policy and the development of Russia’s monetary system under globalization: national
and regional aspects. Moscow: “Ekonomika”, 2006.4 Fetisov G.G. Russian monetary policy: objectives, instruments and rules. Voprosy Economiki. 2008. No. 11.

29Economic and social changes: facts, trends, forecast 1 (25) 2013
DEVELOPMENT STRATEGY
UDC 336.14(470.12)
LBC 65.261.713(2Ros-4Vol)
© Povarova А.I.
Regional budget for 2013 – 2015: stability or survival?The next three-year budget has been enacted in the Vologda Oblast. According to the Senior
Executive Vice-Governor of the Vologda Oblast A.A. Travnikov, the discussion of the main financial
region’s law has been “the hardest over recent years because it is too difficult to drop down, especially
after a long period of sustainable growth”1. For the first time, the regional budget has not been adopted
in the first reading because it has left out of account the resources due to acute debt burden, which are
necessary for eliminating the crisis disproportions, making the conditions for economic growth and
dealing with the vitally important tasks of growth in the population’s prosperity defined by the President
of the Russian Federation in his election programmes. Meanwhile, clear and strict implementation of
these tasks is not only a matter of authorities’ prestige, but also social and political stability.
According to the basic parameters of the budget, the situation in the budgetary sphere will not
improve in the short term. Growing debts and debt service expense force the regional governments
to reduce funding of social programmes. The problem is aggravated by the fact that the Government
of the Russian Federation has not taken decisive measures to stabilize the sub-federal budgets. On
the contrary, the centralized model of the budgetary structure in the country is going to become a
true brake on socio-economic development, and it requires a cardinal re-examination of the current
fiscal policy.
Regional budget, debt burden, loaning, own revenue, deficit, the Decrees of the President of the Russian
Federation dated on May 7, 2012.
1 Speech by A.A. Travnikov at the public hearing on the forecast of the socio-economic development of the Vologda Oblast
and the draft law “On the regional budget for 2013 and the planning period of 2014 and 2015” dated November 21? 2012. Official
website of the Legislative Assembly of the Vologda Oblast. Available at: http://www.vologdazso.ru/analitic/8812/
Anna I.POVAROVAISEDT RAS Scientific Associate
Due to the significant integration of the
Vologda Oblast into the Russia’s and
international economic space, its budget was
formed on the base of key parameters of the
world and Russia’s economies. The global
economic situation will remain unstable in the
medium term in the context of the debt crisis
of the developed countries, which will require
4 or 6 years to be overcome. The growth rates
of the world economy, which began to slow
down in 2011, will have not recovered by 2016.
Russia’s economy will show moderate growth,
which will not exceed the pre-crisis level in
2015 (fig. 1).

30 1 (25) 2013 Economic and social changes: facts, trends, forecast
Regional budget for 2013 – 2015: stability or survival?
strong decline in investment activity. Increase
in the cost of tariffs of natural monopolies
will form the basis for the growth of budget
expenditures (tab. 1).
There is no doubt that financial resources
will not form sufficiently with such pessimistic
economic growth rates. According to the key
The regional budget of the Vologda Oblast
for the period from 2013 to 2015 was based
on the conservative scenario of economic
development in order to level budgetary risks.
It reflects the slowdown in economic growth against the background of the stagnation of
industrial production, consumer demand and
Figure 1. Growth rates of the world and Russia’s economy in 2008 – 2015, % to the previous year
3.1
-0.6
5.0
3.7 3.1
3.4 3.9 4.0
5.2
-7.8
4.3
4.3 3.5 3.7
4.3 4.5
-8
-6
-4
-2
0
2
4
6
2008 2009 2010 2011 2012 2013 2014 2015
World Russian
Table 1. Key macroeconomic indicators for drawing up the regional draft budget
of the Vologda Oblast for the period from 2013 to 2015
Indicators In fact 2012,
evaluation
Plan
2008 2009 2010 2011 2013 2014 2015
Gross regional product* 96.7 87.1 105.7 105.8 101.0 100.0 102.5 102.0
Industrial production index, to the previous year 95.3 90.5 111.1 104.8 99.5 101.5 102.0 102.5
Fixed capital expenditures * 85.9 71.5 96.9 153.4 98.6 74.0 107.6 79.0
Retailing turnover* 108.5 89.4 116.3 106.0 109.4 104.1 103.3 103.2
Real disposable incomes of people, % 98.7 90.4 108.6 100.2 110.0** 103.7 103.6 104.5
Inflation (CPI), December to December, % 114.3 107.2 109.2 105.7 107.0 105.5 104.5 104.5
Tariffs, % to the previous year
Electric energy 120.6 120.1 118.6 113.4 105.1 113.0 111.0 111.7
Natural gas 125.0 115.9 126.7 115.0 107.1 115.0 115.0 114.8
* In comparable prices, % to the previous year.
** January – October 2012.
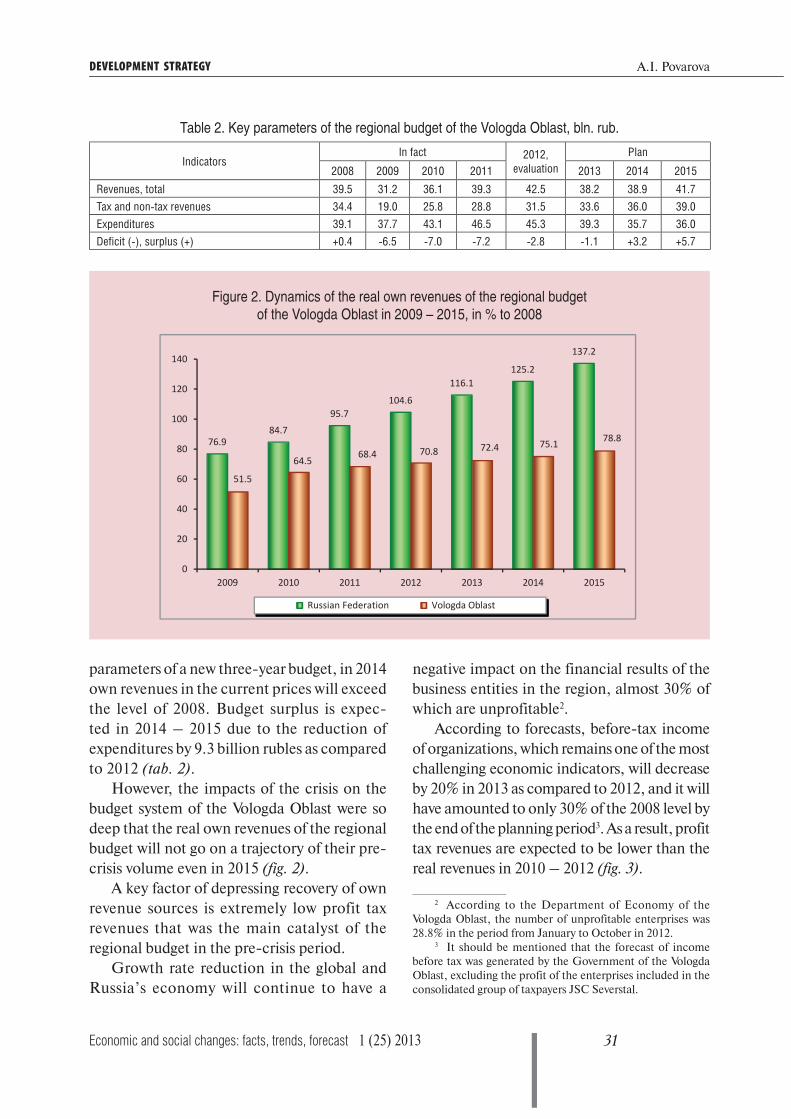
31Economic and social changes: facts, trends, forecast 1 (25) 2013
А.I. PovarovaDEVELOPMENT STRATEGY
Table 2. Key parameters of the regional budget of the Vologda Oblast, bln. rub.
Indicators In fact 2012,
evaluation
Plan
2008 2009 2010 2011 2013 2014 2015
Revenues, total 39.5 31.2 36.1 39.3 42.5 38.2 38.9 41.7
Tax and non-tax revenues 34.4 19.0 25.8 28.8 31.5 33.6 36.0 39.0
Expenditures 39.1 37.7 43.1 46.5 45.3 39.3 35.7 36.0
Deficit (-), surplus (+) +0.4 -6.5 -7.0 -7.2 -2.8 -1.1 +3.2 +5.7
Figure 2. Dynamics of the real own revenues of the regional budget
of the Vologda Oblast in 2009 – 2015, in % to 2008
parameters of a new three-year budget, in 2014
own revenues in the current prices will exceed
the level of 2008. Budget surplus is expec-
ted in 2014 – 2015 due to the reduction of
expenditures by 9.3 billion rubles as compared
to 2012 (tab. 2).
However, the impacts of the crisis on the
budget system of the Vologda Oblast were so
deep that the real own revenues of the regional
budget will not go on a trajectory of their pre-
crisis volume even in 2015 (fig. 2).
A key factor of depressing recovery of own
revenue sources is extremely low profit tax
revenues that was the main catalyst of the
regional budget in the pre-crisis period.
Growth rate reduction in the global and
Russia’s economy will continue to have a
76.9 84.7
95.7 104.6
116.1 125.2
137.2
51.5
64.5 68.4 70.8 72.4 75.1 78.8
0
20
40
60
80
100
120
140
2009 2010 2011 2012 2013 2014 2015
Russian Federation Vologda Oblast
negative impact on the financial results of the
business entities in the region, almost 30% of
which are unprofitable2.
According to forecasts, before-tax income
of organizations, which remains one of the most
challenging economic indicators, will decrease
by 20% in 2013 as compared to 2012, and it will
have amounted to only 30% of the 2008 level by
the end of the planning period3. As a result, profit
tax revenues are expected to be lower than the
real revenues in 2010 – 2012 (fig. 3).
2 According to the Department of Economy of the
Vologda Oblast, the number of unprofitable enterprises was
28.8% in the period from January to October in 2012.3 It should be mentioned that the forecast of income
before tax was generated by the Government of the Vologda
Oblast, excluding the profit of the enterprises included in the
consolidated group of taxpayers JSC Severstal.

32 1 (25) 2013 Economic and social changes: facts, trends, forecast
Regional budget for 2013 – 2015: stability or survival?
Figure 3. Dynamics of profit* and profit tax revenues of the regional budget
of the Vologda Oblast in 2008 – 2015, bln. rub.
* Before-tax income of profitable enterprises excluding agricultural organizations.
The main change in the sectoral structure of
the profit tax will be the reduction in the share
of budget-making enterprise JSC Severstal,
which became record even in 2012. At the same
time, the share of structural units of natural
monopolies and big banks, and local taxpayers
will increase (fig. 4).
These changes are caused by the predicted
worsening of global situation and, therefore,
production and financial indicators of the
metallurgy industry in the Vologda Oblast.
According to the forecasts of the RF
Ministry of Economic Development, the
multiple increases in prices in the export market
of ferrous metals that took place in the pre-
crisis period are not expected in the coming
years. With the falling price trend for steel,
steady excessive supply tendency will last until
2016 (fig. 5).
The volume of steel production will slow
down and the profit will reduce 6-fold as
compared to 2012 under the influence of the
unfavorable external environment (fig. 6). In
this case, only one company of JSC Severstal,
located on the territory of the region, JSC
Severstal-Metiz is expected to be profitable
according to the forecast of the Vologda Oblast’s
Government. Thus, the forecast parameters of
profit and profit tax allow us to say that the
role of the regional economic leader – the
Cherepovets Steel Mill – in the formation of
the financial resources will come to nothing in
the medium term.
However, the establishment of the con-
solidated group of taxpayers JSC Severstal
united 22 companies gives reason to hope for
an increase in profit tax revenues of steel
production4.
4 In January 1, 2013 the consolidated group of taxpayers
JSC Severstal included the largest resource companies JSC
Vorkutaugol, Karelskiy Okatysh and Olkon, which paid 2.8
billion rubles, 3.9 and 1.5 billion rubles, respectively, of profit
tax to the budgets of the Komi and Karelia republics and the
Murmansk Oblast in 2011.
99.5
22.6 21 26.8
31.7 25.3
28.1 29.2 20.8
4.8 10.8 12.0 10.5 8.9 9.7 10.3
60.5
25.3
41.7 41.8
33.3
27.7 26.8 26.3
0
10
20
30
40
50
60
70
0
10
20
30
40
50
60
70
80
90
100
2008 2009 2010 2011 2012 2013 2014 2015
Profit
Profit tax
The share of profit tax in the own budget revenues, %

33Economic and social changes: facts, trends, forecast 1 (25) 2013
А.I. PovarovaDEVELOPMENT STRATEGY
Figure 4. Sectoral structure of profit tax revenues to the regional budget
of the Vologda Oblast in 2008 – 2013
* JSC Severstal (in 2013, including the expected revenues of the consolidated group of taxpayers. Profit tax revenues of a key asset
of Severstal – Cherepovets Steel Mill – are not expected at all).
20
41.233.3
23.323.233.3
9.2
25.5
21.9
22.520.4
37.5
17.4
20.638.1
15.7
16.7
22.5
12.76.7
34.240.7
12.5
50.9
0%
10%
20%
30%
40%
50%
60%
70%
80%
90%
100%
2008 2009 2010 2011 2012 2013
Branches Local organizations Chemical production Metallurgical production*
Figure 5. Dynamics of production, consumption and prices
in the world steel markets in 2008 – 2015
Source: Official website of the RF Ministry of Economic Development. Available at: http://www.economy.gov.ru/minec/activity/
sections/macro/prognoz/
1341 1236
1429 1490 1503
1582 1673
1787
1218 1140
1312 1428 1473
1539 1621
1728
553
405 500
566
420 380 400 420
0
200
400
600
800
1000
1200
1400
1600
1800
2008 2009 2010 2011 2012 2013 2014 2015
World production, bln. t World consumption, bln. t World price, doll./t

34 1 (25) 2013 Economic and social changes: facts, trends, forecast
Regional budget for 2013 – 2015: stability or survival?
Figure 6. Dynamics of the key production and financial indicators* of steel production in 2008 – 2015
* In 2013 – 2015 excluding the consolidated group of taxpayers.
1.41.31.2
8.1
1.20.5
5.9
55.2101.5101.5105.2
113.8
91.5
90.2 98.0 100.0
0
10
20
30
40
50
60
2008 2009 2010 2011 2012 2013 2014 20150
20
40
60
80
100
120
Profit, bln. rub. Production index, % to the previous year
The role of the main budget-formed source
will move from the corporate profit tax to the
personal income tax in the next budget cycle.
The share of personal income tax in the own
revenues of regional budgets will rise to 38% in
2015 as compared to 23% in 2008 (fig. 7).
However, despite the increase in income tax
revenues, its share in budget revenues will be
not as substantial as the share of profit tax,
which amounted to 55 - 60% before the crisis.
This fact is caused by two reasons. Firstly,
according to the budget legislation, 80% of
personal income tax collected in the territory is
included in the regional budget. Secondly, the
Vologda Oblast is characterized by the lag of the
average wages from the national average level
that does not allow a significant increase in the
wages fund. The gap between the regional and
national average wage rates will accounts for 4.5
thousand rubles in 2013, and it will increase to
5.9 thousand rubles in 2015 (tab. 3).
In the context of budgetary resources
constraints, the Government of the Vologda
Oblast has taken decisive steps to optimize the
tax incentive policy in regard to property
taxation. If, the regional budget was short of
75 – 90% of corporate property tax revenues in
2009 – 2011, this indicator will reduced to 7%
in 2013 – 2015. Elimination of tax preferences
will allow increasing the regional treasury by 2.2
billion rubles annually (fig. 8).
In the field of non-tax revenues, we should
note the current practice of their underestimation
in the formation of the regional budget. Thus,
actual non-tax revenues have exceeded by 779
million rubles the revenues planned for 2013
(tab. 4).
Thus, budget planning do not take into
account all the reserves of its fullness, including
in terms of non-tax collection the fiscal
function of which is extremely low and points to
the problems of regional property management.
The implementation of the main directions
of region’s budget policy in the coming period
will be defined by the relationship with the
federal government.

35Economic and social changes: facts, trends, forecast 1 (25) 2013
А.I. PovarovaDEVELOPMENT STRATEGY
Figure 7. Dynamics of income tax revenues of the regional budget of the Vologda Oblast in 2008 – 2015
Table 3. Dynamics of the nominal imputed average monthly wage per employee
IndicatorIn fact 2012,
evaluation
Plan
2005 2006 2007 2008 2009 2010 2011 2013 2014 2015
Vologda Oblast 8.8 10.7 12.9 16.1 16.6 18.5 20.7 23.1 25.5 28.1 30.9
Russian Federation 8.6 10.6 13.6 17.3 18.6 21.0 23.4 26.8 30.0 33.1 36.8
The gap in the level of average wages between the Vologda Oblast and the Russian Federation
Thsd. rub. +0.2 +0.1 -0.7 -1.2 -2.0 -2.5 -2.7 -3.7 -4.5 -5.0 -5.9
% 2.3 0.9 5.1 6.9 10.8 11.9 11.5 13.8 15.0 15.1 16.0
Growth rates of wages
fund, %23.7 18.6 21.2 24.6 -5.0 12.3 8.7 13.5 10.3 10.1 9.7
Sources: data of Rosstat; forecasts of the socio-economic development of the Russian Federation and the Vologda Oblast for the period
from 2013 to 2015; author’s calculations.
Table 4. Dynamics of non-tax revenues of the regional budget of the Vologda Oblast in 2010 – 2015
Indicators 2010 2011 2012* 2013,
plan
2014,
plan
2015,
planplan fact plan fact plan fact
Non-tax revenues, bln. rub. 600.0 648.2 530.8 746.8 537.2 1316.4 776.1 836.9 854.0
The share in own revenues, % 2.9 2.5 1.9 2.6 1.8 5.1 2.3 2.3 2.2
* January – October 2012.
14.8
11.29.7
8.87.97.37.8
13.0
38.6
30.5 30.5 30.833.4
36.1
22.7
38.0
0
2
4
6
8
10
12
14
16
2008 2009 2010 2011 2012 2013 2014 20150
5
10
15
20
25
30
35
40
45
Bln. rub. The share in the own budget revenues, %
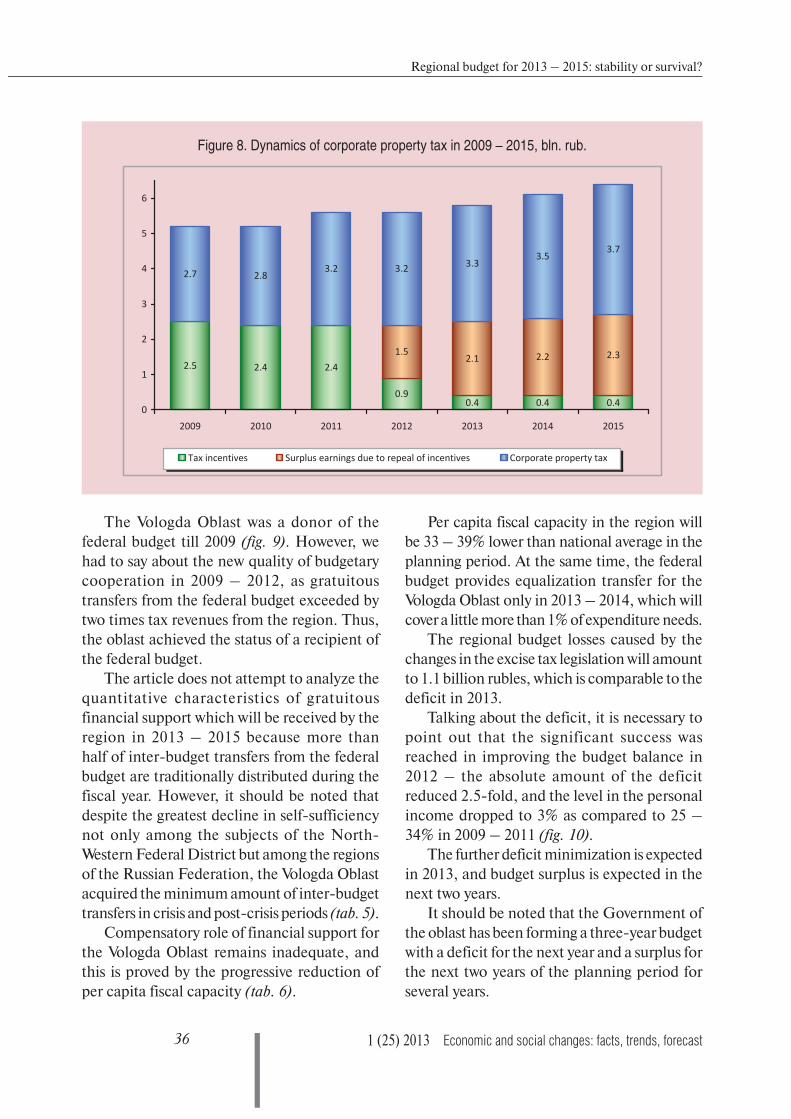
36 1 (25) 2013 Economic and social changes: facts, trends, forecast
Regional budget for 2013 – 2015: stability or survival?
The Vologda Oblast was a donor of the
federal budget till 2009 (fig. 9). However, we
had to say about the new quality of budgetary
cooperation in 2009 – 2012, as gratuitous
transfers from the federal budget exceeded by
two times tax revenues from the region. Thus,
the oblast achieved the status of a recipient of
the federal budget.
The article does not attempt to analyze the
quantitative characteristics of gratuitous
financial support which will be received by the
region in 2013 – 2015 because more than
half of inter-budget transfers from the federal
budget are traditionally distributed during the
fiscal year. However, it should be noted that
despite the greatest decline in self-sufficiency
not only among the subjects of the North-
Western Federal District but among the regions
of the Russian Federation, the Vologda Oblast
acquired the minimum amount of inter-budget
transfers in crisis and post-crisis periods (tab. 5).
Compensatory role of financial support for
the Vologda Oblast remains inadequate, and
this is proved by the progressive reduction of
per capita fiscal capacity (tab. 6).
Per capita fiscal capacity in the region will
be 33 – 39% lower than national average in the
planning period. At the same time, the federal
budget provides equalization transfer for the
Vologda Oblast only in 2013 – 2014, which will
cover a little more than 1% of expenditure needs.
The regional budget losses caused by the
changes in the excise tax legislation will amount
to 1.1 billion rubles, which is comparable to the
deficit in 2013.
Talking about the deficit, it is necessary to
point out that the significant success was
reached in improving the budget balance in
2012 – the absolute amount of the deficit
reduced 2.5-fold, and the level in the personal
income dropped to 3% as compared to 25 –
34% in 2009 – 2011 (fig. 10).
The further deficit minimization is expected
in 2013, and budget surplus is expected in the
next two years.
It should be noted that the Government of
the oblast has been forming a three-year budget
with a deficit for the next year and a surplus for
the next two years of the planning period for
several years.
Figure 8. Dynamics of corporate property tax in 2009 – 2015, bln. rub.
0.40.40.40.9
2.42.42.52.32.22.1
1.5
3.73.5
3.33.23.22.82.7
0
1
2
3
4
5
6
2009 2010 2011 2012 2013 2014 2015
Tax incentives Surplus earnings due to repeal of incentives Corporate property tax

37Economic and social changes: facts, trends, forecast 1 (25) 2013
А.I. PovarovaDEVELOPMENT STRATEGY
Figure 9. Gratuitous transfers from the federal budget to the regional budget
of the Vologda Oblast in 2006 – 2012, % to the oblast’s payments to the federal budget
Source: author’s calculations according to the data of the Treasury of Russia and the Federal Tax Service of Russia.
Table 5. Inter-budget transfers to the subjects of the North-Western
Federal District in 2009 – 2011, thsd. rub. per capita
Subject
Own revenues,
2009 to 2008,
%
2009To the average
indicator in RF 2010
To the average
indicator in RF 2011
To the average
indicator in RF
Nenets Autonomous Okrug 102.8 73.5 7.02 53.3 5.50 61.7 5.36
Kaliningrad Oblast 92.9 19.2 1.84 11.5 1.18 20.2 1.76
Pskov Oblast 100.3 11.2 1.07 12.8 1.30 18.2 1.58
Archangelsk Oblast 75.8 15.5 1.48 17.3 1.77 18.0 1.56
Republic of Karelia 88.3 12.4 1.19 13.1 1.34 14.6 1.27
Murmansk Oblast 96.4 14.8 1.41 11.7 1.20 13.5 1.18
Novgorod Oblast 102.6 10.4 0.99 7.4 0.76 11.9 1.03
Republic of Komi 88.5 9.5 0.91 7.4 0.76 10.0 0.87
Vologda Oblast 55.2 9.2 0.88 7.2 0.73 8.4 0.73Saint Petersburg 85.4 8.2 0.78 5.6 0.58 7.2 0.63
Leningrad Oblast 95.8 5.1 0.48 4.6 0.47 7.0 0.61
Russian Federation 83.7 10.5 1.00 9.8 1.00 11.5 1.00
Source: author’s calculation according to the data of the Treasury of Russia and Rosstat.
Table 6. Per capita fiscal capacity in the Vologda Oblast in 2008 – 2015
Indicators In fact Forecast
2008 2009 2010 2011 2012 2013 2014 2015
Fiscal capacity, thsd. rub. per capita 41.6 33.0 38.4 42.2 45.6 42.4 43.7 46.6
To the average indicator in RF (1) 0.95 0.79 0.84 0.79 0.81 0.67 0.64 0.61
Equalization transfer, bln. rub. 0 0 0 737.9 1332.5 821.1 229.0 0
Source: author’s calculation according to the data of the Treasury of Russia and Rosstat.; Laws on Federal budget and regional budgets of
the Vologda Oblast for the period from 2013 to 2015.
266.5
22.718.7 22.7
176.3 185.7
160.7
0
50
100
150
200
250
300
2006 2007 2008 2009 2010 2011 2012

38 1 (25) 2013 Economic and social changes: facts, trends, forecast
Regional budget for 2013 – 2015: stability or survival?
In reality, the budget process is far from the
scenario conditions and it forces to correct the
results of budget execution many times. Thus,
the budget for 2012 and 2013 were was initially
considered to be surplus ones, and deficiency –
during the formation of the main characteristics
of the next budget cycle (tab. 7).
Thus, the underestimation of the main
budget parameters in the context of limited
revenues specifies surplus coordinates for
budget projecting with the budget deficit,
reducing the continuity and predictability of
medium-term financial planning.
For the financing of budget deficit in 2013
it is planned to attract loans for more than
8 billion rubles from commercial banks, the
volume of these loans will be the maximum
(fig. 11). As a result of borrowing the costs for
their servicing in 2013 – 2014 will increase up
to 2.5 billion rubles and in their share will be
the fifth expenditure item of the regional budget
after social security, general education, road
fund and inter-budget transfers to the territorial
fund of compulsory health insurance.
Due to the planned allocation of significant
amount of budgetary funds for the return of the
achieved volume of debt and for the payment
of interest expenses, the risks of expenditure
obligations execution will increase. In 2013 –
2015 the Vologda Oblast uses 15 – 25% of its own
revenues for the public debt security (fig. 12).
Continuing the issue of the repayment of
loans, it is necessary to emphasize that the
expenditures directed for the repayment of the
credit sources of the budget deficit financing,
in accordance with the legislation are not a
legitimate article of expenses. Therefore, if they
are included in the expenditure part, then the
real budget deficit of the Vologda Oblast in 2013
will exceed the limits, and in 2014 the budget
will be executed with a deficit instead of the
expected surplus (tab. 8).
Figure 10. Dynamics of the regional budget execution results of the Vologda Oblast in 2009 – 2015, bln. rub.
* Deficit to own budget revenues, %
5.7
3.2
-6.5(34.1%)*
-7.0(27.3%)*
-7.2(25.0%)*
-2.8(8.9%)*
-1.1(3.5%)*
-8
-6
-4
-2
0
2
4
6
8
2009 2010 2011 2012 2013 2014 2015
Deficit (-), surplus (+)

39Economic and social changes: facts, trends, forecast 1 (25) 2013
А.I. PovarovaDEVELOPMENT STRATEGY
Table 7. Changes in the projected parameters of deficit
of the regional budget of the Vologda Oblast, bln. rub.
Item 2012 2013 2014
Draft budget for 2011 – 2013 2338.6 3256.1
Draft budget for 2012 – 2014 -4430.0 4838.0 4930.0
Draft budget for 2013 – 2015 -1167.8 3215.5
Figure 11. Dynamics of attracted loans and interest expenses
of the Vologda Oblast budget in 2009 – 2015, bln. rub.
Figure 12. Vologda Oblast budget expenditures on the repayment and servicing of debts in 2010 – 2015
Source: author’s calculations based on the data of the Treasury of Russia and the Vologda Oblast Finance Department.
5.1
6.6
2.9
8.1
0.3
4.7
2.83.3 3.1
1.8
2.52.5
0.50.2
0.81.3
2.0 1.9
0
1
2
3
4
5
6
7
8
9
2009 2010 2011 2012 2013 2014 2015
Banking Budgetary Interests costs
5.8
8.68.3
5.64.9
1.8
24.8
14.8
7.1
17.117.9
23.8
0
1
2
3
4
5
6
7
8
9
10
2010 2011 2012 2013 2014 20150
5
10
15
20
25
30
Bln. rub. In % to own budget revenues

40 1 (25) 2013 Economic and social changes: facts, trends, forecast
Regional budget for 2013 – 2015: stability or survival?
Thus, if additional funding sources in the
form of own revenues or subsidies on the
stabilization don’t be allocated by the federal
centre, there still most likely be the regional
budget deficit in the forecast period and once
again the low reliability of the three-year budget
planning will be proved.
The task of ensuring the return of borrowed
funds aimed at covering the deficit will be
addressed primarily by curbing the public
expenses. In real terms the expenditure part of
the budget will be reduced by almost 10 billion
rubles, or by one third as compared to the level
of 2011 (fig. 13).
The new budget does not stipulate the
changes in the structure of expenses and is
traditionally positioned as a socially oriented
one, but it is unlikely that such a budget can be
considered a merit of the ongoing fiscal policy.
In the future, social orientation will not allow
easily reducing the level of public expenses, so
that the additional resources could be allocated
for the repayment of accumulated debt, and in
the future for investing in the economy.
In 2013 – 2015 over 60% of allocations are
supposed to be used for financing the social
sphere (fig. 14).
One of the main tasks of the new cycle of
budget policy will consist in the implementation
of the RF President’s decrees dated May 7,
2012, first of all those, which concern the
gradual increase of salaries of budgetary sphere
employees. The importance of implementing
these decrees is determined by the fact that they
were signed in the framework of the President’s
election programme.
Table 8. Forecast of the actual results of the Vologda Oblast budget execution, mln. rub.
Indicators 2012 2013 2014 2015
Actual Real Planned Real Planned Real Planned Real
Deficit (-), surplus (+) -2812 -7131 -1168 -7441 3215 -2927 5659 1801
To the budget’s own revenues, % -8.9 -22.6 -3.5 -22.2 8.9 -8.1 14.5 4.6
Source: author’s calculations based on the data of the Vologda Oblast Finance Department.
Figure 13. Dynamics of the real expenditures* of the Vologda Oblast budget
in 2011 – 2015, bln. rub., in the prices of 2011
*For the purposes of comparability, the expenditures are stated without taking into account inter-budgetary transfers.
26.226.729.4
30.4
36.0
0
5
10
15
20
25
30
35
40
2011 2012 2013 2014 2015
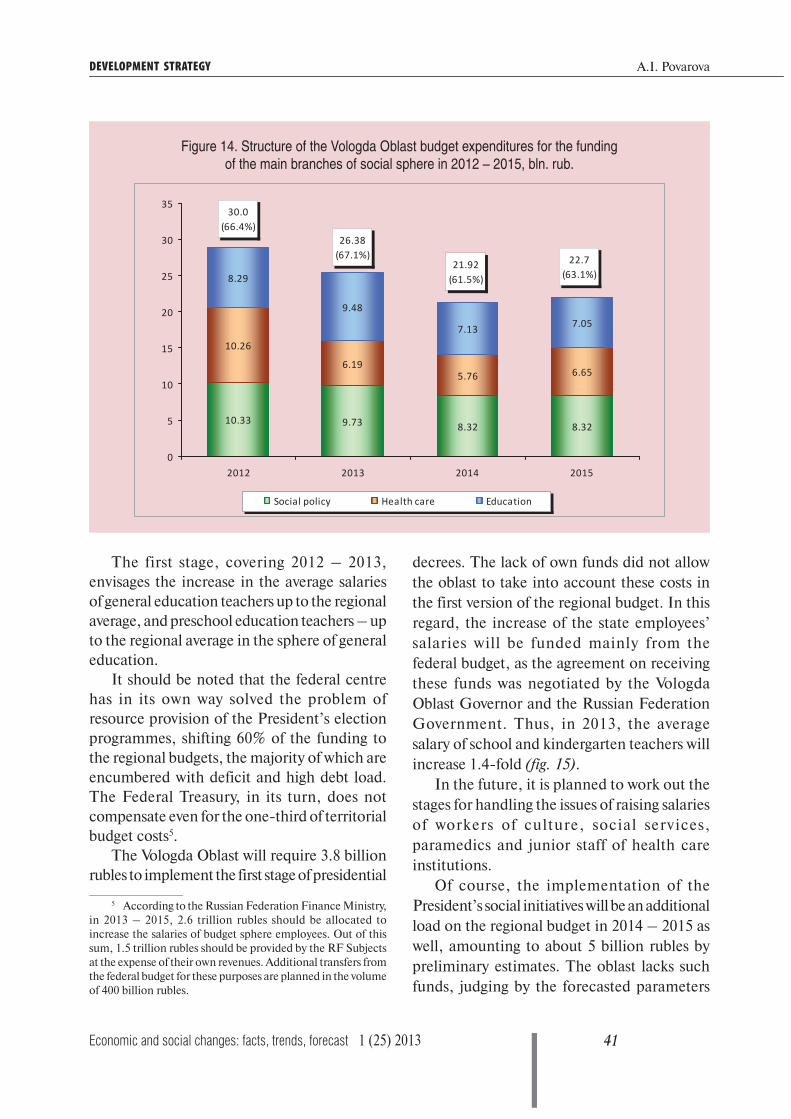
41Economic and social changes: facts, trends, forecast 1 (25) 2013
А.I. PovarovaDEVELOPMENT STRATEGY
The first stage, covering 2012 – 2013,
envisages the increase in the average salaries
of general education teachers up to the regional
average, and preschool education teachers – up
to the regional average in the sphere of general
education.
It should be noted that the federal centre
has in its own way solved the problem of
resource provision of the President’s election
programmes, shifting 60% of the funding to
the regional budgets, the majority of which are
encumbered with deficit and high debt load.
The Federal Treasury, in its turn, does not
compensate even for the one-third of territorial
budget costs5.
The Vologda Oblast will require 3.8 billion
rubles to implement the first stage of presidential
5 According to the Russian Federation Finance Ministry,
in 2013 – 2015, 2.6 trillion rubles should be allocated to
increase the salaries of budget sphere employees. Out of this
sum, 1.5 trillion rubles should be provided by the RF Subjects
at the expense of their own revenues. Additional transfers from
the federal budget for these purposes are planned in the volume
of 400 billion rubles.
decrees. The lack of own funds did not allow
the oblast to take into account these costs in
the first version of the regional budget. In this
regard, the increase of the state employees’
salaries will be funded mainly from the
federal budget, as the agreement on receiving
these funds was negotiated by the Vologda
Oblast Governor and the Russian Federation
Government. Thus, in 2013, the average
salary of school and kindergarten teachers will
increase 1.4-fold (fig. 15).
In the future, it is planned to work out the
stages for handling the issues of raising salaries
of workers of culture, social services,
paramedics and junior staff of health care
institutions.
Of course, the implementation of the
President’s social initiatives will be an additional
load on the regional budget in 2014 – 2015 as
well, amounting to about 5 billion rubles by
preliminary estimates. The oblast lacks such
funds, judging by the forecasted parameters
Figure 14. Structure of the Vologda Oblast budget expenditures for the funding
of the main branches of social sphere in 2012 – 2015, bln. rub.
8.328.329.7310.33
10.26
6.195.76 6.65
7.057.13
9.48
8.29
22.7(63.1%)
21.92(61.5%)
26.38(67.1%)
30.0(66.4%)
0
5
10
15
20
25
30
35
2012 2013 2014 2015
Social policy Health care Education
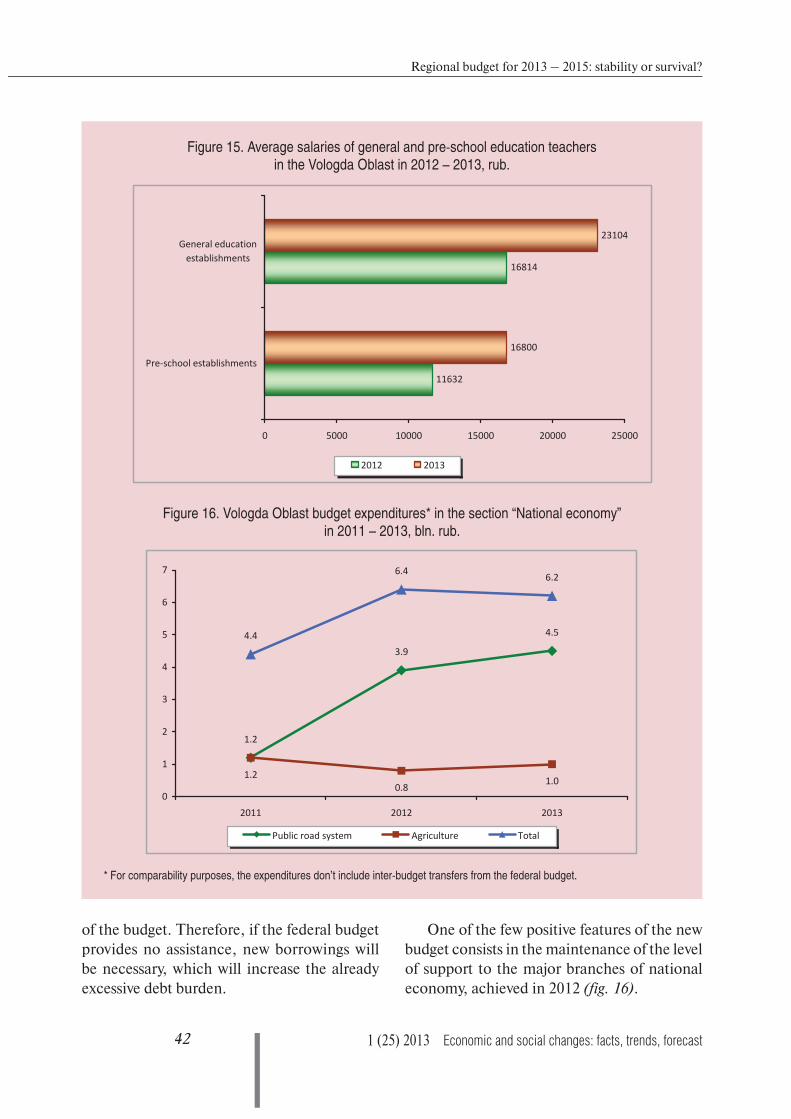
42 1 (25) 2013 Economic and social changes: facts, trends, forecast
Regional budget for 2013 – 2015: stability or survival?
of the budget. Therefore, if the federal budget
provides no assistance, new borrowings will
be necessary, which will increase the already
excessive debt burden.
One of the few positive features of the new
budget consists in the maintenance of the level
of support to the major branches of national
economy, achieved in 2012 (fig. 16).
Figure 15. Average salaries of general and pre-school education teachers
in the Vologda Oblast in 2012 – 2013, rub.
11632
16814
16800
23104
0 5000 10000 15000 20000 25000
Pre-school establishments
General educationestablishments
2012 2013
4.5
3.9
1.2
0.81.2 1.0
6.26.4
4.4
0
1
2
3
4
5
6
7
2011 2012 2013
Public road system Agriculture Total
Figure 16. Vologda Oblast budget expenditures* in the section “National economy”
in 2011 – 2013, bln. rub.
* For comparability purposes, the expenditures don’t include inter-budget transfers from the federal budget.

43Economic and social changes: facts, trends, forecast 1 (25) 2013
А.I. PovarovaDEVELOPMENT STRATEGY
Figure 17. Dynamics of capital investments of the Vologda Oblast budget
in 2008 – 2015, mln. rub., in the prices of 2008
In 2013 it is expected to allocate 18% of the
regional budget funds to the financing of the
national economy let alone non-repayable
revenues (in 2012 – 18.7%). At that, two-thirds
of the funding will be directed to the functioning
of the road fund. The agro-industrial complex
will remain the second priority direction, the
planned financing of which is more than 16%
of budget expenditures.
Despite the relatively sustainable dynamics
of state support to the subjects of national
economy, it should be noted that the socia-
lization of budget expenditures will impede the
formation of the development budget in the
near future. Moreover, the forecasted dynamics
of investments indicates that the oblast budget
has run out of reserves for achieving its balance
by the compression of investment expenses
(fig. 17).
As we can see, the years 2013 – 2015 will
face a rapid reduction of capital expenses in
their total volume as well as in the share of
budget expenditures. In 2015, budget invest-
ments in real terms will be less than 500
million rubles, having decreased almost 5-fold,
compared to 2012.
In recent years, many budget-related
problems of the Vologda Oblast have evolved
into an acute debt crisis. In 2012, the level of
its public debt, amounting to 93% in relation
to the own budget revenues, became critical.
The major part of additionally received own
revenues will be allocated to servicing the debt
in the planning period; however, the escalation
of the external funding sources of adopted
expenditure commitments will not substantially
reduce the debt load (fig. 18).
The structure of the state debt is dominated
by bank loans, the level of which will have reached
more than 70% of the accumulated debt by 2015
(tab. 9), this will require increased attention of
regional authorities to the debt problem.
In 2013 – 2015 in order to minimize debt
risks, it is not planned to provide state guaran-
tee support, consequently, the share of the
conditional part of state debt will reduce
4317
28332116 2360 2172
1243771 452
1.8
4.3
6.26.25.7
11.0
8.0
3.0
0
500
1000
1500
2000
2500
3000
3500
4000
4500
5000
2008 2009 2010 2011 2012 2013 2014 20150
2
4
6
8
10
12
Mln. rub. Share in budget expenses, %
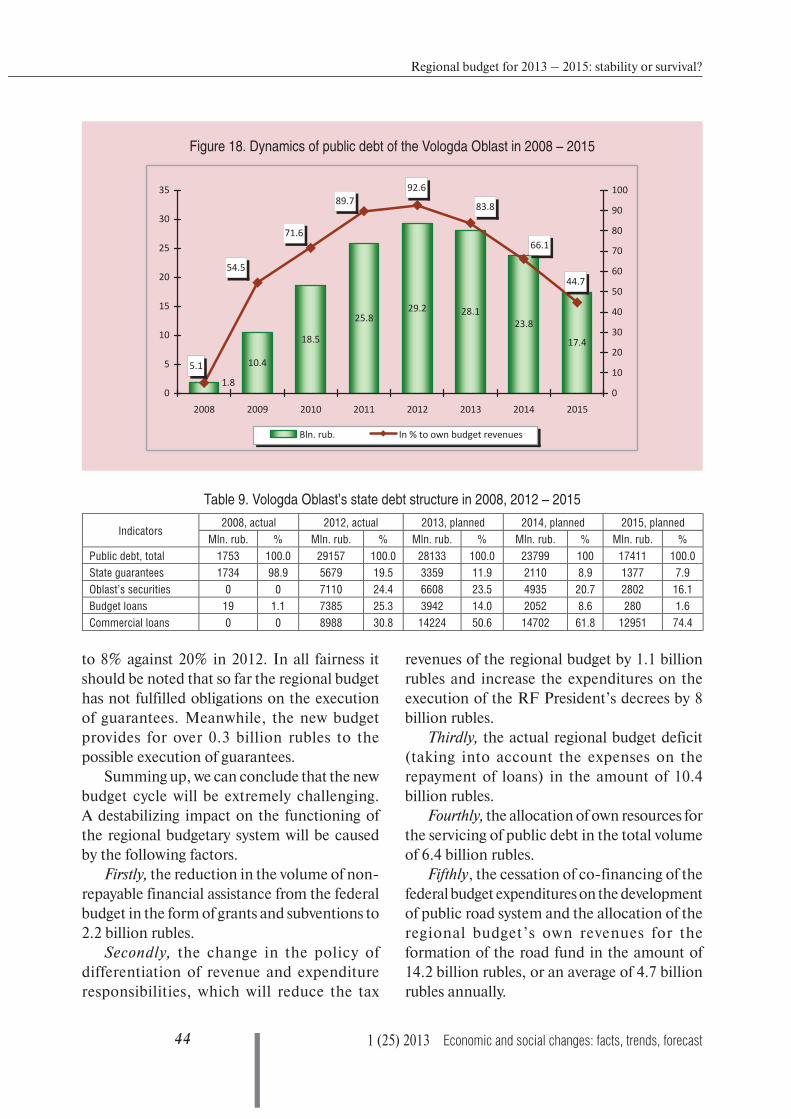
44 1 (25) 2013 Economic and social changes: facts, trends, forecast
Regional budget for 2013 – 2015: stability or survival?
Figure 18. Dynamics of public debt of the Vologda Oblast in 2008 – 2015
Table 9. Vologda Oblast’s state debt structure in 2008, 2012 – 2015
Indicators 2008, actual 2012, actual 2013, planned 2014, planned 2015, planned
Mln. rub. % Mln. rub. % Mln. rub. % Mln. rub. % Mln. rub. %
Public debt, total 1753 100.0 29157 100.0 28133 100.0 23799 100 17411 100.0
State guarantees 1734 98.9 5679 19.5 3359 11.9 2110 8.9 1377 7.9
Oblast’s securities 0 0 7110 24.4 6608 23.5 4935 20.7 2802 16.1
Budget loans 19 1.1 7385 25.3 3942 14.0 2052 8.6 280 1.6
Commercial loans 0 0 8988 30.8 14224 50.6 14702 61.8 12951 74.4
17.4
23.828.129.2
25.8
18.5
10.4
1.8
92.6
5.1
54.5
71.6
44.7
66.1
83.889.7
0
5
10
15
20
25
30
35
2008 2009 2010 2011 2012 2013 2014 20150
10
20
30
40
50
60
70
80
90
100
Bln. rub. In % to own budget revenues
to 8% against 20% in 2012. In all fairness it
should be noted that so far the regional budget
has not fulfilled obligations on the execution
of guarantees. Meanwhile, the new budget
provides for over 0.3 billion rubles to the
possible execution of guarantees.
Summing up, we can conclude that the new
budget cycle will be extremely challenging.
A destabilizing impact on the functioning of
the regional budgetary system will be caused
by the following factors.
Firstly, the reduction in the volume of non-
repayable financial assistance from the federal
budget in the form of grants and subventions to
2.2 billion rubles.
Secondly, the change in the policy of
differentiation of revenue and expenditure
responsibilities, which will reduce the tax
revenues of the regional budget by 1.1 billion
rubles and increase the expenditures on the
execution of the RF President’s decrees by 8
billion rubles.
Thirdly, the actual regional budget deficit
(taking into account the expenses on the
repayment of loans) in the amount of 10.4
billion rubles.
Fourthly, the allocation of own resources for
the servicing of public debt in the total volume
of 6.4 billion rubles.
Fifthly, the cessation of co-financing of the
federal budget expenditures on the development
of public road system and the allocation of the
regional budget’s own revenues for the
formation of the road fund in the amount of
14.2 billion rubles, or an average of 4.7 billion
rubles annually.

45Economic and social changes: facts, trends, forecast 1 (25) 2013
А.I. PovarovaDEVELOPMENT STRATEGY
In general, this refers to the amount of about
40 billion rubles, which is comparable to the
annual volume of the Vologda Oblast budget
revenues.
Obviously, the task of reducing the debt
burden, which was not solved in 2012, as well
as the search for the sources of own revenues
will form the agenda of the next budget cycle.
It seems that the efforts of regional authorities
should be concentrated on the following main
directions.
1. The continuation of the systemic inter-
departmental work on the legalization of
revenues and reduction of indebtedness on the
budget payments. According to the Vologda
Oblast Department of Finance, a “hidden”
individual income tax deficiency is assessed at
6.6 billion rubles. According to the oblast tax
agencies, the total accounts receivable of the
budget as of December 1, 2012 was 1.5 billion
rubles. The collection of the above sums would
solve the problem of the financing sources of
activities aimed at implementing the social
programmes of the RF President.
2. In order to strengthen the mobilizing
functions of non-tax revenues a number of
administrative measures should be imple-
mented, in particular: to make an inventory of
the property of the oblast treasury; to develop
objective methodologies of rents calculation;
to eliminate the facts of transferring regional
property in the free use of federal structures.
3. Implementation of further interaction
with federal authorities on the issues of
receiving additional financial assistance,
primarily to ensure the implementation of
presidential decrees and the functioning of
the road fund, as well as the restructuring of
the total indebtedness on the bank and budget
loans.
4. In the sphere of debt policy it is necessary
to diversify the borrowings through the
substitution of commercial loans for budgetary
loans and market borrowing (state securities of
the oblast), characterized by long terms and
competitive cost of service. For alleviating the
debt burden it will be necessary to intensify
efforts aimed at concluding agreements with
credit institutions for reducing interest rates and
the period of using the borrowed funds. Along
with the implementation of short-term tasks,
it will be necessary to change the priorities of
the debt policy, since borrowing, not focused
on the development and performing the tasks
of covering cash gaps can lead to a deep debt
crisis. The basic element of the state debt
management model should be a system of
risks evaluation and control, which allows
forecasting the possible debt threat6. Legislative
elaboration should be applied to the issues of
enhancing the personal responsibility of public
officials who make decisions concerning the
attraction of loans.
Meanwhile, the problem of increasing
profitable opportunities not only for the
Vologda Oblast, but also for the overwhelming
majority of Russia’s regions can be solved only
by changing the paradigm of inter-budgetary
policy.
To ensure the real fiscal federalism it is
necessary to decentralize the tax system.
Perhaps, it makes sense to resume the comp-
liance with the principles of classical fiscal
federalism, under which the number of revenues
forming the regional budgets, accounts for 50%
of their total number, as it was in the late 1990s7.
The significant increase in the revenues of sub-
federal budgets can be achieved through the
reform of individual property tax, the increase
of excise rates on alcohol, the enrollment of the
profit tax revenues8, the revenues from water
and other taxes and fees to the fullest.
6 An example of this approach can be found in the public
debt management system of Saint Petersburg.7 The share of the consolidated budget revenues of the
RF Subjects in the revenues of the RF consolidated budget in
2013 – 2015 will be 43.9%, 43.3% and 43.1% accordingly.8 According to the author’s calculations, transferring the
federal part of profit tax (2% of tax rate) to the regional level
will stimulate the inflow of profit tax revenues in the Vologda
Oblast budget by 1.6 bln. rub.
46 1 (25) 2013 Economic and social changes: facts, trends, forecast
Regional budget for 2013 – 2015: stability or survival?
The most important reserve of the regions’
revenue base increase is found in the reduction
of federal benefits on land and property taxes9.
The policy of unsustainable expansion of
benefits, without a comprehensive assessment
of their potential impact on budget revenues
and economic activity, not only worsens the
quality of budget management, but also poses
a threat to macroeconomic stability. Suffice it
to say that the scope of benefits provided by
the federal legislation in the VologdaOblast
in 2011 increased 5-fold as compared to 2006
and reached 3.8 billion rubles. This amount
is what the region needs for the first stage of
raising salaries for public sector employees. In
addition tax benefits in 2010 – 2011 exceed by
15% the corporate property tax revenues in the
regional budget.
The issue concerning the change of
conceptual approaches to the formation of
regional budgets requires urgent solving. The
most problematic RF subjects from the
viewpoint of self-sufficiency, such as the
Vologda Oblast, require the abandonment
of the practice of surplus budgets planning
advocated by the RF Finance Ministry, which
distorts the real condition of the state budget.
The efficiency of budget parameters execution
(deficit or surplus) must be determined taking
into account the expenditures allocated for
the return of the loans, which can not be
implemented so far without the appropriate
amendments to the current legislation.
Thus, the Vologda Oblast budget for 2013
and the planning period of 2014 – 2015, will,
in fact, become the budget of survival. Its main
task is to prevent deterioration of social
protection of the citizens, which will require
strict fiscal consolidation from the regional
authorities.
9 The necessity to abolish federal benefits on the territorial taxes has been repeatedly mentioned by the RF President, experts,
the State Duma deputies, and representatives of the power bodies of the RF subjects; however, this issue remains unsettled.
References1. Dmitriyeva O.G. We shall reach a new crisis with unresolved social problems. Moskovsky Komsomolets. 2012.
No. 26071. Available at: http://www.mk.ru/economics/interview/
2. Ilyin V.A., Povarova A.I. Problems of execution of the territorial budgets in 2011. Economics. Taxes. Law. 2012.
No. 5. P. 87.
3. On the execution of budgets of the subjects of the Russian Federation for 2008 – 2011: statements of the Treasury
of Russia. Official website of the Federal Treasury. Available at: http://www.roskazna.ru/reports/mb.html
4. On the budgetary policy in 2013 – 2015: the Budget Message of the President of the Russian Federation.
Reference-search system ConsultantPlus. Available at: http://www.consultant.ru/
5. About the regional budget for 2011 – 2013, 2012 – 2014 and 2013 – 2015. The legislation of the Vologda Oblast.
Reference-search system ConsultantPlus. Available at: http://www.consultant.ru/
6. Povarova A.I. Formation of regional budget in crisis. Economic and social changes: facts, trends, forecast. 2010.
No. 2. P. 101.
7. Povarova A.I. The three-year budget: should we wait for stability? Economic and social changes: facts, trends,
forecast. 2011. No. 2. P. 20.
8. Povarova A.I. The regional budget of 2012 – 2014: stability is delayed. Economic and social changes: facts, trends,
forecast. 2012. No. 3. P. 39.
9. Drobyshevskiy S., Malinina T., Sinelnikov-Murylyov S. The basic directions of reforming the tax system in the
medium term. Economic policy. 2012. No. 3. P. 20.
10. Social and an alternative version of the Federal budget – 2013: continuing “the same old story”. Russian economic
journal. 2012. No. 5. P. 34.

47Economic and social changes: facts, trends, forecast 1 (25) 2013
DEVELOPMENT STRATEGY
UDC 338.1(470.1/.2)
LBC 65.374.6(235.1)
© Vasilyev A.M.
Comprehensive approach to arranging marine economy in the Western Arctic
The article substantiates the necessity of using integrated management of marine economy in the
West-Arctic shelf, primarily in the Barents Sea. It studies the experience of applying marine spatial
planning, the projects of environmental impact assessment, the methodology of integrated coastal zone
management. The necessity to improve the Russian Federation legislation is shown in order to eliminate
contradictions in integrated management.
Marine economy, integrated management, marine spatial planning, environmental impact assessment,
integrated coastal zone management.
Anatoliy M.VASILYEVDoctor of Economics, Head of the Arctic Marine Economics Department
at G.P. Luzin Institute of Economic Problems of Kola Scientific Centre of RAS
The Arctic and Atlantic sectors, being the
areas of the national marine strategy imple-
mentation, include a number of territories and
waters, which are very important for Russia
geographically and functionally. One of the
most outstanding areas in the sector is the
Barents Sea, which is distinguished by the two
crucial factors: firstly, its special geopolitical
and military-strategic role and, secondly,
the abundance of natural resources. At
present, these factors, due to the increasing
contradictions of globalization are turning into
competitive advantages [3, 6].
The whole range of countries, as well as
Russia, consider the Barents Sea to be a very
attractive area for exploring its natural-resource
potential due to its favourable economic
and geographical position, the possibility of
year-round navigation with the direct access
of international trade routes to markets in
Europe and the U.S. combined with large
hydrocarbon reserves and highly productive
biological resource base of the shelf. There
is every indication that by 2020 the region
will have become one of the most important
areas of fuel resources development and a
significant factor of global energy security.
But, at the same time, the Barents Sea cannot
be allowed to lose its status as one of the most
important biological resource basins of the
global ocean and experience negative effects
from the development of offshore oil and gas
production. Therefore, the Barents Sea will
inevitably transform into an ‘integrated area’
requiring the rational use of resources and
nature management.
In the last 10 – 15 years, the issues of com-
plex (integrated) approach to the management
of marine natural and economic systems have
acquired greater importance [1, 4, 7, 11].
48 1 (25) 2013 Economic and social changes: facts, trends, forecast
Comprehensive approach to arranging marine economy in the Western Arctic
achievement of social and economic objectives
through planning and open discussions. Marine
spatial planning, being an efficient method of
functional zoning and strategic assessment of
marine areas utilization opportunities, despite
certain application limitations caused by the
current absence of relevant legislation, can
become a useful tool in the development of
coastal marine component of the strategies
and comprehensive programmes on the socio-
economic development of coastal territories.
The development of marine spatial planning
is one of the promising directions for enhancing
the marine activities management system, and
it is stated in the Strategy for the development
of marine activity of the Russian Federation
up to 2030 [9].
The Integrated Management Plan for the
Barents Sea, elaborated by Norway in 2002
– 2006 is a successful example of the world
experience in marine activity management in
the Arctic Region. The plan is chiefly aimed at
creating favourable conditions for sustainable
exploitation of the Barents Sea resources, the
development of transport and other production
activities, maintaining at the same time the
structure, functions and productivity of exis-
ting ecosystems. Other examples include the
Eastern Scotian Shelf Integrated Management
Plan (Canada, 1998 – 2007), the Irish Sea Pilot
Project (Great Britain, 2002 – present), the
General Plan for the Belgian part of the North
Sea (Belgium, 2003 – 2005) the Integrated
Management Plan for the North Sea, 2003 –
present), the Spatial Plan for the North Sea and
Baltic Sea, 2004 – present) [10].
Economic activity within individual seas
(transport, fishery, oil and gas extraction, etc.)
does not form a unified system and it is not
aimed at obtaining the integrated useful
result. Such concepts as ‘fish industry’, ‘ship
repair complex’, ‘oil and gas complex’, etc.
illustrate the fact. A single marine complex
on a national or regional scale is formed only
with the enhancement of rational interrelations
It is conditioned by the inefficiency of the
branch-wise and departmental approaches to
management, which causes tensions between
the users of natural resources and the increasing
anthropogenic threats to marine ecosystems
in the areas of intensive economic activity.
Developed countries have been recently
using marine spatial planning (MSP) based
on the ecosystem approach to the marine
activities planning and management as the
main tool for the implementation of marine
policy. The Study of MSP methodology shows
that its goal is to create conditions for the
efficient coexistence of various industries, in
particular: fishery, oil and gas activities and
maritime transport. MSP should promote
the elaboration of a common stand in the
management of the considered marine area
among the representatives of various industries,
local, regional and central authorities, as well
as among nature conservation organizations
and groups representing other interests, in the
framework of sustainable development.
Marine spatial planning is currently a tool
of integrated coastal zone management
(ICZM) and the implementation of marine
policy. It promotes the system and long-term
use of the marine environment through a more
rational and efficient organization of maritime
space, the regulation of interaction between
its different users, as well as by ensuring the
balanced development of marine activities and
protection of marine environment.
MSP is a way to improve the efficiency of
decision-making on the issues of organizing
human activities in marine environment, based
on ecosystem approach. It provides an oppor-
tunity for a complex, long-term and consistent
regulation of marine space utilization. The
purpose of marine spatial planning consists
in promoting a more rational usage of marine
space and interaction between utilization
types; furthermore, MSP should bring the
development requirements in accordance with
environmental protection and contribute to the

49Economic and social changes: facts, trends, forecast 1 (25) 2013
A.M. VasilyevDEVELOPMENT STRATEGY
and the achievement of the optimal combina-
tion of major marine and coastal economic
sectors. First of all, these processes involve
integrated marine areas.
Thus, marine and coastal ecosystems in the
Global Ocean serve as the basis for ‘planning
and management units’, and sectoral marine
complexes – as their superstructure. These
components are united most adequately in the
concept ‘regional marine economic complex’
(RMEC), which is a form of unification of
nature, economy and society.
The internal spatial relationships between
the various users of natural resources in the
Barents Sea has just recently started to develop,
reflecting the initial development stage of a new,
more complex ecological-economic situation,
and subsequently, a new ecological-economic
system. Until recently, the absence of com-
petitors to the fishing industry contributed to
the formation of psychological monopoly on
the use of natural resources in this region. At
present, the shelf resources are developed by
various economic sectors, and the integrated
management of versatile marine activities
can become a tool for ensuring sustainable
development [8].
Traditionally the Northern sea areas and
the Barents Sea were used mainly for fishing
and sea transportations. Nowadays, the
situation is changing significantly. Oil and
gas production, coastal transportations of
oil (effective – to the West and developing
– to the East), the increasing number of
ships cruising along the coasts and in the
marine areas of the Arctic, as well as the
exploration of marine bioresources are
the new types of activities that require
assessment of interests, coordination and
regulation with regard to the traditional types
of activity. It concerns especially the relation-
ship between oil industry and fishing industry,
between sea transport and fishing industry and
between transport and gas industry.
The need for an efficient inter-sectoral
marine management system is intensified by
certain changes in economic structure. In terms
of creating economic values, the Barents region
and its neighbouring seas have a great potential.
Among the wide range of approaches to the
development of management systems, a
comprehensive or an integrated one is the most
efficient, as it was stated above [6, 7, 12]. The
concept of integrated approach includes four
essential components:
• firstly, the connections between all the
major ecosystem components within the
selected water area, water layer, bottom and
shores (abiotic and biotic);
• secondly, management should be plan-
ned and implemented in the context of a long-
term development strategy;
• thirdly, the relations between the dif-
ferent users of nature and their social and
environmental interests and values should be
considered together;
• fourthly, the territorial contradictions
of nature management should be resolved
by transforming corporate interests into
national ones in order to achieve strategic
compromise.
In Russia the development of conceptual
framework and methodology in this area is
only in its initial stage. In this connection, the
notions of an ecosystem approach to the
development of MSP seem very promising.
The MSP formation mechanism may include
the following succession of actions: study of the
initial state of a marine object and its analysis
from economic view points → forecasting of
anthropogenic changes of a system according
to the planned economic activity → choice of
methods and measures for the minimization
of negative consequences. This sequence
corresponds to the development methodology
of the Environmental Impact Assessment
(EIA) projects. However, in this case, EIA
should be applied not only to individual
projects, but also to the areas of operation

50 1 (25) 2013 Economic and social changes: facts, trends, forecast
Comprehensive approach to arranging marine economy in the Western Arctic
of individual industries with the subsequent
coverage of the whole managed water area.
In case of the Barents sea, shifting from the
assessments of environmental effects of a
certain industry (e.g. oil and gas industry) to
functional assessments makes it possible to
abandon the ‘opposing’ EIA procedures (e.g.
fishing against oil and gas production) and
move to strategic, territorial ones, i.e. to create
the analytical and forecast basis of marine
spatial planning.
Multiple-use marine areas often suffer
from the competition for exploitation of the
bottom, shores and water areas. In particular,
such industries as fishery and oil and gas
production are potential competitors for the
space of almost entire basin of the Barents Sea.
Figure 1 shows the location of fishing areas
and prospective oil and gas facilities in the
Barents Sea. A number of potentially disputed
areas are defined, for instance, the structures
of the Murmanskoye and Severo-Kildinskoye
deposits, where the share of the average catch
of fish is relatively high. As for the Barents sea,
such competition is not critical yet, however,
in the future it may become alarming.
Competition for one’s ‘share’ in marine
areas is quite tough. However, along with the
development of technology, the direct mana-
gement area will encompass the sea and ocean
areas more distant from the land (for example,
oil and gas extraction on the continental slo-
pes), thereby increasing the scale of managed
subsystem and expanding the zones of potential
conflicts.
The Marine Activity Development Strategy
of the Russian Federation up to 2030 (approved
by the RF Government Order dated December
8, 2010 No. 2205-r) stipulates as its strate-
gic objective ‘the transition to an integrated
approach to the planning of the development
of marine and coastal areas of specific coasts of
the country by uniting them into a single object
of state management’.
The number of coastal subjects of the Rus-
sian Federation, implementing or drafting such
programmes should be 21. Marine natural
resources management, according to the strat-
egy, should be developed as follows:
– ‘introduction and development of the
integrated (inter-sectoral) management at all
levels that considers maritime economy as an
integrated management object and is aimed at
preserving the marine environment and elimi-
nating the conflicts emerging from the multiple
use of marine areas;
– expansion of the marine component of
the programmes on the comprehensive devel-
opment of coastal territories and coastal marine
areas to the borders of the sea areas under the
RF jurisdiction;
– utilization and development of marine
spatial planning tools’.
It should be noted that it is, perhaps, the
first time a federal document raises the issue
concerning the necessity of an integrated plan-
ning and management of maritime economy.
The stated objectives and tasks are expected to
be achieved mainly by implementing individual
sectoral programmes under the RF Govern-
ment coordination.
Consideration of coastal territories and
coastal water areas as a single object of state
management is aimed at improving the regional
strategic socio-economic planning and it will
promote the development of mechanisms for
vertical and horizontal integration of strate-
gies and development programmes. This will
make it possible to harmonize the interests
of the federal centre and regions, individual
users, optimize the structure and enhance the
efficiency of state support to the coastal zone
development.
Integrated coastal zone management
(ICZM) is the most widespread and approved
integrated management model in the world
practice of nature management. ICZM
methodology is aimed at creating an efficient
economic structure of coastal marine areas, at

51Economic and social changes: facts, trends, forecast 1 (25) 2013
A.M. VasilyevDEVELOPMENT STRATEGY
enhancing the efficiency of marine and coastal
economy by resolving the disputes over the
competitive utilization of marine and coastal
resources, at improving the organization
opportunities and human potential develop-
ment. According to the Ministry of Economic
Development, regional strategies and pro-
grammes on the socio-economic develop-
ment of all the coastal subjects of the Russian
Federation and their coastal municipalities
should contain a separate section representing
the coastal and marine component, aimed at
promoting innovations and achieving coopera-
tion through the coordinated development of
marine activity and its coastal infrastructure.
Figure 1. Natural resource management system of the Barents Sea (the object of management) [8]
The structure and content of the coastal and
marine component of development strategies
and programmes of various levels should
complement each other, thus creating a com-
mon system of strategic planning.
The project of the ‘Methodological guide
for the development of the coastal and marine
component...’ (not published) envisages a
three-level structure (fig. 2).
In our viewpoint, the zone at the municipal
level should comprise the territory of the
municipality and the territorial sea within the
zone boundaries, which will provide opportu-
nities for the development of coastal industrial
fishery and fishing for private use.

52 1 (25) 2013 Economic and social changes: facts, trends, forecast
Comprehensive approach to arranging marine economy in the Western Arctic
The cluster approach is a tool that promotes
the transition from sectoral to integrated man-
agement. This approach combines cross-sec-
toral and territorial principles, allows taking
into account internal and external trends and
changes in the structure of the main production
factors, provides an integrated approach to the
planning of the socio-economic development
of coastal territories. Maritime activities, which
represent the system of interaction between the
different types of activities and which have a
significant multiplicative effect, are a promising
object for the use of cluster approach.
The cluster approach actually changes the
content of the state industrial policy. In this
case, the efforts of government authorities
should be directed toward the development of
the relations between suppliers and consumers,
between ultimate consumers and producers,
between producers and government institutions
rather than toward the support of individual
enterprises and industries.
Today, the existing and planned activities in
the Murmansk coastal zone are concentrated
in the nominal triangle with vertices in the areas
of Varangerfjord, Pechenga Bay – Murmansk
city, Kola Bay – Teriberka rural locality,
Orlovka Bay, Korabelnaya Bay, Zavalishina Bay,
Lodeynaya Bay, Opasova Bay (fig. 3) [2].
It is this relatively small (about 5.3 thousand
square km) area of the Kola Peninsula where
the planning, exploration and construction
activities are carried out in the framework
of the two federal megaprojects: the coastal
infrastructure of the Shtokman project and the
infrastructure of the Murmansk transporta-
tion hub. The naval, frontier and EMERCOM
forces are stationed here, and this area possesses
huge potential for coastal fishing, aquaculture
and recreation.
The population in the Murmansk coastal
zone is distributed rather unevenly, its vast
majority is concentrated within the Kola Bay
shores (up to 90%). According to the available
statistical data, the contribution of the coastal
zone in the Murmansk Oblast economy is still
very small (not more than 15%). This does not
correspond to the potential of the Murmansk
coastal zone, and hampers the transition of
the whole peninsular region to sustainable
development.
Coastal fishing and processing of hydrobi-
onts are the socially significant activities in the
coastal zone of the Kola Peninsula.
Figure 2. Basic scheme of a three-level vertical structure of ICZM with indication
of the land boundaries of the coastal areas and maritime borders of the coastal
areas, corresponding to the various levels of state administration
Federal level of ICZM
The coastal zone of
Russia includes coastal RF subjects
and the RF exclusive
zone
OBJECTIVES EXECUTION
Federal level of ICZM The coastal zone of
Russia includes coastal
RF subjects and the RF
exclusive zone
OBJECTIVES EXECUTION
Federal level of ICZM
OBJECTIVES The coastal zone of
Russia includes coastal RF subjects
and the RF exclusive
zone EXECUTION
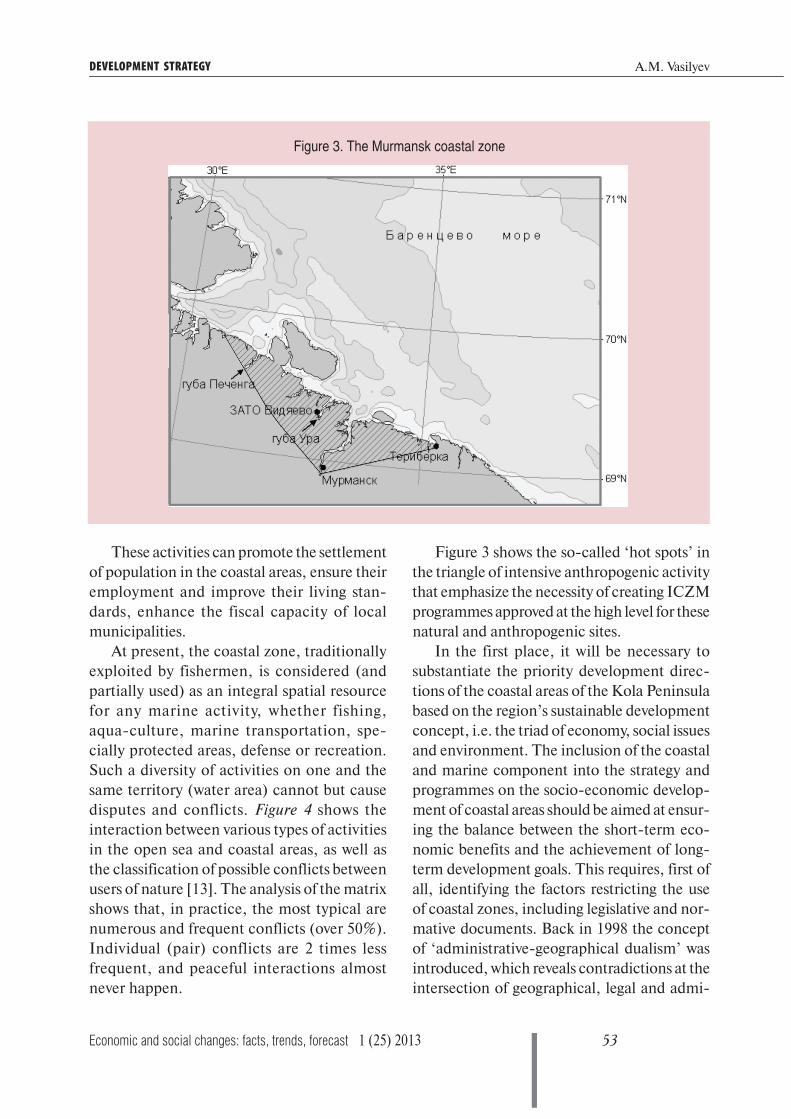
53Economic and social changes: facts, trends, forecast 1 (25) 2013
A.M. VasilyevDEVELOPMENT STRATEGY
These activities can promote the settlement
of population in the coastal areas, ensure their
employment and improve their living stan-
dards, enhance the fiscal capacity of local
municipalities.
At present, the coastal zone, traditionally
exploited by fishermen, is considered (and
partially used) as an integral spatial resource
for any marine activity, whether fishing,
aqua-culture, marine transportation, spe-
cially protected areas, defense or recreation.
Such a diversity of activities on one and the
same territory (water area) cannot but cause
disputes and conflicts. Figure 4 shows the
interaction between various types of activities
in the open sea and coastal areas, as well as
the classification of possible conflicts between
users of nature [13]. The analysis of the matrix
shows that, in practice, the most typical are
numerous and frequent conflicts (over 50%).
Individual (pair) conflicts are 2 times less
frequent, and peaceful interactions almost
never happen.
Figure 3 shows the so-called ‘hot spots’ in
the triangle of intensive anthropogenic activity
that emphasize the necessity of creating ICZM
programmes approved at the high level for these
natural and anthropogenic sites.
In the first place, it will be necessary to
substantiate the priority development direc-
tions of the coastal areas of the Kola Peninsula
based on the region’s sustainable development
concept, i.e. the triad of economy, social issues
and environment. The inclusion of the coastal
and marine component into the strategy and
programmes on the socio-economic develop-
ment of coastal areas should be aimed at ensur-
ing the balance between the short-term eco-
nomic benefits and the achievement of long-
term development goals. This requires, first of
all, identifying the factors restricting the use
of coastal zones, including legislative and nor-
mative documents. Back in 1998 the concept
of ‘administrative-geographical dualism’ was
introduced, which reveals contradictions at the
intersection of geographical, legal and admi-
Figure 3. The Murmansk coastal zone

54 1 (25) 2013 Economic and social changes: facts, trends, forecast
Comprehensive approach to arranging marine economy in the Western Arctic
nistrative-territorial spheres of knowledge [5].
The coastal zones, where the land falls within
the jurisdiction of the RF subjects and the
marine areas – within that of the federal
authorities (the centre), are a bright example
of such contradictions. That is why it is not
quite clear how the strategic issues remaining
the responsibility of the Ministry of Economic
Development, and the issues entrusted to
local authorities can be combined. Taking into
account the current legislation, the integration
of coastal territories and marine areas in the
framework of the general object of state man-
agement, as stipulated by the Marine Activity
Development Strategy, is possible only with the
introduction of significant amendments into a
number of federal laws.
After resolving these issues of principle,
it is necessary to collect the source data for
evaluating the resource potential and risks
in the coastal zone, for example in the
above-mentioned rural locality of Teriberka.
And only after that, it will be expedient to
determine, which methods from the num-
ber of integrated strategic planning tools
will prove to be appropriate for developing
the coastal and marine component of the
strategy.
Figure 4. Compatibility matrix for the types of marine activities
Industrial fishing
Industry
and transport
Industry
and transport
Defense
Defense
Outdoor recreation
and activities
Outdoor
recreation
and activities
Environmental pollution
and conservation
Environmental
pollution and
conservation
Local self-government
and development
Local self-
government
and development
Aquaculture
Aquaculture
Tourism / ecotourism
Tourism /
ecotourism
Multiple and frequent conflicts
Occasional conflicts
No conflicts
Industrial
fishing
References1. Aybulatov N.A., Vylegzhanin A.N., Mikhailichenko Yu.G. Nature management in the coastal zone of Russia’s
seas. Bulletin of the Russian Academy of Sciences. Series: geography. 2005. No. 4. P. 13-26.
2. Vasilyev A.M., Denisov A.M. Problems and prospects of complex approach to organization of maritime activity
in coastal marine area of the Murmansk region. National interests: priorities and security. 2012. No. 24. P. 2-11.
3. Voytolovsky G.K. Development dynamics. Theory and practice of maritime activities. Vol. 5.
Moscow: SOPS, 2005.
4. Denisov V.V. On the integrated management of the Barents sea resources (sea geographer’s view) . Fish resources.
2004. No. 3 (8). P. 2-4.
55Economic and social changes: facts, trends, forecast 1 (25) 2013
A.M. VasilyevDEVELOPMENT STRATEGY
5. Denisov V.V. Environmental geography of multi-resourse shelves in the case of the Barents sea. Studies in
oceanology, atmosphere physics, geography, ecology, water problems and geocryology. Moscow: GEOS, 2001.
P. 94-98.
6. Denisov V.V. Environmental and geographic framework of sustainable nature management in the shelf seas:
(Ecological geography of the sea). Apatity: Publishing house of KSC RAS, 2002.
7. Kotlyakov V.M. Geography in a changing world. Selected works in 6 volumes. Vol. 3. Moscow: Nauka, 2001.
8. Development of integrated technologies for ensuring the economic activity of the shelves in the coastal areas of
the Arctic and Southern seas: R&D report. Part 2: 2007-5-1.5-12-0. Murmansk Marine Biological Institute of
the Kola science centre of the Russian Academy of Sciences; scientific supervisor. I.I. Matishov. Murmansk:
MMBI KSC RAS, 2007.
9. Marine Activity Development Strategy of the Russian Federation up to 2030 ((approved by the RF Government
Order dated December 8, 2010 No. 2205-r) Legislation Bulletin of the Russian Federation. 2010. No. 51. Article
6954.
10. Tarkhanova L.B. Tools for the strategic planning of marine activities in the conditions of uncertainty. Arctic:
society and economy. 2010. No. 4. P. 101-108.
11. Cicin-Sain B., Knecht R.W. Integrated coastal and ocean management: concepts and practices. Washington,
DC: Island Press, 1998.
12. Colby M.E. Environmental management in development: the evolution of paradigms Ecol. Econ. 1-991.
Vol. 3. P. 193-213.
13. The Future of the Coastal Planet Secretarial Norut Gruppen AS. Tromso, 1995.
56 1 (25) 2013 Economic and social changes: facts, trends, forecast
DEVELOPMENT STRATEGY
UDC 339.97
LBC 65.291.551-21
© Aliyev A.B.
Innovation factors in the country’s economic security management system
This article is devoted to the studies in the sphere of introducing innovation factors into the country’s
economic security management system. According to the research, innovation factors and economic
security of the country are determined by its scientific and technological potential. The article reveals
the essence of introducing innovation priorities in the Republic of Azerbaijan and describes two main
categories of innovations. It also studies possible results of the state innovation policy in ensuring the
country’s economic security. Besides, it presents the scheme of innovation revival of the country’s
industrial potential, providing the enhancement of economic security.
Innovation, government policy, structural reforms, investment and innovation potential, innovation policy,
lawmaking, innovation categories, economic security, revival of industrial and scientific-technological sphere.
In the beginning of 1990s the Azerbaijan
Republic possessed a most powerful intellec-
tual, scientific-technological and production
potential.
This provided the opportunity for a break-
through in enhancing the efficiency of econ-
omy and life quality in Azerbaijan. However, in
the course of reforms in the socio-political
system, i.e. in the transition from socialism to
capitalism, negative results were obtained due
to the lack of professionalism of the legislative
and executive powers.
Nowadays the tangible improvement of
macroeconomic indicators is not related to the
country’s innovation strategies, for it is associ-
ated with the export of oil and oil products and
is of a temporary, situational character. The
proportion of innovation-active enterprises in
the country has decreased 22-fold for 20 years.
At the same time, many developed countries,
such as the USA, Japan, Germany, France, and
the leading companies of the world are shifting
to a new innovation-driven economic policy,
to the economy capable of ensuring the overall
quality of products on the basis of the compre-
hensive development of the knowledge base.
According to its innovation-economic pol-
icy, the United States increased its federal bud-
get expenditures on education by 50% in the
period of 2000 – 2010. For example, the U.S.
expenses for these purposes during the stated
period have increased 100-fold in comparison
with Russia. Therefore, if an education system
is not established properly, then it will hardly
be possible to use market innovation-economic
relations for the revival of the economy in CIS
Adalyat Bairamali oglyALIYEVDoctor of Engineering, Professor of Azerbaijan University of Architecture
and Construction
57Economic and social changes: facts, trends, forecast 1 (25) 2013
DEVELOPMENT STRATEGY A.B. Aliyev
countries. Given the current state management
policy, it is impossible to work out efficient
principles of a new innovation economy.
The academic novelty of this article consists
in the development of an efficient mechanism
of innovation business functioning and man-
agement; in the substantiation of the factors
enhancing the role of the government regula-
tion of innovation activity. Besides, the paper
describes the economy of the countries with
market relations, the economy of the countries
with economies in transition (CIS), further-
more, it defines the role of the state in manag-
ing the economy under crisis conditions.
It can be confidently asserted that the sys-
tem approach and system analysis (in particu-
lar, the system of the unity of objects of man-
agement and its external relations) are the key
tools of the new innovation-based economic
policy. The system analysis of an object, or a
subject of management should be carried out
in the following sequence:
a) examination of its investment and inno-
vation opportunities, and the formulation of an
economic mission;
b) study and forecast of trends in the inno-
vation development of the objects located in a
far and near environment;
c) study and forecast of the parameters of
innovation products’ consumers markets and
their competitors;
d) research and forecast of the parameters
of innovation production suppliers’ markets;
e) definition of goals, functions; construc-
tion (development) of the object’s structure on
the innovation basis.
Thus, the results of the system analysis serve
as the foundations for the elaboration of the
strategy of the object’s innovation-based devel-
opment.
The studies indicate that the development
of society is conditioned by efficient republican
laws, strategies and programmes. Their study
according to various aspects of education and
science, the forecast and elaboration of the
socio-economic development plan of the Azer-
baijan Republic and its national economy, as
well as its competitiveness management lead
to the conclusion that the system development
of these documents was not carried out, and if
it was indeed, then the goals, task and results
turned out to be too general. Therefore, invest-
ment and innovation programmes do not and
will not produce the desired outcome. It is
common knowledge, that it is the Constitution
which is the basic law, determining the qual-
ity of the documents on a country’s economy
management [3, p. 7-10].
When drafting the republican laws, the dep-
uties of the National Assembly (Milli Majlis)
of the Azerbaijan Republic consult certain laws
and normative acts of the advanced Western
countries, but at the same time, the selected
laws in the sphere of competition, competitive-
ness, innovation activity, personality develop-
ment, education, healthcare, culture, standard-
ization, information and communication tech-
nologies are not considered sufficiently enough.
There is no system of forecasting, optimiza-
tion, functional-cost analysis, resource-saving,
management of quality, competitiveness and
innovation processes.
Under the conditions of transition to the
market economy, innovation policy is becom-
ing more important as a factor of ensuring the
country’s economic security. The state innova-
tion policy is the major element of economic
and scientific-technological policy. It defines
the main trends of basic innovations at the
regional level, in intergovernmental relations,
as well as the mechanism of implementation of
these priorities. Studies prove that the develop-
ment of innovation priorities in the Republic
of Azerbaijan should be based on:
• long-term economic and scientific-
technological forecasts;
• statement of these priorities in innova-
tion programmes and regulatory documents;
• state support of priority basic innova-
tions and state innovation programmes;

58 1 (25) 2013 Economic and social changes: facts, trends, forecast
Innovation factors in the country’s economic security management system
• support of small business
• creation of the legal base of innovation
activity.
The role and place of the country’s innova-
tion policy becomes more important during
technological crises and the transition to a new
technological mode, i.e. when basic innova-
tions require urgent state support and the appli-
cation of antimonopoly legislation in order
to curb the impact of monopolies, seeking to
preserve obsolete equipment and the old tech-
nological mode.
The innovation policy of Azerbaijan should
be strategically aimed at the elimination of
technological degradation, the development
of the fifth technological mode, the enhance-
ment of innovation activity, the formation of
a unified innovation policy for the country [1,
102-104].
The reform of the economy in our country
depends on the state innovation policy. It con-
tributes to the development of incentives for
innovations commercialization at the enter-
prises and institutes possessing economic inde-
pendence; it also enhances the competitiveness
of domestic production and the development
of new institutional mechanisms of competitive
financing of R&D.
It is necessary to take into account the
aggravation of problems of innovation processes
management that consist in the following:
• weakening of administrative leverages;
• reduction in the number of coordinating
bodies;
• deterioration of industrial science,
which impeded the introduction of new scien-
tific developments;
• deterioration of the personnel and mate-
rial potential of scientific institutions due to
external and internal “brain drain”;
• lowering of the status of scientific work-
ers;
• extreme depreciation of equipment, etc.
Thus, innovation development of Azerbai-
jan economy requires the removal of adminis-
trative and institutional barriers and provision
of economic self-sufficiency of the subjects of
innovation process.
It should be noted that the factors men-
tioned above were then followed by others that
significantly hamper the innovation activity of
economic entities. Such factors consist in:
• absence of a strategic motivation on the
part of the majority of national economic enti-
ties;
• significant resource limitations for the
economy;
• reduction of the creative component in
human activity, conditioned by the change of
values.
Accordingly, at present, the following prob-
lems of innovation sector are coming to the fore
in our country, as well as in CIS countries:
elimination of “non-transparency” of
innovations market, i.e. the elimination of
informal ways of technology transfer, as well
as the complexity of financial and legal rela-
tions;
development of communication chan-
nels, providing the connection between the
subjects of innovation processes;
creation of special tools for financing
innovation projects.
The problems listed above involve the term
“infrastructure of an innovation market”,
which means the set of economic entities and
mechanisms, that provide material and organi-
zational support to the efficient interaction of
manufacturers and consumers of knowledge-
intensive products in the period of creating
innovations and further distribution of knowl-
edge-intensive products in the economy.
Research proves that the enhancement of
production efficiency in modern conditions
can be achieved mainly through the develop-
ment of innovation processes that is displayed
in new technologies, new kinds of competitive
products. The search for and use of innovations
directly at the enterprises is a relevant problem
as well.

59Economic and social changes: facts, trends, forecast 1 (25) 2013
DEVELOPMENT STRATEGY A.B. Aliyev
The development of new organizational
and technological solutions creates the con-
ditions for the renewal of reproduction pro-
cesses at the enterprises and additional impetus
to economic growth. Essentially, innovations
include not only technical or technological
developments, but also any changes for the
better in all spheres of research and produc-
tion activities.
The founder of the theory of innovation
J. Schumpeter, considering innovation, espe-
cially technological, as entrepreneur’s means
of profit-making, proved that a dynamic entre-
preneur is a source of short-term market fluc-
tuations. Analyzing the reasons for such fluc-
tuations, J. Schumpeter, for the first time in
economics, defined the “new combinations
of changes in development” and gave them a
description.
J. Schumpeter identified five typical
changes:
1) manufacture of products with new prop-
erties;
2) introduction of a new method (way) of
manufacture;
3) development of new markets;
4) use of a new source of raw materials;
5) performance of the relevant reorganiza-
tion of production.
What J. Schumpeter meant by the notion
of “innovation” in the 1930s, took place due
to the use of new or advanced solutions of tech-
nological, organizational nature in production,
supply and marketing of products. In accor-
dance with international standards, innovation
is defined as the final result of innovative activi-
ties that was embodied in the form of a new or
improved product introduced in the market, a
new or improved technological process, used
in practical activities.
Traditionally all innovations are divided into
two main categories: technological and non-
technological. Many researchers argue that
technological innovations determine the inten-
sity of production development.
Non-technological innovations include
innovations of organizational, managerial,
legal, social, ecological character. Studies show
that in the transition period the whole produc-
tion sphere and the sphere of services in CIS
countries had to face the situation of the 1930s,
which is possible to handle only by introducing
technological and non-technological innova-
tions on the basis of “combinations of changes
in development” described by J. Schumpeter.
Research shows that due to various external
and internal reasons, the great opportunities of
CIS countries were impeded by sluggish, inef-
ficient bureaucracies in the period of transition
to market relations.
As a result, CIS countries experienced a
complete shutdown of many factories and
plants, with a total loss of skilled personnel in
all the spheres of national economy.
In addition, economic security of these
countries, being part of national security, dete-
riorated. Studies prove that it is impossible to
confront threats to economic and national
security regardless of at least basic national
values and objectives. By and large, the fact
that innovation development has been curbed
is explained by the absence of the state innova-
tion policy strategy, which is to determine the
role and place of the government in the provi-
sion of innovation process in innovation sphere.
The modern experience of the countries
with market economy indicates that the state
actively regulates the economy. Emerging econ-
omies should have a government, which actively
regulates and revives the production sphere by
introducing innovations and investments in it.
In the countries with economies in transi-
tion, it is the state and not the “invisible hand
of the market” that should define the objectives
of the revival of national economy branches on
innovation technological and non-technolog-
ical basis.
It is not the market, but the state that defines
what the economy should be, for the business
in emerging economies is not capable of car-

60 1 (25) 2013 Economic and social changes: facts, trends, forecast
Innovation factors in the country’s economic security management system
rying out structural reforms on its own, to
eliminate imbalances and to level economic
and social differences.
Today, information and industry are impor-
tant conditions for ensuring economic security.
These factors form the foundation for choosing
the policy and strategy of economic revival on
the basis of innovation support and scientifi-
cally grounded introduction of innovations in
the production sphere.
The state innovation policy should be an
integral part of socio-economic policy aimed
at the development and promotion of innova-
tion activity, which is understood as the creation
of new or advanced products, new or advanced
technological processes, implemented in the
economy using R&D, experimental and design
works, or scientific achievements.
Thus, the author believes that the state
innovation policy is defined as the set of socio-
economic relations between the state and the
subjects of scientific-technological activity in
the issues of creation, transformation and use of
innovations for modernization of all spheres of
life, provided that the government ensures legal
support and compliance with moral and ethi-
cal aspects of innovation system’s formation.
And this problem should be solved on the basis
of efficient regulation of innovations by state
authorities: promotion of innovations, creation
of the legal base of innovation processes and
formation of scientific and innovation struc-
ture, which is connected with the solving of the
urgent tasks that the state faces in the sphere of
innovation activity at present.
The state innovation policy should be
f o r m e d a n d i m p l e m e n t e d w i t h t h e
acknowledgement of the fact that innovation
activities are crucial for enhancing the
competitiveness of domestic products, for
ensuring sustainable economic growth, for
increasing the level and improving population’s
life quality, and for ensuring the defense,
technological, industrial, ecological security,
which would provide for the improvement of
economic and national security.
Unfortunately, at present, it is impossible
to carry out an effective innovation policy in
CIS countries, as all the spheres of industrial
production, science, R&D have deteriorated.
Over the last 20 years the innovation policy
in CIS countries hasn’t undergone any
significant positive changes. As for the opinion
of some economists that the modern economy is
determined by the market and not the state, it is
absolutely groundless. In particular, it concerns
the issues of economic development in CIS
countries. The fact is that many countries
with capitalistic socio-political system and
centuries-old forms of economic development
united their industrial and financial capital in
order to upgrade their industrial production,
and thus carrying out their investment and
innovation policy, which linked science and
production. However, even these conditions
did not enhance the development efficiency of
a market economy in order to improve people’s
living conditions.
Economy of CIS countries, including
Azerbaijan, is absolutely different from the
centuries-old capitalist economy. The point is
that the former USSR countries, having shifted
toward market economy, lost their scientific
potential, as well as the great number of
skilled employees, and returned to the level of
1950s – 1960s. All CIS countries, including
the Republic of Azerbaijan, have become raw
material suppliers. Oil and gas exports in these
countries account for 92 – 97% of overall
exports. All the other industries, which don’t
produce competitive products, virtually ceased
to exist, and therefore, economic security can’t
be ensured without the innovation policy of the
government.
The author believes that the crises in CIS
countries and in the Republic of Azerbaijan are
much more complicated structurally than the
crises affecting the developed capitalist
countries. Here we are confronted, on the
one hand, with the crisis in the countries with
powerful industrial potential, which produce

61Economic and social changes: facts, trends, forecast 1 (25) 2013
DEVELOPMENT STRATEGY A.B. Aliyev
competitive products, and where the relations
between science and production are close; on
the other hand, we observe the crisis in the
countries with weak industrial potential that are
not capable of producing competitive products
and that lost the link between science and
production. And in both cases we mean their
innovation factor in ensuring the country’s
economic and national security, affecting
legislative, monopolistic, social, banking and
trade union activities.
The intervention of the government in the
economy at the beginning of the 20th century
was spontaneous and it had no theoretical
foundation as a manifestation of economic
mechanisms of entering the crisis and
preventing it.
The author’s research in the history of the
Great Depression, an economic crisis that took
place in the United States in 1929 – 1933,
shows that the government did everything in
its power to avert it. The then U.S. Presidents
J. Edgar Hoover and Franklin D. Roosevelt
piloted a number of important bills. They
included the laws on loans to farmers and
businessmen, on the programmes for scientific
and industrial policy, public and construction
works. Although these half-measures couldn’t
recover the situation completely, they at least
reduced the crisis effects to a minimum. At
the same time, disastrous changes finally
undermined the confidence in the fact that a
spontaneously organized market enjoying the
minimal participation and intervention of the
government was able to ensure balance and
stability in the economy. At that time it was
already clear that the current economic theory
had serious flaws.
Many economists, including Karl Marx,
were baffled by those flaws. The Great Depression
clarified the occurred economic paradox. The
first step to the solution was made by John
Maynard Keynes in his work “The General
Theory of Employment, Interest and Money”
(1936). Keynes’ main achievement was his
refutation of the existed notion, that market
economy was capable of self-regulation. The
scientist proved that it was inclined to stagnation,
which created internal tension in economic
and social relations, the tension that should be
removed through government intervention.
The author argues that government
intervention in the economy in CIS countries,
including the Republic of Azerbaijan, should
be effected more promptly, than in the developed
countries, on the basis of innovation factors,
which is necessary for the revival of competitive
industry, reduction of social tension and
enhancement of economic security. The funds,
received from the export of raw materials
should be the source of introducing innovation
factors. The implementation of the investment
innovation factor in Azerbaijan’s oil sector led
to the 11-fold increase in oil production in 2011
as compared to 1992 (table).
Here the question arises: how can the
domestic industrial production be revived in
the conditions of a relentless competition by
applying innovations as the main lever of
development?
Studies show that there are two ways to
implement an investment strategy that would
improve a country’s economic security.
The first one consists in paying special
attention to the country’s scientific-tech-
nological potential.
Development of innovation activity in oil industry in the Republic of Azerbaijan in 2005 – 2011
No. Indicators 2005 2006 2007 2008 2009 2010 2011
1. Volume of exported oil products, million tons 33.6 43.6 47.8 29.7 49.5 49.8 50.3
2. Expenditures on technological innovations, billion dollars 1.2 1.3 1.1 1.3 1.6 1.2 1.1
3. Number of innovation enterprises 5 11 12 15 18 21 23

62 1 (25) 2013 Economic and social changes: facts, trends, forecast
Innovation factors in the country’s economic security management system
The second one consists in the introduction
of the existing foreign scientific-technological
potential and innovation into the country’s own
economy. In the first place, this strategy
was used by Japan in the post-war period,
when it purchased licenses to the advanced
technologies from such highly developed
countries as the USA, England, France,
Germany in order to develop the production
of state-of-the-art products, enjoying great
demand on the international market, and also
for the subsequent creation and development of
its own scientific-technological and scientific-
industrial potential. This ensured further
implementation of the innovation cycle
from basic R&D to the introduction of its
own innovations for the modernization of
production.
Studies prove that in the present conditions,
when the industrial and scientific spheres have
declined and the link between science and
production has been lost, the first way of
implementing innovation policy is virtually
impossible.
The second one, i.e. the Japanese way of
reviving industrial innovation and scientific-
technological sphere is the most reasonable
and productive [2, p. 65-69].
Such a strategy was adopted not only in
Japan, but also in China and some countries
of South-East Asia. The classic example is the
creation of the competitive South Korean
automotive industry and industry producing
advanced computers, household equipment
and electronics.
The Republic of Azerbaijan should develop
and choose its own strategy of promoting
innovations, which would be based on the
existing production, intellectual and resource
potential. The strategy of innovation and
technological breakthrough, in case of
its successful development, adoption and
consistent implementation with the government
support, will give Azerbaijan the last chance to
stop its technological deterioration, and to
revive the production in its national economy
up to the relevant international standards.
Studies show that many countries pay
considerable attention to the provision of
necessary external and internal economic and
technological information that is of a certain
innovation interest for national enterprises and
businesses.
In this regard, it is notable experience of
Japan, which since 1958 under the Ministry of
Industry of a foreign trade organization
dedicated to the collection of scientific-
innovation development across the world
and their analysis. This organization receives
economic information due to close contacts
with official representatives of all economically
developed countries. Selection and qualitative
analysis of the innovations is carried out in
Japan (as in France, Germany and etc.) with
the help of information system.
That is the way of innovations implemen-
tation that contributes to the maintenance of
the country’s economic security at the proper
level.
The revival of the industrial potential in CIS
countries requires determining the informa-
tion, financial, personnel sources possessing
the ability to conduct innovation policy taking
into consideration the availability of domestic
raw material resources and the previous ex-
perience in various spheres of industry.
For example, the Azerbaijan Republic has
sufficient raw material resources, like oil, gas,
cotton, wool, silk, tobacco, etc., as well as
intellectual resources consisting in the
experience in the processing of raw materials,
production of consumer and industrial
products, qualified scientific-technological and
engineering personnel, capable in the shortest
term to restore their scientific potential on the
basis of borrowed innovations, introduced in
the production sphere. The figure displays the
ways and sources of innovation policy in the
Republic of Azerbaijan, promoting economic
security.

63Economic and social changes: facts, trends, forecast 1 (25) 2013
DEVELOPMENT STRATEGY A.B. Aliyev
Sch
eme
of
inn
ova
tion
rev
iva
l of
the
coun
try’
s in
dus
tria
l po
ten
tial e
nsu
ring
its
eco
no
mic
sec
urity
Obta
inin
g lic
ense
s to
adva
nce
d t
ech
no
log
ies
and
thei
r in
tro
duct
ion
in
exi
stin
g
pro
duct
ion
pro
cess
es
I st
age
of
the
stat
e
inn
ova
tio
n p
olic
y
II s
tag
e (p
erm
anen
t) o
f th
e st
ate
inn
ova
tio
n p
olic
y
Rev
enues
fro
m s
ales
of
raw
mat
eria
ls
Purc
has
e o
f th
e eq
uip
men
t
nec
essa
ry f
or
pro
duci
ng
go
od
s bas
ed o
n a
dva
nce
d
tech
no
log
ies
Tea
chin
g o
f q
ual
ifie
d
per
son
nel
th
e p
rin
cip
les
of
wo
rkin
g w
ith
mo
der
n
mac
hin
ery
and
eq
uip
men
t
Issu
ing
of
com
pet
itiv
e
pro
duct
s th
at e
njo
y
dem
and
on
th
e m
arke
t
Sci
ence
an
d
tech
no
log
y sp
her
e,
cap
able
of
stat
e
inn
ova
tio
n p
olic
y
mo
der
niz
atio
n
Rev
enues
fro
m
sale
s o
f ra
w
mat
eria
ls a
nd
pro
duct
s
enjo
yin
g
dem
and
on
th
e
do
mes
tic
and
fore
ign
mar
ket
Intr
od
uct
ion
of
inn
ova
tio
n
po
licy
dev
elo
ped
by
the
coun
try’
s
scie
nce
an
d
tech
no
log
y
po
tenti
al
Pri
ori
ty iss
uin
g o
f
com
pet
itiv
e
pro
duct
s en
joyi
ng
hig
her
dem
and
on
the
do
mes
tic
and
fore
ign
mar
ket

64 1 (25) 2013 Economic and social changes: facts, trends, forecast
Innovation factors in the country’s economic security management system
The fast-track introduction of the scheme
of innovation policy aimed at enhancing the
country’s economic security requires
innovation-oriented investments, especially
foreign ones, in order to develop the advanced
technologies of the sixth technological mode.
Integration of science, higher educational
institutions and production in the selected
strategic innovation priorities, which will
contribute to the attraction of talented youth
is particularly relevant for the implementation
of the second stage of innovation policy.
Thus, the restructuring of national economy
in order to ensure the proper level of the
country’s economic security requires a science-
based governmental innovation policy. In turn,
this requires certain financial, intellectual,
informational costs. Science-based innovation
policy contributes to the strengthening of the
country’s economic security, which is possible
due to the gradual innovation revival of the
country’s industry and national economy.
At that, the government plays an important
role in the implementation of innovation policy
in priority areas, as well as in the creation of an
advanced infrastructure of innovation activity,
in ensuring the interaction between science,
education, production and in formation of a
favorable financial and credit sphere for the
development of innovation activities.
References1. Aliyev A.B. Problems of economic and national security of the Republic of Azerbaijan in modern conditions.
Baku: Takhsyl, 2010.
2. Aliyev A.B. et al. Information economy. Baku: Takhsyl, 2012.
3. Vechkanov G.S. Economic security. Moscow, Saint Petersburg: Publishing house “Piter”, 2007.
4. Goncharenko L.P. Innovation policy: textbook. Moscow: KNORUS, 2009.
5. Oleynikov Ye.A. Economic and national security: textbook for higher educational institutions. Moscow: Ekzamen,
21 vek, 2005.
6. Tatarkin A., Kuklin A., Romanova O. Economic security of the region: the unity of theory, methodological
research and practice. Yekaterinburg: Publishing house of the Ural University, 1997.
7. Fatkhuddinov R.A. Competitiveness: Russia and the world. Moscow: Publishing house “Ekonomika”, 2005.
65Economic and social changes: facts, trends, forecast 1 (25) 2013
DEVELOPMENT STRATEGY
UDC 339.9 (476:470+571)+339.54:061.1(100)
LBC 65.59(4Bel+2Rus)
© Milashevich Ye.А.
Framework of harmonization and unification of external economic relations between the Republic of Belarus and
the Russian Federation in the context of Russia’s accession to WTORussia’s accession to the World Trade Organization has serious risks for the economy of the Republic
of Belarus. This will affect such sectors of the Belarusian economy dominating in exports to Russia as
agriculture, machine-building, chemical industry. Therefore, it is necessary to carry out a detailed
analysis of the rules and regulations that exist in the economy in the nearest future. For this purpose, the
methods of harmonization and unification of external economic relations between Belarus and Russia
have been developed. The practical application of the developed methods will reveal the non-compliance
of them with WTO law enforcement practice, which will give an opportunity to take immediate action
to minimize losses in this sphere because of Russia’s accession to WTO.
Republic of Belarus, Russian Federation, World Trade Organization (WTO), harmonization, unification,
economic standards.
Yelena A. MILASHEVICH Scientific Associate of the NASB Institute of Economics
Russia’s accession to WTO will have a
serious impact on the economy of the Republic
of Belarus, which is creating the Common
Economic Space (CES) together with the
Russian Federation and the Republic of
Kazakhstan. Today, three countries have a
common customs tariff and use the unified
measures for tariff and non-tariff regulation of
foreign trade.
According to the Agreement on the
Functioning of the Customs Union (CU) [2],
from the date of any of three states’ accession
to WTO, the rates of common customs tariff
shall not exceed the rates of import tariffs that
are specified in WTO standards.
That is, the Republic of Belarus and
Kazakhstan have to accept obligations that
were bargained by the Russian Federation in
the negotiations on Russia’s accession to WTO.
Due to Russia’s joining WTO, there will be
a reduction in tariffs in the following areas [1, 5]:• average marginal rate for all the products
– from 9.5% down to 7.8%;
• average marginal duty on agricultural
products – from 13.2% down to 10.8%;
• average marginal duty on manufactured
goods – from 9.5% down to 7.3%.
The average level of import duties after the
complete tariff cut on some types of goods is
presented in table 1.

66 1 (25) 2013 Economic and social changes: facts, trends, forecast
Framework of harmonization and unification of external economic relations between the Republic of Belarus...
significant source of currency earnings to the
country: at the end of 2010 commodity group
“Cheese and Curd” headed the list according
to the cost of commodity exports from Belarus
to Russia passed ahead of the position “Trucks
and Tractors”.
2. Due to the increase in Russia’s tariff
quotas for imported food and zero duties on
pork, there will be a decline in prices for
livestock products, which will have a negative
impact on the standing of Belarusian farmers:
livestock production occupies 90% of food
exports in Belarus.
3. Increased competition will affect the
leading Belarusian industry – machine-
building, including farm-machinery industry,
most production of which is exported to
Russia: import duties on almost all the types
of agricultural machinery will be reduced.
4. Low tariff commitments of Russia will
increase the imports from the third countries
to the territory of the Customs Union; this will
involve such industries as chemical and wood-
working.
The study is aimed at the development of
the methods of harmonization and unification
of external economic relations between the
A new rate of duties will be effective for one
third of goods since the date of Russia’s
accession to WTO; as for other goods, a
transitional period from 2 to 8 years will be
used for them according to the type of product:
for example, a transitional period of 8 years was
determined for poultry, a period of 7 years – for
cars, helicopters, civil aircraft.
Tariff quotas on some imported foodstuffs
will be kept after Russia’s accession to WTO:
import within the quotas will be liable to lower
duties, import over the quotas will be liable to
higher duties (tab. 2).
Russia’s commitments to WTO for a
number of commodity items, which include
about 2.5 thousand goods, are below the current
common customs tariff. External rates of duties
on one thousand commodity items are 7 – 15%
lower than the current common customs tariff,
and they are 4 – 6.5% lower on the rest 1.5
thousand items.
Tables 1 and 2 show that the restrictions
adopted by the Russian Federation will have a
significant impact on the economy of the
Republic of Belarus [3]:1. Belarusian milk products can be driven
out of the market in Russia, while they are
Table 1. Changes in the level of import duties after the complete tariff cut
in accordance with Russia’s commitments to WTO [5]
ProductionTariff rate in accordance with
commitments to WTO, %Current tariff rate, %
Dairy products 14.9 19.8
Crops 10.0 15.1
Chemical products 5.2 6.5
Cars 12.0 15.5
Wood and paper 8.0 13.4
Information technology products 0 5.4
Table 2. Tariff quotas adopted by Russia in accordance
with the commitments to WTO, on some imported goods [1, 5]
Production External rates of duties within a tariff quota, % External rates of duties over a tariff quota, %
Beef 15 55
Pork 0, since 2020, on a flat scale – 25 65
Some types of cultured milk foods 10 15
Some types of poultry products 25 80

67Economic and social changes: facts, trends, forecast 1 (25) 2013
Ye.А. MilashevichDEVELOPMENT STRATEGY
Republic of Belarus and the Russian Federation
in the context of Russia’s accession to WTO.
We can see that Russia’s accession to WTO
is resulted in the changes that concern not only
the common customs tariff, but technical
regulations, standards and rules of veterinary
checks and phytosanitary control, volume and
nature of governmental support for various
economical sectors of the Republic of Belarus.
In the near future, it is necessary to carry
out a detailed analysis of the current standards
and regulations in the economic field of the
republic and develop the measures to level a
negative impact of Russia’s accession to WTO
on the economy of Belarus. All these steps
require the harmonization and unification of
the legislation in the Republic of Belarus.
At the same time, it is assumed, for example,
the following harmonization of VAT rates: it
accounts for 20% in the Republic of Belarus
[4] and 18% in the Russian Federation. It is
clear that the reduction of VAT rates down
to the level of Russia will significantly reduce
the budget revenues in Belarus because VAT
revenues account for 31% of the revenue side
of its budget (according to the results of 2011).
But the current rate of 20% can lead over
time to the fact that business and taxpayers will
be to look for more favorable variants move to
Russia in the conditions of free movement of
goods, services, capital and labour contained in
the documents adopted within the framework
of the Customs Union and the Common
Economic Space.
This is precisely why the harmonization,
i.e. the development of common agreed
principles and measures for their implementation
to solve one or another problem in the economic
sphere, is necessary.
The level of harmonization implies the
elimination of the differences in the national
legislations of Belarus and Russia for the benefit
of intensifying the foreign economic relations
between these countries in order to create
common legal basis of the economic sectors.
Harmonization will facilitate a mild impact
of intergovernmental mechanisms on the
development of consistent and coordinated
activity of Belarus and Russia in the field of
external economic relations.
The ways to implement the harmonization
have been developed as part of the methodology
(fig. 1).
It is necessary to use the experience of other
countries and regional organizations, as well as
take into account the negative effects of the
global financial crisis when implementing the
harmonization in the Republic of Belarus and
the Russian Federation.
We suggest the algorithm of harmonization
within the frameworks of the methods developed
(fig. 2).
The proposed technique defines the
methods that should be used to implement the
harmonization:
1. The Republic of Belarus and the Russian
Federation develop consistently the common
principles and measures to achieve them.
2. The country (Belarus and Russia)
introduces some laws or regulations of another
country in its own economic system.
There are the areas of harmonization in the
methodology that include the introduction of model legislation into national legislative acts,
i.e. the development of recommended (model)
legislative acts in the economic sphere. Today,
model legislation is widely used in international
contacts because model laws are suitable to
change the national legislation by developing
a national act on the basis of the common text
but in view of specific character of the country.
The development of model legislation should
be based on the best international practice and
generally recognized principles of international
law (fig. 3).
The next area of the process of harmonization
is filling the gaps in the national legislation in
the economic sphere with new laws and other
regulations to comply with common principles
and standards; bringing the current economic
legislation to conformity with the provisions of
international agreements.
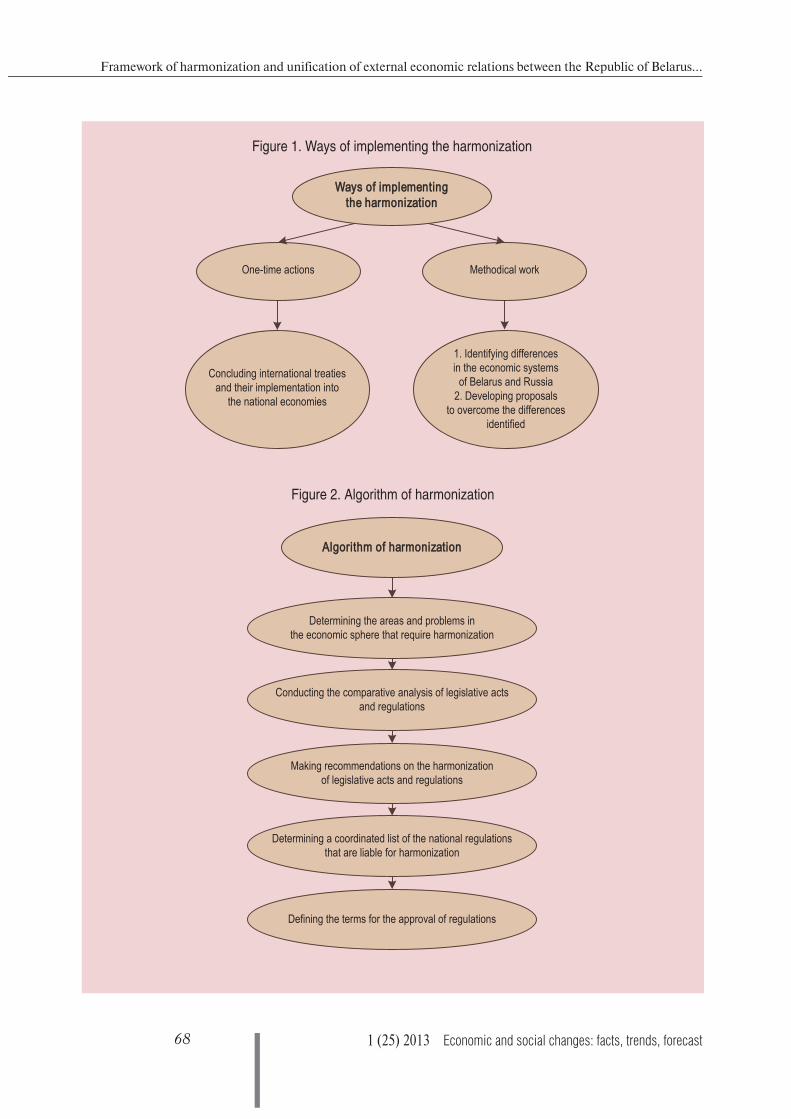
68 1 (25) 2013 Economic and social changes: facts, trends, forecast
Framework of harmonization and unification of external economic relations between the Republic of Belarus...
Figure 1. Ways of implementing the harmonization
Figure 2. Algorithm of harmonization
One-time actions
Ways of implementing the harmonization
Methodical work
Concluding international treaties and their implementation into
the national economies
1. Identifying differences in the economic systems
of Belarus and Russia2. Developing proposals
to overcome the differences identified
Determining the areas and problems in the economic sphere that require harmonization
Algorithm of harmonization
Conducting the comparative analysis of legislative acts and regulations
Making recommendations on the harmonization of legislative acts and regulations
Determining a coordinated list of the national regulations that are liable for harmonization
Defining the terms for the approval of regulations

69Economic and social changes: facts, trends, forecast 1 (25) 2013
Ye.А. MilashevichDEVELOPMENT STRATEGY
The Republic of Belarus and the Russian
Federation are not always ready to develop a
common approach to specific economic issues
due to various objective reasons and arguments
of little substance. Therefore, we propose
to develop a procedure for the preparation,
adoption and implementation of agreements
and decisions made by both states, and their
transformation into the economic systems of
our countries, as well as to develop the common
principles and objectives formulated in the form
of recommendations for reviewing the statutory
wordings in the economic sphere.
The need for unification has been caused
by Russia’s accession to WTO and spreading
of Russia’s commitments to all the members
of the Common Economic Space. This means
that the Republic of Belarus should unify
its own regulations according to Russia’s
commitments in the near future.
These measures are necessary to bring the
regulations and standards of Belarus into
conformity with international ones, improve
the competitiveness of the national economy
and implement the further trade liberalization.
In future, this will allow the Republic of Belarus
to join WTO on the transparent and agreed terms
and become a participant enjoying full rights
in the multilateral trading system. Belarus’
accession to WTO will mean functioning
within WTO legal framework; however, we have
no access to dispute resolution mechanism
within the multilateral trading system of WTO
because our country is not a member of the
World Trade Organization. It is possible to
characterize the current situation as follows:
we have commitments, but we have no rights.
The process of unification involves the
reduction of economic standards and principles
to a complete uniformity, a common form, a
common standard.
Algorithm of unification is depicted in
figure 4.
The methodical basis of comparative
analysis of the economic standards of Belarus
and Russia have been developed, which include
the following components:
1. Tasks of comparative analysis:
• collection and analysis of information
on economic standards of Belarus and Russia;
• identifying the differences in economic
standards, economic principles;
• making recommendations to change
economic standards and regulations.
Figure 3. Ways of implementing the model acts
Issuing of a separate model act
Ways of implementing the model acts
Development of separate model rules and provisions
The Republic of Belarus and the Russian Federation adopt
a separate model act as a national legislative document
The Republic of Belarus and the Russian Federation use
separate model rules and provisions by including them into
the existing legislation
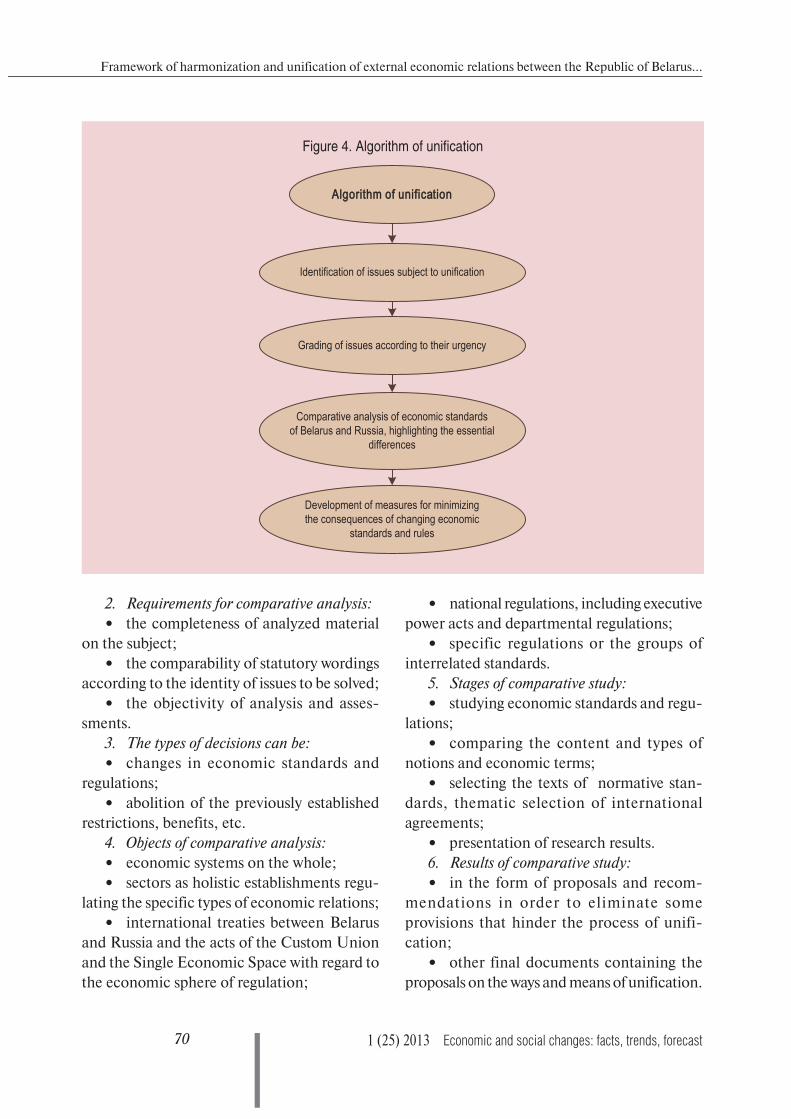
70 1 (25) 2013 Economic and social changes: facts, trends, forecast
Framework of harmonization and unification of external economic relations between the Republic of Belarus...
2. Requirements for comparative analysis:
• the completeness of analyzed material
on the subject;
• the comparability of statutory wordings
according to the identity of issues to be solved;
• the objectivity of analysis and asses-
sments.
3. The types of decisions can be:
• changes in economic standards and
regulations;
• abolition of the previously established
restrictions, benefits, etc.
4. Objects of comparative analysis:
• economic systems on the whole;
• sectors as holistic establishments regu-
lating the specific types of economic relations;
• international treaties between Belarus
and Russia and the acts of the Custom Union
and the Single Economic Space with regard to
the economic sphere of regulation;
• national regulations, including executive
power acts and departmental regulations;
• specific regulations or the groups of
interrelated standards.
5. Stages of comparative study:
• studying economic standards and regu-
lations;
• comparing the content and types of
notions and economic terms;
• selecting the texts of normative stan-
dards, thematic selection of international
agreements;
• presentation of research results.
6. Results of comparative study:
• in the form of proposals and recom-
mendations in order to eliminate some
provisions that hinder the process of unifi-
cation;
• other final documents containing the
proposals on the ways and means of unification.
Figure 4. Algorithm of unification
Identification of issues subject to unification
Algorithm of unification
Grading of issues according to their urgency
Comparative analysis of economic standards of Belarus and Russia, highlighting the essential
differences
Development of measures for minimizing the consequences of changing economic
standards and rules
71Economic and social changes: facts, trends, forecast 1 (25) 2013
Ye.А. MilashevichDEVELOPMENT STRATEGY
Conclusions and proposals Russia’s accession to WTO resulted in
serious impacts on the Republic of Belarus.
The changes will affect not only the common
customs tariff, but technical regulations,
standards and rules of veterinary checks and
phytosanitary control, the volume and nature
of governmental support for various sectors
of Belarus’ economy. In the near future, the
republic should carry out a detailed analysis of
current economic standards and regulations
and develop the measures to level the negative
impact of Russia’s accession to WTO on
the economy of Belarus. All these facts are
resulted in the need for the harmonization and
unification of the legislation in the Republic of
Belarus. Their implementation will contribute
to a mild international mechanisms’ effect on
the formation of consistent and coordinated
activity of Belarus and Russia in the field
of external economic relations. Unification
of Belarus’ standards and regulations in
accordance with Russia’s commitments made
by the country when joining WTO allow the
Republic of Belarus to bring them into line
with international standards, improve the
competitiveness of the national economy and
implement the further trade liberalization,
which in future will allow Belarus to join
WTO on the transparent and agreed terms and
become a participant enjoying full rights in the
multilateral trading system.
The methods developed allow us to reveal
the divergence with WTO law enforcement
practice both at the macrolevel (in the field of
customs regulations, taxation, exchange
and price controls, antitrust regulation,
insurance) and at the microlevel (providing
business entities with individual tax benefits,
compensation for the interest on bank loans,
budget loaning, etc.).
The practical application of the developed
methods allow conducting the structural
analysis of economic standard acts of the
Republic of Belarus to identify the possible
non-compliance of the national legislation
with WTO standards and regulations in order
to take immediate action to change the current
legislation and minimize the losses because of
Russia’s accession to WTO.
References1. World Trade Organization. Available at: http://wto.org. Date of access: 09.06.2012.
2. Agreement on the functioning of the Customs Union within the frameworks of the multilateral trading system.
Available at: http://wto.org///www.tsouz.ru. Date of access: 09.10.2012.
3. Milashevich Ye.А. Analysis of the impacts of Russia’s accession to WTO on the Republic of Belarus in the
conditions of functioning of the Common Economic Space. In: Problems of forecasting and state regulation of
social and economic development. Proceedings of the 13th In ternational scientific conference. Minsk, October
25-26, 2012. Minsk, 2012. Vol. 2. P. 66-67.
4. Ministry of Taxes and Duties of the Republic of Belarus. Available at: http://www.nalog.gov.by. Date of access:
09.10.2012.
5. Center for Customs Tariff and Non-tariff Regulation Research. Available at: http://www.regfortrade.ru. Date of
access: 09.06.2012.

72 1 (25) 2013 Economic and social changes: facts, trends, forecast
UDC 332.1: 621.311 (470.1/.2)
LBC 65.305.142(235.1)
© Chayka L.V.
Spatial aspects of electric power industry development in Russia’s European North*
The article deals with the Karelian-Kola and Dvina-Pechora parts of the electric power system
located in Russia’s European North (REN) as the structures of trans-regional level. A comparative
system analysis of these objects revealed their common and distinctive features, and the problems of
their spatial organization. As a result, important factors of enhancing integration ties have been
determined. Besides, the article highlights the main directions of spatial development of REN power
supply system.
Russia’s European North, economic space, electric power systems, spatial organization, modernization.
Larisa V.CHAYKAPh.D. in Economics, Associate Professor at the Institute of Socio-Economic
and Energy Problems of the North Komi Science Centre, Ural RAS Department
The role of space in electric power industry modernization
Economic space research methodology
is based on the creation of different abstract
images – multivariate models, describing
its properties and revealing its development
regularities [1, 2, 3, 4]. The research is
based mainly on a system approach, which
consists in the presentation of economic
space as a single complex of interconnected
natural, social, technological systems, in
the study of their interactions, formation
principles, trends and development criteria,
regulatory institutions. The results of scien-
tific research on economic space, when
applied in practice, should determine the
optimal mechanisms of interaction and
trends of development, and also contribute
to the creation of an efficient system of
management of these processes.
* The research was carried out under the programme on fundamental research of RAS Presidium “Role of space in Russia’s
modernization: natural and socio-economic potential” (scientific coordinator Academician V.M. Kotlyakov), project No 12-P-7-
1004: “Socio-economic space of the European North (general reasons for modernization and interregional integration)” (scientific
supervisor – RAS Corresponding Member V.N. Lazhentsev).
BRANCH-WISE ECONOMY

Economic and social changes: facts, trends, forecast 1 (25) 2013 73
L.V. Chayka BRANCH-WISE ECONOMY
regularities), external connections with fuel
supply systems (cross-sectoral integration).
Technological condition of power supply
systems determines the possibility of their
institutional organization development, since
the presence or absence of technical alternatives
of power supply of the consumers creates
conditions for a competitive or monopolized
market, in accordance with which the rational
options of business processes are selected.
A functional connection, which shows the
role of economic space in the development of
electric power industry, is created in the
following sequence: characteristics and
properties of the space → its development
capacity, forecasted transformations → rational
formation of energy systems (technology,
organization, potential). The necessary detailed
elaboration of this sequence leads to increasing
complexity of integrated research in energy
and economics and greatly complicates its
informational and methodological support.
Modern tools of system research in energy
sphere help to overcome the emerging difficulties
[7, 8]. The tools include a set of models in the
spheres of energy and economics according to
the sectoral and territorial structure, designed
for forecasting production and investment
activities, material and financial flows, for
the analysis of organizational structures and
multi-objective optimization of development
according to energy, economic, environmental
and social performance criteria. The planning
of electric power systems means the selection
of rational options for the development of
production, and its achieving implies the
creation of favourable conditions and sources
of practical implementation. At that, the urge
towards a rational way of electric power industry
development envisages sustainable and adaptive
solutions taking into account “the influence of
economic factors (such as demand, fuel prices
and the cost of construction of new facilities)
and non-economic factors (environmental,
socio-political, regulatory, institutional and
other constraints)” [8, p. 83].
What is meant here, is the paramount
importance of progressive transformation of
institutional environment, which is an active
structure of economic space, defining the
rules of its functioning and transformation
conditions.
In this regard, “spatial development should
be considered as an approach to state objec-
tives of development management, based on
the system-structural notions of the country’s
integrity and instruments of such management”
[5, p. 18].
Electric power industry or power supply as
a branch or type of activity is an integral
component, a constituent part of economic
environment at any level of its territorial
hierarchy from a global to a local one. At
the same time, power supply systems are
developing in accordance with the properties
and characteristics of economic space, such as
the requirements of economy and population,
geography and climate, ecology, resources,
state of energy infrastructure and economic
potential. “Development of a region’s energy
sector takes place under the influence of
external factors, determined by upper level
systems of the hierarchy and related natural
and socio-economic systems” [6, p. 95]. There
is a close interrelation between the state of
economy and the developmental level of its
energy supply system. Therefore, in the abstract
image of economic space, the characteristics of
an electric power system represent a direct or
indirect display of all the spheres of this space
in energy indicators (coordinates).
It should be emphasized, that characteristics
of spatial fragmentation and cohesion become
crucially important in the creation of energy
supply systems of any level, considering their
technological features: remoteness of power
facilities (both from each other and from
consumers) and mandatory nature of power
supply connections (network topology), priority
of technical conditions of system interaction,
continuity of energy production, distribution
and consumption (physical and technical

74 1 (25) 2013 Economic and social changes: facts, trends, forecast
Spatial aspects of electric power industry development in Russia’s European North
The strategic task of electric power
infrastructure development in Russia, according
to [9], consists in a comprehensive and
accelerated modernization, i.e. a large-
scale renewal of production technologies,
and significant enhancement of the quality
of the whole system of energy supply and
energy saving. Some progress in technological
modernization has already been achieved in the
construction of new facilities and reconstruction
of existing ones with the introduction of new,
advanced machinery and equipment for power
generation, transformation and transfer. It may
be assumed that rapid development of advanced
technologies will lead to progressive structural
changes both in electric power industry
and in economy as a whole. Institutional
modernization has been going on continuously.
It is aimed at improving the conditions and
forms of organization of economic activity,
the rules of interaction between the subjects
of power supply, which requires additional
efforts aimed at the structural and functional
reorganization of energy systems and creation
of appropriate legal and regulatory framework
for their development. The strategy for the
country’s electric power industry modernization
actualizes the objectives of the research of
spatial structures and relationships of energy
and economy in the part of forecasting their
transformations on the basis of scientific-
technological progress and institutional
innovations. Modernization should result
in “the enhancement of reliability of power
supply and energy security of the country, the
growth of energy and ecological efficiency of
electric power industry facilities, providing,
in general, the decrease in growth rates and
stabilization of tariffs for electric and heat
energy” [10, p. 9]. According to such targets,
the indicators of efficiency and reliability of
electric power supply should be considered as
the criteria for planning and monitoring the
development of electric power industry, and
not only for the national system as a whole
(general macroeconomic indicators), but also
for its regional subsystems (field of values) in
order to reflect the heterogeneity of its spatial
structure and identify problem areas.
In the context of the research on the spatial
development of Russia’s North, [3, 11] the
studies of energy supply systems formation and
modernization should, in our opinion, be
specified by the analysis and evaluation of the
following:
reasons for and factors of regional
differentiation of the conditions of energy
supply and energy efficiency of production;
configuration and regional decom-
position of economic and technological
properties of power systems;
efficiency of business structure of the
wholesale and regional energy and power
markets;
factors and methods of inter-regional
energy supply integration;
main relations with other components
of economic environment (resource provision
and settlement system, energy requirements
for economic development, environmental
conditions, etc.);
capacity and directions of technological
and institutional modernization;
requirements for the development of
electric power industry, potential sources and
mechanisms of their provision.
It seems that consideration of these posi-
tions with regard to the territorial factor, will
provide a detailed characteristic of significant
factors of economic space in the process of
energy economy modernization in the North.
Spatial organization of electric power industry in Russia’s European North (REN EPS)
Analyzing the spatial organization of
electric power industry requires clarification
of the following points: the peculiarities of
objects’ allocation, configuration of network
connections and mechanisms of cooperation;
Economic and social changes: facts, trends, forecast 1 (25) 2013 75
L.V. Chayka BRANCH-WISE ECONOMY
besides, the choice of the object of research
is crucially important here. This determines
its integrity, i.e. the systemic character of the
object’s functioning, the level of affordable
aggregation and necessary specification of
its structure; in addition, this determines
the hierarchy of competences in the object’s
management. For example, the study of the
spatial organization of regional energy systems
requires specifying their structure at the level
of energy units – centres of generation and
consumption, their interactions and significant
external relations, which will be the objects
of management contributing to the optimal
development of the entire system. The object of
the present study is the electric power industry
of the European North of Russia1, thus the
regional energy systems, their relations and
cooperation are considered as the structural
elements of the first level, and the issues of
their coordinated development are highlighted.
It should be emphasized that the formation of
the hierarchy of power supply systems in the
Northern regions led to the predominance
of the regional principle of delimitation of
competences and technological integrity. The
2005 – 2008 organizational reform of power
industry, resulting in the establishment of
generating companies of the extraterritorial
level, created new centres of responsibility
and redistributed cash flows, but it didn’t
changed the essentials of functional linkages
and interactions of the subjects of power supply.
Power supply of the consumers on the ter-
ritory of REN is provided by 4 regional energy
systems – Kola, Karelia, Arkhangelsk and
Komi, included in the unified electric power
system of the North-Western Federal District
1 On the territory of the regions included in the Far North
and localities equated to them: the Murmansk and Arkhangelsk
oblasts, the Republic of Karelia and the Republic of Komi. The
Vologda Oblast power system (as part of the Northern economic
area) is considered only in terms of external linkages, since it
is included in the united energy system of the Centre, which
establishes the priorities of its operational interaction and
development.
(UEPS of the North-West). The location of
the main power stations and system-forming
power transmission lines (PTL) is shown in
fig. 1. It is clear that the spatial configuration
of the power system of REN is presented by
two parts – the Western (Karelian-Kola) and
the Eastern (Dvina-Pechora), which are not
connected directly with each other.
The Western part is the association of
regional energy systems of the Murmansk
Oblast and the Republic of Karelia, which
have the unified backbone network with
the voltage of 330 kV (Kola nuclear power
plant – Knyazhegubsky nuclear power plant
– Loukhi – Petrozavodsk), with a maximum
capacity2 of about 600 MW. External inter-
system connections have been formed with
the Leningrad power system by a 330 kV
transmission line (Kirishskaya GRES (Kirishi
state district power station) – Syas – Petro-
zavodsk) and a 220 kV transmission line (Upper
Svir hydroelectric station – Drevlyanka).
A low-power connection has been established
with the Vologda power plant through 110 kV
power transmission lines. Electricity is exported
in limited amounts to Norway and Finland
(about 0.7 billion kWh).
The Eastern part contains an extensive
network, including power systems of the
Arkhangelsk Oblast and the Republic of Komi
that have a backbone connection of a lower
voltage level through 220 kV power transmis-
sion lines Mikun – Urdoma (the maximum
capacity3 on the regions’ border doesn’t exceed
200 MW). There is an outside intersystem
connection through 220 kV transmission lines
with the Vologda Oblast power supply system
(Konosha – Kharovsk, Yavenga), that is part of
the unified electric power system of the Centre.
2 According to the data of OJSC System operator of UES:
Information necessary for competitive capacity procedure for
2012 (http://monitor.so-ups.ru/?P=42&DocumentID=163).3 Scheme and programme for the development of power
industry of the Komi Republic for 2012 – 2017: adopted by the
Resolution of the Government of the Komi Republic dated 28
April 2012 No.172-r.

76 1 (25) 2013 Economic and social changes: facts, trends, forecast
Spatial aspects of electric power industry development in Russia’s European North
The potential of the most efficient utilization
of this connection for transferring the cheaper
electric power from the UEPS of the Centre to
the Northern part of the Arkhangelsk Oblast
is limited by the transmission capacity of a
single-circuit area of high-voltage 220 kV
transmission lines “Konosha – Plesetsk”4.
There are also several low-powered intersystem
connections through 110 kV transmission lines
with the Vologda and Kirov oblasts, but the
energy supplies effected through these lines are
4 Source: website of the Arkhangelsk Oblast Admi-
nistration (http: //www.dvinaland.ru/ power/departments/
deptek/26145).
of local importance. Energy consumers of the
Nenets Autonomous Okrug and North-Eastern
districts (Mezensky and Leshukonsky) of the
Arkhangelsk Oblast remain outside the system
of electric power industry (with decentralized
electricity supply).
The analysis of Rosstat data and the offi-
cial information provided by the regional ad-
ministrations and energy companies allowed
estimating the parameters of the energy-
economic space under review (tab. 1) and iden-
tifying the general and distinctive features
of the two formed separate parts of the electric
power system of REN.
Figure 1. Location of the main electric power facilities of REN

Economic and social changes: facts, trends, forecast 1 (25) 2013 77
L.V. Chayka BRANCH-WISE ECONOMY
Table 1. Economic and power industry indicators of REN for 2010*
Indicators
In the service area
Western part
of EPS
Eastern part
of EPS
Area, thousand km2 325 1006.7
Population, thousand persons 1441.3 2129.7
Number of cities and towns; urban-type settlements; rural settlements 29; 23; 888 24; 49; 4691
Gross regional product (GRP), billion rubles 362.3 708.2
Volume of shipped production (VSP)of industry, billion rubles 288.7 578
Structure of VSP of industry, % according to the type of economic activities (TEA):
Extraction of minerals
Manufacturing
Production and distribution of energy, gas, water
34
46
20
55
34
11
VSP of TEA “Production and distribution of electric power”, billion rubles
VSP of TEA “ Production and distribution of heat power ”
33.9
22.0
32.6
24.7
Volume of electric power consumption, billion kWh, total 22.4 17.9
Including losses in networks 1.2 1.6
Domestic consumption per capita, thousand kWh/person 1.0 0.9
Electric intensity of industrial production, kWh/thousand rubles 50 20
Electric intensity of GRP, kWh/thousand rubles 59 25
Volume of electric power production in 2010, billion kWh 22.7 17.3
Net proceeds (+) or output (-) of electric power, billion kWh -0.3 +0.6
% of the volume of production -1 +3
Power system structure of electric power plants according to their types, MW: 4858 4464
Thermal power plants (TPP) (including those working on gas) 811 (380) 3917(2434)
Nuclear power plants (NPP) 1760 0
Hydraulic power plants (HPP) 2235 0
Stand-alone power plants (including gas-fired power plants) 52 547 (260)
System electric load maximum in % to the total generating capacity of an electric power plant 70 66
Structure of electric power output according to the types of power plants:
TPP 11 100
NPP 47 0
HPP 42 0
Number of power plants with installed capacity over 30; 100; 1000 MW 26, 11, 1 15, 9, 1
Maximum voltage class of the grid, kV 330 220
Total number of substations with the voltage over 35 kV, units 285 396
Transformers powerf, MVA, voltage class:
over 110 kV inclusive
under 35 kV inclusive
9412
1921
6528
4529
Transmission route length, thousand km:
voltage 110 kV and higher
35 kV and lower
10
10
11
45 (36)
Wholesale electricity and capacity market (WECM) zone Price Non-price
Average cost of electricity provided to the consumers rubles/kWh (VAT excluded)** 1.8 3.3
* Compiled on the basis of the official data of Rosstat, regional administrations, energy companies and organizations.
** Calculated as a ratio of the value of the shipped goods of foreign economic activities “Production and distribution of electricity” to the
volume of electricity provided to the consumers.

78 1 (25) 2013 Economic and social changes: facts, trends, forecast
Spatial aspects of electric power industry development in Russia’s European North
General features:
1. Service area of the electric power system
includes Northern territories with harsh natural
conditions and low population.
2. Configuration of the network structure
of an extended linear type, with the predo-
minance of single-circuit power lines. The
routes of the main backbone transmission lines
are located along the railways.
3. The installed capacity of power plants
in both parts of the electric power system
doesn’t exceed 5 GW. The available generating
capacity is sufficient enough for the consumers
of the considered REN regions.
4. The available excess of installed capa-
cities in each of the parts (about 15%) is re-
presented by pent-up capacities, the use of
which is limited by the capacity of the backbone
network transmission.
5. Long-term exploitation of most power
plants (40 – 70 years).
6. The volume of power and energy ex-
change through interconnection lines among
other neighbouring regions (the Leningrad,
Vologda, Kirov oblasts) is insignificant, mainly
due to technological limitations.
7. High depreciation of electric power
distribution networks.
8. The cost volumes of markets of electric
and thermal energy are rather similar.
The two parts of REN EPS differ in the
following aspects.
• The service area of the Dvina-Pechora
part covers a significantly large territory with a
more dispersed settlement structure. Here the
macroeconomic efficiency of social production
is higher mainly due to the prevalence of oil
and gas sector in economy. But the utilization
capacity of electricity is lower both in absolute
and in specific indicators (per capita, per unit
of GRP). The Karelian-Kola part contains
industrial production that consumes more
electricity: specific consumption of electric
power in 2010 on average amounted to 50 kWh
per 1 thousand rubles of shipped products, which
is 2.5 times more than in the Eastern part.
• The structure of installed capacity and
generation at the power plants of the Dvina-
Pechora part is uniform and includes only
thermal power stations operating on organic
fuel, and using gas as a fuel for 60% of their
capacities; about 60% of electricity is generated
using the fuel produced in the region of its uti-
lization. In the Karelian-Kola part of EPS, the
structure of generating capacities is diversified:
energy is produced by nuclear, hydro – and
thermal power stations, and non-fuel power
production, concerning its capacity and
performance, significantly exceeds thermal
power production, which is more expensive
and operates on imported fuel.
• The electric power industry of the
Western part of REN, unlike that of the Eastern
part, is characterized by the less sparse and
concentrated location of power producers:
in a much smaller service area, the system
has a greater number of operating electric
power stations, less distant from each other. A
more uniform and high density of generation
is a factor that enhances the reliability and
efficiency of centralized power supply. Each
part of the electric power industry of REN
contains one GW-class power producer: the
Kola nuclear power plant and the Pechora state
district power station (SDPS).
• The REN EPS power network has the
following voltage classes: the backbone 330 kV
and 220 kV power transmission lines connect
the centres of generation and carry out transit
(long-range) power transmission; 150 kV
and 110 kV power transmission lines are
backbone distribution lines, connecting main
power centres with main load concentration
points; transmission lines of 35 kV and lower
are distribution lines in urban settlements,
rural areas and at enterprises. As the data in
table 1 shows, the system-forming network of
the Western part of REN EPS is more high-
powered: it is formed by transmission lines of
a higher voltage class and has a larger quantity
of transformer capacities than the Eastern part.
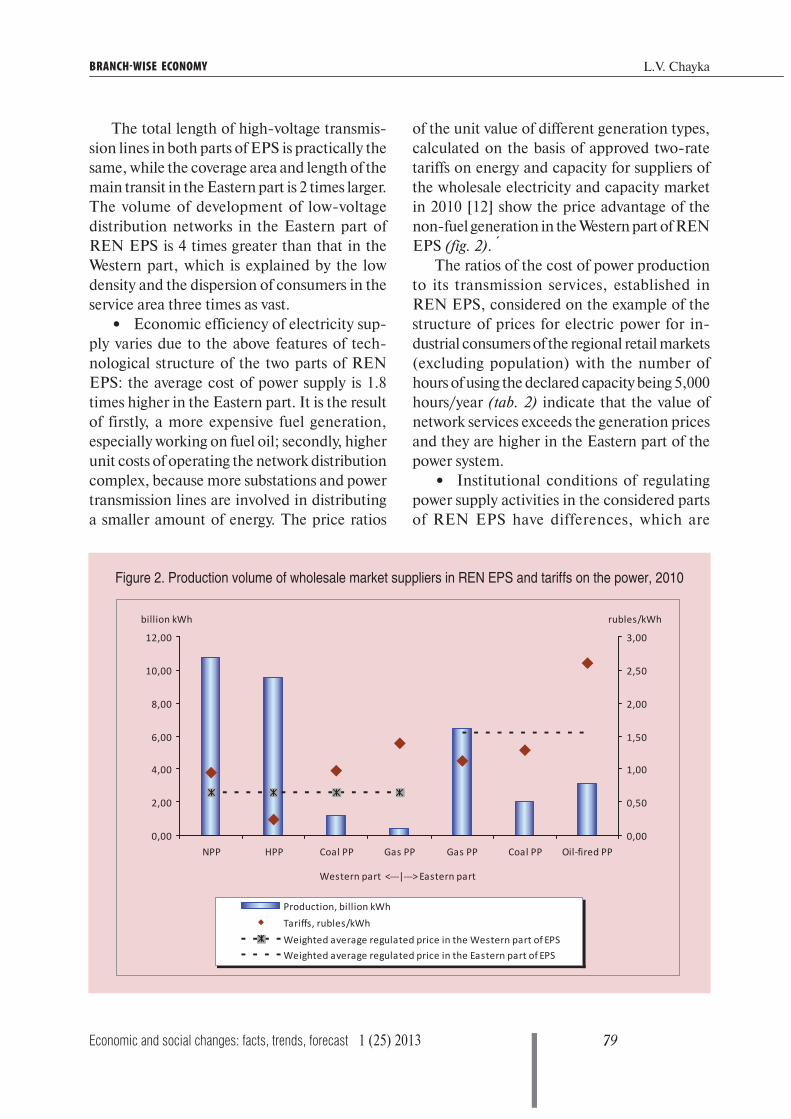
Economic and social changes: facts, trends, forecast 1 (25) 2013 79
L.V. Chayka BRANCH-WISE ECONOMY
The total length of high-voltage transmis-
sion lines in both parts of EPS is practically the
same, while the coverage area and length of the
main transit in the Eastern part is 2 times larger.
The volume of development of low-voltage
distribution networks in the Eastern part of
REN EPS is 4 times greater than that in the
Western part, which is explained by the low
density and the dispersion of consumers in the
service area three times as vast.
• Economic efficiency of electricity sup-
ply varies due to the above features of tech-
nological structure of the two parts of REN
EPS: the average cost of power supply is 1.8
times higher in the Eastern part. It is the result
of firstly, a more expensive fuel generation,
especially working on fuel oil; secondly, higher
unit costs of operating the network distribution
complex, because more substations and power
transmission lines are involved in distributing
a smaller amount of energy. The price ratios
of the unit value of different generation types,
calculated on the basis of approved two-rate
tariffs on energy and capacity for suppliers of
the wholesale electricity and capacity market
in 2010 [12] show the price advantage of the
non-fuel generation in the Western part of REN
EPS (fig. 2).
The ratios of the cost of power production
to its transmission services, established in
REN EPS, considered on the example of the
structure of prices for electric power for in-
dustrial consumers of the regional retail markets
(excluding population) with the number of
hours of using the declared capacity being 5,000
hours/year (tab. 2) indicate that the value of
network services exceeds the generation prices
and they are higher in the Eastern part of the
power system.
• Institutional conditions of regulating
power supply activities in the considered parts
of REN EPS have differences, which are
`
Figure 2. Production volume of wholesale market suppliers in REN EPS and tariffs on the power, 2010
Western part <---|---> Eastern part
0,00
2,00
4,00
6,00
8,00
10,00
12,00
NPP HPP Coal PP Gas PP Gas PP Coal PP Oil-fired PP
billion kWh
0,00
0,50
1,00
1,50
2,00
2,50
3,00
rubles/kWh
Production, billion kWhTariffs, rubles/kWhWeighted average regulated price in the Western part of EPSWeighted average regulated price in the Eastern part of EPS

80 1 (25) 2013 Economic and social changes: facts, trends, forecast
Spatial aspects of electric power industry development in Russia’s European North
Table 2. Electricity prices and tariffs as of 2010, rubles/kWh, VAT excluded*
Price constutuents On retail electricity markets
Murmansk Oblast Republic of Karelia Arkhangelsk Oblast Komi Republic
Cost of generation:
tariff 1.06 1.10 2.02 1.47
open price 1.52 1.64 - -
Tariff on transmission services when
supplying electricity within:
high-voltage (HV) network 1.84** 1.62 1.58 1.76
low-voltage (LV) network 1.84 1.96 3.42 2.35
Sales premium and infrastructural payments 0.03 0.12 0.12 0.11
Total price HV/LV::
regulated (tariff) 2.94 / 2.94 2.84 / 3.18 3.73 / 5.57 3.33 / 3.93
open 3.39 / 3.39 3.37 / 3.72 - -
* Calculated on the basis of two-rate tariffs and prices, according to the official data of regional administrations and marketing companies.
** Equality of HV and LV tariffs indicates tariff cross-subsidization for consumers connected to a LV network, at the expense of customers
in a HV network.
revealed when considering the wholesale
electricity and capacity market (WECM) from
the viewpoint of price and non-price zones.
It is supposed, that the price zone of WECM
(the Western part) has the conditions of a
competitive market in electricity generation,
and in the non-price zone (the Eastern part)
competition is limited by technological
conditions.
Accordingly, the generating companies in
the price zone carry out their activities in the
liberalized segment of the market with free
pricing, and in the non-price zone – under
the conditions of tariff regulation. Figure 3
presents the main subjects of generation and
the share of their production in the appropriate
market areas. In the Western part of REN
EPS, there are only two major generating
companies on the market, but even between
them competition is not possible due to the
normatively established technological priorities
for loading the capacities of a nuclear power
plant. In the Eastern part, the number of market
participants and their share in production allow
the development of competitive relations, but
they are hampered by the network restrictions
and costs of power and energy transfer from
distant sources.
Therefore, full-fledged competitive market
relations between generating companies in both
parts of REN EPS currently can not be realized.
Nevertheless, the rules regulating the activity
in WECM price zone create advantages
for efficient generators. The procedure of
competitive selection in WECM implements
the principle of marginal pricing, which allows
generators with low operating costs get higher
revenues, than under the conditions of tariff
regulation according to economically justified
costs and revenues.
As the data in figure 2 and table 2 show, in
WECM price zone (Western part), the open
price for electricity (with regard to power),
which has been formed at the level of the tariff
(i.e. economically sound cost of production)
of the supplier is about 1.5 rubles/kWh,
which is considerably higher than the tariffs
of nuclear and hydroelectric power stations,
which ensures their high profitability. Official
accounting reports of power companies in-
dicate, that in 2010 the profitability according
to EBITDA in the price zone accounted for
more than 50% at Rosenergoatom and 25%
at TGC-1, in the non-price zone at TGC-9,2
and OGC-3 it didn’t exceed 6%. For energy
companies, such differences in price regulation

Economic and social changes: facts, trends, forecast 1 (25) 2013 81
L.V. Chayka BRANCH-WISE ECONOMY
of their profitability should undoubtedly affect
motivation and the formation of investment
resources for modernization of their own
production capacities. For consumers, the
differences in price regulation resulted in the
outpacing dynamics of the rise in the cost of
energy in the liberalized segment of WECM, as
a result of which the average price level of the
retail markets in the Western part of EPS, with
non-fuel generation more efficient according
to operational costs, approached the more
expensive one – in the Eastern part.
Problems and prospects of spatial deve-lopment of REN EPS
The analysis of the spatial organization of
REN EPS allows the following main conclusions
to be made.
Electric power supply system in Russia’s
European North consists of two self-contained
parts; there is only an indirect connection via
the unified electric power system of the
Centre, with no integration purposes. Both
parts of EPS are included in the North-
Western unified electric power system, but for
the Eastern part, consisting of Arkhangelsk
and Komi power systems, this union is formal,
since there is no technological connection
for the system interaction with other objects
of the unified power system. In the Western
part of EPS the integration is provided by the
power supply network connections between
the Kola and Karelian power systems and the
Leningrad EPS.
System generating capacities in both parts
are sufficient for fulfilling the present-day
requirements of economy and population in
their service areas. Each part of EPS has some
excessive reserves of generating capacity, which
are planned to be used in the 5 – 10-year
perspective for connecting new consumers and
replacing retired capacities. Therefore, the task
of developing external economic relations with
the aim of further transmission and expansion
of electric power market is not relevant at
present. A more differentiated and efficient
generation system with a more powerful
backbone connection has been formed in the
Western part.
The primary task of spatial development
of REN EPS is the “strengthening” of the
established basic structures with the purpose
of organizing technically and economically
optimal interaction of energy facilities.
In this respect, the programmes for the
development of electric networks [10, 13, 14]
envisage the elimination of “bottlenecks”
in the system-forming connections – the
Figure 3. Structure of electric power production according to the main subjects of REN EPS
In the Western part:
0
20
40
60
80
100
Capacity Generation
other
isolated generatingplants
OJSC TGC-1
OJSC Rosenergoatom
In the Eastern part:
0
20
40
60
80
100
Capacity Generation
other
isolated generating plants
OJSC OGC-3
OJSC TGC-9
OJSC TGC-2
82 1 (25) 2013 Economic and social changes: facts, trends, forecast
Spatial aspects of electric power industry development in Russia’s European North
construction of second chains of transmission
lines for increasing transmission capacity and
transmission reliability, reducing losses and
total costs of electric power supply when using
the most cost-efficient facilities.
Since the efficiency level of electric power
industry in the Eastern part of Russia’s
European North is considerably lower than in
the Western part, it is expedient to enhance its
efficiency: 1) by replacing expensive fuel; 2)
by developing and strengthening the backbone
connection; 3) by introducing the sources
of non-fuel generation (nuclear or dispersed
hydro- and bioenergy). The first two directions
are already being implemented: combined
heat and power plants (CHPP) working on
fuel oil are being modified to work on gas,
construction of the second networks of 220 kV
system transmission lines. The creation of an
efficient power source on the basis of coal fuel is
viewed as a strategic goal in solving the problem
of diversification of utilized fuel.
Technological integration of the two parts
of REN EPS into a single complex can be
grounded by the following factors: 1) enhan-
cement of energy security, since the system
integration will promote the diversification of
energy sources structure according to the types
and resources, neutralizing potential threats
of gas being the major resource orientation
of electric power industry in the Eastern part;
2) reduction of the cost of power supply through
optimizing the load and power exchange in
order to use the most efficient energy sources
to the fullest; 3) increase of reliability of power
supply of the consumers given the increase in
the number of acceptable supply alternatives;
4) adjustment of price differences; 5) deve-
lopment of competitive relations by increasing
the number of market participants. The
unification of the two parts of REN EPS is
possible by creating a direct inter-system
connection (for example, a double transmission
line 220 along the route Obozerskoye –
Belomorsk – Kem).
The relative isolation of the Arkhangelsk
and Komi power systems can be handled by
the development of network connections with
the power systems of the Vologda and Kirov
oblasts. But both these systems are not
sufficiently provided with their own generating
capacities, the lack of which is covered by
considerable inter-regional supplies from the
unified energy system of the Centre and that
of the Urals. Therefore, the development of
system connections of the Eastern regions
of Russia’s European North in the southern
direction depends on the maximum capacity
of transit and competitiveness of transferred
energy.
A decision on the expediency of uniting the
two parts of REN EPS can be made only after
pre-project feasibility studies in the framework
of the system planning of Russia’s unified
energy system development. Such studies
are carried out under the direction of federal
bodies (the Ministry of Energy of the Russian
Federation, OJSC System operator of UES)
by the leading developers of strategies and
programmes on the prospective development
of the national UES of Russia (Institute of
Energy Strategy, JSC G.M. Krzhizhanovsky
Power Engineering Institute, Energy Research
Institute of RAS, Melentiev Energy Systems
Institute of the Siberian Branch of RAS, CJSC
Energy Forecasting Agency, etc.), which have
the necessary information, methodological and
modeling tools.
According to Russia’s EPS development
projects for the period up to 2020, included in
the officially approved documents [13, 14], the
spatial structure of REN EPS will not undergo
significant alterations. The relative isolation of
the Eastern part will be maintained (given the
formal inclusion in the UES of the North-West),
the structure and capacity of energy sources
will not change significantly, the regional and
inter-regional system network connections
between the Arkhangelsk and Komi energy
systems will strengthen, the capacity of inter-

Economic and social changes: facts, trends, forecast 1 (25) 2013 83
L.V. Chayka BRANCH-WISE ECONOMY
system connection with the Vologda Oblast for
the power transit from UES of the Centre will
increase. As for the Western part, it is planned to
increase the capacity of the Kola – Karelian –
Leningrad EPS backbone connection, and the
substantial growth of nuclear energy potential
is envisaged as well, with a significant surplus
of generating capacity in this part of UES of
the North-West exceeding the standardized
reserves. Therefore, the planned development
will lead to the increase in the differences in
the potential of electric power economy in the
parts of EPS under consideration.
In conclusion it should be emphasized that
one of the objectives of spatial development of
economy and power industry is to reduce inter-
regional disparities5, which implies rational
alignment of living conditions, including
energy supply: its availability, quality, reliabi-
lity and efficiency. Thus, the plans and projects
for energy infrastructure modernization should
ensure balanced spatial development.
It is difficult to determine to what extent
this requirement is maintained, since the main
programme (federal and regional) documents
on the development of electric power industry
don’t contain, with few exceptions, the forecasts
of future conditions – indicators of reliability,
security, energy, environmental and economic
efficiency, which served as the criteria for the
decisions taken. Meanwhile, no doubt, that
assessing such targets in the planning of spatial
development is extremely important not only
for the macro-level of national power industry,
but also for its established meso-structures and
regional segments. The compulsory character
of assessing the criterial indicators reflecting
the efficiency of various segments of the spatial
structure of energy economy will serve as a
basis for the rational direction of efforts and
resources to “weak” objects and relations, it will
also promote quality monitoring and control
over the efficiency of the system design and
programme management.
5 Pointed out in the Concept of the long-term socio-economic development of the Russian Federation for the period up
to 2020 [15] and the Energy strategy of Russia for the period up to 2030 [9].
References1. Granberg A.G. Programme of fundamental research of the spatial development of Russia and the role of the
North-West region in it. Economy of the North-West: problems and development prospects. 2009. No. 2, 3.
P. 5-11.
2. Granberg A.G. Modeling spatial development of national and world economies: evolution in approaches. Region:
economics and sociology. 2007. No. 1. P. 87-106.
3. Lazhentsev V.N. Spatial development (cases of the North and the Arctic). Proceedings of the Komi Science
Centre, Ural RAS department. 2010. No.1. P. 97-104.
4. Tatarkin A.I. Development of the economic space of Russia’s regions on the basis of cluster principles. Economic
and social changes: facts, trends, forecast. 2012. No. 3 (21). P. 22-29.
5. Okrepilov V.V. Spatial development of Northern territories. Relevant issues, directions and mechanisms of
development of productive forces of the North – 2012: Materials of the 3rd all-Russian scientific seminar
(28 – 30 June 2012. Syktyvkar): in 2 parts. Syktyvkar, 2012. Part 1. P. 13-19.
6. Tatarkin A.I., Lvov D.S., Kuklin A.A., Myzin A.L., Bogatyryov L.L., Korobitsyn B.A., Yakovlev V.I. Modeling
of sustainable development as a prerequisite for the enhancement of the territory’s economic security.
Yekaterinburg: Publishing house of the Ural University, 1999.
7. Makarov A.A. Methods and results of forecast of Russia’s power industry development. Bulletin of the Russian
Academy of Sciences. Energy. 2010. No. 4. P. 26-40.
8. Veselov F.V., Volkova Ye.A., Kurilov A.Ye., Makarova A.S., Khoroshev A.A. Methods and tools of forecasting
of electric power industry development. Bulletin of the Russian Academy of Sciences. Energy. 2010. No. 4.
P. 82-94.
9. Energy strategy of Russia for the period up to 2030. Moscow: Institute of Energy Strategy, 2010.

84 1 (25) 2013 Economic and social changes: facts, trends, forecast
Spatial aspects of electric power industry development in Russia’s European North
10. Programmes for modernization of Russia’s electric power industry for the period up to 2020: project. Available
at: http://www.minenergo.gov.ru/documents/razrabotka/12683.html
11. The North and the Arctic in the spatial development of Russia: scientific-analytical report. RAS Scientific
Council on the issues of regional development; Council for the Study of Productive Forces at the Ministry of
Economic Development of the Russian Federation and RAS Presidium; IEP KSC RAS; ISEEP of the North
Komi science centre, Ural RAS department. Apatity: Publishing house of the Kola science centre of RAS, 2010.
12. On the tariffs for electricity (power) sold on the wholesale market under the contracts within the marginal
(minimum and maximum) sales of electricity (power) at regulated prices (tariffs) of volumes: the Order of the
Federal Tariff Service dated 24 November, 2009. No. 326-e/3. Available at: http://www.fstrf.ru/tariffs/info_tarif/
electro/2010/1
13. Decree of the Government of the Russian Federation dated 22 February 2008 No. 215-r (with the “General
Scheme of Location of Objects of Electric Power Industry up to 2020”). Legislation bulletin of the Russian
Federation. 2008. No. 11. Part 2. Article 1038.
14. Order of the Ministry of Energy of the Russian Federation dated 13 August 2012 No. 387 “On the approval of
the scheme and programme for development of the Unified Energy System of Russia for 2012 – 2018”. Available
at: http://www.minenergo.gov.ru/upload/iblock/0d4/0d43dc46558268f5b0d4def270142be9.pdf
15. Concept of the long-term socio-economic development of the Russian Federation for the period up to 2020: the
Resolution of RF Government dated 17 November, 2008. No. 1662-r Legislation bulletin of the Russian
Federation. 2008. No. 47. Article 5489. 24 November 2008 (as amended by the Resolution of RF Government
dated 08.August 2009 No. 1121-r).

85Economic and social changes: facts, trends, forecast 1 (25) 2013
BRANCH-WISE ECONOMY
UDC 338.45: 621 (470.22)
LBC 65.305.4(2Rus.Kar)
© Nemkovich Ye.G., Kurilo A.Ye.
Transformation of machine building of the Republic of KareliaThe article considers the process of mechanical engineering transformation from the beginning
of market reforms up to the present time. The article provides the comprehensive analysis of the republic’s
machine-building sector, represented by several types of activities, and presents the dynamics
of indicators characterizing its development. Besides, it defines the region’s machine building
development prospects.
Region, machine building, economic activities, regional national development.
Yevgeniy G. NEMKOVICH Ph.D. in Technical Sciences, Leading Scientific Associate of the Institute
of Economics of Karelian scientific center of RAS
On the modern map of machine building
in our country the Republic of Karelia is pre-
sented by a small number of enterprises. But all
of them have their history, specialization, their
problems and strategies, playing a certain role
in the economics of the republic.
In the Soviet period, machine building was
one of the leading sectors in the economy of
the republic. The big enterprises of Petrozavodsk
included Onega tractor plant, Petrozavodsk-
bummash (the factory of paper-making
equipment), the radio manufacturing plant,
the factory Onego (microelectronics), the
shipbuilding factory Avangard, the machine
building plant Stankozavod and a number of
smaller enterprises, where dozens of thousands
of citizens worked.
Machine-building enterprises produced
trail tractors, woodworking machines, paper-
making machines, bark-stripping drums,
crimping aggregates. The production of
Karelian machine builders was exported not
only to socialistic countries, but also to Canada,
Federal Republic of Germany, Greece. Elec-
tronics and instrument engineering accounted
for about one third of the output volume.
Besides about 10 repair enterprises functioned
in the republic.
Anna Ye.KURILOPh.D. in Economics, Senior Scientific Associate of the Institute of Economics
of Karelian scientific center of RAS
86 1 (25) 2013 Economic and social changes: facts, trends, forecast
Transformation of machine building of the Republic of Karelia
Machine-building enterprises in the country
and in Karelia, confronted with the abrupt drop
of purchasing power on their production, had
to use the strategies of survival which didn’t
correspond with the strategies of dynamic
development.
The transformation of enterprises went
under unstable conditions of transitional
economy under the influence of many cont-
radictory factors of outside environment.
Originally a state was the key-subject of
reformation. Balancing between market driven
approaches and demands on the assurance of
people’s survivance, the state moved to the
market slowly but without any serious social
outbursts [6].
During this period different schemes of
enterprises’ disaggregation were used, aimed
at removing the disproportions of planned
economy. The extrication of main production
from non-core kinds of activity was taking
place, and auxiliary departments had the
opportunity to continue their work as self-
contained subjects of economic activity [8].
The process of restructuring of machine-
building enterprises in the Republic of Karelia
affected departments of social services,
auxiliary units, engineer subdivisions and
non-core departments of the main production
unit. For example, in 1997, 18 associated
enterprises were created during the realization
of a large-scale project of the disintegration in
OJSC Onega tractor plant.
In a varying degree restructing was con-
ducted by practically all the machine-building
enterprises of the republic, releasing non-core
production units and minor kinds of activity. As
a result, the situation in the machine-building
industry of the country and the republic
changed fundamentally during the years of
economic reforms.
OJSC Onega tractor plant, having cut the
volumes of production by 1996 in comparison
to 1990 by 23 times – from 11800 tractors a
year to 500 tractors – lost competition in
Machine building of Karelia, which had a
wood profile, provided timber processing
complex both of the country and of the republic
with tree crop harvesters, woodwork machines;
and cellulose and paper industry with spare
parts, aggregates and even paper-making
machines.
In 1985 the share of machine building
industry in the whole volume of industrial
production of Karelia was 19%, and the share
of the employed in this branch was 20% of the
number of manufacturing personnel [2, p. 30].
In the late 1980s – early 1990s, at the
beginning of economic reforms, price libera-
lization and external economic relations, the
whole industry (and machine building as
well) of the country and the republic was built
according to branch-wise principle with the
high level of specialization and the low level
of inter-sectoral and intra-sectoral exchange.
After the demolition of the common economic
space of USSR and Comecon countries,
enterprises found themselves in conditions
of shrinkage of outlet areas and absence of
competitiveness for many positions in the world
market. The enterprises faced a complicated
task of finding their place in transitional
economy, develop and implement a set of
measures aimed at adaptation to the conditions
of arising market-driven economy.
Reformation of the enterprises went
practically spontaneously and separately,
according to branches and territories. The
enterprises tried to solve this problem on
their own. The situation was escalated by the
long delays of payments for already delivered
goods. At the same time foreign manufacturers
carried out an active policy of penetration
into the Russian market. That is why every
enterprise developed its own strategy of survival,
depending on its abilities and opportunities.
New owners and managers often didn’t have
experience in running business operations in
market conditions.

87Economic and social changes: facts, trends, forecast 1 (25) 2013
Ye.G. Nemkovich, A.Ye. KuriloBRANCH-WISE ECONOMY
the Russian market to Finnish companies
(PONSSE, TIMBERJACK) because it wasn’t
ready for developing competitive products. The
production volumes of CJSC Petrozavodskmash
were cut considerably, due to its lack of
financial resources for buying abroad licenses
for producing modern equipment for paper-
making industry. JSC Stankozavod actually
curtailed production: 250 machines in 1990
against 29 machines in 1995 and 4 machines
in 2006. A considerable slum took place in the
volumes of mechanical material maintenance
in CJSC Repair and engineering works
and in Petrozavodsk automotive equipment
maintenance plant, that switched over to
building and renting out manufacturing and
office property. Their functions were taken by
new established enterprises in maintenance
service of equipment.
Many enterprises got through the procedure
of bankruptcy and changed their owners more
than once, and some enterprises couldn’t work
in new conditions and were eliminated. The
Petrozavodsk radio manufacturing plant went
out of business, it fulfilled defence orders
and was a part of the Leningrad research
and manufacturing combine Leninets; the
Petrozavodsk plant Onego dissolved as well,
it represented the Leningrad association of
electronic instrument engineering Svetlana
– the biggest organization in developing and
output of electronic goods in the USSR.
Shipbuilding factory Avangard went through
the procedure of bankruptcy, changed several
owners and ceased to exist; it specialized in
fulfilling defence orders, building of fishing
motor cultivators and trawlers. Its equipment
has been sold, the territory rented out for offices
and a service centre, its boiler-house heats the
city’s residential area.
Eventually the output volumes shrank
considerably, and a number of staff as well, but
the rest of the enterprises adapted to the
conditions of market driven economy,
releasing competitive products, carrying out
modernization and implementing development
strategies. All these enterprises moved off from
repetitive manufacturing, organized their own
marketing system and work customized.
Positive tendencies in the developing of
machine-building industry are the most
significant in CJSC Holding Company
Petrozavodsk factory of paper-making
machine building. It is the biggest producer
of technological equipment for cellulose and
paper, oil and gas industries in the country.
In the course of the reforms, the company’s
restructuring was conducted, the system of
management was changed; the list of outlet
products was expanded. Over a number of
years the enterprise cooperates with such
famous companies as VOITH (Austria),
METSO (Finland), and supplies paper-
making and cellulose equipment to Finland,
Austria, Norway, Sweden, Great Britain and
CIS countries. The goods are produced in
accordance with domestic and international
standards.
The development of new partner relations
with Russian and foreign enterprises allowed
the plant to keep the volume of production
in all kind of outlet goods and integrate
the state corporation Rosatom in OJSC
Atomenergomash. At present, one of the main
tasks of the enterprise is the demonopolization
of market of equipment for atomic power
stations. At the same time, the state corporation
Rosatom set before CJSC Petrozavodskmash
a strategic task of keeping and outputting to
the world market production of equipment for
paper and paperboard and other industries of
the country’s timber complex.
Without reducing production volumes, the
enterprise conducts updating and moder-
nization of production. New equipment is
bought at the cost of about half million euros.
Due to that, in 2010 the volume of goods
dispatched by CJSC Petrozavodskmash was 2.1
billion rubles (2.3 times more than in 2009),
among them, the atomic industry equipment
88 1 (25) 2013 Economic and social changes: facts, trends, forecast
Transformation of machine building of the Republic of Karelia
accounts for 1.6 billion [7]. Following the
results of 2011, the total value of produced
goods was 2.52 billion roubles, which makes
132% to the level of 2010. The main volume
of production is achieved by the orders from
the state corporation Rosatom [5].
In 2012 Petrozavodskmash launched a
large-scale project on constructing a shop for
producing reactor equipment for atomic power
stations. This is the second and the last stage of
the investment programme at the total cost of 5
billion rubles which aims at the modernization
of the enterprise for the output of large-size
equipment for atomic power stations. The
construction and repair works are planned to
be over in the second half of 2013. The total
cost of the project of reactor shop building is
over 3 billion rubles. The project of the shop
is calculated for annual output of 1.5 sets of
reactor block equipment by three-shift work.
The contract for purchasing a package type
vehicle is already closed; this vehicle will allow
transporting a reactor vessel to the port of the
enterprise for embarkation.
The management team of CJSC Petro-
zavodskmash started to work out a strategic
development programme and accomplishes
business planning for long-term prospects;
in the conditions of high uncertainty of
Russian business-environment only a few
representatives of machine-building industry
can afford it.
The oldest enterprise in the country is LLC
Onega tractor plant, developing and producing
tractors for timber processing complex for more
than half a century, was confronted with
difficulties in sales of final products because
outlet caterpillar models are old-fashioned
and are not in such demand as wheeled timber
cutting complexes of foreign manufacture.
The results of last years testify to instability of
manufacturing and financial situation at this
enterprise. 663 tractors were produced in 2003
(the volume of output in monetary terms made
516.6 million roubles), in 2005 only 363 tractors
of different versions were manufactured. In
2010 the plant managed to sell 76 items.
The factory got through the procedure of
bankruptcy, changed several owners. In 2004
it was included in the affiliate group of
corporations Tractor Plants and incurred
accelerated restructing which was aimed at the
elimination of noncompetitive and duplicating
other units departments. As a result, the
subject-oriented combined machine-building
enterprise with enclosed technological cycle
transformed into an assembly plant.
The enterprise takes steps on the way of
participation in international cooperation and
integration into international economic
relations. The project involves semi knocked
down assembly of modern timber cutting
harvesters CHETRA KH-451 made at the
Danish plant Silvatec Skovmaskiner A/S
which is a part of the concern Tractor Plants.
Long-range engineering projects of
constructing and regulating of production of
modern complex of machines for Canadian
timber cutting technology are conducted at
the plant. This complex is composed of felling
and milling and delimber-bucker machines,
timber loader. This is a new technology of
forest harvesting differing from tree-length
logs and cut-to-length method used in our
and European countries. 175 people worked
at the plant in 2012; relocation from the city
centre to the second manufacturing area of
the enterprise is finished and its development
is spreading. Summarizing the results of 2011,
about 100 items was assembled and dispatched
at the factory. Although it was planned for 2012
to produce 130 tractors, output capacities allow
reaching the index of 300 machines a year.
The main enterprise of production of
vehicles and equipment in the republic is the
Onega shipbuilding factory set up as a successor
of shipbuilding-ship repairing capacities OJSC
Belomorsko-Onezhskoe parohodstvo. The
enterprise is assessed by the Russian Marine
Registry of Shipping, Russian River Register
and German Lloyd.
89Economic and social changes: facts, trends, forecast 1 (25) 2013
Ye.G. Nemkovich, A.Ye. KuriloBRANCH-WISE ECONOMY
Within the framework of presidential
programme on the renewal of Russian fleet, a
big project on building of “Karelia” type ships
was implemented at the factory. This is a self-
propelling, one-screw dry cargo ship, meant
for transportation of general and bulk cargoes.
Ships like that being of interest for private
shipping companies are more effective in marine
conditions than familiar to our ship owners crafts
of composite class “river-sea”. In 2009 contract
liabilities for building of three ships were fulfilled
successfully. Despite the world tendency of
reducing the purchase orders for constructing
of crafts and scarcity of working capital in 2010
CJSC Onega shipbuilding factory reached its
maximum efficiency, 4 crafts, and sent them to
the customers. In 2011 the factory began to build
five oil ships of the type “river-sea” of project
RST23 at deadweight capacity 7000 tons.
At present, the capacities of the factory
allow building ships at length to 140 m, width
to 16.5 m and light-ship to 2.3 thousand tons.
The prospects of development of shipbuilding
are governed by the “Strategy of development
of shipbuilding industry in the Russian
Federation for the period till 2020 and the
future perspective” and by the federal target
programme “The Development of civil marine
facilities for 2009 – 2016”. The enterprise
has a task of modernization and expansion of
production facilities in the short term, which
will allow building ships at length to 190 m and
light-ship to 3 thousand tons.
One of the effective examples of successful
cooperation between republican bodies and
manufacturers can be found in the establishment
of two subsidiary enterprises of Finnish concern
PKC Group – LLC AEK and LLC Electrokos
in the city of Kostomuksha. In 2003 – 2005 a
group of companies of this concern completed
the construction of a production base for outlet
of electric wiring for automotive industry
and electronic components. The sum of
investments made up more than 1063 million
rubles. It enabled to create 193 new workplaces.
LLC Electrokos offers services in engi-
neering and producing electronics. LLC AEK,
having become one of the essential branch
offices of the foreign owner in manufacturing
electric wiring for heavy-duty Volvo and Scania
vehicles, employs more than 800 people, mainly
women. Half of all products manufactured in
the republic according to the type of economic
activity “Production of electric, electronic and
optical equipment” fall on these enterprises.
In this field of economic activity a newly
developed research and production enterprise
Proriv (the city of Petrozavodsk) works succes-
sfully; in Russia it is a leading developer and
producer of testing facilities and measuring
equipment in the field of electromagnetic
compatibility.
On the whole, the production index in the
type of economic activity “Production of
electric, electronic and optical equipment” in
2011 was 111.3% [5].
In the process of transformation of Karelian
machine building LLC Research and Pro-
duction Company Microprofil which produces
mechanical equipment for manufacturing of
corrugated fibreboard.
Innovative enterprise CJSC SPA Engi-
neering centre of fire robotics “EFER” spe-
cializes in developing and producing firefighter
hydraulic and hand fire nozzles, fire-fighting
robots, robotize firefighter complexes.
CJSC Petrozavodsky opitno-mehaniches-
ky zavod manufactures machines for wood-
working enterprises, equipment and instruments
for plants of forest and wood-working industry
branches.
During the restructurization of the mining
and beneficiation complex in Kostomuksha
an enterprise of wide-line profile LLC ZRGOO
was created (repair mining and concentrating
equipment factory). It implements machine
processing of large-size parts (to 28 t),
manufactures forge pieces (to 100 kg), spare
parts for heavy dumpers and executes other
works.

90 1 (25) 2013 Economic and social changes: facts, trends, forecast
Transformation of machine building of the Republic of Karelia
Following the results of 2011 products at
total 518.1 million roubles or 125% to the level
of 2010 were manufactured in LLC ZRGOO.
It was possible due to the increasing in
production volumes of the main customer of
the enterprise (LLC Karelsky Okatysh).
Modern conditions of economic mana-
gement and the transition of plants to a new
technological mode caused the emergence of
servicing enterprises. For example, in 2011 a
factory of unit repair LLC Zeppelin Russland
(Petrozavodsk) started working in the Republic
of Karelia. The company, being a dealer of
the world famous company Caterpillar, which
produces different heavy equipment, works
successfully on the territory of the European
part of our country for more than 10 years and
it already has its branch office in the town of
Kostomuksha.
All these examples show the level of
development of machine building in the
republic. In manufacturing works it is repre-
sented by the following types of economic
activity: producing of machine and equipment
(136 enterprises), manufacturing of end metal
goods (106), producing of electric, electronic
and optical equipment (68), manufacturing of
vehicles and devices (23 plants). Meanwhile,
the main potential of machine-building
goods production in the republic (95%) is
concentrated in 9 enterprises.
About one third of the production volume,
dispatched according to the type of economic
activity “Manufacturing works” (fig. 1) falls on
the share of machine-building profile
enterprises. Since 2005 to 2008 this share
increased from 24.4% to 30%. In 2009 (due
to the crisis) indexes dropped, after that in
2010 the summary rate of machine-building
products figured up to 27.3% from the volume
of goods dispatched on the type of economic
activity “Manufacturing works”.
In the enterprises of machine-building
profile 19.4 thousand people work, or 5.6% of
those employed in the republic’s economy. the
products are manufactured to the amount
of 13.5 billion roubles. Cost effectiveness of
production is an average of 5.3%.
Figure 1. Scheme of volume of products dispatched on the type of economic
activity “Manufacturing works” in the Republic of Karelia in 2005 – 2010
0
5
10
15
20
25
30
35
2005 2006 2007 2008 2009 2010
Production of vehicles and equipment, share, %Production of electrical, electronic and optical equipment, share, %Production of machines and equipment, share, %Metallurgical production and manufacturing of end metal goods, share, %

91Economic and social changes: facts, trends, forecast 1 (25) 2013
Ye.G. Nemkovich, A.Ye. KuriloBRANCH-WISE ECONOMY
Average monthly salary is progressively
increasing. If in 2005 it was 10% lower than the
average in the republic, then in 2010 it was 12%
higher.
The analysis of machine-building enter-
prises’ work shows some stabilization of
manufacturing situation approximately by
2005, first of all in big plants. In the period of
2005 – 2007 the factory output was increasing,
which is confirmed by industrial production
indexes (fig. 2). From the beginning of the crisis
in 2008 the development slowed down, and in
2009 the indexes in three types of economic
activity of machine-building industry dropped
considerably. Then the situation began to
improve. While the type of economic activity
“Manufacturing of vehicles and devices” is in
the opposite phase of main tendency, which
is connected with the technology of ship
producing. In 2011 we see the dropping of this
type of activity index to 7%.
Steps taken by the government of the
country, republic and enterprises, allowed in
2011 to increase production volumes on the
following types of economic activity: manufac-
turing of machines and equipment (104.4%),
metallurgical production and production of
end metal goods (106.7%), manufacturing
of electric, electronic and optical equipment
(111.3%). At the same time, in the enterprise
of vehicle production befell a sudden drop of
industrial production index – to 7.1%. Because
of the change of the owner who unsuccessfully
tried to convert the manufacturing to producing
ships of a different class, the enterprise turned
out to be in a situation of bankruptcy.
Enterprises producing competitive goods
demonstrate a positive dynamics of develop-
ment, because they possess modern technologies
and a modern system of management. Here a
computer monitoring of the whole life circle
of products is provided – from formation to
running.
In the medium term, steps in enterprises’
development will be directed towards their
further reconstructing and modernization on
the basis of implementation of modern, high
efficiency equipment, mastering of new product
kinds, more effective usage of manufacturing
facilities.
Figure 2. Industrial production index on the types of economic activity
in the Republic of Karelia in 2005 – 2010, in % to the previous year
0
20
40
60
80
100
120
140
160
180
2005 2006 2007 2008 2009 2010 2011
Metallurgical production and manufacturing of end metal goodsProduction of machines and equipmentProduction of electrical, electronic and optical equipmentProduction of vehicles and equipment
92 1 (25) 2013 Economic and social changes: facts, trends, forecast
Transformation of machine building of the Republic of Karelia
For example, CJSC Holding company
Petrozavodskmash and the State Corporation
Rosatom, which is continuing to implement
the integration project, by 2015 plan to
carry out technical re-equipment of the
existing production, prepare facilities for
increasing production volumes and for
developing the production of Russian nuclear
industry equipment. Besides, it is planned to
develop the resource efficient production of
environmentally safe shipping packaging set
for keeping and transporting of spent nuclear
fuel. In addition, CJSC Petrozavodskmash will
continue its work on the conclusion of long-
term contracts for manufacturing goods for its
traditional customers – cellulose and paper and
oil and gas industries.
The further development of LLC Onega
tractor plant is connected with the enlargement
of product line of output machines and with
new market penetration. A project is being
implemented which is aimed at the import
substitution of timber machines. For the
purpose of effective development of the plant
and organizing the assemblage of new kinds
of modern, competitive machines for timber
cutting works, the enterprise signed a contract
with the Ministry of Industry and Trade of the
Russian Federation for carrying out R&D, for
organizing the manufacturing of a modern
machine complex. At present machine samples
are assembled and tested. Besides the enterprise
is implementing a programme aimed at the
production of a machine complex for cut-to-
length timber harvesting. The programme’s
implementation by 2015 will allow to achieve
the complete replacement of the product line
and to produce the new basic model of a vehicle
Onezhets-300 commercially.
Other machine-building enterprises have
their development programmes as well. Several
factors are needed for their implementation,
including the modernization of manufacturing,
the expanding of distribution areas and output
of new products.
In order to keep their competitiveness in the
conditions of Russia’s joining WTO and given
the increase of foreign machine-building
goods’ import, enterprises have to perform
a deep organizational and management
modernization and to enter the path of
innovation development.
It is necessary to develop a mutually
beneficial partnership between business and
state through the increase of social responsibility
of enterprises and enhancement of state support
instruments. Under these circumstances
collective and cooperated actions of authorities
and employers in the revival of the image of
working professions and in steep increase of
moral and financial incentive for employees of
machine building plants are needed.
In the opinion of several experts the republic
can become an area for implementation of the
cluster approach to development of innovation
timber machine building with high level of
competitiveness of output goods, covering the
requirements of Russian timber enterprises, in
the first place those of the RF North-Western
Federal District [4]. Forest-industry and wood
machine building clusters of the republic are
able to cover requirements of wood enterprises
of the region in equipment and to maintain
deliveries to other regions of the country and
for export.
In general, during the years of political and
economic changes machine building in the
republic fell under complete transformation.
Essentially new enterprises were created,
which have adopted the rules of market
driven economy and are now shifting to a new
organizational and technological mode of
production, they are able to compete in the
conditions of the world market.
At the present stage of development,
machine builders of the republic undertake
mission of maintaining and enhancing the
achieved level of manufacturing, its technical
re-equipment and production of competitive
goods which comply with the world standards.

93Economic and social changes: facts, trends, forecast 1 (25) 2013
Ye.G. Nemkovich, A.Ye. KuriloBRANCH-WISE ECONOMY
That is why the elaboration of a system
strategy of development of machine building
in the Republic of Karelia as part of public-
private partnership appears to be essential [3].
In general, the positive dynamics of
production indexes, negotiation of the
consequences of the crisis and practical actions
of owners and top-managers of machine-
building enterprises indicate that, despite the
existing difficulties and problems, Karelian
machine building has good development
prospects.
Refe rences1. Volnukhin N.M., Odlis D.B., Kobzev M.V. Breaking up into smaller units by means of creating associated
companies (the case of OJSC Onega tractor plant) Petrozavodsk: OTZ-CONSULT, 1999.
2. Karelian ASSR in numbers: stat. coll. Petrozavodsk: SU KASSR, 1987.
3. Kurilo A.Ye., Nemkovich Ye.G. Formation of the institute of public-private partnership in the Republic of
Karelia. Regional economics: theory and practice. 2012. No. 25 (256). P. 12-21.
4. Odlis D.B., Shegelman I.R. Prerequisites for the development of the wood machine-building cluster in Karelia.
Microeconomics. 2009. No. 8. P. 253-256.
5. The report of the Ministry of Economic Development of the Republic of Karelia on the 2011 performance.
Official Karelia. Official portal of governmental authorities of the Republic of Karelia. Available at: http://www.
gov.karelia.ru/gov/Power/Ministry/Development/economy.html
6. Rudakov M.N., Odlis D.B. Ways to overcome the crisis of Russian wood machine building. ECO. 2010. No. 1.
P. 76-89.
7. Socio-economic condition of the Republic of Karelia according to the results of 2010. Official Karelia. Official
portal of governmental authorities of the Republic of Karelia. Available at: http://www.gov.karelia.ru/Power/
Ministry/Development/Economy/itog2010.html
8. Haynish S. 20th anniversary of the Russian management consulting: some lessons, thoughts, paradoxes, illusions.
Problems of the theory and practice of management. 2002. No. 5. P. 106-112.
94 1 (25) 2013 Economic and social changes: facts, trends, forecast
BRANCH-WISE ECONOMY
UDC 37.014.543(470)
LBC 65.261.55(2Rus)
© Avetisyan I.A.
The problems of financing of higher education in modern RussiaThe article deals with the financing of higher education in the current conditions on the materials
of state universities in the Russian Federation. The author proves that education in general, including
higher education, cannot be considered as a commercial service sector and universities as commercial
organizations. He believes that it is a sphere of intellectual and spiritual activities that creates public
goods, which must be provided by the state on a par with other public goods (ensuring of the state and
social security, social security of the population, environmental security, etc.). This article presents
the problems in the improvement of education expenditure planning and financing according to the
objectives of modernizing the country at the new stage of its development.
Higher education in Russia, financing, commercialization of universities, organization of student admitting
and training, academic teaching staff salaries.
Ishkhan A. AVETISYANDoctor of Economics, Professor of the Vologda State Technical University, Honorary
Figure of Russian Higher Education
The course for the modernization of society
declared in Russia should be implemented due
to the transition to an innovation economy. So,
improving the quality of human capital that
depends directly on the education of public
at large takes a particular importance in this
process. The modernization of society is impos-
sible without qualified specialists and talented
scientists, without acquiring knowledge and
high-quality education of people who are, in
turn, the sources of high and sustainable rates
of economic growth.
In this regard, a key role is assigned to higher
professional education (HPE) – the highest level
of the educational system that provides a person
with the guarantees of higher education and
qualification in the chosen field of professional
activity. The institutions of this educational
sphere are called higher education institutions
(institutes of higher education) that have the
forms of a university, academy, institute, etc.
Prior to the adoption of the new Federal
Law “On education” that will become effective
since 2013, legislative and legal principles of
state policy in the field of education in Russia
are regulated by the federal laws “On Edu-
cation” dated January 13, 1996 No. 12-FL
and “On Higher and Postgraduate Educa-
tion” dated August 22, 1996 No. 125-FL, the
National Doctrine of Education Development
approved by the Government Resolution dated
October 4, 2000 No. 751, as well as by the sub-
ordinate legislations of the Ministry of Educa-
tion and Science of the Russian Federation, the
Ministry of Finance of the Russian Federation,
the Federal Treasury of Russia, etc.
Economic and social changes: facts, trends, forecast 1 (25) 2013 95
I.A. AvetisyanBRANCH-WISE ECONOMY
of students were not paid on time. There was
no budgetary financing of expenditures for
the organization of the educational process,
the maintenance and use of buildings, buying
and repairing equipment. State universities’
arrear with the payments for public services
and energy supply increased, and there were
no actual mechanisms and sources to repay
the debt. Due to the acute deficiency of gov-
ernmental funds, the budgetary financing of
state universities reduced under the pretence
of rationalization and efficient use of budget
funds, the need for “the transparency” of bud-
get financing, the intensification of state func-
tions in the budget process. These measures
have resulted in the following:
– reduction in the number of state funded
organizations that was resulted in the closure
and / or consolidation of state universities, as
well as transferring the functions of university
financing to the regional budgets;
– detailed distribution of budgetary funds
by federal authorities between the items of
budget classification already at the stage of
budget quarterly breakdown; allocation of bud-
getary funds for the specific expenditure items
without the right to redistribute them, etc.
In order to solve the situation, state univer-
sities were allowed to search for additional
(non-budgetary) funding sources to cover the
financing gap, especially in the current
expenses. The government stimulated the
development of universities’ entrepreneur-
ial activity that favoured the increase in the
amount of revenue from paid educational
services from year to year and allowed the state
universities to turn into the market-based orga-
nizations. Moreover, market-based state policy
in the field of higher education resulted in the
increased number of non-state commercial
universities and their branches that throve in
our country over the past two decades.
In all fairness it has to be added that the
reduction of the state financial support for
higher education was a necessary measure in
There is no need to prove that the stable
functioning of universities, the development
of higher education and improving the quality
of training of qualified specialists depend
largely on timely financing for the above pur-
pose. Since the development of higher educa-
tion was considered as a national problem, it
was financed mainly from the federal budget of
Russia. According to the 2004 data, nationwide
sphere of state higher education received 93%
of funds from the federal budget of Russia, 6%
from the budgets of the federal subjects of Rus-
sia and 1% from local budgets1.However, there
is a trend to decrease in the nationwide share
of government financing of higher education in
recent years: the share of federal budget in the
financing of state universities’ expenditure has
accounted for 70 – 75%2. The share of extra-
budgetary funds, particularly the revenue from
paid educational services, has increased due to
strengthening the commercialization of state
universities’ activity. Thus, the share of bud-
get financing in the structure of financing the
Vologda State Technical University’s (VSTU)
expenditures was 49.7% in 2003 and 43.9% in
2012, the share of non-budgetary financing was
50.3% in 2003 and 56.1% in 2012. According to
recent statistics, more than 2/3 of the total cur-
rent expenditures of the University are financed
by the funds received from paid educational
services.
This dynamic has its own history. In the
period of transition to a market economy (the
1990s of the 20th century), the educational
system on the whole and higher education in
particular had to survive due to the sustained
reduction of government financial support
for social sphere. Sometimes, the low wages
of lectures and other employees in the state
universities, as well as the meager scholarships
1 Gurov V.А., Sigova S.V. On financing of education.
Finances. 2006. No. 8. P. 49-52.2 Kalashnikova О.V. Financing of higher education in
the transition to an innovative economy. Author’s abstract.
Ivanovo, 2011. P. 11.

96 1 (25) 2013 Economic and social changes: facts, trends, forecast
The problems of financing of higher education in modern Russia
the 1990s because of the chronic economic
decline and deterioration of the financial situ-
ation in Russia due to thoughtless economic
reforms. However, there was an economic
growth in the country after the 1998 default.
Annual average GDP growth rates accounted
for 5 – 6.5% in the period from 2000 to 2008.
During those years, Russia’s GDP grew by
68%, and the country ranked the 6th in the
world according to GDP gross volume. The vol-
ume of Russia’s consolidated budget increased
manifold during that period, the federal budget
of Russia became surplus, there was an increase
in gold and foreign exchange reserves3, etc.
It would seem, Russia had an opportunity to
mobilize the financial support for higher edu-
cation due to the significant improvement of
macroeconomic and financial indicators.
However, it did not happen. Scanty scholar-
ships were persisted. It was not implemented
the provision of the 1996 Russia’s law “On
education” that the average wage rates of aca-
demic teaching staff should be two times higher
than the average wage of industrial workers.
According to this law, the share of expenditures
on higher education should be at least 3% of the
expenditure side of the federal budget, however,
it was actually accounted for 2.5% on average
in 2000 – 2004. There was no radical progress
in the subsequent years.
Table 1 shows that the share of financing of
higher education expenditures in the total
expenditures of Russia’s federal budget
increased slightly – up to 3.3% in 2009, i.e.
the growth was only 0.9% for six years. The
share of budget financing of higher education
expenditures accounted for 0.8% of GDP in
2009. At the end of 2011, it had dropped to
0.7% of GDP, which was two times lower than
in developed countries (average rate of the
OECD countries – 1.3%).Budget amounts of
3 See: Avetisyan I.A. Issues of the state regulation of the
processes of income distribution and use in today’s Russia.
Economic and social changes: facts, trends, forecast. Vologda:
VSCC CEMI RAS, 2009. Iss. 1 (5). P. 109-111.
Russian state universities for research was no
more than 0.04% of GDP, while it amounted
to 0.25 – 0.4%4 in the developed countries.
The quality of specialist training in Russia
has dropped sharply over the recent two decades
that is proved, for example, by the following
facts. The Times Education has published the
World University Rankings 2011 – 2012 based
on the special score evaluation. According
to this ranking, Lomonosov Moscow State
University that was among 50 top universities
in the world until recently found itself in the
group of universities that ranked from 276th to
300th. St. Petersburg State University, followed
the Moscow State University, found itself in
the group of universities rounded out the list
(351st – 400th positions)5.
It is our firm belief6 that one of the main
reasons for the sharp decline in the quality of
higher education in Russia today is the com-
mercialization of state universities and a grow-
ing trend to increase the number of students
who pay for their education due to reducing
the share of free education. In fact, there is
non-compliance with the requirements the RF
Constitution (Article 43) that “everyone shall
have the right to receive, free of charge and
on a competitive basis, higher education in a
state or municipal educational institution or
enterprise”7. As we see, there is no paid higher
education clause on a non-competitive basis in
the Constitution.
Moreover, a number of laws run counter to
the Constitution and aimed at strengthening
the commercialization of state higher educa-
tion institutions have been adopted in the
country in recent years. For example, the Law
of the Russian Federation “On Autonomous
4 Kalashnikova O.V. Ibid. P. 12.5 Version. 2012. No. 11. March 19 – 25. P. 5.6 The author of this article has been teaching in the state
universities for 47 years. Of which, he had been working as a
pro-vice-chancellor for academic affairs for 12 years in the
economic university (in Soviet times).7 Constitution of the Russian Federation. Moscow: RF
MIA Joint Editorial Board, 1998. P. 17.
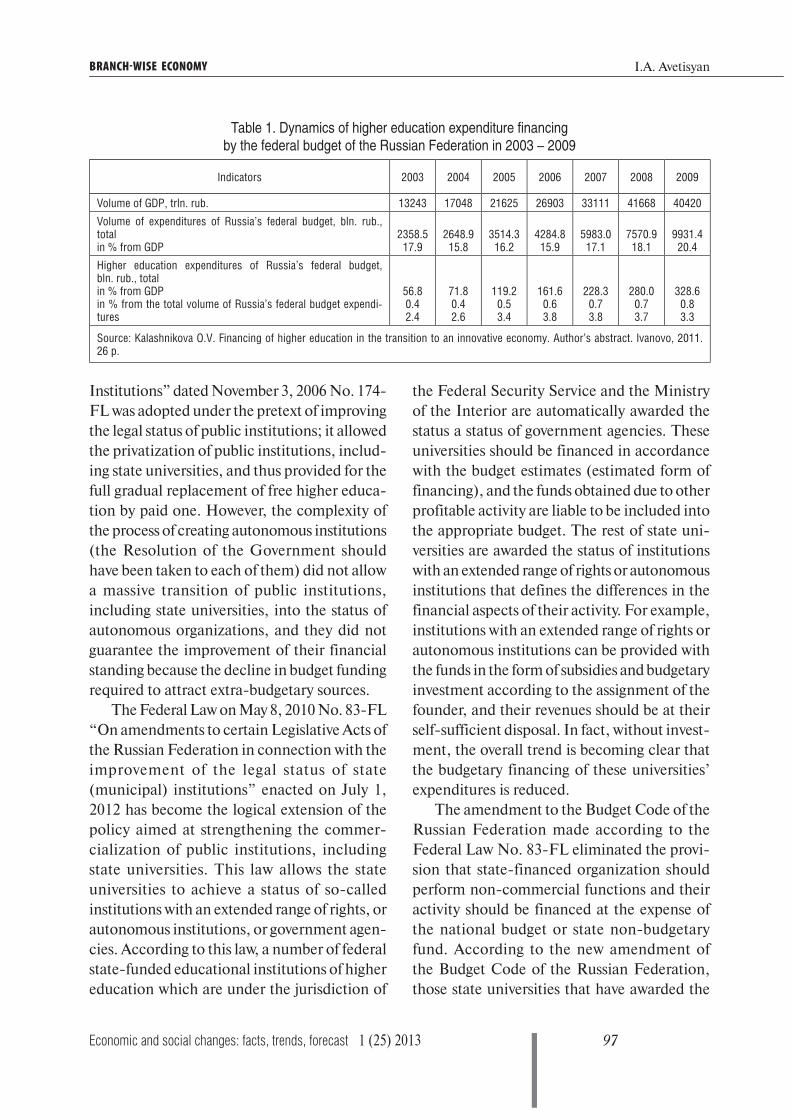
Economic and social changes: facts, trends, forecast 1 (25) 2013 97
I.A. AvetisyanBRANCH-WISE ECONOMY
Institutions” dated November 3, 2006 No. 174-
FL was adopted under the pretext of improving
the legal status of public institutions; it allowed
the privatization of public institutions, includ-
ing state universities, and thus provided for the
full gradual replacement of free higher educa-
tion by paid one. However, the complexity of
the process of creating autonomous institutions
(the Resolution of the Government should
have been taken to each of them) did not allow
a massive transition of public institutions,
including state universities, into the status of
autonomous organizations, and they did not
guarantee the improvement of their financial
standing because the decline in budget funding
required to attract extra-budgetary sources.
The Federal Law on May 8, 2010 No. 83-FL
“On amendments to certain Legislative Acts of
the Russian Federation in connection with the
improvement of the legal status of state
(municipal) institutions” enacted on July 1,
2012 has become the logical extension of the
policy aimed at strengthening the commer-
cialization of public institutions, including
state universities. This law allows the state
universities to achieve a status of so-called
institutions with an extended range of rights, or
autonomous institutions, or government agen-
cies. According to this law, a number of federal
state-funded educational institutions of higher
education which are under the jurisdiction of
the Federal Security Service and the Ministry
of the Interior are automatically awarded the
status a status of government agencies. These
universities should be financed in accordance
with the budget estimates (estimated form of
financing), and the funds obtained due to other
profitable activity are liable to be included into
the appropriate budget. The rest of state uni-
versities are awarded the status of institutions
with an extended range of rights or autonomous
institutions that defines the differences in the
financial aspects of their activity. For example,
institutions with an extended range of rights or
autonomous institutions can be provided with
the funds in the form of subsidies and budgetary
investment according to the assignment of the
founder, and their revenues should be at their
self-sufficient disposal. In fact, without invest-
ment, the overall trend is becoming clear that
the budgetary financing of these universities’
expenditures is reduced.
The amendment to the Budget Code of the
Russian Federation made according to the
Federal Law No. 83-FL eliminated the provi-
sion that state-financed organization should
perform non-commercial functions and their
activity should be financed at the expense of
the national budget or state non-budgetary
fund. According to the new amendment of
the Budget Code of the Russian Federation,
those state universities that have awarded the
Table 1. Dynamics of higher education expenditure financing
by the federal budget of the Russian Federation in 2003 – 2009
Indicators 2003 2004 2005 2006 2007 2008 2009
Volume of GDP, trln. rub. 13243 17048 21625 26903 33111 41668 40420
Volume of expenditures of Russia’s federal budget, bln. rub.,totalin % from GDP
2358.517.9
2648.915.8
3514.316.2
4284.815.9
5983.017.1
7570.918.1
9931.420.4
Higher education expenditures of Russia’s federal budget, bln. rub., total in % from GDP in % from the total volume of Russia’s federal budget expendi-tures
56.80.42.4
71.80.42.6
119.20.53.4
161.60.63.8
228.30.73.8
280.00.73.7
328.60.83.3
Source: Kalashnikova O.V. Financing of higher education in the transition to an innovative economy. Author’s abstract. Ivanovo, 2011. 26 p.

98 1 (25) 2013 Economic and social changes: facts, trends, forecast
The problems of financing of higher education in modern Russia
status of state-financed public organizations
perform commercial functions, and they are
financed in full due to the budget on the basis
of the budget estimates (BC Code of RF; article
161). And most state universities that have not
been awarded this status perform commercial
functions, and they are financed mainly by the
revenues from their paid activity, in particular,
from providing paid educational services.
Finally, Russia has found a global factor to
transfer the activity of social institutions (in the
sphere of education, public health, etc.) onto
commercial basis: the country became a full
member of the World Trade Organization
(WTO) and a participant of the General Agree-
ment on Trade in Services (GATS) at the end of
August, 2012. According to the WTO – GATS
rules, the citizens of Russia, unfortunately, are
deprived of their constitutional rights to free
education, as these social rights become expen-
sive and inaccessible for most people services
that are similar in their nature to the sale of
goods in retail trade system.
Strengthening the commercialization of
state universities, which means, first of all, the
replacement of free education by fee paid edu-
cation is one of the reasons for the sharp decline
in the quality of graduates from the universities.
Table 2 proves this.
The table shows that the total number of
graduates from the Economics Department of
the Vologda State Technical University has
increased 2.2-fold over the period from 2003
to 2006, including 1.7-fold increase in the
number of graduates who got state-subsidized
education and 4.2-fold increase in the number
of fee-paying graduates, i.e. the growth rates
of the fee-paying groups have exceeded the
growth rates of the state-subsidized groups.
Moreover, the share of state-subsidized hon-
ours graduates in the total number of graduates
from the Economics Department accounted for
13.7% in 2006, and the share of graduates who
got state-subsidized education and received
excellent and good final marks was 56.2%. The
share of honours fee-paying graduates was only
1.8%, and the share of fee-paying graduates
who received excellent and good final marks
accounted for 28.2%.It is increasingly possible
to meet such graduates from the economic
faculties who have no ideas about economic
categories and economic laws, say nothing of
the current problems of economic transition of
the country to innovative development.
There is a tendency to reduce the number
of state-subsidized students in the state univer-
sities of the country. So, share of these students
reduced by 4% in 2006 and by 10% in 2007.
Table 2. The number of full-time graduates from the Economics Department
of the Vologda State Technical University their quality classification in 2003 – 2006
Indicators 2003 2004 2005 2006
The number of full-time graduates from the Economics Department, total
Including:
– graduates who got state-subsidized education
152
121
166
146
189
176
336
204
– graduates who paid for their education 31 20 13 132
Graduates quality:
– the number of honours graduates who got state-subsidized education 40 49 44 46
– the number of graduates who got state-subsidized education and received
excellent and good final marks 79 90 104 179
– the number of honours fee-paying graduates 1 – 5 6
– the number of fee-paying graduates who received excellent and good final
marks17 15 7 55
Source: Avetisyan I.A. Higher education expenditure financing in the Russian Federation and the directions of its improvement. Economic
and social changes: facts, trends, forecast. Vologda: VSCC CEMI RAS, 2007. No. 39. P. 12-27.

Economic and social changes: facts, trends, forecast 1 (25) 2013 99
I.A. AvetisyanBRANCH-WISE ECONOMY
The number of state-subsidized students in
Russia amounted to 179 persons per 1000 people
at the end of 2006; according to this indicator
it was overtaken by Canada (299), Austria (227),
Belgium (224), Finland (220), Spain (187), a
number of Latin America countries8.
The new Minister of Education and Science
of the Russian Federation Dmitry Livanov has
called for a further reduction of state-subsidized
student spaces in the state universities and prin-
cipled rejection of free higher education. He
has described his position as follows: “As soon
as we get away from the free higher education
for everyone, we will have got the mechanism
to engage valued staff. For example, educa-
tion loan. If good education is expensive and
a person has to pay for it, he or she will be
able to take out a loan, and an employer to be
will repay it in exchange for commitments”9.
In our view, such an approach of the minister
to higher education reform in today’s Russia,
where a third of the population lives below the
poverty line, and according to official statistics,
the ratio of the average income of the richest
10% to the poorest 10% (the Gini coefficient)
is higher than 15-fold, but in fact it is 35-fold
or more10, puts an end to the availability of free
higher education for many talented and gifted
children from poor families. It is also impos-
sible to agree with the minister’s opinion that an
educational loan can be used as a tool to replace
state-subsidized higher education by fee paid
education because it is almost impossible to use
such a loan due to the great social inequalities
in the country. Moreover, educational loans
for students become risky and unprofitable for
banks and employers due to the second wave
of economic and financial crisis
It is well known that providing high-quality
higher education, first of all, depends on the
standard of knowledge of graduates from sec-
ondary schools and vocational educational
8 Soviet Russia. 2007. January 16. P. 5.9 Soviet Russia. 2012. July 5. P. 1.10 Zavtra. 2012. Aug. No. 31. P. 3.
institutions, which are the main source of con-
tingent for both public and non-government
for-profit universities in the country. If earlier
(in Soviet times), as a rule, only the pupils with
predominant excellent and good marks entered
the universities and became students, then
today mediocre pupils enter the state universi-
ties paying money. Our teaching experience
shows that if the students in state universities
receive objective grades then about 2/3 of fee-
paying students will be immediately expelled
for academic failure after the first session of
the academic year. But this means that that
state university will lose a teacher’s wage rate
and has to dismiss one lecturer. If it is repeated
every term, the university will have to liquidate
the whole department and a lot of lectures will
be unemployed. With such a system of the orga-
nization of higher education, when functioning
of state universities and salaries of their lectures
do not depend on the state budget funding, but
mainly on the money paid for the education
by students and their parents, the objective
assessment of the knowledge of fee-paying
students is eliminated and, therefore, there is
no stimulating basis to improve the quality of
higher education. Is it a reason to explain the
fact that in Russia fee-paying students do not
have the desire to study, and they study badly,
considering that getting “a wallpaper degree”
(i.e. diploma of higher education) is guaran-
teed by the fact of paying for education. This
situation is one of the causes of corruption and
bribery in the system of higher education in
our country.
Former RF Minister of Education and
Science Andrey Fursenko, known for his liberal
and market views on the reforms in Russia’s
higher education system, said, “The main
defect of the Soviet educational system was
an attempt to form a human-creator, and
now our task is to cultivate a skilled consumer
who is able to use ably the results of others’
creativity”11.
11 Soviet Russia. 2012. June 19. P. 4.

100 1 (25) 2013 Economic and social changes: facts, trends, forecast
The problems of financing of higher education in modern Russia
Ex-minister’s ignorance strike us when he
tries to fling mud at the Soviet system of educa-
tion, turn everything upside down and find
faults in everything, even in the creative and
constructive nature of Soviet educational sys-
tem recognized in due course as the best one
in the world. According to ex-minister, form-
ing of a human-creator through the system of
education is not a virtue but a defect. But it is
well known that forming of a human-creator
is a fundamental factor to characterize the
quality of training. Instead of this, it is pro-
posed to bring up the consumers who are able
to use the results of others’ activity (creativity,
creation). What will such an approach lead to?
Firstly, if the higher education system does not
prepare creators, it turns out that the objects
of consumption (advanced technologies and
other objects of creativity) that are not made
in the Russian Federation but abroad, will be
used by Russia’s qualified consumers from the
place where they are made, i.e. from abroad.
Secondly, this approach to higher education
in the context of world globalization will strike
out Russia from the list of potential competi-
tors in the world market. Thirdly, it is the most
important thing, this is a clear failure of plans
to modernize the society and transfer the
national economy to innovative development
announced by the current Russia’s government
because the implementation of these plans
requires the creative impulse and only the
creators but not consumers are able to imple-
ment them.
Introduction of Unified State Exam (EGE
in Russian) in schools is one of the reasons for
the academic decline in schools and, naturally,
the deterioration in quality of higher educa-
tion training in the Russian Federation. Since
2001, EGE has been cultivated in Russia as
an experiment, which is opposed by many
professionals, school and academic teachers.
However, despite the views of experts and the
general public protest, a special federal law
was adopted, and according to it, EGE was
introduced across Russia in 2003 and the oral
and written exams for prospective university
students were replaced by testing. At the same
time, the final school exams in the form of
testing became the entrance university exami-
nations. In other words, if a pupil obtained the
required score (maximum 100 points) accord-
ing to the results of testing and sent a certificate
in the university that he or she liked, he or
she could consider himself/herself a student.
Meanwhile, testing is a formal way of exami-
nation because school leavers, i.e. potential
university students, learn and mechanically
reproduce information without analyzing it
and almost without studying the subjects, they
cease to understand the nature of the question
and think by themselves. In our opinion, EGE
is a means of mental debilitation, cultural and
psychological primitivism of the younger gen-
eration, and, finally, it has a negative impact on
the quality of both general and higher education
in the country.
The test method used in EGE is not par-
ticularly appropriate for testing and objective
assessment of knowledge of social disciplines
and humanities (history, literature, social
studies, etc.), as they are not formalized due
to their specific nature. It is impossible to
assess objectively university entrants’ knowl-
edge of the subjects mentioned above without
direct speaking to them and without an oral
exam. The authorities seem to recognize the
shortcomings of EGE; however, they suggest
to improve this exam but not to cancel it. It
is impossible to agree with this, because the
negative effects of EGE emerge from its faulty
nature. By the way, the developers of the law
on EGE in Russia borrowed it from the former
practice of the American educational system,
which was abolished later in most European
countries, including the USA. EGE support-
ers believe that it is intended to provide all the
school leavers with the equal opportunities for
entering the universities and reduce corruption
and bribery in the education sector.

Economic and social changes: facts, trends, forecast 1 (25) 2013 101
I.A. AvetisyanBRANCH-WISE ECONOMY
However, this is not borne out in practice:
EGE results show that corruption and bribery
have risen to a new level.
Doubtful innovation in higher education is
the transition to the educational process in state
universities according the Bologna system (BS).
Russia’s state universities have adopted a two-
stage educational system “bachelor plus mas-
ter”. This innovation is aimed at the unification
of higher education and acceptance of Russia’s
diplomas in Europe. While there are state-
subsidized, i.e. free, student spaces in the state
universities only for the Bachelor’s programme
as a lower stage of higher education, then stu-
dents should pay for their MA courses at the
highest stage of higher education. The maximal
term of Bachelor’s programme is four years,
and the term of MA course is two years. And
the transition took place when there were no
serious reasons to adopt BS in Russia because
our schoolchildren always ranked first in the
Physics and Mathematics Olympiads, and the
graduates from Russia’s universities such as
engineers and physicists were appreciated and
employed abroad despite the inconvertibility
of their degrees.
We share the opinion of Andrey Fursov that
“the introduction of a four-year bachelor’s
programme instead of five-year traditional high
education turns our high school into a kind of
vocational school; it brings the higher educa-
tion down to earth; and if such a policy is very
bad for an institute, then it is catastrophic for an
university, because an university is eliminated
as a social and civilized phenomenon”12. In
the United States, bachelors are trained in col-
leges that are similar to our technical schools.
Training of bachelors according to BS rules
dramatically increases the bureaucratization
of the educational sphere. The case is that
bachelor’s programme requires a lot of time
of lectures to bring their usual scientific and
educational activities in accordance with the
12 Zavtra. 2011. December. No. 50. P. 5.
formal requirements of bachelor’s programme,
i.e. there are things that are not related to the
content of education here. In such a situation,
low-skilled teachers are ready to cling to the
formal aspect of training.
The financing problems of higher education
are closely related to the financial support for
universities’ scientific activity, as they are not
only educational, but also research centres.
The most part of country’s scientific potential
is concentrated in the universities. The system
of higher education and the realm of science
are inseparable, because a today’s student is
a potential tomorrow’s researcher. Academic
scientists and researchers, especially in the state
universities, do not only impart their profes-
sional and scientific knowledge to students,
but they “produce” the knowledge conducting
fundamental and applied scientific and techni-
cal projects, as well as preparing and publishing
their textbooks, manuals, scientific articles
etc. In the modern era of high technologies,
when the world really strives for a “knowledge
economy”, the new institutional forms of
between education, science and industry such
as “academic university”, “research institute”,
“research and education centre” and others are
in demand.
The budgetary financing of higher educa-
tion has been reduced manyfold in recent years
due to the transition of state universities to
market relations. Despite this, many leading
state universities continue the tradition of tire-
less scientific research which involves leading
scientists who generate new ideas and research
directions. At the same time, the spectrum for
research activities is expanded, and it covers
many fields of knowledge – from the theoreti-
cal and fundamental to specific and applied sci-
ences. Students continue their research activity
that are resulted in publishing the collections
of their research works. Finally, the top state
universities rank first in training of academic,
scientific and research staff through postgradu-
ate and doctoral courses.

102 1 (25) 2013 Economic and social changes: facts, trends, forecast
The problems of financing of higher education in modern Russia
The transition of the country’s economy to
an innovative way of development requires a
new qualitative level of the development of
university’s science and new methods of its
financing. Therefore, in our opinion, when
addressing the issue of funding support for
university’s science according to theoretical
and fundamental areas, including social and
humanitarian researches, it is impossible to
set hopes upon attracting the investment of
businesses because they are not interested in
this. Budgetary financing should predominate
here due to the developed long-term concept of
the state policy in the field of higher education
and science. As for financing of concrete applied
research projects that are developed by major
universities and research and education centres,
then it is possible to involve the investments of
the business community to implement them or
use public-private partnership, as well as they
can involve foreign leading experts and scholars
following the principles of arranging the work
of the Skolkovo Innovation. Centre
Of course, world globalization, high business
competition, technological and scientific
discoveries, which change the way of life,
require the changes in standards of higher
education that should be brought in accor-
dance with the requirements of the day. The
Presidential Decree “On the measures to
implement the state policy in the field of
education and science” dated on May 7, 2012
No. 599 is aimed at solving these tasks. The
decree provides for the activities related to:
• monitoring the activities of universities
to assess the effectiveness of their work in order
to restructure inefficient universities;
• increase in scholarships to needy first-
and second-year students who are studying
on an internal basis on bachelors’ and
specialists’ programmes (state-subsidized
groups) and have excellent and good marks
by the end of 2012;
• transition to normative per capita
financing of universities by June 2013;
• increase in the share of employed people
aged from 25 to 65 who improved their
qualification and (or) were retrained up to 37%
by 2015;
• increase in the share of universities and
secondary vocational institutions, the buildings
of which were adapted for disabled people from
3 to 25% by 2020.
The need for these and other measures was
dictated primarily by the fact that a lack of
governmental regulation of the labour market
for the specialists with higher education was
resulted in a number of non-governmental com-
mercial universities in Russia. As a result, the
total number of universities and the number of
diplomas received in the country became much
more than before 1990. For example, there were
more than 500 universities (only in the form
of state universities) in the RSFSR before the
Soviet Union collapse which involved about 2.8
million students, i.e. there were 6000 students
on average per one university. Today, there
are 2650 universities in Russia (according to
incomplete data), including non-governmental
commercial universities that involve seven
million students, i.e. the average number of
students per one university is 2.64 thousand
people, which indicates the diminishment
of Russia’s universities13. On the other hand,
20.6% of the population in Russia had higher
education at the end of 2005, which was lower
than in the developed countries. For example,
this indicator amounted to 30% for the same
period in the USA14. Furthermore, state-
subsidized (free) student spaces are allocated
to state universities without clear and theoreti-
cally substantiated calculation of the need for
specialists. Both state and non-governmental
commercial universities have been training the
specialists in humanities for the recent 20 years
(lawyers, economists, managers) who are not
on demand in the labour market. At the same
time, there is an acute shortage of highly skilled
engineers and technicians.
13 Soviet Russia. 2012. June 21. P. 5.14 Zavtra. 2006. No. 49. December. P. 4.
Economic and social changes: facts, trends, forecast 1 (25) 2013 103
I.A. AvetisyanBRANCH-WISE ECONOMY
Due to unregulated labour market of spe-
cialists who have higher education and a lack
of the distribution system for the graduates from
the state universities, a lot of graduates are not
in demand for practical work, so they join the
army of unemployed people or do not work in
their specialty. According to the 2004 World
Bank analysis, only 20% of graduates from the
Russian universities worked in their specialty15.
According to the RF President’s Decree
No. 599, the precondition for the implementa-
tion of state policy in higher education is ensur-
ing the sufficient financing for the expenses on
the development of state universities, as well as
using new forms and methods of its implemen-
tation. Moreover, the main item of expenditure
for the current functioning of state universities
is the wages of their employees, especially aca-
demic teaching staff and students’ scholarships.
Since the main persons involved in ensuring the
quality of higher education are teachers and
scientists who work in state universities, it is
necessary to set their wages in such a way that
they would work and live worthily and have a
high social status.
Unfortunately, tariff rates and official sala-
ries of university teachers to the exclusion of
degree and academic rank allowances have not
increased over the years of market reforms, and
they still remain low while increasing the edu-
cational and instructional load. Often a lecture
has to teach 3 – 5 disciplines for the sake of
more or less adequate salary. Of course, such a
lecture regardless of his/her qualification can’t
efficiently teach all the disciplines. Ultimately,
this will have a negative impact on the quality
of training. In addition, many students have to
work at the expense of the quality of training
because of the extremely low scholarships.
It is known that education in general,
including higher education, as one of the
leading sectors of the social sphere belongs to
a non-production sector, where material
15 Premier. 2007. March 27 – April 2. P. 16.
benefits in the form of goods are not directly
produced. However, the social importance
of this field for society is very high, since, as
noted, the effective economic development of
any country depends on the education of its
citizens. That is why free secondary education
and free higher education on a competitive
basis is a constitutional right of citizens in
Russia (Article 43 of the Constitution) and
one of the social functions of the Russian state
because the Russian Federation is a social state
(Article 7 of the Constitution). But nowadays
education in Russia is increasingly derived
from the social functions of the state, higher
education services become a commodity, and
the universities turn into trade organizations.
In our opinion, the whole education system,
including higher education, can’t be considered
a service sector. This is a sphere of intellectual
and spiritual activities of the society, which
allows us to acquire knowledge, educates
and forms a human person who has not only
higher education, but also spiritual, moral and
ethical qualities. World experience shows that
there are benefits (public goods) at the level of
society, which are not rational and sometimes
impossible to be acquired individually. Of
course, these public goods include educational
services. But this does not mean that educational
state-financed institutions, particularly state
universities, cannot receive extra-budgetary
funds from the additional educational activities
through their preparatory departments, training
and retraining centres, experimental farms, as
well as through contractual researches and their
implementation, rental property, etc.
Today, all the spheres of social life, including
higher education, have a pressing issue of
strengthening the public financial control over
budgetary expenditures. It is a known fact
that low budget discipline, embezzlements,
thefts, improper use of budget resources,
corruption, bribery, etc. take place in some
state universities due to weak, ineffective and
sometimes formal state internal and external
104 1 (25) 2013 Economic and social changes: facts, trends, forecast
The problems of financing of higher education in modern Russia
financial control at the level of the Ministry
of Education and Science, therefore, it is
necessary to focus on some issues relating to the
use of new techniques, forms and mechanisms
of financing for higher education.
Until recently, the current expenditures on
the wages of state university employees in a
public sector, including higher education, were
financed through a unified tariff net (UTN),
which was abolished later and replaced by a
new one, so-called sectoral system of financ-
ing the public sector expenditures. That is, the
individual methods of planning and financing
of budget expenditures began to be used in
every sector of the public sphere (education,
health, culture, etc.). In order to implement
a new phase of higher education reform, there
is a need for the development of a new model
to finance its expenditures that is adequate to
today’s challenges. SIFO system (State indi-
vidual financial commitments), which is used
in planning and financing the expenditures of
state universities and which is a part of a new
model of financing the higher education expen-
ditures, is worth noticing. This system is called
“a transition to a normative per capita financing
of universities”. It will be used since June 2013.
If budgeted form of financing predominated
earlier in the planning and financing of state
universities’ expenditures, i.e. the amount of
funding was formed not on the base of the
actual and expected results of budget expendi-
tures, but by indexing and adjusting the amount
of funds allocated in the previous year, then the
amount of financing for each state university
is formed by programmed target principle in
the new format. These budget expenditures on
financing of each university are argued by the
purpose of spending which is permitted by the
government. In this case, the purpose is deter-
mined in accordance with the task determined
by the government. For example, funding for
university teachers’ salaries expenses in the part
of training state-paid students directly depends
on the number of the latter. The use of pro-
grammed target principle of funding provides
a stronger link between budgetary financing of
state universities’ expenditures and achieving
the objectives, thereby improving the utilization
of budgetary funds.
The analysis of the problems investigated in
this article allows us to formulate the main
conclusions and suggestions.
1. In our opinion, education in whole,
including higher education, can’t be considered
a service sector, educational services as goods,
and universities should not be considered
as commercial organizations. The specifics
of education, including higher education, is
the fact that it is a sphere of intellectual and
spiritual activities of the society, which allows
us to acquire knowledge, educates and forms
a human person who has not only higher edu-
cation, but also spiritual, moral and ethical
qualities.
2. The reform of higher education and the
educational system in whole implemented
under the guise of modernization in Russia in
recent years that is based on educational
standards (models) of Western countries
with the use of the Unified State Exam and
the Bologna education system has a negative
impact on the quality of general and higher
education in the country, which brings into a
question the feasibility of the strategic objec-
tives of society modernization and the transi-
tion of economy to innovative development.
We oppose the mechanical copying of the
Western educational standards and propose
to develop the National Doctrine for the
development of education, including higher
education of the Russian Federation, as well
as to have our own model of its long term
modernization – the model based on the best
traditions of Russian and Soviet education. In
our opinion, the compliance with the national
roots and traditions does not mean that the
country refuses to make progress and we doom
ourselves to mark time. On the contrary, it
means that the reform of higher education in
our country should be oriented to the world’s

Economic and social changes: facts, trends, forecast 1 (25) 2013 105
I.A. AvetisyanBRANCH-WISE ECONOMY
achievements in this field, it should create
the necessary prerequisites for the improve-
ment of higher education system in Russia.
3. The unregulated labour market of spe-
cialists who have higher education was resulted
in a number of non-governmental commercial
universities in Russia. As a result, the total
number of universities and the number of diplo-
mas received in the country became much more
than before 1990. However, universities train
the specialists in humanities, while there is an
acute shortage of highly skilled engineers and
technicians in the country. This is a result of the
fact that state-subsidized (free) student spaces
are allocated to state universities spontaneously,
i.e. without a clear and scientifically calculat-
ing the need for them. There is no distribution
system for the state-subsidized graduates from
the state universities, so a lot of graduates are
not in demand for practical work, so they join
the army of unemployed people or they work
not in their specialty, and talented specialists
go abroad. Based on this, we propose to recover
the practice of planning the number of state-
subsidized spaces in the state universities for
the certain types of specialties based on clear
and scientifically grounded calculation, as well
as to put into practice the distribution system
for the state-subsidized graduates aimed at the
compliance of their training with real needs.
4. Since ensuring the quality of higher
education is largely determined by the aca-
demic teaching staff of state universities, today
an important task of the state is to increase their
wages in such a way that they would work and
live worthily and have a high social status, as it is
done in the developed countries. The labour of
a university teacher and an academic scientist is
a highly skilled labour required for the current
and further development.
We also propose to restore the provision of
an article 54 of § 3 of the 1996 RF Law “On
Education”, which states that the average wage
rates and official salaries ... for the academic
teaching staff of state universities are set at the
level that is two times higher than the average
wages of industrial workers in Russia. And it
is necessary to achieve the implementation
of this provision at the expense of the budget
funds, which will become available due to the
reorganization and reduction of the number of
inefficient institutions.
5. High competition, technological and
scientific breakthroughs that change the way
of people’s life in a few years require to change
the standards of higher education in the coun-
try so as to bring these changes into line with
modern requirements. Therefore, the reform
of higher education that is characterized by
continuous and dynamic nature must be closely
related to the development and implementation
of a new model of financing the educational
expenditures. It is impossible to improve the
quality of higher education by the only increase
in funding the educational expenditures. Today,
more than ever, it is important to increase state
financial control over the spending of budget
funds allocated to finance the expenditures on
higher education.
In terms of the implementation of a new
phase of the reform (modernization) of higher
education in Russia, a significant result can be
achieved by a funding model, a part of which
is the system of State individual financial com-
mitments. According to it, since June 2013
the expenditures on higher education will be
financed on the base of a programmed target
principle.
References 1. Avetisyan I.A. Higher education expenditure financing in the Russian Federation and the directions of its
improvement. Economic and social changes in the rigion: facts, trends, forecast. Vologda: VSCC CEMI RAS,
2007. Iss. 39. P. 12-27.
106 1 (25) 2013 Economic and social changes: facts, trends, forecast
The problems of financing of higher education in modern Russia
2. Avetisyan I.A. Issues of improving salaries of public sector employees. In: Problems of the strategy and tactics of
regional development. Proceedings of IV Russian scientific and practical conference (Vologda, April 2 – 5, 2003).
Vologda: VSCC CEMI RAS, 2003. P. 156-162.
3. Avetisyan I.A. On the effectiveness of the state budget and budgetary expenditure. Economic and social changes
in the region: facts, trends, forecast. Vologda: VSCC CEMI RAS, 2005. Iss. 29. P. 9-19.
4. Avetisyan I.A. On the public financing of control in today’s Russia. Economic and social changes in the region:
facts, trends, forecast. Vologda: VSCC CEMI RAS, 2006. Iss. 34. P. 19-31.
5. Avetisyan I.A. Issues of the state regulation of the processes of income distribution and use in today’s Russia.
Economic and social changes in the region: facts, trends, forecast. Vologda: VSCC CEMI RAS, 2009. Iss. 1 (5).
P. 107-121.
6. Constitution of the Russian Federation. Moscow: RF MIA Joint Editorial Board, 1998.
7. Budget Code of the Russian Federation (as of April 25, 2012). Moscow: Omega-L, 2012.
8. The concept of reforming the budget process in the Russian Federation in the period from 2004 to 2006. Approved
by the RF Government Decree dated May 22, 2004 No. 249. Available at: Consultant Plus.
9. Gurov V.А., Sigova S.V. On financing of education. Finances. 2006. No. 8. P. 49-52.
10. Kalashnikova О.V. Financing of higher education in the transition to an innovative economy. Author’s abstract.
Ivanovo, 2011.
11. Kovaleva T.M., Barunin S.V. Budget and fiscal policy in the Russian Federation. Moscow, 2005.
12. Parygina V.A., Tadeyev A.A. Budget law and procedure. Moscow, 2005.
13. Svischeva V.A. State and municipal finances. Moscow, 2008.
14. Godin A.M., Goreglyad V.P., Podperin I.V. Budget system of the Russian Federation. Moscow, 2009.
107Economic and social changes: facts, trends, forecast 1 (25) 2013
SOCIAL DEVELOPMENT
UDC 36 (470. 13)
LBC 65.261.55(2Rus.Kom)
© Tikhomirova V.V.
Methodology and mechanisms of funding the social welfare system in the Northern regions
The article deals with the notion ‘social assistance’ as a form of social protection. It gives the
definition of the concept ‘social assistance measures’ and analyzes such forms of social assistance as
regular monetary payments, lump-sum payments and monetary compensation provided in the Northern
regions. Besides, the article analyzes expenditure obligations of the Russian Federation and its subjects
on the provision of social assistance measures. Furthermore, it determines the dynamics of structural
changes in the categories of population receiving social support in the Northern regions for the period
from 2012 to 2020.
Social protection of population, social assistance, regular monetary payment, lump-sum payment, monetary
compensation, targeted social assistance.
Valentina V.TIKHOMIROVAPh.D. in Economics, Senior Scientific Associate at the Institute of Socio-Economic
and Energy Problems of the North Komi Science Centre, Ural RAS Department
Implementation of social support measures
provided to different population groups in
Russia’s Northern territories is specified by the
region, as it is determined by the level of
socio-economic development of the territory,
characteristics of various-level budgeting,
prerogatives of federal and regional authorities
in the sphere of social protection, which is the
field of shared responsibility.
Great practical experience in the usage
of different forms and methods of budgetary
support of the population entitled to benefits
has been accumulated in the Northern
regions by now. Legislative and regulatory
framework governing measures on social
security has been formed. Diverse network of
institutions providing social services to certain
population groups has been established. There
are, however, factors significantly reducing
efficiency of social support measures, such as
the lack of balance between federal and regional
social programmes, uneven distribution of
expenditure obligations on social support
provided by the Russian Federation and
RF constituent entities; insufficient level of
retirement benefits from federal sources that

108 1 (25) 2013 Economic and social changes: facts, trends, forecast
Methodology and mechanisms of funding the social welfare system in the Northern regions
requires regional authorities to take additional
measures to raise non-working pensioners’
income to the subsistence level. The most
vulnerable group of population with income
below the subsistence level is not affected
sufficiently by social support. The task of
providing targeted social support has not
been solved so far. The common feature of
RF constituent entities with varying levels of
budget allocation sufficiency is the prevalence
of categorical social support measures in the
structure of social security expenditures.
The legislative framework is the basis for
state social security regulation. Legislators
present social support as one of the forms of a
broader concept “social security”.
The term “social security” does not have a
single regulatory meaning yet, therefore it is
interpreted quite differently in academic circles
demonstrating that “the specified social
phenomenon is complex and diverse” [1].
Some authors consider the content of the
term “social support” broader, than that of the
term “social security” [2]; others, on the cont-
rary, narrow it greatly defining social support
as a form of supplemental assistance to people
facing difficult life situation, and not to those
living below the subsistence level. Social
support is poorly regulated by normative-legal
documents.
According to the majority of specialists,
however, social support is provided to low-
income citizens in financial distress in the form
of monetary payments, in-kind assistance,
benefits, services and, as a rule, is of short-term
nature [4].
In general, three main tasks of social
support system are the following:
– to provide support to people, who have
made outstanding contributions to the state;
– to make insurance-like payments (pen-
sions, temporary disablement allowance,
benefits for harsh environmental and hazardous
working conditions);
– to carry out social services for disabled
population group not provided with adequate
family support, including certain benefit
payments of such as child benefits, benefits to
families with three or more children and single-
parent families, etc.
The latter task is of the lowest priority and
is poorly financed. As a result, low-income
(needy) population groups have limited access
to resources reallocated through allowance and
benefits system.
The content of social support, according to
the author, practically coincides with the
content of social assistance, but differs
nominally by legal formalization and sources
of financing.
Hence, social support measures are defined
as a complex of activities, carried out as a part
of social security programme within the
framework of the state’s social policy and aimed
at providing assistance to certain population
groups in accordance with the legislative and
regulatory acts of the Russian Federation and
RF constituent entities.
Financial security of the social support
system (income generation and use) is carried
out through the set of corresponding financial
institutions [5]. Therefore, the system of social
support should be regarded as a financial
institution from the institutional point of view,
as it is based on money relations (finance) and
requires financial security.
State sources constitute the major part of
social support funding sources, and they are
allocated from budgetary and non-budgetary
funds.
Federal Laws No. 122-FL of August 22, 2004,
No. 122-FL of July 23, 2005, No. 67-FL of
May 9, 2006 introduced amendments to the
legislative acts of the Russian Federation envisaging
changes from in-kind benefits provided to certain
population groups to monetary compensations, as
well as the division of expenditure commitments
providing social support measures by levels of the
budgetary system.
109Economic and social changes: facts, trends, forecast 1 (25) 2013
SOCIAL DEVELOPMENT V.V. Tikhomirova
Thus, firstly, the law made a clear distinction
of expenditure powers between federal,
regional, and municipal levels of authorities.
Secondly, expenditure commitments assigned
to the federal budget in the field of social
support were reduced, unfunded mandates
were eliminated. Thirdly, ensuring the
conformity of budgets profits and new
expenditure powers became the responsibility
of regional and local authorities. Finally, in
order to improve accountability and increase
transparency of financial flows, certain types
of in-kind benefits were transferred into
monetary compensations [6].
Distribution of powers on social support
resulted in the distribution of all welfare
recipients into two levels of responsibility – of
the federal government and of the RF entities.
The group of “federal welfare recipients”
comprises veterans and disabled persons of the
Great Patriotic War, veterans of military actions,
family members of dead war veterans, Heroes
of the USSR and the Russian Federation,
Heroes of Socialist Labour, Full Cavaliers of
the Orders of Glory and the Orders of Labour
Glory, honorary donors, victims of radiation
accidents and nuclear disasters, the disabled
(including children with disabilities).
Powers regulating the implementation and
financing of measures providing social support
to “regional welfare recipients”, i.e. labour
veterans, home front workers, rehabilitees and
victims of political repressions, were allocated
to RF constituent entities.
Moreover, social support and services
provided to the elderly and the disabled,
families with children, orphans, poor and
socially vulnerable population groups, as well
as the development of regional standards in the
rent subsidies programme have fallen under the
jurisdiction of regions.
Thus, once the Federal Law No. 122-FL
had been issued, the law on veterans underwent
the most substantial reduction, with the two
largest categories of welfare recipients –
labour veterans and home front workers, being
excluded. These groups were attributed to the
RF entities, due to the distribution of powers
between the federal centre and constituent
entities of the Russian Federation.[7].
At present, the system regulating social
support reflects such indicators as population
groups entitled to social support; the number
of welfare recipients at regional and federal
levels; dynamics of social support expenditures;
territorial and socio-demographic differen-
tiation of population; rate of population growth.
Expenses on the implementation of social
support measures is an ongoing priority within
budget commitments of the Northern regions.
Thereupon, it is appropriate to analyze the
dynamics of the number of certain population
groups and expenditure commitments of the
Russian Federation and RF constituent entities
on the measures regulating social support.
The forms of social support are distinguished
as following: regular monetary payment; lump-
sum payment; money compensation.
Regular monetary payment is defined as
payment, introduced due to the changes in the
form of social benefits, as well as all kinds of
payments (extra-payments), provided to
certain categories of citizens at regular intervals
(monthly or quarterly) in accordance with
the regulatory acts of RF constituent entities,
except for monetary compensations [8].
According to Rosstat data [9], the total
number of certain population categories
receiving regular monetary payments, as a
whole across the Russian Federation in 2008
was 18446 thousand people, i.e. 743 thousand
people more as compared to the year 2007, with
1046 thousand (5.7%) welfare recipients in the
Northern regions. Out of the total number of
individuals in the Northern territories entitled
to benefits and receiving regular monetary
compensations, only 13.5 (1.3%) thousand
people fall under the jurisdiction of the Russian
Federation. The largest number of welfare
recipients are in Khanty-Mansi Autonomous
Okrug (6.1 thousand) and in the Sakhalin
Oblast (3.3 thousand).

110 1 (25) 2013 Economic and social changes: facts, trends, forecast
Methodology and mechanisms of funding the social welfare system in the Northern regions
The sum of regular monetary payments in
Northern regions in 2007 ranged from 100 to
2518 rubles in the Republic of Sakha per month
per one welfare recipient, and in 2010 from
100 rubles in Kamchatka Krai to 19566 rubles
in Yamalo-Nenets Autonomous Okrug,
depending on the category of recipients.
According to Rosstat data, the total number
of individuals receiving regular monetary
payment and falling under the jurisdiction of
the Russian Federation made up 12.8 thousand
in 2009, and 1.6 thousand in 2010, which is
9.4% less as of the last year level. This change
occurred due to reducing number of the war-
disabled (216 people), the disabled (747 people)
and children with disabilities (281 people).
The total volume of regular payments by the
Northern regions comprising 13.3 million
rubles in 2009, increased by 13.9% in 2010.The
average amount of regular monetary payments
amounted to 1042 rubles in 2009, and has
increased to 1333 rubles per a recipient in 2010.
Disabled children, disabled war veterans, and
veterans of the Great Patriotic War accounted
for the largest volume of payments (fig. 1).
The largest number of the war-disabled in
2010 was registered in Khanty-Mansi
Autonomous Okrug (595 people) and in the
Republic of Sakha (509 people), of the disabled
– in the Republic of Sakha (533 people), of
children with disabilities – in Khanty-Mansi
Autonomous Okrug (4.6 thousand people).
The Sakhalin Oblast accounted for a significant
number of the Great Patriotic War veterans
(1018 people) and citizens awarded the title of
“Honorary donor of Russia” (2410 people).
The total number of certain population
categories receiving regular monetary pay-
ments and falling under the jurisdiction of RF
constituent entities has increased from 617.7
Figure 1. The amount of regular monetary payments under the jurisdiction
of the Russian Federation, thsd. rub.
53635569
2654
1271
1827
3684
1713
1877
15422769
261196
0%
10%
20%
30%
40%
50%
60%
70%
80%
90%
100%
2009 0102
Family members of dead war-disabled people, participants of the Great Patriotic War and veterans of military operations
The war-disabled
Citizens awarded the title of “Honorary Donor of the USSR” or “Honorary Donor of Russia”
Veterans of the Great Patriotic War, except for home front workers
The disabled
Disabled children
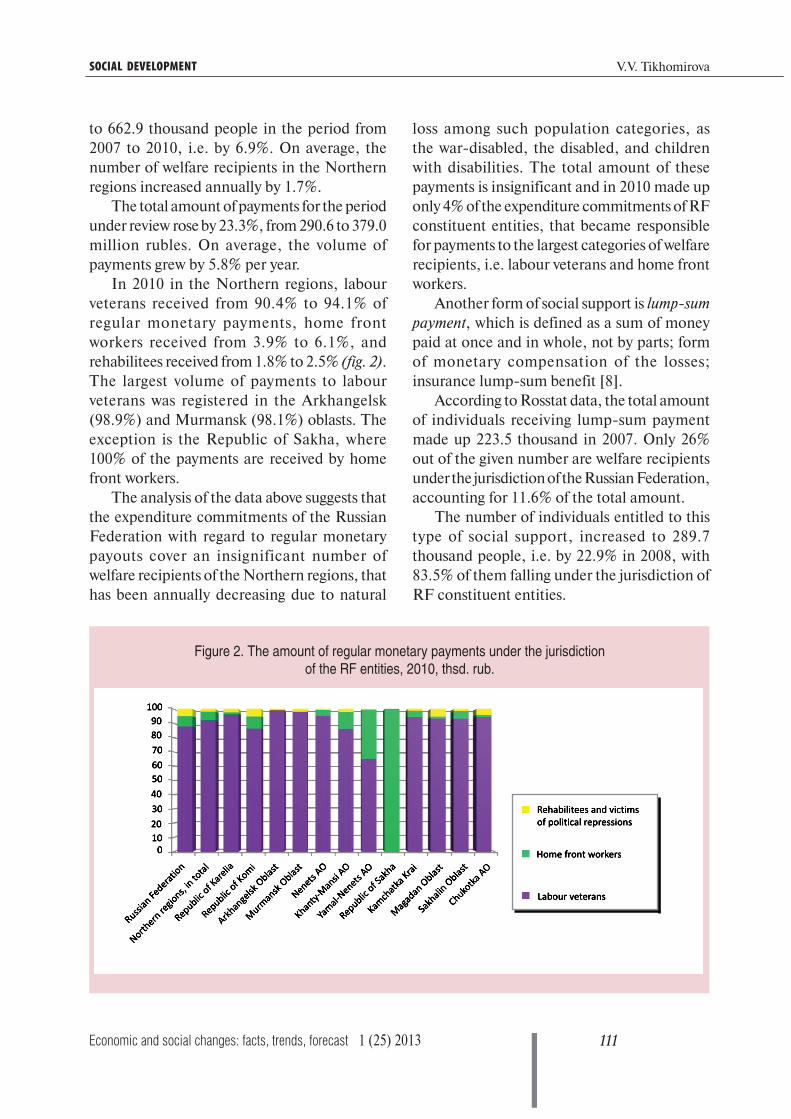
111Economic and social changes: facts, trends, forecast 1 (25) 2013
SOCIAL DEVELOPMENT V.V. Tikhomirova
to 662.9 thousand people in the period from
2007 to 2010, i.e. by 6.9%. On average, the
number of welfare recipients in the Northern
regions increased annually by 1.7%.
The total amount of payments for the period
under review rose by 23.3%, from 290.6 to 379.0
million rubles. On average, the volume of
payments grew by 5.8% per year.
In 2010 in the Northern regions, labour
veterans received from 90.4% to 94.1% of
regular monetary payments, home front
workers received from 3.9% to 6.1%, and
rehabilitees received from 1.8% to 2.5% (fig. 2).
The largest volume of payments to labour
veterans was registered in the Arkhangelsk
(98.9%) and Murmansk (98.1%) oblasts. The
exception is the Republic of Sakha, where
100% of the payments are received by home
front workers.
The analysis of the data above suggests that
the expenditure commitments of the Russian
Federation with regard to regular monetary
payouts cover an insignificant number of
welfare recipients of the Northern regions, that
has been annually decreasing due to natural
loss among such population categories, as
the war-disabled, the disabled, and children
with disabilities. The total amount of these
payments is insignificant and in 2010 made up
only 4% of the expenditure commitments of RF
constituent entities, that became responsible
for payments to the largest categories of welfare
recipients, i.e. labour veterans and home front
workers.
Another form of social support is lump-sum
payment, which is defined as a sum of money
paid at once and in whole, not by parts; form
of monetary compensation of the losses;
insurance lump-sum benefit [8].
According to Rosstat data, the total amount
of individuals receiving lump-sum payment
made up 223.5 thousand in 2007. Only 26%
out of the given number are welfare recipients
under the jurisdiction of the Russian Federation,
accounting for 11.6% of the total amount.
The number of individuals entitled to this
type of social support, increased to 289.7
thousand people, i.e. by 22.9% in 2008, with
83.5% of them falling under the jurisdiction of
RF constituent entities.
Figure 2. The amount of regular monetary payments under the jurisdiction
of the RF entities, 2010, thsd. rub.
112 1 (25) 2013 Economic and social changes: facts, trends, forecast
Methodology and mechanisms of funding the social welfare system in the Northern regions
The number of lump-sum payment
recipients under the jurisdiction of RF
constituent entities, was 80.9 thousand people
in 2009. The total volume of payments in
all Northern regions as a whole reached 490
million rubles. Home front workers received
the main share of payments (92.7%), labour
veterans – 6.6%, and rehabilitees and victims
of political repressions – 0.7%. On average,
home front workers received the highest lump-
sum payments (21753 rubles). They follow
by rehabilitees with 1556 rubles, and labour
veterans with 556 rubles per one recipient.
Though being insignificant, the payment
was received mostly by labour veterans (57.9
thousand people, or 71.6%). In the Murmansk
Oblast labour veterans receive 84.9% of
payment funds. In some regions, such as the
Republic of Sakha (Yakutia), Kamchatka Krai,
Nenets and Khanty-Mansi autonomous okrugs
home front workers are the only ones to receive
lump-sum payment.
The number of lump-sum payment
recipients in the Northern regions increased
by 25.9 thousand people and reached 106.9
thousand people in 2010, due to a significant
increase in the number of home front workers,
that rose by 28 thousand as compared to the
2009 level. In the total volume of spent funds,
however, their share decreased by18.7% as
compared to the last year level and made up
74%.
Average amount of lump-sum payment per
a recipient sharply decreased: from 21753
rubles to 1348 rubles, i.e. 16 times. Lump-sum
payment was made only to home front workers
in practically all Northern regions. The only
exceptions were the Murmansk Oblast, with
86.1% of the funds paid to the labour veterans,
and Yamalo-Nenets Autonomous Okrug, with
4.4% of payments received by rehabilitees.
The above-stated information indicates
that, often, subjects of management do not have
necessary statistical data on the number of
individuals, entitled to social support by
categories that in many cases results in
inefficiency of social policy when making
strategic decisions.
Social monetary compensation is another
type of social support. Compensation [from lat.
“compensation”] is defined in the dictionary
as repayment or remuneration [10]. In Russian
economic literature and in practice the term is
mostly used in the meaning of “compensation”.
The meaning is stipulated in the Labour
Code of the Russian Federation, in which
compensation is defined as monetary payment,
implemented in order to reimburse expenses to
employees, and related to fulfillment of labour
duties or other forms of duties envisaged by the
Federal Law by the Federal law [11].
Rosstat interprets monetary compensation as
a complete or partial targeted reimbursement
of expenses for purchase of goods and services
paid to individuals.
Social compensations are targeted at certain
population groups, including:
– participants of the Great Patriotic War
and home front workers in the Great Patriotic
War given the same status;
– mothers and widows of soldiers, who
died during the Great Patriotic War and in
peacetime;
– former underage prisoners of fascism;
– victims of political repressions;
– victims of radiation accidents;
– other population groups.
Since the budgets of different levels and
funds (mainly the federal and local budgets,
the Pension Fund of the Russian Federation)
are the sources of different types of compensations
and indexations, it is impossible to keep track
of and assess the extent of compensation
payments to the fullest. Remunerations of
financial character, i.e. having monetary value
are used as compensation. The expression “of
financial character” highlights the idea that
the compensation payouts are accompanied by
formation of financial relations. The latter are
associated with the movement of cash flows, use

113Economic and social changes: facts, trends, forecast 1 (25) 2013
SOCIAL DEVELOPMENT V.V. Tikhomirova
of money funds for financing of compensation
payments, regardless of the form (cash, in-kind,
or services) they were made in each specific case.
The compensation payments are as follows:
use of urban, suburban and intercity transport;
purchase of medicines; sanatorium and health
resort treatment; phone subscription fee;
food, purchase of clothes, shoes and articles
of prime necessity; manufacturing and repair
of dentures; installation of house telephone;
other purposes.
According to Rosstat data, the total number
of welfare recipients falling under the jurisdiction
of the Russian Federation in the Northern
regions made up 640 thousand people in 2007,
and rose by 64.4% and reached 993.7 thousand
people in 2010. In the period under review the
given indicator grew by 19.5% from 6.5 million
people to 7.8 million people throughout the
country. Northerners comprised 12% out of the
total number of Russian citizens provided with
financial support in the form of compensation
payments in 2010, illustrating considerable
expenditure commitments of the subjects of
the Northern territories with regard to social
support measures.
The largest number of individuals receiving
compensation payments falls on the Republic
of Sakha (377 thousand people), Kamchatka
Krai (144 thousand), and Khanty-Mansi
Autonomous Okrug (110 thousand).
The largest share of compensation recipi-
ents out of total population was observed in
Kamchatka Krai (44.8%),the Republic of
Sakha (39.3%), and Nenets AO (32.9%),
and the smallest share was registered in the
Magadan and Murmansk oblasts (0.6 – 1.8%).
Compensation payments are not practically
carried out in Chukotka AO (tab. 1).
In 2007 – 2010 period a considerable share
of welfare recipients used the benefit for
travelling by urban and suburban transport,
which makes 40% out of total compensation
payments and remains almost without changes
during the period (fig. 3) with compensation
payments provided to 84.6% of all compensation
recipients in the Murmansk Oblast, 56.4% of
the recipients in Kamchatka Krai, and 54.2%
in the Republic of Sakha. This fact is explained
by very low population density in the named
regions and high demand for transportation
communications.
Table 1. The number of individuals receiving compensation payments out of the total population in 2010
RegionsThe total population,
thousand people
The number of compensation
recipients, thousand people
The number of compensation
recipients out of total population, %
Russia, in total 142938.3 7765 5.4
Northern regions, in total 7617.1 933.7 12.3
Republic of Karelia 646.1 63.9 9.9
Republic of Komi 904.1 40.5 4.5
Arkhangelsk Oblast 1187.9 112.5 9.5
Murmansk Oblast 798.2 14.4 1.8
Nenets AO 42.6 14.0 32.9
Khanty-Mansi AO 1527.3 109.6 7.2
Yamalo-Nenets AO 523.7 18.2 3.5
Republic of Sakha 958.2 377.0 39.3
Kamchatka Krai 321.7 144.0 44.8
Magadan Oblast 157.6 1.0 0.6
Sakhalin Oblast 498.9 38.6 7.7
Chukotka AO 50.8 0.0 -

114 1 (25) 2013 Economic and social changes: facts, trends, forecast
Methodology and mechanisms of funding the social welfare system in the Northern regions
The next most important type of compen-
sation is phone subscription benefit. Its share
remained at the level of 19% throughout the
analyzed period. However, this kind of benefit
is only made in three Northern regions
(Kamchatka Krai, the Republic of Sakha
and Yamalo-Nenets Autonomous Okrug),
whereas in other regions it has been abolished.
Nevertheless, such type of compensation as
the installation of house telephone has been
introduced, with the share of 27.3% out of
total compensation payments throughout
the Northern regions. It is necessary to note,
that this type of compensation was paid by
all Northern regions, without exception. The
largest share of the benefit is in Nenets (94.6%)
and Khanty-Mansi autonomous okrugs
(80.9%), the Arkhangelsk Oblast (66.1%) and
the Republic of Komi (57.7%).
The percentage of medicines benefits has
increased from 3.1% to 5.1%. The highest
number of individuals receiving this kind of
benefit was registered in the Magadan Oblast
(74.6%), the Republic of Karelia (63.5%) and
the Republic of Komi (24.5%).
In the period under review, the share of
individuals receiving sanatorium and health
resort treatment benefit decreased from 0.9 to
0.4%. The benefit is present only in two
Northern regions – the Republic of Komi
(13.3%), and the Murmansk Oblast (4.5%).
Food expenditures increased considerably, with
the Sakhalin Oblast being the leader (98.8% of
the benefit recipients).
Thus, the analysis conducted has shown that
the most financed types of compensation
payments are the following: travelling by urban
and suburban transport, phone subscription
fee and installation of house phone. There are
regions, in which the funds are directed mostly
to one type of payment, i.e. the Sakhalin Oblast
(food – 98.8%), the Murmansk Oblast (use of
urban transport – 84.6%), the Magadan Oblast
(the purchase of medicines – 74.6%). Such cost-
based payments as sanatorium and health resort
treatment, purchase of medicines, clothes, shoes
and articles of prime necessity, manufacturing
and repair of dentures are not carried out in most
Northern regions, which is determined by socio-
economic development level of these regions.
Figure 3. Share of payments by compensation types in 2007, 2010, %
22.1
20.2
21.5
20.2
19.5
19.219.7
11.1
3.1
5.1
4.1
0%
10%
20%
30%
40%
50%
60%
70%
80%
90%
100%
2007 2010
Food
Use of intercity transport
Purchase of medicines
Manufacturing and repair of dentures
Installation of house telephone
Use of suburban transport
Use of urban transport
Other

115Economic and social changes: facts, trends, forecast 1 (25) 2013
SOCIAL DEVELOPMENT V.V. Tikhomirova
Based on the Rosstat population forecast
for the 2012 – 2020 period, the dynamics of
structural changes within the groups of social
support recipients in the Northern regions was
revealed by the author, who adjusted the Rosstat
calculation of expected population size in three
variants (low, medium, high) proceeding from
the size and categories of resident population
as of the beginning of 2009 taking into account
Russia’s 2010 Census data. [12].
The medium forecast scenario is considered
the most likely and is accepted as the base one.
The population forecast by the Northern
regions was made for the 2012 – 2020 period.
According to Rosstat data, average
population size in the Northern regions will be
steadily declining up to the year 2020. The only
exception is four Northern regions, where
sustained population growth is expected:
Khanty-Mansi AO (11.2%), Yamalo-Nenets
AO (10.9%) and Nenets AO (2.8%), and the
Republic of Sakha (1.5%) (tab. 2).
Population has been growing in these
regions due to migration and natural increase
processes over the years. Population growth
throughout Russia’s northern regions will make
up 0.3% (7631.8 thousand people).
Population growth forecast by groups. The
important characteristic of socio-demographic
processes is the age structure of population that
will undergo serious changes. According to the
medium forecast scenario, in the Northern
regions average size of population under working
age will increase by 1556.7 persons (9.4%) by
the year 2020. In Russia growth rate will
amount to 11.8% (tab. 3).
According to the table, five top regions are:
Khanti-Mansi AO (20.5%), Yamalo-Nenets
AO (16.8%) and Nenets AO (15.5%), the
Republic of Sakha (9.6%).
Growth rates in other Northern regions will
be fluctuating from 2% (the Sakhalin Oblast)
to 5.9% (the Murmansk Oblast). The exception
is Chukotka AO, with the size of population
under working age declining by 2.8%.
Population aging generally typical for the
country becomes a serious issue for the
Northern territories, as well. Considering
growth of population under working-age,
and significant increase of retirement-age
individuals in almost every region, working age
population will decrease considerably.
Maximum reduction in the number of
working-age population will be observed in
Table 2. Population growth rates in Russia’s Northern regions by 2020, %
Regions 2012 2013 2014 2015 2016 2017 2018 2019 2020
Russia 0.0 0.1 0.1 0.1 0.1 0.0 0.0 -0.1 -0.1
Northern regions 0.1 0.1 0.2 0.3 0.3 0.3 0.3 0.3 0.3
Republic of Karelia -0.4 -0.9 -1.3 -1.7 -2.2 -2.7 -3.2 -3.8 -4.3
Republic of Komi -0.6 -1.1 -1.6 -2.2 -2.7 -3.3 -3.9 -4.4 -5.0
Arkhangelsk Oblast -0.5 -1.0 -1.5 -2.0 -2.6 -3.2 -3.7 -4.3 -4.9
Nenets AO 0.5 0.9 1.2 1.7 1.9 2.1 2.4 2.6 2.8
Murmansk Oblast -0.4 -0.8 -1.2 -1.6 -2.0 -2.4 -2.9 -3.3 -3.7
Khanty-Mansi AO 1.3 2.6 3.9 5.2 6.5 7.6 8.8 10.0 11.2
Yamalo-Nenets AO 1.1 2.3 3.6 4.8 6.1 7.3 8.5 9.7 10.9
Republic of Sakha 0.2 0.4 0.6 0.8 0.9 1.1 1.2 1.4 1.5
Kamchatka Krai -0.3 -0.6 -1.0 -1.3 -1.7 -2.1 -2.5 -2.9 -3.3
Magadan Oblast -0.5 -1.1 -1.6 -2.1 -2.6 -3.1 -3.6 -4.1 -4.6
Sakhalin Oblast -0.7 -1.4 -2.1 -2.8 -3.5 -4.3 -5.1 -5.8 -6.6
Chukotka AO -1.7 -3.4 -4.9 -6.6 -8.0 -9.5 -11.0 -12.5 -14.0

116 1 (25) 2013 Economic and social changes: facts, trends, forecast
Methodology and mechanisms of funding the social welfare system in the Northern regions
Chukotka AO (by 21.8%), the Arkhangelsk (by
15.8%) and Sakhalin (by 15.6%) oblasts,
the Republic of Karelia (by 14.5%) and the
Republic of Komi (by 14.1%), Yamalo-Nenets
AO being the only one with the indicator
increasing by 2.2% up to 374.8 thousand people
(tab. 4).
In general, this population group will reduce
by 9.3% and will amount to 4.5 million people
throughout the Northern regions by 2020.
Hence, high growth rate of retirement-age
population throughout Northern regions is
forecast by 2020. Specifically significant
increase of retirement-age population will
be observed in Yamalo-Nenets AO (75.9%),
Khanty-Mansi (74.2%) and Nenets autono-
mous okrugs (47.5%), the Republic of Sakha
(37%). In other Northern regions this indicator
will be fluctuating from 2% (the Sakhalin
Oblast) to 5.9% (Kamchatka Krai). The
exception is Chukotka AO, where retirement-
age population will reduce by 1.9%. (tab. 5)
This will result in a considerable increase in
financial expenses of local budgets for social
support of the elderly: bringing income level
of non-working pensioners to subsistence
minimum, benefits and compensation
payments, social service provided to the elderly.
Table 3. Growth rate of population under working age by 2020, %
Regions 2012 2013 2014 2015 2016 2017 2018 2019 2020
Russia 3.2 5.0 6.5 8.2 9.7 10.2 10.7 11.2 11.8
Northern regions 2.7 4.1 5.4 6.9 8.1 8.4 8.8 9.1 9.4
Republic of Karelia 2.3 3.5 4.5 5.6 6.2 5.6 5.1 4.5 4.0
Republic of Komi 1.6 2.5 3.1 4.0 4.6 4.3 3.9 3.6 3.2
Arkhangelsk Oblast 2.3 3.4 4.2 5.2 5.8 5.3 4.8 4.2 3.7
Nenets AO 3.1 5.2 7.2 9.3 11.3 12.4 13.4 14.4 15.5
Murmansk Oblast 1.9 3.0 4.0 5.2 6.0 6.0 5.9 5.9 5.9
Khanty-Mansi AO 5.0 7.6 9.9 12.5 14.9 16.3 17.7 19.1 20.5
Yamalo-Nenets AO 3.0 4.9 6.7 8.7 10.9 12.4 13.8 15.3 16.8
Republic of Sakha 1.8 2.9 4.1 5.6 6.8 7.5 8.2 8.9 9.6
Kamchatka Krai 1.9 2.9 3.4 4.3 5.2 5.2 5.2 5.2 5.2
Magadan Oblast 1.8 2.9 3.2 4.3 4.7 4.6 4.5 4.4 4.3
Sakhalin Oblast 1.5 2.5 3.0 3.8 4.0 3.5 3.0 2.5 2.0
Chukotka AO 0.9 0.9 0.9 0.9 0.9 0.0 -0.9 -1.9 -2.8
Тable 4. Growth rate of working age population by 2020, %
Regions 2012 2013 2014 2015 2016 2017 2018 2019 2020
Russia -2.1 -3.3 -4.5 -5.7 -6.9 -7.8 -8.6 -9.5 -10.4
Northern regions -2.3 -3.4 -4.6 -5.8 -6.8 -7.4 -8.0 -8.7 -9.3
Republic of Karelia -3.2 -4.9 -6.6 -8.4 -9.9 -11.1 -12.2 -13.3 -14.5
Republic of Komi -3.4 -5.1 -6.7 -8.4 -9.9 -10.9 -12.0 -13.1 -14.1
Arkhangelsk Oblast -3.7 -5.5 -7.3 -9.2 -10.9 -12.1 -13.3 -14.5 -15.8
Nenets AO -2.6 -4.1 -5.3 -6.8 -7.9 -8.8 -9.8 -10.7 -11.7
Murmansk Oblast -3.0 -4.4 -5.9 -7.3 -8.5 -9.3 -10.1 -10.9 -11.7
Khanty-Mansi AO -0.2 -0.3 -0.5 -0.8 -0.9 -0.7 -0.4 -0.1 0.1
Yamalo-Nenets AO 0.1 0.1 0.2 0.2 0.2 0.7 1.2 1.7 2.2
Republic of Sakha -1.8 -2.7 -3.7 -4.9 -5.9 -6.6 -7.2 -7.9 -8.5
Kamchatka Krai -2.8 -4.2 -5.4 -6.7 -8.0 -8.9 -9.9 -10.8 -11.7
Magadan Oblast -3.8 -5.6 -7.1 -8.7 -9.9 -10.8 -11.7 -12.5 -13.4
Sakhalin Oblast -4.0 -6.0 -7.8 -9.6 -11.2 -12.3 -13.4 -14.5 -15.6
Chukotka AO -6.0 -8.5 -11.4 -13.6 -15.5 -17.1 -18.7 -20.3 -21.8

117Economic and social changes: facts, trends, forecast 1 (25) 2013
SOCIAL DEVELOPMENT V.V. Tikhomirova
As a result, due to demographic processes,
average annual size of population in the
Northern regions, which is subject to the system
of social guarantees, will be objectively
increasing in the 2012 – 2020 period. It is
related both to growing rate of population
under working-age (by 1% on average), and
overall population ageing (the number of the
elderly increase by 2.9%).
The analysis of the dynamics of structural
changes within the groups of social support
recipients has shown that many individuals,
entitled to social benefits will be moving from
one group to another. Due to demographic
reasons (natural loss), the Russian Federation
expenditure commitments will be steadily
decreasing, whereas the commitments of the
RF constituent entities will be considerably
increasing.
Hence, in the course of implementation of
the Federal Law No. 122-FL of August 22, 2004
concerning measures of social support provided
to regional welfare recipients, the growing
tendency of all welfare recipients groups is
observed, mostly due to natural increase in the
number of the elderly, entitled with “Labour
Veteran”. This group of welfare recipients
accounts for the largest expense volume from
regional budgets. Therefore, the main burden of
providing population with social support weighs
heavily on the local authorities.
Thus, the imbalance of resources and
commitments at all levels of the RF budget
system is the most acute problem, determining
socio-economic relations between the state and
the society. The federal government faces the
task of promoting efficiency of social security
system and decreasing social differentiation
in order to reduce poverty by means of
interbudgetary level equalization.
In this connection, the main method of
social security in general and of social support,
in particular is the provision of targeted social
assistance only to the households with the
actual consumption below the subsistence
minimum.
In practice, system functioning of social
payments in the regions shows that the only
possible way to improve its effectiveness is to
introduce immediately the targeting principle.
The concept of “targeting” in this context is
defined as limitation of social support recipients
to specific target groups depending on the state
priorities concerning social policy at a given
stage.
In this case, the targeting principle is
opposed to “category approach” with social
assistance provided to individuals depending
Table 5. Growth rate of retirement-age population by 2020, %
Regions 2012 2013 2014 2015 2016 2017 2018 2019 2020
Russia 4.0 6.0 8.2 10.5 12.6 14.4 16.1 17.9 19.6
Northern regions 7.0 10.5 14.1 17.6 20.7 22.8 25.0 27.1 29.2
Republic of Karelia 3.7 5.7 7.8 10.0 11.9 13.2 14.5 15.8 17.1
Republic of Komi 4.9 7.2 9.6 12.0 13.9 15.1 16.2 17.4 18.5
Arkhangelsk Oblast 4.3 6.3 8.6 10.8 12.6 13.7 14.9 16.1 17.3
Nenets AO 11.9 16.9 22.0 27.1 32.2 36.0 39.8 43.6 47.5
Murmansk Oblast 4.7 7.0 9.4 11.5 13.2 13.9 14.6 15.3 16.0
Khanty-Mansi AO 15.9 23.8 32.4 41.0 48.9 55.2 61.6 67.9 74.2
Yamalo-Nenets AO 16.6 25.2 34.2 43.4 51.9 57.9 63.9 69.9 75.9
Republic of Sakha 8.3 12.5 16.7 21.0 25.2 28.2 31.1 34.1 37.0
Kamchatka Krai 5.2 7.7 9.9 12.0 13.9 15.1 16.3 17.4 18.6
Magadan Oblast 6.2 9.2 11.7 13.6 15.0 15.6 16.1 16.7 17.2
Sakhalin Oblast 4.9 6.7 8.8 10.2 11.2 11.4 11.6 11.8 12.0
Chukotka AO 3.8 5.7 7.5 7.5 5.7 3.8 1.9 0.0 -1.9

118 1 (25) 2013 Economic and social changes: facts, trends, forecast
Methodology and mechanisms of funding the social welfare system in the Northern regions
References1. Buyanova М.О. The right to social security: a training manual. Мoscow, 2006.
2. Shedenkov S.A. Social protection and conditions of local self-government: Ph.D. in Social Sciences thesis.
Belgorod, 1995.
3. Social security in the region. Ed. by Ph.D. in Social Sciences Popov V.G. Editorial Board: D. Sc. in Law, Prof.
V.S. Shayhatdinov; D.Sc. in philosophy, Prof. Y.U. Ermakov; D. Sc. in philosophy, Prof. N.V. Ivanchuk; Ph.D.
in Sciences, Assoc. Prof. A.G. Grichuk. Yekaterinburg: UrAGS, 1999.
4. Liborakina M.I. Targeted social support assistance. Local self-government level. Ed. by A.S. Puzanov. Moscow:
Fund “Urban institute of Economics”, 1998.
5. Goncharov A.I. The concept of financial ensuring of the system of social support in Russia. Accounting for
budgetary and non-commercial organizations. 2007. No. 4.
6. Monetization of social benefits in the light of the reform on distribution of budgetaryresponsibilities. Presentation
by G.V. Kurlyandskaya at the scientific conference “Social policy: challenges of the 21st century”. Independent
Institute for social policy. Moscow, 2005. Electronic resource.
7. Log library “Social protection”. The Law on veterans (redrafted). Moscow: Socionomia, 2005.
8. On approval of statistical tools for the organization of statistical observation for 2009: Order No. 270 dated
October 27, 2008.
9. Central base of statistical data. Available at: http://www.gks.ru/dbscripts/Cbsd/DBInet.cgi.
10. Raysberg B.A., Lozovskiy L.Sh., Starodubtseva E.B. Modern economic dictionary. 5th ed., revised. Moscow:
INFRA-M, 2007.
11. Pilyaeva V.V. The Labour Code of the Russian Federation: Handbook dictionary. Moscow: Astrel: Khranitel,
2006.
12. The population of the Russian Federation up to 2030: a statistical bulletin. Available at: http://www.gks.ru/
doc_2010/bul_dr/progn_09.zip; The results of the all-Russia population census of 2010. Available at: http://
www.gks.ru/free_doc/new_site/perepis2010/croc/Documents/Vol2/pub-02-03.xlsx
13. Baygreyev M. Poverty and policy of social assistance targeting low-income families, Man and Labour. 2001. No. 1.
on the formal type of the group (professional or
social-demographic) they belong to, not taking
into account the neediness factor.
Boosting social assistance targeting requires
the adoption of legislative and organizational
measures to limit social support recipients to
poor families and poor individuals without
families. Corresponding budgetary resources
will be formed by means of reduction in non-
targeted forms of assistance, as well as socially
unjustified benefits and payments.
It should be noted, that the benefits
provided for outstanding contributions to the
state, such as Heroes of Russia and the Soviet
Union, Full Cavaliers of the Orders of Glory,
the disabled and participants of the Great
Patriotic War are to be preserved [13]. Provision
of other benefits should be dependent on the
income of the recipients.
In this connection, the amount of social
payments should correspond with regional
financial possibilities. The criterion of social
advisability providing social security becomes a
serious issue, requiring exact definition of those
who, due to objective reasons, completely or
partially, are not able to take care of themselves
and have incomes below the subsistence
minimum. Absence of due consideration to the
real needs, and maintenance of equalization
results in low efficiency of social support, as it is
unreasonably distributed among large number
of its consumers.
Against the background of the current crisis
and in conditions of limited financial resources,
conceptual approaches for establishing the
social security system (field of activity, a set
of indicators, categories of recipients, funding
sources and levels of responsibility), as well
as quantitative characteristics (the number of
recipients, the amount of support) and forms of
direct entitlement (cash, in-kind and services)
become crucial.

119Economic and social changes: facts, trends, forecast 1 (25) 2013
SOCIAL DEVELOPMENT
UDC 316.658
LBC 60.5 (2Rus-4Vol)
© Shabunova A.A., Morev M.V.
Vologda residents’ notions of happinessThe article evaluates the level of happiness in the Vologda Oblast in comparison with the Russian
Federation and the countries of the world. It studies the influence of internal sensation of happiness
on the perception of socio-political processes and demographic situation. Furthermore, the article
analyzes some of the factors affecting the level of happiness (financial situation, professional activities,
interpersonal relations, socio-demographic characteristics).
Happiness index, social characteristics of population, quality of life.
Aleksandra A.SHABUNOVADoctor of Economics, Head of ISEDT RAS Department
For a long time scientists are trying to
explain what happiness is and how happy
people feel. Pitirim Sorokin marked that
progress achievements are valuable only when
they increase the feeling of happiness among
popular majority. The weight of any terminal
values (love for one’s neighbors, solidarity,
knowledge, etc.) is decreasing if they are not
accompanied by parallel development of
happiness [1, p. 15].
From the history of happiness phenomenon
studies
The first attempts to measure that pheno-
menon were offered by Emile Durkheim. He
supposed that the number of suicides per capita
could be used as the level of society’s unhap-
piness. Durkheim’s idea was simple: if a person
decided to commit a suicide, so he was deeply
unhappy. However, further investigations of
psychologists and sociologists proved that not
all people are predisposed to suicides, therefore
using that figure for evaluation of happiness
level in society was not quite correct. Although,
certain dependence between the suicide level
and happiness level of course exists.
Macroeconomic indicators (such as GDP)
do not always reveal the country’s real state of
development. In particular, high income level
Mikhail V.MOREVPh.D. in Economics, ISEDT RAS Scientific Associate
120 1 (25) 2013 Economic and social changes: facts, trends, forecast
Vologda residents’ notions of happiness
Puerto Rico, and Columbia. Russia moved to
88th place in the list. Zimbabwe took the last one.
In 2006 another international fund – New
Economist Foundation (NEF) – introduced
metrics “Happy Planet Index” that revealed
people’s welfare and environmental condition in
different countries. The index shows efficiency
with which the countries worldwide “convert”
natural resources into the lasting and happy life
of their citizens. While estimating the happi-
ness index, three figures are taken into account:
human impact on nature (ecological footprint),
life expectancy and life satisfaction. The more
is the index, the less is the amount of resources
spent by the country on the provision of happy
life of their citizens (life expectancy + life sat-
isfaction). The index calculated this way does
not show “happiness” of citizens of a certain
country, but natural resources efficiency for a
person to feel happy. For instance, a huge amount
of resources is necessary for American citizens
to be satisfied with their lives; consequently, this
developed country has a low Happy Planet Index.
The highest Happy Planet Index has Costa Rica
(76.12), the lowest – Zimbabwe (16.59), Russia
with its index 34.47 takes 108th place1.
Mass public surveys became the simplest
and most efficient way to investigate happiness.
Most of the data is gathered in different coun-
tries worldwide on the most typical classical
question: “How happy are you?” – with four
variants of responses: “very happy”, “happy
rather than unhappy”, “unhappy rather than
happy”, “very unhappy”.
According to happiness index estimated in
58 countries worldwide, the Russian Federation
takes 40th place2.
1 Happy planet index. – Available at: www.priroda.su2 The survey was conducted in October – December 2011
in the framework of the global research “Global Barometer on
Hope and Despair” covering the population majority of the
world. All in all 45 thousand people from 58 countries were
questioned. In every country the respondents were questioned
according to the national probability sampling with the help of
personal interviews, phone interviews or online questionnaire.
Questionnaires in Russia were conducted by research company
“Romir” – the representative of Gallup International in Russia.
does not always guarantees life satisfaction.
Growth of wealth during decades is not
accompanied by features of the increasing
happiness [2]. This problem is a matter of
fierce debates in the UK, France, Canada,
Northern Ireland and many other developed
nations. Methods of measuring happiness and
its factors, opportunities of monitoring on
the international level are being discussed by
specialists [2].
Investigations of relationship between the
economic growth, measured by GDP, and the
personal happiness level show that happiness is
increasing with GDP, while GDP is growing
till certain level. Beyond that level, GDP
growth does not lead to human happiness rise
any more. For instance, Japan, where fivefold
increase of GDP during the 20th century did not
lead to human happiness rise [3]. The similar
situation is observed in the U.S.: during last
30 years income per capita including inflation
increased twofold, however, the share of those
who consider themselves happy reduced by 14
million people, divorce rate increased twofold,
the number of suicides among adolescents –
threefold, grave offense level – fourfold, prison
population – fivefold. The same situation takes
place in other countries, which can be named
as carriers of European civilization (France,
Norway, Australia, the UK, and Canada) [4].
In 1972 the king of Bhutan Jigme Singye
Wangchuck offered the notion of gross national
happiness (GNH) as the official state
philosophy.
In 2003 the International Fund World
Values Survey conducted the first global
research in 65 countries. The result was
extremely unexpected. The happiest countries
were Nigeria, Mexico, Venezuela, the Republic
of El Salvador, Puerto Rico, then Western
Europe, the USA and Canada. Russia turned
out to be among the unhappiest.
In 2008 the same organization conducted a
research already in 97 countries. The highest
figures of happiness were stated in Denmark,
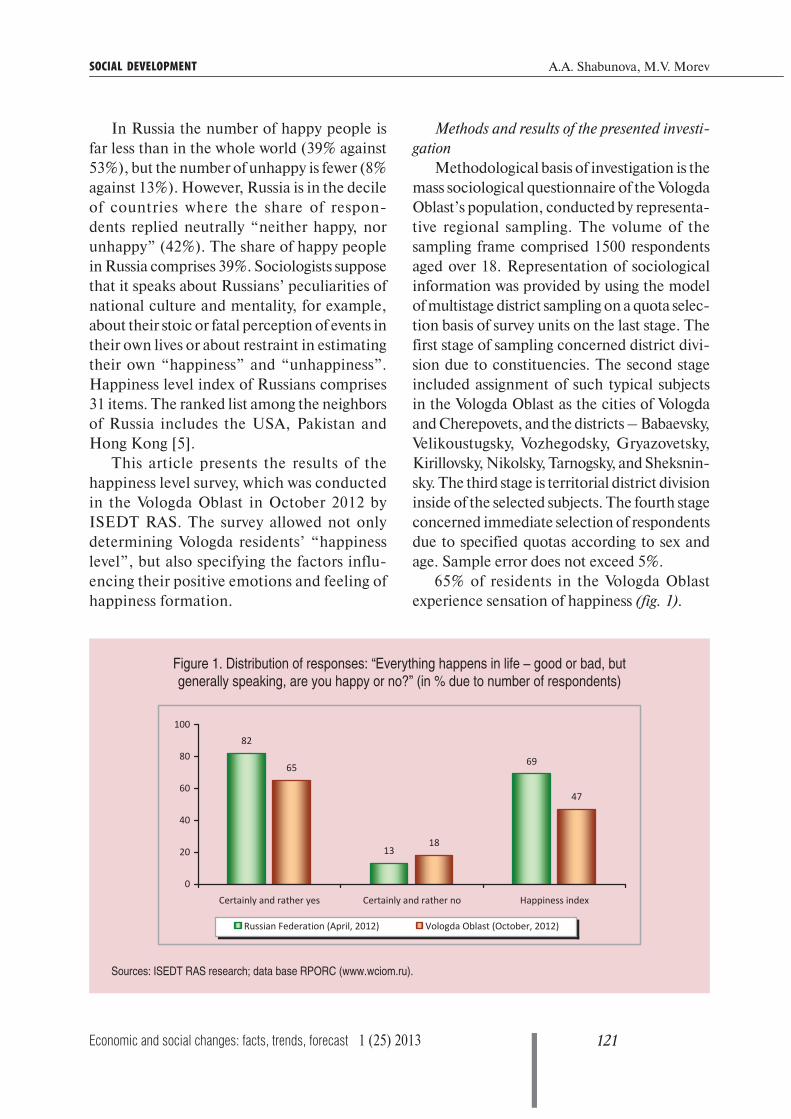
121Economic and social changes: facts, trends, forecast 1 (25) 2013
A.A. Shabunova, M.V. MorevSOCIAL DEVELOPMENT
In Russia the number of happy people is
far less than in the whole world (39% against
53%), but the number of unhappy is fewer (8%
against 13%). However, Russia is in the decile
of countries where the share of respon-
dents replied neutrally “neither happy, nor
unhappy” (42%). The share of happy people
in Russia comprises 39%. Sociologists suppose
that it speaks about Russians’ peculiarities of
national culture and mentality, for example,
about their stoic or fatal perception of events in
their own lives or about restraint in estimating
their own “happiness” and “unhappiness”.
Happiness level index of Russians comprises
31 items. The ranked list among the neighbors
of Russia includes the USA, Pakistan and
Hong Kong [5].
This article presents the results of the
happiness level survey, which was conducted
in the Vologda Oblast in October 2012 by
ISEDT RAS. The survey allowed not only
determining Vologda residents’ “happiness
level”, but also specifying the factors influ-
encing their positive emotions and feeling of
happiness formation.
Methods and results of the presented investi-
gation
Methodological basis of investigation is the
mass sociological questionnaire of the Vologda
Oblast’s population, conducted by representa-
tive regional sampling. The volume of the
sampling frame comprised 1500 respondents
aged over 18. Representation of sociological
information was provided by using the model
of multistage district sampling on a quota selec-
tion basis of survey units on the last stage. The
first stage of sampling concerned district divi-
sion due to constituencies. The second stage
included assignment of such typical subjects
in the Vologda Oblast as the cities of Vologda
and Cherepovets, and the districts – Babaevsky,
Velikoustugsky, Vozhegodsky, Gryazovetsky,
Kirillovsky, Nikolsky, Tarnogsky, and Sheksnin-
sky. The third stage is territorial district division
inside of the selected subjects. The fourth stage
concerned immediate selection of respondents
due to specified quotas according to sex and
age. Sample error does not exceed 5%.
65% of residents in the Vologda Oblast
experience sensation of happiness (fig. 1).
Figure 1. Distribution of responses: “Everything happens in life – good or bad, but
generally speaking, are you happy or no?” (in % due to number of respondents)
Sources: ISEDT RAS research; data base RPORC (www.wciom.ru).
82
13
6965
18
47
0
20
40
60
80
100
Certainly and rather yes Certainly and rather no Happiness index
Russian Federation (April, 2012) Vologda Oblast (October, 2012)
122 1 (25) 2013 Economic and social changes: facts, trends, forecast
Vologda residents’ notions of happiness
Table 1. What is “happiness” for you? (in % due to the number of respondents,
who answered the question: “Are you happy or not?”
Variants of responses Vologda Cherepovets Districts Oblast
Family, well-being 29.9 20.8 31.1 27.2
Own health and health of relatives 24.4 21.6 24.0 23.2
Children, grandchildren 9.8 10.0 13.9 11.7
Material wealth, money 4.9 3.3 11.5 7.3
Love, beloved 6.1 8.2 4.1 6.0
...
Stable situation in the country and world 2.4 0.0 0.0 0.5
Freedom 0.0 1.1 0.0 0.4
Work, labor of love 0.6 0.4 0.3 0.4
Youth 0.6 0.0 0.0 0.1
Belief in God 0.0 0.0 0.3 0.1
Can not answer 55.3 28.1 55.5 48.6
Source: investigation of ISEDT RAS.
According to Russian Public Opinion
Research Center’s (RPORC) data, the ratio of
“happy” Russians is more than 82% [4], while
interpreting the results temporal characteris-
tics of public opinion, such as seasonal factor
impact (spring – autumn) on subjective self-
concept should be taken into account. All in
all, it can be noted that the vast population
majority in the Vologda Oblast and on average
in the whole country experiences sensation of
happiness.
However, 30% of region’s residents consider
that there are more happy people among their
acquaintances and relatives (in Russia – 33%),
and 13% (24) of residents have the opposite
opinion; at the same time 33% (36) of respon-
dents are equally surrounded by happy and
unhappy people. Though, a quarter of respon-
dents are undecided, in the whole country the
number of those people is considerably less.
Residents of large cities aged 18 – 24 (40%),
highly educated people (45%) and representa-
tives of 20% well-off people (30%) state that in
their surrounding the number of happy people
is prevailing. Country people (20%), people
over 45 (16%), low-income residents of the
region (24%) are inclined to consider their
acquaintances as unhappy.
Defining the notion happiness for them-
selves, 27% of Vologda residents (in Russia
– 28%) marked that it is “family and well-
being”; 23% (in Russia – 17%) – “own health
and health of relatives”; 12% - “children and
grandchildren” (tab. 1). In Russia the third
position is taken by “material welfare” – 17%.
Region’s residents make fewer associations
with happiness regarding stable situation in
the country, work, youth, and faith in God. It
is noteworthy that almost half of respondents
(49%) could not give an answer to that question.
The greater number of respondents (67%)
could not answer, where the majority of happy
people live. Pondering that question, most
Vologda residents mentioned Russia (18%),
the USA (12%) and European countries:
Germany (7%), Switzerland (5%), France
(5%), etc. Among Russian cities, Moscow
(8%), St. Petersburg (5%) and Vologda (5%)
are mainly named. Other respondents mention
Paris (4%), New York (2%), Sochi, Los
Angeles, and Venice (1%). Opinions of region’s
residents considerably coincide with the data
countrywide.
Among the reasons of “happiness” well-
being in family (41%), communication plea-
sure with children and grandchildren (25%),
123Economic and social changes: facts, trends, forecast 1 (25) 2013
A.A. Shabunova, M.V. MorevSOCIAL DEVELOPMENT
joy of living in this world (23%) were named
more frequently; regular material wealth was
mentioned by 13% of respondents. Amidst
the circumstances determining the feeling of
“unhappiness” price growth (22%), poverty
(18%), economic insecurity (9%), sickness and
senility (8%) were noted.
In-depth analysis allowed presenting socio-
demographic characteristics of “happy” and
“feeling less happy” residents of the region.
Four blocks of figures were investigated:
financial situation; labor activity; interpersonal
relations; socio-demographic characteristics
(sex, age, education level, place of residence,
marital status).
Socio-economic situation
Last investigations in the sphere of income
and emotional condition of population proved
two regularities [3]:
1. Beyond the threshold in annual income
equal to 10 000 U.S. dollars at parity of
purchasing capacity, happiness is the function
of non-material factors.
2. Beyond the threshold in income equal
to 75 000 U.S. dollars per year full saturation
with happiness and reverse process take place:
growth in prosperity contributes to growth of
unhappiness, stresses, sadness, and suicides.
On this basis, material welfare factor loses
its significance due to average monthly income
level over 28 thousand rubles. Taking into
consideration that according to the data of
2011, average income level in the Vologda
Oblast comprises 15 467 rubles [6, p. 85], it is
worth speaking about the influence of material
wealth on the happiness level of its residents.
The data of our investigation confirms these
facts. Among happy people the share of those
who refer to 20% of least well-off social groups
is two times smaller than among those who
consider themselves less happy (15 and 36%
respectively; tab. 2). Moreover, identical feature
is observed in all income groups: happy people
have the level of actual income higher than
those, who feel less positive.
It is noteworthy that in none of the groups
the income level reaches that critical point,
when the role of material factor in forming
the feeling of happiness loses its importance
(28 thousand rubles per month).
So, “happy” people identify themselves
with “poor” and “beggar” groups more rarely
in comparison with the rest population (33%
against 76% respectively); more positively
characterize their financial situation (10%
against 5% respectively); less alarmed by
economic problems; possess higher purchasing
capacity of incomes (tab. 3).
Labor activities
Among people feeling happy in comparison
with the other part of population two categories
of people are predominant: working-age
employed (70% against 58%) and students/
pupils (7% against 3%; fig. 2). All the rest
categories concerning the character of em-
ployment (excepting military men) are mostly
represented among of those who do not feel
themselves happy.
The reasons of such distribution of em-
ployment in groups of “happy” and “unhappy”
are explained by their special characteristics.
For instance, prevalence of “happy” among
students and pupils can be explained by age
Table 2. Distribution regarding subjective feeling of happiness and income level in income groups
Decile groups
Representation among population
(in % due to number of responses
to the question “Are you happy or not?”)
Income level, rub.
Happy Feeling less happy Happy Feeling less happy
20% least well-off 15.3 36.0 5042 3031
60% of middle class 60.5 56.2 10 306 7211
20% most well-off 24.2 7.9 22 596 14 510
Source: public opinion monitoring of ISEDT RAS.
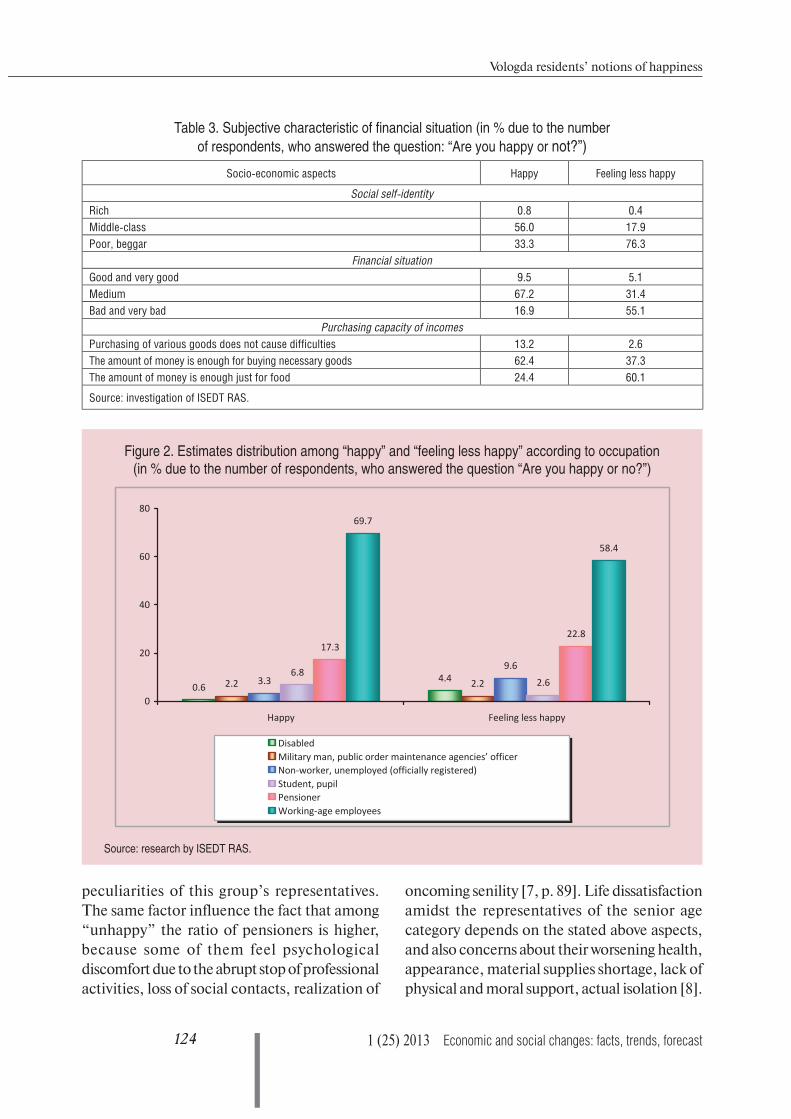
124 1 (25) 2013 Economic and social changes: facts, trends, forecast
Vologda residents’ notions of happiness
Figure 2. Estimates distribution among “happy” and “feeling less happy” according to occupation
(in % due to the number of respondents, who answered the question “Are you happy or no?”)
Source: research by ISEDT RAS.
peculiarities of this group’s representatives.
The same factor influence the fact that among
“unhappy” the ratio of pensioners is higher,
because some of them feel psychological
discomfort due to the abrupt stop of professional
activities, loss of social contacts, realization of
oncoming senility [7, p. 89]. Life dissatisfaction
amidst the representatives of the senior age
category depends on the stated above aspects,
and also concerns about their worsening health,
appearance, material supplies shortage, lack of
physical and moral support, actual isolation [8].
Table 3. Subjective characteristic of financial situation (in % due to the number
of respondents, who answered the question: “Are you happy or not?”)
Socio-economic aspects Happy Feeling less happy
Social self-identity
Rich 0.8 0.4
Middle-class 56.0 17.9
Poor, beggar 33.3 76.3
Financial situation
Good and very good 9.5 5.1
Medium 67.2 31.4
Bad and very bad 16.9 55.1
Purchasing capacity of incomes
Purchasing of various goods does not cause difficulties 13.2 2.6
The amount of money is enough for buying necessary goods 62.4 37.3
The amount of money is enough just for food 24.4 60.1
Source: investigation of ISEDT RAS.
4.40.6 2.22.2
9.63.3 2.6
6.8
22.817.3
58.4
69.7
0
20
40
60
80
yppah ssel gnileeFyppaH
DisabledMilitary man, public order maintenance agencies’ officerNon-worker, unemployed (officially registered)Student, pupilPensionerWorking-age employees
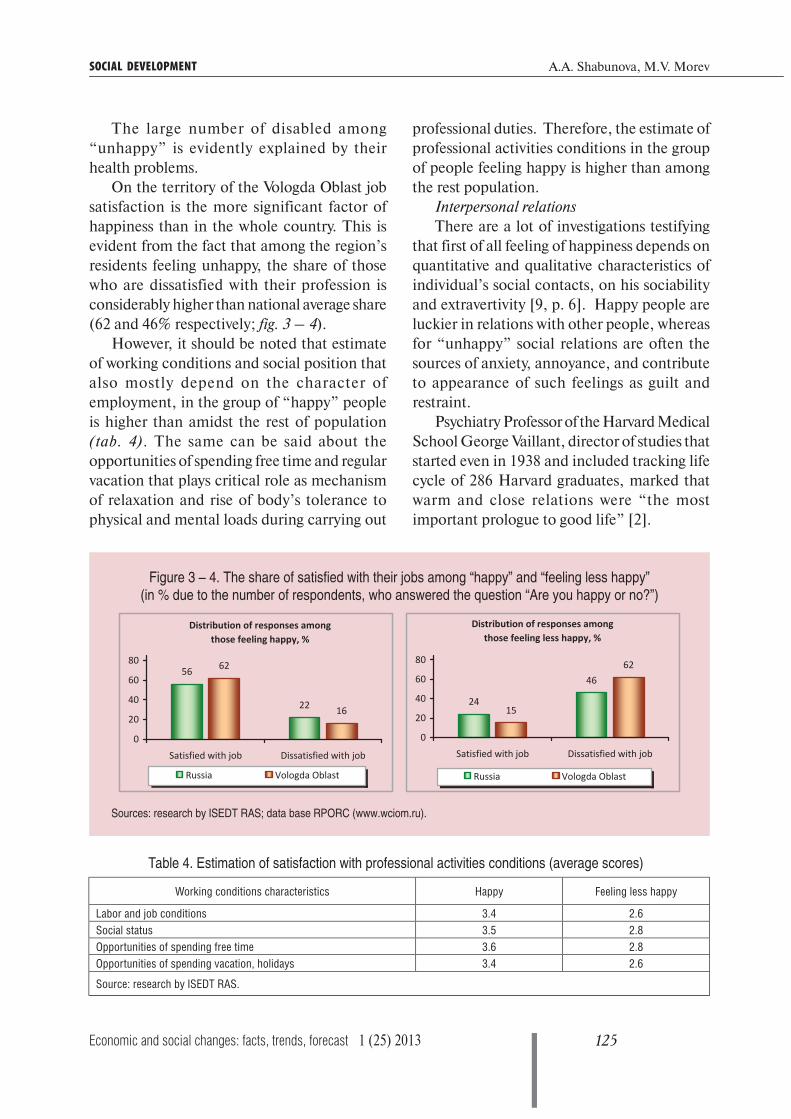
125Economic and social changes: facts, trends, forecast 1 (25) 2013
A.A. Shabunova, M.V. MorevSOCIAL DEVELOPMENT
The large number of disabled among
“unhappy” is evidently explained by their
health problems.
On the territory of the Vologda Oblast job
satisfaction is the more significant factor of
happiness than in the whole country. This is
evident from the fact that among the region’s
residents feeling unhappy, the share of those
who are dissatisfied with their profession is
considerably higher than national average share
(62 and 46% respectively; fig. 3 – 4).
However, it should be noted that estimate
of working conditions and social position that
also mostly depend on the character of
employment, in the group of “happy” people
is higher than amidst the rest of population
(tab. 4). The same can be said about the
opportunities of spending free time and regular
vacation that plays critical role as mechanism
of relaxation and rise of body’s tolerance to
physical and mental loads during carrying out
professional duties. Therefore, the estimate of
professional activities conditions in the group
of people feeling happy is higher than among
the rest population.
Interpersonal relations
There are a lot of investigations testifying
that first of all feeling of happiness depends on
quantitative and qualitative characteristics of
individual’s social contacts, on his sociability
and extravertivity [9, p. 6]. Happy people are
luckier in relations with other people, whereas
for “unhappy” social relations are often the
sources of anxiety, annoyance, and contribute
to appearance of such feelings as guilt and
restraint.
Psychiatry Professor of the Harvard Medical
School George Vaillant, director of studies that
started even in 1938 and included tracking life
cycle of 286 Harvard graduates, marked that
warm and close relations were “the most
important prologue to good life” [2].
Figure 3 – 4. The share of satisfied with their jobs among “happy” and “feeling less happy”
(in % due to the number of respondents, who answered the question “Are you happy or no?”)
Sources: research by ISEDT RAS; data base RPORC (www.wciom.ru).
Table 4. Estimation of satisfaction with professional activities conditions (average scores)
Working conditions characteristics Happy Feeling less happy
Labor and job conditions 3.4 2.6
Social status 3.5 2.8
Opportunities of spending free time 3.6 2.8
Opportunities of spending vacation, holidays 3.4 2.6
Source: research by ISEDT RAS.
Distribution of responses among those feeling happy, %
56
22
62
16
0
20
40
60
80
Satisfied with job Dissatisfied with job
Russia Vologda Oblast
Distribution of responses among those feeling less happy, %
24
46
15
62
0
20
40
60
80
Satisfied with job Dissatisfied with job
Russia Vologda Oblast

126 1 (25) 2013 Economic and social changes: facts, trends, forecast
Vologda residents’ notions of happiness
Table 5. Distribution of emotional states, caused by relations with relatives and close friends (in
% due to the number of respondents, who answered the question “Are you happy or not?”)
Emotions caused by communicating with friends
and relatives
Happy Feeling less happy
Russia Vologda Oblast Russia Vologda Oblast
Happiness, satisfaction 92 85 71 41
Unhappiness, dissatisfaction, disappointment 1 6 15 28
Source: research by ISEDT RAS; data base RPORC (www.wciom.ru).
Judging by the results of our investigation,
among “happy” residents of the Vologda Oblast
the share of those, who have positive emotions
communicating with friends and family
members, is two times more than among people
feeling less happy (85 and 41% respectively;
tab. 5). Moreover, such data correlates with the
estimates of population countrywide (92 and
71% respectively) [10].
The average value of satisfaction commu-
nicating with relatives and close friends among
“happy” and “unhappy” residents of the region
comprised 4.1 and 3.4 points respectively,
satisfaction communicating with surrounding
people all in all – 4 and 3.4 points. In addi-
tion, “happy” people – every second in the
Vologda Oblast (53%) and the Russian Fed-
eration (47%) see the reason of their higher
emotional state in relations with relatives and
close friends3.
Socio-demographic characteristics
Analysis of socio-demographic character-
istics showed that most of all the representatives
of the following social groups consider them-
selves happy (tab. 6):
1. People aged 30 – 55 years (44%). How-
ever, it is noteworthy that among the residents
under 30 the share of those, who feel unhappy,
is the lowest (19%) in comparison with the rest
age categories.
3 Data of public opinion monitoring conducted by ISEDT
RAS and RPORC. In the structure of the question “If you feel
happy, can you let us know why?” 16 variants of responses
existed. In the article the combined group of the responses is
presented “family welfare (everybody is healthy)”; “find my
joy in children and grandchildren”; “I have a beloved, love,
and I love my relatives”; “I have friends”; “I have parents”.
2. Residents of the cities (55%). It can be
explained by their higher social position and
financial situation, broad opportunities of
qualified employment assistance, leisure
activities, and also more comfortable living
conditions.
3. People with complete or incomplete higher
education (41%). From our point of view, it is
connected with circumstances that accompany
higher education: higher social status and
income level, quality of living conditions,
profession’s prestige, and social environment’s
culture level.
4. Cohabiting married couples (58%) having
one child (25%). Such aspect gives evidence to
significance of family relations concerning
feeling of happiness formation; and also to
the fact that the existence of children is one
of the conditions to achieve psychological
well-being.
Consequently, urban residents, people aged
30 – 55 years, married with children, people
with higher education, work bringing satis-
faction, and having income above average in the
region consider themselves happier. According
to the received data, social status considerably
determines subjective feeling of happiness.
A happy person is more open to com-
munication, to new sources of information,
has more enthusiasm and creativity to his
professional activities, more stable to physical
and mental loads, etc. At the same time such
a person more positively perceives socio-
economic reforms taking place in the country,
estimates his/her future and prospects for
country’s and society’s development with
optimism.

127Economic and social changes: facts, trends, forecast 1 (25) 2013
A.A. Shabunova, M.V. MorevSOCIAL DEVELOPMENT
The results of investigation showed that
people considering themselves happy in
comparison with the rest population more
positively estimate economic and political
situation in the country (43% against 27%
and 49% against 27% respectively). Amidst
happy people the level of confidence to acting
government authorities and social institutions
is higher (tab. 7).
Happy people are not inclined to conflicts,
more tolerant to ongoing events than those who
are feeling less happy. The negative stock of
patience among people feeling unhappy is 3
times more than happy people (36 and 11%
respectively). The share of people who consider
protest actions at the place of residence possible
comprised among “happy” and “unhappy” 23
and 30% respectively (fig. 5). However, every
fourth person among “unhappy” people is
ready to take part in protest actions (23%), at
the same time among “happy” people the share
of those is considerably smaller (13%).
The growing number of scientific data
evidencing that happiness contributes to good
health preservation is one of the economic
reasons why politicians appeal to mental
welfare of population. Understanding and
taking into account the link between welfare
and health presents the important aspect of
the World Health Organization’s working
process. In particular, it helps to work
out a policy on health promotion of aging
population, which is at risk of rising chronic
disease incidence [2].
Table 6. Socio-demographic characteristics of those feeling “happy” and “less happy”
(in % of the number of respondents who answered the question “Are you happy or not?”)
Socio-demographic characteristics Happy Feeling less happy
Sex
Male 43.3 45.6
Female 56.7 54.4
Age
Under 30 27.2 18.6
30 – 55 years 44.1 48.9
Over 55 28.7 32.5
Territory
Vologda 25.1 24.8
Cherepovets 29.7 15.7
Districts 45.3 59.5
Education
Secondary and incomplete secondary education 27.2 47.6
Vocational secondary education 32.1 30.9
Higher and incomplete higher education 40.7 21.6
Marital status
Married and cohabiting with husband/wife 58.2 50.4
Married, but not cohabiting with husband/wife 0.6 1.5
Not married, but cohabiting with a partner 6.6 8.0
divorced 6.7 12.0
Unmarried 20.3 16.4
Widowed 7.5 11.7
Number of children under 18
No children 64.5 72.6
1 24.7 19.3
2 9.5 7.7
3 0.8 0.0
More than 3 children 0.4 0.4
Source: research by ISEDT RAS.

128 1 (25) 2013 Economic and social changes: facts, trends, forecast
Vologda residents’ notions of happiness
Figure 5. Protest moods level among happy and feeling less happy (in % due
to the number of respondents, who answered the question “Are you happy or not?”)
Table 7. Level of confidence to government authorities and social institutions (the share of trusting,
in % due to the number of respondents, who answered the question “Are you happy or not?”)
Government authorities, social institutions Happy Feeling less happy
President of the Russian Federation 77.0 65.9
Government of the Russian Federation 69.3 61.5
Federation Council 63.8 55.5
State Duma of the Russian Federation 58.2 52.8
Public chamber of the Russian Federation 60.1 41.4
Vologda Oblast authorities 66.2 42.0
Local government 56.5 38.9
Public Chamber of the Vologda Oblast 56.7 38.8
Police 53.9 35.4
The Federal Security Service 662 46.8
Court 67.2 40.7
Public prosecution office 64.1 36.9
Army 59.7 43.3
Trade unions 52.8 47.3
Church 78.1 68.7
Public organizations 55.4 44.7
Political parties and movements 42.5 29.5
Mass media 54.2 43.6
Directors and heads of enterprises 52.5 32.4
Banking and business circles 45.6 26.2
Source: research by ISEDT RAS.
Source: investigation of ISEDT RAS.
12.5
22.5 23.4
29.6
0
5
10
15
20
25
30
Share of those, who consider protestactions possible
Share of those, who are ready to take partin protest movements
Happy Feeling less happy

129Economic and social changes: facts, trends, forecast 1 (25) 2013
A.A. Shabunova, M.V. MorevSOCIAL DEVELOPMENT
According to the results of the survey
(10 thousand people) conducted by the Insti-
tute of fiscal investigations relative to London
University’s College, conclusions about
dependence of happiness level on such serious
factors of life expectancy as ischemic heart
disease and disablement, were drawn [3].
If middle-aged people show life dissatisfaction,
then the possibility of the fact that they will live
long is very low. People who are fully satisfied
with their lives, in comparison with others live
9 – 10 years longer. At the same time in the
group of people dissatisfied with their lives,
death comes 3 times oftener [11].
According to Ed Diener, Psychology
Professor of the Illinois University (USA), who
studied the phenomenon of happiness for 30
years, “there are many types of data, pointing
at the fact that happiness leads to health and
sustains life, of course, besides many other
factors. Subjective welfare can sustain people’s
lives in healthy population, whereas a happy life
in comparison with an unhappy one can mean
five additional years of life, although it depends
on many things, as well as smoking issue” [2].
According to Russian Public Opinion Re-
search Center’s data, among happy Russians
73% are satisfied with their health and health
of their relatives and friends, among unhappy –
37% [10]. The same results were received during
the research conducted by ISEDT RAS. Happy
people are satisfied with their health more than
the rest people (average estimate of health
satisfaction is 3.4 and 2.5 points respectively);
they mark that they are satisfied with health of
their family, relatives and their own one 4 times
oftener (65 and 18% respectively; fig. 6).
Happy people characterize different aspects
of their personal life and the situation in the
society more positively. Therefore, studying of
happiness level and consequences determi-
ning it, has not only research, but practical
character, because support level of political and
economic line of policy followed by govern-
mental authorities; character of psychological
climate in society, the consequences of which
can be such problems as high crime rate,
alcoholism, drug addiction, suicidal behavior,
etc.; the level of disease incidence and mortality,
influencing life expectancy, and other figures of
Figure 6. The share of people satisfied with health of their family, relatives and their own one
(in % due to the number of respondents, who answered the question “Are you happy or no?”)
Sources: research by ISEDT RAS; data base RPORC (www.wciom.ru).
73
65
37
18
0
10
20
30
40
50
60
70
80
tsalbO adgoloVnoitaredeF naissuR
Happy Feeling less happy
130 1 (25) 2013 Economic and social changes: facts, trends, forecast
Vologda residents’ notions of happiness
demographic situation depend on the share of
positively-spirited people in the society.
As the investigation showed, more than half
of the residents in the Vologda Oblast, as well
as Russians all in all, consider themselves
happy. Science has research data regarding
interrelation between subjective well-being and
such categories as income (material welfare
level), employment, education, marriage and
family, behavior and lifestyle, sex, biological
factors, personal characteristics, and subjective
satisfaction with some living conditions.
However, none of the enumerated figures do
not determine the whole level of subjective
well-being, but contribute to it [12].
Judging by the results of the conducted
investigation, subjective feeling of happiness
is determined by the set of conditions: mate-
rial welfare level, family relations character,
satisfaction with professional occupation, etc.
All in all, such indicators characterize
individual’s social status, determining his level
of aspiration, achieving which reflects emotional
well-being and subjective environmental
perception. Hence, it is necessary to create
conditions for vertical mobility and self-
actualization of population for maintaining
high happiness level in society.
The fact that the majority of residents both
in the Vologda Oblast and the Russian
Federation link their depressed mood mainly
with socio-economic problems, provides
evidence of necessity in taking steps for
improvement life quality of people at large
(primarily vulnerable social groups), and
for the decrease of negative effects of those
socio-economic determinants (first of all
unemployment and wealth gap) that have
negative impact on subjective person’s
perception of his/ her own emotional state.
References1. Sorokin P.A. Human. Civilization. Society. Ed. by A.U. Sogomonov: translation from English. Moscow: Politizdat,
1992.
2. Happiness effect. Bulletin of the World Health Organization, 2011. Available at: http://www.who.int/bulletin/
volumes/89/4/11-020411/ru/
3. Rodionov-Zrazhevsky A.G. Core factor of human potential. Eurasian international scientific-analytical edition
“Problems of modern economics”. 2012. No. 2 (42). Available at: http://www.m-economy.ru/art.php?nArtId=4144
4. Lein R. Loss of happiness in terms of market democracy, 2010. Site of Sevastopol city organization Party of
Regions. Available at: http://sevreg.com.ua/2010/11/nasha-zhizn-uskoryaetsya-s-kazhdym-dnem.html
5. Happiness is not in money: analytical materials. Research holding “Romir”. Available at: http://www.romir.ru/
studies/305_1328212800/
6. Statistical yearbook of the Vologda Oblast 2011: statistical abstract. Vologdastat. Vologda, 2012.
7. Morev M.V., Shabunova A.A., Gulin K.A. Socio-economic and demographic aspects of suicidal behavior:
monograph. Vologda: ISEDT RAS, 2010.
8. Kagermazova L. Ts. Developmental psychology: electronic tutorial. International institute of group psychotherapy.
Available at: http://www.group-analysis.ru/library/
9. Argail M. Psychology of happiness. St. Petersburg, 2003.
10. What is the reason of happiness? : Press-edition of RPORC. No. 2019. Available at: http://wciom.ru/index.
php?id=459&uid=112766
11. Life expectancy depends on the feeling of happiness: online-journal “Ecobyt”. Available at: http://www.ecobyt.
ru/news/1513/
12. Kostenko K.V. Subjective picture of life journey and life satisfaction in later years (on the material of living in
the boarding schools): Ph.D. in pedagogical sciences thesis. Krasnodar, 2005. Available at: http://www.dissercat.
com
13. More money, less happiness: analytical materials. RPORC. Available at: http://wciom.ru/index.
php?id=269&uid=13996
14. Regions of Russia. Socio-economic figures: statistical abstract. Moscow, 2010.

131Economic and social changes: facts, trends, forecast 1 (25) 2013
SOCIAL DEVELOPMENT
UDC 316.356.2 (470.12)
LBC 60.542.14 (2Rus-4Vol)
© Kondakova N.A.
Health and living conditions of the rising generationThe article presents the research results of the rising generation’s quantitative and qualitative
characteristics in Russia and in the Vologda Oblast. The main trends characterizing children’s health,
their living conditions and lifestyle in their families are revealed in the article. Today the primary task
of social policy in terms of child population increase is to provide the rise of their qualitative potential
and living standards.
Children’s health, living conditions and lifestyle, child neglect, incomes of families with children.
Nataliya A.KONDAKOVAISEDT RAS Junior Scientific Associate
Nowadays the Government of the Russian
Federation pays more and more attention to
the socio-demographic development of the
country. National priority projects “Health”,
“Education”, “Affordable housing” started in
2005, demographic programmes have positi-
vely influenced the country’s socio-economic
development. All of them are assigned to
improve people’s quality of life, to preserve
and strengthen population’s health, to amend
the demographic situation. However, the
children’s health continues getting worse as
evidenced by the results of lasting research
studies (A. Baranov, E. Breyeva, I. Zhuravleva,
O. Kislitsyna, Y. Lisitsyn, N. Rimashevskaya,
A. Shabunova).
This article is aimed at quantitative and
qualitative characteristics analysis of the rising
generation (aged from 0 to 17 years). The
emphasis will be laid on health, which is not
only the basis of sustainable development of
the Russian society today, but influences the
country’s development in future.
Appealing to the characteristics research
of the rising generation, several main trends
can be marked:
1. Decrease in child population is
noteworthy. From 2000 to 2010 the proportion
of children in the total population of the
country reduced from 24 to 18%. Similar
situation is observed in the Vologda Oblast,
where the child population rate over the
specified period decreased by 5% (from 23 to
18%) [12].
According to the forecasts of the Federal
State Statistics Service, in 2030 the rate of
population under working age will remain
intact and comprise 16% as in 2011. However,
the reduction will be observed in absolute
figures: from 2011 to 2030 the population of
this category in the Vologda Oblast will decrease
by 9% equal to 181 thousand people, national
average – by 1.5% (22845.4 thousand people).
In the meantime the working-age population
rate will reduce by 7% both in national average
and in the Vologda Oblast (tab. 1).

132 1 (25) 2013 Economic and social changes: facts, trends, forecast
Health and living conditions of the rising generation
benefit till 18 months in Russia in 2007.
Essentially, these measures are aimed at birth
support in the families that have children,
whereas many families delay first-birth.
Despite the rise in births, uniparous families
are predominant in Russia. According to the
National Population Census (2010) in
households (both in the city and in the
country) uniparous families prevail. During the
intercensal period the amount of households
without children under 18 rose by 15%; the
amount of households, which consist of two
and more people and have children under 18
reduced by 8% (from 52% in 2002 to 44% in
2010) [12].
Child development in uniparous families
is subject to risk. On the one hand, his parents
have more opportunities to give a fair deal for
the development. On the other hand, adults
pay excessive attention and hyper-care to
him. As a result, a child’s selfishness and
steep demands to surrounding people are
shaping.
Consequently, ageing population process is
evidenced and will continue. Rapid growth of
elderly and aged people rate involves inevitable
structural transformations in the economy,
institutional environment, and changes in
social benefits flow [13].
As a result of demographic policy carried
out by the Russian Government, since 2006,
the country’s birth rate has increased from 10.4
to 12.5 ‰, in the Vologda Oblast this figure
(over a period of 2006 – 2010 has increased from
10.9 to 12.5 ‰) conforms to the nationwide
rate. Nevertheless, the birth rate remains lower
than necessary even for new generations to
replace parental cohorts, which do not allow
overcoming population reduction (tab. 2).
Hence, over 11 years the population in the
region has decreased by 7.6%, comprising
1 201.2 thousand people in 2011 that exceeds
reduction pace nationwide (over 4 million.
people or 2.7%) [12].
Birth rate increase is mainly connected with
introduction of maternity capital and nursing
Table 1. Age distribution forecast in the Russian Federation and the Vologda Oblast (VO)
for the period until 2030 (average variant of the forecast, in % due to the total population)
YearUnder working age Working age Over working age
RF VO RF VO RF VO
2011 16.3 16.5 61.6 61.2 22.0 22.3
2015 17.4 17.8 58.8 57.9 23.8 24.3
2020 18.3 18.6 55.7 54.6 26.0 26.8
2025 17.8 18.0 54.7 53.8 27.4 28.3
2030 16.4 16.4 55.1 54.4 28.5 29.2
Source: Unified Interdepartmental Statistical Information System. Available at: http://www.fedstat.ru/indicator/data.do
Table 2. Natural population movement in the Russian Federation and the Vologda Oblast
Year
Population, thousand
peopleCrude birth rate, ‰ Crude death rate, ‰ Natural decline, ‰
RF VO RF VO RF VO RF VO
2000 146 890.1 1 299.6 8.7 8.8 15.3 16 -6.6 -7.2
2006 142 753.5 1 235.4 10.4 10.9 15.2 17.1 -4.8 -6.2
2007 142 220.9 1 227.8 11.3 11.6 14.6 15.9 -3.3 -4.3
2008 142 008.8 1 222.9 12.1 12 14.6 16.3 -2.5 -4.3
2009 141 903.9 1 218.2 12.4 12.4 14.2 16.2 -1.8 -3.8
2010 141 914.5 1 213.7 12.5 12.5 14.2 16.8 -1.7 -4.3
2011 142 865.4 1 201.2 12.6 13.0 13.5 15.7 -0.9 -2.7
Source: Federal State Statistics Service. Available at: http://www.gks.ru/dbscripts/Cbsd/DBInet.cgi?pl=2415019

133Economic and social changes: facts, trends, forecast 1 (25) 2013
N.A. KondakovaSOCIAL DEVELOPMENT
2. The next trend is child’s health dete-
rioration, which plays a critical role not only
in demographic development, but it also
determines the quality of the territory’s
human potential. Among all the age-groups of
population child’s health condition tendencies
became the most unfavorable. During 2000 –
2011 child disease incidence has increased by
32% (in 2011 it equaled 1932 cases per 1000
age-appropriate people), in the Vologda Oblast
– by 37% (in 2011 – 2533 cases respectively);
while among adult population total disease
incidence rose by 8% in the whole country, and
by 3% in the region [12].
However, it is worthwhile to note certain
positive changes in newborn’s health condition.
As a result of implementing regional target
programmes “Healthy child” and the national
priority project “Health” [2] newborn disease
incidence in the Vologda Oblast has reduced
by 27% during 2000 – 2010. At the same time
the situation on the country level is a little
worse: disease incidence has reduced by 7%
only (fig. 1).
Nevertheless, during the growing-up pro-
cess starting from birth, children’s health
potential is constantly declining. And, as the
scientists note, the most substantial prevalence
rate growth of chronic diseases, abnormal
physical development, frequency of acute
distress and exacerbation of chronic pathology
take place during the process of systematic
education (while studying in pre-school,
general secondary, elementary and secondary
vocational educational institutions) [7].
According to the Ministry of Healthcare
and Social Development of the Russian
Federation, in Russia in 2010 the following
figures were mentioned among the school-
children due to their health condition: first
group (healthy) – 21%; second group (healthy,
but with some functional abnormalities) – 59;
third group (with chronic diseases) – 18; forth
and fifth groups (disabling diseases) – 2% of
the children [7].
The main diseases, which are spread among
children more often, are: eye diseases (myopia),
diseases of musculoskeletal system (postural
Figure 1. Newborn disease incidence (%, to the total amount of quick-borns)
Sources: Statistical yearbook of Russia. 2010: statistical abstract. Rosstat. Moscow, 2011.; Statistical yearbook of the Vologda
Oblast: statistical abstract .Vologdastat. Vologda, 2011.
3839.3
39.940 40.2 40.7
39.839
37.336.1 35.535.6
40.440.539.9
38.7 38.6 38.6
32.5
31.1
27.929.3
25
27
29
31
33
35
37
39
41
43
2000 2001 2002 2003 2004 2005 2006 2007 2008 2009 2010
Russian Federation Vologda Oblast

134 1 (25) 2013 Economic and social changes: facts, trends, forecast
Health and living conditions of the rising generation
disorder, scoliosis), diseases of digestive system.
However, medical workers note that 70% of
abnormalities fixed in lower grades transform
into chronic form by the graduation from
school [10].
Children’s health deterioration is confirmed
not only by the official statistics data, but also
by the results of sampling social studies. In
March 2012 the Institute of Socio-Economic
Development of Territories of the Russian
Academy of Sciences (ISEDT RAS) conducted
a research in two schools in Vologda: School No.
1 with advanced study of English, where study
load for pupils is enhanced in comparison with
ordinary comprehensive school, and School
No. 13 (ordinary comprehensive school)1.
Analysis of grouping according to health
condition showed that in both educational
establishments the distinct tendency of reducing
the proportion of the first group of children to
senior school is visible and simultaneously
increasing of the children with the third and
forth groups (fig. 2).
Unfavorable trends in children’s health
condition lead to such negative social and
economic consequences, as unpreparedness
to schooling, academic failure, inability to
realize his/her labor potential, elaboration
disorder of reproductive function, and diseased
generations’ birth, etc.
3. Families’ income level in Russia
continues declining, which influences the
children’s living conditions. A great number
of children live in low-income families.
According to a sample inquiry of household
budgets, in 2010 families with children under
16 years comprised 57.5% of the total number
of households accommodating resources
1 In both schools the questionnaire was conducted among
the students (1st, 5th, 9th and 11th forms). These forms are
selected, because exactly these periods are critical for children:
beginning of schooling (1st form), beginning of middle school
(5th form), and transition to senior school (9th, 11th forms).
In both schools 577 pupils aged from 7 to 18 years: in School
No. 1 – 324 pupils (1st form – 107; 5th form – 92; 9th-11th
forms – 125); in School No. 13 – 253 pupils (1st form – 84;
5th form – 82; 9th-11th forms – 87).
lower than minimum subsistence level (in
2009 – 54.6%), including families with one
child – 31.2%, families with two children –
20.3%, families with three and more children
– 6%. The same situation is observed in the
Vologda Oblast, where families with children
under 16 years comprise 55% among low-
income population [8]. When a family’s
living conditions are poor, it does not have an
opportunity to offer all the necessary facilities
for normal development, to provide good
rest during summer holidays, and to organize
healthy and proper nutrition, etc.
Analyzing the level of average available
resources per capita in the families with various
amounts of children gives evidence of welfare
decline in the families with three children. In
2010 such category of families had the lowest
level of average available resources per family
member – 5 460 rubles per month contrary to
12 071 rubles in families with one child and
8 716 rubles in families with two children.
However, meal expenses remain the main
expenditure item of the family budget. Within
consumer expenditure they comprised 38% (in
2009 – 41.3%) [8].
Providing a child with necessary nutrition
considerably depends on family’s social
position and its financial capabilities. Judging
by the data from the monitoring of child health
forming conditions, conducted by ISEDT RAS
from 1995 up to the present day2, in the group comprising 20% of lower-class families the share of those who pointed out bad provision of children with foodstuff twice or even 5-fold exceeds that of the groups of middle-class and upper-class families (tab. 3).
2 Monitoring of child health forming conditions is
conducted by ISEDT RAS from 1995 under technical guidance
of ISESP RAS. Medical workers are engaged for evaluation
children’s health and development. Families, whose children
were born in the certain periods: May, 15-30 1995 (first cohort)
and March, 1-20 1998, 2001 and 2004 (second – fourth
cohorts) take part in survey organized in the Vologda Oblast
(Vologda and Cherepovets, district centres Kirillov and Velikiy
Ustyug, urban-type settlement Vozhega). Monitoring supposes
complex tools usage based on sociological questionnaires.

135Economic and social changes: facts, trends, forecast 1 (25) 2013
N.A. KondakovaSOCIAL DEVELOPMENT
Malnutrition can lead to such negative
processes as decrease in immunity, and disorder
not only in physical, but also in mental
development of the child. According to the
results of monitoring, all the children with “bad
and very bad” foodstuff provision have health
abnormalities (tab. 4).
4. Problems of child neglect and home-
lessness continue to be relevant in Russia.
Orphanhood statistics are inaccurate. Various
departments, institutions and organizations
mention different figures. For instance,
Albert Likhanov, the chairman of the Russian
Children’s Fund, stated that according to the
Figure 2. Distribution of pupils according to their health state, %
54
4.614.4
21.5
77.374.2
53.8
8.47.41
0
20
40
60
80
100
1 form 5 form 9-11 forms
%
I (healthy children)II (children with some health deviations)III, IV (children with chronic deseases)
Table 3. Foodstuff provision of children depending on family’s financial
situation in 2011 (in % of the number of respondents)
Foodstuff provision of children
20% of lower-class 60% of middle-class 20% of upper-class
7
years
10
years
13
years
16
years
7
years
10
years
13
years
16
years
7
years
10
years
13
years
16
years
Good 35.7 13.3 15.4 44.4 43.6 45.5 42.6 34.4 64.3 56.3 58.7 60.0
Satisfactory 64.3 73.3 69.4 44.4 53.8 47.7 52.6 62.5 35.7 43.8 41.3 40.0
Unsatisfactory 0.0 13.3 15.2 11.1 2.6 6.8 4.8 3.1 0.0 0.0 0.0 0.0
Source: Monitoring of child health forming conditions. ISEDT RAS, 2011.
Table 4. Influence of foodstuff provision on children’s health in 2011.
Foodstuff provision
Health group of children
Children born in 1995 Children born in 1998 Children born in 2001 Children born in 2004
R1 R2 R1 R2 R1 R2 R1 R2
Good 24.3 75.7 17.6 82.4 15.4 84.6 13.6 86.4
Satisfactory 24.3 75.7 18.2 81.8 6.3 93.8 6.0 94.0
Bad, very bad 0.0 100.0 0.0 100.0 0.0 100.0 0.0 100.0
R1 – group with minimal risk of health deterioration
R2 – children with various health abnormalities and chronic diseases
Source: Monitoring of child health forming conditions. ISEDT RAS, 2011.

136 1 (25) 2013 Economic and social changes: facts, trends, forecast
Health and living conditions of the rising generation
Figure 3. The number of children without parental care in 2000 – 2011, people
Source: Internet portal of the Ministry of Education and Science of the Russian Federation / Department of youth policy, care and
social protection of children. Available at: http://www.usynovite.ru/statistics/2011/1/
Fund’s data the number of orphans in Russia is
at least 10% more than it is declared in the State
report of 2007 [9]. That means not 731 000 but
over 800 000 people (2007 – 2008). In contrast:
after World War II in USSR the number of
orphans was 678 000 children (1945). Today
in Russia according to the statistical data there
are 2 – 2.5 million homeless children, whereas
according to the estimate of the Federation
Council, the Public Prosecution Office of the
Russian Federation and independent experts
their number comprises up to 3 – 4 million.
Lack of a clear definition concerning the
grade of the loss of control over a child’s
behavior to consider him/her as neglected and
also a formalized procedure of neglect
establishment, the absence of the neglected
children registration procedure and the single
record-keeping body lead to the extremely
inaccurate figures of neglected children ratio.
Statistics take into consideration only
neglected children who are placed into certain
institutions and reside there, but not their real
number. So, according to the statistical
data by the Internet portal of the Ministry
of Education and Science of the Russian
Federation “adoptinrussia.ru”, the maximum
number of children without parental care was
marked in Russia in 2005 (133034 people). A
gradual decline of this figure is observed: 82177
orphaned children were recorded in 2011 (fig. 3).
In spite of incompleteness, it is possible to speak
about their significance.
Orphanhood consequences are impossible
to overestimate, and it concerns not only
physical, mental and moral health and
development deterioration of the rising
generation, but also socio-economic situation
in the country and in a particular region.
5. Changes in the lifestyle of families with
children are quite alarming. No doubt,
favorable conditions at early stages of their life
play a critical role in further development.
However, if an adult bears responsibility for his/
her health condition by him/herself to a great
extent, then children’s health virtually depends
on their environment. The urgency of the
problem intensifies, because over the last years
the tendency of polarization of families due
to their living standards is observed, as well as
instability of marriage, divorce and incomplete
families’ rate growth, interfamilial tensions and
spreading of pernicious habits, in its turn lead
to changing of the families’ lifestyle.
123204 128075 127090 128951 132505 133034127096 124384
115627106716
9380682177
20000
60000
100000
140000
2000 2001 2002 2003 2004 2005 2006 2007 2008 2009 2010 2011
Russian Federation
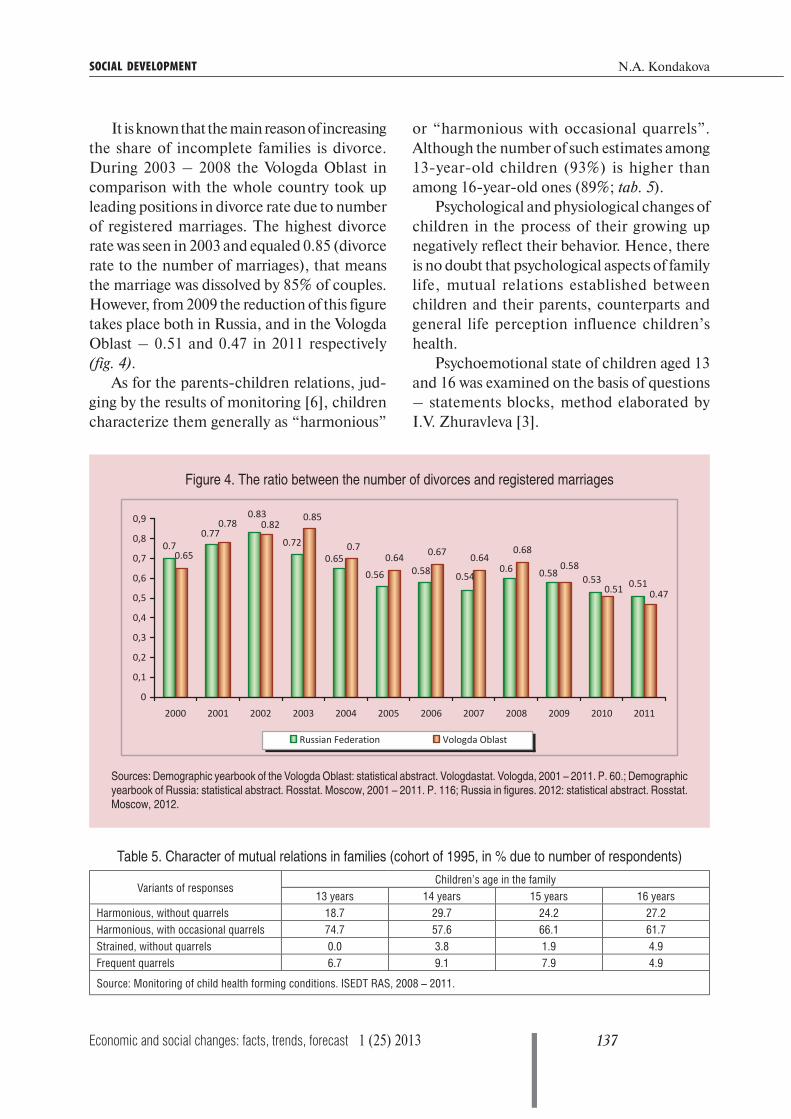
137Economic and social changes: facts, trends, forecast 1 (25) 2013
N.A. KondakovaSOCIAL DEVELOPMENT
It is known that the main reason of increasing
the share of incomplete families is divorce.
During 2003 – 2008 the Vologda Oblast in
comparison with the whole country took up
leading positions in divorce rate due to number
of registered marriages. The highest divorce
rate was seen in 2003 and equaled 0.85 (divorce
rate to the number of marriages), that means
the marriage was dissolved by 85% of couples.
However, from 2009 the reduction of this figure
takes place both in Russia, and in the Vologda
Oblast – 0.51 and 0.47 in 2011 respectively
(fig. 4).
As for the parents-children relations, jud-
ging by the results of monitoring [6], children
characterize them generally as “harmonious”
or “harmonious with occasional quarrels”.
Although the number of such estimates among
13-year-old children (93%) is higher than
among 16-year-old ones (89%; tab. 5).
Psychological and physiological changes of
children in the process of their growing up
negatively reflect their behavior. Hence, there
is no doubt that psychological aspects of family
life, mutual relations established between
children and their parents, counterparts and
general life perception influence children’s
health.
Psychoemotional state of children aged 13
and 16 was examined on the basis of questions
– statements blocks, method elaborated by
I.V. Zhuravleva [3].
Figure 4. The ratio between the number of divorces and registered marriages
Sources: Demographic yearbook of the Vologda Oblast: statistical abstract. Vologdastat. Vologda, 2001 – 2011. P. 60.; Demographic
yearbook of Russia: statistical abstract. Rosstat. Moscow, 2001 – 2011. P. 116; Russia in figures. 2012: statistical abstract. Rosstat.
Moscow, 2012.
0.510.53
0.70.77
0.83
0.720.65
0.56 0.58 0.540.6 0.58
0.680.640.670.640.65
0.78 0.820.85
0.7
0.58
0.51 0.47
0
0,1
0,2
0,3
0,4
0,5
0,6
0,7
0,8
0,9
2000 2001 2002 2003 2004 2005 2006 2007 2008 2009 2010 2011
Russian Federation Vologda Oblast
Table 5. Character of mutual relations in families (cohort of 1995, in % due to number of respondents)
Variants of responsesChildren’s age in the family
13 years 14 years 15 years 16 years
Harmonious, without quarrels 18.7 29.7 24.2 27.2
Harmonious, with occasional quarrels 74.7 57.6 66.1 61.7
Strained, without quarrels 0.0 3.8 1.9 4.9
Frequent quarrels 6.7 9.1 7.9 4.9
Source: Monitoring of child health forming conditions. ISEDT RAS, 2008 – 2011.

138 1 (25) 2013 Economic and social changes: facts, trends, forecast
Health and living conditions of the rising generation
Different questions were offered to adoles-
cents and due to their responses their mutual
relations with parents, counterparts and general
life satisfaction were estimated. For every
statement it was necessary to choose one variant
– from “absolutely agree” to “absolutely
disagree”. Then Stress-ratio (S) was calculated
as the correlation of extreme positions between
negative and positive content. The more the
share of negative responses, the more the value
of the Stress-ratio (tab. 6).
The highest Stress-ratio (1.48 – 2.4) was
seen in the block “Life perception”. Adolescents
aged 13 have total Stress-ratio (4.8) higher than
16-year-old ones (3.15).
Good and comfortable atmosphere at
home, at school also has a substantial influence
on children’s health. Comparing estimates of
their own health condition and the Stress-
ratio showed that children, who consider their
health condition as excellent and good, have
total Stress-ratio (2.72) lower than children,
who estimate their health as ”satisfactory” or
“bad” (3.51).
Existence of pernicious habits among the
children’s immediate surrounding is a risk
factor for their health and formation of self-
destructive lifestyle. According to sociological
data, in such families where at least one
member was smoking, 12-year-old children
tried smoking four times oftener (17%) than
in nonsmoking families. By the age of 16
the number of children who tried smoking
increased almost 3-fold (49%) [6]. Even at
the age of 10 the share of smoking children
comprises on average 4%, that further will
have an extremely negative influence on
their health. Received data is supported
by other investigations too: 11-year-old
pupils from Russia are the “leaders” in the
Table 6. Stress-ratios (S) as figures of mutual relations with parents, counterparts and surrounding people
Questions-statements 13 years 16 years
Relations with parents
Mutual understanding with parents 0.04 0.18
Comfortable atmosphere at home 0.09 0.08
Respecting of adolescent’s feelings by parents 0.05 0.11
Frequency of desire to leave the house 0.05 0.06
Pressure on adolescent from parents 0.25 0.05
Total in block 0.48 0.48Relations with counterparts
Self-confidence 0.05 0.04
Confidence in fact that it is joyful to be with him/her 0.08 0.05
Confidence in people’s sympathy 0.25 0.14
There are some difficulties speaking to class 1.00 0.63
Popularity among counterparts 0.54 0.34
Total in block 1.92 1.20Life perception
Feeling of life’s heaviness 0.04 0.05
Everything had got all mixed up in life 0.15 0.07
Frequent feeling of shame 0.61 0.22
Always show what he/she should do 1.00 0.14
Teachers lets feel shortcomings 0.60 1.00
Total in block 2.40 1.48Total 4.80 3.16
Source: Monitoring of child health forming conditions. ISEDT RAS, 2011.
139Economic and social changes: facts, trends, forecast 1 (25) 2013
N.A. KondakovaSOCIAL DEVELOPMENT
European Region in the amount of smokers,
at least once a week: 4% of girls and 5% of
boys [17]. According to the World Trade
Organization (WHO), in Europe almost
every fifth adolescent (19.9%) aged 13 – 15 is
smoking: boys (22.7%) a little more than girls
(16.8%) [18].
One more pernicious habit, which can have
a negative influence on the health of parents
and their children, is alcohol abuse. The survey
showed that if an alcohol consumption practice
exists in the family, then 13% of children at the
age of 12 and 70% of children aged 16 tried
it, which is two times more than in families,
where there is no such practice. It means that
pernicious habits of parents have a significant
influence on their children’s health. According
to Russian surveys, Russia is just behind
Ukraine in level of consuming alcohol by
11-year-old pupils (7% of girls and 10% of boys
consume alcohol almost once a week) [16]. Due
to HBSC international report, in European
countries on average 21% of adolescents aged
15 consume alcohol once a week. By the age
of 16, two-thirds of adolescents already tasted
alcohol [17].
To sum up, the most urgent problems for
the rising generation can be marked:
– depopulation of children;
– children’s health deterioration, inclu-
ding the spreading of pernicious habits;
– problem of low income in families with
children;
– problem of underage neglect.
Summing up, it is necessary to point out
that the main task of social policy is to enhance
the children’s quality potential and living
standards. To improve the situation concerning
child health, it is necessary to carry out a complex
policy of healthy lifestyle in collaboration with
holding activities aimed at improving financial
and social status of families with children,
revealing factors having influence on children’s
health. In this case the monitoring is required
to help to determine the most vulnerable groups
due to health condition, and also the socio-
economic factors that influence population’s
health negatively. In the meantime, the
efficiency of preventive actions regarding health
care of children and adolescents, including
those ones who are deprived of parental care,
should increase.
References1. State report on children’s position in the Russian Federation in 2010. Moscow: Ministry of Healthcare and Social
Development of the Russian Federation, 2010.
2. State report on public health and health activities in the Vologda Oblast in 2009. Ed. by Ph.D. in Medical Sciences
A.A. Kolinko. Vologda, 2010.
3. Zhuravleva I.V. Health of adolescents: sociological analysis. Moscow: Sociology Institute of RAS, 2002. P. 78.
4. D.M. Medvedev’s Interview. Official site of the party “United Russia”. Available at: http://old.er.ru/text.
shtml?20/3451,100033.
5. Kopeykina N.A. Problems of pupils’ health preservation. Problems of development of territories. 2012. No. 60.
P. 44-52.
6. Kopeykina N.A. Monitoring of child health forming conditions: research report. Vologda, 2011.
7. Baranov A.A., Kuchma V.R., Tutelyan V.A., Velichkovskiy B.T. New opportunities of preventive medicine in solving
health problems of children and adolescents in Russia. Comprehensive programme of research studies “Prevention
of prevailing diseases among children and adolescents in 2005 – 2009”. Moscow: GEOTAR-Media, 2008.
8. Position of children under 16 in the Vologda Oblast in 2010: statistical bulletin. Vologdastat. Vologda, 2011.
9. The number of derelict children is increasing. Business press. No. 22. June, 3 2004. Available at: http://www.
businesspress.ru/newspaper/article_mId_40_aId_304822.html
10. Rimashevskaya N.M., Shabunova A.A. Pupils’ health: tendencies and determining factors. Population. 2011.
No. 4. P. 4-16.

140 1 (25) 2013 Economic and social changes: facts, trends, forecast
Health and living conditions of the rising generation
11. Rimashevskaya N.M. Nation’s preservation – strategic imperative of Russia. In: Non-economic edges of
economics: unexplored interaction. Scientific and publicistic notes of social scientists. Ed. by O.T. Bogomolov.
Moscow: IES, 2010.
12. Webite of the Federal State Statistics Service. Available at: http://www.gks.ru.
13. Social and economic development of Russia. Cairo action programme: 15 years later: analytical report devoted
to 15th anniversary of International Conference on Population and Development. Moscow: IISP, 2010.
14. Shabunova A.A., Stepanenko V. V. Family’s financial position influence on children’s health. Problems of
development of territories. 2012. No. 45. P. 80-85.
15. Shabunova A.A., Leonidova G.V. Human capital as an indicator of sustainable development of the territory.
Economic and social changes: facts, trends, forecast. 2011. No. 5 (17). P. 101 – 115.
16. Kuchma V.R., Sukhareva L.M., Rapoport I.K., et al. Health schools in Russia. Moscow: Scientific Centre of
Children Health under RAMS, 2009.
17. Currie C. et al., eds. Social determinants of health and well-being among young people. Health Behaviour in
School-aged Children (HBSC) study: international report from the 2009/2010 survey. Copenhagen. WHO
Regional Office for Europe, 2012.
18. World health statistics 2009. Geneva, World Health Organization, 2009. Available at: http://www.who.int/whosis/
whostat/2009/en/index.html.
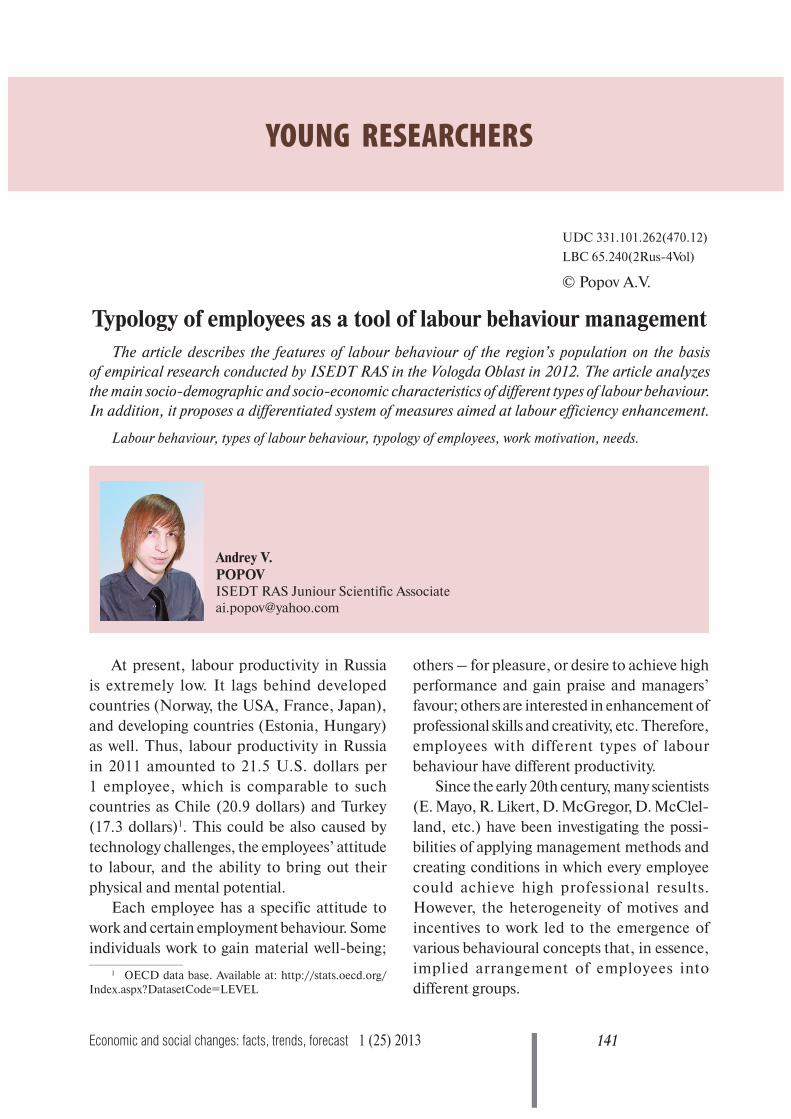
141Economic and social changes: facts, trends, forecast 1 (25) 2013
YOUNG RESEARCHERS
UDC 331.101.262(470.12)
LBC 65.240(2Rus-4Vol)
© Popov A.V.
Typology of employees as a tool of labour behaviour managementThe article describes the features of labour behaviour of the region’s population on the basis
of empirical research conducted by ISEDT RAS in the Vologda Oblast in 2012. The article analyzes
the main socio-demographic and socio-economic characteristics of different types of labour behaviour.
In addition, it proposes a differentiated system of measures aimed at labour efficiency enhancement.
Labour behaviour, types of labour behaviour, typology of employees, work motivation, needs.
Andrey V.POPOVISEDT RAS Juniour Scientific Associate
At present, labour productivity in Russia
is extremely low. It lags behind developed
countries (Norway, the USA, France, Japan),
and developing countries (Estonia, Hungary)
as well. Thus, labour productivity in Russia
in 2011 amounted to 21.5 U.S. dollars per
1 employee, which is comparable to such
countries as Chile (20.9 dollars) and Turkey
(17.3 dollars)1. This could be also caused by
technology challenges, the employees’ attitude
to labour, and the ability to bring out their
physical and mental potential.
Each employee has a specific attitude to
work and certain employment behaviour. Some
individuals work to gain material well-being;
1 OECD data base. Available at: http://stats.oecd.org/
Index.aspx?DatasetCode=LEVEL
others – for pleasure, or desire to achieve high
performance and gain praise and managers’
favour; others are interested in enhancement of
professional skills and creativity, etc. Therefore,
employees with different types of labour
behaviour have different productivity.
Since the early 20th century, many scientists
(E. Mayo, R. Likert, D. McGregor, D. McClel-
land, etc.) have been investigating the possi-
bilities of applying management methods and
creating conditions in which every employee
could achieve high professional results.
However, the heterogeneity of motives and
incentives to work led to the emergence of
various behavioural concepts that, in essence,
implied arrangement of employees into
different groups.

142 1 (25) 2013 Economic and social changes: facts, trends, forecast
Typology of employees as a tool of labour behaviour management
In the Soviet period, employees typology
according to their attitude to labour was mostly
made up by evaluating their “positive” and
“negative” characteristics. The dominating
role of social determination and abandonment
of psychological approaches led to the fact
that employees were considered mainly as an
object rather than subject of management.
These approaches include the one proposed
by V.A. Smirnov who distinguished three
groups: top performers, average performers and
underperformers; and the one proposed by
B.G. Proshkin who distinguished five groups:
the best, good, average, bad and worst, etc. The
methodologies were, as a rule, based on the
employees performance evaluation by their
immediate superiors, which made it difficult to
reveal the reasons for some behaviour or other
[6, p. 65-66].
We consider that labour behaviour is
determined primarily by motivation, therefore,
prior to relating an employee to a certain type,
it is necessary to consider the composition,
diversity and motivation force of labour activity.
Labour motivation is a combination of
internal and external driving forces that induce
people to act and that orient them toward
achieving the goals [1, p. 145].
S.A. Naumova proposes to distinguish types
of employees based on the combination of
strong groups of labour motives (labour as an
inherent worth and labour as a means). It
resulted in allocation of 16 motivation types,
each corresponding to a certain worker group:
from the “harmonious” and “artisans” to
“sybarites” and “robots” [5, p. 61]. This
methodology, despite its flexibility and
management capacity, is, on the one hand,
too simplified, and on the other, rather
cumbersome, which casts doubt on the
practical relevance of the research.
Due to the fact that objective quantitative
estimation of employees’ needs is unfeasible,
we used a methodology that, on the basis
of A. Maslow’s hierarchy of needs, allows
indirect assessment of labour motivation of
the region’s population. The study was carried
out on the basis of the labour potential quality
monitoring2.
The article is aimed at the development of
methodological approaches to the typology of
employees and the analysis of their labour
behaviour types. The research results can be
used for the improvement of mechanisms of
population’s labour behaviour management.
Employees’ labour behaviour types were
determined on the basis of the survey “For you,
your work is, primarily, the way to…”. The
population’s labour activity was evaluated on
a five-point scale (from absolute disagreement
to absolute consent) according to various
motivation aspects.
Table 1 shows that the list of motives
proposed for evaluating was formed in
accordance with A. Maslow’s hierarchy of
needs and was expanded according to labour
motivation peculiarities. Thus, the total
number of components is ten.
The systematization of variables was carried
out using factor analysis; as a result, three
factors were determined that had the values
more than unity. Their sum frequencies explain
73% of the variance.
The use of mathematical tools3 has shown
that the selected factors can be arranged in the
following sequence.
The first factor combines the following
variables: ‘to bring out one’s personality
potential’, ‘to achieve success’, ‘to build a
career’, ‘to gain a sense of accomplishment’
and ‘to acquire new knowledge’. Thus,
2 ISEDT RAS has been carrying out the monitoring of
labour potential quality of the Vologda Oblast population since
1997. The object of research is the able-bodied population
of the Vologda Oblast. Polls are held annually in August –
September in the cities of Vologda and Cherepovets and in
eight districts of the oblast (Babayevsky, Velikoustyugsky,
Vozhegodsky, Gryazovetsky, Kirillovsky, Nikolsky, Tarnogsky
and Sheksninsky). The method of survey is questioning at the
respondents’ place of residence. Sample size is 1500 people,
sampling error doesn’t exceed 3%.3 Orthogonal varimax rotation with Kaiser normalization
was used.

143Economic and social changes: facts, trends, forecast 1 (25) 2013
YOUNG RESEARCHERS A.V. Popov
an important message, which these components
bear, allows this factor to be identified as ‘the
motives for development’.
The second factor comprises such com-
ponents as ‘feel secure, ‘earn love, respect and
recognition’. This indicates the need for
stability and public recognition. This factor is
named ‘the motives of stability’.
The third factor includes the following
variables: ‘fend for myself (provide for my
family)’ and ‘make money’, which testifies to
the high importance of financial factors and
corresponds to the notion of ‘the motives of
enrichment’ (tab. 2).
The hierarchical cluster analysis of factors
has allowed for the arrangement of respondents
into layers (clusters) and define the types of
labour behaviour (tab. 3).
The number of clusters is determined by
finding the difference between the total number
of observations and the number of steps in the
course of agglomeration, after which the
coefficient (squared Euclidean distance)4
is increasing very rapidly. The process of
unification into new clusters stopped at step
1325 (the total number of observations being
1327), where the measure of the distance
between two clusters increases from 17.9 to 31.5.
4 Used to add greater weights to the objects more distant
from one another.
This means that after the three clusters
have been formed, there is no necessity for us
to make any subsequent unifications, and the
result of the three clusters is optimal.
When assessing the cluster centres, it should
be noted, first of all, that here we speak about
the mean values of the factors ranging approxi-
mately from -3 to +3. Besides, one should bear
in mind that, according to the coding of res-
ponses (1 – completely disagree, 5 – completely
agree), the factor’s high negative value indi-
cates a low degree of its manifestation, i.e.
shows low competence, and, on the contrary,
the factor’s high positive value implies a high
degree of its manifestation (tab. 4).
The final results of the cluster analysis5
indicate the presence of distinct layers.
Having considered the quantitative indi-
cators of each of the clusters, we can conclude
that the defined layers represent the employees
typology (tab. 5).
The formation of workers typology under
the presented approach gives an opportunity
not only to identify the particular types of
population’s labour behaviour on the basis of
the strong and weak groups of labour motives,
to determine their characteristics related to
social status, but also to point out structural
changes in social development in future.
5 Result of summarizing the iterative process data.
Table 1. Question template: “For you, your work is, primarily, the way to…”
Components (variables)
Answer option
Completely agree Agree Difficult
to answerDisagree
Completely
disagree
1. Fend for myself (provide for my family) 5 4 3 2 1
2. Feel secure 5 4 3 2 1
3. Earn love 5 4 3 2 1
4. Earn respect, recognition 5 4 3 2 1
5. Bring out one’s personality potential 5 4 3 2 1
6. Achieve success 5 4 3 2 1
7. Make money 5 4 3 2 1
8. Build a career 5 4 3 2 1
9. Gain a sense of accomplishment 5 4 3 2 1
10. Acquire new knowledge 5 4 3 2 1
Source: hereinafter – Monitoring of the quality of labour potential of the Vologda Oblast population, ISEDT RAS.
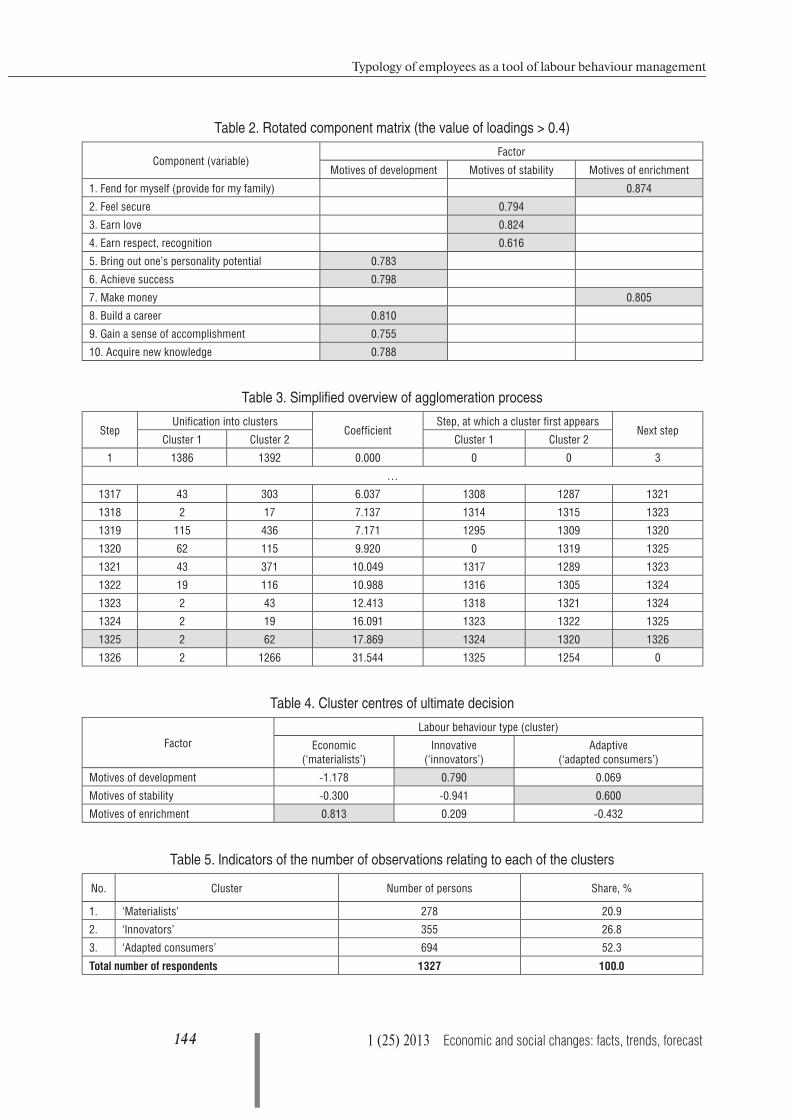
144 1 (25) 2013 Economic and social changes: facts, trends, forecast
Typology of employees as a tool of labour behaviour management
Table 3. Simplified overview of agglomeration process
Step Unification into clusters
Coefficient Step, at which a cluster first appears
Next stepCluster 1 Cluster 2 Cluster 1 Cluster 2
1 1386 1392 0.000 0 0 3
…
1317 43 303 6.037 1308 1287 1321
1318 2 17 7.137 1314 1315 1323
1319 115 436 7.171 1295 1309 1320
1320 62 115 9.920 0 1319 1325
1321 43 371 10.049 1317 1289 1323
1322 19 116 10.988 1316 1305 1324
1323 2 43 12.413 1318 1321 1324
1324 2 19 16.091 1323 1322 1325
1325 2 62 17.869 1324 1320 1326
1326 2 1266 31.544 1325 1254 0
Table 4. Cluster centres of ultimate decision
Factor
Labour behaviour type (cluster)
Economic
(‘materialists’)
Innovative
(‘innovators’)
Adaptive
(‘adapted consumers’)
Motives of development -1.178 0.790 0.069
Motives of stability -0.300 -0.941 0.600
Motives of enrichment 0.813 0.209 -0.432
Table 2. Rotated component matrix (the value of loadings > 0.4)
Component (variable)Factor
Motives of development Motives of stability Motives of enrichment
1. Fend for myself (provide for my family) 0.874
2. Feel secure 0.794
3. Earn love 0.824
4. Earn respect, recognition 0.616
5. Bring out one’s personality potential 0.783
6. Achieve success 0.798
7. Make money 0.805
8. Build a career 0.810
9. Gain a sense of accomplishment 0.755
10. Acquire new knowledge 0.788
Table 5. Indicators of the number of observations relating to each of the clusters
No. Cluster Number of persons Share, %
1. ‘Materialists’ 278 20.9
2. ‘Innovators’ 355 26.8
3. ‘Adapted consumers’ 694 52.3
Total number of respondents 1327 100.0

145Economic and social changes: facts, trends, forecast 1 (25) 2013
YOUNG RESEARCHERS A.V. Popov
The first type of employees comprises
individuals seeking to improve their financial
welfare (enrichment motives loading is 0.813).
The motives of stability and development are
insignificant for them, which makes it possible
to identify them as ‘materialists’ (their share in
the total population is 21%).
Representatives of the second type are
characterized by aspirations for personal
development and realization of their potential.
The enrichment motives are also of some
importance (0.209), which may be a reflection
of aspirations to build a career. The components
related to reasons of stability have a negative
loading and don’t exert any significant influence
on the respondents. Let us designate them as
‘innovators’.
The third type comprises the majority of
employees (52%). A significant component of
this type of labour behaviour is the motive of
stability (0.600). ‘Adapted consumers’ are least
of all interested in material values (-0.432), and
motives of their development are not stated
clearly (0.069).
Judging by the socio-demographic
characteristics of these types, the most
significant differences between them are
observed in the level of education. The majority
of ‘innovators’ and ‘adapted consumers’ have
higher or incomplete higher education (47%
and 38%, respectively; tab. 6).
‘Materialists’ are mostly represented by the
working population with a low level of education,
and especially the representatives of trade
occupations (54%; fig. 1).
It is noteworthy, that ‘innovators’ are do-
minated by young people (65%) and urban
population (59%). Thus, ‘innovators’ are a
group of young intellectuals with a wide range
of different professions working mainly in urban
areas.
Assessment of the quality of labour potential
of the considered types of workers illustrates
their hierarchy (fig. 2). So, the ‘innovators’
possess high-quality labour potential, which is
reflected by the integral index (social capacity
index), equal to 0.705 units.
‘Materialists’, on the contrary, have the
worst values of labour potential components
(except for mental health index). ‘Adapted
consumers’ reflect the general state of the
working-age population and occupy an
intermediate position between ‘innovators’ and
‘materialists’.
As the survey results prove, the second and
third types of employees show the best level of
labour potential realization than the first one
(tab. 7). It is necessary to note that in their
labour activity ‘adapted consumers’ use such
qualities as physical health (37%), knowledge,
erudition, qualification (37%) and creativity
(28%) to a greater extent, and ‘innovators’
Table 6. Comparison of the types in view of the socio-demographic
characteristics (in % of the number of respondents, 2012)
Criterion Group ‘Materialists’ ‘Innovators’ ‘Adapted consumers’
Territory
Vologda 24.1 23.1 25.8
Cherepovets 30.2 36.3 22.6
districts 45.7 40.6 51.6
Sex male 50.0 45.6 49.9
female 50.0 54.4 50.1
Age under 35 46.0 65.4 50.7
over 35 54.0 34.6 49.3
Education
lower than secondary 40.7 22.7 32.0
specialized secondary 29.5 30.6 29.7
higher and incomplete higher 29.8 46.7 38.3

146 1 (25) 2013 Economic and social changes: facts, trends, forecast
Typology of employees as a tool of labour behaviour management
Figure 1. Distribution of employees by the type of employment
(in % of the number of respondents, 2012)
36.224.0
53.8
13.621.2
11.9 14.912.7
11.9 9.313.3
8.326.028.8
14.8
0,0
10,0
20,0
30,0
40,0
50,0
60,0
70,0
80,0
90,0
100,0
Materialists Innovators Adapted consumers
OtherEngineering employeeRepresentative of intellectual professions not involved in productionOffice workerIndustrial worker
Figure 2. Quality of labour potential (2012)
* Social capacity index, units.
0.753
0.712
0.580
0.533
0.720
0.637
0.757
0.575
0.741
0.782
0.628
0.592
0.769
0.729
0.795
0.7020.7330.748
0.617
0.556
0.758
0.713
0.790
0.664
0,500
0,550
0,600
0,650
0,700
0,750
0,800
0,850
Physic
al hea
lth
Mental healt
h
Cognitiv
e potentia
l
Creativ
e poten
tial
Socia
l Skil
ls
Cultural le
vel
Moral and
ethic
leve
l
Need fo
r ach
ievemen
ts
Materialists (0.642*) Innovators (0.705*) Adapted consumers (0.683*)

147Economic and social changes: facts, trends, forecast 1 (25) 2013
YOUNG RESEARCHERS A.V. Popov
Table 7. Distribution of answers to the question: ‘How much do you
‘extend yourself’ at work? To what extent do you use your qualities and abilities?’
(answer option: ‘to the fullest’) (in % of the number of respondents, 2012)
Answer option ‘Materialists’ ‘Innovators’ ‘Adapted consumers’
Physical abilities and health 33.3 32.4 37.3
Psychological resistance 25.7 38.6 38.9
Knowledge, erudition, qualification 19.7 34.8 37.5
Creative abilities 11.4 23.4 27.9
Sociability, interpersonal skill 32.8 47.4 41.0
Manners and behaviour in general 28.0 40.3 38.2
Moral and ethic qualities 32.5 39.9 38.4
Desire to be promoted 12.5 30.0 30.5Average level 24.5 35.9 36.2
use such qualities as sociability (47%), good
manners and behaviour (40%) and moral and
ethic qualities (40%). This may be conditioned
not only by specific features of the performed
functions, but also by the working conditions
at a particular workplace.
Among the qualities, most often used by
‘materialists’, one can point out physical health
(33%), sociability (33%) and moral and ethic
qualities (32%). This is likely explained by the
essence of their employment. Only 11% of
representatives of this type use their creative
abilities to the fullest.
The analysis showed that the employees,
who have adapted to the modern economic
environment, bring out their potential to a
greater extent. Thus, ‘consumers’ and ‘inno-
vators’ are very eager to ‘extend themselves’
at work, which is reflected in their labour
contribution in the region’s economy (the
average level of labour potential implementa-
tion is 36%).
Considering wages and salaries as a measure
of employees’ labour input compensation, we
can point out that ‘adapted consumers’ are the
lowest-paying group. Their earnings reach
the top in about 11 – 15 years and account
for 13015.6 rubles (fig. 3). ‘Innovators’, on
the contrary, are distinguished by the greatest
earnings (peak falls on the employment term
of 6 to 10 years). The change in earnings with
an increase of employment term, as in the case
of ‘consumers’, doesn’t show any significant
negative deviations, i.e. the salaries and wages
tend to grow.
The remuneration of ‘materialists’ is
determined in many respects by the load of the
work performed. By realizing their physical
health potential to the greatest extent, they
are able to earn more in the beginning of their
career, than the representatives of other groups.
However, as the health deteriorates, they find it
more and more difficult to cope with labouring
work; consequently, the amount of earnings at
the end of their career accounts for 11889.5
rubles, which is the lowest figure among all
the types of employees. Therefore, the issue of
proper working conditions for ‘materialists’ is
a priority one [9, p. 609].
Having studied the characteristics of work
activities, we can state that ‘innovators’ show
the greatest labour activity. They hold the
leading positions by all the indicators reflecting
labour efficiency (fulfillment of performance
standards, production quality, labour-saving
activities) (fig. 4).
‘Materialists’ and ‘adapted consumers’ are
less active. The former are characterized mostly
by the in-time fulfillment of their tasks (53%)
and high-quality performance of their work
(44%), and the latter are distinguished by the
over-fulfillment of performance standards
(30%) and introduction of rationalization
proposals (14%).

148 1 (25) 2013 Economic and social changes: facts, trends, forecast
Typology of employees as a tool of labour behaviour management
Figure 3. Dependence of remuneration on the total employment term (2012)
8181.8
11753.3
12987.0
8347.5
17272.315868.6
10434.6
15126.3
11889.5
6000,0
8000,0
10000,0
12000,0
14000,0
16000,0
18000,0
Under 2 years 2-5 years 6-10 years 11-15 years 16-20 years over 20 years
Total employment term
Rubles
Materialists Innovators Adapted consumers
Figure 4. Distribution of answers to the question: ‘Which of the following characterizes
your work most accurately?’ (answer option: ‘it happens frequently’)
(in % of the number of respondents, 2012)
53.4
44.1
23.7
5.31.9 1.9 1.1
2.14.7
66.8
53.6
32.8
17.2
3.3
44.5
36.4
30.4
14.4
3.5 2.6 3.7
0,0
10,0
20,0
30,0
40,0
50,0
60,0
70,0
80,0
100%
fulfi
lmen
t of
perf
orm
ance
stan
dard
s
High
-qua
lity
wor
kfr
om t
he fi
rst
pass
Ove
r-fu
lfillm
ent
ofpe
rfor
man
cest
anda
rds
Intr
oduc
tion
ofra
tion
aliza
ton
prop
osal
s
Non-
fulfi
llmen
t of
perf
orm
ance
stan
dard
s
Wor
k co
llaps
e by
your
faul
t
Late
arr
ival
s,ab
senc
e fro
mw
ork,
leav
ing
wor
kah
ead
of ti
me
Materialists Innovators Adapted consumers

149Economic and social changes: facts, trends, forecast 1 (25) 2013
YOUNG RESEARCHERS A.V. Popov
It is worth noting that ‘materialists’ are
characterized by the best discipline among all
the types of employees.
The current labour activity can in many
respects be conditioned by the fact that some
of performed functions don’t correspond to the
professional qualities of employees. Among the
‘materialists’ the majority of respondents point
out that they don’t work within the specialty,
which they had obtained at professional
education institutions (48%; tab. 8). The given
circumstance is less typical for the remaining
two types of employees (their share in the total
population is 41%).
This can be explained by the fact that
‘materialists’ don’t work within their specialty
because of the poor working conditions offe-
red by employers; as for ‘innovators’ and
‘consumers’, there is a lack of demand for their
professions on labour market (33% and 38%,
respectively).
In general, we can point out that the jobs of
a great number of employees don’t correspond
either to their vocation, or their personal
qualities that are the subjective conditions of
successful labour activity (fig. 5).
It is ‘adapted consumers’ who find labour
market conditions most suitable to themselves.
Representatives of this group (60%) believe that
they work by vocation (this share is 48% among
‘innovators’ and 40% - among ‘materialists’).
Despite the importance of financial factors
when choosing a job (labour remuneration, the
company’s stability and social benefits; tab. 9),
the incentives of the different types of employees
vary considerably.
Figure 5. Compliance of the profession (main activity) with a person’s abilities,
inclinations and vocation (in % of the number of respondents, 2012)
Table 8. Distribution of answers to the question: ‘Do you work within
the specialty, obtained at a professional education institution (university,
technical school, college)?’ (in % of the number of respondents, 2012)
Answer option ‘Materialists’ ‘Innovators’ ‘Adapted consumers’
Yes 42.2 47.9 47.0
No 47.7 41.5 41.4
Didn’t obtain a specialty 10.1 10.6 11.6
60.6
47.8
40.2
70.067.2
57.0
30,0
40,0
50,0
60,0
70,0
80,0
Mat
eria
lists
Inno
vato
rs
Adap
ted
cons
umer
s
Mat
eria
lists
Inno
vato
rs
Adap
ted
cons
umer
s
Abilities and inclinations Vocation

150 1 (25) 2013 Economic and social changes: facts, trends, forecast
Typology of employees as a tool of labour behaviour management
As table 8 shows, financial factors play a
decisive role for ‘materialists’ and, in fact,
explain the choice of a job.
‘Innovators’ prefer to have the opportunity
for self-realization (38%), acquisition of new
experience, knowledge (38%) and promotion
(34%).
For ‘adapted consumers’ financial factors
are less important and non-material factors are
gaining importance as well as for ‘innovators’.
However, they point out a greater role of
independence and responsibility of decisions
(23%), the company’s proximity to the place of
residence (20%), the intensity of work (20%), etc.
No doubt, the relevance of certain factors
for different types of employees is reflected in
their views of the future as well (fig. 6).
Thus, ‘innovators’ possess high willingness
to entrepreneurial, creative and other activities,
which is expressed in the desire for spiritual
growth (33%), for establishing partner relations
in the work sphere (32%), for acquiring new
knowledge (29%), etc.
‘Adapted consumers’, as well as ‘innovators’
seek to make their work useful to people (22%),
work for the country’s welfare (18%) and
improve their qualification at the expense of
their own means (14%).
‘Materialists’, in turn, are distinguished by
labour passivity, which is reflected in the
pessimistic views on the prospects of professional
activity (tab. 10). Only 40% of the respondents
appreciate their relevance in the profession,
28% - the improvement of their qualification,
25% - decent salaries, etc.
‘Innovators’ and ‘adapted consumers’ are
in more favourable conditions. The development
of personal qualities leads to the fact that nearly
one person in two is confident in professional
growth.
Thus, the socio-status characteristics of
different types of labour behaviour have been
determined using the analysis of empirical data.
It has been revealed, that a large part of
working population in the Vologda Oblast are
conservative in their views and they require
sustainable, consistent development. Vologda
residents, which include the representatives
of all socio-demographic groups, have low
financial demands and, given comfortable
working conditions, are ready for professional
growth.
But not everyone is able to disregard the
amount of remuneration in favour of personal
development. ‘Materialists’ try, in general, to
satisfy their priority needs: to earn money and
Table 9. Distribution of answers to the question: ‘Which of the following is important to
you?’ (answer option: ‘very important’; in % of the number of respondents, 2012)
Answer option ‘Materialists’ ‘Innovators’ ‘Adapted consumers’
High remuneration 63,3 65,4 40,8
Company’s stability 39,7 48,2 34,8
Decent social benefits 37,5 47,0 32,5
Proximity to one’s place of residence 19,6 17,3 20,2
Promotion opportunities 10,5 34,4 22,9
Acquisition of new experience and knowledge 9,8 37,9 24,0
Opportunities to self-realization 8,7 38,4 23,3
High intensity of work 8,0 16,1 19,6
Self-sufficiency and responsibility of decisions 7,6 20,8 23,0
Company’s size 5,1 13,7 16,6
Company’s credibility / image 5,1 16,7 18,5
Participation in management issues 4,0 18,3 18,2
Note. The degree of relevance of each factor is marked in colour (green – high, yellow – moderate, red – low).

151Economic and social changes: facts, trends, forecast 1 (25) 2013
YOUNG RESEARCHERS A.V. Popov
provide for their families. As a rule, they are the
representatives of trade occupations with basic
and secondary education.
At the same time, the society has a layer of
highly motivated, enterprising people who can
sustain the region’s economy modernization.
These are mostly young, highly educated urban
intellectuals [2, p. 123].
The assessment of the actual situation and
prospects for each type of employees requires
consideration of their strong and weak points,
as well as opportunities and threats on the basis
of SWOT analysis (tab. 11).
Proceeding from the obtained results, a
differentiated system of measures for labour
intensification can be developed.
Figure 6. Distribution of answers to the question: ‘How eager are you to...?’
(answer option: ‘to the fullest’) (in % of the number of respondents, 2012)
Table 10. Distribution of answers to the question: ‘How do you evaluate your professional
prospects?’ (answer option: ‘highly’; in % of the number of respondents, 2012)
Answer option ‘Materialists’ ‘Innovators’ ‘Adapted consumers’
Demand for the profession 39.6 55.8 55.2
Improvement of one’s professional qualification 27.7 52.1 54.3
Decent remuneration 25.5 45.6 44.8
Self-realization in the profession 22.3 52.4 47.0
Promotion prospects 17.3 45.9 41.4
1.4
2.9
4.7
5.0
7.2
7.2
9.0
10.1
10,8
12.931.8
32.7
28.7
29.0
22.0
12.1
15.5
14.1
16.6
22.8
17.7
10.2
14.1
9.9
10.8
19.0
21.5
21.6
21.5
21.6
0 5 10 15 20 25 30 35
Set up one's own business, family business
Improve one's qualification using one's own means
Move to another settlement within the country with morefavourable working conditions
Learn a foreign language if necessary
Continuously acquire new skills and knowledge
Work for the country's welfare
Develop one's potential
Make oneself useful to others through one's work
Improve oneself spiritually and intellectually
Create partnership relations at work
Materialists Innovators Adapted consumers

152 1 (25) 2013 Economic and social changes: facts, trends, forecast
Typology of employees as a tool of labour behaviour management
Tabl e 11. SWOT analysis of employees typology
‘Materialists’
Strengths Weaknesses
Mental stability
Moderate labour activity
Consent to do ‘any’ work with an appropriate remuneration
Low creative activity
Priority of financial factors
Low level of education and general self-development
Low self-esteem and lack of interest in personal development
Absence of clearly formed plans for the future
Opportunities Threats
Creation of the layer of highly qualified personnel in trade
occupations
Poor professional prospects in labour sphere
Deterioration of economic situation in the region (country as a whole) can
result in marginalization of ‘materialists’
‘Innovators’
Strengths Weaknesses
Comprehensive development, high education level
High labour activity
Innovative / labour-saving approach to work
Desire for personal growth and well-being of the country
as a whole
High material incentive due to personal ambitions
Opportunities Threats
Excellent professional prospects: promotion, high level of
labour remuneration, etc.
Inability of the country (of the economy in particular) to meet the requirements
of ‘innovators’ may cause their migration to developed countries
‘Adapted consumers’
Strengths Weaknesses
High adaptability to modern economic conditions
Rationalization activities
Conformity of the chosen profession with their abilities
and vocation
Interest in work for the benefit of the country and society
Negligence in work
Significant part of their labour potential is in a state of ‘conservation’
Opportunities Threats
Wide employment opportunities (mainly due to the fact
that remuneration doesn’t play a decisive role)
Actual measures aimed at stimulating professional growth
can become a factor of transforming ‘consumers’ into
‘innovators’
Destabilization of economic, political and other spheres can lead to disorders
(strikes, protest actions, etc.)
Absence of actual measures of personal activity stimulation may become
a factor causing the development of labour passivity
‘Materialists’:
• modernization of personnel training
system;
• maximum balancing of the demands of
labour market and professions that specialists
get; enhancement of activities of employment
agencies and career guidance systems for young
people;
• establishment of safe working conditions,
health care and work efficiency of employees;
• improvement of the system of labour
remuneration in the private sector of economy
(the possibility of increasing salary depen-
ding on labour efforts, fairness in payment,
conformity of payments with the labour
contribution of an employee, etc.) [7, p. 172].
‘Innovators’:
• assistance in the establishment of la-
bour performance standards and the creation
of favorable conditions for the realization
of population’s creative potential, especially
in the fields of science, culture and educa-
tion;
• provision of decent financial conditions
to the representatives of creative professions
(teachers, researchers), promotion of
rationalization activities, social guarantees
and measures for copyright protection;
• creation of favorable conditions for the
development of small and medium-sized
businesses, promotion of innovation entre-
preneurship [3, p. 54].

153Economic and social changes: facts, trends, forecast 1 (25) 2013
YOUNG RESEARCHERS A.V. Popov
‘Adapted consumers’:
• provision of continuing professional
education, which implies multi-level stage-wise
training;
• standard increase of the importance of
a practical part in the training for all education
levels;
• promotion of actual participation
of employees in production manage-
ment;
• adoption of a regional policy of
quality management, aimed at improving
the quality, of both the outcome and process
of work.
References1. Vikhanskiy O.S., Naumov A.N. Management: textbook. 4th ed. Moscow: Ekonomist, 2006.
2. Lastochkina M.A. Socio-cultural types of population in the region. Economic and social changes: facts, trends,
forecast. 2012. No. 4. P. 99-106.
3. Leonidova G.V., Popov A.V. Social portrait of the creative population in the Vologda Oblast. Problems
of development of territories. 2012. No. 2. P. 45-55.
4. Modernization of Russia: socio-humanitarian dimensions: monograph. Ed. by. N.Ya. Petrakov. Saint Petersburg:
Nestor-Istoriya, 2011.
5. Naumova, S.A. Typology of employees: management issues. Sociological studies. 1991. No. 2. P. 60-65.
6. Temnitskiy A.L. Theoretical and methodological approaches to the study of labour behaviour. Sociological
studies. 2007. No. 6. P. 60-71.
7. Chekmaryova Ye.A. Rising in labour potential: the role of wages. Economic and social changes: facts, trends,
forecast. 2011. No. 2. P. 165-172.
8. Maslow A. Motivation and personality. 3rd ed. Pearson, 1997.
9. Oliva-Moreno J. Loss of labour productivity caused by disease and health problems: what is the magnitude
of its effect on leading Spain’s Economy? The European journal of health economics. 2012. Vol. 13. No. 5.
P. 605-614.

154 1 (25) 2013 Economic and social changes: facts, trends, forecast
YOUNG RESEARCHERS
UDC 338.43(470.12)
LBC 65.32-21(2Рос-4Вол)
© Mironenko N.V.
Tools for state regulation of the region’s agricultureThe article analyzes the issues of providing state support to agricultural enterprises in the Vologda
Oblast. It classifies its municipal districts according to the production potential of agriculture. On this
basis, the article proposes the ways of reducing the differentiation of the districts according to the level
of their capacity development by using the tools of budget support, lending, leasing, and insurance.
Furthermore, the article provides calculations of their efficiency.
Vologda Oblast, branch of agriculture, typological classification of municipal entities, territorial
differentiation, tools of financial support.
The research [1, 2, 3, 4, 5, 6] shows that the
four central districts of the Vologda Oblast:
Vologodsky, Gryazovetsky, Sheksninsky and
Cherepovetsky have the most developed
agricultural production in the oblast. Their
agricultural enterprises, possessing 32%
of the total agricultural land in the oblast,
produce about 73% of the total volume of
agricultural production. All these enterprises
are provided with advanced equipment and
machinery, highly qualified personnel and,
as a consequence, they enjoy high crop
yield, animal productivity and relatively high
financial performance. Accounting for the
remaining 27% of the volume of agricultural
production, the rest twenty-two districts are
characterized by a high share of unprofitable
enterprises, in which the number of employees,
number of livestock, agricultural areas, volume
of agricultural production have been decreasing
significantly.
These problem economic entities incur
great losses resulting from the increase in prices
for the tariffs, services and products of the
sector. If their deferred debt were included
in the performance evaluation system, such
enterprises would fall within the bankruptcy law.
This is mainly the result of unsatisfactory state
regulation in the development of agricultural
production. Due to the limited amount of
available financial resources, investments are
made primarily in the agricultural enterprises
of the four leading districts. The data in table 1
indicates that over the 5 years of the analyzed
period (2006 – 2010), the oblast’s leading
districts has accounted for more than 65% of
the amount of state financial support.
They account for over 80% of the amount
of all the taxes paid. In this case, the return in
the form of paid taxes in these districts more
than 1.5 – 2.5-fold exceeds the government
investment in them.
Natalia V.MIRONENKOLecturer at the Finance and Credit Department of the Vologda State
Technical University

155Economic and social changes: facts, trends, forecast 1 (25) 2013
YOUNG RESEARCHERS N.V. Mironenko
Thus, the state financial support for
agricultural producers is an essential prere-
quisite and primary measure of state regulation,
along with other conditions of the sector’s
development.
We consider that the typological classification of the oblast’s municipal entities according to the level of support provided for the development of their production potential can contribute to the elimination of territorial differentiation in the development of agricultural production.
Municipal entities can be classified accor-
ding to the condition and utilization of their
agricultural potential [8].
This requires grouping the municipal
formations by two criteria: the level of available
resources and the performance results, and then
comparing them.
The list of criteria for grouping the region’s
municipal entities by the level of available
resources should include indicators cha-
racterizing the level of all factors used in the
production, including the number of workers
employed in agricultural production, the
volume of production assets, energy facilities,
and financial resources. We worked out the
classification based on the following indicators:
- number of workers employed in
agriculture per 100 ha of agricultural land,
pers./ha;
- provision of agricultural enterprises with
fixed assets, thousand rubles/ha;
- capital/labour ratio, thousand rubles/
pers.;
- number of cattle per 100 ha of agricultural
land, head/ha;
Table 1. Share of the leading districts of the Vologda Oblast
in the general indicators of the oblast in 2006 – 2010, % [7]
Indicators Year Deviation of 2010
from 2006, p.p.2006 2007 2008 2009 2010
Share in general indicators
In the total area of agricultural land 32 33 32 35 36 4
In the average annual number of employees engaged in
agricultural production
54 55 57 57 59 5
In the total value of fixed assets by the end of the year 69 68 64 67 65 -4
In the total amount of production facilities 51 53 51 52 55 4
In the total number of cattle 53 53 53 55 56 3
In the total number of agricultural enterprises 28 30 29 30 32 4
Share of investments in the leading districts
In the total volume of state financial support 62 65 67 69 64 2
In the total sum of subsidizing of interest rates on investment
and attracted loans
90* 78 79 76 75 -15 **
In the total sum of crop insurance subsidies 53* 68 74 86 100 47 **
In the total number of machinery leased by the agricultural
enterprises
n.a. 56 39 69 63 7 ***
Share of return from the leading districts
In the total amount of taxes paid (taking into account
individual income tax)
78 78 77 78 79 1
In the total amount of taxes paid (regardless of individual
income tax)
79 80 79 80 80 1
In the total volume of gross output 75 73 73 74 76 1
In the total volume of commercial output 74 72 70 73 73 -1
In the total amount of revenues 59 66 61 76 71 12
* For 2005.
** Deviation of 2010 from 2005.
*** Deviation of 2010 from 2007.
Source: calculated on the basis of the data of the Vologda Oblast Department of Agriculture, Food Stocks and Trade.

156 1 (25) 2013 Economic and social changes: facts, trends, forecast
Tools for state regulation of the region’s agriculture
- provision with energy, HP per 100 ha of
agricultural land, HP/ha;
- application of mineral fertilizers per 1
ha of crops, kg of application rate/ha;
- volume of subsidies and compensations
from the budgets of all levels to the oblast’s
districts per 100 ha of agricultural land,
thousand rubles/ha.
A multivariate comparative estimation
(MCE) of each of the seven factors according
to the results of 2010 was carried out in advance
for each municipality. According to the
methodology of G.V. Savitskaya [9], this
assessment is carried out according to the
following algorithm. First, the standard value
(maximum or minimum depending on the
nature of the indicator) is determined for
each of these indicators. Then, the so-called
standardized coefficients reflecting the ratio
of the reference indicator to the indicator for
each district of the region, raised to the second
power, are calculated for each unit of the set.
Further on, squared standardized coefficients
for each unit are summed up and the square
root is taken from the sum, the result is the value
of the multivariate comparative estimation.
The results of these calculations are
presented in table 2 and figure 1.
The highest value of the multivariate
comparative estimation corresponds to the best
unit in the selected list of indicators, and the
lowest value – to the worst unit, accordingly.
By the level of resources available for
agricultural production, the oblast’s districts,
as the table shows, are divided into three groups:
1) below average; 2) average; 3) above average.
About half of the municipalities (12 units) are
included into the first group, with the availability
of resources for agricultural production below
average. At the same time, the availability of
resources is above average in five districts.
We used indicators, characterizing agri-
cultural production efficiency for grouping
according to the performance results of agricultural
enterprises in municipal entities. The list of
these indicators is as follows:
• yield of grain crops (harvested area),
centners/ha;
Table 2. Grouping of the Vologda Oblast’s municipal districts by the level
of resources availability for agricultural production, 2010
Level of resources availabilityValue of MCE,
units
Number of districts,
unitsDistrict and its rating according to MCE*
1. Below average Under 0.99 12 15) Ust-Kubinsky,
16) Vashkinsky, 17) Tarnogsky,
18) Belozersky, 19) Babayevsky,
20) Kichmengsko-Gorodetsky,
21) Nikolsky,
22) Vytegorsky, 23) Babushkinsky,
24) Vozhegodsky, 25) Syamzhensky,
26) Nyuksensky
2. Average From 0.99 to 1.40 9 6) Sheksninsky,
7) Mezhdurechensky,
8) Velikoustyugsky,
9) Totemsky, 10) Chagodoshchensky,
11)Kirillovsky,
12) Verkhovazhsky, 13)Kharovsky,
14) Sokolsky
3. Above average Over 1.40 5 1) Vologodsky, 2)Cherepovetsky,
3) Kaduysky, 4) Ustyuzhensky,
5) Gryazovetsky
Total 26
* MCE – multivariate comparative estimation; see fig. 1.

157Economic and social changes: facts, trends, forecast 1 (25) 2013
YOUNG RESEARCHERS N.V. Mironenko
Figure 1. Rating of the oblast’s municipal districts according to MCE, characterizing
their provision with resources for agricultural production, 2010
0,00
0.50
1.00
1.50
2.00
2.50
1 2 3 4 5 6 7 8 9 10 11 12 13 14 15 16 17 18 19 20 21 22 23 24 25 26
Rating of districts
МСE
• average milk yield per 1 cow, kg;
• fat content of milk, %;
• production of milk per 100 ha of
agricultural land, centners/ha;
• volume of cattle and poultry sales per
100 ha of agricultural land, centners/ha;
• yield on capital investments, rubles/100
rubles;
• average monthly salary of employees,
rubles.;
• labour productivity (gross agricultural
output in comparable prices of 1994 per one
worker, thousand rubles/pers.;
• profitability of products with subsi-
dies, %;
• share of profitable (cost-effective) farms
in the total number of farms in the district, %.
The distribution according to the perfor-
mance results was different from the distribu-
tion according to the availability of resources.
However, the same districts, Vologodsky, Chere-
povetsky and Gryazovetsky, headed the list.
Judging by table 3, which consolidates the
classification results, the districts are divided
into 9 groups. However, due to similarity in the
characteristics of some districts, they can be
divided into five types (fig. 2).
Final distribution of the Vologda Oblast’s
municipal districts by the type of production
potential is represented in table 4.
Table 5 describes activities aimed at impro-
ving state regulation of agricultural production
in municipal districts depending on their type.
These activities cover the issue of state regulation,
including the formation of prices for agricultural
products, budgetary investments, compensations
and subsidies, loans. Special attention, in our
viewpoint, should be paid to the creation of
agricultural insurance system. For financing
the activities stated above, we propose to create
an Oblast Fund for support to agricultural produ-
cers. The procedure for the fund’s formation can
be entrusted to the Vologda Oblast Department
of Agriculture, Food Stocks and Trade.

158 1 (25) 2013 Economic and social changes: facts, trends, forecast
Tools for state regulation of the region’s agriculture
Table 3. Results of typological classification of the Vologda Oblast’s districts according
to the level and degree of utilization of agricultural production potential
Level of available resourcesLevel of obtained results
Below average Average Above average
Below average 1. Ust-Kubinsky
2. Vashkinsky
3. Tarnogsky
4. Belozersky
5. Babayevsky
6. Kichmengsko-Gorodetsky
7. Vytegorsky
8. Babushkinsky
9. Vozhegodsky
10. Syamzhensky
11. Nyuksensky
Nikolsky
Average 1. Totemsky
2. Chagodoshchensky
3. Kirillovsky
4. Verkhovazhsky
5. Kharovsky
1. Sheksninsky
2. Mezhdurechensky
3. Velikoustyugsky
4. Sokolsky
Above average Kaduysky Ustyuzhensky 1. Vologodsky
2. Cherepovetsky
3. Gryazovetsky
Figure 2. Representation of groups and types of municipal districts according
to the level and degree of utilization of agricultural production potential
Level of resourcesLevel of results
Below average Average Above average
Below average 1 2 3
Average 4 5 6
Above average 7 8 9
– 1 type – 2 type – 3 type – 4 type – 5 type
Let us consider in more detail the above
mentioned tools of state regulation.
Insurance. It is necessary to introduce a
system of compulsory crop insurance at the
federal level. Consequently, insurance tariffs
will be lower and enterprises will be able to
carry out wide-scale agricultural insurance.
At the oblast level it is proposed to carry
out livestock insurance with the use of
the oblast budget funds. At present, the
voluntary insurance of farm animals is not
carried out due to the fact that agricultural
enterprises lack financial resources for the
implementation of production activity (crop
insurance is effected to a very limited extent
for the same reason).
There are exceptions in cases related to
receiving loans when the insurance of animals,
presented in the form of security, is carried out
upon the request of the bank. We suggest
that animals should be insured in OJSC
Rosgosstrakh, as it has low insurance rates. In
addition, the sum of unconditional franchise
(the policyholder’s losses that are not subject to
compensation by the insurer under the insurance
terms, [10]) is minimal (not more than 1%).
Insurance terms and conditions are as follows.
Insurance should cover the full package of risks.
The tariff rate in this case is 0.97% of the sum
insured. According to Rosgosstrakh, enterprises
insure livestock animals mainly in the range of
40% up to 60% of the insurance value.
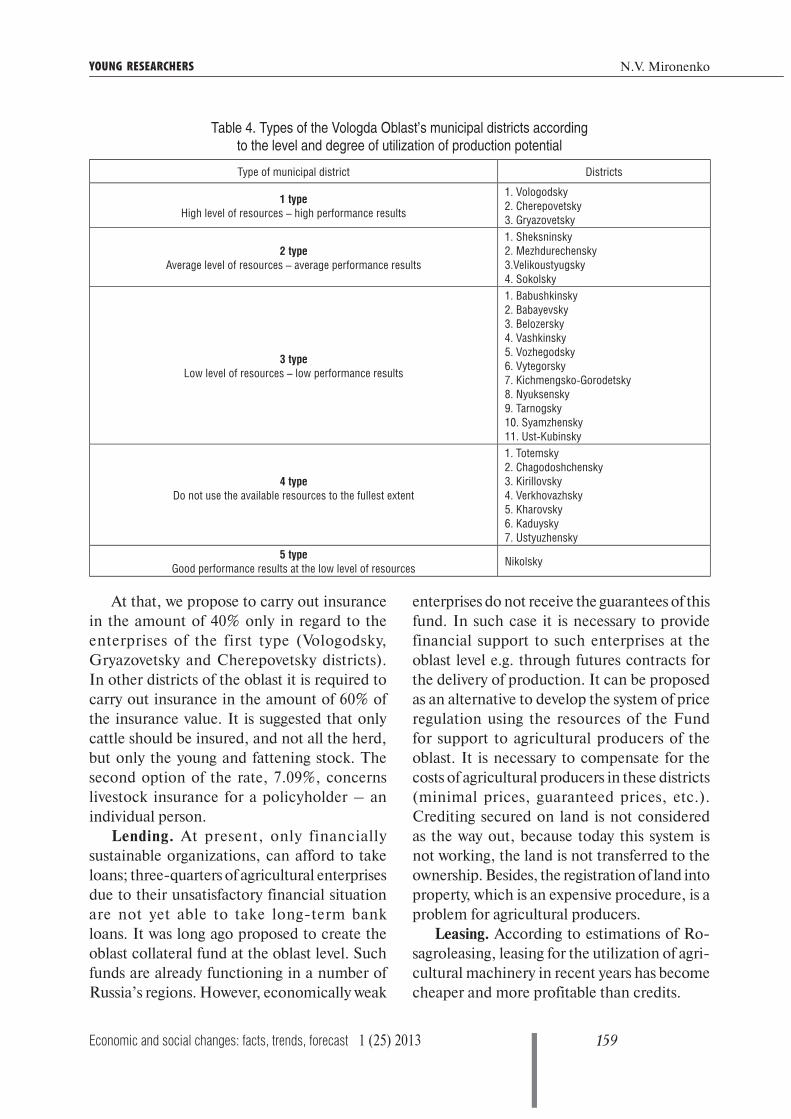
159Economic and social changes: facts, trends, forecast 1 (25) 2013
YOUNG RESEARCHERS N.V. Mironenko
Table 4. Types of the Vologda Oblast’s municipal districts according
to the level and degree of utilization of production potential
Type of municipal district Districts
1 typeHigh level of resources – high performance results
1. Vologodsky
2. Cherepovetsky
3. Gryazovetsky
2 typeAverage level of resources – average performance results
1. Sheksninsky
2. Mezhdurechensky
3.Velikoustyugsky
4. Sokolsky
3 typeLow level of resources – low performance results
1. Babushkinsky
2. Babayevsky
3. Belozersky
4. Vashkinsky
5. Vozhegodsky
6. Vytegorsky
7. Kichmengsko-Gorodetsky
8. Nyuksensky
9. Tarnogsky
10. Syamzhensky
11. Ust-Kubinsky
4 typeDo not use the available resources to the fullest extent
1. Totemsky
2. Chagodoshchensky
3. Kirillovsky
4. Verkhovazhsky
5. Kharovsky
6. Kaduysky
7. Ustyuzhensky
5 typeGood performance results at the low level of resources
Nikolsky
At that, we propose to carry out insurance
in the amount of 40% only in regard to the
enterprises of the first type (Vologodsky,
Gryazovetsky and Cherepovetsky districts).
In other districts of the oblast it is required to
carry out insurance in the amount of 60% of
the insurance value. It is suggested that only
cattle should be insured, and not all the herd,
but only the young and fattening stock. The
second option of the rate, 7.09%, concerns
livestock insurance for a policyholder – an
individual person.
Lending. At present, only financially
sustainable organizations, can afford to take
loans; three-quarters of agricultural enterprises
due to their unsatisfactory financial situation
are not yet able to take long-term bank
loans. It was long ago proposed to create the
oblast collateral fund at the oblast level. Such
funds are already functioning in a number of
Russia’s regions. However, economically weak
enterprises do not receive the guarantees of this
fund. In such case it is necessary to provide
financial support to such enterprises at the
oblast level e.g. through futures contracts for
the delivery of production. It can be proposed
as an alternative to develop the system of price
regulation using the resources of the Fund
for support to agricultural producers of the
oblast. It is necessary to compensate for the
costs of agricultural producers in these districts
(minimal prices, guaranteed prices, etc.).
Crediting secured on land is not considered
as the way out, because today this system is
not working, the land is not transferred to the
ownership. Besides, the registration of land into
property, which is an expensive procedure, is a
problem for agricultural producers.
Leasing. According to estimations of Ro-
sagroleasing, leasing for the utilization of agri-
cultural machinery in recent years has become
cheaper and more profitable than credits.

160 1 (25) 2013 Economic and social changes: facts, trends, forecast
Tools for state regulation of the region’s agriculture
Table 5. Proposals for enhancing state regulation of the activities of agricultural
enterprises according to the types of the Vologda Oblast municipalities
Type of municipal entity Brief description of district types Proposed activities
1 type
Agricultural enterprises in these
districts are better adapted to
market conditions and they use
the available production potential
rationally. But their performance
can be higher, if they are provided
with additional resources.
These enterprises are suitable for investments, as the funds that are
already at their disposal, produce economically successful results.
In addition to the existing system of state support, it is proposed to
carry out livestock insurance in the amount of 40% of the insurance
value at the expense of oblast budget funds, to promote innovations
implementation and to carry out lending with the participation of the
oblast government.
2 type
The enterprises of this group are
characterized by the average level
of provision with resources, which
hinders the achievement of better
results.
In order to get better performance results, the agricultural
enterprises of this group should receive financial investments,
which will contribute to the renewal of fixed assets. In addition to the
already applied tools of state regulation, it is also proposed to insure
livestock in the amount of 60% of the insured value at the expense
of the oblast budget.
3 type
The enterprises of this group have
a very low production potential.
Agricultural production in such
conditions is unprofitable. Additional
funding of such enterprises can turn
out useless.
These enterprises can be recommended to develop other directions
of activities. It is necessary to take into account social importance
of the enterprises included in this group. Gaining profit, as well as
preserving agricultural production should become strategic goals.
That is why it is only small enterprises that can be shut down or
oriented toward other activities; and large enterprises require the
development of specific action programmes. In addition to the
already utilized tools of state support, it is proposed to insure
livestock in the amount of 60% of the insured value at the expense
of the oblast budget.
4 type
The two most likely reasons for the
current situation in such enterprises
include flaws in their industrial and
organizational structures and poor
performance of the department
distributing the manufactured
products.
The enterprises of this type should improve the structure of
production and organization of management, and implement the
achievements of advanced farms. Such enterprises should be given
an opportunity to insure livestock at the expense of the oblast budget
in the amount of 60% of the insured value.
5 type
Such enterprises should strengthen
their production facilities. But in
this case, not only material and
financial support, but also active
innovation activity is necessary.
In addition to strengthening their material base by the infusion of
investments and innovations, this group of farms requires state
support in the form of higher purchase prices for agricultural
products or special compensations. Besides state support, it is
proposed to carry out insurance of livestock in the amount of 60%
of the insured value at the expense of the oblast budget.
For farms of all types we propose to implement, besides the existing system of subsidies, the compensation of losses at the expense of
the Oblast Fund for support to agricultural producers. It is proposed to compensate the losses on the sales of milk and cattle meat through
the establishment of guaranteed prices.
However, only financially sustainable
enterprises have an opportunity to conclude
agreements on the delivery of machinery and
equipment for lease. Banks do not cooperate
with economically weak farms. It is suggested
that the Oblast Fund for support to agricultural
producers should allocate funds to the
enterprises of the 3 and 5 types so that they could
purchase the necessary equipment (to create
machine and tractor fleets (MTF) in some
districts) and use it. In the course of the study,
conditional calculations were made concerning
the volume of the expenses necessary for the
formation of MTF. In particular, according
to the all-Russian agricultural census data of
2006, the performance of agricultural activities
in the Vologda Oblast required the employment
of machinery and equipment of third-party
organizations. The number of attracted
equipment for one organization was 3 tractors
and 2 combine harvesters (in the period from
1 July till 30 June of the following year) [11].

161Economic and social changes: facts, trends, forecast 1 (25) 2013
YOUNG RESEARCHERS N.V. Mironenko
According to the information of the Vologda
Oblast Department of Agriculture, 85 such
organizations functioned in the 11 districts of
the 3rd type in 2010. In addition, it is suggested
that the MTF Fund should include the
machinery and equipment for Nikolsky
district, falling into the 5th type in 2010.
This is explained by the fact that this district
has a very low level of resources. The total
number of enterprises including Nikolsky
district was 93 units in 2010. Therefore, the
total amount of equipment required for the
establishment of MTF, is 279 tractors and
186 combine harvesters. The ratio of forage
harvesters to grain harvesters (46% and 54%,
respectively) was calculated on the basis of the
2010 data provided by the oblast Department
of Agriculture; i.e. 87 forage harvesters and 99
grain harvesters will be required. According to
Rosstat, the average cost of a tractor is 2 million
rubles, a grain harvester costs 5 million rubles, a
forage harvester – from 2 up to 4 million rubles.
The maximum price of 4 million rubles was
chosen for the calculations. Therefore, the total
amount of funding required for the formation
of MTF, according to our calculations, is
1401 million rubles. Tractors for MTF were
chosen with the drawbar category 1.4, which
corresponds to the capacity of 80 – 130 HP,
since, according to the census, the share of such
tractors in the oblast accounts for about 70% of
the total tractor fleet.
The economic benefit from the imple-
mentation of the proposed activities will be
expressed in the observance of scheduled time-
frames of all agricultural works by the enterprises,
in reducing downtime due to breakdown of the
equipment, in the growth of total energy supply
and energy potential by more than 9%.
Subsidies for livestock production. A system
of guaranteed prices for the sold milk and meat
of cattle in live weight was proposed and
developed in view of the foreign experience of
prices introduction [13, 14, 15]. These prices
take into account the required minimum
profitability level (in the amount of 15%) for the
further development of agricultural production.
The amount of additional payments (the
amount of subsidies) was determined on
the basis of conducted calculations. The
calculations were made according to two
options. The difference between them lies in
the fact that in the second option no additional
payments were effected when selling cattle
meat to the enterprises of the 1st type. This
is explained by their greater financial stability
and a greater amount of subsidies in the total
distributed volume. If the amount of financial
resources is limited, the additional payments
by this indicator are unnecessary.
The total economic impact from the
activities on the insurance of farm animals and
the establishment of guaranteed prices for the
sold milk and meat of cattle will be as follows:
in case of the first option, the total amount
of additional payments will be 1 053 285.7
thousand rubles, in the second case – 527 373.8
thousand rubles. At that the profitability of
primary activity of agricultural enterprises
in the oblast in general will increase by 8.7
and 4.4 percentage points, respectively. If we
determine the economic impact only from the
introduction of guaranteed prices for milk and
livestock insurance, then the profitability in the
oblast in general will increase by 1.2 percentage
points.
As the economic impact is not reduced to
the indicators of profitability alone, we
considered it possible to estimate changes
according to other indicators. In particular,
we calculated the increase in revenue per each
ruble of additional investments. At that, we
didn’t take into account the amount of funding
allocated for the creation of machine and
tractor fleet, since it remains the property of
the oblast, and considering livestock insurance,
we took into account the amount of received
insurance benefits.

162 1 (25) 2013 Economic and social changes: facts, trends, forecast
Tools for state regulation of the region’s agriculture
The pair correlation was worked out
between state financial support (x) and sales
revenue (y) based on the data of the oblast
Department of Agriculture. The analyzed
period was 12 years (from 1999 to 2010).
Regress ion equat ion was as fol lows:
Y = 6.228х + 2502.2. The coefficient of
determination was R2 = 0.8407, which indi-
cates that the equation is statistically signifi-
cant. Therefore, each ruble of the investments
leads to an increase in revenues by 6.23 rubles.
This indicator has been calculated for the
oblast as a whole. Further, using the method of
forecasting from the general to the particular,
we estimated the growth in revenues for each
municipality and the oblast as a whole, the
growth of labour productivity, as well as the
aggregated PSE.
The economic benefit from the imple-
mentation of the proposed activities for the
oblast in general will be as follows (tab. 6):
• increase in revenue growth rates and
labour productivity up to 7.34 percentage
points per year;
• improvement in the profitability of the
main activities up to 8.7 p.p. per year.
The implementation of the above recom-
mendations will facilitate the equalization of
business environment, the elimination of
disparities in socio-economic development of
the districts by enhancing the performance of
agricultural organizations.
References1. Sovetova N.P., Sovetov P.M. “Market failures” and state support of the development of agriculture. University
science – to the region: materials of the 6th all-Russian scientific and technical conference: in 2 volumes. Vologda:
VSTU, 2008. Vol. 2. P. 183-186.
2. Chekavinskiy A.N. Region agrarian and industrial complex: lessons of reforming and conclusions for prospect.
Economic and social changes: facts, trends, forecast. 2011. No. 3 (15). P. 130-138.
3. Anishchenko N.I., Ivanova M.N., Bilkov V.A. Agriculture of the Vologda Oblast on the eve of Russia’s accession to
the World Trade Organisation. Economic and social changes: facts, trends, forecast. 2012. No. 3 (21). P. 107-116.
Table 6. Calculation of economic benefit from the implementation of proposed
activities for the oblast in general, in the prices of 2010
IndicatorsActual value,
2010Project (1 option)
1. Amount of the state financial support (subsidies and compensations) without
taking into account the creation of MTF, thousand rubles 1474222 2527507.7
2. Increase of the amount of state financial support, thousand rubles, including: х 1053285.7
in the sector of milk production and distribution х 88490
in the sector of production and distribution of cattle meat in live weight х 905474.6
in the sector of livestock insurance (compensation) х 59321.1
3. Increase of the amount of state financial support, including:
absolute increase, thousand rubles х 1053285.7
increase rate, % х 71.45
4. Sales revenue, thousand rubles 12758247 13694928
5. Revenue increase, including:
absolute increase, thousand rubles х 936681
increase rate, % х 7.34
6. Labour productivity as calculated per one employee engaged in agricultural
production, rubles per person641859.8 688983.6
7. Labour productivity increase:
absolute increase, rubles/person х 47123.8
increase rate, % х 7.34
8. Profitability of the main activities, % 6.5 15.2
163Economic and social changes: facts, trends, forecast 1 (25) 2013
YOUNG RESEARCHERS N.V. Mironenko
4. The main directions of the development of the Vologda Oblast’s agro-industrial complex for the period of 2006
– 2010: oblast target programme: Decree of the Vologda Oblast Government dated August 30, 2005 No. 960.
Available at: http://www.consultant.ru
5. Mironenko N.V., Fyodorova V.V. Estimation of modern condition of financing of the agricultural sector in the
Vologda Oblast. Problems of strategy and tactics of regional development: proceedings of the 5th Russian scientific-
practical conference, Vologda, 25 – 27 January 2006. Part 2. Vologda: VSCC CEMI RAS, 2006. P. 351-357.
6. Mironenko N.V. The role of state financial support of agricultural enterprises in the Vologda Oblast. University
science – to the region: materials of the 6th all-Russian scientific and technical conference: in 2 volumes. Vologda:
VSTU, 2008. Vol. 2. P. 105-108.
7. Statistical yearbook of the Vologda Oblast of 2011: stat. coll. Vologdastat. Vologda, 2012.
8. Kostyleva L.V. Classification of municipal entities of the Vologda Oblast according to the degree of the use of
socio-economic potential. Problems of strategy and tactics of regional development: proceedings of the 5th
Russian scientific-practical conference “Strategy and tactics of implementation of socio-economic reforms:
regional aspect”. Vologda, 2006. Part 2. P. 186-193.
9. Savitskaya G.V. Theory of the analysis of economic activity: textbook. Moscow: INFRA-M, 2007. P. 74-76.
10. Rayzberg B.A., Lozovskiy L.Sh., Starodubtsev a Ye.B. Modern economic dictionary. 6th revised edition. Moscow:
INFRA-M, 2008.
11. The main results of the all-Russian agricultural census of 2006. The results of the Vologda Oblast. Vologdastat.
Vologda, 2008.
12. The guidelines of the requirements of the agro-industrial complex for the equipment for crop and livestock.
Official Internet-portal of the Ministry of Agriculture of the Russian Federation. Available at: http://www.mcx.
ru/Министерство/Департаменты
13. Nazarenko V.I. Forms and directions of the state support of agriculture in the West. Economics of agricultural
and processing enterprises. 2007. No. 3. P. 10-13.
14. Nazarenko V.I. Forms and directions of the state support of agriculture in the West. Economics of agricultural
and processing enterprises. 2007. No. 4. P. 16-18.
15. Nazarenko V.I. Forms and directions of the state support of agriculture in the West. Economics of agricultural
and processing enterprises. 2007. No. 5. P. 15-17.

164 1 (25) 2013 Economic and social changes: facts, trends, forecast
YOUNG RESEARCHERS
UDC 338.23:338.45(470.12)
LBC 65.30-18 (2Rus-4Vol)
© Mazilov Ye.A.
Industrial policy as a mechanism of regional developmentThe article reveals the essence of industrial policy and determines its role in ensuring the region’s
sustainable development. Furthermore, it substantiates the importance of industrial policy in the
rationalization of the region’s economy structure and enhancement of its performance. The article
also proposes an algorithm for the development of active regional industrial policy.
Region, strategic planning, industrial policy.
Yevgeniy A.MAZILOVISEDT RAS Junior Scientific Associate
Industry is the most important part of
national economy. Its share in the Vologda
Oblast accounted for 44.2% of GRP in 2010
[10]. The industrial complex, among all the
branches, is capable of creating the greatest
volume of products with the highest value
added.
Meanwhile, the industry has been expe-
riencing the most acute consequences of
market reforms of the domestic economy. Over
the last eleven years the volume of industrial
production in the Vologda Oblast increased
by only 36%, while in Russia as a whole it
grew 1.5-fold, and in the North-Western
Federal District – almost twice (fig. 1). The
characteristic features of the region’s industrial
complex included the slowdown of positive
changes in its structure, the stagnation in the
level of economic efficiency and exposure to
external and internal negative trends.
The industrial complex structure in 2000
– 2011 was still based on metallurgy (tab. 1).
The 2009 – 2011 period witnessed some
reduction of its share caused by the decrease in
production volumes, as well as in demand and
prices for metal products in the world markets.
The share of industries and, first of all,
mechanical engineering, producing high-tech
products, accounts for only 3%. The share of
such an important industrial branch, as
woodworking industry decreased 2-fold in 2011
as compared to 2000, and as for light industry,
its share accounted for less than 1% in 2011.
Unsustainable industrial development is
confirmed by other indicators as well. Thus,
the output profitability for the oblast in 2009
proved to be lower than the national average
(fig. 2). It remained low even in 2011, when
the economy was recovering after the financial
crisis.
The consumption of fixed capital is still
extremely high. The volume of investments in
the fixed capital of enterprises in 2005 – 2011
reduced almost twice. The share of those
employed in the industry in the total number
of economically active population is decreasing

165Economic and social changes: facts, trends, forecast 1 (25) 2013
YOUNG RESEARCHERS Ye.A. Mazilov
Table 1. Structure of industrial complex in the Vologda Oblast in 2000 – 2011, %
Branch of industry 2000 2005 2007 2009 2010 2011Absolute deviation
of 2011 from 2000
Metallurgical 68 72.0 69.8 59.9 63.2 62.5 -5.5
Chemical 9 9.3 10.0 15.5 19.3 19.7 10.7
Food processing 5 6.4 6.0 9.5 7.0 7.1 2.1
Mechanical engineering 3 4.3 5.7 5.5 2.9 3 0
Woodworking 6 4 4.2 4.6 2.9 3 -3
Light 1 0.3 0.2 0.3 0.2 0.2 -0.8
Other 8 1.6 3.7 4.5 4.5 4.6 -3.4
Source: Official website of the Federal State Statistics Service. Available at: http://www.gks.ru/wps/wcm/connect/rosstat/rosstatsite/main/
enterprise
Figure 1. Dynamics of industrial production in the Russian Federation,
the North-Western Federal District and the Vologda Oblast in 2000 – 2011, % [10]
because of the labour outflow to the services
sector (tab. 2). The level of innovation activity
of the oblast industrial enterprises is less
than 10%. This figure contradicts the main
international trends: for instance, in 2009 the
share of organizations engaged in innovation
activity in the total number of organizations
reached 79.9% in Germany, 52.2% – in
Finland, 50.2% – in France [11].
The situation in the region urges government
authorities to take active measures concerning
industry and its transition to innovation
development.
The experience of economic reforms in
developed and developing foreign countries
highlights the importance of industrial policy
development and implementation, as it is
the main institutional and economic basis of
successful comprehensive transformations.
Academic literature contains many inter-
pretations of the concept “industrial policy”.
The analysis enables us to identify its main
features, defined by the authors [1, 5, 6, 9, 13,
14, 15]. Firstly, industrial policy is implemented
by state and local government authorities.
Secondly, the creation of new hi-tech industries
113100 103
106116
125131
139
149 150
136
147 154
104
118
126
146
159
169
181 182168
182
192
97 102106
120129
135129
117
130 136
90
110
130
150
170
190
2000 2001 2002 2003 2004 2005 2006 2007 2008 2009 2010 2011 Year
%
Russia NWFD Vologda Oblast

166 1 (25) 2013 Economic and social changes: facts, trends, forecast
Industrial policy as a mechanism of regional development
should become the main guideline in the
development of a competent industrial policy in
modern conditions. Thirdly, it should influence
all the aspects of industrial complex, providing
its harmonious and efficient development.
In this respect, we believe that the essence
of industrial policy is described most com-
prehensively by Academician A.I. Tatarkin.
He considers that industrial policy is a system
of relations between state authorities and
municipal authorities, economic entities,
scientific and public organizations concer-
ning the formation of a structurally balanced,
competitive industry with its intellectual
core represented by the latest technological
mode [12].
Figure 2. Output profitability at industrial enterprises of the Russian
Federation, the Vologda Oblast in 2000 – 2011, % [10, 17]
Table 2. Main performance indicators of industrial enterprises of the Russian
Federation and the Vologda Oblast in 2000 – 2011, %
Indicator 2000 2005 2009 2010 2011 Absolute deviation of 2011 from
2000, p.p. 2005, p.p.
Russia
Consumption of fixed capital 50.4 47.1 45.7 46.1 46.7 -3.7 -0.4
Share of persons employed in the
industry in the total number of
economically active population
22.6 21.7 19.9 19.7 19.7 -2.9 -2
Level of innovation activity 8.8 9.7 9.3 9.5 9.6 0.8 -0.1
Vologda Oblast
Consumption of fixed capital 45.5 50.1 36.6 40.6 43.2 -2.3 -6.9
Share of persons employed in the
industry in the total number of
economically active population
26.7 21.7 19.7 19.4 18.1 -8.6 -3.6
Level of innovation activity 11.0 8.4 7.6 7.4 9.3 -1.7 0.9
Source: Official website of the Federal State Statistics Service. Available at: http://www.gks.ru/wps/wcm/connect/rosstat/rosstatsite/main/
account/#
35.5
29.1
33.6
29 28.7
12.4
14 12.2
24.7
15.316.6
18.417.1
12.5
14.813.2
10
15
20
25
30
35
40
2000 2005 2006 2007 2008 2009 2010 2011 Year
%
Vologda Oblast Russia
167Economic and social changes: facts, trends, forecast 1 (25) 2013
YOUNG RESEARCHERS Ye.A. Mazilov
This definition allows highlighting the
major objective of industrial policy that con-
sists in ensuring the country’s sustainable
economic development, enhancement of
domestic producers’ competitiveness and, as a
consequence, citizens’ welfare.
Enterprises, corporations and production
complexes are the objects of industrial policy,
and state authorities are its subjects.
Using the tool under consideration, regional
authorities carry out the management of
individual industries and enterprises for en-
hancing their commercial and budgetary
efficiency and social responsibility.
Development and implementation of
regional industrial policy includes a whole
range of legal, economic and organizational
measures promoting the formation of a
competitive industrial complex, ensuring its
efficient performance and dealing with the
region’s social problems [12].
The main mechanisms of realization
of industrial policy are the restructuring
of declining industries, development of
knowledge-intensive industries and creation
of compensation mechanisms, aimed at
reducing the negative impact of proposed
solutions. The constituent parts of regional
industrial policy are as follows: the creation
of conditions for improving investment
climate; establishment of a favorable tax
regime; provision of benefits on loan rates
to enterprises, simplification of a crediting
system as a whole; increase of investments in
R&D; other measures aimed at introducing
innovations and achieving scientific and
technological progress [3].
The principles of industrial policy are
usually contained in various official documents.
The most important document is the concept
of industrial policy, since it is an ideological
and value landmark that forms the basis of
strategic, tactical, and operational activities
aimed at the development of the region’s
industry.
However, due to the absence of documents,
regulating industrial policy at the federal level,
the concepts of industrial policy, already
adopted in 40 Russian regions, coordinate
with each other rather poorly and they do not
have common principles and a clear purpose.
Besides, these documents do not contain
the mechanisms of federal industrial policy
implementation. Therefore, in our opinion,
the time is right to work out a balanced federal
industrial policy, which will form the basis
for the concepts of industrial development of
Russia’s subjects.
The so-called “strategic” approach is
applied most frequently in the elaboration of
regional industrial policy. It is based on a
specific algorithm of creation and realization
of the policy project. Here we consider it
possible to use the following algorithm (fig. 3)
with regard to the peculiarities of development
and organization of the region’s industrial
complex.
The Vologda Oblast industrial policy
concept for the period of 2003 – 2010, ela-
borated in the framework of this approach,
turned out to be inefficient in the conditions
of the financial and economic crisis of 2008. The
new concept of industrial policy is still under
development. In the meantime, a number of
measures aimed at the development of industry
are being implemented in the region.
The Directorate for Industry and Science
under the Department of Economy of the
Vologda Oblast Government carries out
organizational and legislative support of
industrial policy. This structural division
is focused on the regulation of investment
activity and provision of government support
to innovation activities in the industry.
The Vologda Oblast has developed and is
now implementing the programmes on
providing support to individual industries in
the short and medium term. In particular, a
number of investment projects are being carried
out in the primary sectors of industry, advanced
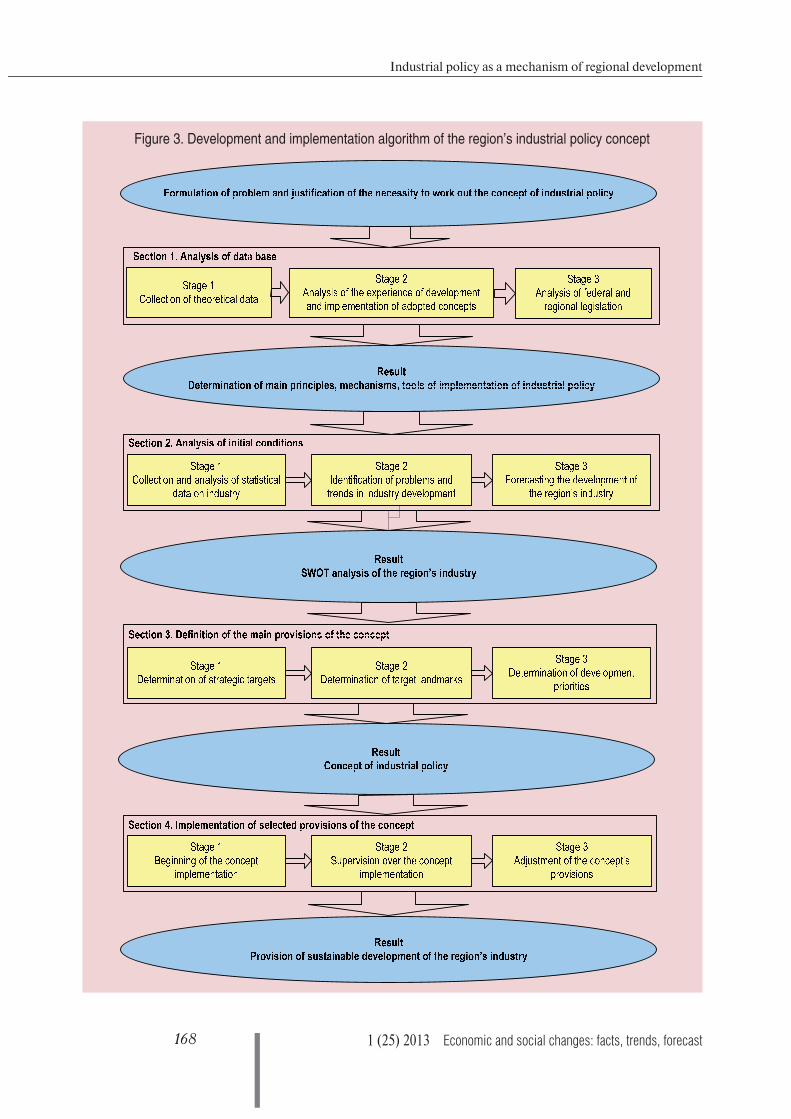
168 1 (25) 2013 Economic and social changes: facts, trends, forecast
Industrial policy as a mechanism of regional development
Figure 3. Development and implementation algorithm of the region’s industrial policy concept

169Economic and social changes: facts, trends, forecast 1 (25) 2013
YOUNG RESEARCHERS Ye.A. Mazilov
wood processing, house-building, production
of transport and electronic equipment, food
production. Industrial parks Sheksna and Sokol
have been established and are now developing,
the project of Industrial Park Vologda – East is
currently under development.
Besides, a Guarantee Fund has been
established with the main goal of providing
securities for bank loans to small and medium-
sized businesses. And although the amount
of guarantees can’t exceed 70% of the sum
set in the credit agreement, establishment
of such a structure allows organizations that
lack resources to provide loan guarantees to
receive funds necessary for their development.
However, it can be noted that the provision of
guarantees by the Fund is a very complicated
and time-consuming process, which requires
collecting a large set of documents. The fact,
no doubt, reduces the attractiveness of this tool
of state support.
Such organizations as the Union of
Industrialists and Entrepreneurs of the Vologda
Oblast(UIEVO) and the Vologda Chamber of
Commerce and Industry (VCCI) have been
already functioning for a long time.
UIEVO is mainly aimed at establishing
efficient cooperation with power and
administration bodies on the issues of the
region’s industrial development. At the same
time, the Union should participate in the
implementation of active regional policy by
considering the oblast legislation and developing
recommendations on its improvement. The
Union should also promote the establishment
of competitive environment in mechanical
engineering and other industries. Today almost
100 enterprises are included in the registry of
the regional employers’ association.
In 2012, the Union of Constructors and
Designers of the Vologda Oblast was established
on the initiative and with the assistance of
UIEVO. Organizational activities have been
carried out for establishing the sectoral
association of employers in the fuel and
energy complex. Consultations are going
on concerning the transformation of such
organizations as the association “Machine-
Building Enterprises of Vologda Oblast” and
the non-commercial partnership “Housing
and Communal Services of the Vologda Oblast”
into sectoral associations of employers. The
Agreement on the regulation of social and
employment relations for 2013 was signed
between the Vologda Oblast Federation of
Trade Unions, UIEVO and the Vologda Oblast
Government in the framework of the extended
session of the oblast tripartite commission.
But in practice, the activities of UIEVO are
only of a formal, consultative nature, the
majority of the Union’s decisions haven’t been
reflected in the oblast legislation.
The Vologda Chamber of Commerce and
Industry provides on a commercial basis
assistance in drawing up the documents for
registration of trademarks and intellectual
property, participates in the certification of
goods, carries out training seminars on the
issues of taxation and business, as well as
marketing research. The chamber organizes
the annual contest “Silver Mercury” with
the nomination of titles “best enterprise in
the sphere of industrial production», “best
enterprise in the sphere of construction”, “best
enterprise in the sphere of consumer goods
production”.
However, it should be noted that the tools
used by the authorities to support the industrial
complex are not always interrelated and
sufficient. It is consistency and comprehen-
siveness that are necessary to make industrial
policy a more efficient mechanism of regional
development.
In our viewpoint, the development and
implementation of active regional industrial
policy should become one of the priority
directions ensuring the region’s transition to
innovation development.

170 1 (25) 2013 Economic and social changes: facts, trends, forecast
Industrial policy as a mechanism of regional development
References1. On the national industrial policy of the Russian Federation: the draft Federal law. Available at: http://docs.
kodeks.ru/document/902135400.
2. Vyacheslavov A.M. Problems of formation of the innovative climate in the region. Modern research of social
problems. 2012. No. 1 (09). Available at: http://sisp.nkras.ru/issues/2012/1/Vyacheslavov.pdf.
3. Gulin K.A. On the issue of socio-economic modernization of Russian regions. Economic and social changes:
facts, trends, forecast. 2012. No. 4. P. 35-49.
4. Investment processes in the Vologda Oblast: statistical collection. Vologdastat. Vologda, 2011.
5. Carson R.B. What economists know: an economic policy primer for the 1990’s and beyond. Moscow, 1993.
6. Kuznetsov B.V. Does Russia need industrial policy? Industrial policy in Russia: to be or not to be? Moscow:
TEIS, 2002.
7. Mazilov Ye.A. Innovation activity as the tool of development of the region’s industrial complex. New economy
– new society: materials of the 6th inter-academic scientific and practical conference, Vologda, 29 April 2011.
Vologda: ISEDT RAS, 2011. P. 76-80.
8. Mazilov Ye.A. Industrial policy as a basis for modernization of the region’s economy. Strategy and tactics of
implementation of socio-economic reforms: regional aspect. Materials of the international scientific and practical
conference. Vologda, 6 – 8 October 2011. Vologda: ISEDT RAS, 2011. Vol. 2. P. 414-422.
9. On industrial policy in the Russian Federation. Industrial policy in the Russian Federation. 2007. No. 5. P. 3.
10. Official website of the Federal State Statistics Service. Available at: http://www.gks.ru/wps/wcm/connect/rosstat/
rosstatsite/main/account/#.
11. Official website of Eurostat. Available at: http://epp.eurostat.ec.europa.eu/portal/page/portal/science_
technology_ innovation/data/main_tables.
12. Tatarkin A.I., Romanova O.A., Chenenova R.I., Filatova M.G. Regional industrial policy: theoretical foundations,
the practice of formation and the mechanism of implementation. Yekaterinburg: Ural RAS Department, 2000.
P. 67.
13. Romanova O.A., Chenenova R.I. The industrial policy as the factor of maintenance of economic security of the
regions. Ekonomika regiona. 2008. No. 3.
14. Smirnov Ye. Innovation vector of the industrial policy of the European Union. International Economics. 2007.
No. 2. P. 58.
15. Tatarkin A.I., Romanova O.A. T he industrial policy and the mechanism of its realization: the system approach.
Ekonomika regiona. 2007. No. 3 (11). P. 19-31.
16. Terebova S.V., Mazilov Ye.A. Structure of the region’s industry: state and problems of target-oriented change.
Modern research of social problems. 2012. No. 3 (11). Available at: http://sisp.nkras.ru/e-ru/issues/2012/3/
mazilov.pdf.
17. Financial condition of organizations of the Vologda Oblast in 2009 – 2011: statistical collection. Vologdastat.
Vologda, 2012. P. 137.
18. Rodrick D. Trade and industrial policy reform in developing countries: a review of recent theory and evidence.
NBER working paper No. 4417 August, 1993. Available at: http://www.nber.org/papers/w4417.pdf

171Economic and social changes: facts, trends, forecast 1 (25) 2013
YOUNG RESEARCHERS
UDC 336.717
LBC 65.262.5
© Gisin L.M.
Influence of capital and costs on the evaluation of transfer pricesThe present article deals with the methodology for defining the optimal transfer price in commercial
structures. The paper contains the examples and analysis of assessing transfer prices taking into account
the specifics and characteristics of organization’s costs and capital. The novelty of the work consists in
the fact that it analyzes approach methods based on a detailed classification of expenditures with a
purpose of practical implementation of the transfer pricing system.
Banking, profitability, fixed and variable costs, opportunity costs, value of capital, transfer price.
Lev M.GISINPostgraduate Student at the Russian Presidential Academy of National Economy
and Public Administration
[email protected]; [email protected]
Introduction The era of globalization is characterized by
the formation of single information, economic,
cultural, political and legal space. Globaliza-
tion produces new opportunities, positive as
well as negative, connected with the change
of established systems and relations. The
expansion of financial market, along with
increasing number and volume of transactions,
leads to the change of its conditions and
manifold increase of financial risks.
Under these conditions, commercial
multidivisional banking structures, having
representative offices in local markets, are
becoming more competitive. The stability
of such large structures depends on their
interdivisional commercial activities, transfers
of banking products and services. The study of
transfer pricing and the practical experience of
its application proves that, at present, transfer
pricing, which is, in fact, an outcome of
globalization, is a necessary prerequisite for the
successful development of large multidivisional
commercial banks. Practical research also
proves that the introduction of transfer pricing
is relevant for any international commercial
structures, in particular, in the sector of
industry and services [1] .
Therefore, a fundamental goal, faced by top
managers of modern commercial multidivisional
banking structures, consists in practical
definition of an optimal transfer price and
introduction of a transfer pricing system among
its divisions. This objective implies the solution
of certain tasks.
These include, firstly, the allocation of
structural units, generating profits of the whole
structure, the so-called profit centres, which
were first identified and subsequently studied
by P. Drucker [2, 3]. It should be noted that a
profit centre of the structure can be a specific
division, as well as its products and services, or
a structural unit specially created on the basis
of available resources.

172 1 (25) 2013 Economic and social changes: facts, trends, forecast
Influence of capital and costs on the evaluation of transfer prices
Secondly, the proper determination of an
optimal transfer price, as a rule, requires the
use of mathematical modeling.
In addition, the implementation of a
transfer pricing system and establishment of
an optimal transfer price requires a thorough
analysis and consideration of actual market
conditions, market prices and the multitude
of factors and costs that affect the structure’s
income.
The present article considers the influence
of costs on the determination of an optimal
transfer price.
Assessment of a transfer price with regard to fixed and variable costs
Costs are cash expenditures emerging in the
process of production and circulation of a
product or service due to the consumption of
various economic resources (raw materials,
labour, fixed assets, services, financial resour-
ces). Costs are one of the most important
economic factors of any commercial orga-
nization, since they have direct influence on
profits maximization in creating and selling
competitive products or services. At present,
the growth of costs can be found in almost
all types of business. The banking sector
witnessed a significant increase of operational
costs, including administrative and manpower
costs. A considerable growth of expenses is
conditioned by the necessity of introducing
new technologies.
The information (official statements
according to International Financial Reporting
Standards – IFRS) on operating costs of
Sberbank, which includes both variable costs
and fixed (administrative and other operating
profit), as well as net profit and pre-provision
operating profit (fig. 1).
The graph shows, that as the bank develops,
its expenditures increase in general with the
increase in its operating profit, therefore, it is
most relevant to estimate the types of costs
properly when determining the transfer price.
As for 2009, the fall of net profit was the
result of increased allowances for loan loss
provisions. This event does not contradict the
correlation between the increase of the bank’s
expenditures and profit in the context of
transfer pricing and cost optimization, and
refers to the sphere of credit risk.
To illustrate the correlation mentioned
above, let us consider a graph of balance sheets
of two main products of a commercial bank on
the example of Sberbank, on the basis of its
official statements according to IFRS (fig. 2).
The graph shows that the growth of expenses
over time indicates their dependence on the
increasing volume of rendered services.
Let us consider a model of a basic business
structure, existing in various countries. As
mentioned above, any such structure contains
profit centres – structural divisions, which
gain profit on their own, being an independent
source of a specific part of the whole structure’s
total profit; and cost centres – structural
divisions, which are a source of costs and which
support other units of a company [4].
The whole company’s activities are aimed
at profit maximization, which can be expressed
analytically as the solution of a standard linear
problem of profit maximization and the
creation of a system, in which the structures’
owners will gain the greatest possible profit.
Solving the problem of profit maximization
implies that an analyst, who faces the task of
simulating a transfer pricing system and
determining an optimal transfer price, can
make up a mathematical representation of
the function of profit and costs. But it is very
difficult to implement in practice.
Essentially, the company’s managers either
focus on the state of variable and fixed costs for
assessing transfer prices, or just use market
prices without solving the problem of profit
optimization.
When considering fixed and variable costs
in practice, one mainly focuses on two areas:
1) comparison of specific costs with the
particular type of goods;
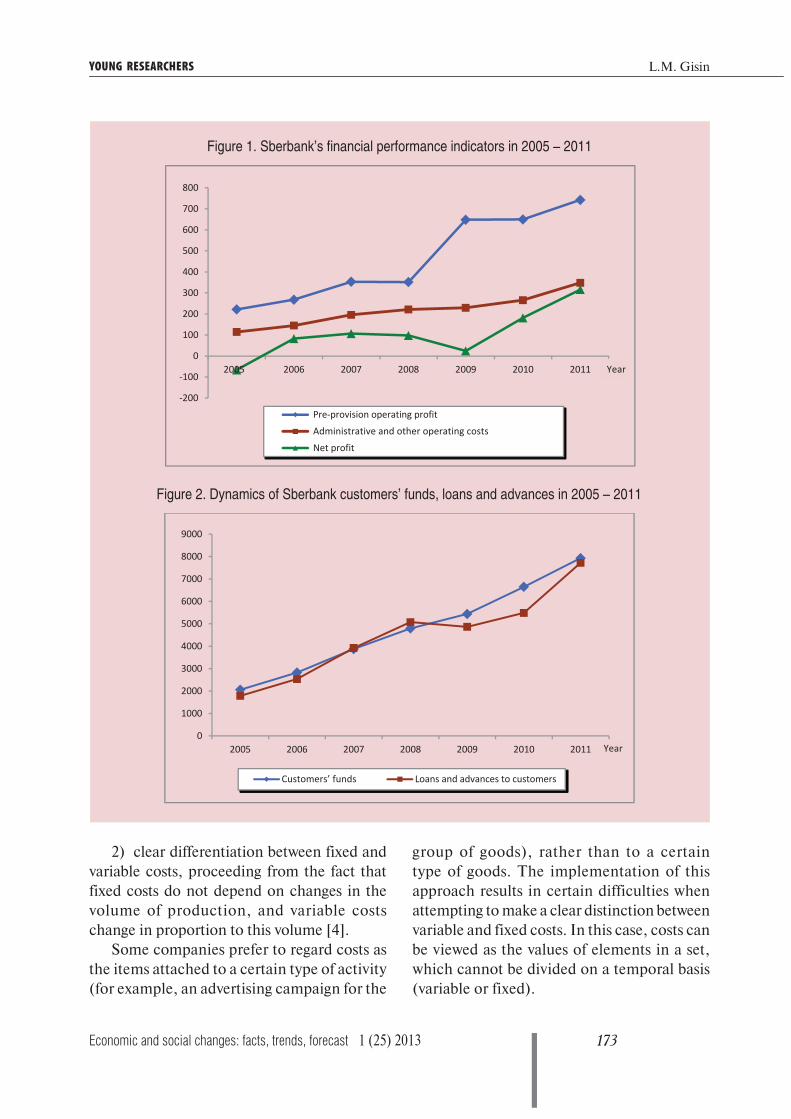
173Economic and social changes: facts, trends, forecast 1 (25) 2013
YOUNG RESEARCHERS L.M. Gisin
2) clear differentiation between fixed and
variable costs, proceeding from the fact that
fixed costs do not depend on changes in the
volume of production, and variable costs
change in proportion to this volume [4].
Some companies prefer to regard costs as
the items attached to a certain type of activity
(for example, an advertising campaign for the
group of goods), rather than to a certain
type of goods. The implementation of this
approach results in certain difficulties when
attempting to make a clear distinction between
variable and fixed costs. In this case, costs can
be viewed as the values of elements in a set,
which cannot be divided on a temporal basis
(variable or fixed).
Figure 1. Sberbank’s financial performance indicators in 2005 – 2011
Figure 2. Dynamics of Sberbank customers’ funds, loans and advances in 2005 – 2011
-200
-100
0
100
200
300
400
500
600
700
800
2005 2006 2007 2008 2009 2010 2011
Pre-provision operating profit
Administrative and other operating costs
Net profit
Year
0
1000
2000
3000
4000
5000
6000
7000
8000
9000
2005 2006 2007 2008 2009 2010 2011
Customers’ funds Loans and advances to customers
Year

174 1 (25) 2013 Economic and social changes: facts, trends, forecast
Influence of capital and costs on the evaluation of transfer prices
Figure 3. Cooperation between the treasury and structural resources of the bank
It should be noted that under this approach
the variance of costs (as a statistical measure
of dispersion of their values) from the view-
point of their division by the type of goods
increases, since the elements of the set vary
depending on the type of activity, rather
than the type of goods. Furthermore, there
are other problems in costs accounting
with regard to the determination of transfer
prices. They are caused by the differences
in understanding of the costs contained in
transfer pricing models, as well as the costs
described in accountancy.
In the banking sphere, the treasury is most
frequently the centre of inner market among
the divisions of a structure (fig. 3) [5].
The treasury not only manages the bank’s
liquidity, providing an optimal assets/liabilities
ratio, but also purchases the resources from
attracting structural divisions and sells them to
distributing divisions.
In large banks, working with a wide range
of financial products and tools, carrying out
internal control and accounting, the treasury
is the profit centre of the entire organization, it
defines buying and selling transfer prices for its
structural divisions, taking into account market
prices and costs.
In the absence of an internal accounting
system in small banks, where the asset and
liability management is carried out on the
basis of their portfolio grouping, the treasury
External profit External cost
interest on deposits
Internal profit Internal cost
Transfer profit from the selling of resources to
the treasury
ATTRACTING RESOURCEof the bank on the external market TREASURY
Internal profit Internal cost
Transfer cost for the purchase of resources from the attracting
resource
Transfer profit from the selling of resources to the
distributing resource
DISTRIBUSING RESOURCEof the bank on the external market
External profit External cost
interest on loans
Internal profit Internal cost
Transfer cost for the selling
resources to the treasury
Transfer profit from the selling of resources to
the treasury
ATTRACTING AND DISTRIBUSING RESOURCE
of the bank on the external market
External profit External cost
Banking and brokerage commission expenses
Banking and brokerage commission profit
Internal profit Internal cost
Transfer cost for the purchase of resources of the treasury
Transfer profit from the selling of resources to the treasury

175Economic and social changes: facts, trends, forecast 1 (25) 2013
YOUNG RESEARCHERS L.M. Gisin
sets transfer rates for each type of assets
or liabilities with regard to urgency and
currency denomination, but it does not
have its own profit and it is the centre of
costs. Its profits-expenditures item on the
redistribution of bank resources is determined
by the difference between the revenues from
sales and expenditures on purchasing the bank’s
resources, without redistribution for the centre
of the bank’s profits and without affecting the
total financial performance of the bank as a
whole.
Evaluation of a transfer price with regard to opportunity costs and the cost of capital
In this context, one should consider op-
portunity costs and the cost of capital separately.
Alternative costs in a broad economic sense
(and with respect to the simulation of transfer
pricing systems in particular) can be represented
as a profit that was lost due to the disuse of
economic resources in the most profitable of
all possible types of activity. For example, for
the owners of the company described above,
opportunity costs are the maximum salaries,
which they could get, working for hire.
In economics, the concept “opportunity
costs” is used in the analysis of resource
allocation efficiency. So, in the example above,
when evaluating the efficiency only on the
basis of business profits, a company can be
considered efficient only if its income exceeds
the highest alternative earnings of its owners.
Business accounting regards costs as actual and
clearly identifiable expenses and in its essence
it cannot deal with opportunity costs.
The following diagram (fig. 4) provides an
overview of the types and characteristics of
opportunity costs.
Let us consider the second example, in
which we will examine the cost of capital. In
itself, the term “capital” has many definitions.
In order to define the capital accounting
methodology, it is necessary to understand and
define the main concepts and terms, which
characterize capital and its components [6].
Capital, as the aggregate sources of pro-
perty forming organization’s assets, can be
determined by the fundamental equation of
accounting: Assets is Aggregate capital. Sources
of the organization’s property, which should
be presented in the assets of accounting, may
include both its own sources, and the sources
equivalent to them, as well as borrowed funds.
At the same time, the notion “capital” has
a different meaning in market economy, since
any borrowed capital in the market conditions
is considered as a liability. In this case, the
notion of capital may include only equity capital
Figure 4. Opportunity costs
Costs of production, goods and services, measured by the value of the best missed opportunity of using production resources spent on their creation
OPPORTUNITY COSTS
Explicit (cash) costs take the form of cash payments to the owners of resources of production and semi-
finished products
Implicit (imputed) costs take the form of lost income from the use of resources, which are the company’s
property

176 1 (25) 2013 Economic and social changes: facts, trends, forecast
Influence of capital and costs on the evaluation of transfer prices
– the owner’s capital. International financial
reporting standards adhere to market-based
understanding of capital, which is reflected
in the Russian edition of IFRS in the section
Principles of compiling financial statements. Here
capital is defined as part of a company’s assets
remaining after deducting all of its liabilities.
Then the fundamental accounting equation
takes the following form: Assets is Obligations
plus Equity capital.
The normative system regulating accoun-
tancy in the Russian Federation does not
provide a clear definition of the term under
consideration. The concept of accounting in
Russia’s market economy defines “capital”
as “investments of owners and profit,
accumulated for all the period of organization’s
activities” [7].
Therefore, given the fact that the term
“capital” has many meanings, one can observe
that at present there are certain differences
between accounting and models used in
economics to estimate transfer prices. In order to
measure the expected cost of new (or borrowed)
capital, it is necessary to use market-based
valuation of each of the components, rather
than the data of accounting statements, which
can significantly differ from the market ones.
In addition, accounting lacks a formal
permanent rate of payments on shares, and the
assessment of transfer prices requires the
calculation of the weighted average cost of
capital, which is represented by the weighted
average cost of debt obligations and shares of a
company’s owners. In short, the calculation of
transfer prices requires permanent accounting
of the clearly specified percentage indicative of
dividend payments on equity shares.
Weighted average cost of capital allows
companies’ owners to evaluate the attractiveness
of certain investments, comparing the yield rate
of investments to the weighted average cost
of capital. An investment can be considered
profitable, if the rate of its return exceeds the
weighted average cost of capital.
Weighted average cost of capital (WACC)
takes into account the cost of equity and
borrowed funds, and can be calculated as
follows:
WACC= Re(E/V) + R
d(D/V)(1 - t
c),
where:
Re – rate of profitability of equity (joint stock)
capital, calculated, as a rule, with the use of Capital
Asset Pricing Model;
E – market value of equity (joint stock) capital;
it is calculated as the product of the number of
equity shares of a company and the price per share;
D – market value of borrowed capital, which
in practice is often determined according to the
financial statements as the amount of the company’s
loans (if these data are not available, one can use the
available information on the ratio of equity capital
to borrowed capital of similar companies);
V = E + D – aggregated market value of
company’s loans and its equity capital;
Rd - rate of return of the company’s borrowed
capital (the costs for raising debt funds), such costs
are interests on bank loans and corporate bonds of
a company; in this case the value of borrowed
capital is adjusted with regard to profit tax rate
(the adjustment lies in the fact that the interest on
credits and loans servicing is referred to the cost
of products, thereby the tax base for profit tax is
reduced);
tc – profit tax rate [8].
If the capital includes preferred shares with
their own value, then the formula should
include additional components for each source
of capital. Other, more rare sources of funding,
such as convertible bonds, convertible preferred
shares, etc. will be additionally included in
the formula only in case, if they are present
in significant volumes, since the cost of such
financing is usually different from the value of
standard bonds and shares [9].
Considering the practical application of
WACC rate in the formation of a transfer price

177Economic and social changes: facts, trends, forecast 1 (25) 2013
YOUNG RESEARCHERS L.M. Gisin
of capital, one should bear in mind that there
is no standardized model of their relationship.
Essentially, the company’s top managers
decide upon the use of WACC as a transfer
price of capital if the borrowed capital can’t
be definitely associated with a specific set of
financial products on the side of assets. In
practice, this means that borrowed capital has
been used, for instance, for investing in the
bank’s infrastructure rather than for granting
loans. Thus, the issue of “who will pay” for
capital, is settled by dividing the balance of
capital (debt and joint-stock) at the WACC
interest rate between the bank’s profit-centres.
The highest share will be allocated to the
profit-centre that has the most urgent demands
for the infrastructure, mentioned above. In the
second place, attention will be paid to the
motivation issues of employees, whose incomes
on management accounting are small because,
when allocating the capital to the profit-centre,
the management deliberately underestimates
EBIT of this profit-centre, which is not always
in the interests of management, as the staff will
start losing motivation because of a formally
poor performance of their department. The
question arose: why the joint-stock capital
rather than debt capital was considered when
using WACC as a transfer price of capital.
The answer lies in the fact that, in practice,
joint-stock capital can’t be definitely bound
to specific assets – in the notion of the bank’s
management it is a basic buffer, which performs,
among other things, mandatory regulatory
requirements and for which, as a consequence,
all the profit centres of the bank “pay” in the
proportions established by the management.
Thus, if the debt capital is nonetheless allocated
to specific assets, then the separate transfer rate
of debt capital (not WACC) will be paid for it
by the profit-centres that own these assets, and
the profit-centres of the bank in general will
receive only the distributed joint-stock capital
at the rate of joint-stock capital (not WACC)
in the proportion specified by the bank’s
management.
Accounting methods of determining transfer prices
Let us consider the various methods
developed from the viewpoint of accounting
in order to estimate the optimal transfer price
in a commercial structure. Their classification
is given by Kaplan and Atkinson [10]. We shall
study in greater detail some types of costs and
their impact on the transfer pricing system.
Marginal costs in the transfer price evaluation.
Marginal costs include the expenditures for
producing one additional unit of production.
If the transfer price is chosen so that it
corresponds to the marginal costs (optimal
transfer price. – L.G.), this helps the company
reach economic self-sufficiency and allows all
the departments to participate in the production
and sale of goods to the necessary extent. If the
transfer price is set above the value of marginal
costs, then it increases the motivation of the
producing department to produce as many
goods as possible and sell them to the selling
department, because the marginal profit of the
producing department will exceed the marginal
costs of the goods production.
If the transfer price is set below the value of
marginal costs, it reduces the motivation of the
producing department to sell goods to the
selling department, but it can increase the
motivation to sell the same goods in the foreign
market, if the external price exceeds the transfer
price.
One should also take into account the fact
that purchasing and selling departments can
turn their attention to the external market. If
the transfer price exceeds the average market
price, then the heads of the selling department
will be more eager to bring the transfer price
closer to the market one, and the producing
department will strive to optimize marginal
costs with a purpose of their reduction.
Marginal costs exist mainly in financial
institutions along with fixed expenses, which
are allocated to departments according to
reporting periods. This allows accountants

178 1 (25) 2013 Economic and social changes: facts, trends, forecast
Influence of capital and costs on the evaluation of transfer prices
able prices, lies in the fact that in case when full
costs are considered, fixed costs will be defi-
nitely taken into account. Marketing activity
of a sales department can be an example of
fixed costs that are connected with production.
The study of external market is a company’s
function, which is not related to the number
and, sometimes, the type of goods and, conse-
quently, it is an independent item of fixed costs.
Transfer pricing systems, based on full costs,
are, in fact, a borderline case of transfer pricing
systems, and the more complex the business,
the worse the performance of one of the main
functions of such systems, which is the reflec-
tion of objective analytical data on centres of
profit and costs.
In case of choosing such an approach, top
management will not be able to assess objectively
the efficiency of individual departments. Despite
the lack of support on the part of scientific com-
munity for this type of transfer pricing systems,
many companies choose it, since it is easy to
implement and is designed for simple structures.
It is obvious that the simpler the company’s
structure, the more objective this approach.
Some scientists consider it the best [11].
Variable costs in view of markups in the
assessment of transfer prices. This type of trans-
fer pricing is a special case of transfer pricing
systems that are based on variable costs. The
difference from the standard approach in this
case consists in the addition of a fixed markup
to transfer prices. This increases the profit of a
producing department, but reduces the profit
of a selling department. This method is suitable
for the company, in which its producing depart-
ment produces goods with a low level of variable
costs (in comparison with the average market
price. – L.G.). In order to show the margin that
the company saves due to the activities of this
department, one can put together the trans-
fer price and the value that doesn’t exceed the
difference between the market transfer price
and the level of variable costs of the produc-
ing department. The situation being directly
to assess the distribution of profit by the
departments and justify the decrease in profit
of one department in favor of another.
Variable costs in the transfer price evaluation.
Variable costs are operational expenses, which
change in direct proportion to the change of
production or sales volume, capacity utilization
or other kinds of activity, e.g. consumed
materials, direct labor expenditures, production
electricity, as well as sales commissions.
Accounting, according to Kaplan and
Atkinson, makes a clear distinction between
transfer pricing systems, based on marginal and
variable costs. In fact, the difference between
the two approaches consists in the practical
complexity of distinguishing between fixed and
variable costs.
For example, some types of expenditures
may be fixed in the short term, but variable in
the long term. Some of the costs, e.g. manpower
costs, can be hanged depending on the volume
of production only with the consent of the
company management. In general, the number
of types of variable costs exceeds the number of
marginal costs and includes the types of costs,
which are considered fixed from the viewpoint
of marginal costs. The advantages of transfer
pricing systems, based on marginal costs, can
be described in the framework of a simple
mathematical model. The transfer pricing
system, based on variable costs, will lead to
optimal transfer prices only if marginal costs
are equivalent to variable costs.
Total costs in the transfer price evaluation.
Transfer pricing systems based on total costs
imply the accounting of all the expenses of a
company for determining the transfer price.
The transfer price is defined as the aggregate
total costs of a company, divided by the quantity
of goods produced. This approach is character-
ized by a greater degree of randomness in the
distribution of costs according to the types of
goods, if there are goods of more than one type.
The difference between this approach and
the approach, which takes into account vari-

179Economic and social changes: facts, trends, forecast 1 (25) 2013
YOUNG RESEARCHERS L.M. Gisin
opposite, namely, in case when variable costs
exceed average market prices, a markup can
be set as a negative value in order to reflect the
efficiency of the selling department correctly.
In this case, its efficiency is considered to be
the profit, which the selling department will be
able to make with regard to the average mar-
ket price. Obviously, in this case the producing
department will suffer constant losses from the
viewpoint of transfer pricing. But it is justified,
because, in fact, the producing department is
non-competitive in the market.
Agreed transfer prices. Transfer prices can be
set by the company’s management with or with-
out regard to the approaches described above.
This forced decision may be conditioned by
special market conditions and the manage-
ment’s desire to shift motivation from one
department to another.
Conclusions concerning banking structuresThe present article studies the influence of
various costs and capital on the determination
of an optimal transfer price for a structure, con-
sisting of producing and selling departments.
Such structure can comply with the banking
structure if we draw the analogies:
1) between the producing department and
profit centre for the attraction of monetary
funds;
2) between the selling department and
profit centre for the allocation of monetary
funds.
The task of profit optimization can be solved
mathematically by establishing transfer prices
equal to marginal costs. This decision is appli-
cable to any business structure, as it leads to its
self-repayment.
But in practice, the accounting system in
banks is the most detailed and developed in
comparison with other business systems.
The accountants working in banking struc-
tures are much more pragmatic and closer to
reality in their assessments than economists. In
the vast majority of cases, the former rely on
approved and acknowledged practical method-
ologies in contrast to the latter who rely mainly
on a variety of abstract approaches.
Therefore, banking structures should take
into consideration, first of all, an accounting
point of view on the bank’s costs. This will pro-
mote the introduction of the most efficient
models of transfer pricing.
References1. Atkinson A.A. Intra-firm cost and resource allocations: theory and practice. Toronto, 1987.
2. Drucker P.F. Management challenges for the 21st century. M.: Williams, 2000.
3. Druker P.F. The practice of management. New York: Harper and Row, 1954.
4. English-Russian dictionary of economics. Available at: http://economy_en_ru.academic.ru.
5. Ashkinadze A., Knyazhechenko Ye. Technology of accounting of the actual execution of the budget of
a commercial bank. Banks and technologies. 2001. P.5
6. Khabarova L.P. Capital in the accounting reports of organizations. Accounting bulletin. 2008.
7. Concept of accounting in Russia’s market economy, i.7.4.
8. Sinadskiy V. Calculation of the discount rate. Financial director. 2003. No. 4.
9. Brealey R., Myers S. Principles of corporate finance. Library “Troika-Dialog”, 2012.
10. Atkinson E.A., Bunker R.D, Kaplan R.S., Young M.S. Management accounting. Publishing house “Williams”,
2005.
11. McAulay L., Tomkins C. A Review of the contemporary transfer pricing literature with recommendations for
future research. British journal of management. 1992. No. 3.

180 1 (25) 2013 Economic and social changes: facts, trends, forecast
YOUNG RESEARCHERS
UDC 001.89
LBC 65.9(2)-5
© Ilyin P.V.
Foreign experience of technology transfer and its application in Russia
The article provides an overview of foreign experience in technology transfer and commercialization.
It describes the peculiarities and drawbacks of organizing technology transfer in Russia. In addition,
the article proposes the directions for applying foreign experience in the country’s innovation system.
Technology transfer, foreign experience, Russian practice, innovation infrastructure.
Pyotr V.ILYINPostgraduate student at Saint Petersburg State University of Economics and Finance
During the current period of economic glo-
balization the role of scientific research, forma-
tion and implementation of new mechanism
technologies, and methods of stable economic
development is increasing. Technology trans-
fer is one of the main components of eco-
nomic development. The extent of countries’
involvement in the process mostly defines the
possibilities of their technological progress and
competitiveness. At present, great interest in
technology transfer in Russia is linked not only
with the improvement of market relations in
the economy, but also the country’s accession
to the World Trade Organization. In order to
characterize the development of science and
innovation, the term of scientific and innova-
tion potential is widely used in national and
foreign practice.
For evaluating innovation development,
domestic and foreign practice uses the notion
of scientific and innovation potential. The ana-
lytic subdivision of the journal “Economist
Intelligence Unit” worked out the system of
indicators of innovation activity and integral
index of innovation development that comprises
many factors. [1]. The survey has been held since
2007, and at the moment it provides the most
complete set of indicators of innovative devel-
opment in different countries of the world.
In 2012, the international business school
INSEAD and the World Intellectual Property
Organization submitted analytical report
“Global innovation index of 2012”. The survey
covered 141 countries, which produce 99.4% of
the global GDP [2].
In 2012 Russia ranked 51st in the list (tab.1),
moving 6 points up as compared to 2011.
However this position is far from desirable.
According to 2012 results, the rating of the
countries by the level of innovation capabilities
is headed by Switzerland; Sweden and Singa-
pore are still among the top three countries.
The report notes [2] that BRIC countries
should continue to invest in the development
of innovations, to bring out their potential to
the fullest extent.

181Economic and social changes: facts, trends, forecast 1 (25) 2013
YOUNG RESEARCHERS P.V. Ilyin
China is second only to Switzerland, Swe-
den, Singapore and Finland according to the
indicators of knowledge and technology devel-
opment, however, like India, it has its weak
points in innovation infrastructure.
In this respect, it is expedient to consider
the experience of Sweden and Switzerland, the
leading countries in technology transfer accor-
ding to the level of innovation capacity and
performance.
Switzerland is making great efforts to com-
mercialize its scientific and technological
potential. The Swiss government annually
increased its expenditures on education, sci-
entific research and technologies on an average
by 6% in 2004 – 2007 [3]. The State Commis-
sion for technology and innovation (KTI) is
implementing a motto ‘Science to market’ [4].
Serving as an agency for innovations and devel-
opment at the state level, KTI supports applied
research and development (R&D), contributes
to the promotion of newly established compa-
nies and the development of entrepreneurship
in general.
The innovation R&D commercialization in
Switzerland is not backed by direct state invest-
ments. Private sector plays an important part
in R&D funding. Innovation technology
transfer into industry takes place along with
the provision of support to firms, mainly in
the conditions of technology parks. Due to
the lack of direct state support to innovations
in the business sector, innovation policy tools
are focused primarily on applied scientific
research. The Swiss association of technology
transfer “swiTT”, founded in 2003, carries out
the exchange of scientific and technological
information between national research institu-
tions and private sector [4]. Special centres for
the commercialization of R&D results function
under Swiss universities.
Sweden is distinguished by the high level of
education and qualification of public sector
employees, the efficient performance of state
institutions and a sustainable political system.
The country has a well-developed venture capi-
tal market. However, the system of support and
incentives to R&D results commercialization
through the creation and development of new
enterprises is still developed insufficiently.
This resulted in the creation of a whole
chain of organizations responsible for the
implementation of the policy related to the
development of business. Innovation Bridge
supports the commercialization of R&D results
and provides (limited) funding. ALMI Business
Partner provides support to business (not con-
ducting R&D). Industrial Fund is a state ven-
ture capital investor. Invest Sweden contributes
to the inflow of investments [3].
The main feature of a typical Western tech-
nology transfer centre (TTC) consists in the
creation of a complete innovation chain, allow-
ing a project to be developed from an idea to
a small enterprise with growth prospects. TTC
work according to a standard scheme. At the
initial stage, the demand for this technology on
the market is evaluated, the options for protec-
tion are checked. After the research is finished,
a detailed marketing analysis is carried out,
including the search for potential customers.
If the development is considered to be promis-
ing, then the key point is to make up a patent
application and receive a patent. The next stage
Table 1. Global innovation index of some countries in 2012
Rating Country Index Rating Country Index Rating Country Index
1 Switzerland 68.2 10 USA 57.7 54 South Africa 37.4
2 Sweden 64.8 15 Germany 56.2 58 Brazil 36.6
3 Singapore 63.5 25 Japan 51.7 63 Ukraine 36.1
4 Finland 61.8 34 China 45.4 64 India 35.7
5 Great Britain 61.2 51 Russia 37.9 78 Belarus 32.9

182 1 (25) 2013 Economic and social changes: facts, trends, forecast
Foreign experience of technology transfer and its application in Russia
is the decision on the transfer option: the issu-
ance of a license, the creation of a subsidiary
or joint venture, the sale of the patent. If a sci-
entist decides to develop an enterprise on his/
her own, TCC will help him/her to work out a
business plan, register the company, calculate
the cost, find suppliers and customers, etc.
In some countries (USA, Finland) technol-
ogy transfer is legally established as the “third
mission of universities” along with education
and R&D [7]. If a university does not fulfill this
obligation, it is deprived of the rights to its own
intellectual property.
In the world practice most universities
determine potential intellectual property rights
and the distribution of license income between
the university, department, inventor and cen-
tres. TTC receives 30% of the net license
income, which is directed to cover patent costs
and other legal costs for property management.
At the same time, the economic benefit from
TTC activities consists not so much in making
profit, as in creating new small and medium-
sized enterprises, well-paid jobs for highly
qualified personnel, and also in increasing tax
revenues of the budget in the course of com-
mercialization.
Independent technology transfer centres,
as well as those created on the basis of univer-
sities, are united in the networks of technology
transfer and support to innovation business. For
example, at present, the European network for
business support (Enterprise Europe Network
– EEN) unites about 250 syndicates, 600 orga-
nizations from 50 countries [8]. They provide
enterprises with integrated support to busi-
ness and innovations development, including
information services, support to business coop-
eratives, internationalization of enterprises,
knowledge and technologies transfer, partici-
pation of small and medium businesses in the
European Union framework programmes.
The U.S. has been interested in the issues
of technology transfer and commercialization
for several decades already, which, according
to American experts, was caused by two main
factors: firstly, by escalating competition in
high-tech sphere on the part of foreign com-
panies; secondly, by the desire to enhance
the efficiency of commercial use of research
results, obtained in the course of development
of federal budget allocations to R&D. The U.S.
accounts for 35% of the global R&D expendi-
tures according to purchasing power parity [9].
In the early 1990s the U.S. established the
National Technology Transfer Network con-
sisting of the principle national technology
transfer centre and six regional centres located
in the different parts of the country. The general
supervision over their activities is entrusted to
the National Aeronautics and Space Admin-
istration (NASA) that is aimed to enhance
economic performance of the implemented
large-scale space projects. The network is of
national importance and it provides the nec-
essary support in technology transfer to other
interested departments.
All this boosted technology transfer activi-
ties at all levels. Positive effects include the
increase in the number of applications for
inventions involving federal laboratories, the
increase in the number of granted patents and
the increase of private sector expenditures on
scientific research in universities.
The government does not provide direct
financial support to technology transfer cen-
tres. However, at the initial stage of TTC for-
mation (usually 5 – 10 years), national labo-
ratories and universities provide them with
significant financial support, from their own
resources directly. Subsequently, as soon as
TTC start gaining profit from the R&D results
commercialization, the volume of subsidies
on their activities is gradually reduced and,
ultimately, universities are relieved from the
necessity of providing direct subsidies to these
centres. In some cases TTC may receive direct
or indirect (through a university or national
laboratory) financial support from industrial
organizations as well.
183Economic and social changes: facts, trends, forecast 1 (25) 2013
YOUNG RESEARCHERS P.V. Ilyin
In Germany the functions of technology
intermediaries between laboratories and com-
panies are carried out by various scientific soci-
eties and joint research associations in indus-
try [10]. A leading organizational role belongs
to the Fraunhofer Society, which includes
58 research institutions [11]. Their activity is
funded by the federal government subsidies and
revenues from the contract R&D.
The main goal of the society is to promote
the introduction of new technologies in indus-
try and carry out nationwide research (for
instance, in the sphere of environmental pro-
tection and energy conservation). For promot-
ing the access of small enterprises to its services,
the government provides them with subsidies in
the amount of up to 40% of the full value of the
ordered R&D [11].
Local authorities, first of all, the govern-
ments of the Länder take active part in tech-
nology transfer. In particular, they contribute
a lot to the establishment of science parks and
innovation centres, considering this activity a
most important direction in solving regional
development problems.
Many of the state-subsidized intermediaries
depend on the financial assistance of third par-
ties as well, and, in order to stay afloat, they
explore a broader segment of the market besides
the market of technology transfer services.
A great number of such agencies, for exam-
ple, provide the services on organizing train-
ing seminars, trade exhibitions and financial
consultations, using public promotional pro-
grammes. This is why, transfer agencies dif-
fer in their structure. In Germany there are
over 190 transfer agencies and several hun-
dred other sources of technological informa-
tion [10] (business-incubators, demonstration
and application centres, technology transfer
departments under universities, the National
Research Centre, the Fraunhofer Society, the
Max Planck society, etc.).
The Japanese experience in establishing
TTC is also noteworthy, since the country has
achieved significant progress in the field of sci-
ence and industry integration and reflected its
cultural traditions in the choice of technology
transfer type. The Japanese system of support-
ing the appropriate level of technology transfer
is quite efficient.
The Japanese innovation model has the fol-
lowing structural elements:
a) a clear planning system has been formed
(since 1996 the five-year plans for science and
technology have been implemented, the so-
called Science and Technology Basic Plan,
in the framework of which there is a separate
strategic programme “Intellectual property”,
as well as a comprehensive strategy for the pro-
motion of science);
b) venture business laboratories in 45 uni-
versities have been established;
c) the agency for science and technologies,
the society for the promotion of science have
been formed;
d) a comprehensive interaction mechanism
“industry – academic science – government”
is being implemented [12].
It is considered important to promote the
commercialization of R&D results for their
practical application by scientific-research
institutes: for the last five years the number of
joint R&D projects of universities and industry
has doubled. Over the last three years almost
450 venture companies have been established
[12] that use the results of university R&D. con-
siderable importance is attached to the orga-
nization of technologies licensing, creation of
special organizations, which transfer the uni-
versity R&D results into industry.
The experience of the countries, which have
achieved considerable progress in technology
development and R&D results commercializa-
tion, may also be of particular interest.
In China in 1998, technology transfer cen-
tres existed only in Tsinghua University and
Peking University. At present, every major
research university has a technology transfer
department, initially financed by the Chinese
184 1 (25) 2013 Economic and social changes: facts, trends, forecast
Foreign experience of technology transfer and its application in Russia
Government from the total funds allocated to
the university by the Government. This model
of TTC funding has been changing in recent
years. Today, the majority of TTC function as
associated private companies, owned exclu-
sively by universities [3].
The current Russian innovation system fol-
lows the Soviet approach to innovation, which
can be described as “building on technology”
[5]. It envisages such phases as: research and
development, pilot production, industrial pro-
duction, marketing.
However, such an organization does not
reach the marketing stage in most cases. This
model works only in the conditions of guaran-
teed demand for the product, existing on a
highly regulated market. The innovation pro-
cess is more complicated in an open market
economy. As a rule, it begins with the assess-
ment of business opportunities rather than with
R&D activities. This is the model of “attract-
ing demand”, that includes a number of stages
from a concept to a product with a high demand
on the market: a study of opportunities for
business, preliminary assessment of the mar-
ket, preliminary technical assessment, market
research, business / financial analysis, product
development, design and technological docu-
mentation (this is the stage when R&D activi-
ties begin), internal testing of a product, mar-
ket testing, pilot production, pre-production
business analysis, launching of a product and
its entrance to the market.
The “building on technology” model has
several weaknesses. Firstly, it requires significant
volumes of investments in a large number of
potential innovation processes, only few of
which will reach the market stage. Secondly, the
“building on technology” focuses on the initial
research stage of innovation activities when
there is a high risk of scientific work becoming
an end in itself. Thirdly, technological process,
essentially, starts from scratch and ignores the
lessons learned in other areas of activity.
In Russia, the model of “building on
technology” in R&D commercialization is used
in the activities of TTC operating under
institutes and universities. One of the main tasks
of TTC consists in “project packaging”, i.e. in
the transformation of scientific research into a
business-project using international standards.
Technology transfer centres introduced rare
and well-represented technologies to the
market. And all of them found a potential
buyer only by accident. For the successful
commercialization, the process of technology
transfer should be based on market demand.
There are two main complementary ways of
improving technology transfer and accelerating
the innovation process in Russia. The first one
envisages the creation of new organizations (or
“organizational structures” such as networks
and partnerships) for the association and
cooperation of existing organizations in order
to implement technology transfer.
The second one consists in the creation of
efficient tools and mechanisms managing and
supporting the interaction between innovation
organizations. This includes, for example,
a contractual base of intellectual property
licensing, the use of contracts, etc. In practice,
both approaches are often used simultaneously:
in order to license technologies efficiently, many
universities and research institutions create
technology licensing offices or technology
transfer offices.
In recent years the development of the
market of technology transfer and com-
mercialization in Russia has received significant
information, material and resource support.
The main initiatives in the science and tech-
nology development have been recognized by
the wide scientific community. To illustrate the
development of a new market in the country,
we can mention the following:
– creation of the databases of scientific
and scientific-technological projects, which
are based on innovations;
– carrying out the state-subsidized annual
selection of promising innovation projects
having patent clearance and industrial app-
licability;

185Economic and social changes: facts, trends, forecast 1 (25) 2013
YOUNG RESEARCHERS P.V. Ilyin
– implementation of activities aimed at
explaining the importance of intellectual
property rights to the objects created as a result
of such projects implementation;
– adoption of the laws on special economic
zones, focus on the organization of technology
parks in these particular regions [6].
However, the development of innovation
economy requires not only an innovation
component, but also financial, administrative
and marketing infrastructure. Now the RF
Government proposes the establishment of
several state venture funds that will invest in
high-tech enterprises. Such a decision can be
relatively efficient. But in order to get high
performance, private financial institutions
should be also involved, as they can work more
efficiently than government venture capital
funds.
A complex investment, marketing and
management support to the projects of
commercialization and technology transfer is
a promising direction of the activities for
private financial organizations. In this case, the
process of technology transfer is considered as
part of commercialization process, one of its
components, necessary for the promotion of
science-intensive, innovation products both
on the domestic and international markets.
At that, export is particularly important:
the expansion of export structure due to the
transfer of domestic high technologies creates
the conditions for long-term international
cooperation. Establishment of the balanced
system of technology transfer in Russia will
provide a reliable barrier for selling abroad
our latest technologies for a song. A Russian
developer gets access to foreign investment
and acquires the experience of international
cooperation necessary for the development of
domestic production.
Thus, the development of the country’s
economy requires the increase of the pace of
unique and progressive technologies transfer,
the attraction of financial resources for boosting
innovation activity. At that, the introduction of
innovations at enterprises should be arranged
on a systemic basis.
References1. Strelkov O.I. The Russian index of inventive activity. Available at: http://www.akvobr.ru/rossiiskii_indeks_
izobretatelskoi_aktivnosti.html
2. The INSEAD study: the Global innovation index, 2012. Centre of humanitarian technologies. Available at:
http://gtmarket.ru/news/2012/07/06/4531
3. The review of international experience of innovation development. Science and technology of the Russian
Federation. Available at: http://www.strf.ru/material.aspx?CatalogId=223&d_no=39679
4. Official information portal of Switzerland. Available at: http://www.swissworld.org/ru/nauka/nauka_i_
gosudarstvo/transfer_tekhnologii/
5. A critical analysis of the practice of the scientific and technological innovation activity and the results of technology
commercialization in the Russian Federation and EU. Available at: http://www.marsiada.ru/357/464/725/684
6. Kolmakov V.M. Introduction in technology transfer. Available at: http://www.innovbusiness.ru/content/
document_r_32324CCC-3415-4775-AD09-FFE60AED3E6F.html
7. Terebova S.V. Technology transfer as an element of innovation economy development. Problems of development
of territories. 2010. No. 4. P. 31-36.
8. European network of business support. Available at: http://www.gate2rubin.ru/een
9. The report of the Director of the RAS Institute for US and Canadian Studies, RAS Corresponding Member
S.M. Rogov at the meeting of RAS Presidium. Available at : http://www.iskran.ru/news.php?id=91#_edn1
10. Dagayev A. Technology transfer from public sector to industry as an instrument of state innovation policy. Available
at: http://vasilievaa.narod.ru/ptpu/13_5_99.htm
11. Fraunhofer society for the promotion of applied research. The programme of support to talented scientists.
Available at: http://csr.spbu.ru/archives/10678
12. Japan’s viewpoint on the issue of participation in the international exchange of technologies. Available at: http://
www.innovprom.ru/poziciya-yaponii-po-voprosu-uchastiya-v-mezhdunarodnom-obmene-texnologij

Information about authors
Avetisyan Ishkhan Artashovich
Academic degree Doctor of Economics
Academic rank Professor, Honorary Figure of Russian Higher Education
Full name of the organization – the
place of employment
Vologda State Technical University
Work status Professor of the Finance and Credit Department
Off. Tel. / Fax (8172) 53-17-54
Mailing address 15, Lenin Street, Vologda, 160000, Russia
Aliyev Adalyat Bairamali ogly
Academic degree Doctor of Engineering
Academic rank Professor
Full name of the organization – the
place of employment
Azerbaijan University of Architecture and Construction
Work status Professor of the Construction Economics Department
Off. Tel. / Fax (+994 12) 538-94-57
E-mail [email protected]
Mailing address 5, A. Sultanov Street, Baku, AZ-1073, Azerbaijan
Vasilyev Anatoliy Mikhailovich
Academic degree Doctor of Economics
Academic rank Associate Professor, Honoured Economist of the Russian Federation
Full name of the organization – the
place of employment
G.P. Luzin Institute of Economic Problems of Kola Scientific Centre of RAS
Work status Head of the Arctic Marine Economics Department
Off. Tel. / Fax (8152) 25-35-58
E-mail [email protected]
Mailing address 15, Khalturin Street, office 510, Murmansk, 183010, Russia
Glazyev Sergey Yuryevich
Academic degree Doctor of Economics
Academic rank RAS Academician, Professor
Full name of the organization – the
place of employment
Russian Federation Presidential Administration
Work status Presidential Advisor
Off. Tel. / Fax (495) 606-79-10
E-mail [email protected]
Mailing address 4, Staraya Square, Moscow, Russia
Gisin Lev Mikhailovich
Academic degree Postgraduate Student
Academic rank
Full name of the organization – the
place of employment
Russian Presidential Academy of National Economy and Public Administration
Work status
Off. Tel. / Fax
E-mail [email protected], [email protected]
Mailing address
186 1 (25) 2013 Economic and social changes: facts, trends, forecast

Ilyin Vladimir Aleksandrovich
Academic degree Doctor of Economics
Academic rank Professor, Honoured Scientist of the Russian Federation
Full name of the organization – the
place of employment
Institute of Socio-Economic Development of Territories of Russian Academy of Sciences
Work status Director, Chairman of the Public Chamber in the Vologda Oblast
Off. Tel. / Fax (8172) 59-78-01
E-mail [email protected], [email protected]
Mailing address 56A Gorky Street, Vologda, 160014, Russia
Ilyin Pyotr Vladimirovich
Academic degree Postgraduate student of the Innovation Management Depertment
Academic rank
Full name of the organization – the
place of employment
Saint Petersburg State University of Economics and Finance
Work status
Off. Tel. / Fax
E-mail [email protected]
Mailing address
Kondakova Nataliya Aleksandrovna
Academic degree
Academic rank
Full name of the organization – the
place of employment
Institute of Socio-Economic Development of Territories of Russian Academy of Sciences
Work status Junior Scientific Associate of the Department of Living Standard and Lifestyle Studies
Off. Tel. / Fax (8172) 59-78-10
E-mail [email protected]
Mailing address 56A Gorky Street, Vologda, 160014, Russia
Kurilo Anna Yevgenyevna
Academic degree Ph.D. in Economics
Academic rank Associate Professor
Full name of the organization – the
place of employment
Institute of Economics of Karelian scientific center of RAS
Work status Senior Scientific Associate of the Department for the Regional Development Modeling and
Forecast
Off. Tel. / Fax (8142) 57-15-25 / 57-22-10
E-mail [email protected]
Mailing address 50, Alexander Nevsky Avenue, Petrozavodsk, Republic of Karelia,185030, Russia
Nemkovich Yevgeniy Grigoryevich
Academic degree Ph.D. in Technical Sciences
Academic rank Associate Professor
Full name of the organization – the
place of employment
Institute of Economics of Karelian scientific center of RAS
Work status Leading Scientific Associate of the Department for Territorial Strategies and Programmes
Off. Tel. / Fax (8142) 57-22-10 / 57-22-10
E-mail [email protected]
Mailing address 50, Alexander Nevsky Avenue, Petrozavodsk, Republic of Karelia,185030, Russia
187Economic and social changes: facts, trends, forecast 1 (25) 2013
Mazilov Yevgeniy Aleksandrovich
Academic degree
Academic rank
Full name of the organization – the
place of employment
Institute of Socio-Economic Development of Territories of Russian Academy of Sciences
Work status Junior Scientific Associate of the Innovation Economics Department
Off. Tel. / Fax (8172) 59-78-04
E-mail [email protected]
Mailing address 56A Gorky Street, Vologda, 160014, Russia
Milashevich Yelena Aleksandrovna
Academic degree
Academic rank
Full name of the organization – the
place of employment
Institute of Economics of the National Academy of Sciences of Belarus
Work status Scientific Associate
Off. Tel. / Fax +375-17-2841387 / +375-17-2841387
E-mail [email protected]
Mailing address 1, Surganov Street, building 2, Minsk, 220072, Republic of Belarus
Mironenko Nataliya Voktorovna
Academic degree
Academic rank
Full name of the organization – the
place of employment
Vologda State Technical University
Work status Lecturer at the Finance and Credit Department
Off. Tel. / Fax (8172) 53-19-44
E-mail [email protected]
Mailing address 81A, Gagarin Street, Vologda,160002, Russia
Morev Mikhail Vladimirovich
Academic degree Ph.D. in Economics
Academic rank
Full name of the organization – the
place of employment
Institute of Socio-Economic Development of Territories of Russian Academy of Sciences
Work status Scientific Associate
Off. Tel. / Fax (8172) 59-78-10
E-mail [email protected]
Mailing address 56A Gorky Street, Vologda, 160014, Russia
Povarova Anna Ivanovna
Academic degree
Academic rank
Full name of the organization – the
place of employment
Institute of Socio-Economic Development of Territories of Russian Academy of Sciences
Work status Scientific Associate of the Department of Social and Economic Development and Management in
the Territorial Systems
Off. Tel. / Fax 8 (8172) 59-78-10
E-mail [email protected]
Mailing address 56A Gorky Street, Vologda, 160014, Russia
188 1 (25) 2013 Economic and social changes: facts, trends, forecast
Popov Andrey Vasilyevich
Academic degree
Academic rank
Full name of the organization – the
place of employment
Institute of Socio-Economic Development of Territories of Russian Academy of Sciences
Work status Junior Scientific Associate of the Department of Living Standard and Lifestyle Studies
Off. Tel. / Fax (8172) 59-78-04
E-mail [email protected]
Mailing address 56A Gorky Street, Vologda, 160014, Russia
Tikhomirova Valentina Valentinovna
Academic degree Ph.D. in Economics
Academic rank
Full name of the organization – the
place of employment
Institute of Socio-Economic and Energy Problems of the North Komi Science Centre, Ural RAS
Department
Work status Senior Scientific Associate at the Laboratory of Financial and Economic Studies
Off. Tel. / Fax (8212) 44-06-84
E-mail [email protected]
Mailing address 26, Kommunisticheskaya Street, Syktyvkar, 167982, Russia
Fetisov Gleb Gennadyevich
Academic degree Doctor of Economics
Academic rank RAS Corresponding Member, Professor
Full name of the organization – the
place of employment
Federal State-Funded Research Institution the Council for the Study of Productive Forces under the
RF Ministry of Economic Development and RAS
Work status Chairman of the Council
Off. Tel. / Fax (499) 135-61-08
E-mail [email protected]
Mailing address 7, Vavilov Street, GSP-7Moscow, 117997, Russia
Chayka Larisa Viktorovna
Academic degree Ph.D. in Economics
Academic rank Associate Professor
Full name of the organization – the
place of employment
Institute of Socio-Economic and Energy Problems of the North Komi Science Centre, Ural RAS
Department
Work status Senior Scientific Associate
Off. Tel. / Fax (8212) 24-34-70
E-mail [email protected]
Mailing address 26 Kommunisticheskaya Street, GSP-2, Syktyvkar, 167982, Russia
Shabunova Aleksandra Anatolyevna
Academic degree Doctor of Economics
Academic rank Associate Professor
Full name of the organization – the
place of employment
Institute of Socio-Economic Development of Territories of Russian Academy of Sciences
Work status Deputy Director, Head of the Department of Living Standard and Lifestyle Studies
Off. Tel. / Fax (8172) 59-78-20
E-mail [email protected]
Mailing address 56A Gorky Street, Vologda, 160014, Russia
189Economic and social changes: facts, trends, forecast 1 (25) 2013

Requirements to manuscripts
The proposed articles should contain the results of the studies characterized by novelty and practical
orientation. They should be available in the form of presentation for a wide range of readers and meet the
scientific focus of the journal (economic and sociological researches).
The article should generally include the following aspects: the purpose of research; method and
methodology of work, its results and the field of their application; conclusions. The findings may be
accompanied by recommendations, suggestions and hypotheses, resulting from the contents of the article.
When presenting the results of sociological research in the article, it is necessary to state the following
information: methods and methodology; the date, place (territory) and organization which carried out the
study; the structure of total population; the type, volume and sampling error; the description of methods
of data collection and analysis. This information should be arranged according to one of the following
options: in the special section (paragraph) of the article; directly in the text; in the footnote. When creating
tables, it is necessary to specify, whether the percentage of persons is calculated out of the number of those
who answered the question, or out of the total amount of respondents. References should demonstrate the
author’s professional outlook and the quality of the research.
Authors are responsible for the selection and authenticity of the facts, quotations, statistical and
sociological data, proper names, place names and other information, as well as for ensuring that the article
does not contain the data that cannot be liable to open publication.
The cost parameters in tables (diagrams) related to different time periods are usually represented in
the form of comparable scores. If tables (diagrams) contain comparative data on some territories, kinds of
economic activities, etc., they should be presented in rank order, indicating the period of ranking.
The volume of articles should be no more than 40 000 printed characters (1 author list), including
spaces and footnotes, for doctorates and PhDs (including the co-authors having no degree). It should
contain no more than 20 000 printed characters (0.5 AL) for the rest of the authors. Exceptions are possible
only in terms of a preliminary agreement with the editorial board.
The author should send the text of the article and supporting information in printed form by mail (1
copy on one side of the sheet) and identical materials by e-mail. The printed copy must be signed by the
author(s).
The text of the article is sent in MS Word format, in accordance with the following parameters: headset
Times Roman, font size – 14-point type, line spacing – 1.5, footnotes in Arabic numerals are placed at
the end of the text in the order mentioned in the text. Graphs and charts for an electronic version of the
articles are performed in MS Excel. They should be done in a separate file, which must contain not only
the graphics, but initial data (tables). Flowcharts are drawn in MS Word or MS VISIO-2003.
The article should be assigned the UDC index (it is located above the title of the article).
The article should be accompanied by the abstract (600-700 printed characters; the summary is supposed
to contain the following aspects: statement of problem, research techniques and information resources,
characteristic of basic research results, the ways of problem solving), key words in the English and Russian languages, references.
The works in references are arranged in alphabetical order, firstly in the Russian language, then – in
English (other languages – in Latin). When the author makes reference to the work, it is necessary to give
its number in square brackets.
Information about authors is attached to the article in a separate file. It should contain the title of the
article (in Russian and English), surname, name and patronymic (in full), academic degree, academic rank,
full name and address of the organization – the place of employment, work status, telephone and fax
numbers, e-mail address and mailing address for correspondence.
The electronic version of the article should include author’s color photo (print size – 4x6 cm; file type
– TIF (preferred) or JPEG; photo format – 300 dpi).
190 1 (25) 2013 Economic and social changes: facts, trends, forecast

In accordance with the requirements of the Civil Code of the Russian Federation the authors and the
editorial board of the journal should conclude a License agreement enclosed by the Product acceptance
and conveyance certificate. These documents are drawn up on the form below and signed by all authors
of the article. They should be submitted to the editorial board along with the text of the article. A copy of
the agreement signed by the editorial board will be sent to the authors by mail with a copy of the author’s
journal issue.
Manuscripts should be sent by mail to: 56A Gorky Street, Vologda, 160014, Russia, ISEDT RAS, the
editorial board, marked “for publication in the Journal “Economic and Social Changes: Facts, Trends,
Forecast”, and to e-mail: [email protected]. Fax: (8172) 59-78-02. Tel. (8172) 59-78-31 .
It is obligatory to refer to the journal at full or partial reprint of manuscripts in another publication.
All manuscripts are liable to reviewing. If a reviewer has any questions, the article is returned for revision.
Delivery date of the article is the date when the editorial board receives the final version of the article.
The editors reserve the right to make editorial changes and cuts that do not distort the meaning of the article.
Since 2010, the journal has opened a rubric “Young researchers”, which publishes manuscripts of
postgraduate students. The article should be written without co-authors. It must be certified by a research
supervisor and recommended by the research organization to which the postgraduate student is assigned.
Attention! In cases these requirements are not met the article is not considered by the editorial board.
Electronic version of the journal is available at: http://esc.vscc.ac.ru.
191Economic and social changes: facts, trends, forecast 1 (25) 2013

SUBSCRIPTION INFORMATION
Dear Colleagues,
we offer you to subscribe to the journal
“Economic and Social Changes: Facts, Trends, Forecast”.
The founder: Institute of Socio-Economic Development of Territories of Russian Academy of Science
(ISEDT RAS) (previously - VSCC CEMI RAS).
The Journal publishes the researching results on the performance evaluation of regional socio-economic
systems of the North-West Federal District of Russia, economy sectors of the District’s subjects and
municipalities in the following directions:
– Development strategy;
– Regional economy;
– Social development;
– Foreign economic relations;
– Information economy;
– Problem of expanded reproduction, etc.
The Journal is included in the database of Russian Science Citation Index (RSCI).
According to the decision of the Presidium of the Higher Attestation Commission of the Russian
Education and Science Ministry № 6/6 of February 19, 2010 the Journal is included in the List of leading
scientific publications, recommended for publishing the results of doctorial and candidate theses.
The main purpose of the Journal is to provide the scientific community and practitioners with the
possibility to familiarize themselves with the results of research in the sphere of scientific support for the
regional economy, to participate in discussions on these issues.
The Editorial Board which carries out an independent examination of scientific papers consists of the
leading scientists from several regions of Russia.
The Journal is published 6 times a year.
The Journal is included in the inter-regional part of the Russian press catalogue “Post of Russia”:
Subscription Index 83428.
Catalogue price of one issue of the journal is 250 rubles (excluding delivery). The subscription form is
annexed.
192 1 (25) 2013 Economic and social changes: facts, trends, forecast
Editor O.V. Tretyakova
Make-up page T.V. Popova, E.S. Nefedova
Proof-readers A.A. Sokolova
Translators O.V. Tretyakova, A.A. Sokolova
Passed for printing March 12, 2013.
Date of publication March 15, 2013.
Format 60×841/8. Digital recording.
Con. pr. sheets 22.6. Number of 100 copies. Order No. 68.
Price is open.
The journal is registered by the Federal Service
for Supervision of Telecom and Mass Communications (Roskomnadzor).
Certificate of registration PI FS77-49490 dated April 20, 2012.
Founder: Federal State Budget Scientific Establishment Institute of Socio-Economic Development
of Territories of RAS (ISEDT RAS)
Address of the Publisher and Editorial office:
56A, Gorky St., Vologda, 160014, Russia
phone (8172) 59-78-03, fax (8172) 59-78-02, e-mail: [email protected]