Economic and social development - digitales archiv
501
digitales archiv ZBW – Leibniz-Informationszentrum Wirtschaft ZBW – Leibniz Information Centre for Economics Other participants: Burilovic, Luka; Rados, Tomislav; Recker, Nicholas Book Economic and social development : 63rd International Scientific Conference on Economic and Social Development - "Building Resilient Society" : book of proceedings : Zagreb, 11-12 December 2020 Provided in Cooperation with: Varazdin Development and Entrepreneurship Agency This Version is available at: http://hdl.handle.net/11159/4961 Kontakt/Contact ZBW – Leibniz-Informationszentrum Wirtschaft/Leibniz Information Centre for Economics Düsternbrooker Weg 120 24105 Kiel (Germany) E-Mail: [email protected] https://www.zbw.eu/econis-archiv/ Standard-Nutzungsbedingungen: Dieses Dokument darf zu eigenen wissenschaftlichen Zwecken und zum Privatgebrauch gespeichert und kopiert werden. Sie dürfen dieses Dokument nicht für öffentliche oder kommerzielle Zwecke vervielfältigen, öffentlich ausstellen, aufführen, vertreiben oder anderweitig nutzen. Sofern für das Dokument eine Open- Content-Lizenz verwendet wurde, so gelten abweichend von diesen Nutzungsbedingungen die in der Lizenz gewährten Nutzungsrechte. Terms of use: This document may be saved and copied for your personal and scholarly purposes. You are not to copy it for public or commercial purposes, to exhibit the document in public, to perform, distribute or otherwise use the document in public. If the document is made available under a Creative Commons Licence you may exercise further usage rights as specified in the licence. zbw Leibniz-Informationszentrum Wirtschaft Leibniz Information Centre for Economics
-
Upload
khangminh22 -
Category
Documents
-
view
0 -
download
0
Transcript of Economic and social development - digitales archiv

digitales archivZBW – Leibniz-Informationszentrum WirtschaftZBW – Leibniz Information Centre for Economics
Other participants: Burilovic, Luka; Rados, Tomislav; Recker, Nicholas
BookEconomic and social development : 63rd International ScientificConference on Economic and Social Development - "BuildingResilient Society" : book of proceedings : Zagreb, 11-12 December2020
Provided in Cooperation with:Varazdin Development and Entrepreneurship Agency
This Version is available at:http://hdl.handle.net/11159/4961
Kontakt/ContactZBW – Leibniz-Informationszentrum Wirtschaft/Leibniz Information Centre for EconomicsDüsternbrooker Weg 12024105 Kiel (Germany)E-Mail: [email protected]://www.zbw.eu/econis-archiv/
Standard-Nutzungsbedingungen:Dieses Dokument darf zu eigenen wissenschaftlichen Zweckenund zum Privatgebrauch gespeichert und kopiert werden. Siedürfen dieses Dokument nicht für öffentliche oder kommerzielleZwecke vervielfältigen, öffentlich ausstellen, aufführen, vertreibenoder anderweitig nutzen. Sofern für das Dokument eine Open-Content-Lizenz verwendet wurde, so gelten abweichend von diesenNutzungsbedingungen die in der Lizenz gewährten Nutzungsrechte.
Terms of use:This document may be saved and copied for your personaland scholarly purposes. You are not to copy it for public orcommercial purposes, to exhibit the document in public, toperform, distribute or otherwise use the document in public. Ifthe document is made available under a Creative CommonsLicence you may exercise further usage rights as specified inthe licence.
zbw Leibniz-Informationszentrum WirtschaftLeibniz Information Centre for Economics

Varazdin Development and Entrepreneurship Agency and University North in cooperation with
Croatian Chamber of Economy Faculty of Management University of Warsaw
Faculty of Law, Economics and Social Sciences Sale - Mohammed V University in Rabat Polytechnic of Medimurje in Cakovec
Economic and Social Development
63rd International Scientific Conference on Economic and Social Development Development – "Building Resilient Society"
Book of Proceedings
Editors:
Luka Burilovic, Tomislav Rados, Nicholas Recker
Zagreb, 11-12 December 2020

Varazdin Development and Entrepreneurship Agency and University North in cooperation with
Croatian Chamber of Economy Faculty of Management University of Warsaw
Faculty of Law, Economics and Social Sciences Sale - Mohammed V University in Rabat Polytechnic of Medimurje in Cakovec
Editors: Luka Burilovic, Croatian Chamber of Economy, Croatia
Tomislav Rados, Croatian Chamber of Economy, Croatia Nicholas Recker, Metropolitan State University of Denver, United States
Economic and Social Development 63rd International Scientific Conference on Economic and Social Development Development –
"Building Resilient Society"
Book of Proceedings
This esd Conference is part of the project “Centar održivog razvoja”/"Center of sustainable
development", co-financed by the European Union from the European regional development fund and
implemented within Operational Programme Competitiveness and Cohesion 2014 – 2020 of the Republic
of Croatia, based on the call "Investing in Organizational Reform and Infrastructure in the Research,
Development and Innovation Sector".
Due to the Covid-19 restrictions and epidemiological measures, the Program of the Conference has been
scheduled online. All Sessions and Presentations have been presented via Discord platform.
Zagreb, 11-12 December 2020
Title ◼ Economic and Social Development (Book of Proceedings), 63rd International Scientific Conference on Economic and Social
Development Development - "Building Resilient Society"
Editors ◼ Luka Burilovic, Tomislav Rados, Nicholas Recker
Scientific Committee / Programski Odbor ◼ Marijan Cingula (President), University of Zagreb, Croatia; Sannur Aliyev, Azerbaijan State
University of Economics, Azerbaijan; Ayuba A. Aminu, University of Maiduguri, Nigeria; Anona Armstrong, Victoria University, Australia;
Gouri Sankar Bandyopadhyay, The University of Burdwan, Rajbati Bardhaman, India; Haimanti Banerji, Indian Institute of Technology,
Kharagpur, India; Victor Beker, University of Buenos Aires, Argentina; Asmae Benthami, Mohammed V University, Morocco; Alla Bobyleva,
The Lomonosov Moscow State University, Russia; Leonid K. Bobrov, State University of Economics and Management, Novosibirsk, Russia;
Rado Bohinc, University of Ljubljana, Slovenia; Adnan Celik, Selcuk University, Konya, Turkey; Angelo Maia Cister, Federal University of
Rio de Janeiro, Brasil; Mirela Cristea, University of Craiova, Romania; Taoufik Daghri, Mohammed V University, Morocco; Oguz Demir,
Istanbul Commerce University, Turkey; T.S. Devaraja, University of Mysore, India; Onur Dogan, Dokuz Eylul University, Turkey; Darko
Dukic, University of Osijek, Croatia; Gordana Dukic, University of Osijek, Croatia; Alba Dumi, Vlora University, Vlore, Albania; Galina
Pavlovna Gagarinskaya, Samara State University, Russia; Mirjana Gligoric, Faculty of Economics - Belgrade University, Serbia; Maria Jose
Angelico Goncalves, Porto Accounting and Business School - P.Porto, Portugal; Mehmet Emre Gorgulu, Afyon Kocatepe University, Turkey;
Klodiana Gorica, University of Tirana, Albania; Aleksandra Grobelna, Gdynia Maritime University, Poland; Liudmila Guzikova, Peter the
Great Saint-Petersburg Polytechnic University, Russia; Anica Hunjet, University North, Koprivnica, Croatia; Khalid Hammes, Mohammed V
University, Morocco; Oxana Ivanova, Ulyanovsk State University, Ulyanovsk, Russia; Irena Jankovic, Faculty of Economics, Belgrade
University, Serbia; Myrl Jones, Radford University, USA; Hacer Simay Karaalp, Pamukkale University, urkey; Dafna Kariv, The College of
Management Academic Studies, Rishon Le Zion, Israel; Hilal Yildirir Keser, Uludag University, Bursa, Turkey; Sophia Khalimova, Institute
of Economics and Industrial Engineering of Siberian Branch of Russian Academy of Science, Novosibirsk, Russia; Marina Klacmer Calopa,
University of Zagreb, Croatia; Igor Klopotan, Medjimursko Veleuciliste u Cakovcu, Croatia; Vladimir Kovsca, University of Zagreb, Croatia;
Goran Kozina, University North, Koprivnica, Croatia; Dzenan Kulovic, Univeristy of Zenica, Bosnia and Herzegovina; Robert Lewis, Les
Roches Gruyere University of Applied Sciences, Bulle, Switzerland; Ladislav Lukas, Univ. of West Bohemia, Faculty of Economics, Czech
Republic; Mustapha Machrafi, Mohammed V University, Morocco; Joao Jose Lourenco Marques, University of Aveiro, Portugal; Pascal
Marty, University of La Rochelle, France; Vaidotas Matutis, Vilnius University, Lithuania; Daniel Francois Meyer, North West University,
South Africa; Marin Milkovic, University North, Koprivnica, Croatia; Abdelhamid Nechad, Abdelmalek Essaadi University, Morocco; Gratiela
Georgiana Noja, West University of Timisoara, Romania; Zsuzsanna Novak, Corvinus University of Budapest, Hungary; Tomasz Ochinowski,
University of Warsaw, Poland; Barbara Herceg Paksic, University of Osijek, Croatia; Vera Palea, Universita degli Studi di Torino, Italy; Dusko
Pavlovic, Libertas International University, Zagreb, Croatia; Igor Pihir, University of Zagreb, Croatia; Dmitri Pletnev, Chelyabinsk State
University, Russian Federation; Miroslaw Przygoda, University of Warsaw, Poland; Karlis Purmalis, University of Latvia, Latvia; Nicholas
Recker, Metropolitan State University of Denver, USA; Kerry Redican, Virginia Tech, Blacksburg, USA; Humberto Ribeiro, University of
Aveiro, Portugal; Robert Rybnicek, University of Graz, Austria; Elzbieta Szymanska, Bialystok University of Technology, Poland; Katarzyna
Szymanska, The State Higher School of Vocational Education in Ciechanow, Poland; Ilaria Tutore, University of Naples Parthenope, Italy;
Sandra Raquel Alves, Polytechnic of Leiria, Portugal; Joanna Stawska, University of Lodz, Poland; Ilko Vrankic, University of Zagreb, Croatia;
Stanislaw Walukiewicz, Bialystok University of Technology, Poland; Thomas Will, Agnes Scott College, USA; Li Yongqiang, Victoria
University, Australia; Peter Zabielskis, University of Macau, China; Silvija Zeman, Medjimursko Veleuciliste u Cakovcu, Croatia; Tao Zeng,
Wilfrid Laurier University, Waterloo, Canada; Snezana Zivkovic, University of Nis, Serbia.
Review Committee / Recenzentski Odbor ◼ Marina Klacmer Calopa (President); Ana Aleksic; Sandra Raquel Alves; Ayuba Aminu; Mihovil
Andjelinovic; Josip Arneric; Lidija Bagaric; Tomislav Bakovic; Sanja Blazevic; Leonid Bobrov; Ruzica Brecic; Anita Ceh Casni; Iryna
Chernysh; Mirela Cristea; Oguz Demir; Stjepan Dvorski; Robert Fabac; Ivica Filipovic; Sinisa Franjic; Fran Galetic; Mirjana Gligoric;
Tomislav Globan; Anita Goltnik Urnaut; Tomislav Herceg; Irena Jankovic; Emina Jerkovic; Dafna Kariv; Oliver Kesar; Hilal Yildirir Keser;
Martina Dragija Kostic; Tatjana Kovac; Vladimir Kovsca; Angelo Maia Cister; Katarina Marosevic; Vaidotas Matutis; Marjana Merkac Skok;
Daniel Francois Meyer; Natanya Meyer; Josip Mikulic; Ljubica Milanovic Glavan; Guenter Mueller; Ivana Nacinovic Braje; Zlatko Nedelko;
Gratiela Georgiana Noja; Zsuzsanna Novak; Alka Obadic; Claudia Ogrean; Igor Pihir; Najla Podrug; Vojko Potocan; Dinko Primorac; Zeljka
Primorac; Sanda Renko; Humberto Ribeiro; Vlasta Roska; Souhaila Said; Armando Javier Sanchez Diaz; Tomislav Sekur; Lorena Skuflic;
Mirko Smoljic; Petar Soric; Mario Spremic; Matjaz Stor; Tomasz Studzieniecki; Lejla Tijanic; Daniel Tomic; Boris Tusek; Rebeka Daniela
Vlahov; Ilko Vrankic; Thomas Will; Zoran Wittine; Tao Zeng; Grzegorz Zimon; Snezana Zivkovic; Berislav Zmuk.
Organizing Committee / Organizacijski Odbor ◼ Domagoj Cingula (President); Djani Bunja; Marina Klacmer Calopa; Spomenko Kesina;
Erlino Koscak; Tomasz Ochinowski; Miroslaw Przygoda; Michael Stefulj; Rebeka Danijela Vlahov; Sime Vucetic.
Publishing Editor ◼ Spomenko Kesina, Mario Vrazic, Domagoj Cingula
Publisher ◼ Design ◼ Print ◼ Varazdin Development and Entrepreneurship Agency, Varazdin, Croatia / University North, Koprivnica,
Croatia / Croatian Chamber of Economy, Zagreb, Croatia / Faculty of Management University of Warsaw, Warsaw, Poland / Faculty of Law,
Economics and Social Sciences Sale - Mohammed V University in Rabat, Morocco / Polytechnic of Medimurje in Cakovec, Cakovec, Croatia
Printing ◼ Online Edition
ISSN 1849-7535
The Book is open access and double-blind peer reviewed.
Our past Books are indexed and abstracted by ProQuest, EconBIZ, CPCI (Web of Science) and EconLit databases and available for download
in a PDF format from the Economic and Social Development Conference website: http://www.esd-conference.com
© 2020 Varazdin Development and Entrepreneurship Agency, Varazdin, Croatia; University North, Koprivnica, Croatia; Croatian
Chamber of Economy, Zagreb, Croatia; Faculty of Management University of Warsaw, Warsaw, Poland; Faculty of Law, Economics
and Social Sciences Sale - Mohammed V University in Rabat, Morocco; Polytechnic of Medimurje in Cakovec, Cakovec, Croatia. All
rights reserved. Authors are responsible for the linguistic and technical accuracy of their contributions. Authors keep their copyrights for further
publishing.

CONTENTS
ECONOMIC POTENTIAL AS A MEASURE OF STRENGTH OF TERRITORIAL
UNITS - QUANTITATIVE ANALYSIS BASED ON EU MEMBER STATES IN 2018 .. 1 Adrianna Mastalerz-Kodzis
DECISION-MAKING PROCESS OF TOP MANAGERS IN SLOVENIA AND
COMPANIES’ ORIENTATION TO FOREIGN MARKETS........................................... 11
Damjan Grusovnik, Dusko Ursic, Alenka Kavkler
A THEORETICAL APPROACH TO THE CONCEPT OF THE CLUSTER ................ 18 Jose G. Vargas-Hernandez, Jose Sergio Morones Servin, Omar Cristian Vargas Gonzalez
TYPES OF INNOVATIONS AND FIRM PRODUCTIVITY IN RUSSIA ...................... 28 Karina Nagieva, Andrey Pushkarev, Natalia Davidson, Oleg Mariev
THE INFLUENCE OF VALUE ADDED TAX ON THE FORMATION OF PRICES IN
HOSPITALITY ON THE TERRITORY OF THE REPUBLIC OF CROATIA ............ 37
Anita Grubisic, Toni Miljak, Andela Mustafovski
THE INFORMATION SOCIETY AGAINST THE BACKGROUND OF
CONTEMPORARY PROBLEMS OF GLOBALISATION .............................................. 44 Anna Janiga-Cmiel
SOCIO-ECONOMIC DEVELOPMENT OF INDUSTRIAL REGIONS AS A FACTOR
FOR REALIZING THE POTENTIAL OF WORKING YOUTH .................................... 53
Lyudmila Bannikova, Anastasia Yuzhakova
CROATIAN CUSTOMERS ATTITUDE TOWARDS MOBILE ADVERTISING - SEM
APPROACH ........................................................................................................................... 58
Valentina Slunjski, Damir Dobrinic, Iva Gregurec
PRACTICAL EXPERIENCE USING THE TOOLS OF DIGITALIZATION IN THE
EDUCATIONAL ENVIRONMENT .................................................................................... 72
Daria Shalina, Natalia Stepanova, Viola Larionova
FINANCIAL STRUCTURES IN RETAIL TRADE, EXCEPT OF MOTOR VEHICLES
AND MOTORYCLES IN THE REPUBLIC OF CROATIA ............................................ 79 Dina Korent
DO CAUSAL AND EFFECTUAL APPROACHES TO ENTREPRENEURSHIP
EQUALLY DRIVE THE CREATION OF SOCIAL CAPITAL? A THEORETICAL
EXAMINATION .................................................................................................................... 93 Mihaela Mikic, Tin Horvatinovic, Martina Dronjak
JOB SEARCH - INFORMATION ON POSSIBILITIES OF JOB APPLICATION IN
THE ENVIRONMENT OF MARGINALIZED ROMA COMMUNITIES IN SLOVAKIA
................................................................................................................................................ 101 Erik Satara, Jurina Rusnakova, Lydia Gabcova
EVALUATION OF FINANCIAL HEALTH OF CZECH CONSTRUCTION
COMPANIES USING PREDICTION MODELS ............................................................. 111
Simona Cincalova, Jaroslav Jansky
THE POWER OF ELITE ON BUSINESS: A CASE FROM THE EARLY
MERCATILISM PERIOD .................................................................................................. 120 Eduardo Manuel de Almeida Leite, Humberto Nuno Rito Ribeiro, Sandra Raquel Alves, Amelia
Ferreira da Silva, Ana Leite
REVOLUTION IN INDUSTRY AND EVOLUTION IN EDUCATION OR
DEVELOPMENT OF INTELLIGENCE .......................................................................... 133 Venelin Terziev, Marusya Lyubcheva, Olga Andreeva, Marin Georgiev
ANALYSIS OF SELECTED PROBLEMS OF THE MODERN WORLD IN THE
CONTEXT OF MUNICIPAL WASTE MANAGEMENT .............................................. 143 Karolina Gwarda
THE USE OF FUZZY MODELLING TO INVEST IN THE POLISH CAPITAL
MARKET IN THE PANDEMIC ERA............................................................................... 151
Ewa Pospiech
SHARING ECONOMY AS A MODERN ECONOMIC PARADIGM .......................... 159
Anita Freimann, Helena Stimac, Maja Rupcic
INTERNATIONAL REPRODUCTION OF CAPITAL AND INTEGRATION OF SMES
INTO GVC ............................................................................................................................ 169
Anar Rzayev, Ganira Ibrahimova
THE IMPACT OF TECHNOLOGICAL EVOLUTION IN THE AUTOMOTIVE
INDUSTRY ON HOW TO MANIFEST THE REBOUND EFFECT ............................. 179 Giani Gradinaru, Erika Marin, Iulia Neagoe, Catalin Rotaru
ECONOMIC EVALUATION OF OLD BARRACKS BROWNFIELD
REVITALIZATION TO SUPPORT SOCIALLY DISADVANTAGED PEOPLE ....... 186 Jakub Sabo, Vit Hromadka
TRENDS IN THE LOGISTICS MARKET AND WAREHOUSES FOR LOGISTICS
SERVICE PROVIDERS - EXPERIENCES FROM POLAND ....................................... 193 Joanna Miklinska
THE REVENUE RECOVERY OF THE MUSIC INDUSTRY AS A RESULT OF
REVENUE GROWTH FROM STREAMING .................................................................. 203 Josko Lozic
APPLICATION OF SPATIAL AUTOCORRELATION TO ANALYZE THE
DIFFERENTIATION OF ECONOMIC GROWTH IN SELECTED EUROPEAN
UNION COUNTRIES .......................................................................................................... 215 Katarzyna Zeug-Zebro

DEVELOPMENT OF THE SMALL AND MEDIUM- SIZED BUSINESS SECTOR IN
RUSSIA THROUGH PARTICIPATION IN PUBLIC- PRIVATE PARTNERSHIP
PROJECTS ........................................................................................................................... 224 Sofia Lyubyashenko, Gennady Lyaskin
MANAGING THE FLOW OF GOODS IN POLISH-CHINESE BILATERAL TRADE
DURING COVID-19 PANDEMIC - THE ANALYSIS OF PROBLEMS FROM THE
PERSPECTIVE OF FREIGHT FORWARDERS ............................................................ 235 Magdalena Klopott
HUMAN CAPITAL ASSESSMENT WITH IMPORTANCE AND SATISFACTION
WITH DIFFERENT SPHERES ......................................................................................... 243 Maria Volkova, Maksim Rybachuk
EXPERIENCE IN ORGANIZING DISTANCE LEARNING IN LOCKDOWN ......... 251 Marina Bareicheva, Ekaterina Kubina, Viola Larionova, Natalia Stepanova, Ken Brown
CROATIA: Q1-Q3 2020 TOURISM RESULTS IN CONTEXT OF COVID-19
PANDEMIC .......................................................................................................................... 259
Mario Basic, Mario Skoric
THE APPLICATION OF THE HDI INDEX TO ASSESS THE SOCIO-ECONOMIC
DEVELOPMENT OF THE EU COUNTRIES IN 1990-2018 ......................................... 269 Monika Miskiewicz-Nawrocka
COMMUNICATION STRATEGIES OF LUXURY BRANDS DURING COVID-19
CRISIS................................................................................................................................... 281
Alica Grilec, Dominik Vukusic, Dino Dujic
CLUSTER ANALYSIS APPLICATION IN EXPLORING ECONOMIC INDICATORS
DIFFERENCES AMONG BALKAN COUNTRIES ........................................................ 291
Presiana Nenkova, Milena Kovachevich
AN ALTERNATIVE Q-THEORY FOR THE EXAMINATION OF THE HOSTILE
TAKEOVERS PHENOMENON ........................................................................................ 302
Eduardo Manuel de Almeida Leite, Humberto Nuno Rito Ribeiro, Sandra Raquel Alves, Amelia
Ferreira da Silva, Jose Manuel Pereira
NEW APPROACH TO ASSESSMENT OF THE APPLICATION OF A NEW
TECHNOLOGY IN DAIRY AND MEAT CATTLE BREEDING ................................. 315
Irshad Abdul Oghlu Kerimli, Ramal Karimov Irshad, Rauf Gunduz Oglu Safarov
BUSINESS CAREER IN THE FRAMEWORK OF LABOUR MARKET
COMPETITIVENESS: CHALLENGES, APPROACHES, AND SOLUTIONS .......... 323 N. Z. Sotnikov
THE (POST) LIBERAL NEW WORLD ORDER: OPPORTUNITIES AND
CHALLENGES IN A COVID-19 AFFECTED WORLD ................................................ 332
Bostjan Peternelj, Petar Kurecic

THE IMPACT OF ECONOMIC POLICY UNCERTAINTY ON INDUSTRIAL
PRODUCTION IN GERMANY ......................................................................................... 339
Dejan Romih, Alenka Kavkler
DRIVER AND BARRIER FACTORS OF INDUSTRY 4.0 IMPLEMENTATION FOR
SMALL AND MEDIUM-SIZED ENTERPRISES: AN OVERVIEW............................ 343 Santi Setyaningsih, Peter Kelle, Azmi Sulaiman Maretan
PROFESSIONAL ORIENTATION AS A LIFELONG LEARNING METAMODEL
FOR CONTINUING EDUCATION................................................................................... 355
Svetlana Sotnikova, Olga Prokudina
CRITERIA OF SERVICE VALUE ASSESSMENT USING THE EXAMPLE OF AN
EDUCATIONAL SERVICE AT A UNIVERSITY........................................................... 365
Hanna Mackiewicz
ANALYSIS AND CHALLENGES OF INTRODUCING DIGITAL TAXATION IN
EUROPEAN UNION COUNTRIES .................................................................................. 373 Mario Hak
DESIGNING AND VALIDATING AN INSTRUMENT FOR THE EVALUATION OF
BUSINESS PROCESS MANAGEMENT AND CUSTOMER EXPERIENCE
MANAGEMENT CONVERGENCE APPROACH ......................................................... 379 Dino Pavlic, Maja Cukusic
EMPIRICAL ANALYSIS OF TOURISM IMPACT ON CROATIAN GDP ................ 389
Damira Dukec, Damira Kecek, Igor Klopotan
MARITIME TOURISM IN THE TIME OF COVID-19 PANDEMIC IN THE BALTIC
SEA REGION – CHALLENGES FOR FERRY AND CRUISE OPERATORS ........... 397 Ilona Urbanyi-Popiolek
THE ROLE OF DIGITALIZATION FOR SMART PORT CONCEPT ....................... 406 Adrianna Karas
MARKET FOR PRO BONO LEGAL SERVICES IN CROATIA – WHAT IS THE
PLACE OF SMALL BUSINESS CLINICS....................................................................... 413
Anamarija Delic
URBAN MOBILITY MANAGEMENT DURING THE CORONAVIRUS PANDEMIC:
THE IMPACT OF COVID-19 ON THE ECONOMIC, ECOLOGICAL AND SOCIAL
DIMENSIONS OF TRANSPORT ...................................................................................... 421 Michal Kuzia
USING THE BALANCED SCORECARD FOR TRANSLATING STRATEGY INTO
ACTIONS AND FOR EXERCISING OF EFFECTIVE CONTROL ............................. 432 Venelin Terziev, Marin Georgiev, Olga Andreeva
GOVERNMENT EXPENDITURE EFFICIENCY AND MACROECONOMIC
PERFORMANCE OF BALKAN COUNTRIES: DEA APPROACH ............................ 439 Presiana Nenkova, Gergana Mihaylova-Borisova
A FLEXIBLE TIME MANAGEMENT MODEL PROPOSAL ...................................... 449
Luis Filipe Sardinha, Aurea Sousa, Eduardo Leite, Humberto Nuno Rito Ribeiro, Andreia
Carvalho
CONCEPTUALIZATION OF SOFT SKILLS FOR TOURISM EMPLOYEES' ........ 461 Valentina Kraljic, Ana Cuic Tankovic, Marina Perisic Prodan
ELECTRONIC FREIGHT EXCHANGES IN THE BUSINESS ACTIVITY IN TSL
SECTOR ............................................................................................................................... 472 Sławomir Skiba
COMPETITIVENESS OF SCIENTIFIC AND PEDAGOGICAL WORKERS IN THE
CONDITIONS OF FORMATION OF THE NATIONAL SYSTEM OF
QUALIFICATIONS............................................................................................................. 479
Svetlana Sotnikova, Elena Mikhailova

63rd International Scientific Conference on Economic and Social Development – "Building Resilient Society" - Zagreb, 11-12 December, 2020
1
ECONOMIC POTENTIAL AS A MEASURE OF STRENGTH OF
TERRITORIAL UNITS - QUANTITATIVE ANALYSIS BASED ON EU
MEMBER STATES IN 2018
Adrianna Mastalerz-Kodzis
University of Economics in Katowice,
Department of Statistics, Econometrics and Mathematics,
1-Maja 50 Street, 40-287 Katowice, Poland
ABSTRACT
The concept of potential comes from sciences, particularly physics, but can be applied to
economics and finance, management sciences, and spatial econometrics. In spatial
econometrics, potential is defined as the pool of strength, skills and performance that can be
assigned to a given territorial unit. The potential of a region or area is a multi-dimensional
concept because it depends on many different, often interdependent factors. Potential
determines the strength of an individual based on skills, competencies and efficiency. Then the
size of the potential depends on the distance of individual territorial units, e.g. geographic
coordinates are taken into account in the research. The result of the analysis depends on the
adopted measure. The potential models analyse the impact of all territorial units (facilities) on
a given unit. The potential can then be interpreted as the strength, intensity of the impact of all
regions of the system, territorial division into a selected region. Each region is perceived in
relation to the rest of the system units and to itself. For example, a given region may have a low
own potential, but it may be in a favourable territorial position, close to strong regions, so its
potential (total and surrounding) is increased. The aim of the work is to show the properties of
the constructed modified measure of the potential of a territorial unit, as well as to compare its
value with the HDI social and economic development measures and with the Gini coefficient.
The article consists of two parts. The first one presents the method of measuring the potential
of territorial units and includes references to the method of calculating HDI and the Gini
coefficient. The second part is empirical and contains the results of comparing the values of the
discussed measures for the European Union countries.
Keywords: Economic potential, Gini coefficient, HDI, international comparisons
1. INTRODUCTION
International analyses play an important role in assessing the strength and ability to function in
international markets. Many methods can be used during quantitative analysis. The article uses
three selected measures: economic potential, HDI measure of socio-economic development and
Gini coefficient. After a short methodological description, a multidimensional comparative
analysis for European Union countries was carried out and conclusions were written.
2. RESEARCH METHODOLOGY
The article uses three measures: economic potential, HDI measure of socio-economic
development and Gini coefficient. A brief methodological description of the measures is
presented below [Anselin L., Florax R., Rey S. (2004); Getis A., Mur J., Zoller H. (2004); Giri
C.N. (2004); Matyas L., Sevestre P. (ed.) (2006); Paelinck J.H.P. Klaassen L.H. (1983);
Rencher, A. C., Christensen W.F. (2012); Suchecka J. (2014); Suchecki B. (2010); Woolridge
G (2002)].

63rd International Scientific Conference on Economic and Social Development – "Building Resilient Society" - Zagreb, 11-12 December, 2020
2
2.1. Economic potential
G. Dutton in 1970 introduced the concept of the quotient of income potentials and population.
The quotient of income potential and population is the equivalent of income per capita,
however, in the analyses it takes into account the interregional relations shaping these
potentials. The following formulas were constructed based on the literature, however, the
formulas were slightly modified, without doubling the potentials of own income and
population, and introducing a time variable. This made it possible to clearly record the total
potential of a given territorial unit as the sum of: own potential and the potential of the
environment. This division enables precise spatial interpretation of the obtained quantities.
Moreover, a time variable was introduced into the models, thus enabling not only a static but
also a dynamic interpretation of the calculated measures [Brakman S., Garretsen H., van
Marrewijk Ch. (2001); Combes P-P, Mayer T., Thisse J-F., (2006); Rich D.C., (1980)].
Potential models are, inter alia, used for analysis of the level of socio-economic development.
The value of the spatial potential is then interpreted as a measure of the region's spatial
accessibility for residents of other regions. The following spatial potential models can be
distinguished:
• Models of income potential (shaping the spatial variability of income) - a measure of the
ability to meet the demand. The income potential in i - this region is a function of the income
generated in that region and income in other regions and the distance between regions.
• Models of population potential. The models inform about the potential of the population of
a given region compared to other regions.
• Location potential models. The model informs about the availability of a given region for
the inhabitants of other regions.
In empirical research, attention is drawn to the existence of a significant spatial correlation
between the variability of the population potential and the variability of many indicators
reflecting the level of socio-economic development of regions. The population's potential is
then treated as a substitute for socio-economic phenomena. On the other hand, the regional
income potential is treated as a measure of the availability of economic activity. The following
designations are adopted:
t - time parameter (e.g. period: year, quarter, month or moment).
( )tLi - total potential of the population in the i-th region at time t,
( )tZ i - total income potential in i-th region at time t,
( )tPi - quotient of the potentials in the i-th region at time t,
( )tzi - GDP in i-th region at time t,
( )tli - population in i-th region at time t,
ijd - distance from the region i and from the region j ( it is assumed that 1=iid ).
The total potential of the population and the total income potential are defined as the sum of
own and environment potentials (foreign potentials):
( )( ) ( )
=
+=n
ijj ij
j
ii
ii
d
tl
d
tltL
1
(1)
( )( ) ( )
=
+=n
ijj ij
j
ii
ii
d
tz
d
tztZ
1
(2)

63rd International Scientific Conference on Economic and Social Development – "Building Resilient Society" - Zagreb, 11-12 December, 2020
3
and the quotient of the potential for the region and:
( )( )( )tL
tZtP
i
ii = (3)
In Suchecki (2010) in the second component of formulas (1) and (2), he does not add a subscript
below the sum. This doubles the value for individual units in the calculation of the potential,
thus lowering the impact of the environment on a given unit. In formulas (1) and (2), the
potential of a given unit is not counted twice, thus allowing for a precise interpretation of the
impact of the environment on a given territorial unit. Potential is a measure of spatial
accessibility of a given territorial unit. The potential is also often interpreted as a measure of
the influence of regions included in a given system of regions on a given region. It determines
the intensity of the impact between the regions, taking into account the given economic values
and the distance between the regions according to the established metric. A region may have a
small own potential, but it may have a good location in the system of impacts, and thus its
surrounding potential (and total potential) is increased. Total income potential in a given region
is a function of the income generated in that region and in all other regions of a given system
of territorial division, and the distance between regions. It takes into account the impact of
interregional income dependencies on the level of spatial variability of income. Total
population potential means accessibility of a given region to people from other regions. In order
to distinguish strong and weak territorial units, the quotient ( ) ( )tgtP ii / is determined, where
( )tg i is the ratio of income per capita in the territorial unit and at the time moment (period) t:
( )( )
( )
( )
( )
( )tl
dtl
tz
dtz
tg
tP
i
n
ijj
ijj
i
n
ijj
ijj
i
i
+
+
=
=
=
1
1
1
1
(4)
In further analysis, the obtained values are compared, namely:
• The value of the quotient ( ) ( )tgtP ii / depends on the proportion between the surrounding
potential of the i-th region and the region's own potential in terms of income and the number
of inhabitants; the quotient takes values close to 1.
• In a situation where the quotient ( ) ( )tgtP ii / is greater than one, it means that the region's
potential is greater than its per capita income, which means that the environment clearly
plays a role in shaping the level of economic growth development. Very often in such a
situation there are regions with a low own potential, with a significant share of agricultural
land, but located in a favourable location, near large urban agglomerations
and regions with high self-potential.
• When the quotient ( ) ( )tgtP ii / is lower than one, the per capita income exceeds the region's
potential. Most often, such a situation occurs for regions with a predominance of urban
areas, for large urban agglomerations with very well developed economic development.

63rd International Scientific Conference on Economic and Social Development – "Building Resilient Society" - Zagreb, 11-12 December, 2020
4
The economic development of countries or agglomerations largely depends on their
geographical location. There is a significant influence of the environment on the level of
economic growth of a given territorial unit, as well as on the development of the labor market
of this unit. It can be shown that the potential quotient is a useful decision support tool
and shaping strategies in making economic decisions. The potential method is used in empirical
analyses for various issues, including economic ones. The application of this method in the
study of economic potential for European Union countries and the study of the dependence of
the potential on socio-economic development and the indicator of social inequality will be
proposed below.
2.2. The Human Development Index
The Human Development Index (HDI) was developed by Amarty Sen and Mahbub ul Haq in
the 1990s. [Duncan C.J., Scott S. (1998); Santon E.A. (2007); Waller L.A., Gotway
C.A.(2004)]. It is used to describe socio-economic changes in countries around the world. The
HDI measures three criteria: long and healthy life, knowledge and standard of living. The
United Nations Development Program recommends that the synthetic HDI be calculated using
basic characteristics, which are:
• Health Index (Heath Index) 65
25.
−= i
i
LEIndH , where iLE is the average life expectancy
in the i-th country.
• Education Index ( ) ( )iii IndENRIndLITIndE ...31
32 += for iIndLIT . - the illiteracy rate,
iIndENR. - the enrollment rate.
• Welfare Index: ( )( ) ( )
( ) ( )$100log$40000log
$100loglog.
−
−= i
i
yIndY where iy is the income per capita in a
given country.
The per capita social development index for a given country is as follows:
3
... iiii
IndYIndEIndHHDI
++= (5)
The size of HDI at a given level means a developed country: poorly (0-0.5), medium (0.501-
0.8), high (0.801-0.9), very high (0.901-1).
2.3. Gini coefficient
In economics, the Gini coefficient is used primarily to measure the uneven distribution of goods,
in particular the uneven distribution of income, for example in households. The value of the
coefficient is contained in the interval (0, 1). When the value is 0, it means that all people get
the same income. When the value of the coefficient reaches the level of 1, it means that one
household concentrates all income in a given country. The value of the ratio should be
interpreted as follows: the higher the value, the greater the income inequality in a given country
[Fingleton B (2003); Suchecki B. (2010)]. The measure of income inequality is the Gini
coefficient, which in econometrics is called the social inequality index. When the observations
are ordered in ascending order, it is calculated using the formula:
( ) ynyniG i
n
i
2
1
12
−−=
=
(6)

63rd International Scientific Conference on Economic and Social Development – "Building Resilient Society" - Zagreb, 11-12 December, 2020
5
where n is the number of sample elements, then iy the income of the i-th unit is the average
income y in the sample. You can also use the alternative formula of the form: 2
YXEG
−= ,
for YXE − - the mean absolute difference between the two incomes, is the average value of
the incomes. When the G coefficient is doubled, information is obtained as to what part of the
average is the average absolute difference between a random pair of incomes (e.g. for G =
0.3 the average difference between incomes is 60% of the average income).
3. COMPARATIVE ANALYSIS OF SOCIO-ECONOMIC DEVELOPMENT, SOCIAL
INEQUALITY INDEX AND THE POTENTIAL OF THE EUROPEAN UNION -
EMPIRICAL RESEARCH
The purpose of the analysis carried out in this chapter is to examine the dynamics of changes
in the socio-economic sphere of Poland against the background of the European Union Member
States using the potential quotient method, and to compare the obtained values with the values
of the measure of the level of socio-economic development and the measure of income
differentiation. The law in force in the European Union has a significant impact on the socio-
economic development of the Member States. The unrestricted movement of people and the
freedom to take up employment has a positive effect on most economic indicators, favours the
development of trade, opens borders for population migration and allows free shaping of
economic activity. The data analysis concerns selected economic characteristics of the EU
countries. Calculated: distance matrix between countries, HDI index, Gini coefficient. Data
analysis covers the following variables: iz - GDP, ig - GDP per capita, ijd - distance between
territorial units i and j; we accept, than 1=iid (Euclidean distance between the capitals of EU
countries, geographic coordinates were used). The empirical analysis was conducted on the
basis of selected socio-economic characteristics for the EU countries in 2018.
Table following on the next page

63rd International Scientific Conference on Economic and Social Development – "Building Resilient Society" - Zagreb, 11-12 December, 2020
6
EU Country iZ
=
n
ijj ij
j
d
z
1
iL
=
n
ijj ij
j
d
l
1
iP
The Netherlands 3103840 2320119 78,73 61,80 39441
Germany 4967782 1412704 122,32 41,63 40612
Denmark 2495896 2248431 64,25 58,55 38846
Ireland 1559866 1315939 40,45 35,70 38614
Sweden 1741383 1297480 46,19 36,39 37702
United Kingdom 4319345 1818170 113,38 48,69 38095
France 4404040 2001473 117,37 52,95 37529
Austria 2475210 2110897 69,34 61,04 35695
Belgium 3308980 2844118 85,48 74,18 38711
Luxemburg 2583763 2527625 67,53 66,93 38262
Finland 1265628 1053092 36,14 30,64 35022
Slovenia 2193209 2132430 62,82 60,71 34925
Italy 3253394 1244891 94,78 34,95 34335
Spain 2592347 1079620 75,75 29,65 34222
Czech Republic 3112788 2799836 83,44 72,94 37306
Greece 1247327 976540 40,28 29,28 30965
Cyprus 702232 665860 21,09 19,89 33298
Estonia 1352713 1317705 38,59 37,29 35055
Lithuania 1322630 1246081 40,28 37,38 32838
Poland 2338097 1379423 76,52 37,92 30556
Slovakia 2442957 2385427 68,86 66,77 35479
Malta 1222950 1211422 35,48 35,08 34464
Portugal 1291799 1016892 38,71 28,41 33368
Hungary 1963051 1720758 59,77 49,87 32843
Croatia 2089913 2004107 61,09 56,90 34208
Latvia 1317182 1271926 39,25 37,25 33561
Romania 1437581 1049026 50,69 31,19 28361
Bulgaria 1373132 1252733 45,59 38,49 30123
Table 1: The income and population potential (own and the environment) as well as the
quotient of potentials for EU countries in 2018.
(Source: own study)
a) Own income potential b) Income potential of the environment
Figure 1: Value map of selected measures for EU countries
(Source: own study)

63rd International Scientific Conference on Economic and Social Development – "Building Resilient Society" - Zagreb, 11-12 December, 2020
7
Then the HDI index and the Gini coefficient were determined for the EU countries and their
values were compared with the Pi /gi quotient. The table below shows the results.
EU Country GINI HDI Pi/gi
The Netherlands 0,274 0,934 0,851
Germany 0,311 0,939 0,922
Denmark 0,278 0,930 0,895
Ireland 0,289 0,942 0,748
Sweden 0,271 0,937 0,832
United Kingdom 0,335 0,920 0,985
France 0,285 0,891 1,006
Austria 0,268 0,914 0,814
Belgium 0,257 0,919 0,941
Luxemburg 0,313 0,909 0,411
Finland 0,259 0,925 0,906
Slovenia 0,234 0,902 1,207
Italy 0,334 0,883 1,022
Spain 0,332 0,893 1,043
Czech Republic 0,240 0,891 1,252
Greece 0,323 0,872 1,258
Cyprus 0,291 0,873 1,099
Estonia 0,306 0,882 1,302
Lithuania 0,369 0,869 1,244
Poland 0,278 0,872 1,230
Slovakia 0,209 0,857 1,295
Malta 0,287 0,885 1,196
Portugal 0,321 0,850 1,250
Hungary 0,287 0,845 1,342
Croatia 0,297 0,837 1,674
Latvia 0,356 0,854 1,483
Romania 0,351 0,816 1,423
Bulgaria 0,396 0,816 1,774
Table 2: Values of HDI and Gini coefficients as well as Pi/gi for EU countries.
(Source: own study)
Figure 2: Values of HDI and Gini coefficients and Pi/gi for EU countries.
(Source: own study)

63rd International Scientific Conference on Economic and Social Development – "Building Resilient Society" - Zagreb, 11-12 December, 2020
8
The socio-economic development of the EU countries measured by the HDI index is at a very
high level (11 out of 28 countries have HDI> 0.9). The Gini index belongs to the range (0.209;
0.396). Countries with the lowest level of income inequality are: Slovakia, Slovenia and the
Czech Republic, while the highest level of inequality was recorded for Lithuania and Bulgaria.
For the 10 countries (the richest) there is a relation. iP < ig . For the remaining 18 countries,
there is a relation of the highest values ii gP / for countries with low income. Pearson's
correlation coefficients between the measures were determined. It can be written that:
• There is a significant negative relationship between HDI and Pi/gi (Pearson's value -0.85).
Thus, the higher the level of socio-economic development (and thus also the higher GPD),
the smaller the impact of the environment on a given country. The lower the level of socio-
economic development (poorer countries), the stronger the influence of the environment.
• There was a moderate negative correlation between HDI and the Gini index (Pearson -0.43).
Thus, the higher the level of development of a country, the lower the income inequality.
The highest level of income inequality occurs in countries with the lowest HDI
• There is a moderate, positive relationship between HDI and GDP per capita (Pearson 0.67).
GPD per capita is one of the three components of HDI, it explains about 46% of the HDI
variation. The rest are the components of health and education.
• A moderate, positive relationship was found between the following values: Gini coefficient
and Pi/gi (Pearson 0.32). The higher the level of income inequality, the country more
dependent on the environment.
• There is a low, negative correlation between GDP per capita and the Gini coefficient
(Pearson -0.38). About 14% of income inequality can be explained by the level of income
in EU countries.
a) Gini coefficient b) HDI
c) Pi/gi
Figure 3: Value map of selected measures for EU countries
(Source: own study)

63rd International Scientific Conference on Economic and Social Development – "Building Resilient Society" - Zagreb, 11-12 December, 2020
9
4. CONCLUSION
All analysed indices: HDI, Gini coefficient and Pi/gi values affect the standard of living of the
population. In countries with high GDP per capita, high socio-economic development index,
relatively low Gini index, the standard of living of the population is significantly higher than in
less developed countries. The level of the labour market development largely determines all the
indicators discussed in the paper. The problem of many EU Member States is the high level of
unemployment (Spain, Greece), especially among young people (Spain, Greece, Croatia, Italy).
Therefore, in order to describe the socio-economic situation of countries more fully, indicators
should be considered not only about the level of income, education and health, but also income
disparities (income inequalities), the economic environment and the level of the labour market.
In countries with high GDP per capita, high socioeconomic development index, relatively low
Gini index, the standard of living of the population is significantly higher than in less developed
countries. The level of the labour market development largely determines all the indicators
discussed in the paper. Thus, in order to describe the socio-economic situation of countries
more fully, indicators should be considered not only about the level of income, education and
health, but also income disparities (income inequalities), the economic environment and the
level of the labour market. Socio-economic development of EU countries is diversified, both in
terms of the level of education and health, as well as social and income inequalities. There are
highly developed countries with high GDP and low income inequalities. There are also poorer
and less developed countries where income inequalities are significant, and the environment
plays an important role in the process of shaping economic life.
LITERATURE:
1. Anselin L., Florax R., Rey S. (2004). Advances in spatial econometrics methodology tools
and applications. Springer Verlag, New York
2. Brakman S., Garretsen H., van Marrewijk Ch. (2001). An Introduction to Geographical
Economics, Cambridge University Press.
3. Combes P-P, Mayer T., Thisse J-F., (2006). Economie Geographique, Economica, Paris.
4. Duncan C.J., Scott S. (1998). Human Demography and Disease, University Press,
Cambrodge, UK.
5. Fingleton B (2003). European regional growth. Springer Verlag, Berlin
6. Getis A., Mur J., Zoller H. (2004). Spatial Econometrics and Spatial Statistics, Palgrave
Macmillan, New York.
7. Giri C.N. (2004). Multivariate Statistical Analysis, USA Marcel Dekker.
8. Matyas L., Sevestre P. (ed.) (2006). The Econometrics of Panel Data, Kluwer Acedemic
Publishers, Dordrecht.
9. Paelinck J.H.P. Klaassen L.H. (1983). Ekonometria przestrzenna, Warszawa, PWN.
10. Rencher, A. C., Christensen W.F. (2012). Methods of Multivariate Analysis,. USA, John
Wiley & Sons.
11. Rich D.C., (1980). Potential Models in Human Geography. Concepts and Techniques in
Modern Geography, Geo Abstracts, nr 26, Norwich.
12. Santon E.A. (2007). Inequality and the Human Development Index, ProQuest LLC.
13. Suchecka J. (2014). Statystyka przestrzenna. Metody analizy struktur przestrzennych.
Wydawnictwo Beck, Warszawa.
14. Suchecki B. (2010). Ekonometria przestrzenna, Wydawnictwo Beck, Warszawa.
15. Waller L.A., Gotway C.A.(2004). Applied Spatial Statistics for Public Health Data, J Wilej
& Sons Inc. Pub., Heboken, New Jersey.
16. Woolridge G (2002). Econometric analysis of cross section and panel data. MIT Press,
Cambridge.
17. www.stat.gov.pl

63rd International Scientific Conference on Economic and Social Development – "Building Resilient Society" - Zagreb, 11-12 December, 2020
10
18. www.ec.europa.eu/eurostat
19. www.undp.org

63rd International Scientific Conference on Economic and Social Development – "Building Resilient Society" - Zagreb, 11-12 December, 2020
11
DECISION-MAKING PROCESS OF TOP MANAGERS IN SLOVENIA
AND COMPANIES’ ORIENTATION TO FOREIGN MARKETS
Damjan Grusovnik
Mariborska cesta 65, 2250 Ptuj, Slovenia
Dusko Ursic
Faculty of Economics and Business, University of Maribor,
Department of General Management and Organization
Razlagova 14, 2000 Maribor, Slovenia
Alenka Kavkler
Faculty of Economics and Business, University of Maribor,
Department of Quantitative Economic Analysis
Razlagova 14, 2000 Maribor, Slovenia
ABSTRACT
In this study, top managers in Slovenia were questioned about their past decisions. More
specifically, they were asked about the quality of their decision-making process when they made
important (high-impact) decisions. The quality of the decision-making process was measured
using four reflective dimension measures. The goal of this paper was to determine if there is a
relationship between the quality of the decision-making process of managers and companies’
scope of orientation to foreign markets as measured by the share of revenues generated in
foreign markets. The findings reveal that the differences in scope of orientation to foreign
markets between companies with above-average and below-average quality of decision-making
process of managers are not statistically significant. The differences between the first and the
last (10th) decile of companies in the quality of decision-making process of managers, on the
other hand, are statistically significant at the 10 % level.
Keywords: company performance, decision-making process quality, foreign markets
1. INTRODUCTION
The true essence of management is reflected in the true success of managers’ decisions over
time (Harrison, 1999, 2000). Guillemette et al. (2014) pointed out that an important distinction
must be made between the performance of the decision-making process and the quality of the
decision itself; or between the results of the process and the results of the decision. In the
business world, decision-making process performance is an important prerequisite (required as
a prior condition) for a quality decision. A relationship appears to exist between these two
distinct constructs (Van Bruggen et al., 1998; Lilien et al., 2004; Bernd-Mathias et al., 2011).
The Guillemette et al. (2014) study concentrated on evaluating the decision-making process,
rather than on the consequences of the dimensions. Meissner and Meissner and Wulf (2014)
also confirm that an increasingly dominant school of thought in the strategy process literature
argues that decision-making processes should be evaluated on the basis of the quality of the
process itself, rather than on the basis of the decision-making outcomes (e.g., financial
performance) (Amason, 1996; Keren & de Bruin, 2005). The decision-making process consists
of five phases: intelligence phase (i.e., information search, problem identification), design
phase (i.e., criteria choice, search for alternatives, predicting and measuring outcomes), choice
phase (i.e., final solution, implementation planning), implementation phase and a monitoring
63rd International Scientific Conference on Economic and Social Development – "Building Resilient Society" - Zagreb, 11-12 December, 2020
12
phase (i.e., feedback and correction) (Simon, 1977; Turban et al., 2011). Performance is
influenced by several factors that may mask the effect of the decision-making process (Dean &
Sharfman, 1996; Meissner & Wulf, 2014). These factors can include organizational and
environmental influence factors that are unrelated to the decision-making process itself (Hansen
& Wernerfelt, 1989; Meissner & Wulf, 2014). In contrast, the process based measures of the
quality of the decision-making process are less likely to be influenced by exogenous factors and
are more likely to be linked to the decision-making process (Meissner & Wulf, 2014). Several
studies have also stressed that the quality of the strategic decision-making process is one of the
most important determinants of organizational performance (Eisenhardt, 1989; Meissner &
Wulf, 2014). Empirical studies have found that a high quality decision-making process can
increase total shareholder returns (TSR) and the return on investment (ROI) by six to seven
percentage points (Blenko et al., 2010; Lovallo & Sibony, 2010). Decision-making quality is
based on the thoroughness with which all relevant leadership and technical issues are
considered (Rausch, 2007). Chen et al. (2012) identified seven key principles of decision-
making quality: 1) immediate and rich information, 2) including complete data from the past;
3) a precise forecasting model; 4) key forecasting parameters and random factors; 5) the
distance between the forecasting point and the current time point, where the closer they are, the
more precise the forecasting value is; 6) an immediate and multi-frequency feedback rate in a
decision-making process missile control model; and 7) overall system thinking and rational
decision-making evaluations. The quality of the decision-making process and the company’s
success is considerably influenced by who makes the decisions, what skills and capabilities
they have, what managerial style they apply, and the techniques and methods they apply in the
course of the decision-making process. Consequently, it is not only an applied decision-making
approach and a managerial style that leaves their mark on the decision-making process. It is
also the level of professional ability, education and experience that the manager possesses
(Zoltay-Paprika et al., 2008). Guillemette et al. (2014) developed a construct model of the
decision-making performance. This multidimensional construct is composed of four reflective
dimensions (which are also used in our study). The decision-making quality construct was
measured via formative measures of the decision-making quality and the satisfaction measures
of the effectiveness of the user’s decision-making process. All formative and reflective
variables were measured through a user’s perception. The study focused on high-impact
decisions. These decisions are mostly ill-structured, relatively complex, and important for the
organization (tactical or strategic decisions). Such decisions are not made in total isolation and
are influenced by other stakeholders. The study proved that the relationship between the
decision-making performance and the decision-making quality was significant. The study also
calculated the size of the weights of the dimensions of the decision-making performance. All
four dimensions of the decision-making performance were found to positively contribute to the
perceived decision-making quality. This paper is structured as follows. Next chapter describes
the setting of our survey of top managers in Slovenia and the used questionnaire. Chapter 3
examines how to measure quality of the decision-making process of managers and its
dimensions, following Guillemette et al. (2014). Main results are described in the fourth
chapter, while chapter five concludes.
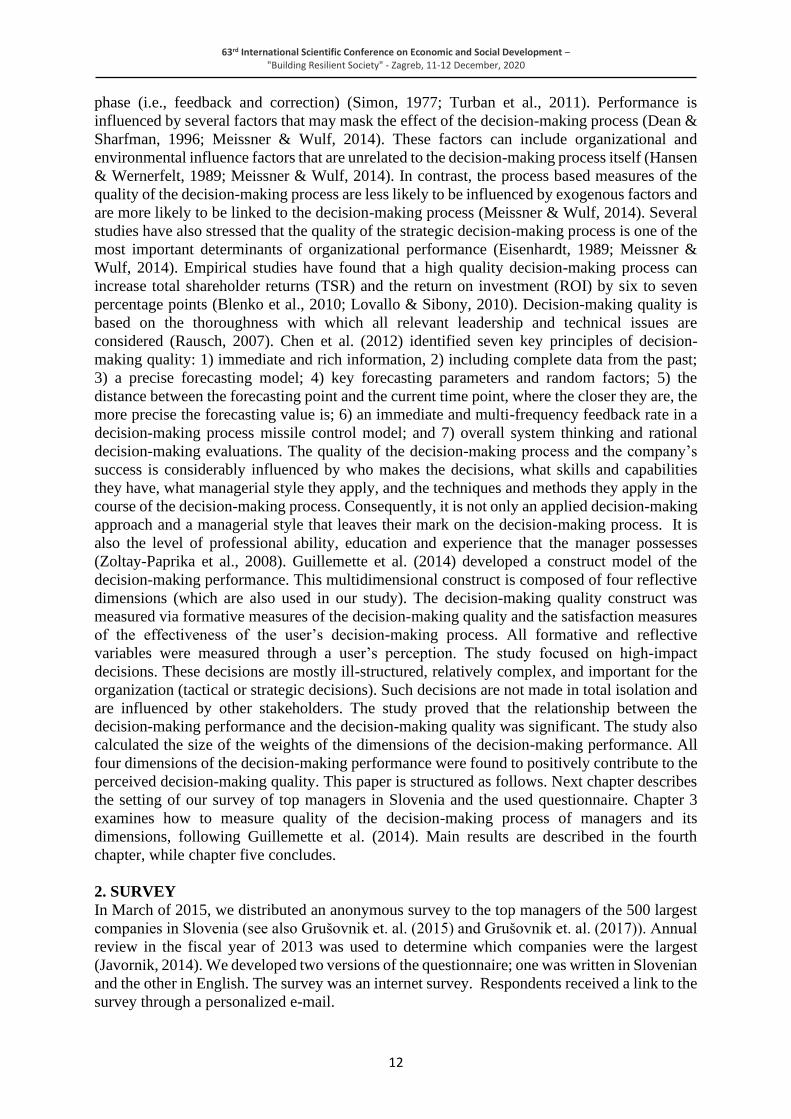
2. SURVEY
In March of 2015, we distributed an anonymous survey to the top managers of the 500 largest
companies in Slovenia (see also Grušovnik et. al. (2015) and Grušovnik et. al. (2017)). Annual
review in the fiscal year of 2013 was used to determine which companies were the largest
(Javornik, 2014). We developed two versions of the questionnaire; one was written in Slovenian
and the other in English. The survey was an internet survey. Respondents received a link to the
survey through a personalized e-mail.

63rd International Scientific Conference on Economic and Social Development – "Building Resilient Society" - Zagreb, 11-12 December, 2020
13
Of the 500 e-mails that were sent out, 255 managers clicked on the survey and 112 of those
managers fully completed the questionnaire. Hence, the data collected represents 22,4% of the
target audience. 210 of the managers accessed the survey through a personal computer, 25
through a smart phone and 20 through a tablet computer. 86 managers out of 112 were working
in companies that participated in foreign markets. The questionnaire consisted of 26 questions,
where 22 questions referred to the quality of decision-making process. The other 4 questions
referred to company employees and company performance measure. Managers were answering
questions for the fiscal year 2014. The performance measures that was chosen is scope of
orientation to foreign markets (measured by the share of revenues generated in foreign markets
in relation to total revenues, for the year 2014, in percent). The primary goals of our research
model involved answering the following questions:
• Is there a positive correlation between the quality of the decision-making process of
managers’ in Slovenia and the company’s orientation to the foreign markets?
• Have companies in Slovenia, whose managers’ exhibit an above-average quality decision-
making process, on average, a higher orientation to foreign markets than companies where
managers show a below-average quality decision-making process?
3. MEASURING THE QUALITY OF THE DECISION-MAKING PROCESS
The first 22 questions in our survey were related to the dimensions of the quality of the decision-
making process. These questions are identical to the questions in the Guillemette-Laroche-
Caudieux survey on the reflective measures of decision-making performance (Guillemette et
al., 2014). Each individual dimension of the quality of the decision-making process included a
7 point Likert scaled question where: 1 - strongly disagree, 2 - disagree, 3 - partly disagree, 4 -
neither disagree nor agree, 5 - partly agree, 6 - agree, and 7 - completely agree. The scale of
the 22nd question was reversed. Since the range of the scale was not evident from the content
of the scientific article, we established contact with the main author of the paper and obtained
this information. The research model included the following four dimensions. Each question,
or dimension, was weighted according to the importance of the quality of the decision-making
process:
• Procedural rationality (7 questions - No.: 1, 5, 9, 10, 16, 17, 18);
• Exhaustivity of information (5 questions - No.: 3, 12, 14, 19, 22);
• Effort (5 questions - No.: 2, 4, 6, 8, 20);
• Openness of spirit (5 questions - No.: 7, 11, 13, 15, 21).
The values of the original weights were: 0,208 + 0,255 + 0,382 + 0,2 = 1,045. For a more logical
display, we converted the values so the sum was the following: 0,199 + 0,244 + 0,366 + 0,191
= 1 or 100%. The sums of the answers of the individual dimensions for each manager were
entered into Equation (1). This allowed us to calculate a comparable value for the quality of
the decision-making process for each individual manager. The equation for an individual
manager's quality in terms of their decision-making process (abbreviated as D.M.P.) is as
follows:
Q(m)D.M.P. = (D1act
D1max wD1) + (
D2act
D2max wD2) + (
D3act
D3max wD3) + (
D4act
D4max wD4) (1)
D(1, 2, 3, 4)act – actual sum of manager’s achieved points from the answers for each dimension
D1max – (7 × 7 = 49) sum of maximum possible points from the dimension of procedural
rationality
D2max – (5 × 7 = 35) sum of maximum possible points from the dimension of information
exhaustivity

63rd International Scientific Conference on Economic and Social Development – "Building Resilient Society" - Zagreb, 11-12 December, 2020
14
D3max – (5 × 7 = 35) sum of maximum possible points from the dimension of effort
D4max – (5 × 7 = 35) sum of maximum possible points from the dimension of openness of spirit
wD1 = 0,199 – weight of the dimension of procedural rationality
wD2 = 0,244 – weight of the dimension of the exhaustivity of the information
wD3 = 0,366 – weight of the dimension of effort
wD4 = 0,191 – weight of the dimension of the openness of spirit
3.1. A practical example explaining Equation (1)
Since in the dimension of procedural rationality, there is a maximum of 49 possible points,
these 49 points represent 0.199, or 19.9%, of the manager’s quality of the decision-making
process. The results of the answers will rarely reach the maximum value. If we assume that the
manager, in the dimension of procedural rationality, scores 40 points, then this is 40
49 = 0.816, or
81.6%, of 0.199 (0.816 x 0.199 = 0.162). In this case, the value 0.162 represents the actual
comparable value of the manager's dimension of procedural rationality against the other
managers’ (the weight of the dimension is still 0.199, only in relation to the other managers’
actual comparable value, which is 0.162). We calculated the mean/median values for all
decision-making quality values for an individual manager (Equation 1). All the companies
above the mean/median value, belonged to the group where the managers are above-average
successful in the quality of the decision-making process. Other companies that were below or
equal to the mean/median value, belonged to the group where the managers are below-average
successful in the quality of the decision-making process.
4. EMPIRICAL RESULTS
Table 1 illustrates the results of our statistical analysis. We performed the usual tests for both
of our research questions. We calculated the Spearman correlation coefficient and to compare
the means of two groups, we performed the t-test and its nonparametric alternative, namely the
Mann-Whitney test. In majority of cases, the results are not statistically significant (e. g. the
Spearman correlation, most t-tests and most Mann-Whitney tests). Different success measures
(mean/median) did not sufficiently alter our results. We also analyzed data on managers in the
upper and lower quartiles and deciles of the values of the decision-making quality. For quartiles,
our results were still not statistically significant, therefore we also compared the first and tenth
decile of quality of the decision-making process of managers from companies that are present
on foreign markets. The p-value of the Mann-Whitney U test and of the t-test for the 1st and
10th decile are 0,062 and 0,074, respectively. Thus both tests are statistically significant at the
10 % level. Since our sample for the deciles was small (only 16 companies), it would be difficult
to obtain significant results at a lower level of significance. For this purpose, we would probably
need a larger sample of companies.
Table following on the next page

63rd International Scientific Conference on Economic and Social Development – "Building Resilient Society" - Zagreb, 11-12 December, 2020
15
Table 1: Results of the statistical tests
Perfor-
mance
Group
size
Measure
of success
Test
method rs p
Below
average
Above
average
Ori
enta
tio
n o
n
fore
ign
ma
rket
s
Foreign
(86) / Spearman 0,083 0,450 / /
Foreign
(86)
M t-test / 0,805 M 52,48 M 54,46
MWU / 0,794 MR 42,73 MR 44,14
MD t-test / 0,919 M 53,16 M 53,97
MWU / 0,924 MR 43,24 MR 43,76
Foreign
Quartiles
(42)
M=MD
t-test / 0,080 M 34,95 M 54,42
MWU / 0,102 MR 18,40 MR 24,60
Foreign
Deciles
(16)
M=MD
t-test / 0,074 M 25,75 M 57,00
MWU / 0,062 MR 6,88 MR 11,60
Note: M – Mean value; MD – Median value; MR – Mean of ranks; MWU – Mann Whitney U
test; t-test (two tailed); rs – Spearman correlation coefficient; p - significance level; M=MD –
both measures off success, divide the managers into groups, the same way.
Source: Own survey (2015)
The results of the statistical tests are as follows:
• There is no positive correlation between the quality of the decision-making process of
managers’ in Slovenia and the scope of orientation on the foreign markets.
• Companies in Slovenia, whose managers’ exhibit an above-average quality in the decision-
making process, on average, do not have a higher orientation to foreign markets than
companies where managers show a below-average quality in the decision-making process.
• The differences between the first and the last (10th) decile of companies in the quality of
decision-making process of managers, on the other hand, are statistically significant at the
10 % level.
We also analyzed the differences between the averages of the single questions (items) from our
survey about the quality in the decision-making process of managers, between companies with
above-average and below-average orientations to foreign markets (86 managers; measure of
success: mean value). For almost all of the questions, the above-average companies in terms of
foreign market orientation had, on average, better (i.e. higher) values than the below-average
companies (ratio 19:3 in favor of above-average). Only the last three smallest differences were
in favor of the below-average. The five largest differences were in the following questions:
question 20 (I was completely immersed in solving my problems), question 16 (I considered
the risks associated with each alternative), question 8 (I have shown my eagerness to address
the problems), question 4 (I made the required effort to solve the problems), and question 2 (I
put a great deal of effort into achieving my tasks).
5. CONCLUSION
No positive correlation between the variables of quality in the decision-making process of
managers in Slovenia and the performance of the companies was found. In addition, companies
in Slovenia, whose managers exhibit an above-average quality in the decision-making process,
on average, do not have higher performance measure than companies where managers show a
below-average quality in the decision-making process.

63rd International Scientific Conference on Economic and Social Development – "Building Resilient Society" - Zagreb, 11-12 December, 2020
16
Only when restricting the analysis to the first and last decile of companies in the quality of
decision-making process of managers, the differences became statistically significant. We used,
as performance measure, the percentage of the revenues created on foreign markets. To improve
the results for future surveys, we could give the following recommendations for future research:
• Increase the size of the Likert scale from 7-point to 9-point scale. Managers were very
focused on the range of values between 4 and 7. They want to provide you with answers
that are positioned above the middle. If you make the correction that is concentrated on a
larger range of values (5-9), then the values will be more dispersed. Managers strive to
provide answers in the higher half of the value interval.
• Consider another performance indicator (e.g., return on investment (ROI)) and determine
whether the results will fluctuate less with the increasing quality in the decision-making
process. One of the approaches of other authors was that managers evaluated several
performance indicators on a 7-point scale in relation to their main competitors. The
performance indicator with excellent results is the balanced scorecard (Ling Sim & Chie
Koh, 2001), which measures company performance via four dimensions (i.e., financial,
costumer, internal business processes, innovation and learning). The disadvantage of this
approach is that the questionnaire becomes quite long.
LITERATURE:
1. Amason, A.C. (1996). Distinguishing the effects of functional and dysfunctional conflict
on strategic decision making: Resolving a paradox for top management teams. The Academy
for Management Journal, 39(1), 123-148.
2. Bernd-Mathias, A., Baets W.B., & König R. (2011). A complexity perspective on
collaborative decision making in organizations: The ecology of group-performance.
Information & Management, 48, 157-165.
3. Blenko, M.W., Mankins, M.C., & Rogers, P. (2010). The decision-driven organization.
Harvard Business Review, 88(6), 54-62.
4. Dean, J.W. Jr., & Sharfman, M.P. (1996). Does decision process matter? A study of
strategic decision-making effectiveness. Academy of Management Journal, 39(2), 368-396.
5. Eisenhardt, K.M. (1989). Making fast strategic decision in high velocity environments.
Academy of Management Journal, 32, 543–576.
6. Grušovnik. D., Uršič, D., & Kavkler A. (2015). Dimensions of quality of managerial
decision-making process. In K. Vuković, R. Brčić & M. Klačmer Čalopa
(Eds.). Entrepreneurial society: current trends and future prospects in entrepreneurship,
organization and management. Varaždin: Faculty of Organization and Informatics, 67-73.
7. Grušovnik. D., Kavkler A. & Uršič, D. (2017). Dimensions of Decision-Making Process
Quality and Company Performance: A Study of Top Managers in Slovenia. Naše
gospodarstvo / Our Economy, 63(4), 66-75.
8. Guillemette, M.G., Laroche, M., & Cadieux, J. (2014). Defining decision making process
performance: Conceptualization and validation of an index. Information & Management,
51(6), 618-626.
9. Hansen, G.S., & Wernerfelt, B. (1989). Determinants of firm performance: The relative
importance of economic and organizational factors. Strategic Management Journal, 10(5),
399-411.
10. Harrison, E.F. (1999). The Managerial Decision making Process, 5th ed. Boston, MA:
Houghton Mifflin.
11. Harrison, E.F., & Pelletier, M.A. (2000). The essence of management decision.
Management Decision, 38(7), 462-469.

63rd International Scientific Conference on Economic and Social Development – "Building Resilient Society" - Zagreb, 11-12 December, 2020
17
12. Keren, G., & de Bruin, W.B. (2005). On the assessment of decision quality: Considerations
regarding utility, conflict and accountability. In D.J. Hardtman & L. Macchi (Eds.),
Thinking: Psychological Perspectives on Reasoning, Judgment and Decision Making (pp.
347-363). Chichester: John Wiley & Sons Ltd.
13. Lilien, G.L., Rangaswamy, A., Van Bruggen, G.H., & Starke, K. (2004). DSS effectiveness
in marketing resource allocation decisions: Reality vs. perception. Information Systems
Research, 15, 216-235.
14. Lovallo, D., & Sibony, O. (2010). The case for behavioral strategy. McKinsey Quarterly,
1-16.
15. Meissner, P., & Wulf, T. (2014). Antecedents and effects of decision comprehensiveness:
The role of decision quality and perceived uncertainty. European Management Journal, 32,
625-635.
16. Rausch, E. (2007). Leadership in management education and development: Criteria for
quality decisions. European Business Review, 19(3), 257-268.
17. Simon, H. (1977). The New Science of Management Decision. Englewood Cliffs, NJ:
Prentice Hall.
18. Turban, E., Sharda, R., & Delen, D. (2011). Decision Support and Business Intelligence
Systems, 9th ed. New Jersey: Prentice Hall.
19. Van Bruggen, G.H., Smidts, A., & Wierenga, B. (1998). Improving decision making by
means of a marketing decision support system. Management Science, 44, 645-658.
20. Zoltay-Paprika, Z., Wimmer, A., & Szanto, R. (2008). Managerial decision making and
competitiveness: The case of Hungary. Competitiveness Review: An International Business
Journal, 18 (1/2), 154-167.

63rd International Scientific Conference on Economic and Social Development – "Building Resilient Society" - Zagreb, 11-12 December, 2020
18
A THEORETICAL APPROACH TO THE CONCEPT OF THE
CLUSTER
Jose G. Vargas-Hernandez
Research professor, Department of Administration,
University Center for economic and Managerial Sciences, University of Guadalajara,
Periférico Norte 799 Edif. G201-7 Núcleo Universitario los Belenes,
Zapopan, Jalisco, 45100, Mexico
Jose Sergio Morones Servin
Master in Busines and economic Studies,
University Center for economic and Managerial Sciences,
University of Guadalajara, Mexico
Omar Cristian Vargas Gonzalez
Master in Computer Systems,
Tecnológico Nacional de México - Instituto Tecnológico de Ciudad Guzmán,
Av. Tecnológico 100, Ciudad Guzmán, Jalisco, 49000, Mexico
ABSTRACT
The main objective of this research is to provide a general overview of the concept of the cluster,
through the review of theoretical-empirical studies and some proposed models as well as its
importance as a strategy for regional development and its operation.
Keywords: cluster, regional development, functioning
1. INTRODUCTION
There is no single formal definition about the concept of the industrial cluster. Some authors
such as Porter (2003), Rosenfeld (1996), Altemburg (2001), Hoen (1999), among others,
propose definitions regarding this concept, but the concept of the cluster goes beyond the
networks developed by companies that operate in the same market of final goods, which are
part of the same industry and which cooperate in certain areas, including strategic alliances. To
approach the concept, it is necessary to analyze the theoretical approaches of the cluster, starting
from the approach of classical economists such as Marshall (1890), the theory of industrial
location of Weber (1929), the theory of industrial interactions and industrial districts. Becattini
(1992) and the new economic geography of Krugman (1995), in addition to the competitive
advantages of Porter (1990) among others. Another of the key aspects is to place the cluster as
a global or regional development strategy in the global and local context, due to which it allows
to interrogate the impact through its analytical theoretical bases and study the success cases and
their contributions to the economies local. To know the formation of industrial clusters it is
necessary to know the value chains and identify the processes and the interrelated parts that
compose it. Some key factors to identify a cluster are technological development, commercial
linkages, cooperation between firms and, according to Porter, subcontracting (Corrales, 2007,
page 171). Many researchers agree that the cluster consists of a critical mass of companies,
generally small and medium-sized, specialized in the same sector or related productive
activities, located in a specific and relatively small geographical area. Other authors suggest
that a cluster includes institutions that interact with companies that affect their competitive
performance.

63rd International Scientific Conference on Economic and Social Development – "Building Resilient Society" - Zagreb, 11-12 December, 2020
19
Finally, some others explicitly refer to the existence of collaborative relationships between all
these actors and highlight the importance of social, historical, political and cultural factors that
promote or hinder collaboration between actors
2. CONCEPTUAL THEORETICAL BACKGROUND
2.1. Analysis of the concept
This concept has its origins in the industrial districts of Alfred Marshall (1963) when he tried
to analyze the reasons why industry emerges concentrated in certain localities in which he
points out, that some elements that constitute industrial concentration: physical conditions, for
example, nature of climate and soil, needs of local consumers, families and businesses,
infrastructure (roads) and access roads (transport). This author emphasizes three aspects:
mutual proximity of companies in an industrial district, which exchange information, new ideas
and inventions; appearance of subsidiary activities or companies that reduce costs, and
concentration of specialized labor (Garnica & Rivero, 2004, page 144). To this Krugman agrees
with Marshall. However, Krugman (1992) adds that other aspects to consider in the
conformation and growth of an industrial belt are: increasing returns to scale, arbitrary and
accidental components, and historical and cumulative phenomena. The convergence of these
processes contributes to the integration of a specialized labor market (Garnica & Rivero, 2004,
page 145). But it was Becattini (1992) who reused it to describe and analyze the success of
industrial conglomerates in Italy in the modern era; nevertheless, it corresponded to Piore and
Sabel, (1984) through a Second Industrial Divide of 1984, to make known to the world the
success of some regions of Italy through industrial districts (Corrales, 2007, pp. 186-187).
According to Vera (2007, pp. 303-306), a cluster is a sectoral and / or geographical
concentration of companies that work in the same activities or in closely related activities, both
backwards, towards suppliers of inputs and equipment, and forward and to the sides, towards
processing and user industries as well as services and activities closely related to important and
cumulative external economies, agglomeration and specialization due to the presence of
producers, suppliers and specialized labor and services annexed to the sector and with the
possibility of carrying out a joint action in search of collective efficiency. For Porter cited in
(Vera, 2007, page 306) the clusters are geographical concentrations of interconnected
companies, specialized suppliers, service providers, related sector companies and related
institutions that compete but also cooperate. In its character of critical masses of unusual
competitive success in determined areas of activity, in an activity characteristic of all or almost
all national, regional and even metropolitan economies, especially that of the most advanced
countries. Not only applies to local geographic sectors but also to the national environment, an
important fact is that, as there are rival companies within the cluster, this will promote
innovation and the competitive development of firms. While for Roldan (2019) a cluster is a
geographical concentration of support institutions and companies that produce and complement
each other in a specific field. Functionally, it is articulated in associative schemes with value
network structures, with the main objective of improving its profitability and competitiveness.
Another author who defines the cluster and is a pioneer in the new economic geography is Gala
(2005, pp. 9-10), who in a general way can define the clusters as a group, geographically close,
of interconnected companies and associated institutions in a particular field and linked by
externalities of various types, which can be seen as processes in the sense that they can be
considered a way of understanding how the economy works and organizes its strategies, as well
as results, observing the clusters as a critical mass of firms interconnected geographically. On
the other hand, Krugman (1991) considers the cluster is a product of history and economies of
scale propitious by the behavior of the market; for Scott (1986), clusters are the spatial
consequence of the vertical disintegration of large companies; while for Harrison (1992), the
cluster is constituted by companies specialized in one or more phases of the production

63rd International Scientific Conference on Economic and Social Development – "Building Resilient Society" - Zagreb, 11-12 December, 2020
20
processes, which leads to cooperation and to exchange tools and information to improve the
collective processes of the regional industry. On the other hand, Storper (1992 and 1997), based
on the findings of Piore and Sabel (1984), suggests that the clusters are the result of flexible
specialization. A simpler way to define it is the one proposed by Rosenfeld (1997) cited in the
Regional Quantitative Analysis Research Group of the University of Barcelona (2005), a cluster
is used very simply to represent concentrations of companies that are capable of producing
synergies due its geographical proximity and the existence of interdependencies between them,
despite the fact that their weight in total employment is not preponderant or even relevant. It is
necessary to consider that economic clusters do not only have to do with sectors and support
institutions, but they have to do with them as much as they are more competitive due to the
relationships they establish between them, this facilitates the exchange, potentiates the
synergies and minimizes transaction costs. Altemburg adds that a cluster is an agglomeration
of a significant number of companies in a defined geographical area that has a clear profile of
specialization and in which the degree of division of work and interactions between companies
is high (Garnica & Rivero, 2004). Then the clusters are in the majority networks, trans-sectorial
networks that comprise complementary companies and specialized in a link or knowledge base
in the value chain.
2.2. Theoretical approaches
The first proposed approach is that of the classical economists who divide this approach into
two basic currents: The Marshallian perspective or the theory of interaction and the industrial
districts, exposed by Marshall (1890) and the theory of industrial location with contributions
from Weber (1929) and Hoover (1937) later Krugman (1995) and Borja and Castells (1997).
On the one hand, the theory of industrial location and economic geography tries to explain why
activities tend to be concentrated in certain areas and are not distributed randomly. It
emphasizes the relative weight of the cost of transport in the final cost, which would explain
why some activities are usually located close to natural resources, close to markets and others
anywhere, in which benefits are produced and called economies of agglomeration and on the
other the theory of interaction aims to explain that the most propitious conditions for there to
be learning are based on interaction. What, according to this approach, would explain the
success of the industrial districts. Likewise, the interaction accelerates the dissemination of
knowledge and innovation, which is a social good internalized by all the companies in the
district (Garnica & Contreras, 2007, page 311). The theory of cluster growth and sectoral
agglomeration in turn attempts to explain the development of clusters, whether or not they are
based on natural resources. First, these new theories have demonstrated the importance of the
accumulation of a specific resource to explain economic growth (Garnica & Rivero, 2004, page
312). The new economic geography explains why certain activities agglomerate in a certain
region. The decisions of firms' locations depend on the interrelation between production costs
and the ease of access to markets (of goods, factors, etc.). If transport costs are reduced, then
the sites of the firms are highly sensitive to the differentials of productive costs. On the other
hand, if the above costs are high, companies will find themselves more linked to certain given
markets and, consequently, they are less sensitive to disparities in production costs. It promotes
growth through the innovation of economic activities, which in turn benefits a reduction in the
costs of innovation and, consequently, a higher growth, so that a circular causality is generated
between growth and geographical concentration of economic activities (Garnica & Contreras,
2007, page 313). Another approach is that of the industrial districts and the collective efficiency
in which two mechanisms that lead to the formation of this are distinguished, on the one hand,
are the positive external economies that are the savings that a company can make due to the
actions of other actors. These arise when the actors cannot incorporate all the costs and benefits
of an activity and on the other side is the joint action that acts as a deliberate measure, by

63rd International Scientific Conference on Economic and Social Development – "Building Resilient Society" - Zagreb, 11-12 December, 2020
21
including the association with other stakeholders to ensure the interests of the union, exchange
information or contract a service that shares the costs. This action can take place directly
between two or more companies or comes through trade associations and promotion institutions
(Vera, 2007, page 315). Within the theoretical approaches, the one of the competitive advantage
of the nation stands out that according to Porter (1990) it indicates that the competitiveness of
a nation depends on the capacity of its industry to innovate and improve. The competitive
advantage is created and maintained through a very localized process influenced by very
characteristic of a nation, such as its values, culture, economic structure, institutions and history,
and for this the theory of resources and capabilities is taken into account. Because in the clusters
a collective strategy originates, which recognizes the existence of a strategy of a strategic scope
superior to that of the cooperation and the business unit and that would be shared by the
organizations of the same field or niche, this when referring to a cooperative strategy on the
part of the companies involved and that share in such a way resources and specialization. The
following is a summary of the various types of approaches (See Table 1).
Table 1: Cluster theoretical approaches Theoretical
approach
Author Description
New Economic
Geography
P. Krugman
Prepared from A. Marshall's pioneering contributions:
The agglomerations result from the cumulative action
induced by the presence of local external economies.
External economies are incidental and the spatial structure
of the economy is determined by processes of invisible
forces. There is little space for public policies.
Business
economics
M. Porter
Emphasizes the importance of geographically restrictive
external economies, concentration of highly specialized
skills and knowledge, institutions, competitors, related
activities and sophisticated consumers, also in international
competition.
Local strategies are part of the business strategy. The
government must provide education, physical infrastructure
and rules for competition.
Regional
Economy
A. Scout
Economic geography and industrial performance are
interrelated. There is an endemic tendency in capitalism in
the direction of local clusters that are constituted in intensive
regional economies and in transactions that, in turn, are
linked by structures of dispersed interdependence. The
construction of competitive advantages lies in the extra
market coordination and public policies.
Innovation
economy
D.B. Audretsch
Local proximity facilitates the flow of information and the
dimension of knowledge. Economic activities based on new
knowledge are likely to be grouped into geographical
regions.
Small businesses
and industrial
districts
H. Scmitz In addition to the incidental or spontaneous local external
economies, there is a strength derived from the consistent
cooperation between private agents and the public sector.
The concept of collective efficiency combines the
spontaneous effects (unplanned) and those consciously
sought (planned), and is defined as the competitive
advantage derived from local external economies and joint
action.
Source: recovered from (Roldan, 2019, page 14)
63rd International Scientific Conference on Economic and Social Development – "Building Resilient Society" - Zagreb, 11-12 December, 2020
22
Beyond the reasons for the initial location of a cluster, once the specialization pattern is
established, cumulative trade gains are generated. There is a strong path dependence in the
patterns of specialization and commerce. Commerce and location are integrated. When an
industry has a leading development within a region, that region will continue to specialize in
that industry Quintanar and Gatto (1992), the Italian industrial districts were characterized as
small and medium industrial firms with successful recent experiences for their dynamic
development and highly competitive internationally that they managed to harmonize (Gala,
2005). According to Rebelloti (1995) this model was constructed from the presence of four
main characteristics. In the first place, it was constituted by small and medium-sized companies
that were geographically concentrated and specialized sectorially. Second, they established ties
back and forth based on the exchange of goods, people and services both by means of market
mechanisms and outside of it. Third, these companies were characterized by having common
cultural and social backgrounds that favored the creation of codes of conduct both explicit and
implicit. Finally, they were characterized by the presence of a network of local institutions, both
public and private, that supported economic agents within the cluster (Gala, 2005, page 15).
The focus of global value chains looks at the recent changes in production systems, distribution
channels and financial markets, which gained speed as a result of the globalization of product
markets and the spill of IT technologies, suggest that it is necessary pay more attention to
external linkages. In this regard, the approach of global value chains allows to account for the
activities that occur outside the cluster and, above all, to understand the meaning of the
relationships of local producers with the main external actors. This approach is nourished by
two theoretical sets (Pyke, 1998, Helmsing, 2001 and Nadvi, 1995). On the one hand, it uses
the literature on industrial clusters to account for the role of local institutions and networks in
strengthening the conditions for the upgrading of local producers (Gereffi and Kaplinsky,
2001). On the other, it applies the literature on value chains to emphasize how the role of global
buyers and the way of organizing the value chain define the opportunities for modernization of
local companies. This model, as developed by Pietrobelli and Rabelloti (2004), is based on four
elements: value chains, governance, upgrading and tactical knowledge (Gala, 2005, page 17).
On the other hand, Gordon and McCann (2000) suggest three basic types of industrial cluster:
1) The classical model of pure agglomeration, based on Marshall's ideas and characterized by
the absence of cooperation between agents, free membership and the importance of the co-
location. 2) The model of the industrial complex, characterized by the existence of stable and
identifiable relationships between companies, which give rise to a closed club, and the need to
share the same location in space. 3) The model of the social network, based on the strength of
social interactions between companies, in which personal trust plays a preponderant role and
where membership is not completely free although it is not a completely closed club. Spatial
localization is not essential, although it favors the establishment of the bonds of trust that
sustains the network (Regional Quantitative Analysis Research Group of the University of
Barcelona, 2005). Thus, we see how both the sectoral dimension and the geographical
dimension play a fundamental role in the definition, although the problem arises when it comes
to delimiting both dimensions. Although for this Porter mentions that the delimitation of a
cluster is often a matter of nuance. Involving a creative process that must be determined by
knowledge of the links and complementarities between companies and institutions (Figure 1).
Figure following on the next page

63rd International Scientific Conference on Economic and Social Development – "Building Resilient Society" - Zagreb, 11-12 December, 2020
23
Figure 1: Theoretical approaches and cluster development
Source: own elaboration from (Garnica & Contreras, 2007).
3. CLUSTER AS DEVELOPMENT STRATEGIES
For Latin America, Altenburg and Meyer-Stamer (1999) propose a typology of clusters with
three different characteristics: those of survival, composed of micro enterprises and small
businesses that generate low quality consumer products for local markets, have a low degree of
labor force specialization; the clusters that produce for the massive consumption, that prospered
in the stage of substantive industrialization of imports, whose production destined it to the
national market; and the clusters that supply transnational corporations (Corrales, 2007, pp.
190-191):
a) The survival clusters were developed in poor areas and are dedicated to the manufacture of
shoes, furniture, clothing, among other products and services. Altenburg and Meyer-Stamer
(1999) and Altenburg (2001) found imitation practices among their promoters, low levels
of education and trust, as well as predatory and opportunistic attitudes.
b) The clusters that produce massively to the national market are constituted by medium and
large companies with good administrative organization and technological capacity. These
clusters lack technological innovation, with the exception of their suppliers, who buy
automated machinery with state-of-the-art technology.
c) The clusters formed around the transnational companies carry out a set of activities more
technologically complex, such as the assembly and manufacture of parts for the electronics
and automotive industry. Given the technological level with which they operate, there are
many barriers to the entry of local companies as suppliers or subcontractors.

63rd International Scientific Conference on Economic and Social Development – "Building Resilient Society" - Zagreb, 11-12 December, 2020
24
Another way to develop a cluster is through sector analysis Porter (1998) cited in (Garnica &
Rivero, 2004, pp. 145-146) which is to understand the competition is the sector. A sector
(manufacturer or service) is a group of competitors that manufacture products or provide
services and compete directly with others. Sectors differ from the nature of competition and not
all sectors offer the same opportunities to achieve sustained profitability. The second essential
issue in the strategy is the positioning within the sector. Some positions are more profitable
than others, regardless of what the average profitability of the sector may be. Although it is
worth mentioning that according to (Garnica & Rivero, 2004) there are studies mentioning that
the sectoral analysis is limited because it concentrates on quantitative or statistical aspects,
therefore, qualitative interconnections linked to knowledge flows arising between inter-network
networks are neglected. business, focuses only on groups of companies producing similar final
goods, are not considered links that the company can create with customers, suppliers and
specialized institutions, there are doubts about whether the companies that make up the sector
can establish cooperation ties with their rivals and seeks diversity in existing industrial
trajectories, rather than synergies. A central element to consider the analysis of the cluster is
that of inter-company networks. A network is defined as: a set of explicit, selected links with
preferential patterns that occur jointly of companies based on complementary advantages and
market relations, with the static and dynamic reduction of uncertainty as the main goal
(Freeman, 1991: 501) cited in (Garnica & Rivero, 2004, page 150), where this type of networks
arises for several reasons:
a) Need to coordinate processes of productive and technological specialization of companies
b) Rapid and widespread introduction of new information and communication technologies
c) Rediscovery of the influences of static and dynamic externalities) in the different members
of a group.
d) Decrease in the trend towards vertical integration and boom in outsourcing processes
Social and institutional innovations that contribute to the solution of complex socio-economic
problems, that neither the market nor the company can offer an adequate response. An important
element for the emergence of the cluster is cooperation and this is achieved through networks
and trust ties, because this reduces transaction costs and generates linkages (see Figure 2).
Figure 2: Determining factors for the operation of the cluster
Source: own elaboration from (Corrales, 2007)

63rd International Scientific Conference on Economic and Social Development – "Building Resilient Society" - Zagreb, 11-12 December, 2020
25
Clusters are not the magic formula for economic growth and sustainable regional industrial
development, but in several parts of the world they have yielded results and generated
economies of scale. The proximity between companies and the establishment of institutions and
processes to support industries within a specific geographical area has advantages. Some of
them include the proximity of raw materials and markets, a constant supply of skilled labor and
the support of institutions and government. There are also elements that can hinder the growth
of geographically agglomerated companies, the model of development through clusters also has
considerable disadvantages (Martin and Sunley, 2003, Pacheco-Vega, 2004, Palazuelos, 2005).
The negative aspects include the increase in competition between companies (predatory
behavior), both in the aspect of final customers and in terms of the availability of skilled labor
(Pacheco-Vega, 2007). The popularity of the clusters is due not only to the Italian literature and
its analyzes of the economic boom and the industrial regional development of the Third Italy
(Becattini, 2002, Grandinetti and Tabacco, 2003, Paniccia, 1998, Rabellotti, 1995), but also to
the interest in Saxon literature by industrial groupings (Feldman et al., 2005, Harrison, 1992,
Porter, 1998, 2000, Quadrio-Curzio and Fortis, 2002) (Pacheco-Vega, 2007). The spatial
distribution of the cluster feeds the commercial and non-commercial relationships and also
generates resource supply indirectly to some sub-sectors of the related economy. The
emergence of a cluster is part of the process of restructuring the economy in the focused
delegations of a city (Mercado & Moreno, 2011).
4. CONCLUSIONS
Although all the theoretical approaches to the concept are relevant, we can conclude that several
authors coincide in the assumptions and some parts of the conceptual definition subtracting a
simple definition is that the cluster is a group of companies that perform in the same activities
or activities closely related both backward, forward and sideways. The cluster according to the
authors cited can be a natural or artificial, natural regional development strategy like the one
that has already been formed due to supply and demand and the artificial ones created through
public policies to encourage the development of a region. Although several theoretical
approaches have been analyzed, it is pertinent to mention that all of them subscribe to this topic
of relevance, the cluster cannot be defined by means of a focal lens or through a perspective.
For future empirical research it is necessary to start from the theory because there are empirical
studies that do not give great value to the theory, this being the support of knowledge generated
through the application in case studies.
LITERATURE:
1. Altenburg T. (2001). La promoción de clusters industriales en América Latina. Buenos
Aires: Focopyme.
2. Altenburg, T, & Meyer-Stamer, J,, (1999). How to Promote Clusters: Policy Experiences
from Latin America, World Development, Elsevier, vol. 27(9), pages 1693-1713,
September.
3. Becattini, G. (2002), Industrial Sectors and Industrial Districts: Tools for Industrial
Analysis, European Planning Studies, vol. 10, núm. 4, pp. 483-493
4. Becattini, G. (1992). El distrito industrial marshaliano como concepto socioeconómico, en
Pyke, F., G. Becattini y W Sengenberger (eds.), Los distritos industriales y las pequeñas
empresas, vol. Distritos industriales y cooperación interempresarial en Italia", Madrid,
Ministerio del Trabajo, 1992.
5. Borja, J. y Castells, M. (1997). Local y global, la gestión de las ciudades en la era de la
información, Madrid, Taurus, 1997.
6. Corrales, S. (2007). Importancia del clúster en el desarrollo regional actual. Frontera Norte,
19(37), 173-191.

63rd International Scientific Conference on Economic and Social Development – "Building Resilient Society" - Zagreb, 11-12 December, 2020
26
7. Feldman, M. P., Francis, J. y Bercovitz, J. (2005), Creating a Cluster while Building a Firm:
Entrepreneurs and the Formation of Industrial Clusters, Regional Studies, vol. 39, núm. 1,
pp. 129-141.
8. Freeman, Ch. (1991). Networks of Innovators: A Synthesis of Research Issue, Research
Policy 20, NorthHolland, 1991, pp. 499-514.
9. Gala, M. (2005). Competitividad y complejos productivos: teoría y lecciones de política.
Serie: Estudios y Perspectivas, 9-10.
10. Garnica, A., & Rivero, A. (2004). Clúster y coo-petencia (cooperación y competencia)
industrial: algunos elementos teóricos para considerar. Problemas de desarrollo, Revista
Latinoamericana de Economía, 35(139), 144-145.
11. Garnica, J., & Contreras, F. (2007). Los Clúster Industriales: Precisión Conceptual y
Desarrollo Teórico. Cuadernos de Administración, 303-322.
12. Gereffi, G. and Kaplinsky, R. (eds) (2001) The Value of Value Chains,IDS Bulletin,32(3),
special issue
13. Gordon, I.R., McCann, P. (2000) Industrial clusters: complexes, agglomeration and/or
social networks? Urban Studies, 37: 513–532
14. Grandinetti, R. y R. Tabacco (2003), Formation and Evolution of Industrial Districts: a
Knowledge-based Perspective for Industrial District Research, Reinventing Regions in a
Global Economy: Regional Studies Association International Conference, Pisa, Italia.
15. Grupo de Investigación Análisis Cuantitativo Regional de la Universidad de Barcelona.
(2005). Definición de la metodología de detección e identificación de clústers industriales
en España. Obtenido de www.ipyme.org/Publicaciones/lopezbazo.pdf
16. Harrison, B., (1992). Industrial Districts: Old Wine in New Bottles, Regional Studies, vol.
26, núm. 5, 1992.
17. Helmsing, B. (2001) Externalities, Learning and Governan-ce: New Perspectives on Local
Economic Development,Development and Change, 32: 277-308.
18. Hoen, A. (1999). Three variations on identifying clusters. [Documento www]. Dirección en
Internet: http:/www.oecd.org/dsti/sti/s_t/inte/nis/Clusters/clusters.htm
19. Hoover, E. (1937). Spatial price discrimination. Review of Economic Studies, 4, 182-191
20. Krugman, P. (1995). Development, Geography, and Economic Theory, Estados Unidos de
América, Massachusetts Institute of Technology, 1995.
21. Krugman, P. (1992). Geografía y Comercio, Barcelona, Antoni Bosch Editor, 1992.
22. Krugman, P. (1991). Increasing returns and economics geography. Journal of Political
Economy, 99 (3), 483-499
23. Marshall, A. (1963). La Concentración de las Industrias Especializadas en las Localidades
Particulares, en Principios de Economía, Madrid, Editorial Aguilar, 1963, pp. 223-232.
24. Marshall, A. (1890). Principles of economics: An introductory volume. Canada: McMaster
University.
25. Martin, R. y Sunley, P. (2003), Deconstructing Clusters: Chaotic Concept or Policy
Panacea?, Journal of Economic Geography, vol. 3, núm. 1, pp. 5-35.
26. Mercado, A., & Moreno, M. (2011). La ciudad de México y sus clústers. México: Juan
Pablo SA.
27. Nadvi, K. (1995), Industrial Clusters and Networks: Case Stu-dies of SME Growth and
Innovation, Sussex, Institute ofDevelopment Studies-University of Sussex.
28. Pacheco-Vega, R. (2007). Una crítica al paradigma de desarrollo regional mediante clusters
industriales forzados. Estudios Sociológicos, 25(3), 683-707.
29. Pacheco-Vega, R. (2004), Historia de dos ciudades: un análisis comparativo de los distritos
industriales del cuero y calzado en León y Guadalajara, Meeting of the Latin American
Studies Association, Las Vegas, Nevada.

63rd International Scientific Conference on Economic and Social Development – "Building Resilient Society" - Zagreb, 11-12 December, 2020
27
30. Palazuelos, M. (2005), Clusters: Myth or Realistic Ambition for Policymakers?, Local
Economy, vol. 20, núm. 2, pp. 131-140.
31. Paniccia, I. (1998), One, a Hundred, Thousands of Industrial Districts. Organizational
Variety in Local Networks of Small and Medium-sized Enterprises, Organization Studies,
vol. 19, núm. 4, pp. 667-699
32. Piore, M. J. y Charles F. S. (1984) The Second Industrial Divide, Possibilities for
Prosperity, Nueva York, Harper Collins Publishers, 1984
33. Porter, M. (2003). Ser competitivo: nuevas aportaciones y conclusiones. Bilbao: Ediciones
Deusto.
34. Porter, M. E. (1998) The Competitive Advantage: Creating and Sustaining Superior
Performance. NY: Free Press, 1985. (Republished with a new introduction, 1998.)
35. Porter, M. (1990). The competitive advantage of the nations. New York: The Free Press.
36. Pietrobelli, C., & Rabellotti, R. (2004). Upgrading inclusters and value chains in Latin
America: The roleof policies. InSustainable Development DepartmentBest Practices Series.
Washington, DC: Inter Amer-ican Development Bank
37. Pyke, F. (1998), Local Development Initiatives and the Management of Change in Europe,
Discussion Paper, Employment Department, International Labour Office, Geneva.
38. Quadrio-Curzio, A. y Fortis, M. (2002), Complexity and Industrial Clusters: Dynamics and
Models in Theory and Practice, Heidelberg, Nueva York, PhysicaVerlag.
39. Quintanar, A. y Gatto, F. (1992). Distritos industriales italianos. Experiencias y
aportaciones para et desarrollo de políticas industriales locales. Documento de trabajo
PRIDES, num. 29, publicaciones CEPAL, Argentina, 1992
40. Rabellotti, R. (1995). Is there an `industrial district model'? Footwear districts in Italy and
Mexico compared. World Development23, 29-41.
41. Roldan, C. (17 de Mayo de 2019). Conceptos y fundamentos de los clúster insdustriales.
Obtenido de
http://www.ptolomeo.unam.mx:8080/xmlui/bitstream/handle/132.248.52.100/528/A4.pdf?
sequence=4
42. Rosenfeld A., S. (1999). Estados Unidos: Las concentraciones empresariales, Redes de
empresas y desarrollo local, París, Organización para la Cooperación y el Desarrollo
Económico, 1999.
43. Scott, A. J. (1986). Industrial Organization and Location on Labor, the Firm and Spatial
Process, Economic Geography, vol. 62, núm. 3, 1986.
44. Storper, M. (1992). The Limits to Globalization: Technology Districts and International
Trade, Economy Geography, vol. 68, núm. 1, 1992.
45. Vera, R. (2007). Los clúster industriales: precisión conceptual y desarrollo teórico. Revista
Cuadernos de Administración, 20(33), 303-322.
46. Weber, A. (1929). Theory of the location of industries. Chicago: University of Chicago
Press

63rd International Scientific Conference on Economic and Social Development – "Building Resilient Society" - Zagreb, 11-12 December, 2020
28
TYPES OF INNOVATIONS AND FIRM PRODUCTIVITY IN RUSSIA
Karina Nagieva
Ural Federal University, Ekaterinburg, Russia
Andrey Pushkarev
Ural Federal University, Ekaterinburg, Russia
Natalia Davidson
Ural Federal University, Ekaterinburg, Russia
Oleg Mariev
Ural Federal University, Ekaterinburg, Russia
ABSTRACT
This paper analyzes the factors behind the firm-level innovations and the effects of various
types of innovations on firm productivity in Russia. We apply CDM model and use BEEPS data
on the Russian companies for the years 2012-2014. Several types of innovations are
considered: product, process, organizational and marketing innovations. The results suggest
that all types of innovations increase productivity, both if introduced individually and in
combination. We also find that cooperation of firms in implementing innovations strongly
facilitates innovative activity. In addition, business climate and state policies substantially
affect firm innovation activity. In particular, improving the quality of institutions and human
capital, facilitating competition, and increasing the efficiency of government spending are
measures especially important for increasing innovative activity of Russian firms.
Keywords: business climate, CDM model, human capital, productivity, types of innovations
1. INTRODUCTION
Being essential for enterprise competitiveness, innovation is also a source of sustainable
economic growth and improved living standards. Moreover, while technological development
creates controversy in terms of employment, innovation as a broader phenomenon generates
new sectors and jobs through technology (World Bank, 2019). In this paper, we explore the
impact of innovations on productivity of manufacturing enterprises. Although there is a lot of
research on this issue, which is particularly important in the era of digitalization, the relationship
between innovations and productivity is not evident. The reasons for this ambiguity are twofold.
Firstly, all firms deal with innovations differently: some of them are more inclined to pursue
innovations than the others; some firms are relatively more efficient in performing innovations
and so on. Secondly, endogeneity is likely to be present, in other words, while innovative firms
are more productive, more productive firms tend to introduce innovations. We study the factors
affecting firm level innovations and productivity employing Business Environment and
Enterprise Performance Survey (BEEPS) micro-level dataset of the Russian firms and using
three-stage CDM model. This firm level survey is performed by EBRD and the World Bank.
Managers are asked about the quality of business environment. Our research takes into account
both firm characteristics and a number of exogenous factors, such as business climate, human
capital, and governmental support reflected in the Survey. The case of Russia is especially
interesting, when it comes to the connection between intention to innovate and productivity

63rd International Scientific Conference on Economic and Social Development – "Building Resilient Society" - Zagreb, 11-12 December, 2020
29
gains. Currently, Russian economic environment combines low level of innovative activity,
relatively high level of human capital and low level of labour productivity and its growth. In
other words, understanding how decisions to innovate are connected to actual productivity in
Russia may be important for elaboration of the relevant policy improvements and uncovering
obstacles for innovation in Russia and other transition countries with similar features. The
existing literature is expanded with analysis of different types of innovations in Russia and their
impact on the firm performance. Our results suggest that it is more effective for the firms to
combine several types of innovations than to introduce them separately. Further, not only
internal factors, but also external ones, such as competition and obstacles to business activity,
are found to be significant for the innovative capacity of firms. The rest of the work is structured
as follows. In the next section, a brief review of research papers is provided. Following section
is devoted to description of data and methodology. Then we present and discuss the results of
econometric analysis. The last section concludes and discusses possible policy implications.
2. BACKGROUND AND THE EXISTING RESEARCH
There are a number of studies on the relationship between innovation and productivity. For our
research we employ a CDM-model (Crépon-Duguet-Mairesse model). This model links the
intensity of R&D, introduction of innovations and productivity in a single chain for the French
firms (Crépon et al., 1998). In this section we review mainly the papers where this model is
employed. Besides, we are interested in the studies devoted to transition economies, particularly
to Russia. The CDM-model studies the channels through which decisions to invest in
development affect innovation activities, which, in turn, affect productivity. The original CDM
model consists of 3 stages with 4 equations, dependent variables being predicted and included
in the next equation. Based on the sample of 4,164 French firms from the national innovation
survey, Crépon et al. (1998) reveal positive effect of R&D activities and innovations on value
added per employee. Various forms and modifications of the original CDM model were
suggested depending on the aims of the authors. In particular, a variety of innovations indicators
were introduced. For example, Lööf et al. (2003) and Janz et al. (2003) use innovative sales per
employee of Swedish and German firms as an innovative result. Hall et al. (2008) and Duguet
(2006) measure innovations as probability for Slovenian firms to introduce various types of
innovations (product, process, etc.). Another important subject related to transferring R&D into
innovations and further into productivity gains is various types of innovations that a firm can
pursue. Cirera (2015) analyzes 500 Kenyan firms for 2013-2014 based on CDM-model and
finds that international competition, market pressure on product diversification and access to
finance have the strongest effect on the intensity of research and development, and that
innovative firms invest more in knowledge resources. Authors devote attention to firms’
internal characteristics affecting various types of innovations. Junge et al. (2012) based on
CDM model and Danish Community Innovation Surveys for 2004, 2007 and 2008 finds that
education in technical sciences is significant for all types of innovations, while education in
social sciences and humanities is especially important for organizational and marketing
innovations. Moreover, the firms implementing more than one innovation are more productive
than the firms that introduce only one of them. Higher level of employee’s education and
managers’ perceived knowledge, as well as presence of R&D department and cooperation with
universities and research institutions was found to be favorable for innovations in Chili and
Colombia (Marotta et al., 2007). Eastern European countries are inefficient at converting their
R&D, innovation and production capabilities into improvement of productivity, as firms
working in transition economies have to deal with complicated institutional environment
(Kravtsova & Radosevic, 2012). In Russia innovation activity of firms in the high-tech
manufacturing sector was found to be limited by the lack of financial resources and by unfair
competition caused by the non-uniform state support (Roud, 2007).

63rd International Scientific Conference on Economic and Social Development – "Building Resilient Society" - Zagreb, 11-12 December, 2020
30
There remains a lack of studies on the topic of external factors determining various types of
innovations in Russia. We intend to shed some light on this issue. In the next section we discuss
methods and data used in our research.
3. DATA AND METHODS
While studying the determinants and effects of firms’ innovative activities, we focus on the
endogeneity of innovations performed by the firms. With this in mind, we have chosen CDM
model as the main tool for the analysis. We employ data from the Business Environment and
Enterprise Performance Survey (BEEPS) conducted by the World Bank and the European Bank
for Reconstruction and Development for 2012-2014 on firms from transition countries. This
survey involves 1564 manufacturing enterprises from 37 regions of the Russian Federation. At
the first stage, firms decide whether and how much to invest in R&D. Using the goodness-of-
fit test after estimating Poisson regression model, we found that the most appropriate model for
the first step is the negative binomial regression. Such model allows taking into account the
firms with zero investments. At the first stage, the following determinants were identified: 1)
external factors, such as number of competitors, status of importer, business environment
conditions; 2) individual characteristics of firms, such as age, size, being a part of a large
association or enterprise (Bozic & Botric, 2011). Dependent variable at the first stage is
expenditures on R&D in thousands of rubles. At the second stage, a predicted amount of R&D
is used in the model with an innovative result as a dependent variable. We analyze four classic
types of innovations: product, process, organizational and marketing ones. Given a binary
nature of the dependent variables (1, if any innovations were implemented, and 0 otherwise),
the equations are estimated using the probit model. The impact of human capital at the firm
level is of particular interest, as special skills and knowledge are essential for successful
implementation of innovations. Besides, dummy variables of firms’ cooperation with various
stakeholders are introduced, and they are all compared to the case of the companies that did not
cooperate with anyone on innovations. When studying the types of innovations, the question
arises as to what extent they are substitutes or complements for each other. Technological
innovations (product and process) tend to be relatively more researched. Organizational
innovations seem to be the most hidden type of innovations, since they can be observed mainly
within the company. We constructed the following combinations with organizational
innovations:
• Product and organizational innovations
• Process and organizational innovations
• Marketing and organizational innovations
• Product, process and organizational innovations
• Product, marketing and organizational innovations
The first three combinations are evaluated using the binary probit model, and for the last two
ones the multivariate probit model is employed. At stage three, the innovative result predicted
at the second stage is used to estimate its impact on firm productivity. To evaluate the third
step, a standard Cobb-Douglas production function was chosen and modified based on Cirera
(2015):
log (𝑌𝑖 𝐿𝑖⁄ ) = 𝛿0 + 𝛿0 log 𝐻𝑖 + 𝛼 log (𝐾𝑖 𝐿𝑖⁄ ) + (𝛽 + 𝛼 − 1) log 𝐿𝑖 + 휀𝑖 ,
where Y, H, K, L is revenue in thousands of rubles, innovative result, capital as replacement
cost for machines and labor costs in thousands of rubles of the i-th company respectively.

63rd International Scientific Conference on Economic and Social Development – "Building Resilient Society" - Zagreb, 11-12 December, 2020
31
In all three steps of the CDM-model we included control variables such as industrial and
regional dummies. The results of estimating the CDM-model are presented in the next section.
4. RESULTS AND DISCUSSION
In all equations of the CDM model robust standard errors are used to deal with
heteroscedasticity. Below are the results of the first stage of the model. The dependent variable
at this stage is R&D expenditures within the firm (see Table 1).
Variables The sum of R&D expenditures within the firm (own
expenditures)
Size 0.583** (0.228)
Age -0.015* (0.008)
Competition -0.004* (0.002)
Part of a larger enterprise 0.667** (0.283)
Subsidies 0.372 (0.293)
Taxes 0.221 (0.188)
Inadequacy of the workers' qualification 0.650*** (0.186)
Import 0.711*** (0.231)
Business licensing and permits 0.560*** (0.208)
Industry, regional dummies YES
Constant 10.74*** (1.115)
LR test 229.62***
Pseudo R2 0.039
Observations 1,505
Table 1: The CDM model for the Russian firms: the first stage
(Source: Author’s calculations based on the BEEPS data)
Notes: *** significant at the 1% level, ** - at the 5% level, * - at the 10% level. The standard
errors are in parentheses
The results of the first stage of the CDM-model are in line with our hypotheses. As it can be
seen from the table, large firms are more inclined to invest in research and development. This
could be expected, since research and development require substantial financing, which is more
likely to be provided by larger firms. Age coefficient shows that the younger the firm, the more
it invests in R&D. This is an expected result, since new firms must be as competitive as possible
so that they could establish themselves on the market. Concerning the role of competition, the
results show that an increase in the number of competitors has a negative impact on investment
into research and development. An increase in the number of competitors probably puts
additional pressure on firms, which as a result may reduce R&D funds. It might occur due to
the nature of competition in the transition economy of Russia. However, weak competition may
be among the reasons for low innovation activity in the Russian Federation, and competition
could potentially be a driver for innovations in the market. Firms owned by a large enterprise
are observed to spend relatively more on research and development. Such firms, as a rule, have
access to knowledge and skills within the enterprise. In addition, based on our data and model
specification the impact of subsidies turned out to be positive, but not significant. This may
indicate that subsidies could have been directed to the purposes other than innovations.
Moreover, enterprises might know little about state support programs, and firms might possibly
have unequal access to subsidies. Business barriers, except for tax rates, turned out to be
significant for R&D expenditures. A positive sign indicates that innovative firms tend to face
some obstacles and are burdened by them. In particular, positive impact of business licensing
and permits indicates problems in the Russian institutional environment that innovative
companies face. Positive relation between inadequacy of the employees’ educational level and
intensity of R&D investment can arise because innovative companies have higher requirements

63rd International Scientific Conference on Economic and Social Development – "Building Resilient Society" - Zagreb, 11-12 December, 2020
32
and are less satisfied with employees’ qualification. Bozic & Botric (2011) also received a
positive impact of the barriers to doing business on the propensity to innovate, based on the
BEEPS 2009 survey, which included 12,000 enterprises from 29 transitional countries (EU
candidate countries). Results indicate that import as an indicator of international economic
activity is positive and significant for R&D. In other words, a company being involved in
foreign trade has an opportunity not only to acquire foreign technologies, but also to gain
knowledge on business practices. Industry and regional dummies are both significant for R&D
investment. At the next stage possible combinations of types of innovations are analyzed. These
combinations were introduced after considering specific features of each type of innovations.
In Table 2 below the results of the second stage of the CDM model are presented.
Variables Probability of
introducing
product
innovation
Probability of
introducing process
innovation
Probability of
introducing
organizational
innovation
Probability of
introducing
marketing
innovation
Predicted sum of R&D
expenditures within the
firm
0.0000667**
(0.0000303)
0.0000837***
(0.0000266)
0.0000646***
(0.0000203)
0.0000264
(0.0000198)
Licensing
-
0.266***
(0.093)
0.180*
(0.093)
0.100
(0.098)
Domestic suppliers
-
0.212***
(0.059)
0.116**
(0.056)
0.127**
(0.061)
Foreign suppliers
-
0.263***
(0.095)
0.123
(0.091)
0.071
(0.091)
Domestic consumers
-
0.309***
(0.081)
0.206***
(0.077)
0.225***
(0.076)
Foreign consumers
-
-
0.510***
(0.184)
0.516***
(0.189)
Cooperation with
universities or research
institutions
-
0.451***
(0.120)
0.290***
(0.091)
0.148
(0.099)
Training of personnel
0.098***
(0.025)
0.169***
(0.022)
0.159***
(0.021)
0.146***
(0.022)
Industry dummies NO NO NO YES
Regional dummies YES YES YES YES
Wald test 141.62*** 237.92*** 246.86*** 205.94***
Pseudo R2 0.101 0.142 0.145 0.118
Observations 1,328 1,503 1,503 1,499
Table 2: The CDM model for the Russian firms: the second stage (marginal effects of probit
model)
(Source: Author’s calculations based on the BEEPS data)
Notes: *** significant at the 1% level, ** - at the 5% level, * - at the 10% level. The standard
errors are in parentheses
As it can be seen from the table, the return on investment in R&D is significant for all types of
innovations excluding marketing innovations. We argue that the reason for such result is that
this kind of innovations does not require as much R&D investments as the others. Alternatively,
the effect of the investments could only be noticeable if they were jointly introduced with other
types of innovations. The results show that almost all sources of innovations are positive and
significant for an innovative result. These sources are compared with the firm’s own idea, and
they prove to increase the innovative potential of enterprises. The exception is product
innovations with all sources of innovations being insignificant. Training of personnel proved to
be positive and significant for innovative results, which indicates the importance of special
skills and knowledge of personnel for innovations regardless of their type.

63rd International Scientific Conference on Economic and Social Development – "Building Resilient Society" - Zagreb, 11-12 December, 2020
33
In terms of control variables, only marketing innovations were sensitive to industry differences.
Below are the results of the last stage of the CDM modeling (see Table 3).
Variables The logarithm of labor productivity
Predicted probability of introducing product
innovation
1.906**
(0.886)
Predicted probability of introducing process
innovation
0.743**
(0.291)
Predicted probability of introducing
organizational innovation
1.013***
(0.352)
Predicted probability of introducing marketing
innovation
1.055**
(0.451)
Cost of capital per unit of labor cost 0.081***
(0.024)
0.080***
(0.022)
0.080***
(0.022)
0.081***
(0.022)
Logarithm of labor cost
-0.170***
(0.042)
-0.169***
(0.035)
-0.170***
(0.035)
-0.163***
(0.035)
Industry, regional dummies YES YES YES YES
Constant
4.036***
(0.660)
4.439***
(0.569)
4.558***
(0.574)
4.369***
(0.564)
Observations 304 355 357 356
R-squared 0.360 0.360 0.360 0.354
Table 3: The CDM model for the Russian firms: the third stage
(Source: Author’s calculations based on the BEEPS data)
Notes: *** significant at the 1% level, ** - at the 5% level, * - at the 10% level. The standard
errors are in parentheses
Results show that all types of innovations are positive and significant for labor productivity, i.e.
the firms’ investments in research and development lead to successful commercialization.
Concerning the remaining variables of traditional production factors, an increase in capital per
unit of labor costs leads to an increase in labor productivity as it would be expected. A negative
sign of the logarithm of labor costs indicates an inverse mathematical relationship between
productivity and labor costs in the final equation. Industry and regional dummies are both
significant for productivity. Next we perform a robustness check. Bivariate and multivariate
probit models are estimated at the second stage of the CDM model to test complementarity
between the types of innovations (see Table 4).
Table following on the next page

63rd International Scientific Conference on Economic and Social Development – "Building Resilient Society" - Zagreb, 11-12 December, 2020
34
Bivariate model Multivariate probit
(1) (2) (3) (4) (5)
Variables Probability of
introducing
product and
organizational
innovation
Probability of
introducing
process and
organizational
innovation
Probability of
introducing
marketing and
organizational
innovation
Probability of
introducing
product,
process and
organizational
innovation
Probability of
introducing
product,
marketing and
organizational
innovation
Predicted sum
of R&D
expenditures
within the firm
0.0000489***
(0.0000133)
0.0000581***
(0.0000154)
0.0000361***
(0.0000129)
0.000232**
(0.0000988)
0.000209**
(0.0000873)
Licensing
0.760***
(0.0656)
0.174**
(0.074)
0.127*
(0.073)
6.986***
(0.430)
7.031***
(0.450)
Domestic
suppliers
1.052***
(0.059)
0.131***
(0.038)
0.101**
(0.042)
10.22***
(0.384)
10.19***
(0.347)
Foreign
suppliers
0.648***
(0.0513)
0.141***
(0.0523)
0.087
(0.0754)
6.398***
(0.172)
6.419***
(0.145)
Domestic
consumers
0.697***
(0.0493)
0.207***
(0.0499)
0.185***
(0.0542)
4.047*
(2.181)
3.377***
(0.651)
Foreign
consumers
0.826***
(0.095)
0.952***
(0.096)
0.447***
(0.167)
5.859***
(0.173)
5.985***
(0.267)
Cooperation
with
universities or
research
institutions
0.749***
(0.055)
0.308***
(0.069)
0.182***
(0.070)
6.222***
(0.195)
6.329***
(0.192)
Training of
personnel
0.105***
(0.014)
0.132***
(0.016)
0.131***
(0.017)
0.296***
(0.076)
0.290***
(0.077)
Industry,
regional
dummies
YES YES YES YES YES
Wald test 30622.87*** 7543.99***
rho 0.460*** 0.631*** 0.809***
rho21 0.613*** 0.366***
rho31 0.395*** 0.382***
rho32 0.595*** 0.757***
Observations 1,505 1,505 1,505 1,505 1,505
Table 4: Results of the second stage of the CDM model for the Russian firms: marginal effects
of bivariate and multivariate probit model
(Source: Author’s calculations based on the BEEPS data)
Notes: *** significant at the 1% level, ** - at the 5% level, * - at the 10% level. The standard
errors are in parentheses
The results show that joint probability of the suggested combinations is significant in all
specifications of the binary and multiple probit models. This is indicated by the correlations
rho. In particular, the closest relationship is observed between marketing and organizational
innovations (0.81) and process and organizational innovations (0.63) in equations (3) and (2)
respectively. In multiple probit models a high correlation can be traced between product and
process innovations (0.61) and process and organizational innovation (0.59) in equation (4),
and also between marketing and organizational innovation (0.76) in equation (5). In other
words, introducing one type of innovation may not be enough to generate benefits, and therefore
firms decide to introduce several types of innovations at a time. Organizational innovations
complement all combinations. In all regressions, investing in R&D is positively significant for
the joint probability of various types of innovations, and the marginal effects are greater in
multiple probit models than in individual ones.

63rd International Scientific Conference on Economic and Social Development – "Building Resilient Society" - Zagreb, 11-12 December, 2020
35
This suggests that the returns from R&D are higher in case when various innovations are
introduced simultaneously. The same applies to the ways of introducing innovations. Almost
all variants of cooperation, with the exception of foreign suppliers in equation (3), have a
positive effect on the joint likelihood of different innovations. Training of personnel is
significant for all combinations. Sectoral and regional dummies are also significant in all
specifications of the model. Below are the results for the last stage of the CDM model with joint
probabilities of innovations (see Table 5).
Predicted joint probabilities
Product and
organizational
innovation
Process and
organizational
innovation
Marketing and
organizational
innovation
Product, process
and
organizational
innovation
Product,
marketing
and
organizational
innovation
The logarithm of
labor productivity
0.773**
(0.299)
0.875***
(0.331)
0.9262**
(0.4321)
0.0263*
(0.0151)
0.0268*
(0.0152)
Table 5: Effects of joint probabilities of innovations on the productivity
(Source: Author’s calculations based on the BEEPS data)
Notes: *** significant at the 1% level, ** - at the 5% level, * - at the 10% level. The standard
errors are in parentheses
Table 5 shows that all combinations of innovations are positive and significant for productivity.
In particular, when combined with organizational innovations, process innovations provide
greater productivity than when they are implemented alone. Among all the combinations,
marketing and organizational innovations have the greatest effect on productivity. The results
of the CDM-model show the relationship between different types of innovations. Namely it was
revealed that organizational innovations are usually implemented jointly with the other types
of innovations. Individual and joint probabilities of innovation positively affect productivity.
The results for Russian enterprises are somewhat different from those obtained by Cirera (2015)
for Kenyan firms, for which the effect of joint introduction of organizational innovations with
product and process innovations was not significant. The obtained results contribute to
understanding the ways to improve innovation policy measures. In particular, they shed some
light on the institutional conditions in the regions, as well as on the role of education and
training. Firms need to think about introducing not only technological innovations (product and
process), but also non-technological ones (marketing and organizational). When introduced
together, they are more successful in improving enterprise competitiveness.
5. CONCLUSION
The results of the CDM model show that investment in R&D is significant for innovations, and
all types of innovations are positive and significant for labor productivity. In particular,
investing in R&D brings greater returns for implementing several types of innovations jointly.
This indicates greater efficiency in terms of R&D if introducing several types of innovations.
Our study has confirmed that business environment and state policy substantially affect firms’
innovative activity. A range of problems important for innovations in Russia are revealed:
underdevelopment of institutions, not high enough quality of human capital, low competition
and inefficient spending. In the present circumstances, in order to facilitate innovative activity
and by doing so improve enterprise productivity, the following measures need to be considered.
It is important to develop competitive environment. It is also necessary to simplify bureaucratic
procedures for business so that start-ups and small firms could work on the market. As far as
human capital and R&D are concerned, it is important both to pay attention to fundamental
science and education, and to aim education at the needs of innovative enterprises.

63rd International Scientific Conference on Economic and Social Development – "Building Resilient Society" - Zagreb, 11-12 December, 2020
36
A good example would be dual education, that is, a program combining theory and practice. In
order to facilitate training of personnel, state could also help by organizing special training
centers or participate in their financing. This is especially important for the firms with lack of
resources. We also find that ineffective licensing and protection of intellectual property are a
substantial problem. It leads to the conclusion that legislation should be improved. Moreover,
cooperation of large and small firms should probably be more intensive, since small firms often
require financial support and since the amount of time needed to implement an innovative
project can be too long for small firms. Large companies could form innovative ecosystems,
which would include small and medium-sized companies. Such ecosystems could include other
stakeholders, researchers, consumers, suppliers, and so on. We recognize the limitations of this
research. Apart from the standard limitations of the CDM modelling itself they are mainly
connected to subjective estimates of external factors affecting R&D expenses in BEEPS.
Besides, we consider only limited set of firms not covering all markets and industries. In future,
we plan to consider objective indicators of possible barriers on the regional level.
ACKNOWLEDGEMENT: Research was supported by the grant of the Russian Science
Foundation № 19-18-00262 “Empirical modelling of balanced technological and
socioeconomic development in the Russian regions”.
LITERATURE:
1. Bozic, L., Botric, V. (2011). Innovation Propensity in the EU Candidate Countries.
Transition Studies Review, 2011(18), 405–417.
2. Cirera, X. (2015). Catching up to the technological frontier? Understanding firm-level
innovation and productivity in Kenya. Innovation and Entrepreneurship, Trade and
Competitiveness Global Practice, the World Bank, 2015(94671), 1–45.
3. Crépon, B., Duguet, E., Mairesse, J. (1998). Research, innovation and productivity: an
econometric analysis at the firm level. Economics of Innovation and New Technology,
1998(7(2)), 115–158.
4. Duguet, E. (2006). Innovation height, spillovers and TFP growth at the firm level: Evidence
from French manufacturing. Economics of Innovation and New technology, 2006(15(4-5)),
415-442.
5. Hall, B. H., Lotti, F., & Mairesse, J. (2008). Employment, innovation, and productivity:
evidence from Italian microdata. Industrial and corporate change, 2008(17(4)), 813-839.
6. Janz, N., Lööf, H., & Peters, B. (2003). Firm level innovation and productivity-is there a
common story across countries? ZEW Discussion Papers, 2003(3(26)), 1-35.
7. Junge, M., Severgnini, B., Srensen, A. (2012). Evidence on the Impact of Education on
Innovation and Productivity. Copenhagen: Copenhagen Business School.
8. Kravtsova, V., Radosevic, S. (2012). Are systems of innovation in Eastern Europe efficient?
Economic Systems, 2012(36(1)), 109–126.
9. Lööf, H., Heshmati, A. (2003). The link between firm-level innovation and aggregate
productivity growth: a cross-country examination. Research evaluation, 2003(12(2)), 131-
147.
10. Marotta, D., Mark, M., Blom, A., Thorn, K. (2007). Human capital and university-industry
linkages' role in fostering firm innovation: an empirical study of Chile and
Colombia. Washington: World Bank.
11. Roud, V. (2007). Firm-level research on innovation and productivity: Russian experience.
Maastricht: UNU-MERIT.
12. World Bank. (2019). World Development Report 2019: The Changing Nature of Work.
Washington, DC: World Bank.

63rd International Scientific Conference on Economic and Social Development – "Building Resilient Society" - Zagreb, 11-12 December, 2020
37
THE INFLUENCE OF VALUE ADDED TAX ON THE FORMATION OF
PRICES IN HOSPITALITY ON THE TERRITORY OF THE REPUBLIC
OF CROATIA
Anita Grubisic
Veleučilište u Šibeniku
Trg Andrije Hebranga 11, 22 000 Šibenik, Croatia
Toni Miljak
Međimursko veleučilište u Čakovcu
Ul. bana Josipa Jelačića 22, 40000, Čakovec, Croatia
Andela Mustafovski
Student
Kroz Smiljanovac 1, 21210 Solin, Croatia
ABSTRACT
Tourism, as an economic branch, is extremely important in the Republic of Croatia and as such
should be given special attention when defining legislative frameworks. In addition to
regulations and ordinances governing the business and conduct of business entities in the
tourism market, the legislator also enacts tax provisions that apply to all market stakeholders.
Frequent changes in tax regulations do not contribute to the stability and competitiveness of
the hospitality industry and tourism in general. Since January 2020, two value added tax rates
of 13 and 25% have been applied to the hospitality industry as an activity. To this must be
added the consumption tax, which also affects the final price of the product or service in the
hospitality industry. The maximum amount of consumption tax is 3%. On the other hand, only
the value added tax rate of 13% is applied to accommodation services. When we look at the
Croatian economy as a whole, we can see an exceptional dependence on overall tourism, which
accounts for up to 20% of GDP. By comparison, in other competing countries, tourism accounts
for 5 to 10% of GDP. Also, the Croatian tax system is much more complex and burdens the
economy more than the tax systems of other countries. The aim of this paper is to show the
extent to which the tax burden affects the formation of the final price in catering, which can be
crucial in attracting individual guests.
Keywords: calculation, price formation, tax system, tourism
1. INTRODUCTION
Historically, the emergence of taxes has been linked to the emergence of common public
functions. For a long period of time, thinking about taxes was not continuous. The idea of taxing
turnover by applying value added tax for 1918 and 1919 appears for the first time in the financial
literature. The first idea, about the introduction of value added tax, was proposed by the factory
owner and tax advisor Wilhelm von Simens, and he put forward the idea that Germany should
introduce a refined sales tax (Šinković, 2010.). Value added tax is a form of tax that is calculated
and paid in all phases of the production and turnover cycle, whereby in each phase only the
amount of value added that was realized in that phase of the production and turnover cycle is
taxed. it is one of the forms of general sales tax on goods and services.

63rd International Scientific Conference on Economic and Social Development – "Building Resilient Society" - Zagreb, 11-12 December, 2020
38
2. VALUE ADDED TAX
Value added tax is a modern form of consumption taxation and is paid on goods supplied and
services rendered. Goods include real estate, equipment, products, goods, etc. The main
advantage of VAT is the fact that it contributes large revenues to the budget (up to 2/3 of
revenues). Of the European Union member states, France was the first to introduce VAT in
1958 (Miljak, 2013.). Value added tax - VAT is the revenue of the state budget of the Republic
of Croatia. VAT is calculated and paid according to the provisions:
• The Value Added Tax Act (Official Gazette Nos. NN 73/13, 99/13, 148/13, 153/13, 143/14,
115/16, 106/18, 121/19) and
• Ordinance on value added tax (Official Gazette no. 79/13, 85/13-correction, 160/13, 35/14,
157/14, 130/15, 1/17, 41/17, 128/17, 1/19, 1/20).
2.1. Taxpayer
According to the Value Added Tax Act, a taxpayer is any person who independently performs
any economic activity, regardless of the purpose and result of performing that activity.
Economic activity is any activity of producers, traders or persons performing services,
including mining and agricultural activities and activities of free professions. The use of
tangible or intangible assets for the purpose of permanent income is also considered an
economic activity. Taxpayers are not considered state authorities, state administration bodies,
bodies and units of local and regional self-government, chambers and other bodies with public
authority even in the case when they collect fees, charges and other payments related to the
performance of activities or transactions within its scope or authority. If the pursuit of such
activities, as if they were not taxable persons, would lead to a significant distortion of the
principles of competition in the performance of such activities or transactions, those authorities
shall be considered taxable persons in respect of those activities or transactions (Zakon o porezu
na dodanu vrijednost, 2020).
2.2. VAT rates
In the Republic of Croatia, the general VAT rate is 25%, while the reduced rates are 5% and
13%. VAT at the rate of 5% is paid on (Zakon o porezu na dodanu vrijednost, 2020.):
a) all types of bread,
b) all types of milk,
c) books of professional, scientific, artistic, cultural and educational content, textbooks for
pedagogical education,
d) medicinal products approved by the competent authority for medicinal products and
medical devices in accordance with special regulations,
e) medical equipment, aids and other devices used to alleviate the treatment of disability,
f) scientific journals,
g) cinema tickets,
h) newspapers of a newspaper publisher with a media statute, which are published daily,
except for those that contain in whole or in part (more than 50%) advertisements or serve
advertising and in addition to those that consist in whole or in part (more than 50%) from
videos or music content.
VAT at the rate of 13% is paid on:
a) accommodation or bed and breakfast, half board or full board services in hotels or facilities
of similar purpose, including holiday accommodation and rental of accommodation in
holiday camps or in places designated for camping and accommodation in nautical tourism
vessels. Facilities of similar purpose are considered to be all types of commercial catering
facilities.

63rd International Scientific Conference on Economic and Social Development – "Building Resilient Society" - Zagreb, 11-12 December, 2020
39
b) newspapers and magazines of a newspaper publisher that has a media statute and
newspapers and magazines of a publisher for which there is no obligation to adopt a media
statute according to a special regulation, except for those referred to in paragraph 1, item h)
of this Article, which are published periodically; they mostly contain advertisements or
serve advertising (more than 50%) and except for those that consist entirely or mostly of
videos or music content (more than 50%),
c) edible oils and fats, of vegetable and animal origin, in accordance with a special regulation
on edible oils and fats and olive oil.
d) child car seats and baby diapers
e) the supply of water, other than bottled or otherwise packaged water. Water supply is
considered to be services directly related to water supply or performance of water service
of public water supply and public drainage, ie delivery to another supplier or end user
according to a special regulation on water,
f) concert tickets,
g) delivery of electricity to another supplier or end user, including fees related to that delivery,
h) public service of collection of mixed municipal waste, biodegradable municipal waste and
separate waste collection according to a special regulation on sustainable waste
management,
i) urns and coffins placed on the market under that name,
j) seedlings and seeds.
2.3. VAT refund
The taxpayer, who in the tax period is entitled to deduct input tax, the amount of which is greater
than his tax liability, is entitled to a refund of this difference or may transfer the amount of
overpaid VAT to the next tax period. If the taxpayer requests a refund of overpaid VAT, the
Tax Administration is obliged to return the difference within 30 days from the date of
submission of the VAT return, and no later than 90 days from the date of initiation of tax
supervision (Zakon o porezu na dodanu vrijednost, 2020). A taxpayer who does not have a
registered office, permanent establishment from the territory of the European Union from which
deliveries, residence or usual abode are entitled under the conditions prescribed by this Act to
a refund of VAT charged on movable goods and services provided by other taxpayers in the
Republic Croatia or which is charged to him when importing goods in the Republic of Croatia.
The right to a VAT refund is exercised provided that in the applicant's country of origin the
domestic taxpayer is also entitled to a VAT refund, which is determined by the exchange of
information between the tax authority of the Republic of Croatia and the tax authority of a third
country. A taxpayer, who is not established in the Republic of Croatia but is established in
another member state of EU, is entitled to a refund of VAT charged on goods and services
supplied or performed by other taxpayers in the country or for goods imported into the country.
If a taxpayer with a registered office, residence or habitual residence in the Republic of Croatia
submits a request for VAT refund from another Member State, he must submit it via the
electronic portal of the Tax Administration of the Republic of Croatia no later than September
30 of the calendar year following the refund period. submitted only if the applicant has filled in
all the necessary information for VAT refund. An electronic acknowledgment of receipt of the
request shall be sent to the applicant without delay (Zakon o porezu na dodanu vrijednost,
2020).
3. PRICE FORMATION IN HOSPITALITY
When conducting a pricing policy, it would be necessary to take into account the formation of
a selling price that is attractive to the buyer. It should be competitive with the prices of similar
bidders in the market. Then the price should be high enough to ensure a profitable business.

63rd International Scientific Conference on Economic and Social Development – "Building Resilient Society" - Zagreb, 11-12 December, 2020
40
The price decision is made after a detailed analysis of information from different areas that can
be external and internal. Pricing should ensure a sufficient volume of turnover, and thus
profitable business. Internal factors in price formation are:
• costs (determine the lower price limit below which losses are generated),
• working conditions (directly affect labor productivity).
External factors in price formation are:
• development of supply and demand,
• stage in the life cycle of the product,
• product differentiation,
• consumer buying styles,
• price elasticity (Karić, 2009.).
Some of the pricing methods are the method of determining the margin, target yield method
and by the method of perceived value. In the method of determining the margin, it is necessary
to include fixed costs, variable costs, expected sales and the desired yield - margin. While the
application of the target return method takes into account fixed costs, then variable costs,
expected sales, invested capital and the desired return on invested capital.
3.1. Calculation and its elements
Calculation is a calculation procedure through which the price is calculated (purchase, sale, cost
price). The task of the calculation is to include all costs according to a certain point of view as
well as the type and place of costs. Also included is a comparison of costs, etc. The basic
characteristic of the calculations is accurate and adapted to the way the company operates
documented by bookkeeping, it is uniform for all products and of course can be compared with
other calculations (Ekonomski fakultet Banja Luka, 2020.). The elements of the calculation are:
• invoice price, ie the purchase price of goods that the entrepreneur pays to suppliers per
invoice less discounts (if the supplier approves the discount),
• dependent purchase cost is the cost incurred on the way of the goods from the supplier's
warehouse to the customer,
• conversion costs are the costs of processing and finishing that occur in the business,
• purchase price is the trade price of the cost of purchased goods; if the dependent purchase
costs were borne by the supplier with no conversion costs, then the purchase price is equal
to the invoice price.
• the difference in price is the difference between the purchase and sale price and occurs in
the form of a margin or rebate,
• value added tax is calculated in each phase of the production and turnover cycle, on the
amount of value added that occurred in that phase,
• consumption tax is an integral part of the calculation only in cities and municipalities that
have prescribed the consumption tax rate,
• selling price is the price at which a trading company sells goods.
3.2. An example of the formation of the retail price in the hospitality industry on the
example of the main course
As an example of the formation of the retail price, a dish of lamb leg steaks with vegetables in
the Mediterranean way from a well-known Zagreb restaurant was taken as an example. In order
to form a price, it is first necessary to know the norm of the dish.

63rd International Scientific Conference on Economic and Social Development – "Building Resilient Society" - Zagreb, 11-12 December, 2020
41
Dish: lamb leg steaks with vegetables in
the Mediterranean way (for 4 persons) Norm of the dish
Lamb leg 800 g
Lemon 5 g
Oregano 5 g
Olives 120 g
Red pepper 200 g
Celery stalks 100 g
White wine 0,1 l
Smooth flour 100 g
Extra virgin olive oil 0,05 l
Salt 10 g
Pepper 5 g
Table 1: Norm of the dish
(Source: authors according to restaurant Kaptol data)
Taking into account the norm and the price of food, it is necessary to calculate the purchase
value of these foods. The purchase value is calculated in such a way that VAT must be deducted
from the sales price of the food. An overview of the cost calculation is shown in Table 2:
Main course (4 people) Calculation of the purchase price according to the given
norm
Lamb leg 69,99-(69,99*13/113)=61,93/1000*800=49,54 kn
Lemon 16,99-(16,99*13/113)=15,03/1000*5=0,07 kn
Oregano 811,25-(811,25*25/125)=649/1000*5=3,25 kn
Olives 59,34-(59,34*25/125)=47,47/1000*120= 5,70 kn
Red pepper 9,99-(9,99*13/113)=8,84/1000*200=1,77 kn
Celery stalks 9,99-(9,99*13/113)=8,84/1000*100=0,88 kn
White wine 21,99-(21,99*25/125)=17,59/1000*100=1,76kn
Smooth flour 4,99-(4,99*25/125)=3,99/1000*100=0,40 kn
Extra virgin olive oil 99,99-(99,99*13/113)=88,49/1000*50=4,42 kn
Salt 5,49-(4,49*25/125)=4,59/1000*10=0,05 kn
Pepper 99,99-(99,99*25/125)=79,99/1000*5=0,40 kn
TOTAL N.V. = 68,24 kn
Table 2: Calculation of the purchase price according to the given norm
(Source: authors according to restaurant Kaptol data)

63rd International Scientific Conference on Economic and Social Development – "Building Resilient Society" - Zagreb, 11-12 December, 2020
42
The purchase value of this dish is 68,24 kn (for 4 people), or 17,06 kn per person. Then it is
necessary to calculate the retail price of the dish by calculation. The margin in the observed
restaurant is 320%. In the calculation process, the margin is first added to the purchase value.
The sum of purchase value and margin represents the wholesale price to which VAT is then
added. VAT rate on food service in catering is 13%. The sum of the wholesale price and VAT
represents the retail price:
Purchase value = 17,06 kn
Margin (320%) = 54,59 kn
Wholesale price = 71,65 kn
VAT (13%) = 9,31 kn
Retail price = 80,96 kn
3.3. An example of the formation of the retail price in the hospitality industry on the
example of beverages
When forming the retail price of beverages in catering facilities, the consumption tax should
also be taken into account. Consumption tax is a special tax that is calculated on the taxpayer
who provides beverage services in a catering facility (Carina, 2020). Regardless of the
company's headquarters, it is paid in the city or municipality where the income from the sale of
beverages originated. The tax base is the selling price of beverages sold in restaurants.
Consumption tax is paid on the consumption of alcoholic beverages (brandy, brandy and spirits)
of natural wines, special wines, beers and non-alcoholic beverages in catering facilities, which
does not include value added tax. The highest consumption tax rate can be 3%. When
calculating the wholesale price, in addition to VAT, consumption tax should also be calculated.
(Zakon o lokalnim porezima, 2017.). If the purchase price of a bottle of carbonated juice is 3,50
kn (VAT is deducted from the purchase price) then the calculation of the retail price will look
like (margin is still 320% and consumption tax is 3%):
Purchase value = 3,50 kn
Margin (320%) = 11,20 kn
Wholesale price = 14,70 kn
VAT (25%) = 3,68 kn
Consumption tax (3%) = 0,44 kn
Retail price = 18,82 kn
4. CONCLUSION
Since the Republic of Croatia is highly dependent on tourism (it accounts for one fifth of GDP),
work should be done to improve price competitiveness in tourism. The Croatian tax system is
extremely complex and very often creates doubts for entrepreneurs. According to the current
tax regulations, value added tax is calculated in catering at a reduced rate of 13% only on food
(including sweets) while the general VAT rate is calculated on the serving of all beverages.
This VAT calculation system puts Croatia in a very unfavorable position in the Mediterranean.
For example, from the competition, Italy has a VAT rate on catering of 10%, in France the rate
is 5.5%, in Greece 13%, in Spain 8%. In addition to the above, in Croatia as much as a quarter
of the price, ie 25% of the price of a drink goes to VAT, while in Spain, for example, only 8%
of the price of a drink goes to VAT. Croatia needs to adopt a single reduced VAT rate on
catering services. The result of the reduced VAT rate results in the creation of new jobs, new
investments in the hospitality sector and lower and attractive prices for guests. Thus, the gray
market, which is strengthening due to high taxation of the hospitality industry, would be
reduced.

63rd International Scientific Conference on Economic and Social Development – "Building Resilient Society" - Zagreb, 11-12 December, 2020
43
LITERATURE:
1. Kalkulacija cijena koštanja, Ekonomski fakultet Banja Luka, https://ef.unibl.org/
literatura/954471_br.4_-_Kalkulacije_cijena_ko0tanja.pdf, (retrived 24.10.2020)
2. Karić, M., (2009.) Ekonomika poduzeća, Ekonomski fakultet u Osijeku, Osijek
3. Miljak, T. (2013). Accounting treatment of VAT at entrepreneurs after the accession of the
Republic Croatia in the European Union, Učenje za poduzetništvo, 3(2), Zagreb
4. Posebni porezi, Carinska uprava: https://carina.gov.hr/propisi-i-sporazumi/trosarinsko-
postupanje/najcesca-pitanja-i-odgovori-3645/kava-i-bezalkoholna-pica-3861/posebni-
porez-na-bezalkoholna-pica-3890/3890 (retrived 20.10.2020)
5. Pravilnik o porezu na dodanu vrijednost (NN 79/13, 85/13, 160/13, 35/14, 157/14, 130/15,
1/17, 41/17, 128/17, 1/19, 1/20)
6. Šinković, Z., (2010) Priručnik iz Financijskog prava za internu uporabu (teoretski i
praktični dio), Sveučilište u Splitu, Pravni fakultet, Split
7. Zakon o lokalnim porezima (NN 115/16, 101/17)
8. Zakon o porezu na dodanu vrijednost (NN 73/13, 99/13, 148/13, 153/13, 143/14, 115/16,
106/18, 121/19)

63rd International Scientific Conference on Economic and Social Development – "Building Resilient Society" - Zagreb, 11-12 December, 2020
44
THE INFORMATION SOCIETY AGAINST THE BACKGROUND OF
CONTEMPORARY PROBLEMS OF GLOBALISATION
Anna Janiga-Cmiel
University of Economics in Katowice, Faculty of Management,
Department of Statistics, Econometrics and Mathematics,
1 Maja 50, 40-287 Katowice, Poland
ABSTRACT
The study aimed to determine the position of particular EU Member States in terms of the level
of internet and IC technology usage based on selected indicators describing the subject of the
study. To this end, the classical and positional taxonomic methods were employed. In addition,
the same methods were used to organize the EU Member States into groups made up of
countries featuring a similar level of development. The study compared the data for the years
2010, 2015 and 2019.
Keywords: Econometric Methods, Globalisation, Information Society, Mathematical Methods,
Taxonomic analysis
1. INTRODUCTION
Economic growth significantly correlates with the development and adoption of ever newer IC
technologies, whose deployment leads to continual changes in the socio-economic life at both
the national and global levels. We can observe ongoing advances in IC technologies facilitating
data collection, processing and transfer. What is more, the development of these technologies
against a background of globalization contributes to the emergence and gradual transformation
of an increasingly globalized information society. Globalization impacts on the creation of the
information society and its evolution towards more advanced stages (Kempty, 1998). The
literature offers a variety of definitions of the information society. L. Drelichowski defines it
as: ” …. all the people who are able to communicate easily and widely and who have access to
the necessary information which enhances living conditions, improves work performance as
well as helps fulfill civic duties” (Drelichowski, 2001). The development of the information
society depends on numerous factors, such as the level of informatization and computerization,
geographical barriers, economic changes and the level of economic development, the degree of
urbanization, the level of education, employment structure, access to and geographic coverage
of internet services, state telecommunications policy, and the size of population, which is of
particular significance as high density areas are the most attractive in terms of investment
return. The negative factors include lack of internet access, lack of ICT literacy and skills,
digital exclusion, lack of access to hosts. The price of telecommunications services is also
becoming a serious problem. It is worth noting that the COVID-19 pandemic we are currently
experiencing has resulted in changes to our daily lives, and the situation is posing a challenge
to the new technologies. ICT skills, the internet and the new technologies are being even more
commonly used to communicate and transfer big data. They have proved of utmost importance
as a tool which enables companies and public and educational institutions to operate on a daily
basis, achieve their operational and business goals as well as fulfil society’s needs.
2. THE TAXONOMIC MEASURE OF DEVELOPMENT – HELLWIG CLASSICAL
MEASURE AND POSITIONAL MEASURE BASED ON WEBER MEDIAN VECTOR
The analysis was conducted by means of the following research tools: the taxonomic measure
of development – Hellwig classical measure and positional measure based on Weber median
vector (Młodak, 2006), (Panek, 2009), (Panek, 2009), (Pociecha, Podolec, Sokołowski, and

63rd International Scientific Conference on Economic and Social Development – "Building Resilient Society" - Zagreb, 11-12 December, 2020
45
Zając, 1988). The first stage of the analysis involved calculating the variability of the potential
diagnostic features. A classical variation coefficient and a positional coefficient were used in
accordance with the formula (Młodak, 2006):
where 𝑥�̅� – arithmetic mean, Sj – standard deviation, j =1,…,m.
Where:
The Hellwig method of selecting potential diagnostic features was used. Next, the nature of the
features was determined, which meant identifying stimulants and destimulants, and
standardization was carried out. The standardization procedure
- classical:
and positional approach (Młodak, 2006):
where:
𝑚𝑎�̃�(𝑋𝑗) − absolute median deviation, where instead of measuring the distance of the features
to the median, their distance to the Weber vector is calculated:
At the next stage of the linear ordering of the objects, the synthetic indicator was calculated. In
the case of the first measure, i.e. Hellwig synthetic measure, for the calculated measures of
development a higher value of the measure means that the object is closer to the pattern.
Detailed information on the measure construction as well as on the grouping method (the three
median method) can be found in (Grabiński, Wydymus, Zeliaś, 1989), (Panek, 2009),
(Pociecha, Podolec, Sokołowski, and Zając, 1988), (Młodak, 2006). Based on the calculated
values of the measure, the objects were ordered linearly and the countries under study were
divided into four typological groups. Another measure applied in the study was the positional
measure based on Weber median vector. The analysis of some complex phenomena requires
the application of Weber spatial median, and thus Hellwig classical method can be converted
into a positional one (Młodak, 2006).
𝑚𝑎�̃�(𝑋𝑗) = med𝑖=1,2,…,𝑛
𝑥𝑖𝑗 − 𝜃𝑖𝑗 , j= 1,…,m
𝑉𝑗 =𝑠𝑗
𝑥𝑗 , (1)
휁𝑗 =𝑚𝑎𝑑 (𝑋𝑗 )
𝑚𝑒𝑑 (𝑋𝑗 ), (2)
𝑚𝑒𝑑(𝑋𝑗)- median 𝑋𝑗 , 𝑚𝑎𝑑(𝑋𝑗) = med𝑖=1,2,…,𝑛
𝑥𝑖𝑗 − 𝑚𝑒𝑑(𝑋𝑗 ) .
𝑧𝑖𝑗 =𝑥𝑖𝑗 −𝑥𝑗
𝑠𝑗 , i =1,…,n, j =1,…,m (3)
𝜃0 = (𝜃01 ,𝜃02 , … , 𝜃0𝑚 ) – the Weber median,
𝑧𝑖𝑗 =𝑥𝑖𝑗 −𝜃0𝑗
1,4826 ∙𝑚𝑎�̃� (𝑋𝑗 ) i = 1,…,n (4)

63rd International Scientific Conference on Economic and Social Development – "Building Resilient Society" - Zagreb, 11-12 December, 2020
46
The development pattern is defined as:
j = 1,…,m.
Aggregate measure is calculated according to formula:
where:
Distance from the development pattern (Młodak, 2006) :
In the last step of the analysis, the countries were grouped according to the level of internet and
IC technology usage. For this purpose, the three median method was employed. Based on the
taxonomic measure of development, the objects bearing similarity in the level of development
are grouped together. Next, the set of objects is split into two subsets, one comprising the
objects whose measures are higher than the overall median, the other – all the other objects.
Next, in each of the groups the median is determined (Młodak, 2006):
I : 𝜇𝑖 >med1( 𝜇);
II : med( 𝜇) < 𝜇𝑖 ≤ med1(𝜇);
III : med2 (𝜇) < 𝜇𝑖 ≤ med(𝜇);
IV: 𝜇𝑖 ≤ med2(𝜇).
where: med1(𝜇𝑖) and med2(𝜇𝑖) —median of the development measure values.
Having the values of the synthetic measures calculated, we can assess the concordance between
the results using Spearman’s rank correlation coefficient and Kendall’s tau.
3. THE EMPIRICAL ANALYSIS
The data comes from the statistical yearbooks published by the Central Statistical Office and
from the Eurostat websites; it covers the years 2010, 2015 and 2019 (the EU Member States
(also included Norway, Iceland)). The set of the diagnosic variables, which was established
based on the descriptive and formal analysis of these variables, included (Janiga-Ćmiel,
2017A), (Janiga-Ćmiel, 2017B), (Janiga-Ćmiel, 2018A), (Janiga-Ćmiel, 2018B):
X1 - Number of the individual lives in household without the Internet use,
X2 - Percentage of individuals who used internet within the last year,
X3 - Number of the individuals who have never used either the computer or the Internet,
X4- Number of the individuals who finding information about goods and services - Internet use,
X5 - Number of the individuals who posting messages to social media sites or instant messaging.
X6 – Number of the enterprises giving portable devices for a mobile connection to the Internet
to their employees.
𝜇𝑖 = 1 −𝑑𝑖
𝑑_ (6)
𝑑_ = 𝑚𝑒𝑑(𝒅) + 2,5𝑚𝑎𝑑(𝒅), 𝒅 = (𝑑1, 𝑑2, … , 𝑑𝑛) (7)
𝑑𝑖 = med𝑗=1,…,𝑚
𝑧𝑖𝑗 − 𝜑𝑗 (7)
𝜑𝑗 = max𝑖=1,…𝑛
𝑧𝑖𝑗 (5)

63rd International Scientific Conference on Economic and Social Development – "Building Resilient Society" - Zagreb, 11-12 December, 2020
47
Tables 1, 2, 3, 4 and 5 present the ordering of the EU Member States (also included Norway,
Iceland) according to the level of development of the analysed phenomenon in the years 2010,
2015, 2019.
2010
Procedure- classical Procedure - Positional
COUNTRY VALUE RANK VALUE RANK
Belgium 0,839 10 0,679 11
Bulgaria 0,022 28 0,422 28
Czechia 0,019 29 0,488 22
Denmark 0,968 5 0,891 7
Germany 0,922 8 0,636 14
Estonia 0,135 20 0,363 20
Ireland 0,745 13 0,625 15
Greece 0,033 25 0,164 26
Spain 0,108 22 0,690 10
France 0,875 9 0,700 9
Croatia 0,151 19 0,522 23
Italy 0,032 26 0,122 29
Cyprus 0,067 23 0,142 27
Latvia 0,578 14 0,673 12
Lithuania 0,012 30 0,306 25
Luxembourg 0,955 7 0,754 8
Hungary 0,187 17 0,517 17
Malta 0,422 21 0,741 30
Netherlands 0,974 3 0,945 2
Austria 0,835 11 0,908 6
Poland 0,139 15 0,528 18
Portugal 0,060 24 0,436 21
Romania 0,025 27 0,657 19
Slovenia 0,158 18 0,643 24
Slovakia 0,215 16 0,545 16
Finland 0,967 6 0,936 4
Sweden 0,973 4 0,927 5
United
Kingdom 0,798 12 0,654 13
Iceland 0,975 2 0,945 3
Norway 0,975 1 0,988 1
Table 1: Synthetic measurement values for European Union countries according to selected
methods - 2010 (based on own research)
Table following on the next page

63rd International Scientific Conference on Economic and Social Development – "Building Resilient Society" - Zagreb, 11-12 December, 2020
48
2015
Procedure-
classical Procedure - Positional
COUNTRY VALUE RANK VALUE RANK
Belgium 0,899 9 0,810 10
Bulgaria 0,026 29 0,278 21
Czechia 0,459 15 0,349 20
Denmark 0,949 5 0,909 5
Germany 0,958 4 0,659 13
Estonia 0,073 26 0,252 27
Ireland 0,614 13 0,766 11
Greece 0,082 24 0,276 23
Spain 0,254 20 0,204 28
France 0,882 10 0,871 8
Croatia 0,291 19 0,478 15
Italy 0,028 28 0,265 25
Cyprus 0,082 25 0,175 29
Latvia 0,083 23 0,376 17
Lithuania 0,127 21 0,276 22
Luxembourg 0,944 6 0,827 9
Hungary 0,397 17 0,366 19
Malta 0,341 18 0,066 30
Netherlands 0,966 1 0,929 3
Austria 0,842 11 0,873 7
Poland 1,492 14 0,568 14
Portugal 0,067 27 0,274 24
Romania 0,020 30 0,257 26
Slovenia 0,401 16 0,369 18
Slovakia 0,123 22 0,476 16
Finland 0,962 2 0,937 2
Sweden 0,929 8 0,881 6
United
Kingdom 0,935 7 0,714 12
Iceland 0,775 12 1,000 1
Norway 0,962 3 0,913 4
Table 2: Synthetic measurement values for European Union countries according to selected
methods - 2015 (based on own research)
Table following on the next page

63rd International Scientific Conference on Economic and Social Development – "Building Resilient Society" - Zagreb, 11-12 December, 2020
49
2019
Procedure- classical
Procedure -
Positional
COUNTRY VALUE RANK VALUE RANK
Belgium 0,766 9 0,81477 10
Bulgaria 0,458 20 0,253475 29
Czechia 0,425 21 0,37385 18
Denmark 0,802 5 0,947358 4
Germany 0,782 8 0,670702 13
Estonia 0,359 23 0,286441 25
Ireland 0,627 13 0,728814 11
Greece 0,258 28 0,378749 16
Spain 0,011 30 0,261259 28
France 0,789 7 0,819128 9
Croatia 0,283 27 0,36236 19
Italy 0,488 17 0,355481 20
Cyprus 0,473 18 0,3477 23
Latvia 0,349 24 0,274581 26
Lithuania 0,313 26 0,270944 27
Luxembourg 0,810 3 0,876755 7
Hungary 0,586 15 0,35109 22
Malta 0,374 22 0,290557 24
Netherlands 0,743 11 0,961259 2
Austria 0,804 4 0,690073 12
Poland 0,517 16 0,535109 14
Portugal 0,182 29 0,376755 17
Romania 0,466 19 0,154946 30
Slovenia 0,592 14 0,353511 21
Slovakia 0,329 25 0,456126 15
Finland 0,675 12 0,961259 3
Sweden 0,972 1 0,893462 5
United Kingdom 0,799 6 0,835351 8
Iceland 0,855 2 0,890315 6
Norway 0,761 10 0,983417 1
Table 3: Synthetic measurement values for European Union countries according to selected
methods - 2019 (based on own research)
Table following on the next page

63rd International Scientific Conference on Economic and Social Development – "Building Resilient Society" - Zagreb, 11-12 December, 2020
50
Group 2010
I II III IV
Norway France Poland Cyprus
Iceland Belgium Slovakia Portugal
Netherlands Austria Hungary Greece
Sweden
United
Kingdom Slovenia Italy
Denmark Ireland Croatia Romania
Finland Latvia Estonia Bulgaria
Luxembourg Malta Czechia
Germany Spain Lithuania
2015 I II III IV
Netherlands Belgium Poland Lithuania
Finland France Czechia Slovakia
Norway Austria Slovenia Latvia
Germany Iceland Hungary Greece
Denmark Ireland Malta Cyprus
Luxembourg Croatia Estonia
United
Kingdom Spain Portugal
Sweden Italy
Bulgaria
Romania
2019 I II III IV
Sweden Netherlands Poland Latvia
Iceland Finland Italy Slovakia
Luxembourg Ireland Cyprus Lithuania
Austria Slovenia Romania Croatia
Denmark Hungary Bulgaria Greece
United
Kingdom Czechia
Portugal
France Malta Spain
Germany Estonia
Belgium
Norway
Table 4: The classification – Procedure classical - 2010, 2015, 2019 (based on own research)
Table following on the next page

63rd International Scientific Conference on Economic and Social Development – "Building Resilient Society" - Zagreb, 11-12 December, 2020
51
Group 2010
I II III IV
Norway France Slovakia Slovenia
Netherlands Spain Hungary Lithuania
Iceland Belgium Poland Greece
Finland Latvia Romania Cyprus
Sweden
United
Kingdom Estonia Bulgaria
Austria Germany Portugal Italy
Denmark Ireland Czechia Malta
Luxembourg Croatia
2015
I II III IV
Iceland Luxembourg Slovakia Portugal
Finland Belgium Latvia Italy
Netherlands Ireland Slovenia Romania
Norway
United
Kingdom Hungary Estonia
Denmark Germany Czechia Spain
Sweden Poland Bulgaria Cyprus
Austria Croatia Lithuania Malta
France Greece
2019
I II III IV
Norway France Greece Malta
Netherlands Belgium Portugal Estonia
Finland Ireland Czechia Latvia
Denmark Austria Croatia Lithuania
Sweden Germany Italy Spain
Iceland Poland Slovenia Bulgaria
Luxembourg Slovakia Hungary Romania
United Kingdom Cyprus
Table 5: The classification – The three median method - 2010, 2015, 2019 (based on own
research)
The results displayed in tables 1,2 and 3 show that as far as the level of internet and IC
technology usage is concerned, both methods indicate: Norway, Netherlands, Finland,
Denmark Sweden Iceland as top-ranked EU countries. Looking at the position of particular
countries in the ranking, it can be observed that for some countries the positions based on the
synthetic measure are similar in the years under study, but they differ depending on the method
applied. Spearman’s rank correlation coefficient and Kendall’s tau show moderate concordance
between the results obtained for the years under study by means of the two selected methods,
i.e. there are differences between the results depending on the adopted method.

63rd International Scientific Conference on Economic and Social Development – "Building Resilient Society" - Zagreb, 11-12 December, 2020
52
4. CONCLUSION
The multivariate comparative analysis performed by means of the selected method enabled the
examination of ICT use, the Internet in particular , taking into consideration a set of selected
features that characterize the level of ICT adoption in the selected European countries. The
analysis spanned the years: 2010, 2015 and 2019. The measures applied in the study indicate a
high level of internet and IC technology usage in particular countries, which remained steady,
did not change much, in the years under study(Norway, Netherlands, Finland, Denmark,
Sweden, Iceland). Also, the countries with the lowestlevels of were identified ( Bulgaria,
Greece, Italy, Malta, Portugal, Estonia, Spain, Lithuania).The grouping methods employed in
the study enabled the division of the EU Member States into four groups, each consisting of
countries with a similar level of internet and IT technology usage. It can be noted that the
makeup of the groups did not change much over the years covered in the study.
LITERATURE:
1. Drelichowski L., (2002), Społeczeństwo informacyjne a kształtowanie rozwoju
zrównoważonego, Promocje, nr2, (pp. 10).
2. Grabiński, T., Wydymus, A., and Zeliaś, A. (1989), Metody taksonomii numerycznej
w modelowaniu zjawisk społęczno-gospodarczych. Warszawa, PWN, (pp.71-100).
3. Janiga-Ćmiel A. (2017A), A Comparative Analysis of the Information Society In Poland
and Selected Countries. Proceedings of 35th International Conference Mathematical
Methods In Economics, Hradec Kralove, Czech Republic, (pp. 283-288).
4. Janiga-Ćmiel, A. (2017B), Globalisation and the information society in Poland
and selected countries. Proceedings of 17th International Scientific Conference.
Globalization and its socio-economic consequences, Zilina, Czech Republic,
(pp. 787-795)
5. Janiga-Ćmiel, A. (2018A), Analysis of the level of internet - based information processing
in the USA and selected countries of the European Union against a background of
globalization. Proceedings of 18th International Scientific Conference. Globalization and
its socio-economic consequences, Zilina, Czech Republic, (pp. 2099-2106)
6. Janiga-Ćmiel, A. (2018B), Correspondence analysis of the information society.
Contemporary issues and economic problems, ed. Martina Blaskova, Sylwia Pangsy-Kania,
Karolina Drela, Aneta Sokół, Aachen: Shaker Verlag, (pp. 76-84)
7. Kempty M. (1998), Globalizacja. Encyklopedia socjologii, Oficyna Naukowa, Warszawa,
(pp. 241)
8. Młodak, A. (2006), Analiza taksonomiczna w statystyce regionalnej, DIFIN, Warszawa,
(pp. 1-160).
9. Panek, T. (2009), Statystyczne metody wielowymiarowej analizy porównawczej. Warszawa:
Szkoła Główna Handlowa w Warszawie – Oficyna Wydawnicza, (pp. 58-114)
10. Pociecha, J., Podolec B., Sokołowski, A., and Zając, K. (1988), Metody taksonomiczne
w badaniach społeczno-ekonomicznych, Warszawa, PWN, (pp. 36-100)

63rd International Scientific Conference on Economic and Social Development – "Building Resilient Society" - Zagreb, 11-12 December, 2020
53
SOCIO-ECONOMIC DEVELOPMENT OF INDUSTRIAL REGIONS AS
A FACTOR FOR REALIZING THE POTENTIAL OF WORKING
YOUTH
Lyudmila Bannikova
Ural Federal University
named after the First President of Russia B. N. Yeltsin, Russian Federation
Anastasia Yuzhakova
Ural Federal University
named after the First President of Russia B. N. Yeltsin, Russian Federation
ABSTRACT
The article examines the influence of regional conditions on the implementation of the
innovative potential of Russian working youth. Industrial regions with a high level of
development of high-tech industries, the most promising for the development and
implementation of the innovative potential of various social and professional groups, were used
as the research space. The selection of regions was carried out on the basis of their position in
the ratings of innovative development and on the basis of the type of industrial development:
traditional industrial regions with a high level of industrial production, traditional industrial
regions with stable de-industrialization processes and new industrial regions with growing
high-tech industries. Within each region, high-tech enterprises of the industries that are priority
for the development of the respective region were selected. Parameters such as region and
industry were used as quota indicators of sociological research. The object of the study was
young people under 30 with higher or secondary vocational education. Based on the empirical
data obtained in the survey, it was found that working youth in industrial regions is
characterized by a certain pragmatism, orientation towards economic indicators and
technological development outside of any ideological orientations. The innovative activity of
working youth is largely associated with the industry affiliation of the enterprise, partly with
the level of development of the region, and the active innovation policy of regional authorities.
To a greater extent, the potential of young people, their susceptibility and readiness to innovate
depends on their status, on the complexity and diversity of their work functions. An increase in
the official and professional status leads to an increase in the innovative resources of a young
worker. The highest ratings for opportunities to participate in innovation are shown by
technicians and managers.
Keywords: Innovative potential, Youth, Industrial region
1. INTRODUCTION
The problems of modernizing the economy based on innovative activities remain the most
urgent for modern Russia. The creation of a national innovation system was identified as a
strategic direction for the country's development at the end of the last century. For the period
2013–2020 Russia managed to significantly develop its innovative potential against the
background of the world level, improving its position in the GII (Global Innovation Index) from
62nd to 43rd place [3]. Indicators characterizing the development of human capital, such as the
quality of the higher education system, the number of graduates of scientific and engineering
specialties, and others, remain traditionally high. At the same time, in recent years, there has
been a trend towards a slowdown in the growth rates of indicators of innovation activity. The
indicators of the effectiveness of innovations, the degree of impact of the results of scientific,

63rd International Scientific Conference on Economic and Social Development – "Building Resilient Society" - Zagreb, 11-12 December, 2020
54
technical and innovative activities on the economy and society are decreasing. The problem of
the insensitivity of the economy and society to innovations remains; there are no economic
mechanisms stimulating both the creation of innovations and their commercialization. The
analysis of the regions by the level of socio-economic development makes it possible to assess
the conditions for the formation of the innovative potential of the population, primarily of that
part of it that is most ready to take on entrepreneurial risks in the technological sphere. The
regions are characterized by uneven development of various aspects of innovation processes,
which is reflected in the rating of innovative development of the constituent entities of the
Russian Federation. Based on the results of assessing the positions of the regions in certain
areas, the constituent entities of the Russian Federation are ranked, and the composite Russian
regional innovation index (RIRI) is calculated [4]. Regions are also assessed by the share of
workers employed in high-tech and medium-tech high-level industries of industrial production
in the total number of people employed in the economy, by the number of students enrolled in
educational programs of higher education. Differences between regions in terms of the
conditions and results of the development of high technologies, digital inequality, network
readiness, the development of high-tech business, and support practices for start-ups are no less
important in assessing the possibilities of realizing the potential of working youth [6]. The most
promising resource for accelerating the country's technological development is Russian youth.
At the present time, in the conditions of economic and technological crises, a pandemic, young
people are exposed to numerous risks, which jeopardize their ability to form and then realize
their innovative potential. In the world social and psychological science, the problems of social
expectations, the processes of growing up and adaptation of young people are actively
investigated. The socio-economic and psychological factors of socialization and the associated
numerous indicators of well-being and social support are analyzed [8]. In the context of the
problems of youth choice of life path, education, place of work, the problem of overestimated
expectations, “unreasonable ambitions” is especially emphasized [9; 7]. Quite a lot of works
related to the study of professional and career development, professionalization of youth are
presented [1; 2; 5; 10]. Much less attention is paid to issues related to the innovativeness of
youth, with the study of its innovative potential. The use of the concept of "potential" in
sociology means a holistic view of the latent possibilities of a social community in reserve,
which are capable of being realized under favorable conditions. At the same time, researchers
pay attention not only to the already established social and professional properties of the
community, but also to the process of formation of the corresponding properties. An
insufficiently developed direction is the study of the most promising part of young people -
working young people in terms of their success in realizing their professional and educational
potential in innovative spheres of the economy.
2. METHODOLOGY
To accomplish the set task, we conducted a survey of working youth employed at industrial
enterprises in six regions of Russia. The survey was implemented in May - September 2018;
using a questionnaire on the Googleform platform, as well as using a traditional printed version
of the questionnaire. 1050 young workers under the age of 30 with higher and specialized
secondary education were interviewed. A targeted quota sample was used, with the region of
residence and industry being used as quota indicators. The industrial regions with a high level
of development of high-tech industries, the most promising for the development and
implementation of the innovative potential of various social and professional groups, were used
as the research space. The selection of regions was carried out on the basis of their position in
the ratings of innovative development. The sample presents regions with different values of the
RIRI indicator (Russian regional innovation index): from a high level (RRII = 7) in the
Sverdlovsk region to a level below the average (RRII = 41) in the Volgograd region.

63rd International Scientific Conference on Economic and Social Development – "Building Resilient Society" - Zagreb, 11-12 December, 2020
55
The second parameter was the type of industrial development: traditional industrial regions with
a high level of industrial production (Republic of Bashkortostan, Kaluga region), traditional
industrial regions with stable deindustrialization processes (Sverdlovsk region, Krasnoyarsk
region) and new industrial regions with growing high-tech industries (Perm region, Volgograd
region). Within each region, high-tech enterprises of the industries that are priority for the
development of the respective region were selected. The survey of working youth was held at
enterprises of aircraft and rocket engineering, mechanical engineering, instrument making and
transport, information technology, the space industry and communications enterprises, the
chemical and pharmaceutical industry, oil production and oil refining, metallurgical production
[11].
3. RESULTS
Based on the empirical data obtained in the survey, it was found that working youth in industrial
regions is characterized by a certain pragmatism, orientation towards economic indicators and
technological development outside of any ideological orientations. Study of youth in industrial
regions, their social feelings and moods, showed a number of interesting facts and trends. In
general, working youth are characterized by optimism in assessing the overall satisfaction with
life and a sense of confidence in the future. When transition to assessments of the state of affairs
in various spheres of society (economy, politics, social sphere and cultural sphere) optimism
decreases significantly. Young people assess the state of affairs in the economy most
negatively, and a significant portion of young people show dissatisfaction with their personal
economic status, which is an important indicator of an individual's social well-being. In the
definitions of the main life goals and landmarks, there are no significant differences among the
youth of the studied regions. Young people value family and a high standard of living with its
inherent attributes - high income, career and achievement of high official positions. These
points form the ideal of a successful life trajectory for young people. The importance of
creativity and the ability to embody their ideas (this orientation serves as a value foundation
specifically for innovative human behavior) is characteristic of less than 10% of young workers
(Table 1).
Evaluation parameters in %
Good family, successful children 28
High economic status, income level 20
High professional achievements 16
Own housing 10
Career, achievement of high official positions 10
The opportunity to be creative, to embody your ideas 9
Own business, independence from the employer 7
TOTAL: 100
Table 1: Life strategies of working youth
For working youth, the dominant means of achieving success in work is hard work and hard
work. Young people assess these qualities significantly higher than the presence of start-up
capital, social connections and support from influential relatives [11, p. 171]. Formation of
innovative openness and youth activity, its readiness to take part in innovative changes in the
organization, society depends on the degree of interest and trust in science, technology,
perception of their role in modern society. An attempt to link the level of interest of working
young people to scientific information with the “innovative background” of a particular
territory was unsuccessful. To a greater extent, the level of interest of working youth in
scientific issues depends on the industry affiliation of the enterprise. A double gap in the number
of people actively involved in innovation exists between young workers employed in the field

63rd International Scientific Conference on Economic and Social Development – "Building Resilient Society" - Zagreb, 11-12 December, 2020
56
of IT technologies, communications and at enterprises of the metallurgical industry, where the
wear of fixed assets is more than 70%. Assessment of the degree of readiness of working youth
to innovation is determined not only by the involvement of young people in problems scientific
and technological research and achievements, value attitude to science, but also the presence of
technological, financial conditions for the adoption and support of innovation as in production
activities and in everyday life. Quarter to a third of respondents work with high technologies,
often use and innovate. Every third respondent noted that he is often engaged in the
development of new technologies at his workplace. The innovative activity of working youth
depends on the innovation policy of the regional authorities, interest in business and production
innovations. Among the factors influencing the development of innovative potential, every
second respondent noted the absence or lack of government programs to support youth
initiatives and business disinterest in innovation, the pursuit of momentary profit. Along with
this, part of the respondents, among the reasons that prevent young people from putting forward
and implementing new ideas, indicated the mentality of modern youth, their unwillingness and
indifference. To a high degree, the potential of young people, their susceptibility and readiness
to innovate depends on their status, on the complexity and diversity of their work functions. An
increase in official and professional status leads to building up the innovative resources of a
young worker. The highest assessments of opportunities to participate in innovation are
demonstrated by technicians and managers. The official status largely determines the
motivation for participation in innovative activities at the enterprise. For qualified workers, both
material factors, receiving monetary rewards, and factors associated with increasing the level
of industrial safety, improving the ecological situation in the region. Motivation of technicians
connected with the content of their professional activities, improving the technical
characteristics of products. According to managers, the introduction of innovations will help
improve the quality of products and, as a result, increase the competitiveness of the enterprise.
4. CONCLUSION
A significant part of working youth shows an active interest in the innovation field, have
creative and innovative thinking, and are ready for innovation. The most active agents of
innovative development are young specialists and managers. Under certain conditions, the
innovative potential of young people can be successfully used, realized, and may remain
unclaimed. The negative factors that hinder the development of innovative processes and, as a
result, the innovative potential of young people include the lack of regulatory legal acts and
government programs that support the innovative activity of young people at the macro level;
lack of local incentive systems at enterprises; lack of interest in business innovation; low level
of professional and managerial training of decision-makers on the implementation of
innovations. The social well-being of working youth has regional specificity. Regions with the
highest assessments of social well-being are distinguished, and regions whose youth assess the
current situation and the current state of affairs in different spheres of society is rather
pessimistic. To a large extent, the differences in the assessments of young workers are explained
by the peculiarities of the socio-economic development of industrial regions, their current
position on the trajectory of the modernization process. The innovative activity of working
youth is largely associated with the industry affiliation of the enterprise, partly with the level of
development of the region, and the active innovation policy of regional authorities.
ACKNOWLEDGEMENT: The research was supported by the Russian Foundation for Basic
Research (RFBR), the project №18-011-00907 “Youth of Russian Industrial Regions: The
Image of Social Future as a Factor in the Development of Innovation Potential".

63rd International Scientific Conference on Economic and Social Development – "Building Resilient Society" - Zagreb, 11-12 December, 2020
57
LITERATURE:
1. Begu L. S., Vasilescu M. D. (2017). School-to-work transition: european youth's
perception of labour market opportunities. Economic computation and economic
cybernetics studies and research. Vol. 51. Issue: 1. 5-20 pages.
2. Didkovskaya Ya.V. (2011). Sociocultural analysis of professional
3. Global Innovation Index. (2019). Who Will Finance Innovation? Retrieved 01.11.2020
from http://www.globalinnovationindex.org.
4. Gokhberg, L.M. (2020). Article title: Rating of innovative development of constituent
entities of the Russian Federation. Issue 6 Nat. issled. University Higher School of
Economics - 264 page.
5. Gorshkov M.K., Sheregi F.E. (2010). Youth of Russia: Sociological portrait. TsSPiM. 592
page.
6. National report. (2018). High-tech business in the regions Russia Retrieved 01.11.2020
https://www.researchgate.net/publication/322656032.
7. Sabates R. Harris A.L., Staff J. (2016) Ambition Gone Awry: The Long-Term
Socioeconomic Consequences of Misaligned and Uncertain Ambitions in Adolescence.
Social science quarterly. Vol. 92. Issue 4. 959-977 pages.
8. Scales, P.C. (2011). Youth Developmental Assets in Global Perspective: Results from
International Adaptations of the Developmental Assets Profile. Сhild indicators
research. 2011. Vol. 4, issue 4. Special issue. 619-645 pages. Self-determination and careers
of youth. UrFU. 125 page.
9. Van Mol C. (2016). Migration aspirations of European youth in times of crisis.
Journal of youth studies. Vol. 19. Issue 10. 1303-1320 pages.
10. Wang M., Ye F., Degol J.L. (2017). Who Chooses STEM Careers? Using A Relative
Cognitive Strength and Interest Model to Predict Careers in Science, Technology,
Engineering, and Mathematics. Journal of youth and adolescence. Vol. 46. Issue 8. 1805-
1820 pages.
11. Youth of the industrial regions of Russia: the image of the social future and innovative
capacity (2018). Monograph. Publishing house Ural University. 215 page.

63rd International Scientific Conference on Economic and Social Development – "Building Resilient Society" - Zagreb, 11-12 December, 2020
58
CROATIAN CUSTOMERS ATTITUDE TOWARDS MOBILE
ADVERTISING - SEM APPROACH
Valentina Slunjski
Faculty of organization and informatics, University of Zagreb,
Varaždin, Pavlinska 2, Croatia
Damir Dobrinic
Faculty of organization and informatics, University of Zagreb,
Varaždin, Pavlinska 2, Croatia
Iva Gregurec
Faculty of organization and informatics, University of Zagreb,
Varaždin, Pavlinska 2, Croatia
ABSTRACT
This paper aims to research the advertising value model initially developed by Ducoffe (1995).
The model will explore the relationship between the factors of entertainment, information,
credibility, and irritability of ads displayed on mobile devices with the perception of their value,
and the relationship of factors of entertainment, credibility, and value with the attitude of
mobile advertising. For the research purposes, a conceptual framework was developed and
hypotheses formed, which were tested using the structural equation modeling method using the
statistical software package SPSS AMOS 26. Empirical research was conducted on a sample
of 150 respondent's users of the social network Facebook. Based on the obtained results, it was
determined that there is a statistically significant correlation between the factors of
entertainment and credibility with the perception of the value of mobile ads. At the same time,
in the case of informativeness and irritability, there is no such correlation. Furthermore, the
research results show that there is a statistically significant correlation between entertainment
and attitudes about mobile phone advertising and that there are no correlations between the
credibility of the ad and the attitude about mobile advertising. Also, no statistically significant
correlation was found between mobile ads' value and the attitude towards mobile advertising.
In addition to scientific knowledge, the results can be useful for experts to shape marketing and
sales strategies.
Keywords: advertising value model, ad value, advertising attitude, mobile advertising
1. INTRODUCTION
The everyday life of people is subject to various changes. These changes can be caused by
various social or technological factors that can, to a greater or lesser extent, change the
individual's current habits and life, but also and society as a whole. Mobile communication
devices are certainly a technological factor that has caused several changes in human life. With
the advent and initial use of mobile devices, one could not even guess how advanced this
technology would be. Due to the further development of this technology and the development
of smart mobile devices, it is assumed that by the end of 2023, it will sell about 1.48 billion
mobile devices to users. (S.O`Dea, 2020) The fact that the representation of mobile devices is
growing is evidenced by data showing that by 2025, more than 5 billion people will use mobile
phones, and half of them will be smart mobile devices. (Priyanka Chowdhury, 2019) Most users
have their mobile devices on hand at all times.
63rd International Scientific Conference on Economic and Social Development – "Building Resilient Society" - Zagreb, 11-12 December, 2020
59
With their help, they can communicate at any time but also get information about everything
that is of interest to them at a given time. With all the benefits that mobile devices provide to
their users, their excessive use can lead to addiction, which leads to less and less face-to-face
communication. (Alpana et al., 2016) The characteristics of mobile devices and their
possibilities to both users and mobile operators or advertisers make it an excellent advertising
medium. In order to ensure competitiveness in the market, it is necessary to continually improve
promotional strategies and find advertising media that will give the best results and the greatest
efficiency. In this regard, and considering the importance of mobile devices for each individual,
the increasingly common way of advertising is mobile advertising. It is assumed that mobile
advertising's global cost in 2022 will amount to more than 280 billion dollars. (Guttmann, 2019)
Previous research on mobile advertising appropriateness by consumers shows that young
consumers are more receptive to and view mobile ads than older consumers. (Ünal et al., 2011)
Granting prior permission by users also contributes to better acceptance of such advertisements.
(Standing et al., 2005), (He and Lu, 2007). On the other hand, the main reasons why consumers
do not accept advertising messages on mobile devices are obstruction, interference, or irritation
caused by these ads. (Bauer and Stephen, 1968). This leads to different conclusions about the
usefulness of mobile ads. Zhang and Xiong (2012) point out in their paper that the consumer's
attitude towards mobile advertising is mostly negative and irritating. The existence of negative
attitudes about mobile advertising is also determined by Tsang et al. (2004). In order to change
consumer attitudes about mobile ads, it is necessary to invest in the effectiveness of advertising
messages constantly. With good market research, advertising messages need to be tailored to
consumers' needs to avoid advertising's negative consequences. This paper aims to research the
impact of entertainment, information, credibility, and irritability of ads on user perception of
mobile ads' value and the impact of entertainment, credibility, and value on the attitude about
mobile advertising. The research results will help define new insights related to the formation
of values and attitudes about advertising. The research's practical contribution is reflected in
the possibilities of adapting promotional strategies that include mobile devices as an advertising
medium. After the introductory part, an overview of previous research is presented, and
hypotheses are formed. The third part of the paper presents the research methodology, followed
by data analysis. A conclusion with implications, limitations, and recommendations for future
research are given in the paper's final part.
2. LITERATURE OVERVIEW AND HYPOTHESES DEVELOPMENT
The growing presence and use of smart mobile devices allow customers to access information
and products at any time. (Mejda, 2014) Such a need and high representation of mobile devices
have spurred the development of mobile advertising. The function of advertising in achieving
business goals is indisputable. By using different media, advertising enables disseminating
information related to an idea, product, or service. (Tatarević and Krnjić, 2019) In addition to
informing consumers about products, advertising seeks to entertain, make people laugh, and
educate consumers. (Balog and Leko, 2017) Although every company, when creating
advertising messages, strives to be entirely tailored to consumers, many advertising messages
do not provoke the desired reaction. On the contrary, they are considered irritating. Thus, for
example, in the case of the very popular online advertising, its main disadvantage is a large
amount of advertising and thus the high saturation of product information. (Mejda, 2014)
Consumer attitude is one of the more important elements observed when conducting particular
research on customer behavior. (Zeheer and Kline, 2018) Numerous researches are also focused
on examining the attitudes of consumers towards mobile advertising. (Tsang et al., 2004), (Ünal
et al., 2011), (Feng et al., 2011), (Gauzente et al., 2008). The displayed advertising messages
try to influence the formation of positive consumer attitudes about the product or try to change
negative consumer attitudes into positive ones (Nakic, 2014b).

63rd International Scientific Conference on Economic and Social Development – "Building Resilient Society" - Zagreb, 11-12 December, 2020
60
Although the creation of advertising messages seeks to impact consumers positively, some of
the research also finds the existence of negative attitudes about mobile advertising. (Yang,
2004), (Tsang et al., 2004). The observed negative attitudes of consumers require companies to
increase investment in the promotion of a new product (Nakić, 2014a). Getting information
about a particular product is the most common reason for opening ad messages on a mobile
device. This is why some consumers find advertising messages useful and valuable. The value
of advertising messages is related to the subjective assessment of the value or usefulness of
advertising for the consumer. (Ducoffe, 1995). Therefore, numerous studies are focused on
examining the value of mobile ads among consumers. (Kim, 2019), (Kim and Han, 2014), (Liu
et al., 2012) Ducoffe (1995) develops a model of advertising value in which he highlights
several factors influencing the perception of ad value and attitudes about advertising. Based on
this model and a review of the research in which this model was tested, a conceptual research
framework was developed in this paper. Based on the conceptual framework (Figure 1), the
impact of entertainment, credibility, value, and irritability of mobile ads on the perception of
their value and attitudes about mobile advertising will be explored.
Figure 1: Conceptual model
Source: The authors
2.1. Entertainment
According to Ducoff (1995), ads must be entertaining in order for the perception of their value
to be higher. Sternthal and Craig (1973) agree that entertainment ads attract consumers'
attention, which is associated with creating a positive attitude (Elliott and Speck, 1998). One of
the reasons for the growing presence of mobile devices among young people is the greater
possibility of entertainment due to the numerous applications that can be installed on mobile
devices. (Grant and O`Donohoe, 2007) Entertainment, as Hug et al. (2015) point out, is an
important factor in mobile marketing. That there is a positive influence of entertainment on the
formation of attitudes about advertising in their works is confirmed by several authors.
(Ducoffe, 1995), (Gao & Zang, 2014), (Huq et al., 2015), (Qin and Yan, 2017), (Sigurdsson et
al., 2017), (Murillo et al., 2016). Also, numerous studies prove a positive link between
entertainment and ad value. Kim and Han (2014), Tsang et al. (2004), Zhang and Wang (2005)
Zhang and Wang (2005) Based on the results of previous research and their findings,
hypotheses H1 and H2 were formed.
H4
H5
H7
Entertainment
Informativeness
Credibility
Irritation
Mobile phone
advertising value
Attitudes toward mobile
phone advertisement
H2
H1
H6
63rd International Scientific Conference on Economic and Social Development – "Building Resilient Society" - Zagreb, 11-12 December, 2020
61
H1: There is a significant positive correlation (impact) between mobile ad entertainment and
mobile ad value.
H2: There is a significant positive correlation between mobile ad entertainment and attitudes
about mobile advertising.
2.2. Informativeness
Having the right information at the right time is the desire of every consumer. Such information
facilitates the buying process, which has a positive effect on his ultimate satisfaction. Martins
et al. (2018) point out that ads are a good source of information and, therefore, useful and
enjoyable. Therefore, when advertising products and services of the company, information is
considered one of the most important characteristics that contribute to the effectiveness of the
advertising process. (Chowdhury et al., 2006) Quality information about the products found on
the company's website has a direct impact on user perception. (Kaasinen, 2003) It is this
information that directs consumers to their further behavior. (İnanç et al., 2020) Ducoffe (1996)
also emphasizes that information plays a vital role in achieving overall consumer satisfaction.
Authors Brackett and Carr (2001) point out that advertising messages displayed to consumers
must be as informative as possible because they influence consumers' final attitudes. Numerous
studies indicate that information has a positive effect on the perception of ad value. (Ducoffe,
1996), (Tsang et al., 2004), (Kim and Han, 2014), (Aydogan et al., 2016). Hypothesis H3 was
formed in accordance with the results of previous research.
H3: There is a significant positive correlation between mobile ad informativeness and mobile
ad value.
2.3. Irritation
Negative aspects of advertising that lead to a reduction in advertising effectiveness are
associated with irritation. (Ducoffe, 1995) Irritation refers to a condition in which an advertising
message irritates and slows consumers. (Kim and Han, 2014) The prevalence of irritation
among consumers has a negative impact on the achievement of company goals. Irritation leads
to a reduction in purchases, which is associated with a reduction in company earnings. As
various techniques are used when creating ads, some of them can leave a bad impression on
consumers, which causes irritation. (Ducoffe, 1996). With the realization that mobile devices
are used for different purposes today, when advertising products via a mobile device, one can
come across information that disturbs and irritates consumers. (Stawart and Pavlou, 2002) Due
to the relatively low cost of mobile advertising, most companies send messages en masse to all
their consumers. (Hug et al., 2015) It is precisely these marketing ways of advertising that
distract and irritate most people. (Rittippant et al., 2009) Irritating ads to consumers are
associated with a decrease in its effectiveness. (Loureiro, 2017) Therefore, numerous research
papers state that irritation is the reason for the negative perception of advertisements' value and
final attitudes about advertisements. (Ducoff, 1995), (Tsang et al., 2004), (Xu, 2006), (Kim and
Han, 2014). Based on these studies, hypothesis H4 was formed.
H4: There is a significant negative correlation between mobile ad irritability and mobile ad
value.
2.4. Credibility
The credibility of the advertising messages themselves is significant in their perception and thus
in their more lasting attachment to the company. According to the author MacKenzie and Lutz
(1989), credibility shows the extent to which the consumer believes that certain claims about

63rd International Scientific Conference on Economic and Social Development – "Building Resilient Society" - Zagreb, 11-12 December, 2020
62
the product brand being advertised are true and credible. Messages that lack credibility are most
often ignored and bypassed. (Moore and Rogers, 2005) Research by Kelly et al. (2010) indicates
that credibility in young people plays an important role because they move away from
unreliable advertisements and ignore them. Research examining the credibility of ads concludes
that the credibility of messages transmitted to a user’s mobile device can affect a consumer’s
attitude toward advertising. (Chowdhury et al., 2006) According to previous research, it can be
concluded that the credibility of advertising messages affects the creation of a positive
perception of the value of advertising and positive attitudes about advertising. (Azeem & Haq,
2012), (Murillo et al., 2016), (Braket and Carr, 2001), (Chia-Ling et al., 2012). Hypotheses H5
and H6 were formed based on these studies.
H5: There is a significant positive correlation between mobile ads' credibility and mobile ads'
value.
H6: There is a significant positive correlation between mobile ads' credibility and the attitude
about advertising.
2.5. The value of mobile ads and the attitude towards mobile advertising
Most authors in their research use Ducoff's model to determine consumers' final value because,
in his work, he lists the key factors that affect the value of mobile ads and the final attitude of
consumers about advertising. (Ducoff, 1995). In a study by Liu et al. (2012), the perceived
value of advertising contributes to the growth of good attitudes toward ads because consumers
focus on message applications and eliminate irrelevant thoughts. (Hoffman and Novak, 1996)
Also, it is assumed that informative, entertaining, credible, and unobtrusive ads will positively
affect consumers' final attitude within the prediction of consumer behavior. (Tahereh and Zahra,
2012.) This is confirmed by the results of research by Blanco et al. (2010), Kim and Han (2014),
Murillo et al. (2016), which indicate that there is a positive relationship between values and
attitudes about advertising. According to previous research showing that there is a positive
relationship between value and attitude about advertising, hypothesis H7 was formed.
H7: The value of mobile ads is positively related to the attitude of customers towards mobile
advertising.
3. RESEARCH METHODOLOGY
3.1. Scale development
This research aims to test the Ducoffe model of determining mobile ads' value and consumers'
attitudes about mobile advertising. According to previous research results, the value of
advertising affects the creation of final consumer attitudes about a particular advertising type.
Taking these results into account, this research tests the ad value model in the context of mobile
advertising. In this regard, the following are examined: A) the impact of entertainment,
information, irritability, and credibility on the value of mobile ads, B) the impact of
entertainment and credibility on the mobile advertising attitude, and C) the connection and
impact of the value of mobile ads on the final mobile advertising attitude. Variables from the
model were measured using a 5-point Likert scale in which subjects expressed a degree of
agreement or disagreement with absolute statements (scale ranging from 1 = strongly disagree
to 5 = strongly agree). The sources used to form the scale are shown below. (Table 1)
Table following on the next page

63rd International Scientific Conference on Economic and Social Development – "Building Resilient Society" - Zagreb, 11-12 December, 2020
63
Table 1: Sources – measuring scales Construct Source The initial
number of
items
The final
number of
items
Entertainment Ducoffe (1996) 5 5
Informativeness Ducoffe (1996) 6 6
Irritation Ducoffe (1996); Bracket and Car (2003) 5 3
Credibility
Bracket &Car (2003) 5 4
Mobile phone advertising value
Ducoffe (1996); Bracket &Car (2003) 3 3
Attitudes toward mobile phone
advertisement
Tsang i sur. (2004); Pollay and Mittal,
(1993)
4 4
Source: The authors
Some questions were left out in the continuation of the research due to low factor load (Table
2).
Table 2: Original measurement items Construct Measurement items
Entertainment
EN1 Mobile phone ads are entertaining.
EN2 Mobile phone ads are pleasing.
EN3 Mobile phone ads are pleasing.
EN4 Mobile phone ads are enjoyable.
EN5 Mobile phone ads are fun to use.
Informativeness
IN1 Mobile phone ads are good sources of product/service information.
IN2 Mobile phone ads supply relevant product information.
IN3 Mobile phone ads provide timely information.
IN4 Mobile phone ads are good sources of up-to-date product/service
information.
IN5 Mobile phone ads are convenient sources of product/service
information.
IN6 Mobile phone ads make product/service information immediately
accessible.
Irritation
IR1 Mobile phone ads are annoying.
IR2 Mobile phone ads are irritating.
IR3* Mobile phone ads are deceptive.
IR4* Mobile phone ads are confusing.
IR5 Mobile phone ads insult people’s intelligence.
Credibility
CR1* Mobile phone ads are convincing.
CR2 Mobile phone ads are credible.
CR3 Mobile phone ads are trustworthy.
CR4 Mobile phone ads are believable.
CR5 I believe that mobile phone ads are a useful reference for purchasing
products.
Mobile phone advertising
value
VA1 Mobile phone ads are useful.
VA2 Mobile phone ads flyers are valuable.
VA3 Mobile phone ads are important.
Attitudes toward mobile
phone advertisement
AT1 Overall, I consider mobile phone ads a good thing.
AT2 Overall, I like mobile phone ads.
AT3 My general opinion about mobile phone ads is favourable.
AT4 I like to watch mobile phone ads.
Source: The author
*Problematic items excluded from further analysis (low factor loading and not adequate
model fit).

63rd International Scientific Conference on Economic and Social Development – "Building Resilient Society" - Zagreb, 11-12 December, 2020
64
3.2. Data collection and sample used
A survey of consumers' value and final attitudes about mobile advertising was conducted
through a survey during May and June 2020 by posting on various Facebook groups. One
hundred and fifty (150) valid questionnaires were collected. The majority of respondents are
female, 82% of them, while the largest number of respondents belongs to the group of 20 to 25
years. A detailed presentation of the basic demographic characteristics of the respondents can
be seen in Table 3. Table 4 shows the answers to the questions related to the use of mobile
devices. According to these data, it can be concluded that most respondents use these devices
for at least 3 hours a day, mostly using them for access and activities on social networks.
Table 3: Basic demographic characteristics of the survey respondents
Demographic characteristics %
Gender Female 82%
Male 18%
Age
0-19 4,7%
20-25 72%
26-40 17,3%
41-54 4%
More than 55 2%
Education degree
Primary school -
High school 38,7%
Bachelor 31,3%
College 20%
Univ.spec/PhD 10%
Source: The authors
Table 4: Use of mobile devices
%
Time of using the mobile
device
At least 3 hours a day 53,3%
At least 6 hours a day 25,3%
More than 6 hours a day 21,3%
I am using a mobile device
for…
Calls 6%
Messages 11,3%
Social networks 80,7%
Other 2% (e-mail, useful pages, all
of the above)
Source: The authors
4. DATA ANALYSIS
During the analysis of the collected data, the measurement construct's reliability was measured
using the statistical software package SPSS 23. In contrast, in testing hypotheses and
relationships between variables, confirmatory factor analysis (CFA) was used, using the
software package SPSS AMOS 26.
4.1. Internal reliability of a measuring instrument
The internal reliability of the measuring instrument construct was measured using the
Cronbach's alpha coefficient, whose values for each construct in the measuring instrument are
higher than the reference value (0.7). Internal reliability is shown in Table 5.

63rd International Scientific Conference on Economic and Social Development – "Building Resilient Society" - Zagreb, 11-12 December, 2020
65
Table 5: Internal reliability of the measuring instrument
INTERNAL RELIABILITY
Construct Items Cronbach`s
alpha
Item-total
correlation
MEAN SD
Entertainment
EN1 0,953 ,852 2,322 1,220
EN2 ,883 2,418 1,224
EN3 ,877 2,100 1,098
EN4 ,881 2,521 1,221
EN5 ,881 2,096 1,193
Informativeness
IN1 0,884 ,661 3,288 1,063
IN2 ,719 2,904 0,991
IN3 ,721 3,199 1,071
IN4 ,684 3,555 1,089
IN5 ,639 3,644 1,068
IN6 ,754 3,301 1,110
Irritation
IR1 0,725 ,705 3,829 1,091
IR2 ,647 3,884 1,141
IR5 ,330 2,534 1,187
Credibility
CR2 0,876 ,731 2,644 0,884
CR3 ,803 2,575 0,931
CR4 ,766 2,705 0,940
CR5 ,646 2,719 1,035
Mobile phone
advertising value
VA1 0,898 ,761 2,993 0,993
VA2 ,836 2,651 1,014
VA3 ,802 2,596 1,105
Attitudes toward
mobile phone
advertisement
AT1 0,902 ,808 2,733 1,164
AT2 ,839 2,411 1,171
AT3 ,734 2,904 1,097
AT4 ,744 2,050 1,202
Source: The authors
4.2. Confirmatory factor analysis (cfa)
To check the connections between the constructs within the conceptual model and to test the
hypotheses, the structural equation modelling method was used using the software package
SPSS AMOS 26. The relationships between the variables defined by the conceptual framework
were tested by measuring fit indices: GFI, AGFI, IFI, TLI, CFI, RMSEA, and SRMR. The
tested model did not show adequate values (GFI <0.8, AGFI <0.8, IFI> 0.9, TLI <0.9, CFI <0.9,
RMSEA = 0.089 and SRMR> 0.089). By modifying the measuring instrument, the statements
IR3, IR4, and CR1 were eliminated, and satisfactory results were obtained (good model fit).
Table 6 shows the modified structured model's values, while Figure 2 shows the structural
model.
Table following on the next page

63rd International Scientific Conference on Economic and Social Development – "Building Resilient Society" - Zagreb, 11-12 December, 2020
66
Table 6: Fit indices
Fit indices Test Model Modification
model
Recommended
value
Source
Chi-square 1289,4:df=337
P<0,001
437,748; 255
P<0,001
x2/df 3,82 1,717 <5 Park&Kim(2014)
GFI 0,765 0,805 >0,8 Halmi, (2016)
AGFI 0,717 0,751 >0,8 Halmi, (2016)
IFI 0,885 0,942 >0,9 Park&Kim(2014)
TLI 0,871 0,931 >0,9 Kim&Han,(2014)
NFI 0,851 0,871 >0,9 Park&Kim(2014)
CFI 0,885 0,941 >0,9 Hu&Bentler, (1999)
RMSEA 0,089 0,070 0,03 do 0,08 Hair i sur., (2014)
SRMR 0,089 0,0589 <0,08 Hair i sur., (2014)
Source: The authors
Figure 2: Structural model
Source: The authors

63rd International Scientific Conference on Economic and Social Development – "Building Resilient Society" - Zagreb, 11-12 December, 2020
67
4.3. Hypothesis tests
The results of hypothesis testing show the following:
• Hypothesis H1 is not supported (β=0,245, C.R. =1,947, p>0,05).
• Hypothesis H2 is supported (β=0,667, C.R. =8,771, p<0,001).
• Hypothesis H3 is not supported (β=-0,041, C.R. =-0,318, p>0,05).
• Hypothesis H4 is not supported (β=-0,102, C.R. =-1,049, p>0,05).
• Hypothesis H5 is supported (β=0,687, C.R. =5,560, p<0,001).
• Hypothesis H6 is not supported (β=0,171, C.R. =1,780, p>0,05).
• Hypothesis H7 is not supported (β=0,198, C.R. =1,779, p>0,05).
A more detailed presentation of the results is shown below. (Table 7 and Figure 3).
Table 7: Summary of the hypothesis testing results
Hypothesis Independent
variable
Dependent
variable
Standard
estimate
CR P-
value
Supported
H1 (+) EN VA 0,245 1,947 0,051* Not supported
H2 (+) EN AT 0,667 8,771 *** Supported
H3 (+) IN VA -0,041 -0,318 0,750* Not supported
H4 (-) IR VA -0,102 -1,049 0,294* Not supported
H5 (+) CR VA 0,687 5,560 *** Supported
H6 (+) CR AT 0,171 1,780 0,075* Not supported
H7 (+) VA AT 0,198 1,779 0,075* Not supported
Source: The authors
*** p < 0,001; *p > 0,05
IN- Informativeness, EN – Entertainment, IR – Irritation, CR- Credibility, VA- Advertising
value, AT – Attitude toward mobile phone advertising.
Figure 3: Results of a hypothesis test
Source: The authors
The representativeness of the research model was checked using the coefficient of
determination (R2). The measured values are shown in Table 8. According to the results, it can
be seen that entertainment, information, irritability, and credibility explain 78.8% of the
variance in the perception of the value of ads, while entertainment, credibility, and value explain
90.2% of the variance of the attitude about mobile advertising. The results show good
representativeness of the model.
H3
H5
H7
H6
H4
H1
0,17
0,19
0,69
-0,10
-0,04
0,25
0,67
Informativeness
Irritation
Credibility
Mobile phone
advertising
value
Attitudes toward
mobile phone
advertisement
Entertainment

63rd International Scientific Conference on Economic and Social Development – "Building Resilient Society" - Zagreb, 11-12 December, 2020
68
Table 8: Squared multiple correlations of the proposed research model
Source: The authors
5. DISCUSSION, IMPLICATIONS, AND LIMITATIONS
Encouraged by the knowledge of daily advances in technology and the growing prevalence of
product advertising through mobile devices, this research determines the relationship of factors
(entertainment, information, credibility, and irritability) with the perception of mobile ads'
value attitudes about mobile advertising. The research was conducted through a survey
conducted in the Republic of Croatia. Based on the conceptual model, hypotheses were formed
and tested by research. Hypotheses H1 and H5 were confirmed while hypotheses H2, H3, H4,
H5, and H6 were not. It has been found that there is a positive correlation of credibility with
the perception of the value of mobile phone ads. No negative correlation between ad irritability
and ad value was found. Observing the irritability (mean in the ranges from 2.53 to 3.84 on a
scale of 1 to 5), it is evident that there is no decisive agreement of respondents with the statement
that mobile ads are irritating and negatively affect the value of mobile ads. This concludes that
irritation is not a reason for not accepting mobile ads, as shown in previous research. (Bauer
and Stehpen, 1968), (Xu, 2006), (Wang and Genç, 2019) Unexpectedly, this research found that
there is no correlation between information and the value of mobile ads, which is not in line
with previous research. Considering the mean, which ranges from 2.90 to 3.64, it is evident that
there is certain neutrality regarding the informativeness of the advertisement. There was also
no statistically significant correlation between entertainment and the perception of the value of
mobile ads. Mean ranges from 2,096 to 2,521, which means that there is no agreement about
the entertainment of ads, i.e., entertainment is not crucial in forming the perception of mobile
ads' value. The model also measured the level of correlation between entertainment, credibility,
and ad value with the attitude towards mobile advertising. The research results show that there
is a statistically significant correlation between entertainment and attitudes about mobile
advertising, as shown in previous research. (Sigurdsson et al., 2017), (Gao and Zang, 2014).
Furthermore, unexpected research results show that there are no correlations of ad credibility
with an attitude about mobile advertising. Mean responses range from 2.57 to 2.72 on a scale
of 1 to 5, indicating a low perception of mobile ads' credibility. Also, unexpectedly, no
statistically significant correlation was found between mobile ads' value and the attitude
towards mobile advertising, which is contrary to previous research. Mean responses answers to
questions about the perception of mobile ads' value range from 2.59 to 2.99, which shows
disagreements or certain neutrality regarding mobile ads' value. Respondents' answers
regarding the attitude towards mobile advertising are also interesting, name. Namely mean of
the answers ranges from 2.05 to 2.90, which also shows their somewhat negative (or neutral)
attitude towards mobile advertising. In addition to new knowledge about the perception of
mobile ads' value and the formation of attitudes about mobile advertising, the practical
contribution of this research is reflected in more efficient planning and implementation of
promotional activities through mobile networks. The main limitation of the research is the
sample used. The survey was conducted exclusively through one social network, and 89% of
respondents are in the age group of 20 to 40 years. In this regard, the results cannot apply to the
entire population. The following research recommendation is to expand the sample and include
older age structures and investigate the relationship of demographic variables with values and
attitudes about mobile advertising.
Construct Values
Mobile phone advertising value 78,8 (0,788)
Attitudes toward mobile phone advertisement 90,2 (0,902)

63rd International Scientific Conference on Economic and Social Development – "Building Resilient Society" - Zagreb, 11-12 December, 2020
69
LITERATURE:
1. Alpana V., Vinayak P., Ajay V. (2016). Mobile Phone Usage among Youth. International
Journal of Applied Research and Studies, 5(3), 25-35
2. Azeem, A. & Haq, ul. Z., (2012). Perceptions towards Internet advertising: a study with
reference to three different demographic grups, Global Businnes and Menagement
Research: An International Journal, 4 (1),28-45
3. Aydogan, S., Aysuna C., Aktan, M. (2016). Web Advertising Value and Student’s Attitude
Towards Web Advertising, European Journal of Business and Management, 8 (9), 86-96
4. Balog, A. i Leko, D. (2017). Moralno rasuđivanje u marketinškom oglašavanju. Ekonomski
vjesnik, 30 (1), 239-248
5. Bauer, Raymond A. and Greyser, Stehpen A. (1968). Advertising in America: The
Consumer View, Boston:Division of Research, Graduate School of Business
Administration, Harward University, 67 (4),874-880
6. Blanco, C.F., Blasco, M.G., I Azorin, I. I. (2010). Entertainment and informativeness as
precursory factors of successful mobile advertising messages, Communications of the
Ibima, 1-11
7. Brackett, L. K., & Carr, B. N. (2001). Cyberspace Advertising vs. Other Media: Consumer
vs. Mature Student Attitudes. Journal of Advertising Research, 41(5), 23–32.
8. Chia-Ling, L., Sinkovics, R., Pezderka, N. and Haghirian, P. (2012), “Determinants of
consumer perceptions toward mobile advertising: a comparison between Japan and
Austria”, Journal of Interactive Marketing, 26 (1), 21-32.
9. Chodhury, H.K., Parvin, N., Weitenberner, C. & Becker, M. (2006). Consumer attitude
toward mobile advertising in an emerging market: An empirical study. International
Journali of Mobile Marketing, 1(2),33-41
10. Ducoffe, RH (1995). How Consumers Assess the Value of Advertising, Journal of Current
Issues & Research in Advertising, 17 (1), 1–18.
11. Ducoffe, R.H. (1996). Advertising value and advertising on the web, Journal of Advertising
Research,36(5), 21-35
12. Elliott, Michael T. and Paul Surgi Speck. (1998). "Consumer perceptions of advertising
clutter and its impact across various media." Journal of Advertising Research, 38 (1)
13. Feng, X., Fu, S., & Qin, J. (2016). Determinants of consumers’ attitudes toward mobile
advertising: The mediating roles of intrinsic and extrinsic motivations. Computers in
Human Behavior, 63, 334–
14. Gao, S., & Zang, Z. (2014). An empirical examination of users’ adoption of mobile
advertising in China. Information Development, 32(2), 203–215.
15. Gauzente, C. (2008). Attitude toward M-Advertising, Perceived Intrusiveness, Perceived
Ad-Clutter and Behavioral Consequences: A Preliminary Study. 2008 19th International
Conference on Database and Expert Systems Applications.
16. Grant, I., & O’Donohoe, S. (2007). Why young consumers are not open to mobile marketing
communication. International Journal of Advertising, 26(2), 223–246.
17. Guttmann A. (2019). Mobile Internet advertising revenue Available at:
https://www.statista.com/statistics/303817/mobile-internet-advertising-revenue-worldwide
(Retrieved : 08.07.2020 )
18. Hair Jr. F.J., Black, R.E., Babin, J.B. & Anderson, E.R., (2014). Multivariate Dana
Analysis-7th Edition, Pearson, Harlov, 2014,99.579
19. Halmi, A., (2016). Multivarijantna analiza, Alineja, Zagreb, 2016, 99.175
20. He, D., & Lu, Y. (2007). Consumers Perceptions and Acceptances Towards Mobile
Advertising: An Empirical Study in China. 2007 International Conference on Wireless
Communications, Networking and Mobile Computing

63rd International Scientific Conference on Economic and Social Development – "Building Resilient Society" - Zagreb, 11-12 December, 2020
70
21. Hoffman D., & Novak T.(1996). Marketing in hypermedia environment foundations:
Conceptual foundations. Journal of Marketing , 60 (3),50-68
22. Hu, L.& Bentler, P.M. (1999). Cutoff criteria for fit indexe sin covariance structure analysis:
Conventional criteria versus new alternatives, Structural Equation modeling, 6(1), 1-55
23. Huq, S. M., Alam S.M., Nekmahmud, M.,Aktar,M.S. & Ala,S.M.S.(2015). Customer’s
Attitude Towards Mobile Advertising in Bangladesh. International Journal of Business and
Economics Research.4(6), 281-292
24. İnanç, S.A., Gökaliler, E.& Gülay, (2020). Do bumper ads bump consumers?: An empirical
research on YouTube video viewers, El profesional de la información, 29 (1), 1-13
25. Kaasinen, E. (2003). User Needs for Location-Aware Mobile Services, Personal and
Ubiquitous Computing, 7, 70-79
26. Kim, M. (2019). Determinants of Young Consumers’ Attitude toward Mobile Advertising:
The Role of Regulatory Focus. Journal of Promotion Management, 1–21.
27. Kim, J.Y.& Han, Y.I., (2014). Why smartphone advertising attracts customers: A model of
web adverising, flow, and personalization, Computer sin Human Behavior 338 (2014), 256-
269
28. Liu, C-L. `E., Sinkovics, R. R., Pezderka, N., & Haghirian, P. (2012). Determinants of
consumer perceptions toward moble advertising- A comparison between Japan and Austria.
Journal of Interactive Marketing 26(1), 21-32.
29. Loureiro S.M.C. (2017). Tell What You Want but Do Not irritate Me: A Senior Perspective
Abaut Advertising, Jurnal of Promotion Managment, 24(2), 198-214
30. MacKenzie, S. B., & Lutz, R. J. (1989). An Empirical Examination of the Structural
Antecedents of Attitude toward the Ad in an Advertising Pretesting Context. Journal of
Marketing, 53(2), 48–65.
31. Martins, J., Costa, C., Oliveira, T., Gonçalves, R., & Branco, F. (2018). How smartphone
advertising influences consumers’ purchase intention. Journal of Business Research.
32. Mjeda, T. (2014). Mediji kao mediji ( između brenda i čovjeka). In medias res, 3(5), 724-
731
33. Moore, J. J., & Rodgers, S. L. (2005, January). An examination of advertising credibility
and skepticism in five different media using the persuasion knowledge model. Proceedings
of the American Academy of Advertising, USA 10–18.
34. Murillo,E., Merino, M. & Nunez, A. (2016). The advertising value of Twitter Ads: a study
among Mexican Millennials, Rrvista Brasileia de Gestao Negocios 18 (61), 436-456
35. Nakić, S. (2014a). Područja primjene stavova potrošača. Praktični menadžment, 5(1), 14-
21.
36. Nakić, S. (2014b). Stavovi potrošača u promotivnim aktivnostima. Praktični menadžment,
5(2), 109-114.
37. Park, E., & Kim, K. J. (2014). An Integrated Adoption Model of Mobile Cloud Services:
Exploration of Key Determinants and Extension of Technology Acceptance Model.
Telematics and Informatics, 31(3),376-385
38. Piyanka Chowdhury. (2019). Quide to mobile advertising: Types of ads and main platforms.
Available at: https://www.clickz.com/guide-to-mobile-advertising/252590/ (Retrieved :
08.07.2020 )
39. Pollay, R.w. & Mittal, B. (1993). Here`s the Beef: Factors, Determinants, and Segment sin
Consumer Criticism of Advertising, Journal of Marketing, 57(3),99-114
40. Rittippant, N., Witthayawarakul, J., Limpiti, P., & Lertdejdecha, N. (2009). Consumers'
perception of the effectiveness of Short Message Service (SMS) and Multimedia Message
Service (MMS) as marketing tools. Proceedings of World Academy of Science: Engineering
& Technology, 53, p815.

63rd International Scientific Conference on Economic and Social Development – "Building Resilient Society" - Zagreb, 11-12 December, 2020
71
41. Sigurdsson, V., Menon, R. G. V., Hallgrímsson, A. G., Larsen, N. M., & Fagerstrøm, A.
(2017). Factors Affecting Attitudes and Behavioral Intentions Toward In-app Mobile
Advertisements. Journal of Promotion Management, 24(5), 694–714.
42. S.O´Dea. (2020). Smartphones - Statistics & Facts. . Available at:
https://www.statista.com/topics/840/smartphones/ (Retrieved : 08.07.2020)
43. Standing, C., S. Benson, and H. Karjaluoto.(2005). “Consumer Perspectives On Mobile
Advertising And Marketing”. In ANZMAC 2005 Conference: Electronic Marketing. Perth,
Australia: Dr Sharon Purchase.
44. Stewart, D. W. & Pavlou, P.A.(2002). From consumer response to active consumer:
Measuring the effectiveness of interactivemedia. Journal of the Academy of Marketing
Science, 30 (4), 376-396
45. Sternthal, B., & Craig, C. S. (1973). Humor in Advertising. Journal of Marketing, 37(4),
12–18.
46. Tahereh, N. & Zahra, G.T.,(2012). Investigating Effective Factors on the Perceived Values
and Attitudes of Internet Advetisements Users. Journal of Bascis and Applied Scientific
Research, 2(5),4392-4399
47. Tatarević, L. i Krnjić A. (2019). Utjecaj oglašavačkih poruka na ponašanje krajnjih kupaca.
Tranzicija, 22(44), 124-135.
48. Tsang, M. M., Ho, S.-C., & Liang, T.-P. (2004). Consumer Attitudes Toward Mobile
Advertising: An Empirical Study. International Journal of Electronic Commerce, 8(3), 65–
78.
49. Zeheer, N. i Kline, M. (2018). Korištenje segmentacije životnog stila za ocjenu stavova
potrošača i ponašanja prema mobilnom oglašavanju. Market-Tržište, 30(2), 213-229.
50. Zhang,P. & Wang, C. (2005). Am empirical study on consumer`s perceived value and
attitude toward advertising. Procedings of the 6 Global Information Technology and
Management World Conference, June5-7, 2005, Anchorage, Alaska
51. Zhang, X., & Xiong, K. (2012). A Conceptual Model of User Adoption of Mobile
Advertising. 2012 International Conference on Computer Science and Electronics
Engineering.
52. Xu, D.J. (2006). “The influence of personalization in affecting consumer attitudes toward
mobile advertising in China”, Journal of Computer Information Systems, 47 (2), 9-19
53. Yang, K. C. C. (2004). A comparison of attitudes towards Internet advertising among
lifestyle segments in Taiwan. Journal of Marketing Communications, 10(3), 195–212.
54. Wang, Y.,Genç, E. (2019). "Path to effective mobile advertising in Asian markets:
Credibility, entertainment and peer influence". Asia Pacific Journal of Marketing and
Logistics,
55. Qin, L. & Yan, H. (2017). Attitude towards MoBILE Advertising and Mobile Web
Information Acquisition Behaviour: Persperctives from the Advertising Value, Credibility
and Self-efficacy, Advances in Social Science, Education and Humanities Research,
72,368-377
56. Ünal, S., Ercis, A., & Keser, E. (2011). Attitudes towards Mobile Advertising – A Research
to Determine the Differences between the Attitudes of Youth and Adults. Procedia - Social
and Behavioral Sciences, 24, 361–377.

63rd International Scientific Conference on Economic and Social Development – "Building Resilient Society" - Zagreb, 11-12 December, 2020
72
PRACTICAL EXPERIENCE USING THE TOOLS OF
DIGITALIZATION IN THE EDUCATIONAL ENVIRONMENT
Daria Shalina
Ural Federal University (UrFU), Ekaterinburg, Russia
Natalia Stepanova
Ural Federal University (UrFU), Ekaterinburg, Russia
Viola Larionova
Ural Federal University (UrFU), Ekaterinburg, Russia
ABSTRACT
This paper investigates the assessment of the knowledge management process when using
information technologies in the distance learning process. The current problem is the
unfavorable epidemiological situation that forced us to switch to a new educational
environment. There was a lack of training of teachers, students and administration in applying
the skills of using modern information technologies, and the workload of technical equipment.
These and other reasons caused a certain confusion in the field of education and had a negative
impact on students and teachers. Therefore, the purpose of the study is to provide a socio-
economic justification of this problem of organizing training on the real practical example of
the Ural Federal University. To achieve this goal, the criteria of the modern educational
environment were studied, the main difficulties of creating such an environment were identified,
and the concept of an "educational platform" as a replacement for the usual audience was
presented. Various methodological tools were used: analysis of theoretical material,
description of emerging problems and difficulties, comparing of the spring and autumn
semesters, and empirical experience of using a single educational platform. As a result of the
research, we have shown how to optimally and effectively use the tools of digitalization in
education on the real practical example of the Ural Federal University. The study was
conducted on the basis of estimated impacts from teachers and students, as well as educational
and auxiliary material. Ahead of us is the introduction of a new stage – project-based training
using information technology training.
Keywords: Consequences of coronavirus, digitalization, distance education
1. INTRODUCTION
The spring appearance of the virus and the development of the pandemic contributed to the exit
from the comfort zone of all economic and social systems, including education. Our usual
education in schools/universities has turned into an information mess: a lot of information
resources for training, system overload, technical failures, increased preparation time for
classes (both teachers and students) and etc. All these factors increased the level of stress on
the background of the unfavorable epidemiological situation, which led to insufficient quality
of obtaining and mastering knowledge. Further – sometimes a complete lack of desire to learn
due to an uncomfortable educational environment. And as a result, the concept of "innovation"
was associated with "chaos". This arrangement will not bring the desired results to anyone –
neither to students, nor to teachers, nor to employers, nor to the state. A solution to this problem
was found by the administration of the Ural Federal University (UrFU).

63rd International Scientific Conference on Economic and Social Development – "Building Resilient Society" - Zagreb, 11-12 December, 2020
73
The new approach to education allowed us to improve the educational process, create a
favorable educational climate for students and teachers, and use the principles of modern
management and planning.
1.1. Relevance and practical significance
At the time of writing (September 2020), the coronavirus is spreading. Most educational
institutions use distance learning methods. But not everyone has enough information resources
to create a favorable educational climate.
In our research, we will share unsuccessful and successful experiences of distance learning,
which will be useful for other educational institutions.
1.2. Goal and objectives
The purpose of our research is the socio-economic justification of the practical use of
information technologies in University education. To achieve this goal, the following tasks
were set:
• Consideration of sustainable concepts and training methods before the pandemic;
• Drawing up cause-and-effect relationships for introducing innovations in the learning
process in the shortest possible time;
• Description of a new approach to training;
• Forecasting changes in the educational process everywhere.
The research is based not only on observation, but also on concrete facts and reports of distance
learning at the University.
2. MAIN BODY OF THE PAPER
2.1. Theoretical aspects and known results
Digitalization tools are gradually replacing live interaction between people. But despite the high
efficiency of new technologies, live communication is necessary for a person, especially in an
educational environment (Kalimullina, Trotsenko, 2018). The educational environment is a
space that provides the educational process with the necessary information, technical and social
resources for the effective interaction of its participants (Nadtochiy, Lunkov, 2020). The
introduction of digital tools in education affects participants in the educational process in
different ways:
1) Students' involvement in learning increases, as the modern generation is attracted to
multimedia materials, distance learning, and various gamifications. The educational
environment should have a number of characteristics that correspond to the interests of
students:
• Creating a creative atmosphere
• Developing interpersonal skills through increased study of humanities subjects;
• Creating a new individual approach to learning;
• Emergence of new teachers – coaches;
• Ensuring the growth of internal mobility.
2) For teachers this change is commensurate with the challenges and new opportunities.
Traditional teacher training does not involve the using of primarily digital tools in teaching.
In this regard, there are difficulties in integrating digitalization into the educational process.
Instead of facilitating learning, teachers spend time learning new information platforms and
modernizing the entire learning material. Therefore, there is a need for digital literacy.
Digital literacy is a combination of knowledge, skills and experience in the field of
digitalization (Kalimullina, Trotsenko, 2018).

63rd International Scientific Conference on Economic and Social Development – "Building Resilient Society" - Zagreb, 11-12 December, 2020
74
3) Digital resources improve the learning process. But we do not forget about personal
development. The modern educational environment should also contain personality-
oriented principles, combine digitalization and socialization (Nadtochiy, Lunkov, 2020).
Thus, we can distinguish the following criterions for evaluating the modern educational
environment:
• Availability of opportunities for personal self-development;
• Promoting the development of students' abilities;
• A variety of information;
• Focused on the learning process itself, its importance and value;
• Equality of the participants of the education regardless of status;
• Creative atmosphere;
• High internal mobility;
• Balanced and structured learning process (Nadtochiy, Lunkov, 2020).
To satisfy the requirements of the modern economy and the interests of the younger generation,
the educational environment should use an innovative approach instead of the traditional one
(Kalimullina, Trotsenko, 2018). Digital skills have already become a prerequisite for effective
interpersonal interaction. This leads to the need to develop digital literacy of people of different
professions and ages in the context of the digital economy (Peskov, 2018).
2.2. Transition from traditional to innovative education
Before the outbreak of the coronavirus pandemic, educational institutions followed traditional
teaching principles: real attendance of classes, live communication with the teacher. This
system of education was sufficiently effective for obtaining theoretical knowledge and practical
skills, which should be the focus of the learning process (Vertakova, Plotnikov, 2020). In higher
education, traditional training is presented in the form of streaming lectures. This type of
training contributes to improving the scientific level of students' training and ensures uniform
and systematic work during the semester (Osmina, 2019). Traditional training has not been
subject to global changes for many years. It was gradually improved by technical means that
complemented the educational process. These include presentations and electronic reference
books. These information elements are effective in teaching and socializing students
(Vertakova, Plotnikov, 2020). Now the traditional audience has an analog in the form of an
online educational platform. An educational platform is an online system that contains a set of
educational materials for all participants of the educational process. This system satisfies the
modern criterions of the educational environment, as it uses new ways of organizing learning,
educational applications, it is possible to track the dynamics of students and the development
of their creative abilities (Panyukova, 2020).
2.3. Unorganized distance learning in extreme conditions
The educational environment was shaken by the abrupt transition to distance learning in the
spring of 2020. From this, a chain is built: traditions – an outbreak of coronavirus –
"antitraditions". Live communication has been replaced with virtual communication,
university/school classes with online broadcasts, etc. Effective online learning requires a
number of conditions:
1) Availability of high-quality access to digital technologies: necessary technical equipment
and Internet in educational institutions.
2) Support of the educational process with high-quality and informative information.
3) The possession of the necessary knowledge and skills to use new tools of digitalization
(Ratheeswari, 2018).

63rd International Scientific Conference on Economic and Social Development – "Building Resilient Society" - Zagreb, 11-12 December, 2020
75
Lack of preparation led to classes being held on different platforms, which led to "chaos" in the
educational environment. This phenomenon has caused stress among participants in the
educational process, which contradicts the favorable educational climate. Effective teaching
depends largely on the teacher's training. Now information technologies and systems are used
for this purpose. New technical support provides great opportunities for all participants of the
educational process (Ratheeswari, 2018). Therefore, the work of both teachers and students has
increased. It took more time to create the task, publish it, inform students, upload the task,
complete it, answer questions via an online chat with a delay, upload the task to a specific
platform, check the tasks by the teacher and assign a grade. In the situation with a single
educational platform, everything would be different. The unified educational platform provides
online access to educational materials at any time, convenient monitoring of attendance and
completion of tasks by students, reducing the time for organizing a lesson, quickly sending
tasks for verification, a wide range of information resources and online communication via chat
with instant notifications of new messages. The administration can quickly make management
decisions based on data on attendance, student performance, and the learning process
(Panyukova, 2020).
2.4. A new approach to the implementation of the educational process in UrFU
Students and teachers of the Ural Federal University also experienced "remote chaos". The
problem solution of plenty of platforms and their congestion was to collect all disciplines in a
single Microsoft Teams system. Technical issues were finalized at the beginning of the year.
Students reacted negatively to the news about the new platform, as something new is already
associated with problems and numerous problems. However, this information platform did not
require long-term adaptation. In a recent interview the rector of UrFU said that the University
is moving forward, gradually introducing new technologies. It is important for the University
that graduates have a high degree of adaptation and a certain set of competencies. Regardless
of the conditions, students are given the necessary knowledge (Grishankov, Zherdev, 2020).
Microsoft Teams is adapted to the educational process and has all the necessary tools to create
a comfortable educational environment. First, online classes are meetings where you can see
all the participants and track their attendance. Using video and audio communication, the online
lesson will be as close as possible to the traditional one. In an online class you can raise your
hand to answer a question or voice a question to the teacher. For the same purpose, you can use
the chat directly during the lesson. Secondly, it is possible to display a screen that allows you
to show the training material, and draw on a digital board to explain the material. Third, you
can record a lesson and give it to students to repeat. The recording can be downloaded and
viewed within the specified time frame (about 20 days). Fourth, the teacher can publish the
task, and students can submit it for review on the same platform. Fifth, each discipline has its
own team, which is identical to the audience at the University. Students and teachers can easily
find and join this team for a class (Microsoft, 2020). So, Microsoft Teams is not just a corporate
platform, but and a complete online educational environment. Let's compare the quality of the
educational environment in the spring and autumn of 2020 according to the criteria of the
modern educational environment (see Table 1).
Table following on the next page

63rd International Scientific Conference on Economic and Social Development – "Building Resilient Society" - Zagreb, 11-12 December, 2020
76
Criterion Semester
Spring semester Autumn semester
Availability of opportunities for
personal self-development
Opportunities are present: development in non-standard
conditions, the ability to respond flexibly to changes
contributes to the development of the individual
Promoting the development of
students' abilities
It is difficult to implement
without live communication.
It is difficult to determine
who is capable of what
through online tasks
It is difficult to identify
capable students, but thanks
to audio and video
communication, the teacher
can mark active students
A variety of information Online resources, individual
lecture recordings, online
library, individual lecture
presentations
Online resources, lecture
recordings, online library,
online books, lecture
presentations
Focused on the learning process
itself, its importance and value
Result-oriented, because the
process is too complex, which
is why it loses its value
Process orientation, attracting
students to view and
participate in lectures
Equality of the participants of the
education regardless of status
All are equal, points are awarded according to certain
criterions
Creative atmosphere There is little creativity due to
tight deadlines and the lack of
a single platform
A variety of activities, you
can draw on a digital board, a
stylish educational platform
High internal mobility It is possible only in social
networks or by mail
It is possible in social
networks, and on the platform
itself
Balanced and structured learning
process
Lack of preparation for
distance education "broke"
the structure of the
educational process
Clear structure of training on
the online platform, balance
of time for classes and rest
Table 1: Comparison of the educational environment in spring and autumn 2020
Based on this comparative analysis, we can conclude that the educational environment in the
autumn semester is better. It satisfies to many criterions of the modern educational environment,
which contributes to an effective educational process. In the spring, the reason for non-
compliance with many criteria was lack of preparation. The transition to online educational
platforms was too fast. Distance learning is supposed to be temporary, but information
resources are of great importance in education and can be used after the incidence of
coronavirus has decreased. They help to increase the level of participation and interaction, the
quality of education, facilitate learning to quickly search for information and develop critical
thinking (Ratheeswari, 2018).
3. METHOD
3.1. Method of research
The research methods used were analysis, description, comparing, and empirical experience.
The study provided basic concepts and theoretical aspects for research (educational
environment, digital literacy, educational platform). By analyzing the theoretical material, the
main criterions of the modern educational environment were identified for further comparing
of the spring and autumn semesters. The article describes the traditional approach to teaching,
the cause-and-effect relationships of the emergence of "chaos" in education in the spring of
2020, and a new way of conducting classes. The study provides real practical experience of
using Internet resources in training.

63rd International Scientific Conference on Economic and Social Development – "Building Resilient Society" - Zagreb, 11-12 December, 2020
77
An example of an information system is Microsoft Teams, where participants in the learning
process can conduct online lectures, upload files, tasks, and communicate.
3.2. Application aspects
Preparation for the beginning of the 2020/21 academic year included (according to the rector's
order No. 655/03 from 18.08.2020):
• For full-time and part-time education, a combined mode of the educational process is
established: practical classes are held in the traditional format, lectures - using distance
learning technologies;
• For correspondence courses, classes should only be held remotely;
• To conduct classes in a remote format, you must use the Microsoft Teams cloud service;
• Broadcast lectures (webinars) from specialized classrooms of the University;
• Specify the platform and audience in the schedule/ only the platform if the class is held from
home;
• All students and teachers must activate Office 365 and install Microsoft Teams before
starting their training.
To use the Microsoft Teams service in the educational process, methodological seminars were
organized for teachers before the start of the school year. The following issues were considered
for discussion:
• Justification of the need and preparatory measures for the implementation of MS Teams in
the educational process;
• Organization of training and group work in MS Teams;
• Experience in MS Teams;
• Answers to participants' questions.
The next stage will be the introduction of project-based training at the University. Its goal is to
increase the attractiveness of UrFU General education programs and ensure high
competitiveness of Graduates in the global labor market.
4. CONCLUSION
The educational environment, using traditional approaches in teaching, slows down not only its
own development, but also the development of participants in the educational process.
Continuous modernization and socialization are becoming the main criterions of the modern
educational environment. The introduction of innovations in the educational process should be
accompanied by digital literacy of educational participants. Otherwise, digital tools will
complicate all the usual organizational processes. A single educational platform is a convenient
option for the effective operation of the educational system. All participants in the process are
present in one place, as in one educational institution. In UrFU, such a platform is Microsoft
Teams. The full use of information resources can turn from uncertainty into a rapid process of
reaching heights. The knowledge and skills acquired during innovative training will become a
key parameter in career growth.
LITERATURE:
1. Grishankov, D., Zherdev, F. (2020). An University that employers love. Motivation:
magazine about innovations in Russia. Retrieved 24.09.2020 from
https://stimul.online/articles/sreda/universitet-kotoryy-lyubyat-rabotodateli/.
2. Kalimullina, O.V., Trotsenko, I.V. (2018). Modern digital educational tools and digital
competence: analysis of existing problems and trends. Open education, 22 (3), pp. 61–73.

63rd International Scientific Conference on Economic and Social Development – "Building Resilient Society" - Zagreb, 11-12 December, 2020
78
3. Microsoft (2020). Microsoft Teams for education. Retrieved 25.09.2020 from
https://www.microsoft.com/ru-ru/microsoft-365/microsoft-teams/education.
4. Nadtochiy, A.P., Lunkov, V.Y. (2020). Formation of the educational environment. Modern
pedagogical education, 3, pp. 8–12.
5. Osmina, K.S. (2019). The introduction of online lectures in the traditional education. World
of science, culture, and education, 4 (77), pp. 177–179.
6. Panyukova, S.V. (2020). Digital tools and services in the work of a teacher. Moscow:
Publishing house "Pro-Press".
7. Peskov, D. (20.09.2018). We will learn programming before we learn to read.
Komsomolskaya Pravda. Retrieved 20.09.2020 from
https://www.ural.kp.ru/daily/26884/3928381/?fbclid=IwAR30qJIDih70BZS45uQfILioTI
K4cwK-BSy5pqOEXumkuJBNWuZUOPr4xKc.
8. Ratheeswari, K. (2018). Information Communication Technology in Education. Journal of
Applied and Advanced Research, 3 (1), pp. 45–47.
9. Order on the beginning of the new 2020-2021 academic year (2020). The order of the rector
of Federal University named after the first President of Russia B.N. Yeltsin, No. 655/03.
Ekaterinburg: UrFU.
10. Vertakova, Y.V., Plotnikov, V.A. (2020). Traditional training technologies and quality
assurance of economic education in the digital transformation era. Management consulting,
3 (135), pp. 54–60.

63rd International Scientific Conference on Economic and Social Development – "Building Resilient Society" - Zagreb, 11-12 December, 2020
79
FINANCIAL STRUCTURES IN RETAIL TRADE, EXCEPT OF MOTOR
VEHICLES AND MOTORYCLES IN THE REPUBLIC OF CROATIA
Dina Korent
Faculty of Organization and Informatics, University of Zagreb
Pavlinska 2, 42000 Varaždin, Croatia
ABSTRACT
The aim of this paper is to identify the financial structures of companies in the retail trade,
except of motor vehicles and motorcycles in the Republic of Croatia. The time frame of interest
is the period from 2008 to 2015, the subject of the analysis are all companies in the specified
activity division, and the data source are the databases of the Financial Agency.
Methodological requirements imply the application of general scientific methods, and in the
empirical part of the paper also the methods of descriptive statistical analysis. In a broader
sense, through the prism of the overall vertical financial structure of passive, a high level of
total company indebtedness is determined with a decreasing trend from the middle of the
period. In a narrower sense, from the aspect of the vertical financial structure of part of the
passive, the existence of a relatively conservative capital structure is stated, with domination
of equity over long-term debts. In other words, a relatively low intensity of the use of financial
leverage is identified, accentuated by the fact of reducing its cost-effectiveness in the analyzed
period. This conservatism is more pronounced for small companies compared to medium-sized
and large companies. In addition, the persistence of the identified capital structures is evident
throughout the observed period, which is why it can potentially be considered an inherent
characteristic of the subject activity division. This also indicates that the variability in the
indicators of the overall vertical financial structures of passive is obviously predominantly
potentiated by relative variability in short-term debt financing. Horizontal financial structures,
ie working capital management strategies, are assessed as relatively aggressive, with the stated
aggressiveness being most pronounced for large companies, followed by small companies, and
finally medium-sized companies. Finally, although generally unfavorable, indicators of risk of
financial difficulties record a positive trend from the middle of the period, which, without
further analysis, can be roughly provoked by the adequacy of financial structures of companies
in retail trade, except of motor vehicles and motorcycles.
Keywords: financial structures, retail trade, except of motor vehicles and motorcycle, activity
division G 47, Republic of Croatia, analysis
1. INTRODUCTION
The financing process is formalized in the company's bookkeeping. In this sense, the financing
process can be observed by the duality of the accounting method through the structure of assets,
ie active on the one hand and the structure of liabilities and equity, ie passive on the other, and
ultimately by observing the logical connections between these structures. The latter is easiest
to determine on the basis of financial statements, primarily on the basis of the balance sheet.
Therefore, we can talk about the following financial structures: vertical financial structures that
include the structure of active (assets) and the structure of passive (liabilities and capital), and
the horizontal financial structure that shows the relationship between parts of active and parts
of passive (Burtchett & Hicks, 1948; Orsag, 2018). Under the financial structure, however, is
often understood only the vertical structure of the passive of the balance sheet of the company,
and usually the structure of its long-term part, or the so-called capital structure. (Martin et al.,
1974; Brigham & Ehrhardt, 2011) The passive of a company's balance sheet formalizes its
relationships with sources of funds.

63rd International Scientific Conference on Economic and Social Development – "Building Resilient Society" - Zagreb, 11-12 December, 2020
80
Globally, the structure of a company's passive is shown by the debt-to-equity ratio or the degree
of indebtedness that shows the share of total debts in total passive. Comprehensively, therefore,
the structure of the company's passive is represented by the relations of own and borrowed
capital (Orsag, 2018). Furthermore, as mentioned, related to the vertical structure of passive of
the balance sheet, the term capital structure also appears, which means the vertical structure of
a part of passive, as a rule, its long-term part, ie the structure of long-term liabilities and equity.
Consequently, although there are cases when the capital structure may provoke the possibility
of including short-term capital, ie short-term and current liabilities, the capital structure can be
characterized as a long-term financial structure of passive of the company’s balance sheet.
Simplified, the capital structure is shown through the ratio of debts, as a rule, long-term, and
equity (Orsag, 2015; Orsag, 2018). The horizontal financial structure implies the maturity
connection of parts of active and parts of passive, ie it demonstrates the compliance of parts of
assets with the way of financing them. According to the so-called golden rules of financing the
company's operations, and conditioned by the principle of security, ie the principles of liquidity
and solvency, long-term investments (in fixed and permanent current assets) should be financed
using long-term financing. In contrast, the financing of occasional needs should be viewed
through the principle of profitability. This principle requires that fluctuating funding needs be
financed in the short term. Since the size of permanent current assets is objectively difficult to
determine, these requirements are modified in practice in such a way that inventories are
considered long-term, ie permanent, and other forms of current assets, as short-term, ie
fluctuating current assets (Orsag, 2015; Orsag, 2018).
2. STRUCTURAL-BUSINESS CHARACTERISTICS OF THE RETAIL TRADE,
EXCEPT OF MOTOR VEHICLES AND MOTORYCLES
The retail trade, except of motor vehicles and motorcycles (G47 according to the National
Classification of Activities 2007) was chosen because of its importance in the economy of the
Republic of Croatia. Figure 1 shows the share of this activity division in the total business
results (number of companies, number of employees, total revenues, total expenses, gross
profit, gross investment in fixed assets) of the Republic of Croatia for the period 2008-2015.
As the figure shows, the G47 activity division participates with 7.91-9.66% in the total number
of companies, with 10.35-11.20% in the total number of employees, with 12.31-13.89% in the
total revenues, with 12.50-14.16 in total expenses, with -9.52-16.94% in gross profit and
between 2.96-13.86% in gross investment in fixed assets.
Figure 1: Shares of results of the G47 activity division in the total business results of the
Republic of Croatia (Author’s work according to (FINA, 2017) data)
-10.00%
0.00%
10.00%
20.00%
2008 2009 2010 2011 2012 2013 2014 2015
Shares of results of the G47 activity division in the total business results of the
Republic of Croatia
Number of entrepreneurs Number of employees by hours worked
Total revenues Total expenses
Gross profit Gross investment in fixed assets

63rd International Scientific Conference on Economic and Social Development – "Building Resilient Society" - Zagreb, 11-12 December, 2020
81
The degree of concentration of the subject activity division, measured by the Herfindahl-
Hirschman index (HHI), is continuously gradually increasing in the period from 2008-2015,
specifically from 284.73 in 2008 to 384.99 in 2015. These values indicate that retail trade is
extremely unconcentrated, ie highly fragmented or atomistic activitiy division with a larger
number of relatively small companies with approximately the same, smaller share of activity
revenue. Consequently, no company has a significant market share, ie it is not in a situation of
dominance of the activity nor does it have the power to shape events in it (Tipurić et al., 2002).
However, the time trend shows a slow but continuous increase in market concentration. The
capital intensity coefficient1 of activity division G47 ranges from 0.427 to 0.481, and the
reciprocal to the stated labor intensity ratio is in the range from 2.080 to 2.339. A value of
capital intensity coefficient less than one indicates capital equipment below the economy
average. In other words, congruent to the labor intensity coefficient, activity divsion G47 can
be attributed as an above-average labor-intensive, more precisely more than twice labor-
intensive than the economy average. Finally, in the observed period from 2008 to 2015, the
median of labor productivity and the median of capital productivity of the activity division G47
range from 319,828.06 to 408,542.03 kunas of total income per employee and in the range from
1.40 to 6.26 kunas of total income per kuna of fixed assets, respectively, and generally have a
negative trend.
3. METHODOLOGICAL FRAMEWORK OF EMPIRICAL ANALYSIS
The chapter provides an insight into the sample design and a description of the data, variables
and methods used in the analysis.
3.1. Sample design
Empirical analysis in this paper is based on a statistical set consisting of annual observations
for companies registered in the Republic of Croatia, whose predominant activity, ie division of
activity, is retail trade, except trade in motor vehicles and motorcycles (G 47 according to the
National Classification of Activities 2007). The sample of empirical analysis is an unbalanced
sample consisting of 74,092 company-year observations, ie annual observations for companies
registered in the Republic of Croatia and whose predominant activity, ie division of activity, is
retail trade, except trade in motor vehicles and motorcycles (G 47 according to National
classification of activities 2007) in the period from 2008-2015, and are registered in the
database of the Financial Agency (FINA). Figure 2 shows the number and structure of
companies by size in activity division G47 in the period 2008-2015, ie the structure of the
sample by years and by company size. It is evident from the graph that, regardless of the year,
the structure of the sample is dominated by small companies, with a share ranging from 98.48%
in 2009 to 98.74% in 2015. The share of medium-sized companies in the observed period ranges
from 0.82% in 2015 to 1.10% in 2009, while the share of large companies is the lowest in 2010
(0.37%) and the highest in 2014 (0.46%). If we look at the first and last year of the observed
period, it can be seen that the total number of companies decreased by 1.80% (168 companies),
primarily due to a decrease in the number of small and medium companies and a slight increase
in the number of large companies. As a result of the latter, in 2015, compared to 2008, the
shares of small and large companies increased, while the share of medium-sized companies
decreased.
1 The capital intensity coefficient shows the share of fixed assets of a particular activity in the fixed assets of the economy
according to the share of employees in a particular activity in the total employment of the economy (Kovačević & Vuković,
2006).

63rd International Scientific Conference on Economic and Social Development – "Building Resilient Society" - Zagreb, 11-12 December, 2020
82
Figure 2: Sample structure by year and company size
(Source: Author’s work according to (FINA, 2017) data)
3.2. Data, variables and methods
For the purposes of empirical analysis, data on the companies that make up the sample were
used. The data were obtained from the „living“ database of the Financial Agency on 12 July
2017 and accordingly represent secondary data. Data include basic data and quantitative data
needed to calculate the indicators of the selected variables. In order to perform the empirical
analysis, the indicators of the corresponding variables were first calculated on the basis of the
above data, using the MS Excel software package. Variables and indicators of variables used
in other similar research are used, and their selection is determined by the theoretical basis and
the availability of data needed for their calculation. In general, the variables used in the analysis
are the vertical financial structure of passive, the horizontal financial structure, probability of
financial distress and company size. Variables, ie indicators of these variables are defined for
each company-year, and their names, labels and calculation methods are given in Table 1.
Table following on the next page
92179082
94939311
8889 89099090 9067
97
101
96
95
97 83
78 75
37
39
36
39
38 40
42 41
8400
8600
8800
9000
9200
9400
9600
9800
2008 2009 2010 2011 2012 2013 2014 2015
Number of companies in activity division G47 by company size
Small companies Medium-sized companies Large companies

63rd International Scientific Conference on Economic and Social Development – "Building Resilient Society" - Zagreb, 11-12 December, 2020
83
Name of variable Indicator name and label Calculation method of (indicator)
variable
Vertical financial structure
of passive
Debt ratio (DR) total liabilities / total assets
Equity ratio (ER) equity / total assets
Debt to equity ratio (DER) total liabilities / equity
Long-term debt ratio (LDR) long-term debt / (long-term debt + equity)
Long-term debt to equity ratio
(LDER) long-term debt / equity
Financial leverage indeks (FL) ROE/ROA
Horizontal financial
structure
Coverage ratio I (CRI) equity / fixed assest
Coverage ratio II (CRII) (equity + long-term debt) / fixed assets
Current ratio (CR) current assets /short-term liabilities
Quick ratio (QR) (current assets - inventories) / current
liabilities
Probability of financial
distress Altman Z-Score (ZSCORE)
It is quantified by adjusting the estimate
of Altman's Z-Score (1968) for private
business entities that may be located
outside the manufacturing sector (Žager et
al., 2008; Bogdan et al., 2019), and is
therefore among the developed models
most suitable for the analysis of trade,
according to the following expression:
Z-Scoreit = 6,56*X1 + 3,26*X2 + 6,72*X3
+ 1,05*X4
where X1 = net working capital / total
assets; X2 = retained earnings / total
assets; X3 = profit (earnings) before
interest and taxes / total assets; X4 = book
value of equity / book value of total
liabilities
Company size
The analysis follows a
classification into company size
categories applied by the Financial
Agency. In its databases, the
Financial Agency classifies small,
medium-sized and large companies
on the basis of the Accounting Act
(NN 78/15, 134/15, 120/16,
116/18, 42/20, 47/20) (Vlada
Republike Hrvatske, 2020)
indicators (amount of total assets,
amount of income and the average
number of employees during the
business year) determined on the
last day of the business year
preceding the business year for
which the financial statements are
prepared.
It is determined in the context of the
following three modalities of company
size: small companies (S), medium-sized
companies (M) and large companies (L).
Table 1: Names, labels and calculation methods of (indicators of) variables
(Source: Authors’s work)
The analysis of the capital structure of companies in the selected activity division in the
Republic of Croatia was performed by applying descriptive statistics of the mentioned
variables, ie indicators of variables. An analysis was performed for the entire sample of
enterprises, in the selected activity division, as well as for subsamples of comapnies by size,
specifically for the subsample of small comapnies, for the subsample of medium-sized
companies and for the subsample of large comapnies.

63rd International Scientific Conference on Economic and Social Development – "Building Resilient Society" - Zagreb, 11-12 December, 2020
84
4. RESULTS OF EMPIRICAL ANALYSIS
The results of descriptive statistics of variable indicators for all companies in the sample, ie for
all companies in activity division G47 covered by the same, as well as for individual subsamples
of the companies according to their size, generally demonstrate the existence of noticeable
variation ranges, standard deviations and coefficients of variation of observed indicators. The
latter indicates large variations between values and their large dispersion around the average
values. Given that the coefficients of variation of all indicators exceed the limit of 30, and often
100 and more %, mentioned, as indicators of representativeness of the average, suggest more
or less unrepresentativenessof the same. Consequently, the average, ie the arithmetic mean is
not a relevant measure of the value of the relevant indicators for the respective companies, and
the median is used as a more appropriate measure of descriptive statistics in the analysis and
drawing conclusions.
4.1. Results of vertical financial structure of passive analysis
Starting from the analysis of the vertical financial structure of the entire passive, observed for
the sample of all companies, but also individual subsamples of companies by size, in the activity
division G47 in the period 2008-2015 the movement of the medial value of the debt ratio
(Figure 3) in the interval from 0.83 to 0.88 was identified. The debt ratio in all years achieves
high median values, indicating that the companies in the activity divison G47 finances more
than 80% of its assets with debts. In addition, since the stated median values exceed the limit
value of 0.67, it can be concluded that, viewed from a conservative point of view, the companies
in the relevant activity division are medially over-indebted. In general, with a minor exception
for the subsample of medium-sized companies in 2010, there is an evident trend in the shape of
the inverted letter U, ie an increase in the level of indebtedness until 2012, followed by a gradual
decline.
Figure 3: Medians of debt ratio for whole sample and subsamples by company size in the
period 2008-2015
(Source: Author’s work according to (FINA, 2017) data)
The inversely proportional to the movement of the median debt ratio, the trend of the median
values of the equity ratio in the observed period from 2008 to 2015 (Figure 4) is U-shaped, both
for the whole sample of companies and for subsamples of companies by size. This suggests the
existence of a trend of decreasing the share of self-financing until 2012 and the trend of
increasing the share of self-financing after 2012. In terms of value, and complementary to the
degree of indebtedness, the medians of the equity ratio in the period from 2008-2015 for the
whole sample of companies and the subsample of small companies range from 0.12 to 0.17,
0.80
0.82
0.84
0.86
0.88
0.90
2008 2009 2010 2011 2012 2013 2014 2015
Medians of debt ratio for whole sample and subsamples by company size in the
period 2008-2015
whole sample median small company median
medium-sized company median large company median
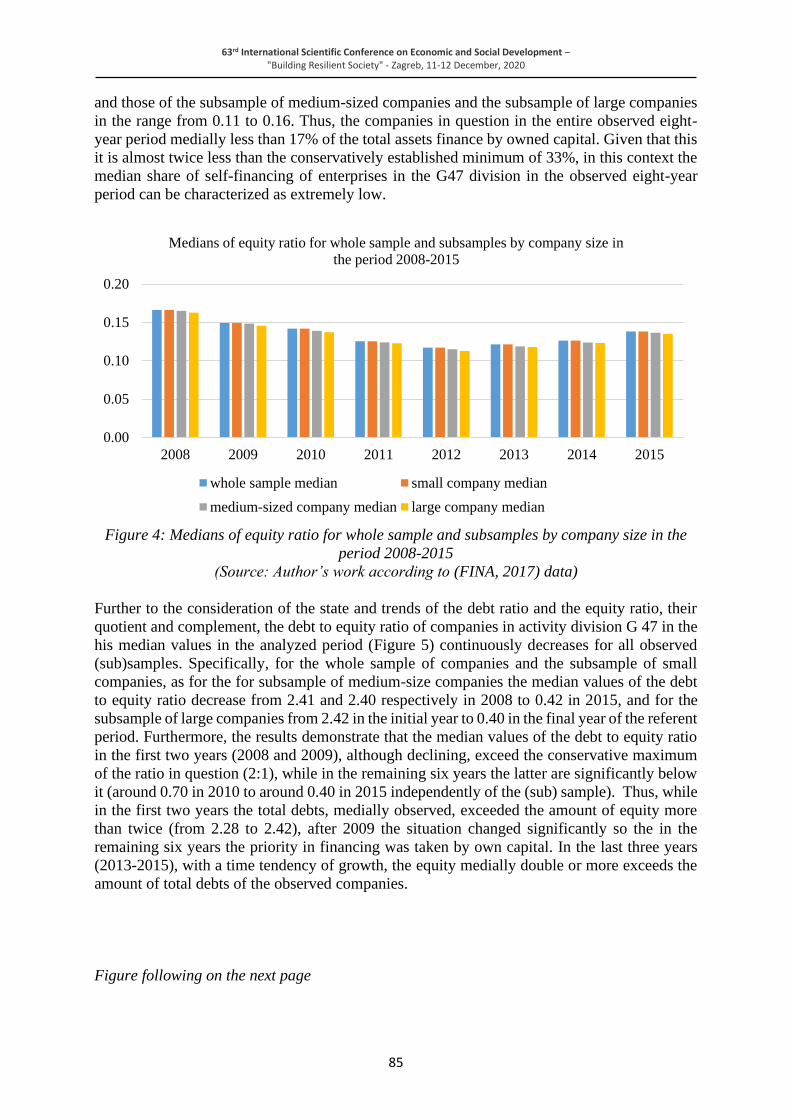
63rd International Scientific Conference on Economic and Social Development – "Building Resilient Society" - Zagreb, 11-12 December, 2020
85
and those of the subsample of medium-sized companies and the subsample of large companies
in the range from 0.11 to 0.16. Thus, the companies in question in the entire observed eight-
year period medially less than 17% of the total assets finance by owned capital. Given that this
it is almost twice less than the conservatively established minimum of 33%, in this context the
median share of self-financing of enterprises in the G47 division in the observed eight-year
period can be characterized as extremely low.
Figure 4: Medians of equity ratio for whole sample and subsamples by company size in the
period 2008-2015
(Source: Author’s work according to (FINA, 2017) data)
Further to the consideration of the state and trends of the debt ratio and the equity ratio, their
quotient and complement, the debt to equity ratio of companies in activity division G 47 in the
his median values in the analyzed period (Figure 5) continuously decreases for all observed
(sub)samples. Specifically, for the whole sample of companies and the subsample of small
companies, as for the for subsample of medium-size companies the median values of the debt
to equity ratio decrease from 2.41 and 2.40 respectively in 2008 to 0.42 in 2015, and for the
subsample of large companies from 2.42 in the initial year to 0.40 in the final year of the referent
period. Furthermore, the results demonstrate that the median values of the debt to equity ratio
in the first two years (2008 and 2009), although declining, exceed the conservative maximum
of the ratio in question (2:1), while in the remaining six years the latter are significantly below
it (around 0.70 in 2010 to around 0.40 in 2015 independently of the (sub) sample). Thus, while
in the first two years the total debts, medially observed, exceeded the amount of equity more
than twice (from 2.28 to 2.42), after 2009 the situation changed significantly so the in the
remaining six years the priority in financing was taken by own capital. In the last three years
(2013-2015), with a time tendency of growth, the equity medially double or more exceeds the
amount of total debts of the observed companies.
Figure following on the next page
0.00
0.05
0.10
0.15
0.20
2008 2009 2010 2011 2012 2013 2014 2015
Medians of equity ratio for whole sample and subsamples by company size in
the period 2008-2015
whole sample median small company median
medium-sized company median large company median

63rd International Scientific Conference on Economic and Social Development – "Building Resilient Society" - Zagreb, 11-12 December, 2020
86
Figure 5: Medians of debt to equity ratio for whole sample and subsamples by company size
in the period 2008-2015
(Source: Author’s work according to (FINA, 2017) data)
Looking at the capital structure in the context of the long-term debt ratio (Figure 6) and the
long-term debt to equity ratio (Figure 7) it is clear that the median values of the latter for the
entire sample and subsample of small companies in activity division G47 are zero throughout
the whole observed period. This points out that the companies, medially observed, do not
finance themselves by long-term debt in relation to the total long-term forms of financing and
in relation to the equity respectively. The median values of the subject indicators for the
subsamples of medium-sized companies range from 0.07 to 0.39 and from 0.00 to 0.51
respectively, and for the large companies from 0.20 to 0.35 and from 0.07 to 0, 50 respectively,
with a general decreasing trend over time, which is more pronounced for the long-term debt to
equity ratio than for long-term debt ratio. Respecting the standard values, ie conservative
maximums of the long-term debt ratio (0.5) and the long-term debt to equity ratio (1:1), the
state and movement of said medial values indicate that the analyzed companies are financed to
a much lesser extent by long-term debts compared to equity financing. Accordingly, the
existence of conservative capital structures, ie the conservative use of financial leverage, of
companies in the activity division G47 can be stated. Given the more pronounced conservatism
of small companies compared to medium-sized and large companies in this activity division,
the capital structure, ie the use of financial leverage of small companies can be assessed as
extremely conservative, and that of medium-sized and large companies as an extremely
conservative to conservative. In addition, given the constant median values of long-term debt
ratio and long-term debt to equity ratio in the observed period for the entire sample and for
subsample of small companies, as well as quite stable values of latter for subsamples of
medium-sized and large companies, it can be concluded that the capital structure in this activity
division generally persists and as such it can be considered its potentially inherent
characteristics. The latter also point out that the variability in the indicators of the overall
vertical financial structure of passive, ie the debt ratio, the equity ratio and the debt to equity
ratio, is likely predominantly determined by relative variability in the use of short-term debt.
0.00
0.50
1.00
1.50
2.00
2.50
2008 2009 2010 2011 2012 2013 2014 2015
Medians of debt to equity ratio for whole sample and subsamples by company
size in the period 2008-2015
whole sample median small company median
medium-sized company median large company median

63rd International Scientific Conference on Economic and Social Development – "Building Resilient Society" - Zagreb, 11-12 December, 2020
87
Figure 6: Medians of long-term debt ratio for whole sample and subsamples by company size
in the period 2008-2015
(Source: Author’s work according to (FINA, 2017) data)
Figure 7: Medians of long-term debt to equity ratio for whole sample and subsamples by
company size in the period 2008-2015
(Source: Author’s work according to (FINA, 2017) data)
Taking into account the indications of company financing, based on the median values of the
financial leverage index greater than 1 in the entire analyzed period and for all (sub)samples of
companies, it can be concluded that for companies in activity division G47 is more profitable
to finance with borrowed capital. However, given the identified continuity of decline of the
median of the mentioned index in the observed period, the stated profitability is constantly
weakening, ie for analyzed companies it pays less and less to finance by borrowing. In
particular, the median value of the financial leverage index in the period from 2008 to 2015
falls for the whole sample, the subsample of small companies and the subsample of medium-
sized companies from 2.63 to 1.19, and for the subsample of large companies from 2.64 to 1.
15 (in 2014) and 1.17 (in 2015), respectively. The negative trend of the median financial
leverage index, which suggests a decreasing profitability of debt financing, potentially explains
the trend of the debt to equity ratio in the direction of relatively increasing equity financing
versus debt financing, ie financing by short-term and long-term liabilities.
0.00
0.10
0.20
0.30
0.40
2008 2009 2010 2011 2012 2013 2014 2015
Medians of long-term debt ratio for whole sample and subsamples by company
size in the period 2008-2015
whole sample median small company median
medium-sized company median large company median
0.00
0.10
0.20
0.30
0.40
0.50
0.60
2008 2009 2010 2011 2012 2013 2014 2015
Medians of long-term debt to equity ratio for whole sample and subsamples by
company size in the period 2008-2015
whole sample median small company median
medium-sized company median large company median

63rd International Scientific Conference on Economic and Social Development – "Building Resilient Society" - Zagreb, 11-12 December, 2020
88
The negative trend of the median leverage index, which suggests the decreasing profitability of
using other people's sources of financing, potentially explains the trend of the ratio of (total)
debt and equity in the direction of relatively increasing equity financing versus other people's
financing, ie financing short-term and long-term liabilities.
Figure 8: Medians of financial leverage index for whole sample and subsamples by company
size in the period 2008-2015
(Source: Author’s work according to (FINA, 2017) data)
4.2. Results of horizontal financial structures analysis
In the context of the horizontal financial structure, Figure 9 and Figure 10 show the movements
of median of the coverage ratio l I and coverage ratio II, and Figure 11 and Figure 12 show
movements of the median values of the current ratio and quick ratio of all companies in activity
division G47, as well as of subsamples of companies by size, for period from 2008-2015. From
the above figures it can be seen that the annual median values and trends of the coverage ratios
I and II, and that of current ratio and quick ratio are independent of the (sub)samples of the
companies throughout the observed period. Coverage ratios I and II demonstrate the movement
of medial values in the range from 0.61 to 0.83 and from 1.04 to 1.26 respectively, for the whole
sample and the subsample of small companies, with only slight differences for subsamples of
medium-sized companies (from 0.60 to 0.83 and from 1.03 to 1.26, respectively) and large
companies (from 0.59 to 0.82 and from 1.02 to 1.25, respectively). The medians of the current
ratio and the quick ratio in the observed period for the whole sample and subsample of small
companies range between 1.01 and 1.07 and between 0.44 and 0.50, respectively, for the
subsample of medium-sized companies between 1.11 and 1.28 and between 0.51 and 0.60,
respectively, and for the subsample of large companies between 0.75 and 1.02 and between
0.33 and 0.50, respectively. The trends of all four indicators have an U-shape, which is more
pronounced for the coverage ratios than for the current ratio and the quick ratio. In more detail,
the trends of coverage levels are characterized by degressions to and reaching the minimum of
annual medians in 2012 and progression and reaching the maximum of the same in 2015 and
2008, respectively. Median values of coverage ratio I show that 50% of companies in activity
division G47 in the whole reference period finance their fixed assets mainly by equity. In
addition to the previous, the median values of the coverage ratio II throughout the entire period
indicate that 50% of the companies in the activity division G47 realize a surplus of net working
capital, ie short-term assets financed long-term. The medians of the current ratio and the quick
ratio, as a kind of norms of the horizontal financial structure, confirm the results of the coverage
ratios, further shedding light on the connection between the parts of active and passive.
0.000.400.801.201.602.002.402.80
2008 2009 2010 2011 2012 2013 2014 2015
Medians of financial leverage index for whole sample and subsamples by
company size in the period 2008-2015
whole sample median small company median
medium-sized company median large company median

63rd International Scientific Conference on Economic and Social Development – "Building Resilient Society" - Zagreb, 11-12 December, 2020
89
These suggest that medially observed relatively small part of current assets are financed from
quality long-term sources of finance, ie that inventories as opportunely determined permanent
part of current assets are mostly financed from short-term sources, and only to a lesser extent
from quality long-term sources. Given the preference for the coverage ratio I to be as close as
possible to the value of 1, and the coverage ratio II to be more than 1 (Žager et al., 2008), it can
be stated that the medial coverage of fixed assets with equity (coverage ratio I) and with equity
increased by long-term liabilities (coverage ratio II) is satisfactory in the entire observed period.
However, respecting the reference frame that current ratio is at least 2 and quick ratio is at least
1, medians of current ratio and quick ratio achieved achieved at levels below the reference,
reveal that the horizontal financial structures of companies in the activity division G47 do not
follow golden rules of financing. In other words, medially observed, the horizontal financial
structures, ie working capital management strategies, of the companies in question can be
characterized as relatively aggressive. The stated aggressiveness is most pronounced for a large
companies, followed by small companies, and finally medium-sized companies.
Figure 9: Medians of coverage ratio I for whole sample and subsamples by company size in
the period 2008-2015
(Source: Author’s work according to (FINA, 2017) data)
Figure 10: Medians of coverage ratio II for whole sample and subsamples by company size in
the period 2008-2015
(Source: Author’s work according to (FINA, 2017) data)
0.00
0.20
0.40
0.60
0.80
1.00
2008 2009 2010 2011 2012 2013 2014 2015
Medians of coverage ratio I for whole sample and subsamples by company size
in the period 2008-2015
whole sample median small company median
medium-sized company median large company median
0.00
0.50
1.00
1.50
2008 2009 2010 2011 2012 2013 2014 2015
Medians of coverage ratio II for whole sample and subsamples by company size
in the period 2008-2015
whole sample median small company median
medium-sized company median large company median

63rd International Scientific Conference on Economic and Social Development – "Building Resilient Society" - Zagreb, 11-12 December, 2020
90
Figure 11: Medians of current ratio for whole sample and subsamples by company size in the
period 2008-2015
(Source: Author’s work according to (FINA, 2017) data)
Figure 12: Medians of quick ratio for whole sample and subsamples by company size in the
period 2008-2015
(Source: Author’s work according to (FINA, 2017) data)
4.3. Results of probability of financial distress analysis
As shown in Figure 13, the median values of the Altman z-score (whole sample and subsample
of small companies: 0.35–1.15; subsample of medium-sized companies: 0.32–0.15; subsample
of large companies: 0, 01-1,12) ) in all observed years and for all companies in general as well
as for individual subsamples of companies according to ther size warn of the danger of
bankruptcy or classify companies in the gray zone, which is characterized by the attribute that
the companies in the same are neither stable nor on the verge of bankruptcy. Despite the
identified dangers of financial difficulties, ie bankruptcy, median values of Altman's z-score
point to a positive trend at the end of the observed period.
0.00
0.10
0.20
0.30
0.40
0.50
0.60
0.70
2008 2009 2010 2011 2012 2013 2014 2015
Medians of quick ratio for whole sample and subsamples by company size in the
period 2008-2015
whole sample median small company median
medium-sized company median large company median
0.00
0.20
0.40
0.60
0.80
1.00
1.20
1.40
2008 2009 2010 2011 2012 2013 2014 2015
Medians of current ratio for whole sample and subsamples by company size in
the period 2008-2015
whole sample median small company median
medium-sized company median large company median

63rd International Scientific Conference on Economic and Social Development – "Building Resilient Society" - Zagreb, 11-12 December, 2020
91
Figure 13: Medians of Z-Score for whole sample and subsamples by company size in the
period 2008-2015
(Source: Author’s work according to (FINA, 2017) data)
5. DISCUSSION AND CONCLUSION
Conclusion of the analysis of financial structures of companies in the retail trade, except trade
in motor vehicles and motorcycles in the Republic of Croatia in the period 2008-2015 it can be
synthesized from the aspect of the overall vertical financial structure of passive, from the aspect
of the vertical financial structure of the part of the passive, specifically its long-term part, ie the
capital structure, and in the context of the horizontal financial structure. Additionally, based on
the determined probability of financial distress, their adequacy is potentially assessed. Through
the prism of the overall vertical financial structure of passive, and based on the debt ratio, equity
ratio and the debt to equity ratio, a high level of total company indebtedness is determined with
a decreasing trend from the middle of the period, and in the context of debt to equity ration, in
continuity from the beginning of the period The increase in the conservatism of overall vertical
financial structures of passcive can potentially be provoked by a decrease in productivity and
an increase in market power in the relevant activity division in the observed period. In a
narrower sense, based on the long-term debt ratio and the long-term debt to equity ratio, it can
be stated the existence of a, medially observed, relatively conservative capital structure in which
the share of equity dominates over the share of long-term debt. In other words, a relatively low
intensity of the use of financial leverage is identified, accentuated, according to the financial
leverage index, by the fact of reducing its profitability in the analyzed period. Given the more
pronounced conservatism of small companies compared to medium-sized and large companies
in this activity division, the capital structure, ie the use of financial leverage of small companies
can be assessed as extremely conservative, and those of medium-sized companies and large
companies as extremely conservative to conservative. Also, the persistence of the identified
capital structure throughout the observed period is evident, which is why it can potentially be
considered an inherent characteristic of the relevant division of activity. This also indicates that
the variability in the indicators of the overall vertical financial structure of the passive is
obviously dominantly potentiated by the relative variability in short-term debt financing. In the
context of horizontal financial structure, despite the identified marginally satisfactory coverage
ratios, based on the current ratio and the quick ratio, it is determined that the horizontal financial
structures of companies in the activity division G47 do not follow the golden rules of financing.
In other words, medially observed, the horizontal financial structures, ie working capital
management strategies, of the companies in question can be characterized as relatively
aggressive.
0.00
0.20
0.40
0.60
0.80
1.00
1.20
2008 2009 2010 2011 2012 2013 2014 2015
Medians of Z-Score index for whole sample and subsamples by company size in
the period 2008-2015
whole sample median small company median
medium-sized company median large company median

63rd International Scientific Conference on Economic and Social Development – "Building Resilient Society" - Zagreb, 11-12 December, 2020
92
The stated aggressiveness is most pronounced for a large companies, followed by small
companies, and finally medium-sized companies. Finally, although generally unfavorable, the
indicator of probability of financial distress show a positive trend from the middle of the period,
which, without further analysis, can be roughly provoked by the adequacy of financial
structures of companies in retail trade, except of motor vehicles and motorcycles.
LITERATURE:
1. Bogdan, S., Bareša, S. & Hađina, V., (2019). Testiranje primjenjivosti Altmanovog Z-score
modela za predviđanje stečaja u Republici Hrvatskoj. Notitia - časopis za ekonomske,
poslovne i društvene teme, 5.
2. Brigham, E.F. & Ehrhardt, M.C., (2011). Financial Management: Theory and Practice 13th
ed., Mason, OH: South-Western Cengage Learning.
3. Burtchett, F.F. & Hicks, C.M., (1948). Corporation Finance H. and B. Publishers, ed., New
York.
4. FINA, (2017). Baza podataka FINA-e.
5. Kovačević, Z. & Vuković, K., (2006). Performanse poduzeća u hrvatskom sektoru
informacijsko-komunikacijske tehnologije (ICT). Ekonomska misao i praksa, 15(2),
pp.217–240.
6. Martin, J.D., Keown, A.J., Petty, W.D. & Scott, D.F., (1974). Basic Financial Management,
New Jersey: Prentice Hall, Inc, Englewood Cliffs.
7. Orsag, S., (2015). Poslovne financije S. Andrašić, ed., Zagreb: Avantis: Hrvatska udruga
financijskih analitičara.
8. Orsag, S., (2018). Vrijednosni papiri, Sarajevo: Revicon d.o.o.
9. Tipurić, D., Kolaković, M. & Dumičić, K., (2002). Istraživanje promjena u koncentraciji
hrvatske bankarske industrije 1993.-2000. Ekonomski pregled, 53(5–6), pp.470–494.
10. Vlada Republike Hrvatske, (2020). Zakon o računovodstvu, Republika Hrvatska:
https://www.zakon.hr/z/118/Zakon-o-ra%C4%8Dunovodstvu.
11. Žager, K., Mamić Sačer, I., Sever, S. & Žager, L., (2008). Analiza financijskih izvještaja
2nd ed., Zagreb: MASMEDIA.

63rd International Scientific Conference on Economic and Social Development – "Building Resilient Society" - Zagreb, 11-12 December, 2020
93
DO CAUSAL AND EFFECTUAL APPROACHES TO
ENTREPRENEURSHIP EQUALLY DRIVE THE CREATION OF
SOCIAL CAPITAL? A THEORETICAL EXAMINATION
Mihaela Mikic
The Faculty of Economics & Business, University of Zagreb
Trg J.F. Kennedy 6, Zagreb, Croatia
Tin Horvatinovic
The Faculty of Economics & Business, University of Zagreb
Trg J.F. Kennedy 6, Zagreb, Croatia
Martina Dronjak
IN2 d.o.o.
Josipa Marohnića 1/1, Zagreb, Croatia
ABSTRACT
Social capital has been extensively studied in the past decades using various approaches
applied to different conceptual levels. The importance of this concept in the scientific literature
has grown because scholars recognized that it is, alongside physical and human capital, a vital
resource for various economic actors. Despite it being highly studied in different social
sciences, in example within economics, social capital has yet to be fully explored in
entrepreneurship studies. In parallel to the development of the theory of social capital, a new
view of the entrepreneurial process emerged in the last two decades and its recognition is still
growing. This view is called effectuation and it proposes affordable loss, strategic alliances,
exploitation of contingencies and controlling the future as principles that entrepreneurs
comply. In contrast to this view stands causation, what can be called a textbook approach,
which highlights the principles of expected returns, competitive analyses, exploitation of
preexisting knowledge and prediction of the future. This study aims to answer the question
which of these above-mentioned approaches is more contributive in the creation of social
capital by utilizing a model of social capital developed in the management literature. In this
model, social capital consists of three dimensions; structural, relational and cognitive. By
examining an entrepreneur at an individual level, this study puts forward a proposition that
entrepreneurs that adopt an effectual approach should have a more developed base of social
capital than entrepreneurs that are using a causal approach. The proposition is empirically
testable and future research is called for in order to validate or discredit it.
Keywords: causation, effectuation, social capital
1. INTRODUCTION
The concept of social capital has a long history dating back to the beginning of classical science
texts and has become a popular research theme in recent decades (Akçomak, 2011) used in both
developed and developing countries (Gannon and Roberts, 2020) as a solution of a diversified
set of problems. According to classical economists, land, labor and physical capital were the
only three assets that generate income and foster economic growth (Aghajanian, 2012). Becker
(1962) pointed to the importance of human capital, that was also added to the previous mix.
After physical and human capital, social capital has been introduced into economic analysis as
a third and equally important type of capital that provides tools and training to enhance

63rd International Scientific Conference on Economic and Social Development – "Building Resilient Society" - Zagreb, 11-12 December, 2020
94
productivity (Aghajanian, 2012). There are multiple benefits it can provide, among which are
“influencing professional success, helping workers in the job search, facilitating the exchange
of resources between units, stimulating innovation, intellectual capital creation and the
efficiency of multidisciplinary teams, reducing the rotation of employees and support the
creation of start-ups, and strengthening relations with suppliers, regional network production
and inter-organizational learning” (Bueno et al., 2004). Putnam (2000) stated that the core idea
of social capital theory is that social networks have value and that social contacts affect the
productivity of individuals and groups just as physical and human capital do. What
distinguishes social capital from the other two sorts is that it is a fragile, hardly transferable,
less tangible resource embedded in the connections between actors (Akçomak, 2011). There
have been a plethora of empirical studies on the formation of social capital in the context of
societies and communities (Poder, 2011), but in the domain of entrepreneurship, there is more
room for improvement. Meaning that although there have been studies that focus on social
capital in the entrepreneurial context (e. g. Barr, 2000) and how it affects the formation of firms
(Svendsen and Svendsen, 2004; Walker et al., 1997), this still not a completely understood.
This study aims to move this area of entrepreneurial research forward by proposing a model of
a new antecedent of social capital creation, namely effectuation. It can be said that effectuation
and causation are two dominant entrepreneurial logics found in the literature today (Sarasvathy,
2001; Sarasvathy and Dew, 2005). By using and analyzing their postulates and processes a new
proposition for further empirical examinations is put forward. Specifically, that entrepreneurs
that predominantly use an effectual approach should have a more developed base of social
capital. The remainder of the paper is structured as follows. The next section (2) displays
various ways of defining social capital, section 3 builds up a theoretical basis for integrating an
effectuation approach to social capital formation. The last section (4) provides the concluding
remarks.
2. DEFINING SOCIAL CAPITAL
Social scientists have offered numerous definitions of social capital and categorized them by
whether the focus was on the relationship between external stakeholders or the relationships
characterized by the internal structure of an organization (Adler and Kwon, 2000). Table 1
displays definitions, listed chronologically, of social capital by a couple of influential authors
in the field.
Table following on the next page

63rd International Scientific Conference on Economic and Social Development – "Building Resilient Society" - Zagreb, 11-12 December, 2020
95
Table 1: Definitions of social capital Authors Definition
Bourdieu (1986) “The aggregate of the actual or potential
resources which are linked to possession of a
durable network of more or less institutionalized
relationships of mutual acquaintance or
recognition”.
Baker (1990) “Resource that stakeholders derive from specific
social structure and then use to pursue their
interests”.
Coleman (1990) “Social capital is defined by its function. It is not
a single entity, but a variety of different entities
consisting of some aspect of social structure or
they enable certain actions of individuals who are
within the structure”.
Fukuyama (1995) “The ability of people working together for
common purpose in groups and organizations”.
Putnam (1995) “Features of social organization such as
networks, norms and social trust that facilitate
coordination and cooperation for mutual benefit”.
Inglehart (1997) “A culture of trust and tolerance”.
Nahapiet and Ghoshal (1998) “The sum of the actual and potential resources
embedded within, available through, and derived
from the network of relationships possessed by an
individual or social unit. Social capital thus
comprises both the network and the assets that
may be mobilized through that network”.
Portes (1998) “The ability of stakeholders to secure benefits by
virtue of membership in social networks or other
social structures”.
Ostrom (2000) “The shared knowledge, understandings, norms,
rules and expectations about patterns of
interactions that groups of individuals bring to a
recurrent activity”.
Lin (2001) “Resources embedded in social networks and
accessed and used by stakeholders for actions.
Thus, the concept has two important components:
(1) it represents resources embedded in social
relations rather than individuals, and (2) access
and use of such resources reside with the actors”.
Source: compilation from authors
One can see, from the above-displayed definitions, that social capital is a multifaceted concept
and that various points of view can be taken when examining it. One point of view, e. g. Baker
(1990), focuses on external links between actors, while another view, e. g. Fukuyama (1995),
emphasizes internal links between actors. The third approach, the one taken in this article, is
more flexible than the previous two with regards to linkages between actors because it can be
applied on examining internal of external links between actors (Adler and Kwon, 2002).
Furthermore, since this article is concerned with the creation of firms, a definition of social
capital is adopted that was devised to fit the context of firms. So, the definition by Nahapiet and
Ghoshal (1998), as well as their overall approach, is utilized in this study. It is useful to mention
that it is the most used approach in management research on the topic of social capital
(Akçomak, 2011).

63rd International Scientific Conference on Economic and Social Development – "Building Resilient Society" - Zagreb, 11-12 December, 2020
96
Their approach is compatible with a knowledge-based view of the firm and was built for the
purpose of explaining how intellectual capital is created. They identify three dimensions of
social capital: structural, cognitive and relational. This model is displayed in picture 1. Before
examining these three dimensions, Nahapiet and Ghoshal (1998) approach needs to be clarified
on one additional point. Even though their model can accompany both internal and external
views of social capital, this does not mean that it is trying to integrate all definitions presented
in table 1 into one all-encompassing definition. An explicit statement about this has been made
by the authors in which they say that in their view social capital consists of the networks
themselves and the resources that can be used from those networks. On this point they do not
agree with some authors and their definitions given in table 1, for instance with Coleman (1990)
because he only asserts the structure of networks as comprising social capital. By using a more
elaborate view of social capital, their model is more in line with Putnam (1995) and Bourdieu
(1986) (Nahapiet and Ghoshal, 1998).
Figure 14: Dimensions of social capital
Source: Nahapiet and Ghoshal (1998)
2.1. Structural dimension
The structural dimension of social capital is concerned with the structure of non-personal links
(networks) between various actors on different levels (e. g. individual, group or organization).
It looks at a network in its entirety and examines how actors can explore networks for successful
actions (Nahapiet and Ghoshal, 1998). One can easily see that this dimension corresponds to
the network dimension of other authors (e. g. Putnam, 1995), which is considered a crucial
dimension of social capital (Adler and Kwon, 2000). This makes this dimension almost non-
controversial in the formation of social capital. However, what facets of the structural
dimension are conducive to creating value can be debated. Nahapiet and Ghoshal (1998) in their
model include network ties (channels inside networks that are used for information
distribution), network configurations (easiness of the flow of information impacted by density,
connectivity, and hierarchy of the network) and appropriable organizations (degree of social
capital transferability).
2.2. Relational dimension
While the structural dimension was primarily focused on positions of actors in networks and
ways of the flow of information, the relation dimension seeks to investigate what conditions are
conducive for the participation of economic actors. The relationships between actors are
important in the sense that they enable them to create and leverage resources (Nahapiet and

63rd International Scientific Conference on Economic and Social Development – "Building Resilient Society" - Zagreb, 11-12 December, 2020
97
Ghoshal, 1998). This dimension is another well-established aspect of social capital, however,
multiple constituents fall under this category that are sometimes analyzed separately (Adler and
Kwon, 2000). According to Nahapiet and Ghoshal (1998), the relational dimension consists of
trust (willingness of actor participation), norms (reached consensus between actors), obligations
(levels of commitment between actors) and identification (the degree to which an actor is to
identify with other actors).
2.3. Cognitive dimension
The above two mentioned dimensions can be found, in some form, in most studies where
defining social capital was one of the goals of the study. This is not the case with the cognitive
dimension and it was a contribution to the literature that had its roots in management theory
(Nahapiet and Ghoshal, 1998). The cognitive dimension can fall under the concept of beliefs
(Adler and Kwon, 2000) where mutual understanding and shared meaning plays a vital role in
enhancing communication between economic actors. Shared codes and language (gain access
to information by mutual understanding) and shared narratives (gain access to information
through stories and metaphors) constitute the cognitive dimension (Nahapiet and Ghoshal,
1998). Having described them, the question becomes what are the antecedents of these
dimensions of social capital? In other, what sets the conditions for social capital creation using
the model proposed by Nahapiet and Ghoshal (1998)? One possible answer the authors
themselves give in a possible feedback effect of intellectual capital. In other words, social
capital creates intellectual capital which then creates social capital. This study develops a new
model where effectuation affects social capital creation more than the causation approach. In
the next chapter, the rationale for this model is displayed.
3. INTEGRATING ENTREPRENEURIAL LOGIGS WITH SOCIAL CAPITAL
Causation and effectuation are two dominant underlying logics that govern the actions of
entrepreneurs. However, they are opposite from one another in their overall approach and
underlying principles (Sarasvathy, 2001). In using a causation approach, the entrepreneur starts
with an effect that is desired and gathers resources to achieve that predetermined effect. Four
principles are in the background guiding this process, namely expected returns, competitive
analysis, exploitation of preexisting knowledge and controlling an unpredictable future
(Sarasvathy, 2001). This means that entrepreneurs use profit maximization methods to evaluate
future predictions in a venture where current knowledge is the base of competitive advantage
that is mostly maintained by analyzing and outperforming the competition in the already
existing market. Expressed as a process, an entrepreneur first identifies a business opportunity
then develops a (business) plan to exploit the opportunity by working out and creating a solution
for the found market needs which is possible through resource acquisition procedures (Fisher,
2012). In contrast, with an effectual approach, an entrepreneur starts with resources that are at
his disposal (his personal characteristics) to narrow down and determine the desired effect. As
was with causation, four principles are key in effectuation. These four are affordable loss,
strategic alliances, exploitation of contingencies and controlling an unpredictable future
(Sarasvathy, 2001). Therefore, by concentrating on features of the future that are under the
control of the entrepreneur, he/she is able to create a business opportunity by using other firms
as allies in developing products and/or services through experimentation where affordable loss
is the guiding method and where unexpected events are not trying to be avoided. In the process
view, an entrepreneur makes a list of things he/she can do which is a result of personal
examination. Then he/she interacts with people in their surroundings to create stakeholder
commitments, out of which new means and goals flow ultimately leading to the creation of a
new market (Sarasvathy and Dew, 2005). These approaches can be applied at the individual
level and the level of the firm, the same as was the case in the model developed by Nahapiet

63rd International Scientific Conference on Economic and Social Development – "Building Resilient Society" - Zagreb, 11-12 December, 2020
98
and Ghoshal (1998). In this study, the individual level is chosen, or more specifically the focus
is what has occurred once the pre-venture phase is completed. In other words, when the firm is
founded do levels of social capital vary between entrepreneurs that predominantly utilized a
more causal approach and entrepreneurs that predominantly utilized a more effectual approach?
From the examination of the theoretical postulates of both causation and effectuation
approaches to entrepreneurship reasons can be given for the expectation that if an entrepreneur
uses a more effectual approach he/she will have higher levels of social capital at the moment
that the firm is founded. Firstly, adopting an effectual approach is more in line with the first
dimension of social capital (Nahapiet and Ghoshal, 1998), that is the structural dimension. This
dimension looks at the network in its entirety. An effectual entrepreneur should have a more
developed network of individuals and/or firms since he/she is actively trying to collaborate with
them to narrow down the characteristics of the product and/or service. Sarasvathy (2001) stated
that the firm, when established, is just a residual of network creation. This is not to say that the
causal entrepreneur does not create a network of stakeholders because he/she does. But relative
to the effectual entrepreneur, the causal entrepreneur does not emphasize network creation as
much. Secondly, improving the relational dimension of social capital is more compatible with
an effectual view. Although there are multiple facets of the relational dimension, here the focus
is on trust. Commitments between entrepreneurs with a more effectual approach and the
partners are more likely to be based on trust (Reymen et al., 2015). Furthermore, it seems that
effectual entrepreneurs even tend to over-trust (Goel and Karri, 2006). Therefore, an effectual
approach is more congruent with the relation dimension. Finally, the cognitive dimension of
social capital needs to be addressed. Again, this dimension is more in line with effectuation.
However, the theoretical principles of this dimension have not been explored or empirically
tested within the causation-effectuation framework. Nevertheless, it is possible to infer from
the mentioned process of effectuation that the entrepreneur is trying to establish a community
where members are aligned to achieve similar purposes. Communities are built upon, among
other things, a common language and understanding (Prusak and Lesser, 2004). So, when a
community in the business context is observed, it is likely that it is established on effectuation
principles. In order to maintain that community, shared language and meaning are vital. As a
result, an entrepreneur that used a more effectual approach is more likely to have shared
language and meaning with others in the community, concepts that are facets of the cognitive
dimension. In accordance with all of the above mentioned, a detailed proposition is put forward.
Proposition: entrepreneurs that dominantly employ an effectual approach in the process of
creating a firm will have higher levels of social capital at the time the firm is founded in
comparison to entrepreneurs that dominantly adopt a more causal approach in the process of
creating a firm.
4. CONCLUSION
Social capital is a rich and broad concept that has been studied for decades in many different
contexts. However, in its entirety, it is yet to be fully explored in an entrepreneurship setting.
This study aims to push the research forward by postulating a theoretical model by means of
synthesizing social capital with two dominant entrepreneurial logics, causation and
effectuation. By comparing the three dimensions of social capital in the model developed by
Nahapiet and Ghoshal (1998) with the principles and processes of causation and effectuation,
a proposition was made that entrepreneurs that are more effectually oriented should have higher
levels of social capital at the point that the firm is established. This a theoretical proposition
and a call for future studies to empirically investigate. In addition to empirical testing, future
studies could further strengthen the proposed model of this study by associating the principles
and processes of causation and effectuation with all the facets listed in Nahapiet and Ghoshal

63rd International Scientific Conference on Economic and Social Development – "Building Resilient Society" - Zagreb, 11-12 December, 2020
99
(1998). The reason is that currently there does not exist a strong enough basis for connecting
all the facets of the three dimensions of social capital with both causal and effectual approaches
to entrepreneurship. When new findings regarding this topic emerge in the literature, future
studies could incorporate them into the theoretical basis of this study. These theoretical
considerations, with addition to empirical testing, could improve our understanding of social
capital creation in an entrepreneurial framework and open the doors for other interesting
avenues of research.
LITERATURE:
1. Adler, P. and Kwon, S.-W. (2000). Social capital: The good, the bad, and the ugly. In:
Lesser, E. (Ed.), Knowledge and Social Capital: Foundations and Applications. Boston:
Butterworth-Heinemann, pp. 89-115.
2. Adler, P. and Kwon, S.-W. (2002). Social Capital: Prospects for a New Concept. The
Academy of Management Review, 27(1), pp. 17-40.
3. Aghajanian, A. (2012). Social Capital and Conflict. HiCN Working Paper 134. Available
at: https://www.researchgate.net/publication/235443868_Social_Capital_and_Conflict
4. Akçomak, S. (2011). Social Capital of Social Capital Researchers. Review of Economics
and Institutions, 2(2), pp. 1-28.
5. Baker, W. (1990). Market Networks and Corporate Behavior. American Journal of
Sociology, 96(3), pp. 589-625.
6. Barr, A. (2000). Social capital and technical information flows in the Ghanaian
manufacturing sector. Oxford Economic Papers, 52(3), pp. 539-559.
7. Becker, G. (1962). Investment in Human Capital: A Theoretical Analysis. Journal of
Political Economy, 70(5), pp. 9-49.
8. Bourdieu, P. (1986). The forms of capital. In: Richardson, J.G. (Ed.), Handbook of Theory
and Research for the Sociology of Education. New York: Greenwood Press, pp. 241-258.
9. Bueno, E., Salmador, M. and Rodríguez, Ó. (2004). The role of social capital in today’s
economy: Empirical evidence and proposal of a new model of intellectual capital. Journal
of Intellectual Capital, 5(4), pp. 556-574.
10. Coleman, J. (1990). Foundations of social theory. Cambridge: Harvard University Press.
11. Fisher, G. (2012). Effectuation, Causation, and Bricolage: A Behavioral Comparison of
Emerging Theories in Entrepreneurship Research. Entrepreneurship Theory and Practice,
36(5), pp. 1019-1051.
12. Fukuyama, F. (1995). Social Capital and the Global Economy. Foreign Affairs, 74(5), pp.
89-103.
13. Gannon, B. and Roberts, J. (2020). Social capital: exploring the theory and empirical divide.
Empirical Economics, 58(3), pp. 899-919.
14. Goel, S. and Karri, R. (2006). Entrepreneurs, Effectual Logic, and Over-Trust.
Entrepreneurship Theory and Practice, 30(4), pp. 477-493.
15. Inglehart, R. (1997). Modernization and postmodernization: cultural, economic, and
political change in 43 societies. Princeton: Princeton University Press.
16. Prusak, L. and Lesser, E. (2004). How to invest in social capital. Harvard business review,
79(6), pp. 86-93.
17. Lin, N. (2001). Social capital: a theory of social structure and action. New York:
Cambridge University Press.
18. Nahapiet, J. and Ghoshal, S. (1998). Social Capital, Intellectual Capital, and the
Organizational Advantage. Academy of Management Review 23(2), pp. 242-266.
19. Ostrom, E. (2000). Social Capital: A Fad or a Fundamental Concept. In: Dasgupta, P.,
Serageldin, I. and Weltbank (Eds.), Social Capital: A Multifaceted Perspective.
Washington: World Bank, pp. 172-214.

63rd International Scientific Conference on Economic and Social Development – "Building Resilient Society" - Zagreb, 11-12 December, 2020
100
20. Poder, T. (2011). What is Really Social Capital? A Critical Review. The American
Sociologist, 42(2), pp. 341-367.
21. Portes, A. (1998). Social Capital: Its Origins and Applications in Modern Sociology. Annual
Review of Sociology, 24(1), pp. 1-24.
22. Putnam, R. (2000). Bowling alone: the collapse and revival of American community. New
York: Simon & Schuster.
23. Putnam, R. (1995). Bowling Alone: America’s Declining Social Capital. Journal of
Democracy, 6(1), pp. 65-78.
24. Reymen, I., Andries, P., Berends, H., Mauer, R., Stephan, U. and van Burg, E. (2015).
Understanding Dynamics of Strategic Decision Making in Venture Creation: A Process
Study of Effectuation and Causation. Strategic Entrepreneurship Journal, 9(4), pp. 351-
379.
25. Sarasvathy, S. (2001). Causation and Effectuation: Toward a Theoretical Shift from
Economic Inevitability to Entrepreneurial Contingency. Academy of Management Review
26(2), pp. 243-263.
26. Sarasvathy, S. and Dew, N. (2005). New market creation through transformation. Journal
of Evolutionary Economics, 15(5), pp. 533-565.
27. Svendsen, G. and Svendsen, G. (2004). The creation and destruction of social capital:
entrepreneurship, co-operative movements, and institutions. Cheltenham: Edward Elgar.
28. Walker, G., Kogut, B. and Shan, W. (1997). Social Capital, Structural Holes and the
Formation of an Industry Network. Organization Science, 8(2), pp. 109-125.

63rd International Scientific Conference on Economic and Social Development – "Building Resilient Society" - Zagreb, 11-12 December, 2020
101
JOB SEARCH - INFORMATION ON POSSIBILITIES OF JOB
APPLICATION IN THE ENVIRONMENT OF MARGINALIZED ROMA
COMMUNITIES IN SLOVAKIA
Erik Satara
Constantine the Philosopher University in Nitra, Faculty of Social Sciences and Health Care,
Institute of Romological Studies, Kraskova 1, 981 01 Nitra, Slovakia
Jurina Rusnakova
Constantine the Philosopher University in Nitra, Faculty of Social Sciences and Health Care,
Institute of Romological Studies, Kraskova 1, 981 01 Nitra, Slovakia
Lydia Gabcova
Constantine the Philosopher University in Nitra, Faculty of Social Sciences and Health Care,
Institute of Romological Studies, Kraskova 1, 981 01 Nitra, Slovakia
ABSTRACT
The high unemployment rate of Roma in Slovakia, which according to the European Union
Agency for Fundamental Rights (2016) is three times higher than the unemployment rate of the
majority population, is also related to the possibilities of Roma to search for information about
free job vacancies. Several studies show that people living in social exclusion have limited
access to social networks outside their immediate circle. This can have serious consequences,
as networks connecting different "social worlds" are important means by which people find a
good job. We will look at the issue from the point of view of theories of social exclusion and
social networks. The aim of our contribution is to show from what sources marginalized Roma
draw information about job opportunities. We will look at the issue from the point of view of
theories of social exclusion and social networks. We obtained research data from the project
APVV-17-0141 (questionnaire research) focused on barriers affecting the employment of
residents from marginalized Roma communities. A total of n = 677 respondents participated in
the research, number n = 222 (32,70%) out of the total of respondents were currently employed.
As the important sources of information and opportunities about the employment possibilities
in case of men and women from marginalised communities were identified social sources and
municipality offices or directly employers. The category "known" was relatively low in the
results of the mentioned research. In the context of the above mentioned theories, these findings
are interesting because they can also be interpreted as that people in a marginalized (or
spatially segregated) environment turn mainly to resources in their immediate vicinity, which
may be unemployed without information about job opportunities. This fact is also a
confirmation of the importance of the so-called formal resources.
Keywords: Employment, Marginalized Roma communities, Social exclusion, Social networks
1. INTRODUCTION
Citizens living in marginalized and segregated environments have limited access to social
resources (Laurence, 2017) and live in isolation from wider society (Cantle, 2005). In such an
environment, they have little opportunity to interact regularly outside their neighbourhood and
community (Uslaner, 2012; Lichter, 2013), which reduces their ability to form social bonds
beyond their close social environment (Semyonov, Glikman, 2009).In Slovakia, this
phenomenon affects Roma, who are one of the largest national minorities.

63rd International Scientific Conference on Economic and Social Development – "Building Resilient Society" - Zagreb, 11-12 December, 2020
102
A significant proportion of them live in so-called marginalised Roma communities, which are
spatially separated from municipalities and towns (Mušinka et all., 2014; Rusnáková,
Čerešníková, 2015).Roma living in a segregated environment have long been among the groups
of slovak citizens most at risk of social exclusion, poverty and discrimination. Various forms
of social exclusion of Roma are explained and empirical evidenced by a number of studies (e.g.
Veselovská, Pirová, 2014; Marcinčinová, 2014; Rusnáková, Rochovská, 2016; Lajčáková et
all., 2017), an important place in them is the exclusion from the labour market.For example, in
EU research MIDIS II. only 20% of Slovak Roma declared any employment, the results of this
survey show, among other things, a significant gender gap in male employment (26%) women
(14%) (FRA, 2018). The nature of the segregated environment is created by labor market
application strategies (Radičová, 2001), what jobs are available to residents of such
communities, both in terms of qualifications but also in terms of stability and financial valuation
(Hyde, 2006). Inequalities in the labor market between Roma and the rest of the population are
also 'recognized' by the European Union and set strategic objectives for Roma inclusion – one
of the four priority areas is employment. These objectives are contained in specific strategy
papers – at EU level it is the newly published new strategic framework for equality, inclusion
and Roma participation in the EU for 2020-2030.
2. JOB SEARCH THEORY
Finding suitable jobs takes time and effort for the individual, who must make a decision on how
he or she will behave when looking for a job. The job search process can be explained by the
job search theory (Berg, Uhlendorf, 2018), which says that finding work and the behavior of
people looking for work is not a unidimensional construct (Hoye, 2017) but a dynamic gradual
process in which individuals decide when to stop the process and under what conditions
(Faggian, 2014). They use two types of resources to find work:
• exogenous working information networks, that is, the place where the individuals obtained
employment information through the social structure in which they are located, and
• endogenous working information networks resulting from uncoordinated actions by the
individual (Ioanmides, Loury, 2004).
The simpler distribution of sources of job information is formal, (employment agencies,
advertising, television) and informal sources (recommendations, internet) (Sameen, 2016).
Formal sources of information on jobs affect the use of public intermediaries (Hoye, 2017).
Social networks, which are informal resources, are part of the environment in which households
and individuals operate. The most basic element of social networks is, of course, the family,
but in the context of work application there are essential contacts that connect the unemployed
(or job seekers) with the working environment, work.). Socially excluded residents have very
limited access to such social networks (Rochovská, 2011) and are reliant on formal resources.
The use of informal sources of information is associated with better results, such as a high level
of job security, while formal sources are linked to less advantageous offers. For example,
research findings conducted in the banking space show that employees hired through informal
sources indicated higher levels of job satisfaction, lower turnover and better work performance
(Sameen, 2016).
2.1. Finding work through informal channels
A special section of literature is devoted to the process of finding work through networks of
relationships and using so-called weak links (Mussida, Zanin, 2020; Brass, Borgatti, 2020). The
power of weak social ties came to the fore mainly because of the work of Granovettera (1973),
which explains it on the dissemination of information about vacancies. Ties in social networks
are divided into strong and weak, with strong relationships especially with family and loved
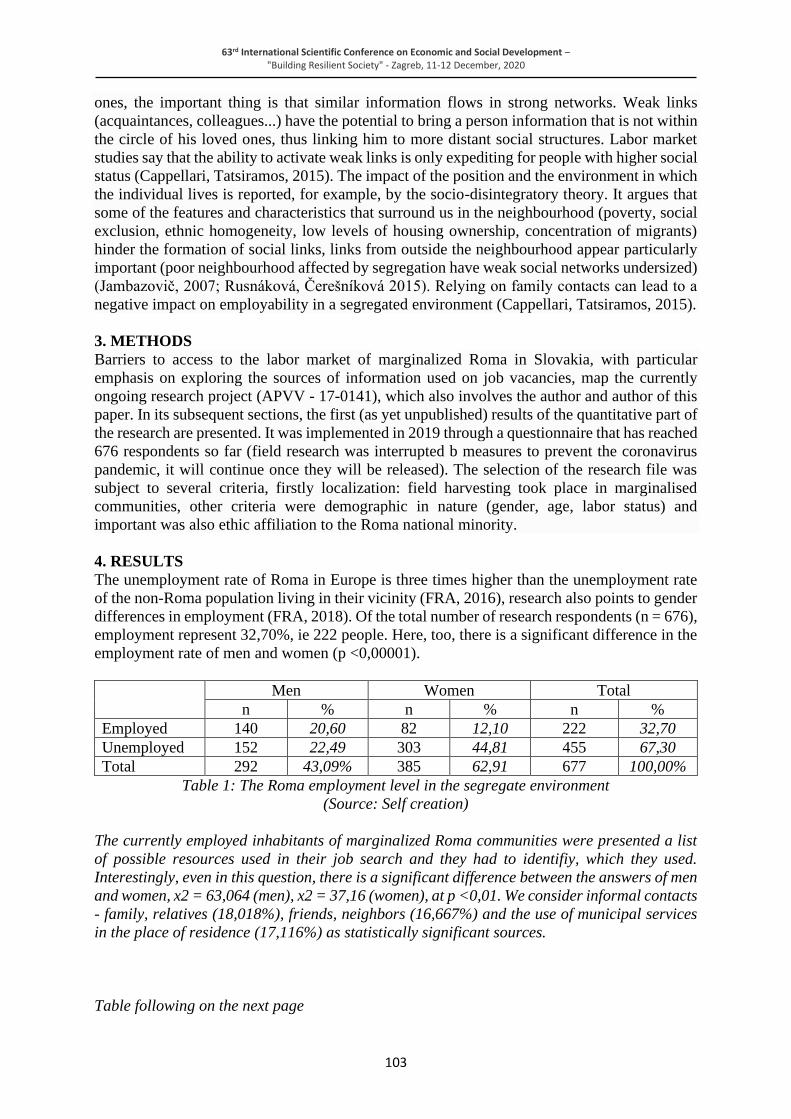
63rd International Scientific Conference on Economic and Social Development – "Building Resilient Society" - Zagreb, 11-12 December, 2020
103
ones, the important thing is that similar information flows in strong networks. Weak links
(acquaintances, colleagues...) have the potential to bring a person information that is not within
the circle of his loved ones, thus linking him to more distant social structures. Labor market
studies say that the ability to activate weak links is only expediting for people with higher social
status (Cappellari, Tatsiramos, 2015). The impact of the position and the environment in which
the individual lives is reported, for example, by the socio-disintegratory theory. It argues that
some of the features and characteristics that surround us in the neighbourhood (poverty, social
exclusion, ethnic homogeneity, low levels of housing ownership, concentration of migrants)
hinder the formation of social links, links from outside the neighbourhood appear particularly
important (poor neighbourhood affected by segregation have weak social networks undersized)
(Jambazovič, 2007; Rusnáková, Čerešníková 2015). Relying on family contacts can lead to a
negative impact on employability in a segregated environment (Cappellari, Tatsiramos, 2015).
3. METHODS
Barriers to access to the labor market of marginalized Roma in Slovakia, with particular
emphasis on exploring the sources of information used on job vacancies, map the currently
ongoing research project (APVV - 17-0141), which also involves the author and author of this
paper. In its subsequent sections, the first (as yet unpublished) results of the quantitative part of
the research are presented. It was implemented in 2019 through a questionnaire that has reached
676 respondents so far (field research was interrupted b measures to prevent the coronavirus
pandemic, it will continue once they will be released). The selection of the research file was
subject to several criteria, firstly localization: field harvesting took place in marginalised
communities, other criteria were demographic in nature (gender, age, labor status) and
important was also ethic affiliation to the Roma national minority.
4. RESULTS
The unemployment rate of Roma in Europe is three times higher than the unemployment rate
of the non-Roma population living in their vicinity (FRA, 2016), research also points to gender
differences in employment (FRA, 2018). Of the total number of research respondents (n = 676),
employment represent 32,70%, ie 222 people. Here, too, there is a significant difference in the
employment rate of men and women (p <0,00001).
Men Women Total
n % n % n %
Employed 140 20,60 82 12,10 222 32,70
Unemployed 152 22,49 303 44,81 455 67,30
Total 292 43,09% 385 62,91 677 100,00%
Table 1: The Roma employment level in the segregate environment
(Source: Self creation)
The currently employed inhabitants of marginalized Roma communities were presented a list
of possible resources used in their job search and they had to identifiy, which they used.
Interestingly, even in this question, there is a significant difference between the answers of men
and women, x2 = 63,064 (men), x2 = 37,16 (women), at p <0,01. We consider informal contacts
- family, relatives (18,018%), friends, neighbors (16,667%) and the use of municipal services
in the place of residence (17,116%) as statistically significant sources.
Table following on the next page

63rd International Scientific Conference on Economic and Social Development – "Building Resilient Society" - Zagreb, 11-12 December, 2020
104
Employed – sources of information
through which they were employed
Men Women Total
n % n % n %
Through the Labour Office 10 4,505 9 4,054 19 8,559
Through the municipal office 27 12,162 11 4,954 38 17,116
Through field social workers 2 0,900 4 1,802 6 2,702
Through an employment agency 1 0,451 7 3,153 8 3,604
Through an NGO 0 0 0 0 0 0
Directly with the employer 18 8,108 10 4,505 28 12,613
Through advertising 6 2,703 5 2,251 11 4,954
Own advertisment 1 0,451 0 0 1 0,451
Through family, relatives 22 9,910 15 6,756 37 16,666
Through acquaintaces 7 3,153 6 2,702 13 5,855
Through friends, neighbors 31 13,964 8 3,604 40 18,018
Start the busines 8 3,604 1 0,451 9 4,055
Via Internete 7 3,153 4 1,802 10 4,505
Through school 0 0 1 0,451 1 0,451
I do not remember 0 0 1 0,451 1 0,451
Total 140 63,064 82 36,936 222 100
Table 2: Employees – sources of information which they were employed
(Source: Self creation)
From the point of view of the above theories, it is important to know what are the differences
in information sources for residents living in a segregated environment compared to
respondents living in ethnically mixed and spatially integrated neighborhoods. To put it simply,
the Roma in Slovakia live in three types of housing in terms of the spatial relationship to the
majority population. The first type is segregation, where the settlement of Roma is located at
some distance from the village or town, the second type is a settlement located on the outskirts
of the village or town and the third type is spatial integration (ie when Roma families live in
ethnically mixed neighborhoods). According to the respondents, information from friends,
neighbors (10,714%) and information obtained at the municipal office (5,714%) predominate
among employed Roma men living in segregation. Roma men living on the outskirts of the
municipality draw information from the municipal office (7,143%) and from employers
(6,428%). Romani men living in spatial integration are dominated by informal sources - friends,
neighbors (7,857%), family and relatives (7,143%).
Figure following on the next page

63rd International Scientific Conference on Economic and Social Development – "Building Resilient Society" - Zagreb, 11-12 December, 2020
105
Figure 1: Working men – resources by place of living
(Source: Self cration)
Employed women from segregated Roma communities obtained information from the
municipal office (9,756%), while women living on the outskirts of the municipality are
dominated by informal sources - family, relatives (9,756%) and services of the state
employment agency - Office of Labor, Social Affairs and Family - ÚPSVaR (7,317%). Roma
women living directly in the village drew information from family, relatives (8,536%) and
employers (8,536%).
Figure 2: Employed women – resources by place of living
(Source: Self creation)
A similar question was presented to unemployed respondents in the research sample (n = 454),
they could choose the sources of information according to their experience when looking for a
job (they could use several options). Here, too, there was a significant difference between the
choices of men and women, x2 = 63,064 (men), x2 = 37,16 (women) (p <0,01). Roma men and
women from marginalized Roma communities use the services of the Labor Office of Social
Affairs and the Family (21,214%), the municipal office in the place of residence (9,888%) and
information obtained directly from employers (10,211%).
0.00%2.00%4.00%6.00%8.00%
10.00%12.00%
Employed men - resources by place of living
Farther the village Edge the village In the village
0.00%2.00%4.00%6.00%8.00%
10.00%12.00%
Employed women - resources by place of living
Farther the village Edge the village In the village

63rd International Scientific Conference on Economic and Social Development – "Building Resilient Society" - Zagreb, 11-12 December, 2020
106
Unemployed – sources of information
through which they were lokin for work
Men Women Total
n % n % n %
Throug the Labour Office 53 8,453 80 12,761 133 21,214
Through the municipal office 25 3,987 37 5,901 62 9,888
Through field social workers 5 0,797 9 1,435 14 2,232
Through an employment agency 5 0,797 6 0,957 11 1,754
Through an NGO 0 0 0 0 0 0
Directly with the employer 26 4,147 38 6,061 64 10,208
Through advertisting 24 3,828 16 2,551 40 6,379
Own advertisment 4 0,638 0 0 4 0,638
Through family, relatives 9 1,435 10 1,595 19 3,030
Through acquaitances 22 3,509 10 1,595 32 5,104
Through friends, neighbors 20 3,190 13 2,073 33 5,263
Started the busine 0 0 0 0 0 0
Via Internete 4 0,638 4 0,638 8 1,276
Personal information 0 0 1 0,159 1 0,159
The work was arranged by the mayor 0 0 1 0,159 1 0,159
Not applicable (not looking for a job) 12 1,914 31 4,944 43 6,858
No choice 32 5,104 130 20,734 162 25,838
Total 241 386 627
Table 3: Unemployed – sources of information through which the sought work
(Source: Self creation)
In terms of the spatial relationship in housing, the state ÚPSVaR appears in all three men
groups, for men living in segregation it was selected by 2,871% , for men living on the outskirts
of municipalities it was 3,190% of selections and for unemployed men living in spatial
integration 2,392% of selections.
Figure 3:Unemployed men – resources by place of living
(Source: Self creation)
For women, a relatively high percentage chose the "none" option, which probably means that
they have not yet tried to find a job. The option “none” was selected by the most elections for
women living in segregation (8,931%), then for women living in spatial integration (7,177%)
0.00%0.50%1.00%1.50%2.00%2.50%3.00%3.50%
Unemployed men - resources by place of living
Farther the village Edge the village In the village

63rd International Scientific Conference on Economic and Social Development – "Building Resilient Society" - Zagreb, 11-12 December, 2020
107
and living on the outskirts of municipalities (4,147%). Regardless of the location of residence,
information from the Labor Office dominated among unemployed women. Women living in
the village, city, still directly addressed employers (2,392%) and 2,073% responded to the
advertisement.
Figure 4: Unemployed women – resources by place of living
(Source: Self creation)
When comparing the most used resources in the groups of employed and unemployed
respondents, we find interesting differences. Employed Roma used contacts of friends
(18,018% to 5,263% for the unemployed) and families (16,667% for the employed to 3,030%
for the unemployed) to a greater extent when looking for work. The unemployed turn more to
the Labor, Social Affairs and Family Offices (21,214% for the unemployed and 8,558% for the
employed). The data also point to gender differences, with employed men making more use of
local government assistance (12,162%) than employed women (4,954%).
5. CONCLUSION
A characteristic feature of marginalized Roma communities is the high unemployment rate
(Marcičinová, 2014; Veselovská, Pirová, 2014), in our case, 67,30% of respondents were
unemployed during the survey.Poverty and social exclusion are associated with high levels of
unemployment, which causes and multiplies barriers to the employment of Roma from the
marginalized environment in the labor market and is the cause of the feeling of inferiority,
which can also manifest itself in the job search process (Lajčáková et all., 2017). Research
suggests that the worst situation is in that part of the population of marginalized communities
living in spatial segregation. For example in the 2010 UNDP survey (UNDP 2012), the lowest
employment rate was in segregated localities, but the survey also showed that the employment
rate of Roma (regardless of where they live) is significantly lower than that of the majority
population. The theory of segregation speaks of spatial concentration and social isolation,
which are related to race, place and poverty (Garrido, 2020) and shows signs of multiple
disadvantage. Living in communities and groups characterized by poverty and social exclusion
is one of the key mechanisms for transmitting inequalities. Poor households and individuals
living in poor localities with major social problems can find it very difficult to get out and
escape poverty (Džambazovič, 2007). Among other disadvantages, they also have limited
contact with the "world" outside their immediate neighborhood and their social networks are
0.00%1.00%2.00%3.00%4.00%5.00%6.00%7.00%8.00%9.00%
10.00%
Unemployed women - resources by place of living
Farther the village Edge the village In the village

63rd International Scientific Conference on Economic and Social Development – "Building Resilient Society" - Zagreb, 11-12 December, 2020
108
highly homogeneous. Job search is a self-regulatory process (Motta Veiga et al., 2018), which
summarizes the collection of data on job vacancies (Hoye, et al., 2009), so that sources of
information on job opportunities, resp. availability of these resources. When looking for a
suitable job, we use various formal and informal sources of information (Hoye et al., 2009) and
ties with other social groups (outside the immediate circle of people) are particularly important.
They are especially important in disadvantaged neighborhoods where extralocated ties can help
in finding work; on the other hand, we know that poor neighborhoods affected by segregation
and social exclusion have undersized social networks beyond the neighborhood (Džambazovič,
2007). In our article, we looked at where respondents (residents of marginalized Roma
communities) get information about job vacancies. We divided the research group into three
groups in terms of spatial location of housing in relation to the majority population: segregation
(Roma neighborhood is located at a distance from the majority), on the outskirts (Roma
neighborhood is located on the outskirts of the majority part of the municipality or city), spatial
integration (Roma the neighborhood is located in the immediate vicinity of the majority or
Roma families live in ethnically mixed neighborhoods). To some extent, we can state that the
spatial relationship with the majority proved to be significant in terms of the type of source.
Roma living in segregated localities to a greater extent turn to formal sources, specifically the
state Office of Labor, Social Affairs and Family. It is also important to note that these
respondents are probably less successful in finding work - at the time of the research they were
more often unemployed. More rarely (compared to the group of Roma living in spatial
integration with the majority) they turn to informal sources. Another interesting finding is that
employed respondents (regardless of the location of housing) - ie successful residents in the
labor market, turned to informal sources to a greater extent when looking for employment and,
conversely, the unemployed used more the Office of Labor, Social Affairs and Family. From
this point of view, this state office is proving to be less efficient in comparison with other used
resources (informal sources, employers - advertisements, local governments). Gender has also
proved to be an important indicator, women are less successful than men in the labor market
and the unemployment rate is higher for women. Our findings will be further supported by
further analysis, but they already seem to provide feedback on state support for job placement
for marginalized groups (in which considerable funds are invested) and indicate to us which job
search support strategies can be effective.
ACKNOWLEDGEMENT: This paper was created as part of the project UGA IX / 4/2020
Analysis of the conditions of labor mobility of the inhabitants of marginalized Roma
communities and the project APVV - 17-0141 Analysis of access to employment opportunities
for marginalized groups: Selected regions of Slovakia in socio-economic, geographical and
socio-anthropological perspective.
LITERATURE:
1. Berg, J. G., Uhlendorff, A. (2018). Economic Job Search and Decision-Making Models. In.
Klehe, Ch-U. – Hoof, E. (2018). The Oxford Handbook of Job Loss and Job Search. Oxford:
Oxford University Press, 2018. 615 p. Retrieved 28.10.2020 from https://books.google
.sk/books?id=FHtVDwAAQBAJ&pg=PR3&hl=sk&source=gbs_selected_pagese.
2. Brass, J. D., Borgatti, S. (2020). Social Networks at Work. 1st edition. New York :
Taylor&Francis, 2020. 392 p.
3. Cantle, T. (2005). Community Cohesion: A New Framework for Race and Diversity. 2nd
edition. London : Palgrave Macmillen, 2005. 265 p.

63rd International Scientific Conference on Economic and Social Development – "Building Resilient Society" - Zagreb, 11-12 December, 2020
109
4. Cappellari, L.,Tatsiramos, K. (2015). With a Little Help from my Friends? Quaity of Social
Networks, Job Finding and Job Match Quality. European Economic Review, 2015, vol. 78,
p. 55-75. Retrieved 29.10.2020 from https://www.researchgate.net/publication/27589787
7_With_a_Little_Help_from_My_Friends_Quality_of_Social_Networks_Job_Finding_an
d_Job_Match_Quality.
5. Džambazovič, R. (2007). Priestorové aspekty chudoby a sociálneho vylúčenia. Sociológia.
2007, vol. 39, no. 5, p. 432-458.
6. European Union Agency for Fundamental Rights. (2016). Chudoba a zamestnanosť Rómov
v 11 členských štátoch EÚ: Prieskum zameraný na Rómov – kľúcové údaje. Luxemburg :
Úrad pre vydávanie publikácii Európskej únie, 2016. 56 p.
7. European Union Agency for Fundamental Rights. (2018). Druhý prieskum Európskej únie
týkajúci sa menšín a diskriminácie Rómov – vybraté výsledky. Luxemburg : FRA, 2016. 50
p. Retrieved 2.11.2020 from. https://op.europa.eu/sk/publication-detail/-/publication/d1e
36336-3168-11e8-b5fe-01aa75ed71a1.
8. EU Roma strategic framework for equality, inclusion and participation for 2020-2030
(2020). Retrieved 10.11.2020 from https://ec.europa.eu/info/sites/info/files/union_of_equ
ality_eu_roma_strategic_framework_for_equality_inclusion_and_participation_en.pdf.
9. Faggian, A. (2014). Job Search Theory. Fisher, M. M. – Nijkamp, P. (2014). Handbook of
regional science. Heidelberg : Springer, 2014. 1732 p. Retrieved 30.10.2020 from https://
www.researc hgate.net/publication/278661248_Job_Search_Theory.
10. Garrido, M. (2020). Reconceptualizing Segregation from the Global South. City &
Community. 2020. Retrieved 29.10.2020 from https://onlinelibrary.wiley.com/doi/abs/
10.1111/cico. 12504
11. Granovetter, S. M. (1973). The Strength of Weak Ties. American Jorurnal of Sociology.
1973, vol. 78, no. 6, p. 1360-1380. Retrieved 28.10.2020 from https://edisciplinas.usp.br/
pluginfile.php/4865899/The%20Strength%20of%20Weak%20Ties.pdf.
12. Hoye, G. et all. (2009). Networking as a job search behaviour: A social network perspective.
Journal of Occupational and Organizational Psychology. 2009, vol. 82, no. 3, p. 661-682
from https://www.researchgate.net/publication/233990472Networking_as_a_job_search_
behaviour_A_social_network_perspective.
13. Hoye, G. (2017). Job Search Behavior as a Multidimensional Construct: A Review of
Different Job Search Behaviors and Sources. In. Klehe, Ch-U. – Hoof, E. (2018). The
Oxford Handbook of Job Loss and Job Search. Oxford : Oxford University Press, 2018.
615 p. Retrieved 29.10.2020 from https://books.google.sk/books?id=FHtVDwAAQBAJ&
pg=PR3&hl=sk&source=gbs_selected_pages&cad=2#v=onepage&q&f=false.
14. Hyde, A. (2006). Systematic Exclusion of Roma from Employment. Political Sciences.
2004, vol. 6, no. 1, p 3-8. Retrieved 1.11.2020 from https://www.ceeol.com/search/article-
detail?id=149926
15. Ioannides, M. Y., Loury, D. L. (2004). Job Information Networks, Neighborhood Effects,
and Inequlity. Journal of Economic Literature. 2004, vol. 42, no. 4, p 1056-1093. Retrieved
2.11.2020 from https://www.aeaweb.org/articles?id=10.1257/0022051043004595.
16. Lajčáková, J. et all.(2017). Riešenie nezamestnanoti Rómov. Bratislava : CVEK, 2017. 94
p.
17. Laurence, J. (2017) Wider-community Segregation and the Effect of Neighbourhood Ethnic
Diversity on Social Capital: An Investigation into Intra-Neigbourhood Trust in Great
Britain and London. Sociology. 2017, vol. 51, no. 5, p. 1011-1033. Retrieved 1.11.2020
from https://www.ncbi.nlm.nih.gov/pmc/articles/PMC5603975/.
18. Lichter, T. D. (2013). Integration or Fragmentation? Racial Diversity and the American
Future. Demography. vol. 50, p. 359-391. Retrieved from https://link.springer. com/article/
10.1007%252Fs13524-013-0197-1.

63rd International Scientific Conference on Economic and Social Development – "Building Resilient Society" - Zagreb, 11-12 December, 2020
110
19. Marcinčinová, Ľ. (2014). Rómovia a trh práce. Bratislava : CEIT, 2014. 29 p.
20. Mussida, CH., Zanin, L. (2020). Determinants of the Choice of Job Search Channels by the
Unemployed Using a Multivariate Probit Model. Social Indicators Research. 2020, vol. 1,
no. 52, p. 369-420. Retrieved 31.10.2020 from https://www.ncbi.nlm.nih.gov/ pmc/articles
/PMC73666 07.
21. Mušinka. A. et all. (2014). Atlas rómskych komunít na Slovensku 2013. Bratislava : UNDP,
2014. 120 p.
22. Radičová, I. (2001). Hit Sunt Romales. Bratislava : INTERLINGUA, 2001. 96 p.
23. Rochovská, A. (2011). Životné stratégie – teoretické východiská. In. Rusnáková, J. et all.
(2011). Životné stratégia obyvateľov rómskych osídlení: Zborník vedeckých štúdií. Nitra :
UKF FSVaZ, 2011. 232 p.
24. Rusnáková, J., Rochovská, A. (2014). Segregácia obyvateľov marginalizovaných rómskych
komunít, chudoba a znevýhodnenie súvisiace s priestorovým vylúčením. Geographia
Cassoviensis VIII. 2014, vol. 2, p. 162 – 172. Retrieved 2.11.2020 from http://www.humann
ageografia.sk/clanky/Rusnakova_Rochovska_tlac1.pdf.
25. Rusnáková, J., Čerešníková, M. (2015). Sociálna opora a sociálno siete marginalizovaných
Rómov: Analýza druhov sociálnej opory v sociálnych sieťach. Nitra : UKF, 2015. 133 p.
26. Sameen, S. (2016). Employ Hiring through Informal and Formal Sources of Recruitment
and Implication for Job Satisfaction and Intension to Leave. International Journal of
Innovation, Management and Technology. 2016, vol. 7, no. 6, p. 286 – 291. Retrieved
1.11.2020 from http://www.ijimt.org/vol7/688-MB00026.pdf.
27. Semyonov, M., Glikman, A. (2009). Ethnic Residential Segregation, Social Contacts, and
Anti-Minority Attitudes in European Societies. European Sociological Review. 2009, vol.
25, no. 6, p. 693-708. Retrieved 29.10.2020 from https://www.researchgate.net/publicatio
_Ethnic_Residential_Segregation_Social_Contacts_and_AntiMinority_Attitudes_in_Euro
pean_Societies.
28. Veselovská, Z., Pirová, B. (2014). Rómske okresy – nositelia sociálnych problémov.
Geographia Cassoviensis. 2014. vol. 1, p. 96-106. Retrieved 1.11.2020 from. https://uge
.science.upjssk/images/geographia_cassoviensis/articles/GC201481/07Veselovska_Pirova
29. Uslaner, M. E. (2012). Segregation and Mistrust: Diverstiy, Isolation and Social Cohesion.
Maryland : University of Maryland, 2012. p. 273. Retrieved 29.10.2020 from
https://books.google.sk/books?hl=sk&lr=&id=ZE9D890ZXgMC&oi=fnd&pg=PR7&ots=
QaDO3yaG1H&sig=hFmigzMmKKTG9JFNmARSe84YLy4&redir_esc.

63rd International Scientific Conference on Economic and Social Development – "Building Resilient Society" - Zagreb, 11-12 December, 2020
111
EVALUATION OF FINANCIAL HEALTH OF CZECH
CONSTRUCTION COMPANIES USING PREDICTION MODELS
Simona Cincalova
College of Polytechnics Jihlava
Tolstého 16, 586 01 Jihlava, Czech Republic
Jaroslav Jansky
College of Polytechnics Jihlava
Tolstého 16, 586 01 Jihlava, Czech Republic
ABSTRACT
The paper focuses on the construction industry and its evaluation using selected prediction
models, bancruptcy models. The purpose of bankruptcy models is to predict a company's default
based on an analysis of financial statements. The aim of the paper is to evaluate Czech
companies in this sector in 2010 and 2014 based on Altman's Z-score, IN95 and IN05. Based
on the calculations, it will be concluded if the compilation of Z´´ score, IN95 and IN05 models
differs from each other and if the models are influenced by whether selected indicators of
accounting units are assessed on the basis of average or median. Furthermore, the research
questions will be answered, of the results of the bancruptcy models will be more favorable in
the analyzed year 2014 for all construction companies according to the size of the accounting
entity than in 2010.
Keywords: Bancruptcy models, Construction, Czech economy
1. INTRODUCTION
Construction is one of the most dynamic sectors of the Czech economy, contributing
significantly to both employment and GDP. During the transformation, the construction
industry demonstrated the ability to adapt to market conditions, coped with changes in demand,
restructuring of the production base, increasing demands on the quality and architectural level
of construction works. The construction industry successfully follows European trends in all
construction fields. In recent years, we have seen a trend in the construction industry, with
construction output still declining to almost stagnation, as well as sales, which are declining at
a slower pace (see Figure 1). In the coming years, we can expect that this situation will not
change and this trend will continue. According to CZSO data, in 2019 construction output
increased by 2.3%. Building construction increased by 2.0% and civil engineering even by
3.4%. According to our surveys, the directors of construction companies were slightly more
optimistic and expected growth of 2.7%.
Figure following on the next page

63rd International Scientific Conference on Economic and Social Development – "Building Resilient Society" - Zagreb, 11-12 December, 2020
112
Figure 1: Development of the Czech construction industry in the years 2007 – 2021
(Source: CEEC Research)
The aim of the paper is to evaluate companies in the construction industry according to various
size entities, ie. according to the size of the entity in 2010 and 2014 on the basis of selected
bankruptcy models, Altman's Z-score, IN95 and IN05. The analysis builds on previous studies
by the authors (Jánský et al., 2019; Činčalová et al., 2019), in which they examine the crisis
years 2010 and 2014. Crisis years are deliberately chosen at a delay, as the construction industry
responds to the Great Recession delay compared to other sectors.
2. THEORETICAL BACKGROUND
Knowledge of the financial situation and financial health of the company is very important for
any financial management or decision-making in the company. The information based on
financial analysis can serve many users, both external and internal. There are a number of
financial models that diagnose and predict a company's financial health. In general, they can be
divided into two basic categories - creditworthiness and bankruptcy models. Kuběnka and
Slavíček (2014) claim that their construction is usually similar and the individual models differ
mainly in their focus. Bankruptcy models – the Altman Z-score, indexes IN95 and IN05 will
be used to meet the goal of the paper.
2.1. Z´´score
The Z-score is one of the world's best-known bankruptcy forecasting indices (Qiu et al., 2020;
Akbar et al., 2020). Altman (1968) developed this model for assessing the quality of ratio
analysis. The equation includes several financial variables and predicts bankruptcy using a
multiple discriminatory statistical method. Altman's first Z-score (Altman, 1968) contained five
ratios. Subsequently, seven ratios were modified and examined (Altman et al., 1977).
Furthermore (Altman, 1993) a Z´ Score was created for companies not traded on capital markets
again with five indicators, in 1995 (Altman et al., 1995) the so-called EM score was tested on
specific Mexican companies issuing Eurobonds denominated in USD. Another revision
(Altman, 2006) compiled the Z´´score, which is applicable to non-US non-manufacturing
enterprises and for this reason the absence of the indicator used so far (sales / total assets). The
Kuběnka and Králové (2006) study uses the Z´´score model created by Altman (2006) for the
analysis of the construction industry, which according to the authors is the most accurate
bankruptcy model for companies in this industry.

63rd International Scientific Conference on Economic and Social Development – "Building Resilient Society" - Zagreb, 11-12 December, 2020
113
2.2. Index IN95
The IN95 index is a bankruptcy model and its indicators do not include any that would work
with the market value of the company, as is the case with Altman's model (Vlašicová and
Náglová, 2015; Kopta, 2009). This adjustment is an advantage for conditions of a less liquid
capital market. According to Neumaier and Neumaierová (2002), "specifics for the Czech
economy, where there is a high insolvency, is the inclusion of the indicator Payables after
maturity / revenues". This indicator characterizes the inability of the company and the value of
the index decreases by it. The index was tested on the data of thousands of Czech companies
and proved to be an excellent indicator for estimating the financial distress of these companies.
The success rate of the index is more than 70%.
2.3. Index IN05
The IN05 index is so far the latest version of the IN indexes. This index was compiled to update
the IN01 index, which began to lose its prediction success in 2004. After testing the IN01 index,
Mr. and Mrs. Neumaier decided to slightly adjust the weights for the IN05 index. The value
limits for the classification of companies as value-creating companies and for companies
heading for bankruptcy recorded a more significant change. The authors of the index examined
the success in the classification of companies in more detail. One of the more detailed
evaluations, namely the evaluation for medium-sized enterprises, was the following
(Neumaierová and Neumaier, 2013):
• The IN05 index correctly ranked 83% of value-creating companies and 78% of companies
going bankrupt, with an average success rate of 81%.
• The index included only 2% of value-creating enterprises and 9% of bankrupt enterprises
in the opposite (incorrect) group of companies.
• If the index classified the company in the gray zone, it was not counted as successful or
unsuccessful classification.
• Shortly after its inception, the IN05 index reached a relatively wide use among companies
and ranked as an equal partner alongside foreign creditworthiness and bankruptcy indices
used in the Czech Republic (e. g. Fiala et al., 2020; Cerny et al., 2019).
3. DATA AND METHODS
The paper focuses on all companies in the construction sector in the Czech Republic in 2010
and 2014, it is not a sample. The statistical data of all these enterprises were analyzed for the
mentioned years using the Albertina database, Statistica and Excel programs. In 2010, there
were 9584 construction companies operating in the sector, and in the crisis year of 2014 there
was a large decrease to 6846 (see Table 1).
Size of enterprises / Year 2010 2014 2014/2010
Micro 6027 62.89 % 4752 69.41 % - 21 %
Small 3070 32.03 % 1806 26.38 % - 41 %
Medium 422 4.40 % 240 3.51 % - 43 %
Large 65 0.68 % 48 0.70 % - 26 %
Total 9584 100 % 6846 100 % - 29 %
Table 1: Industry structure by size of enterprises in selected years
(Source: own processing)
For both monitored years, the whole set of enterprises was divided according to the size of
accounting units (AU) on the basis of an amendment to the Accounting Act, into so-called
micro, small, medium and large enterprises. Companies can be classified into different
categories according to their size.
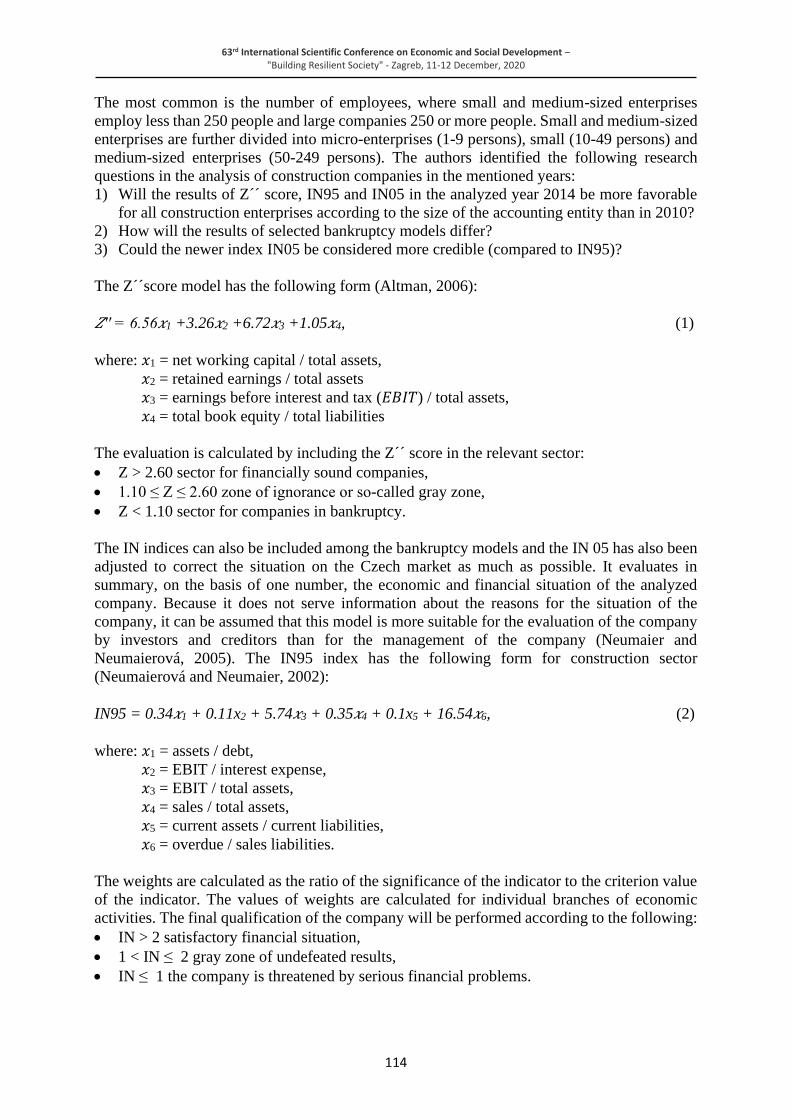
63rd International Scientific Conference on Economic and Social Development – "Building Resilient Society" - Zagreb, 11-12 December, 2020
114
The most common is the number of employees, where small and medium-sized enterprises
employ less than 250 people and large companies 250 or more people. Small and medium-sized
enterprises are further divided into micro-enterprises (1-9 persons), small (10-49 persons) and
medium-sized enterprises (50-249 persons). The authors identified the following research
questions in the analysis of construction companies in the mentioned years:
1) Will the results of Z´´ score, IN95 and IN05 in the analyzed year 2014 be more favorable
for all construction enterprises according to the size of the accounting entity than in 2010?
2) How will the results of selected bankruptcy models differ?
3) Could the newer index IN05 be considered more credible (compared to IN95)?
The Z´´score model has the following form (Altman, 2006):
𝑍′′ = 6.56𝑥1 +3.26𝑥2 +6.72𝑥3 +1.05𝑥4, (1)
where: 𝑥1 = net working capital / total assets,
𝑥2 = retained earnings / total assets
𝑥3 = earnings before interest and tax (𝐸𝐵𝐼𝑇) / total assets,
𝑥4 = total book equity / total liabilities
The evaluation is calculated by including the Z´´ score in the relevant sector:
• Z > 2.60 sector for financially sound companies,
• 1.10 ≤ Z ≤ 2.60 zone of ignorance or so-called gray zone,
• Z < 1.10 sector for companies in bankruptcy.
The IN indices can also be included among the bankruptcy models and the IN 05 has also been
adjusted to correct the situation on the Czech market as much as possible. It evaluates in
summary, on the basis of one number, the economic and financial situation of the analyzed
company. Because it does not serve information about the reasons for the situation of the
company, it can be assumed that this model is more suitable for the evaluation of the company
by investors and creditors than for the management of the company (Neumaier and
Neumaierová, 2005). The IN95 index has the following form for construction sector
(Neumaierová and Neumaier, 2002):
IN95 = 0.34𝑥1 + 0.11x2 + 5.74𝑥3 + 0.35𝑥4 + 0.1x5 + 16.54𝑥6, (2)
where: 𝑥1 = assets / debt,
𝑥2 = EBIT / interest expense,
𝑥3 = EBIT / total assets,
𝑥4 = sales / total assets,
𝑥5 = current assets / current liabilities,
𝑥6 = overdue / sales liabilities.
The weights are calculated as the ratio of the significance of the indicator to the criterion value
of the indicator. The values of weights are calculated for individual branches of economic
activities. The final qualification of the company will be performed according to the following:
• IN > 2 satisfactory financial situation,
• 1 < IN ≤ 2 gray zone of undefeated results,
• IN ≤ 1 the company is threatened by serious financial problems.

63rd International Scientific Conference on Economic and Social Development – "Building Resilient Society" - Zagreb, 11-12 December, 2020
115
The IN05 index has the following form (Neumaierová and Neumaier, 2013):
IN05 = 0.13𝑥1 + 0.04x2 + 3.97𝑥3 + 0.21𝑥4 + 0.09x5, (3)
where: 𝑥1 = assets / debt,
𝑥2 = EBIT / interest expense,
𝑥3 = EBIT / total assets,
𝑥4 = sales / total assets,
𝑥5 = current assets / current liabilities.
The final qualification of the company will be performed according to the following:
• IN05 > 1.6 the company creates value
• 0.9 < IN05 < 1.6 gray zone of undefeated results
• IN05 < 0.9 enterprise does not create value (destroys)
4. RESULTS AND DISCUSSION
The Z´´ score model, indexes IN95 and IN05 were used for the calculation according to the size
of the accounting unit (AU) of construction companies, while the first calculations are based
on the averages of indicators for individual AU and the second calculations on the median of
the indicators. For comparison, the Z´´ score is further calculated for the whole set of
enterprises, which does not consider classification into AU (see Table 2).
Size of accounting unit /Year 2010 2014
average median average mediam
Micro 1.06 1.11 1.07 1.34
Small 2.79 2.38 3.88 3.61
Medium 2.62 2.96 3.01 2.89
Large 2.34 2.27 2.66 2.61
Total 2.288 1.31 2.68 1.59
Table 2: Results of Z´´ score
(Source: own processing)
Based on the calculated values, we can conclude (see Table 3) that the compilation of Z´´ score
models is influenced by whether we assess selected indicators of accounting units on the basis
of average or median. According to the above-mentioned characteristics of the average and the
median, it can be considered in this situation as a better telling value of the median indicator.
The main advantage of the median as a statistical indicator is the fact that it is not affected by
extreme values. Therefore, it is often used in the case of oblique distributions, where the
arithmetic mean usually gives inappropriate results. The disadvantage is usually the use of the
median for files in which the monitored character has only two possible values. There, the
median behaves the same as the mode: it is a rough measure of the properties of the distribution,
and if both categories are represented roughly equally, it is very unstable (Minařík, 2008).
Table following on the next page
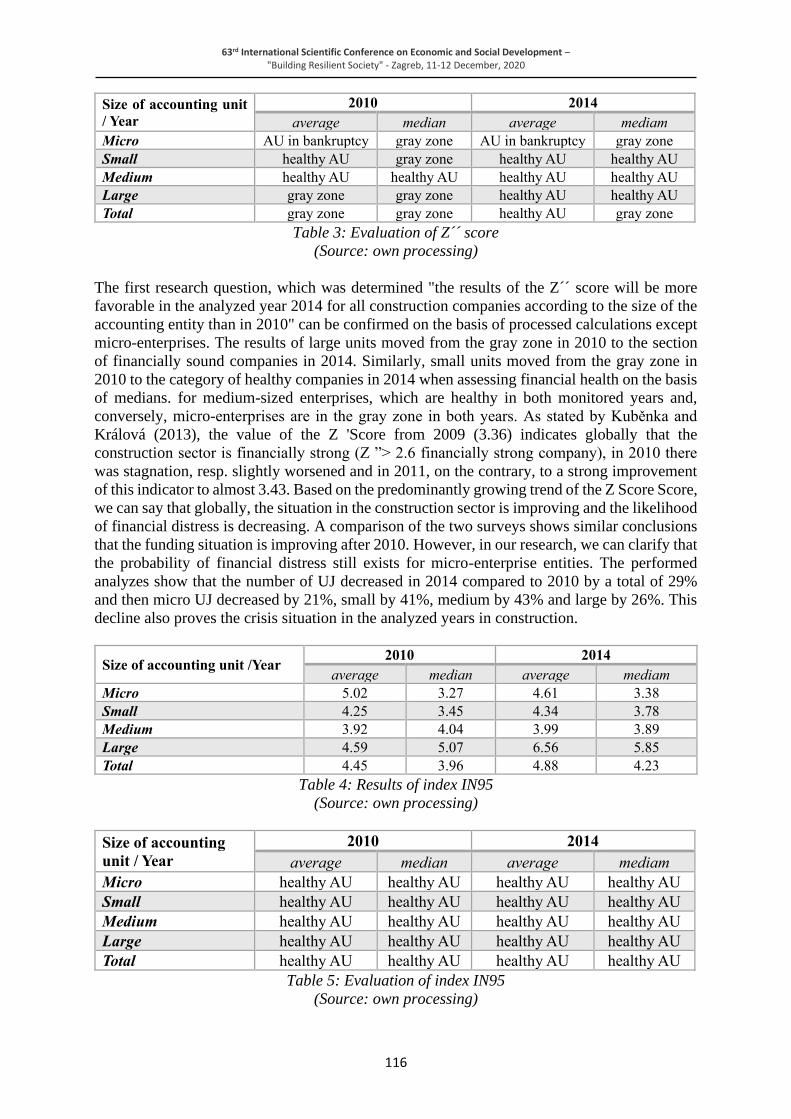
63rd International Scientific Conference on Economic and Social Development – "Building Resilient Society" - Zagreb, 11-12 December, 2020
116
Size of accounting unit
/ Year
2010 2014
average median average mediam
Micro AU in bankruptcy gray zone AU in bankruptcy gray zone
Small healthy AU gray zone healthy AU healthy AU
Medium healthy AU healthy AU healthy AU healthy AU
Large gray zone gray zone healthy AU healthy AU
Total gray zone gray zone healthy AU gray zone
Table 3: Evaluation of Z´´ score
(Source: own processing)
The first research question, which was determined "the results of the Z´´ score will be more
favorable in the analyzed year 2014 for all construction companies according to the size of the
accounting entity than in 2010" can be confirmed on the basis of processed calculations except
micro-enterprises. The results of large units moved from the gray zone in 2010 to the section
of financially sound companies in 2014. Similarly, small units moved from the gray zone in
2010 to the category of healthy companies in 2014 when assessing financial health on the basis
of medians. for medium-sized enterprises, which are healthy in both monitored years and,
conversely, micro-enterprises are in the gray zone in both years. As stated by Kuběnka and
Králová (2013), the value of the Z 'Score from 2009 (3.36) indicates globally that the
construction sector is financially strong (Z ”> 2.6 financially strong company), in 2010 there
was stagnation, resp. slightly worsened and in 2011, on the contrary, to a strong improvement
of this indicator to almost 3.43. Based on the predominantly growing trend of the Z Score Score,
we can say that globally, the situation in the construction sector is improving and the likelihood
of financial distress is decreasing. A comparison of the two surveys shows similar conclusions
that the funding situation is improving after 2010. However, in our research, we can clarify that
the probability of financial distress still exists for micro-enterprise entities. The performed
analyzes show that the number of UJ decreased in 2014 compared to 2010 by a total of 29%
and then micro UJ decreased by 21%, small by 41%, medium by 43% and large by 26%. This
decline also proves the crisis situation in the analyzed years in construction.
Size of accounting unit /Year 2010 2014
average median average mediam
Micro 5.02 3.27 4.61 3.38
Small 4.25 3.45 4.34 3.78
Medium 3.92 4.04 3.99 3.89
Large 4.59 5.07 6.56 5.85
Total 4.45 3.96 4.88 4.23
Table 4: Results of index IN95
(Source: own processing)
Size of accounting
unit / Year
2010 2014
average median average mediam
Micro healthy AU healthy AU healthy AU healthy AU
Small healthy AU healthy AU healthy AU healthy AU
Medium healthy AU healthy AU healthy AU healthy AU
Large healthy AU healthy AU healthy AU healthy AU
Total healthy AU healthy AU healthy AU healthy AU
Table 5: Evaluation of index IN95
(Source: own processing)

63rd International Scientific Conference on Economic and Social Development – "Building Resilient Society" - Zagreb, 11-12 December, 2020
117
Size of accounting unit /Year 2010 2014
average median average mediam
Micro 0.49 0.77 0.62 0.94
Small 1.09 1.03 1.22 1.24
Medium 1.14 1.49 1.12 1.45
Large 1.19 1.55 1.58 1.89
Total 0.98 1.21 1.14 1.38
Table 6: Results of index IN05
(Source: own processing)
Size of accounting
unit / Year
2010 2014
average median average mediam
Micro AU in bankruptcy AU in bankruptcy AU in bankruptcy gray zone
Small gray zone gray zone gray zone gray zone
Medium gray zone gray zone gray zone gray zone
Large gray zone gray zone gray zone healthy AU
Total gray zone gray zone gray zone gray zone
Table 7: Evaluation of index IN05
(Source: own processing)
To continue the first research question for the results according to the index IN95 and IN05 (see
Tables 4-7), it can be stated that the results are completely different for both indices. The results
according to the IN95 index show that all enterprises according to the size of UJ are healthy
and the opposite situation is with the results according to the IN05 index, where in both
monitored years 2010 and 2014 there was no improvement in the financial situation of
enterprises according to financial distress and all construction enterprises in the gray zone. The
same situation is with small and medium-sized enterprises according to the size of UJ and large
enterprises are moving from the gray zone in 2010 to healthy enterprises in 2014. The situation
is similar for micro-enterprises, where there is also a more favorable development, from micro-
enterprises in bankruptcy in 2010. to the gray zone in 2014. Overall, it can be stated that no
significant change in financial distress was recorded for the IN95 index and, conversely, for the
IN05 index there was a positive change in the observed years 2010 and 2014 only for UJ micro
and large enterprises. When comparing the results of all three models with the Z score bank,
the IN95 index and the IN05 index according to the second research question, it can be stated
that the results of the models are different. The Z score model in the analyzed year 2014 in all
construction enterprises according to the size of the accounting unit achieves more favorable
results than in 2010, except for micro-enterprises. The model of the IN95 index did not show
any significant change in these years, and on the contrary, the model of the IN05 index shows
a positive change in the analyzed years of only two groups of enterprises, namely micro and
large enterprises. Regarding this research question, it can be stated that two models of financial
distress, namely the Z score and the IN05 index, affect changes in some UJ groups for the
observed period of 2010 and 2014. The third research question confronts the achieved results
of the IN 95 and IN05 indices and it can be stated that the results of the IN 05 index are more
credible in comparison with the IN95 index model, which could be caused in this model mainly
by the overdue liabilities / income indicator.
5. CONCLUSION
Construction is one of the key sectors of the national economy in the Czech Republic. In
general, the construction industry also proves the overall state of our country's economy and in
times of crisis is able, as evidenced by the results of research to significantly stabilize the

63rd International Scientific Conference on Economic and Social Development – "Building Resilient Society" - Zagreb, 11-12 December, 2020
118
financial situation of small, medium and large enterprises. According to the above results of
research on the financial situation of construction companies according to two models of
financial distress Z score, index IN05, it is necessary to focus a more detailed analysis on a
group of micro-enterprises that logically have greater problems in liquidity indicators
(Činčalová, Jánský, Palát 2019) and subsequently in indicators indebtedness. In general, it can
also be stated during the crisis that there is a significant decline in the performance of companies
and thus also increased competitiveness, which was proved especially by the interest of large
companies in obtaining public contracts in that period. Following this paper, future research
should analyze in more detail the financial distress of individual companies within these UJ
groups, so as to show in times of crisis the structure of companies in financial distress that do
not solve the difficult situation or can not solve it.
ACKNOWLEDGEMENT: This paper was supported by the College of Polytechnics, Jihlava,
under Grant no. 1170/4/195 “Implementation of Corporate Social Responsibility in Czech
Conditions”.
LITERATURE:
1. Akbar, M., Akbar, A., Maresova, P., Yang, M., Arshad, H. M. (2020). Unraveling the
Bankruptcy Risk‒Return Paradox across the Corporate Life Cycle. Sustainability, 12(9), 1-
19.
2. Altman, E. I. (1968). Financial Ratios, Discriminant Analysis and the Prediction of
Corporate Bankruptcy. Journal of Finance, 23(4), 589–609.
3. Altman, E. I. (1993). Corporate Financial Distress and Bankruptcy: A Complete Guide to
Predicting and Avoiding Distress and Profiting from Bankruptcy, New York: John Wiley
and Sons Inc.
4. Altman, E. I., Haldeman, R. G., Narayanan, P. (1977). ZETA’“ Analysis: a New Model to
Identify Bankruptcy Risk of Corporations. Journal of Banking & Finance [online]. 1(1),
29–54. Dostupné z: doi:10.1016/03784266(77)90017-6
5. Altman, E. I., Hartzell, J., Peck, M. (1995). Emerging Markets Corporate Bonds: A Scoring
System, Salomon Brothers Working Paper.
6. CEEC Research: Analysis of Construction Sector [online]. Prague: CEEC Research, 2020
[cit. 2020-10-06]. Dostupné z: https://www.ceec.eu/research/
7. Cerny, I., Vanek, M., Pitrik, J., & Bora, P. (2019). An analysis of selected benchmarks and
evaluation methods to test the replacebility of mathematical-statistical methods in
benchmarking by solvency and bankruptcy models: A case study in assessing gravel-sand
mining companies in the Czech Republic. Inżynieria Mineralna, 21.
8. Činčalová, S., Jánský, J., Palát, M. (2019). Assessment of the Construction Sector in the
Czech Republic Based on Selected Indicators of Corporate Social Responsibility. In 6th
SWS International Scientific Conference on Social Sciences 2019, 389–396. Sofia,
Bulgaria: STEF92 Technology Ltd.
9. Fiala, R., Hedija, V., Dvořák, J., & Jánský, J. (2020). Are profitable firms also financially
healthy? Empirical evidence for pig-breeding sector. CUSTOS E AGRONEGOCIO ON
LINE, 16(1), 173-201.
10. Jánský, J., Činčalová, S., Dočekalová, M., Palát, M. (2019). Ekonomicko-statistická
analýza odvětví stavebnictví. In Proceedings of the international scientific conference
Competition, 154-163. Jihlava: VŠP Jihlava.
11. Kopta, D. (2009). Possibilities of financial health indicators used for prediction of future
development of agricultural enterprises. Agricultural Economics (Zemědělská
ekonomika), 55(3), 111-125.

63rd International Scientific Conference on Economic and Social Development – "Building Resilient Society" - Zagreb, 11-12 December, 2020
119
12. Kuběnka, M., Slavíček, O. (2014). Detection of Cognation between Creditworthy Models
and Bankruptcy Models. In Proceedings of Managing and Modelling of Financial Risks,
Ostrava: Technical University of Ostrava, 426–433.
13. Kuběnka, M., Králová, V. (2013). Využití Z’’ score při hodnocení finančního zdraví
odvětví stavebnictví, E&M Economics and Management, 16(1), 101–112.
14. Neumaier, I., Neumaierová, I. (2005). Index IN05. In Evropské finanční systémy. Brno:
Masaryk University, 143-148.
15. Neumaierová, I., Neumaier, I. (2002). Výkonnost a tržní hodnota firmy, GRADA
Publishing, a.s.
16. Neumaierová, I., Neumaier, I. (2013). Vypovídací schopnost Indexu IN05. In International
Conference organized on the occasion of the 60th anniversary of University of Economics,
July (Vol. 3).
17. Qiu, W., Rudkin, S., Dłotko, P. (2020). Refining understanding of corporate failure through
a topological data analysis mapping of Altman’s Z-score model. Expert Systems with
Applications, 156.
18. Vlašicová, E., Náglová, Z. (2015). Differences in the economic situation of organic and
conventional winemaking enterprises. AGRIS on-line Papers in Economics and
Informatics, 7(665-2016-45089), 89-97.

63rd International Scientific Conference on Economic and Social Development – "Building Resilient Society" - Zagreb, 11-12 December, 2020
120
THE POWER OF ELITE ON BUSINESS: A CASE FROM THE EARLY
MERCATILISM PERIOD
Eduardo Manuel de Almeida Leite
CiTUR, ESTG, University of Madeira, Funchal, Portugal
Humberto Nuno Rito Ribeiro
GOVCOPP, ESTGA, University of Aveiro, Portugal
Sandra Raquel Alves
CEOS.PP, ESTG, Polytechnic Institute of Leiria, Portugal
Amelia Ferreira da Silva
CEOS.PP, Porto Accounting and Business School, Porto Polytechnic, Portugal
Ana Leite
IACHR, CLEPUL, EHESS and Open University, Portugal
ABSTRACT
This paper examines the life and work of a Jewish businesswoman, from the early mercantilism
period, in the scope of a theoretical background composed of the following trilogy: i) Elite
Theory (Mosca, Gaetano, 1858-1941); ii) Critical Structuralism (Bourdieu, Pierre, 1930-
2002,); and, iii) Dynamic Capitalism (Sombart, Werner,1863-1941). The research departs from
the main question of knowing whether Doña Gracia Nasi is appropriately inserted in the ideal-
type of elite bourgeois of her time, considering the different instrumental, moral and intellectual
factors of her behaviour. Based on written documentation and data, the authors of this research
built an ethnographical/historical set that attributes to Doña Gracia an explanatory value that
reflects the spirit and action of her time, space and social class. As we could convene enough
evidence to support and accept the hypothesis that Doña Gracia Nasi fitted to the elite status
of her time, it was therefore possible to focus on her as a case study. This study suggests that
Doña Gracia Nasi was a particularly important element of the economic and financial elite of
her time. This allowed her to become a privileged player in her relationship with the political,
ideological and cultural elites, enabling diverse achievements, through her network of influence
amidst other elites, placing herself at the centre of the classic dominant-dominated dichotomy,
being, nevertheless, a victim of several setbacks, resulting from under the stage conspirations
and plots, among other threats. Regardless gender and religion, which were by then critical
handicaps to be successful on business, this Jewish businesswoman’s case proved that having
an elite status may dwarf such a priori constrains.
Keywords: Businesswoman, Entrepreneurship, Elite Theory, Dynamic Capitalism, Critical
Structuralism
1. INTRODUCTION
Taking into account, broadly, the two main traditional sociological theories, functionalism and
Marxism, we may observe the common postulation of an ontology of societies which is
characterized by the predominance action of the structure above, or, as some authors appoint,

63rd International Scientific Conference on Economic and Social Development – "Building Resilient Society" - Zagreb, 11-12 December, 2020
121
the explanatory prevalence of the macro dimension above the micro, without prejudice of many
other reconciliation attempts between these dimensions (vid., Ritzer 1996, 358: Ritzer, 1979,
1981a; Alexander,1982; Norbert Wiley, 1988, James Coleman, 1986, 1987; Rendal Collins,
1981 a) and 1981 b). The life history of Doña Gracia Nasi, which is to be analysed on this paper,
seems sparsely explainable under the postulates of these paradigms, becoming, in alternative,
evidently relevant when read under the scope of other sociological theories that we will adopt.
On the other hand, the concept of Elites developed in the scope of what has been called
sociology of the elite as initiated by (Pareto (1848-1923), Mosca (1858-1941) and Michels
(1876-1936) evolved as a collection of theoretical constructions alternative to the referred
paradigms. This theoretical tradition explained the social change in a different way both from
functionalism and from Marxism. With effect, it did not resort to teleology’s or social
mechanisms that transcend individuals, which would minimize the role of some actors or
particular groups in the explanation of social change. The concept of Elites, developed in the
scope of the elite’s sociology, or classic realism, under the ontological point of view, postulated
the existence of elites as minority groups of influence over the set of societies, both over its
structural dimensions as over its conjunctural dimensions, existent in all societies, times and
spaces, as groups of influence, power and decision. These authors, underlined the dichotomy
elite/masses as a social ontology trait and elaborate its epistemological models according to this
characteristic belief. The elite was described as a circle of people that direct the destinies of
social masses, governing them by the appropriation they manage to make of power systems
established in each society (Bessa, 1993, 2002; Mosca, 1939; Higley, 2008; Busino, (s/data),
Dahl, 1961; Bottomore, 1974; Bourdieu, 1984; Daloz, 2010, Hartmann, 2007; Wright Mills,
1956). In the investigation domain of the roles of singular actors, the elite’s theory reveals an
interesting theoretical picture. It consists of analysing individual’s aggregates that direct and
conduct, or condition, societies and structures, due to the fact that they dispose of sometime
superiority or power and for the fact that their decisions affect the collective life. The study of
individual social action in the scope of the theory of elites enables the profound understanding
of social interdependence between individual and society or interaction between actor and
structure, highlighting the capacity of individual action in history, both from minorities, as from
singular actors, through a sociological point of view instead of a psychological one. This paper,
through the financial story of Doña Gracia Nasi, tries to point out, how an important business
woman, that is to say, how a singular actor, through her social action, managed not only to
maintain herself and her family as permanent members of the economic and financial elite but
also, to influence the conjunctural and structural frameworks of the countries she lived in,
namely, in the present case, with a bigger emphasis on Portugal in the 16th century. The analysis
also shows that the interdependence of the nature of the social phenomena, addressing
individual economical social action as manifestations of complete social phenomena,
consequently, showing that businesses are more than mere numbers and that social phenomena
transcend individuals. The concept of the elites remits us to the existence of real groups in
situations of objective superiority in a society or group that are also sources of symbolic
representation over the mind frame, ways of life, tastes, consumerism styles, etc. (Bourdieu,
1979) and that condition the evolution and the economic, political, ideological, cultural and
mental transformation. A history of Doña Gracia Nasi also shows that as a social fact,
companies are not only subject to the principles and corporate standards, but above all to social
collective actors’ subject to social coercive, structural dynamic and conjunctural forces that are
exteriorly imposed on her (Bourdieu, 2005; Coleman, 1987; Collins, 1981 a, and b; Michels,
2001; Mosca, 1884; Ritzer, 1996; Sombart, 1928; Weber, 1958.) It shows, how the elites,
independently of its types, are connected by relationships (Barabási, 2002). We can, therefore,
state that as it can be seen from the text, that the social phenomena and social rules are
determinant in the success or failure of business and entrepreneurs.

63rd International Scientific Conference on Economic and Social Development – "Building Resilient Society" - Zagreb, 11-12 December, 2020
122
It means that, the power of the collective supersedes the individual, even if individual interests
have the reason or the truth by their side. The case study of Doña Gracia reveals an impressive
history of leadership and commitment with business, the family and the Jewish cause. Doña
Gracia Nasi due to her psychological features never accepted to follow the easiest path, even if
it meant more personal and financial sacrifices. But her history also shows that the sociological
perspective about the own logic of the social phenomena, namely of the elites, their network
connection and their reproduction capacity, constitute valid models, pertinent and useful to the
life histories explanation. A sociological interpretation of the Doña Gracia Nasi story, through
major classical thinkers, such as Mosca (1858-1941 elite theory), Bourdieu (1930-2002 –
critical structuralism) and Sombart (1863-1941, dynamics of capitalism) helps us to understand
the decisions of Doña Gracia Nasi, contextualized in the sixteenth-century Europe,
characterized by economic dynamics caused by the discoveries and ideologically controlled by
the Inquisition.
2. DOÑA GRACIA’S BUSINESS TRAJECTORY
Doña Gracia Nasi, also known by her Portuguese name of Beatrice de Luna, was born into a
crypto-Jewish family sometime in 1510 in Lisbon, Portugal. After becoming a widow, she
entered the world of business and finance, and she became a major businesswoman at the time,
continuing a history of success and social integration at the elite level of the time. Even
considering numerous singular factors and conjunctures of notable order that could suppose her
marginalization as a foreigner, refugee and member of a cultural and religious minority that
was persecuted. Table 1, shown below, offers a view on Doña Gracia’s life in the context of
Europe on the period of early Mercantilism.
Table following on the next page

63rd International Scientific Conference on Economic and Social Development – "Building Resilient Society" - Zagreb, 11-12 December, 2020
123
Year Event
1497 Forced Conversions of Portuguese Jews and the birth of the “Cristãos-Novos” (New
Christians)
1506 Lisbon Massacres
1510 Gracia is born in Portugal. Her Portuguese name was Beatrice de Luna. In the family
she is called Gracia (Hannah) Nasi. Her brother — Dr. Miguez — was the royal
physician.
1512 Diogo Mendes, Francisco Mendes’s brother, opens Antwerp branch of House of
Mendes. By 1525 the brothers control the largest share of the pepper and spice trade.
The capital at his disposal was 300,000 — 400,000 florins He made loans to the Kings
of Portugal and England.
1528 Gracia marries Francisco Mendes
1531 Diogo is arrested for Judaizing. Uses safe conduct letters from the Holy Roman Emperor
and is released the same day.
1532 Diogo is arrested on the word of a child who, with his mother and 3 siblings, Diogo has
previously helped escape to Salonika. Diogo is moved to Brussels. Antwerp places
obstacles, demands the right to stop him. The King of Portugal, who will lose 200,000
ducats if Diogo cannot complete business deals, instructs his representatives to
intervene. Mary of Hungary and Henry VIII also support Diogo.
1532 September. Diogo is released under bail of 50,000 ducats and a large cash payment.
Charges are dropped
1532 The Emperor prohibits New Christians from travelling through Antwerp on their way
to Turkey. The House of Mendes is able to help most travellers anyway
1536 Francisco dies, Gracia is left with an infant daughter Reyna (publicly known as
Brianda). The administration of Francisco’s fortune is divided between Gracia, who is
to act in the name of her daughter, and Diogo
1536 Formal establishment of the Inquisition in Portugal, on the Spanish model. New
Christians cannot easily immigrate to non-Christian countries, but can go to Northern
Europe. Gracia moves to Antwerp with her daughter Brianda, her unmarried sister
Brianda (namesake of Gracia’s daughter) and her nephews Joao Miguez (a.k.a. Joseph
Nasi, later Duke of Naxos) and his younger brother.
1536 Brianda marries Diogo
1539 Inquisition formally starts in Lisbon causing mass exodus of Portuguese entrepreneurs
to Antwerp
1542--43 Death of Diogo. Gracia is named administrator of Diogo’s half of the business on behalf
of his widow and infant daughter. Gracia must fight charges of heresy against Diogo (or
else his property will be confiscated)> the charges are withdrawn when she lends the
emperor 100,000 ducats interest free.
1544 Doña Gracia flees to Venice
1546-1549 Brianda accuses Doña Gracia of heresy and attempts to take control of House of
Mendes.
1550 Doña Gracia moves to Ferrara. Jews expelled from Venice.
1552 Publication in Portuguese of “Consolação às Tribulações de Israel” by Samuel Usque
1554 Joseph Nasi arrives in Istanbul, converts to Judaism and marries Doña Gracia’s
daughter.
1555 Pope institutes formalized ghettos for Jews
1556 Mass burnings of Jews in Italy
1558 Doña Gracia moves to Turkey
1562--69 Rise of Power of Joseph Nasi
1569 Death of Doña Gracia
Table 1: Doña Gracia’s life in the context of Europe on early Mercantilism times
(Source: Leite, 2013)

63rd International Scientific Conference on Economic and Social Development – "Building Resilient Society" - Zagreb, 11-12 December, 2020
124
It is important to recall that the early sixteenth century was a time of great economic expansion
in Portugal as well as a period of political, economic, and ideological turmoil. From all
indications, Beatrice de Luna (Doña Gracia) came from an upper class crypto-Jewish
entrepreneurial Lisbon family. She married in 1528 but her marriage was a short one. It ended
with the death of her husband Francisco, in 1538. At the time of her husband’s death, she had
one daughter, Brianda (known by her family as Reyna). After becoming a widow, she chooses
not to hand her business interests over to her husband’s brothers, but rather in a period in which
few women entered the world of business and finance, she became a major businesswoman at
the time. Her husband’s death (along with multiple political factors in Portugal) may have been
one of the reasons that she moved (or fled) to Antwerp where her brother-in-law, Diogo, had
already established a branch office of their bank, the House of Mendes. In 1542, Doña Gracia’s
brother-in-law died, and she assumed control of the Mendes commercial empire. Doña Gracia
was not only a highly successful businesswoman. Her enormous wealth had put her into a
position to influence kings and popes. She also used her wealth to confront major powers in the
protection of her people. For example, under Doña Gracia, the House of Mendes dealt with
Henry II of France, Henry VIII of England, Charles V of Spain and the Holy Roman Empire,
Maria of Austria, Regent of the Low Countries, Popes Paul III and Paul IV, and Suleiman the
Magnificent, Sultan of the Ottoman Empire. These dealings involved commercial activities,
loans and bribes. Payments to the Pope delayed the establishment of the Inquisition in Portugal.
The historical record appears to indicate that she was an excellent negotiator. Under her
leadership the House of Mendes had very important business dealings. The following Figure 1
maps the historical path taken by Doña Gracia from her birth until her death.
Figure 15: Path taken by Doña Gracia from her country birth Portugal until her death in
Constantinople
(Source: Cecil Roth, 1977. Doña Gracia of the House of the Nasi. The Jewish Publication
Society, Philadelphia-Jerusalem)
The map shows that Doña Gracia consistently sought both new business opportunities and
places in which the government would interfere in both her business and private life to the least
extent. What makes Doña Gracia so important to the world of business is that she was able to
develop international companies in a time of poor communications and did it in the context of
an intolerance society. Thus, Andrée Aelion Brooks notes: “She would constantly mix
profitable business dealings with her community work on behalf of the refugees she had taken
under her wing, trading bribes and favours with the elite of the day. Even a journey alone
through the Adriatic port of Ragusa (modern day Dubrovnik) on her way to the Ottoman capital
of Constantinople became a moment to pause and extract a preferential trading agreement from
the local authorities.” (http://www.sefarad.org/publication/lm/049/html/page46.html,
November 12, 2015).

63rd International Scientific Conference on Economic and Social Development – "Building Resilient Society" - Zagreb, 11-12 December, 2020
125
Despite or because of these challenges, the modern reader learns from her life how she dealt
with ideological issues (the basis for marketing theory) and how she survived internal takeover
attacks. Her story is both tragic and inspirational and serves the student of modern finance and
business with insights into the history of their academic field and the realization the world of
finance is composed of more than mere figures, but also very much reflects the real world in
which we live.
3. THEORETICAL FRAMEWORK
In the research shown here, the authors opted to analyse the life history of Doña Gracia on the
basis of three fundamental theoretical contributions: Mosca, Gaetano (1858-1941 elites’
theory), Bourdieu, Pierre (1930-2002 – critical structuralism) and Sombart, Werner (1863-
1941, capitalism dynamic). Werner Sombart was one of the greatest German classical
sociologists that developed a wide work about the capitalist system and, simultaneously, the
connection of this system with the Jewish people. This last study was published in 1911 under
the title “Die Juden und das Wirtschaftsleben”. Leipzig: Duncker und Humblot and translated,
originating the first English edition in 1911, Sombart, W. (2001 (orig. 1911)), entitled “The
Jews and modern capitalism”, published in Ontario, by Batoche books Ltd. Although the author
is not consensual because he was considered by some as an Anti-Semite, and by others,
including many Jews, a Philo-Semite, this work constituted an important sociological reference
and a fundamental source of data for whom studies the role of Jews in the emergency of
capitalism. It is a study that concerns precisely over our data set, in such a war that Sombart, in
this book refers to the Mendes family, i.e. the family of Doña Gracia Nasi, seven times, on
pages, 42, 65, 119, 120, 130, and 260. Werner Sombart used, in this study, the genetic and
statistical methods, trying to know “to what extent a group of people (the Jews) influence or
have influenced the form and development of modern economic life — to discover, that is, their
qualitative or, as I have already called it, their dynamic importance” (ibidem, 8). The author
was convinced that the “principles, now accepted on all hands as fundamental, are specific
expressions of the Jewish spirit” (ibidem, 8), even stating that “Without the discovery of
America and its silver treasures, without the mechanical inventions of technical science,
without the ethnical peculiarities of modern European nations and their vicissitudes, capitalism
would have been as impossible as without the Jews.” (Sombart, 2001. 9).” Over the work, the
author shoes, through numerous data sets, that the determining influence exerted by Jews in the
origin and development of capitalism was hidden due to their systematic persecutions and
forced conversions. With effect, many Jewish realizations were historically registered as
Christian, because the Jews that were forced to convert, were considered Christians (New
Christians) although, in the fact, they were crypto-Jewish because they never abandoned their
beliefs. Such historical sub-representation of the crypto-Jewish economy “In… cases …they
adopted Christian names, the uncertainty is even greater.” (ibidem 11). When we analyse the
life of Doña Gracia Nasi we understand how this theoretical Sombartian framework perfectly
helps us to explain and accommodate it in the dynamic of the emerging capitalism. Sombart,
like Weber, studied capitalism onwards from the elaboration of ideal-types that he developed,
both in this work as in “Le bourgeois: contribuition à l’historie morale et intellectuelle de
l’homme économique moderne” (1909). When studying capitalism, Sombart verified that “One
of the most important facts in the growth of modern economic life is the removal of the centre
of economic activity from the nations of Southern Europe — the Italians, Spaniards and
Portuguese... to those of the North-West — the Dutch, the French, the English and the North
Germans. The epoch-making event in the process was Holland’s sudden rise to prosperity, and
this was the impetus for the development of the economic possibilities of France and England”
(ibidim 12). The author links this geographic displacement from the centres of production of
richness to the displacement and relocation movements of Jews.

63rd International Scientific Conference on Economic and Social Development – "Building Resilient Society" - Zagreb, 11-12 December, 2020
126
Such movements, produced by various persecutions that were made to them from the South,
were extended to the protestant countries, not being confined to the Inquisition action areas,
although Jews were more tolerated in the North. Sombart states that, “…is indeed surprising
that the parallelism has not before been observed between Jewish wanderings and settlement
on the one hand, and the economic vicissitudes of the different peoples and states on the other.
Israel passes over Europe like the sun: at its coming new life bursts forth; at its going all falls
into decay” (Sombart, 2001, 13). To sustain this hypothesis, the author systematically analysed
the evolution of Jewish fortunes since the 15th century and concluded that, “Now it is a
remarkable thing that the brief space during which Antwerp became the commercial centre and
the money-market of the world should have been just that between the coming and the going of
the Marranos (Iberian Jews converted by force to Christianism). It was the same in England.
The economic development of the country, in other words, the growth of capitalism ran parallel
with the influx of Jews, mostly of Spanish and Portuguese origin” (Sombart, 2001,14/15).
However, Sombart considered that these were not sufficient evidence to establish a true
causality between the two phenomena and for that, he was dedicated to the typifying, both from
the capitalistic spirit as from the capitalistic entrepreneur. The author concludes that there are
three characteristics on the second that clearly adapt to the first’s spirit: 1) Abstraction capacity,
with consequent relative despise for the qualitative aspect of things and simultaneously the
overvaluation of the quantitative; 2) Prevalence of the willpower and 3) Focus on self-interest
(Sombart, 1909, and 1911). From the analysis that he made of the Jewish people, Sombart
concluded that they possessed three mentioned characteristics that, together with various
historical factors, namely those that derived from their persecution, enable that they had
contributed in a wide scale not only for the creation of the spirit of capitalism and the
economical international relations, but equally for the diversity and quality of the
commercialized products and the luxury goods monopoly, dominating the product exchanges
trendy among the aristocratic elites: gold, silver, pearls, gemstones, etc. Indeed, according to
Sombart the Jews were the first to be installed in the New World exploring new areas where
such products came from and, since remote ages, always dominated by land, the commerce
with the Orient. Thus, joining the past and present, the Jews created modern trade. The author
states that, “It was by the character of their trade that they partially revolutionized the older
forms, and thus helped to make commerce what it is to-day” (Sombart, 2001, 14/22).
Furthermore, the Jewish influence over capitalism cannot be limited to its extension: “I attach
to their influence, cannot be adequately explained merely from the point of view of their
numbers. It is rather the particular kind of influence that I lay stress on, and this can be
accounted for by a variety of complex causes”. (ibidem, 33). Some factors seem to have been
important, such as: a network organization, a familiar connection that crossed several territories
and the specificity of the Jewish character that made them frequently assume the role of funders
of the communities where they lived (ibidem, 34, 38). Sombart linked Jews, both to the
development of colonial empires, as to the implementation of the Modern States dependant on
the existence of precious metals for their economies (Sombart, 2001,14/23, 38 and subsequent)
and considered to always having existed an association between politic leaders and Jews, in the
sense, that the first protect the second from the persecutions they suffered by pre-capitalistic
forces, while the second provide the first, both with the materials needed to the maintenance of
their sovereignty (weapons, munitions, food in time of war), as with loans in general for the
current needs (ibidem, 38-45). The contribute of the theory of the elites to the explanation of
social change became central in the sociological theory. Effectively, being the social inequality
a phenomenon presented in all societies, the privilege and the political domination through the
exercise of political power and its formal structures of power, granted, and always grant in all
societies the existence of dominant and dominated. The contribution of Gaetano Mosca to the
sociology of elites enables us to also analyse some aspects connected to the life of Doña Gracia.

63rd International Scientific Conference on Economic and Social Development – "Building Resilient Society" - Zagreb, 11-12 December, 2020
127
This realistic thinker, pro-Machiavelli, prolific author (vid. e.g. Mosca, 1884, 1923, 1939
[1896]); Mosca and Bouthoul, 1936 based on a pessimistic anthropology (contrary to the myth
of the good savage) separates the moral politic, and states that all societies, without exception,
are characterized by having organized elites and undifferentiated masses without cohesion. For
their organization, but also by the material conditions or intellectual superior qualities, the
privileged birth, work capacity, ambition, or any other appreciated characteristics valued by
society, the elites dominate the masses and exhale power. Mosca distinguishes the State models
in four categories, two autocratic (the feudal State and the bureaucratic) and two liberal (liberal
and representative) and analysis in these types of State, the groups that exercise political power
and its characteristics that distinguish them from the masses. Therefore, typifying elites in:
“priestly aristocracy”, “military aristocracy”, “money aristocracy” and “intellectual
aristocracy” (Mosca, 1923). “Money aristocracy”, whose distinctive and origin access to power
are based on possession of richness, would be, according to the author’s understanding, the
prevailing class of the modern bureaucratic States. Doña Gracia Nasi lived at a time of history
in which the Modern State was being formed and, therefore, was subjected to processes of
complex social dynamic that simultaneously involved, feudal and modern governmental
bureaucratic elements in the process of modern economy emergence that would result in
liberalism. Doña Gracia Nasi integrated, as we saw, the “money aristocracy” of her time, having
employed direct, significant and considerable influence over political elites (aristocracy and
royal houses) with which she established very privileged relationships. During the beginning
of the modern era, the predominant social distinction criteria was still based on status heredity,
the top being represented by dynastic families which originated in the Middle Ages, but
progressively, the distinction based on richness became more prevalent as the money economy
developed and needed more and more currency (Sombart, ibidem). The interconnection
between these two elites (political and economic) was fundamental, both in the maintenance of
power for great dynasties that would become great colonial empires, as in the affirmation of the
National Modern State of the bureaucratic type. “Elites may be defined as persons who, by
virtue of their strategic locations in large or otherwise pivotal organizations and movements,
are able to affect political outcomes regularly and substantially” (Higley, 2008: 3). Effectively,
according to Mosca (1923, 1939), the formation of elites is strictly determined by the social
structure and constituted by members of higher classes, that is, the richest, that, in turn, are the
ones that have the most power. The author states that “the ruling class distinguished from the
political class includes all the characteristics of ruling class, but it is more specific about the
nature of minorities. The minority is not only conscious, cohesive and generally powerful, but
is also characterized by the absolute monopoly of political power. The ruling class is the
minority group which enjoys a great deal of power of any kind; social, economic, religious,
even political. The political class, on contrary is strictly limited to the political arena...In
Mosca’s theory any member of the upper class – a baron or entrepreneur – is a member of the
ruling class but he will not necessarily be a member of political class” (Zannoni 1978, 9). Both
Sombart and Mosca, are inserted in what has been called classical sociology, which is
characterized in great measure for the concern of establishing the disciplinary statute of
sociology and by the search of general theories. These authors, contrary to the other classical
ones, related the existence of elites with social structure and searched for explanations and
causalities of general type, opposing to the teleonomic visions of history and advocating for
this a certain circularity (Mosca, 1923). More recently, another fundamental perspective
emerged, with great pertinence for the explanation of the elites and although it has been
developed to understand the contemporary world does not stop being sufficiently widespread
to the point that it provided important explanatory elements for our analysis. Pierre Bourdieu
(1984) analysis society as a crystallizing of the differentiation processes. Bourdieu’s theory
relates the elite to their tastes, ways of life, consumerism habits, culture and preferences, in
63rd International Scientific Conference on Economic and Social Development – "Building Resilient Society" - Zagreb, 11-12 December, 2020
128
general. The author characterized French contemporary bourgeoisie giving them a type of ideal
and bourgeois spirit, theoretically and methodologically built in differently from Sombart, but
that equally shows the existence of different groups within society, these groups produce
concepts/cultures that mutually antagonize and define, that locate them within different social
representation scopes that, in turn, are the motors of its mobilization for social action or
inaction. Bourdieu showed how the senses created by culture could condition and change “...the
whole experience of a social relationship or which modifies the schemes of perception, shows
something else, other properties, previously unnoticed or relegated to the background (such as
common interests hitherto masked by ethnic or national differences); a separative power, a
distinction, diacrisis, discretion, drawing discrete units out of indivisible continuity, difference
out of the undifferentiated” (Bourdieu, 1984:479). Bourdieu took as a basis the Weberian
concept of “elective affinity” (Weber, 1958; Howe, 1978), that is, the existence of a connection
between beliefs, ways of acting, and, consequences that are not foreseen in collective action.
The author shows that the elites ensure their reproduction in power through the possession of
various types of capital, including, social, cultural, economic, political capital, etc: “The
primary differences, those which distinguish the major classes of conditions of existence, derive
from the overall volume of capital, understood as the set of actually usable resources and powers
- economic capital, cultural capital and also social capital. The distribution of the different
classes (and class fractions) thus runs from those who are best provided with both economic
and cultural capital to those who are most deprived in both respects” (Bourdieu, 1984, 114).
Such concept (social capital) enabled to empirically identify the existence of nets of connections
between privileged actors, with similar capitals, which constitute the power elites that dominate
societies. Bourdieu stated that “Individuals do not move about in social space in a random way,
partly because they are subject to the forces which structure this space (e.g., through the
objective mechanisms of elimination and channelling), and partly because they resist the forces
of the field with their specific inertia, that is, their properties, which may exist in embodied
form, as dispositions, or in objectified form, in goods, qualifications etc” (ibidem, 110). The
author argues also that “The network has its ultimate source in the opposition between the 'elite'
of the dominant and the 'mass' of the dominated, a contingent, disorganized multiplicity,
interchangeable and innumerable, existing only statistically”. (ibidem, 468). Several analyses
of social networks have been made and a considerable theoretical production is now at our
disposal, clearly showing that the elites act accordingly amongst themselves (Hughes, 1993:
175; Gaxie, 1983). The theory of nets developed wide analysis capacities, offering, today,
quantitative models that enable, to some extent, to objectify the world of influences and
domination deriving from the organization of society in networks (Barabási and Albert, 1999,
Barabási, 2002, Albert and Barabási, 2002, Guara, 1990, Spacey et al. 2010).
4. METHODOLOGY AND RESEARCH MODEL
The life histories’ methods, already widely used for decades by the social sciences, always
departs from the real to the conceptual. Therefore, starting by the material collection and only
subsequently are the collected elements analysed, interpreted and the data criticized. In the
present case, the method is historical and not truly biographical since the life in analysis is
already finished and all its information comes from written sources. Therefore, it is about, a
biography without the possibility of maieutic construction or psychography. We only look for
building a document of etnobiographical/historical type that attributes to the actress in analysis
the exemplary value of an element that reflects the spirit and action of her time, space and social
position. However, we do not cease, to present as a life history, although with the own limitation
of a history that we cannot control through the verifying of testimonies and, therefore, is solely
based in existing documents before the beginning of the data collection. Such circumstance
delimits our study’s scope to “the formalized and represented reality”, preventing us from

63rd International Scientific Conference on Economic and Social Development – "Building Resilient Society" - Zagreb, 11-12 December, 2020
129
accessing the “vivid reality” (Poirier, 1995, 30/31). Therefore, it is only about, building a “he”,
or “an exterior personality field” (ibidem, 36). In any case, even at the presentation level we
gave priority to the life history’s narration and only after presenting the theoretical/problematic
context and the historical/sociological model in analysis. The analysis model constructed to this
research, as shown in Figure 2, includes the consideration of three types of explicative axes:
• A – Axis of exogenous variables: historical, said exceptional or irregular:
• A.1. Politic/ideological variables
• A.2. Economical/financial variables
• A.3. Scientific/technological variables
• B – Axis of endogenous variables: Sociological, said recurrent or regular:
• B.1. Societal, relational and agent organizational.
• B.2. Cultural performative or plastic.
• B.3. Symbolical, conceptual/idiosyncratic or ethical.
• C – Axis of residual variables: not evaluated by the model:
• C.1. Unknown variables.
• C.2. Not considered variables due to impertinence or no feasibility.
Figure 2: Explanatory axes model representation
(Source: Developed by the authors)
5. OBSERVATION PROCESS
Being impossible to currently observe Doña Gracia Nasi, we analysed the most diverse
documentation written about her, in order to, reconstruct her life and work. Despite being a
Portuguese citizen, there are very little things written about Doña Gracia in Portugal, being
more studied in the USA. Thus, a great part of the work that we now present was developed in
the USA. To better understand the profile of Doña Gracia Nasi, we decided to integrate for
some months a year, during approximately 3 years, the Jewish community of College Station,
in the State of Texas, spending time, even weekly going, at Fridays, the synagogue of Texas
A&M University to take part in the Shabat.

63rd International Scientific Conference on Economic and Social Development – "Building Resilient Society" - Zagreb, 11-12 December, 2020
130
We interviewed, several times, the Rabbi of the community, trying to identify within the
community, entrepreneurial and reference women of the community. This procedure enabled
us to watch the behaviour of people with the same beliefs as Doña Gracia, and of similar profile,
to better understand the way in which Jewish entrepreneurs act. They live in relatively small
communities, developing a strong spirit of mutual help to cope with other massified beliefs.
They value personal development, rarely accepting preconceived ideas, fostering heated
debates. Praising intensively the work of past generations, looking for references that work as
an inspiration for present and future generations. Thus, justifying some attitudes of Doña Gracia
Nasi, as she bribed people to avoid the death of other Jews and financed Torah’s translations to
take the culture to other stops and also the construction of synagogues. The elites assume the
community’s significant social responsibility, in order to, avoid that a minority culture
succumbs to the growing absorption process of the dominant cultures. This community also has
the particularly of being inserted in a city and region with economic superavit, like Doña Gracia
Nasi was in the convergence business centre that resulted from the discoveries, allowing the
understanding that this class tries to search for macro-economic contexts that enable them to
develop, them simultaneously being a factor of development.
6. CONCLUSIONS
We can consider that Doña Gracia Nasi was well-fit to the bourgeois ideal-type capitalist elite
of her time. In fact, it is possible to state that Doña Gracia Nasi was part of an international
entrepreneurial elite, that is reflected by the level of her relationships and influences in the
different royal courts with which she was in direct interaction both as an entrepreneur and
financier, but also considering the internationalization of her businesses in general.
Furthermore, we can observe the existence of a network of elitist connections that can be
attributed to the success of Doña Gracia Nasi as an entrepreneur, since her connections were of
the highest level, the economical/entrepreneurial dimension of her life seems to have been the
only evident factor of protection towards the vulnerabilities related to the persecutions made
throughout Europe to the Jews. Effectively, her success was mostly due to her privileged
contacts and the fact that her fortune/companies, were functionally useful and needed in the
sustenance scope of the neo-state or neo-capitalist in the time she lived. Therefore, we can
attribute the historical/sociological conditions a role, at least as important as the psychological
profile of Doña Gracia Nasi, in the explanation of her success as a capitalist businesswoman.
On the other hand, the facts connected to the Jews’ expulsion from Spain and the persecutions
in Portugal, political phenomena of centralization of royal power, Europe’s geographical
expansion, occurrence of her widowhood and her brother’s, among others, contributed as
exceptional or historical factors to explain the path and the life history of the actress (A – Axe
of exogenous variables: historical, said exceptional or irregulars). In contrast, the occurrence of
factors connected to the type of current social inequality, to the nature of the elitist political
domination, to the characteristics of elite social actions operating in networking structure and
to the own characteristics of the production of richness system – capitalism – the commercial
and financial nature of international and the own structural organization of societies,
contributed as sociological factors of generator repetitive/systematic nature (B – Axe of
endogenous variables: Sociological, said recurrent or regulars). Consequently, we can argue as
a work hypothesis that it was possible that Doña Gracia Nasi escaped inquisition and maintained
her fortune due to the fact of being inserted in a power elite (vide, Mosca’s ruling class),
although it did not belong to a political elite. This is shown by the political elite interferences
in her favour and the constant privileged relations that the businesswoman maintained with the
political class. Considering that Doña Gracia Nasi belonged to an ethnic/religious group, that
was as a whole actively pursued, the fact that she belonged to a ruling class, as understood by
Mosca, may be the predominant factor in the explanation of success, influence and no

63rd International Scientific Conference on Economic and Social Development – "Building Resilient Society" - Zagreb, 11-12 December, 2020
131
discrimination of her gender and religion, not only in Portugal, but all over her geographical
life path. A future study could be carried in order to obtain a more precise and detailed
characterization of these variables considering our operational model, emphasizing with
accuracy the several intervening factors and its interconnections. In such a subsequent research,
it would be interesting to make a critical operative analysis of the instrumental, moral and
intellectual factors of Doña Gracia behaviour that could be assessed from other documents,
allowing to better elaborate her characterization within the Sombartian ideal-type scope.
LITERATURE:
1. Albert, R. & Barabási, A.-L. (2002). Statistical mechanics of complex networks. Reviews
of Modern Physics, 74(1), 47–97.
2. Alexander, J. (1982). Theoretical Logic in Sociology. Vol. 1, Positivism, Presuppositions,
and current controversies. Berkley: University of California Press.
3. Barabási, A. (2002). Linked: The New Science of Networks. New York: Perseus Books
Group.
4. Barabási, A.-L. & Albert, R. (1999). Emergence of scaling in random networks. Science,
286 (5439), 509–512.
5. Bessa, A. (1993). Quem Governa? Uma análise Histórico-Política do Tema da Elite. ISCSP,
Lisbon
6. Bessa, A. (2002). Elites e Movimentos Sociais. Lisboa: Universidade Aberta, Instituto
Superior de Ciências Sociais e Políticas.
7. Bottomore, T. B. (1974). As Elites e a Sociedade, Rio de Janeiro. Edições Zahar.
8. Bourdieu (1979): La distinction. Critique sociale du jugement, Ed. De Minuit, Paris.
9. Bourdieu (1989): La noblesse d’Etat. Grandes écoles et esprit de corps, Ed. De Minuit,
Paris.
10. Bourdieu, P. (1984). Distinction. A social critique of the judgement of taste, Harvard
University Press: Cambridge, Mass.
11. Bourdieu, P. (1989a). The Logic of Practices, Cambridge, MA: Polity Press
12. Bourdieu, P. (2005). The Social Structures of the Economy. Cambridge: Polity Press.
13. Brooks, A. (2002). The Woman Who Defied Kings: The Life and Times of Doña Gracia
Nasi. Minnesota, Paragon House.
14. Busino, G. (s/data). Elites e Elitismo, Porto. Rés-Editora.
15. Coleman, J. (1986). Social Theory, Social Research and a Theory of Action. American
Journal of Sociology 91, 1039-1335.
16. Coleman, J. (1987).” Microfoundations and Macrosocial Behavior.” In: Alexander, J. et al.
(eds.), The Micro-Macro link. Berkeley: University of California Press: 153-173.
17. Collins, R. (1981 a). “On the Microfoundations of Macrosociology” in: American Journal
of Sociology 86, 984-1014.
18. Collins, R. (1981 b). “Micro-Translation as Theory-Building Strategy.” In: K. Knorr-Cetina
and A. Cicourel (eds.), Advantages in Social Theory and Methodology. New York:
Methuen: 81-108.
19. Dahl, R. A. (1961): Who governs? Democracy and power in an American city, Yale
University Press,
20. Daloz, J. P. (2010): The sociology of élite distinction. From theoretical to comparative
perspectives, Palgrave Macmillan, London.
21. Gaxie, D. (1983): “Les facteurs sociaux de la carrière gouvernementale sous la Cinquième
République.
22. Hartmann, M. (2007): The sociology of elites, Routledge, London/New York.
23. Higley, J. (2008). Elite theory in political sociology, University of Texas at Austin.

63rd International Scientific Conference on Economic and Social Development – "Building Resilient Society" - Zagreb, 11-12 December, 2020
132
24. Howe, H. (1978): “Max Weber’s elective affinities”, American Journal of Sociology, 84
(2), pp. 366-385.
25. Hughes, T. (1993): Networks of power. Electrification in Western Society, 1880-1930
(Third edition), The Johns Hopkins University Press, Baltimore/London.
26. Leite, E. (2013). An academic contribution toward qualitative evaluations of surprise
business takeover attack: an historical perspective. Ph.D. Thesis, UTAD, Vila Real,
Portugal.
27. Marx, K. (1977). Capital. New York: Vintage Books.
28. Michels, R. (2001 [1915]). Political parties: a sociological study of the oligarchical
tendencies of modern democracy, Batoche Books, Kitchener.
29. Mosca, G. (1884). Sulla teórica dei governi e sul governo parlamentare. Studii storici e
social. Torino: Loescher.
30. Mosca, G. (1923). Elementi de scienza política. Turim: Fratelli Bocca Editori
31. Mosca, G. (1939 [1896]): The ruling class, Westport: Greenwood Press.
32. Mosca, G. & Bouthoul, G. (1936). Histoire des Doutrines Politiques depuis l’Antiquité
jusqu à nous jours. Paris: Payot.
33. Pareto, V. (1991 [1901]): The rise and fall of the elites. An application of theoretical
sociology, Transaction Publishers, New Brunswick, New Jersey.
34. Poirier, J., Clapier-Valladon, S. & Raybaut, P. (1995). Histórias de Vida Teoria e Prática.
Oeiras, Portugal: Celta.
35. Portugal, S. (2007). “Contributos para uma discussão do conceito de rede na teoria
sociológica”. RCAAP, EBSCOhost (accessed March 18, 2016).
36. Ritzer, G. (1979). “Toward an Integrated sociological Paradigm.” In: W. Snizek et al. (eds).
Westport, Conn.: Greemwood Press: 25-46.
37. Ritzer, G. (1981a). Toward an integrated Sociological Paradigm: the Search for an
Exemplar and an image of the subject Matter. Boston: Allyn and Bacon.
38. Ritzer, G. (1996). Modern Sociological Theory, McGraw-Hill book Co.
39. Cecil Roth (1977). Doña Gracia of the House of the Nasi. The Jewish Publication Society,
Philadelphia-Jerusalem.
40. Sombart, W. (1928, orig. 1909). Le bourgeois: contribuition à l’historie morale et
intellectuelle de l’homme économique moderne. Retrieved on 13 de March 2016 in:
http://classiques.uqac.ca/classiques/sombart_werner/le_bourgeois/le_bourgeois.html
41. Sombart, W. (2001, orig. 1911)). The Jews and modern capitalism. Ontario: Batoche books
Ltd.
42. Spacey, K., Rudin, S., Brunetti, D., et al. (Producers) (2010). The social network [Film].
Culver City, CA: Columbia Pictures.
43. Usque, S. (1965). Consolations for the Tribulations of Israel. Philadelphia: Jewish
Publication Society.
44. Weber, M. (1930). The Protestant Ethic and the Spirit of Capitalism, Unwin Hyman,
London & Boston.
45. Weber, M. (1958): The protestant ethic and the spirit of capitalism. New York: Scribner.
46. Weber, M. (2003). The Protestant Ethic and the Spirit of Capitalism. Translated by Talcott
Parsons originally published by Scribner, New York 1958, Library of Congress.
47. Wiley, N. (1988). “The Micro-Macro Problem in social Theory”. Sociological theory 6,
254-261.
48. Wright Mills, C. (1956): The power élite, Oxford University Press, New York/London.

63rd International Scientific Conference on Economic and Social Development – "Building Resilient Society" - Zagreb, 11-12 December, 2020
133
REVOLUTION IN INDUSTRY AND EVOLUTION IN EDUCATION OR
DEVELOPMENT OF INTELLIGENCE
Venelin Terziev
Georgi Rakovski Military Academy, Sofia, Bulgaria
University of Rousse, Rousse, Bulgaria
Kaneff University Hospital, Rousse, Bulgaria
Marusya Lyubcheva
University “Prof. d-r Assen Zlatarov” – Bourgas, Bulgaria
Olga Andreeva
Rostov State University of Economics, Rostov-on-Don, Russia
Marin Georgiev
Kaneff University Hospital, Rousse, Bulgaria
ABSTRACT
For almost ten years now, Europe has been existing and focusing on three main goals –
intelligent, sustainable and inclusive growth. All resources are organized and mobilized to
achieve them, but it is more than obvious that education and science have a leading role. On
the one hand, because these goals are a continuation of the paradigm for creation of
“knowledge-based economy” introduced in 2000, but on the other hand, because it is clear that
modern technical and technological development is at such a stage that without science and
innovation fast growth in development cannot take place. Without underestimating other types
of growth, the intelligent is the one that performs the basic functions of achieving economic
growth related to innovation, high efficiency, quality, productivity and overall sustainable
development. The goal of the present publication is to study the process of technological change
as revolutionary and the period of our development today as Industry 4.0.
Keywords: Revolution, Evolution, Industry, Intelligent development
1. INTRODUCTION
When talking about evolution and revolution, irrespective of the fields, we always mean
historical transitions and relations between the past, present and future. In terms of education,
it is clear that the periods in which results of the changes are reported differ from those in other
fields, due to the specifics of the system and the longer period of obtaining relevant results:
extended by at least 10 years, during which a person begins and completes at least the first stage
of their education (Terziev, Bogdanova, 2019). This period is indefinite and long enough to
analyze data from past periods, but it is necessary to move forward. Considering that we are
currently living in a period of Industry 4.0, as well as the growing importance of education in
the modern world, we need to be ready with these analyses, models and with the interaction of
education with other systems in order to be able to define its future, even though it sounds
conditional at the moment, because “tomorrow will always be late”. In practice, it all starts with
education and education must be seen as part of the political, economic and social relations in
general in the context of globalization. Transformations in social and economic development
in the first decade of the 21st century are a serious challenge to sustainable development and

63rd International Scientific Conference on Economic and Social Development – "Building Resilient Society" - Zagreb, 11-12 December, 2020
134
economic growth, education being part of them. It is indisputable that technological and
technical development has passed and will continue to pass through different stages, but we
need to assess it on the basis of today's state and interaction between the various elements that
influence today`s and future periods. There are several key areas that determine the level of
economic growth today – information and communication technologies, digitalization, low-
carbon economy, i.e. the high-tech industry. These key areas are linked to global development
goals. There are several key systems that support these economic areas - education, science and
innovation, each of them being specific, evolving at different speeds, by different mechanisms
and not negligible comparing to others (Terziev, Lyubcheva, Solovev, 2020).
2. EVOLUTION OF EDUCATION
For almost ten years now, Europe has been existing and focusing on three main goals -
intelligent, sustainable and inclusive growth. All resources are organized and mobilized to
achieve them, but it is more than obvious that education and science have a leading role. On the
one hand, because these goals are a continuation of the paradigm for creation of “knowledge-
based economy” introduced in 2000, but on the other hand, because it is clear that modern
technical and technological development is at such a stage that without science and innovation
fast growth in development cannot take place. Without underestimating other types of growth,
the intelligent is the one that performs the basic functions of achieving economic growth related
to innovation, high efficiency, quality, productivity and overall sustainable development
(Terziev et al. 2020a; Terziev, Dacheva, 2020b). Today we define technological change as
revolutionary and the period of our development today as Industry 4.0. It is not difficult to trace
the transformations in the development of technologies - from 1 to 4, to assess the complexity
and changes they have caused to various aspects of people's lives, such as everyday life, culture,
work and leisure. Changes that shape the labour market, the living environment, the political
system, technology and human identity.
Figure 1: Transformations of technology (Индустрия – Industry)
If Industry 4.0 is a tendency in the development of automation and data exchange in production
technologies, then we need to think about what basis for this development education and
research offer, being inextricably linked to technological development. Should education be
measured as Education 4.0 to ensure that it is sufficiently consistent with industrial
development? Can we talk about Science 4.0 to provide the necessary basis for technological
development? And if they exist in space today or as some options for the future, what is the real
situation of their interaction with industry?

63rd International Scientific Conference on Economic and Social Development – "Building Resilient Society" - Zagreb, 11-12 December, 2020
135
2.1. Industry Х.0., Education У.0., Distance
The rate of new knowledge and skills accumulation in the last decade of the XX and the first
decades of the XXI century is very different from that of the implementation of technological
solutions. Until now, the educational and scientific base supported the technological
process/progress well enough. At one point, however, the distance between education and
science on the one hand and technology on the other, as separate systems, began to increase not
in favour of synergies in economic growth. Such an imbalance is impossible to occur and last
for a long period of time, i.e. the education cannot sustain the Fourth Industrial Revolution,
because it is at lower stages than the fourth level. In fact, we still can't talk about Education 4.0,
but is it possible for both systems to develop at the same speed? The answer lies in a systematic
analysis of education in particular. It is well known that education, as a sufficiently conservative
system, develops in an evolutionary rather than a revolutionary way. This means we need to
find the right matching models between education and Industry 4.0 so that there is no slowdown
in technological development, rather than focusing on whether it is level 4.0 or not. If the
correlation between education, science, and technology is as described above, what are the
factors that determine revolutionary technology in evolutionary educational development? And
how long can this discrepancy exist? Is it possible to achieve intelligent growth with such
correlation? The answer to this question can be yes and no. At first glance, we should answer
no, because this discrepancy could create problems for the whole development process. The
deeper answer to this discrepancy must be sought in the differences of the systems and their
essential characteristics, which determine the mechanisms in their internal changes - principles,
factors and criteria. The education system predetermines the other two (science and
technology). The accumulation of a sufficient basis in terms of quantity and quality is necessary
for the development of research and technology. The axis of this dependence is one-way, but
there are branches, though not decisive in this process. It is this accumulation and renewal of
the theoretical and informational content of the basis that determines everything else. The
conservative model gives the impression of a “slow” development of education - because there
is no way to remove from the education system fundamental theories and facts that have been
in textbooks for centuries and will continue to exist, unlike some fast-changing databases and
information content. The education system itself contains an interaction between fundamental
knowledge, databases and information in order to achieve transformed knowledge, which is
relevant to each period of development whether we call it “’Industry 2.0” or “Industry 4.0”.
The evolution of education means it is impossible to change the fundamental knowledge
“revolutionary” or too radically. We see examples in which radical changes, albeit in non-
technologically defining fields, cause serious conflicts. The fundamental theories in
mathematics, physics, and chemistry are part of the continuous fundamental basis. They also
change, or rather complement each other, which happens consistently and systematically,
sometimes looking back or establishing data and facts. The process can be identified as “two
steps forward, one back” and can be associated with upgrading and adaptation, but in any case
we need confirmation, which takes a long time. For example, the laws of physics (Newton,
Einstein, Lomonosov), the laws of thermodynamics, the Periodic table will continue to be
studied, regardless of the name under which it exists in different countries and so on. It took a
tremendous amount of quantitative research so that mathematics could become the foundation
of computer technology – but no one can remember the names of all those who have invested
in this long period of intellectual potential and effort, except one or two. This also fully relates
to the advances in chemical and physical sciences that contributed to the creation of new
materials for computers, but the computer is a fact and so is computer technology. (When we
talk about the development of computer technology, we tend to forget the education behind it).
All these fundamental laws, in accordance with new discoveries and additions, are included in
the transformed knowledge, which in turn should be considered part of the era.

63rd International Scientific Conference on Economic and Social Development – "Building Resilient Society" - Zagreb, 11-12 December, 2020
136
On the basis of the transformed knowledge (including through the introduction of ICT
education and other modern achievements with basic value) science and technology have been
developed, which in a certain sense and certain period become autonomous, and can now cause
changes much faster, which we consider as “revolutionary”. This is exactly what happened with
information and communication technologies, with digital technologies, so that we can talk
about Industry 4.0. This means that there is a secondary process, which, with the help of
education (in its current state), causes accelerated development and achieves other parameters
of development in which computerization, digitalization, e-control, DG networks find their
defining place. This also means something very important - the structure of the educational base
can be considered as concentric - central part with a strong evolutionary character and
peripheral circles in different areas where movement is accelerated - self-developing spaces in
which there is a reduction in the length of scientific -technological chains. In this sense, the
evolution of education and the creation of transformed knowledge have actually provoked the
possibility of revolutionary scientific and technological solutions and this has created the next
paradigm with the participation of knowledge - formulated as a knowledge triangle (knowledge
– research – innovation). In other words, the discrepancy has become compliance.
Figure 2: Evolution of education
It has become very common to talk about a knowledge triangle between education, science and
business and with its help explain much of what is happening or not happening in the interaction
between the individual elements. In recent years, this triangle exists in another slightly modified
version: education - research - innovation. We use them in different contexts – in one case
subjective, in the other case as process. However, both options are important enough to ensure
growth and intellectual growth above all, as will be discussed later. In the period of Industry
4.0 we often talk about digital education. The question is what is meant by “digital education”
and to what extent it exists today. An almost systemic error is made here. The digitalization of
education is seen as the introduction of information and communication technologies in
learning process in various disciplines, as a method of teaching and learning. The content of the
educational elements can be presented in different ways, but this does not change its essence.
Rather, it changes its perception. Therefore, other criteria should be considered in terms of
educational models. It is still not enough to work on computers and tablets at school and use
electronic platforms to call education digital. We can upload knowledge from the 19th century,
a lecture course from the 20th century or even older on the platform.

63rd International Scientific Conference on Economic and Social Development – "Building Resilient Society" - Zagreb, 11-12 December, 2020
137
These methods are undoubtedly significant, but are insufficient and do not define education as
digital. It is necessary to change the content of the basis, both fundamental and peripheral in
order to derive new transformed knowledge about the new technology as the content of
processes, mechanisms, and interactions. Adapted to the current situation, learning content is
the key word in education. The integration between methods and content, and if both meet the
definition of digital, then so does the educational model. The changed content should make it
possible for the school to train experts with high-level skills, including high digital skills for
different sectors (digital management of organizations, digital technology management, high
technology, digital commerce, digital data exchange, skills for problem solving in different
areas, integrated skills, complex competencies), but if the need to change the curriculum is
perceived as a formality, then the problems will continue to accumulate and education will
continue to lag behind. Schools and universities as educational institutions are responsible for
bringing education as close as possible to the revolutionary nature of technology, which means
complexity - starting from the types of structures, going through the organizational elements,
tools and reaching quality. Administrations and teaching communities direct their efforts to this
process and more precisely to its improvement. Rethinking education in this context is an
important step – continuously updated content, combined with new teaching methods and
teaching staff who are aware of their responsibility in terms of development. A next important
task is to develop real digital education by creating platforms for the exchange of transformed
knowledge (Kyriakopoulos et al. 2020c; Solovev et al. 2020d). Knowledge sharing is already
becoming a paradigm of development. It is not enough to provide knowledge at
university/school only for its pupils and students. Knowledge must reach the maximum number
of users. Many people study outside of school and university.
3. EVOLUTION VERSUS REVOLUTION IN EDUCATION
Is it possible for education to develop revolutionary? How to influence the acceleration of
evolutionary changes in education? The questions we are seeking answers to are whether
Bulgarian education is ready for the challenges of today's interconnected and digitalized world,
whether it possesses necessary skills, how to rethink the concept of uninterrupted education and
what the place of vocational education in it is, as well as what the current policies to meet the
needs of the future are. Influencing development is not only possible, but is a natural move in
the interaction between the elements of a system or the systems between each other. As far as
the education system is the one that mainly implements and spreads knowledge, we need to talk
about both knowledge and education. The influence is defined as a result of various factors,
depending on the concentricity of the structure of knowledge accumulation, as well as
depending on the structures that shape knowledge. The conservatism of the education system
is one of the main factors with which we associate the slower changes in the system. It is
expressed both in its structure and content. The structure related to the types and kinds of
schools, the models for the implementation of education, the networks of educational structures,
the establishment of universities and colleges – these are issues whose decisions go through a
long process of regulations, legal procedures, administrative acts, etc. Of course, there are
changes, but in their essence they are partial, sometimes when we don't like them, we define
them as "made in pieces". Some of them do not lead to any improvement and acceleration in
the development of the system, they are useless and even harmful (such as the transformation
of technical schools into vocational schools). Others lead to significant changes and a sense of
improvement, but the analyses, although difficult to make their way, show different results (as
was the transformation of all high schools into universities). Content is also hard to change due
to state educational requirements and standards. Knowledge at its core changes slowly enough
to keep the necessary foundation. In this sense it is especially important to maintain balance, as
well as to influence all areas.

63rd International Scientific Conference on Economic and Social Development – "Building Resilient Society" - Zagreb, 11-12 December, 2020
138
Because when we talk about education of the future, we must not forget about all the
interdisciplinary and creative cultural connections, without which the general development
would be distorted. The changes in education are also correlated with the methods used in
training carried out faster due to the introduction of results from research and industrial
development, i.e. we can observe the feedback effect. Here is the role of ICT and other methods
in the educational process, which facilitate the perception of knowledge, and with which
education comes out to some extent of its conservatism and approaches Industry 4.0 faster, but
this still cannot be called a revolution. The conservatism of the education system was to some
extent overcome by several important steps taken after 2000 that affected its quality and the
pace of change - the Lisbon Strategy (defining education criteria), the Bologna process and the
introduction of easy-to-understand and comparable education degrees (bachelor, master and
doctor); introduction of academic credit system (ECTS) as units of student employment;
introduction of European quality dimensions; removal of the existing obstacles to the free
movement of students and teachers in the European area (European and National Qualifications
Frameworks, introduction of key competencies (mother tongue, mathematics, foreign
language), introduction of the Lifelong Learning Programme. Where do these new elements
lead in the education? They are not fundamental by themselves, but they have an added value
as peripheral and organizational elements that improve education, image of the educational
foundation and increase the sustainability of the educational base. The transfer of knowledge
and skills, which in turn underlie the research and technological process, is part of the impact
on the evolutionary development of education, which increases its usability. There is another
element in the evolutionary model of education that is worth considering and that is shared
knowledge. Shared knowledge is the semantic content of education as a whole, because going
beyond individual possession knowledge is being used by communities, i.e. from individual it
becomes communal or corporate. This is also a factor in accelerating the development of
educational models. Shared knowledge expands the perimeter of transformed knowledge, and
can relate to some extent to non-formal or informal education and can significantly affect the
rate of change in the education system without radicalism, from which content may be lost. The
transition from individual to corporate knowledge provides another opportunity for realization
and this is a new paradigm – knowledge management. Perhaps this is the closest thing to the
changes in the educational system towards the revolutionary nature of technology, because the
mechanisms used in knowledge management, in addition to using computer technology and
devices, incorporate technological content that greatly upgrades the fundamental and peripheral
basis of education. In the third place is the issue of leadership in education. It is time to talk
about leaders in education in the full sense of the term. No strategy or any document can replace
the role of the leader in education - a factor that determines the true criteria for quality,
dissemination and implementation of knowledge, this is the way towards faster evolution. One
of the tasks in the management of education is to make leadership in the system as a defining
characteristic feature and not only formally, but together with the responsibility it brings. The
leader in education (teacher of the future) is a constantly improving professional with
willingness, intellect and high emotional intelligence, who being in constant interaction with
other systems can identify and provoke those skills that will make people successful.
Knowledge societies can also find a place in every school and university. It is through them
that interdisciplinarity can be achieved, which is also very important for the development of
education. The categorization as “innovative schools” and “research universities” is possible to
detach a part of the young emerging intelligent people and give them a higher start for
development, but it must be combined with the parameters of the whole educational
environment in order not to contradict the general principles of development and to avoid the
possibility of creating conflict between the individual elements, groups or even regions. The
curriculum is structured, subject to educational standards and in its sense is uniform for the

63rd International Scientific Conference on Economic and Social Development – "Building Resilient Society" - Zagreb, 11-12 December, 2020
139
respective types of schools. The standards should ensure the possibility of a change to be
introduced before the end of a full course of study. This will ensure the evolution of education,
corresponding to evolutionary or revolutionary changes in social processes. Universities are
quite liberal in terms of curriculum. Evolutionary changes in university education are more
favourable due to the fact that in addition to teaching (educating) they are engaged in research,
elements of which can be included in teaching programmes. These activities determine criteria
and indicators through which the necessary control is executed, ratings are made and the quality
of implementation is assessed. The educational environment, perceived as ecosystem, is
extremely specific in order to be regulated sporadically with pseudo-creative tools or with
frequent changes in the legislation. It has a clear hierarchical pyramidal structure, as have all
the stratification systems, the top of which is always occupied by the experts with their highest
potential - those who bring change and can bring the system as close as possible to the
requirements of society. In other words, the creativity of the young generations, provoked by
the teacher and the educator, must develop in such a way as to ultimately produce high expert
potential in the full meaning of the term.
4. RESEARCH AS PART OF THE PARADIGM OF A REVOLUTION IN
TECHNOLOGY
The transition from education to research is a natural way to technological development.
Universities and research centres are the main carriers of research potential and have
independent significance, but in order to reach a technological product, unconditional
interaction with an industrial operator is required. The nature of this interaction actually
determines the nature of the industrial period. The Industrial Revolution 4.0 is driven by the
transition from automated to digital systems – as part of research efforts in mathematics,
physics, chemistry on the one hand and applicable technological solutions in computer systems
on the other. Accumulated database allow research to become innovative technologies that are
applied in industry, move fast enough and generate new solutions on their own, as well as offer
economic growth. The distance between research and technology is much smaller than between
education and science or education and industry. On the one hand, science employs human
capital with high expertise (knowledge, skills and competencies acquired in the education
system and outside of it), who work in a synergistic model in terms of methods and tools for
research and technology development. This leads to a shortened period of research chains and
offering implementation solutions to the business, which change the essence of the industrial
age. The factors that determine the changes both in the research system and in the “science –
business – innovation” (Terziev, Lyubcheva, Solovev, 2020) interaction are human capital,
financial resources and international cooperation. Interventions to accelerate research are
related to the creation of various structures, agencies and institutions. One of the leading
structures at European level is the European Institute of Innovation and Technology, whose
mission is to strengthen the EU's innovation capacity “by promoting synergies and cooperation
between academic, research and innovation activities that meet the highest standards, including
by promoting entrepreneurship”. The knowledge societies that underlie the development of
projects in various scientific fields, incl. for building strategies for science development, centres
of excellence, etc. The changes taking place in all sectors of socio-economic life obviously
reflect on the capacity of human capital. Efforts to improve the capacity and competencies of
the human resources have their reflection in various instruments - programmes and programme
documents – Rethinking higher education, New Skills Agenda for Europe, financial instruments
– Horizon Programme. All this, together with the idea of a targeted innovation policy that
encompasses both science and technology systems, contributes to some compensation for the
distances between systems. The research, divided into separate programmes of different
institutions (EC, national institutions, agencies) are supported by serious tools, which makes

63rd International Scientific Conference on Economic and Social Development – "Building Resilient Society" - Zagreb, 11-12 December, 2020
140
the progress in science tangible. They involve transnational cooperation, networking, mobility
and cover interdisciplinary areas, which is crucial for the realization of revolutionary
discoveries. That is why investment in research and innovation, which we define as investment
in the future, are so crucial. WHERE ARE WE? They create an environment to improve
competitiveness and allow businesses to create more and better jobs. Strengthening industrial
innovation, including investment in key technologies, easier access to funds and support for
innovative entrepreneurship, are among the important steps in developing the synergies
between research and innovation. Research and innovation policies ensure that technological
breakthroughs and revolutionary solutions become viable products with real potential and high
added value, which is beneficial for society by improving the quality of life.
5. GROWTH OF INTELLIGENCE - A SYMBIOSIS OF KNOWLEDGE AND HUMAN
RESOURCES
None of the areas mentioned above can be considered separately from human resources/human
capital. The centre of the knowledge triangle, recognized as a model for growth of intelligence,
is MAN, the bearer of knowledge, the one who does research and implements innovations. In
this sense, human resources and their development are crucial for the development of any
organization and company, as well as for growth of intelligence in general. Growth of
intelligence is driven by several essential elements:
• education – encouraging people to learn and develop their skills;
• research – supporting research teams (knowledge communities) in the field of high
technology, ICT, climate change, etc.;
• innovations – creating new products/services, that generate growth and jobs and help solve
social problems;
• digital society – using information and communication technologies.
Growth of intelligence is a continuation of the idea of creating a knowledge economy translated
into a new language, namely the realization of the knowledge triangle in which universities,
research institutes and centres play a significant role. This is where the expert human
resource/capital intersects with the ideas of innovation and technological development.
Universities and research centres in their dual role - to prepare and develop human resources
on the one hand and to create innovations on the other, have a very significant contribution to
the realization of intelligence growth. That is why the support for universities at all levels is
essential, using various means, incl. political, financial, organizational and legislative.
6. CONCLUSION
Leading initiatives of intelligence growth are related to the accelerated development in the field
of digital technologies, the establishment and functioning of the Innovation Union, the
establishment of the “Youth on the Move” programme (Terziev, 2020e). Integration between
research and innovation created by human capital is implemented in intelligent growth through
various tools and initiatives. The “scientist at the centre” is the message that makes it clear that
human resources are the driving force. Through the symbiosis education-science-innovation
and with human driving force the distance to Industry 4.0. is decreasing. The functioning of a
common European research area is a necessary condition in this process, due to the need for
internationalization of research driven by globalization. The role of not only integration as a
principle, but of partnership between the subjects as a model is growing. Universities are one
of the most active in the implementation of international partnerships – leaders in ideas,
creativity, forecasting and determining directions of development. It should be emphasized that
in Bulgaria we need to create internal partnerships, which would have a very positive impact
on the regional development of the country.

63rd International Scientific Conference on Economic and Social Development – "Building Resilient Society" - Zagreb, 11-12 December, 2020
141
The country has a rich network of universities and colleges, but unfortunately none of the inter-
university networks like those in other countries that work actively, efficiently and successfully.
And this is the way to create centres of excellence. I should say that whatever strategies we use,
if there is no partnership and the creation of university expert teams, there can be no success.
Nor will it be enough to use partnerships with universities abroad, for which Bulgarian
universities usually play a secondary role. It is not about official cooperation, ensured by
contracts that often do not work, but about creating expert teams that implement partnership
and cooperation. And in addition to building partnerships, it is essential that they are
sustainable, i.e. that they have long-term business prospects. And thirdly - the interaction with
business. Research will not be alive if it is not done. Technologies change so fast that if a created
innovation is not implemented within a year, it irretrievably loses its value and if it is not created
in partnership with the business in our country, the business will get same or similar technology
from abroad. Research shows exactly such situations – business prefers to trust an imported
innovation than one created by our university or institute. Which in turn gives a chance for
higher growth of the foreign economy. This is the reason why we are talking about the need to
achieve integrated growth not only at the EU level, but also in our country – a national
expression of it. In the context of intelligence growth, the best option is to include business
representatives in the expert partner teams. It is also about building trust between science and
business, which is part of the value system of the current industrial age. Among the prerequisites
for the realization of intelligence growth, and with its increasing importance, is the development
of start-ups and entrepreneurship. They are again based on the leading role of human capital
and the research-innovation interaction. Their future in our country is just as important as in
Berlin, Lisbon and Stockholm. Each era has its own industry that symbolizes it. In the 19th
century, these were the railway companies. Car manufacturers, radio and television channels
and information and communication technology companies have marked the 20th century.
Now, in the 21st century, is the time of digitalization and of the start-ups and entrepreneurship
that use and develop it. Their advantage is not simply in the implementation of new
technologies. A start-up in a key area is much more than a small or young company that applies
digital technology to its work. This is something much more important. It is a combination of
values and technology! What are the key values embedded in their DNA? Ambition, speed,
entrepreneurship, striving for leadership. They strive to occupy a central place in their
environment, in their ecosystem, to dominate it. The difference is in tradition and innovation,
in routine and leadership, in human capacity and the combination of human capacity and
digitality, in following well-known paths and tolerable risk. This type of entrepreneurs has led
technical progress through all the industrial revolutions, but of course at different levels. This
is the new type of business model that breaks traditional connections and creates huge network
potential that can solve a given problem at once and lead it to a successful end. It's like a race
where only the first ones win. The battle not only for profit, but also for leadership, which brings
many other benefits, is what motivates them. Start-ups covering key economic areas definitely
possess revolutionary innovative achievements. This is contagious and is already moving into
a new trend for the development of key areas, namely the creation of artificial intelligence. This
is a product of this same human capital, which is already on its way and is very likely that the
next industrial period will be connected with it.
LITERATURE:
1. Terziev, V., Bogdanova, M. (2019). The academic capitalism and the new business model
of the universities. // Proceedings of ADVED 2019 - 5th International Conference on
Advances in Education and Social Sciences, 21-23 October 2019, International
Organization Center of Academic Research, Istanbul, Turkey, 2019, pp. 477-484, ISBN:
978-605-82433-7-8.

63rd International Scientific Conference on Economic and Social Development – "Building Resilient Society" - Zagreb, 11-12 December, 2020
142
2. Terziev, V., Lyubcheva, M., Solovev, D. (2020). The interaction: business - education -
investment for development. // Proceedings of INTCESS 2020- 7th International Conference
on Education and Social Sciences 20-22 January, 2020 - DUBAI (UAE), International
Organization Center of Academic Research, Istanbul, Turkey, 2020, pp. 865-869, ISBN:
978-605-82433-8-5.
3. Terziev, V., Dimitrovski, R., Pushova, L., Georgiev, M., Solovev, D. (2020a). Change
management and digital age training. // Proceedings of INTCESS 2020- 7th International
Conference on Education and Social Sciences 20-22 January, 2020 - DUBAI (UAE),
International Organization Center of Academic Research, Istanbul, Turkey, 2020, pp. 730-
738, ISBN: 978-605-82433-8-5.
4. Terziev, V., Dacheva, I. (2020b). Innovations in Bulgarian education. // Knowledge –
International Journal Vol. 38.2, Institute of Knowledge Management, Skopje, N.
Macedonia, 38, 2020, 2, pp. 343-347, ISSN 1857-923X (for e-version), ISSN 2545 – 4439
(for printed version).
5. Kyriakopoulos, G., Solovev, D., Kuzora, S., Terziev, V. (2020c). Exploring research
methods and dynamic systems toward economic development: an overview. // Proceeding
of the International Science and Technology Conference “FarEastСon 2019”, October
2019, Vladivostok, Russian Federation, Far Eastern Federal University, Smart Innovation,
Systems and Technologies, vol 172. Springer, Singapore, 2020, pp. 1-29, (Online)
ISBN978-981-15-2244-4, (Print) ISBNOnline ISBN978-981-15-2243-7.
6. Solovev, D., Kuzora, S., Kyriakopoulos, G., Terziev, V. (2020d). Algorithmic approach to
the assessment of innovation. // Proceeding of the International Science and Technology
Conference “FarEastСon 2019”, October 2019, Vladivostok, Russian Federation, Far
Eastern Federal University, Smart Innovation, Systems and Technologies, vol 172.
Springer, Singapore, 2020, pp. 31-50, (Online) ISBN978-981-15-2244-4, (Print)
ISBNOnline ISBN978-981-15-2243-7.
7. Terziev, V. (2020e). Factors influencing education system. // Economic and Social
Development (Book of Proceedings), 50th International Scientific Conference on Economic
and Social Development Development, 13-14 February 2020, Chelyabinsk, 2020, pp. 651-
656, ISSN 1849-7535.
63rd International Scientific Conference on Economic and Social Development – "Building Resilient Society" - Zagreb, 11-12 December, 2020
143
ANALYSIS OF SELECTED PROBLEMS OF THE MODERN WORLD
IN THE CONTEXT OF MUNICIPAL WASTE MANAGEMENT
Karolina Gwarda
Gdynia Maritime University, Poland
ABSTRACT
Mankind has long struggled with the problem of waste, but it was not until the nineteenth-
century industrial revolution that a sharp increase in production and an avalanche of new
inventions started generating huge amounts of problematic and increasingly harmful waste.
The problem of waste as a global threat to the environment is therefore an entirely new
phenomenon, fully determined by human activity over the past 200 years. However, looking
through the prism of the growing global population, urbanization and excessive consumerism,
it can be expected to become even more burning. The aim of the article is to show selected
causes and effects of improper municipal waste management in a global perspective. The
analysis was performed taking into account demographic, social, urban, raw-materials, energy
and environmental factors.
Keywords: municipal waste management, solid waste management
1. INTRODUCTION
The picture of the modern world, inhabited by over 7.7 billion people (UN, 2019, p. 1) spread
across more than 190 countries, is extremely diverse in many ways. Projections for the coming
decades show that the Earth is on the brink of a significant demographic explosion. However,
mankind is increasingly aware of the fact that the world is beginning to grapple with many
issues and threats that until recently did not exist or passed unnoticed. Very often, due to
economic and financial motives, as well as the sheer scale of these emerging phenomena, they
have a global outreach and by default assume global dimensions. What is more, because of their
interconnection and interpenetration, problems may quickly escalate and become difficult to
solve. An example is municipal waste, which is a byproduct of everyday human activity that
poses a serious threat to the environment around the world (Ogundipe, Jimoh, 2015, p. 1305).
The reasons for this state of affairs should be sought mainly in demographics, since the growing
global population means increased demand for food whose consumption generates a large
amount of municipal waste. It is also not without significance that the world is becoming an
increasingly urbanized place, while the high standard of living in affluent countries and
overconsumption in emerging markets create a constant, unbridled demand for more and more
goods. In all this, improper waste management contributes to the wastage and depletion of raw
materials, and therefore to economic losses. Using the natural environment as an outlet for
waste leads to environmental destruction and pollution, climate change, air pollution, all of
which have a direct impact on numerous ecosystems and species. The negative effects of
improper waste management come to the foreground especially with regard to raw-materials,
energy and environmental factors. In the following sections, the causes and effects of
inappropriate municipal waste management were analyzed.
2. GLOBAL TRENDS IN MUNICIPAL WASTE MANAGEMENT
According to World Bank data, 2.01 billion tons of municipal solid waste are generated around
the world every year. Worse still, at least 33% of that waste is not managed in an
environmentally safe manner. The amount of waste generated per person per day averages 0.74
kilograms but can range anywhere from 0.11 to 4.54 kilograms. Most municipal waste is
generated by high-income countries - around 34%, or 683 million tons of the world's waste.

63rd International Scientific Conference on Economic and Social Development – "Building Resilient Society" - Zagreb, 11-12 December, 2020
144
Global waste is expected to reach 3.40 billion tons by 2050. It should be noted that there is a
positive correlation between waste generation and income levels. The daily generation of waste
per capita in high-income countries is projected to increase by 19% by 2050, and 40% or more
in low- and middle-income countries. Currently, the region of East Asia and Pacific (23% of
the global amount) generates the largest amounts of waste, while the region of the Middle East
and North Africa accounts for 6% of the world's municipal waste. However, in the fastest
growing regions – that is, Sub-Saharan Africa, South Asia, and the Middle East and North
Africa - the total amount of waste generated is expected to increase more than twofold, or even
threefold, by 2050 (The World Bank, 2018, pp. 3-8). Detailed data on this is shown in Fig. 1.
Figure 1: Projected waste generation, by region (millions of tonnes/year)
(Source: The World Bank. (2018). What a Waste 2.0 A Global Snapshot of Solid Waste
Management to 2050. Retrieved 10.10.2020 from
https://openknowledge.worldbank.org/handle/10986/30317 p.20.)
Unfortunately, more than half of the waste in these regions is currently disposed of in the form
of open dumping, meaning that the projected increase in waste will have serious implications
for the environment, health and the well-being of the world's population. It should also be borne
in mind that the composition of the waste itself depends on the level of income, which is related
to the different consumption and wealth patterns in a society. High-income countries produce
relatively less food and green waste (about 32% of all waste), while generating more recyclable
dry waste such as plastic, paper, cardboard, metal, and glass (51% of waste). Middle and low-
income countries generate 53% and 57% of food waste and green waste, respectively. It should
also be noted that the share of organic waste increases along with the decline in economic
development. In low-income countries, materials that can be recycled make up only 20% of the
waste stream. On average, all regions generate around 50% or more of organic waste, with the
exception of Europe, Central Asia and North America, which generate more dry waste. It is
food waste and green waste that constitute the most numerous group - 44% (The World Bank,
2018, pp. 19-22). A detailed percentage breakdown of global municipal waste is shown in Fig.
2.
Figure Following on the next page

63rd International Scientific Conference on Economic and Social Development – "Building Resilient Society" - Zagreb, 11-12 December, 2020
145
Figure 2: Global waste composition (percent)
(Source: The World Bank. (2018). What a Waste 2.0 A Global Snapshot of Solid Waste
Management to 2050. Retrieved 10.10.2020 from
https://openknowledge.worldbank.org/handle/10986/30317 p.29.)
Another important aspect of waste management is waste disposal and neutralization. In the
global perspective, the majority of waste – about 70% - is deposited in various types of landfills:
open dumps, sanitary landfill with landfill gas collection, unspecified landfill (Chen D., et al.,
2020). Proper waste disposal or treatment is usually practiced in high- and middle-income
countries (where only 2% of waste is landfilled). In lower-income countries, as much as 93%
of all waste is landfilled. Figure 3 shows how to deposit or treat the global municipal waste
stream.
Figure 3: Global treatment and disposal of waste (percent)
(Source: The World Bank. (2018). What a Waste 2.0 A Global Snapshot of Solid Waste
Management to 2050. Retrieved 10.10.2020 from
https://openknowledge.worldbank.org/handle/10986/30317 p.34.)
As can be seen, it is necessary to identify the causes of this global problem and seek
comprehensive solutions that will improve and curb the projected amounts of municipal waste
and the way of its disposal and treatment to make it more environmentally friendly.

63rd International Scientific Conference on Economic and Social Development – "Building Resilient Society" - Zagreb, 11-12 December, 2020
146
3. SELECTED CAUSES OF THE GLOBAL PROBLEM WITH MUNICIPAL WASTE
3.1. Demographic, social and urbanization factors
In a 2019 report prepared by the United Nations’ Department of Economic and Social Affairs,
the so-called medium scenario forecasts the world population to grow from 7.7 billion in 2019
to 8.5 billion by 2030, 9.7 billion by 2050, and close to 11 billion in 2100 (UN, 2019 , p. 1).
Population growth was estimated in three different scenarios, known as: low, medium, and high.
Figure 4 illustrates the past and future evolution paths of the world's population under these
three scenarios over the course of the years 1950-2100.
Figure 4: World population in 1950 - 2100 (three possible variants of development)
(Source: Own elaboration based on Unitet Nations. (2019). World Population Prospects
2019. Retrieved 10.10.2020 from https://population.un.org/wpp/Publications/Files/
WPP2019_Highlights.pdf)
A growing world population leads to increased consumption and thus to an increase in food
demand, which is often markedly unbalanced. Taking into account the current UN population
projections, and assuming that the current lifestyle and consumption patterns remain unchanged
to meet demand, agriculture in 2050 will have to produce 50% more food, feed and biofuels
than in 2012 (FAO, 2017 , p. 62). It is expected that changes in the demand for food will also
be influenced by the demographic structure and spatial distribution of the population. In 2018,
more than half of the global population lived in urban areas (55%), but this percentage is
expected to reach 68% by 2050. Urbanization, coupled with the overall trend of global
population growth, shows that, by 2050, as many as 2.5 billion people could arrive to settle in
urban areas, with nearly 90% of this increase expected to be recorded in Asia and Africa alone
(UN, 2018, p. 5). It can therefore be concluded that the world is becoming an increasingly
urbanized place, but increased urbanization also entails problems with effectively managing
municipal waste for both developing and emerging cities. The global waste crisis would not be
as alarming were it not for mass production and ubiquitous consumerism. It is estimated that
annual consumption in emerging markets will increase to USD 30 trillion by 2025 (compared
to USD 12 trillion in 2010), accounting for nearly 50% of global consumption (compared to
32% in 2010). It is also forecasted that the number of inhabitants with sufficiently high incomes
will become significant consumers of goods and services. Referring to the trend of urbanization,
about 600 million people are projected to live in just 440 cities located in emerging economies
alone (McKinsey Global Institute, 2012, p. 1). Global economic growth increased fivefold
between the 1950s and 2009. In 2019, world GDP growth stood at 2.4%, the lowest record since
2009. According to Central Bank forecasts, the upcoming years are likely to look as follows in
terms of GDP growth: 2020 - 2.5%, 2021 - 2.6%, 2020 - 2.7%.

63rd International Scientific Conference on Economic and Social Development – "Building Resilient Society" - Zagreb, 11-12 December, 2020
147
4. SELECTED EFFECTS OF THE GLOBAL MUNICIPAL WASTE PROBLEM
4.1. Raw-material and energy factors
For years, human society lived under the conviction that water, air and soil resources are
unexhaustive. This led to constant exploitation of natural resources, largely by urban
populations, thus giving rise to an uncertain future for all of us. Rapidly urbanizing emerging
economies and their increasingly well-off consumers are now the driving source of demand for
the world's dwindling capital and depleting natural resources. That is despite the fact that, over
time, this will inevitably result in reduced economic growth and possibly also continuous
fluctuations in the price of raw materials. Current consumption patterns are so that the demand
for natural resources already exceeds 41% of the Earth's spare production capacity. If these
consumption and production trends are maintained until 2030 and the projections of 11-billion
population hold true, human species will soon need a new planet Earth to retain its current
lifestyle and consumption (WWF, 2016, p. 15). In a human-footprint analysis prepared by
Global Food Network, a non-profit organization that develops tools to promote sustainable
development, including the ecological footprint measuring the amount of resources owned and
used, the annual pool of natural resources for 2020 was exhausted on August 22 (the global
economic crisis caused by the coronavirus pandemic delayed the day of crossing the ecological-
debt threshold by three weeks). The report compiled by the International Resource Panel (IRP)
think tank, which is part of the UN Environment Programme, concluded that the amount of raw
materials extracted by the broadly understood industry has tripled in 40 years. In 1970 it was
22 billion tons, compared to 70 billion tons in 2010. This data included basic materials such as
biomass, fossil fuels, metal ores and non-metal minerals (UNEP, 2016, p.5). As can be seen,
the demand for resources is increasing at an unsustainable pace. By 2017, the world
consumption of these materials reached 90 billion tonnes. By 2050, the consumption of primary
raw materials is expected to increase to 186 billion tons, provided that current consumption
trends are maintained (Hatfield-Dodds S.et. all, 2017, pp. 403-408). The impact and rate of
growth vary depending on the type of natural resources. Under current trends, fossil fuel
extraction are set to increase by 53% between 2015 and 2050, biomass and metal ore extraction
will rise by 87% and 96%, respectively, while non-metallic raw materials are projected to
increase by 168%. Figure 5 shows the current and forecasted (based on current growth trends)
global resource extraction divided into four categories (biomass, fossil fuels, metal ores and
non-metallic minerals) in the years 2010-2050.
Figure 5: Global resource extraction 2010-2050
(Source: Hatfield-Dodds S.,et.all. (2017). Assessing global resource use and greenhouse
emissions to 2050, with ambitious resource efficiency and climate mitigation policies. Journal
of Cleaner Production, 144, p. 409)

63rd International Scientific Conference on Economic and Social Development – "Building Resilient Society" - Zagreb, 11-12 December, 2020
148
It is estimated that four of the nine planetary boundaries have been crossed irreversibly,
changing the functioning of the main processes in the earth system (IRP, 2017, p. 17). Needless
to say, this accelerated demand for raw materials and their overexploitation comes with
alarming implications for the environment. The high standard of living in industrialized
countries and the overconsumption in emerging and developing markets create a constant,
unbridled demand for an ever greater amount of commodities, natural resources and energy.
Ultimately, this may deplete essential natural resources, cause price fluctuations that can trigger
armed conflicts, and further aggravate climate change from the enormous energy inputs
generated by their extraction, consumption, transportation and disposal.
4.2. Environmental factors
Embedding natural environment in the management process leads not only to the scarcity,
depletion and overexploitation of resources for the sake of meeting society's growing needs,
but also to environmental destruction and pollution. The negative impact of municipal waste on
the environment is significant and burdensome, especially in heavily populated areas such as
cities. Landfills are repsonsible for releasing methane into the atmosphere, Methane is a
powerful greenhouse gas contributing to climate change and it arises from the presence of
microorganisms and biodegradable waste, such as food or paper, in landfills. Methane (CH4)
stays in the atmosphere much less time than carbon dioxide, but it has a much more pronounced
greenhouse effect. It is estimated that, between 1990 and 2005, global CH4 emissions from
landfills increased by around 12%, from 706 to 794 Mt CO2. Between 2005 and 2030, emissions
are projected to increase by around 21%, from 794 to 959 Mt CO2. The growing global
population, ever-wealthier societies and progressive industrialization all result in the incrased
amount of waste generated and are factors driving this trend to new extremes. An equallly
important environmental issue faced by the modern world in the context of municipal waste is
the pollution of the Earth with plastic, which is used for the production of packaging among
other other purposes. In 2016, a total of 335 million tons of plastics were produced in the world
(thermosets and thermoplastics, polyurethanes, adhesives, sealants), 18% of which is owed to
the production having place in the European Union. Over the last 50 years, the amount of
plastics produced increased nearly twentyfold. Unfortunately, there is no hope for a reversal of
this global trend, although in Europe the level of production has remained fairly stable over the
last ten years (Fig. 6).
Figure 6: Global plastic production from 1950 to 2016 (in million metric tons)
(Source: The Statistic Portal. Retrieved 09.09.2018 https://www.statista.com/statistics/
282732/global-production-of-plastics-since-1950)

63rd International Scientific Conference on Economic and Social Development – "Building Resilient Society" - Zagreb, 11-12 December, 2020
149
Studies have shown that (Geyer, R., Jambeck, J., Lavender, L., 2017, p.1-2):
• by 2016, 8,300 million metric tons (Mt) of virgin plastics were produced,
• by 2015, 6,300 Mt of plastic waste was produced,
• 9% of this waste was recycled, 12% was incinerated and 79% was deposited in landfills or
in the natural environment,
• with the current trends in production and waste management, 12,000 Mt of plastic waste
will be deposited in landfills or in the environment by 2015.
Plastics become particularly problematic when plastic waste ends up in the natural environment,
including various types of water bodies. World data - based on information on solid waste,
population density and economic status - indicates that in 2010 alone anywhere from 4.8 to 12.7
million tons of plastic waste (of which about 236,000 tons were microplastics) posing a threat
to ecosystems and human health were released into the oceans and seas as a result of improper
waste management,. As much as 95% of plastic waste that enters the oceans through rivers
comes from only 10 rivers, 2 of which are located in Africa with the other 8 in Asia (MoEFCC,
2018, p.64). Many marine organisms consumed by humans, such as fish and crustaceans, cannot
recognize plastic waste in food and therefore contain undigested plastic scraps. Other physical
hazards include asphyxiation and entanglement. It is estimated that around 100,000 marine
animals are killed each year by plastics (WWF, 2018, p. 64). If the current trend of water
pollution with plastic continues, the amount of plastics will triple by 2025. This means that their
total weight will exceed the total weight of the fish (UN, 2019, p. 32). In addition, the five
plastic-waste islands located on the surface of the oceans are another difficult problem to solve.
The largest of these is located in the Pacific Ocean and covers the rapidly expanding area of 1.6
million km2, which is larger than the territories of Germany, France and Spain combined. While
Europe is responsible for only a small part of the plastic that pollutes waters, a study carried
out in the Mediterranean found that 18% of tuna and sword fish had plastic debris in their
stomachs. What is more, plastic waste also pollutes the Baltic Sea and is just as serious a
problem there as elsewhere. According to WWF data, 56% of the waste on the Baltic beaches
is plastic, which then ends up mostly in the sea. Another very serious group of pollutants are
fish-set nets abandoned as a result of random events (storms, collisions, snags), the annual
number of which ranges from 5,500 to 10,000 and totaling a weight of 810 tons (WWF, 2015,
p. 6). Waste-caused pollution is a problem not only in the aquatic environment. Cities are
growing in both size and population, producing an increasing mass of waste and prompting the
need for more space to collect, segregate, store, and incinerate waste, which in turn destroys the
natural habitats of fauna and flora. The scale of these phenomenon is large, given that waste
treatment stations and landfills require significant areas and can themselves contribute to water,
air and soil pollution, while waste incinerators emit particles of harmful substances into the air.
5. CONCLUSION
The projected increase in the mass of municipal waste and its improper management may pose
a serious threat to the modern world, and thus to its inhabitants. The growing global population,
many of whom will largely relocate to urban areas, will be a huge challenge, as human existence
and activity are associated with the generation of waste, which is an indispensable byproduct
of our lives. In developing countries focused on boosting consumerism, the amount of
municipal waste generated is constantly growing, and its composition has changed along with
technical advancement. It is therefore pivotal to identify the causes and effects of this global
problem in order to be able to take the right countermeasures. Due to their large diversity, these
challenges can be analyzed on many levels, including demographic (an increase in the global
population), social (consumerism), urbanization (the trend of moving into cities), raw materials
and energy (depletion of raw materials in the perspective leading to a reduction in economic

63rd International Scientific Conference on Economic and Social Development – "Building Resilient Society" - Zagreb, 11-12 December, 2020
150
growth) and environmental (air, soil, groundwater and water pollution) . The current state of
affairs requires prompt action and a shift in attitude to minimize waste production so that it does
not disturb or degrade the planet. Lack of awareness-raising initiatives, thoughtless purchases,
poor segregation of waste, and the resulting low level of waste recovery and recycling, will
only cause further harm to our environment.
LITERATURE:
1. Chen D. et all. (2018). The world’s growing municipal solid waste: Trends and impacts.
Environmental Research Letters 15 (7).
2. FAO. (2017). The future of food and agriculture: Trends and challenges. Retrieved
10.10.2020 from http://www.fao.org/3/a-i6583e.pdf
3. FAO. (2018). The future of food and agriculture – Alternative pathways to 2050. Retrieved
10.10.2020 from http://www.fao.org/3/I8429EN/i8429en.pdf
4. Geyer, R., Jambeck J., Lavender Law K. (2017). Production, use, and fate of all plastics
ever made. Science Advances. 3(7).
5. Hatfield-Dodds, S., et all. (2017). Assessing global resource use and greenhouse emissions
to 2050, with ambitious resource efficiency and climate mitigation policies. Journal of
Cleaner Production. 144.
6. IRP. (2017). Assessing global resource use: A systems approach to resource efficiency and
pollution reduction. Retrieved 30.10.2020 https://www.resourcepanel.org/reports/
assessing-global-resource-use
7. McKinsey Global Institute. (2012). Urban World: Cities and the rise of the consuming
class. Retrieved 10.10.2020 from https://www.mckinsey.com/featured-
insights/urbanization/urban-world-cities-and-the-rise-of-the-consuming-class#
8. MoEFCC. (2018). Plastics in life and environment. Retrieved 30.10.2020
http://www.indiaenvironmentportal.org.in/files/file/Plastics%20in%20Life%20and%20En
vironment.pdf
9. Ogundipe, F.O., Jimoh, O.D. (2015). Life cycle assessment of municipal solid waste
management in Minna. Nigeria. Environmental Research. No. 9 (4).
10. The World Bank. (2018). What a Waste 2.0 A Global Snapshot of Solid Waste Management
to 2050. Retrieved 10.10.2020 from https://openknowledge.worldbank.org/handle/
10986/30317
11. UN. (2017). Towards a pollution-free planet: Report of the Executive Director. Retrieved
21.10.2020 https://pdfs.semanticscholar.org/c10d/97ac736205effee0bf8781aece53995
b7f79.pdf?_ga=2.146327479.2065180805.1606649355-2042752759.1606649355
12. UN. (2018). World Urbanization Prospects The 2018 Revision. Retrieved 02.11.2020 from
https://population.un.org/wup/Publications/Files/WUP2018-Report.pdf
13. UN. (2019). World Population Prospects 2019. Retrieved 10.10.2020 from
https://population.un.org/wpp/Publications/Files/WPP2019_Highlights.pdf
14. UNEP. (2016). Global material flows and resource productivity. Retrieved 11.10.2020
www.resourcepanel.org/file/423/download?token=Av9xJsGS
15. WWF. (2015). Removal from the bottom of the Baltic Sea of fishing gear lost by fishermen.
Retrieved 21.10.2020 https://www.wwf.pl/sites/default/files/2017-07/Usuwanie%20z%
20dna%20Ba%C5%82tyku%20utraconego%20przez%20rybak%C3%B3w%20i%20zaleg
aj%C4%85cego%20sprz%C4%99tu%2C%20raport%20ko%C5%84cowy.pdf
16. WWF. (2016). Living Planet Report, Risk and resilience in a new era. Retrieved 10.10.2020
from http://awsassets.panda.org/downloads/lpr_living_planet_report_2016.pdf
17. WWF. (2018). Living Planet Report - 2018: Aiming Higher. Retrieved 21.10.2020
https://www.wwf.fr/sites/default/files/doc-2018-10/20181030_Living_Planet_Report-
2018.pdf?utm_source=website&utm_medium=infog%20great%20acceleration
63rd International Scientific Conference on Economic and Social Development – "Building Resilient Society" - Zagreb, 11-12 December, 2020
151
THE USE OF FUZZY MODELLING TO INVEST IN THE POLISH
CAPITAL MARKET IN THE PANDEMIC ERA
Ewa Pospiech
University of Economics in Katowice
1 Maja 50, 40-287, Poland
ABSTRACT
Many tools can be used to build a portfolio consisted of capital market instruments. When
deciding to invest in stocks, you can take different approaches. Building a stock portfolio is
a complex process. Using the fundamental analysis in this process, which enables the
assessment of the economic and financial situation of the company, the condition of the
enterprise is examined with the use of fundamental and market indicators. Such an approach
allows the use of multi-criteria methods in the analyzes, treating the included indicators as
evaluation criteria. In a situation where the decision-maker is not able to provide the exact
values of the criteria assessments or the decision problem is imprecise (which is the case in
many practical matters), fuzzy numbers can be used to describe the phenomenon. The results
of using this approach, compared to the market portfolio, under "normal" conditions gave
interesting results. Therefore, based on the results obtained in previous studies, which used the
TOPSIS methods (in the standard and fuzzy versions), which made it possible to organize
companies, build effective portfolios (from among the highest ranked companies) and compare
them with the market portfolio, an analysis was conducted aimed at assessing the portfolios
generated by the proposed approach and comparing their performance with the market
portfolio during the global crisis caused by the pandemic. Therefore, the main objective of the
study was to compare the results of the multi-criteria portfolios, taking into account the fuzzy
approach, with the market portfolio in the conditions of a global pandemic. The analysis
showed that despite the difficult conditions it is possible to generate very profitable portfolios.
Keywords: Effective portfolios, FTOPSIS and TOPSIS methods, Market portfolio
1. INTRODUCTION
Investing in stocks requires knowledge and experience from the investor. In this process, it is
also worth using quantitative tools enabling a methodical approach to the issue. When
constructing portfolios composed of capital market instruments, in particular a portfolio of
shares, the time horizon of the investment is important. In the case of long-term portfolios, an
important element of the research is the assessment of the macroeconomic environment as well
as the economic and financial situation of the companies in which the investor wants to invest
his funds. For this purpose, a fundamental analysis is carried out, which allows to assess the
condition of companies using selected fundamental and market indicators. This is an important
issue in the context of a long-term investment, as the company's favourable situation guarantees
its stability, which attracts potential investors. A methodical approach to the assessment of
companies is based on the use of methods that allow for conducting analyzes in an orderly
manner. Multi-criteria methods can be used to evaluate objects (decision variants) assessed
through the prism of many characteristics – such an approach makes it possible to choose those
companies in which, in the opinion of an investor, it is worth investing (based on the criteria
selected by him, meeting his preferences). When it comes to selecting a portfolio consisting of
shares, portfolio analysis tools are often used, in which effective portfolios are determined –
portfolios with the lowest risk are built at a given rate of return or the rate of return is maximized
at a certain level of acceptable risk (Jajuga, Jajuga, 2015). Due to the different types of risk
associated with investments, even when the market is relatively stable, none of the tools used

63rd International Scientific Conference on Economic and Social Development – "Building Resilient Society" - Zagreb, 11-12 December, 2020
152
can guarantee a profit. In turn, when extreme phenomena occur, especially on a global scale
(economic and political crises, natural disasters, pandemics, etc.), an immediate, negative
reaction on capital markets is visible. The following questions arose: Does investing in equities
during a pandemic have to be associated with large losses? Is it possible to obtain profitable
portfolios under these conditions? These questions determine the purpose of this article, which
is to build effective portfolios consisting of shares listed on the Warsaw Stock Exchange Main
Market, constructed on the basis of the results of the fundamental analysis conducted on the
basis of 2017-2019, and to evaluate the results of these portfolios in 2020 – the year in which
the entire the world is struggling with the coronavirus pandemic. The research hypothesis is:
Despite negative market reactions related to the pandemic, it is possible to construct profitable
long-term effective portfolios taking into account the fuzzy approach.
2. RESEARCH CONDITIONS
It was decided that the research will use the tools that had been used in the previous analyzes,
and the application of which gave promising results. The multi-criteria TOPSIS and Fuzzy
TOPSIS (FTOPSIS) methods were used, as well as portfolio analysis tools enabling the
determination of effective portfolios. Literature studies (Chen, Hung, 2009; Ece, Uludag, 2017;
Kazemi et al., 2014; Liu, et al., 2012; Nguyen, Gordon-Brown, 2012; Raei, Bahrani Jahromi,
2012) and previously conducted research (Pośpiech, 2017a; Pośpiech, 2017b; Pośpiech, 2018;
Pośpiech, 2020; Pośpiech, Mastalerz-Kodzis, 2015; Pośpiech, Mastalerz-Kodzis, 2016) showed
the validity of the use (in various approaches) of the TOPSIS methods (standard and fuzzy) in
the issue of supporting the portfolio selection.
2.1. Methodology
The TOPSIS method, both in the standard and fuzzy version, is carried out in stages. Its
description is included in many studies (Hwang, Yoon, 1981; Jahanshahloo, et al., 2006; Lai,
et al., 1994; Roszkowska, Wachowicz, 2013; Trzaskalik, 2014). The end result of the procedure
is a ranking of the examined objects, which is built on the basis of the decreasing value of the
Si indicator. In the article, the examined objects are listed companies, and their economic and
financial condition is assessed on the basis of selected fundamental and market indicators. The
selected indicators constitute the evaluation criteria, and the period from which the data was
taken was three years (Tarczyński, 2002). In the standard version of the TOPSIS method, the
mean values of the studied indicators from three years were taken into account as criteria
assessments, while in the fuzzy approach, the data for three years were the parameters of a
triangular fuzzy number: ),,(~ )(
ikikik
k
i umla = , where k − specifies the criterion number, lk − the
smallest value of the criterion assessment from three years, mk – the middle value of the criterion
assessment from the years, uk – the highest value of the criterion assessment from three years.
Four indicators were used for the fundamental assessment of the company (Leszczyński, 2004;
Tarczyński, 2001; Tarczyński, 2002; Trzaskalik, 2006; Tyran, 2001):
• return of assets ROA (net income/average total assets),
• return of equity ROE (net income/shareholder equity),
• P/BV (price-book value),
• P/E (price-earnings ratio).
It was found that high index values are desirable and therefore each criterion was maximized.
It was also found that each criterion is equally important, therefore each of them was given the
same weight. The rankings, built using TOPSIS methods, made it possible to determine the sets
of companies that were the basis for the selection of the portfolio. Effective portfolios were
built (minimum risk portfolios with a given portfolio return rate) using the classic Markowitz
approach (Markowitz, 1952).

63rd International Scientific Conference on Economic and Social Development – "Building Resilient Society" - Zagreb, 11-12 December, 2020
153
The results of the effective portfolios were compared with the results of the market portfolio
represented by the WIG20 index (the WIG20 is a capitalization-weighted stock market
index of the twenty largest companies on the Warsaw Stock Exchange).
2.2. The subject of analysis
The analyzes examined the companies that comprised the WIG20 index in December 2019. It
was made up of companies representing nine sectors (Table 1).
Company Abbreviation Sector
ALIOR ALR BANKS
CCC CCC CLOTHES & COSMETICS
CDPROJEKT CDR VIDEO GAMES
CYFRPLSAT CPS TELECOM
DINOPL DNP GENERAL RETAILERS
JSW JSW MINING
KGHM KGH MINING
LOTOS LTS OIL & GAS
LPP LPP CLOTHES & COSMETICS
MBANK MBK BANKS
ORANGEPL OPL TELECOM
PEKAO PEO BANKS
PGE PGE ENERGY
PGNIG PGN OIL & GAS
PKNORLEN PKN OIL & GAS
PKOBP PKO BANKS
PLAY PLY TELECOM
PZU PZU INSURANCE
SANPL SPL BANKS
TAURONPE TPE ENERGY
Table 1: Companies included in the research
(Source: Own study)
In the analyzes, effective portfolios were built on the basis of sets containing from ten to fifteen
companies – the companies with the highest ranking were selected.
3. RESULTS OF EMPIRICAL ANAYSIS
The research period covered the years 2017-2020. Data for fundamental and market indicators,
included in the multi-criteria procedure, were taken from 2017-2019, while the annual data for
2019 was used in the construction of effective portfolios. The rankings of companies obtained
using the TOPSIS methods are presented in Table 2. Table 3 shows the sets of companies which
formed the basis of building effective portfolios. Portfolios for which the variance was
minimized at a given value were determined – as this value the average of positive return rates
of companies composing the WIG20 index in December 2019 was taken into account.

63rd International Scientific Conference on Economic and Social Development – "Building Resilient Society" - Zagreb, 11-12 December, 2020
154
Company TOPSIS (TOP) Fuzzy TOPSIS (FTOP)
Si Ranking Si Ranking
ALR 0.568 19 0.492 17
CCC 0.608 6 0.529 9
CDR 0.669 2 0.686 1
CPS 0.583 11 0.517 11
DNP 0.623 3 0.594 3
JSW 0.610 5 0.617 2
KGH 0.586 10 0.526 10
LTS 0.597 8 0.551 7
LPP 0.619 4 0.579 4
MBK 0.574 17 0.496 16
OPL 0.770 1 0.562 6
PEO 0.576 15 0.500 14
PGE 0.576 14 0.481 18
PGN 0.591 9 0.531 8
PKN 0.605 7 0.573 5
PKO 0.575 16 0.499 15
PLY 0.120 20 0.396 20
PZU 0.580 12 0.505 12
SPL 0.577 13 0.501 13
TPE 0.572 18 0.461 19
Table 2: Values of the Si indicator and rankings according to the methods
(Source: Own study)
Methods of
ordering
Sets of companies
n = 10
Companies attached to the previous group
in order to obtain a given number set
n = 11 n = 12 n = 13 n = 14 n = 15
TOPSIS OPL, CDR, DNP, LPP, JSW,
CCC, PKN, LTS, PGN, KGH CPS PZU SPL
PGE PEO
FTOPSIS PEO PKO
Table 3: The sets of companies – the basis of portfolio selection
(Source: Own study)
In the case of sets with ten, eleven, twelve and thirteen elements, both TOPSIS methods made
it possible to determine the same sets, while for sets of fourteen and fifteen elements, different
sets were obtained. The obtained sets allowed to designate eight effective portfolios. They are
marked with the symbols presented in Table 4.
Methods
Designation of the portfolio depending on the pre-selection method and
the size of the set
n = 10 n = 11 n = 12 n = 13 n = 14 n = 15
TOPSIS P1 P2 P3 P4
P5 P7
FTOPSIS P6 P8
Table 4: Designations of constructed effective portfolios
(Source: Own study)
The results of the obtained (hypothetical) portfolios built as at 03/01/2020 are presented in
Figures 1-2. They were compared with the results of the PM market portfolio, represented by
the WIG20 index.

63rd International Scientific Conference on Economic and Social Development – "Building Resilient Society" - Zagreb, 11-12 December, 2020
155
Figure 1: Profits/losses of portfolios P1, P2, P3, P4 (n = 10, 11, 12, 13) and PM.
(Source: Own study)
P1-P4 portfolios consisted of six or seven companies. In January, the performance of all five
portfolios shown in Figure 1 was comparable, recording little gains or losses. Over the twenty
days of February, the market portfolio recorded losses of several percent, while the remaining
four portfolios showed an upward trend in profits. From the end of February to March 12, 2020,
there were smaller profits or increasing losses of portfolios, which was a result of the
development of the coronavirus epidemic in the world and in Europe – in the world, the worst
situation was in China, and in Europe – in Italy; in Poland, the first COVID-19 patient was
diagnosed in early March. The worst results of all portfolios were recorded on March 12, 2020,
with losses in the market portfolio reaching -40%, while the remaining portfolios recorded
losses of -32% to -23%. From that day on, better and better results were observed over the next
few months. The market portfolio recorded losses throughout the analyzed period (from January
to October 2020), with the lowest (oscillating around -16%) recorded in the period June-August.
Against this background, hypothetical effective portfolios performed much better. After
decreasing losses recorded until mid-April, the portfolios were characterized by successive
gains. P1-P3 portfolios over the next several months recorded increases from a few to over a
dozen percent, achieving the highest result of over 18% on August 28, 2020. Only at the end of
the analyzed period (end of October) losses of several percent again were recorded. The P4
portfolio is the best in this ranking – from April 8 it was profitable, with a peak of approx. 35%
reaching 27 August. Overall, from the beginning of October, a downward trend has been
evident for all portfolios (decreasing profits or increasing losses). The obtained results show
that the results of the generated (hypothetical) effective portfolios are much more favourable
than the market one. These portfolios have recorded significant profits since April. When
analyzing the composition of these portfolios, there are no companies from the banking, energy
or mining sectors in their composition. The obtained results also reflect the impact of the
pandemic on capital markets – significant losses in the initial phase of the pandemic, in which
there were further restrictions, then a slow elimination of restrictions and stabilization of the
number of COVID-19 cases (June-August), and further declines related to, among others, the
so-called "second wave" of coronavirus and events in the country and the world.
Profits/losses of portfolios
-50
-40
-30
-20
-10
0
10
20
30
40
2020-0
1-0
3
2020-0
1-1
6
2020-0
1-2
8
2020-0
2-0
7
2020-0
2-1
9
2020-0
3-0
2
2020-0
3-1
2
2020-0
3-2
4
2020-0
4-0
3
2020-0
4-1
7
2020-0
4-2
9
2020-0
5-1
2
2020-0
5-2
2
2020-0
6-0
3
2020-0
6-1
6
2020-0
6-2
6
2020-0
7-0
8
2020-0
7-2
0
2020-0
7-3
0
2020-0
8-1
1
2020-0
8-2
1
2020-0
9-0
2
2020-0
9-1
4
2020-0
9-2
4
2020-1
0-0
6
2020-1
0-1
6
2020-1
0-2
8
WIG20 (PM)
Portfolio P1
Portfolio P2
Portfolio P3
Portfolio P4

63rd International Scientific Conference on Economic and Social Development – "Building Resilient Society" - Zagreb, 11-12 December, 2020
156
Figure 2: Profits/losses of portfolios P5, P6, P7, P8 (n = 14, 15) and PM.
(Source: Own study)
The P5-P8 portfolios perform even better compared to the market portfolio and the previously
discussed ones. The profit/loss performance is analogous to the P1-P4 portfolios, with even
higher profits for P5-P8 – the highest profit of over 43% was recorded by the P7 portfolio on
August 27, 2020. The profits of the generated portfolios are similar, and from mid-April 2020
they do not fall below 10%. P5 and P7 portfolios are effective portfolios obtained after
preliminary selection using the TOPSIS method – their profits are slightly higher than the other
two (P6 and P8) constructed after the initial selection using the FTOPSIS method. However,
these portfolios only consist of four securities and their risk (measured by the standard
deviation) is higher than that of P6 and P8 portfolios. P6 and P8 portfolios, on the other hand,
consist of seven stocks and their risk is lower. The issue of the recommendation regarding the
advantage of considering the fuzzy approach in the considerations, which in the cases of many
previous studies was more unambiguous, is left to the decision-maker who decides for himself
whether he is ready for slightly higher profits at the expense of increasing the portfolio risk, or
he prefers a slightly lower profit, accompanied by lower risk (Table 5).
Risk
measure
Portfolio risk
P1 P2 P3 P4 P5 P6 P7 P8
S 1,110 1,076 1,059 1,227 1,332 1,131 1,391 1,216
Table 5: Risk of portfolios
(Source: Own study)
4. CONCLUSION
The conducted analyzes were aimed at determining the effective portfolios that were generated
from the sets of companies obtained on the basis of the initial selection using the multi-criteria
TOPSIS methods (standard and fuzzy). The aspect of interest for the author were the results of
the obtained portfolios and their comparison with the market portfolio in the situation of the
prevailing global pandemic. Eight portfolios were generated – the results of each of them were
definitely better than the market portfolio. On the other hand, when comparing the results of
the portfolios with the pre-selection of the standard or fuzzy method, identical or slightly better
Profits/losses of portfolios
-50
-40
-30
-20
-10
0
10
20
30
40
50
2020-0
1-0
3
2020-0
1-1
7
2020-0
1-3
0
2020-0
2-1
2
2020-0
2-2
5
2020-0
3-0
9
2020-0
3-2
0
2020-0
4-0
2
2020-0
4-1
7
2020-0
4-3
0
2020-0
5-1
4
2020-0
5-2
7
2020-0
6-0
9
2020-0
6-2
3
2020-0
7-0
6
2020-0
7-1
7
2020-0
7-3
0
2020-0
8-1
2
2020-0
8-2
5
2020-0
9-0
7
2020-0
9-1
8
2020-1
0-0
1
2020-1
0-1
4
2020-1
0-2
7
WIG20 (PM)
Portfolio P5
Portfolio P6
Portfolio P7
Portfolio P8

63rd International Scientific Conference on Economic and Social Development – "Building Resilient Society" - Zagreb, 11-12 December, 2020
157
results were obtained using the TOPSIS method – these portfolios, however, had a higher risk.
Moreover, it is worth emphasizing that the obtained effective portfolios consisted mainly of
companies belonging to the following sectors: Telecom, Oil and Gas, General Retailers, which
indicates those areas that play a huge role in the pandemic era. The surveyed companies did not
include, for example, companies from the IT sector (they were not taken into account at all,
because they were not included in the WIG20 index), but in the era of remote activity covering
more and more areas of life, it can be expected that companies from this sector would end up
in a profitable portfolio. The selected portfolios were obtained on the basis of historical data
analysis – the economic and financial condition of companies was examined on the basis of
selected fundamental and market indicators, while effective portfolios were determined based
on historical rates of return. So if the historical data shows a given company in a favourable
light, the chances of good performance of the portfolios containing that company are greater.
Research has shown the possibility of building attractive (profitable) portfolios in a situation
where the whole world is struggling with the COVID-19 pandemic and its social and economic
consequences. There are at least two reasons for obtaining portfolios with such good results: a
solid fundamental analysis of companies which shows those in the best condition, and investing
in those areas that are booming under these conditions. It can therefore be concluded that the
fundamental analysis of companies, the observation of the currently occurring phenomena and
trends, and reasonable portfolio management allow for minimizing the existing investment risks
and building profitable portfolios even in a difficult time of a pandemic.
LITERATURE:
1. Chen, C.T., Hung, W.Z. (2009). A New Decision-Making Method for Stock Portfolio
Selection Based on Computing with Linguistic Assessment. Journal of Applied
Mathematics and Decision Science, 2009. doi: http://dx.doi.org/10.1155/2009/897024.
2. Ece, O., Uludag, A.S. (2017). Applicability of Fuzzy TOPSIS Method in Optimal Portfolio
Selection and an Application in BIST. International Journal of Economics and Finance,
9(10), 107-127. doi: https://doi.org/10.5539/ijef.v9n10p107.
3. Hwang, C. L., Yoon, K. (1981). Multiple Attribute Decision Making: Methods and
Application. Berlin: Springer Verlag.
4. Jahanshahloo, G.R., Hosseinzadeh Lotfi, F. and Izadikhah, M. (2006). Extension of the
TOPSIS Method for Decision-making Problems with Fuzzy Data. Applied Mathematics and
Computation, 181(2), 1544-1551. doi: http://dx.doi.org/10.1016/j.amc.2006.02.057.
5. Jajuga, K., Jajuga, K. (2015). Inwestycje – Instrumenty finansowe. Aktywa niefinansowe.
Ryzyko finansowe. Inżynieria finansowa. Warszawa: PWN.
6. Kazemi, A., Sarrafha, K. and Bedel, M. (2014). A hybrid fuzzy decision making method
for a portfolio selection: A case study of Tehran Stock Exchange. International Journal of
Industrial and Systems Engineering, 18(3), 335-354. doi: http://dx.doi.org/
10.1504/IJISE.2014.065537.
7. Lai, Y.J., Liu, T.Y. and Hwang C.L. (1994). TOPSIS for MODM. European Journal of
Operational Research, 76(3), 486-500. doi: http://dx.doi.org/10.1016/0377-
2217(94)90282-8.
8. Leszczyński, Z. (2004). Analiza ekonomiczno-finansowa spółki. Warszawa: PWE.
9. Liu, Y.J., Zhang, W.G., and Xu, W.J. (2012). Fuzzy multi-period portfolio selection
optimization models using multiple criteria. Automatica, 48(12), 3042-3053. doi:
http://dx.doi.org/10.1016/j.automatica.2012.08.036.
10. Markowitz, H.M. (1952). Portfolio selection. Journal of Finance, 7(1), 77–91. doi:
http://dx.doi.org/ 10.2307/2975974.

63rd International Scientific Conference on Economic and Social Development – "Building Resilient Society" - Zagreb, 11-12 December, 2020
158
11. Nguyen, T.T., Gordon-Brown, L.N. (2012). Fuzzy Numbers and MCDM Methods for
Portfolio Optimization. International Journal of Computer, Electrical, Automation, Control
and Information Engineering, 6(12), 1593-1605.
12. Pośpiech E. (2017a). Multi-criteria fuzzy modelling in the issue of portfolio selection. In
M. Čulik (ed.), Financial Management of Firms and Financial Institutions 2017.
Proceeding (Part III.), 700-707, Ostrava: VŠB – TU.
13. Pośpiech, E. (2017b). Rozmyte modelowanie we wspomaganiu decyzji inwestycyjnych.
Organizacja i Zarządzanie, 113, 375-384.
14. Pośpiech, E. (2018). The Risk of Multi-Criteria Portfolios Taking into Account the Fuzzy
Approach. In M. Čulík (ed.), Managing and Modelling of Financial Risks. 9th International
Scientific Conference – Proceedings (Part 2), 411-418, Ostrava: VŠB-TU.
15. Pośpiech, E. (2020). The Multi-criteria Fuzzy Approach to Building and Evaluating
Effective Portfolios. Organizacja i Zarządzanie, 144, 397-407.
16. Pośpiech, E., Mastalerz-Kodzis, A. (2015). Wybór metody wielokryterialnej do
wspomagania decyzji inwestycyjnych. Organizacja i Zarządzanie, 86, 379-388.
17. Pośpiech, E., Mastalerz-Kodzis, A. (2016). Zastosowanie metody TOPSIS w ujęciu
rozmytym do selekcji walorów giełdowych. Organizacja i Zarządzanie, 96, 395-404.
18. Raei, R., Bahrani Jahromi, M. (2012). Portfolio optimization using a hybrid of fuzzy ANP,
VIKOR and TOPSIS. Management Science Letters, 2, 2473-2484. doi:
http://dx.doi.org/10.5267/j.msl.2012.07.019.
19. Roszkowska, E., Wachowicz, T. (2013). Metoda TOPSIS i jej rozszerzenia – stadium
metodologiczne. In T. Trzaskalik (ed.), Analiza wielokryterialna. Wybrane zagadnienia,
11-40. Katowice: Uniwersytet Ekonomiczny.
20. Tarczyński, W. (2001). Rynki kapitałowe. Metody ilościowe. Warszawa: Polska Agencja
Wydawnicza PLACET.
21. Tarczyński, W. (2002). Fundamentalny portfel papierów wartościowych. Warszawa: PWE.
22. Trzaskalik, T. (ed.). (2006). Metody wielokryterialne na polskim rynku finansowym.
Warszawa: PWE.
23. Trzaskalik, T. (ed.). (2014). Wielokryterialne wspomaganie decyzji. Warszawa: PWE.
24. Tyran M. R. (2001). Wskaźniki finansowe. Kraków: Oficyna Ekonomiczna.
25. Data source: www.bankier.pl, access: 03.11.2020.
26. Data source: www.gpw.pl, access: 03.11.2020.
27. Data source: http://infostrefa.com/infostrefa/pl/archiwum, access: 03.11.2020.

63rd International Scientific Conference on Economic and Social Development – "Building Resilient Society" - Zagreb, 11-12 December, 2020
159
SHARING ECONOMY AS A MODERN ECONOMIC PARADIGM
Anita Freimann
Faculty of Economics in Osijek, Croatia
Helena Stimac
Faculty of Economics in Osijek, Croatia
Maja Rupcic
Croatia
ABSTRACT
The new business model called the sharing economy has emerged as a response to the many
challenges faced by (international) trade. Growth and development of the sharing economy is
the result of globalization, rapid technological development, the emergence of digital
platforms, and the growing need for environmental protection. The world's population is
growing and resources are limited. The awareness of its residents about the problems in the
world is becoming more pronounced, their tastes and opinions are changing. The emphasis is
no longer on owning certain goods, but on using them and enjoying them. It has grown steadily
in recent years, becoming interesting to a growing number of users, but also to governments as
legislators. There is no generally accepted definition or models of the sharing economy; there
are many advantages of the sharing economy but there are also challenges, and one of the most
significant is the privacy and security of users. This paper presents different models of the
sharing economy, as well as its share in economic activity. Increasing advances in information
and communication technology are expected in the future, which is the foundation of the
sharing economy. The key factors for the further development of the sharing economy are the
creation of added value, trust, good experience, and reputation. The primary research that has
been conducted (n= 217) has shown that the younger population (students) is very happy to use
certain forms of the sharing economy, but they are unfortunately still not familiar enough with
the concept of the sharing economy itself. It can be concluded that the sharing economy is an
example of a new business model that has an increasing impact and share in the local and
international economy.
Keywords: globalization, sharing economy, technology
1. INTRODUCTION
International trade is facing frequent changes that are primarily related to information and
communication technology that has escalated due to the globalization process. The world has
become a global village, innovations are increasing, the desires and demands of the market are
increasing, and people are ready and forced to change. Classical economic models are no longer
sufficient, and for this reason more and more new economic models are emerging that seek to
respond to the needs of the modern market. One such model is sharing economy. The sharing
economy is a modern paradigm that is being given increasing importance as it has become
exponentially present in the market and in people’s lives. The sharing economy has no official
definition or commonly accepted name. Some of the most commonly used names in English
are peer-to-peer economy and sharing economy. According to the European Economic and
Social Committee (2016), the sharing economy is best defined as a system within which private
individuals share their property and services free of charge or for a fee, and this is most often

63rd International Scientific Conference on Economic and Social Development – "Building Resilient Society" - Zagreb, 11-12 December, 2020
160
done over the internet. Botsman (2015) defines the sharing economy as a system of
decentralized networks and markets that also use the value of unused assets to meet society’s
needs by bypassing traditional intermediaries. It can be concluded that the sharing economy is
based on the principles of solidarity and cooperation, and is created by the demand for property,
resources, time and various skills needed by man. According to Bašić and Jurčević (2017),
participants in the sharing economy are service providers, intermediaries and users. The
growing need for socially responsible behavior has a great influence on the development of the
sharing economy, and the biggest advocates of this way of doing business are young people,
that is, a generation group called millennials (people born between 1980 and 2000). The sharing
economy can be viewed through various aspects, namely the social, economic aspect, the labor
market, the real estate market, and the legal and regulatory aspect. The most famous examples
of the sharing economy in the world are Airbnb (accommodation, stay), Easy Car Club (car
exchange), Instacart (grocery shopping and delivery), Liquid Space (use of office space or work
space), Park At My House (parking spaces; people share their driveway, garage or other parking
space), Task Rabbit (small household chores), Uber (passenger transport), BlaBlaCar
(passenger transport), Couchsurfing (tourist accommodation), etc.
2. ASPECTS OF SHARING ECONOMY
2.1. Social aspect
The economy is changing more and more under the influence of various factors, and human
trends and habits are also changing. The sharing economy today has emerged as a result of both
changes, although the first form of trade was actually barter (exchange). In addition, people
have always helped and shared everything among each other. "Today's platforms make sharing
easier among people who don't know each other and who lack mutual friends or connections.
Just as people used to judge others through their personal assessments or the assessments of the
people around them, so today, in line with technological progress, digital assessment systems
have been developed to help us assess who to do and share business with on platforms.” (Bašić
and Jurčević, 2017). The sharing economy enables people with poorer financial opportunities
to afford a holiday or some other service (unattainable in standard conditions), that is, it tries to
provide everyone with equal access to goods. It also has a positive effect on the environment
and reduces its pollution: instead of people buying things and accumulating resources, they
share them, which enables the protection of the environment and the reduction of excessive use
of non-renewable sources of raw materials. Furthermore, resources that would otherwise remain
unused, with this growing phenomenon, they help many in this way. According to Bašić and
Jurčević (2017), online education is an important trend which is growing in numbers. The hectic
way of life also changes the way of learning. Literature, seminars and trainings can now be
found on online platforms, and more and more reputable faculties hold (free) trainings and
lectures online. This way of giving educational lectures and other ways of doing business online
is especially visible in this time of the COVID-19 epidemic that has imposed that business
activities be done online around the world.
2.2. Economic aspect
The sharing economy arose as a result of market trends. Market trends are changing along with
the development of technology, as well as the scale of supply and demand on a global level. It
used to be important to own certain goods, while today the experience that those goods provide
is more important. According to Hamari, Ukkonen, and Sjöklint (2016) participation in the
sharing economy is cost-effective, the consumer exchanges ownership over a particular good
or premises with a particular service at a lower cost. According to Owyang, Tran, and Silva
(2013) practicing sharing economics enables you to: cash in surplus or inactive stocks, increase
financial flexibility, have access to goods that are not owned by the same person.

63rd International Scientific Conference on Economic and Social Development – "Building Resilient Society" - Zagreb, 11-12 December, 2020
161
Technological progress is increasingly replacing labor and capital, and dematerializing the
economy. The population is growing, and certain resources are becoming limited. The sharing
economy reduces the overproduction of goods and the accumulation of waste, in such a way as
to allow the maximal use of existing goods and the creation of new values. Mobile devices have
become a part of everyday life and are the main devices of the sharing economy (Bašić and
Jurčević, 2017).
2.3. Labor market and real estate market
The labor market is another aspect of the sharing economy. Bašić and Jurčević (2017) state that
work through online platforms is divided into two types of work: physical services (which are
ordered through online platforms and are performed physically) and virtual services (which can
be performed through online platforms or applications). "There are actually no workers on the
platforms, but all service providers are self-employed, and the only thing they do is choose the
working hours, how much they will work, the amount of compensation and the person or
company for which they will do the work, and barriers to entering a certain market niche are
quite low." (Bašić and Jurčevic, 2017). In this way people come up with different ways to
increase their income, more and more people are turning to this way of self-employment for the
reason that they do not want to work in large corporations. The European Union has still not
fully addressed self-employment issues on sharing economy platforms, and those platforms are
often defined only as intermediaries. Another aspect is the real estate market. As rental
platforms are used exclusively for short-term rental of real estate, there is an increase in long-
term rental prices. Short-term rent is suitable only for tourist needs. One of the problems is that
"the market is not yet regulated, there are problems with taxation, illegal renting and other issues
that can bring instability to the market." (Bašić and Jurčević, 2017).
2.4. Legal and regulatory aspect
The importance of the sharing economy, and its impact on development, has been particularly
recognized by the European Union. The European Economic and Social Committee (2016)
notes that the sharing economy encourages solidarity among citizens, creates new jobs and
stimulates the growth of local economies, and rationalizes consumption. For this reason, the
European Union is taking various measures to ensure that all member states have a clear and
equal legislation on the sharing economy. According to Bašić and Jurčević (2017), the most
important legal and regulatory restrictions need to be taken in the following areas: tax issues,
fair market competition, consumer protection, data and privacy, and worker protection. It is
precisely the clear definition of the previously listed areas that will enable the further
development of the sharing economy and the safe use of this phenomenon. Tax issues are
related to the taxation of platforms, which is significantly discussed, then fair market
competition speaks about how competition in the market should be fair, and that all participants
should have the same legislative conditions, and a monopoly should be prevented. Great
attention is also paid to the protection of workers. Petropoulos (2016) indicates that the main
feature of this model is flexible working hours of the service provider, that is, the service
provider in most cases chooses when and how long he will work. Therefore, it is necessary to
introduce a new employment relationship that will protect workers, and at the same time the
flexibility of working hours must not be neglected. The protection of consumers, privacy and
their data is a topic that is increasingly presented in the public and great attention is paid to it,
be it through the sharing economy, but also in general.

63rd International Scientific Conference on Economic and Social Development – "Building Resilient Society" - Zagreb, 11-12 December, 2020
162
3. THE IMPACT OF TECHNOLOGY AND GLOBALIZATION ON THE
DEVELOPMENT OF THE SHARING ECONOMY
Technology has an increasing impact on all parts of modern business that are impossible to
imagine without the presence of technology. "The sharing economy is based on companies
looking for simpler ways to exchange goods. The initial examples of the sharing economy were
online classifieds through which people sought employment, love partners, exchanged and sold
goods. It continues to popularize and develop in the field of real estate rental and transportation
services. Today, the sharing economy is a multisectoral industry that encompasses all aspects
of everyday life.” (Bašić and Jurčević, 2017). Technology and globalization are one of the main
initial drivers of the sharing economy as well as other alternative models of (international) trade.
According to Hamari, Ukkonen, and Sjöklint (2016), the sharing economy arose from a number
of technological advances that simplified the process of sharing goods and services online. In
their book 2.0 Economic, Haring and Storbeck see the world as one big global village, precisely
because of globalization and the growing advances of technology. It is the world that has
become one big global village, in which information (which was once unthinkable) can be
reached with the click of a mouse in a few seconds. With the help of technology and
globalization, people are more connected, exchanging their ideas, attitudes and thoughts, and
thus building communities. Nowadays, mobile devices are everywhere, there is almost no
young person who does not own a "smartphone". In this way, the whole world is "in the palm
of everyone's hand". At any time, certain information can be checked, accommodation can be
booked, transportation can be ordered and the like. According to Pobi (2018), there are three
most important technological drivers of the sharing economy: social networks, mobile
applications, and payment systems. Borovac (2014) describes social networks as "a set of
internet applications, platforms and media that aim to enable cooperation between people and
joint creation and exchange of content." The importance of social networks is that it enables
fast and interactive communication between participants. Borovac (2014) lists: Facebook,
YouTube, Google+, Twitter, LinkedIn and Instagram as the most popular social networks.
Mobile applications are also considered technological drivers of the sharing economy, precisely
for the reason that sharing economy platforms via mobile devices and applications can be in
everyone's pocket and thus access the platforms at any time. Payment systems also play an
important role - secure and fast payments are important to consumers, especially in a world
where there are many financial frauds. It is security, speed and trust that are ensured by adequate
and secure payment systems. One of the most well-known and widespread payment systems is
certainly PayPal. The system is based on a credit card and bank account infrastructure, and
payment is made securely and within a reasonable time. The PayPal system makes about 8
million payments on a daily basis and is available in more than 190 countries (Lipovšek, 2019).
3.1. Sharing economy in numbers
According to the study An Economic Review on the Collaborative Economy (2016) conducted
by Petropoulos at the request of the European Parliament, Asia has most of the platforms for
the sharing economy (82), followed by North America (64), Europe (27), Africa and South
America. have 3 platforms, then the largest number of employees in the sharing economy is in
North America (820 million), Asia (352 million), in Europe the number of employees in the
sharing economy reaches 109 million. The sum of all employees in the world through the
sharing economy is 1.3 billion, which is a large number if we take into account the total
population, and total employment is growing from year to year with the development of new
technologies and platforms. The same research indicates the total market value of sharing
economy companies expressed in billions of US dollars. Data refer to North America, South
America, Europe, Asia and Africa. North America has the highest market value, followed by
Asia. The total global market value of the sharing economy in 2016 was USD 4.303 billion.

63rd International Scientific Conference on Economic and Social Development – "Building Resilient Society" - Zagreb, 11-12 December, 2020
163
The use of the sharing economy for accommodation is growing year after year. In the Republic
of Croatia, significant growth can be noticed in the last three years. According to Crnjak (2017),
in 2017 there were 103,000 accommodation units in the Republic of Croatia, and the average
income per household was USD 2,100.00 through Airbnb. The city of Zagreb recorded an
increase of 68% in the number of guests that year. The sharing economy has become widespread
in the daily life of an individual. Its importance is growing, and with the development of
technology, the sharing economy is developing exponentially. It can be concluded that models
of the sharing economy are more widespread in the world, and in the Republic of Croatia they
are gaining in importance, especially among the younger population. The most famous
examples of the sharing economy in the Republic of Croatia are BlaBlaCar, Airbnb, Uber and
Solidarity Food Exchange. According to research by the author Lock (2019), entitled Number
of Sharing Economy Users in the United States from 2016 to 2021, a continuous growth of
users can be seen. For example, in 2018, the number of users was 66.3 million. While in 2020,
that number exceeds 81 million users. The authors' predictions say that it will grow by the end
of 2020. According to Mazarean (2020) who conducted a survey entitled "Monthly Number of
Uber's Active Users Worldwide from 2017 to 2020, by Quarter (in millions)" it is possible to
notice a steady growth of Uber users in the world. For example, in the first quarter of 2017,
Uber was used by 49 million people, while in the last quarter of 2019, Uber was used by 111
million people worldwide. In 2020, there was a decrease in Uber use due to the COVID-19
epidemic, but the author notes that Uber generated USD 26 billion in the first half of 2020.
4. CHOSEN MODELS OF THE SHARING ECONOMY
There is no universal business model of the sharing economy; different authors describe the
sharing economy model in different ways. Kumar, Dogan and Lahiri (2017) model the sharing
economy in a simple way as a system in which a service provider, service users and platforms
that enable service delivery. Then Puschmann and Alt (2016) present the business model of the
sharing economy according to three levels of interaction between service providers and users.
At the strategic level, the sharing economy connects users and service providers directly or
through intermediaries. The process layer shows the processes that users, intermediary
platforms, and providers go through in transactions in the sharing economy. The third level
shows the use of information systems that serve to connect users and providers in the sharing
economy. These are, for example, applications used by users in order to meet their needs from
the process phase, then intermediary ones that, for example, ensure transaction execution,
billing and evaluation, and those from providers related to customer relations and lifecycle
management systems. Constantiou, Marton, and Tuunainen (2017) share the sharing economy
according to the level of control exercised by the platform owner over platform participants and
according to rivalry. Thus the sharing economy is divided into four models called franchisors,
director, captain and gardener. Franchisors and directors, that is, Uber and Handy, have a strict
level of control over the participants due to, for example, standardization of services and the
issuance of contracts. Directors and franchisors differ according to the degree of rivalry,
franchisors feel great rivalry due to the prices of contracted services and constant changes in
supply and demand in real time. While the model directors feel low rivalry due to standard
service prices. On the left side of the matrix are the captains and gardeners. Captains whose
best example is Airbnb feel high rivalry, due to prices and constant changes in supply and
demand, while gardeners feel low rivalry. Captains and gardeners have weak control over
platform participants (Constantiou, Marton, & Tuunainen, 2017). The following sharing models
are described according to Barb and Brat (2018) who divide them into: business model based
on approach, market / platform economy, on-demand service providers. The business model
based on the approach is also known as the excess capacity model, due to the fact that it is based
on underutilized resources.

63rd International Scientific Conference on Economic and Social Development – "Building Resilient Society" - Zagreb, 11-12 December, 2020
164
The model known due to the principle of access to various services and goods through internet
platforms. The consumer will not buy a certain product as in the traditional economy, but will
access it when he needs it. The platform owner provides tangible and intangible assets that the
consumer can rent. The importance of this model is that it forces consumers to a different way
of thinking in which access to a product is more important than owning a particular product.
The following is a market / platform economy in which consumer relations are in many cases
automated. Examples of this model are Airbnb (which facilitates transactions and connects
property owners with consumers) and BlaBlaCar (which facilitates the transportation of
people). The importance of this model is that it provides benefits to all parties, facilitates the
connection of users and providers in a fast and secure way, and refers to traditional products
and services such as transport, accommodation. The on-demand service provider model refers
to customer-focused service activities. Users require the provision of specific services by other
persons or by specialized companies. Value delivery is done through applications and
platforms. The platform has the role of ensuring the efficiency of transactions, but at the same
time offers an opportunity for evaluation for the provider and consumer of services through an
evaluation system (Barbu and Bratu, 2018).
5. ADVANTAGES AND DISADVANTAGES OF SHARING ECONOMY
The advantages of the sharing economy most often include: better prices, environmental
sustainability, community affiliation, possibility of additional income, use of unused materials,
better experience, and trust. According to Tabcum Jr. (2019) most cars are not used 95% of the
time. Owning a car often comes with fees, interest, insurance and a number of other costs. It is
these costs that can be reduced with sharing economy platforms. In addition, using a sharing
economy is cheaper than a traditional economy which further attracts users. This is especially
noticeable in the transport sector, for example Uber and BlaBlaCar are often cheaper than taxi
services. The sharing economy is environmentally friendly for the reason that it reduces the
demand for new goods. Instead, it allows the sharing of goods that remain unused and can be
shared multiple times. The sector of the sharing economy that contributes most to the
preservation of the environment is the transport sector. This sector improves environmental
sustainability by reducing greenhouse gas emissions (Frenken and Schor, 2017). Instead of
everyone owning a car, using fuel and gas, more people gather who use the same good together
and thus save money, time and participate in preserving the environment. Platforms facilitate
the process of sharing between people around the world who do not know each other, have no
common connections or common friends. In this way, new social networks and communities
are created that share their experience. One example is the socializing of hosts and guests during
rented accommodation (Frenken and Schor, 2017). The sharing economy allows people to
increase economic independence by earning even after traditional working hours or if they are
unemployed. People have flexible working hours, and can use their own goods that they do not
normally use. According to Tabcum Jr. (2019) the vast majority of the population owns things
they don’t need, an estimated 80% of items at home are used less than once a month. In addition,
goods become obsolete quickly or have a shelf life, by sharing these goods for a small fee or
by renting more people can enjoy those goods, and at the same time one can earn money. For
example, you can rent an unused room, bike, car, lawn mower, drill and the like. The sharing
economy is evolving and offering more and more innovations that improve the user experience.
"Trust is the main currency in the sharing economy. The wealth that a man accumulates is called
reputation. Every service has a rating system in which users rate, criticize and praise each
other.” (Sajter, 2014). It is the rating system that helps to establish trust between users. If a
person has a bad rating, there is a high probability that the user will not opt for it. Trust is also
considered a major challenge of the sharing economy, and it is precisely because of a lack of
trust that many people are not condemned to participate in sharing economy platforms,

63rd International Scientific Conference on Economic and Social Development – "Building Resilient Society" - Zagreb, 11-12 December, 2020
165
especially when renting their own home due to the possibility of theft and damage.
Disadvantages of the sharing economy can be classified into five main categories, namely:
instability of personal income, less benefits and protections for service providers, service
providers are responsible for their own training, capital investment and maintenance costs are
the responsibility of service providers, and user privacy and security. “Service providers in the
sharing economy are completely dependent on the platform’s ability to connect them with
customers, so service providers are often unsure whether their services will be in demand at all.
Also, in the case of platforms that determine prices independently, service providers are not
sure about the price until they start providing that service, and the price can change at any time.”
(Stojković, 2019). This shortfall is considered one of the most important for the reason that
providers are not sure how much income they will have per month. In addition, income may
vary from month to month. Furthermore, service providers are not classified as employees, for
this reason they do not have minimum wages, paid annual leave, sick leave, health and pension
benefits and the like. In addition, if a client cancels, is late, or simply does not show up for a
particular service, insurance does not cover such costs (U.S. Department of Commerce, 2016).
Service providers are responsible for their own training and the education they need to provide
services independently and seamlessly through the sharing economy. Platforms are not required
to provide training to service providers because they are not their employees. Service providers
are responsible for investing in the maintenance of their services. For example, Uber and
BlaBlaCar drivers themselves invest in their vehicle insurance, repairs and maintenance.
“Businesses involved in the sharing economy must, as a rule, collect customer data in order to
be able to connect customers with service providers in a reliable way. With numerous examples
of misuse and insufficient security of user data, it is necessary to consider the risk that
participation in the digital economy poses to personal privacy. Data security depends on the
legislation and the level of trust that users have in the company to which they provide data.”
(Brozović et al., 2019). For this reason, it is important to tell users which data is being collected
and to ask for their consent for this action. Disadvantages are also related to user safety. "One
example of the dark side of the online sharing platform is the wave of reporting cases of rape
and abuse via Couchsurfing, through which people can spend the night on their trips for an
affordable fee at one of the providers on the platform." (Bašić and Jurčević, 2017).
Couchsurfing is an online platform through which accommodation is offered to tourists, that is,
it acts as a community of travel enthusiasts who offer each other accommodation at the cheapest
prices in all parts of the world. One of the common reasons for not using the sharing economy
is precisely fear and mistrust. There is also the issue of theft or other forms of exploitation.
6. PRIMARY RESEARCH RESULTS
The primary research was conducted in June 2019 at the Faculty of Economics in Osijek
(Croatia) for the purpose of research on youth awareness of the existence of the sharing
economy. The target group were second-year undergraduate students, and the study included a
total of 217 respondents. The aim of the research was to investigate and find out how familiar
students are with the concept of sharing economics and which of the examples they use and to
what extent. The research was conducted through the online tool Google Forms. The
questionnaire included demographic questions, questions related to international trade, and
questions related to the sharing economy. The questionnaire was structured in such a way that
most questions had answers offered, while some questions were open-ended. The name of the
questionnaire was International Trade Awareness in my Environment. Out of a total of 217
respondents (second-year undergraduate students at the Faculty of Economics in Osijek), there
were 149 female students (68.7%) and 68 male students (31.3%). Most respondents (92.9%)
belong to the age group of 18 to 24 years, and 3.2% belong to the age group of 25 to 30 years.

63rd International Scientific Conference on Economic and Social Development – "Building Resilient Society" - Zagreb, 11-12 December, 2020
166
A total of 2.3% of respondents belong to the group of 30 to 39 years, and the same percentage
of respondents belongs to the group of 40 and more years. 72.8% of respondents with secondary
education participated in the survey, while 26.3% of respondents stated that they had completed
college or university. The most important research results are listed below. To the question:
"Have you heard of the term sharing economies", a total of 59% and 128 respondents answered
that they have not heard of the term sharing economies, only 24.4% of respondents answered
that they are familiar with the term, and 16.6% of respondents answered that he did not know
the answer to this question. Respondents most often heard of Uber (179), BlaBlaCar (144),
Airbnb (105), and a total of 21 respondents had not heard of any of the examples offered. It can
be concluded that the respondents know about certain examples of sharing economics, but they
do not know that these examples belong to the concept of sharing economy. When it comes to
using certain platforms, the situation is a little different. To the question "Which platforms have
you used so far?" The majority (a total of 104 respondents, i.e. 47.9%) answered that they have
not used them. Students most often use Uber (36.4%), BlaBlaCar (22.6%) and Airbnb (15.7%).
To the question “What do you think is the advantage of the sharing economy?” respondents
were able to choose multiple correct answers. The largest percentage of respondents (55.3%)
decided that the main advantage of the sharing economy is cost reduction, 50.2% of respondents
answered that the advantage is the connection between consumers and visible reviews, in
addition, the sharing economy increases quality of life, creates new jobs and encourages the
development of the local economy. When asked "Do you think that distrust is the main
challenge of the sharing economy", a total of 45.2% of respondents answered in the affirmative,
23.5% of them believe that distrust is not the main challenge, while 31.3% of respondents said
they do not know. Most respondents (43.1%) used the sharing economy in the field of transport,
35.2% in the field of tourism, and 32.4% in the field of food delivery and exchange. Students
use different examples, but are not aware that they belong to the sharing economy, that is, they
do not know enough about its concept. Unlike knowledge of platforms and various examples,
a large number of students did not use sharing economy platforms which is not expected due to
the fact that sharing economy in the world is most often used by young people. Students were
expected to use the sharing economy mostly for transportation and accommodation, most
commonly Uber, BlaBlaCar and Airbnb as research has shown.
7. CONCLUSION
The importance of international trade is growing, and the factors affecting it are changing
rapidly. Globalization and the development of information and communication technology have
a significant and exponential impact on international trade. Classic models find it increasingly
difficult to follow modern trends, desires and requirements of the world, and are exposed to
increasing challenges. People are eager for change, they are more connected than ever before,
and their social responsibility and environmental awareness, which is increasingly being
brought to the fore, is growing. The main drivers of the new way of thinking and new consumer
habits are millennials, people born between 1980 and 2000. As a consequence of the challenge,
new business models are emerging, and one of them is the sharing economy. The sharing
economy is a modern paradigm that has no official and accepted definition, and can be briefly
defined as the sharing of property or services free of charge or for a fee. It arose in response to
a number of challenges related to growing poverty, crisis, environmental pollution, climate
change, migration and social irresponsibility. Solidarity, cooperation and reciprocity of people
are at the forefront. The focus is on human resources, quality, efficiency, added value as well
as on social and environmental responsibility. The sharing economy has a number of benefits
for both service providers and users. The main challenge is the privacy and security of users.
The European Union pays great attention to the adoption of measures for clear and equal
regulation of the sharing economy through taxes, protection of consumers and workers, and

63rd International Scientific Conference on Economic and Social Development – "Building Resilient Society" - Zagreb, 11-12 December, 2020
167
through fair market competition. The result of the sharing economy is solidarity, job creation,
rationalization of consumption, and growth of local economies. It can be concluded that the
sharing economy is a true example of a new business model that has an increasing impact on
the international economy. It allows individuals to be both users and service providers of the
sharing economy. The impact can be seen through the results that the sharing economy achieves
and the constant growth in the number of users that is expected in the future as well. The impact
of the sharing economy is also great in the Republic of Croatia, but the lag behind the large
European Union countries such as Germany, France and others is still visible. This result was
confirmed by the primary research. Young people are still not familiar enough with the concept
of the sharing economy. Most respondents are not familiar with the concept of sharing
economy, but recognize some of its platforms or have used them without even being aware that
it is precisely the sharing economy. However, given the trends, different research results are to
be expected in the future. In order for the sharing economy to develop faster, it is necessary to
abandon old habits and accept new ones. Younger people are those who find it easiest to adopt
new habits and who use various platforms of the sharing economy. It is expected that more and
more products and services will be included in the sharing economy in the future, and that the
constant development of information and communication technology will overcome user
distrust, improve security and data protection. The COVID-19 epidemic brings economic crisis
and disruption of the supply and demand on the market. It is likely that the sharing economy
will best adapt to the current situation due to its flexibility and willingness to change, which
could further affect the growth of the sharing economy in total (international) trade.
LITERATURE:
1. Barbu, C., Bratu, R. (2018). Business Models of the Sharing Economy. volume 19, Issue 2,
Romania: University of Craiova. Retrieved 16.08.2020 from:
https://www.researchgate.net/publication/330222122_Business_Models_of_the_Sharing_
Economy.
2. Bašić, M., Jurčević, A. (2017). Ekonomija dijeljenja. Croatia: Faculty of Economics in
Zadar. Retrived 16.08.2020. from: http://sdp-zadar.org/wp-content/uploads/2018/03/
Ekonomijadijeljenja.pdf
3. Borovac, N. (2014). Strategije očuvanja privatnosti u okviru modernih društvenih medija.
Croatia: Filozofski fakultet u Osijeku. Retrived 16.08.2020 from: https://repozitorij.ffos.hr/
islandora/object/ffos%3A1493/datastream/PDF/view
4. Botsman, R. (2015). Defining the Sharing Economy: What is Collaborative consumption-
and What isn’t? USA: Fast Company. Retrived 01.08.2020 from:
http://www.fastcoexist.com/3046119/defining-the-sharing-economy-what-is-collaborative
consumption-and-what-isnt.
5. Brozovic, V. et al. (2019). Ekonomija dijeljenja: poslovni model budućnosti?
Croatia,Zagreb: Zbornik Ekonomskog fakulteta u Zagrebu, Vol. 17 No. 1, 2019. Retrived
06.08.2020 from: https://hrcak.srce.hr/.
6. Constantiou, I., Marton, A., Tuunainen, V. (2017). Four Models of Sharing Economy
Platforms. Indiana: Kelley School of Business at Indiana University. Retrived 16.08.2020
from: https://www.researchgate.net/publication/321576374_Four_Models_of_Sharing_
Economy_Platforms
7. Crnjak, M. (17.08.2017). Međunarodna platforma za najam smještaja osvojila Jadran.
Croatia: Poslovni dnevnik. Retrived 10.08.2020 from: http://www.poslovni.hr/
hrvatska/rast-prometaairbnba-u-hrvatskoj-visi-od-100-330700

63rd International Scientific Conference on Economic and Social Development – "Building Resilient Society" - Zagreb, 11-12 December, 2020
168
8. Frenken, K., Schor, J. (2017). Putting the sharing economy into perspective, Environmental
Innovationand Societal Transitions, 23(1), str. 3-10 Boston: Environmental Innovation and
Societal Transitions. Retrived 11.08.2020 from:
https://www.sciencedirect.com/science/article/pii/S2210422417300114
9. Hamari, J., Ukkonen, A., Sjöklint, M. (2016). The Sharing Economy: Why People
Participate in Collaborative Consumption. Journal of the Association for Information
Science and Technology. 67. 2047-2059. 10.1002/asi.23552. Retrived 15.08.2020
from:https://www.researchgate.net/publication/255698095_The_Sharing_Economy_Why
_People_Particiate_in_Collaborative_Consumption
10. Haring, N, Storbeck, O. (2009). 2.0 Economic., Ney York: Palgrave macmillan
11. Lipovšek, I. (09.05.2019). Online plaćanje smještaja: Top 5 payment gateway sistema u
Hrvatskoj. Croatia: Cimerfraj.hr. Retrived 25.07.2020 from:
https://www.cimerfraj.hr/ideje/payment-gateway-hrvatska.
12. Lock, S. (2019). Number of sharing economy users in the United States from 2016 to 2021.
USA: Statista. Retrived 15.08.2020 from:
https://www.statista.com/statistics/289856/number-sharing-economy-users-us/.
13. Mazareanu, E. (2020). Monthly number of Uber's active users worldwide from 2017 to
2020, by quarter (in millions). Germany: Statista. Retrived 16.08.2020 from:
https://www.statista.com/statistics/833743/ususers-ride-sharing-services/.
14. Owyang, J., Tran, C., Silva, C. (2013). The Collaborative Economy: Products, services, and
market relationships have changed as sharing startups impact business models. To avoid
disruption, companies must adopt the Collaborative Economy Value Chain. Altimeter
Research Theme: Digital Economies. USA: Altimeter. Retrived 11.08.2020 from:
http://www.collaboriamo.org/media/
2014/04/collabecon-draft16-130531132802phpapp02-2.pdf .
15. Petropoulos, G. (2016). An economic review on the Collaborative Economy. Brusseles:
European Parliament. Retrived 16.08.2020 from:http://www.europarl.europa.eu/RegData/
etudes/IDAN/2016/595358/IPOL_IDA(2016)595358_EN.pdf
16. Pobi, L. (2018). Ekonomija dijeljenja. Croatia Faculty of Economics in Osijek. Retrived
03.08.2020 from: https://urn.nsk.hr/urn:nbn:hr:145:753543.
17. Puschmann, T, Alt, R. (2016) Sharing Economy. Business & Information Systems
Engineering, 58, 93-99. Retrived 16.08.2020 from: https://www.researchgate.net/
publication/289367044_Sharing_Economy/link/5efc8b72a6fdcc4ca440acc5/download
18. Sajter, D. (2014). Ekonomija dijeljenja. Croatia: Faculty of Economcs in Osijek. Retrived
04.08.2020 from: https://bib.irb.hr/datoteka/722791.Ekonomija_dijeljenja.pdf.
19. Stojković, M. (2019). Utjecaj ekonomije dijeljenja na promjene u transportnom ponašanju
starije populacije. Croatia: Faculty of Economcs & Business Zagreb Retrieved 08.08.2020.
from: https://zir.nsk.hr/islandora/object/efzg%3A4123/datastream/PDF/view.
20. Tabcum Jr. (04.03. 2019). The Sharing Economy Is Still Growing, And Businesses Should
Take Note. Los Angeles: Forbes. Retrieved 09.08.2020. from: https://www.forbes.com/
sites/forbeslacouncil/2019/03/04/the-sharing-economy-is-still-growing-and-businesses-
should-take-note/#3422461a4c33.
21. U.S. Department of Commerce (2016). Digital matching firms: A new definition in the
„sharing economy“ space. Washington: U.S. Department of Commerce. Retrieved
09.08.2020. from: https://www.commerce.gov/sites/default/files/migrated/reports/digital-
matching-firms-new-definition-sharing-economy-space.pdf

63rd International Scientific Conference on Economic and Social Development – "Building Resilient Society" - Zagreb, 11-12 December, 2020
169
INTERNATIONAL REPRODUCTION OF CAPITAL AND
INTEGRATION OF SMES INTO GVC
Anar Rzayev
Azerbaijan State University of Economics (UNEC), Azerbaijan
Baku, Istiqlaliyyat str.6, AZ1001, Azerbaijan
Ganira Ibrahimova
Siegen University, Germany
Unteres Schloß 3, 57072 Siegen, Germany
ABSTRACT
The world economy will soon enter a post-pandemic period, never expiriences in such scales
before. There are already many opinions and forecasts about what the world economy will look
like in the nearest future. Although the reality shows that the whole world will face a social and
economic crisis unprecedented in the past. Indeed, the COVID-19 pandemic has become a
serious trigger for changing the current system of global production. And the emerging gap in
existing connections within global value chains has become a huge challenge for all actors of
the world economy. Being the main drivers of the global production and financial system, large
corporations faced the need to improve, but it is still difficult to say how much time it will take.
Although, it is become more and more obvious within quarantine recession, that SME are
getting increasing impact not only within the national economies of countries but also in the
scale of the world economy as a whole. At the moment SME sector is receiving huge
institutional and financial aid support from governments which willl eventually lead to the
improvement of the International Capital Reproduction System. The main objective of this study
is to reveal and assess the existing factors for integrating SMEs into global value chains and
also to identify prospects for internationalization and improvement of production relations
between suppliers and buyers. The article analyzes the situation of one-way integration of the
regime and information flow and outlines the solution of problems in the SME management
approach. The article refers to the key attributes of factors directly related to SMEs and
integration and focuses on how SMEs can influence the sustainable economic growth of the
world economy.
Keywords: internationalization, integration, pandemia, reproduction of capital, value chain,
SMEs, information exchange
1. INTRODUCTION
The great importance of GVC as an economic and political tool in the formation of a new global
economy system requires a serious study of this system effectiveness, especially during the
post-pandemic period. It is clear that the inclusion of countries in global chains allows them to
pursue planned economic policies in the aspect of attracting foreign investment and
subsequently increasing export and transit potential. We observe on the one hand, the existence
of unequal dynamics among GVC countries leads to the dependence of developing countries
on developed countries, and on the other hand, excluding such ties leads to economic and
political isolation. As our research shows, the institutionalization of the GVC approach has in
fact revealed new mechanisms for the integration process based on the close interconnection of
countries' production systems within regional and global networks. Such networks, managed
by transnational capital, basically deploy reproductive processes both within individual
countries and globally, ultimately leading to economic growth in the world economy.

63rd International Scientific Conference on Economic and Social Development – "Building Resilient Society" - Zagreb, 11-12 December, 2020
170
This situation allows economic actors from developing countries to achieve strategic positions
in the world economy. In addition, the situation associated with COVID-19 has further
increased this prospect, since almost 90% of all existing chains have either been frozen for the
quarantine period or have ceased to exist. It became clear that the GVCs that existed during the
before-pandemic period would differ significantly during the post-pandemic period. The
question is, how exacty the image of GVC and its participants will be changed? Many nations
have invested huge amounts of money in supporting small and medium businesses during the
pandemic disaster. This approach is fair, as it is this part of the national economies that has
suffered the most. Negative social and economic consequences and the search for new ways to
develop entrepreneurship can have a positive impact on the economic development of countries
during the post-pandemic era of the world economy. Our research is based on the following
hypothesis:
• First of all, to determine the importance of the GVC's contribution from its inception within
the framework of World Systems Theory (WST) to its final association within the network
paradigm. The impact of globalization on economic and institutional functioning needs to
be analysed here.
• Secondly, on the basis of key elements, it is necessary to critically assess the GVC approach,
to consider the existing limitations in its theoretical structure related to the increased role of
the State; to consider national and regional trajectories (as well as socio-economic and
political factors and elements); to analyze the reproduction in the context of unequal country
dynamics generated by global transnational actors.
• Thirdly, conduct a comparative analysis of institutional factors impact on entrepreneurship
development in developing and developed countries and assess the prospects for their
inclusion in the new GVC system.
2. THEORETICAL AND METHODOLOGICAL BACKGROUND OF GVC
GVC is not only a theoretical and methodological basis for global reproductive processes, but
also a practical system of interaction and assimilation within a global political network. But it
should be noted that it is in this situation that certain problems are discovered that nascent
antagonism between large capital and the global bureaucracy. Perhaps that is why the Davos
World Economic Forum is such a huge success, as it creates a "Platform" for the resolution of
certain controversial situations and creates new and effective "Rules of the Game" of
relationships between representatives of large business and political elite. The main goal is to
create a system of "Common Interests" within the developed and existing GVC. In other words,
as part of our research, we consider the need to develop a new approach capable of overcoming
the limitations imposed by the political conditions of GVC as a condition for creating global
alternatives based on the laws of neoliberal doctrine that dominates the global world. Over the
past decade and a half, the global value chain (GVC) approach has become one of the most
stimulating tools for analyzing the geo-economic dynamics of globalization. While a group of
researchers used this concept rather vaguely in advising governments and organizations on the
competitiveness of regions and firms, another group of scientists based on a more systematic
and complex theoretical tradition used it to explain the principles of various industrial global
networks (Gereffi 1996; Gereffi and Kaplinsky 2001). From the institutional point of view,
inclusion in the GVC allows many developing countries, especially those in transit, to bring
their institutions closer to the neoliberal mode of the "Western World" under the influence of
global political and supranational institutions. Since the 1990s, the concept of the Global
Commodity Chain (GCC) was first introduced by Gary Jereffy, and today the issue is very
relevant, particularly in the study of applications and methodological aspects. Since 2000, there
has been a rapid development of globalization and this has led to the concept of GVC's global
value chain replacing that of GCC's global product chain.
63rd International Scientific Conference on Economic and Social Development – "Building Resilient Society" - Zagreb, 11-12 December, 2020
171
At this time, there has been a change in attitude towards the essence of the commodity in the
international trade system. Indeed, the emergence of certain problems in commodity-rich
countries has led to complex problems with the uneven development of the world economy,
manifested by the decline in exports of high value-added goods, which are derived from the
innovation component. It was therefore necessary to revisit the very notion of commodities and
the nature of the problems that arose in the nature of value addition from raw materials to
finished products. This led to the need to introduce new forms of chain management (Bair
2005). Both the concepts of GCC and GVC have led to a gradual change in meaning with
respect to GCC (Gereffi et al. 2005), which is an attempt to use this approach as a new tool for
understanding the specifics of current globalization processes. In this sense, the concept of GVC
and its empirical application were different from the method provided by WTS (World System
Theories) for product chains. The specificity of this process is based on a new form of economic
reproduction, which takes place on the functional integration of dispersed activities, on the
international arena, which has a significant difference with internationalization. In other words,
this approach is less focused on the activities of a single State as well as on the criterion based
on international trade or FDI. Instead, qualitative elements have been identified as a result of
changes in the industrial organization of TNCs in various sectors of the world economy. This
has led to a re-prioritization of national economies of domestic scale through vertical integration
with external economies, mainly through outsourcing (Gibbon; Ponte 2005). Spatially, this has
created space for highly fragmented and geographically dispersed value chains, where TNCs
break down production processes and place them on a global scale. GVC's approach assumes
that the holistic perspective has not been retained to understand the capitalist system as a whole,
but to analyze a particular network of enterprises that do business globally in certain activities
that transcend national and regional boundaries. In this sense, the GVC approach is assumed to
be "an international structure for the production, trade and consumption of goods that is broken
down into stages, included in a network of activities controlled by firms". The new scenario of
global reproductive formation is based on the concept of management and modernization of
world production, which directly affects not only the size of world consumption and the
qualitative change of the world product. Competitive struggle on the world stage changes the
entire face of global politics, which naturally alienates many countries from the system of world
economic relations. We see this by the example of growing alienation of many integration
groups from the rest of the world or the increase of political power of some countries over
others within the same regional integration associations. GVC in this process is a powerful tool
for understanding how political and economic activities interact and develop in different
directions in the global world. The stages of production corresponding to each global economic
network and the way in which value is produced and distributed in these activities (Gereffi et
al. 2005) not only focus on productive activities, but also include expanding markets and
deepening the global division of labour (Giuliani et al. 2005).
Based on different approaches, it is possible to group the existing shortcomings into three
interrelated groups:
1) The concept of subordination and its implications in networks and circuits;
2) Underestimation of national trajectories and dynamics - their specific matrix of socio-
economic power, as well as the role and capabilities of the historically established state - as
a result of analytical excessive centralization of firms;
Insufficient attention to the process of financing and financial capital in global networks, as
well as their role in relationships with participation in different chains.

63rd International Scientific Conference on Economic and Social Development – "Building Resilient Society" - Zagreb, 11-12 December, 2020
172
According to researchers, GVC provides an opportunity to learn "how authority is distributed
and used among member firms in a chain", and the distribution of authority in the area of
responsibility allows us to identify the following issues:
1) Which actors control the chain?
2) Where do the sources of authority come from and what is the nature of the sources of
authority?
3) Based on what conditions is the distribution of income or flow of value among the different
actors in the chain?
In other words, GVC makes it possible to identify who is responsible for generating and
maintaining dynamic functions - in terms of value management - i.e. to determine how the total
power of chain actors is distributed in a network and node management system (Gereffi et al.
2005). The management concept, which, as already shown, classifies GVC as being managed
by the manufacturer, as well as by the buyer. In the case of manufacturer-oriented GVC with
intensive use of capital and technology, management is a key productive activity. In the case of
GVC, which is buyer-oriented, we are talking directly about labour-intensive products and
labour-intensive production (clothing, footwear and agri-food products). A geographical feature
is, of course, of great importance and has exceptional benefits from transit potential. Although
it can be said that this factor may not be the main one of the total value added if the country is
not in the geopolitical interests of the main GVC member countries. In addition, during the
pandemic, companies with a huge portfolio of online products were able to quickly become
GVC leaders. Based on the fact that the GVC management system operates in the form of
vertically integrated networks where information, production costs, product design, advertising
and modern supply chain management systems create barriers to entry, the main factor of
inclusion will be the availability and ability to invest capital... In these chains, production
functions are usually outsourced and key players focus on branding, design and marketing
functions.
3. NEW GLOBAL REPRODUCTIVE SCENARIO
The new scenario of global reproductive formation is based on the concept of management and
modernization of world production, which directly affects not only the size of world
consumption, but also the qualitative change in the world product. Competitive struggle on the
world arena changes the entire face of global politics, which naturally alienates many countries
from the system of world economic relations. We see this by the example of growing alienation
of many integration groups from the rest of the world or the increase of political power of some
countries over others within the same regional integration associations. GVC in this process is
a powerful tool for understanding how political and economic activities interact and develop in
different directions in the global world. The stages of production corresponding to each global
economic network and the way in which value is produced and distributed in these activities
(Gereffi et al. 2005) not only focus on productive activities, but also include expanding markets
and deepening the global division of labour. Taking into account national trajectories and
characteristics of socio-economic and political structures and their dynamics means analyzing
not only the activities of firms, but also those of the state. In a certain sense, the issue of global
reproduction involves integration factors with several other qualities different from those we
are used to considering within existing integration associations. These factors are related to the
specifics of the existing actors, which are expressed by different shares of capital, labor and the
level of political influence. At the same time, it is necessary to accept the fact that even in such
a situation the interrelation of subjects, being consistent, is still of scalar nature, i.e. top-down
control. As far as the state is concerned, it is considered not simply as an institution, but as a
specific subject with varying degrees of power in its configuration, interacting with the power

63rd International Scientific Conference on Economic and Social Development – "Building Resilient Society" - Zagreb, 11-12 December, 2020
173
of social coalition classes involved in the historical creation of state capabilities. Recognition
of the strengths and weaknesses that shape these state capabilities is important for
understanding the capabilities from which regional, national, and labor force representatives
contribute to modernization in GVCs.
4. THE PROBLEM OF INTERACTION OF ENTREPRENEURSHIP SYSTEMS IN
GVC INSTITUTIONAL INDICES ANALYSIS
During the pandemic, many countries felt that the socio-economic development of the national
economy was seriously threatened. States have invested huge amounts of money to support
SME. In the new formation in the post-Pandemic period of GVC development, it is possible
that not only the participating countries will change, but also the share of SME will increase. In
this regard, based on previous studies, it is necessary to identify how the institutional systems
of developed and developing countries match each other. For this purpose, we built an
econometric analysis model in GRETL 1-7-1. Indexes calculated by the World Bank and GEM
for 2016-2017 were used to build the econometric analysis model. Analysis for developing
countries by World Governance indicators (World Bank. Kaufmann) such as Rule of Law (RL),
Control of corruption (CC), Total Early-Stage Entrepreneurial Activity (TEA) and Established
Business Ownership Rate (EBOR). Developed-country analysis by International Property Right
Index (IPRI), Total Early-Stage Entrepreneurial Activity (TEA) and Established Business
Ownership Rate (EBOR). In the model for developing countries, we see that, despite the low
statistical significance of the business rate, the control of corruption has an impact. The Total
Early-Stage Entrepreneurial Activity indicator is heavily influenced by the rule of law.
Table 1: Model for Developing Countries OLS estimates using the 11 observations 1-11
Dependent variable: TEA
Variable Coefficient Std. Error t-statistic p-value
const -25,357 8,3129 -3,0503 0,01857 **
CC 0,171938 0,130757 1,3149 0,22997
EBOR 0,193003 0,64346 0,2999 0,77293
RL 0,327818 0,160704 2,0399 0,08073 *
Mean of dependent variable = 10,3636
Standard deviation of dep. var. = 5,55919
Sum of squared residuals = 77,4317
Standard error of residuals = 3,32591
Unadjusted R2 = 0,749449
Adjusted R2 = 0,64207
F-statistic (3, 7) = 6,97946 (p-value = 0,0164)
Log-likelihood = -26,3416
Akaike information criterion = 60,6832
Schwarz Bayesian criterion = 62,2747
Hannan-Quinn criterion = 59,6799
Table following on the next page

63rd International Scientific Conference on Economic and Social Development – "Building Resilient Society" - Zagreb, 11-12 December, 2020
174
Table 2: Correlation coefficients, using the observations 1 - 11
5% critical value (two-tailed) = 0,6021 for n = 11
CC TEA RL EBOR
1,0000 0,7488 0,6655 0,5356 CC
1,0000 0,8199 0,5697 TEA
1,0000 0,5705 RL
1,0000 EBR
For 95% confidence intervals, t(7, .025) = 2,365
Countries TEA Prediction std. error 95% confidence
interval
Bulgaria 4,80000 1,77927 4,24217 (-8,25186, 11,8104)
Chile 24,2000 18,3036 3,91023 (9,05742, 27,5499)
Croatia 8,40000 7,96689 3,65758 (-0,681912, 16,6157)
Georgia 8,60000 10,3017 4,02228 (0,790461, 19,8128)
Hungary 7,90000 8,02224 3,54898 (-0,369777, 16,4142)
Latvia 14,2000 14,2858 4,14499 (4,48446, 24,0872)
Malaysia 4,70000 8,56863 3,68209 (-0,138123, 17,2754)
Poland 10,7000 13,3220 3,55544 (4,91470, 21,7293)
Slovakia 9,50000 11,1609 3,67920 (2,46094, 19,8608)
South Africa 6,90000 4,87387 4,04682 (-4,69533, 14,4431)
Uruguay 14,1000 15,4152 4,14660 (5,61002, 25,2203)
Figure 1: The forecast
The forecast shows that countries such as Georgia, Hungary, Malaysia, Poland, Slovakia and
Uruguay can significantly increase their early-stage entrepreneurial activity by further
developing existing institutions. This suggests that the new formation of GVC has a great
opportunity to actively include entrepreneurial structures of these countries. For the rest of the
countries, it makes sense to improve the qualitative characteristics of the institutions and their
impact on entrepreneurship development.
Table following on the next page
-10
-5
0
5
10
15
20
25
30
1 2 3 4 5 6 7 8 9 10 11
TEA
forecast
95 percent confidence interval

63rd International Scientific Conference on Economic and Social Development – "Building Resilient Society" - Zagreb, 11-12 December, 2020
175
Table 3: Model for Developed Countries: OLS estimates using the 10 observations 1-10
Dependent variable: TEA
Variable Coefficient Std. Error t-statistic p-value
const -5,41723 6,02018 -0,8998 0,39810
IPRI 0,00124323 0,000789596 1,5745 0,15937
EBOR 0,584934 0,354272 1,6511 0,14270
Mean of dependent variable = 7,48
Standard deviation of dep. var. = 2,79754
Sum of squared residuals = 38,1427
Standard error of residuals = 2,3343
Unadjusted R2 = 0,458477
Adjusted R2 = 0,303756
F-statistic (2, 7) = 2,96325 (p-value = 0,117)
Log-likelihood = -20,8831
Akaike information criterion = 47,7663
Schwarz Bayesian criterion = 48,674
Hannan-Quinn criterion = 46,7705
Table 4: Correlation coefficients, using the observations 1 - 10
5% critical value (two-tailed) = 0,6319 for n = 10
IPRI EBR TEA
1,0000 0,1218 0,4976 IPRI
1,0000 0,5164 EBR
1,0000 TEA
For 95% confidence intervals, t(7, .025) = 2,365
Countries TEA prediction std. error 95% confidence interval
Finland 6,70000 9,26732 2,58432 (3,15637, 15,3783)
France 5,30000 6,12134 2,55822 (0,0721143, 12,1706)
Germany 4,60000 8,27752 2,47093 (2,43471, 14,1203)
Italy 4,40000 4,65613 2,80063 (-1,96630, 11,2786)
Luxembourg 9,20000 6,71866 2,82599 (0,0362616, 13,4011)
Netherlands 11,0000 10,5285 2,81120 (3,88106, 17,1759)
Portugal 8,20000 6,94111 2,53921 (0,936840, 12,9454)
Spain 5,20000 5,48225 2,71952 (-0,948392, 11,9129)
Sweden 7,60000 7,22415 2,63507 (0,993195, 13,4551)
USA 12,6000 9,58302 2,64354 (3,33205, 15,8340)
Figure following on the next page

63rd International Scientific Conference on Economic and Social Development – "Building Resilient Society" - Zagreb, 11-12 December, 2020
176
Figure 2: The impact of the established business rate (EBR) on Total Early-Stage
Entrepreneurial Activity (TEA)
For developed countries, the impact of the established business rate (EBR) on Total Early-Stage
Entrepreneurial Activity (TEA) is of great importance. Based on the analysis, it can be
concluded that in the new formation of GVC, developing countries will increasingly be included
in global networks, provided a significant change in the institutional framework, which directly
affects the development of SME. On the other hand, financial and economic support to small
and medium-sized businesses during the pandemic will not give a tangible impact. The
consideration of the role of finance in GVC leads to an important aspect of identifying
difficulties in accessing credit resources. The privileged access that leading - non-financial -
firms have to financial resources enhances the dynamics of financing and their relationship with
both financial investors and banks. Weak access to finance by economic actors from developing
countries, mainly SMEs, leads to their involvement in localized and subordinate functions of
GVC. In this situation, global holdings are created, consisting of economic entities included in
GVC (Hessels, J., & Van Stel, A. 2011). The financing process in GVC (in principle it is a
global financial system) tends to complicate asymmetrical control over powers and sets barriers
to entry for small entities. In order to improve their functions and position in GVC through new
financial investments, these participants rely on assistance offered by either lead firms or
national and international programs of international development and financial assistance
institutions. As structured and coordinated national financial systems in developing countries
tend to be underdeveloped, regional SMEs become increasingly dependent either on their own
revenues or on international financial programmes, most of which are implemented through
national and regional governments.
5. CONCLUSION
Ironically, the GVC approach has been strengthened by its increasing assimilation with
international organizations. Exploring this relationship may allow us to better understand how
and why GVC's main constraints are related to ideas and interests that unite economic and
institutional global networks. Indeed, even in spite of GVC's political, economic, and
geographic development, the institutional framework plays an enormous role. Therefore, in the
period of post-Pandemic development of the world economy, international institutions will be
of great importance. In this regard, we should talk about the need to improve the global
institutional system. Then it is possible to solve such issues as identification of reasons and
ways to include GVC in the strategy of international institutions, which will form global
political networks. To solve the problems of increasing the role of GVC in global political
networks, with the exception of the problems of asymmetric logic and interests of the global
-2
0
2
4
6
8
10
12
14
16
18
1 2 3 4 5 6 7 8 9 10
TEA
forecast
95 percent confidence interval
63rd International Scientific Conference on Economic and Social Development – "Building Resilient Society" - Zagreb, 11-12 December, 2020
177
economic networks. The next issue is related to conducting "fast" towards SME. Creating a
neoliberal device that makes it possible to activate the continuity of inclusion or exclusion and
the system of subordination of subjects from the fragmentation process. The international
organizations of the UN system and other global financial institutions are conducting serious
studies on how the processes and dynamics of development in national economies of
developing countries (mainly the concepts of cluster development or regional innovation
systems are analyzed) can be integrated into global chains. In the study of the relationship
between local clusters and GVC, and in the presence of the above mentioned management and
modernization categories, for international organizations, this was the main objective to achieve
the overall goal of increasing SME competitiveness and, consequently, reducing poverty in
these countries. The organisation of SMEs in the form of local clusters is necessary in order to
enter the GVC (supported by supranational institutions), seems to be involved in this
environment of a micro-disciplinary and coherent "quick policy"; to encourage local
governments and community organisations to accept the scenario of a global network as
inevitable, and to recognise that their characteristics can be adapted and extended to include
them in global value chains of quality. Strengthening SME clusters through the development of
productive activities and their inclusion in GVC, with a focus on UN organizations, is the main
mechanism not only for the development of national SMEs, but also with the participation of
global capital for their inclusion in the global reproductive process. This is, in principle, the
essence of the design of new development programs implemented by supranational economic
organizations.
LITERATURE:
1. Carter, S., & Jones-Evans, D. (2006). Enterprise and Small Business. Essex: Pearson
Education Limited.
2. Bair, J. and Gereffi, G. (2001) Local clusters in global chains: the causes and consequences
of exportdynamism in Torreon’s blue jeans industry, World Development, 29(11), pp.
1885–1903
3. Gereffi, G. and Korzeniewicz, M. (eds) (1994) Commodity Chains and Global Capital-
ism,Westport: Praeger.
4. Gereffi, G. and Memodovic, O. (2003) ‘The Global Apparel Value Chain: WhatProspects
for Upgrading by Developing Countries?’ United Nations Indus-trial Development
Organization (UNIDO), Sectoral Studies Series, availablefor downloading at
http://www.unido.org/doc/12218
5. Gary Gereffi, John Humphrey, Raphael Kaplinsky, Timothy J. Sturgeon, Gibbon, P. (2001)
Introduction: Globalisation, Value Chains and Development Upgrading primary
production: a global commodity chain approach, WorldDevelopment, 29(2), pp. 345–363
6. Gibbon, P. and S. Ponte (in press) Trading Down? Africa, Value Chains and the Global
Economy Philadelphia: Temple University Press.
7. Krajewski, L. J., Ritzman, L.P., & Malhotra, M. K. (2007). Operations Management.
Processes and Value Chains. New Jersey: Pearson. Kristensen, P.H., & Lilja, K. (2011).
Nordic Capitalisms and Globalization. New forms of economic organizations and welfare
institutions. Oxford: University Press. http://dx.doi.org/10.1093/acprof:oso/
9780199594535.001.0001
8. Perry, M. (2012). Small firms and network economies. London and New York: Routledge.
Porter, M. (2008). On competition. Boston: Harvard Business Review.
9. Ponte, S. (2002b) ‘The ‘Latte Revolution’? Regulation, Markets and Consumption in the
Global Coffee Chain’, World Development 30(7): 1099-1122
10. Todeva, E. (2006). Business Networks. Strategy and Structure. London and New York:
Routledge.

63rd International Scientific Conference on Economic and Social Development – "Building Resilient Society" - Zagreb, 11-12 December, 2020
178
11. Hessels, J., & Van Stel, A. (2011). Entrepreneurship, export orientation, and economic
growth. Small Business Economics, 37(2), 255–268. https://doi.org/10.1007/s11187-009-
9233-3.
12. Hessels, J., van Gelderen, M., & Thurik, R. (2008). Drivers of entrepreneurial aspirations
at the country level: the role of start-up motivations and social security. International
Entrepreneurship and Management Journal, 4(4), 401–417. https://doi.org/10.1007/s11365-
008-0083-2.
13. WGI https://info.worldbank.org/governance/wgi/
14. IPRI https://www.internationalpropertyrightsindex.org/
15. GEM https://www.gemconsortium.org/

63rd International Scientific Conference on Economic and Social Development – "Building Resilient Society" - Zagreb, 11-12 December, 2020
179
THE IMPACT OF TECHNOLOGICAL EVOLUTION IN THE
AUTOMOTIVE INDUSTRY ON HOW TO MANIFEST THE REBOUND
EFFECT
Giani Gradinaru
The Bucharest University of Economic Studies,
Institute of National Economy – Romanian Academy, Romania
Erika Marin
The Bucharest University of Economic Studies, Romania
Iulia Neagoe
The Bucharest University of Economic Studies, Romania
Catalin Rotaru
The Bucharest University of Economic Studies, Romania
ABSTRACT
In economics, the rebound effect is the reduction of expected gains from new technologies that
increase resource efficiency due to behavioral or other systemic responses. These responses
usually tend to offset the beneficial effects of new technology or other measures taken.
Currently, the car market is undergoing the most important change since the mass production
of internal combustion engines, because with the advent of the electric motor, most car
companies are trying to gain interest and conquer the market with exorbitant amounts invested
in research and development. Critics of energy efficiency programs in public policy debates
cite the rebound effect as the reason why hybrid cars and plug-in electric vehicles, for example,
do not really save energy in the long run. If a technology is cheaper, people may use it more.
Else, they can use the savings to buy other things that require energy. This theory also applies
to the car industry. The paper presents an analysis and forecast of electric vehicle sales and
the impact that the development of this market will have on energy consumption.
Keywords: automotive, rebound effect, energy consumption
1. INTRODUCTION
In 1908, in America, a new era began - that of the industrial revolution, a certain steam engine.
It is about the moment when Henry Ford leaves the first model of series car, respectively, Model
T, a car powered by an engine powered by ethanol. Since then, today, the automotive industry
has crossed borders to be a luxury good, and has become a commodity, which is present in any
family. But as the industry grew, so did the concerns about pollution, so mankind began to
question the use of fossil fuels. Therefore, electric cars appear on the market, one of the
revolutionary elements of Industry 4.0, and along with them, a lot of scientific studies, which
have introduced among them, statistical demonstrations regarding the fact that this type of car
is much more beneficial than the conventional. There are also studies in the literature, which
use the name of rebound effect in their content. In economics, the rebound effect (or withdrawal
effect) is the reduction of expected gains from new technologies that increase resource
efficiency, due to behavioral or systemic responses. These responses usually tend to offset the
beneficial effects of new technology or other measures taken.

63rd International Scientific Conference on Economic and Social Development – "Building Resilient Society" - Zagreb, 11-12 December, 2020
180
2. CHANGES IN THE CAR MARKET
Currently, the car market is undergoing the most important change since the mass production
of internal combustion engines, because with the advent of the electric motor, most car
companies are trying to gain interest and conquer the market with exorbitant amounts invested
in research and development. The new rules imposed by the European Union play an important
role in changes in the transport sector, aimed at reducing carbon dioxide emissions. Subsidies
have been granted and bills on CO2 emissions have been implemented, and it is expected that
by 2040, more than half of active cars will use electricity to the detriment of fossil fuels. If we
refer to the social benefits brought by the technological evolution of the automotive industry,
we can certainly say that the population will learn how to invest in sustainable means and
equipment, which use renewable energy and contain reusable materials. Moreover, the
emergence of new trends in the car market, bring with them new business models and new ways
of adapting to the business environment. An electric vehicle charging equipment business can
be created. In the near future, the installation of electric car charging equipment will become
one of the successful businesses. Electrification of transportation and charging technologies for
electric cars are expected to come to life and become one of the most successful businesses. It
all depends on the timing and coverage of the market offer. Competitive advantage is very
important in a healthy economic market, and innovation offers the opportunity to gain the
attention and sympathy of consumers. The electric car market brings with it new business
opportunities, and the most convenient is represented by the infrastructure, i.e. recharging
stations and authorized workshops for hybrid and electric motors. Existing strategies present
initiatives to develop charging services for drivers who own fully electric cars or hybrid cars
with the possibility of charging, allowing drivers to find available charging stations according
to geographical location. Through location systems interconnected with applications, social
networks and search engines, drivers will be able to book a charging station, charge as soon as
possible and pay by all existing methods. There is also the idea of sharing your own stations
with strangers who are in the area where other stations are not already installed, if they are
registered on an international website. The article "Electric cars: EU trade surplus of EUR 3
billion" presents aspects of the electric car market such as sales of car companies in the EU, but
also imports from other parts of the world, amounts invested in developing and increasing the
value of specialized businesses. In 2018, the European Union (EU) exported electric cars and
hybrid electric cars worth EUR 4.7 billion, which included both petrol and diesel engines. All-
electric and hybrid electric cars from imports were worth EUR 1.6 billion, with a trade surplus
of EUR 3.0 billion.
Figure following on the next page

63rd International Scientific Conference on Economic and Social Development – "Building Resilient Society" - Zagreb, 11-12 December, 2020
181
Figure 1: Representation of countries' share in import and export
(Source: Eurostat)
According to Eurostat (2019) EU exports in 2018 went to the following destinations: Norway
(39%), United States (23%) and China (10%). According to Eurostat (2019) EU exports in 2018
went to the following destinations: Norway (39%), United States (23%) and China (10%).
Among EU Member States, the leader in exports of electric and hybrid cars to non-EU countries
in 2018 was Germany (64%), followed by Sweden (13%) and the United Kingdom (10%). The
three countries were also among the Member States with the largest imports of electric and
hybrid cars from outside the EU: Germany (26%), Belgium and Sweden (both with 16%) and
the United Kingdom (15%). Overall, trade in electric and hybrid cars was dominated by hybrid
petrol cars, with 67% of EU imports and 60% of EU exports, while fully electric cars accounted
for 32% of imports and 39% of exports. The EV volumes has published the article “Global sales
BEV & PHEV for 2019”, which includes worldwide sales of types of electric vehicles. Global
sales of plug-in vehicles in 2019 reached 2,264,400 units, 9% higher than in 2018. This is a
clear deviation from the growth rates of the last 6 years, which were between 46% and 69%.
The reasons are the developments in the two largest markets, China and the US, where sales
stagnated in the second half of 2019 and remained significantly below the sales boom in 2018.
And in the US, sales of plug-in models fell in compared to the boom of 2018. In China, the
further reduction in subsidies, associated with stricter technical regulations, has caused a
collapse in the demand and supply of classic cars, starting July. Europe has become the
lighthouse of EV sales in 2019, with an increase of 44%, accelerating towards the end of the
year. The WLTP introduction, along with changes in vehicle taxation has created greater
awareness and demand for EVs. The industry aimed to reach the target of 95 gCO2 / km for
2020/2021. More than 30 new and improved BEV / PHEV models were introduced in 2019,
most in the latter part of the year, which will push EV sales this year and next. According to the
mentioned article, the global share of BEV & PHEV for 2019 was 2.5%, and the smaller car
markets continue to lead to the adoption of EV. The leader of the actions is Norway, as usual,
where 56% of new car sales were plug-ins in 2019. Iceland ranked 2nd with 24.5% and the
Netherlands ranked 3rd with 15%. Among the larger economies, China leads with a share of
5.2%, the United Kingdom registered 3.2%, Germany 2.9%, France 2.8%, and Canada 2.7%.
All other car markets with over 1 million total sales were 2% or less for 2019. At the end of
2019, the global fleet of plug-ins was 7.5 million, counting light vehicles. Medium and heavy
commercial vehicles add another 700,000 units to the global stock of plug-ins. Their global
deliveries were 100,000 units in 2019, of which 95% in China and mostly large buses.
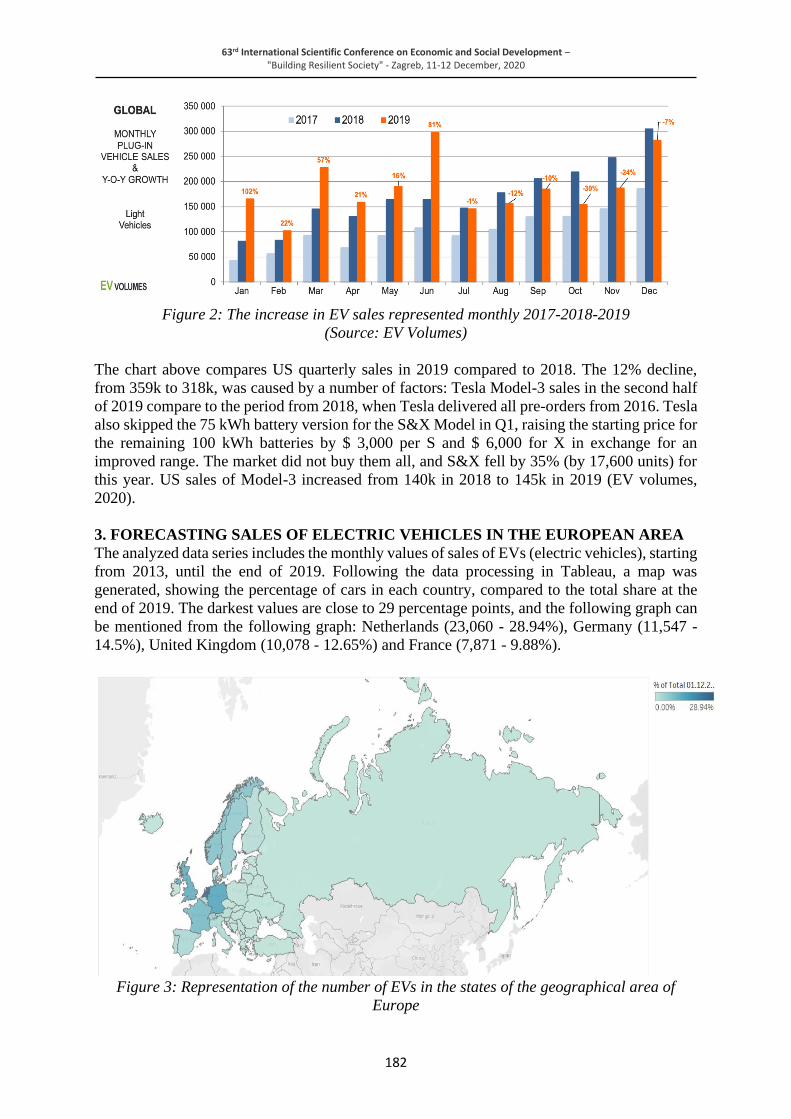
63rd International Scientific Conference on Economic and Social Development – "Building Resilient Society" - Zagreb, 11-12 December, 2020
182
Figure 2: The increase in EV sales represented monthly 2017-2018-2019
(Source: EV Volumes)
The chart above compares US quarterly sales in 2019 compared to 2018. The 12% decline,
from 359k to 318k, was caused by a number of factors: Tesla Model-3 sales in the second half
of 2019 compare to the period from 2018, when Tesla delivered all pre-orders from 2016. Tesla
also skipped the 75 kWh battery version for the S&X Model in Q1, raising the starting price for
the remaining 100 kWh batteries by $ 3,000 per S and $ 6,000 for X in exchange for an
improved range. The market did not buy them all, and S&X fell by 35% (by 17,600 units) for
this year. US sales of Model-3 increased from 140k in 2018 to 145k in 2019 (EV volumes,
2020).
3. FORECASTING SALES OF ELECTRIC VEHICLES IN THE EUROPEAN AREA
The analyzed data series includes the monthly values of sales of EVs (electric vehicles), starting
from 2013, until the end of 2019. Following the data processing in Tableau, a map was
generated, showing the percentage of cars in each country, compared to the total share at the
end of 2019. The darkest values are close to 29 percentage points, and the following graph can
be mentioned from the following graph: Netherlands (23,060 - 28.94%), Germany (11,547 -
14.5%), United Kingdom (10,078 - 12.65%) and France (7,871 - 9.88%).
Figure 3: Representation of the number of EVs in the states of the geographical area of
Europe

63rd International Scientific Conference on Economic and Social Development – "Building Resilient Society" - Zagreb, 11-12 December, 2020
183
Figure 4: Increase in AE sales from 2013 to 2019
The data series was introduced into the Crystal Ball program to forecast sales for the next 24
months. The values obtained are presented in table 1.
Table 1: The forecast output obtained in Oracle Crystal Ball (1)
After processing the data, the system chose between several different forecasting methods, and
finally the Holt-Winters' Multiplicative method was used. Currently, the total value of sales in
the geographical area and in the analyzed time period is 1,896,468 vehicles. Following the
forecast, the number will increase to approximately 1,988,356 vehicles in 2 years. In other
words, the increase will be about 4.8 percentage points.
0
5,000
10,000
15,000
20,000
25,000
Increase in AE sales from 2013 to 2019
01.12.2013 01.12.2019
Date Lower: 2,5% Forecast Upper: 97,5%
01.01.2020 48.529 56.878 65.227
01.02.2020 49.743 59.170 68.598
01.03.2020 71.763 82.109 92.455
01.04.2020 50.858 61.125 71.391
01.05.2020 53.162 63.481 73.799
01.06.2020 76.930 87.949 98.967
01.07.2020 54.525 65.371 76.217
01.08.2020 56.717 67.791 78.865
01.09.2020 82.272 93.788 105.304
01.10.2020 57.546 69.618 81.689
01.11.2020 60.118 72.101 84.085
01.12.2020 86.946 99.628 112.309
01.01.2021 60.089 73.864 87.639
01.02.2021 61.629 76.412 91.194
01.03.2021 89.896 105.467 121.038
01.04.2021 63.292 78.110 92.929
01.05.2021 65.887 80.722 95.556
01.06.2021 95.614 111.307 126.999
01.07.2021 65.853 82.357 98.861
01.08.2021 67.850 85.032 102.215
01.09.2021 98.772 117.146 135.520
01.10.2021 68.223 86.603 104.984
01.11.2021 71.626 89.342 107.059
01.12.2021 104.437 122.986 141.534

63rd International Scientific Conference on Economic and Social Development – "Building Resilient Society" - Zagreb, 11-12 December, 2020
184
Table 2: The forecast output obtained in Oracle Crystal Ball (2)
We keep in mind that there are seasonal influences, so expectations are that most sales will be
made in September and December.
Figure 5: Evolution of sales in 2021 - Oracle Crystal Ball forecast
4. CONCLUSIONS
Drivers make their own decisions about how much to drive each year. Therefore, the rebound
effect largely depends on the type of driver. People who buy hybrid vehicles are generally
looking to either save costs or show determination to do good for the environment. Intuitively,
people who care about the environment will be less likely to drive more even if they have more
fuel-efficient cars. However, people who are motivated by cost savings will drive more. Due to
the diversity of consumers, it is difficult to speculate on the rebound effect of electric cars. We
are concerned about both the magnitude of the rebound effect and its change over time. The
mix of buyers of different electric cars could change gradually, given that electric vehicles are
relatively new compared to conventional cars. When electric cars first appeared, those who
adopted early were those who cared about the environment or those who were enthusiastic about
new technologies. Instead, those who were economically sensitive could have been more
cautious about this new type of car. One reason is that hybrid vehicles were much more
expensive than other comparable conventional cars. The second reason is its ability to reduce
energy costs, which has not been fully proven. The development of electric vehicles could have
changed the component of different types of buyers and could have led to a change in the
rebound effect. Critics of energy efficiency programs in public policy debates cite the rebound
effect as a reason why hybrid cars and plug-in electric vehicles, for example, do not really save
energy in the long run. If a technology is cheaper, people may use it more. If not, I can use the
savings to buy other things that require energy. This theory also applies to the car industry.
Method Rank RMSE
Holt-Winters' Multiplicative Best 4.260
Damped Trend Seasonal Multiplicative 2nd 4.262
Seasonal Multiplicative 3rd 4.439
Method Theil's U Durbin-Watson
Holt-Winters' Multiplicative 0,6359 1,82
Damped Trend Seasonal Multiplicative 0,6360 1,82
Seasonal Multiplicative 0,6339 1,96

63rd International Scientific Conference on Economic and Social Development – "Building Resilient Society" - Zagreb, 11-12 December, 2020
185
The rebound effect occurs in four ways - one direct, one indirect and two through
macroeconomic changes. The direct way is when consumers use their car more after purchasing
one that is more energy efficient. The indirect way is if consumers, given that they have more
money at hand due to energy savings, use that money to purchase other energy-consuming
products. A macroeconomic rebound effect can occur when a country reduces the consumption
of a resource, oil, causing its price to fall. This, in turn, causes people in other countries to use
it more. According to EiA Annua Energy Outlook, this conversion is beneficial both financially
and as a way to slow down the damage caused to the planet, even if it can cause a revival of
consumption by as much as 50%.
• In 2025, it would reduce energy consumption by almost 7% in the absence of behavioral
changes.
• A pessimistic estimate of the rebound effects is generated by the increase in driving time
and the time to purchase additional goods that limit energy reductions to about 5%.
LITERATURE:
1. Barker, T., Dagoumas, A., & Rubin, J. (2009). The macroeconomic rebound effect and the
world economy, Energy Efficiency.
2. Electric Car Home (2020). BEV, PHEV, HEV, ICE. Available at
https://electriccarhome.co.uk/electric-cars/bev-phev-hev-ice/
3. Enerdata. (2020). Global Energy Statistical Yearbook 2019.
4. EiA Annual ENERGY OUTLOOK Eurostat. (2019). Electric cars: EU trade surplus of €
3 billion. Available at https://ec.europa.eu/eurostat/web/products-eurostat-news/-/DDN-
20190510-1
5. EV volumes. (2020). Global BEV & PHEV Sales for 2019.
6. Gillingham, K. (2013). The rebound effect is overplayed, Nature.
7. Greensoft. (2019, iulie). INDUSTRIA 4.0, Nu este o revoluție, este o evoluție! Available at
https://www.greensoft.ro/industria-4-0
8. Herring, H., & Roy, R. (2007). Technological innovation, energy efficient design and the
rebound effect, Technovation.
9. Iceberg. (2018). Industria 4.0. Available at ICEBERG.RO:
https://www.iceberg.ro/industria-4-0/
10. International Federation of Robotics. (2018). International Federation of Robotics.
Available at International Federation of Robotics: https://ifr.org/img/uploads/2018-FEB-
07-IFR-Press_Release_Robot_density_EN.pdf
11. Ministerul mediului, apelor si padurilor. (2020). ACORDUL DE LA PARIS. Available at
http://www.mmediu.ro/categorie/acordul-de-la-paris/178
12. Nordhaus, W. D., Bresnahan, T. F., & Gordon, R. J. (1996). The Economics of New Goods.
University of Chicago Press.
13. Owen, D. (2010). The Efficiency Dilemma – If our machines use less energy, will we just
use them more. The New York.
14. Virta. (2020). 15 EV charging industry trends. Available at https://www.virta.global/
15. WLTP Facts. (2020). What is WLTP and how does it work? Available at WLTP
Facts.EU.US. Department of Energy, Alternative Fuels data center
16. https://cleantechnica.com/2012/03/28/prius-rebound-effect-wrong/06 04 2020
63rd International Scientific Conference on Economic and Social Development – "Building Resilient Society" - Zagreb, 11-12 December, 2020
186
ECONOMIC EVALUATION OF OLD BARRACKS BROWNFIELD
REVITALIZATION TO SUPPORT SOCIALLY DISADVANTAGED
PEOPLE
Jakub Sabo
Brno University of Technology, Faculty of Civil Engineering,
Brno, 602 00, Czech Republic
[email protected]; [email protected]
Vit Hromadka
Brno University of Technology, Faculty of Civil Engineering
Brno, 602 00, Czech Republic
ABSTRACT
The paper is focused on the issue of the economic evaluation of brownfield revitalization, which
served as a former Russian army barracks, but today is primarily intended for rental housing
for the socially disadvantaged. It is complex of buildings situated in city Nové Mesto and Váhom
in western Slovakia, which was built in 1968. In 2016 the revitalisation of buildings was started.
Buildings is owned by city, and they can provide value of costs. Against this value of costs, the
value of profit benefit and socio-economic benefits associated with revitalization can be
compared. After comparing the value of all these benefits with the value of costs, we can
determine whether this project was profitable and whether it could serve as a template for other
similar revitalizations of similar buildings, because they are almost in every city.
Revitalizations like this could bring socio-economic benefits to society for housing of the
socially disadvantaged and if the city will not be interested, also private company could invest
and revitalise for the financial profit.
Keywords: Economic evaluation, brownfield, revitalization, CBA analysis
1. INTRODUCTION
The revitalization of brownfields is very important today and more and more towns and villages
are beginning to address this topic. In most European cities, you can find similar brownfields
in several places. They often carry an environmental or economic burden and it is to the benefit
of society to revitalize these facilities and areas. However, this issue is often very complex and,
as a result, sometimes rejected in advance. Nevertheless, the brownfield topic has been a very
popular for several decades, and more and more investors are interested in rebuilding and
revitalizing these buildings due to its popularity. At the same time, there is a trend towards
revitalization of brownfields for public purposes. In order to evaluate whether a public project
will be economically efficient, the method of CBA analysis is often used, which compares the
costs of revitalization and the benefits of revitalization associated with it. These benefits do not
have to be just financial gains and revenues. The case study of this paper is revitalized building
- old abandoned barracks. This type of brownfield is very widespread in Slovakia and the Czech
Republic. Revitalization can effectively restore their function. As this is a public project, it is
not expected to make profit, or at least that is not the main purpose of the project. The benefits
of a public project can also be benefits for society and the population, benefits for nature and
the ecosystem and many other benefits. We can assign all these changes to socio-economic
value using certain methodologies and consider them as a benefit in the CBA analysis. Since
we usually do this analysis ahead of time and before the revitalization itself, in order to
determine whether it can be effective, it is necessary to use discounting over time to all
investment costs, variable costs and also all benefits, both financial and socio-economic.

63rd International Scientific Conference on Economic and Social Development – "Building Resilient Society" - Zagreb, 11-12 December, 2020
187
2. PRESENT STATE REFERENCES
Today, Brownfields are often a problem for the development of municipalities due to their
negatives such as complex property relations, mostly devastated buildings and last but not least,
as already mentioned, often the environmental burden caused by toxic substances used during
their original operation that could also contaminate groundwater and surface water and
surroundings. They are often used as illegal landfills, and on many of them were stored
hazardous waste that has often remained there to this day. Due to these circumstances, the
surroundings of brownfields are often harmful to health, and because of that, this problem seems
even worse. It is therefore in the interest of the general public that brownfields should be
revitalized and thus stop threatening society or if they begin to be some sort of benefit for
society [1] [2] [5] [9]. Revitalization of the old barracks into residential objects seems to be an
ideal case of brownfield revitalization for society, but it is questionable whether it is also
economically efficient. There is a lot of papers and literature on the topic of brownfield and its
revitalization, as the topic is quite popular nowadays. The basic theoretical information in this
paper is based on the book by Božena Kadeřábková and Marian Piecha "Brownfields - how
they arise and what about them." In this book it is possible to find theoretical information about
the origin and dividing of brownfield types, as well as the possibilities of dealing with them.
Further information can be found in the book "Contemporary Forms of Use of Industrial
Historical Buildings" by Martina Peřinková [5] [9]. Directly on this topic is an paper entitled
"Military brownfields in the Czech Republic and the potential of their revitalization focused on
their residential function" by Jan Hercik, Petr Šimáček, Zdeněk Szczyrba and Irena Smolová
from Masaryk University in Brno and Palacký University in Olomouc [4].
3. METHODOLOGY
The article will look to a case study of the already performed revitalization of the brownfield
of the old barracks in city Novo Mesto nad Váhom in Slovakia. The former Russian barracks
have been converted into residential buildings and the city offers them as rental apartments. As
this is a public project, I will use the Cost-Benefit analysis method, where I will compare the
revitalization investment costs, which I gathered from the investor, which was the city itself,
and the benefits of revitalization, financial, as rent for rented residential space but also non-
financial benefits, called socio-economic benefits which have socio-economic value. These
benefits will be quantified mainly using the eCBA tool, the calculation of which was most
created by it’s authors by combining some empirical results and factors. As this will be a time-
spread analysis, discounting will be used to take into account the time value of money. The
value of costs provided by the investor, the city of Nové Mesto nad Váhom, will be used and
the benefits that were identified during the revitalization of this type of building for the purpose
of residential use will be quantified. It is almost certain that the revitalization has also brought
benefits that will not be quantified, because either not all information is known or the these
benefits are minor. We will therefore consider the following key benefits:
• ICPS - Improving the condition of public spaces
• ICPPG - Improving the condition of parks and public greenery
• PTS - Parking time savings
• TTSPV - Traffic time savings of personal vehicles
• VCSPV - Variable costs savings of personal vehicles
• EDIR - Employment development in the region
• RRS - Rental of residential space
For better understanding of the article, there will be briefly explained some theoretical concepts
such as brownfield, Cost-Benefit Analysis (CBA), discounting and Net Present Value (NPV).

63rd International Scientific Conference on Economic and Social Development – "Building Resilient Society" - Zagreb, 11-12 December, 2020
188
3.1. Brownfield
The issue of brownfields and their revitalization has been an important topic in the world since
about the 1960s. This topic is closely related to changes in the socio-economic structure of
individual regions, strategic, territorial and landscape planning. Brownfields are a major
problem and obstacle to the sustainable development of municipalities, cities and regions.
Addressing these issues is often a priority of many public authorities' policies and strategies at
national, regional and local levels. In our territory, the issue of brownfields is very much related
to the Ministry of the Environment. It often relates to issues of environmental protection,
prevention and elimination of environmental burdens, water purity, protection of the rock
environment and soil. The Ministry of the Environment is, of course, interested in revitalizing
disturbed areas, either to strengthen ecological functions in segments of the disturbed landscape
or to improve the environment in municipalities and cities [1] [2] [5]. Brownfields are most
often old abandoned factories and quarry or mining areas. But we also know other types of
brownfields, such as old abandoned barracks or power plants or even abandoned residential
buildings. However, brownfields are most often divided as follows [5]:
• unused industrial zones in the urbanised territory
• unused administrative objects in inner zones of cities
• unused objects of railways
• unused objects of armed forces
• unused agricultural objects
• remains of finished mining activity
We can also divide brownfields according to the possibility of the economy to solve these
projects with the help of private investors or the state as a market regulator. So they can be also
divided as follows [5]:
• project with zero balance
• projects with moderate support
• non-commercial projects
• dangerous projects
• other projects
3.2. Cost-Benefit analysis (CBA)
The Cost-Benefit analysis, or CBA method, is an analytical tool used to assess the economic
advantages or disadvantages of investment decisions in order to assess their contribution to
changing welfare levels and also whether they contribute to EU policy objectives. The aim of
the Cost-Benefit analysis is not to find possible alternatives, but to allow a more efficient
allocation of resources while demonstrating the benefits of the intervention to society [8]. This
method tracks costs and benefits throughout the project whole lifecycle. The final goal of the
CBA method is to allow the evaluation of non-profit investments using standard evaluation
methods, due to the fact that this is the method that is most often used in the evaluation of
construction investments [7]. The most often used analytical framework of CBA refers to a list
of underlying concepts which is as follows (only briefly for simplicity) [8]:
• Opportunity cost
• Long‑term perspective
• Calculation of economic performance indicators expressed in monetary terms
• Microeconomic approach
• Incremental approach.

63rd International Scientific Conference on Economic and Social Development – "Building Resilient Society" - Zagreb, 11-12 December, 2020
189
3.3. Discounting
Benefits and costs of the project take place in individual years of the evaluated period.
Economic efficiency indicators are based on the time value of money, which is represented in
the calculations by the discount rate. To evaluate the project, it is appropriate to distinguish
between the social discount rate and the financial discount rate. The financial discount rate is
usually equal to the cost of the opportunity to raise capital. If we use a certain amount of funds
for the implementation of a certain project, it is not possible to use this amount for the
implementation of another project. This second, unrealized project will then show the
opportunity cost, ie the loss of income. In the case of a private project, the amount of the
discount rate is determined by the business entity itself, in the case of public projects, a discount
rate of 5% is most often used, and this value will also be calculated in the CBA analysis of this
particular economic evaluation [6] [8].
3.4. Net Present Value
The Net Present Value represents the increase in the company's resources caused by investing.
The Net Present Value of the investment is based on the basic assumption that the funds are
effectively invested only if the return on investment is equal to or higher than the initial
investment cost [6]. NPV allows the evaluation of the economic efficiency of projects over a
longer period of time. In consideration of that the value of cash changes over time, it is
necessary to establish a mechanism that can convert all projected future returns to their present
value. These time shifts are made possible by a mechanism that is based on a mathematical
method of discounting and is called Present Value (PV) in economic calculations [6].
4. RESULTS
The case study “Brownfield Barracks Nové Mesto nad Váhom” is based on the project of the
revitalization of the old abandoned barracks. The barracks were built in 1968 and the beginning
of the revitalization was in 2016. The total investment costs for the revitalization of this building
are more than € 2,230,000. These barracks were revitalized and converted into residential
housing units. Since the building is owned by the city, the housing units in it serve as city rental
apartments and are provided mainly to socially disadvantaged families. The building has a total
area of the sum of all housing units of almost 2500 m2. There are 1-room, 2-room and 3-room
apartments, of which there are a total of 49. Suppose that there are from 1 to 2 adults (+ possible
children) in one apartment, we can average it to 1.5 adults per apartment. Therefore, the number
of adults in the building is approximately 74.
Object Project Morgage Grant Own Resources Total investment
costs
I. BD 30 000 € 1 321 887 € 881 250 € 7 € 2 233 144 €
Table 1: Divided investment costs by resources
(Source: City of Nové Mesto nad Váhom [10])
For economic evaluation using CBA analysis, the total costs and total benefits of the project
have to be quantified and then discounted to create a Net Present Value. These benefits are
described in the “Methodology” chapter.
4.1. Improving the condition of public spaces (ICPS)
The revitalization of the old barracks also changed the condition of the public spaces, as the old
abandoned building became a newly reconstructed building with inhabited apartments,
surrounding infrastructure and people in the streets. We can assign socio-economic value to this
benefit using the eCBA tool [3].

63rd International Scientific Conference on Economic and Social Development – "Building Resilient Society" - Zagreb, 11-12 December, 2020
190
As the benefit is calculated on the number of people passing by, it has been estimated that about
1,000 people pass by the building every day, as the city has about 20,000 inhabitants and as the
building is located close to the city's main road. Thus, the number of people affected per year
is 365,000. As can be seen in Table 2, the resulting socio-economic value of the benefit is
therefore € 10,842 per year.
Number of people
affected per year Unit price of impact Total benefit value per year
365 000 0,000 297 04 € 10 842 €
Table 2: Improving the condition of public spaces benefit value
(Source: Own calculation, eCBA [3])
4.2. Improving the condition of parks and public greenery (ICPPG)
Like the previous benefit, the surrounding public greenery, parks and park benches were
restored during the revitalization, which also has its quantifiable socio-economic value. This
value was again determined using the eCBA tool. [3] As the greenery and parks around the
building again affect the surrounding people, the number was again set at 1000 people per day
for the same reasons as the previous benefit, so the annual number of people affected is 365,000.
This benefit will have a socio-economic value of € 21,684 per year.
Number of people
affected per year Unit price of impact Total benefit value per year
365 000 0,000 594 08 € 21 684 €
Table 3: Improving the condition of parks and public greenery benefit value
(Source: Own calculation, eCBA [3])
4.3. Parking time savings (PTS)
Because the parking spaces assigned to the apartments were also built during the revitalization,
it is possible to assume, that the inhabitants of the apartments will no longer have to look for a
parking space, thus they will save time. As mentioned above, we can assume that either an
individual or a couple (or a family) lives in each apartment, and thus at least one car will belong
to each apartment. Based on this, the number of cars will be 49. We will assume 3 minutes time
savings per day, as the parking lot is located right next to the building and therefore saves
walking time, especially during working days, so we will count 5 days a week. That is 720
minutes per car per year (3 minutes * 5 days * 4 weeks * 12 months). The unit price of the
impact will come from the eCBA. [3] This benefit therefore amounts to a socio-economic value
of € 6968 per year.
Number of minutes saved
per year per car Number of cars Unit price of impact Total benefit value per year
720 49 0,197 5 € 6 968 €
Table 4: Parking time savings benefit value
(Source: Own calculation, eCBA [3])
4.4. Traffic time savings of personal vehicles (TTSPV)
We can assume that people will want to live in that building also because of a more
advantageous position, because the building is located on the main road and in the city center.
It is probable that people from the surrounding villages also moved into the house. Furthermore,
we can assume that at least about half of the cars in the house, which is 25 cars, will save 10
minutes a day.

63rd International Scientific Conference on Economic and Social Development – "Building Resilient Society" - Zagreb, 11-12 December, 2020
191
If we use the same formula as in the previous benefit, it is 2400 minutes per car per year (10
minutes * 5 days * 4 weeks * 12 months). The unit price of impact will again come from the
eCBA. [3] With this calculation we get the socio-economic value of the benefit of € 11,850 per
year.
Number of minutes saved
per year per car Number of cars Unit price of impact Total benefit value per year
2 400 25 0,197 5 € 11 850 €
Table 5: Traffic time savings of personal vehicles benefit value
(Source: Own calculation, eCBA [3])
4.5. Variable costs savings of personal vehicles (VCSPV)
Due to identical reasons as the benefit above, we can assume that the inhabitants of the
apartment building also have their points of interest closer not only in time, but in distance
manner. Since the building is located in the city center, we can assume that half the population
will save 10 kilometers per day. Again, this is 2400 kilometers per car per year (10 kilometers
* 5 days * 4 weeks * 12 months). For the unit price of impact, the eCBA tool was again used.
[3] So the socio-economic value will be € 14,220 per year.
Number of kilometers
saved per year per car Number of cars Unit price of impact Total benefit value per year
2 400 25 0,237 € 14 220 €
Table 6: Variable costs savings of personal vehicles benefit value
(Source: Own calculation, eCBA [3])
4.6. Employment development in the region (EDIR)
As there is big demand for employees in the region, we can assume that people, who lived far
away and moved into the apartment building, found a job. Assume that half of the population
had already a job, and since there are approximately 74 adults in the building, 37 will get a job
and partially fill the demand for employees. Every single job position creates a certain socio-
economic value benefit and the eCBA tool has been used for this again [3]. The annual socio-
economic value of the benefit is therefore € 432,122.
Number of newly
employed people Unit price of impact Total benefit value per year
37 11 435,724 423 122 €
Table 7: Employment development in the region benefit value
(Source: Own calculation, eCBA [3])
4.7. Rental of residential space (RRS)
Data of the amount of rents were obtained from the city and thus the total annual rent for the
whole building was calculated. As the rent is paid directly to the city, this benefit is not socio-
economic, but financial. The rent varies for each housing unit according to its size, so for
simplicity, only the value of the total rental income for the whole building is needed. This value
is approximately € 5400 per month, which is € 64,800 per year.
4.8. Discussion
Since we have all the benefits listed, we can calculate them and therefore the total undiscounted
benefits are € 553,480 per year. The total undiscounted investment costs are € 2,233,144. We
also have to take into account variable costs, but since we do not know their exact value, it will

63rd International Scientific Conference on Economic and Social Development – "Building Resilient Society" - Zagreb, 11-12 December, 2020
192
be calculated as 2% of the investment costs per year. We will discount the benefits and costs
over time and use them in the CBA analysis. After recalculation, we can see how the net cash
flow and accumulated net cash flow will develop. As the table with CBA analysis with all
discounted costs and all discounted benefits is too large, only the results will be summarized
here. As with most public projects, the discount factor was set at 5%. Inflation will also be
included, at 3% per year. The annual rate of the beginning of the CBA analysis begins in the
year of the beginning of the revitalization and thus in 2016. Since the revitalization lasted 2
years, housing units will not be inhabited until 2018.
5. CONCLUSION
Due to the large value of the benefits, the accumulated cash flow will get out of red numbers in
2022, and thus the discounted pay off period is 6 years. This form of revitalization can therefore
generally be considered very cost-effective. As old abandoned barracks are very widespread in
our area, it is appropriate to consider these revitalizations. It is questionable whether the
revitalization would be sufficiently effective if the project were of the private type and not as a
public project. For a private investor, financial benefits are more important than socio-economic
benefits and the results may therefore be diametrically opposed. However, it is clear that if the
revitalization is financed by the city or the state, or by the European Union and is therefore
intended for the public, projects of a similar type have a good chance to turn out similarly well
in the CBA analysis.
ACKNOWLEDGEMENT: This paper has been worked out under the project of the specific
research at Brno University of Technology no. FAST-J-20-6428 Procedure of economic
evaluation of brownfields revitalization.
LITERATURE:
1. Atkinson G., Doick K.J., Burningham K. & France C. Brownfield regeneration to
greenspace: Delivery of project objectives for social and environmental gain. Urban
Forestry & Urban Greening. 2014, 13(3), 586-594
2. Brownfields regeneration. PLANETA. 2007, XV(3), 21.
3. ECBA - evaluation of investment projects [online]. Brno, 2020 [cit. 2020-10-01]. Available
from: www.ecba.cz
4. Hercik, Jan, Petr Šimáček, Zdeněk Szczyrba a Irena Smolová. Military brownfields in the
Czech Republic and the potential for their revitalisation, focused on their residential
function. Quaestiones geographicae. 2014, 2014(2), 12.
5. Kadeřábková B. & Piecha M. Brownfields, how do they arise and what to do with them. 1st
edition. Prague: C. H. BECK, 2009, ISBN 978-80-7400-123-9
6. Korytárová, Jana. Investment Economics. Study script. Brno : BUT,. FCE,2006.
7. Korytárová, Jana a Vít Hromádka. Public Construction Investment I. Study script. Brno:
BUT,.FCE, 2007.
8. Laissy, Ana-Paula. Guide to Cost-Benefit Analysis of Investment Projects. 1160 Brussels
Belgium: European Union, 2015. ISBN 978-92-79-34796-2.
9. Peřinková, Martina. Current forms of use of industrial historical objects. Ostrava ; Prague:
Gasset; Techné Ostrava, 2012. ISBN 978-80-87079-25-6.
10. Serdahelyová, Mária. Conversion of the barracks complex into a city district with housing.
Dobre Mesto [online]. 2020 [cit. 2020-10-01]. Available from:
https://dobremesto.gov.sk/obnova-uzemi/skusenosti-miest/nove-mesto-nad-vahom-areal-
kasarni/

63rd International Scientific Conference on Economic and Social Development – "Building Resilient Society" - Zagreb, 11-12 December, 2020
193
TRENDS IN THE LOGISTICS MARKET AND WAREHOUSES FOR
LOGISTICS SERVICE PROVIDERS - EXPERIENCES FROM POLAND
Joanna Miklinska
Gdynia Maritime University, Poland
ABSTRACT
The Polish logistics market is part of the European logistics services market, ranking seventh
in terms of share in the accumulated European logistics expenditures. Among the largest
Logistics Service Providers (LSPs) in Poland, the majority are global entities. Also through
their presence, processes and trends with an international outreach have made their way into
the Polish market. Rapidly changing needs, and attempts to satisfy them, in a very competitive
market make it easier to observe emerging logistics trends, such as: development of e-
commerce and omnichannel logistics, sustainable logistics, automation and robotization, etc.
This also prompts LSPs to have varied requirements for warehouse space. The main goal of the
paper is twofold: 1) present the specificity of the Polish logistics market, 2) indicate the effects
of selected trends in logistics on warehouses used by LSPs in the Polish market. Despite
referring to a broader background, the article focuses on selected trends and issues that relate
to the development of: e-commerce, sustainable (green) logistics, and combined transport
services and their links with different areas of warehouse requirements. To this end, analysis
of the following was carried out: reference literature; statistical data published by the Polish
Central Statistical Office; reports published by: Fraunhofer Institute, DHL, GS1 Poland,
Gemius, the Office of Rail Transport (rail market regulator in Poland), consulting companies,
as well as data derived from LSPs operating in the Polish logistics market and from developers
active on Poland’s warehouse commercial market.
Keywords: Logistics trends, Logistics Service Providers, Warehouse facilities, E-commerce,
Sustainable logistics
1. INTRODUCTION
The Polish logistics market is well embedded into the EU logistics market. Poland's accession
to the European Union in 2004 and the transfer of logistics operations to Poland from Western
Europe following the 2008-2009 financial crisis provided strong impetus for its growth
(Zysińska, 2019, p. 143). Lower need-fulfillment costs, improved linear infrastructure of
various modes of transport - over 19,398 km of railways (CSO, 2020a, p. 317) and a total of
4,146.5 km of expressways and motorways (GDDKiA, 2020) and central location on the map
of Europe were all factors that significantly helped propel Poland’s logistics sector and
warehousing market forward. The total area of warehouses in Poland has increased over the
years to over 95 million m2 (estimates based on: Fechner, 2016, p.113), of which approx. 20
million m2 is commercial space (that is, warehouses for lease) (AxiImmo, 2020). This segment
of the warehouse space market is growing particularly fast, most notably in: Warsaw, Central
Poland, Upper Silesia, Wrocław and Poznań (Cushman & Wakefield, 2020a), while the
developers with the largest share of the market are: Panattoni, Prologis, Segro, Logiscor
(Miklińska, 2017b). In search of flexibility, so indispensable in a market marked by constant
changes, LSPs are particularly attracted to the idea of warehouses for lease. The advantages of
this solution include: a relatively quick process of getting space, convenient location, ever-
higher standards of newly built warehouses, the possibility of changing the place of service
provision along with the changing needs and specificity of logistics operations. Because of all
that, LSPs now account for approx. 30-40% of the demand for commercial warehouse space
(Miklińska, 2017b).

63rd International Scientific Conference on Economic and Social Development – "Building Resilient Society" - Zagreb, 11-12 December, 2020
194
It is worth noting that, despite the increased availability of warehouse space over time, this
percentage share has remained stable since the late 1990s (which is when the logistics market
in Poland properly took off). Industry-specific fluctuations and diversified needs of LSP clients
overlap with the changes having place within logistics processes themselves. In response to
this, new locations, dimensions, technical standards or warehouse equipment are being
developed. The ongoing quest for maximum efficiency among LSPs can also force new trends
in the area of ownership of warehouse facilities. Own warehouses are nowadays being sold and
abandoned for modern leased facilities situated in more convenient locations. The main goal of
this paper is twofold: 1) present the specificity of the Polish logistics market, 2) indicate the
effects of selected trends in logistics on warehouses used by LSPs in the Polish market.
2. TRENDS IN THE LOGISTICS MARKET
In the context of location, international importance and active players, the Polish logistics
market is very much susceptible to global trends. Such trends are ongoingly updated and
discussed in the literature and reports of various organizations (e.g. Infosys, Penn State, Penske,
C. John Langley Jr, 2020, p. 4-7). A number of scientific and advisory institutions debate over
perceptible trends. Particularly noteworthy are findings from two such think tanks. The first is
the report by researchers from the Fraunhofer Center for Applied Research on Supply Chain
Services SCS, which identifies ten logistics trends, including external trends (which affect the
demand for logistics services) and internal trends (which can be influenced by logistics actors)
(Schwemmer, 2019) (Table 1).
Table 1: Logistics trends External trends
1. Globalization Volatility in goods flows
2. Demographic change. Aging societies, immigration and urbanization
3. New lifestyles. High demand for convenience in business and consumer markets
4. Servitization
5. Sustainability
6. Rising risks and threats. Political and economic instability, climate change, natural
catastrophes, terrorism and cybercrimes
Internal trends
7. Innovative technologies and digital transformation
8. New challengers. Innovative approaches from outside
9. Professionalization and effective logistics. Efficiency of logistic operations
10. Shareholder value objectives in logistics. Effectiveness of logistics operations
Source: M. Schwemmer (2019), p. 8.
The second example is the report prepared biannually by DHL, whose latest version – already
accounting for the toll of the global pandemic - was published in September 2020. Similarly to
previous editions, the report splits trends into two groups: Social Trends and Business Trends
on one hand (e.g. Mass Personalization, Multi-sourcing, Omnichannel Logistics, Sharing
Economy, Sustainable Logistics), and Technology Trends on the other hand (e.g. 3D Printing,
Artificial Intelligence, Big Data Analytics, Blockchain, the Internet of Things, Robotics &
Automation, Self-Driving Vehicles, Unmanned Aerial Vehicles) (Toy et al, DHL Trend
Research, 2020). In Polish publications, the following are indicated as particularly relevant for
Poland’s logistics market: growth of e-commerce, development of linear and point transport
infrastructure, further growth of consumption and process automation (Zysińska, 2019, p. 143).
In studies that already take into account the pandemic, the following tendencies have been
identified as important for the near future and strongly determining LSPs’ strategy: shortening
of supply chains, diversification of supply sources, transfer of sales to the online channel, as

63rd International Scientific Conference on Economic and Social Development – "Building Resilient Society" - Zagreb, 11-12 December, 2020
195
well as automation and robotization. It should be noted that, owing to changes in the supply
chains, shifts in the directions of the flow of cargo are also expected (Brdulak, 2020a, p. E16).
Each of these trends is conditioned by a number of factors differing in strength, direction, and
potential effects. For example, it can be indicated that, in connection with the development of
e-commerce, particular challenges will concern not only the increase in the number of parcels
or new methods of their delivery, but also support in the functioning of online stores. Therefore,
various forms of new services such as out-of-home delivery (ODH) and one-stop e-commerce
(including, e.g. additional warehouse services) are projected to gain traction (GS1Polska, 2019,
pp. 14-17). Due to the above, as well as taking into account the specificity of the Polish logistics
market, the article focuses on three selected trends: e-commerce, sustainable (green) logistics,
and the development of services in combined transport in connection with various aspects of
the use of warehouses by LSPs.
3. THE SPECIFICITY OF THE POLISH LOGISTICS MARKET ON THE
BACKGROUND OF EUROPEAN CIRCUMSTANCES
To better illustrate the size and specificity of the Polish logistics market, it will be set against
the European and local markets. Compared to Europe, Poland was in 2018 the seventh largest
such market in Europe in terms of accumulated European logistics expenditures, with a share
of 4% (Schwemmer, p. 10). The European logistics industry’s worth is estimated at EUR 1,120
billion, of which 50% goes to LSPs while the remaining part goes to proprietary logistics
operations of manufacturing and trading companies (Schwemmer, p. 7). In 2018, the value of
the entire logistics sector in Poland was estimated at approx. PLN 81.5 billion (EUR 18.5
billion). The largest in terms of revenues are those segments that relate to road transport - a total
of approx. PLN 54 billion, or EUR 12 billion. A large share is also held by CEPs (Courirer,
Express and Parcel Services) - PLN 6.8 billion, or EUR 1.5 billion, and by contract logistics -
PLN 6.2 billion, or EUR 1.4 billion (Zysińska, p. 153). For years, the share of transport and
logistics activities in the structure of Polish GDP has gradually increased. The "Transport and
Warehouse Management" industry accounted for 6.3% in 2018 and for 6.6% in 2019 of
Poland’s GDP (CSO, 2019, 2020b). Based on the surveys published in Poland annually over
the period of 25 years (Brdulak, 2017-2020a) and covering about 60 significant companies
(excluding the main CEP operators), it can be observed that the dynamics of revenue growth
for this group in 2019 greatly exceeded the growth rate of Polish GDP, standing at 11.8%
(Brdulak, 2020b, p. E 16). Referring to (GS1 Polska, 2019, p. 2-4), it should also be noted that
CEP is the fastest growing segment of the Polish logistics market, whose growth rate is almost
three times higher than that of Poland's GDP. This industry is driven mostly by seven operators:
three global service providers (DHL, UPS and FedEx (TNT)), two subsidiaries of European
postal services: DPD (French mail) and GLS (British mail); one foreign-invested domestic
service provider - InPost (Advent International), and one national postal operator: Poczta Polska
(GS1 Polska, 2019, p. 7). Others key LSP players in the Polish market (after Brdulak 2017-
2020a) offer for the most part a broad portfolio of services. Aggregated data on operators and
their activities does not suffice for a detailed analysis of how trends affect individual changes
in LSP services. Table 2 shows data collected between 2016 and 2019 (Brdulak 2017-2020a).
On this basis, it can be observed that a large percentage (from 74% to 82%) of the key LSPs in
the Polish market offer warehousing services. An increasing number of operators also provide
e-commerce logistics services, and notable progress can also be seen in the number of LSPs
providing services in the B2C model (more on this in Chapter 4). As a result of increased
consumer expectations and the sustainable development policy pursued at EU level,
sustainable-logistics solutions are becoming an important trend also in the logistics market. It
is for that reason that service providers in Poland have been engaged in the preparation and
publication of CSR reports for several years now.

63rd International Scientific Conference on Economic and Social Development – "Building Resilient Society" - Zagreb, 11-12 December, 2020
196
Unfortunately, the number of LSPs doing that decreased in 2019 (Brdulak, 2020b). It seems
nonetheless that reporting on sustainable solutions does not necessarily signal reduced interest
among operators to incorporate such changes into their logistics services. Notably, the number
of operators providing services for combined transport is on the rise, which is just one example
of the application of this concept in practice. Further deliberations in this paper were devoted
to the correlation of these issues with the warehousing problems faced by logistics operators.
Table 2: Selected data on the operators active in the Polish TSL market in 2016-2019 2016 2017 2018 2019
% of LSPs providing
warehousing services 74% 82% 80% 74%
% of LSPs providing e-
commerce logistics
services
33% 39% 40% 45%
data unavailable B2B 35% B2B 35% B2B 36%
data unavailable B2C 15% B2C 7% B2C 21%
% of LSPs providing
services in combined
transport
44% 49% 48% 52%
% of LSPs preparing
CSR reports data unavailable 28% 37% 34%
% of LSPs publishing
CSR reports data unavailable 20% 27% 19%
Source: own elaboration based on: Brdulak, 2017-2020a.
4. DEVELOPMENT OF E-COMMERCE AND LOGISTICS FACILITIES IN LSPS
E-commerce in Poland has seen a rapid growth in the past several years. In 2018, the share of
e-commerce in total retail was 6%. About 476 million parcels were delivered to customers,
containing mainly: consumer electronics (sales value PLN 8.6 billion), construction products,
furniture and interior furnishings (PLN 6.1 billion), clothing, footwear, and accessories (PLN
5.7 billion) (GS1, 2020, p. 14; M. Gawryluk after GS1, 2019, p. 4). Although the market share
of e-commerce in Poland is still lower than in other European countries, a significant increase
is expected due to the growing interest in this form of shopping. In 2019, out of 38 million
Polish residents, over 28 million used the Internet and 73% of those made purchases online.
72% of all online shoppers placed orders in Polish online stores, 30% - in foreign stores
(Gemius, IGE, 2020). Another catalyst for this trend was the Covid-19 pandemic. Social
distancing and closed shopping malls quickly changed the shopping habits of many consumers
and gave further impetus to online commerce. The largest clothing and footwear retailers have
reported online sales increases of several hundred percent. With this staggering dynamics, more
and more logistics companies are jumping on the e-commerce bandwagon. These services
provided by specialized providers are collectively referred to as "fulfillment". The scope of
fulfillment usually includes goods receipt, storage, completion, packaging and shipment to
recipients (GS1, 2020, p. 4-5). Let us note that fulfillment is just one of the methods of
organizing logistics in e-commerce, with others being own logistics of an online seller and drop-
shipping (shipment of goods to the customer directly from the manufacturer, distributor).
Recently, fulfillment services have been gaining traction and there are now various specialized
fulfillment service providers, more than 60 in Poland alone (GS1, 2020, p. 4). There are
currently four basic fulfillment service models in use (Table 3). It should be noted that one of
these models is LSP fulfillment, including CEP and other LSP companies, totaling a dozen or
so logistics service providers (GS1 Polska, 2020).

63rd International Scientific Conference on Economic and Social Development – "Building Resilient Society" - Zagreb, 11-12 December, 2020
197
Table 3: Fulfillment models in Poland Fulfillment model Examples of service providers in Poland
Fulfilment offered as a core service Omnipack, Ingram Micro CFS Fulfilment, eCommerce
Connections
Fulfilment offered by an LSP Fiege, Rhenus Logistics, Raben, DHL Supply Chain,
Rohling Suus, No Limit, Schenker and CEP operators:
UPS, InPost
Fulfilment offered by sales platforms Amazon
Fulfilment offered as an additional
service
Point of View, Traffica, Arvato, Azymut
Source: own elaboration based on: (GS1, 2020, p. 16-19)
E-commerce undoubtedly drives the accelerated development of the Polish logistics market,
especially in the segment represented by CEP companies. Recently, other LSPs have emerged
providing such logistics services. In 2016, 33% of LSPs provided such services, and in 2019 -
already 45% (Brdulak, 2017-2020a). However, logistics operators need appropriate logistics
facilities for that. To have the full picture of the kind of challenges faced by LSPs in relation to
fulfillment services, we may need to review the e-business models. Subjectively, logistics
services for e-commerce are mainly provided by CEP operators. In recent years, the share of
parcels in the B2C model in Polish e-commerce has clearly increased while the share of B2B
has decreased. In 2018, B2B accounted for 50% and B2C for 43% (including 35% B2C (e-
commerce) and only 8% B2C excluding e-commerce) of the CEP market in value terms. Last
but not least, the C2X model accounts for 7% of the market (M. Gawryluk after GS1 Polska,
2019, p. 5). Other types of LSPs also provide e-commerce logistics services. Based on the
ranking (Brdulak, 2017-2020a), it should be noted that since 2017 the share of operators
providing services within the B2B model has remained relatively stable (approx. 35%). It is a
model that requires less adjustment by the LSP and is less cumbersome to implement. Changes
can be seen in the LSP's handling of the B2C model. In 2017, services in this area were provided
by 15% of operators, and in 2019 - by 21% of operators (Brdulak, 2017-2020a). To efficiently
implement logistics services for e-commerce, LSPs use various types of warehouse facilities.
These are mainly: sorting centers and courier hubs, online-order processing centers, warehouses
of food products sold online, returns handling centers, and various types of City Logistics
facilities (Prologis, JLL, 2015, p. 6). The type of facility used by an LSP is influenced among
other factors by: the scope of fulfillment services provides, the type of clientele (from which
industries), and the size (scale) of operations. The indicated facilities can be used as either
standalone or combined solutions, also functioning in the spoke-hub paradigm in the case of a
large scale of operations. CEP operators provide services mainly in reloading and storage
facilities, having at their disposal branches and sorting hubs/centers. Table 4 shows basic data
on the facilities used by CEP operators in the Polish market.
Table following on the next page

63rd International Scientific Conference on Economic and Social Development – "Building Resilient Society" - Zagreb, 11-12 December, 2020
198
Table 4: CEP logistics facilities in Poland (2019) Firma Sorting hubs/centers Branches Pick-up and drop-off
points
DHL Parcel 6 national sorting centers 41 7000
DPD 3 central sorting hubs, 4
sorting centers
50 national branches and
30 city branches
2500
FedEx 4 sorting hubs 43 600
GLS 1 central sorting hub 38 1600
InPost 1 central sorting hub, 3
sorting centers
52 6000 parcel machines,
1500 customer-service
points offering pick-up
and drop-off of parcels
Poczta Polska 14 forwarding-distribution
nodes
7500 branches 12000
UPS 3 sorting hubs 33 1200
Source: GS1, 2019, p. 12.
It should be noted that servicing of e-commerce often requires flexibility (Infosys, Penn State,
Penske, C. John Langley Jr, 2020, p. 38) in the use of warehouses, even greater than in the case
of brick-and-mortar purchases. Space lease, despite owning certain facilities, may provide the
expected flexibility in increasing or reducing the space at LSPs’ disposal (Prologis, JLL, 2015).
When discussing warehousing in the context of e-commerce, attention should be paid to the
size of warehouse space, location aspects and the equipment enabling the proper
implementation of services. It is estimated that implementation of e-commerce services requires
three times more warehouse space than in traditional trade. The reason for this is the large
assortment structure of goods and their varying dimensions. This, in turn, only strengthens the
need to maintain greater inventory and to handle returns (Prologis, 2014, p. 4). Goods returned
to warehouses are normally tampered with and must be restored to a salable condition. Such
processes also often require separate rooms. More space is also required due to the number of
employees who complete shipments in the B2C model. In addition to all this, health-and-safety
and social measures must be observed at all times (Prologis, 2014, p. 6; Prologis, JLL 2015).
Other requirements of e-commerce warehousing include the need for a larger number of
transshipment docks (especially in cross-dock facilities), which is associated with faster goods
rotation in the warehouse. Here, the dock index is assumed at 1 dock per 500 m2. Furthermore,
e-commerce warehouses require more efficient HVAC power systems and mezzanines that can
be used as additional storage or picking areas (Prologis, JLL 2015, p. 7). Location-wise, when
the scale of operations in e-commerce is significant, more dedicated warehouse facilities must
be introduced to support e-commerce. For the implementation of dispersed orders, it is
important to use warehouses located closer to final customers, and therefore closer to cities and
to urban centers (Prologis, 2014, p. 6). Warehouses of this type are referred to as City Logistics
or last-mile fulfillment centers, and according to international data, they accounted for 73% of
the industrial real estate market in 2017 (Infosys, Penn State, Penske, C. John Langley Jr, 2020,
p. 38). The demand for this type of warehouse lease has been growing in the Polish market for
several years. In various cities, several City Logistics facilities have been delivered by
Panattoni, among others, and it was mainly LSP companies who leased that space (Panattoni,
2020a).
5. LSPS AND GREEN SOLUTIONS FOR WAREHOUSES
Until just a few years ago, the "greening" of warehouses was considered a secondary problem
in the development of the warehouse market. Fast forward to today, it has attained the status of
one of this market’s crucial pivots. Research shows that 82% of all lessees of warehouse space
in the commercial space market are currently interested in pro-environmental solutions and

63rd International Scientific Conference on Economic and Social Development – "Building Resilient Society" - Zagreb, 11-12 December, 2020
199
inquire about such initiatives when looking for space to let. Additionally, it should be noted
that 37% of these potential tenants interested in green solutions are LSPs (Cushman &
Wakefield, 2020b, p. 7). A number of green solutions adopted by LSPs is influenced by new
legislation, the growing environmental awareness and the desire to cap costs (Infosys, Penn
State, Penske, C. John Langley Jr, 2020, p. 26). The aim is therefore to use more energy-
efficient devices, increase the use of renewable energy sources, and implement solutions that
will reduce carbon dioxide emissions to the atmosphere. The "green" initiatives currently used
by warehouses in the Polish market include: LED lighting, photovoltaic panels mounted on
rooftops or in the form of farms located next to warehouse buildings, heat pumps, insulation of
roofs and walls, air destratificators, rainwater and gray-water recovery systems, or the use of
CO2 for cooling. Lessees are particularly interested in photovoltaic solutions and heat recovery
(Cushman & Wakefield, 2020b, p. 3). Some developers have also normalized the following
solutions: charging stations for electric cars, planting trees and shrubs, or homes for insects or
birds. If requested by the client, apiaries with bees or green chill zones for employees can be
offered (Panattoni, 2020b). Ecological certification systems serve to attest the pro-
environmental solutions used in the warehouse facilities. Several certification systems are used
in Poland, most notably: BREEAM (British), LEED (American), DGNB (German) and the
recently introduced in Poland WELL (PLGBC, 2020, p. 6.). The first certified warehouse in
Poland was put into use in 2012 (PLGBC, 2020, p. 13); in 2016, there were 25 warehouses with
ecological certificates (18 - BREEAM and 7 - LEED) (Colliers International, 2016). The recent
popularization of this concept has been so staggering that only between March 2019 and March
2020 as many as 55 such certified facilities were added to the Polish market, bringing the total
to 141 (108 - BREEAM, 21 – LEED, and 12 - DGNB). Let us note that, apart from newly built
warehouses with the highest ecological standards, certificates are also granted to modernized
facilities that have been present in the market for several years (BREEAM In-use) (PLGBC,
2020, p. 13). One developer brand with extensive experience in building sustainable warehouse
spaces is Panattoni. In Europe alone, Panattoni has already delivered 2 million m2 of certified
warehouses to the market – over 20 buildings in Poland and another 30 currently pending the
certification process (Panattoni, 2020b). Warehouses with eco certificates are also delivered to
the Polish market by (Segro 2017) and P3 (PropertyNews.pl, 2020a). There is a wealth of
examples of existing "green" warehouses for LSPs, among them DB Schenker facilities (DB
Schenker, 2014) or those built for the logistics service provider No Limit by the developer 7R
in Gliwice. This last facility is intended to be fully powered by renewable energy sources, and
thanks to other pro-ecological solutions applied, it will hold BREEAM certification
(PropertNews.pl, 2020b).
6. LSPS AND WAREHOUSES FOR COMBINED TRANSPORT SERVICES
Along with the rise of combined (intermodal) rail-road transport in Poland, the role of LSPs
and their services became more important. LSPs are now a crucial group of entities that in many
cases constitute an intermediate link in the relationship between the client and the intermodal
operator. The number of operators offering combined transport services has been systematically
growing in the Polish logistics market as well. In 2016, they accounted for 44% of the key
companies, and already 52% in 2019 (Brdulak, 2020b). The development of services in
combined transport corresponds to the aforementioned implementation of environmental
protection goals, being one of the solutions for introducing the principles of sustainable
development to logistics services. Combined transport in Poland is aptly described as rail
container transport (Miklińska, 2017a). The development of the intermodal transport market in
Poland is evidenced by the increase in the transported cargo weight (from 4,403 thousand tons
in 2010 to 19,509 thousand tons in 2019), the number of intermodal units (from 569 640 TEU
in 2010 to 2 137 122 in 2019), and the increasing number of railway carriers (from 6 in 2010

63rd International Scientific Conference on Economic and Social Development – "Building Resilient Society" - Zagreb, 11-12 December, 2020
200
to 20 in 2019). Combined transport in Poland revolves around 39 intermodal terminals (ORT,
2020), which are used to handle domestic and international transport. What further encourages
LSPs to opt for intermodal transport loads is the paving of the New Silk Road and the fact that
Poland is envisaged to be part of this route. As part of their combined transport services,
logistics operators carry out operations on full container loads or consolidate collective
containers, which requires access to storage facilities. In this context, attention should be paid
to the correlation existing between the location of warehouse space and the location of
intermodal terminals in Poland. Unfortunately, due to the uneven distribution of terminals
across the country, many warehouses are located far away from the terminals, thus making the
provision of logistics services in combined technology either difficult or financially inviable.
Relevant research findings were shared by the Office of Rail Transport (ORT, 2020). The
reason for this is that, while the warehouse space market was growing in Poland, that growth
was not accompanied by coordinated planning so as to link the location of warehouses with the
proximity of rail transport infrastructure, as was the case for example in Germany and its 1990s
Masterplans. This is why only few warehouses in Poland have nowadays direct access to
railroad tracks or intermodal terminals, a shortcoming that is becoming increasingly
troublesome for businesses. Customers are more and more inclined to ask about the possibility
of combined-transport services, making it all the more important to logistics operators. Let us
note that even intermediaries in the commercial warehousing market have introduced, as part
of their IT platforms (warehouse space search engines), a feature calculating the distance
between the warehouse and the nearest intermodal terminal (see e.g. Cushman & Wakefield,
2020c). Finally, it should be stressed that, in several locations across Poland, clusters of
warehouses - also operated by LSPs – do indeed have access to intermodal terminals. Examples
include the Clip Group warehouses near Poznań (Clip Group, 2020), and warehouses near
Mszczonów or Gdynia.
7. CONCLUSION
Each of the discussed trends influencing the services provided in the Polish logistics market
forces certain changes in terms of how warehouse facilities are used. These changes include:
transformations in the location of warehouses, dispersion of the facility base, approximation to
the final recipients of shipments, or last but not least, having warehouses located near
intermodal terminals. Requirements for the location of facilities are also related to changes in
the legal basis for managing a warehouse base, where ownership no longer implies a
competitive advantage. Changes in the expectations of service users, in particular
environmental protection requirements, are having an impact on the building and/or
modernization of facilities, where those which follow CSR protocols are preferred. The
challenges of modern logistics - trends in the logistics market – put a lot of pressure on logistics
operators, whose warehouse properties are now expected to become "flexibly" responsive to
changes in the environment.
LITERATURE:
1. AxiImmo. (2020). Polski rynek magazynowy w III kwartale 2020, Retrieved 02.11.2020
from https://www.axiimmo.com/raporty-i-publikacje/raport-polski-rynek-magazynowy-3-
kwartal-2020-r.
2. Brdulak H., (2017). Ranking firm TSL 2016, Dziennik Gazeta Prawna, nr 118, 21.06.2017,
Retrieved 01.11.2020 from https://p.infor.pl/promocja-infor/adnet/tsl.pdf.
3. Brdulak H., (2018). Ranking firm TSL 2017, Dziennik Gazeta Prawna, nr 118, 20.06.2018
Retrieved 01.11.2020 from http://g0.gazetaprawna.pl/p/_wspolne/pliki/3367000/3367586-
tsl-dodatek-2018.pdf.

63rd International Scientific Conference on Economic and Social Development – "Building Resilient Society" - Zagreb, 11-12 December, 2020
201
4. Brdulak H., (2019). Ranking firm TSL 2018, Dziennik Gazeta Prawna, nr 115, 14-
16.06.2019, Retrieved 01.11.2020 from https://g.gazetaprawna.pl/p/_wspolne/pliki/
4244000/4244602-24-edycja-rankingu-firm-tsl-wydanie-115-5017-14-czerwca-2019.pdf.
5. Brdulak H., (2020a). Ranking firm TSL 2019, Dziennik Gazeta Prawna, nr 117,
18.06.2020, Retrieved 01.11.2020 from https://g.gazetaprawna.pl/p/_wspolne/pliki/
4552000/4552528-ranking-firm-tsl-wydanie-117-5270-18-czerwca-2020.pdf.
6. Brdulak H., (2020b). Sytaucja gospodarcza w okresie pandemii. Zmiany architektury
łańcucha dostaw, Dziennik Gazeta Prawna, nr 117, 18. 06.2020 Retrieved 02.11.2020 from
https://g.gazetaprawna.pl/p/_wspolne/pliki/4552000/4552528-ranking-firm-tsl-wydanie-
117-5270-18-czerwca-2020.pdf.
7. Clip Group. (2020), Retrieved 01.11.2020 from http://clip-group.com/.
8. Colliers International. (2016). Zielone budynki w Polsce, Warszawa, Retrieved 01.11.2020
from http://www.colliers.com/pl-pl/poland/research/premium-reports/zielone-budynki-
2016.
9. CSO. (2020a). Central Statistical Office, Concise Statistical Yearbook of Poland, Warsaw,
July, pp. 1-546.
10. CSO. (2020b). (Central Statistical Office), Główny Urząd Statystyczny, Polska w liczbach,
Warszawa, Retrieved 03.11.2020 from https://stat.gov.pl.,
11. CSO. (2019). (Central Statistical Office), Główny Urząd Statystyczny, Polska w liczbach,
Warszawa, Retrieved 03.11.2020 from https://stat.gov.pl.
12. Cushman & Wakefield. (2020a). Marketbeat. Rynek magazynowy. Podsumowanie 2019,
Retrieved 01.11.2020 from https://www.logistyka.net.pl/bank-wiedzy/item/90884-raport-
cushman-wakefield-marketbeat-polska-podsumowanie-2019-roku.
13. Cushman & Wakefield. (2020b). Industrial Goes Green. Zielone rozwiązania najczęściej
stosowane w Polsce, Retrieved 02.11.2020 from https://www.logistyka.net.pl/bank-
wiedzy/item/91364-raport-cushman-wakefield-industrial-goes-green.
14. Cushman & Wakefield. (2020c). See the Poland’s warehouse and logistics properties map,
Retrieved 01.11.2020 from https://industrial.pl/en.
15. DB Schenker. (2014). Coroporate Responsibility Report, Retrieved 02.11.2020 from
http://2014.dbschenker-csr.pl/en/environment/terminals-and-warehouses.
16. Fechner I. (2016). Rynek powierzchni magazynowych [In:] I. Fechner, G. Szyszka(ed.),
Logistyka w Polsce. Raport 2015, Instytut Logistyki i Magazynowania, Poznań.
17. GDDKiA. (2020). General Directorate for National Roads and Motorways, Motorways,
Retrieved 01.11.2020 from https://www.gddkia.gov.pl/pl/926/autostrady.
18. Gemius, IGE. (2020). Gemius, Izba Gospodarki Elektronicznej, E-commerce w Polsce
2020. Gemius dla e-Commerce Polska, Retrieved 01.11.2020 from https://eizba.pl/wp-
content/uploads/2020/06/Raport-e-commerce-2020.pdf.
19. GS1 Polska (2019). Rynek KEP w Polsce. W obliczu trendów i nowych wyzwań, Retrieved
03.11.2020 from https://www.gs1pl.org/strona-szukaj?searchword=rynek%20kep%20%
20w%20polsce&searchphrase=all.
20. GS1 Polska. (2020). Fulfillment w e-commerce. Wykorzystanie standardów GS1 w
obszarze działalności operatorów fulfillment, Report prepared by: Sieć Badawcza
Łukasiewicz – Instytut Logistyki i Magazynowania, A. Kawa; Retrived 02.11.2020 from
https://www.gs1pl.org/fulfilment-w-e-commerce-wykorzystanie-standardow-gs1-w-
obszarze-dzialalnosci-operatorow-fulfilment.
21. Infosys, Penn State, Penske, C. John Langley Jr. (2020). Third – Party Logistics Study. The
State of Logistics Outsourcing. Results and Findings of the 24th Annual Study, Retrieved
01.11.2020 from https://www.3plstudy.com/ic3pl/ic3pl.ic3pl.home.

63rd International Scientific Conference on Economic and Social Development – "Building Resilient Society" - Zagreb, 11-12 December, 2020
202
22. Miklińska J. (2017a). Development of the Intermodal Market in Poland from the
Perspective of Cargo Handling Operations in International Supply Chains – Selected
Issues. BUSINESS LOGISTICS in Modern Management Proceedings of the 17th
International Scientific Conference, 2017, Osijek, pp. 233-249.
23. Miklińska J. (2017b). Development of the Market for Modern, Commercial Warehouse
Spaces as the Logistics Infrastructure Facilities of the Region – Experiences from Poland
In 6th International Scientific Symposium ECONOMY of EASTERN CROATIA – VISION
and GROWTH, Anka Mašek Tonković (ed.), Sveučilište Josipa Jurja Strossmayera u
Osijeku, Ekonomski fakultet u Osijeku Osijek, pp. 880-889.
24. ORT. (2020). Office of Rail Transport. UTK, Sprawozdanie z funkcjonowania rynku
transport kolejowego, Warszawa, Retrieved 01.11.2020 from https://www.utk.gov.pl/pl/
raporty-i-analizy/analizy-i-monitoring/sprawozdania/16190,Sprawozdanie-z-funkcjonowa
nia-rynku-transportu-kolejowego-w-2019-r.html.
25. Panattoni. (2020a), City Logistics, Retrieved 02.11.2020 from
http://www.panattonieurope.com/pl/kraj/polska/portfolio-projektow/city-logistics/
26. Panattoni (2020b), Sustainable. See our earthwise solutions!.
27. PLGBC. (2020). Polskie Stowarzyszenie Budownictwa Ekologicznego, Certyfikacja
zielonych budynków w liczbach, Gliwice. Retrieved 02.11.2020 from
https://plgbc.org.pl/wp-content/uploads/2020/04/Certyfikacja-zielonych-budynkow-
2020.pdf
28. Prologis. (2014). E-Commerce and a New Demand Model for Logistics Real Estate, July,
Retrieved 02.11.2020 from https://www.prologis.com/about/logistics-industry-research/e-
commerce-and-new-demand-model-logistics-real-estate.
29. Prologis, JLL. (2015). Logistyka e-commerce w Polsce. Przetarte szlaki dla rozwoju
sektora, Retrieved 04.11.2020 from https://magazyny.pl/media/plugins/report_file/
Logistyka_e-commerce_w_Polsce_-_Przetarte_szlaki_dla_rozwoju_sektora.pdf.
30. PropertyNews.pl. (2020a). Sortownia dla InPost w P3 Mszczonów z certyfikatem
BREEAM Retrieved 01.11.2020 from
https://www.propertynews.pl/forum/artykuly,86111,10.html
31. PropertNews.pl. (2020b). 7R buduje „zielony” magazyn dla No Limit, Retrieved
01.11.2020 from https://www.propertynews.pl/magazyny/7r-buduje-zielony-magazyn-dla-
no-limit,82673.html.
32. Schwemmer M. (2019). Top 100 in European Transport and Logistics Services 2019/2020.
Executive Summary, A. Pflaum (ed.), Fraunhofer Center for Applied Research on Supply
Chain Services SCS, October, Retrieved 03.11.2020 from https://www.scs.fraunhofer.de/
content/dam/scs/DE/publikationen/studien/maerkte-standorte-
logistik/TOP100_2019_ExecutiveSummary_english.pdf.
33. Segro. (2017). Magazyn Segro najbardziej ekologiczny w Polsce według certyfikacji
BREEAM, Retrieved 01.11.2020 from https://www.segro.com/media/press-releases/
2017/18-05-2017-po?sc_lang=en?lang=en.
34. Toy J., Gesing B., Ward J., Noronha J., Bodenbenner P, DHL Trend Research, (2020). The
Logistics Trend Radar 5th Edition, Retrieved 02.11.2020 from https://www.dhl.com/global-
en/home/insights-and-innovation/insights/logistics-trend-radar.html.
35. Zysińska M. (2019). Ocena przedsiębiorstw TSL działających w Polsce – dylematy
metodyczne badań, Studia i Prace Kolegium Zarzadzania i Finansów, 173, pp. 141-162.

63rd International Scientific Conference on Economic and Social Development – "Building Resilient Society" - Zagreb, 11-12 December, 2020
203
THE REVENUE RECOVERY OF THE MUSIC INDUSTRY AS A
RESULT OF REVENUE GROWTH FROM STREAMING
Josko Lozic
University North, Croatia
ABSTRACT
The global music industry is going through a period of transformation. The turn of the century
marked the beginning of a decline in the music industry’s revenue. Digitization and
convergence of production and distribution systems have enabled illegal loading and sharing
of music content between users. Global music corporations have been forced to completely
change the way they do business and generate revenue. The aim of this paper is to point out the
changes in the management practice of global music corporations as well as the change in the
structure of revenues. The research and analysis are aimed at comparing the change in the
revenue structure of global music corporations in relation to the structure of total revenues.
The survey includes the three largest music corporations that generate the bulk of the revenue
of the overall music industry. In the last five years, the revenues of the music industry have been
growing exponentially, which indicates the recovery of the music industry on completely new
development models.
Keywords: music corporations, music industry, revenue, streaming
1. INTRODUCTION
The beginning of the 20th century marked a turning point in the development of global music
industry. After 1999, revenues began to fall and this decline stopped only with the development
of the streaming industry. The revenue recovery of the music industry is often associated with
the term digitization, although this is not a precise definition. Digitized forms of music content,
ie revenues generated by music corporations from this form of revenue, appeared for the first
time in 2004. The highest revenue from the sale of digital content was realized in 2012. Revenue
from the sale of digital content amounted to $ 4.4 billion, which was 29.5% of total revenue
(Lozić 2019). At the same time, digital technology enabled various forms of piracy, which
directly affected the continuous decline in total revenues until 2015. The first streaming revenue
was generated in 2006. The sharp rise in streaming revenue began in 2013, marking the end of
digital content revenue growth. Revenues from streaming grew from year to year, while
revenues from the sale of digital content continued to fall. In 2019, streaming revenue accounted
for 55.9% of the global music industry’s total revenue. At the turn of the century, there was no
revenue structure for the music industry because all revenue came from the sale of physical.
The new era and postmodern society have brought significant changes in all social spheres,
including the music industry. The biggest contribution to such a change in habits was made by
Generation Z (Seemiller, Grace 2019), but the change in habits very quickly affected most users
of the music industry services. The music industry emerged as part of the old media industry
and used management tools and practices used by all the old industries. The decline in music
industry revenues has caused the classic contractions known in all the old industries. Music
corporations, faced with declining revenues and profits, sought to maintain market share and
profits lost by declining total revenues in the industry through acquisitions. On the one hand,
revenues were threatened by digital technology and piracy, and on the other hand, shopping and
ownership habits began to change abruptly. Through the M&A process, global music
corporations dominated the market, but more importantly, they adapted to postmodern society
and new habits of consuming music.

63rd International Scientific Conference on Economic and Social Development – "Building Resilient Society" - Zagreb, 11-12 December, 2020
204
2. LITERARY REVIEW
The new century has brought very dramatic changes to the old media industry. Her fate was
followed by the music industry, as a segment of the old media industry. Hesmondhalgh and
Meier (2018) point out that the beginning of the 21st century marked a turning point in the use
of electronic platforms for listening to music. The desktop computer has been somewhat
neglected, and mobile digital playback devices such as the Apple iPod are coming into the
spotlight, and this way of consuming music is beginning to prevail. Ryan (2019) notes that the
new century has been marked by the development of technology. With the start of the 21st
century, the digital transformations that have affected the music industry have been very
dramatic, and completely new and technologically diverse competitors such as Napster, iTune,
Pandora, Spotify and YouTube have emerged. In the music industry, the transition from the
"old music industry" to the "new music industry" took place in several developmental stages.
Changes in the way music content is consumed in the twentieth century have been shaped by a
series of related interactions between social change and the strategy of capitalist organizations,
especially those in the computing and electronics sectors (Hesmondhalgh, Meier 2018). The
end of the twentieth century was marked by the digitization and distribution of music content
in a new form. The transformation took place in several different but related phases:
gramophone records were replaced by CDs; CD audio carriers were slowly replaced by MP3
digital tracks, after which streaming platforms took over the dominance in the distribution and
consumption of music content (Simon 2019; Fuentes et al. 2019). Each of these phases meant
the reorganization of the socio-economic infrastructure in the music industry, the construction
of new models of production and consumption of music content, and changes in the use of
music technology (Fuentes et al. 2019). Changes in social and music infrastructure referred to
a change in technology that began with the invention of the radio, followed by gramophone
records, cassettes, CDs, desktops, and finally streaming services (Simon 2019). With the
development of smartphones, MP3 audio players, PDAs, laptops and other technologically
advanced devices, users have easy access to music and other media content. What marked the
fundamental change was the ability for users to access music while on the go. Such a change in
habits, based on the development of music infrastructure, marked a complete change in listening
habits (Denegri-Knott 2015). The digitized form of the music content provided some
advantages over the classic analog recording in terms of its quality and the length of the
recording that could be stored on some analog audio carrier. However, what was once a
sociological / cultural aspect of listening to music has been challenged by accessing large
databases of music content on demand (Arditi 2017). Werner (2020), in his research, seeks to
prove the connection between gender and the type of music recommended as a “list” by users
of the platform. The development of music technology has directly affected the increase of
mobility and availability of music content and has gradually increased user control over music
content. A large number of changes that have occurred in the music industry have preceded
changes in other industries (Irene 2014; Dholakia et al. 2015). Listening to music, turned from
an activity in which the user listened to music himself, into a daily activity that accompanied
all the daily events (Hagberg, Kjellberg 2017). Digitized music and streaming service allow
you to listen to music during all activities, especially free activities outside the home (Kerrigan
et al. 2014). Choosing and listening to music (“soundtracking”) was made possible in everyday
activities such as traveling to work, work, socializing and driving vehicles (Fuentes et al. 2019).
Consumption of music becomes a personalized activity, and the construction of individual
musical tastes is separated from the connection with class affiliation (Wright 2015). The
development of music streaming services marked the final end of the old music industry.
Streaming services Spotify, Deezer and Apple Music have influenced the complete
transformation of listening and enabled listening to music on the go (Sinclair, Tinson 2017).

63rd International Scientific Conference on Economic and Social Development – "Building Resilient Society" - Zagreb, 11-12 December, 2020
205
The technological solution of real-time streaming was used in the processing of a large number
of data, and found its first application in online bookmakers, data on stock exchanges,
processing of sports results, weather forecasts and the like (Maheshwari 2019). Streaming
services have changed the way we consume music or music content. Access to the content that
is broadcast is not permanent and ends when the subscription to the music service expires
(Hiller, Walter 2017).
3. METHODOLOGIES AND HYPOTHESIS
The survey will be conducted based on publicly released data on the financial performance of
music corporations: Sony Music, Warner Music Group and Universal Music Group. Financial
results are taken from publicly available Form-10K forms. The financial results downloaded
for Sony Music were converted from Yen to $ at an approximate exchange rate in 2019. The
results are indicative to analyse the revenue structure for labour purposes. The global financial
results of the music industry are taken from the specialized agency IFPI, which monitors the
trends of the global music industry. The results were published in the document Global Music
Report: The Industry in 2019. For the purposes of the analysis, only individual items of the
corporate income statement will be processed. Trend and revenue structure analysis will be
analysed by regression models to compare results based on the same methodology. The research
is aimed at proving or dismissing two basic hypotheses:
• H1 – revenues of the three largest music corporations are continuously growing due to the
growth of revenues from the sale of copyrights, ie revenues from streaming.
• H2 – global music industry revenues are growing due to the exponential growth of
streaming revenues.
Research and proof of hypotheses continues on earlier research. Kask and Oberg (2019) explore
music market trends and business strategies of three global music corporations. Guichardaz
et.al. (2019) explore the music oligopoly of three global corporations in a model of transitioning
the structure of revenue from dominant sales revenue in the “brick-and-mortar” model to
revenue from streaming and copyright sales. Im et.al. (2019) investigate the revenue generation
of different models of monetization of music content. Hiller and Walter (2017) analyze market
changes under the influence of rising streaming revenue.
4. DATA ANALYSIS
The research is divided into four basic parts, and consists of a financial analysis of the
operations of the three largest global corporations and an analysis of the revenue trend of the
global music industry. For each analysed economic entity, as well as for the global music
industry, revenues in the analysed period were analysed and a regression analysis of individual
parts of the revenue structure was made.
4.1. Sony Music
According to Sony's 2019 Consolidated Financial Results released on May 13 for its fiscal year
ended March 31, the estimated of the disease on 2019 fiscal year consolidated operating income
from music was maybe a loss of 1% (Zarczynski 2020a). Selected results of the Sony music
financial report are shown in Table 1. For research purposes, we selected total sales and
operating income over a period of eight years, from 2013 to 2020. The fiscal year ends in March.
As Carter (2020) points out by 2014, with digital singles decimating album sales, coupled with
the rise of illegal file sharing, revenues hit an all-time low. The future of labels looked bleak.
But around that same time, streaming was beginning to pick up steam, and the industry was
plotting a new future for itself. It was a future built on data.

63rd International Scientific Conference on Economic and Social Development – "Building Resilient Society" - Zagreb, 11-12 December, 2020
206
Table 1: Sony Music financial items (000 $)
2013 2014 2015 2016 2017 2018 2019 2020
Total sales 4.317.190 4.920.580 5.339.860 6.192.390 6.476.580 7.999.950 8.074.890 8.499.090
Operating income n/a n/a n/a 865.090 757.980 1.277.860 2.324.870 1.423.450
Total sales % 14,0% 8,5% 16,0% 4,6% 23,5% 0,9% 5,3%
Operating income % n/a n/a n/a -12,4% 68,6% 81,9% -38,8%
Source: Own illustration
Sony Music’s total revenue rose from $ 4,317 billion in 2013 to $ 8,499 billion in 2020. That’s
an increase of 96.67%. In the period from 2016 to 2020, operating income increased by 65.64%.
The increase in total revenues was not accompanied by an increase in operating income due to
an increase in the cost of sales and other operating expenses. At the corporate level, Sony has
entered a restructuring process that has also taken place in the music segment. Total revenues
grew continuously, so that in 2019 revenue growth would be less than 1%. Operating income
has fluctuated, indicating volatile operating costs and changes in the global music market. All
of this has prompted Sony’s management to restructure and reorganize operations similar to
what major competitors in the WMG and Universal Music Group industries have already done
(Kelly 2019).
Table 2: Sony regression analysis
Source: Own illustration
The Covid-19 global pandemic refers to the business results for 2020 (ended fiscal year March
31). Despite expectations of high revenue growth due to the lock-down model, total revenue
grew by 5.3% while operating income fell by 38.8% compared to the same period in 2019.
Operating costs in the pandemic grew faster than total revenue growth. Zarczynski (2020b)
warns of a report by the Sony administration that points to a problem with the pandemic.
Projects with the production of new content were late. Restrictions on movement and the
problem of maintaining social distance directly affected the decline in sales of physical carriers.
Revenues from ticket sales and concerts were completely absent. The results of the analysis of
revenue trends by statistical regression models are shown in Table 2. The average growth of
total revenues in the analysed period was 9.9% per year (s = 9.98) with a significance coefficient
of 93.13%. The largest annual increase in revenue of 23.5% was recorded in 2018, and the
following year the increase was the lowest 0.9%. Business instability significantly affected the
movement of operating income and the direction curve has a negative coefficient and an
insufficient coefficient of significance (R2 <0.8). The indexation model by years showed an
average increase in operating income of 24% and should be careful with the interpretation
because the regression curve has a negative coefficient. Despite a rough start to the internet era,
the music industry is now rebuilding itself. Sony Music — and indeed, recording as a whole —
is riding on four years of healthy growth. Below, five innovative ways the music industry is
using data to serve artists and grow business today, at Sony and beyond (Carter 2020).
y = 5E+06e0.0952x
R² = 0.9313
0
2,000,000
4,000,000
6,000,000
8,000,000
10,000,000
0 2 4 6 8
Total sales
y = -75821x2 + 571644x + 641487
R² = 0.51840
500,000
1,000,000
1,500,000
2,000,000
2,500,000
0 1 2 3 4 5
Operating income

63rd International Scientific Conference on Economic and Social Development – "Building Resilient Society" - Zagreb, 11-12 December, 2020
207
4.2. Warner Music Group
Warner Music Group is home to some of the most iconic record labels, including Atlantic
Records, Warner Records, and Parlophone Records, featuring recording artists such as Ed
Sheeran, Bruno Mars, and Cardi B. (Sanchez 2020). The financial indicators of the Warner
Music Group are shown in the table. For the purposes of the research, data on revenue, cost of
revenue, total costs and operating income were taken. The financial indicators cover a period
of six years. In the analysed period, from 2014 to 2019, WMG’s total revenue grew from $
3.027 billion to $ 4.475 billion, an increase of 47.83%.
Table 3: WMG financial items (million $)
2014 2015 2016 2017 2018 2019
Revenue 3.027 2.966 3.246 3.576 4.005 4.475
% - -2,0% 9,4% 10,2% 12,0% 11,7%
Cost of revenue 1.570 1.511 1.707 1.931 2.171 2.401
% -3,8% 13,0% 13,1% 12,4% 10,6%
Total costs 3.008 2.839 3.032 3.354 3.788 4.119
% - -5,6% 6,8% 10,6% 12,9% 8,7%
Operating income 19 127 214 222 217 356
% - 568% 69% 4% -2% 64%
Source: Own illustration
In the same period, the cost of revenue increased by 52.93%. Total expenses increased by
36.93%, while operating income increased by 89.47%. Total costs grew continuously, while
the cost of revenue had a digressive increase. The reason for such behaviour of financial
indicators is found in the continuous change in the structure of income. In the last few years,
copyright revenues charged by music corporations from streaming platforms have grown
exponentially, which has a direct impact on the decline in the cost of revenue. Total revenues
fell until 2015, after which they began to grow continuously. The cost of revenue and total cost
had the same trend. Operating income fell in 2018 by 2% compared to the previous period and
increased by as much as 64% the following year. In the analysed period, revenues grew on
average 8.81% (s = 8.8%) per year with a significance coefficient of 93.54%. Cost of revenue
grew at an average rate of 10% (s = 10%), but in the last analysed period they fell by 1.8%.
Total costs have the smallest average increase; ie they grew on average 7.52% (s = 7.52) with
a significance coefficient of 86.43%. Operating income grew digressively and then grew
exponentially. The change in the growth trend is related to the copyright revenues that the
corporation charges from the streaming platform. The coefficient of significance is 69.62%,
which is not sufficient for the certainty of estimating the average increase. The average growth
rate, with 69.62% significance, would be approximately 59% of the average annual growth of
operating income. The results of the regression analysis of the financial result of WMG are
shown in Table 4.
Table following on the next page

63rd International Scientific Conference on Economic and Social Development – "Building Resilient Society" - Zagreb, 11-12 December, 2020
208
Table 4: WMG regression analysis
Source: Own illustration
4.3. Universal Music Group
Universal Music Group is unstoppably taking a leading position in the global music industry.
In doing so, we do not only target financial indicators, but also qualitative indicators of positive
management practices. Universal Music Group’s leading artists are the driving force behind
Paris-based Vivendi SA’s latest growth. Successful new releases by artists including Justin
Bieber, Eminem and The Weekend supported growth in streaming and recorded music, which
helped the company remain largely unaffected by entertainment industry declines caused by
the COVID-19 pandemic (Zarczynski 2020b). The world’s largest music publisher Universal
Music Group (UMG) has revived the record label and its valuation thanks to Chinese owned
Tencent’s 10% stake in the company. UMG’s parent company Vivendi has already been
pushing into emerging markets like Africa where global music consumers are poised to triple
(Hale 2020). Spotify and one of its earliest adopters, Universal Music Group (UMG),
announced a new, multi-year global license agreement that deepens the companies’ joint effort
to create added value for music artists and more engaging features for fans. The new deal will
support music discovery experiences and collaboration on new, state-of-the-art marketing
campaigns across Spotify’s platform (Zarczynski 2020c). UMG integrates D&I into the core of
its culture and as a central tenet of its business strategy (Kruse 2020). UMG announced that
it entered into a joint venture with with Dakia U-Ventures to launch UMUSIC Hotels. The first
of three hotels named UMUSIC Broadwater is to begin construction on a 266-acre property that
will include “virtual reality, augmented reality, artificial intelligence, and holograms,” as well
as a 12,000 capacity music venue (Owsinski 2020). LEGO Group and Universal Music Group
announced an exclusive global partnership to launch a new suite of music-based LEGO
products in 2021 (Mandell 2020). The analysis of UMG's financial indicators covers a period
of eight years, from 2012 to 2019. In the analysed period, UMG's revenues increased from $
4.545 billion to $ 7.159 billion, an increase of 57.51%. Revenues fell 6.7% in 2014 compared
to the previous period, after which they grew continuously. The largest increase in revenue was
realized in 2019, and it amounted to 18.9% growth compared to the previous year. EBITA
increased from $ 511 million to $ 1.124 billion over the period under review, an increase of
119.96%. Since 2015, EBITA has been growing continuously and achieved the largest increase
in the last analysed period, as it was with the increase in total revenue. The increase was 24.6%
compared to 2018. The results of the analysis are shown in Table 5.
y = 2842.1e0.0844x
R² = 0.9354
0
1,000
2,000
3,000
4,000
5,000
0 1 2 3 4 5 6
Revenue
y = 1461.9e0.0953x
R² = 0.93590
1,000
2,000
3,000
0 1 2 3 4 5 6
Cost of revenue
y = 2775e0.0725x
R² = 0.8643
0
1,000
2,000
3,000
4,000
5,000
0 1 2 3 4 5 6
Total cost
y = 44.91e0.4656x
R² = 0.69620
100
200
300
400
500
0 1 2 3 4 5 6
Operating income

63rd International Scientific Conference on Economic and Social Development – "Building Resilient Society" - Zagreb, 11-12 December, 2020
209
Table 5: Universal financial items (million $) 2012 2013 2014 2015 2016 2017 2018 2019
Revenue 4.545 4.886 4.557 5.108 5.267 5.673 6.023 7.159
%
7,5% -6,7% 12,1% 3,1% 7,7% 6,2% 18,9%
EBITA 511 511 565 593 644 761 902 1.124
%
0,0% 10,6% 5,0% 8,6% 18,2% 18,5% 24,6%
Source: Own illustration
Table 6: UMG regression analysis
Source: Own illustration
The results of the regression analysis showed that UMG revenue grew on average annually at
a rate of 6% (s = 6.02%), with a significance coefficient of 86.99%. The average annual increase
in EBITA was 9.9% (s = 9.86%), with a coefficient of 92.29%. The significance coefficient is
higher in the EBITA assessment due to the higher growth of the indicator in the last two
analysed periods. EBITA growth in the last three analysed periods is much higher than the
percentage of revenue growth, which indicates a change in management practices and a new
revenue structure. The revenue from the sale of copyrights is growing, which affects the
decrease in costs for sales and the growth of operating income.
4.4. Global music industry
Global music industry revenues have been falling steadily since the end of the last century until
2014. In 1999, the revenues of the global music industry were $ 25.2 billion (IFPI; Lozić 2019).
According to the revenue structure, the total revenue was realized from the sale of physical
sound carriers. The drop in revenue lasted until 2014, when the lowest revenue of the global
music industry of 14.1 billion dollars was achieved. The new century brought changes in the
revenue structure, and in 2001, revenue of $ 0.6 billion was generated from performance right.
In 2005, the first streaming revenues were generated, after which the streaming revenues grew
exponentially. The trends in total revenues of the global music industry are shown in Figure 1.
Revenues declined until 2014 and then began to grow exponentially. For the purposes of the
analysis, data on the revenue trends of the global music industry in the last ten years were taken.
In 2009, most of the revenue came from psychical, followed by revenue from the sale of digital
content. Such a revenue structure was maintained until 2014, and in 2015 and 2016 the sum of
digital and streaming revenues surpassed psychical revenues. Since 2017, most of the revenue
of the global music industry comes from streaming (Lozić 2020a). 2019 streaming revenue is
$ 11.4 billion, which is about 50% of total revenue. Revenue trends and trend lines are shown
in Figure 1.
Picture following on the next page
y = 4355.2e0.0585x
R² = 0.8699
0
1,000
2,000
3,000
4,000
5,000
6,000
7,000
8,000
0 1 2 3 4 5 6 7 8
Revenue
y = 473.94e0.094x
R² = 0.9229
0
200
400
600
800
1,000
0 2 4 6 8
EBITA

63rd International Scientific Conference on Economic and Social Development – "Building Resilient Society" - Zagreb, 11-12 December, 2020
210
Picture 1: Global music industry revenue 2009-2019 (bill. $)
Source: Own illustration
Table 7: Global music industry regression analysis (2013-2019)
Source: Own illustration
Table 8: Correlation between subjects Global Sony WMG Universal
Global 1 0,98646 0,98624 0,96022
Sony 1 0,95558 0,91633
WMG 1 0,96598
Universal 1
Source: Own illustration
The results of the regression analysis are shown in Table 7. For easier comparison with the
financial indicators of global corporations, the survey covers a period of seven years, from 2013
to 2019. The analysis is divided into two parts. The first part of the analysis presents the results
of the research of the trend of total revenues. Total revenues grew on average 6.5% per year (s
= 6.49%). Total revenues refer to all categories in the revenue structure of the global music
industry. In the second part, the results of the analysis of the trend of streaming income are
presented. The results of the analysis showed that streaming revenues grew by an average of
44% per year (s = 44.14%). The revenue structure changed significantly as streaming revenue
became higher than physical revenue. Postmodern society has brought changes, on the one
hand, in the way music is consumed, and on the other hand, in the model of revenue generation.
From exclusive physical income, corporations generate income from various sources of income.
In managerial practice, the situation is known as blurred borders (Lozić 2020b). The research
covers revenues in the period from 2014 to 2019. The results of the research showed a very
strong link between the entities in the global music industry, as well as a strong correlation
between the revenue trend of the global music industry and the revenue trend of the three largest
global corporations. The revenue trend of the global music industry has the strongest connection
with the revenue trend of Sony Music Group (r = 0.98646), and the weakest with Universal (r
= 0.96022). The revenue growth trend of the global music industry and Sony Music Group
revenue, in the analysed period of 6 years, has a linear trend.
y = 1.075x + 13.346
R² = 0.91630.0
5.0
10.0
15.0
20.0
25.0
0 2 4 6 8
Total global music revenue 2013-2019
y = 1.4058e0.3656x
R² = 0.99060.0
5.0
10.0
15.0
0 2 4 6 8
Global streaming revenue 2013-2019
16.214.9 14.7 14.9 14.5 14.1 14.7
16.017.3
19.020.4
0.0
5.0
10.0
15.0
20.0
25.0
2009 2010 2011 2012 2013 2014 2015 2016 2017 2018 2019

63rd International Scientific Conference on Economic and Social Development – "Building Resilient Society" - Zagreb, 11-12 December, 2020
211
Universal's revenues are growing by 18%, in the last analysed period, and are approaching an
exponential growth trend. The weakest correlation in the analysis is between Universal and
Sony (r = 0.91633). The results of the correlation research of the analysed subjects of the music
industry are shown in Table 8.
5. DISCUSSION
The results of the research can be summarized in five basic points that prove the set research
hypotheses:
• All three corporations had operating profit growth above total revenue growth in 2019. An
increase in the share of streaming revenue reduced the cost of revenue.
• The average revenue growth of Sony (s = 9.9%) and WMG (S = 8.8) is above the industry
average of 6.5%, but the operating costs of corporations are volatile. Both corporations have
entered a restructuring process. Universal has lower average revenue growth (s = 6%) than
average revenue growth in the industry, but operating costs have stabilized and operating
profit has started to grow exponentially. The share of streaming revenue has a significant
effect on the overall revenue structure.
• The total revenues of the music industry have been growing continuously since 2014. The
average annual revenue growth is 6.5%. In the same period, streaming revenue grew at an
average rate of 44.14% per annum and is now at 50% of total music industry revenue.
• The total revenues of the global music industry show a very strong correlation with the
revenue trend of all three corporations. The link is strongest with Sony (0.98646) and then
with WMG (0.98624) due to fluctuations in revenue growth as in the global music industry.
• The exponential growth of streaming revenue directly affects the revenue growth of global
music corporations that are taking an increasing share of the global music market.
The results of the analysis presented in the five basic points of the discussion confirm both
hypotheses. All three corporations achieved revenue growth, but also operating profit growth.
In the last analysed period (2019), the growth of operating profit was higher than the growth of
revenue. This confirms the first hypothesis as streaming revenue grows, which directly affects
the cost of revenue. The second hypothesis is confirmed by the results of research on the
revenue trend of the global music industry. Total revenue grew at an average annual rate of
6.5% while total streaming revenue grew at an average rate of 44.14%. Exponential revenue
growth directly affects, not only the change in revenue structure, but also the continuous growth
of total revenue of the global music industry.
6. CONCLUSION
The total revenue of the global music industry has been growing for five years in a row. After
the oscillation of revenues that started in 2011, with the sharp growth of streaming revenues,
total revenue is growing exponentially. Confirming the first hypothesis, which refers to the
increase in revenue that is directly related to the growth of revenue from the sale of copyrights,
ie the increase in revenue from streaming, it is necessary to point out two important factors.
First, revenue growth is directly related to the development of technology, ie streaming
platforms. The second factor refers to a change in consumer behaviour. Postmodern society,
and especially Generation Z, has developed a subscription and streaming model instead of
owning physical ones. The habit of buying and listening to music indoors has been replaced by
listening to music on the go as well as during various daily activities. The changing model of
music consumption significantly affected the profits of global music corporations at the turn of
the century. Digitization of music content and piracy have particularly affected the music
industry and legal and other efforts have been needed to regulate and abolish it. Streaming
technology has made it possible to consume without the possibility of piracy.

63rd International Scientific Conference on Economic and Social Development – "Building Resilient Society" - Zagreb, 11-12 December, 2020
212
The revenues of the music industry are growing, but they have not yet returned to the levels
from the beginning of the century. Future research should focus on the revenue trend in the
Covid-19 pandemic and the analysis of the revenue structure.
LITERATURE:
1. Arditi, D. (2017). “Digital Subscriptions: The Unending Consumption of Music in the
Digital Era”. Popular Music and Society. Volume 41, (3), pp. 302-318.
doi.org/10.1080/03007766.2016.1264101.
2. Carter, C. (2020). “How Sony Music Use Data to Connect Artist with Fans”. Forbes.
https://www.forbes.com/sites/forbescontentmarketing/2020/08/26/how-sony-music-uses-
data-to-connect-artists-with-fans/?sh=1cae36a85e1c. [04.11.2020.]
3. Denegri-Knott, J. (2015), “MP3”, Consumption Markets and Culture, Vol. 18 No. 5,
pp. 397-401., doi.org/10.1080/10253866.2015.1048962
4. Dholakia, N., Reyes, I.; Bonoff, J. (2015), “Mobile media: from legato to staccato,
isochronal consumptions capes”, Consumption Markets and Culture, Vol. 18 No. 1, pp. 10-
24. doi.org/10.1080/10253866.2014.899216.
5. Fuentes, C.; Hagberg, J.; Kjellberg, H. (2019). „Soundtracking: music listening practices in
the digital age“. European Journal of Marketing., pp. 483-503. DOI 10-1108/EJM-10-
2017-0753
6. Guichardaz, R.; Bach, L.; Penin, J. (2019). „Music industry intermediation in the digital era
and the resilience of the Majors’ oligopoly: the role of transactional capability“. Industry
and Innovation. 26:7, 843-869, DOI: 10.1080/13662716.2018.1561357.
7. Hagberg, J.; Kjellberg, H. (2017). “Digitalized music: entangling consumption practices“,
(Eds). Cochoy, F.; Hagberg, J.; Peterson McIntyre, M.; Sörum, N. Digitalizing
Consumption: how devices shape consumer culture, Routledge, pp. 167-189. ISBN 978-1-
138-12489-9.
8. Hale, K. (2020). “Universal Music Group’s $3 Billion Tencent Deal Ushers In a Golden
Vibes Era”. Forbes. https://www.forbes.com/sites/korihale/2020/01/13/universal-music-
groups-3-billion-tencent-deal-ushers-in-a-golden-vibes-era/?sh=404862fc7d53.
[04.11.2020.]
9. Hesmondhalgh, D.; Meier, L.M. (2018). „What the digitalisation of music tells us about
capitalism, culture and the power of the information technology sector”. Information,
Communication & Society, 21:11, 1555-1570.
10. Hiller, S. R.; Walter, M.J. (2017). The rise of Streaming Music and Implication for Music
Production. Rev Netw Econ; 16(4): 351–385.
11. Hiller, S. R.; Walter, M.J. (2017). The rise of Streaming Music and Implication for Music
Production. Rev Netw Econ; 16(4): 351–385. doi.org/10.1515/rne-2017-0064.
12. IFPI - Global music report – The industry in 2019.
https://www.ifpi.org/wp-content/uploads/2020/07/Global_Music_Report-
the_Industry_in_2019-en.pdf. [06.11.2020.]
13. Im, H.; Song, H.; Jung, J. (2019). „The effect of streaming services on the concentration of
digital music consumption“. Information Technology & People. Vol. 33 No. 1, pp. 160-179.
DOI 10.1108/ITP-12-2017-0420.
14. Irene, C.L.Ng. (2014). Creating New Markets in the Digital Economy, Cambridge
University Press.
15. Kask, J.; Oberg, C. (2019). “Why “majors” surge in the post-disruptive recording industry”.
European Journal of Marketing, Vol. 53 No. 3, pp. 442-462. DOI 10.1108/EJM-11-2017-
0841.

63rd International Scientific Conference on Economic and Social Development – "Building Resilient Society" - Zagreb, 11-12 December, 2020
213
16. Kelly, C. (2019). “Sony Consolidates Recorded Music and Publishing Under Sony Music
Group”. Forbes. https://www.forbes.com/sites/caitlinkelley/2019/07/19/sony-consolidates-
recorded-music-and-publishing-under-sony-music-group/?sh=18ff0aaf7dbc. [04.11.2020.]
17. Kerrigan, F.; Larsen, G.; Hanratty, S.; Korta, K. (2014). “Gimme shelter’: experiencing
pleasurable escape through the musicalisation of running”, Marketing Theory, Vol. 14 No.
2, pp. 147-166.
18. Kruse, K. (2020). “How Universal Music Group Engages Millennial Managers and
Leverages Diversity”. Forbes.
https://www.forbes.com/sites/kevinkruse/2020/02/05/how-universal-music-group-
engages-millennial-managers-and-leverages-diversity/?sh=1be83d4f3db4. [04.11.2020.]
19. Lozić, J. (2020a). „The global music industry is recovering from the crisis: Streaming
revenues takes over dominance other revenue segments“. 54th International Scientific
Conference on Economic and Social Development. Novosibirsk, pp. 50-59.
20. Lozić, J. (2020b). “Media industry in a post-industrial society: Media industry revenue
convergence and blurred boundaries in media sector”. 51st International Scientific
Conference on Economic and Social Development. Rabat, pp. 261-269.
21. Lozić. J. (2019). „Digitalization creates a new paradigm of global music industry: The
traditional music industry is under pressure of the streaming platforms”. 46th International
Scientific Conference on Economics and Social Development – „Sustainable Tourist
Destinations. Varazdin, pp. 179-190.
22. Maheshwari, A. (2019) Digital Transformation: Building Intelligent Enterprises. Wiley &
Sons. ISBN 978-1-119-54083.
23. Mandell, J. (2020). “LEGO and Universal Music Group Announce Exclusive Global
Partnership”. Forbes. https://www.forbes.com/sites/joshmandell/2020/04/27/lego-and-
universal-music-group-announce-exclusive-global-partnership/?sh=63087b10676c.
[04.11.2020.]
24. Owsinski, B. (2020). „What Destination Hotels Mean For Universal Music“. Forbes.
https://www.forbes.com/sites/bobbyowsinski/2020/10/21/what-destination-hotels-mean-
for-universal-music/?sh=3a18583f7b2a. [04.11.2020.]
25. Ryan, D. (2019). “Digital disruption in the music industry: The case of the compact
disc”. Creative Industries Journal, 12:2, 159-166.
26. Sanchez, L. (2020). “Warner Music Group Shows the Music Industry Can Be Profitable
Again”. Nasdaq. https://www.nasdaq.com/articles/warner-music-group-shows-the-music-
industry-can-be-profitable-again-2020-08-12. [04.11.2020.]
27. Seemiller, C.; Grace, M. (2019). Generation Z: A century in a making. Routledge.
28. Simon, J.P. (2019). „New players in the music industry: lifeboats or killer whales? The
role of streaming platforms. Digital Policy, Regulation and Governance, pp. 525-549. DOI:
10.1108/DPRG-06-2019-0041.
29. Sinclair, G.; Tinson, J. (2017). “Psychological ownership and music streaming
consumption”. Journal of Business Research, Vol. 71, pp. 1-9.
30. Werner, A. (2020). „Organizing music, organizing gender: algorithmic culture and Spotify
recommendations“. Popular Communication. 18:1, 78-90, DOI:
10.1080/15405702.2020.1715980.
31. Wright, D. (2015). Understanding cultural taste: Sensation, skill and sensibility.
Basingstoke: Palgrave Macmillan. ISBN 978-1-137-44706-7.
32. Zarczynski, A. (2020a). “Sony Music Braces for Operating Revenue Declines After 40%
Bump”. Forbes.
https://www.forbes.com/sites/andreazarczynski/2020/05/15/sony-music-braces-for-
operating-revenue-declines-after-40-bump/?sh=357e7bfd728a. [04.11.2020.]

63rd International Scientific Conference on Economic and Social Development – "Building Resilient Society" - Zagreb, 11-12 December, 2020
214
33. Zarczynski, A. (2020b). “Successful Universal Music Group Albums Power Vivendi Profits
Amidst Industry Crisis”. Forbes.
https://www.forbes.com/sites/andreazarczynski/2020/04/21/successful-universal-music-
group-albums-power-vivendi-profits-amidst-industry-crisis/?sh=46e86f3417df.
[04.11.2020.]
34. Zarczynski, A. (2020c). “Spotify’s New Universal Music Group Deal Drives Deeper Atrist-
Fan Engagement”. Forbes.
https://www.forbes.com/sites/andreazarczynski/2020/07/22/spotifys-new-universal-music-
group-deal-drives-deeper-artist-fan-engagement/?sh=4bc833c85dd4. [04.11.2020.]

63rd International Scientific Conference on Economic and Social Development – "Building Resilient Society" - Zagreb, 11-12 December, 2020
215
APPLICATION OF SPATIAL AUTOCORRELATION TO ANALYZE
THE DIFFERENTIATION OF ECONOMIC GROWTH IN SELECTED
EUROPEAN UNION COUNTRIES
Katarzyna Zeug-Zebro
University of Economics in Katowice, Poland
ABSTRACT
Economic growth is nothing more than the process of increasing the production of goods and
services in a given region at a given time. It includes those elements of the economy that we
can measure (e.g. production, income, employment). In view of the significant the socio-
economic differences between regions, the economic growth is not homogenous. However, the
regions are not independent of each other and changes in one area are spreading to others.
Therefore, spatial relationships should be taken into account in research on economic growth.
For example, the European regions can assess whether the border regions of different
countries show a similarity to each other due to the feature studied. The use of spatial analysis
(spatial autocorrelation) to study the regional differentiation in the level of economic growth
allows establishing existing relationships between the studied regions in relation to this
phenomenon. Thus, the question can be answered whether a given region is surrounded by
regions of high or low value, or is it similar/different to its neighboring regions. The main goal
of the article is to analyze the regional dependence of the level of economic growth measured
by the GDP per capita indicator in selected countries of the European Union using the global
and local spatial autocorrelation measures. The data used in the analysis comes from the
database of Eurostat. All calculations and presented maps were made in R CRAN program and
in MS Excel.
Keywords: economic growth, Gross Domestic Product, spatial analysis, global and local
statistics
1. INTRODUCTION
There are many different definitions of economic growth in the literature (Begg, Fisher,
Dornbusch, 2007; Samuelson, Nordhaus, 2012; Marciniak, 1997). One of them says that
economic growth is a measurable economic variable, which is defined in terms of the increase
in the value of the annual production of goods and services in a given country (Marciniak,
1997). Economic growth is also a process of increasing the effects of management, the measure
of which is the economic growth rate, generally equated with the production growth rate.The
diversity of the socio-economic space determines the possibilities of economic growth. Various
collections of resources owned by regions (concentration of economic activity, geographic and
geopolitical location, climate, deposits, proximity to population centers, as well as the location
of industrial plants, research and development units, availability of technical infrastructure,
quality of labor resources) largely determine the development opportunities of area (Bogdański,
2010; Nazarczuk, 2015). The application of spatial analysis to investigate the economic growth
will allow to establish existing relationships between the studied regions with respect to this
phenomenon. It will allow not only general but also individual characteristics of similarities
and differences of regions. The main objective of this paper is to study the spatial dependences
of the economic growth in selected countries of European Union using measures of global and
local spatial autocorrelation. The countries of Central and Eastern Europe (Poland, the Czech
Republic, Slovakia, Lithuania) and Germany as the reference country were selected for the
study. All calculations and maps were made in the statistical program R CRAN and Microsoft
Excel. The data was obtained from the Eurostat (www 1), 2007-2018.

63rd International Scientific Conference on Economic and Social Development – "Building Resilient Society" - Zagreb, 11-12 December, 2020
216
2. ASSESSMENT OF ECONOMIC GROWTH MEASURED BY THE GDP PER
CAPITA
The most frequently used indicator for estimating the level of economic growth is gross
domestic product (GDP). In international comparisons, however, the GDP per capita indicator
is used, ie gross domestic product per inhabitant. Economic growth measured by the GDP per
capita indicator in the European Union countries is presented in Table 1.
Area/Year 2007 2018 i2018/2007 Area/Year 2007 2018 i2018/2007
European Union
28 countries 26 070 31 030 119,03%
Latvia 10 340 15 130 146,32%
Lithuania 8 980 16 240 180,85%
Belgium 32 340 40 290 124,58% Luxembourg 77 340 98 640 127,54%
Bulgaria 4 240 7 990 188,44% Hungary 10 170 13 910 136,77%
Czechia 13 470 19 850 147,36% Malta 14 240 25 740 180,76%
Denmark 42 740 52 190 122,11% Netherlands 37 800 44 920 118,84%
Germany 30 860 40 480 131,17% Austria 34 230 43 600 127,37%
Estonia 12 210 19 660 161,02% Poland 8 230 12 960 157,47%
Ireland 44 800 67 270 150,16% Portugal 16 640 19 950 119,89%
Greece 21 060 16 750 79,53% Romania 6 110 10 500 171,85%
Spain 23 780 25 770 108,37% Slovenia 17 370 22 130 127,40%
France 30 330 35 100 115,73% Slovakia 10 440 16 440 157,47%
Croatia 10 180 12 700 124,75% Finland 35 370 42 360 119,76%
Italy 27 470 29 290 106,63% Sweden 39 240 46 260 117,89%
Cyprus 22 930 24 630 107,41% United Kingdom 36 840 36 440 98,91%
Table 1: GDP per inhabitants in European Union in 2007- 2018
(Source: own elaboration)
Table 1 shows the significant differences in the standard of living of the inhabitants of the
European Union. First of all, it should be emphasized that in the analyzed period, economic
growth was observed in the vast majority of Member States, the greatest in Bulgaria, Lithuania
and Malta. The countries where the index decreased were Greece and the United Kingdom.
Luxembourg continues to lead the EU in terms of GDP per capita - despite the high level of
this indicator in 2004, it still registered an increase of just over 27%. The Irish and the Danes
are next in terms of wealth, although the distance to Luxembourg is still very large. Figure 1
shows the level of GDP per capita in the countries of Central and Eastern Europe (Poland, the
Czech Republic, Slovakia, Lithuania) and Germany as the reference country. The countries of
Central and Eastern Europe were recognized as developing countries and at the initial stage of
economic development in relation to the highly developed economy (Germany). The level of
GDP per capita in 2007–2018 shows a growing tendency in each of the countries presented,
albeit to a different extent. A large disproportion between GDP per capita in Germany and other
countries is visible. The GDP growth in the presented period does not indicate that the distance
between Germany and other countries is narrowing.
Figure following on the next page

63rd International Scientific Conference on Economic and Social Development – "Building Resilient Society" - Zagreb, 11-12 December, 2020
217
Figure 1: GDP per capita indicator in selected countries of the European Union in the years
2007- 2018
(Source: own elaboration)
Figure 2 presents the classification of regions (NUTS 2) of selected EU countries due to the the
level of economic growth measured by value of the GDP per capita indicator in the years 2007-
2018.
Figure 2: Classification of regions (NUTS 2) of selected EU countries according to the level
of economic growth (GDP per capita) in 2007-2018
(Source: own elaboration)
The GDP per capita indicator G were the basis for the classification of these regions, due to
homogeneous groups, from the point of view of the degree of the phenomenon studied (ie the
level of economic growth).
0
5,000
10,000
15,000
20,000
25,000
30,000
35,000
40,000
45,000
2007 2008 2009 2010 2011 2012 2013 2014 2015 2016 2017 2018
GDP per capita
Germany Czechia Slovakia Lithuania Poland

63rd International Scientific Conference on Economic and Social Development – "Building Resilient Society" - Zagreb, 11-12 December, 2020
218
The total volatility range of measures was divided into four class to which the regions were
assigned according to the following rules rules (Kuc, 2012; Zeliaś, 2000):
• class I (high level of the studied phenomenon): �̅� + 𝑆𝐺 ≤ 𝐺𝑖
• class II (medium level of the studied phenomenon): �̅� ≤ 𝐺𝑖 ≤ �̅� + 𝑆𝐺
• class III (low level of the studied phenomenon): �̅� − 𝑆𝐺 ≤ 𝐺𝑖 ≤ �̅�
• class IV (very low level of the studied phenomenon): 𝐺𝑖 < �̅� − 𝑆𝐺
where:
�̅� =1
𝑛∑ 𝐺𝑖
𝑛𝑖=1 , 𝑆𝐺 = √
1
𝑛∑ (𝐺𝑖 − �̅�)2𝑛
𝑖=1 . (1)
The results of the classification presented on the maps (Fig. 2) showed that in the analyzed
years most of the regions belonged to class III or IV, which indicates a low and very low level
of economic growth. In the analyzed period, 59 regions did not change their place in the
classification, 5 regions changed the class in which the studied phenomenon was higher, and in
the remaining ones, they changed the class to a lower level of economic growth. The countries
with the regions with the lowest values of GDP per capita are Poland, Lithuania and Slovakia.
In turn, the highest values of this measure were recorded in the south-western part of Germany,
Bratislavský Kraj, Praha and, since 2012 in Warszawski Stoleczny region. It was observed that
with the passage of time the number of regions belonging to the second class (previously
belonging to third class) increases, i.e. class with an average level of economic growth. Most
of these regions are adjacent to Germany, which is a more developed country. Probably the
highly developed economy of Germany influences the economic development of its neighbors.
3. SPATIAL AUTOCORRELATION
The spatial autocorrelation occurs when a certain phenomenon in a single spatial unit alters the
probability of occurrence of this phenomenon in the neighbouring units (Bivand, 1980). In
general, a positive spatial autocorrelation occurs when we observe the accumulation, in terms
of location, of high or low values of observed variables. In the case of negative autocorrelation,
high values are adjacent to low, and low to high, creating a kind of checkerboard (Suchecki,
2010). The lack of spatial autocorrelation means spatial randomness, i.e. high and low values
of observed variables are distributed independently. There are two types of indicators of spatial
associations (ISA): global and local measures of autocorrelation. Global autocorrelation results
from the existence of correlation within the entire studied spatial unit. The local measure shows
spatial dependence between the variable and its neighbouring units in a particular location.
3.1. Global statistics
The Moran (Moran, 1950) statistics is one of the most widely used measures in the study of
spatial autocorrelation. The global Moran’s I is defined as follows:
( )( )
( ) zz
Wzz
S
n
xxw
xxxxwn
In
i
i
n
i
n
j
ij
n
i
n
j
jiij
T
T
=
−
−−
=
== =
= =
0
1
2
1 1
1 1, (2)
where: xi, xj are the values of variables in the spatial unit i and j, x is the mean of the variable
for all units, n is the total number of spatial units that are included in the study, S0 is the sum of
all elements of a spatial weight matrix, z is a column vector of elements xxz ii −= , W is the

63rd International Scientific Conference on Economic and Social Development – "Building Resilient Society" - Zagreb, 11-12 December, 2020
219
spatial weight matrix degree n, defining the structure of the neighbourhood, wij is an element of
weights matrix W (Kopczewska, 2011). This statistic takes values ranging from
[–1, 1]: positive, when tested objects are similar, negative, when there is no similarity between
them, and approximately equal to 0 for a random distribution of objects. Cliff and Ord (1973)
have shown that the distribution of Moran statistics is asymptotically normal. Thus, the
statistical significance of spatial autocorrelation can be verified using normalised statistics
( )1,0~ NI S :
( )
( )I
III S
Var
E−= , (3)
where: E(I) is the expected value of Moran’s and Var(I) is its variance:
( )1
1E
−−=
nI , ( )
( ) ( )22
0
2
2
021
2
1
1
1
3Var
−−
−
+−=
nSn
SnSSnI , (4)
= =
=n
i
n
j
ijwS1 1
0 , ( )= =
+=n
i
n
j
jiij wwS1 1
2
12
1,
2
1 11
2 = ==
+=
n
i
n
j
ji
n
j
ij wwS . (5)
If the Moran statistic has a value I ≈ –(n –1)–1, IS ≈ 0, it indicates a random spatial pattern.
However, when I > –(n – 1)–1, IS > 0, the spatial autocorrelation is positive, and if
I < –(n – 1)–1, IS < 0, the spatial autocorrelation is negative.
Another global measure of spatial autocorrelation is Global Geary’s C. This statistic, is given
by
( ) ( )
( ) ( )( )
−
−=
−
−−
=
== =
= =I
w
S
n
n
n
xxw
xxwn
C i
n
ii
n
i
n
jij
n
i
n
jjiij
zz
zzT
T.
0
1
2
1 1
1 1
2
diag
12
1
, (6)
where all elements of the formula are defined as in statistic I. The above formula shows that the
Geary measure can be expressed by the Moran statistic (Griffith, 2003). Although Moran and
Geary measures give similar results, the Moran statistic is more effective. This is due to greater
sensitivity of the variance of the Geary statistic to the distribution of sample. Values of this
statistic can be impaired when the matrix of weights is asymmetrical. In order to verify the
hypothesis of no spatial correlation, the Geary statistic can be standardized:
( )
( )( )1,0~
Var
EN
C
CCC S −
= , (7)
where: E(C) is the expected value of Geary’s and Var(C) is its variance:
( ) 1E =C , ( )( )( )
( ) 20
2021
12
421Var
Sn
SSSnC
+
−+−= . (8)

63rd International Scientific Conference on Economic and Social Development – "Building Resilient Society" - Zagreb, 11-12 December, 2020
220
The value of Global Geary’s C is always positive and takes values ranging from [0, 2]. In the
case, of: 1< C < 2, CS > 0, the spatial autocorrelation is negative; when 0< C <1, CS < 0, the
spatial autocorrelation is positive; finally, when C ≈ 1, CS ≈ 0, there is no spatial autocorrelation.
3.2. Local statistics
The local Moran (Anselin, 1995) determines clusters of spatial units and verifies whether the
unit is surrounded by neighbouring units with similar or different values of the variable studied
in relation to the random distribution of these values in the studied space (Mastalerz-Kodzis,
Pośpiech, 2016; Zeug-Żebro, Wolny-Dominiak, 2012). In the case of non-standardised values
of the variable and row-standardised spatial weight matrix (Arbia, 2006) (= =
=n
i
n
j
ij nw1 1
), the
local Moran is given by:
( ) ( ) ( )
−
−−=
==
n
i
in
j
jijiin
xxxxwxxI
1
2
1
, (9)
where all the elements of the formula are defined as in the global Moran’s I. The standardised
local Moran’s 𝐼𝑖𝑆 is used to test the statistical significance of local spatial autocorrelation
(Anselin, 1995):
( )
( )( )1,0~
Var
EN
I
III
i
iiS
i
−= , (10)
where E(Ii) is the expected value of the local Moran and Var(Ii) is its variance
( )1
E1
−−=
=
n
w
I
n
j
ij
i i ( )
( ) ( )
( )( )
22
121
22
1Var
−
−
−−−
−
+−
−
=
n
w
nn
wwnk
n
wkn
Iji
ij
il ihi
ihilji
ij
i, (11)
where ( ) ( )2
24 11
−
−=
i
i
i
i xxn
xxn
k .
When 𝐼𝑖𝑆 is negative, the spatial autocorrelation is negative, too, i.e. when the object is
surrounded by spatial units with significantly different values of the studied variable. The
spatial autocorrelation is positive when 0S
iI , the object is surrounded by similar
neighbouring units.
4. ISA FOR GDP PER CAPITA OF SELECTED EU COUNTRIES
The object of the study were regions (NUTS 2) of the selected countries of the European Union
in years 2007-2018. For this purpose, annual data obtained from Eurostat databases were used
(www 1). In the first stage of the research estimated the spatial autocorrelation of the economic
growth (based on the GDP per capita indicator). Calculated values of global Moran and global
Geary are presented in Table 2.

63rd International Scientific Conference on Economic and Social Development – "Building Resilient Society" - Zagreb, 11-12 December, 2020
221
Global statistic: Morana I and Geary C
Year I p-value C p-value Year I p-value C p-value
2007 0.4899 2.46∙10-10 0.4243 4.25∙10-11 2013 0.4372 1.29∙10-8 0.4648 6.81∙10-10
2008 0.4692 1.17∙10-9 0.4346 1.13∙10-10 2014 0.4567 3.29∙10-9 0.4507 1.93∙10-10
2009 0.4369 1.19∙10-8 0.4566 7.21∙10-10 2015 0.4205 4.05∙10-8 0.4756 1.61∙10-9
2010 0.4364 1.31∙10-8 0.4615 6.82∙10-10 2016 0.4406 1.07∙10-8 0.4665 5.49∙10-10
2011 0.4546 3.78∙10-9 0.4514 2.22∙10-10 2017 0.4300 2.22∙10-8 0.4738 1.02∙10-9
2012 0.4531 4.28∙10-9 0.4533 2.44∙10-10 2018 0.4069 1.04∙10-7 0.4909 3.75∙10-9
Table 2: Global Moran and Geary in the years 2007- 2018
(Source: own elaboration)
Analyzing the data contained in Table 2 can be concluded that both global statistics are positive
and statisti-cally significant. This means the similarity of spatial units (NUTS 2) due to the level
of the economic growth. Graphical presentation of Moran statistics in years 2007, 2008, 2009,
2012, 2015 and 2018 is presented in Figure 3. These graphs show regions with outlying GDP
values. In all analyzed years, the regions of Bratislavsky Kraj, Hamburg, Praha and Warszawski
Stoleczny are located below the regression line. Additionally, in 2007, 2008, 2009 and 2012,
the regions of Darmstadt and Oberbayern joined them. The GDP per capita values at these
locations outweigh the values in neighborhood regions more than it would result from the
overall spatial pattern. Con-versely, the neighbors of the region above the regression line
(Shwaben in 2015 and 2018) have higher, than the mean, values of the GDP per capita.
Figure 3: Scatter plot for the Moran global statistic in selected years
(Source: own elaboration)
The next stage of research was to estimate the local Moran in order to identify the spatial
structure. The results of spatial distribution for the regions of selected countries in the years
2007, 2008, 2009, 2012, 2015 and 2018 are shown in Figure 4.

63rd International Scientific Conference on Economic and Social Development – "Building Resilient Society" - Zagreb, 11-12 December, 2020
222
Figure 4: The classification of regions of the European Union due to the value of the local
Moran for the GDP per capita in selected years
(Source: own elaboration)
Based on these maps (Figure 4) it can be seen that only some of the local Moran are statistically
significant. In the studied period, significant and positive values of local Moran obtained for
the GDP indicator only for 25 regions in 2007, 2008 and 2012; 22 in 2009; 24 in 2015 and 23
in 2018. This means that in chosen years, these regions have been surrounded by units with
similar values of the GDP indicator which expressing the level of the economic growth. The
phenomenon of clustering can be observed for almost all regions of Poland, several southern
regions of Germany, two regions of Slovakia (Východné Slovensko and Stredné Slovensko)
and Vidurio ir vakaru Lietuvos regionas. Standardized local statistics of Moran assume
significantly negative values only for the Bratislavský kraj (in 2009, 2015 and 2018) and the
Warszawski Stoleczny (2018) regions. These regions are outliers, ie they are surrounded by
areas with significant different values of the GDP indicator. For other units local Moran’s Ii
was statistically insignificant.
5. CONCLUSION
The research on economic growth showed that in the analyzed period there were no significant
shifts in the rankings of the economies of selected EU countries. However, the obtained results
should be treated with distance due to the world economic crisis in 2008, which undoubtedly
disrupted a number of initiated processes, postponing or even eliminating the expected effects.
The spatial analyzes of economic growth showed the existence of global and local spatial
autocorrelation. This means the existence of spatial dependencies of the studied variable within
the entire area, but also in relation to neighboring locations. The observed autocorrelation was
positive, but it was not too strong and was at a similar level throughout the period under
consideration. The formation of clusters of similar values observed during the classification of
regions according to the level of economic growth (Fig. 2) can be observed again by examining
the spatial autocorrelation. The study of local Moran statistics in individual years distinguished
clusters of regions and atypical areas adjacent to regions with different values of the GDP per
capita indicator.

63rd International Scientific Conference on Economic and Social Development – "Building Resilient Society" - Zagreb, 11-12 December, 2020
223
The analysis of economic growth with the use of spatial statistics can therefore support the
identification of areas that are characterized by similar or different values, which enables the
monitoring and control of the phenomenon. Moreover, such an analysis may support the
implementation of projects aimed at maintaining positive phenomena and counteracting
possible undesirable trends.
LITERATURE:
1. Anselin, L. (1995). Local Indicators of Spatial Association – LISA. Geographical Analysis,
Vol. 27, 93–115.
2. Arbia, G. (2005). Spatial Econometrics: Statistical Foundations and Applications to
Regional Growth Convergence. New York: Springer.
3. Begg, D., Fischer, S., Dornbusch, R. (2007). Makroekonomia. Warszawa: PWE.
4. Bivand, R. (1980). Autokorelacja przestrzenna a metody analizy statystycznej w geografii.
[in]: Chojnicki, Z. (ed) Analiza regresji geografii. Poznań: PWN, 23-38.
5. Bogdański, M. (2010). Urban Determinants of Polarisation of Economic Development in
Poland. Olsztyn Economic Journal, 5(2), 269-279.
6. Cliff, A., Ord, J.K. (1970). Spatial Autocorrelation: A Review of Existing and New
Measures with Applications. Economic Geography, Vol. 46, 269-292.
7. Griffith, D.A. (2003). Spatial Autocorrelations and Spatial Filtering. Berlin-Heidelberg:
Springer.
8. Kopczewska, K. (2011). Ekonometria i statystyka przestrzenna z wykorzystaniem programu
R Cran. Warszawa: CeDeWu.
9. Kuc, M. (2012). The implementation of synthetic variable for constructing the standard of
living measure in European Union countries. Oeconomia Copernicana, no. 3, 5-19.
10. Marciniak, S. (1997). Innowacje i rozwój gospodarczy. Warszawa: PWN.
11. Mastalerz-Kodzis, A., Pospiech, E.(2016). Dynamic and spatial analysis of economic and
labour market characteristics in European countries. [in]: Kocourek, A., Vavrousek, M.
(eds.) Proceedings of 34th International Conference Mathematical Methods in Economics,
Liberec, Czech Republic, 546-551
12. Moran, P. A. P. (1950). Notes on Continuous Stochastic Phenomena. Biometrika 37 (1),
17–23.
13. Nazarczuk, J. M. (2015). Zróżnicowania regionalne w Unii Europejskiej. Weryfikacja
hipotezy Williamsona. Optimum. Studia Ekonomiczne nr 4 (76), 43-53.
14. Samuelson, P., Nordhaus W. (2012). Ekonomia.Poznań: Dom Wydawniczy REBIS.
15. Suchecki, B. (ed.) (2010). Ekonometria przestrzenna. Metody i modele analizy danych
przestrzennych. Warszawa: C.H. Beck.
16. Wolny-Dominiak, A., Zeug-Żebro, K. (2012). Spatial statistics in the analysis of county
budget incomes in Poland with the R CRAN, [in]: Ramik J., Stavárek D. (eds.) Proceedings
of 30th International Conference Mathematical Methods in Economics. Karviná, Czech
Republic, 992-998.
17. Zeliaś, A. (ed.) (2000). Taksonomiczna analiza przestrzennego zróżnicowania poziomu
życia w Polsce w ujęciu dynamicznym. Kraków: Wydawnictwo Akademii Ekonomicznej.
18. [www 1] Eurostat. Retrieved: 02.11.2020 from https://bdl.stat.gov.pl/BDL/dane.

63rd International Scientific Conference on Economic and Social Development – "Building Resilient Society" - Zagreb, 11-12 December, 2020
224
DEVELOPMENT OF THE SMALL AND MEDIUM- SIZED BUSINESS
SECTOR IN RUSSIA THROUGH PARTICIPATION IN PUBLIC-
PRIVATE PARTNERSHIP PROJECTS
Sofia Lyubyashenko
Novosibirsk State University of Economics and Management,
Russian Federation
Gennady Lyaskin
Novosibirsk State University of Economics and Management,
Russian Federation
ABSTRACT
The relevance of the research topic is due to the need to attract private capital to the state and
municipal sectors of the Russian economy. World experience indicates that public-private
partnership (PPP) mechanisms contribute to the development of entrepreneurship and increase
the sustainability of economic development in the regions. Involving small and medium-sized
businesses in the implementation of PPP projects is especially important for single-industry
territories, which are more at risk of deterioration of socio-economic situation than others. In
the context of the economic crisis, the issue of increasing the efficiency of interaction between
the state and business is becoming extremely urgent for all parties. The article describes the
features of single-industry towns, substantiates the importance of implementing PPP projects
on their territory, outlines the promising areas for the implementation of PPPs involving small
businesses.
Keywords: small and medium-sized businesses, public-private partnerships, regional
sustainability, government support
1. INTRODUCTION
The involvement of private capital in the state and municipal sectors of the Russian economy
is a very urgent issue today. The need to attract small and medium-sized businesses in public-
private partnership (PPP) projects has long been ripe. However, in Russia today, only large
infrastructure projects are mostly implemented through PРРs, due to their complex format.
Successful promotion of a PPP project requires a relatively expensive legal and financial study,
close interaction between business and government, which is quite difficult for small and
medium-sized enterprises. This sector of the Russian economy has always needed the support
of the State. To this end, small business support programs have been developed at all levels of
government. They are aimed at increasing the number of such enterprises, exports and
developing innovative activities, and reducing unemployment in the regions. Small business
development is particularly relevant for single-industry towns. There are 319 single-industry
towns in Russia. Such territories, as a rule, have typical problems: lack of a diversified labor
market, poorly developed social sphere, low mobility of the population, highly specialized city
economy. In the context of the economic crisis, state support measures and the development of
the small and medium-sized enterprise sector are becoming extremely relevant. It is necessary
to identify the most popular and promising of them. Along with such programs, PPP tools can
be considered as a way to support existing enterprises and promote the integrated development
of mono-focus areas, which is especially important for the recovery of the regional economy
from the epidemic.

63rd International Scientific Conference on Economic and Social Development – "Building Resilient Society" - Zagreb, 11-12 December, 2020
225
2. ESSENCE AND CHARACTERISTICS OF SINGLE-INDUSTRY TOWNS IN
RUSSIA
The main document defining the status of single-industry towns in Russian Federation is the
Resolution of the Russian Government of 29.07.2014 № 709 [10]. It is this text that legislates
the criteria for classifying a settlement as single-industry towns, and hence its definition. А
single-industry city is a municipality of the Russian Federation that meets all the criteria shown
in figure 1 at the same time .
Figure 1: Criteria for determining single-industry towns in Russia
In addition, the Government of the Russian Federation annually approves the list of such single-
industry towns - Order of the Government of the Russian Federation of 29.07. 2014 N 1398
“On the list of single-industry municipalities of the Russian Federation (single-industry towns)”
[10]. They have the following characteristics.
• Poorly diversified economies, as a result of the dominance of one industry. The rest are
poorly developed, or the share of the employed population in them is negligible. As a rule,
they are represented by the service sector, or by manufacturing small enterprises serving
the city-forming enterprise.
• High dependence of budget revenues on the activities of the city-forming enterprise or the
development of the industry in which it operates. Other sources of tax revenues to the local
budget are not more than 10% -20%.
• Occupational uniformity of the local population. This is due to the narrow specialization of
educational institutions located on the territory of the city to teach specific skills related to
servicing the dominant industry of the city.
• Infrastructure development in single-industry territories lags far behind other cities.
• High transport costs due to the geographical location of cities - a considerable distance from
other settlements - make the municipality an economically closed system and impede the
development of local commodity markets.

63rd International Scientific Conference on Economic and Social Development – "Building Resilient Society" - Zagreb, 11-12 December, 2020
226
• The unfavorable climatic conditions of many single-industry territories impede the
development of certain sectors of the economy, for example, agriculture.
• The labor market is poorly developed, since the share of small and medium enterprises is
insignificant, and the population structure has regressive features. As a result of youth
migration, the proportion of the working-age population is declining in many cities.
Тhe Resolution of the Russian Government N 709 contains a classification of single-industry
towns - according to the risks of their socio-economic development. They are divided into three
categories [10]:
• Category 1 (with the most difficult socio-economic situation).
• This includes cities with the highest risks of socio-economic development, which cannot do
without state support. To classify a territory in this category, you must meet two of the
several criteria of disadvantage:
- high probability of stopping the activity of the city-forming enterprise, planned
dismissal of more than 10% of its employees.
- the unemployment rate in the city is 2 times higher than in the country;
- the industry to which the city-forming enterprise belongs is assessed as unfavorable;
- the city has an unfavorable socio-economic situation.
• Category 2 (with risks of socio-economic deterioration).
• It includes territories where it is planned to lay off more than 3% of employees of the city-
forming enterprise or where the unemployment rate is higher than the average in Russia.
• Category 3 (with stable socio-economic status). These are cities that belong to the category
of single-industry, but the socio-economic situation and unemployment rate in them are not
lower than the average level. The planned percentage of reduction in the average number
of employees is 3% or less.
Thus, the Government of the Russian Federation, when determining single-industry towns of
various categories, applies the sustainability criteria of a city-forming enterprise, analyzes the
labor market and the level of employment, the risks and the specialization industry of a single-
industry city, to identify those that are at the highest risk of decline. In Russia, a new program
"Integrated development of single-industry towns" has been developed, the purpose of which
is to reduce the dependence of single-industry territories on the city-forming enterprises
activities. 57.3 billion budget funds are planned for its implementation. The previous program
for the period 2016-2025 was considered ineffective and closed ahead of schedule. It has
created 312,000 jobs and increased investment in fixed assets to 1.8 trillion rubles. In 19 single-
industry towns, 42 infrastructure facilities were put into operation for a total of 7 billion rubles,
and 222 residents registered in 63 established territories of advanced development. However,
this is not enough to ensure the sustainability of the economy of single-industry towns. During
the economic crisis caused by the pandemic, single-industry towns are at the highest risk,
because they are the least adapted to solve problems independently and their entire life is built
around a core enterprise. They are usually severely limited in their social and economic
development opportunities. Small businesses survival in such conditions is one of the key tasks
of the state and local governments, since this sector creates additional jobs and contributes to
the employment of the population.
3. STATE SUPPORT FOR SMALL AND MEDIUM-SIZED BUSINESSES IN SINGLE-
INDUSTRY TOWNS
In recent years, the list of Federal programs for support small and medium-sized enterprises in
single-industry towns has increased, but the actual amount of funding from the Federal budget
has been steadily decreasing since 2015.

63rd International Scientific Conference on Economic and Social Development – "Building Resilient Society" - Zagreb, 11-12 December, 2020
227
Article 3 of the Federal law "On the development of small and medium-sized businesses in the
Russian Federation" of 24.07.2007 N 209 refers to business entities (legal entities and
individual entrepreneurs) that are included in the unified state register of legal entities and
comply with the conditions indicated in Law N 209. Such enterprises may receive state support.
The forms of such support include: consulting, educational, property, financial, informational,
infrastructural. Small enterprises operate traditionally in the services and trade sectors.
Medium-sized enterprises are more represented in areas with higher added value - in
manufacturing, construction, and agriculture. To date, Russia has formed a regulatory and
institutional framework for state support of this sector. A Government Commission on
Competition and Development of Small and Medium Enterprises has been created. A number
of large-scale financial support programs are being implemented, under which entrepreneurs in
all regions of the country are able to receive relatively cheap loans, subsidies for reimbursing
the costs of doing business, loan guarantees or loans on concessional terms. For small
enterprises, the state has provided special tax regimes. The state made attempts to facilitate the
access of small businesses to the procurement of goods, work, services for state and municipal
needs, as well as for the needs of companies with state participation, setting quotas for the
implementation of these purchases. The Law on the contract system in the field of public
procurement has been amended to oblige state and municipal unitary enterprises to make
purchases from small and medium-sized businesses. A network of organizations has been
created in the regions that form the infrastructure of information, consulting and property
support for small businesses. In 2015, the State Institute for the Development of Small and
Medium Enterprises was established - the joint-stock company Federal Corporation for the
Development of Small and Medium Enterprises (hereinafter - the Corporation). Despite this,
the contribution of small and medium-sized businesses to the overall economic indicators in the
Russian Federation is significantly lower than in most developed and developing countries. In
Russia, small businesses are primarily micro-businesses (95.5% of the total number of small
and medium-sized firms) [12]. The number of medium-sized enterprises is relatively small.
Small and medium-sized enterprises account for only 5-6% of the total volume of fixed assets
and 6-7% of investment in fixed assets in the country as a whole [12]. Labor productivity in
this sector lags behind the level of developed countries (the United States, Japan, and the
European Union) by 2-3 times. Starting in 2014 we are seeing a negative trend of development
of small and medium enterprises to such indicators as: turnover in the economy as a whole, the
volume of exports (25-35%), the volume of investments, introduction of innovations. In some
developing countries, the contribution of small and medium-sized enterprises to the export of
products is even higher - in South Korea-about 40%, in China-more than 50% [12]. Statistical
data show uneven development of small businesses in the Russian Federation. Low effective
demand and a weak level of business infrastructure development in single-industry townsthat
are remote from administrative centers significantly hinder the development of this sector of
the economy. The list of measures of state support for small businesses is quite wide and
universal for all regions of the Russian Federation, but it is not always effective. One of the
areas of state support is the development of social entrepreneurship. Programs of financial
support for industrial enterprises have a weak legal background, are designed mainly for
medium-sized businesses, and therefore were not implemented in the planned volume in many
regions before the outbreak of the epidemic. A typical problem in single-industry towns is the
inability to receive subsidies due to non-compliance with the program criteria. It can be
assumed that the low effectiveness of existing measures of state support for small businesses in
single-industry towns is caused by their universality. It is necessary to develop a program for
the development of this sector of the economy for such territories, taking into account their
specifics, categories and problems. To achieve a sustainable result, it is important to consolidate
the efforts of the government, entrepreneurs and public organizations and involve residents in

63rd International Scientific Conference on Economic and Social Development – "Building Resilient Society" - Zagreb, 11-12 December, 2020
228
the development of the local economy and social sphere. Improving the efficiency of small and
medium-sized businesses in Russia's industrial sectors is possible through their involvement in
PPP projects. Currently, there is no complete system of views and conceptual provisions on the
role of public-private partnership in the economy of single-industry territories, its functions and
mechanisms of influence on the development of the small and medium-sized business sector
are not defined.
4. LEGAL FRAMEWORK AND FIELDS OF PPP IMPLEMENTATION IN RUSSIA
The Municipal PPP Institute was first legislated with the Federal Act of 13.07.2015 N 224
"Public-private partnership, municipal-private partnership in the Russian Federation and
amendments to individual legislative acts of the Russian Federation" [11]. The Act considers
this institution as a legal agreement for a fixed period and based on the pooling of resources,
the sharing of risks, cooperation of the public (in this case the municipality) and private partners
in order to attract private investment to the economy of municipalities, to ensure that local
governments have access to and improve the quality of goods, works, services for solving local
issues. The main difference between municipal PPP and PPP is project scale. As a rule, the
State participates in the implementation of major PPP projects with the aim of developing
branches of the economy or regions. Municipalities, when dealing with local issues, implement
smaller projects. These differences do not change the principles of project preparation and
execution, but rather the choice of the forms and models. The development of municipal PPPs
is based on the provisions of civil law, legislative acts regulating economic relations and the
participation of public authorities in economic relations, Fiscal legislation and sectoral
legislation. The main legal and institutional forms of PPPs are:
1) Concessions;
2) Public-private partnership based on leases of property in State or municipal ownership,
including a "lease with an investment component";
3) Investment treaties (agreements);
4) Participation in capital;
5) Mixed forms.
The first three forms are the most common. The main normative acts regulating the
organizational and legal forms of public-private partnerships are presented in figure 2.
Figure following on the next page

63rd International Scientific Conference on Economic and Social Development – "Building Resilient Society" - Zagreb, 11-12 December, 2020
229
Figure 2: Legal forms of public-private partnerships in Russia
Projects of municipal-private partnership are most common in the construction and
reconstruction of infrastructure (road construction) and social services (health care, education,
housing and communal services, physical education and sports). The specifics of
municipalities, their geographical location, and climate conditions largely determine the
success of projects. Objectively, some of them are most favorable for the development of
entrepreneurship, while others are unfavorable. Towns have a number of advantages for
business development. These include:
• detailed understanding of specific problems of small business.
• evidence of the needs and requests of the population in determining the priority directions
of small business development.
• the authority of municipal leaders and the popularity of local entrepreneurs among the
population.
However, small municipalities have insufficient economic resources, low qualifications of
municipal employees, poor infrastructure development. Of course, large cities have more
opportunities to implement relatively large-scale projects through a stable financial base, high
qualifications of municipal employees, flexible spatial localization of projects. Thus, the
possibility of successfully implementing municipal PPPs to address local issues increases
significantly in large municipalities, but risks also increase. According to the Ministry of
economic development, 94% of all concession agreements are implemented at the municipal
level, 5% at the regional level, and 1% at the Federal level (Figure 3).
Figure following on the next page

63rd International Scientific Conference on Economic and Social Development – "Building Resilient Society" - Zagreb, 11-12 December, 2020
230
Figure 3: Allocation of concession agreements by level of authority, 2019
Figure 4: Аllocation of investments in concession agreements, 2019
Figure 4 shows the allocation of investments in concession agreements. Most of the investments
are made at the federal level, 25% at the municipal level and 33% at the regional level.
5. DYNAMICS OF INVESTMENTS IN PPP PROJECTS IN RUSSIA
According to the Ministry of economic development in Russia, at the beginning of 2020, there
were about 3,100 active or completed concession agreements in Russia. The total amount of
investment obligations is more than 1.7 trillion rubles. Extra-budgetary investments amount to
1.2 trillion rubles (70%), and 0.5 trillion rubles are state funds [1]. According to the Ministry’s
experts, the data indicated a lack of investment in infrastructure through PPP contracts.
Investment commitments under the concession agreements reached amount to about 1.6 per
cent of GDP for 2019. In the UK, for example, investment in PPP projects is at least 6.6% of
GDP, and in Canada 8.1%. To date, almost all regions have used PPP mechanisms to attract
investment, but only 10 of them have signed 100 or more concession agreements, taking into
account municipal concessions. The number of agreements with investments of more than 10
billion rubles is only 32. On average, about 500 new agreements with investment volume of
about 280 billion rubles are concluded annually in Russia.
94%
5%1%
Municipal level
Regional level
Federal level
25%
33%
42%Municipal level
Regional level
Federal level

63rd International Scientific Conference on Economic and Social Development – "Building Resilient Society" - Zagreb, 11-12 December, 2020
231
At this rate, Russia will not reach the British level of investment in concessions for the
foreseeable future. Today, the PPP market is large. Financial resources exceed the number of
projects required.
Figure 5: Allocation of concession agreements by field of activity in 2019, in %
The majority of concession agreements are in the utilities (electricity, gas and water) (90%),
7% are in the social sphere and 3 % are in the transport sector. Despite a small percentage,
transport concessions represent the largest total investment, accounting for 70 % of the funds.
These are mainly road infrastructure projects. Most agreements (94%) have been concluded at
the municipal level. These are public utilities. However, the largest investments (42%) are in
federal concessions, 96% of which are in transport infrastructure[1]. The most important
projects to date are the construction of the railway line «Obskaya - Salehard - Nadym» in the
Yamal-Nenets Autonomous District (total investment - 130 billion rubles), and the creation of
the railway line «Elegest - Kyzyl - Kuragino» in Tuva and Krasnoyarsk Krai (127 billion
rubles). The Ministry of Economic Development has ranked Russia’s regions by the level of
PPP development. Each indicator was defined as the weighted average of three factors: the
experience of implementing PPP projects in the entity, the development of the institutional
environment in PPPs, and the regulatory framework in this area. The leaders of the rating were
Samara Region, Moscow and Moscow Region (98 points). They are followed by Nizhny
Novgorod Region (96.9 points) and Perm Territory (95.8 points). The worst developed PPPs
are in Republic of North Ossetia – Alania (6.7), Ingushetia (7.5), Bryansk (11.3), Karachayevo-
Circassian Republic (14,7) and Tver Region (15.6). The potential of PPPs in Russia remains
untapped. The main problem is the lack of a mechanism to share responsibility among project
participants. A compromise solution must be found.
6. PROBLEMS OF INVOLVING SMALL AND MEDIUM BUSINESSES IN PPP
PROJECTS
Implementation of infrastructure projects involving small and medium-sized businesses can be
considered as the most popular and promising area for PPP. To date, small and medium-sized
businesses have been assigned a modest role in the implementation of large projects as a
subcontractor. A typical scheme of interaction between all participants is as follows: the
concessionaire enters into a contract with a large enterprise - the General contractor, which, in
turn, enters into many contracts with subcontractors to perform construction and installation
work, develop design and estimate documentation or perform service functions.
7%
3%
90%
Social sphere
Transport
Utilities (electricity, gas andwater),

63rd International Scientific Conference on Economic and Social Development – "Building Resilient Society" - Zagreb, 11-12 December, 2020
232
Thus, small business today is excluded from interaction with government structures and from
detailed project development, its interests are not taken into account by any party. In order to
increase business activity in the region, it is necessary to attract small businesses to participate
in megaprojects by integrating them into the technological and production chain. Currently, the
state provides assistance to small and medium-sized businesses in the implementation of social
projects. This area is promising for the development of PPP and municipal-private partnership.
Investing in socially significant objects has its own specifics. When investing in the social
sphere, the state should act as a guarantor of repayment. Accordingly, risk-sharing mechanisms
should be included in cases of incorrect assessment of the population's ability to pay. And if the
project for objective reasons (subject to the requirements for the quality and cost of services) is
not provided with a demand sufficient for the effective work of the private party, the authorities
within the partnership should provide support. At the first stage, this may be a reduction in
prices for the service, in which the state participates financially in partial reimbursement of
investments. However, despite the fact that such a partnership would be beneficial for everyone,
such mechanisms are not yet developed in Russia. The term "socially significant objects" should
be understood in the broadest sense. In addition to social facilities such as schools, hospitals,
and kindergartens, these may include energy, communications, and road infrastructure. When
implementing social projects, there is a problem of attracting investment at the expense of
financial organizations. It is not profitable for banks and other investors to participate in small
projects from small businesses. To solve this problem, we can offer a mechanism for
cooperation between them for the purpose of joint implementation of the project. It is still quite
widespread in agriculture. Its application can reduce risks and increase investment
attractiveness using the cluster approach. Examples of such cooperation can be found in the
regions of Russia. For example, in the Rostov region, a comprehensive project was
implemented to create a network of private kindergartens, which were joined by developing
children's centers and service enterprises. In this case, the project amount increased from 28 to
150 million rubles, which is the Bank's interest. Thus, it is necessary to make the PPP and
municipal-private partnership format applicable for small and medium-sized businesses. The
potential benefits of all participants in a municipal-private partnership are associated with the
emergence of potential risks.
Figure following on the next page

63rd International Scientific Conference on Economic and Social Development – "Building Resilient Society" - Zagreb, 11-12 December, 2020
233
Figure 6: Potential risks of participants in a municipal-private partnership
Local authorities are restricted by law in the implementation of municipal projects aimed at the
development of the municipal sphere, with the involvement of private investors. So, according
to the Federal law of 27.07.2010 N 190 "Аbout heat supply" and the Federal law of 7.12.2011
N 416 "Аbout water supply and water disposal" the rights of ownership and use of objects in
municipal ownership must be transferred only under concession agreements providing for the
creation or reconstruction of property. However, delays in the conclusion of concessions in this
area, lack of financial resources due to the high cost of such projects, and low interest of private
investors hinder the development of partnership between municipalities and businesses. Solving
the problem of attractiveness of PPP projects at the municipal level is possible by reducing
administrative barriers.
7. CONCLUSIONS
The regulatory and organizational framework created in Russia allows us to implement a
comprehensive approach to the development of small and medium-sized businesses. Taking
into account the economic crisis, the reduction of municipal budget revenues, and the solution
of local problems with the involvement of private investors can be considered as one of the
promising areas of activity of state authorities and local self-government. The use of PPP and
municipal private partnership mechanisms can increase the participation of small and medium-
sized businesses in the country's economy, the degree of their penetration into socially
important sectors, as well as the level of cooperation with large enterprises. To achieve these
goals, it is necessary to review the priorities of supporting small and medium-sized businesses
in the allocation of budget funds, which is especially important for the recovery of industries in
single-industry towns after the pandemic. The development of unified schemes and algorithms
for providing assistance to small and medium-sized businesses can optimize the process of
selecting and" replicating " promising and successful projects, taking into account the strategies
and programs of economic development of municipalities and the state.

63rd International Scientific Conference on Economic and Social Development – "Building Resilient Society" - Zagreb, 11-12 December, 2020
234
LITERATURE:
1. Galcheva, A. The authorities for the first time disclosed the scope of agreements under the
PPP. Economy. RBC. February 25, 2020. Retrieved 26.02.2020 from
https://www.rbc.ru/economics/25/02/2020/5e4fcdf89a7947decf57ae33
2. Lyubyashenko, S. N. (2019). Methodological aspects of assessing the market structure:
concentration and efficiency. Economic and Social Development 49th International
Scientific Conference on Economic and Social Development. Development – "Building
Resilient Society" Book of Proceedings Zagreb, 468-475. Retrieved 20.01.2020 from
https://www.esdconference.com/upload/book_of_proceedings/Book_of_Proceedings_esd
Zagreb2019_Online.pdf
3. Lyubyashenko, S. N. (2020). Enterprise Integration and Market performance results.
Economic and Social Development. 51st International Scientific Conference on Economic
and Social Development Development. Book of Proceedings Rabat, 312-320. Retrieved
05.04.2020 from
file:///C:/Users/Sony/Downloads/Book_of_Proceedings_esdRabat2020_Online%20(1).pdf
4. Lyubyashenko, S, Gennady Lyaskin, G. Antimonopoly policy and development of
competition in the Russian Federation. 52st International Scientific Conference on
Economic and Social Development Development. Book of Proceedings , Porto, 16-17 April
2020
5. Lyaskin G.G.(2015). History of Economic Thought. The module-problem course /
Novosibirsk, 2015.
6. Tatarenko V.I., Lyaskin G.G. (2012). World Economy and International Economic
Relations. Novosibirsk, 2012.
7. Lyaskin G.G. Shabashev V.A. (2016). Approaches to characterization of the role of the
monopsony on the labour market: regional aspect . The module-problem course /
Novosibirsk. 2013. Herald of Omsk University. № 2. pp. 169-179.
8. Lyaskin G.G. (2018) Notion of monopsony: from classic to contemporary interpretation.
Siberian Financial School. №4. pp. 52-56
9. Resolution of the Russian Government of 29.07.2014 No. 709, accessed February 27,2017,
http://government.ru/docs/all/92333/.
10. Resolution of the Russian Government of 29.07.2014 No. 1398-r, accessed February
27,2017, http://government.ru/media/files/41d4f68fb74d798eae71.pdf.
11. Federal Act of 13.07.2015 N 224 "Public-private partnership, municipal-private partnership
in the Russian Federation and amendments to individual legislative acts of the Russian
Federation"
12. Resolution of the Russian Government of the Russian Federation from 02.06.2016 N 1083-
R "The strategy for the development of small and medium-sized businesses in the Russian
Federation for the period up to 2030: [Electronic resource]// http://www.consultant.ru/
document/cons_doc_LAW_199462/15717279f1d8017f1d751059780fba5b9b917b08/

63rd International Scientific Conference on Economic and Social Development – "Building Resilient Society" - Zagreb, 11-12 December, 2020
235
MANAGING THE FLOW OF GOODS IN POLISH-CHINESE
BILATERAL TRADE DURING COVID-19 PANDEMIC - THE
ANALYSIS OF PROBLEMS FROM THE PERSPECTIVE OF FREIGHT
FORWARDERS
Magdalena Klopott
Gdynia Maritime University, Poland
ABSTRACT
The spread of coronavirus has disrupted the movement of goods worldwide. In particular, the
Chinese lockdown measures have had supply chain implications for many Western countries,
including Poland. In the midst of this chaos, freight forwarders who are responsible for
organizing transport and facilitating the flow of goods were found themselves on the front lines.
Therefore, the aim of this article is to identify problems encountered by freight forwarders at
the time of the coronavirus pandemic outbreak and for the following months. The analysis was
conducted using a survey questionnaire and was limited to international freight forwarders that
service the international trade between Poland and China and are located in Pomerania in
Poland. The article starts with a glance at the international trade between Poland and China.
Next, ripple effects of pandemic on maritime containerised transport was briefly described. The
main part of the article is the presentation of the research results and their discussion. The
article reveals, that COVID-19 has placed unprecedented stress on the freight forwarders
activity and highlights certain limitations in the containerized trade that affected their
operations. Apart of the decline in turnover and thus in revenues, the inefficiencies in
communication systems among freight forwarders, ocean carriers and terminals, as well as
enormous delays unseen on such a scale were indicated among the most acute problems
encountered by freight forwarders. The article also showed how vital are international freight
services for ensuring the continuity of supply chains.
Keywords: coronavirus disruption, supply chain, freight forwarders problems, COVID-19,
containerised shipping
1. INTRODUCTION
At the beginning of 2020, a lot of measures were put in place in countries attacked by SARS-
COV-2 virus in order to prevent or slow the spread of the new disease COVID-19. These
measures have come as shock on all stages of the supply chains, but it did not equally affect
different parties of the chains (OECD, 2020), as well as countries itself. In particular, the
Chinese lockdown measures have had supply chain implications for many Western countries,
due to the importance of China in their international trade of goods. Moreover, it should be also
remembered, that Wuhan (the city where the novel coronavirus broke out) is a home for many
factories that serves many of the world’s supply chains. Among those factories are the
American beverage corporation PepsiCo, German conglomerate Siemens, nine different car
factories (e.g. French Peugeot Citroen), Chinese smartphone maker Xiaomi and many, many
others. (LogisticsInsights, 2020) As a result, the lockdown imposed by Chinese government
(Wuhan and its surroundings were completely closed), severely impacted numerous industries
in the global economy. Considering the importance of China in the international trade of Poland,
being responsible for as much as about 12 percent of Polish import, these turbulences also
influenced the Polish market and flow of containerized goods from/to China. In the midst of
this chaos, freight forwarders who are responsible for organizing transport and facilitating the
flow of goods were found themselves on the front lines. Therefore, it seemed reasonable to
research what kind of problems freight forwarders encountered during the outbreak of the
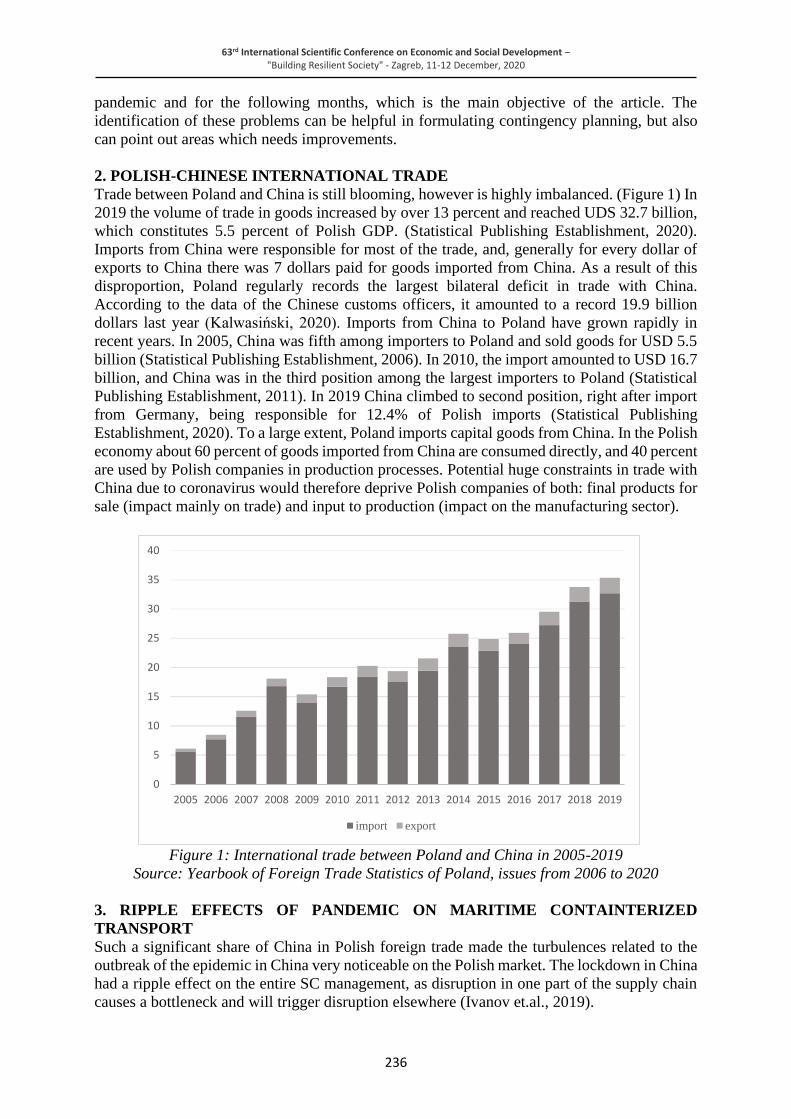
63rd International Scientific Conference on Economic and Social Development – "Building Resilient Society" - Zagreb, 11-12 December, 2020
236
pandemic and for the following months, which is the main objective of the article. The
identification of these problems can be helpful in formulating contingency planning, but also
can point out areas which needs improvements.
2. POLISH-CHINESE INTERNATIONAL TRADE
Trade between Poland and China is still blooming, however is highly imbalanced. (Figure 1) In
2019 the volume of trade in goods increased by over 13 percent and reached UDS 32.7 billion,
which constitutes 5.5 percent of Polish GDP. (Statistical Publishing Establishment, 2020).
Imports from China were responsible for most of the trade, and, generally for every dollar of
exports to China there was 7 dollars paid for goods imported from China. As a result of this
disproportion, Poland regularly records the largest bilateral deficit in trade with China.
According to the data of the Chinese customs officers, it amounted to a record 19.9 billion
dollars last year (Kalwasiński, 2020). Imports from China to Poland have grown rapidly in
recent years. In 2005, China was fifth among importers to Poland and sold goods for USD 5.5
billion (Statistical Publishing Establishment, 2006). In 2010, the import amounted to USD 16.7
billion, and China was in the third position among the largest importers to Poland (Statistical
Publishing Establishment, 2011). In 2019 China climbed to second position, right after import
from Germany, being responsible for 12.4% of Polish imports (Statistical Publishing
Establishment, 2020). To a large extent, Poland imports capital goods from China. In the Polish
economy about 60 percent of goods imported from China are consumed directly, and 40 percent
are used by Polish companies in production processes. Potential huge constraints in trade with
China due to coronavirus would therefore deprive Polish companies of both: final products for
sale (impact mainly on trade) and input to production (impact on the manufacturing sector).
Figure 1: International trade between Poland and China in 2005-2019
Source: Yearbook of Foreign Trade Statistics of Poland, issues from 2006 to 2020
3. RIPPLE EFFECTS OF PANDEMIC ON MARITIME CONTAINTERIZED
TRANSPORT
Such a significant share of China in Polish foreign trade made the turbulences related to the
outbreak of the epidemic in China very noticeable on the Polish market. The lockdown in China
had a ripple effect on the entire SC management, as disruption in one part of the supply chain
causes a bottleneck and will trigger disruption elsewhere (Ivanov et.al., 2019).
0
5
10
15
20
25
30
35
40
2005 2006 2007 2008 2009 2010 2011 2012 2013 2014 2015 2016 2017 2018 2019
import export

63rd International Scientific Conference on Economic and Social Development – "Building Resilient Society" - Zagreb, 11-12 December, 2020
237
A lot of disruption generated by lockdown measures affected maritime containerized transport.
First, the coronavirus outbreak has severely impacted some of the Chinese ports like Shanghai,
Ningbo, Xingang, Shenzhen or Yantian (Kelly, 2020), belonging to the top 10 container ports
in the world. As maritime container supply chains include physical, clerical and data entry
processes, the human element is still crucial in performing those chains. Also, physical cargo
packing operations and cargo consolidations inherently involve human interaction. The
obligatory quarantine for people resulted in, among others: (Klopott, 2020)
• the scarcity of terminal, clerical and port workers,
• changes in terminal work organization,
• the slowdown in the clearance of exports and imports,
• deferring or delaying receipt of containers after clearance by some consignees,
• delaying in cargo consolidations and delivering LCL containers to the port of loading
• the shortage of truck drivers.
All these, together with restricted access to roads and enormous backups at storage facilities
were among factors that triggered huge congestions in Chinese container ports. This, in turn,
triggered a certain decision of shipping lines, that had acute effects on the performance of FF
and their clients. Ocean carriers addressed the port congestion problem in a similar way by:
• diverting the cargo to a different port or even ship it back to the port of loading,
• discharging a container at an intermediate or alternative port without the consent of the
merchant, where the goods could be stored ashore or afloat until it is possible to forward
them to the designated port of discharge (such a right is given by a Bill of Lading)
• introducing a really high Port Congestion Surcharge (PCS) per every container as an
additional fee to the basic freight rate.
Port congestions, however, have not been the only gripe of freight forwarders, as at the same
time many shipping lines announced changes in their liner schedules and services connecting
China with other major seaports in Europe. Simply, they introduced so called blank sailings
(void sailings) that usually refers to a sailing bypassing one or more specific ports on the route,
and/or reduction of the number of vessels on the routes, and/or skipping one particular voyage
of one vessel. According to data provided by Ocean Insights (2020) the number of blank sailing
announcements between mid-March until the end of April 2020 reached as much as 386. In
numbers, these cancellations in the trans-Pacific routes amounted to the equivalent of 198,500
TEUs, and to 151,000 TEUs between Europe and Asia. (Moss, 2020) Moreover, ocean lines
have also started to adjust the vessels’ capacity i.e. they started to substitute container vessels
of huge capacity (about 18-24 thousands of TEUs) with those of two or three times smaller
capacity (Klopott, 2020). Freight forwarders were among many parties in supply chains
grappling with these logistical disturbances. As their role is to facilitate the movements of goods
worldwide, they are generally used to work in uncertain environment. However, this pandemic
brought unseen turbulences to their everyday work, and consequently to their customers’
businesses, especially those involved in Polish- Chinese bilateral trade.
4. RESEARCH FINDINGS AND DISCUSSION
In order to achieve the goal stated in the introduction, a survey questionnaire was distributed
among the freight forwarders located in Pomeranian district, Poland. The questionnaire was
sent via the LinkedIn platform in order to obtain a higher response rate and was available from
20 to 30 of August 2020. For the same reason, the number of questions was limited to six, and
there was a place for commentary in each question. Two question (5 and 6) remained open-
ended. 67 freight forwarders responded to the survey (i.e. about 69% of those located in
Pomerania), most of which come from the port cities of Gdynia and Gdansk (80%).

63rd International Scientific Conference on Economic and Social Development – "Building Resilient Society" - Zagreb, 11-12 December, 2020
238
All respondents admitted that their business portfolio includes customers who trade with China.
However, the freight forwarding service of these clients accounts for a diversified share in the
overall turnover of the company. The number of respondents whose business mostly rely on
handling imports and exports from/to China accounts for slightly more than 60%. Only for10%
of companies this kind of activity is not significant. (Figure 2) Majority of the freight forwarders
(49) mainly serve the imports.
Figure 2: The share of import/exports freight forwarding from/to China in the overall
business activity of respondents
Source: own elaboration
Majority of survey takers (65%) admitted that their operations had been severely or
significantly affected. 35% of them have been moderately or slightly affected. (Figure 3) The
level of disruptions in freight forwarding business caused by the COVID-19 pandemic was not
heterogenous, and, generally, the greater the share of customers involved in trade with China,
the more noticeable and severe was the impact on freight forwarder performance.
Figure 3: The extent to which freight forwarders have been affected by the COVID-19
pandemic.
Source: own elaboration
significant
share
11%
large share
51%
moderate
share
28%
modest
share
10%
severly
affected
16%
significantly
affected
49%
moderately
affected
21%
slightly
affected
14%

63rd International Scientific Conference on Economic and Social Development – "Building Resilient Society" - Zagreb, 11-12 December, 2020
239
However, this does not necessarily mean that freight forwarders, whose share of clients trading
with China do not constitute such a large part, experience the pandemic effect to a much lesser
extent. The influence of the organization's culture, company size, turnover, the degree of
connection with shipowners and other factors is not without significance here. The freight
forwarders were also asked to identify those customers most affected by the transport
disruptions, taking into account the type of cargo (commodity). It turned out that the most
affected group of customers were those whose production is based on components from China,
mainly focused on the automotive and electronic industries, as transport disruption had a ripple
effects on the whole production process. Another significantly affected group of customers
were those who traded food that required refrigeration and are transported in refrigerated
containers. In fact, the effects of the pandemic have been more pronounced for perishable food
logistics than those for dry cargo. In particular, congestion has detrimental effects on reefer
operation (Manaadiar, 2020), as it leads to a massive shortage of electrical plug points in the
ports to connect the reefer containers, that should be done immediately after discharge in order
to safeguard uninterrupted cold chain. Unfortunately, many shipping lines were unable to
discharge reefer containers at the designated ports because most reefer plugs were totally
utilized. It led to potential cargo deterioration and actual losses and damages to the perishable
cargo. The fourth questions in the questionnaire was open-ended. In this question freight
forwarders were asked to indicate problems they faced during the pandemic. Many of the
responses to this question were surprisingly long and detailed. Reading them carefully allowed
the identification of the most important problems which freight forwarders encountered during
the first wave of the pandemic. (Figure 4) All these troubles were among challenges that needed
to be answered immediately. Although freight forwarders are used to working in turbulent and
constantly changing conditions, they experienced huge operational disruptions that no one was
prepared for. They admitted that they had to deal with severe disruptions in the flow of goods
they had never experienced on such a scale and for so long time.
Figure 4: Major problems encountered by freight forwarders during the outbreak of
pandemic and thereafter until the mid- August 2020.
Source: own elaboration
0 10 20 30 40 50 60 70
lack of employees in offices; remotely working
additional, unexpected cost inccured by customers
shortage of reefer containers
problems with payments
lack of ships’ capacity for cargo
cargo losses or damage
lack of real time info
frequent last-minute cancellations of sailings
constantly changes in ocean freight rates
comunication problems (client-forwarder)
dalays in containters delivery to the port of loading
dalays in containers delivery to the port of destination
IT problems
comunication problems (freight forwarder-shipping line)
impact on revenues
volume decline
more workload

63rd International Scientific Conference on Economic and Social Development – "Building Resilient Society" - Zagreb, 11-12 December, 2020
240
As could be expected, the most frequent problems indicated by all respondents was the decline
in turnover, and thus in revenues. Almost all freight forwarders admitted that the organizational
turmoil in maritime transport caused by the pandemic has become the cause of increased
workload of all office workers. It was related to the requirements of customers (sometimes
unrealistic) who expected a quick solution to the problem, including finding an alternative mode
of transport. It was also extremely time-consuming, as they tried to keep their customers inform
of all problems experienced by other stakeholders in the given supply chain, such as resellers,
carriers, lines, agents and terminals. The respondents even described such days in which they
needed to work up to 20 hours. Unfortunately, not all customers have shown an understanding
of the problems, often due to a misunderstanding of complex organizational and legal issues in
the maritime container shipping. That is why so many freight forwarders (46%) indicate
communication with their customers among the main problems they encounter. The crisis has
also revealed a lot of inefficiencies in communication systems between freight forwarders and
ocean carriers and terminals, which only exacerbated the existing chaos. As much as 76% of
freight forwarders have complained about insufficient, inconsistent and non-coherent
information, as well as different and changing means of communication, even among the
alliance partners. They also pointed out confusions over whether a service was blanked or
suspended, and over sometimes different information, that came from alliance partners as to
when a loop would be reactivated. Moreover, they indicated the lack of uniform patterns in
cancellations between the alliances, that only added uncertainty to transport planning. Freight
forwarders emphasized that the ability to provide real-time information to others in the supply
chain has become paramount, as knowing of arrival times and container availability were more
important than ever. In addition to communication problems, the respondents expressed many
objections to ocean carriers. While in the initial period their decisions were understandable, as
everyone was equally surprised by the sudden outbreak of the pandemic and the lockdown in
China, the subsequent decisions of the shipowners raised reservations. In the opinion of
respondents, shipowners used their monopoly position, ignoring the consequences of their
decisions for the activities of others. They pointed out constantly changes in freight rates (the
magnitude of these changes was sometimes shocking, on some Europe-Asia routes from 40 to
60 percent), frequent last-minute cancellations of sailings and lack of ships’ capacity for cargo
as the most frustrating decisions. As many as 74% of respondents indicated delays as one of the
most acute problems. In fact, from the beginning of 2020, container operations have been
dominated by delays unseen on such a scale: delays in deliveries to destination ports, delays in
getting empty containers back, delays in reception of containers after clearance, delays in
delivering container to the port of loading etc. In some regions and routes delays have taken as
long as 3-4 weeks, and shippers had to wait for FAV (i.e. first available vessel) for weeks. These
delays, on the one hand, could only be perceived as failure to meet contractual obligations
(goods intended for retail sale), but on the other hand, they could have had serious
consequences, such as stopping the production processes leading to significant financial losses.
Moreover, such delays constituted additional risk to some cargoes as e.g. perishable food, which
need refrigeration because any increase in transit time can negatively affect the quality of cargo
and shorten its shelf life, leading to losses, damage and wastage. This issue was mentioned by
some respondents, who indicate shortage of reefer containers (24%) as well as losses and
damage to perishable cargoes as the main problem encountered during this time. The pandemic
has demonstrated the need for exceptional management and contingency planning. However,
all freight forwarders admitted that most of their customers were not prepared for such
disruptions in the supply chains, especially since they lasted for many months. Only those who
imported components from China that are necessary for further production processes had any
contingency plans. Unfortunately, none of the food traders had such a plan. Freight forwarders
were also asked (open ended question) about the changes that should take place to avoid or

63rd International Scientific Conference on Economic and Social Development – "Building Resilient Society" - Zagreb, 11-12 December, 2020
241
minimise many of the problems described here in the future. All respondents agreed
unanimously, that shipping needs more digitization and more online procedures. In fact, the
current events associated with the coronavirus pandemic has also highlighted certain limitations
in organization of containerised shipping. Apart from data entry and validation activities,
despite the increasing level of digitization, the industry still relies moderately on the transferring
and dealing with physical documentation. As many people during the pandemic have started
working from home or were placed under mandatory quarantine, despite IT functionality, if
offices remain closed for prolonged periods, the circulation of customs and transport
documentation has been disrupted, leading to problems with delivering the cargo to its
destination or to port of loading. About 35% of freight forwarders admitted that communication
with customers should be improved. First of all, they should gather evidence that they did
everything reasonable to avoid the customer's losses. They should also keep record of
communications with supply chain stakeholders and contractors in order to prove that any
failure to perform were caused by matters genuinely and reasonably outside its control.
5. CONCLUSION
The crisis caused by Covid-19 pandemic made people realized how vital the international
freight services are for ensuring the continuity of supply chains. The level of disruptions in
freight forwarding business caused by the COVID-19 pandemic was not heterogenous, and,
generally, the greater was the share of customers involved in trade with China, the more
noticeable and severe was the impact on freight forwarder performance.The research revealed
that pandemic has placed unprecedented stress on the freight forwarders activity and highlights
certain limitations in the containerized trade that affected their operations. Apart of the decline
in turnover and thus in revenues, the inefficiencies in communication systems among freight
forwarders, ocean carriers and terminals, as well as enormous delays unseen on such a scale
were indicated among the most acute problems encountered by freight forwarders. The research
also revealed that, in the opinion of freight forwarders, shipping needs more digitization and
more online procedures, because apart from data entry and validation activities, despite the
increasing level of digitization, the industry still relies moderately on the transferring and
dealing with physical documentation.
LITERATURE:
1. How global logistics providers are managing the coronavirus crisis. (2020) Retrieved
24.02.2020 from https://logisticsinsights.agility.com/smart-shipping/how-global-logistics-
providers-are-managing-the-coronavirus-crisis/.
2. Ivanov D., Dolgui A., Sokolov B. (2019). Ripple Effect in the Supply Chain: Definitions,
Frameworks and Future Research Perspectives. In Ivanov D., Dolgui A., Sokolov B.
Handbook of Ripple Effects in the Supply Chain, Springer.
3. Kalwasiński, M. (2020). Rekordowy deficyt w handlu z Chinami to nie problem. Retrieved
27.08.2020 from https://www.bankier.pl/wiadomosc/Handel-Polska-Chiny-Rekordowy-
deficyt-7809437.html.
4. Kelly P. (2020). Carriers fear coronavirus port congestion. Lloyds’s Loading List. 9 April
2020. Retrieved from https://www.lloydsloadinglist.com/freight-directory/news/Carriers-
fear-coronavirus-port-congestion/76349.htm#.X1Dmdy22xQI.
5. Klopott, M. (2020). Navigating uncharted waters – the shipping sector’s response to the
COVID-19 pandemic and its impact on the perishable food supply chains. Proceedings of
the 36 International Business Information Management Association (IBIMA) Conference,
November 2020, Granada, Spain.
6. Manaadiar,H. (2020). Impact of Coronavirus on Reefer Containers. Retrieved 27.02.2020
https://www.shippingandfreightresource.com/impact-of-coronavirus-on-reefer-containers/.

63rd International Scientific Conference on Economic and Social Development – "Building Resilient Society" - Zagreb, 11-12 December, 2020
242
7. Moss J. (2020). Coronavirus - The Insurance market impact. Retrieved 24.03.2020 from
https://dwfgroup.com/es-es/news%20and%20insights/press%20releases/2020/2/coronavir
us%20the%20insurance%20market%20impact
8. Neame, C. (2020). The coronavirus and freight forwarding. Retrieved 16.06.2020 from
https://www.hfw.com/The-coronavirus-and-freight-forwarding-March-2020.
9. Ocean Insights. (2020). Blank sailings due to COVID-19 outbreak. Retrieved 18.08.2020
from https://mailchi.mp/ocean-insights.com/blank-sailing-updates.
10. OECD (2020). OECD Policy Responses to Coronavirus (COVID-19). Food Supply Chains
and COVID-19: Impacts and Policy Lessons, OECD. Geneva.
11. Yearbook of Foreign Trade Statistics of Poland (issues from 2006 to 2020), Statistical
Publishing Establishment, Warsaw, Poland.

63rd International Scientific Conference on Economic and Social Development – "Building Resilient Society" - Zagreb, 11-12 December, 2020
243
HUMAN CAPITAL ASSESSMENT WITH IMPORTANCE AND
SATISFACTION WITH DIFFERENT SPHERES
Maria Volkova
Central Economics and Mathematics Institute of Russian Academy of Sciences,
Moscow, Russia,
Plekhanov Russian University of Economics, Moscow, Russia
Maksim Rybachuk
Central Economics and Mathematics Institute of Russian Academy of Sciences,
Moscow, Russia
ABSTRACT
The criteria of satisfaction and importance of nineteen categories covering most aspects of
human capital in fifteen municipalities of Perm region of Russian Federation are evaluated.
Methodology of calculation of satisfaction criteria of various life aspects is based their
importance. A method of assessing the combined subjective indicator of human capital in the
form of a geometric mean of importance and satisfaction ratings is proposed. The method was
tested on the questionnaire data of a sociological survey of the population of the Perm region.
The questionnaire is designed in such a way that respondents could choose any number of
questions when assessing satisfaction with the categories, and when assessing their importance,
the number of questions is limited to five, which allows to determine the most important aspects
of human capital development and circumstances for its development. The obtained estimates
were used to determine the values of three enlarged categories of human capital: Personal
Potential, Material Well-being and Social Well-being. The aggregate indicator was calculated.
The greatest contribution to the formation of the aggregate indicator is made by personal
potential (first, health and education) and social well-being (in particular, respect for the
human rights and the level of personal security). The results reflect a mismatch in importance
and satisfaction estimates for a few main parameters. Of all the proposed categories,
respondents are satisfied with their relationships with relatives to the maximum extent, and
with their careers to the minimum. Health and income are the most important. Least important
are relationships with colleagues. Almost all the key features are skewed: low satisfaction
combined with high importance of the feature.
Keywords: Quality of Life, Welfare, Social Sphere, Population, Satisfaction, Importance
1. INTRODUCTION
The problem of assessing human capital from the standpoint of satisfaction and the importance
of individual areas is considered. Synthetic categories of Personal Potential, Material and Social
well-being were identified. A method for estimating various parameters using a geometric mean
of satisfaction and importance ratings was proposed. To obtain aggregate indicator, the principal
component method was used. According to Sheen and Johnson [1], the best way to assess
personal human capital is to measure the range within which individuals' basic needs are met.
One of the main elements of the assessment of subjective spheres of life is the concept of vital
capacity. According to Alferova [2], the availability for potential realization is associated with
the concept of life satisfaction. There are two ways to assess satisfaction with life. The first way
– "bottom-up" is considered in [3] and characterizes the movement from physiological to
complex cognitive and communication needs. The opposite "top-down" path is represented, e.g.
by Johansson [4] and defines a system of basic needs inherent for all people, regardless of

63rd International Scientific Conference on Economic and Social Development – "Building Resilient Society" - Zagreb, 11-12 December, 2020
244
nationality, cultural background, time of residence. In this paper we will consider the human
capital being the part of quality of life – the complex of needs in good health, high education,
good job, etc. Methodologically, the assessment of subjective spheres of quality of life in terms
of satisfaction and importance analysis is represented by a wide range of studies, all of which
are based on the use of different mathematical methods and models: Palomiaki [5], Rodriguez-
Rosa [6], Ip Po-Keung [7], Halleröd [8], Ferrans and Powers quality of life indicator [9]. In
these and other studies, the importance score is used as a multiplier for the satisfaction score in
order to produce an aggregate indicator.
2. METHODS
Assessment of satisfaction and importance of different categories was made by dividing
features into separate synthetic categories of quality of life in accordance with their meaning.
Within each synthetic category (Personal Potential, Material Well-being, Social Well-being),
relative importance and relative satisfaction (relative to the sum of all respondents ' answers)
were calculated. Several researchers, for example, Hagell [10], claim that there is no significant
difference in the estimates "satisfaction certain categories – life satisfaction and satisfaction
with specific, important, categories – life satisfaction ". In our point of view, such differences
exist, as will be demonstrated later.
3. ESTIMATION OF SATISFACTION
Let there be synthetic category j, which includes p questions-parameters. Then we assume 𝑥𝑖𝑟𝑗(𝑙)
,
where i is the region number, r is the number of respondents, l is the number of questions in the
category. Note that this methodology is applicable to any synthetic category with any number
of questions included in it. In our case 𝑥𝑖𝑟𝑗(𝑙)
is a binary variable, 𝑥𝑖𝑟𝑗(𝑙)
= {10
, which takes a value
of “1” if respondent agrees with the proposed statement (for example, "Are you satisfied with
your health?"), and “0” otherwise. For further analysis, all binary variables were converted to
percentages without considering respondent numbers. Namely, �̅�𝑖.𝑗(𝑙)
=1
𝑛∑ 𝑥𝑖𝑟𝑗
(𝑙)𝑛𝑟=1 ∗ 100% –
the percentage of satisfactory answers to the question l in the region i among all respondents in
it. Satisfaction level indicator for each synthetic category j in the region i: �̃�𝑖.𝑗 =1
𝑛𝑝∑ ∑ 𝑥𝑖𝑟𝑗
(𝑙)𝑛𝑟=1
𝑝𝑙=1 .
Thus, for a fixed synthetic category: �̃�𝑖 =1
𝑛𝑝∑ ∑ 𝑥𝑖𝑟𝑗
(𝑙)𝑛𝑟=1
𝑝𝑙=1 .
4. ESTIMATION OF IMPORTANCE
By analogy with the calculation of satisfaction indicators, 𝑣𝑖𝑟𝑗(𝑙)
– the initial form of data on the
importance of certain features, indices i, r, l and j are the same for both cases. Just as in the case
of satisfaction assessment, 𝑣𝑖𝑟𝑗(𝑙)
= {10
, where 𝑣𝑖𝑟𝑗(𝑙)
takes the value "1 "if the answer is "Yes" to
the proposed question, and "0" - otherwise. The percentage of affirmative answers in the total
answers for the i-th region: �̅�𝑖.𝑗(𝑙)
=1
𝑛∑ 𝑣𝑖𝑟𝑗
(𝑙)𝑛𝑟=1 ∗ 100%. Hence, the indicator of the level of
importance of the j-th synthetic category in the i-th region: �̃�𝑖.𝑗 =1
𝑛𝑝∑ ∑ 𝑥𝑖𝑟𝑗
(𝑙)𝑛𝑟=1
𝑝𝑙=1 .
Like satisfaction assessment: for each synthetic category, the following is true: �̃�𝑖 =1
𝑛𝑝∑ ∑ 𝑥𝑖𝑟𝑗
(𝑙)𝑛𝑟=1
𝑝𝑙=1 .

63rd International Scientific Conference on Economic and Social Development – "Building Resilient Society" - Zagreb, 11-12 December, 2020
245
The aggregate indicator of j-th synthetic category is calculated as the geometric mean of two
indicators (satisfaction and importance): �̃�𝑖 = √�̃�𝑖 ∗ �̃�𝑖.
The procedure for calculating the aggregate indicator of Quality of Life (𝑄𝑖) is made in
accordance to Aivazian [11]: 𝑄𝑖 = 𝑁 − 𝜌𝑖, where 𝜌𝑖2 = ∑ 𝛼(𝑗) ∗ (�̃�𝑖
(𝑗)− 𝑁)23
𝑗=1 – weighted
Euclidean distance to the “ideal” point (N, N) calculated with the weight coefficient of each j-
th synthetic category (𝑗 = 1, 2, 3): 𝛼(𝑗) =𝑠𝑗2
∑ 𝑠𝑗23
𝑗=1
. Weight coefficient is calculated in proportion
to the sample variance 𝑠(𝑗)2 =
1
𝑛∑ (�̃�𝑖
(𝑗)− �̅�(𝑗))2𝑛
𝑖=1 . The average for all regions value of the
integral indicator of each j synthetic category is determined as: �̅�(𝑗) =1
𝑛∑ �̅�(𝑗)𝑛
𝑖=1 .
5. RESULTS
5.1. Personal Potential (PP)
Personal potential is distinguished from the concept of adaptation. So, Konovalova [12]
associates personal and adaptive potential of the person, reducing them to possibilities of mental
adaptation in society. Posokhova [13] equates personal potential to adaptive abilities of a person
and includes bioplastic, biographical, psychic and personality-regulatory components.
From the available set of features, received as the result of sociological survey, those that most
characterize the personal and adaptive potentials are identified:
l (1) – health;
l (2) – education;
l (3) – career;
l (4) – physical form;
l (5) – mood;
l (6) – relationships with loved ones, in the family;
l (7) – relations with colleagues.
Here and later l is the number of question-category.
Diagram of importance and satisfaction level for components of Personal potential category –
on picture 1.
Figure 1: Satisfaction with categories of Personal Potential and their importance

63rd International Scientific Conference on Economic and Social Development – "Building Resilient Society" - Zagreb, 11-12 December, 2020
246
The population of mostly satisfied with relations with relatives to the maximum extent, with
their career to the minimum. Residents of all considered settlements are low satisfied with the
level of their health (for 24% of respondents on average). At the same time, health is the most
important aspect of all considered (for 59% of respondents on average). In General, such
estimates are quite true. From the point of view of the psychological aspect of the quality of life
of the population, the researchers are interested in behavioral criteria, namely, the assessment
of mood, relationships within the family. In most cases, there is a significant discrepancy in the
assessments of importance and satisfaction with mood. An interesting fact is that there is almost
no statistical relationship between the two variables (𝑟(�̅�(5),𝑣 (5)) = 0.023). This, in our opinion,
indicates that the importance of good mood is not noticed by people if it (good mood) presents.
The value of the pair correlation coefficient between variables �̅�(6) и �̅�(6) (satisfaction and
importance of family relationships) (𝑟(�̅�(6),𝑣 (6)) = 0.57). On average, 61% of respondents are
satisfied with relations within the family, but they are important only for 26% of respondents.
Good family relationships are a valuable attribute of an individual's life, but only if they can be
considered good. According to the proposed methodology, the following criteria were
calculated: satisfaction, importance, as well as a summary indicator of personal potential
�̃�𝑖 = √�̃�𝑖 ∗ �̃�𝑖 . A higher degree of satisfaction with all the features that are part of the
considered synthetic category provides a high rank of the municipality according to the
summary indicator "Personal potential".
5.2. Material well-being (WB)
In the context of subjective evaluations, the following criteria were considered:
l (8) – living conditions;
l (9) – job;
l (10) – income;
l (11) – availability of children's educational and developmental facilities;
l (12) – availability of cultural and leisure facilities;
l (13) – availability of sports facilities;
l (14) – medical care;
l (15) – food.
There are two groups of features. The first is characterized by the excess of satisfaction over
importance (provision of children's educational, cultural, sports institutions, as well as food).
For the second – the excess of importance over satisfaction. In the second group-the key factors
of material well-being: housing, health care, job and income – figure 2.
Figure 2: Satisfaction with categories of Material wellbeing and their importance

63rd International Scientific Conference on Economic and Social Development – "Building Resilient Society" - Zagreb, 11-12 December, 2020
247
The negative value of the pair correlation coefficient between the two parameters indicates a
decrease in the significance (importance) of living conditions with an increase in satisfaction
with them. In General, household infrastructure in observed settlements is poorly developed,
although the implementation of a number of state and regional programs aimed at improving
the infrastructure development of the region as a whole, a number of areas have undergone
positive changes. Income for respondents is less important than work. At the same time, several
settlements are characterized by a certain discrepancy in the sphere of material security.
5.3. Social wellbeing and security
We considered social well-being as one of the key factors of quality of life. The analysis was
carried out from the standpoint of evaluation criteria:
l (16) – social guarantees;
l (17) – personal safety;
l (18) – respect for civil rights;
l (19) – state of the environment.
When considering the indicators averaged over all settlements, two are of the greatest
importance: the level of implementation of social guarantees and the quality of the environment.
The low importance of the level of personal security at a very low level of satisfaction with the
category – in some ways a mystery. The only category for which there is a common assessment
of the quality of the environment (figure 3).
Figure 3: Satisfaction with categories of Social Wellbeing and Security and their importance
The indifference of the population to the estimates or to their own safety – what do we rather
face when analyzing the available data? The high importance of security of life and property is
explained, in our opinion, by the same factors as the importance of the implementation of social
guarantees.
5.4. Integral indicator of quality of life (IQOL)
For all parameters values of nonparametric U Mann-Whitney criterion were calculated [14],
revealing statistically significant differences in satisfaction and importance classes 𝑈 = 𝑛1 ∗
𝑛2 +𝑛1(𝑛1+1)
2− 𝑅1 or 𝑈 = 𝑛1 ∗ 𝑛2 +
𝑛2(𝑛2+1)
2− 𝑅2, where 𝑛1 – number of elements in the
first sample and 𝑛2 – the number of elements in the second sample. Sample 𝑛1 is verifiable,
analyzed, and 𝑛2 – modified. Scores are ranked in descending order in each sample. 𝑅1 – sum
of sample ranks by volume 𝑛1, and 𝑅2 – the sum of ranks of sample volume 𝑛2.

63rd International Scientific Conference on Economic and Social Development – "Building Resilient Society" - Zagreb, 11-12 December, 2020
248
In assessing the independence between two samples using the Mann-Whitney test, the null
hypothesis 𝐻0 is put forward: there is no difference between the medians of the two samples
under consideration. Alternative hypothesis 𝐻1: there is a difference between medians. We
combined two samples: satisfaction and the importance of each criterion of quality of life. Thus,
nineteen estimates of the criterion and significance levels were obtained (table 1). Returning to
the notation adopted in the methodology for calculating the U-test, we introduce: 1n - a
combined sample of estimates calculated by formulas: �̅�𝑖.𝑗(𝑙)
=1
𝑛∑ 𝑥𝑖𝑟𝑗
(𝑙)𝑛𝑟=1 ∗ 100% – for
satisfaction and �̅�𝑖.𝑗(𝑙)
=1
𝑛∑ 𝑣𝑖𝑟𝑗
(𝑙)𝑛𝑟=1 ∗ 100% – for importance. But 𝑛2 is a sample in which
variables are set to "1" for satisfaction and " 2 " for importance. The assessment was conducted
for the significance level 𝛼 = 0.05.
Table 1: Mann-Whitney criterion calculation Results Median U- criteria and significance
Satisfaction
(medium value)
Importance
(medium value)
Mann-
Whitney
criterion
Sig. level (р)
Health 24.165 (9.03) 58.904 (23.97) 247.5 0.000*
Education 14.495 (18.25) 12.070 (14.75) 100 0.290
Career 3.194 (11.69) 11.891 (21.31) 205 0.030*
Physical form 12.863 (22.28) 2.472 (10.72) 35.5 0.000*
Mood 28.443 (21.16) 16.374 (11.84) 53.5 0.005*
Relations with
relatives
61.758 (23.06) 26.121 (9.94) 23 0.000*
Relations with
colleagues
21.805 (24.5) 1.142 (8.5) 0 0.000*
Living conditions 36.947 (13.81) 45.984 (19.19) 171 0.105
Job 16.635 (9.84) 38.176 (23.16) 234.5 0.000*
Income 6.829 (8.50) 59.360 (24.50) 256 0.000*
Children's educational
institutions
7.856 (19.44) 4.450 (13.56) 81 0.072
Cultural institutions 11.089 (21.81) 1.693 (11.19) 43 0.001*
Sport institutions 11.317 (21.88) 1.062 (11.12) 42 0.001*
Medical service 12.004 (10.03) 27.688 (22.97) 231.5 0.000*
Food 25.070 (21.84) 11.409 (11.16) 42.5 0.001*
Social guaranties 5.027 (12.62) 11.682 (20.38) 190 0.019*
Safety 7.468 (17.56) 7.324 (15.44) 111 0.517
Human rights 5.987 (16.50) 7.067 (16.50) 128 1.000
Ecology 16.875 (17.75) 12.816 (15.25) 108 0.449
* Differences are statistically significant )05.0( p .
There were no statistically significant differences between satisfaction and importance for
several criteria. Among them: education, housing, children's educational institutions, security,
rights and ecology. Note that all these criteria are characterized by differences in average ranks,
average values and median satisfaction and importance. The parameter of respect for the rights
of individuals stands out most clearly. Calculation of values of the integral QOL indicator is
based on the methodology offered in Ayvazyan S. A. [11] consisting in determination of
Euclidean distance to a reference point taking into account weight 𝛼(𝑗) =𝑠𝑗2
∑ 𝑠𝑗23
𝑗=1
of each
synthetic category in the final indicator. The weights of categories are provided in the Table 5.
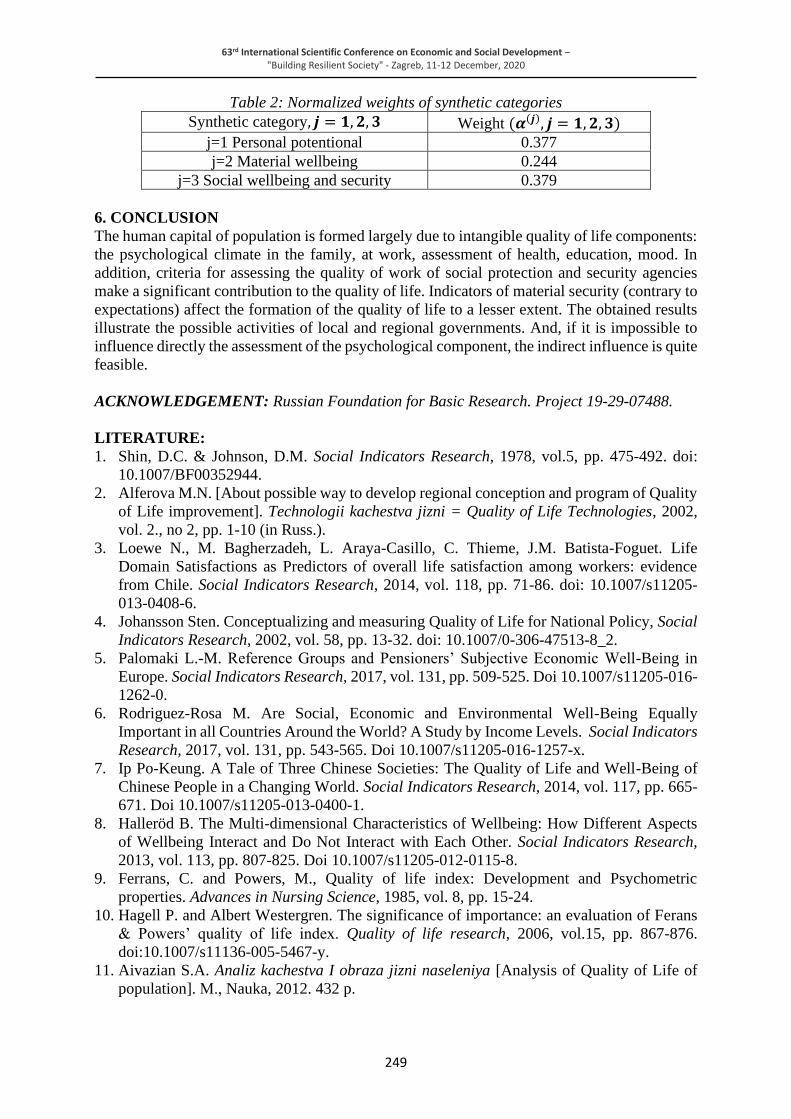
63rd International Scientific Conference on Economic and Social Development – "Building Resilient Society" - Zagreb, 11-12 December, 2020
249
Table 2: Normalized weights of synthetic categories
Synthetic category, 𝒋 = 𝟏, 𝟐, 𝟑 Weight (𝜶(𝒋), 𝒋 = 𝟏, 𝟐, 𝟑)
j=1 Personal potentional 0.377
j=2 Material wellbeing 0.244
j=3 Social wellbeing and security 0.379
6. CONCLUSION
The human capital of population is formed largely due to intangible quality of life components:
the psychological climate in the family, at work, assessment of health, education, mood. In
addition, criteria for assessing the quality of work of social protection and security agencies
make a significant contribution to the quality of life. Indicators of material security (contrary to
expectations) affect the formation of the quality of life to a lesser extent. The obtained results
illustrate the possible activities of local and regional governments. And, if it is impossible to
influence directly the assessment of the psychological component, the indirect influence is quite
feasible.
ACKNOWLEDGEMENT: Russian Foundation for Basic Research. Project 19-29-07488.
LITERATURE:
1. Shin, D.C. & Johnson, D.M. Social Indicators Research, 1978, vol.5, pp. 475-492. doi:
10.1007/BF00352944.
2. Alferova M.N. [About possible way to develop regional conception and program of Quality
of Life improvement]. Technologii kachestva jizni = Quality of Life Technologies, 2002,
vol. 2., no 2, pp. 1-10 (in Russ.).
3. Loewe N., M. Bagherzadeh, L. Araya-Casillo, C. Thieme, J.M. Batista-Foguet. Life
Domain Satisfactions as Predictors of overall life satisfaction among workers: evidence
from Chile. Social Indicators Research, 2014, vol. 118, pp. 71-86. doi: 10.1007/s11205-
013-0408-6.
4. Johansson Sten. Conceptualizing and measuring Quality of Life for National Policy, Social
Indicators Research, 2002, vol. 58, pp. 13-32. doi: 10.1007/0-306-47513-8_2.
5. Palomaki L.-M. Reference Groups and Pensioners’ Subjective Economic Well-Being in
Europe. Social Indicators Research, 2017, vol. 131, pp. 509-525. Doi 10.1007/s11205-016-
1262-0.
6. Rodriguez-Rosa M. Are Social, Economic and Environmental Well-Being Equally
Important in all Countries Around the World? A Study by Income Levels. Social Indicators
Research, 2017, vol. 131, pp. 543-565. Doi 10.1007/s11205-016-1257-x.
7. Ip Po-Keung. A Tale of Three Chinese Societies: The Quality of Life and Well-Being of
Chinese People in a Changing World. Social Indicators Research, 2014, vol. 117, pp. 665-
671. Doi 10.1007/s11205-013-0400-1.
8. Halleröd B. The Multi-dimensional Characteristics of Wellbeing: How Different Aspects
of Wellbeing Interact and Do Not Interact with Each Other. Social Indicators Research,
2013, vol. 113, pp. 807-825. Doi 10.1007/s11205-012-0115-8.
9. Ferrans, C. and Powers, M., Quality of life index: Development and Psychometric
properties. Advances in Nursing Science, 1985, vol. 8, pp. 15-24.
10. Hagell P. and Albert Westergren. The significance of importance: an evaluation of Ferans
& Powers’ quality of life index. Quality of life research, 2006, vol.15, pp. 867-876.
doi:10.1007/s11136-005-5467-y.
11. Aivazian S.A. Analiz kachestva I obraza jizni naseleniya [Analysis of Quality of Life of
population]. М., Nauka, 2012. 432 p.

63rd International Scientific Conference on Economic and Social Development – "Building Resilient Society" - Zagreb, 11-12 December, 2020
250
12. Konovalova N.L. Preduprejdenie narusheniy v razvitii lichnosti pri psichologicheskom
soprovojdenii shkolnikov: monographiya [Prevention of violations in the development of
personality in the psychological accompaniment of schoolchildren: a monograph]. Spb.,
SpbSU, 2000. 232 p.
13. Posochova S.T. Psichologiya adaptiruyusheisya lichnosti: monographiya [Psychology of
the Adaptive Personality: a monograph]. Spb., SpbSU, 2001. 393 p.
14. Mann H. B., Whitney D. R. On a test of whether one of two random variables is
stochastically larger than the other. Annals of Mathematical Statistics, 1947, № 18, pp. 50-
60. doi:10.1214/aoms/1177730491.

63rd International Scientific Conference on Economic and Social Development – "Building Resilient Society" - Zagreb, 11-12 December, 2020
251
EXPERIENCE IN ORGANIZING DISTANCE LEARNING IN
LOCKDOWN
Marina Bareicheva
Ural Federal University (UrFU), Ekaterinburg, Russia
Ekaterina Kubina
Ural Federal University (UrFU), Ekaterinburg, Russia
Viola Larionova
Ural Federal University (UrFU), Ekaterinburg, Russia
Natalia Stepanova
Ural Federal University (UrFU), Ekaterinburg, Russia
Ken Brown
Letterkenny Institute of Technology, Letterkenny, Ireland
ABSTRACT
Due to the fact of coronavirus infection (COVID-19), higher education institutions in the spring
of 2020 were urgently forced to switch to a distance-learning format. An important role was
played by informing all participants about the transition in a short time using messengers and
other Internet resources. During the transition, special support services were created to assist
the teaching staff. Some universities have taken advantage of their educational platforms, while
others have been forced to seek help. The main issue was to coordinate the work of thousands
of people online in a short time. The authors of the study conducted in-depth interviews with
teachers of the Ural Federal University (Russia) in various fields of training to improve
planning, organization, and management during the transition to distance education. The main
problems of distance learning in Russia were identified and possible solutions were proposed.
Using the experience gained from conducting classes in a mass distance format, the authors of
the article structured directions for improving the quality of distance learning in a short time.
The results were proposed to the University administration for implementation in the University
educational environment and successfully implemented at the Ural Federal University in the
future. We have accumulated a lot of experience working with various tools for working in an
online environment – social networks, messengers, applications, and online platforms. The
presented research will also be interesting for representatives of different universities to
integrate the solutions obtained into the existing learning model. This practice can be useful
for those who want to get up-to-date knowledge remotely, without losing the quality of training.
Keywords: Distance education, experience, in-depth interviews, teachers
1. INTRODUCTION
To date, the COVID-19 pandemic has become the most pressing issue for discussion in the
world. There are three views on the current crisis for higher education around the world. One
of them is a quick transition to distance learning. Here, views were divided into skeptical and
optimistic.

63rd International Scientific Conference on Economic and Social Development – "Building Resilient Society" - Zagreb, 11-12 December, 2020
252
All training events, including graduation and admissions companies, were moved to an online
format. Most universities had to adapt quickly to the transition to distance learning. So they
were forced to create electronic databases with educational and methodological materials
almost from scratch. Further, the administration had to help teachers and students if there were
difficulties with switching to online training. Another view describes the current situation as an
impetus to the development of the modern education system. The crisis clearly showed that
universities were not prepared enough for it, despite their historical resilience. Educational
institutions in their practice do not use the analysis of the scenario of world shocks. The latter
view describes that any crisis reveals weaknesses. In the higher education system, there is a
clear differentiation among the funding of different universities. The pandemic has shown who
does not have enough funds, who did not create a safety cushion to provide for their teachers
and students (Melnik, 2020; HSE, 2020; Interfax, 2020).
2. AN OVERVIEW OF THE SOURCES AND THE PROBLEM STATEMENT
Against the background of the current situation in the world, all universities were forced to
switch to distance learning. Each of them faced certain problems when switching to distance
learning and developed their ways to solve them. First, let's look at the experience of foreign
universities (Pop, 2020; Seale, 2020).
2.1. Financing
So at the University of London, SOAS had to take drastic measures to reduce jobs. This decision
was caused by problems with funding, which weakened due to the crisis during the coronavirus
infection. The University of Auckland (New Zealand) has a similar situation. However, the
decision made by the management looked more critical. They sent out e-mails notifying that
the staff of the "New Start General" program (additional training course for specialists) have a
limited choice (a modest choice). They can either work for free in the second half of 2020 or
retire (Collins, 2020; McKie, 2020). Undoubtedly, the resulting crisis in University funding
will lead to higher education institutions to significantly lower enrollment figures for the
coming year. This is due to a reduction in University revenues from all sources, as well as the
risk of staff cuts. However, a reduction in spending on the part of higher education institutions
can not be expected due to the long-term obligations of higher education Institutions to business
(HSE Institute of education, 2020). In other words, funding has decreased, but the cost of
implementing educational programs has remained unchanged.
2.2. Tight deadlines for switching to online
Employees of Guildford technical College (England) were forced to implement tools for
communication between teachers and students in a few days. While initially, we planned to
allocate 90-120 days for this. The Microsoft Teams program was chosen for communication.
This app has become a link between all departments and staff of the College (Msgeek, 2020).
In Russia, the first University to switch to online education was Moscow State University
(MSU). He set an example and proved that the transition to online training can be carried out
in a short time. The development of the distance learning format continues to this day (How to
read the media? 2020). In the context of the coronavirus, Rostov State University of Economics
(Russia) completely switched the educational process to online in just two days. We used a
combination of strict centralization with free, creative solutions to narrow problems. The main
goal was to maintain control over the assimilation of the curriculum. Moodle has become the
basis of the entire online learning system. This is where the main digital footprint of the
educational process is collected. The collected database of tasks is analyzed and evaluated in
the University's data center using AI technologies (MEL Edition, 2020).

63rd International Scientific Conference on Economic and Social Development – "Building Resilient Society" - Zagreb, 11-12 December, 2020
253
In other words, some universities have met the intensive deadlines for switching to online
education. This was due to a clear organization and administration. In others, there were
significant difficulties.
2.3. Monitoring the learning process
A topical issue was the topic of who is in the ring in remote mode. So at Vyatka State University
(Russia) passed the first remote protection of final qualifying works of students. The basic
protection scheme has not changed. The main feature is the use of online proctoring. A similar
practice is implemented at Tambov State University named after G. R. Derzhavin (Russia)
(Klyagin, Makarieva, 2020). In connection with the transition to distance learning, the Ministry
of science and higher education of Russia regularly began to conduct inspections to monitor the
situation on the ground. Teachers should also send weekly reports to Vice-rectors on academic
work (Filippova, 2020). The control over the implementation of the training process was carried
out using the proctoring system. But in some places, the number of students increased, and the
quality of training was not the best.
3. RESEARCH QUESTION
The main topics for discussion and study were the following questions:
• How much distance education meets the requirements of the online learning format;
• Are you satisfied with the quality of feedback from students;
• What information support is formed at the university level;
• What methods of transmitting information and communicating with students do you use?
The aim of the study was to study models of transition to distance learning in a short time in
order to identify algorithms for working in the new conditions of teachers.
Tasks:
1) Study previously conducted research in the area of interest to us;
2) Structure the acquired knowledge;
3) Conduct in-depth interviews with the teaching staff of Ural Federal University (Russia);
4) Give practical recommendations for teachers ' work in an online format;
5) Analyze the data obtained, identify problems of online education for teachers, and suggest
ways to solve them;
6) Make General conclusions and recommendations.
The subject of the study was the study of the organization and planning of distance learning as
a model for working in a pandemic. Conducted in-depth interviews with University teachers,
showed their view of distance learning. The object of research is distance learning in higher
education institutions. A novelty in the multi-aspect analysis and synthesis of the best practices
of distance learning for teachers and replication of techniques for working online. Research
methods include in-depth interviews, analysis, structuring, generalization, and Object
modeling.
3.1. Conducted in-depth interviews (based on the Ural Federal University)
The authors of the article conducted several in-depth interviews with teachers of the Ural
Federal University (UrFU). The authors interviewed 10 groups of UrFU teachers from 13
institutes. The responses received were analyzed and structured as the following conclusions:
• The first question of the in-depth interview was: "How did the University facilitate the
transition of teachers to distance learning?".
• Each teacher was assigned three employees from the University's technical support
Department;

63rd International Scientific Conference on Economic and Social Development – "Building Resilient Society" - Zagreb, 11-12 December, 2020
254
• Several online sessions were held for UrFU teachers to learn how to work on available
platforms. They could also ask questions. All online broadcasts were recorded and posted
on the Internet as online lessons;
• To keep in touch with students, teachers were helped by University resources, such as
Moodle and hypermethod;
• Online courses, live broadcasts from classrooms, electronic resources (video lectures,
electronic textbooks, webinars via Skype, Zoom, Teams, Google G Suite, interaction via
social networks and messengers, as well as via email) have become forms of distance
learning at the University.
The second question was about the most popular forms of communication with students. Each
teacher prefers a particular form of communication:
• First in popularity-social networks and messengers (VK, Telegram), the next Moodle, and
the Hypermetod platform. Moodle and HyperMethod exist in UrFU for quite a long time.
So there are already digitized lectures and course materials, so it was enough just to update
these electronic resources and transfer them to students. In this case, there was less work
for teachers;
• Email is used, but not as popular and is not actively used by all students. Usually, they are
responsible headmen of student groups;
• There are also alerts on the site where the teacher can send alerts to students. For example,
about the beginning of a lecture or a new homework assignment. This expands the range of
interaction between teachers and students.
The third question that interested the authors was the presence of certain difficulties with the
implementation of certain algorithms for conducting classes, for example, the step-by-step
output of formulas for disciplines or other graphical actions that need to be shown to students
in real-time. Each teacher has their own approach to this problem:
• The first thing that became popular was that teachers got used to using classic information
input tools (mouse, keyboard);
• To implement this feature, the teacher set up an additional video camera to record the output
of formulas manually on a piece of paper;
• The use of graphic tablets is popular among young and creative teachers.
Also relevant was the fourth question, how difficult it was for teachers to switch to the remote
format of work. Below are some of the difficulties they encountered:
• Many teachers have already used the remote mode system. Therefore, they are already used
to organizing their work independently. The only difficulty for them was buying new
equipment, such as a headset to improve the quality of communication, a graphics tablet, a
printer, etc.;
• Initially, the use of many resources was limited due to the lack of a full user license. for
example, in Zoom, you could only hold conferences for 40 minutes. To facilitate online
lectures, the University has provided teachers with paid rates on various platforms for free
use;
• One of the problems was fixing the process of independent work of students. If Moodle
services recorded the activity of work, then the new platforms did not have such an
opportunity. In this situation, teachers created questions for independent work that
controlled the deadline, intermediate tests based on electronic platforms for almost all
classes, compiled Excel tables for filling out, as well as separate questions for video
conferences and for written works.

63rd International Scientific Conference on Economic and Social Development – "Building Resilient Society" - Zagreb, 11-12 December, 2020
255
The authors of the study were also interested in the fifth question related to the emotions of
teachers in connection with remote work. Opinions were divided:
• Teachers said that interaction with students has become easier. This means that students
become more independent, performing individual tasks. Now there are no unscheduled
consultations during the break, everything is regulated by time. Also, reports on students '
work come in ready-made and sorted form, which simplifies the process of recording
results.
• However, not all teachers were prepared for such a high rate of change. Many do not feel
confident when using digital technologies. Teachers over the age of 50 are a Prime example.
• The distance between teachers and students who hold conferences via image broadcasting
has been significantly reduced. Teachers note that students become more involved in the
discussion during the class. In addition, the home environment disposes participants to each
other.
Next, the sixth question was asked about the electronic resources provided by universities for
organizing distance learning. The University has an e-learning portal that has been around for
several years. Teachers are already familiar with it, as many have taken advanced training
courses there. In everyday academic life, the portal was also used to interact with students. For
the continuous operation of the entire University, work was carried out to increase its capacity.
For example, at the initial stage, a certain module was linked to an educational program. And
the last, seventh question that was asked to Urfu teachers was: "what changes do you think will
remain in the educational process after the pandemic?". The responses are presented in the form
of the following conclusions:
• Teachers are of the opinion that a complete transition to offline mode is unlikely. Since
everyone is already used to working online, many of the advantages of this format will be
very difficult to refuse. Therefore, after the end of the quarantine, there will be people
among teachers and students who will be more comfortable working offline, and they will
be happy to return to their former life. However, there will be those who will understand
that they would prefer to stay online;
• Some teachers are of the opinion that the University as an educational space will lose its
relevance. The online learning environment will become so popular that it will begin to
displace traditional education;
• The main aspects of the disciplines, such as lectures, can be studied online. More in-depth
study of the subject, such as practice or laboratory work, should take place offline in the
University. This approach will save time, both for teachers and students. Since there is no
need to travel to the University and you will be able to work from any convenient place.
The main thing is to have access to the Internet.
3.2. Practical recommendations for working remotely
The authors asked teachers to give some recommendations for improving the distance learning
process. These wishes are formulated as follows:
• Do not refuse to help each other and do not be afraid to ask for it. This applies to both
teachers and students. After all, helping each other in this difficult time. We will be able to
achieve good result-effective training;
• You need to correctly evaluate your strength and time of students. Although you should
complete the educational program in full, you should not overload students with homework.
You need to understand that some things and disciplines are very difficult to master on your
own;

63rd International Scientific Conference on Economic and Social Development – "Building Resilient Society" - Zagreb, 11-12 December, 2020
256
• Teachers should not strive to master all available electronic resources. You should choose
platforms that will help you implement the distance learning process as effectively as
possible;
• Teachers should not forget about feedback from students. Keep in mind that not all issued
tasks will be immediately understood and perfectly executed. Students may have questions
as they complete assignments and teachers should provide them with contact information.
As practice shows, the more effective the feedback from the teacher, the more loyal the
attitude of students towards him.
3.3. Analysis of the obtained data and possible solutions to existing problems
Based on the results of research and in-depth interviews with the teaching staff of the Ural
Federal University, the authors identified several existing problems in the field of distance
learning in Russia, as well as suggested ways to solve them. One of the problems of the world's
universities is insufficient funding for universities. Everyone has faced this problem, but it is
especially evident in small universities. The result is a reduction in jobs. In this situation, it is
necessary to correctly allocate available funds and control expenses. For example, it is possible
to reduce the cost of operating and maintaining the University building and grounds. To prevent
this situation from happening again in the future, reserve funds of universities should be created.
This airbag will help to avoid difficulties in the period of crisis and lack of funding. Lack of
personalized resources at the university to ensure online work. This led to a long transition to a
distance-learning format. The authors are confident that many universities will correct this error
soon and create their electronic platforms and services. Many teachers over the age of 50 noted
that it is very difficult for them to adapt to working online. They are not very familiar with the
computer and the capabilities of electronic resources. At the moment, they are provided with
all possible support for the organization of work by the University and active students. To avoid
a similar situation with younger teachers, it is suggested that information education courses be
held regularly to maintain the teacher's level of qualification in the field of online systems.
Many institutions have found ways to solve this problem, but it requires attention. The problem
is the difficulty of recording students ' activity during distance learning. This is due to the fact
that not all resources provide reporting on the time and quality of task completion. Therefore,
it is difficult for the teacher to monitor the individual work of the student. At the moment, the
solution can only be a competent selection of resources. In the future, it is possible to create a
special Supplement for educational resources, which will facilitate the integration of the
platform data and the student assessment system (Ilingin, 2020).
4. DISCUSSION OF RESULTS
The proposed solutions will help those who have not yet decided on how to increase the
effectiveness of the distance learning process. Based on world practice, each University can
apply the proposed solutions to its system. As a result of in-depth interviews, many valuable
tips for teachers were revealed. They can share their experience and improve their approach to
distance learning (Savitskaya, 2020). The results of our research in some aspects coincide with
the conclusions of similar works. We also synthesized the best practices of distance learning
and conducted a multidimensional analysis. As a result, we obtained structured techniques for
teachers to work online. The transition to distance learning cannot remain without consequences
for the educational system. Many authorities have expressed their views on the consequences
of switching to emergency distance learning. So Simon Marginson (Oxford University) claims
that it will take at least 5 years to stabilize student mobility. In his opinion, it is possible to
change the learning paradigm: online education will be more viable than traditional (HSE
Institute of education, 2020). Jeff Maggioncalda (Chief Executive of Coursera) speaks about
the fact that there will be a large demand for blended learning.
63rd International Scientific Conference on Economic and Social Development – "Building Resilient Society" - Zagreb, 11-12 December, 2020
257
The crisis is an analogy of "natural selection" for all universities in the world, where the
strongest survive. Lawrence Bakov (President, Harvard University) also supports the idea of
introducing mixed education. This will allow you to adapt online learning to the needs of the
educational environment and keep students active (HSE Institute of education, 2020).
5. CONCLUSION
Thus, the authors of the study identified the main problems of the world education system that
were formed as a result of the COVID-19 pandemic. Reviewed and analyzed in-depth
interviews with teachers of one of the leading universities in Russia, which contributed to
finding solutions to the identified problems. It is not known how the education system would
have developed without the intervention of a period of quarantine and self-isolation. However,
the authors believe that the pandemic not only highlighted the weaknesses of universities and
the education system as a whole but also gave a strong impetus to development. It turned out
that changes are not so terrible, but changes bring a new stage in the development of the
education system.
LITERATURE:
1. Collins, S. (2020). Covid 19 coronavirus: University of Auckland asks contract staff to work
for no pay. Retrieved 15.08.2020 from
https://www.nzherald.co.nz/nz/covid-19-coronavirus-university-of-auckland-asks-contract
-staff-to-work-for-no-pay/HF6ULPD36YARISA6QO6CZ2I6UI/
2. Filippova, L. (2020). Russian universities are adjusting the educational process due to the
coronavirus. Perviy kanal. Retrieved 15.08.2020 from
https://www.1tv.ru/news/2020-03-25/382610-v_rossiyskih_vuzah_iz_za_koronavirusa
_korrektiruyut_obrazovatelnyy_protsess
3. How to read the media? (2020). Universities go online: interview with Moscow State
University teacher Ekaterina Sivakova. Retrieved 15.08.2020 from
https://howtoreadmedia.ru/ru/what_is_media/read/vuzy-vykhodyat-v-onlayn-intervyu-s-
prepodavatelem-mgu-ekaterinoy-sivyakovoy/
4. Ilingin, A. (2020). 6 ways for remote teachers to get closer to their students. MEL. Retrieved
15.08.2020 from
https://mel.fm/blog/piar-sluzhba/53762-6-sposobov-kak-distantsionnomu-uchitelyu-stat-
blizhe-k-uchenikam Retrieved 15.08.2020
5. Klyagin, A. V., Makarieva, A. U. (2020). Cases of rapid reactions of universities during a
pandemic. Moscow: National Research University "Higher School of Economics".
Retrieved 15.08.2020 from https://ioe.hse.ru/sao_universitycases
6. Klyagin, A.V. et al. (2020). The storm of the first weeks: how higher education stepped into
the reality of a pandemic. Modern educational analytics. Moscow: National Research
University "Higher School of Economics", Institute of Education. No. 6 (36). pp. 29–54.
7. McKie, A. (2020). SOAS faces ‘viability problems’ amid pandemic crisis. Retrieved
15.08.2020 from https://www.timeshighereducation.com/news/soas-faces-viability-
problems-amid-pandemic-crisis-director-warns The Worid Yniversity Rankings. Retrieved
15.08.2020
8. MEL edition (2020). How Rostov University successfully transferred the entire university
to online education in two days. MEL. Retrieved 15.08.2020 from
https://mel.fm/distantsionnoye-obucheniye/7152364-rsue_online_education
9. Melnik, D. (2020). Higher education in the world: what problems were highlighted by the
pandemic. Retrieved 15.08.2020 from https://tass.ru/opinions/8306213
10. Msgeek (2020). Two years of digital transformation in two months. Habr. Retrieved
15.08.2020 from https://m.habr.com/ru/company/microsoft/blog/500556/

63rd International Scientific Conference on Economic and Social Development – "Building Resilient Society" - Zagreb, 11-12 December, 2020
258
11. National Research University "Higher School of Economics" (2020). Universities during a
storm. Retrieved 15.08.2020 from
https://ioe.hse.ru/news/368075821.html?fbclid=IwAR1lQt0drJ4vKyLeyyuaGqeW6-q-
SJkgWDBdrZW8zNgOkwFkfUOVi1uqmbI
12. National Research University "Higher School of Economics Retrieved" (2020). Institute of
Education, Five challenges for universities - five opinions of international experts.
Retrieved 15.08.2020 from https://ioe.hse.ru/news/359153775.html
13. Net.finam.ru (2020). Distance learning in extreme conditions. Interfax. Retrieved
15.08.2020 from https://academia.interfax.ru/ru/analytics/research/4491/
14. Pop, A. (2020). 10 Great European Distance Learning Universities. Studyportals. Retrieved
15.08.2020 https://www.distancelearningportal.com/articles/1308/10-great-european-
distance-learning-universities.html
15. PUL "University Development" (2020) April theses on the future of universities.
Challenges for higher education from COVID-19. Moscow: National Research University
"Higher School of Economics", Institute of Education. Retrieved 15.08.2020 from
https://ioe.hse.ru/data/2020/04/21/1560047503/%D0%9A%D0%B0%D1%80%D1%82%
D0%BE%D1%87%D0%BA%D0%B8%20%D0%B0%D0%BF%D1%80%D0%B5%D0
%BB%D1%8C%D1%81%D0%BA%D0%B8%D0%B5%20%D1%82%D0%B5%D0%B
7%D0%B8%D1%81%D1%8B%20(2).pdf
16. Savitskaya, N. (2020). After the pandemic, higher education will never be the same.
Nezavisimaya. Retrieved 15.08.2020 from http://www.ng.ru/education/2020-03-
25/8_7826_education1.html Retrieved 15.08.2020
17. Seale, C. (2020). Distance Learning During The Coronavirus Pandemic: Equity And Access
Questions For School Leaders. Forbes. Retrieved 15.08.2020 from https://www.forbes.com
/sites/colinseale/2020/03/17/distance-learning-during-the-coronavirus-pandemic-equity-
and-access-questions-for-school-leaders/#72b1342a1d4d

63rd International Scientific Conference on Economic and Social Development – "Building Resilient Society" - Zagreb, 11-12 December, 2020
259
CROATIA: Q1-Q3 2020 TOURISM RESULTS IN CONTEXT OF COVID-
19 PANDEMIC
Mario Basic
OTP banka d.d., Croatia
Mario Skoric
University Department of Professional Studies,
University of Split, Split, Croatia
ABSTRACT
COVID-19 pandemic outbreak caused slowdown of global tourism performance already in
March 2020, followed by freefall in second quarter amid worldwide travel restrictions and
lockdowns. Tourism as the most important industry in Croatia has been seriously affected by
pandemic related travel restrictions, with hotels facing the most serious decline year-on-year.
Usually tourists can autonomously choose where to travel and in other recent crisis events
dominantly only some specific areas were affected. During this pandemic there are no
unaffected areas, but some regions and accommodation types are more resistant than the
others. Lower number of confirmed COVID-19 cases and gradual reopening of Croatia in
summer months enabled partial rebound of tourism results in the country, however August
brought new slowdown of foreign arrivals of such magnitude that higher number of domestic
nights spent were not sufficient to compensate severe drop of tourist arrivals coming from other
important tourism markets. The goal of this paper is to analyse impact of COVID-19 pandemic
on recent tourism results in Croatia, with breakdown by accommodation type, most important
markets and local sub-regions. Analysis of different outcome depending on this breakdown
should indicate causes of more resistant areas and lead to some recommendations for advanced
destination management.
Keywords: COVID-19 pandemic, Croatia, tourism
1. INTRODUCTION
Over the last decades, tourism became not only one of the most important industries in the
world, but it also triggered various socio-cultural changes. However, since the outbreak of the
COVID-19 pandemic in 2019, the travel and tourism sector results experienced strong decline
around the world at different periods and degrees. Intensity and timing of the pandemic depend
on many variables, from location, health and social protection system, type of measures
introduced by each country and numerous other variables specific for different countries or
regions. During the 21st century, tourism survived several crises and none of them lasted longer
than two years, with global economic crisis as the one with most severe impact worldwide until
COVID-19 outbreak in 2019. At the moment of writing this paper, full effect of COVID-19
pandemic is still not fully known. According to UNWTO World Tourism Barometer and
Statistical Annex (August/September, 2020), extended scenarios for 2021-2024 point to a
strong rebound in 2021 based on the assumption of a reversal in the evolution of the pandemic,
significant improvement in traveller confidence and major lifting of travel restrictions by the
middle of the year. Nonetheless, the return to 2019 levels in terms of international arrivals could
take up to four years. Having in mind strong uncertainty around the COVID-19 pandemic, many
tourism researchers around the world are analysing numerous scenarios and its impact on all
aspects of life and business, including tourism. However, more comprehensive and precise
forecast will be possible once COVID-19 vaccine will be validated.

63rd International Scientific Conference on Economic and Social Development – "Building Resilient Society" - Zagreb, 11-12 December, 2020
260
When it comes to Croatia as one of the leading tourist destinations in Europe, it has to be noted
that tourism industry has been a major employer, one of the key pillars of the economy and the
largest source of foreign currency in the country. Main characteristic of the local tourism
industry is strong seasonality, with majority of overnights concentrated in the main (summer)
season, thus impact of COVID-19 pandemic was mostly determined by intensity of COVID-19
cases during these months in the country and most important markets. The goal of this document
is to analyse the impact of crisis events on tourism industry, with special focus on COVID-19
pandemic outbreak and its impact on tourism results in Croatia during the first nine months of
2020 when according to Croatian National Tourist Board (October, 2020) overall tourist
arrivals and tourist nights declined close to 60% and 50%, respectively. Using CNTB data, main
tourist markets by accommodation type and local sub-region are analysed as well.
2. TOURISM INDUSTRY IN CRISIS EVENTS WITH SPECIAL FOCUS ON COVID-19
PANDEMIC OUTBREAK
Crisis events are inevitable part of our lives, both private and business. As it is not possible to
avoid all of them, its negative impact has to be reduced taking into account specificity of each
such event. As explained by Hart, Heyse and Boin (2002), the world of crises and crisis
management has changed considerably over the past decades and one should be careful to
generalise the trends without any qualification. Tourism is an industry which is highly
susceptible to negative events and, since there is always a crisis somewhere in the world, the
sector appears to be under an almost permanent threat of another crisis looming (Pforr and
Hosie, 2008). This industry is dependent on many variables, with sudden crisis events as one
of the most important ones. Unfavourable images about the political, economic or social
situation are often distributed all over the world through numerous media channels (Glasser,
2003, Kesić and Pavlić, 2011). Safety aspect is of great importance when it comes to tourism
destination image and the decision-making process about whether or not to visit a certain
location (Martens, Feldesz and Merten, 2016). This aspect is especially significant in the
context of 2019 coronavirus pandemic when it comes to decision on final destination but also
whether to travel at all during the pandemic outbreak. Different nature of the crises creates
different effects on tourism and the rate of recovery. Rapid media uninterest means that normal
marketing effort will largely restore pre-crisis levels of tourism. However, where the crisis
includes a perception of risk, especially health, more comprehensive strategies appear
necessary. This includes management of the media, especially images displayed during the
crisis. Then in post-crisis period, aggressive marketing is needed that does not remind target
markets of the crisis, but presents an image of “business as usual” (Zeng, Carter and De Lacy,
2005).As per types of crisis events, Ritchie and Jiang (2019) elaborated that crises can be
categorized as endocrisis (representing triggers from within the sector) with a gradual change,
or exocrisis (representing triggers from outside the sector) which are hard to anticipate.
Figure 1: Basic breakdown of crisis categories
Source: Own illustration based on Ritchie and Jiang (2019)

63rd International Scientific Conference on Economic and Social Development – "Building Resilient Society" - Zagreb, 11-12 December, 2020
261
Pforr and Hosie (2008) stated that external shocks which are interently unpredictable make the
crises preparation an integral part of the industry’s operations and that proactive crisis
management should form an integral part of contemporary tourism business by making a case
for using preparation for any potential crisis in tourism as a strategic key to recovery. Having
the breakdown on endocrisis and exocrisis in mind, response of stakeholders on crisis situation
may differ depending on crisis type and intensity. As already proven, performance of tourism
industry is determined by every shock in the environment, no matter whether it is related to
political, social, medical or economic contraction, as it was already proven during the several
events over the last 20 years. According to May 2020 UNWTO World Tourism Barometer
analysis, it took eleven months for international arrivals to regain pre-crisis levels after the
SARS epidemic of 2003, 14 months after the USA September 11th attacks of 2001 and 19
months after the global economic and financial crisis of 2009.
Figure 2: Recovery duration of international arrivals crisis 2000-2020
Source: Own illustration based on May 2020 UNWTO World Tourism Barometer
Mihai and Toma (2020) elaborated how many countries depend on tourism, a sector that is
blocked by the current pandemic and its evolution cannot be anticipated, explaining that in
several European countries the share of tourism in GDP was significant in 2018 (25% Croatia,
22% Cyprus, 21% Greece, 19% Portugal). Among the most popular tourist destinations in the
world are the European countries such as France, Spain, Italy and Germany which will record
significant losses in the number of international tourists and receipts from international tourism
during the COVID-19 pandemic. Restrictive measures introduced to limit the spread of the
pandemic have affected the economic activity and paralyzed tourism activity. The economic
agents in the hospitality and tourism industry face serious challenges, being threatened by a
significant decrease in income, the danger of bankruptcy, with immediate consequences in
terms of job losses. Without urgent action and emergency funding to pass the period until the
resumption of tourist flows, many companies could go bankrupt in the coming period according
to Mihai and Toma. As elaborated by Zenker and Kock (2020), there are six main sub-topics
that constitute a starting point for a research agenda beyond obvious crisis-induced research
areas depending on complexity, changes in destination image, tourist behaviour, resident
behaviour, tourism industry in general and long-term and indirect effects, explaining that most
research on crises is focusing on immediate effects thereof, yet, in order to grasp the full impact
of the coronavirus pandemic, one has to take into account the long-term and indirect effects as
well.
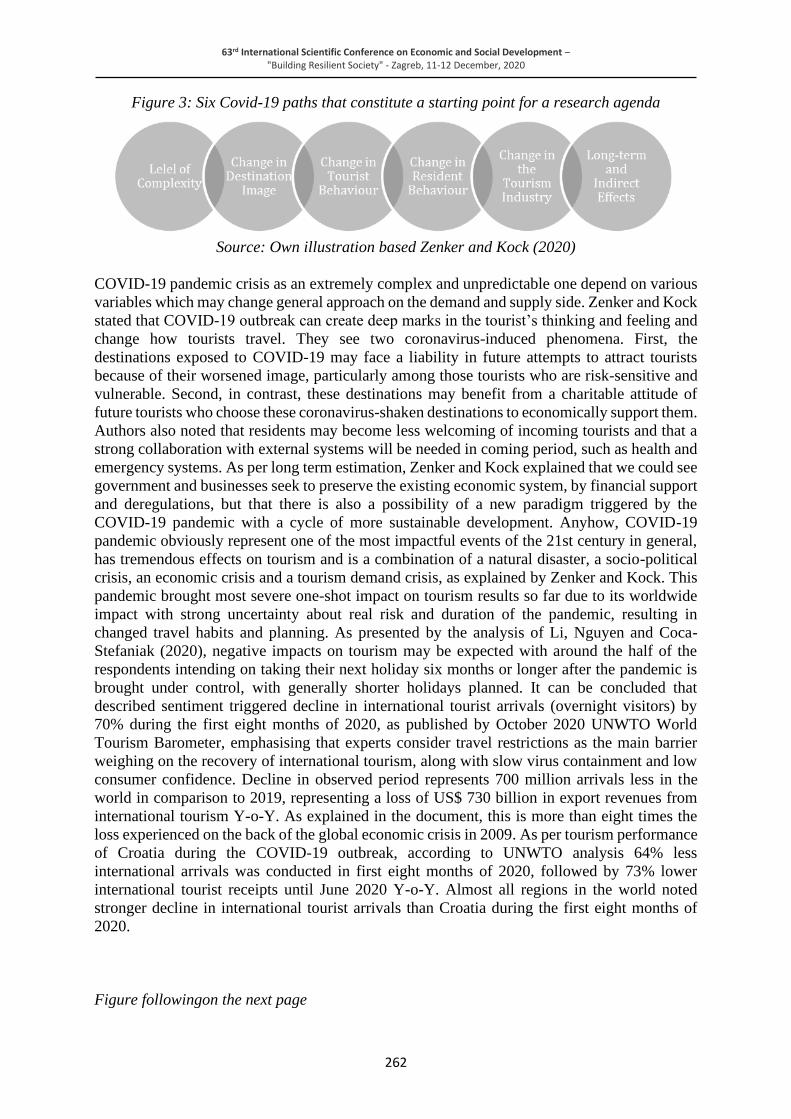
63rd International Scientific Conference on Economic and Social Development – "Building Resilient Society" - Zagreb, 11-12 December, 2020
262
Figure 3: Six Covid-19 paths that constitute a starting point for a research agenda
Source: Own illustration based Zenker and Kock (2020)
COVID-19 pandemic crisis as an extremely complex and unpredictable one depend on various
variables which may change general approach on the demand and supply side. Zenker and Kock
stated that COVID-19 outbreak can create deep marks in the tourist’s thinking and feeling and
change how tourists travel. They see two coronavirus-induced phenomena. First, the
destinations exposed to COVID-19 may face a liability in future attempts to attract tourists
because of their worsened image, particularly among those tourists who are risk-sensitive and
vulnerable. Second, in contrast, these destinations may benefit from a charitable attitude of
future tourists who choose these coronavirus-shaken destinations to economically support them.
Authors also noted that residents may become less welcoming of incoming tourists and that a
strong collaboration with external systems will be needed in coming period, such as health and
emergency systems. As per long term estimation, Zenker and Kock explained that we could see
government and businesses seek to preserve the existing economic system, by financial support
and deregulations, but that there is also a possibility of a new paradigm triggered by the
COVID-19 pandemic with a cycle of more sustainable development. Anyhow, COVID-19
pandemic obviously represent one of the most impactful events of the 21st century in general,
has tremendous effects on tourism and is a combination of a natural disaster, a socio-political
crisis, an economic crisis and a tourism demand crisis, as explained by Zenker and Kock. This
pandemic brought most severe one-shot impact on tourism results so far due to its worldwide
impact with strong uncertainty about real risk and duration of the pandemic, resulting in
changed travel habits and planning. As presented by the analysis of Li, Nguyen and Coca-
Stefaniak (2020), negative impacts on tourism may be expected with around the half of the
respondents intending on taking their next holiday six months or longer after the pandemic is
brought under control, with generally shorter holidays planned. It can be concluded that
described sentiment triggered decline in international tourist arrivals (overnight visitors) by
70% during the first eight months of 2020, as published by October 2020 UNWTO World
Tourism Barometer, emphasising that experts consider travel restrictions as the main barrier
weighing on the recovery of international tourism, along with slow virus containment and low
consumer confidence. Decline in observed period represents 700 million arrivals less in the
world in comparison to 2019, representing a loss of US$ 730 billion in export revenues from
international tourism Y-o-Y. As explained in the document, this is more than eight times the
loss experienced on the back of the global economic crisis in 2009. As per tourism performance
of Croatia during the COVID-19 outbreak, according to UNWTO analysis 64% less
international arrivals was conducted in first eight months of 2020, followed by 73% lower
international tourist receipts until June 2020 Y-o-Y. Almost all regions in the world noted
stronger decline in international tourist arrivals than Croatia during the first eight months of
2020.
Figure followingon the next page

63rd International Scientific Conference on Economic and Social Development – "Building Resilient Society" - Zagreb, 11-12 December, 2020
263
Figure 4: International Tourist Arrivals Jan-Aug 2020 Y-o-Y (provisional data)
Source: Own illustration based on UNWTO World Tourism Barometer (October 2020)
Asia and the Pacific, the first region to suffer the impact of the COVID-19 outbreak, declined
79% during the first eight months of 2020. Africa and the Middle East both recorded a 69%
drop this eightmonth period. Europe recorded almost 68% decline and Americas close to 65%
drop in observed period, according to UNWTO.
3. IMPACT OF COVID-19 PANDEMIC ON TOURISM IN CROATIA
Organization for Economic Co-operation and Development (OECD) published on 1st October
“The COVID-19 crisis in Croatia” paper elaborating that Croatia is highly dependent on
tourism, a sector which was among the most severely affected by the pandemic, which provides
around 25% of Croatian GDP. OECD stated that despite a significant drop in tourist visits in
2020, Croatia managed to salvage 50% of tourism revenues compared to the previous year,
which was an overachievement compared to initial expectations (set at around 30%). It is
crucial to perform regular analysis of volatility in tourism especially for the countries with
strong seasonality, with Croatia as one of the best examples in the world. Almost 90 percent of
visits in Croatia are usually registered during the „4 summer months“ (June, July, August and
September), so it is crucial to understand each deterioration or imbalance of touristic results,
especially during these peak months. A majority of destinations around the world launched
strict travel restrictions in March 2020. Croatia removed majority of restrictions for EU citizens
on 9th May, as one of the first countries decided to take this step. Majority of tourists in Croatia
are foreign ones, mostly from other EU countries, where travel restrictions were modified later
on. When analysing touristic nights spent in 2019 in Croatia, around 95% were related to first
nine months (January-September), so analysis of tourism performance in 2020 based on the
first nine months of 2020 can be taken into consideration as representative. As visible on the
Chart 1, caused by COVID-19 pandemic, tourism performance in Croatia declined at level
recorded in mid-2000s, representing slower deterioration in comparison to EU-27.

63rd International Scientific Conference on Economic and Social Development – "Building Resilient Society" - Zagreb, 11-12 December, 2020
264
Chart 1: Nights spent at EU-27 tourist accommodation establishments, EU-27 vs Croatia,
2005-2020 (index 2005=100, data for 2020 based on data for first seven months of 2020)
Source: data compilation of Eurostat (tour_occ_nim), Croatian Bureau of Statistics and
Croatian National Tourist Board data
Tourism in Croatia recorded stronger growth during the last 15 years in comparison to the EU
average, followed by slower decline during the COVID-19 pandemic crisis, according to
Eurostat and Croatian Bureau of Statistics. Sharp growth was delivered especially after the 2010
when tourism performance in Croatia reached its all time high result. COVID-19 outbreak
caused freefall in nights spent both in Croatia and EU, representing the first period with
downward trend after the global economic and financial crisis in 2009. Taking into account
only first seven months of 2020, decline in nights spent in Croatia was lower by around 10
percentage points in comparison to EU-27 area. This deterioration was not equally distributed
in regard to the breakdown on domestic and foreign tourists and it depend on country and each
specific region. As presented upon Chart 2, decline in nights spent within EU area was lower
within domestic guest category. This fact is especially important for the countries with majority
of tourists coming from abroad, like Croatia where around 90% of nights spent are related to
foreign guests.
Chart 2: Change in nights spent in EU tourist accommodation by origin of the guests, Jan-Jul
2020 compared to Jan-Jul 2019 (%)
Source: European Commission, Eurostat (tour_occ_nim)

63rd International Scientific Conference on Economic and Social Development – "Building Resilient Society" - Zagreb, 11-12 December, 2020
265
EU recorded stronger decline than Croatia in both categories and almost all months during the
COVID-19 pandemic outbreak. Somewhat better performance by local tourism industry was
driven by lower number of confirmed COVID-19 cases in late spring and changed sentiment in
most important markets in this period.
Chart 3: Change in nights spent in Croatia tourist accommodation by origin of the guests,
Jan-Jul 2020 compared to Jan-Jul 2019 (%)
Source: data compilation from Croatian National Tourist Board
In average, majority of nights spent in Croatia are related to two peak months (July and August)
and almost 60% of overall nights are conducted during these two months according to Croatian
Bureau of Statistics. Having this in mind, the overview of results in first nine months of 2020
should be representative when analysing Y-o-Y changes. Table 1 shows that after continuous
surge in pre-coronavirus period, strong decline was delivered in both categories, arrivals and
nights spent of tourists coming from all major markets Y-o-Y, with somewhat slower
deterioration of domestic tourist results which was expected due to measures introduced during
the pandemic.
Table 1: Arrivals and nights spent of domestic and foreign tourists in Croatia during Jan.-
Sept. 2020/2019, top 10 countries per nights spent in 2019
Source: data compilation from Croatian National Tourist Board
-100.00
-80.00
-60.00
-40.00
-20.00
-
20.00
January toJuly
January February March April May June July
Guests from Croatia Guests from foreign countries
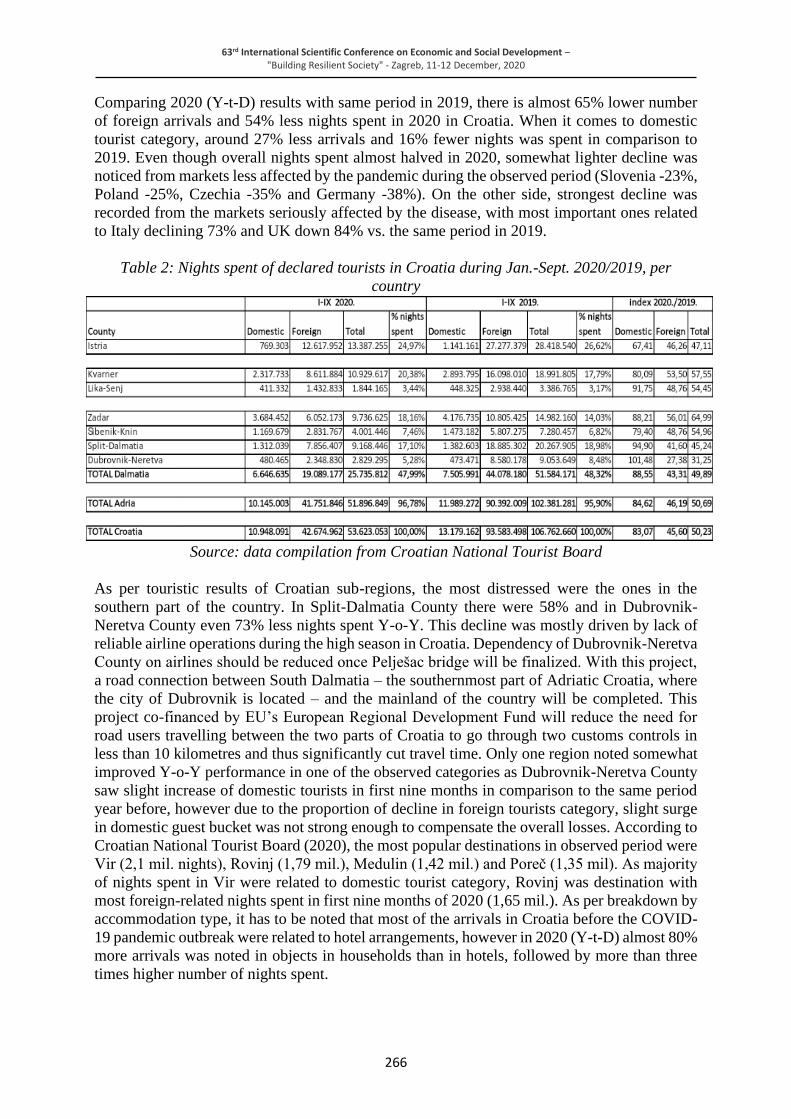
63rd International Scientific Conference on Economic and Social Development – "Building Resilient Society" - Zagreb, 11-12 December, 2020
266
Comparing 2020 (Y-t-D) results with same period in 2019, there is almost 65% lower number
of foreign arrivals and 54% less nights spent in 2020 in Croatia. When it comes to domestic
tourist category, around 27% less arrivals and 16% fewer nights was spent in comparison to
2019. Even though overall nights spent almost halved in 2020, somewhat lighter decline was
noticed from markets less affected by the pandemic during the observed period (Slovenia -23%,
Poland -25%, Czechia -35% and Germany -38%). On the other side, strongest decline was
recorded from the markets seriously affected by the disease, with most important ones related
to Italy declining 73% and UK down 84% vs. the same period in 2019.
Table 2: Nights spent of declared tourists in Croatia during Jan.-Sept. 2020/2019, per
country
Source: data compilation from Croatian National Tourist Board
As per touristic results of Croatian sub-regions, the most distressed were the ones in the
southern part of the country. In Split-Dalmatia County there were 58% and in Dubrovnik-
Neretva County even 73% less nights spent Y-o-Y. This decline was mostly driven by lack of
reliable airline operations during the high season in Croatia. Dependency of Dubrovnik-Neretva
County on airlines should be reduced once Pelješac bridge will be finalized. With this project,
a road connection between South Dalmatia – the southernmost part of Adriatic Croatia, where
the city of Dubrovnik is located – and the mainland of the country will be completed. This
project co-financed by EU’s European Regional Development Fund will reduce the need for
road users travelling between the two parts of Croatia to go through two customs controls in
less than 10 kilometres and thus significantly cut travel time. Only one region noted somewhat
improved Y-o-Y performance in one of the observed categories as Dubrovnik-Neretva County
saw slight increase of domestic tourists in first nine months in comparison to the same period
year before, however due to the proportion of decline in foreign tourists category, slight surge
in domestic guest bucket was not strong enough to compensate the overall losses. According to
Croatian National Tourist Board (2020), the most popular destinations in observed period were
Vir (2,1 mil. nights), Rovinj (1,79 mil.), Medulin (1,42 mil.) and Poreč (1,35 mil). As majority
of nights spent in Vir were related to domestic tourist category, Rovinj was destination with
most foreign-related nights spent in first nine months of 2020 (1,65 mil.). As per breakdown by
accommodation type, it has to be noted that most of the arrivals in Croatia before the COVID-
19 pandemic outbreak were related to hotel arrangements, however in 2020 (Y-t-D) almost 80%
more arrivals was noted in objects in households than in hotels, followed by more than three
times higher number of nights spent.

63rd International Scientific Conference on Economic and Social Development – "Building Resilient Society" - Zagreb, 11-12 December, 2020
267
Table 3: Arrivals of declared tourists in Croatia during Jan.-Sept. 2020/2019 per
accommodation type (commercial accommodation only)
Source: data compilation from Croatian National Tourist Board https://www.htz.hr/hr-
HR/informacije-o-trzistima/informacije-o-tijeku-sezone
According to CNTB data (Table 3), hotels recorded strong decline by more than 70% in nights
spent, followed by downturn in arrivals with campsite of around 55% and objects in households
decline of 53% and 43% in arrivals and nights spent, respectively. Performance in category of
hotels in nights spent in observed period was outperformed even by campsites, as 33% more
nights spent were recorded in campsites than in hotels. In 2020, objects in households delivered
higher average number of days spent per arrival compared to the same period year before (7 vs.
5,8).
4. CONCLUSION
It is already proven and well known that tourism industry in Croatia is marked by strong
seasonality followed by low share of hotel accommodation in the overall result. However, in
context of COVID-19 pandemic outbreak when accommodation in a hotel turned out to be less
resistant compared to campsites or even objects in households, we can conclude that these
shortages had mostly positive impact on local tourism in 2020. For example, during the summer
season most destinations in the country achieved higher than expected results having in mind
the environment and especially in comparison with EU area or worldwide overall result. As a
reaction to the COVID-19 outbreak, local government released a series of balanced measures
in order to boost tourism results during the summer months. During this period and especially
until August, most of the EU countries eased travel restrictions keeping arrivals and nights spent
during the peak months in Croatia elevated. Also, since great part of tourist arrivals in Croatia
is related to road transport, the uncertainty around the airline departures affected local tourism
less in comparison to other Mediterranean destinations. Having above mentioned in mind,
resolution of transportation alternative as well as balanced accommodation types in all regions
in Croatia should be important topic in coming period.
LITERATURE:
1. Brent W., R., Yawei, J. (2019), A review of research on tourism risk, crisis and disaster
management: Launching the annals of tourism research curated collection on tourism risk,
crisis and disaster management
2. Croatian Bureau of Statistics, www.dzs.hr , retrieved 01.11.2020
3. Croatian National Tourist Board, www.htz.hr, retrieved 27.10.2020
4. European Commission, https://ec.europa.eu/regional_policy/en/projects/croatia/new-
bridge-to-improve-road-connections-with-croatias-south-dalmatia-region,
retrieved 29.10.2020
5. European Commission, https://ec.europa.eu/eurostat/statistics-explained/index.php/
Tourism_statistics_-_nights_spent_at_tourist_accommodation_establishments, retrieved
3.11.2020
6. Glaesser, D. (2003), Crisis Management in the Tourism Industry
7. Hart, P., Heyse, L., Boin, A. (2002), New Trends in Crisis Management

63rd International Scientific Conference on Economic and Social Development – "Building Resilient Society" - Zagreb, 11-12 December, 2020
268
8. Li, J., Nguyen, T.H.H., Coca-Stefaniak, J.A. (2020), Coronavirus impacts on post-pandemic
planned travel behaviours
9. Kesić, T., Pavlić I. (2011), Tourism destination Image formation
10. Martens, H.M., Feldesz, K., Merten, P. (2016), Crisis Management in Tourism – A
Literature Based Approach on the Proactive Prediction of a Crisis and the Implementation
of Prevention Measures
11. Mihai, D., Toma, S. (2020), The International Tourism and the COVID-19 Pandemic –
Present and Perspectives
12. OECD https://www.oecd.org/south-east-europe/COVID-19-Crisis-in-Croatia.pdf,
retrieved 29.10.2020
13. Pforr, C., Hosie, P.J. (2008), Crisis Management in Tourism: Preparing for Recovery
14. UNWTO, www.unwto.org, retrieved 27.10.2020
15. Zeng, B., Carter, Rodney W., De Lacy, T. (2005), Short-term Perturbations and Tourism
Effects: The Case of SARS in China
16. Zenker, S., Kock, F. (2020), The coronavirus pandemic – A critical discussion of a tourism
research agenda

63rd International Scientific Conference on Economic and Social Development – "Building Resilient Society" - Zagreb, 11-12 December, 2020
269
THE APPLICATION OF THE HDI INDEX TO ASSESS THE SOCIO-
ECONOMIC DEVELOPMENT OF THE EU COUNTRIES IN 1990-2018
Monika Miskiewicz-Nawrocka
University of Economics in Katowice
1 Maja 50, 40-287 Katowice, Poland
ABSTRACT
The level of economic development of a country is attempted to be measured using various
indicators. One of the most popular and comprehensive measures of the performance of the
entire economy is GDP. However, as a measure of welfare it is not a perfect measure because
it is calculated in current prices and takes into account only the financial aspect. While socio-
economic development also has non-financial aspects. It also depends on the knowledge,
awareness and health of the inhabitants. An alternative approach is the HDI index, used by the
UNDP (United Nations Development Program) to classify countries according to the broadly
understood quality of life of their inhabitants. The HDI is a synthetic measure that takes into
account the three main characteristics of socio-economic development: healthy life expectancy,
education and a fair standard of living. Healthy life expectancy is expressed as the average life
expectancy of newborns. The second feature is related to access to education and is expressed
by the average number of years of education for the population aged 25 and over and the
expected number of years of education for children starting education. While the standard of
living is estimated on the basis of the national income per capita calculated according to the
parity of the labor force. Currently, HDI is estimated as the geometric mean of the indices
describing each of the above-mentioned features. On the basis of the HDI, all countries can be
divided into 4 groups: very high human development, high human development, medium human
development, low human development. The aim of the study is to assess the level of socio-
economic development of EU countries using the HDI index. It will also be examined whether
it was gaining strength in the period under study and whether the differences between countries
deepened or blurred over time. The study took into account Eurostat data for the years 1990,
2000, 2010 and 2018.
Keywords: education, HDI index, healthy life expectancy, socio-economic development,
standard of living
1. INTRODUCTION
The Human Development Index (HDI) is a summary measure used to describe the level of
socio-economic development of territorial units. It is based on three dimensions: a long and
healthy life, access to knowledge and a decent standard of living. On its basis, UNDP (United
Nations Development Program) prepares an annual ranking of countries from the most to the
least developed. Norway has been at the top of the ranking since 2009, for which HDI = 0.954
in 2018. The next places were taken by Switzerland (0.946) and Ireland (0.942). The worst
situation was recorded for Niger (0.377) and Central African Republic (0.381). The aim of the
study is to assess the level of socio-economic development of EU countries using the HDI index
and its components. It was examined whether the HDI was gaining strength in the analyzed
period and whether the differences between countries deepened or blurred over time. The study
also examined spatial relationships between EU countries in terms of the analyzed
phenomenon.
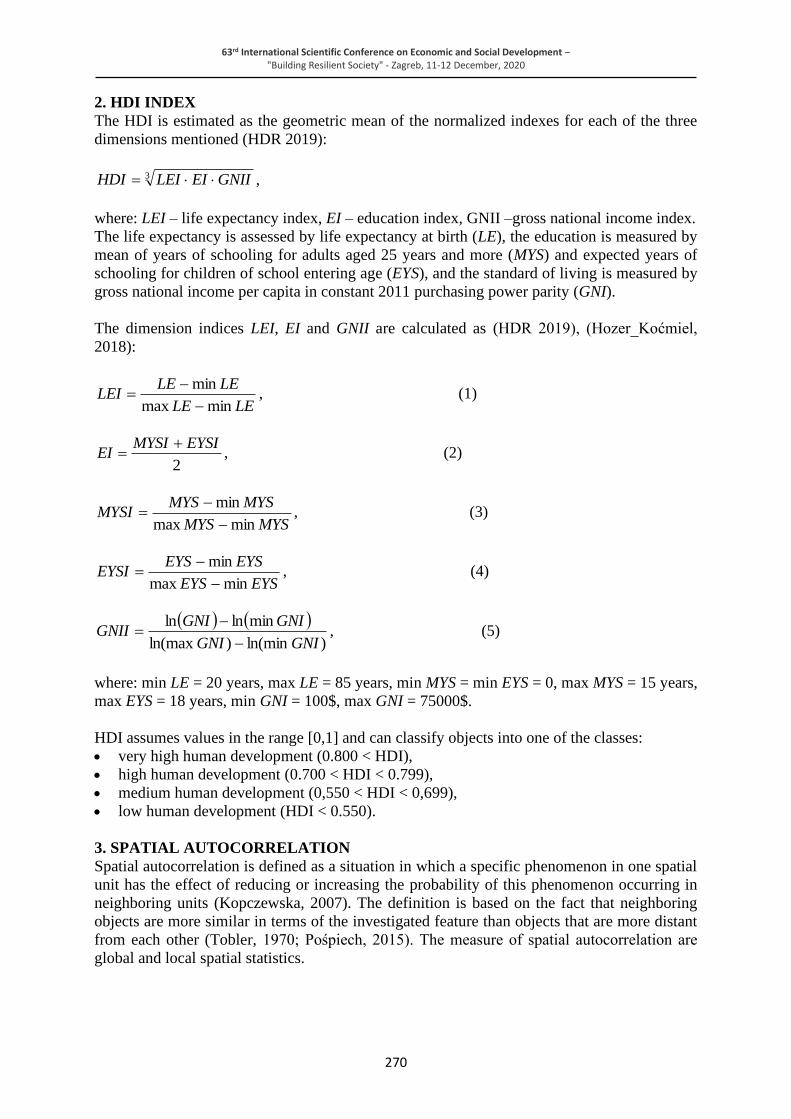
63rd International Scientific Conference on Economic and Social Development – "Building Resilient Society" - Zagreb, 11-12 December, 2020
270
2. HDI INDEX
The HDI is estimated as the geometric mean of the normalized indexes for each of the three
dimensions mentioned (HDR 2019):
3 GNIIEILEIHDI = ,
where: LEI – life expectancy index, EI – education index, GNII –gross national income index.
The life expectancy is assessed by life expectancy at birth (LE), the education is measured by
mean of years of schooling for adults aged 25 years and more (MYS) and expected years of
schooling for children of school entering age (EYS), and the standard of living is measured by
gross national income per capita in constant 2011 purchasing power parity (GNI).
The dimension indices LEI, EI and GNII are calculated as (HDR 2019), (Hozer_Koćmiel,
2018):
LELE
LELELEI
minmax
min
−
−= , (1)
2
EYSIMYSIEI
+= , (2)
MYSMYS
MYSMYSMYSI
minmax
min
−
−= , (3)
EYSEYS
EYSEYSEYSI
minmax
min
−
−= , (4)
( ) ( ))ln(min)ln(max
minlnln
GNIGNI
GNIGNIGNII
−
−= , (5)
where: min LE = 20 years, max LE = 85 years, min MYS = min EYS = 0, max MYS = 15 years,
max EYS = 18 years, min GNI = 100$, max GNI = 75000$.
HDI assumes values in the range [0,1] and can classify objects into one of the classes:
• very high human development (0.800 < HDI),
• high human development (0.700 < HDI < 0.799),
• medium human development (0,550 < HDI < 0,699),
• low human development (HDI < 0.550).
3. SPATIAL AUTOCORRELATION
Spatial autocorrelation is defined as a situation in which a specific phenomenon in one spatial
unit has the effect of reducing or increasing the probability of this phenomenon occurring in
neighboring units (Kopczewska, 2007). The definition is based on the fact that neighboring
objects are more similar in terms of the investigated feature than objects that are more distant
from each other (Tobler, 1970; Pośpiech, 2015). The measure of spatial autocorrelation are
global and local spatial statistics.

63rd International Scientific Conference on Economic and Social Development – "Building Resilient Society" - Zagreb, 11-12 December, 2020
271
Global I Moran statistics is used to test the global spatial autocorrelation between adjacent units
and expressed as (Suchecki, 2010):
( )( )
( )
= ==
= =
−
−−
==n
i
n
i
i
n
j
ij
j
n
i
n
j
iij
xxw
xxxxwn
S
nI
1 1
2
1
1 1
0 zz
WzzT
T
, (6)
where: ji xx , - values of variables in the spatial unit i and j, x - arithmetic mean of the variable
value for all units, 11
−==nini xxzz ,
nnijw
=W - matrix of spatial weights given by the
formula:
=
= ji
ji
ji
ijw
when
unit th-neighbor a not isunit th- when
unit th-neighbor a isunit th- when
,0
,0
,1
,
= =
=n
i
n
j
ijwS1 1
0 , n – number of spatial units, nji ...,,1, = .
The distribution of the Moran I statistic is asymptotically normal and its statistical significance
is verified by statistic (Cliff and Ord, (1973):
( )( )
( )1,0~ NIVar
IEIZ I
−= , (7)
where: ( )1
1
−−=
nIE - the expected value of Moran statistic,
( )IVar - the variance of Moran statistics, which, assuming the normality or randomness of the
sample, is expressed by formulas:
( )( ) ( )22
02
2021
2
1
1
1
3
−−
−
+−=
nSn
SnSSnIVar , (8)
( )( ) ( )
( )( )( ) ( )22
0
2
021
22
021
2
1
1
321
62333
−−
−−−
+−−−+−+−=
nSnnn
SnSSnnkSnSSnnnIVar , (9)
( )= =
+=n
i
n
j
jiij wwS1 1
2
12
1,
2
1 11
2 = ==
+=
n
i
n
j
ji
n
j
ij wwS ,
( )
( )2
2
4
1
1
−
−
=
i
i
i
i
xxn
xxn
k ,
other symbols as above.

63rd International Scientific Conference on Economic and Social Development – "Building Resilient Society" - Zagreb, 11-12 December, 2020
272
Positive and significant values of the I statistics mean the similarity of the investigated spatial
objects (positive autocorrelation), while negative values of the I statistics mean the
differentiation of the investigated objects (negative autocorrelation). For positive spatial
autocorrelation we have: 1
1
−−
nI and 0IZ , while for negative autocorrelation:
1
1
−−
nI
and 0IZ . Lack of autocorrelation means spatial randomness and the relationships are true:
1
1
−−
nI oraz 0IZ .
Moran's local statistics are given by the formula (Suchecki, 2010):
( ) ( )
( )
=
=
−
−−
=n
i
i
n
j
jiji
i
xxn
xxwxx
I
1
2
1
*
1, (10)
where: nnijw
= **
W - standardized weight matrix according to the formula:
=
=n
j
ij
ij
ij
w
ww
1
* , (11)
other symbols as above.
The distribution of the local Moran statistics is also asymptotically normal, and its statistical
significance is tested using the statistical data (Anselin, 1995):
( )( )i
iiIi
IVar
IEIZ
−= , (12)
where:
( )1
1
−−=
=
n
w
IE
n
j
ij
i - the expected value of local Moran I statistic iI ,
( )
( ) ( )
( )( )
2
2
121
22
1
−−
−−
−
+−
−
=
n
w
nn
wwnk
n
wkn
IVarji
ij
il ih
ihilji
ij
i - the variance of Moran statistics iI
other symbols as above.
Local Moran statistics, unlike the global one, allow to determine local interactions between
spatial objects.

63rd International Scientific Conference on Economic and Social Development – "Building Resilient Society" - Zagreb, 11-12 December, 2020
273
It measures whether a spatial unit is surrounded by neighboring regions with similar or different
values of the studied variable in relation to the random distribution of these values in space
(Ojrzyńska, Twaróg, 2011). Standardized local Moran statistics take positive values when the
object is surrounded by similar neighbor regions with similar values of the studied variable
(positive autocorrelation). On the other hand, if the local Moran statistic takes negative values,
it means that the object is surrounded by regions with significantly different values of the
analyzed variable (negative autocorrelation). (Ojrzyńska, Twaróg, 2011)
4. EMPIRICAL ANALYSIS
The subject of the research was 28 countries that belonged to the EU in 2018. The study
included data for 1990, 2000, 2010 and 2018. For each studied country, the following variables
were taken into account: life expectancy at birth, mean years of schooling of adults, expected
years of schooling of children, GNI and HDI. The data used for the analysis come from the
UNDP database. (http://hdr.undp.org/en/data). In the first stage of the study, the LEI, EI, GNII
indexes, the ratio of the maximum value to the minimum value of each of the selected indicators
and single-base indexes expressing the change in the level of the above-mentioned measures in
2018 compared to the level in 1990 were estimated. Next, country differences were research
using classical measures of standard deviation variation and the coefficient of variation. In the
last stage of the study, spatial correlations between the studied countries were researched in
terms of selected indicators. Table 1 presents the LEI values, basic statistics for LEI and single-
base indexes for selected countries in 1990, 2000, 2010 and 2018. Analyzing the data in Table
1, it can be noticed that in analyzed years life expectancy increased in all the studied countries
and the highest values were reached in 2018. This means that in 2018 people on average live
longer than in previous years (5 years longer compared to 1990). The highest values of life
expectancy in the analyzed years were recorded for Spain, Italy, Sweden, France and Malta,
which means that the inhabitants of these countries, on average, live longer than in other
countries. The lowest values of life expectancy were recorded for Latvia, Romania, Lithania
and Bulgaria. The inhabitants of these countries live, on average, shorter than the rest of the
EU. On the basis of the single-base index, the dynamics of the studied variable in 2018
compared to 1990 was characterized. The pace of changes in life expectancy varies, but
increases have been recorded for all countries. The highest increase in LEI compared to 1990
was recorded for Estonia, Poland, Slovenia and Hungary, while the lowest for Bulgaria, Cyprus,
Sweden and Netherland.
Table following on the next page

63rd International Scientific Conference on Economic and Social Development – "Building Resilient Society" - Zagreb, 11-12 December, 2020
274
1990 2000 2010 2018 2018/1990
Austria 0,855 0,895 0,932 0,945 1,104
Belgium 0,860 0,891 0,925 0,946 1,100
Bulgaria 0,789 0,792 0,826 0,845 1,070
Croatia 0,805 0,843 0,874 0,897 1,115
Cyprus 0,871 0,892 0,914 0,935 1,074
Czech Republic 0,798 0,845 0,886 0,911 1,141
Denmark 0,845 0,872 0,914 0,935 1,107
Estonia 0,760 0,775 0,851 0,902 1,186
Finland 0,851 0,889 0,925 0,949 1,116
France 0,874 0,908 0,946 0,962 1,100
Germany 0,854 0,892 0,925 0,942 1,103
Greece 0,871 0,902 0,931 0,955 1,097
Hungary 0,758 0,795 0,838 0,872 1,150
Ireland 0,843 0,875 0,926 0,955 1,133
Italy 0,875 0,917 0,954 0,975 1,114
Latvia 0,755 0,765 0,812 0,849 1,124
Lithuania 0,780 0,785 0,812 0,857 1,099
Luxembourg 0,849 0,888 0,929 0,955 1,125
Malta 0,875 0,908 0,937 0,960 1,097
Netherlands 0,877 0,895 0,935 0,955 1,089
Poland 0,782 0,826 0,866 0,900 1,152
Portugal 0,838 0,872 0,923 0,952 1,136
Romania 0,762 0,777 0,832 0,860 1,129
Slovakia 0,788 0,820 0,854 0,883 1,121
Slovenia 0,818 0,860 0,914 0,942 1,150
Spain 0,880 0,912 0,952 0,975 1,108
Sweden 0,886 0,918 0,946 0,965 1,089
United Kingdom 0,857 0,889 0,929 0,942 1,099
max/min 1,173 1,201 1,174 1,155
mean 0,831 0,861 0,900 0,926
standard deviation 0,043 0,048 0,045 0,040
coefficient of variation 0,052 0,056 0,049 0,043
Table 1: LEI index for EU countries
Table 2 presents the education index (EI), basic statistics for EI and single-base indexes for
selected countries in 1990, 2000, 2010 and 2018. In 1990, the highest values were recorded for
Belgium, Spain and Hungary, while the worst situation in terms of the number of years
education was in Romania, Greece and Lithuania. In 2018, the most favorable situation was
recorded for Crotia, Estonia, Cyprus and Latvia, while Luxemburg and Netherland were
characterized by the lowest LEI values. For all countries in 2018. there was an increase in the
LEI compared to 1990, with Greece being the highest and Hungary the lowest. The ratio of the
maximum value to the minimum value has decreased from 1.505 in 1990 to 1.251 in 2018,
which shows that the differences in the number of years of education between countries have
decrised.
Table following on the next page

63rd International Scientific Conference on Economic and Social Development – "Building Resilient Society" - Zagreb, 11-12 December, 2020
275
1990 2000 2010 2018 2018/1990
Austria 0,602 0,731 0,714 0,871 1,448
Belgium 0,748 0,831 0,779 0,892 1,192
Bulgaria 0,674 0,675 0,753 0,873 1,295
Croatia 0,631 0,655 0,879 0,951 1,506
Cyprus 0,666 0,678 0,927 0,945 1,420
Czech Republic 0,667 0,739 0,783 0,811 1,216
Denmark 0,659 0,807 0,793 0,831 1,259
Estonia 0,633 0,807 0,858 0,949 1,500
Finland 0,606 0,802 0,850 0,801 1,322
France 0,631 0,741 0,878 0,893 1,417
Germany 0,656 0,823 0,853 0,816 1,245
Greece 0,534 0,673 0,832 0,907 1,696
Hungary 0,705 0,734 0,767 0,812 1,151
Ireland 0,598 0,816 0,779 0,866 1,447
Italy 0,682 0,701 0,896 0,936 1,371
Latvia 0,673 0,708 0,838 0,941 1,398
Lithuania 0,546 0,757 0,901 0,804 1,475
Luxembourg 0,599 0,716 0,768 0,759 1,268
Malta 0,697 0,651 0,803 0,823 1,181
Netherlands 0,589 0,821 0,784 0,764 1,297
Poland 0,611 0,778 0,872 0,881 1,442
Portugal 0,608 0,660 0,856 0,818 1,346
Romania 0,497 0,655 0,760 0,797 1,602
Slovakia 0,692 0,710 0,893 0,890 1,287
Slovenia 0,693 0,795 0,832 0,939 1,354
Spain 0,708 0,716 0,852 0,917 1,294
Sweden 0,644 0,902 0,780 0,824 1,280
United Kingdom 0,605 0,837 0,872 0,790 1,306
max/min 1,505 1,387 1,297 1,252
mean 0,638 0,747 0,827 0,861
standard deviation 0,056 0,067 0,053 0,059
coefficient of variation 0,088 0,090 0,064 0,069
Table 2: EI index for UE cuntries
Table 3 shows the GNII index, basic statistics for GNII and single-base indexes for selected
countries in 1990, 2000, 2010 and 2018. When analyzing changes in the GNI index, it can be
noticed that for most countries in the analyzed years there was an increase in the analyzed index,
except for Malta, Austria , Lithuania, Luxembourg, Belgium and Slovakia. The largest
increases in the index were recorded for Estonia, Cyprus and Finland, and the smallest increases
for Netherland and Hungary. At the beginning of the analyzed period, Austria, Slovakia,
Belgium, Netherland and Lithuania were characterized by values higher than the average value
of the GNII index, while in 2018 - values lower than the average for other countries. This means
that the economic growth rate in these countries was lower than in other EU countries. The ratio
of the maximum value to the minimum value decreases from 1.513 in 1990 to 1.228 in 2018,
which shows that the differences in economic development between countries have been
decreased.
Table following on the next page

63rd International Scientific Conference on Economic and Social Development – "Building Resilient Society" - Zagreb, 11-12 December, 2020
276
1990 2000 2010 2018 2018/1990
Austria 0,967 0,899 0,842 0,842 0,871
Belgium 0,872 0,898 0,890 0,860 0,986
Bulgaria 0,757 0,674 0,757 0,927 1,224
Croatia 0,859 0,760 0,907 0,935 1,088
Cyprus 0,695 0,845 0,910 0,929 1,337
Czech Republic 0,852 0,806 0,896 0,907 1,065
Denmark 0,800 0,910 0,852 0,833 1,042
Estonia 0,671 0,759 0,841 0,912 1,358
Finland 0,747 0,883 0,788 0,980 1,311
France 0,716 0,886 0,853 0,872 1,218
Germany 0,766 0,891 0,805 0,846 1,105
Greece 0,801 0,834 0,808 0,939 1,172
Hungary 0,865 0,777 0,875 0,876 1,013
Ireland 0,769 0,881 0,982 0,849 1,105
Italy 0,753 0,891 0,891 0,932 1,238
Latvia 0,869 0,712 0,918 0,919 1,057
Lithuania 0,820 0,723 0,914 0,798 0,972
Luxembourg 0,865 1,010 0,845 0,851 0,983
Malta 1,016 0,828 0,832 0,865 0,851
Netherlands 0,825 0,915 0,778 0,827 1,002
Poland 0,801 0,753 0,812 0,863 1,078
Portugal 0,808 0,837 0,890 0,884 1,094
Romania 0,751 0,701 0,802 0,822 1,095
Slovakia 0,875 0,762 0,922 0,869 0,993
Slovenia 0,870 0,819 0,810 0,955 1,097
Spain 0,863 0,861 0,920 0,903 1,046
Sweden 0,843 0,893 0,872 0,885 1,050
United Kingdom 0,779 0,877 0,927 0,890 1,142
max/min 1,513 1,499 1,298 1,228
mean 0,817 0,832 0,862 0,885
standard deviation 0,074 0,078 0,054 0,044
coefficient of variation 0,091 0,093 0,062 0,049
Tabel 3: GNII index for UE countries
Table 4 presents the HDI index, basic statistics for HDI and single-base indexes for selected
countries in EU countries in 1990, 2000, 2010 and 2018. In the analyzed years, all the European
countries considered belong to the group of very highly or highly developed. The lowest HDI
values were recorded for Croatia, Bulgaria, Latvia and Romania, while the highest values for
Netherlands, Sweden and Germany. In 1990, Slovenia was among the countries with the highest
HDI value, which in the following years was much lower in the ranking. In 2018, there was a
clear increase in HDI for all the analyzed countries compared to 1990. In 2018, there was a
clear increase in HDI for all the countries surveyed compared to 1990. In analyzed the period,
the highest increases in HDI were recorded for Croatia and Ireland, while the lowest for
Slovenia and Netherlands. When analyzing the ratio of the maximum value to the minimum
value, it can be noticed that in the years 1990-2000 the differentiation between the selected
countries in terms of socio-economic development deepened, while in the following years it
decreased. In 1990. the maximum HDI value was 23.9% higher than the minimum value, in
2010 it was higher by 26.5%, while in 2018 it was was higher by 15.4%. Estimated classical
measures of differentiation (standard deviation, coefficient of variation) confirm this regularity.
Table following on the next page

63rd International Scientific Conference on Economic and Social Development – "Building Resilient Society" - Zagreb, 11-12 December, 2020
277
Country 1990 2000 2010 2018 2018/1990
Austria 0,795 0,838 0,895 0,914 1,149686
Belgium 0,806 0,873 0,903 0,919 1,140199
Bulgaria 0,694 0,712 0,779 0,816 1,175793
Croatia 0,67 0,749 0,811 0,837 1,249254
Cyprus 0,731 0,799 0,85 0,873 1,194254
Czechia 0,73 0,796 0,862 0,891 1,220548
Denmark 0,799 0,863 0,91 0,93 1,163955
Estonia 0,73 0,78 0,844 0,882 1,208219
Finland 0,784 0,858 0,903 0,925 1,179847
France 0,78 0,842 0,872 0,891 1,142308
Germany 0,801 0,869 0,92 0,939 1,172285
Greece 0,753 0,796 0,857 0,872 1,158035
Hungary 0,704 0,769 0,826 0,845 1,200284
Ireland 0,764 0,857 0,89 0,942 1,232984
Italy 0,769 0,83 0,871 0,883 1,148244
Latvia 0,698 0,728 0,817 0,854 1,223496
Lithuania 0,732 0,755 0,824 0,869 1,187158
Luxembourg 0,791 0,86 0,893 0,909 1,149178
Malta 0,744 0,787 0,847 0,885 1,189516
Netherlands 0,83 0,876 0,911 0,934 1,125301
Poland 0,712 0,785 0,835 0,872 1,224719
Portugal 0,711 0,785 0,822 0,85 1,195499
Romania 0,701 0,709 0,797 0,816 1,164051
Slovakia 0,739 0,763 0,829 0,857 1,159675
Slovenia 0,829 0,824 0,881 0,902 1,088058
Spain 0,754 0,825 0,865 0,893 1,18435
Sweden 0,816 0,897 0,906 0,937 1,148284
United Kingdom 0,775 0,867 0,905 0,92 1,187097
max/min 1,239 1,265 1,181 1,154
mean 0,755 0,810 0,862 0,888
standard deviation 0,043 0,052 0,038 0,036
coefficient of variation 0,057 0,064 0,045 0,040
Table 4: HDI for UE countries
In the next stage of the research, the spatial autocorrelation of LEI, EI, GNII and HDI indices
in the EU countries in 1990, 2000, 2010 and 2018 was estimated. The values of the global
Moran I statistics are presented in tables 5-8, respectively.
I E(I) Var(I) I(S) p-value
1990 0,5751 -0,0370 0,0223 4,0955 0,00002
2000 0,5620 -0,0370 0,0221 4,0322 0,00003
2010 0,5657 -0,0370 0,0220 4,0589 0,00002
2018 0,5213 -0,0370 0,0219 3,7699 0,00008
Table 5: Global Moran I statistics values for LEI estimated for EU countries
I E(I) Var(I) I(S) p-value
1990 -0,2424 -0,0370 0,0213 -1,4069 0,9203
2000 0,2775 -0,0370 0,0220 2,1195 0,0170
2010 -0,0490 -0,0370 0,0221 -0,0801 0,5319
2018 0,0976 -0,0370 0,0224 0,9002 0,1840
Table 6: Global Moran I statistics values for EI estimated for EU countries
I E(I) Var(I) I(S) p-value
1990 0,3890 -0,0370 0,0209 2,9456 0,0016
2000 0,5879 -0,0370 0,0217 4,2422 0,00001
2010 0,5958 -0,0370 0,0219 4,2773 0,00001
2018 0,5456 -0,0370 0,0219 3,9400 0,00004
Table 7: Global Moran I statistics values for GNII estimated for EU countries

63rd International Scientific Conference on Economic and Social Development – "Building Resilient Society" - Zagreb, 11-12 December, 2020
278
I E(I) Var(I) I(S) p-value
1990 0,3890 -0,0370 0,0221 2,8644 0,0021
2000 0,5932 -0,0370 0,0221 4,2424 0,00001
2010 0,5698 -0,0370 0,0221 4,0802 0,00002
2018 0,5256 -0,0370 0,0221 3,7874 0,0001
Table 8: Global Moran I statistics values for HDI estimated for EU countries
Based on the data presented in Tables 5-8, it can be concluded that in the analyzed years the
values of the global Moran I statistics are statistically significant and higher than the expected
value. The exception is the EI index in 1990, 2000 and 2018. Thus, there is a positive spatial
autocorrelation due to the level of the investigated features between EU countries, which means
the forming of clusters of countries with a similar level of LEI, GNII and HDI. At the same
time, the decrease in the value of the I Moran statistics in the analyzed years due to the average
life expectancy suggests a weakening of the spatial dependence. On the other hand, the increase
in the value of the global I Moran statistics for GNII and HDI means strengthening the spatial
dependence of countries due to the GNI level and HDI level. The next stage of the study was
to estimate the local values of Moran's statistics in order to identify the spatial structure. The
calculated values of the Ii statistics for the EU countries in 1990, 2000, 2010 and 2018 are given
in Tables 9 and 10. The significant values of Moran's local statistics are marked in bold.
LEI EI
1990 2000 2010 2018 1990 2000 2010 2018
Austria -0,2045 -0,0872 -0,0838 -0,0602 -0,5143 -0,0126 -0,4055 0,0195
Belgium 0,5236 0,4533 0,4100 0,3605 -0,6760 0,5240 0,0975 -0,4659
Bulgaria 0,3241 0,6323 0,7020 0,9368 -1,4121 1,3359 0,8040 -0,0312
Croatia 0,5937 0,2506 0,3225 0,3472 -0,1273 -0,3634 -0,5128 0,3770
Cyprus 0,8745 0,5549 0,2072 0,1818 -0,9217 1,1471 0,1680 1,1119
Czech Republic 0,1915 0,0156 0,0435 0,0811 0,0212 -0,0229 -0,0980 -0,0546
Denmark 0,1765 0,1576 0,1653 0,0968 0,1256 1,0155 -0,3124 0,3835
Estonia 2,8790 3,5282 2,1971 1,1843 -0,0540 -0,5149 0,1185 2,0322
Finland 0,6072 0,7085 0,5605 0,5820 -0,0634 1,8921 -0,3815 0,6263
France 0,7756 0,7941 0,8445 0,7538 -0,0922 -0,0147 0,0484 0,0305
Germany 0,1499 0,2282 0,2006 0,1297 0,0031 0,3971 -0,2820 0,2932
Greece -0,0132 -0,3233 -0,4650 -0,6765 -1,0590 1,1701 0,0221 0,6360
Hungary 0,9803 0,6082 0,5951 0,7012 -0,3140 0,1064 0,2378 -0,4039
Ireland 0,1779 0,1800 0,3759 0,2982 0,4085 1,3792 -0,7571 -0,0995
Italy 0,6109 0,7734 0,8619 0,8287 0,2564 0,1851 -0,4820 0,4482
Latvia 2,4712 3,3373 3,0496 2,2746 -0,5444 -0,2991 0,2005 0,3732
Lithuania 1,7047 2,1390 2,7086 2,2489 -0,1202 -0,0079 0,7291 -0,8031
Luxembourg 0,3227 0,4203 0,4580 0,4534 -0,5014 -0,3589 -0,2054 -0,1855
Malta -0,6309 -0,3565 -0,4881 -0,6306 -0,1221 1,9807 -0,4357 -0,9747
Netherlands 0,6608 0,4598 0,4288 0,3419 -1,0011 1,3211 0,1610 0,1869
Poland 0,6810 0,3767 0,5353 0,4557 -0,0197 0,0722 0,4864 -0,1731
Portugal -0,3007 -0,4256 -0,5678 -0,4106 0,0457 -1,1580 0,3178 -1,0756
Romania 2,1251 2,4107 2,3304 2,8269 -2,3255 0,8685 1,5748 0,3372
Slovakia 0,7477 0,3561 0,4579 0,5138 0,1450 0,0110 -0,9941 -0,1443
Slovenia 0,0470 -0,0006 -0,0049 -0,0349 0,3103 -0,4483 -0,0216 0,7077
Spain 1,2403 1,0941 1,2802 1,3527 0,7202 0,1289 0,3325 0,7118
Sweden 0,6072 0,7085 0,5605 0,5820 -0,0634 1,8921 -0,3815 0,6263
United Kingdom 0,1779 0,1800 0,3759 0,2982 0,4085 1,3792 -0,7571 -0,0995
Table 9: Local Moran statistics values for LEI and LE
Based on the data in Table 9, it can be seen that in the analyzed period, the local Moran statistics
for the LEI are significant and greater than 0 for France, Hungary, Latvia, Lithuania, Romania
and Spain. This means that these countries form the so-called clusters, i.e. objects surrounded
by individuals with a significantly similar level of development of the average life expectancy.

63rd International Scientific Conference on Economic and Social Development – "Building Resilient Society" - Zagreb, 11-12 December, 2020
279
A similar situation can be observed in the case of Estonia (1990, 2000, 2010), Italy (2000, 2010,
2018), Poland (1990) and Slovakia (1990). In 2018. the local Moran statistics estimated for EI
are significant and greater than 0 for Estonia and Slovenia, in 2010 for Romania, and in 2000
for Bulgaria, Finland, Greece, Malta, Netherlands and Sweden. This means that the above-
mentioned countries form clusters with a significantly similar level of education development
as expressed by EI. In 1990, the local Moran statistics are irrelevant.
GNII HDI
1990 2000 2010 2018 1990 2000 2010 2018
Austria 0,3573 -0,0820 -0,0330 -0,2955 0,1581 -0,0117 0,0830 -0,0538
Belgium -0,2396 1,0300 -0,4028 0,4531 1,2211 1,1464 1,1892 0,8843
Bulgaria 0,4448 1,6804 2,1047 -0,0972 0,8980 2,0801 1,9742 2,3993
Croatia 0,3881 0,3995 -0,2967 0,8224 -0,6076 0,2755 0,2351 0,5623
Cyprus 0,3515 0,0043 -0,9015 1,2657 0,0230 0,0459 0,0455 0,2102
Czech Republic 0,2209 0,0217 -0,1995 -0,3443 -0,0845 -0,0175 0,0071 0,0079
Denmark 0,1590 0,7772 0,2001 1,0286 1,0824 1,1234 1,9457 1,8083
Estonia -1,3742 1,4403 -0,4058 0,4827 0,7637 0,8725 0,4650 0,1308
Finland -0,3233 0,5255 -0,2438 0,0174 0,9279 1,4547 1,2244 1,6803
France -0,1261 0,7061 -0,0266 0,0402 0,3702 0,4551 0,2009 0,0262
Germany -0,1864 0,5246 0,3210 0,5559 0,6155 0,6813 0,9962 0,7750
Greece 0,2620 -0,0236 0,5471 1,2328 0,0397 0,3054 0,2234 0,6539
Hungary 0,4138 0,3942 -0,0261 0,0003 0,2093 0,5004 0,4091 0,6988
Ireland 0,3323 0,3712 2,7103 -0,0938 0,0822 1,0090 0,7834 1,3150
Italy -0,8680 0,2604 -0,2852 -0,0326 0,2247 0,0744 0,0433 -0,0653
Latvia -0,6711 1,7948 0,3048 -0,5393 0,7277 1,2866 0,7912 0,2816
Lithuania 0,0111 1,7780 0,0530 -0,2952 0,6118 1,0888 0,8827 0,3280
Luxembourg -0,2807 1,7716 0,0764 0,4462 0,7535 1,0046 0,8829 0,5097
Malta 1,5200 0,0372 -0,4722 -0,5245 0,4828 0,5588 0,5260 0,1495
Netherlands 0,0031 0,8708 0,4268 0,9425 1,9281 1,4320 1,7334 1,4216
Poland -0,0323 0,4668 -0,3905 0,3298 0,0957 0,1192 0,0338 -0,0178
Portugal 0,2316 -0,0661 -0,2041 -0,0101 0,6090 0,3566 0,4947 0,1692
Romania 0,0695 2,3002 0,9660 -0,5607 1,6079 2,5541 2,4805 2,9539
Slovakia 0,5686 0,2627 -0,1216 0,1008 0,1634 0,2246 0,1204 0,1707
Slovenia 0,4235 -0,0001 -0,3016 0,4336 -0,8767 -0,0928 -0,1398 -0,1667
Spain -0,2293 0,2021 0,4915 0,0280 -0,0108 0,0837 -0,0044 0,0002
Sweden -0,3233 0,5255 -0,2438 0,0174 0,9279 1,4547 1,2244 1,6803
United Kingdom 0,3323 0,3712 2,7103 -0,0938 0,0822 1,0090 0,7834 1,3150
Table 10: Local Moran statistics values for GNII and HDI
When analyzing the values of the local Moran statistics for GNII (Table 10), it can be noted
that Germany and Greece form clusters in 2018, Bulgaria, Ireland, United Kingdom in 2010,
Belgium, Bulgaria, France, Germany, Latvia, Lithuania, Luxembourg and Romania in 2000 .,
and Malta 1990. Local Moran statistics in these cases are significant and positive. During the
analyzed period, the local Moran statistics for HDI are significant and greater than 0 for
Begium, Germany and Romania. We observe a similar situation for Bulgaria (2000, 2010,
2018), Denmark (2010, 2018), Hungary (2018), Latvia (2000), Lithuania (2000), Luxembourg
(2010, 2000), Netherlands (1990, 2010, 2018) , Sweden (2018). Thus, the above-mentioned
countries form clusters with a significantly similar level of socio-economic development
measured with the HDI.
5. CONCLUSION
The study analyzes the socio-economic development of EU countries using the HDI index and
its components. Based on the research, it can be noticed that the EU countries are developing
and the differences between them are decreasing for EI, GNII and HDI. It may be related to the
accession of some countries to the EU in the period under consideration. There is a relatively
free movement of goods, capital, labor and technology between EU countries. In the analyzed
period, the highest HDI values were obtained for Netherlands, Sweden and Germany, and the

63rd International Scientific Conference on Economic and Social Development – "Building Resilient Society" - Zagreb, 11-12 December, 2020
280
lowest for Croatia, Bulgaria, Latvia and Romania. Moreover, the conducted study confirmed
the existence of a positive global spatial autocorrelation for the EU countries in terms of the
level of socio-economic development, as well as LEI, EI and GNII. These relationships are also
apparent in the analysis of the local autocorrelation. Clusters are formed to identify countries
that have similar values of the studied phenomenon. HDI was created to emphasize the role of
people and their capabilities in assessing the development of a country. However, it should be
realized that HDI does not reflect everything that is related to human development. HDI does
not take into account the basic issues of human development such as gender inequality, race
inequality, population security, and poverty.
LITERATURE:
1. Anselin (1995), Local Indicators of Spatial Association – LISA, Geographical Analysis,
27(2), 93-115.
2. Arbia G. (2006), Spatial Econometrics: Statistical Foundations and Applications to
Regional Growth Convergence. Springer, New York.
3. Cliff A.D., Ord J.K. (1973), Spatial Autocorrelation, Pion, London.
4. Hozer-Koćmiel M. (2018), Ocena rozwoju społeczno-ekonomicznego województw za
pomocą HDI, Wiadomości statystyczne 3 (682), p. 40-49.
5. Kopczewska K. (2006), Ekonometria i statystyka przestrzenna z wykorzystaniem programu
R CRAN. Cedewu.pl, Warszawa.
6. Ojrzyńska A., Twaróg S. (2011), Badanie autokorelacji przestrzennej krwiodawstwa
w Polsce, Acta Universitatis Lodziensis. Folia Oeconomia, 253, 129-141.
7. Pośpiech E. (2015), Analiza przestrzenna bezrobocia w Polsce, Studia Ekonomiczne, (227),
59-74.
8. Suchecki B. (red.) (2010), Ekonometria przestrzenna. Metody i modele analizy danych
przestrzennych. Wydawnictwo C.H. Beck, Warszawa.
9. Tobler W. (1970), A computer Model Simulating Urban Growth in Detroit Region,
Economic Geography, 46(2), 23-240.
10. UNDP Database, Retrieved 20.10.2020 from http://hdr.undp.org/en/data
11. UNDP, Human Development Reports 2019, Retrieved 10.11.2020 from
http://hdr.undp.org/sites/default/files/hdr2019_technical_notes.pdf

63rd International Scientific Conference on Economic and Social Development – "Building Resilient Society" - Zagreb, 11-12 December, 2020
281
COMMUNICATION STRATEGIES OF LUXURY BRANDS DURING
COVID-19 CRISIS
Alica Grilec
Assistant Professor, University of Zagreb, Faculty of Textile Technology, Croatia
Dominik Vukusic
Student, Croatia
Dino Dujic
Student, Croatia
ABSTRACT
As the market for luxury fashion products is constantly evolving and expanding, more
challenges lie ahead for luxury fashion brands. Luxury fashion brands are considered as
pioneers in introducing trends and pressure of taking additional activities to create a better
relationship with their customers to provide them with a better and satisfying. As COVID-19
crisis remodelled global economy, luxury fashion industry was between the first industries that
completely transformed their businesses in order to respond to the crisis situation and also
between the first industries that placed their focus on humanness. Radical changes on the
market needed new skills and marketing strategies to keep pace with global market
developments and a completely new situation. This paper focuses on analysing innovative,
creative and humanitarian ways of reaction and communication of luxury fashion brands
during first three months of COVID-19 period. Content analysis included in total 4 luxury
brands (Louis Vuitton, Chanel, Gucci and Burberry) and research was based on secondary
data obtained from Social media (Facebook, Instagram and Twitter) in period from February
to May 2020. Research concluded that although there were similarities in luxury brands
reactions while communicating the same message of importance of staying at home and self-
isolation, there were also different communication strategies used. While some of them used
photography to deliver the message, other used music, art or poetry. All four observed fashion
brands communicated their humanitarian side of business (donating medical masks, equipment
and/or money to medical centres, medical workers or research centres) with celebrities’
engagement and they posted on social media about their fight against COVID-19 regularly.
Keywords: communication, crisis, luxury fashion, communication strategy
1. INTRODUCTION
Manufacturers of luxury branded clothing are facing increasing competition in the market in
recent years, so it is necessary to attract potential customers in a creative and innovative way to
achieve greater financial gain and create positive reputation of products and brands.
Manufacturers are therefore becoming increasingly innovative in terms of promoting their own
products and brands. In order to gain the attention of customers in a new way, they are
combining experience in various senses, who have "dulled" due to many promotional activities
and constant exposure to similar types of promotion. Many luxury fashion brands started
helping medical institutions and their staff by providing them with masks, sanitizers and gowns
for free (Allaire, 2020; O’Kane, 2020). Other launched fashionable masks donating part of the
profit against the coronavirus (Tobin, 2020).

63rd International Scientific Conference on Economic and Social Development – "Building Resilient Society" - Zagreb, 11-12 December, 2020
282
The issue of new business strategies and models needs to be further studied in order to develop
proposals for new models in pandemics and crises (Larchenko, 2020). In addition to becoming
more popular, new promotion and communication strategies are often intertwined with
traditional ones and thus achieve the best results with customers. A special challenge was found
in the specifics of this crisis, which, unlike the big financial crisis in 2008, companies had to
close their stores for a while and find a new way of selling and promoting their products. Since
these two crises are different in nature, fashion companies will not have the same impact on
their business as they did in 2008. As numerous analyses have shown, overall financial
performance between luxury apparel and mass apparel companies was different in period
between 2008 and 2011 (Lockrem, 2013), which initiates that luxury fashion had a kind of crisis
resistance. Covid-19 crisis has provided a new challenge and an opportunity for new digital
ways to work, advertise, shop and get entertained.
2. LUXURY FASHION BRANDS PROMOTION TECHNIQUES AND
COMMUNICATION STRATEGIES
Since WWII the world has not faced such a form of restriction on the freedom of individuals,
including movement, socializing, and most relevant — physical shopping (Pantano et al., 2020).
Digitization and behavioural changes will leave a long-lasting mark in the world even after a
pandemic (Langer, 2020). The promotion of luxury brands has set a fundamental goal precisely
the sustainability of production in response to changes in commercial thinking in the European
consumers who want to review and consider the established social and environmental effects
of their businesses. The new era when people started prioritizing every-day products over
luxury brands, in order to ensure safety and health. Luxury fashion companies, recovering from
financial losses due to the Covid-19 crisis, are experimenting different strategies to engage with
the consumers by building awareness around Covid-19 and connecting their brand with
compassion (Ansari & Ganjoo, 2020). Luxury brands have begun to drastically change the way
they are promoted, e.g. Burberry started signing on to Tmall’s monthly luxury live streaming
promotion and Louis Vuitton was one of the first luxury brand that started using live streaming
tool and accentuation on globally accessible platforms like TikTok and Instagram Live
(Granskog, A., Lee, L. & Magnus, KH et al., 2020).
Sheme 1: Actions for fashion brands to help society deal with impact of COVID-19 crisis
Source: Granskog, A., Lee, L. & Magnus, KH et al., 2020)
The graph above proves how the established consumer preferences have experienced a
complete reversal with the entry into the health crisis, and accordingly, communication and
promotion strategies must adopt to the disrupted environment. According to previous
allegations, customer habits will not change abruptly with a change in the situation, but certain
behavioural changes will remain for an even longer period of time.

63rd International Scientific Conference on Economic and Social Development – "Building Resilient Society" - Zagreb, 11-12 December, 2020
283
3. CRISIS COMMUNICATION STRATEGIES IN FASHION
In times of uncertainty, customer behaviour is often influenced by feelings of shortage of goods
(Hamilton et al., 2019). Due to all the characteristics of this crisis, the communication between
brands and customers is moving to social networks, and the fight for every customer is
conducted mainly on social networks. The advertising strategy must be adapted to modern
consumer requirements, it must respect social responsibility and it must patch the financial gaps
caused by the crisis as much as possible. Luxury fashion brands (LFB) use social media
networks to ensure brand attitude and customer loyalty (Kim & Lee, 2019), require specific
marketing strategies and are consumed and promoted on a specific way (Han, Nunes, & Drèze,
2010). Sense-breaking is created through crisis communications on social networks, when the
message of great topicality reaches a wide audience (Mirbabaie & Marx 2020). Comprehension
of human emotions during reflection on this theme revealed the centrality to fashion strategy
implementation for further communication (Faria et al., 2020). However, a new perspective on
the communication practice and experimental methods of luxury fashion advertising in the new
integrative framework is becoming the new normal (Kohrs, 2020). A quick look at the Sheme
2 below shows that only a negligibly small proportion of customers have increased their
consumption and this can be attributed to a single increase in available free time due to the
crisis. The rest of the customers (94%) either reduced their consumption or it remained the
same. This posed a major challenge for fashion companies and cast doubt on the applicability
of their strategies.
Sheme 2: Effect of COVID_19 crisis on fashion spending (March 2020, n=2004)
Source: Granskog, A., Lee, L. & Magnus, KH et al., 2020.
That’s exactly how 2016-2017 Armani was known to use secretive and supportive strategies
and to have interaction with their customers via private networks, e.g. email, Facebook
Messenger, website response etc. (Cabiddu et al, 2020). Through tabular comparisons of four
different luxury brands, we will compare their communication changes. This paper have placed
its focus on analysing innovative, creative and humanitarian ways of reaction of 4 luxury
fashion brands (the most valuable brands, according Interbrand research, 2020) during COVID-
19 period from March to June 2020 on the most popular social media platforms (Facebook,
Instagram and Twitter).

63rd International Scientific Conference on Economic and Social Development – "Building Resilient Society" - Zagreb, 11-12 December, 2020
284
4. RESEARCH ON LUXURY FASHION BRANDS COMMUNICATION STRATEGIES
DURING COVID-19 CRISIS PERIOD
4.1. Research methodology and sample
As Baird and Parasnis (2011) emphasize, social networks play a significant role in
communication, which is a key asset and advantage of companies in sales to unexpected
heights. So, for the purpose of this research, we analysed communication content during the
first months of pandemic period (March, April and May 2020) of four luxury brands from some
of the most popular social networks worldwide as of October 2020, ranked by number of active
users are Facebook (first place), Instagram (sixth place) and Twitter (seventeenth place)
(Statista: Most popular social networks worldwide as of October 2020, ranked by number of
active users 2020). For years, the most innovative social network Facebook, created in 2004,
had socializing as its primary goal, and over the years it has become one of the most powerful
business tools in the digital world (Bosanac, 2017). Every day, the number of new Facebook
users grows (Kramarić, 2019). According to the statistical portal (Statista: Facebook & Facts,
2020), as of the 4th quarter of 2019, Facebook had more than 2.5 billion active users. These
data show that this social network generated $ 70.7 billion in revenue, which mostly came from
advertising. Instagram is young social network, which was created in 2010 and started working
as a mobile application. Nakić (2017) points out that Instagram, given the importance of visual
presentation of the product, is also useful in the business world because photos have become
an integral part of the promotion. In the year 2019, almost 855 million users used Instagram
(Statista: Number of Instagram user worldwide from 2016-2023), and „Instagram’s global user-
base is in the vicinity of 715 million and constantly growing“, which means that „a large
potential audience that can be easily reached via organic ads or influencers“ (Statista: Global
Instagram influencer market size from 2017 to 2020). Twitter was founded in 2006, and
companies use Twitter to share information with those interested in their products and services
faster and easier, posts are in the form of 'tweets', and messages contain up to 140 characters
(Zavišić and Mijatović, 2015). In the year 2020, 353 million users used Twitter (Statista: Most
popular social networks worldwide as of October 2020, ranked by number of active users 2020).
Content posted on three observed social networks was analysed in period from March 1st to
May 30th 2020 during the first three months of COVID-19 pandemics. This research included
sample of four luxury fashion brands listed among 100 Best global brands by Interbrand (2020):
Louis Vuitton, Chanel, Gucci and Burberry. Louis Vuitton ranks first in the Interbrand ranking
of luxury brands (17th place in total ranking). With its brand value of $ 31,720m, it recorded a
decline of 2% compared to the previous ranking. Chanel ranks second (21st place in total
ranking), with brand value of $21,201m, it also recorded a decline of -4% compared to the
previous ranking. Gucci ranks fourth (32nd place in total ranking) with brand value of
$15,675m and decline of 2%. And, the last brand observed, Burberry ranks eight in luxury
brand ranking (97th place in total ranking) with brand value of $4,495m and decline of 8%
compared to the previous ranking. Content analysis is in detailed explained in the chapter 4.2,
and summarized with table 1 in Conclusion.
4.2. Analysis on luxury fashion brands crisis communication
4.2.1. Louis Vuitton
The LVHM group, like most fashion organizations/brands, has been involved in the fight
against COVID-19 since the pandemic began. The LVMH group owns many fashion brands,
including Louis Vuitton. On March 20th, the fashion brand advertised for the first time in terms
of pandemics and calls for fellowship in difficult times on Instagram and Twitter (Louis
Vuitton, Instagram). Due to the impossibility of traveling during April and May, LV constantly
invites his own companions/customers to travel "in spirit" to the past called #SpiritOfTravel,
so at the end of March begins to publish photos of Jean Lariviere from the rich past that focuses

63rd International Scientific Conference on Economic and Social Development – "Building Resilient Society" - Zagreb, 11-12 December, 2020
285
on the journey and inspiration that can come from it (Louis Vuitton, Instagram-a). On April
8th, via Instagram and Twitter, announces the conversion of their own workshops into facilities
for the production of medical masks and angles and thanks to all volunteers who help in their
creation (Louis Vuitton, Instagram-b; Louis Vuitton, Twitter). Among other things, the brand
donated medical masks and coats to hospitals in Paris, vulnerable groups such as people in
nursing homes and 25,000 masks to New York City-area hospitals. At the end of April, LV
published a list of music selected by Virgil Abloh, creative director of Louis Vuitton men's
collections called "Music Journey Virgil Abloch" urging followers/customers to stay home
(Lois Vuitton, Spotify). In early May, they began posting photos of Annie Leibovitz titled
"Travel back in time”. Photos show LV campaigns with celebrities including Angelina Jolie,
Catherine Deneuve, Sean Connery, Pale, Maradona, Zidane, Michael Phelps, Ali Hewson,
Bono, Muhammad Ali, Steffi Graf, Francis Ford Coppola. Photos focus both on travel in the
literal sense and on spirit travel and life travel. In mid-May, the LV Cine Club begins through
which brand ambassadors (Sophie Turner, Alicia Vikander, Lea Seydox, Cloe Grace Moretz)
share their own film selections for anyone who respects self-isolation and stays in their own
homes (Louis Vuitton, Twitter-a). To mark the reopening of certain Louis Vuitton boutiques
such as those in Frankfurt and Milan, the brand paints rainbow showcases as a symbol of hope
in difficult times, shares images on social media such as Instagram, Facebook and Twitter
(Louis Vuitton, Twitter-b,c). In mid-June, Louis Vuitton unveils a new Instagram filter inspired
by the rainbow and reopens a boutique on Fifth Avenue in New York City (Louis Vuitton,
Instagram-c).
4.2.2. Chanel
To help reduce the spread of COVID-19, help medical personnel and infected patients, Chanel
decided to provide assistance to those in need during the pandemic. The brand announces its
inclusion in the fight against the pandemic on March 29th via Instagram and Facebook
alongside the publication of photos showing Gabrielle Chanel, Heidi Mount-Whitworth,
Gaspard Ulliel and Diana Kruger (Chanel, Instagram). France, Italy, England, China and South
Korea are some of the countries where Chanel has made donations to healthcare non-profits.
At the end of March, they published a "The Sound of Chanel" music list on the Apple Music
platform on Instagram, Facebook and Twitter to make it easier for customers to stay in homes
during isolation (Chanel, Instagram-a). With the same goal on April 1, Chanel and Belgian
singer Angela are organizing a live concert called "Stay Home with Chanel & Angele",
everyone interested could follow the concert via Instagram story. During April, certain
Instagram and Facebook posts invite customers to stay home, among other things, the brand
presents a new line of cosmetic products (Chanel Beauty) with a description of „Mademioselle
Stays Home“, thus urging all followers/customers to stay home for their own safety and the
safety of their loved ones (Chanel, Instagram-b). From April 10th on Instagram, Facebook and
Twitter, Chanel begins sharing "The Sound of Chanel" music on the Apple Music platform
selected by celebrities such as actress Margaret Qualley, brand ambassador Soo Joo Park, singer
Angela, model and music producer Caroline de Magret, music group Ibeyi, musician and brand
ambassador Sebastien Tellier and Michael Gaubert famous music creator for fashion events
(Deeny, 2020). Chanel fights the pandemic in different ways, so part of the employees make
masks and hospital robes/coats that are the most needed equipment for doctors and medical
personnel working directly with infected patients (Chanel has donated more than 50 thousand
medical masks to the competent French authorities, which are not enough due to high demand)
(Joseph, 2020). The United States is one of the countries affected the most by COVID-19, so
Chanel donated $2 million to help with medical emergencies and those communities most
affected by the virus. During the first wave, the fashion label made contributions to the CDC
(Centers for Disease Control), New York City hospitals (to help patients and medical personnel

63rd International Scientific Conference on Economic and Social Development – "Building Resilient Society" - Zagreb, 11-12 December, 2020
286
in the city area), New York City-area public schools (supporting 1.1 million children in public
schools, focusing in particular on the 114,000 children without their own home), non-profits
that provide food, provide employment and shelter to those in need. Also Chanel has made it
clear that it will not lay off its own employees due to the difficult economic situation that arose
from the pandemic, but will preserve all jobs even if the fashion label gets into a disadvantaged
financial position (Algar, 2020). Chanel is one of the fashion manufacturers that responded best
to the emergence of the pandemic to help patients, medical staff and vulnerable communities
while promoting itself as a fashion label that did not disobey people's needs during the pandemic
and thus showed its humanity (Chanel, 2020).
4.2.3. Gucci
Gucci showed involvement in the fight against COVID-19 virus in late March when it
announced via Instagram, Facebook and Twitter a donation of 1.1 million medical masks and
55,000 medical overalls to Italian hospitals and its medical staff. At the end of March, it
announces a $1m donation to the World Health Organization and $1m to the Italian Civil
Protection, and calls on the community to donate funds to stop the spread of the virus under the
motto "We Are All In This Together" (Gucci, Instagram). By the end of March, Gucci is sharing
several World Health Organization posts focusing on preventing the spread of the virus and
maintaining physical activity during the pandemic. In early April, the brand also shared advice
from the World Health Organization, which promotes physical distance and expressions of
empathy for fellow human beings, among other things (Gucci, Instagram-a). On April 7th, the
Luxury Group Kering celebrates World Health Day and on April 8th the group shows solidarity
with medical personnel and doctors and donates $1 million to the Centers for Disease Control
(Gucci, Instagram-b). Almost daily, it shares advices from the World Health Organization and
promotes funding donations to help prevent the spread of the virus. In mid-April, they expressed
support for medical workers #TogetherAtHome. Gucci invited its own followers/customers to
dedicate themselves and develop hobbies during their home isolation. In mid-April, the brand
showed support for medical workers by publishing a photo of a medical glove and yellow rose
representing happiness and health (Gucci, Twitter). Collaborates with several artists from
various fields of art, so through Instagram and Facebook the brand organizes a performance of
the song "Il mio canto libero" with the singer Benedette Porcaroli, who encourages her own
companions to togetherness, empathy and show support (Gucci, Instagram-c; Gucci,
Facebook). On May 20th, expressed support for women over whom the amount of violence has
increased since the epidemic began under the motto "We Stand With Women" (Gucci,
Instagram-d). Its action against the spread of COVID-19 and providing financial assistance,
Gucci leaves an extremely positive impression in customers and thus promotes itself on the
market.
4.2.4. Burberry
Burberry, as a brand, is one of the most organized in terms of fighting COVID-19. This fashion
manufacturer operates in a wide area to help medical workers, infected and at-risk groups.
Burberry engages in the fight against the pandemic on March 28th when it announces via
Instagram that the brand has donated 100,000 medical masks to the U.K. National Health
Organization, funding the find, i.e. finding it. Developing vaccines against Covid-19 virus in
collaboration with Oxford University, it also donates financial aid to charities that provide food
to communities and individuals who cannot afford it, especially in this difficult time of the
pandemic (Burberry, Instagram; Burberry, Instagram-a;b). Since the beginning of April, the
brand has been collaborating with artists such as Rubber Legz, Helin, Colin Young, Elanor
Johnson and Maria Seijn, Casper Wackerhausen-Sejersen, Luca Mastroianni, Deb Never, Olan
Monk, Mal Devis who, with their art, tell Burberry followers/customers to stay home for their
63rd International Scientific Conference on Economic and Social Development – "Building Resilient Society" - Zagreb, 11-12 December, 2020
287
own safety and the safety of their loved ones (Burberry, Instagram-c;d;e;f). Burberry also
collaborates with artist Lisa Daley Ward, whose poetry is published with a message #StayHome
(Burberry, Instagram-g). Burberry, like most fashion brands, did not disobeyed the needs of
medical workers and infected patients, it is one of the fashion manufacturers that most
preparedly welcomed the pandemic. Burberry has organized its assistance in a wide area to help
as many of those in need as possible in various ways, thus leaving a very positive impression
with existing and potential buyers on the market.
5. CONCLUSION
Luxury fashion market in recent years became highly competitive and therefore, it was already
necessary to use new and innovative types of promotion in order to be able to attract customers
in a creative and different way and thus achieve greater financial gain and a positive reputation
of the product and the brand itself. Luxury fashion brands used celebrities and influencers in
promotional activities to attract adolescents and young customers, but is this strategy still
effective in COVID-19 crisis period? The answer is yes. Also in pandemic period, luxury
fashion brands continue to communicate with their followers on social media with the use of
celebrities. Interesting was, that they focused on the same message that is important for
pandemic period (stay and home and self-isolate) but they communicate their message
differently. In Table 1 it is shown that while communicating, during 3 observed months in 2020
(March, April and May), all four fashion brands focused on different types of communication
media. Louis Vuitton communicated with photographs for promoting idea of staying at home
with their campaign „Travel back in time “included pictures of celebrities. Chanel promoted
the same idea with music selection and their campaign „The sound of Chanel “was available
on the Apple Music platform and brand also organised live concert over social media. Gucci
had the motto "We Are All In This Together" and collaborated with several artists from various
fields of art to organize a performance of the song "Il mio canto libero" with the singer
Benedette Porcaroli, who encourages her own companions to togetherness, empathy and show
support. Burberry was one of the fashion manufacturers that most preparedly welcomed the
pandemic and the brand spread important message of #stayhome using the poetry as a media.
All four observed luxury fashion brands focused their communication strategies in fight against
COVID-19. They all reacted very fast and started supporting communicating about fight against
COVID-19 in March 2020 on their social media platforms. All four luxury brands immediately
transformed their facilities for production of medical masks and they donated it to hospitals and
to medical workers. Burberry started to financially support vaccines development with Oxford
university, while Chanel made contributions to the CDC (Centres for Disease Control), New
York City hospitals (to help patients and medical personnel in the city area), New York City-
area public schools (supporting 1.1 million children in public schools, focusing in particular on
the 114,000 children without their own home), non-profits that provide food, provide
employment and shelter to those in need ana Chanel also highlighted that they will preserve
jobs for their employees. Gucci announced a $1m donation to the World Health Organization
and $1m to the Italian Civil Protection.
Table following on the next page
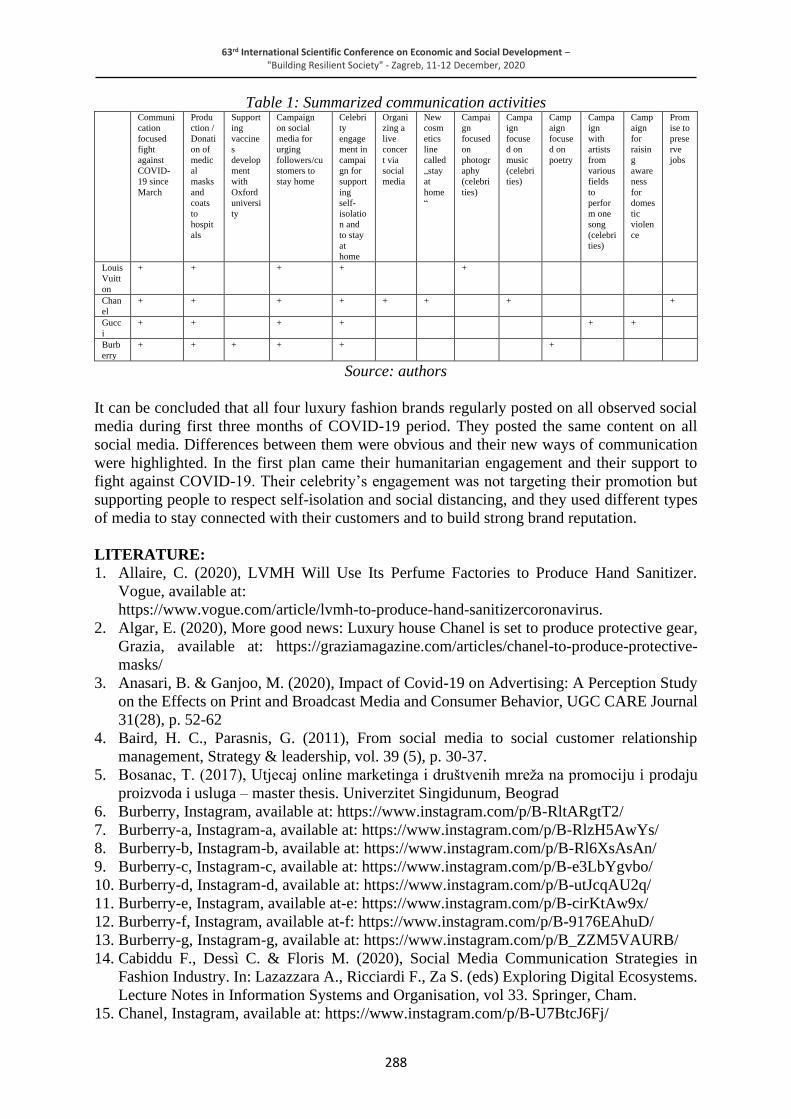
63rd International Scientific Conference on Economic and Social Development – "Building Resilient Society" - Zagreb, 11-12 December, 2020
288
Table 1: Summarized communication activities Communi
cation
focused
fight
against
COVID-
19 since
March
Produ
ction /
Donati
on of
medic
al
masks
and
coats
to
hospit
als
Support
ing
vaccine
s
develop
ment
with
Oxford
universi
ty
Campaign
on social
media for
urging
followers/cu
stomers to
stay home
Celebri
ty
engage
ment in
campai
gn for
support
ing
self-
isolatio
n and
to stay
at
home
Organi
zing a
live
concer
t via
social
media
New
cosm
etics
line
called
„stay
at
home
“
Campai
gn
focused
on
photogr
aphy
(celebri
ties)
Campa
ign
focuse
d on
music
(celebri
ties)
Camp
aign
focuse
d on
poetry
Campa
ign
with
artists
from
various
fields
to
perfor
m one
song
(celebri
ties)
Camp
aign
for
raisin
g
aware
ness
for
domes
tic
violen
ce
Prom
ise to
prese
rve
jobs
Louis
Vuitt
on
+ + + + +
Chan
el
+ + + + + + + +
Gucc
i
+ + + + + +
Burb
erry
+ + + + + +
Source: authors
It can be concluded that all four luxury fashion brands regularly posted on all observed social
media during first three months of COVID-19 period. They posted the same content on all
social media. Differences between them were obvious and their new ways of communication
were highlighted. In the first plan came their humanitarian engagement and their support to
fight against COVID-19. Their celebrity’s engagement was not targeting their promotion but
supporting people to respect self-isolation and social distancing, and they used different types
of media to stay connected with their customers and to build strong brand reputation.
LITERATURE:
1. Allaire, C. (2020), LVMH Will Use Its Perfume Factories to Produce Hand Sanitizer.
Vogue, available at:
https://www.vogue.com/article/lvmh-to-produce-hand-sanitizercoronavirus.
2. Algar, E. (2020), More good news: Luxury house Chanel is set to produce protective gear,
Grazia, available at: https://graziamagazine.com/articles/chanel-to-produce-protective-
masks/
3. Anasari, B. & Ganjoo, M. (2020), Impact of Covid-19 on Advertising: A Perception Study
on the Effects on Print and Broadcast Media and Consumer Behavior, UGC CARE Journal
31(28), p. 52-62
4. Baird, H. C., Parasnis, G. (2011), From social media to social customer relationship
management, Strategy & leadership, vol. 39 (5), p. 30-37.
5. Bosanac, T. (2017), Utjecaj online marketinga i društvenih mreža na promociju i prodaju
proizvoda i usluga – master thesis. Univerzitet Singidunum, Beograd
6. Burberry, Instagram, available at: https://www.instagram.com/p/B-RltARgtT2/
7. Burberry-a, Instagram-a, available at: https://www.instagram.com/p/B-RlzH5AwYs/
8. Burberry-b, Instagram-b, available at: https://www.instagram.com/p/B-Rl6XsAsAn/
9. Burberry-c, Instagram-c, available at: https://www.instagram.com/p/B-e3LbYgvbo/
10. Burberry-d, Instagram-d, available at: https://www.instagram.com/p/B-utJcqAU2q/
11. Burberry-e, Instagram, available at-e: https://www.instagram.com/p/B-cirKtAw9x/
12. Burberry-f, Instagram, available at-f: https://www.instagram.com/p/B-9176EAhuD/
13. Burberry-g, Instagram-g, available at: https://www.instagram.com/p/B_ZZM5VAURB/
14. Cabiddu F., Dessì C. & Floris M. (2020), Social Media Communication Strategies in
Fashion Industry. In: Lazazzara A., Ricciardi F., Za S. (eds) Exploring Digital Ecosystems.
Lecture Notes in Information Systems and Organisation, vol 33. Springer, Cham.
15. Chanel, Instagram, available at: https://www.instagram.com/p/B-U7BtcJ6Fj/

63rd International Scientific Conference on Economic and Social Development – "Building Resilient Society" - Zagreb, 11-12 December, 2020
289
16. Chanel, Instagram- a, available at: https://www.instagram.com/p/B-XRjSnIOou/
17. Chanel, Instagram-b, available at: https://www.instagram.com/p/B-l3AoCIvuk/
18. Chanel, official Web page (2020), available at: https://www.chanel.com/us/covid19-global-
relief-efforts/
19. Deeny, G. (2020), Chanel to host live Angèle performance on Instagram, Fashion Network,
available at: https://ww.fashionnetwork.com/news/Chanel-to-host-live-angele-performa
nce-on-instagram,1204328.html
20. Faria A.P., Providência B., Cunha J. (2021), The Foreseeable Future of Digital Fashion
Communication After Coronavirus: Designing for Emotions. In: Martins N., Brandão D.
(eds) Advances in Design and Digital Communication. Digicom 2020. Springer Series in
Design and Innovation, vol 12. Springer, Cham.
21. Granskog, A., Lee, L. & Magnus, KH et al. (2020), McKinsey Survey: Consumer sentiment
on sustainability in fashion, available at: https://www.mckinsey.com/industries/retail/our-
insights/survey-consumer-sentiment-on-sustainability-in-fashion#
22. Gucci, Facebook, available at: https://www.facebook.com/watch/?v=942563999532767
23. Gucci, Instagram, available at: https://www.instagram.com/p/B-NARHjCLkD/
24. Gucci, Instagram-a, available at: https://www.instagram.com/p/B-hQZ74qs_5/
25. Gucci, Instagram-b, available at: https://www.instagram.com/p/B-uoZzFJKJd/
26. Gucci, Instagram-c, available at: https://www.instagram.com/p/B_PgaO1iVpe/
27. Gucci, Instagram-d, available at: https://www.instagram.com/p/CAazdbZKmkL/
28. Gucci, Twitter, available at: https://twitter.com/gucci/status/1251131369213870082
29. Hamilton, R., Thompson, D., Bone, S. et al. (2019), The effects of scarcity on consumer
decision journeys., J. of the Acad. Mark. Sci. 47, p. 532–550
30. Han, Y. J., Nunes, J. C., & Drèze, X. (2010), Signaling status with luxury goods: The role
of brand prominence. Journal of Marketing, 74(4), p. 15–30.
31. Interbrand: Best Global Brands (2020), available at: https://interbrand.com/best-global-
brands/
32. Joseph, S. (2020) Chanel joins the fight against COVID-19, Bazaar, available at:
https://www.harpersbazaararabia.com/coronavirus/the-luxury-french-fashion-house-joins-
the-fight-against%C2%A0covid-19
33. Kim, A. J., & Ko, E. (2010), Impacts of Luxury Fashion Brand’s Social Media Marketing
on Customer Relationship and Purchase Intention, Journal of Global Fashion
Marketing,1(3), p. 164–171.
34. Kohrs, K. (2020), The language of luxury fashion advertising: technology of the self and
spectacle, Journal of Fashion Marketing and Management, Vol. ahead-of-print No. ahead-
of-print.
35. Kramarić, C. (2019), Oglašavanje na društvenim mrežama, Algebra, Zagreb
36. Langer, D. (2020) 3 critical steps luxury brands must take to rebound from COVID-19, Jing
Daily, available at: https://jingdaily.com/china-luxury-brands-rebound-covid-19-dior-
gucci/
37. Larchenko, V. (2020), A Fashionable Mask: Branded Value Proposition during the
Coronavirus Pandemic. European Journal of Medicine and Natural Sciences, [S.l.], 4(2), p.
42-50.
38. Lockrem, S. (2013), Impacts of the Financial Crisis on Luxury Apparel and Mass Apparel
Companies from 2008 to 2011, Open Access Master's Theses. Paper 51., available at:
https://digitalcommons.uri.edu/theses/51
39. Louis Vuitton, Instagram, available at: https://www.instagram.com/p/B99GOnzqCM4/
40. Louis Vuitton, Instagram-a, available at: https://www.instagram.com/p/B-HIir8Awhz/
41. Louis Vuitton, Instagram-b, available at: https://www.instagram.com/p/B-ujhP_K-We/
42. Louis Vuitton, Instagram-c, available at: https://www.instagram.com/p/CBfZnrwqw4O/

63rd International Scientific Conference on Economic and Social Development – "Building Resilient Society" - Zagreb, 11-12 December, 2020
290
43. Lois Vuitton, Spotify, available at:
https://open.spotify.com/playlist/7dmaX7h0UK3KxDVWWuOq8d?si=41Ra3Dq-S-Cwrd
gdu5gOiw
44. Louis Vuitton, Twitter, available at:
https://twitter.com/LouisVuitton/status/1247936656059097099
45. Louis Vuitton, Twitter-a, available at:
https://twitter.com/LouisVuitton/status/1261616143992852481
46. Louis Vuitton, Twitter-b, available at:
https://twitter.com/LouisVuitton/status/1263454512972513282
47. Louis Vuitton, Twitter-c, available at:
https://twitter.com/LouisVuitton/status/1263545102384979970
48. Mirbabaie, M. & Marx, J. (2020), Breaking’ news: uncovering sense-breaking patterns in
social media crisis communication during the 2017 Manchester bombing, Behaviour &
Information Technology, 39:3, p. 252-266.
49. Nakić, A. (2017), Uloga društvenih mreža u obavljanju marketinških aktivnosti –master
thesis, Sveučilište Jurja Dobrile u Puli, Fakultet ekonomije i turizma
50. Pantano E., Pizzi G., Scarpi D. & Dennis C. (2020), Competing during a pandemic?
Retailers' ups and downs during the COVID-19 outbreak, J Bus Res. Aug; 116, p. 209-213.
51. Statista (2020), Global Instagram influencer market size from 2017 to 2020, available at:
https://www.statista.com/statistics/748630/global-instagram-influencer-market-value/
52. Statista (2020), Facebook & Facts, available at:
https://www.statista.com/topics/751/facebook/
53. Statista (2020), Number of Instagram user worldwide from 2016-2023 available at:
https://www.statista.com/statistics/183585/instagram-number-of-global-users/
54. Tobin S. (2020), How to match your mask to the rest of your look: four stylish outfits to try
now. The Telegraph, available at: https://www.telegraph.co.uk/fashion/style/match-mask-
rest-look-four-stylishoutfits-try-now/?li_source=LI&li_medium=liftigniter-rhr.
55. Zavišić, S. & Mijatović, A. (2015), Društvene mreže u funkciji povećanja prodaje,
Suvremena trgovina Stručni časopis za trgovinu, Mettler-Toledo, Zagreb

63rd International Scientific Conference on Economic and Social Development – "Building Resilient Society" - Zagreb, 11-12 December, 2020
291
CLUSTER ANALYSIS APPLICATION IN EXPLORING ECONOMIC
INDICATORS DIFFERENCES AMONG BALKAN COUNTRIES
Presiana Nenkova
Finance Department,
University of National and World Economy (UNWE),
Sofia,8th December str., 1700, Bulgaria
Milena Kovachevich
Finance Department,
University of National and World Economy (UNWE,)
Sofia,8th December str., 1700, Bulgaria
ABSTRACT
More than ten years after the 2008 global financial and economic crisis, the world's economies
recovery is uncertain and vulnerable. The global crisis has also affected Balkan countries.
Although the overall social and economic impact was negative, the crisis influenced the
economic performance of Balkan countries in different ways. The cluster analysis we applied
suggested two distinct groups of countries. The first cluster includes countries with significantly
lower GDP per capita, higher GDP growth, higher inflation and current account deficit, which
is covered by FDI inflows. The second cluster includes countries that are already part of the
Eurozone. After 2008 almost all indicators for both clusters deteriorated. However,
unemployment rate and FDI decreased for the first group of countries and increased for the
second group. The indicators that were meaningful for the classification of the groups differred
before and after the year of 2008. The indicators that remained significant in both clusters
before and after the crisis was GDP per capita and exchange rate regime.
Keywords: Balkan countries, Cluster analysis, Economic indicators
1. INTRODUCTION
Balkan countries present an interesting case study in terms of the dynamic of the processes in
their economies and the continually changing development conditions. In socioeconomic terms,
partly due to the different economic backgroung, the Balkan region is very diverse. Unlike
Greece and Turkey, during the 90s some of the Balkan countries, the former socialist countries
transitioning to a market economy, faced the difficult task of restructuring and reforming their
national economies. Political instability during this period and the adverse effects of armed
conflicts in the region, have hampered and slowed down the necessary structural reforms in the
Western Balkans. The deepening integration of the European and global economy has given a
strong impetus to investment and consumption in all Balkan countries, hence the robust GDP
growth rates at the beginning of the new millennium. Overcoming economic and political
shocks and a strong pro-EU orientation have improved the economic situation in countries lying
on the Balkan peninsula. After a period of intensive economic growth until 2008, Balkan
countries, in keeping with EU Member States, experienced a slowdown in economic activity.
The aftermath of the crisis saw a significant outflow of foreign investment, a drop in capital
expenditure, freezing of certain current costs, etc. The attractiveness of the idea of future
membership for countries that are not yet part of the EU, is the main driving force and incentive
for reform and problem solving. In 2004, Slovenia joined the EU as part of the large-scale
enlargement of the Union in Central and Eastern Europe.

63rd International Scientific Conference on Economic and Social Development – "Building Resilient Society" - Zagreb, 11-12 December, 2020
292
It was followed by Bulgaria and Romania in 2007 and Croatia in 2013, which became the first
country in the Western Balkans to complete the onerous journey to becoming a full Member
State of the EU. In 2020, Albania, North Macedonia, Montenegro, Serbia and Turkey have the
status of candidates for full EU membership, and Bosnia and Herzegovina and Kosovo are
potential candidates for membership. These countries have concluded stabilisation and
association agreements with the EU, which create conditions for free trade and investment. In
addition, some of the Balkan countries have already adopted the Euro as their national
currencies, and others plan to do so in the future. Greece and Slovenia are members of the
Economic and Monetary Union (EMU) of the EU and in the summer of 2020 Bulgaria and
Croatia adopted the Exchange Rate Mechanism (ERM II) as a step towards joining the
Eurozone. After gaining independence, Kosovo and Montenegro unilaterally adopted the Euro
as their national currency, although they are not officially part of the EMU. Bulgaria and Bosnia
and Herzegovina have established currency boards, which tie their national currencies to the
euro. In addition, Balkan countries have taken on an obligation to comply with the quantitative
convergence criteria established by the Maastricht Treaty, respectively the stability and growth
pact, and most of them, except for North Macedonia and Turkey, have introduced additional
fiscal discipline rules into their national legislation. The similarities and differences between
the Balkan countries mean that an analysis of their macroeconomic indicators should involve
an effort to group the countries, depending on the dynamics of certain economic variables. In
geographical terms, the Balkan region includes both the countries situated within the borders
of the Balkan peninsula per se. i.e. Bulgaria, Greece, North Macedonia, Albania, Bosnia and
Herzegovina, Kosovo and Montenegro, and those whose territory is mainly or partly situated
in the Balkans, such as Slovenia, Croatia and Serbia. Although only a very small part of Turkey
is lying on the Balkan peninsula, the country has its influence on all other countries in the region
and the same applies to Romania.This paper aims to fill the gap for lack of comparative studies
of Balkan countries as a region. The next section presents methodology used and the
prerequisites for the use of cluster analysis in comparing the Balkan countries. Section three
presents the results of clustering the Balkan countries and the final section concludes.
2. METHODOLOGY OF THE STUDY
Cluster analysis is a method which allows the studied population to be divided into homogenous
groups called clusters on the basis of several (typically more than two) variables. The economic
variables used in current analysis are gross domestic product (GDP, growth rate), GDP per
capita, inflation (%), gross sovereign debt (% of GDP), budget balance (% of GDP),
unemployment (%), foreign direct investment (% of GDP) and current account balance (% of
GDP). The exchange rate regime has also been used in the cluster analysis. We used the data
of The World Bank, International Monetary Fund (IMF), National Statistics and Eurostat. The
analysis covers the period 2004-2018. In order to track the changes in the indicators of the
individual clusters and the countries in each cluster before and after the onset of the financial
and economic crisis of 2007-2008, a non-hierarchical cluster analysis has been applied to the
input data for 2007 (pre-crisis) and 2018 (ten years after the crisis) used in the analysis. The
data has been analysed using the SPSS v.26 statistical software.
2.1. Prerequisites for the use of cluster analysis
The reasons for the use of a cluster analysis become apparent upon closer examination of the
dynamics of some key macroeconomic parameters of the Balkan countries. For example, the
analysis of the indicator GDP per capita warrants the division of the countries into two groups
— countries with a significantly higher GDP per capita (Greece and Slovenia), which is closer
to the EU average, and the second group which includes all other countries with GDP per capita
between USD 5 000 and USD 15 000 (Fig. 1).

63rd International Scientific Conference on Economic and Social Development – "Building Resilient Society" - Zagreb, 11-12 December, 2020
293
After the onset of the crisis in 2008, all countries recordes a drop in this indicator, which lasted
for the entire duration of the next period of almost ten years. It was only in mid-2018 that the
countries rebounded to the pre-crisis levels. The greatest drop in GDP per capita was registered
in Greece where in 2018 the levels of the GDP per capita indicator were still lower than in 2004.
Although in the period 2008-2009 the indicator also dropped in high-income countries, they
saw recovery at a much faster pace and, at the end of 2018, GDP per capita was 11 % higher
than in 2008. The analysis of available data on economic growth per country also supports the
division of the countries into two groups — those with high average economic growth of
approximately 5 % (Albania, Turkey and Romania) and the rest which registered lower
economic growth rates during the period (Fig. 2). Bulgaria, North Macedonia, Serbia and
Kosovo also registered relatively high economic growth rates (approximately 3 %), so they can
be grouped separately. Average growth in all countries was higher than the EU average, except
in Croatia where economic growth was the same as in the EU and Greece, the country which
was most strongly affected by the Eurozone debt crisis and registered negative growth by 0.8
% during the period.
Figure 1: GDP per capita
(Source: World Bank Database)
Figure following on the next page

63rd International Scientific Conference on Economic and Social Development – "Building Resilient Society" - Zagreb, 11-12 December, 2020
294
Figure 2: Average economic growth rate, 2004-2018, ( %)
(Source: Eurostat, IMF, World Economic Outlook, April 2020 National Statistics)
During the period 2004-2018 the Balkan countries also registered higher inflation rates
compared to the EU average. Except for Greece and North Macedonia, where inflation was
lower than the EU average, all other countries in the region registered inflation rates that were
higher than the EU average (Fig. 3). Here, the countries can also be divided into two groups —
those with high inflation (Romania, Serbia, Turkey) and all other countries with lower inflation,
although the latter include several countries in which inflation rates were very close to the EU
average (Slovenia, Kosovo, Croatia, and Bosnia and Herzegovina). In Bulgaria, Albania and
Montenegro, average inflation remained relatively low but was still higher than the EU average
and close to the average in other Balkan countries.
Figure 3: Average inflation rate, 2004-2018, (%)
(Source:Eurostat, IMF, World Economic Outlook, April 2020; National Statistics)
Unemployment in the Balkans remained relatively high throughout the period under review.
The average unemployment rate was approximately 17 % with significant variations between
the different countries (Fig. 4). The countries with the highest unemployment were Bosnia and
Herzegovina, Kosovo, Montenegro, North Macedonia and Serbia.

63rd International Scientific Conference on Economic and Social Development – "Building Resilient Society" - Zagreb, 11-12 December, 2020
295
The average unemployment rate in the other countries was lower but remained high compared
to that in developed EU Member States.
Figure 4: Average unemployment rate, 2004-2018, ( %)
(Source:Eurostat, IMF, World Economic Outlook, April 2020; National Statistics)
The emergence of two groups on the basis of these indicators signals the appropriateness of
applying a cluster analysis. The exchange rate regime has been added as an indicator for the
grouping of the countries for the purpose of a cluster analysis. The choice of the exchange rate
regime and the subsequent movement of the local currency against the foreign currencies of
trading partners can have a significant impact on the import and export of a country and thus
on its foreign trade balance, GDP, inflation, investment and the economy as a whole. Domestic
currency depreciation stimulates export and makes imports more expensive thereby increasing
GDP while domestic currency appreciation causes a decrease in export and an increase in
import. This is why countries with free-floating exchange rates are more flexible compared to
all other currency exchange regimes, meaning that in the case of a negative shock on the
economy, the shock is first absorbed by the exchange rate (which depreciates) and is only then
felt in the real economy. This is the reason why countries with free-floating exchange rate
regimes usually register higher than average GDP growth rates, but also higher inflation.
Figures 2 and 3 clearly show the same trend in Balkan countries — countries with free-floating
exchange rates (Romania, Turkey, Albania, Serbia) have the highest average GDP growth rates
but also the highest inflation. According to the classification of the International Monetary Fund
(IMF) published annually in the Annual Report on Exchange Arrangements and Exchange
Restrictions the Member States of the Fund are divided into several groups, depending on their
currency exchange regimes:
• Countries with hard pegs, including the countries with currency boards and the countries
using foreign currencies as legal tender;
• Countries with soft pegs, which includes countries with fixed exchange rates, countries with
crawling pegs and exchange rates fixed within a certain range, and countries with
stabilisation agreements with the IMF;
• The group of countries with a floating exchange rate;
• The group of countries with other exchange rate regimes.

63rd International Scientific Conference on Economic and Social Development – "Building Resilient Society" - Zagreb, 11-12 December, 2020
296
Table 1 sets out the classification of the countries according to exchange rate regime applied.
2018
Exchange rate regime (number of countries) Countries
Hard pegs (Currency Board (2) and No
separate legal tender (2)) (4)
Bosnia and Herzegovina, Bulgaria, Kosovo,
Montenegro
Soft pegs, managed floating and Stabilized
arrangement (3)
Croatia, North Macedonia, Serbia
Floating (3) Turkey, Romania, Albania
Eurozone countries (2) Greece, Slovenia
2007
Hard pegs (Currency Board (2) and No
separate legal tender (2)) (4)
Bosnia and Herzegovina, Bulgaria, Kosovo,
Montenegro
Soft pegs, managed floating and Stabilized
arrangement (2)
Croatia, North Macedonia
Floating (4) Turkey, Romania, Albania, Serbia
Eurozone countries (2) Greece, Slovenia
Table 1: Countries grouping according to the exchange rate regime
(Source: IMF, Annual Report on Exchange Arrangements and Exchange Restrictions 2007
and 2018)
Although originally the countries did not have stabilisation agreements with the IMF, in certain
periods (mostly after the 2007-2008 crisis) some of them, and more specifically Serbia, Albania,
Turkey, Greece, Romania, Croatia, Kosovo, Bosnia and Herzegovina and North Macedonia,
concluded stabilisation agreements with the Fund. For most countries, this did not involve a
change in the original exchange rate regime used before the agreements were concluded. Out
of the countries covered by the study, Bulgaria, Slovenia and Montenegro were the only
countries that did not conclude agreements with the IMF during the period under review.
2.2. Literature Review
There are several studies examining different aspects of the application of cluster analysis to
Balkan countries. Develioglu and Kantarci (2012) examine the competitiveness indicators of
The World Economic Forum’s Global Competitiveness Index, which takes into account factors
such as institutions, infrastructure, macroeconomic environment, financial market
development, market size, innovations etc., and conclude that the countries can be grouped into
two clusters. The first cluster includes Bulgaria, Croatia, Greece, Romania, Serbia and Turkey.
The second one includes Albania, Bosnia and Herzegovina, North Macedonia and Slovenia.
The results show that the only statistically significant factor for differentiation between the
clusters is market size, with the first cluster having a competitive advantage. Stanišić, Leković
and Stošić (2019) consider the link between competitiveness and the quality of training,
applying a cluster analysis to the second indicator. Balkan countries can thus be grouped into
two clusters. The first cluster includes Greece and Slovenia in which the quality of training is
significantly better than in the other countries (Albania, Bosnia and Herzegovina, Bulgaria,
Croatia, Montenegro, Romania and Serbia) as compared to the second cluster. Ivanovska
(2020) examines the bank system of North Macedonia, EU Member States and the Balkan
countries, using two cluster analyses. The results of the first cluster analysis of the banking
sector show that North Macedonia is grouped first with Slovenia and then with Croatia, which
reveals that its banking sector is most similar to the banking sectors of Slovenia and Croatia,
respectively.

63rd International Scientific Conference on Economic and Social Development – "Building Resilient Society" - Zagreb, 11-12 December, 2020
297
Regarding the results of the second cluster analysis of the financial brokerage indicators, North
Macedonia is grouped together with Montenegro in the penultimate cluster and then together
with Serbia, which confirms that financial brokerage services in these Balkan countries are less
common as compared to the levels in other EU Member States. Kittova and Steinhauser (2018)
apply a cluster analysis in which West Balkan countries are placed in predefined clusters of EU
Member States, depending on the values of the Index of Economic Freedom. The results show
that Albania, North Macedonia and Bosnia and Herzegovina are in the same cluster determined
on the basis of Croatia; Montenegro is in the same cluster with Slovenia; and Serbia and Kosovo
are in the cluster of Greece. Dumičić, Bahovec, Čeh Časni, and Palić (2014) examine consumer
behaviour and online shopping in the countries in Central and Eastern Europe. According to
one of the research hypotheses put forth by the authors the countries in Central and Eastern
Europe display similarities in terms of the variables analysed and can probably be grouped in
the same cluster. The cluster analysis has been applied to 30 countries and shows two distinct
groups within the CEE. The first group includes five less developed countries (Bulgaria,
Romania, North Macedonia, Serbia and Turkey) and the second four more developed countries
(Greece, Cyprus, Slovenia and Croatia), which join the cluster together with several other EU
Member States. Milošević, Žeželj, Gorton and Barjolled (2012) examine the food habits of
people and the food selection in the countries in the Western Balkans and Gorton, Ness and
White (2013) discover five groups of users for the Western Balkans characterised by significant
differences in food consumption models both in terms of food consumption and demographic
and social and economic characteristics.
3. RESULTS OF THE APPLICATION OF A CLUSTER ANALYSIS
The results of the application of the cluster analysis show that the countries can be divided in
two clusters (Table 2). In 2007, out of the 2 clusters, the second one includes Greece and
Slovenia (the countries are members of the Eurozone), while the first cluster includes all other
ten countries.
Cluster centers for 2007 Cluster centers for 2018
Clusters Clusters
1 2 1 2
Exchange rate regime 2,00 4,00 Exchange rate regime 1,90 4,00
GDP 17,37 9,12 GDP 5,47 4,47
Inflation rate 4,97 3,33 Inflation rate 3,56 1,25
Budget balance 0,52 -3,38 Budget balance -0,92 0,86
Debt 27,88 62,91 Debt 45,06 127,65
Current account balance -13,89 -9,03 Current account balance -4,38 1,30
Unemployment rate 19,07 6,62 Unemployment rate 13,97 12,21
GDP per capita 6425,55 26307,49 GDP per capita 8405,82 23189,42
FDI 11,21 -0,86 FDI 3,93 1,81
Table 2: Cluster centers
(Source: Authors’ calculations)
The first cluster includes countries with a significantly lower GDP per capita and, in keeping
with general trends in developing countries, with higher GDP growth, higher inflation and
current account deficit covered by the inflow of FDI. The countries in this cluster have, on
average, lower sovereign debt and balanced budget accounts. However, unemployment is
several times higher than the corresponding rates in developed countries (Figure 5). In 2018,
more than 10 years after the beginning of the economic crisis in 2008, the number and the
countries in the two clusters remain the same — ten countries in the first cluster and two
countries in the second.

63rd International Scientific Conference on Economic and Social Development – "Building Resilient Society" - Zagreb, 11-12 December, 2020
298
A deterioration in almost all indicators is observed in both clusters — higher sovereign debt
and a slowdown in GDP growth. The inflation rate is decreasing in both clusters. In terms of
FDI indicators, an increase was registered in the two countries in the second cluster (i.e. the
developed countries in the Eurozone). The decrease in FDI in the countries in the first cluster
indicates that almost ten years after the onset of the financial crisis in 2008, investors remain
reluctant to invest in developing countries against a trend of increasing investments in the
developed countries from the second cluster, despite the fact that they were most strongly
affected by the debt crisis in the Eurozone. During global economic crises, FDI are among the
first indicators registering a decrease across developing countries, regardless of whether the
crisis was triggered by a developed or a developing country. As a result of the economic and
debt crisis in the Eurozone, both average sovereign debts and unemployment rates increased
almost twofold in the second cluster, Greece being among the most severely affected EU
Member States. This has also had an impact on GDP per capita figures — for the developing
countries from the first cluster, regardless of the economic crisis in 2008, in 2018 GDP
increased by approximately 30 % while registering a decrease by approximately 12 % in
Eurozone countries.
Figure following on the next page

63rd International Scientific Conference on Economic and Social Development – "Building Resilient Society" - Zagreb, 11-12 December, 2020
299
Figure 5: Cluster centers
(Source: Authors’ calculations)
Table 3 sets out which of the nine variables are statistically significant for cluster determination.
Those that are statistically significant contributed to the differentiation between the two groups
of countries. In 2007, these were Exchange rate regime and GDP per capita. In 2018, the public
debt was also a statistically significant variable serving to distinguish between the two groups
of countries.

63rd International Scientific Conference on Economic and Social Development – "Building Resilient Society" - Zagreb, 11-12 December, 2020
300
Cluster analysis for 2007 Cluster analysis for 2018
F
statistics Sig. Level
F
statistics Sig. Level
Exchange rate regime 4,231 0,016 Exchange rate regime 16,224 0,009
GDP 3,841 0,157 GDP 0,026 0,848
Inflation rate 2,561 0,313 Inflation rate 0,807 0,511
Budget balance ,466 0,191 Budget balance 0,033 0,267
Debt 5,341 0,064 Debt 12,568 0,009
Current account balance 0,430 0,563 Current account balance 1,079 0,220
Unemployment rate 3,837 0,169 Unemployment rate 0,378 0,778
GDP per capita 87,912 0,000 GDP per capita 51,875 0,000
FDI 4,088 0,068 FDI 0,469 0,323
Table 3: Cluster analysis results
(Source: Authors’ calculations)
4. CONCLUSION
Depending on the main macroeconomic indicators – GDP growth, rate of inflation, GDP per
capita, exchange rate regime, etc. – Balkan countries may be grouped into two clusters. The
first cluster includes the developing countries, which are characterised by high GDP growth
rates, relatively high inflation and unemployment, current account deficits covered by FDI, and
low GDP per capita. The second cluster includes developed countries, which are also members
of the Eurozone. These countries typically have lower levels of inflation and unemployment,
lower GDP growth compared to the countries in the other group, higher sovereign debts but
also the highest GDP per capita. During the post-crisis period, a drop in GDP growth rates and
lower inflation levels coupled with higher sovereign debt were registered in both clusters.
However, a decrease was registered in both unemployment and FDI in the developing countries
from the first cluster while in the second cluster, i.e. in more developed countries, both
unemployment and FDI inflow increased, mostly as a result of the higher risk in the global
economy after the 2008 crisis, although more than ten years had elapsed since its onset. Despite
this, GDP per capital registered an increase in the countries from the first cluster and a decrease
in those in the second cluster. GDP per capita and exchange rate regime remain a statistically
significant indicators for cluster determination both before and after the crisis. The remaining
variable used to differentiate between the two groups in 2018 is sovereign debt.
LITERATURE:
1. Develioglu, K., Kantarci, K. (2012). Clustering Balkan Countries Based on
Competitiveness Factors: A Strategic Perspective, Journal of Economic and Social Studies,
vol.2., no. 2. (pp.5-8). Sarajevo: International Burch University.
2. Dumičić, K., Bahovec, V., Čeh Časni, A., Palić, I. (2014). Internet Purchases in South-East
European Countries: Cluster Analysis Approach, Proceedings, International Conference
SMEs and Innovation: Building competitive future of South-Eastern Europe, Ohrid, 3-4
October, Macedonia. (pp. 171-183). Prilep: Faculty of Economy.
3. Eurostat Database. (2020). Retrieved 1.10.2020 from
https://ec.europa.eu/eurostat/data/database.
4. Gorton, M., Ness, M., White, J. (2013). Segmenting Consumers Using Cluster Analysis: An
Application to Food Motivations in the Western Balkan Countries, In book: Food Consumer
Science (pp.43-55), Dordrecht: Springer.

63rd International Scientific Conference on Economic and Social Development – "Building Resilient Society" - Zagreb, 11-12 December, 2020
301
5. IMF, Annual Report on Exchange Arrangements and Exchange Restrictions for 2007 and
2018. (2018). Retrieved 1.10.2020 from https://www.imf.org/en/Publications/Annual-
Report-on-Exchange-Arrangements-and-Exchange-Restrictions/Issues/2020/08/10/Annual
-Report-on-Exchange-Arrangements-and-Exchange-Restrictions-2019-47102.
6. IMF, WEO Data April 2020. (2020). Retrieved 1.10.2020 from
https://www.imf.org/en/Publications/WEO/weo-database/2020/April.
7. Ivanovska, Е. (2020). Cluster Analysis of Separate Indicators of the Banking Systems of
North Macedonia, the EU Member States and the Balkan Countries, Journal оf
Contemporary Economic аnd Business Issues, Issue No: 1. (pp. 77-90). Scopje: Економски
факултет - Скопје, Универзитет „Св.Кирил и Методиј“
8. Kittova, Z., Steinhauser, D. (2018). The International Economic Position of Western Balkan
Countries in Light of their European Integration Ambitions. Journal of Competitiveness,
10(3). (pp.51–68). Zlin: Tomas Bata University
9. Milošević, J., Žeželj, I., Gorton, M., Barjolled, D. (2012). Understanding the motives for
food choice in Western Balkan Countries. Appetite, Volume 58, Issue 1. (pp.205-214).
Amsterdam: Elsevier.
10. Stanišić, T., Leković, M. & Stošić, L. (2019). Relationship between the quality of higher
education and Balkan countries’ competitiveness. International Journal of Cognitive
Research in Science, Engineering and Education, 7(3). (pp. 49-59). Serbia: CEES
11. World Bank Database. (2020). Retrieved 1.10.2020 from
https://data.worldbank.org/indicator/NY.GDP.PCAP.CD.

63rd International Scientific Conference on Economic and Social Development – "Building Resilient Society" - Zagreb, 11-12 December, 2020
302
AN ALTERNATIVE Q-THEORY FOR THE EXAMINATION OF THE
HOSTILE TAKEOVERS PHENOMENON
Eduardo Manuel de Almeida Leite
CiTUR, ESTG, University of Madeira, Funchal, Portugal
Humberto Nuno Rito Ribeiro
GOVCOPP, ESTGA, University of Aveiro, Portugal
Sandra Raquel Alves
CEOS.PP, ESTG, Polytechnic Institute of Leiria, Portugal
Amelia Ferreira da Silva
CEOS.PP, Porto Accounting and Business School, Porto Polytechnic, Portugal
Jose Manuel Pereira
IPCA-Polytechnic Institute of Cávado and Ave, CICF, Barcelos, Portugal
ABSTRACT
Despite the hostile takeover phenomenon being a current practice in nowadays business
environment, it was, however, once classified as a “deviant innovation” (Hirsch, 1986, p. 800).
Several hypotheses have been examined to explain the occurrence of corporate takeovers.
These include synergies, exploitation of market power, reductions in employee welfare, hubris,
among others (Shivdasani, 1993). However, little is known about the hostile takeovers prior to
the capital market advent. This paper attempts answering this existing gap in literature. It
examines one of the major problems in the business world, the issue of proper evaluations of
potential threats. In a world of ever-lasting possible conflicts, businesses must constantly
evaluate their own organization’s strengths and weaknesses, together with potential opponents
that may arise. These evaluation’ needs are not new. The need to evaluate properly has been a
part of the world of business ever since the very beginnings of business. While the need to
evaluate has not changed, many of our tools-at-hand have. Sixteenth century Portuguese
entrepreneurs may not have had modern statistical tools, but they found other, and no less valid,
ways to evaluate their situation and make business decisions. By applying the concepts and
principles of the alternative Q-Theory proposed in this paper, we believe it is possible to predict
a takeover attempt, the course of business, as well as the success or failure of such events.
Keywords: Takeovers, Alternative Q-Theory, Business Family, Business Conflicts,
Businesswoman, Hostile Environment
1. INTRODUCTION
Despite the hostile takeover phenomenon being a current practice in nowadays business
environment, it was, however, once classified as a “deviant innovation” (Hirsch, 1986, p. 800).
Several hypotheses have been examined to explain the occurrence of corporate takeovers. These
include synergies, exploitation of market power, reductions in employee welfare, hubris, among
others (Shivdasani, 1993).

63rd International Scientific Conference on Economic and Social Development – "Building Resilient Society" - Zagreb, 11-12 December, 2020
303
However, little is known about the hostile takeovers prior to the capital market advent. This
paper attempts answering this existing gap in literature. It examines one of the major problems
in the business world, the issue of proper evaluations of potential threats. In a world of ever-
lasting possible conflicts, businesses must constantly evaluate their own organization’s
strengths and weaknesses, together with potential opponents that may arise. These evaluation’
needs are not new. The need to evaluate properly has been a part of the world of business ever
since the very beginnings of business. While the need to evaluate has not changed, many of our
tools-at-hand have. Sixteenth century Portuguese entrepreneurs may not have had modern
statistical tools, but they found other, and no less valid, ways to evaluate their situation and
make business decisions. In this paper we examine the business dealings of one particular
Portuguese businesswoman, Beatrice de Luna, known in the literature as Doña Gracia Nasi.
Traditionally, academics have studied business takeovers from financial perspective (Powell,
2004; Owen and Yawson, undated). In reviewing the business literature, it also becomes
apparent that modern scholars often study these hostile actions from the perspective of the
aggressor, i.e. the bidder, or from the perspective of the attacked, i.e. the target (vid. e.g. Ribeiro
and Cravo, 2004; Ribeiro et al. 2012, Ribeiro, 2012). These studies provide us with a good
sense of rational behaviour and pattern analysis, as it is the case of the Mergers & Acquisitions
(M&A) waves phenomenon (vid. e.g. Ribeiro, 2010, 2012). However, such approaches neither
examine or even deal with relevant “soft-data”, such as as motivation, commitment to a specific
ideology or organizational loyalty. In order to reach a deeper level of understanding, this paper
focus on the issue of the hostile takeover not only from the perspective of business, but as an
historical treatise that provides the researcher with a comprehensive combination of
sociological, psychological and philosophical insights. In terms of methodological approach,
we positioned as qualitative researchers, who, unlike the quantitative researcher, recognize that
there is no full objectivity (Rossman and Rallis, 2012). We adopted the view of a qualitative
research that recognizes the problems of validity within statistical research and seeks to
compensate for these potential research problems by triangulating multiple sources and non-
statistical methodologies (Yin, 2009). By examining the life of Doña Gracia from a distance of
centuries, the authors believe that are able to observe her life with greater objectivity, allowing
to examine her business decision-making model within its historical context. Furthermore,
making use of the literature analysis, the authors use a number of hermeneutic tools to examine
not only what the parties expressed, but also what may be the hidden, underlying “text behind
the text.”.
2. HOSTILE TAKEOVERS AND THE Q-THEORY
To develop this meta-analysis, we assume that there may be certain similarities between the
military and the business’ world. For example, militaries live in a world of zero-sum games,
i.e., when someone wins, other one loses (Washburn and Wood, 1995; Dresher, Karlin, and
Shapley, 1950). As such a military must be prepared for both defensive and aggressive
situations. In a likely way, we assume business as a world based on a zero-sum game. To
accomplish this analysis a number of new assumptions must be outlined, namely:
1. All businesses being groups are subject to conflict (Hobbes, 1991; Piirimäe, 2006; Marx,
1977).
2. No business can survive without a system of internal and external control (Walsh and
Seward, 1990).
3. Organizations resist to change (Hannan and Freeman, 1984).
4. Decision-makers rarely have all of the necessary information with which to develop a final
determination (Miller, 1956; Payne, 1976).

63rd International Scientific Conference on Economic and Social Development – "Building Resilient Society" - Zagreb, 11-12 December, 2020
304
Therefore, based on these assumptions and inspired by classical sociological perspectives, we
constructed a social theory in order to accomplished and test Kam’s principles in the world of
business. Scientists and scholars recognize that no theory is complete. In fact, starting with
Einstein, physicists have worked for years to create what is now called “the theory of
everything” in which one single theory would explain the totality of reality. So far, the theory
of everything has eluded scientists as such there are no grand theories, but only those of the
mezzo level. In reality, the attempt to produce a grand theory would result in a tautological error
in which the theory proves itself by itself. As such we must work with theories of the mezzo or
micro level. These mezzo-level theories provide the analytical tools that are needed for a meta-
analysis of Kam (1988) thoughts and how they apply to the non-military world. Durkheim
(1982) states that a social fact is “any way of acting, whether fixed or not, capable of exerting
over the individual an external constraint, or which is general over the whole of a given society
whilst having an existence of its own, independent of its individual manifestations” (Durkheim,
1982, p. 59). This concept interface with the ideas expressed by Kam (1988). In order to better
understand the social context in which business must operate we have created a theory that we
call Q. This theory permits historical reconstruction and allows the researcher to fill in missing
lacunae. The theory argues that at times reconstruction may be more valuable than primary or
even secondary data analysis as it permits the researcher to examine not only the data per se,
but also the way the data appear, and permits the researcher to examine what data may have
been omitted from the record. In this work we use the letter Q to represent any living organism
(a real or social construct), or combination of organisms into a new social organism. We then
begin by assuming that all organisms, be they concrete or social constructs, have certain similar
characteristics and that these assumptions exist on some level within all forms of social life.
These are:
• Q’s desire to survive. If a Q does not seek its own survival than some form of social suicide
will occur. What is true of biological sociology is also true of business sociology. Thus,
businesses must either grow or begin to decline. They must take in more than the output if
they are to survive. In the world of finance a business that does not perform the task of
seeking its own survival chooses bankruptcy.
• Q’s may unite to form new Q’s. The smallest Q is the individual, who may join with another
Q to form a dyad. Q’s can become parts of multiple Q’s (as seen in the diagram below) and
these Q’s may be exclusive, contained in one another or share some commonality. In the
world of business, these Q’s may be employees and employers, new joint ventures, business
relationships etc.
• A newly formed Q becomes independent of its mother Q. That is to say that once a Q unites
with another Q it enters into its own social reality. The older (mother Q) and the new Q’s
(daughter Q’s) then live parallel existences. The formation of a new Q does not necessarily
means the destruction of the older Q. For example, this means that in business employees
may fight owners on one level while at the same time working to keep a company
competition.
• Q’s consistently enter and exist relationships with other Q’s, thus all Q’s live in an unstable
and always changing social environment. Because Q’s are dynamic social facts, they exist
in a highly unstable world. This insight means that business is never stable, that not only
are businesses going through consistent internal changes, but that the environment is also
continuously in a state of change.
• Q’s are both expandable and contractible. This statement means that Q’s live in a hostile
environment in which some Q’s will seek to “consume” other Q’s. This constant lack of
stability means that business can never rest. Like a shark they must be in continual motion,
neither resting nor sleeping.

63rd International Scientific Conference on Economic and Social Development – "Building Resilient Society" - Zagreb, 11-12 December, 2020
305
• Conflict is ubiquitous within and between each Q. Not only are Q’s unstable and exist in an
unstable environment, but they are in constant competition for resources with each other.
This competition may be conscious or unconscious, quiescent or active, but like static
electricity it always has the potential to be activated.
• The more complex the Q the greater the need for a clear division of labour (Durkheim,
1893) within the Q. This means that large Q’s not only need a way to distribute tasks, but
also require ethic and economic regulation to hold a Q together.
• To maintain stability between Q’s each sub-Q must receive, or believe it is receiving, more
than it is giving. Therefore, Q’s live within the realm of social balance. When social balance
ceases to exist then the Q’s sub-Q’s will begin to spin apart one from the other. The social
balance need not be the same on both sides of the scale. Thus, Q’s can be held together by
psychological, economic or physical rewards.
Q’s are not, however, one-dimensional. Instead, within each Q are different forms of energy
that interact and create a dynamic that allows the Q to be held together. Just like the atom in
which there are sub-atomic factors that are constantly in motion, so too are there sub-Q
principles that never cease. In the world of atomic physics these sub-atomic particles are called,
neutrons, protons and electrons. These particles are never still but rather they are in a state of
constant interaction. In a like manner, Q’s have their sub-Q’s. We call these sub-Q energy
particles: P’s, E’s and I’s. These letters are merely social constructs used for the purpose of
evaluation and analysis. As noted above these sub-Q dynamics produce evolving energies.
Below is an analysis of these energies and how they interact within the Q. Figure 1, shown
below, is an example of a Q within a Q.
Figure 1: A Q within a Q
(Source: Adapted from Leite, 2013)
Social groups have multiple aspects that we will call for purposes of this research as PIE. PIE
is composed of the follow assumptions and parts:
• All social organisms, such as a business, have needs represented by the letter E (economics).
No social organism can exist without needs and all social organisms must identify their
needs. For example, social organisms have the need to “take in” more than they “put out.”
That is to say, that any social organism must either grow or begin to die. For purposes of
this work, we represent these needs by the letter “E” which stands for economics. Failure
to identify these needs may lead to misevaluations, military defeat or business failure. At
times Q’s are unaware of their needs and this lack of understanding may lead to false
conflict or non-satisfactory resolutions of a problem.
• All organizations must find a way to satisfy these needs. An organization may know its
needs (P), but if it cannot satisfy these needs then organizational death occurs. We have
classified the act of satisfying an organization’s need by the letter “P”. In our social theory
we understand P (politics), as the means through which an organization satisfies its wants
and needs, be these means legal or illegal, moral or immoral. In the political world, a

63rd International Scientific Conference on Economic and Social Development – "Building Resilient Society" - Zagreb, 11-12 December, 2020
306
government is a means to satisfy a nation’s needs, but is in itself a sub-Q that has both needs
and methods.
• The E of one Q may be a separate Q unto itself. Thus, a business may be that E that permits
a Q to earn money, but once established becomes its own Q with a full set of sub P’s, E’s
and I’s’.
• Organizations must function in both a world beyond themselves and within themselves.
Because organizations do not exist in isolation, they must justify their needs (P) and needs
fulfilment methodologies (E) to others and to themselves. We call this justification process
the “I” (ideology). Ideologies move people and permit organizations to justify their actions
to their constituents and to themselves. We hypothesize that without the proper organization
ideology, no group can survive. Furthermore, while few Q’s are willing to sacrifice
themselves for another Q’s P, many Q’s may share a common I and thus sacrifice
itself/themselves on behalf a common I. Examples of I’s range from emotions such as love
or hate, to forms of human expressions such as marketing or propaganda.
It is essential to remember that each Q is a social organism unto itself and is at the same time
part of multiple Qs, and that each sub-Q will have its own PIE. We may then state that: Q = P
+ E + I plus the sum of its sub Q’s. All evaluations reflect the E of a specific Q’s P as represented
by its I. If the evaluation does not encompass the proper I then no matter how correct the
evaluation’s mathematics may be, the evaluation will not be accepted by the defining Q. As
previously stated, Q’s bond with other Q’s to form new Q’s. This bonding, however, does not
mean that the first Q ceases to exist or that its own particular PIE ceases. Thus, we have not
only Q’s and sub-Q’s, but also PIE’s and sub-PIE’s. Furthermore, a Q may have multiple P’s,
E’s and I’s. P’s E’s and I’s however do not exist in a vacuum. Instead they must have human
beings who turn these ideas into realities or social facts. We represent this humanization of the
P, E and I by the letter H. Accordingly, we can have a PH1, PH2, etc. That is to say these are
the person(s) in charge of determining necessities or who create necessities. In a like manner,
we can hypothesize the concept of an EH and an IH. In an organizational structure the PH may
be the person(s) who set(s) the agendum, the EH may be the staff, and the IH may be the
marketers or human resource management. It should be stated that H’s can mutate, thus in one
situation an H may be a PH and then in another situation transition into an EH or IH role.
However, each PH, EH, and IH is part of multiple dynamic Q’s, and lives within an infinity of
Q’s. This multiplicity of Q’s means that not only is the Q unstable, but that competition is ever
present. Thus, we can predict that within the PH, EH and IH exists a competitive ranking, that
is to say PH1, PH2, PH3 and so on, along with an EH1, EH2, EH3, IH1, IH2, IH3, etc. It should
be noted that the I provides the ‘social glue’ to hold the Q together and that with few exceptions,
real power lays within the realm of the Q’s I. That is to say that within an organization the IH
will dominate even if it does not have authoritative power. As stated above, we assume that a
Q’s leaders and leadership are never totally stable. This means that competition for power may
exist within the Q just as the Q must fight for survival within a greater Q. Power is never one-
dimensional. Instead, there are different forms of power. Two of these forms we will call
“Authoritarian Power” (AP) and “Influential Power” (IP). By AP we refer to power enshrined
into a position such as a president of a company, or a CEO. Authoritarian Power may also lie
within the realm of the “I”. For example, a religious leader or a judge may have authoritarian
power by dint of their position within the Q. Authoritarian power may also cross the lines of a
Q. Thus, the PH, PE and/or PI may be the same person as the person who has AP. The person(s)
who hold AP power holds specific rights and duties and it is assumed that these people will
exercise their power for the good of the larger Q and for their personal Q’s, should that be
needed. The term IP refers to power not necessarily enshrined in a job description, but rather
by the informal use of influence.

63rd International Scientific Conference on Economic and Social Development – "Building Resilient Society" - Zagreb, 11-12 December, 2020
307
For example, a secretary may have a great deal of influence on their boss, or may be able to
control a situation by becoming a gatekeeper or a controller of information. As such the person
of AP becomes dependent on the person with IP. All organizations must deal within the confines
of the social world. How an organization chooses to see that world is dependent on its
theoretical perspective. For example, a Q’s leadership may choose to see the nature of people
as totally good (e.g. Candide, ou l'Optimisme, Voltaire, 2011) or from a highly defensive nature.
The assumption about the nature of humans leads to the following working hypotheses:
• Openness to a surprise attack against one’s business may be related to the negative or
positive worldview that a Q’s leadership holds.
• Business CEOs and presidents may be either powerful or merely figureheads.
• Internal conflicts may so outweigh the need to protect a business that it becomes vulnerable
to surprise attacks due to misevaluations.
Although not stated overtly numerous social thinkers throughout the ages have contributed to
the ideas behind the Q. For example, Weber (1930; 2003) developed the concept of “Symbolic
Interaction”. Symbolic Interaction assumes that the value of any action is determined by the
way we choose to view (examine) any particular action of set of actions. For example, a child
may slap a father and we interpret this slap as nothing more than cute, a slap between angry
lovers may not be liked but will be tolerated, while the same slap between two men who are not
friends can be a call to battle. Weber argues that things are defined within a social context. What
is acceptable in one context may not be acceptable in the next. Weber as such worked in the
realm of the Q’s I. Q’s are consistently examining the symbolism of other Q’s. Symbolic
interaction argues that evaluations fail when one Q assigns a meaning to an action that is
different from what the other Q meant. A failed analysis does not necessarily result in conflict.
It does, however, open Q1 to a surprise attack (misevaluation) by Q2. Although the P and E are
essential, the real work of evaluation almost always occurs in the realm of the I. The work of
the early XX century philosopher Martin Buber provides us with further insights into the realm
of the I. Buber (1958) hypothesizes that all inter-Q relationships can be viewed on two planes.
The first plane he calls: “I-Thou”. Buber (1958) wrote “to man the world is twofold in
accordance with his twofold attitude. The attitude of man is twofold, in accordance with the
twofold nature of the primary-words that he speaks. The primary-words are not isolated words,
but combined words. The one primary word is the combination I-Thou. The other primary word
is the combination I-It; wherein, without a change in the primary word, one of the words he and
she can replace the it. Hence the I of man is also twofold. For the I of the primary I-Thou is a
different I from that of the primary word I-It” (Buber, 1958, p. 3). The author expresses the idea
that no Q exists in isolation, rather we judge a Q by its various primary-shared-relationships, so
that a Q changes its nature not by what it is but rather with whom/what it interacts. In order to
interact, a Q must judge the other Q’s within its frame of reference. Thus, in business, a Q that
poorly judges its interactive fellow Q’s is liable to both a surprise attack and to destruction. In
mathematical terms, Buber (1958) is referring to weighing factors within multivariate
equations, in which each evaluator must determine the importance of each sub-Q relationship
within the realm of a Q or of competitive Q’s. Durkheim (1893; 1982), Weber (1930; 2003)
and Buber (1958) provide the following insights:
• Business must deal with social facts.
• Businesses are in a continual set of change.
• Businesses are open to misinterpretations by interpreting the symbolism of an event (social
fact) incorrectly.
• Businesses may misdiagnose or chose not to diagnose an event and thus open themselves
to a surprise attack.
• These surprise attacks may be due to internal conflicts or to external conflicts.

63rd International Scientific Conference on Economic and Social Development – "Building Resilient Society" - Zagreb, 11-12 December, 2020
308
Buber’s model then adds depth to that of Weber’s. Weber looks at how a Q interprets another’s
actions, while Buber looks at how symbolism interacts within the dynamic of the Q’s. Marx
may be seen as a mélange of Hobbes and Hegel (Worsley, undated). Hobbes (1651) viewed
society as a world of internal conflict. In his work “The Leviathan” Hobbes (1651) accepted the
idea that to live is to be in a state of battle and that each entity competes for resources. The
author extended this idea even to the world of botany. For example, Hobbes (1651) argued that
trees compete for sunlight and that the roots of plants compete for water. Hobbes (1651) argued
that all Q’s are in a perpetual competitive state of war. Hegel (1817) saw the world as a dynamic
in which ideas created facts and that these ideas would be part of an eternal pattern of growth
and rebirth. In his work The Encyclopedia of the Philosophical Sentences in Outline, Hegel
(1817) called this process the interaction of the thesis (idea) with its counter idea, called the
antithesis from which a new idea was borne, the synthesis, which in turn would become a new
thesis. Worsley writes of Hegel: “In Hegel’s thinking, the progress of humanity was seen in
terms of the gradual refinement and realization of the uniquely human capacity to understand
not only the natural world of which human beings were a part, but also to understand the
principles which underlay the development of both the natural world and of society” (Worsley,
undated, p. 23). From Hegel’s perspective, this growth and rebirth pattern would continue into
infinity. Hegel’s conceptualized Q’s are borne from ideas; the Q goes through a lifecycle and
in the end another Q absorbs it. In the world of business examples of action such as these may
be called a hostile takeover or a government takeover. Worsley goes on to state: “…Hegel
argued that there was no separate real world out there, beyond and quite apart from our mental
categories. The world rather can only be known through our mental activity, and the concepts
we use to make sense of the world are constantly changing: historical, not fixed categories.
Knowledge was relative, not absolute” (Worsley, undated, pp. 23-24). Hegel’s analysis tells us
a great deal about Q’s and their relationship position to each other. If we assume that Kam
(1988) is writing about attacks between two Q’s and an analysis is nothing more than a snapshot
of reality taken at a specific time, then Hegel’s analysis means that all business evaluations are
merely transitory and never fully accurate. Marx (1977) synthesized these two philosophers
into one. From a Marx perspective, conflict is ever present, but Marx places certain provisos on
his ideas of conflict. Firstly, Marx turns Hegel on his head. Instead of ideas creating realities,
Marx argued that ideas are the results of realities. Thus, realities adjust their ideas as a form of
self-explanation. Furthermore, Marx took a messianic view of the world and of the nature of
mankind. Like Buber, Marx argued that Q’s relationships are twofold. However, Buber defined
the Q by relationship theory, while Marx defined the Q by theo-economic theory. That is to say,
Marx argues that there are two groups of people that inhabit the world, the proletariat and the
bourgeois. Marx argued that the bourgeois is by nature cruel and seeks to exploit the proletariat.
The proletariat, on the other hand, is pure goodness. As such, once a revolution is to occur, the
nature of the Q changes and conflict ceases (See George Orwell’s books such as: Animal Farm
and 1984.) From Marx’ perspective, all conflict between Q’s occurs due to the bourgeois’ desire
to dominate and to control the proletariat Q’s. In business, this means that there can be no sense
of morality or ethics, but instead a state of constant warfare until the system self-destructs. In a
contrary position to Marx lies the philosophy of the American economist Adam Smith. In his
work The Wealth of Nations, Smith (2003) argues that a Q succeeds by means of competition
with other Q’s. From Smith’s perspective competition not only determines which Q’s will
dominate and which Q’s will fail, but also Q’s define themselves by their competitive nature.
This precursor to Social Darwinism then argues that societies need competition and that the
more a Q is allowed to compete with other Q’s the greater its chance for success. Meanwhile,
a hostile takeover seen from a Marxian perspective is a step backwards. A Marxist would argue
that hostile takeovers represent capitalist greed and the lack of morality within the bourgeois.

63rd International Scientific Conference on Economic and Social Development – "Building Resilient Society" - Zagreb, 11-12 December, 2020
309
From the perspective of Adam Smith, a hostile takeover represents the pinnacle of success. It
is the ability of the strong to eliminate the weak and strengthens a society by vanquishing the
less strong. We now turn to the research of Parsons (1937, 1960). In many ways the Parsons
perspective on theory is very close to that of quantum physics, in that Parsons believed that
everything is connected to everything else in both the social world and that of finance. That is
to say that even the slightest change in the social system can provide unexpected changes at a
later date. The chaos theoretician, physicist Lorenz (1993) famously called this the “butterfly
effect”. “… Chaos theory attempts to explain the fact that complex and unpredictable results
can and will occur in systems that are sensitive to their initial conditions. A common example
of this is known as the Butterfly Effect. It states that, in theory, the flutter of a butterfly's wings
in China could, in fact, actually affect weather patterns in New York City, thousands of miles
away. In other words, it is possible that a very small occurrence (sic) can produce unpredictable
and sometimes drastic results by triggering a series of increasingly significant events” (vid. e.g.
http://library.thinkquest.org/3120). Likewise, any change in the financial/social structure may
produce unexpected consequences. From the Parsons perspective the asking then of the
question “why” is a methodological mistake, as the true answer to why may never be known.
Instead, why provides us with only partial answers to partial questions. Parsons thought also
connects nicely with another principle found in Kam, which is: Evaluations often fail due to
information overload, and this evaluation failure may lead in a like manner to a business failure.
Kam (1988) argues that analytical groups often suffer not from a lack of information, but from
too much information that leads to an analysis paralysis. Kam (1988) shows how military
organizations often miss a threat due to the fact that they were not able to establish a protocol
for prioritizing data. In the same way, this work seeks to see what protocols businesses use to
separate “needed information” from useless information. This work then seeks to look at some
of the reasons behind business evaluation failures and their results: from bankruptcy to hostile
takeovers. It understands that persons in a leadership position (AP power) never have all of the
data, but rather methodologically, it seeks to create hypotheses that will allow for both insights
and further research. What is the relationship between the interactions of Q’s? How does this
create ‘group-think’ or sabotage that may result in a business failure? These above statements
mean that to apply Kam (1988) thought against the background of business theory, we begin
with an additional series of assumptions. Among these are:
• In the best Hobbes terms, conflict is ubiquitous. If social life has an ever-present conflict
component, then the world of business is not socially stable. No business can ever rest on
its laurels but rather must be constantly on-guard against some form of attack, be that attack
foreseen or by surprise.
• Organizations can range from dyads (two people) to highly complex organizations. In all
cases, the same social phenomena occur. The only difference being that the bigger the
organization the more complex it becomes and the less easy it is to see both internal and
external threats.
• Businesses are social groups with both internal and external conflicts. According to Hobbes
theory as reinterpreted by Marx, any social group has the potential for both internal and
external conflict. In the world of business, we call this conflict “competition”. Competition,
however, is nothing more that organized conflict. Businesses must compete for resources,
and opportunities.
• Business can die or be defeated. If conflict exists, then both products and businesses have
life cycles. Life cycles indicate that death (called failure, closure, bankruptcy, or takeover)
can exist.
• Businesses desire to dominate their competition. Marx’s theory would predict that wherever
there are two social groups that must occupy the same space; one will try to dominate or

63rd International Scientific Conference on Economic and Social Development – "Building Resilient Society" - Zagreb, 11-12 December, 2020
310
destroy the other. Domination may manifest itself in multiple ways, from outright
destruction to marginalization.
• Businesses must deal with both centrifugal forces and centripetal forces.
3. THE APPLICATION OF THE Q-THEORY TO THE HOUSE OF MENDES
Doña Gracia Nasi, also known by her Portuguese name of Beatrice de Luna, was born into a
crypto-Jewish family sometime in 1510 in Lisbon, Portugal. The early 16th century was a time
of great economic expansion in Portugal as well as a period of political, economic, and
ideological turmoil. From all indications, Beatrice de Luna (Doña Gracia) came from an upper
class crypto-Jewish entrepreneurial Lisbon family. She married well (1528). The marriage
would be a short one in that with the death of her husband Francisco, she became a widow in
1538. After becoming a widow she chose not to hand her business interests over to her
husband’s brothers, but rather in a period in which few women entered the world of business
and finance, become a major businesswoman of the times. Her husband’s death (along with
multiple political factors in Portugal) may have been one of the reasons that she moved (or fled)
to Antwerp where her brother-in-law, Diogo, had already established a branch office of their
bank, the House of Mendes. In 1542, Doña Gracia’s brother-in-law died, and she assumed
control of the Mendes commercial empire. Doña Gracia was not only a highly successful
businesswoman. Her enormous wealth put her into a position to influence kings and popes. She
also used her wealth to confront major powers in the protection of her people. What makes
Doña Gracia so important to the world of finance is that she was able to develop international
businesses in a time of poor communications, coupled with intolerance. The application of the
Q-Theory to the Doña Gracia’s House of Mendes is summarized below in Table 1.
Table 1: The House of Mendes and the Q-Theory
E (Economics) P (Politics) I (Ideology)
Economic Success
Create relations with the
government officials,
international relations and
networking
The House of Mendes’
success is good for the
country in which it is
located and that
country’s economy
Win the public’s
approval
Provide business capital Business improves
people’s lives
Grow business in stable
climate
Use bribes and good networking All Christians are equal
in the eyes of God
Loyal staff Use family of crypto-Jewish
community
Family is central in the
eyes of the Church
Have alternative
locations should the
need arise
Maintain business offices around
Europe, have a way to move
money quickly
International banking is
good for the host
country
Protect money from
kings and church
Use of bribes and codes What the bank made,
belongs to the bank,
primitive capitalism
Maintain a double
appearance, on the
outside Christian and on
the inside Jewish
Use of Christian symbols and
foods, refusal to be Jewish in
public. Residence in Christian
neighbourhoods
One who is born a
Christian is a Christian
Transmigration of
blood/ one is always a
Jew
(Source: authors’ creation)

63rd International Scientific Conference on Economic and Social Development – "Building Resilient Society" - Zagreb, 11-12 December, 2020
311
Analysing the Table 1’s content, we can conclude that:
• From the P side perspective, we note that Doña Gracia and the Mendes family were:
- Part of a wealthy crypto-Jewish family.
- Marriage alliances were extremely important.
- Women were usually not part of the governmental/administrative elite.
- Business relationships often stayed within the family structure.
- In the case of Doña Gracia, she had to work as a double minority (gender plus religion).
- Due to Portuguese law, half of her husband’s assets belonged to her daughter, exposing
her to potential hostile takeovers.
- As head of the Mendes family, she was able to use her wealth to be known at court.
• From a “drash” perspective (or “derash”, meaning for Jews the reading of what is not
written, but is implied by the text), we can infer that:
- Doña Gracia and crypto-Jews formed a despised minority group and therefore were at
a disadvantage in doing business. Creating a despised class was helpful for those who
were classified as old Christians. Additionally, she was a woman in a man’s world and
therefore had to work harder to win respect. Her money may have provided her certain
advantages or protection. Her money also made her a target, she could not fly under the
radar. In order to survive, the House of Mendes under her leadership had to develop
networks and develop interactive boards. These boards provided leadership, but also
created new political difficulties. As in any multi-layered group, there were divergences
of opinions and often the personal was confused with the business relationship.
• Finally, from a “Remez-sod” (or “hint-secret” in Jewish hermeneutics) perspective, we can
draw conclusions from both the P and E levels of analysis. From this perspective we are
able to draw the following conclusions in our financial history of Doña Gracia and the
House of Mendes:
- It is to the Q’s advantage if its personnel come from a wealthy family (families) or from
high social prestige families. Although there are those who may have broken the wealth
barrier, starting out with money can make entrance into the world of finance much
easier.
- Interfamily networking may have extremely positive or negative repercussions.
- Networking may be one key to financial success.
- The world of finance need not be gender specific.
- Business in-group Qs often resist those from outside of the Q.
- In a tolerant society being a minority may be a favourable factor in business due to
group hegemony, but in an intolerant society minority, status may become a business
liability.
- Entrepreneurial success or decisions may be a function of the legal system in which the
Q lives.
- Successful businesses require persistence and a sense of commitment within the I of the
Q.
- Money may buy power and/or entrée into the right Q’s that form upper classes.
However, money without the proper I is only a temporary entrance into power.
- Money is a major motivation.
- Money often determines policy.
- The more complicated the business Q the more technical business acumen is needed.
- Success or failure in a business Q may be determined by the business leaders’ ability to
evaluate others, both from within and from without.

63rd International Scientific Conference on Economic and Social Development – "Building Resilient Society" - Zagreb, 11-12 December, 2020
312
- A business is a Q and all Q’s may be in conflict with other Q’s. Business is a strategic
set of battles with given rules of war.
- The willingness to assume risk is essential for business.
- The more risk adverse a business is the less well it may grow in a capitalist I oriented
Q.
- There is always tension within the world of business; to be in business is to be in a
constant war.
- Business leadership qualities are essential in a business that has many sub-parts.
- Business battles are won or lost in the realm of the I.
4. CONCLUSIONS
Following the outlined principles and characteristics of the Q proposed in this paper, it is
possible to conclude that, although the Q is not a linear analysis, ultimately, the success or
failure of a business may be examined through it, namely concerning the analysis of potential
business hostilities and takeovers. By applying the concepts and principles of the proposed Q-
Theory, we believe it is possible to predict a takeover attempt, the course of business, as well
as the success or failure of the same. On the other hand, following Kam, with his studies of the
military, one may conclude that Q it is unlikely to provide a preparation for a surprise raid. In
this paper we assume a different position from most previous research in literature, where
qualitative approaches are broadly missing, being the few existing ones mostly developed under
military views. What distinguishes this study from previous studies is that it uses a biographical-
qualitative approach (through a case study of Doña Gracia) allowing in-depth analyses that are
often lacking in quantitative academic research. The Q-theory therefore serves to fill in the
missing analytical lacunae even when much of the data is missing. The ability to examine
business organizations from a qualitative approach permits academic predictions based on a
lack of quantitative data. In this research we could observe how with a minimal amount of
information we can predict the outcome of Doña Gracias journeys in the Catholic anti-business
countries. Indeed, knowing that as in quantum physics, protons and ions and their negative and
positive poles attract or repel, depending on the type of energy they contact, using the theory of
Q and PIE analysis, we can also predict the cycle life energy (Q), and its route and end, by
Catholics and non-Catholics countries, some repelling and others attracting businesses. The
social facts indicate that the probability of Doña Gracia’s ultimate business success in the
Catholic countries ranged from extremely low to nil. The hostilities towards Doña Gracia
resulted from a variety of factors, including the lack of social integration. This preponderance
of society over the individual must allow his/her fulfilment, assuming you can integrate in this
structure. In the Doña Gracia’s case, both for religious reasons (ideological), and professional
(economic) and personal (psychological), this integration was never achieved. The reasons for
this lack of social integration can be summarized as follows:
1) Jewish ancestry in an anti-Semitic milieu.
2) Being a woman in a male dominated culture.
3) The need to do business in a rural economy.
4) A weak economy that was anti-business.
All these factors constituted a challenge to the "moral" authority force, which translated into
the attacks, culminating in her departure from the Catholic nations and the subsequent end of
her business in such hostile environment. Therefore, we may conclude that hostile takeovers
were justified, not due to financial reasons, but due to social and political motivations. The
takeovers were partly successful, but did not have the desired practical results, therefore we
may conclude that they were not successful.

63rd International Scientific Conference on Economic and Social Development – "Building Resilient Society" - Zagreb, 11-12 December, 2020
313
The desired effect of these hostile takeovers was social control over individuals, but in many
cases the results were a brain and monetary drain of national resources. In the case of Portugal,
these policies may have contributed for a social and economic decline, leading to financial
difficulties and questioning the domestic power to the point of a loss of the national
independence.
LITERATURE:
1. Buber, M. (1958). I and Thou. New York: Charles Scribners & Sons Ltd.
2. Dresher, M., Karlin, S., & Shapley, L. S. (1950). Polynomial games. Santa Monica,
California: Rand Corp.
3. Durkheim, É. (1893). De La Division du Travail Social. Presses Universitaires de France.
4. Durkheim, É. (1982). The rules of sociological method and selected texts. New York:
McMillam Press.
5. Hannan, M. T., & Freeman, J. (1984). Structural inertia and organizational
change. American sociological review, 149-164.
6. Hegel, G. (1817). Encyclopaedia of the Philosophical Sciences in Basic Outline. Part 1:
Logic, translated and edited by Klaus Brinkmann and Daniel O. Dahlstrom, Cambridge:
Cambridge University Press, 2010.
7. Hirsch, P. M. (1986). From ambushes to golden parachutes: Corporate takeovers as an
instance of cultural framing and institutional integration. American journal of Sociology,
800-837.
8. Hobbes, Thomas (1991). Leviathan [1651]. Richard Tuck, ed. Cambridge: Cambridge
University Press.
9. Kam, E. (1988). Surprise Attack. Cambridge, MA: Harvard University Press.
10. Kerdeman, D. & Kushner, Rabbi L. (1986). The Invisible Chariot: An Introduction to
Jewish Mysticism and Spirituality. Denver, CO: Alternatives in Religious Education.
11. Leite, E. M. A. (2013). An academic contribution toward qualitative evaluations of surprise
business takeover attack: an historical perspective. Ph.D Thesis, UTAD.
12. Lorenz, E. N. (1993). The Essence of Chaos. Washington. University of Washington Press.
13. Marx, K. (1977). Capital. New York: Vintage Books.
14. Miller, G. A. (1956). The magical number seven, plus or minus two: some limits on our
capacity for processing information. Psychological review, 63(2), 81.
15. Orwell, G. (2007). A Revolução dos Bichos. Companhia das Letras.
16. Orwell, G. (2009). 1984. Companhia das Letras.
17. Owen, S. & Yawson, A. (undated). Post-IPO corporate life cycle and takeovers School of
Banking and Finance. University of New South Wales, Sydney Australia, Unpublished
article.
18. Parsons, T. (1937). The Structure of Social Action. McGraw-Hill, Boston.
19. Parsons, T. (1960). Structure and Process in Modern Societies. Glencoe, Illinois: The Free
Pres
20. Payne, J. W. (1976). Task complexity and contingent processing in decision making: An
information search and protocol analysis. Organizational behavior and human
performance, 16(2), 366-387.
21. Piirimäe, P. (2006). The explanation of conflict in Hobbes’s Leviathan. 10(60/55), 1, 3–21.
22. Powell, R. (2004). Takeover Prediction Models and Portfolio Strategies: A Multinomial
Approach. SSRN Scholarly Paper No. ID 622101. Rochester, NY. Accessed on
http://papers.ssrn.com/abstract=622101.
23. Ribeiro, H. & Cravo, D. (2004), Some evidence about how corporations perceive the
success in M&A, 27th European Accounting Association Proceedings, Prague, Czech
Republic

63rd International Scientific Conference on Economic and Social Development – "Building Resilient Society" - Zagreb, 11-12 December, 2020
314
24. Ribeiro, H. (2010), The Missing Links of Mergers & Acquisitions Waves, The IUP Journal
of Business Strategy, 7(3), 7-25.
25. Ribeiro, H. (2012), New Business Combinations Accounting Rules and the Mergers and
Acquisitions Activity. Saarbruckën, Germany: AV Akademikerverlag.
26. Ribeiro, H., Carvalho, P., Pereira, J. & Silva, A. (2012). Post-merger & acquisitions (M&A)
returns: are buyers winners? Evidence from Portugal, 5th Annual EuroMed Academy of
Business Proceedings, 1189-1199.
27. Rossman, G. & Rallis, S. (2012). Learning in the Field: An Introduction to Qualitative
Research. Thousand Oaks: Sage Publications.
28. Shivdasani, A. (1993). Board composition, ownership structure, and hostile takeovers.
Journal of Accounting and Economics, 16 (1–3), 167-198.
29. Smith, A. (2003). A Riqueza das Nações. Martins Fontes, Brasil.
30. Voltaire (2011). Candide. Belin, France.
31. Walsh, J. P., & Seward, J. K. (1990). On the efficiency of internal and external corporate
control mechanisms. Academy of management review, 15(3), 421-458.
32. Washburn, A., & Wood, K. (1995). Two-person zero-sum games for network
interdiction. Operations Research, 43(2), 243-251.
33. Weber, M. (1930). The Protestant Ethic and the Spirit of Capitalism, Unwin Hyman,
London & Boston.
34. Weber, M. (2003). The Protestant Ethic and the Spirit of Capitalism. Translated by Talcott
Parsons originally published Scribner New York 1958, Library of Congress.
35. Worsley, P. (undated). Marx and Marxism. Chichester, England: Ellis Horwood Limited.
36. Yin, R. (2009). Case Study Research: Design and Methods (4th ed.). Thousand Oaks: Sage
Publications.

63rd International Scientific Conference on Economic and Social Development – "Building Resilient Society" - Zagreb, 11-12 December, 2020
315
NEW APPROACH TO ASSESSMENT OF THE APPLICATION OF A
NEW TECHNOLOGY IN DAIRY AND MEAT CATTLE BREEDING
Irshad Abdul Oghlu Kerimli
Azerbaijan State University of Economics (UNEC)
Baku, 6, Istiqlaliyyat str., AZ1001, Azerbaijan
Ramal Karimov Irshad
Azerbaijan National Academy of Scienses (ANAS)
Baku, Huseyn Javid Avenue. AZ1000, Azerbaijan
Rauf Gunduz Oglu Safarov
Azerbaijan University of Cooperation
Baku, Najaf Narimanov str., AZ1000, Azerbaijan
ABSTRACT
It should be noted that in agriculture, too, the quantitative expression of technological progress
is determined primarily by the result of the production function. In this sense, it is worth noting
that the direction of modernization of machinery and technology in agricultural livestock farms
is reflected in the process of gradual concentration of milk and meat production. From the point
of view of natural climate condition, natural grass covers of the soil, fodder supply in the
administrative regions of Azerbaijan, there is not much improvement in the manufacturing
areas for dairy raw materials and thus concentration. This paper finds out that as a result, the
technical and economic justifications presented as a part of this research must be taken into
account for the optimal position of small and medium-sized dairy farms and dairy plants in
region.
Keywords: dairy farms, diary production, milk production, a new technology
1. OPPORTUNITIES FOR THE NEW TECHNOLOGY IN THE DIARY
PRODUCTION
Not any structure of the agriculture is capable for entirely renewing an existing technology and
simultaneously following each scientific-technical achievement. But, quality parameters of
management of funds, technology and production used in each structure should be necessarily
reflected on the sequence of technological advancement in agriculture. It should be noted that
quantitative expression of technological advancement in agriculture is also determined with the
output of the function of production. In this view, it’s much more important to ensure the
application of new techniques and technologies in cattle breeding fields of the agriculture in the
process of gradual concentration of dairy and beef production (Babayev, 2019; Babayev,
2020).It allows correct determination of the further development direction of the sector,
contributing to the increased economic efficiency of additional expenditures. For this reason,
the importance of the determined direction is dependent of elements of resources required for
dairy and beef production, which can be reflected on the assessment of the increase of
production attributed to the share of relevant resources. For this, the calculation of multiple
regression methods should determine the average annual growth rate for each resource type
based on the elasticity coefficient. To find the average annual growth rate, we can use the index
method, which evaluates the main direction of technological innovation in the field, as the
formula for the Index method is as follows.

63rd International Scientific Conference on Economic and Social Development – "Building Resilient Society" - Zagreb, 11-12 December, 2020
316
𝐷𝑘𝑖 =𝐸𝑖𝐾
∑ 𝐸𝐾𝑖𝑛𝑖=1
Here, 𝐷𝑘𝑖 − is the efficiency index; i–is the type of animal husbandry; Ei– is the coefficient of
elasticity; Ki- is the average annual growth rate.
Based on the above-mentioned formula, the milk and meat production efficiency index of
Azerbaijan for 2010-2015 is calculated by 0.5% (excluding livestock), 0.28% for livestock and
poultry and 0.58% for fodder. It means that the technological innovation is an effective way for
improving the productivity of one herd (which contributes 7% of all product growth). At the
same time, modernization of feed structure was 7.7%, introduction of more productive varieties
of cultural feed and improvement of feed production technology was 14.6%. Indicators-
describing the efficient utilization of labor resources should be of particular interest. During the
period under review, the average annual number of employees in dairy and dairy livestock
farms was over 25% of total product growth, and overall share in labor resources was more than
35%, including 15.5% due to an increase in the number of employees, the share of skilled labor
increased by 7.0%, and the cost on scientific research for improving technology of organization
and management of production increased by 14.5%. The proposed method of approach allows
for a reliable and accurate assessment of the main trends in the utilization of technological
innovations in livestock production in Azerbaijan, which is very important for the selection and
stimulation of the most effective directions.
2. CYCLIC SYSTEM TECHNOLOGY OF MILK PRODUCTION
There is a need for the reconstruction of livestock products, including the milk production cycle
- and the rapid application of new technology for this production in Azerbaijan. This system
should be implemented based on the utilization of local raw resources. The cattle-breeding
farms should make better utilization of existing local opportunities to gradually improve the
supply of Azerbaijani consumers to milk and dairy products (Todaro, 1997). The dairy and
dairy-meat agricultural cattle-breeding farms, the dairy industry, the milk processing industry,
auxiliary production and specialized vehicles are included to the milk production cycle of
Azerbaijan. One of the main stages of such a system is the provision of fodder resources.
Precious fodders are considered as fodder produced by agricultural fields and by nature. Dairy
farms in the milk production cycle take the special place, where milk is produced for sale in
these farms. The number of such farms in Azerbaijan is about 150, with their production volume
accounting for 25-30% of the total agricultural output. Experience shows that specialized
economies have higher economic and ecological effectiveness of milk production than multi-
sectorial economies. This is confirmed by the cost of milk production per 100 hectare of
agricultural areas and the average annual milk yield indicator per cow yielding. For example,
between 2005 and 2015years, on average, 500 quintals of milk produced on 100 hectare of
productive agricultural areas, and more than 350 quintals of milk on multi-sectorial economies.
At present, the demand for dairy products of the population of Azerbaijan is not in the required
level. In 2017, 2024143 tons of dairy products were produced at the expense of local resources
and 344018 tons were imported from abroad. In 2017, at the expense of local resources, 225 kg
of dairy products (including milk) accounted for per person of population, which is 31.5%
below the rational physiological norm. The figures show that in the long run, the industry needs
to have a rapid growth rate to meet the needs of the Azerbaijani population in dairy and dairy
products. If the provision of the population with milk and dairy products will improve at the
level of physiological norms, taking into consideration the efficiency of local production,
import substitution of these products will happen, thus the import will reduce. For this purpose,
there is a need to make fundamental changes at all stages of the milk production cycle.

63rd International Scientific Conference on Economic and Social Development – "Building Resilient Society" - Zagreb, 11-12 December, 2020
317
Based on the establishment of efficient balancing at all stages of the milk production cycle, it
is necessary to set up a cycle system so that the local production of milk and milk products can
replace not only the same products, but more to have a chance to enter foreign markets with
these products. The central part of milk production is concentrated mainly in rural areas, with
large farms and peasant households, which their share favorably accounted for 68.1 and 31.9%
of total milk production in 2017. The size of milk production in Azerbaijan increased from
1,536,000 tons to 2,024,000 tons in 2010-2017, which has led to an average growth of 1.3%
over the same period. It should be taken into consideration that 1.3% growth over 8 years
couldn’t be considered economical. Because during that period milk and dairy products per
capita for the population of Azerbaijan increased from 190 kg to 210 kg. This is a very small
indicator. (See Table 1)
Table 1: Milk production in Azerbaijan1 in 2010-2017
YEARS 2005 2010 2015 2017
1 2 3 4 5
Milk production
(thousand tons)
1251,8 1535,8 1924,5 2024,1
Cheese production
(thousand tons)
including
311,4 357,0 399,4 444,5
Butter 350,7 458,1 524,1 960,3
Yogurt 129,7 130,2 125,8 126,6
Sour cream 320 320,0 410,8 888,4 960,0
Other products 5 5,0 8,5 14,0 11,6
In addition to increasing the systematic organization of different stages of milk production,
further limitation of its seasonal nature is very important. At present, seasonal milk production
level (coefficient) on months and quarters throughout the Republic are in the range of 45-50%.
It means that the population of the country is not able to meet their actual demand for local milk
and milk products, and at the same time the ineffective use of production facilities of milk
processing enterprises.
Graph following on the next page
1 The table is calculated on the basis of statistical datas of Azerbaijan . Baku 2018, page 504

63rd International Scientific Conference on Economic and Social Development – "Building Resilient Society" - Zagreb, 11-12 December, 2020
318
Graph 1: Production capacity of milk processing plants (thousand tons) (Statistical
Indicators of Azerbaijan 2019, 2020)
3. ANALYSIS
The current position of the milk and dairy products market of Azerbaijan shows that the buyer
increases demand for milk products faster in comparison with the local milk. Based on this
growth, it is necessary to pay particular attention to the effectiveness of milk production cycle,
thus procurement and delivering of milk to the processing facilities. Refrigerating the quality
of milk, reduction of losses, and increasing dairy production according to the market
requirements, milk needs to be cooled at 10-120 after the milking stage. But unfortunately, this
process is not yet fully implemented in the republic. Only 25-30% of procured milk delivered
in the cooled form. For comparison it must be pointed out that 90-95% of the procured milk in
Belarus, Estonia and such other republics is being delivered to the processing facilities in the
refrigerating form. Reception of refrigerating cooled milk, especially by centralized
transportation, and delivering to processing facilities is considered more efficient from the
economic efficiency point of view. About 35-40% of provision of the population with milk and
dairy products in Azerbaijan have been carried out on the account of imported products from
abroad or manufactured goods under the license of foreign countries. For the replacement of
such imports in the near future, it is necessary to raise the average annual milk yield from per
cow to 2000-2500 kg. Taking into account that currently 1.2 million cows would be breed in
the livestock sector of Azerbaijan. In this case, milk production in the country can be increased
to 2300 x 1200000 = 2.8 million tons, which is close to the effective rate (3.5 million tons) to
meet the population's demand. For the acceleration of this approach, intensive technology must
be applied in dairy-husbandry farms, not less than 300 kg of milk per cow should be yielded.
To this end, for the production of 1ton of milk there is a need for 1,3 – 1,5 center of em unit
and 5,5 – 6,0 man power /hour, and for the milking of 5000 kg of product there is a need for
1,1 – 1,2 center of em unit and 4,0-4,5 man power/hour resources. At present, the development
of dairy farming in several foreign countries and transforming practice of these farms to a more
industrialized households are of particular interest.
1.5 2 2.3
25
140145
0
20
40
60
80
100
120
140
160
1990 1995 2000 2005 2010 2015

63rd International Scientific Conference on Economic and Social Development – "Building Resilient Society" - Zagreb, 11-12 December, 2020
319
The industrial technology dairy production applied in USA, Canada, Germany, Netherlands etc.
countries, is differed by high intensity and yields more than 5000 kg per cow. It should be noted
that such technology can be successfully applied in Azerbaijan, in its high-intensity dairy
breeding zones.
Figure 1: Milk production per 100 ha of agricultural field (per 1 ha of centner)
The specialized husbandry complexes consisting of 500, 700 and 1200 cows should be
established based on the gradual reduction of existing small and medium-sized dairy farms,
focusing on zoning on the map of the natural-climate and soil cover features of Azerbaijan. It
would be better to breed 100 and 120 dairy cows in each dairy farm suitable for the conditions
of Azerbaijan for the application of above mentioned new technological devices. After all, at
least 20 cows with 3,000 kg of milk yield can be breed in per 100 hectares of farmland, which
means 650-700 center of milk per day. Taking into consideration the existing current natural-
climate and vegetation-soil cover conditions and perspectives of Azerbaijan, the establishment
of dairy and meat -dairy breeding zones in accordance with the feasibility study for the
construction of specialized dairy farms with high economic indicators should be considered
advisable (Materials of the republican meeting of non-oil exporters of Azerbaijan, 2017).
Table following on the next page
+
Zagatala
Shaki
Khachmaz
Sumgayit
Baku
Shamakhi Aghdash
Yevlakh
Barda
Aghdam
Khankandi
Jabrayil
Kalbajar
Ganja
Aghstafa
Nakhchivan
Ordubad Lankaran
Masalli
Salyan
+

63rd International Scientific Conference on Economic and Social Development – "Building Resilient Society" - Zagreb, 11-12 December, 2020
320
Table 2: Economic indicators of individual farmers by natural and economic regions of
Azerbaijan for 2010-2017 (Report materials of the Ministry of Agriculture of Azerbaijan for
2019, 2020) Dairy farmers Number of
cows and
buffaloes
milk for
per cow
and
buffalo in
kg-s
Farm land
area of
households in
hectare
Household
direction
Name and
surname of
farmer
"Agro
Industries"
LTD Shaki
district
569 5397 250 Dairy Rafael
Rahimov
"Zabrat"
Apsheron
district “
110 1000 0,5 Dairy Rahib
Pashayev
"Afadli"
Agstafa
district
293 2927 100 Dairy Fuad
Ayubzade
“Shiyakaran”
Lankaran
District
150 148 20 Dairy Akif Aliyev
“Yasamal”
Shamakhi
District
65 960 180 Dairy Guloghlan
Hasanov
If the biotechnology, including genetically and cellular engineering achievements of new
directions of biology could be used more effectively in dairy husbandry households, the field
would achieve great perspectives and high-yield productive dairy farms could be established in
future. Based on the experience of various countries, the most productive breeds of animals
adapted to the different climatic conditions of the country should be considered as the most
feasible way to bring the breeding potential to a different, yet appropriate, country. This
experience is also unique for Azerbaijan, and it should be further expanded within specialized
farms in the country. For this purpose, it is necessary to continue the creation of more productive
breeds based on the hybridization of highly productive breeds of Russia, Belarus, the
Netherlands and other countries with local breeds of Azerbaijan. This way can yield 6,000 to
7,000 kg of milk from per cow with 4.5 to 5.0% fat content. Formation and concentration of the
milk production cycle on the territory of Azerbaijan and the specialization of livestock at any
stage should be inextricably linked. This enables farmers to produce dairy products from a wide
range of milk resources. This process can be clearly seen from the cyclical structural model of
milk production from milk resources. (See photo 2)
Figure following on the next page

63rd International Scientific Conference on Economic and Social Development – "Building Resilient Society" - Zagreb, 11-12 December, 2020
321
Figure 2: Cyclic model of milk production from milk resources
S - milk production; S1- - annual milk processing; S2 – composite milk processing; S3 -
finished product production; L - lean milk; L1-substituted milk; L2- drinking milk; L3-dry fat
milk; L4- curds; a- buttermilk; a1 - cheese, curds; a2 - dry buttermilk; a3- drinking; r - protein;
r1 - milk sugar; r r2- protein contained in milk; r3 - protein substance; G – yeast(leaven)
production
4. CONCLUSION
As can be seen from the structural model, milk-resource turnover continues from low networks
to the final and ready-to-use products of dairy factories. The sale of final and ready-to-use dairy
products by the dairy factories should be qualitative and continuous, the factories located in
regional centers and major cities can freely make decisions for the realization of products
available through flexible private, local (municipal) and state-owned trading networks. In this
sense, the specialization of the enterprises on the production of these products should be
expanded both width and deep, as a great deal of raw materials were used for the production of
butter, cheese, dry milk, curd, cream, milk sugar and other types of dairy products. Changes in
the production places of dairy raw materials and their concentration in terms of natural and
climatic conditions of the administrative regions of Azerbaijan, natural grass cover and feed
delivery are not considered. As a result, the feasibility study provided in this project should be
taken into account for the optimal location of small and medium-sized dairy farms and dairy
plants across the country.

63rd International Scientific Conference on Economic and Social Development – "Building Resilient Society" - Zagreb, 11-12 December, 2020
322
LITERATURE:
1. Babayev, B. (2020). Main Directions of the Non-Oil Export Sector in Azerbaijan. Journal
of Economic Sciences: Theory & Practice, 77(1).
2. Babayev, B. (2019) "Studying the Case of the UAE in Economic Diversification and Non-
Oil Export Growth: Public Policy Lessons for Azerbaijan." Journal of Economic Sciences:
Theory & Practice 76, No. 2
3. Materials of the republican meeting of non-oil exporters of Azerbaijan (2017) p. 27
4. Michael P. Todaro Economic Development, New York University (1997) p.671.
5. Report materials of the Ministry of Agriculture of Azerbaijan for 2019 (2020) Baku.
6. Statistical Indicators of Azerbaijan 2019 (2020) Baku, available at Stat com.

63rd International Scientific Conference on Economic and Social Development – "Building Resilient Society" - Zagreb, 11-12 December, 2020
323
BUSINESS CAREER IN THE FRAMEWORK OF LABOUR MARKET
COMPETITIVENESS: CHALLENGES, APPROACHES, AND
SOLUTIONS
N. Z. Sotnikov
Novosibirsk State University of Economics and Management, Russia,
56 Kamenskaya Street, Novosibirsk, 630099, Russian Federation
ABSTRACT
The article is focused on the on-going challenge of developing a system of balanced business
career indicators, identifying its prospects in order to ensure the competitiveness of the
company labour market. The article offers a system of balanced business career indicators,
which includes four groups of indicators, which are independent, correlated and interlinked.
The presented system of indicators does not only facilitate the assessment of the level and
dynamics of a business career at any time, but can also quickly and accurately analyse its state
with a view to making reasoned management decisions. In general, the proposed system of
balanced business career indicators is able to evaluate a career through its infrastructure
criterion, technological, marketing and financial; determine the contribution of its individual
stakeholders to achieving the competitiveness of the labour market; identify business career
indicators that negatively affect the competitiveness of the national labour market; take a more
reasonable approach to the development of organizational strategies, plans and career
programmes.
Keywords: Business career, Company labour market, Labour market competitiveness, System
of balanced indicators
1. INTRODUCTION
In a situation when the socio-economic environment is highly complex, uncertain and dynamic,
and the a 'transparent' world market is developing, the rationalization and automation of
business processes, the use of internal reserves of the working time, improvement of the
production management, labour and management do not always result in a qualitative increase
in the competitiveness of the labour market. It should be recognized that "Russian organizations
have come close to their maximum capacity of dealing with challenges of the economy and
management of the labour processes, having constructed a foundation in the form of sufficiently
advanced organizational and economic systems in the social and professional sphere" [25, p.
80]. The competitiveness of the labour market increasingly depends on the qualification of
personnel, the degree of their involvement into the process of attracting resources required for
a business development, creative activity, willingness to take responsibility for decisions, etc.
Not only should the employees be highly qualified and accept the executive discipline, but they
also should seek the reserves for their own development. "The development of competition in
the economy presents a challenge to everyone who is striving for personal success and
outperforming other competitive employees who aspire for identical goals" [23, pp. 1302-
1303]. As a result, the focus of employers' attention is shifting to encouraging their employees
to achieve a self-conscious competitive advantage over other competitive employees in order
to ensure their well-being throughout their working life, i.e., to a business career. A
comprehensive study of a business career and factors that influence its development, progress,
and destruction is one of the components of managerial decision making, adapted to the
challenges of the internal and external environment, with a view to ensuring the competitiveness
on the internal labour market. In this regard, it is extremely important to have a complete system
of indicators that can be used to measure and evaluate a business career in the company, identify

63rd International Scientific Conference on Economic and Social Development – "Building Resilient Society" - Zagreb, 11-12 December, 2020
324
its least developed elements, determine the necessary tools for its development and analyse the
effectiveness of management decisions. Hence, the focus of the study is to built a foundation
for an integrated system of indicators, measuring and evaluating a career in the company,
identify its vulnerable positions, determine the necessary measures for its development and
analyse the effectiveness of management decisions in the context of ensuring the
competitiveness on the internal labour market. The objectives of the study are to clarify the
essential characteristics of the modern business career concept in the context of ensuring the
competitiveness of the labour market of organizations, to study the possibilities and limitations
of using business career indicators in modern conditions, to systematize the principles of
constructing a system of its indicators in accordance with the current requirements, to build a
system of business career indicators. The hypothesis of the study is that the system of business
career indicators creates the foundation for an effective system for managing the
competitiveness of the internal labour market, which ultimately enables the capitalization of a
business career management and, as a result, to enhance the efficiency of organizations in the
current market conditions. The scientific novelty lies in the fact that one of the key problems of
scientific and methodological support for a business career of personnel has been solved,
namely, the theoretical and methodological imperatives of an integral system of its indicators
in the context of ensuring the competitiveness of the internal labour market have been
developed. A complex of basic methods of theoretical research (analytical abstraction,
interpretation, classification and typology) is effectively used in the article. The subject matter
of the research is quantitative characteristics of stable and regular socio – economic
relationships within business career processes.
2. CONCEPTUAL FOUNDATIONS OF A BUSINESS CAREER: SOCIO-ECONOMIC
ESSENCE
The modern concept of a business career, while retaining elements of technocratic and
humanistic concepts, is based on completely different values. It proceeds from the
understanding that "while a person sees their career as a development and promotion in the
organization, the organization regards it, first of all, a question of the completeness and integrity
of this space" [12, p.220]. A career is "the progress of an individual up the career ladder in their
professional improvement, corresponding to their values, and at the same time satisfying the
interests of society to the full extent" [13, p.23-24]. It is "the progress of the individual towards
competitiveness in society in order to meet personal and organizational labour needs, based on
a subjectively conscious position, taking into account factors of the external and internal
environment" [11, p. 9]. Thus, a career within the framework of the market concept is a way to
achieve dialectical equivalence (balance) of socially different work interests of the employer
and employees, based on the labour sale and purchase relationships. The interests of the
employer and employees in the national labour market are closely interrelated, which is circular
in nature. The employer is interested in the creation of the demand for such price and quality
characteristics of the labour force, which increase the utility of labour. In other words, "the
employer's strategic interests appear to be focused on preserving and developing key knowledge
and competencies the organization requires" [3, p. 12-15]. Employees are interested in such
labour offers that will allow them to have an acceptable (desirable) quality of working life in
the form of all kinds of material and non-material benefits (including the promotion up the
hierarchical ladder). "In the flow of social life, the results of personal achievements and
outperforming other competitive employees is to surpass and increase the quality of working
life achieved by the employee at the moment" [22, p.190-200]. The understanding of a business
career as a way to achieve dialectical equivalence (balance) of socially different work interests
of the employer and employees enables us to state that the "desirable" or "typical" state of the

63rd International Scientific Conference on Economic and Social Development – "Building Resilient Society" - Zagreb, 11-12 December, 2020
325
internal labour market is an equilibrium (i.e., when the interests of the employer and employees
match), and in case of imbalance, the labour market tends to restore it through a business career.
The labour market is certainly experiencing cyclical fluctuations, and the balance of interests
in the national labour market is relative, it is dynamic and changeable. These interests can
change quite widely, responding to the scientific, technical and socio-economic progress, the
reproduction of human resources, the dynamics of market demand for goods and services,
personal development and changes in its needs, the actions of employers, etc. It appears that
certain market situation may occur, when, firstly, employers experience the deficit of labour
force, and therefore the employer faces the need for extra outsource labour force, or, on the
contrary, the number of employees is higher then actually needed, which implies excess labour
force. Secondly, the employee, as the owner of the labour force, seeks to increase the profit
from participation in the production and commercial activities, taking into account their existing
or advanced professional aptitudes, in which case the employee is not inclined to stay long with
the company. In these cases, career mechanisms, establishing a broken concordance in terms of
the quantitative characteristics, step in. At the same time, achieving a balance of work interests
does not mean that career opportunities are exhausted. A situation is possible when the existing
personnel structure (by category, division, functional and professional groups of employees)
does not meet the needs of the organization or the interests of employees. In this case, career
mechanisms, establishing a broken concordance in terms of the quality characteristics, step in.
So, in the national labour market, there are three key types of imbalance of work interests that
activate the mechanisms of a business career:
• recessionary gap is when the key problem is the company labour demand, lagging behind
the total supply of labour;
• expansion gap is when the problem of aggregate labour supply, steadily lagging behind its
aggregate demand, is crucial,
• depression gap is when the structure of the total labour supply does not coincide with the
structure of its total supply in the conditions of a quantitative equilibrium of labour supply
and demand.
A business career as a whole develops through the interaction of three types of imbalances of
work interests mentioned above, reducing or increasing the gap between the volumes and
structures of company labour demand and supply. The career develops, first, via the model of
intra-organizational careers related to the advancement up the hierarchical ladder in order to
achieve a certain social status, a specific position; second, via the model of inter-organizational
career, followed by a transfer from one organization to another within the same industry or
different industries; third, via the model of professional career, coupled with the development
of competencies (competitive advantages), and professional development. It should be noted
that each type of interests imbalance in the labour market requires its own business career logic,
which has certain vulnerabilities that should to be carefully and comprehensively measured and
evaluated. A career driver under the circumstances of one type of imbalance is a career barrier
under the circumstances of another type of imbalance. Thus, a business career in the
recessionary imbalance manifests itself primarily in the intensification of an inter-
organizational career, while the depressive imbalance, on the contrary, hinders it.
3. BUSINESS CAREER AS AN OBJECT OF STATISTICAL RESEARCH:
APPROACHES AND PROBLEMS
A career as an object of statistical research is defined as a way to achieve the balance of work
interests of an employer and employees. It has clearly expressed stages distributed over time
and is characterized by a certain set of statistical indicators. Statistical studies of business
careers involve a creative study of the features of personal/professional and service and post

63rd International Scientific Conference on Economic and Social Development – "Building Resilient Society" - Zagreb, 11-12 December, 2020
326
types of personnel positioning in various types of imbalance of work interests in the internal
market by comparing the absolute and relative values of business careers, its time series,
variations, sample observations, measurements, relationships, etc. These studies are required to
determine the most effective ways of positioning personnel in a dynamic market stratified
system of the division of labour, taking into account the competitive advantages and
vulnerability of the position of the national labour market, in accordance with the features of
internal and non-organizational realities. The objectives of studying a business career as an
object of statistical research are:
• the study of the career system as an integral set of resources for achieving a dialectical
balance of interests in the domestic labour market, i.e., the infrastructure of a business
career;
• the study of determinants, elements, sources, driving forces and mechanisms of formation,
development and destruction of a business career, i.e. technologies of a business career;
• the development of a system of reasoned ideas about the directions of the development of
quantitative characteristics and the future state of a business career and its environment, i.e.
the consumer value of a business career;
• Identifying the conditions under which intangible assets of a business career bring tangible
outcomes, i.e., the conditions for its capitalization.
The issues of measuring a employee business career cause numerous discussions in the Russian
and foreign works due to the multi-aspect character and novelty of the task of a business career
indicators systematization. At the moment, there is no generally accepted system of indicators
that makes it possible to quantify the personnel career. Contemporary studies of business
careers usually use two basic approaches to measuring it: objective and subjective. An objective
approach to measuring a business career primarily employs the results of socio-psychological
tests and statistical personnel reporting of organizations. In recent years, a significant
contribution to the development of socio-psychological career indicators has been made by
Russian and foreign scientists. The peculiarity of these systems is the measurement of business
career mainly through a set of attributive socio-psychological indicators: professional types of
personality and environment [7, pp. 87-102], career anchors [19], career potential [6, p.117-
131], type of promotion [21], styles of organizational leadership [30; 10]; coping strategies
[18]; perception of the other [17]; career motives and values [15], and how an individual
interacts with the space and time of their life [28, p. 325-328; 27, p. 13-24], etc. As a rule, these
systems are characterized by weak formalization, fuzzy classification of indicators, the
predominance of qualitative measurement methods, and most importantly, the so-called
synergistic effect of interaction and interdependence of these indicators is not taken into
account, which presents a certain problem for statistical career analysis. Statistical observation
indicators used in Russian statistical practice provide the information about a business career
measured by quantitative methods. The properties of a business career are defined through:
• objective spatial parameters of an employee career. This is the career range, its lowest and
highest point, inter-career ratios, "career bottleneck", an indicator of potential mobility [2;
24; 26];
• temporary characteristics of labour mobility. This is the time of transition from one stage
(position, production level on the "social hierarchical ladder") to another, the period of work
in the same position [12, p. 210-221], the number of employees been promoted, including
after training, and following the assessment [8, p. 832-84], as well as the number of
employees included into the personnel reserve [21];
• cost indicators of investment into the personnel career. These are return on investment
(ROI), income from the implementation of training programs, and total training costs [21].

63rd International Scientific Conference on Economic and Social Development – "Building Resilient Society" - Zagreb, 11-12 December, 2020
327
It is not uncommon for indirect statistics to be used to measure careers. These are the
characteristics of the personnel structure by age, category, length of service, level of education
[20, pp. 327-330], job levels [6, p. 109], as well as indicators for evaluating the competitiveness
and achievements (labour outcomes) of employees [31; 26, pp. 195-197]. Indicators of
statistical observation of business careers are often considered either as the state of a spatial set
of individual careers, or as a dynamic sequence that characterizes the development of this set
over time. In other words, a business career is described at a certain point in time – in this case,
it is about its level (state) at the current time, and in dynamics – when it is about assessing
changes in its level (status). It is easy to see that the use of such indicators for statistical
personnel reporting of organizations is characterized by limited opportunities for a productive
career research in the context of labour market competitiveness, since these indicators are often
not functionally related. But this aspect does not take into account the new qualitative career
characteristics that are generated by the synergy effect of employee individual careers in the
process of joint work, their mutual influence on each other (including on the success of the
careers of others). If the interrelation of career indicators is being neglected, the career dynamics
tend to develop along such a trejectory, when the improvement of some indicators leads to the
deterioration of the other, and hence, reduces the competitiveness of the labour market.
Moreover, such indicators cannot be used by managers when making career related decisions,
since they do not have any informative value regarding career prospects, development and
destruction. The subjective approach to measuring a business career is based on the results of
sociological surveys that reflect opinions and judgments of various individuals regarding
motivation and satisfaction with the aspects of a business career [1; 16, pp. 201-212]. This type
of data is mainly processed through the methods of expert assessments or self-assessments,
associated with insufficient reliability of the information required for the evaluation, and the
use of semantic measures for measurement and evaluation. So, at present, due to its novelty and
multidimensional nature, the urgent task of the classification of business career indicators,
expressed in a numeric form, has not found proper coverage in Russian and foreign studies.
However, the development of an integrated system of such indicators is preconditioned by the
need for a comprehensive statistical study in order to identify unique conditions, causes and
factors that ensure the competitiveness of the internal labour market, and to achieve a higher
level of competition. This system will serve as an information base for the development of
company career policy with a focus on the increase of competitiveness on the internal market,
taking into account the company development vector.
4. THE SYSTEM OF BALANCED BUSINESS CAREER INDICATORS:
METHODOLOGICAL AND METHODICAL FOUNDATIONS
The system of business career indicators is a set of variables used to measure and evaluate
through digital data the properties (attributes) of a business career in its development. This is a
set of simplified, mandatory quantitative statements that determine the characteristics of
personnel positioning in the labour market. The developed system of business career indicators
is based on the systematized results of analysis of foreign and national experience in developing
a system of indicators [5; 9, pp. 162-166; 4, p. 31]:
• the principle of the indicator meaningfulness, i.e. its ability to cover the most significant
aspects of the person's activity;
• the principle of quantative measurements – all indicators used in the assessment should be
quantifiable;
• the principle of sensitivity to changes, i.e. the ability to detect changes in a timely and
sufficient manner;

63rd International Scientific Conference on Economic and Social Development – "Building Resilient Society" - Zagreb, 11-12 December, 2020
328
• the principle of dynamism determines the need to consider changes in the person's goals and
requirements, as well as changes in the external and internal environment of the
organization;
• the principle of simplicity and accessibility requires an information system that is
comprehensible, simple, and accessible for the end user;
• the principle of uniqueness is the need to consider the specific features of the person's
activity and mandatory construction of a unique indicators vector;
• the principle of compliance is a compliance of the evaluation goals, forms, methods and
techniques with the goals and principles of effectiveness;
• the principle of tailor-made ways of information transmission, i.e. complex relationships
and processes can be reflected through indicators in a relatively simple way.
Since a business career is a complex and multi-faceted category, no system of indicators and
evaluation model is able to perfectly reflect this socio-economic phenomenon. Thus, to solve a
specific practical task, it is advisable to consider it in a specific target context, enabling the
development of the most effective system for a certain case, which probably does not consider
all its features, but is ultimately adapted to solve specific practical tasks. The current system of
reporting in Russian statistical practice, based on common methodological principles, concepts
and classifications and constituting an interconnected system of annual statistical monitoring
of the labour market, employment and wages, enables the development of a system of business
career indicators that provides the establishment of cause-effect and functional relationships
between resources and career capitalization in order to achieve the equilibrium of the labour
market. Business career is viewed through the prism of infrastructure )(I , technology )(T ,
marketing )(M and financial )(F criteria:
);;;( ITMFfBSCC = .
Hence, we have four external criteria, each affecting and measuring the quality of a business
career in its own way.
• indicators of the financial prospects of a business career )(F , which characterize the
measure of its capitalization and contain indicators of career performance, a career marginal
income, and marginal investment into a career;
• indicators of marketing prospects )(M set the value of a business career for individual
stakeholders (employees, entrepreneurs, employers, and society as a whole), especially the
consumer value of a career. Indicators of this prospect include indicators of career
satisfaction in general (including professional and intra-organizational careers), and
complementarity between professional and organizational careers.
• indicators of technological prospects )(T determine the conditions and ways to accelerate a
business career (including professional, intra-organizational and inter-organizational),
creating conditions for its development, progress and destruction. This prospect is measured
by the following indicators: time in office; speed and range of business careers; the intensity
of intra-organizational, inter-organizational, professional careers; intensity of changing the
career types, as well as complementarity between the intra-organizational career and inter-
organizational career;
• indicators of infrastructure prospects for a business career )(I determine the nature and
content of the resource provision of a business career, i.e. a set of interrelated intangible
assets that form the basis for the functioning of a career as a system.

63rd International Scientific Conference on Economic and Social Development – "Building Resilient Society" - Zagreb, 11-12 December, 2020
329
This is a real and potential scale of a business career, intra-organizational, inter-
organizational, and professional career.
The above system of a business career indicators covers the simplest, but at the same time very
important statistical indicators that are able to directly assess the contribution of a career to the
competitiveness of the internal labour market. Undoubtedly, this list is absolutely not perfect
and needs to be clarified, supplemented, specified, etc., which will provide an opportunity to
get a more complete and adequate description of the conditions, causes and factors of a career
that allow you to achieve a higher level of competition in labour.
5. CONCLUSION
The considered methodological approach to the construction of a system of business career
indicators can ensure: firstly, high mobility and flexibility of indicators in relation to the goals
of its study; secondly, balanced consistency of interests of different stakeholder groups; thirdly,
balance between short-term and long-term goals, financial and non-financial indicators,
quantitative and quality characteristics, main and auxiliary parameters, as well as external and
internal career factors; fourth, predictive value for the development of a unique analytical
system for each person, taking into account the specifics of their work interests. And, finally,
the balance of interests of an employee business career, the possibility of making better
investment and management decisions by identifying, analysing and systematizing business
career problems. Moreover, based on the proposed system of indicators, it is possible to track
the effectiveness of measures taken to develop, advance and destroy a business career, both at
the organizational level and in the context of the development of other organizations. In general,
the proposed system of indicators is quite transparent and logical and can be introduced as an
easy to use basis for managerial decisions regarding business careers in the context of ensuring
the competitiveness of the company's and regional labour market of the organization and the
region.
LITERATURE:
1. Ambalova, A. B. (2006). Upravlenie kar'eroi gosudarstvennogo grazhdanskogo
sluzhashchego : (Sotsiologicheskii analiz) [Civil Servant Career Management:
(Sociological Analysis)]: Dis. ... kand. sotsiol. nauk: 22.00.08, Moskva, 2006, p.22
2. Bazarov, T.Yu., Eremin, B.L. (2002). Upravlenie personalom: Uchebnik dlya vuzov. M:
YuNITI, 2002, p.560
3. Eremina, I.Yu., Toderash, V.A. (2016). Upravlenie kar'eroi v Rossii i za rubezhom [Career
management in Russia and abroad]. Problemy ekonomiki i upravleniya neftegazovym
kompleksom [Problems of oil and gas complex economy and management], pp. 12-15.
4. Fal'ko S., Brizhan' A. (2018). Sisteme sbalansirovannykh pokazatelei 25 let: est' li
perspektiva stat' klassikoi? [The system of balanced indicators of 25 years: is there a
prospect of becoming a classic?]. Vestnik Evroaziatskogo transportnogo soyuza. 16. 31.
5. Gorshkova Yu.O. (2006). Nauchno-metodicheskie podkhody k formirovaniyu sistemy
indikatorov ustoichivogo razvitiya: Kaluzhskaya oblast' [Scientific and methodological
approaches to the formation of a system of indicators of sustainable development: Kaluga
Oblast]. Na puti k ustoichivomu razvitiyu Rossii [Towards sustainable development of
Russia], pp.16-21.
6. Guseva A.S., Iglin V.A., Lytov B.V. et al. (1998). Sluzhebnaya kar'era [Business career]
ed. E.V.Okhotskii. M.: OAO «Izd-vo «Ekonomika»
7. Holland, J. L., & Holland, J. (1999). Why interest inventories are also personality
inventories. In M. Savickas & A. Spokane (Eds.), Vocational interests: Meaning,
measurement, and counseling use. Palo Alto, CA: Davies-Black., pp. 87-102

63rd International Scientific Conference on Economic and Social Development – "Building Resilient Society" - Zagreb, 11-12 December, 2020
330
8. Ivanovskaya L.V. (ed.), Kashtanova, D.K., Zakharov, E.S. et al. (2018). Razvitie personala:
monografiya [Development of personnel: monograph]. Moscow: Izdatel'skii dom GUU, p.
219
9. Izotova T.G. (2006). Razrabotka metodiki vybora pokazatelei otsenki effektivnosti
deyatel'nosti khozyaistvuyushchikh sub"ektov [Development of a methodology for selection
of performance indicators of economic entities]. Izvestiya vysshikh uchebnykh zavedenii.
Geodeziya i aerofotosemka [News of higher educational institutions. Geodesy and aerial
photography], pp.162-166.
10. Karpov A.V., Markova E.V. (2016). Stilevye osobennosti protsessa prinyatiya
upravlencheskikh reshenii [Stylistic Characteristics of the Decision-Making Process].
Vestnik Yaroslavskogo gosudarstvennogo universiteta im. P.G. Demidova. Seriya
Gumanitarnye nauki. [Vestnik Yaroslavskogo Gosudarstvennogo Universiteta im. P.G.
Demidova. Serija Gumanitarnye Nauki]. № 3 (38), pp.80 –86
11. Kozlova O.P. (2010). Organizatsionno-ekonomicheskie osnovy regulirovaniya kar'ery
nauchno-pedagogicheskikh rabotnikov vysshei shkoly [Organizational and Economic Basis
of Regulation of Career of Higher School Scientific and Pedagogical personnel]: Avtoref.
diss. …kand. ekon. nauk. Omskii gosudarstvennyi universitet im. F.M. Dostoevskogo.
Novosibirsk
12. Manukhina S. Yu., Karmanov M. V. (2010). Metodologicheskie voprosy statisticheskogo
issledovaniya kar'ery rabotnikov [Methodological issues of statistical research on the career
of employees]. Uchenye zapiski Rossiiskoi Akademii predprinimatel'stva. Vypusk XXIII.
[Scientists notes of the Russian Academy of Entrepreneurship ], pp.210-222
13. Mikhailova G.B. (1997). Ponyatie kar'ery v psikhologicheskoi nauke [Definition of career
in psychological science]. Psikhologicheskie problemy professional'noi deyatel'nosti
kadrov gosudarstvennoi sluzhby [Psychological problems of professional activity of public
service personnel]. M.NITI
14. Mogilevkin E.A. (2008). Tekhnologiya upravleniya kar'eroi [Career Management
Technology]. Moscow. Retrieved from: www.careerbook.ru
15. Moll, E.G. (2012). Upravlenie delovoi kar'eroi menedzhera [Manager's Business Career
Management]. SPb.: Piter
16. Plaksa, J. V. (2019). Key aspects of effective career development. Servis v Rossii i za
rubezhom [Services in Russia and Abroad], 13(2), pp. 201-212.
17. Povarenkov, Yu.P., Slepko, Yu.N. (2014). Predstavleniya uchashchikhsya, roditelei i
metodistov ob osobenno-styakh lichnosti effektivnogo uchitelya [Ideas of Pupils, Parents
and Methodologists about Features of the Effective Teacher's Personality]. Yaroslavskii
pedagogicheskii vestnik. 2(4), pp. 25-30
18. Saporovskaya, M.V., Kryukova, T.L. (2017). Zhiznennyi stil' sovremennika v kontekste
sovladaniya s trudnostyami [Contemporary life style in the coping with everyday stress
context]. Vestnik Omskogo universiteta. Seriya: Psikhologiya [Herald of omsk university.
series: psychology], pp.12-18.
19. Schein, Edgar H, (1996). Career Anchors (discovering your real values), Jossey-Bass
Pfeiffer
20. Shalaev I.A., Bocharova V.A., Borodina M.S. (2017). Sovremennaya statistika upravleniya
delovoi kar'eroi personala v rossiiskoi federatsii [Modern statistics of management of
business career of personnel in the Russian Federation]. Vestnik kafedry statistiki
Rossiiskogo ekonomicheskogo universiteta imeni G.V. Plekhanova Materialy i doklady
[Journal of Statistics of the Russian Economic University named after G.V. Pleanov],
pp.327-330

63rd International Scientific Conference on Economic and Social Development – "Building Resilient Society" - Zagreb, 11-12 December, 2020
331
21. Skopina I.V. (2008). Metodika otsenki effektivnosti upravleniya kar'eroi menedzherov
[Methodology for Evaluating the Efficiency of Management of Managers 'Careers].
Upravlenie ekonomicheskimi sistemami: elektron. nauchn. zhurn [Management of
Economic Systems: Electron. Science]. 2 (14). Kirov: uecs.mcnip.ru
22. Sotnikov N.Z. (2015). Delovaya kar'era kak metamodel' upravleniya
konkurentosposobnost'yu naemnogo personala [Business career as metamodel of
management of competitiveness of the hired personnel]. Vestnik NGUEU, pp. 190-200
23. Sotnikov N.Z., Sotnikova S.I., Mikhailova E.M. (2018). Business career personel: modern
man-agement models of Russian banking organizations: GCPMED 2018 - International
Scientific Conference "Global Challenges and Prospects of the Modern Economic Develop-
ment". Vol. LVII The European Proceedings of Social & Behavioural Sciences, рр. 1302-
1315
24. Sotnikova S.I. (2016). Upravlenie personalom: delovaya kar'era: Ucheb. posobie. [Human
resources management: business career]. Moscow: RIOR: INFRA-M, p. 332
25. Sotnikova S.I., Milyaeva L.G., Chulanova O.L. et al. (2020). Upravlenie
konkurentosposobnost'yu personala na osnove kontseptsii Performance management
(Upravlenie effektivnost'yu): monografiya [Personnel competitiveness management based
on Performance management: monograph]. Novosibirsk: NGUEU.
26. Sotnikova S.I., Nemtseva Yu.V., Kozlova O.P. (2011). Upravlenie proforientatsiei kadrov
v innovatsionnoi ekonomike: monografiya [Personnel guidance management in innovation
economy: monograph]. M-vo obrazovaniya i nauki Rossiiskoi Federatsii, Novosibirskii
gos. un-t ekonomiki i upr.. Novosibirsk
27. Tolochek, V. A. (2020). Professional'naya kar'era: sinergeticheskii podkhod. Chast' 1
[Professional Life: Synergetic Approach. Part 1]. Izvestiya Saratovskogo universieta.
Novaya seriya: Akmeologiya obrazovaniya. Psikhologiya razvitiya [Izvestiya of Saratov
University. New series. Series: Educational Acmeology. Developmental psychology]. 9-1
(33), pp. 13–24.
28. Tolochek, V.A. (2018). Professional'naya kar'era: issledovaniya, rezul'taty, vozmozhnye
perspektivy issledovanii [Professional career: research, results, possible research
prospects]. Sistemogenez uchebnoi i professional'noi deyatel'nosti Materialy VIII
vserossiiskoi nauchno-prakticheskoi konferentsii. Pod red. Yu.P. Povarenkova.
[Systemogenesis of Educational and Professional Activity Materials of the VIII All-Russian
Scientific and Practical Conference], pp. 325-328.
29. Vyrupaeva, T.V. (2018). Kar'ernyi profil' kak instrument upravleniya kar'eroi
gosudarstvennykh sluzhashchikh [Career profile as the instrument for managing career state
employees]. Omskie nauchnye chteniya, 2018, pp. 904-906
30. Zankovskii, A.N. (2015). Psikhologiya organizatsionnogo liderstva: v poiskakh
korporativnoi sinergii. [Psychology of Organizational Leadership: in Search of Corporate
Synergy]. Moscow: Izd-vo Litera, p. 360
31. Zhelaevskaya N. F.. (2010). Professional'naya otvetstvennost' lichnosti kak determinanta
kar'ernogo prodvizheniya [The professional responsibility of the individual as a
determinant of career advancement]: Avtoref. dissertatsiya ... kand. psikh. nauk : 19.00.01.
Sochi

63rd International Scientific Conference on Economic and Social Development – "Building Resilient Society" - Zagreb, 11-12 December, 2020
332
THE (POST) LIBERAL NEW WORLD ORDER: OPPORTUNITIES AND
CHALLENGES IN A COVID-19 AFFECTED WORLD
Bostjan Peternelj
Doctoral candidate, University of Ljubljana, Faculty of Social Sciences, Slovenia
Petar Kurecic
University North, Department of Economics, Varazdin, Croatia
ABSTRACT
The study of liberal internationalism and peace, composed by Ikenberry, promotes a new world
order values that should replace the Wilsonian liberties for the sovereignty of states. A new
liberal model constituted post Westphalian principles, laid on Wilsonian obligations that
should be replaced with integrationists’ model of regional hegemony under a neoliberal
regime, whilst sorely Wilsonian mechanism are no longer adequate to support a liberal
international order. The US unipolarity could be replaced with integrationists’ model under
multipolarity fusion of regional superpower states, to them are reintegrated smallest states
under collective defence mechanisms. The new US President-elect Joseph Biden, according to
the announcements, seeks to recalibrate the “America First” design of the world order, into a
more multipolar stable world, through working with allies, if agreed with the democratic pole
to change its foreign strategy to avoid confrontation, and turn it into a polycentric post
neoliberal globalized world order. The paper represent a product of a mentor-doctoral student
cooperation. It discusses various scenarios, more or less certain, for the development of the
future relations between great powers in the light of the events following the defeat of America
First foreign policy and the COVID-19 pandemic affected world.
Keywords: globalization, new world order, alliances, post neoliberal world order
1. INTRODUCTION: THE NEOLIBERAL (DIS)ORDER AND GLOBALIZATION
New world order in a globalized world represents a new era for creating new geopolitical
paradigm, more volatile towards the so-called neoliberal states. The question has to be posed;
what consequences shall suffer the ideas of sovereignty of states under these “Post-Westphalian
principles”. The Westphalian principles of states might become outdated and could be replaced
with post-liberal order principles of free borders. Globalization implies a certain erosion of
national boundaries (Slaughter, 1997: 192) spreading ideas of free flows of capital, money,
weapons etc. Globalist, neoliberal regime took control over national regulators and changed
them with transnational limitless instruments by controlling of national resources, still
controlling riots and movements. If globalization leads to internationalization or transferring
regulatory authority from the national level to international institution (Slaughter, 1997: 192
and Sutter, 2006), then it may restore dismantled and outdated national institutions especially
into outdated armies those had lost operative facilities many years ago under dismantling
defence capabilities for defending national values. This failure shall be replaced within
sustained common military management architecture laid on robotics supports and artificial
intelligentsia networked on G5 net hyperlink connection to control movements to tame
sovereignism. Trans-governmental defence networks system could empower its function by
putting C4I on two-sided cable track as to headbanded defence management operations system
shall run uninterrupted from the core to the periphery, all put on hyperlink ordering
communication to local elites those are following decision makers at capitol hill or get suffering
from regime change mechanisms sticks and carrot method used to discipline or leave them as

63rd International Scientific Conference on Economic and Social Development – "Building Resilient Society" - Zagreb, 11-12 December, 2020
333
the reasoning for the disobediences of local elites. A new era of defence architecture of
globalists is sustaining under the COVID-19 disease. The new net network system, from sky
like Skynet hyperlink command communications system, should cover the entire globe for
using at main cable for following globalists order those are given to global army at maritime
and air capabilities by lending on the prompt hypersonic global strike facilities to carry out at
most strikes at non-sight from everywhere to hit all targets on the globe. A credible example
presents the fact, if we compare liberal internationalists and neoconservative realists those had
fallen within the same discursive formation like a Euro-American hegemony (Gathii, 2000;
Motaharnia and Salehi, 2017), but is still into divorcing period while Trump effect was
recorded. EU-centric approach toward resetting neoliberal global agenda pushed toward
international option to create confederal world order. In opposite, European cohesion shall be
ruined into disintegration process within collisions of nations, such as BREXIT. In comparison
to the rather disunited African union, Arab Union, ASEAN etc., the European community is
much more integrated than other regional communities. Prosperity for regional security turns
toward regional armies. Deeping defence integrations attempts to transform NATO forces and
EUBG into the European army under supreme command of Pax Brussels. Security holes into
grey shades of de-stability Pax Brussels interventions might contribute to more efficient de-
escalation process in Africa and Asia to accomplish EU global strategy goals.
2. POST-NEOLIBERAL WORLD ORDER PRINCIPLES
The US study of liberal internationalism and peace (Ikenberry, 2009) is promoting of new world
order values that shall replace Wilsonian liberties for sovereignty states. A new Liberal model
constituted post Westphalian principles those laid on the Wilsonian obligations shall be
replaced with integrationists’ model of regional hegemony under neoliberal regime, while
Wilsonian mechanisms are no longer adequate to support a liberal international order. US
dominated unipolarity could be replaced with integrationists’ model under multipolarity fusion
of regional superpower states, to them are reintegrated smallest states under collective defence
mechanisms. The US foreign policy does not fully respect sovereignty of coalition states if it
neglects the principles of the Westphalian sovereignty (Sutter, 2006), that leads to new power
global struggle over supremacy toward authority that prevailed inside the international
community as NATO did many years ahead ago. It is also important to study how a neoliberal
order has affected the US foreign policy, and what the still sitting US president Trump had done
to the transatlantic relationship. Whether it was in Canada, France or Germany, president
Trump’s words and actions over the past four years have tarnished America’s reputation on the
world stage: “He has insulted our allies and embraced our enemies, seemingly having more of
an affinity for Putin and Kim Jong Un than Merkel and Macron” (Laufgraben, 2020). The
question is if a US President-elect Joe Biden can fix this spoiled relationship after disaffected
American society that is sinking into multifaced socio-economical dimension of internal
disorder. President Biden will probably spend the next four years to consolidate the US society
by leaving behind NATO relationship and put aside NATO centric states to take care for its
own national security. He can not give promise to invest more money into defence spending for
Europe protection. The mistakes that were made those was used as advantage for China to rise
up military power into the ASEAN community and at geopolitical approach have panicking
some European allies which some insist that NATO cannot survive any bickering at the top, as
it is already under strain from European leaders who hope to build a competing European Union
military alliance: “But allowing NATO’s destruction from within is simply a quieter way to
allow the organization to collapse” (Pletka, 2020). It is time for a new world order that would
fuse a Eurasian community from Lisbon to Vladivostok more intertwined after Chinas push
toward western hemisphere by the Pearl and Strings strategy, as “One Belt, One Road”, had
flattened the entire continent into a hyperlink highway by avoiding maritime points of

63rd International Scientific Conference on Economic and Social Development – "Building Resilient Society" - Zagreb, 11-12 December, 2020
334
instability from SE Asia to the Mediterranean basin. China, in turn, has begun to consistently
build up and modernize its nuclear and conventional weapons and launched programs for
developing armaments capable of overcoming the U.S. missile defence and those that can
compete with U.S. precision-guided conventional systems: “China has challenged neighbouring
countries and the U.S. military domination in the seas west and south of its shores and claimed
access to natural resources in Asia and Africa and to control sea lanes used to transport these
resources in the Indian and Pacific Oceans” (Arbatov, 2018). China builds up a surface strategy
to avoid maritime confrontation with the US dominance at sea lanes and its strengths Rimland
al land especially with Iran, Pakistan Turkey to reconnect Eurasian with African community
along Rimland belt by pushing out the US troops. China is sending military aid to the anti-US
coalition states in the Middle East. The most eminent critical facilities to defend its territory
that opened trajectory of offensive strike within China’s anti-access/area denial (A2/AD)
strategy in the Asia-Pacific region by using boosted ballistic trajectory anti-ship rocket DF-21D
to limit the US blue water navy’s freedom of movement what exploits operational
vulnerabilities. That put US navy into protentional risk as being sunk, especially if was fitted
nuclear warhead on DF-21D that could endanger the entire US pacific fleet. China’s navy took
advantage to limit the US free movement at the seas close to its maritime interests. Russia will
no longer be seen as a threat as NATO enlargement will cease while any military support for
Ukraine and Georgia will be curtailed. Security arrangements will be created with the United
Kingdom outside NATO. Should the European Union resist U.S. economic pressures, the
president will bring leverage through diminished American support for NATO (Clark, 2020).
If Biden returns back to the isolationist US foreign policy as Trump did, that it may open
opportunity to Russia that exploits politically, economically, or informationally US weakness
for further creeping not only NATO but also the EU. Europe unprotected will be opened for
deeper geo-economic penetration by Russia and China toward Western hemisphere at multiple
axis of deepening multiple dimensions of interests into vital regional zones of EU community.
In the Middle East, the U.S.-Israeli-Saudi anti-Iran alliance is crippling while the US forces are
leaving Iraq and Syria (and Afghanistan) under strengthening Turkey’s expansionist tendencies.
President Trump was blamed for failures that he made in the US foreign policy, by neglecting
unipolarity while the president has not made America great(er) again. Some argue that he has
made it weaker than it has ever been since the beginning of the World War II. The USA has
become disrespected, ridiculed, and now even pitied, as it struggled to grapple with the
coronavirus pandemic: “President Trump has failed to rebalance relations with China, failed to
deal with North Korea, failed to end the endless wars in the Middle East, failed to cow Iran,
failed to stop European free-riding, and even failed to improve relations with Russia. And that’s
before one considers his record of undercutting or destroying international treaties on climate
change, trade, and nuclear weapons” (Mc Tague and Nicholas, 2020). It is however true that
President Trump stopped military campaigns by pulling out the US troops from NATO states
and hot spot areas to reinvest more money for opening new jobs for US workers, while foreign
policy was not his priority. Nevertheless, Russia remained the only true nuclear opponent, to
US after postponed START II Agreement; China exploits the US weakness, and the Middle
East became pretty much a disaster for NATO policy etc. Trump had inherited the US foreign
policy in a rather bad condition, somewhat compromised. Trump however did not execute grand
strategy in the Middle East to appease Arabs, he did not eliminate the ISIS in Syria, he did not
succeed with coercion policy against Iran to reduce Iranian attacks on American interests and
its allies. Biden has less opportunity to win after those debacles as only chance is left him to
step into reconciliation process as to re-join to the deal that could be signed soon with China,
Russia and several European powers, and the USA would have the effect of improving frayed
multilateral cooperation with those nations for accepting multipolar policy, meant as signed
capitulation of a unipolar US foreign policy from previous president mandates.

63rd International Scientific Conference on Economic and Social Development – "Building Resilient Society" - Zagreb, 11-12 December, 2020
335
Saudi Arabia saw the US pressure on Iran as a key component of its strategy to contain Iranian
influence beside to protect Israeli interests (Khan, 2020) but “big brother” has been giving up
to defeat Iran that has increased its military potential into Persian gulf after lifting embargo and
sanctions of UN since 2020. If Biden will steadfastly supports Trumps aggressive policies in
the Israeli-occupied West Bank and Gaza territories and still accepting his odd decision by
declaring Jerusalem for capital of Israel, then Arab nations will be certainly uprising against
infidelity of US Arab-Israeli policy for betraying Arabs confidence. Arab states will certainly
be waiting on the possible decision of Biden to refuse Trump decision among Israel deal for
Jerusalem, otherwise Arab NATO will collapse after distrust from Arab states by supporting
peace solution that could be averted against Israel. Joseph Biden’s brand policy in geopolitics
theory momentum is capable to face with decentralized balancing of power and the resultant
“sub-balances put into new world order. If he tries to understand new circumstances after
Trump doctrine do not poke into hornet nest to avoid consequences in the Middle East state to
intervene in Egypt, Iran, Israel, Qatar, Saudi Arabia and Turkey—joined by the religious non-
state Sunni and Shi’ite movements—have now come to dominate regional affairs, with the USA
either helpless or settling for an auxiliary role. “Another timely case in point is the reorientation
of American foreign policy to Asia and the Pacific basin, focusing attention at one level on the
US-China relationship, and at another level on the manoeuvrings of a number of local actors,
among them Indonesia, Japan, the Philippines, Singapore and Vietnam” (Klieman, 2015: 25).
Biden’s recalibration of the US policy needs a longstanding preoccupation with competitive
arms race, multidimensional shifting alliances, anti US sentiment buffers, army race partitions
etc. to catch up entire gamut of diplomatic activity from normalization to estrangement during
dynamic calculations between imperial rivalries and bargaining with spheres of influence. That
means that unipolar pursuit does not have a chance of succeeding and that the USA has to face
with the new dilemma of a polycentric world. He needs to understand the new balance of power,
as an updated doctrine for a changing world and approved evidence how is changing the
international system, as proof is ambivalent relationship between Germany and its European
Union partners; the adjacent Turkey-Russia-Iran and Iran-Saudi Arabia-Pakistan triangles;
Sino-American rivalry; the Sunni-Shi’a divide within the Islamic world in competition for
position, prestige and possession of partial maritime East Asia aggravation points. If select
group of players into globalised world as Big Five + 1 (China, Britain, France, Russia, US and
joined Germany) did ignore the smaller state into pivotal areas of interests particularly in the
EU, ASEAN and the Middle East, rising those regional medium powers. What prospects for
local and regional states into pivotal zones of Rimland affected on balancing of power to sustain
regional stability and equilibrium in coming years by the BRICS countries (Brazil, Russia,
India, China and South Africa) and other semi powered stats in uprising (Indonesia, Japan,
South Korea and Turkey) brought to rebalancing global multipolar stability. Applebaum (2009)
had described what happened in Afghanistan, Iraq, Syria, Libya etc. during NATO campaigns.
Separatists, terrorist, fifth column, paramilitary units, renegades, gangs etc. served as tools for
supporting at ground NATO operations by leading from behind. Eccentric approach to the
Global War on Terror (GWOT) doctrine was lend on latest doctrine for massive resistance of
armed people under militia formations behind the enemy lines of interstate wars. Paramilitary
formations such partisans’ groups were regrouped from behind front lines to conduct sporadic
attacks on enemy infrastructure within overstretched supply lines and hubs more eastward from
homeland. Fabricated and updated modern GWOT doctrine was studied from the Soviet style
of asymmetric warfare to being effective for regime change scenarios into “coloured
revolutions”, but NATO planners had included into war gaming evaluations and predictions
more speculative expectations for outcome of wars. The international community from post
Neoliberal aspect neglects sovereign principles, were outside the scope of the accepted rule that
any limitation of sovereignty must be followed by the establishment of real legal titles of

63rd International Scientific Conference on Economic and Social Development – "Building Resilient Society" - Zagreb, 11-12 December, 2020
336
cooperation and solidarity (Dimitrijević and Vučić, 2016). It is difficult to assert that sovereign
states are going to accept all conditions at legal basis of internationalisation. Pax Americana
referred on geopolitical and geo-economic protectionism into the western part of Europe after
US had integrated into NATO alliance (Kupchan, 1998). Regional integration from bipolarity
in Europe was transformed into multipolarity of European NATO pillar of the Big Four (United
Kingdom, France, Germany, and Italy). Post neoliberal ambitions of Pax Brussels are seen logic
to hold together international regime from EU members to survive volatile times of insecurity
in the world after collapsing the US unipolar world order. World order, power and liberalism
are much more potent mixture than simply the exercise of crude material power alone. But the
question remains whether the resulting American-led order is an empire (Ikenberry, 2005).
European NATO pillar participated to global dominance after used military power against non-
liberal states. Behind neoliberal hegemony are staying US ambitions by seeking broader support
inside alliance to prevent multipolar creation of global community, as managing the global
system within Washington rules and institutions. New global government projection consists
of five states (EU, US, Russia, China and India) into pentomic structure that may form the
confederation council for global governance. Confederation council could replace the UN
global government and included into the new global peace-making plan. Those powerful states
at world with economic, financial and military power could drive neoliberal unipolar de-
stability order into more stable and peacefully post-liberal order. If we the globe tailored on
five regional centres of power those are formed from small and smallest states around the
powerful biggest states. We constitute regional regimes of powers managing inside regional
communities, where the periphery is connected with a capitol. Global geopolitical projection
includes those regional centres of power Pax Brussel, Pax Russia, Pax China, Pax India, and
Pax Americana to rebalance global stability that moves from unipolarity to multipolarity as
shaped new pentomic global form of stability. Confederal council deals with divided and
imperia to fix grey zones of instability inside African Union, Arab Union, and South America
within multidimensional assistance from Pax Brussel, while Pax China covers ASEAN states,
Pax Russia previous vital zones of Soviet Union (Eurasian and Central Asian states), Pax
Americana returns us back to the Monroe doctrine, and Pax India covers South East Asia states.
Other states out of control from regional superpowers became a bargain chip in cases both
Australia and the UK may belong to Pax Americana, Turkey and Iran participated to Pax Russia
etc. Pax vital zone of interests shall determinate regional multipolarity toward more stable
global order by mutual respect that was seen from Westphalian peace for Europe. Parity of
power presents security measures that avoids confrontations for interstate affairs and it is
unlikely to resume local conflicts toward inter regional conflicts among Oceanian and Eurasian
powers. Oceanian powers then would lose control for unipolarity that is creeping under
Eurasian link toward more stable, interconnected, cooperated and complemented world island.
3. CONCLUSION
NATO states are pulling out own troops from hot spot areas. The UK hoped to reinvigorate
NATO alliance after BREXIT, but German – French EU-centric approach toward EU
sovereignty had crossed legs to the UK, while defence integration of EU deepened EU-centric
ties toward more independent CSDP against the UK-US Anglo-Saxon alliance. Federalist
ambitions of EDU under French geopolitics sponsorship had complicated interrelated positions
inside transatlantic link at the most recent NATO summit held in London (2019). Pax Brussels
is looking to accomplish EU integration process toward federal states of Europe under a
parliamentary control, from Brussels. BREXIT had opened door to German – French EU centric
hub to reinforce its positions to Eurasian integration within connection of Pax Russia and Pax
China. Pax Brussels is participating to the China’s One Belt, One Road initiative, that will
increase tensions against Oceania power that consists of Pax America with Pax Britannica.

63rd International Scientific Conference on Economic and Social Development – "Building Resilient Society" - Zagreb, 11-12 December, 2020
337
Global peace-making model (4 plus 1) runs toward more stable and secured global governance
under multipolarity. President’s Biden policy needs to be accustomed to multifaced polycentric
world order or the US foreign policy will collapse if does not change its post liberal principles
toward polycentric states. For the US policy are only two options, where Trump put aside intact
foreign policy into a delicate situation at the previous point of turbulence that Biden must
recalibrate or fix it for the US benefit.
LITERATURE:
1. Arbatov, A. (2018). The Emergence of a polycentric world and its challenges. Available at:
https://eng.globalaffairs.ru/articles/collapse-of-the-world-order-2/
2. Applebaum, A. (2009). The New New World Order America and the New Geopolitics.
Available at:
https://www.hoover.org/sites/default/files/uploads/documents/0817939024_1.pdf
3. Clark, W. (2020). Can the Liberal World Order Survive Another Four Years of Trump?
Available at: https://washingtonmonthly.com/magazine/april-may-june-2020/can-the-
liberal-world-order-survive-another-four-years-of-trump/
4. Dimitrijević D., Vučić, M. (2016). Globalisation and the New World Order. Available at:
https://www.researchgate.net/publication/323812397_GLOBALISATION_AND_THE_N
EW_WORLD_ORDER
5. Khan, M. (2020). Opinion: Trump altered the geopolitics of the Middle East — how would
Biden policies compare? Available at: https://www.marketwatch.com/story/trump-altered-
the-geopolitics-of-the-middle-east-how-would-biden-policies-compare-11603203959
6. Ikenberry, J. (2005). Power and liberal order: America’s postwar world order in transition.
Available at:
https://scholar.princeton.edu/sites/default/files/gji3/files/power_and_liberal_order.pdf
7. Ikenberry, J. (2009). Liberal Internationalism 3.0: America and the Dilemmas of Liberal
World Order. Available on https://www.jstor.org/stable/40407217?seq=1
8. Slaughter, A.-M. (1997). The Real New World Order. Available at:
https://books.google.si/books?hl=en&lr=&id=WzG5qJM0AekC&oi=fnd&pg=PR1&dq=n
ew+world+order+AM+Slaughter+&ots=KdARAy9a7G&sig=ooDCVMKgA-bEMpEP
PuP5i7tkFDA&redir_esc=y#v=onepage&q=new%20world%20order%20AM%20Slaught
er&f=false.
9. Gathii, T. (2000). Neoliberalism, Colonialism, and International Governance: Decentering
the International Law of Government Legitimacy. Available at:
https://repository.law.umich.edu/cgi/viewcontent.cgi?article=3071&context=mlr
10. Klieman, A. (2015). Great Powers and Geopolitics International Affairs in a Rebalancing
World. Available at: http://www.springer.com/series/10201
11. Kupchan, C. (1998). After Pax Americana: Benign Power, Regional Integration, and the
Sources of a Stable Multipolarity. Available at:
https://www.jstor.org/stable/2539379?seq=1 (accessed November 25, 2020)
12. Laufgraben, J. (2020). Trump abandoned the New World Order, Biden will rejoin it.
Available at: https://www.dailycardinal.com/article/2020/11/trump-abandoned-the-new-
world-order-biden-will-rejoin-it (accessed November 25, 2020)
13. Mctague, T. and Nicholas, P. (2020). The World Order That Donald Trump revealed.
Available at: https://www.theatlantic.com/international/archive/2020/10/donald-trump-
foreign-policy/616773/ (accessed November 25, 2020)
14. Motaharia M. and Ensiyeh, S. (2017). The New World Order in the Twenty – First Century.
Available at: https://www.researchgate.net/publication/314169421_The_New_World_
Order_in_the_Twenty-First_Century (accessed November 27, 2020)

63rd International Scientific Conference on Economic and Social Development – "Building Resilient Society" - Zagreb, 11-12 December, 2020
338
15. Pletka, D. (2020). It’s time for a new world order. Available at:
https://www.aei.org/opeds/its-time-for-a-new-world-order/ (accessed November 28, 2020)
16. Sutter, K. (2006). Globalisation and New World Order. Available on http://www.global-
directions.com/Articles/Business/Globalization1.pdf (accessed November 29, 2020)

63rd International Scientific Conference on Economic and Social Development – "Building Resilient Society" - Zagreb, 11-12 December, 2020
339
THE IMPACT OF ECONOMIC POLICY UNCERTAINTY ON
INDUSTRIAL PRODUCTION IN GERMANY
Dejan Romih
University of Maribor, Slovenia
Alenka Kavkler
University of Maribor, Slovenia
ABSTRACT
There is a growing interest among politicians and policymakers in economic policy uncertainty
(EPU) in major economies. In this paper, we examined the impact of EPU on industrial
production in Germany, which is a major European industrial power. We found that a positive
EPU shock leads to a decrease in industrial production, which points to the need to prevent
EPU in Germany.
Keywords: economic policy uncertainty, industrial production, Germany
1. INTRODUCTION
There is a growing interest among politicians and policymakers in economic policy uncertainty
(EPU) in major economies such as the US, which is a major North American industrial power.
In this paper, we examined the impact of EPU on industrial production in Germany, which is a
major European industrial power. Many analysts agree that EPU in major European and North
American economies contributed to a slowdown in their economic recovery after the Great
Recession. In addition, studies have shown that the recovery period was accompanied by a rise
in EPU (Baker, Bloom & Davis, 2016). There is a growing need among politicians and
policymakers to measure and monitor EPU in the US and other major economies. Baker, Bloom
and Davis (2016) developed a daily and monthly newspaper-based index of EPU for the US,
and a monthly newspaper-based index of EPU for Canada, China, France, Germany, India,
Italy, Japan, Russia, South Korea, Spain and the UK. In this paper, we use a monthly
newspaper-based index of EPU for Germany, which is based on the monthly number of
newspaper articles in two major German newspapers, namely the Frankfurter Allgemeine
Zeitung and the Handelsblatt. These articles contain the terms Wirtschaft or wirtschaftlich,
Ausgaben, Bundesbank, Defizit, EZB, Haushalt, Haushaltsdefizit, Regulierung, Steuer,
Wirtschaftspolitik or Zentralbank and unsicher or Unsicherheit (Baker, Bloom & Davis, 2016,
Appendix A, p. 2). The website https://www.policyuncertainty.com/ provides data on the
newspaper-based index of EPU for 24 countries, namely Australia, Brazil, Canada, Chile,
China, Colombia, Croatia, France, Germany, Greece, Hong Kong, India, Ireland, Italy, Japan,
Mexico, the Netherlands, Russia, Singapore, South Korea, Spain, Sweden, the UK and the US.
There is a growing body of literature on the impact of EPU on industrial production in the US
and other major economies. Baker, Bloom and Davis (2016) and Curth (2018) examined the
impact of EPU on industrial production in the US. They found that a positive EPU shock leads
to a decrease in industrial production. Curth (2018) also found that a positive EPU shock leads
to a decrease in industrial production in both recessions and expansions. Istiak and Serletis
(2018) examined the impact of EPU on industrial production in Canada, France, Germany,
Italy, Japan, the UK and the US. They found that a positive EPU shock leads to a decrease in
industrial production, while a negative EPU shock leads to an increase in industrial production.
They also found that EPU is countercyclical. Piano (2013) examined the impact of EPU in
Europe on industrial production in France, Germany and Italy.

63rd International Scientific Conference on Economic and Social Development – "Building Resilient Society" - Zagreb, 11-12 December, 2020
340
He found that a positive EPU shock in Europe leads to a decrease in industrial production. Belke
and Kronen (2017) examined the impact of EPU on industrial production in Germany and
Greece. They found that a positive EPU shock leads to an increase in industrial production in
Germany and a decrease in industrial production in Greece. As this literature review shows,
there is conflicting evidence about how EPU affects industrial production in Germany.
Therefore, the purpose of this paper is to provide additional evidence on this subject.
2. METHODS
In this paper, we used vector autoregression (VAR) as advocated by Sims (1980) to study the
impact of EPU on industrial production in Germany. We took a similar approach to that of
Baker, Bloom and Davis (2016) for the US. As pointed out by Sims (1980), VAR models
describe the dynamic structure of the variables better than multivariate simultaneous equations
models and the distinction between endogenous and exogenous variables does not have to be
made a priori. Lütkepohl (2013) emphasizes that VAR models are a natural tool for forecasting.
In VAR models, current values of the set of variables under observation are explained by their
past values. VAR models thus describe the dynamic evolutions of a set of variables from their
common history (Verbeek, 2008). VAR models were postulated for stationary variables without
time trends. After the concept of cointegration was developed in the 1980s, several authors
(including Granger, 1981; Engle and Granger, 1987; Johansen, 1995) extended the use of this
type of models to include variables with stochastic trends (Lütkepohl, 2013).
A VAR with an lag-order 𝑝, denoted by VAR(𝑝), is
𝑦𝑡 = 𝑐 + 𝐴1𝑦𝑡−1 + 𝐴2𝑦𝑡−2 + ⋯ + 𝐴𝑝𝑦𝑡−𝑝 + 𝑒𝑡, 𝑡 = 1, … , 𝑇,
where 𝑦𝑡 is a 𝑘 × 1 vector of endogenous variables, 𝑐 is a 𝑘 × 1 vector of constants, 𝐴𝑖 is a
time-invariant 𝑘 × 𝑘 matrix of coefficients and 𝑒𝑡 is a 𝑘 × 1 vector of error terms.
In this paper, we used a VAR(𝑝) with five variables. These are the newspaper-based index of
EPU for Germany at time 𝑡, denoted by 𝑒𝑝𝑢𝑡, the logarithm of the DAX at time 𝑡, denoted by
𝑑𝑎𝑥𝑡, the short-term interest rate for Germany at time 𝑡, denoted by 𝑖𝑡, the logarithm of the
unemployment rate for Germany at time 𝑡, denoted by 𝑢𝑛𝑡 and the logarithm of the index of
industrial production for Germany at time 𝑡, denoted by 𝑖𝑝𝑡. Unlike Baker, Bloom and Davis
(2016), we used the unemployment rate instead of the employment rate. We obtained monthly
data on the EPU from https://www.policyuncertainty.com/, data on the DAX from Yahoo!
Finance and data on the short-term interest rate, the unemployment rate and the index of
industrial production from OECD. In this paper, we also used a Cholesky decomposition. We
ordered the variables in the same order as above. We used monthly data from January 1993 to
August 2019. Based on the Akaike information criterion, the final prediction error and the
Hannan and Quinn information criterion, we chose a VAR model with three lags (𝑝 = 3), which
is
𝑒𝑝𝑢𝑡 = 𝑐1 + 𝑎1,11 𝑒𝑝𝑢𝑡−1 + 𝑎1,2
1 𝑑𝑎𝑥𝑡−1 + 𝑎1,31 𝑖𝑡−1 + 𝑎1,4
1 𝑢𝑛𝑡−1 + 𝑎1,51 𝑖𝑝𝑡−1 + ⋯ +
𝑎1,13 𝑒𝑝𝑢𝑡−3 + 𝑎1,2
3 𝑑𝑎𝑥𝑡−3 + 𝑎1,33 𝑖𝑡−3 + 𝑎1,4
3 𝑢𝑛𝑡−3 + 𝑎1,53 𝑖𝑝𝑡−3 + 𝑒1,𝑡,
𝑑𝑎𝑥𝑡 = 𝑐2 + 𝑎2,11 𝑒𝑝𝑢𝑡−1 + 𝑎2,2
1 𝑑𝑎𝑥𝑡−1 + 𝑎2,31 𝑖𝑡−1 + 𝑎2,4
1 𝑢𝑛𝑡−1 + 𝑎2,51 𝑖𝑝𝑡−1 + ⋯ +
𝑎2,13 𝑒𝑝𝑢𝑡−3 + 𝑎2,2
3 𝑑𝑎𝑥𝑡−3 + 𝑎2,33 𝑖𝑡−3 + 𝑎2,4
3 𝑢𝑛𝑡−3 + 𝑎2,53 𝑖𝑝𝑡−3 + 𝑒2,𝑡,

63rd International Scientific Conference on Economic and Social Development – "Building Resilient Society" - Zagreb, 11-12 December, 2020
341
𝑖𝑡 = 𝑐3 + 𝑎3,11 𝑒𝑝𝑢𝑡−1 + 𝑎3,2
1 𝑑𝑎𝑥𝑡−1 + 𝑎3,31 𝑖𝑡−1 + 𝑎3,4
1 𝑢𝑛𝑡−1 + 𝑎3,51 𝑖𝑝𝑡−1 + ⋯ +
𝑎3,13 𝑒𝑝𝑢𝑡−3 + 𝑎3,2
3 𝑑𝑎𝑥𝑡−3 + 𝑎3,33 𝑖𝑡−3 + 𝑎3,4
3 𝑢𝑛𝑡−3 + 𝑎3,53 𝑖𝑝𝑡−3 + 𝑒3,𝑡,
𝑢𝑛𝑡 = 𝑐4 + 𝑎4,11 𝑒𝑝𝑢𝑡−1 + 𝑎4,2
1 𝑑𝑎𝑥𝑡−1 + 𝑎4,31 𝑖𝑡−1 + 𝑎4,4
1 𝑢𝑛𝑡−1 + 𝑎4,51 𝑖𝑝𝑡−1 + ⋯ +
𝑎4,13 𝑒𝑝𝑢𝑡−3 + 𝑎4,2
3 𝑑𝑎𝑥𝑡−3 + 𝑎4,33 𝑖𝑡−3 + 𝑎4,4
3 𝑢𝑛𝑡−3 + 𝑎4,53 𝑖𝑝𝑡−3 + 𝑒4,𝑡,
𝑖𝑝𝑡 = 𝑐5 + 𝑎5,11 𝑒𝑝𝑢𝑡−1 + 𝑎5,2
1 𝑑𝑎𝑥𝑡−1 + 𝑎5,31 𝑖𝑡−1 + 𝑎5,4
1 𝑢𝑛𝑡−1 + 𝑎5,51 𝑖𝑝𝑡−1 + ⋯ +
𝑎5,13 𝑒𝑝𝑢𝑡−3 + 𝑎5,2
3 𝑑𝑎𝑥𝑡−3 + 𝑎5,33 𝑖𝑡−3 + 𝑎5,4
3 𝑢𝑛𝑡−3 + 𝑎5,53 𝑖𝑝𝑡−3 + 𝑒5,𝑡, 𝑡 = 1, … , 320.
3. RESULTS
Table 1 shows descriptive statistics for five variables, namely 𝑒𝑝𝑢𝑡, 𝑑𝑎𝑥𝑡, 𝑖𝑡, 𝑢𝑛𝑡 and 𝑖𝑝𝑡.
Table 1: Descriptive statistics
Variable Observations Mean Standard deviation Minimum Maximum
𝑒𝑝𝑢𝑡 320 124.45 61.77 28.43 454.01
𝑑𝑎𝑥𝑡 320 8.61 0.54 7.36 9.49
𝑖𝑡 320 2.41 2.05 −0.41 8.59
𝑢𝑛𝑡 320 1.94 0.35 1.13 2.42
𝑖𝑝𝑡 320 4.45 0.14 4.17 4.69
Source: Own calculations
Figure 1 shows the orthogonalized impulse response graphs. The impulse variable is 𝑒𝑝𝑢𝑡 and the response variables are 𝑑𝑎𝑥𝑡, 𝑖𝑡, 𝑢𝑛𝑡 and 𝑖𝑝𝑡.
Figure 1: The orthogonalized impulse response graphs
Source: Own calculations

63rd International Scientific Conference on Economic and Social Development – "Building Resilient Society" - Zagreb, 11-12 December, 2020
342
Figure 1 shows that a positive unit (one standard error) EPU shock leads to a decrease in the
DAX, the short-term interest rate and industrial production. As can be seen, the decrease in
industrial production is statistically significant between the second and the fifth month after the
orthogonalized shock.
4. DISCUSSION
Many analysts believe that EPU is the new normal in major economies. There is therefore a
growing need among economists and policymakers to study the impact of EPU on industrial
production in these economies. This paper provides further evidence on how EPU affects
industrial production in Germany. In contrast to Belke and Kronen (2017), we found that a
positive EPU shock leads to a decrease in industrial production. However, since there is a
growing interest in the nonlinear impact of EPU on the economy, further studies are needed.
5. CONCLUSION
There is a growing body of evidence that EPU adversely affects industrial production in the US
and other major economies. In this paper, we examined the impact of EPU on industrial
production in Germany. We found that a positive EPU shock leads to a decrease in industrial
production. This is consistent with our expectations. This study has broad policy implications.
Firstly, action must be taken by politicians and policymakers to decrease EPU in Germany.
Secondly, action must be taken to reduce the adverse impact of EPU on the German economy.
However, taking action may not be easy as EPU is a complex phenomenon.
LITERATURE:
1. Baker, S. R., Bloom, N. & Davis, S. J. (2016). Measuring economic policy uncertainty. The
Quarterly Journal of Economics, 131(4), 1593–1636.
2. Belke, A. & Kronen, D. (2017). The impact of uncertainty on macro variables: an SVAR-
based empirical analysis for EU countries (Ruhr Economic Papers No. 699). Essen: RWI
Leibniz-Institut für Wirtschaftsforschung; Bochum: Ruhr-Universität Bochum; Dortmund:
Technische Universität Dortmund; Essen: Universität Duisburg-Essen.
3. Curth, A. (2018). Uncertainty and the US economy: an investigation of the economic effects
of economic policy uncertainty shocks originating in the US and Europe. Undergraduate
thesis, Rotterdam: Erasmus University Rotterdam.
4. Engle, R. F. & Granger, C. W. J. (1987). Co-integration and Error Correction:
Representation, Estimation, and Testing. Econometrica, 55(2), 251-276.
5. Granger, C. W. J. (1981). Some properties of time series data and their use in econometric
model specification. Journal of Econometrics, 16(1), 121-130.
6. Istiak, K. & Serletis, A. (2018). Economic policy uncertainty and real output: evidence from
the G7 countries. Applied Economics, 50(39), 4222–4233.
7. Johansen, S. (1995). Likelihood-Based Inference in Cointegrated Vector Autoregressive
Models. Oxford: Oxford University Press.
8. Lütkepohl, H. (2013). Vector autoregressive models. In N. Hashimzade & M. A. Thornton
(ed.), Handbook of Research Methods and Applications in Empirical Macroeconomics (p.
139–164). Cheltenham: Edward Elgar Publishing.
9. Piano, S. (2013). The impact of European economic policy uncertainty on the economic
performance of the Eurozone. Undergraduate thesis, Coventry: University of Warwick.
10. Sims, C. (1980). Macroeconomics and reality. Econometrica, 48(1), 1–48.
11. Verbeek, M. (2008). A Guide to Modern Econometrics. Chichester: John Wiley & Sons.

63rd International Scientific Conference on Economic and Social Development – "Building Resilient Society" - Zagreb, 11-12 December, 2020
343
DRIVER AND BARRIER FACTORS OF INDUSTRY 4.0
IMPLEMENTATION FOR SMALL AND MEDIUM-SIZED
ENTERPRISES: AN OVERVIEW
Santi Setyaningsih
Szechenyi Istvan University, Hungary
Peter Kelle
Louisiana State University, USA
Azmi Sulaiman Maretan
Szechenyi Istvan University, Hungary
ABSTRACT
The development of Industry 4.0 is based on third Industrial Revolution which marked by the
rapid improvement of Information Technology (IT), electronics and digitalization that consist
of Internet of Things (IoT), Cyber Physical System (CPS) and Internet of Services (IoS) that
create Smart Factory. Industry 4.0 concept is causing significant impact to the industrial sector
and usually already applicable in developed countries such as Germany, USA, and Japan,
mostly by the larger enterprises. However, it is quite challenging for the Small and Medium
Sized Enterprises (SMEs) to implement the same. This paper utilizes literature review
methodology focusing on the emerging digital technology of Industry 4.0 that have several
driver and barrier factors in application to the organization of SMEs. It is already proven that
applying this Industry 4.0 can bring several benefits to organization such as improve the quality
of product and service, reduce the lead time to the market, increase more productivity, etc. We
identified six drivers with 27 sub-factors and six barrier factors with 23 sub-factors for the
barriers based on 53 selected articles that focus on Industry 4.0 implementation. The results
are crucial for SMEs in planning conversion towards digitalized processes. The paper also
contributes academically by supporting future research investigating the effect of geographical
and organizational structure on these driver and barrier factors of Industry 4.0 implementation.
Keywords: Barrier, Driver, Industry 4.0, Small and Medium Enterprises
1. INTRODUCTION
Industry 4.0 has changed the geography of industry, especially their technological system which
is based on IoT, Cloud, Big Data, and several other types of digital technology (Won and Park,
2020). This term that was announced in Germany in 2011 has a purpose to improve and enhance
productivity, revenue growth, employment, and investments (Piccarozzi, et al., 2018).
Information from manufacturing companies in Italy showed that Industry 4.0 was able to
improve product quality by 63.1% through the reduction of errors, share the advantages in the
management of logistic by 53.8%, time-saving by 50.8%, and also successfully decrease the
physical stress of collaborators by 40% (Brozzi, et al., 2020). The sample of proven
implementation of Industry 4.0 is mostly from larger enterprises. Indeed, they contribute
significantly to the economy of a country. However, SMEs cannot be ignored since they
contribute around 90% of the economy of the EU (European Union) countries (OECD, 2016).
The contribution of SMEs is also substantial in providing job opportunities, economic growth
as well as ensure social stability. In terms of Industry 4.0 implementation, SMEs have more
difficulties since they face a greater shortage of financial and knowledge resources (Masood

63rd International Scientific Conference on Economic and Social Development – "Building Resilient Society" - Zagreb, 11-12 December, 2020
344
and Sonntag, 2020). Previous research revealed that SMEs require a flexible and simple
application of Industry 4.0 (Moeuf, et al., 2019). Since SMEs are part of the big supply chain,
improving their digitalization can provide additional opportunities to enter into new markets as
well as improve their productivity (Peillon and Dubruc, 2019). A systematic literature review
is presented in this research to determine what are the significant driver and barrier factors for
SMEs in the implementation of Industry 4.0. We also summarize the key topics in Industry 4.0
and the research progress in these areas. Further, we show the managers of SMEs' in which area
they need to focus first on Industry 4.0 implementation. The research paper is structured as
follows: Section 2 describes the research methodology used for this literature review
framework. Section 3 shares the process of screening results and descriptive findings from the
assessment. Section 4 explains the comprehensive review of accumulated articles and split the
result between driver factors and barrier factors of Industry 4.0 implementation. Section 5
concludes with the contributions and limitations of the study and proposes future research
directions.
2. METHOD
2.1. Database Selection
At the time as the term Industry 4.0 was first publicly introduced in 2011 (Luenendonk, 2019),
very few articles were published containing this term in International Journals, so in our search,
we are also included International Conference Proceedings to enhance our publication database.
This review was conducted using public literature databases. The search was not limited to the
manufacturing, industrial, and engineering type of journal but a wider variety of journals and
conference proceedings that published Industry 4.0 related topics. To access a broad variety of
academic articles and conference publications, we selected the ProQuest and Science Direct
databases. ProQuest databases share a single source for scholarly journals, newspapers, reports,
working papers as well as e-books. However, we filtered it for only scholarly journals.
Likewise, Science Direct has around 4,277 journals and 30,498 books for search but we filtered
searching journal articles between 2011-2020.
2.2. Keyword Search
In this paper, we refer only to the most relevant and connected articles that are correlated to our
research question. The objective was to determine a productive, thorough, and fair article search
procedure. Several keywords that are used for this search process included: i) driver of Industry
4.0 in SME, ii) barrier of Industry 4.0 in SME, iii) challenge of Industry 4.0 in SME, iv) success
factor of Industry 4.0 in SME and v) benefit of Industry 4.0 implementation in SME. However,
we also included articles focused its research on Smart Manufacturing, IoT, and Smart Factory.
Figure 1: Flow of Databases Collection

63rd International Scientific Conference on Economic and Social Development – "Building Resilient Society" - Zagreb, 11-12 December, 2020
345
2.3. Inclusion/Exclusion Criteria
Articles that we analyzed further in this research paper follow these inclusion criteria:
Identifier Description
C1 Articles in English language
C2 Articles that published in between 2011-2020
C3 Eliminate dissertation, theses, books, newspapers,
magazines, working papers, and reports
C4 Articles that has more than 4 pages
C5
Articles encompassing the subsequent title, abstract
or keywords terms: Industry 4.0, driver, barrier,
challenges, success factor, and benefit
Table 1: Inclusion/Exclusion Criteria (Source: Own Development)
We did the screening process several times to make sure that all the articles that being analyzed
are dealing with the same topic, and there were no duplications. The initial keyword search
resulted in around 13,728 publications. We confirmed that various facets of Industry 4.0 are
already enclosed in the gathering phase and were also already filtered by the inclusion/exclusion
criteria.
3. RESULT
3.1. Article Screening Result
The screening process used three phases to ensure that the appropriate articles from the search
databases were included in the analysis part. In phase one, we were entering the keywords in
the databases with the inclusion criteria and resulted in 13,728 publications under 5 themes of
keywords. In phase two, we screened those articles based on titles and abstracts that are
connected to the investigated topic. This action resulted in 13,551 articles that have been
excluded, and 177 articles being left. In phase three, we excluded duplication articles to
streamline the final databases. After discussing this selection among the co-authors resulted in
53 articles as a final selection. In summary, these actions demonstrate how this literature review
provides a focused review of Industry 4.0 implementation by SMEs.
3.2. Descriptive Analysis
Since Industry 4.0 has been launched in 2011, no articles focused on our specific topic until
2017. In recent years, papers related to the driver and barrier research of Industry 4.0
implementation increased gradually. Table 2 shows the trend we observed from the year 2017
to 2020.
2017 2018 2019 2020
No. of Articles 7 18 19 9
Table 2: Statistics of Resulted Article by Year (Source: Own Development)
Out of the 53 articles directly connected to our research, 13% were published in Procedia
Manufacturing, 11% in IFAC Papers Online, and the rest has a small percentage in several other
journals. The highest-ranked journal that has some related articles is the Technological
Forecasting & Social Change with three articles (6%). This journal is classified as a Q1 journal
in applied psychology and has a 103 H index rank.

63rd International Scientific Conference on Economic and Social Development – "Building Resilient Society" - Zagreb, 11-12 December, 2020
346
Journal Articles and Conference Proceeding No. of Articles
Procedia Manufacturing 7
IFAC Papers Online 6
Procedia CIRP 3
Sustainability 3
Technological Forecasting & Social Change 3
Computers in Industry 2
Processes 2
Social Science 2
Other Proceedings and Journals 25
Total Articles 53
Table 3: Statistics of Resulted Article by Journal and Proceeding (Source: Own Development)
The published case studies in these articles were mostly coming from Germany as a country
origin of industry 4.0. As we see in Table 4, most of the published cases come from developed
countries.
Country Wise - Case Study No. of Articles
Germany 10
Italy 3
European 2
Hungary 2
Japan 2
Malaysia 2
UK 2
Other Countries 17
Unknown 13
Total Articles 53
Table 4: Statistics of Resulted Article by Country (Source: Own Development)
Most authors used empirical research that covered 64% of all articles that were investigated.
Empirical research is based on observations and obtain knowledge from experience rather than
utilize theory (PSU, 2020). Several advantages of the empirical research method include
flexible methodology concerning changing sample size, sampling type, and data collection
method. Besides, this research method has also fewer rules to be followed (Projectguru, 2020).
Research Method No. of Paper
Empirical 34
Survey 13
Case Study 8
Interview 8
Mixed Method 4
Others 1
Conceptual/Theoretical 9
Research Method No. of Paper
Literature Review 5
Modeling 4
Conceptual/Theoretical + Survey 1
Total Articles 53
Table 5: Distribution of Review Articles by Research Method (Source: Own Development)

63rd International Scientific Conference on Economic and Social Development – "Building Resilient Society" - Zagreb, 11-12 December, 2020
347
4. DISCUSSION
4.1. Driver Factors of Industry 4.0 Implementation
In practice, several methods can be used to trigger SMEs to implement Industry 4.0. We
classified them as driving factors. Reduction of cost including human resource cost, inventory
cost and operating cost are the main things to encourage companies to move forward as it has
been revealed in several papers of our sample: Mohamed (2018); Horváth and Szabó (2019);
Müller and Voigt (2018); Zimmermann, et al. (2019); Rauch, et al. (2019); YaŞar and Ulusoy
(2019); Stentoft, et al. (2019); Masood and Sonntag (2020); Hamzeh, et al. (2018)). However,
we understand that these impacts can be achieved after SMEs implement Industry 4.0 with high
investment as well. Besides, by implementing Industry 4.0, the enterprise could improve their
production by doing mass production or ensure flexibility of customizable production systems
depend on customers’ demand as it has been published by Rauch, et al. (2019); Bär, et al.
(2018); Kiel, et al. (2017); Mittal, et al. (2018); Masood and Sonntag (2020); Kolla, et al.
(2019); Hamzeh, et al. (2018); Bigliardi, et al. (2020); Zhong, et al. (2017); Zimmermann, et
al. (2019).
Table following on the next page

63rd International Scientific Conference on Economic and Social Development – "Building Resilient Society" - Zagreb, 11-12 December, 2020
348
Group Factor Literatures
Financial
Reduction of Cost (E.g.: Human
Resources, Inventory Management and
Operating Costs)
Mohamed (2018); Horváth and Szabó (2019); Müller and
Voigt (2018); Zimmermann, et al. (2019); Rauch, et al.
(2019); YaŞar and Ulusoy (2019); Stentoft, et al. (2019);
Masood and Sonntag (2020); Hamzeh, et al. (2018);
Increase Revenue Mohamed (2018); Kiel, et al. (2017)
Process
Simplification of Business Process
Mohamed (2018); Horváth and Szabó (2019); Kiel, et al.
(2017); Nagy, et al. (2018); Backhaus and Nadarajah
(2019)
Reducing the Error Rate
Mohamed (2018); Horváth and Szabó (2019); Kiel, et al.
(2017); Müller and Voigt (2018); Zimmermann, et al.
(2019)
Improve Lead Time
Türkes, et al. (2019); Horváth and Szabó (2019); Kiel, et al.
(2017); Stentoft, et al. (2019); Bigliardi, et al. (2020);
Alaloul, et al. (2019); Müller and Voigt (2018); Zhong, et
al. (2017)
Ensuring Reliable Operation Horváth and Szabó (2019); Kiel, et al. (2017)
Group Factor Literatures
Process
Mass Production or Flexible
Customization
Rauch, et al. (2019); Bär, et al. (2018); Kiel, et al.
(2017); Mittal, et al. (2018); Masood and Sonntag
(2020); Kolla, et al. (2019); Hamzeh, et al. (2018);
Bigliardi, et al. (2020); Zhong, et al. (2017);
Zimmermann, et al. (2019)
Having Real Time Data Rauch, et al. (2019); Bär, et al. (2018); Nagy, et al.
(2018); Kilimis, et al. (2019)
Efficiency Resources
Bär, et al. (2018); Kiel, et al. (2017); Masood and
Sonntag (2020); Dalmarco, et al. (2019); Zimmermann,
et al. (2019)
External
Exposure
Fulfill Customer Requirement Türkes, et al. (2019); Bär, et al. (2018); EUDF (2018);
Stentoft, et al. (2019)
Market Competition Horváth and Szabó (2019)
Pressure from Competitors Türkes, et al. (2019); Horváth and Szabó (2019), Lin, et
al. (2018); Stentoft, et al. (2019); Müller, et al. (2018)
Social and Economic Sustainability
Brozzi, et al. (2020); Maresova (2018); Strandhagen, et
al. (2017); Haseeb, et al. (2019); Nagy, et al. (2018);
Alaloul, et al. (2019)
Integrate Stakeholder Bär, et al. (2018); Zimmermann, et al. (2019)
Due to Legal Requirement/Changed
Legislation
Türkes, et al. (2019); Stentoft, et al. (2019); Lin, et al.
(2018)
Human Resource
Increase Labour Shortage Horváth and Szabó (2019)
Decrease Human Work Horváth and Szabó (2019); Kiel, et al. (2017)
Improve Productivity Zhong, et al. (2017); Mohamed (2018); Nagy, et al.
(2018)
Management
Greater Control from Management Horváth and Szabó (2019); Dalmarco, et al. (2019)
Continuous Monitoring of Company's
Performance Horváth and Szabó (2019); Won and Park (2020)
Change Business Process
Maresova (2018); Gabellano and Veiga (2019); Kiel, et
al. (2017); Alaloul, et al. (2019); Garbellano and Veiga
(2019)
Improve Competitive Advantage Kiel, et al. (2017); Müller, et al. (2018); Masood and
Sonntag (2020); Alaloul, et al. (2019)
Company Size Trstenjak, et al. (2020)
Group Factor Literatures
Technology
Advance Manufacturing Technologies Agostini and Nosella (2020); Maresova (2018); Lin, et al.
(2018); Bigliardi, et al. (2020)
Traceability of Data Kiel, et al. (2017); Zimmermann, et al. (2019)
Effective Data Exploitation Kiel, et al. (2017); Müller and Voigt (2018)
Better Data Security Dalmarco, et al. (2019); Alaloul, et al. (2019)
Table 6: Driver Factors Industry 4.0 Implementation (Source: Own Development)

63rd International Scientific Conference on Economic and Social Development – "Building Resilient Society" - Zagreb, 11-12 December, 2020
349
4.2. Barrier Factors of Industry 4.0 Implementation
The major challenge that has been faced by SMEs implementing Industry 4.0 is the lack of
appropriate skills of the employees working in the organization as it was mentioned in several
articles. This barrier is typically related to another sub-factor, such as lack of training held by
the company, as it is published in Türkes, et al. (2019); Horváth and Szabó (2019); Rauch, et
al. (2019); Stentoft, et al. (2019); Moeuf, et al. (2019); Niemeyer, et al. (2020); Kamble, et al.
(2018); Iyer (2018); Kolla, et al. (2019). Also, the manager often had a lack of education in
Industry 4.0 which impacted the organization's performance (Mukherjee (2018); Horváth and
Szabó (2019); Trstenjak, et al. (2020); Moeuf, et al. (2019); Masood and Sonntag (2020);
Centea, et al. (2020)). Those sub-factors are classified into human resource and management
barrier factors. Another important barrier for Industry 4.0 implementation is high investment.
We understand that the company only has a restricted amount of money that should be
prioritized for the activities that are the most beneficial for the company. Industry 4.0 is very
important in several cases, so the company should make an early decision whether they want
to allocate the money for this implementation or not.
Table following on the next page

63rd International Scientific Conference on Economic and Social Development – "Building Resilient Society" - Zagreb, 11-12 December, 2020
350
Group Factor Literatures
Human Resource
Lack of Appropriate Knowledge from Workforce
Mohamed (2018); Hamada (2019); Türkes, et al. (2019); Horváth
and Szabó (2019); Huang, et al. (2019); Rauch, et al. (2019);
Maresova (2018); Kiel, et al. (2017); EUDF (2019); Trstenjak, et al. (2020); Schröder (2017); Stentoft, et al. (2019); Mokhtadir, et
al. (2018); Müller (2019); Peillon and Dubruc (2019); Glass, et al.
(2018); Masood and Sonntag (2020); Centea, et al. (2020); Kamble, et al. (2018); Taurino and Villa (2019); Hamzeh, et al.
(2018); Dassisti and Giovannini (2018); Zapata, et al. (2020)
Lack of Resources Türkes, et al. (2019); Haseeb, et al. (2019); Schröder (2017);
Stentoft, et al. (2019)
Group Factor Literatures
Human Resource Lack of Training of Knowledge
Türkes, et al. (2019); Horváth and Szabó (2019); Rauch, et al.
(2019); Stentoft, et al. (2019); Moeuf, et al. (2019); Niemeyer, et
al. (2020); Kamble, et al. (2018); Iyer (2018); Kolla, et al. (2019)
Technology
Capacity of technology
Mohamed (2018); Huang, et al. (2019); Warren (2017);
Mokhtadir, et al. (2018); Glass, et al. (2018); Masood and
Sonntag (2020); Iyer (2018); Kolla, et al. (2019); Müller and Voigt (2018)
Lack of Standard of Industry 4.0 Implementation
Türkes, et al. (2019); Horváth and Szabó (2019); Schröder (2017);
Stentoft, et al. (2019); Glass, et al. (2018); Kamble, et al. (2018);
Kolla, et al. (2019); Alaloul, et al. (2019); Müller and Voigt (2018); Zapata, et al. (2020)
The need for large amounts of storage capacity Horváth and Szabó (2019); Kamble, et al. (2018)
Lack of back-end systems for integration Horváth and Szabó (2019); Kamble, et al. (2018)
Insecure data access predisposes companies to cyber
crime and industrial spying
Rauch, et al. (2019); Kiel, et al. (2017); EUDF (2019); Schröder (2017); Stentoft, et al. (2019), Mokhtadir, et al. (2018); Kamble,
et al. (2018), Vaidya, et al. (2018); Müller and Voigt (2018)
Management
Lack of Managerial Skill Mukherjee (2018); Horváth and Szabó (2019); Trstenjak, et al. (2020); Moeuf, et al. (2019); Masood and Sonntag (2020);
Centea, et al. (2020)
Lack of Understanding the Importance of Industry
4.0 Türkes, et al. (2019); Stentoft, et al. (2019)
Lack of Concious Planning and Goals
Horváth and Szabó (2019); Huang, et al. (2019); Schröder (2017);
Moeuf, et al. (2019); Mokhtadir, et al. (2018); Müller (2019);
Hamzeh, et al. (2018)
Lack of Top Management Support Rauch, et al. (2019); Kiel, et al. (2017); EUDF (2019); Kolla, et al. (2019); Kilimis, et al. (2019); Hamzeh, et al. (2018); Zapata, et
al. (2020)
Flexibility of Corporate Culture Kiel, et al. (2017); Kamble, et al. (2018); Kolla, et al. (2019); Alaloul, et al. (2019); Zapata, et al. (2020)
Busy with Other Challenges Hamzeh, et al. (2018)
Group Factor Literatures
Financial High Investment
Horváth and Szabó (2019); Huang, et al. (2019); Rauch, et al. (2019); Kiel, et
al. (2017); Schröder (2017); Warren (2017); Stentoft, et al. (2019); Mokhtadir, et al. (2018); Peillon and Dubruc (2019); Glass, et al. (2018);
Masood and Sonntag (2020); Kamble, et al. (2018); Vaidya, et al. (2018);
Won and Park (2020); Hamzeh, et al. (2018); Dassisti and Giovannini (2018); Zimmermann, et al. (2019)
Long evaluation period for tenders Horváth and Szabó (2019)
Organizational
Contradictory Interest from Different Department
Horváth and Szabó (2019)
Resistance to Change
Horváth and Szabó (2019); Rauch, et al. (2019); Kiel, et al. (2017); Trstenjak,
et al. (2020); Stentoft, et al. (2019); Mittal, et al. (2018); Müller (2019);
Peillon and Dubruc (2019); Kolla, et al. (2019); Müller and Voigt (2018)
Regulatory Compliance Issue Kamble, et al. (2018)
External
Resistance to Cooperation from other
Parties
Horváth and Szabó (2019); Rauch, et al. (2019); Kiel, et al. (2017); Müller, et
al. (2017); Mittal, et al. (2018); Mokhtadir, et al. (2018); Müller (2019);
Glass, et al. (2018); Kolla, et al. (2019); Zimmermann, et al. (2019)
Government Policies Tsuruta (2018); Antoniuk, et al. (2017); Maresova (2018); Iyer (2018);
Alaloul, et al. (2019)
Understanding of specific customer
requirements due to increased collaboration and involvement
Kiel, et al. (2017); Peillon and Dubruc (2019)
Legal and Contractual Uncertainty Kamble, et al. (2018); Iyer (2018); Alaloul, et al. (2019)
Table 7: Barrier Factors Industry 4.0 Implementation (Source: Own Development)
5. CONCLUSION AND FUTURE RESEARCH
Nowadays, companies cannot neglect the new development of Industry 4.0 that offers
opportunities to improve the performance of the organization. This strategy can be very helpful,
especially for the manufacturing SMEs that strive to survive in an aggressive environment

63rd International Scientific Conference on Economic and Social Development – "Building Resilient Society" - Zagreb, 11-12 December, 2020
351
(Peillon and Dubruc, 2019). Although SMEs can operate well with the current strategy, but the
absence of Industry 4.0 technology will reduce their potential and may result to get behind other
rivals in the global market. The objective of this research is to find the significant driver and
barrier factors for Industry 4.0 implementation. In our focused literature research we found 6
drivers with 27 sub-factors and 6 barrier factors with 23 sub-factors. Reduction of cost is the
most stated driver factor of Industry 4.0 implementation. However, this phase can be reached
after the organization implements its Industry 4.0 itself, which requires high investment cost.
Careful calculation must be done by the management to make sure that the investment is worth
especially in SMEs that have limited financial resources. On the other hand, the lack of
appropriate knowledge for the employee has become the most stated barrier factor. It is
supported by the fact that SMEs have a small number of employees having only limited skills.
However, this situation can be solved by recruiting employees that already understand more
about Industry 4.0 or improve training or coaching for their own employees. Several limitations
from this research are important to be acknowledged. First, we considered only English
language articles. Second, we used only two databases, ProQuest and Science Direct. From
both of the limitations above, possibly more factors can be found from including other kinds of
literature. Thirdly, since this topic has just spread out since 2011 also Conference Proceeding
should be considered. The results of this review are intended to support future research. Firstly,
these driver and barrier factors of Industry 4.0 implementation could be tested qualitatively
using different samples from areas with different geographical structure and SCM strategy to
find out whether any specific additional factor comes out from this perspective. Secondly,
future research could focus on ranking the driving and barrier factors. Therefore, the current
results can be used as a reference for managers to handle Industry 4.0 development in their
organization. Thirdly, the recommendation is to employ more advanced research methods, both
in data collection and data analysis. This research only used literature review methodology,
however, additional research methods can enhance the result. The more research methods are
used, the more blind spots can be recognized and deliver full pictures increasing the validity
through triangulation.
ACKNOWLEDGEMENT: This research has been supported by Széchenyi István University
and Stipendium Hungaricum scholarship.
LITERATURE:
1. Agostini, L. and Nosella, A. (2020). The Adoption of Industry 4.0 Technologies in SMEs:
Results of an International Study. Management Decision, Vol. 58, No. 4, pp. 625-643
2. Alaloul, W.S., Liew, M.S., Zawawi, N.A.W.A., Kennedy, I.B. (2019). Industrial Revolution
4.0 in the Construction Industry: Challenges and Opportunities for Stakeholders. Ain
Shams Engineering Journal, doi: 10.1016/j.asej.2019.08.010.
3. Antoniuk, L., Gernego, I., Dyba V., Polishchuk, Y. and Sybirianska, Y. (2017). Barriers
and Opportunities for Hi-Tech Innovative Small and Medium Enterprises Development in
the 4th Industrial Revolution Era. Problems and Perspectives in Management, Vol. 15,
Issue. 4, pp. 100-113.
4. Backhaus, S.K.H. and Nadarajah, D. (2019). Investigating the Relationship between
Industry 4.0 and Productivity: A Conceptual Framework for Malaysian Manufacturing
Firms. Procedia Computer Science, Vol. 161, pp. 696-709.
5. Bär, K., Hansen, Z.N.L.H. and Khalid, W. (2018). Considering Industry 4.0 Aspects in the
Supply Chain for an SME. Production Engineering. Doi: 10.1007/s11740-018-0851-y
6. Bigliardi, B., Bottani, E. and Casella, G. (2020). Enabling Technologies, Application Areas
and Impact of Industry 4.0: A Bibliographic Analysis. International Conference on Industry
4.0 and Smart Manufacturing, Vol. 42, pp. 322-326.

63rd International Scientific Conference on Economic and Social Development – "Building Resilient Society" - Zagreb, 11-12 December, 2020
352
7. Brozzi, R., Forti, D., Rauch, E. and Matt, D.T. (2020). The Advantages of Industry 4.0
Application for Sustainability: Results from a Sample of Manufacturing Companies.
Sustainability, Vol. 12, No. 3647, doi:10.3390/su12093647
8. Centea, D., Singh, I., Wanyama, T., Magolon, M., Boer, J. and Elbestawi, M. (2020). Using
the SEPT Learning Factor for the Implementation of Industry 4.0: Case of SMEs. 10th
Conference on Learning Factories, doi: 10.1016/j.promfg.2020.04.079.
9. Dalmarco, G., Ramalho, F.R., Barros, A.C. and Soares, A.L. (2019). Providing Industry 4.0
Technologies: The Case of a Production Technology Cluster. Journal of High Technology
Management Research, doi: 10.1016/j.hitech.2019.100355.
10. Dassisti, M and Giovannini, A. (2018). An Approach to Support I4.0 Adoption in SME: A
Core-Metamodel and Applications. IFAC Papers Online, Vol. 51, No. 11, pp. 42-47.
11. European Union Development Fund (2018). Industry 4.0 - Opportunities and Challenges
for SMEs in the North Sea Region. Interreg North Sea Region Growin 4.0.
12. Garbellano, S. and Veiga, M.R.D. (2019). Dynamic Capabilities in Italian Leading SMEs
Adopting Industry 4.0. Measuring Business Excellence, Vol. 23, No. 4, pp. 472-483.
13. Glass, R., Meissner, A., Gebauer, C., Stürmer, S. and Metternich, J. (2018). Identifying the
Barrier to Industry 4.0. 51st CIRP Conference on Manufacturing Systems, Vol. 72, pp. 985-
988.
14. Hamada, T. (2019). Determinants of Decision-Makers' Attitudes toward Industry 4.0
Adaptation. Social Science, Vol. 8, No. 140, doi:10.3390/socsci8050140.
15. Hamzeh, R., Zhong, R. and Xu, X.W. (2018). A Survey Study on Industry 4.0 for New
Zealand Manufacturing. 46th SME North American Manufacturing Research Conference,
Vol. 26, pp. 49-57.
16. Haseeb, M., Hussain, H.I., Slusarczyk, B. and Jermsittiparsert, K. (2019). Industry 4.0: A
Solution towards Technology Challenges of Sustainable Business Performance. Social
Science, Vol. 8, No. 154, doi: 10.3390/socsci8050154.
17. Horváth, D. and Szabó, R.Z. (2019). Driving Forces and Barriers of Industry 4.0: Do
Multinational and Small and Medium Sized Companies have Equal Opportunities?.
Technological Forecasting & Social Change, No. 146, pp. 119-132.
18. Huang, C.J., Chicoma, E.D.T. and Huang, Y.H. (2019). Evaluating the Factors that are
Affecting the Implementation of Industry 4.0 Technologies in Manufacturing MSMEs, the
Case of Peru. Processes, Vol. 7, No. 161, doi:10.3390/pr7030161.
19. Iyer, A. (2018). Moving from Industry 2.0 to Industry 4.0: A Case Study from India on
Leapfrogging in Smart Manufacturing. 15th Global Conference on Sustainable
Manufacturing, Vol. 21, pp. 663-670.
20. Kamble, S.S., Gunasekaran, A. and Sharma, R. (2018). Analysis of the Driving and
Dependence Power of Barriers to Adopt Industry 4.0 in Indian Manufacturing Industry.
Computers in Industry, Vol. 101, pp. 107-119.
21. Kilimis, P., Zou, W., Lehmann, M. and Berger, U. (2019). A Survey on Digitalization for
SME in Bradenburg, Germany. IFAC Papers Online, Vol. 52, No. 13, pp. 2140-2145.
22. Kiel, D., Arnold, C. and Müller, J.M. (2017). Sustainable Industry Value Creation: Benefits
and Challenges of Industry 4.0. XXVIII ISPIM Innovation Conference, Composing the
Innovation Symphony, Austria, Vienna.
23. Kolla, S., Minufekr, M. and Plapper, P. (2019). Deriving Essential Components of Lean
and Industry 4.0 Assessment Model for Manufacturing SMEs. 52nd CIRP Conference on
Manufacturing Systems, Vo. 81, pp. 753-758.
24. Lin, D., Lee, C.K.M., Lau, H. and Yang, Y. (2018). Strategic response to Industry 4.0: an
empirical investigation on The Chinese automotive industry. Industrial Management and
Data Systems, doi: 10.1108/IMDS-09-2017-0403

63rd International Scientific Conference on Economic and Social Development – "Building Resilient Society" - Zagreb, 11-12 December, 2020
353
25. Luenendonk, M. (2019). Industry 4.0: Definition, Design, Principles, Challenges, and the
Future of Employment. Retrieved 24.08.2020 from https://www.cleverism.com/industry-4-
0/#:~:text=The%20term%20also%20refers%20to,competitiveness%20in%20the%20manu
facturing%20industry
26. Maresova, P., et al. (2018). Consequences of Industry 4.0 in Business and Economics.
Economies, Vol. 6, No. 46, doi:10.3390/economies6030046
27. Masood, T. and Sonntag, P. (2020). Industry 4.0: Adoption challenges and benefits for
SMEs. Computers in Industry, Vol. 121.
28. Mittal, S., Khan, M.A., Romero, D. and Wuest, T. (2018). A Critical Review of Smart
Manufacturing & Industry 4.0 Maturity Models: Implication for Small and Medium Sized
Enterprises (SMEs). Journal of Manufacturing Process, Vol. 49, pp. 194-214.
29. Moeuf, A., Lamouri, S., Pellerin, R. Giraldo, S.M., Valencia, E.T. and Eburdy, R. (2019).
Identification of Critical Suceess Factors, Risks and Opportunities of Industry 4.0 in SME.
International Journal of Production Research, doi: 10.1080/00207543.2019.1636323.
30. Mohamed, M. (2018). Challenges and Benefits of Industry 4.0: An overview. International
Journal of Supply and Operations Management, Vol. 5, Issue. 3, pp. 256-265.
31. Mokhtadir, M.A., Ali, S.M., Sarpong, S.K. and Shaikh, M.A.A. (2018). Assessing
Challenges for Implementing Industry 4.0: Implications for Process Safety and
Environmental Protection. Process Safety and Environmental Protection, doi:
10.1016/j.psep.2018.04.020.
32. Mukherjee, S. (2018). Challenges to Indian Micro Small Scale and Medium Enterprises in
the Era of Globalization. Journal of Global Entrepreneurship Research, Vol. 8, No. 28.
33. Müller, J.M. (2019). Assessing the Barriers to Industry 4.0 Implementation from a Workers'
Perspective. IFAC PapersOnLine, Vol. 52, No. 13, pp. 2189-2194.
34. Müller, J.M., Buliga, O. and Voigt, K.I. (2018). Fortune Favors the Prepared: How SMEs
Approach Business Model Innovations in Industry 4.0. Technological Forecasting & Social
Change, Vol. 132, pp. 2-17.
35. Müller, J.M., Maier, L., Veile, J. and Voigt, K.I. (2017). Cooperation Strategies among
SMEs for Implementing Industry 4.0. Proceeding of Hamburg International Conference of
Logistics, ISBN 9783745043280.
36. Müller, J.M. and Voigt, K.I. (2018). The Impact of Industry 4.0 on Supply Chains in
Engineer to Order Industries - An Exploratory Case Study. IFAC Papers Online, Vol. 51,
No. 11, pp. 122-127.
37. Nagy, J., Oláh, J., Erdei, E., Máté, D. and Popp, J. (2018). The Role and Impact of Industry
4.0 and the Internet of Things on the Business Strategy of the Value Chain - The Case of
Hungary. Sustainability, Vol. 10, No. 3491, doi:10.3390/su10103491.
38. Niemeyer, C.L., Gehrke, I., Müller, K., Küsters, D. and Gries, T. (2020). Getting Small
Medium Enterprises started on Industry 4.0 Using Retrofitting Solutions. 10th Conference
on Learning Factories, Vol. 45, pp. 208-214.
39. OECD (2016). Enhancing the Contributions of SMEs in a Global and Digitalized Economy.
Retrieved 26.07.2020 from https://www.oecd.org/industry/C-MIN-2017-8-EN.pdf.
40. Peillon, S. and Dubruc, N. (2019). Barrier to Digital Servitization in French Manufacturing
SMEs. 11th CIRP Conference on Industrial Product-Service Systems, Vol. 83, pp. 146-150.
41. Piccarozzi, M., Aquilani, B. And Gatti, C. (2018). Industry 4.0 in Management Studies: A
Systematic Literature Review. Sustainability, Vol. 10, No. 3821, doi: 10.3390/su10103821.
42. Projectguru (2020). What are the Advantages and Disadvantages of an Empirical Study?.
Retrieved 24.08.2020 from https://www.projectguru.in/what-are-the-advantages-and-
disadvantages-of-an-empirical-study/
43. PSU (2020). Empirical Research in the Social Sciences and Education. Retrieved
24.08.2020 from https://guides.libraries.psu.edu/emp

63rd International Scientific Conference on Economic and Social Development – "Building Resilient Society" - Zagreb, 11-12 December, 2020
354
44. Rauch, E., Dallasega, P. and Unterhofer, M. (2019). Requirements and Barriers for
Introducing Smart Manufacturing in Small and Medium Sized Enterprises. Engineering
Management Review, DOI 10.1109/EMR.2019.2931564
45. Schröder, C. (2017). The Challenges of Industry 4.0 for Small and Medium Sized
Enterprises. Friedrich Ebert Stiftung.
46. Stentoft, J., Jensen, K.W., Philipsen, K. and Haug, A. (2019). Drivers and Barriers for
Industry 4.0 Readiness and Practice: An SME Perspective with Empirical Evidence.
Proceedings of the 52nd Hawaii International Conference on System Sciences, ISBN: 978-
0-9981331-2-6.
47. Strandhagen, J.W., Alfnes, E. and Strandhagen, J.O. (2017). The Fit of Industry 4.0
Applications in Manufacturing Logistics: A Multiple Case Study. Advance Manufacture,
doi: 10.1007/s40436-017-0200-y.
48. Taurino, T. and Villa, A. (2019). A Method for Applying Industry 4.0 in Small Enterprise.
IFAC Papers Online, Vol. 52, No. 13, pp. 439-444.
49. Trstenjak, M., Opetuk, T., Cajner, H. and Tosanovic, N. (2020). Process Planning in
Industry 4.0 - Current State, Potential and Management of Transformation. Sustainability,
Vol. 12, No. 5878, doi:10.3390/su12155878.
50. Tsuruta, D. (2018). SME Policies as a Barrier to Growth of SMEs. Small Business
Economies, doi: 10.1007/s11187-018-0119-0
51. Türkes, M.C., Oncioiu, I., Aslam, D., Pantelescu, A.M., Topor, D.I. and Căpusneanu, S.
(2019). Drivers and Barriers in Using Industry 4.0: A Perspective of SMEs in Romania.
Processes, Vol. 7, No. 153, doi:10.3390/pr7030153
52. Vaidya, S., Ambad, P. and Bhosle, S. (2018). Industry 4.0 - A Glimpse. 2nd International
Conference on Materials Manufacturing and Design Engineering, Vol. 20, pp. 233-238.
53. Warren, P. (2017). The Potential of Smart Technologies and Micro-Generation in UK SME.
Energies, Vol. 10, No. 1050, doi:10.3390/en10071050.
54. Won, J.Y. and Park, M.J. (2020). Smart Factory Adoption in Small and Medium
Enterprises: Empirical Evidence of Manufacturing Industry in Korea. Technological
Forecasting & Social Change, Vol. 157.
55. YaŞar, E. and Ulusoy, T. (2019). Industry 4.0 And Turkey. Business and Management
Studies: An International Journal, Vol. 7, No. 1, pp. 24-44.
56. Zapata, M.L., Berrah, L. and Tabourot, L. (2020). Is It a Digital Transformation Framework
Enough for Manufacturing Smart Products? The Case of Small and Medium Enterprises.
Procedia Manufacturing, Vol. 42, pp. 70-75.
57. Zhong, R.Y., Xu, X., Klotz, E. and Newman, S.T. (2017). Intelligent Manufacturing in the
Context of Industry 4.0: A Review. Engineering, Vol.3, pp. 616-630.
58. Zimmermann, M., Rosca, E., Antons, O. and Bendul, J.C. (2019). Supply Chain Risks in
Times of Industry 4.0: Insight from German Cases. IFAC Papers Online, Vol. 52, No. 13,
pp. 1755-1760.

63rd International Scientific Conference on Economic and Social Development – "Building Resilient Society" - Zagreb, 11-12 December, 2020
355
PROFESSIONAL ORIENTATION AS A LIFELONG LEARNING
METAMODEL FOR CONTINUING EDUCATION
Svetlana Sotnikova
Novosibirsk state university of economics and management, Russia
Olga Prokudina
Novosibirsk state university of economics and management, Russia
ABSTRACT
Professional orientation in the context of the concept of lifelong learning (LLL) represents the
general ideology of choosing a professional career by an employable individual given the
changing socio-economic reality. The importance of professional orientation in the VUCA
economy is related the need to achieve for labor market entities a sustained rate of income
growth and reduce labor costs. The article substantiates the modern concept of the professional
orientation based on system-triad analysis of genesis of ideas about the essence and content of
the professional orientation. The term «triad of vocational orientation» is introduced into the
managerial circulation. Based on the analysis and generalization of available domestic and
foreign experience of professional orientation the authors interpret the concept of «design of
vocational orientation», interpretation its socio-economic content, essence. The classification
of types of vocational guidance design is proposed: operational and strategic. Author's
interpretation of the imperatives of operational and strategic design of vocational orientation
is given. The imperatives of the vocational orientation design allow to identify and predict
favorable opportunities and risks when choosing a professional career by an employable
individual.
Keywords: Professional orientation, Vocational orientation, Triad of vocational orientation,
Vocational orientation design, Professional career, Career guidance, Professional self-
determination
1. INTRODUCTION
The belief in the high worth of the professional orientation of an employable individual is so
universal now, that the importance and need to regulate professional orientation is considered
at the interstate level. According to the modern concept of UNESCO «Education through Life:
Continuing Education for Sustainable Development», which is part of the «Sustainable
Development Goals - UN 2030», in order to ensure sustainable economic growth, the need to
«strive to create an environment for children and youth that is conducive to the full realization
of their rights and opportunities» was canonized. The development of the main provisions of
the UNESCO concept of continuing education in the context of the transition of the Russian
Federation from industrial to post-industrial information society was reflected in the Concept
of development of continuing adult education in the Russian Federation for the period until
2025. This concept, as a system of views on the content, principles and main priorities of state
policy to ensure throughout life opportunities for the implementation of the guaranteed right to
«freely dispose of their abilities to work, choose the type of activity and profession» (Russian
Constitution as amended, 2014), has proclaimed the increasing value and mandatory
professional orientation not only for the younger generation, but also for the adult person
(Development concept of continuous adult education, 2015).

63rd International Scientific Conference on Economic and Social Development – "Building Resilient Society" - Zagreb, 11-12 December, 2020
356
The main ideas of institutionalization of cooperation and stakeholder engagement in the
development of professional orientation are also reflected in Russian centralized regulations:
Law of the Russian Federation «On employment in the Russian Federation» of 19.04.1991 №
1032-1 (articles 9, 12), Federal Law «On education in the Russian Federation» No. 273-FL of
December 29, 2012 (article 42), the State programs of the Russian Federation «Development
of education» for 2013-2020 and 2018-2025, as well as the Concept of development of
additional education for children until 2020, the Regional standard of personnel for industrial
growth, etc. In this regard, the focus of research interest is on the development of organizational
and economic imperatives of the professional orientation as a mechanism for creating
conditions for successful professionalization of an employable individual, development and use
its «potential for innovative socially-oriented development of the country» (Resolution of the
Government of the Russian Federation No 295, 2014). The objectives of the research are to
triadically analyze the genesis of theoretical and methodical foundations of the professional
orientation, to bring the content of the modern concept of the professional orientation in
accordance with the realities of time, to substantiate the theoretical and methodical foundations
of the vocational orientation design during the short, medium and long periods of time.
Scientific novelty consists in the development of theoretical and applied foundations for the
design of professional orientation of employable individuals in the VUCA economy, ensuring
a balance between short-term and long-term goals, financial and non-financial indicators, main
and auxiliary parameters, as well as external and internal factors of vocational orientation.
Regarding the problematics of the article, a complex of basic methods of theoretical research -
analytical abstraction, interpretation, classification and typologization of the phenomenon
under study - has been effectively used. The subject of the study is stable and regular
interrelationships that can be found in the processes of development of professional orientation
of an employable individual on the labor market.
2. SOCIO-ECONOMIC ESSENCE OF PROFESSIONAL ORIENTATION:
LITERATURE OVERVIEW
The professional orientation as research object has been the focus of science for decades. The
interest in studying this phenomenon and process, its scope, intensity and causes is not
accidental, as it most vividly reflects many important processes of professionalization an
employable individual, which reflect the dynamism of labor market competitiveness. The
analysis of the available literature on the problem of the professional orientation allowed to
reveal the triad structure of the professional orientation – «factor - function - activity», the form
of manifestation of which is «personal need for labor (Ppn) - public (market) need for labor (Pmn)
- choice of profession (Pcp)»:
𝑃𝑝𝑛 ⇒ 𝑃𝑚𝑛 ⇒ 𝑃𝑐𝑝
In other words, the professional orientation (Po) is presented as an individually conscious choice
of the profession (Pcp), reflecting the resolution of the conflict between personal (Ppn) and public
(market) (Pmn) needs in professional labor. It is a choice of a significant profession for an
employable individual based on a clear understanding of his needs, interests, personal
properties and talents, and a public (market) need to labor. The development of industrial
relations, the system of division of labor, approaches to a person, labor and property
significantly changes the fundamental principles and fills the triad of the vocational orientation
with new social and economic content, allowing to give it a new qualitative level which
characteristic for a certain stage of society development (Table 1).

63rd International Scientific Conference on Economic and Social Development – "Building Resilient Society" - Zagreb, 11-12 December, 2020
357
Period
Forms of substances triads of the professional orientation Conceptual
content
Personal need for
labor (Ppn)
Public (market)
need for labor
(Pmn)
Choice of
profession (Pcp)
1918–1936 The need to
realize the right to
labor
The need for
qualified
employees
Professional
vocation
Ensure full
employment of
employable
people
1936-1958 Prohibition of professional orientation activities in the country by the Decree of
the Communist party and the government of the Soviet state (1936)
1960–1990 The need to
realize personal
inclinations for
labor
The need for
comprehensively
developed
employees
Professional self-
realization
Ensuring social
equality of
employable
persons
1990–2000 Monetary labor
needs
The need for
professionally
qualified
employees
Professional self-
determination
Promotion of
efficient
employment of
employed
persons
2001 -
present
The need for
personal benefits
in labor
Need for
competitive
employees
Professional
career
Promotion of
labor market
competitiveness
Table 1: Origin of the professional orientation triad: terminological analysis of ideas about
forms of manifestation of the professional orientation substances (developed by authors)
It is not difficult to notice that the development of the concept of the vocational orientation
came from spontaneous and traditional distribution of employable people in the system of
division of labor taking into account their attraction to any profession (calling) to professional
self-realization, which is determined by a person's awareness of their own capabilities and
potentials in various activities, then to professional self-determination, in which the
responsibility for the validity and results of the choice of profession increases, and, finally,
choosing a professional career as an individually conscious position and behavior related to the
reproduction of qualifications throughout the labor life of an employee (Skrypova, 2015, pp.
190-200) .
3. IMPERATIVES OF THE PROFESSIONAL ORIENTATION: A MODERN
CONCEPT
In the conditions of modern VUCA economy as a result of dynamic processes of formation of
consumer demand for professional labor at an employable individual and employer, obeying
different laws and therefore not coinciding in time and direction of changes, the balance in the
triad system of vocational orientation is disturbed: 𝑃𝑝𝑛 ⇒ 𝑃𝑚𝑛 ⇒ 𝑃𝑐𝑝 . Disturbed balance in the
triad means that the individually conscious professional position of an employable individual
in the system of division of labor does not allow him to meet the market need for professional
labor and get personal benefits for himself. The manifestations of this conflict are:
• first, the loss of interest in the profession, the loss of professional prospects, the
disintegration of professional attitudes due to the lack of opportunities to meet personal
labor needs;
• second, the awareness of an employable individual of the insufficient level of real
opportunities or personal merits to meet the social (market) need for labor;

63rd International Scientific Conference on Economic and Social Development – "Building Resilient Society" - Zagreb, 11-12 December, 2020
358
• third, the discrepancy between personal and market needs for professional labor, due to the
existing division of labor and uneven development of certain sectors of the economy, which
create different conditions for the choice of labor activity of employees.
All this, in the end, contributes to a decrease in the competitiveness of employable individuals
in the labor market, not timely their involvement in the market economy, irrational placement
in the workplaces, inefficient use and fixation in the workplace, and, consequently, weakening
the viability of the organization, falling profits and labor efficiency, etc. Deployment of the
conflict in the triad system of the vocational orientation promotes toughening of competition
between employees for a more advantageous sphere of application of their qualification based
on free labor, growth of personal income. A peculiar form of economic compulsion is being
developed for an employable individual, aware of the limits of freedom and responsibility for
achieving competitive sustainability throughout their life, not just to choose a profession
demanded by the market in accordance with personal labor needs, but to constantly search for
alternative opportunities to acquire personal benefits from professional labor. «Market
economy not only creates suitable conditions for the independent action of each individual, but
also sets strict requirements for it - the ability to choose freely, and to be responsible for the
result of the choice made (that is, to be prepared for unpredictable situations)» (Bataeva, 2017,
pp. 145-150). Under these conditions, employable individuals are forced to act proactively,
anticipating the necessary changes on the labor market, based on the development of «self-
confidence in the choice of personal goals in significant activities, means and ways of achieving
the set goals, the ability to make a real self-assessment of their own actions» (Deeva, 2006, pp.
317-319). There is a shift in attitudes and values when choosing a profession: such concepts as
«profession forever» and «one job for life» disappear. «Today, a person changes eight activities,
not positions, but activities on average during his life» (Chistyakova, 2007). There is a growing
need for an employable individual to choose their personal and professional positioning
trajectory in the market system of division of labor throughout their labor life. From how fast
an employable individual is ready to respond to the challenges of the competitive environment
depends on the achievement of personal benefits in professional labor, its competitive position
in the labor market. In other words, under unforeseen market conditions, the vocational
orientation does not contribute to a one-time act of choosing a professional activity for the entire
labor life. The vocational guidance contributes to the formation of an individually conscious
sequence of alternative choices of professional labor in the changing life conditions and
professional activity of an employable person, i.e. the choice of professional career. In terms of
content, the professional career acts as a personal and professional positioning of an employable
person in the market system of division of labor throughout his working life, considering his
social and psychological abilities and market demand for labor. Structurally, the professional
career is presented as a set of selections of professional activities choices related to mastering
a variety of qualifications, different areas of human experience, taking into account the
professional preferences of an employable individual and the requirements of the labor market
(Table 2).
Table following on the next page

63rd International Scientific Conference on Economic and Social Development – "Building Resilient Society" - Zagreb, 11-12 December, 2020
359
Comparison
criterion
Conceptual space of notions
Professional self-
realization
Professional self-
determination Professional career
Purpose Disclosure of personal
potential in the chosen
profession
Choice of professional
activity
Choosing a professional
future
Object An employable
individual
Growing generation An employable individual
Object role reactive Preventive Proactive
Duration
During the performance
of the function
During labor life During labor life
Periodicity Situationally Once: one profession for
life
Permanent: depending on
the market situation
Stakeholders An employable
individual
An employable
individual
State, business, family, an
employable individual
Providers An employable
individual, family
Employers, state
authorities, local self-
government bodies,
representatives of
science and education,
family, an employable
individual
Employers, state
authorities, local self-
government bodies,
representatives of science
and education, family, an
employable individual
Method Operative Tactical Strategic
Table 2: The conceptual space of the concepts of «professional self-determination»,
«professional self-realization» and «professional career» (developed by authors)
The choice of the professional career is an expression of the will, conscious personal activity
of an employable person, his vision of the economic value of maintaining and improving
professional qualification. In other words, this choice allows «not only to act in accordance with
necessity, but also, identifying and developing their creative abilities, to achieve better results
of activity in comparison with market ones, i.e. to possess competitive advantages in
professional labor in changing conditions of life and professional activity» (Ford, 2011, р. 85).
Thus, if the professional career allows a person to get personal benefits in various labor
situations and provides a sense of identity as in the internal, psychological and external,
existential spaces (Chudzikowski, 2012, pp. 298-306), it defines the career track, otherwise - is
not so, and there is a need to change the profession, change their career track. And if the
economic usefulness of the professional career exceeds the economic investment in it, it is
promising, in the opposite situation - a dead end. Thus, the development modern stage of the
professional orientation concept is conditioned by the special role of the professional
orientation in creation and maintenance of competitive advantage by an employable individual.
The vocational guidance is designed to promote personal and conscious choice of the
professional career, which will allow everyone employable individual not only to act in
accordance with the need, but also, identifying and developing their creative abilities, to achieve
better results than market results throughout his labor life, i.e. to have a competitive advantage
in professional labor and achieve personally benefits in the changing conditions of life and
professional activity. In this context, the professional orientation is a means of protection
against stagnation in professionalism, unemployment, deterioration in quality of life, sets the
resources for creativity and creation, encourages the identification of new opportunities to
improve competitiveness, gives direction, sets the limits and forms of mastering a variety of
qualifications that complement and develop an employable individual.

63rd International Scientific Conference on Economic and Social Development – "Building Resilient Society" - Zagreb, 11-12 December, 2020
360
4. METHODOLOGICAL BASIS OF THE PROFESSIONAL ORIENTATION DESIGN
Deciding on the choice of the professional career in the market system of division of labor is a
systematic process included in the context of the more general system - life definition of an
employable individual, first, and mastering the profession, second. The decision is made based
on various professional orientation technologies in a specific situation that is uncertain, unique
and irreversible. At that, there is no better (one and only right) impacts of the vocational
orientation: an employable individual can achieve personal benefits (meeting personal needs)
due to varying the professional orientation technologies across different careers. The
professional orientation as a targeted activity has an infinite number of decisions related to the
professional career choice, where some solutions are more correct than others. The correctness
of solution depends on the nested conceptual meaning. In this regard, the importance of building
a design of the vocational orientation is growing. The professional orientation design as a
process - is a conscious intuitive activity to design the formal elements of the vocational
guidance system of an employable individual. This design regulates the activities of all labor
market subjects to create conditions for the professional career's choice, which is focused on
maintaining and strengthening an employable individual competitiveness in the labor market.
The professional orientation design as a result - is an information carrier that contains an
analytical model that serves as an interface between an employable individual and the labor
market and sets the conditions for choosing the consumer qualities of the professional career.
Depending on the content of the professional orientation design, operational design and
strategic design are distinguished (Table 3).
Comparison
criteria
Design of the operational
professional orientation
Design of the strategic
professional orientation
Purpose Compliance with budget of the
professional orientation
Competitiveness of the professional
labor market
Orientation Orientation to action Analytical orientation
Subject Selection of a target segment of
the labor market
Analysis of labor market
participant's needs
Essence Functional support planning to
achieve the vocational guidance
goal
Labor market segmentation: macro-
segmentation, micro-segmentation,
ego segmentation
Contents Comprehensive research «4P-mix
career»: type of the professional
career, quality of labor life,
employment, labor mobility
The professional career
attractiveness analysis: potential of
professional labor market, life cycle
of professional qualifications
Opportunities,
resources
Existing opportunities, resources New opportunities, resources
Subject Professional self-determination Professional career
Competitive
Environment
Stable environment Dynamic environment
Nature of
exposure
Preventive Proactive
Result Implementation of the professional
orientation activity: performance
and control over achievement of
goals
Choosing the professional
orientation strategy
Table 3: Comparative characteristics of strategic and operative profession design (developed
by authors)

63rd International Scientific Conference on Economic and Social Development – "Building Resilient Society" - Zagreb, 11-12 December, 2020
361
Design of the operational professional orientation is the activity on designing and optimization
of the professional orientation processes, which allows to satisfy utilitarian, material and
spiritual needs of an employable person to the fullest extent possible, taking into account market
opportunities in the short or medium term. Depending on the dominance of individual
substances in the professional orientation triad 𝑃𝑝𝑛 ⇒ 𝑃𝑚𝑛 ⇒ 𝑃𝑐𝑝, distinguishes: professional
information and consultation, professional selection and marketing, professional benchmarking
and logistics, and professional adaptation (Figure 1).
Figure 1: Graphic operational design of professional orientation: personal (𝑃𝑝𝑛) and
public/market (𝑃𝑚𝑛) needs for professional labor, professional choice (𝑃𝑐𝑝) (developed by
authors)
• Sector (Cmn= 𝑃𝑚𝑛/𝑃𝑝𝑛/𝑃𝑐𝑝) - sector of one substance «public need to labor». This sector
defines the implementation of the professional information, which involves providing
information about the world of professions, the state and prospects of market demand for
professional labor, professional requirements, labor conditions and regime, employment
opportunities, educational organizations in an accessible and understandable form.
• Sector (Cpn= 𝑃𝑝𝑛/𝑃𝑚𝑛/𝑃𝑐𝑝) - sector of one substance «personal need to labor» defines the
implementation of the professional consultation. The vocational guidance in this segment
is aimed at helping an employable person to make a reasonable personal choice of a
professional track that will allow to fully meet personal labor needs.
• Sector (Ccp= 𝑃𝑐𝑝/𝑃𝑝𝑛/𝑃𝑚𝑛) - sector of one substance «professional choice» defines the
implementation of the professional selection - profession choice based on monitoring own
strong and weak social and psychological abilities (Minchington, pp. 14-16) .
• Sector 1 – Co= (𝑃𝑚𝑛 ∩ 𝑃𝑝𝑛) - this dyad determines implementation of the professional
adaptation, which orients an employable person to gradually adapt their personal labor
needs to labor requirements, social environment, labor conditions and regime.
• Sector 2 – Co= (𝑃𝑚𝑛 ∩ 𝑃𝑐𝑝) - this dyad determines implementation of the professional
logistics -selection of optimal vectors of self-realization on the labor market, choice of
optimal vectors of self-realization on the labor market, manifestation of own activity of an
employable person in self-knowledge, development of abilities, search of ways of
realization of personal intentions in the conditions of competition.
• Sector 3 – Co= (𝑃𝑐𝑝 ∩ 𝑃𝑝𝑛) - this dyad determines implementation of the professional
marketing which is focused on the search for a profession in the labor market that will
achieve a competitive edge in satisfying personal labor needs in terms of labor life quality,
as well as identifying opportunities for their preservation over time.

63rd International Scientific Conference on Economic and Social Development – "Building Resilient Society" - Zagreb, 11-12 December, 2020
362
• Sector 4 – Co= (𝑃𝑐𝑝 ∩ 𝑃𝑝𝑛 ∩ 𝑃𝑚𝑛) - this sector provides for the professional benchmarking,
which allows to achieve competitive leadership in the profession based on an objective
assessment of personal needs in labor, aptitudes of abilities and other individual qualities of
the person taking into account the market demand for labor.
So, the design of the operational professional orientation is a productive process of building a
harmonious subject-dimensional environment of personal and professional positioning of an
employable individual in the market system of division of labor, which mediates the unity of
the three substances of the vocational guidance - personal (Ppn) and public/market (Pmn) needs
for professional labor, professional choice (Pcp). Each of the substances, representing an
independent structure, to a greater or lesser extent contributes to the understanding of the design
of professional orientation at certain stages of the life cycle of an employable individual. The
market economy presents each employable individual the purpose of creating material and
spiritual prerequisites for improving the quality of one's life, then the vocational guidance
makes sense for any labor market actor if the professional orientation can generate an additional
value. (Kong, Chrung, Song, 2012, рp. 10-11), i.e. leads to capitalization. The proposal of the
consumer value of professional orientation to the target group of labor market actors - this is
the premise that intangible assets of professional orientation produce financially results
(income). The strategic design of the professional orientation - is the project planning of the
capitalization of vocational orientation processes based on the system of equal interaction of
labor market actors (Sotnikov, 2016, pp. 56-62) through regular and comprehensive monitoring
and analysis of trends in consumer satisfaction and competitiveness of these actors. This design
creates a causal set of professional orientation objectives and indicators for achieving these
goals, initiatives, resources, time frames and liability, it allows us to understand how to achieve
the strategic objectives of creating a stable system of views, beliefs, principles, qualities of
employable people and their groups, which motivates them to choose a career (Sotnikov, 2016,
pp. 126-135). This design clearly illustrates the focus and possibilities of focusing on such
forward-looking directions of professional orientations as infrastructure, technology,
stakeholders and finance. Prospects of the vocational guidance strategic design are connected
among themselves by a cause-and-effect chain - an employable individuals, realizing the
guaranteed right of free choice of a kind of activity and profession, carry out individually
conscious choice of the professional career which adapts to changing conditions of market
system of division of labor. Debugged the professional orientation processes allow to satisfy
the consumer demand of stakeholders (subjects of the labor market) in the professional
orientation and to achieve such quality of labor life, when the main motive of an employable
individual professional activity becomes the satisfaction from labor achievements as a result
of self-realization, the opportunity to develop their creative abilities and use them rationally in
the process of meaningful labor, to participate in production management and decision making,
etc. It is consumer satisfaction with the vocational guidance that is the source of income for the
subjects of the labor market, contributes to the improvement of social and economic labor
efficiency, reducing the personnel professionalization costs, and therefore increase profits,
growth the labor market competitiveness and business competitiveness, etc. Reverse chain of
strategic design of the professional orientation means that the reasons of unsatisfactory values
of the professional orientation social and economic indicators (ROVO - Return on investment
of professional orientation: efficiency of professional labor, costs on professionalization of the
personnel, quality of labor life) are in the perspective of «Stakeholders». Dissatisfaction with
consumer demand in the professional orientation (low economic and social performance of
professional labor, its quality and complexity) means problems in the «Technology»
perspective (professional information, consultation, selection, marketing, benchmarking,
adaptation) as a result of conflict in the professional orientation triad system, the cause of which

63rd International Scientific Conference on Economic and Social Development – "Building Resilient Society" - Zagreb, 11-12 December, 2020
363
is in the «Infrastructure» block. Based on the above, the cause-and-effect relationships chain
reflected in the professional orientation operational and strategic design technologies gives a
holistic view of the professional orientation current and strategic objectives , defines a sequence
of hypothetical cause-and-effect relationships between its material results and the driving
factors for their achievement. The professional orientation strategic design sets the bounds,
forms, and focus on capitalization of the professional orientation. It makes to identify and
predict the favorable opportunities and risks of income growth of the labor market entities and
reduction of labor costs, to ensure a balance between short-term and long-term goals of the
professional orientation, its financial and non-financial indicators, main and auxiliary
parameters, external and internal factors.
5. CONCLUSION
Thus, the modern professional orientation concept represents a general ideology of the
professional career choice for an employable individual, designed to prepare him for the
changing socio-economic reality throughout his labor life. Professional orientation is intended
to become a full-fledged regulator of lifelong learning (LLL) by increasing the socio-economic
efficiency the professional career choice, the future professional choice of employable person,
in accordance with their needs in labor, abilities, motives, preferences and the needs of labor
market actors. The professional orientation value is explained by the fact that it is directly
related to the achievement of sustainable income growth rates and labor costs reduction of labor
market actors. The imperatives of the professional orientation strategic and operational design
allow, first, to guarantee a professional approach to investing in professional orientation, the
choice of a way of self-realization of long-term competitive advantages of employable
individuals in the labor market. Second, consolidate the vision of a strategic personal-
professional position of employable individuals in the labor market and create the basis for its
competitiveness in the labor market. Third, create the conditions for the transition from
«responsibility to choose a profession» to responsibility for a professional career.
LITERATURE:
1. Bataeva, Y.D. (2017). Formy i metody professionalnoi orientatsii v vuze [Forms and
methods of professional orientation in the university]. Izvestiia chechenskogo
gosudarstvennogo pedagogicheskogo instituta [Izvestia of the Chechen State Pedagogical
Institute]. No 1. Pp. 145 - 150. (Russian)
2. Chistyakova, S. N. (2007). Pedagogicheskoe soprovozhdenie samoopredeleniya
shkol'nikov: metod. posob. [Teaching of self-determination of schoolchildren:
methodological manual]. Moscow: Izdatel'skii tsentr «Akademiya» (Рubl.). 128 p.
(Russian)
3. Chudzikowski, K. (2012) Career transitions and career success in the «new» career era.
Journal of VocationalBechavior. No 81. Рp. 298-306.
4. Constitution of the Russian Federation (considering the amendments made by the Laws of
the Russian Federation on amendments to the Constitution of the Russian Federation).
(2014). Konstitutsiia RF s uchetom popravok vnesennykh Zakonami Rossiiskoi Federatsii
o popravkakh k Konstitutsii Rossiiskoi Federatsii, No 2, 6, 7, 11. Retrieved 1.10.2020 from
http://www.consultant.ru/document/cons_doc_LAW_28399/.
5. Deeva, E. V. (2006). Sushchnost i usloviia protsessa formirovaniia sotsialnoi uspeshnosti
iunoshei sredstvami sotsialno-pedagogicheskoi deiatelnosti v uchrezhdenii dopolnitelnogo
obrazovaniia [The essence and conditions of the process of forming social success of young
men by means of social and pedagogical activities in the institution of additional education].
Vestnik Tambovskogo universiteta Seriia Gumanitarnye nauki [Bulletin of Tambov
University. Humanities Series]. Vol. 43. No 3-1. Pp. 317-319. (Russian)

63rd International Scientific Conference on Economic and Social Development – "Building Resilient Society" - Zagreb, 11-12 December, 2020
364
6. Decree of the government of the Russian Federation «On approval of the state program of
the Russian Federation «Education development» in 2018-2015. (2017). Postanovlenie
pravitelstva RF «Ob utverzhdenii gosudarstvennoi programmy Rossiiskoi Federatsii
«Razvitie obrazovaniia» na 2018-2015, No 1642. Retrieved 25.09.2020 from
http://www.consultant.ru/document/cons_doc_LAW_286474/11438c397a53550b06a14dd
e6831a3de221a52d9/
7. Decree of the government of the Russian Federation «On approval of the state program of
the Russian Federation «Education development» in 2013-2020. (2014) Postanovlenie
pravitelstva RF «Ob utverzhdenii gosudarstvennoi programmy Rossiiskoi Federatsii
«Razvitie obrazovaniia» na 2013-2020, No 295. Retrieved 20.09.2020 from
http://static.government.ru/media/files/0kPx2UXxuWQ.pdf.
8. Ford, S.A. (2011). Dynamics of earning capacity. S.A. Ford. Greater Louisville Metro
Attorney at Law Magazine. Pp. 10-11.
9. Kong, H., Chrung, C., Song, H. (2012). From hotel career management to employ-ees career
satisfaction.The mediating effect of career competency. International Journal of Hospitality
management. No 31. Рp. 76-85.
10. Minchington, B., Thorne, K. (2007). Measuring the effectiveness of your employer brand.
Human Resources. October-November. Pp. 14-16.
11. Order of the government of the Russian Federation «On approval of the concept of
development of additional education for children». (2014). Rasporiazhenie Pravitelstva RF
«Ob utverzhdenii Kontseptsii razvitiia dopolnitelnogo obrazovaniia detei», No 1726-р.
Retrieved 20.09.2020 from static.government.ru/media/files/ipA1NW42XOA.pdf.
12. Regional standard of staffing for industrial growth. (2016). Regionalnyi standart kadrovogo
obespecheniia promyshlennogo rosta. Retrieved 22.09.2020 from
https://asi.ru/upload_docs/Региональный_стандарт_кадрового_обеспечения_2.0.PDF.
13. Sotnikov, N.Z. (2016). Kontseptual'nye osnovy strategicheskogo analiza delovoi kar'ery
personala [Conceptual frameworks for strategic career analysis of staff]. Menedzhment v
Rossii i za rubezhom [Management in Russia and abroad]. No 4. Pp. 126-135. (Russian)
14. Sotnikov, N.Z. (2016). Metodicheskii podkhod k formalizatsii strategii delovoi kar'ery na
osnove sistemy sbalansirovannykh pokazatelei [Methodological approach to the
formalization of a business career strategy based on a balanced scorecard system]. Vol. 5.
No 4. Pp. 56-62. (Russian)
15. The Law of the Russian Federation «On employment of population in the Russian
Federation». (1991). Zakon RF O zaniatosti naseleniia v Rossiiskoi Federatsii ot
19.04.1991, No 1032-1. Retrieved 1.10.2020 from
http://www.consultant.ru/document/cons_doc_LAW_60/.
16. The Concept of development of continuing adult education in the Russian Federation for
the period until 2025. (2015). Kontseptsiia razvitiia nepreryvnogo obrazovaniia vzroslykh
v Rossiiskoi Federatsii na period do 2025 goda. Retrieved 25.09.2020 from
http://ipk.bspu.ru/sites/default/files/koncepciya_razvitiya_nepreryvnogo_obrazovaniya_vz
roslyh.docx.pdf.

63rd International Scientific Conference on Economic and Social Development – "Building Resilient Society" - Zagreb, 11-12 December, 2020
365
CRITERIA OF SERVICE VALUE ASSESSMENT USING THE
EXAMPLE OF AN EDUCATIONAL SERVICE AT A UNIVERSITY
Hanna Mackiewicz
Gdynia Maritime University, Poland
ABSTRACT
The article reflects on service value assessment criteria understood as personalized service
relationship. Service understood this way in an intentional provision of work by members of a
meeting. By treating a man as a subject, not as an object, members of the meeting find sense in
their lives through work relationships. In consequence, an enterprise will obtain value which
will allow continuing the establishment’s activity for the benefit of their stakeholders including
their clients, employees, asset holders or society members. The article develops the previous
theoretical considerations undertaken in the paper on regional scope (Mackiewicz, 2012). The
theoretical content was presented using the example of educational services at a higher
education institution.
Keywords: Assessment, Education, Economic and Social Value, Service
1. INTRODUCTION
The main reason for the reflection on the service value assessment criteria has been the latest
discussion in scientific articles and economic literature referring to the subject matter. The
multiplicity of the observed attitudes to solutions in this field has inclined the author to consider
if these various criteria of assessment could be met and, if so, to what extent. The decisive factor
in the layout and composition of this article has been the very object of the assessment, namely
the notion of “service”. For the sake of considerations, here the concept of service proposed by
K. Rogoziński (Rogoziński, 2000) has been adopted. Therefore, the first chapter of the paper
deals with the criteria of service value assessment, where service is discussed within the
dimension of relationship, the act of service provision. The second chapter concerns the
dimension of a product and its offer on the market, and the third one – the dimension of a
practical example of assessment.
2. CRITERIA OF SERVICE RELATIONSHIP EVALUATION
Service is an activity performed by one person for the benefit of another; it is an intentional
provision of work (Rogoziński, 2000). Quite often service recipients are simultaneously co-
authors of a service (prosumers, co-producers), performing their work (Boguszewicz-Kreft,
2009). As a result of the performed work, the needs of both parties are satisfied. The above
statement suggests that work should not necessarily be a profit generating activity; the notion
of work comprises all the activities undertaken by parties in the process of exchange. The
sequence of interconnected activities results in a relationship which, in consequence, joins
members in mutual exchange. At the end of this model process, the servicing company is
transformed into the community of common interests (Rogoziński, 2006). The relationship
relies on cooperation. The relationship process in its essence is free from describing its
effectiveness and efficiency (Rogoziński, 2000). For members of a given activity it is the jointly
added value which gives significance (Rogoziński, 2006). What is value? The concept of value
contains non-definability in itself. According to M.Scheller, recognition of value is performed
through emotional acts (Galarowicz, 1992). Experience of value is prior to its definition; it is
the source of its understanding and evaluation (Grzywocz, 2010). A person may be delighted
as the experience of value “speaks to the man” – do not leave, let me be (Grzywocz,2010).

63rd International Scientific Conference on Economic and Social Development – "Building Resilient Society" - Zagreb, 11-12 December, 2020
366
Service relationship is the meeting of people, an event (Bukowski, 1987), a phenomenon
(Rogoziński, 2007). Meeting as such is the expression of opening of members of a service
relationship on which the intentionality of service provision is based, as well as the dialogue
enabling long-term cooperation among its members (Rogoziński, 2006). By accepting the fact
of intentionality, namely the awareness of the sense of service activity, both on the part of the
service receivers as well as the service providers, a mutual “expectation” of the meeting
members as to the co-feeling of the mystery of an event is assumed, whose effect is difficult to
foresee or guess. At some stage of such a meeting, it could be hard to differentiate between the
service provider and the receiver in this event (Rogoziński, 2006). According to J. Tischner, “a
meeting is a moment when we experience our own or someone else’s real tragic nature”. It
results from the fact that the world structure is based on a hierarchy, and human thinking relies
on preferences. A man free in his choices starts to prioritize, and this leads to a situation “where
all scenarios of drama are possible” (Tischner, 2011). A meeting member can adopt various
attitudes, such as closing oneself to relationships, withdrawing oneself or accepting the meeting
exchange – “cultivating life”. According to J. Tischner, the notion “cultivating life” means
“allowing to be”(Tischner, 2011). One necessary condition of such an attitude is sacrifice,
which, according to the philosopher, implies crossing the borders of oneself, accepting one’s
good will – one’s good will directed towards another man (Covey, 2003, Boguszewicz – Kreft,
2009). According to J. Tischner, this opening to agatological (unveiling) ideal yields in
consequence the affirmation of human existence and rebellion, which, when expressed,
stimulates to axiological (projecting) thinking. “Such axiological thinking results in preference
of truth over untruth”, which in relation to a meeting consists of endeavours to find truth in a
dialogue and is equal to the unveiling of face covered by a mask of pretence. The question
should be asked here about the possible limits of openness. W. Chudy warns, “Exaggerated
value of openness brings sometimes threat of (…) blurring someone’s identity and relativity of
truth” (Chudy, 2001). Unity which could be but does not necessarily has to be built between
the service provider and service receiver should be based on truth, mainly on the truth about
man, his nature and his fair obligations (Chudy, 2001). The question arises if and to what extent
such sacrifice of people in the service relationship is possible. What could incline two members
of exchange to such an attitude? Can the 21th century people afford such heroic nobility which
is revealed, as R. Ingarden wrote (Tischner, 2011), in the generosity relying on the assumption
that one should be faithful to the values even for the sake of the values themselves. To
summarize the above, the first analysed here dimension related to service understanding deals
with the personal aspect of the act of provision. In this dimension, the criterion of service value
assessment focuses on the place of the service in the meeting members’ hierarchy of values.
The criterion of service value relationship assessment is the fact of accepting/non accepting
someone’s view on human subjectiveness, on the level of transcendence via truth about the
nature of man, on his dignity and the system of values protecting humans against manipulations
caused by individual or collective egoism (Chudy, 2001). The assumption on human
subjectivity criteria contradicts a frequent practice applied in the field of services relying on the
limitation of activities in the consumption sphere to the ones most satisfying the client and
concentrating on obtaining the maximum profit. Such an attitude leads to the human alienation
in the field of consumption and work. A service recipient should experience support in the
authentic and substantial realization of his personality; therefore, an employee should be
accompanied with an employer’s interest in personal development through work relations. Only
then is a man treated as a subject, not an object of such an act.
3. CRITERIA OF SERVICES VALUE ASSESSMENT BY STAKEHOLDERS
No company operates in isolation. Each service organization also has its own “electorate”,
whose members sense the results of company activities and are interested in its best effects

63rd International Scientific Conference on Economic and Social Development – "Building Resilient Society" - Zagreb, 11-12 December, 2020
367
(Griffin, 2002). Generally speaking, a service providing company is responsible before
members of three main groups: clients, employees and investors. Stakeholders, as risk carriers,
bring their demands to a company, which a company should accept. In other words, companies
operate under social pressure, the opinion created by the majority. This should not mean that
these claims are always justified from the moral point of view or as physically feasible
(Klimczak, 2006). The Davos Manifesto should be treated as guidance reference to the subject-
oriented approach. One of its assumptions is that an organization management’s prior aim
should be serving its clients, co-workers, capital providers and society as well as balancing their
disputable interests (Steinmann, Schreyögg, 1995). The notion of serving is the opposite of the
term ruling. Serving means bowing, listening to stakeholders, familiarizing with them and
trying to understand. As a result of such agreement oriented activities, profit may be obtained,
which should be viewed as a kind of “prize” for the management’s long-term orientation
towards services aimed for the benefit of their stakeholders. The framed items below refer to
the Davos Manifesto assumptions relating to some of the service activity specifics.
The management has to serve its clients.
It has to satisfy its clients’ needs and give them the best value. Competition among companies
is the usual and accepted way of ensuring that clients receive the best value choice. The
management’s aim is to translate new ideas and technological progress into commercial
products and services.
Point B.1. of the Davos Manifesto
This dimension of service has been referred to clients. Satisfaction of clients’ needs is
characteristic of the marketing oriented attitude (Rogoziński, 2007). In marketing of services,
attention is paid to the quality of services and clients’ satisfaction as the key elements
conditioning a sustainable relationship, which has significant financial consequences both for
an entrepreneur and for a client. In accordance with the rule of whisper marketing, clients will
share their service experience with other clients, which in consequence will influence the
ultimate financial result. Clients, however, will expect to have a possibility to continue
sustainable cooperation. The second part of point B.1 of the Davos Manifesto does not
correspond to the service activity. The majority of the personalized service relationships is
characterized by a low clarity of prices (which results from the feature of non-materiality),
versatility of a service (which results from the lack of divisibility of services production and
consumption as well as heterogeneity of activities of members in the services process), the
essential insusceptibility if this kind of services to technical progress, unless it deals with
relieving arduousness related to the provision process (Simon, 1996; Rogoziński, 2001).
However, when referring to innovation, the features such as organization, marketing and
process have much greater significance in services. Due to the fact of co-production (co-
creation) of services, clients may want to collaborate hoping to obtain lower costs for a given
service.
The management has to serve its employees
because in a free society leadership must integrate the interests of those who are led. In
particular, the management has to ensure the continuity of employees, the improvement of real
income and the humanization of the work place.
Point B.3. of the Davos Manifesto
Although front line employees, who have first contact with a client, are also co-creators of a
service, yet the process of service provision as well as its final result equally depends on
supporting employees and backstage staff.

63rd International Scientific Conference on Economic and Social Development – "Building Resilient Society" - Zagreb, 11-12 December, 2020
368
Therefore, like in any system in which elements jointly contribute to a success of the whole
unit, all employees are the co-workers creating the final effect, i.e. the process and a certain
technical result of the provision system. In the first place, any management should care about
stability of the organization by providing and maintaining proper workplaces. An
entrepreneur’s task is to offer his clients good at a decent level. To achieve this goal,
management of a given organization should start from an accurate recruitment of personnel
whose knowledge, interpersonal skills and attitude are adequate to the adopted mission and
organizational culture, in order to avoid or limit problems of misfit related, for example, to
pathological suppression of emotions or to moral conflicts (Klimczak, 2008). In favourable
conditions, an employee is given an opportunity to remain faithful to his professional ethos
(Klimczak, 2008).. Man undertakes his professional work to support himself and his family
and, therefore, he deserves decent remuneration for his efforts. Thus information on the
company stability, profitability or settling its obligations is so significant to its employees
(Olchowicz, 2009). Man should be perceived as a physical-psychical-spiritual unity and, as
such, he expects from his management to be provided with adequate conditions of work, decent
treatment, respect and mannered forms of cooperation. In the results of research quoted by
J.L.Hesketta, the values appreciated most by employees include the possibility of meeting
customer’s needs, job satisfaction, remuneration, fair promotion, treatment with respect and
dignity, group work and interest in the employee’s situation (Boguszewicz- Kreft, 2009). The
literature in the field of services marketing (or more widely relational marketing) is primarily
focused on satisfying personal relationships among employees (Boguszewicz- Kreft, 2009).
The management has to serve its investors
by providing a return on its investments, higher than the return on government bonds. This
higher return is necessary to integrate a risk premium into capital costs. The management is
the shareholders’ trustee.
Point B.2. of the Davos Manifest
Capital providers including investors and loan providers take a considerable amount of risk by
offering their capital. Therefore, investors should be provided with fair information on the risk,
uncertainty related to investment, return rate of the involved capital, ability of a unit to pay
dividends; the lenders need to be provided with information on the risk related to
creditworthiness of the unit and the possibility of repayment of credit together with interests
(Olchowicz, 2009).
The management has to serve society
It must assume the role of a trustee of the material universe for future generations. It has to use
the immaterial and material resources at its disposal in an optimal way. It has to continuously
expand the frontiers of knowledge in management and technology. It has to guarantee that its
enterprise pays appropriate taxes to the community in order to allow the community to fulfil its
objectives. The management also has to make its own knowledge and experience available to
the community.
Point B.4. of the Davos Manifesto
“Investing means giving a society an opportunity to add value to their work” (John Paul II,
2000). What is significant for the society is to be aware of the financial standing of a unit and
the possibility of its sustainable operation, providing a possibility of constant employment for
staff, supporting local suppliers, developing infrastructure and contributing to local authorities’
budgets (Olchowicz, 2009). An important asset to the discussion on combining companies’
competitiveness with the shape of society is the proposal to create economic and social values

63rd International Scientific Conference on Economic and Social Development – "Building Resilient Society" - Zagreb, 11-12 December, 2020
369
simultaneously as in the model proposed by M. E. Porter and M. R. Kramer (2011). Summing
up, the conclusion can be drawn from the above statements that the primary criteria of the
services value assessment should be decent well-being offered as service. Measurable and non-
measurable elements are significant both for clients and for employees. Cooperation in the
scope of delivering decent well-being, desired by man, both for himself and for others, may
release involvement and passion contributing to clients’ satisfaction and their continued loyalty.
Satisfied clients become ambassadors of a brand, disinterestedly encouraging others to use
services of a given organization. As a result of such natural promotion, an organization obtains
profit from valuable services leading to further satisfaction of its investors. It appears from the
above that capital originates from work, and when work is a significant life element and
becomes one’s passion, man finds sense of his life through work.
4. CRITERIA OF SERVICES VALUE ASSESSMENT ON THE EXAMPLE OF AN
EDUCATIONAL SERVICE
The gainful work of specialist-managers is included in the Davos Manifesto as a service, and
the principles of organizing and managing enterprises as ethical and professional values for
stakeholders (Polańska, 2018). The work of an academic teacher performed as an educational
service is the work of a specialist-manager (Mackiewicz, 2014). In a service meeting, the
teacher meets students who have different motives and expectations. It is interestingly captured
on a plaque in the Sorbonne that has survived to our times: “Some students come here to study
to satisfy their curiosity, others – to gain fame, money, or power. These motifs are popular, but
not very noble. Worthy students are those who learn in order to serve others, thus increasing
good in the world, and those who want to advance in wisdom”. Six values were distinguished
to motivate people to learn. Nowadays, Polish students most often undertake studies in order to
facilitate access to work that brings above-average salary (Polańska, 2018). When asked about
which skills should be emphasized when designing a new field of study in Management,
candidates for studies at one of the Polish universities indicated (the results of quantitative
research provided by the Department of Promotion of the Gdynia Municipal Office):
• 60.8% (104 persons) – practical skills
• 42.1% (72 persons) – expertise
• 39.8% (68 persons) – managerial skills
• 29.2% (50 persons) – IT skills
• 18.1% (31 persons) – technical knowledge
• 14.6% (25 persons) – soft skills
• 1% (1 person) – other.
Second-year students studying in the field of Innovative Economy during the class in Marketing
Research emphasized the usefulness of the course for the ability to conduct simple marketing
research. The texts cited above show the multiplicity and diversity of human values in relation
to studies. Two sources of information are used in the process of assessing the work of an
academic teacher in terms of teaching duties at Polish universities: students’ opinions and
written opinions of the immediate superior visiting a class. The teacher is allowed to respond
to these opinions. When assessing the classes conducted by academic teachers at Gdynia
Maritime University, students answered the following closed questions in 2020:
• The teacher familiarized the students with the subject syllabus and with the requirements
and criteria for passing the course.
• The teacher conducted classes according to the presented syllabus.
• The teacher conducted classes in accordance with the schedule; the classes started and
ended on time.

63rd International Scientific Conference on Economic and Social Development – "Building Resilient Society" - Zagreb, 11-12 December, 2020
370
• Classes were conducted in an understandable and orderly manner, and they took place in a
cultural and encouraging atmosphere.
• The teacher aroused interest in the subject of the classes and motivated to expand knowledge
independently in the area of the subject of the classes.
• The teacher prepared (presented) up-to-date teaching materials, adequate to the type of
activity.
Within the individual criteria, academic teachers were assessed on a scale from 2 to 5 (where 2
means that the teacher did not meet the criterion, and 5 that he met the criterion very well). In
students’ opinion, the questionnaire evaluating the work of an academic teacher examines the
formal compliance of work during classes with the syllabus and the study plan. One point relates
to assessing the extent of motivating students to search independently for knowledge in the area
of the subject matter of classes. One question relates to interpersonal communication with
students. Assessing academic lecturers’ teaching activities at Gdynia Maritime University,
superiors answered the following closed questions in 2020:
• Is the teacher properly prepared for the classes?
• Did the teacher introduce the topic and purpose of the lesson?
• Is the content provided by the teacher consistent with the subject syllabus?
• Does the teacher use the correct language?
• Is the structure of the classes logically ordered?
• Does the teacher emphasize the practical importance of the subject?
• Is the teacher able to interest students in the subject?
• Is the teacher communicative; does he/she explain the discussed issues in a clear and
understandable way?
• Can the teacher answer the questions asked by students?
• Is the class time properly planned?
• Does the teacher make proper use of teaching aids and resources?
• Did the classes take place as per the schedule?
• Did the classes start and end on time?
• Does the teacher encourage students to ask questions and actively participate in classes?
• Does the teacher treat the students with kindness and respect?
Under individual criteria, academic teachers were rated on a scale from 1 to 5 (where 1 means
unsatisfactory, and 5 - excellent). In the superiors’ opinion, the questionnaire assessing the work
of an academic teacher, on a different scale, largely examines formal compliance of work during
classes with the syllabus and the study plan. There are also questions regarding interpersonal
communication with students. There is also a question about the organization of classes, the
ability to raise interest in the subject, as well as the practical importance of the subject, and
whether the teacher is properly prepared to the classes. From the point of view of the entire
University, the quality of education assessed by the Polish Accreditation Committee is very
important. The category of the University, and thus the funds awarded to the university, depends
on the assessment of the committee. The committee takes into account the learning outcomes
specified in the course syllabuses. It should be noted that syllabuses cannot be changed during
the course. It is a social interest that university graduates find a job or be able to create a job for
themselves and others. From the above content, an image of the drama of the service meeting
clearly emerges. An academic teacher is a specialist in his field; he/she undertakes the trouble
of compliance with his profession. It is a profession of social trust. On the one hand, there is a
need for freedom from efficiency and effectiveness in service relations; on the other hand, there
are evaluation criteria emphasizing compliance with the learning outcomes, the syllabus and

63rd International Scientific Conference on Economic and Social Development – "Building Resilient Society" - Zagreb, 11-12 December, 2020
371
the study plan rigidity. The pandemic situation has shown this rigidity even more. Suddenly,
all the subjects in the field of management had to be completed in distance learning. The real
challenge was to conduct the so-called soft subjects, which had to be implemented as part of
the curriculum in the syllabuses using the Internet as a distribution channel for the educational
service. Students had problems with equipment (no webcam or equipment at all) or they had
problems with Internet access from their place of stay. These difficulties were not only
objective. Students do not activate the webcam for various reasons. For some, it is a genuine
lack of a webcam, a broken webcam, but also a desire to hide, to dodge, to use an opportunity
to cheat during tests, a possibility to skip some classes. These are just examples, and there are
many others. The organization responds with procedures and declarations. The values that help
in working on personal professional qualifications have been lost somewhere.
5. CONCLUSION
In summary, it should be stressed that service should be perceived as an act of intentional
provision. Work is a broader concept than profit generating work; it comprises effort undertaken
in order to satisfy human needs. Therefore, the need to prioritize, to find sense in undertaking
activities as well as being open to truth in dialogue should be focused on. The only proper
attitude which will release the desire to sacrifice is when one treats man as a subject, not as an
object in achieving one’s goals. When is it possible? Only when man accepts that by serving
others, he can influence their lives. In consequence, opening to such wisdom may lead to
satisfaction of employees, clients, workers and investors. The prerequisite to achieve this goal
should be the application of a coherent system of personal values of the service meeting
members, consistent with the declared mission of the service organization, which would enable
the employees to remain loyal to their profession. It seems that the values adopted by employees
are the foundation of the set of values shared by the company. Formal evaluation raises people’s
resistance because it changes their situation. When implementing and using employee
evaluation systems in the service process, it is necessary to harmonize the interests of
employees with other stakeholders. When the interests of one entity are higher than those of the
other entities, then the privileged entity benefits only in the short term. These are unprofitable
benefits (Polańska, 1995). And the assessment questionnaires from a tool that collects opinions
that can be the basis for dialogue can only become a tool for rigid, formal control.
LITERATURE:
1. Boguszewicz-Kreft, M. (2009), Zarządzanie doświadczeniem klienta w usługach,
Wydawnictwo Uniwersytetu Gdańskiego, Gdańsk.
2. Bukowski, J. (1987), Zarys filozofii spotkania, Społeczny Instytut Wydawniczy Znak,
Kraków.
3. Chudy, W. (2001), Społeczeństwo zakłamane, Oficyna Naukowa, Warszawa.
4. Covey, S. (2003), 7 nawyków skutecznego działania, Dom Wydawniczy Rebis, Warszawa.
5. Galarowicz, J. (1992), Na ścieżkach prawdy. Wprowadzenie do filozofii, Wydawnictwo
Naukowe PAT w Krakowie, Kraków.
6. Griffin, R.W. (2002), Podstawy zarządzania organizacjami, Wydawnictwo Naukowe
PWN, Warszawa.
7. Grzywocz, K. (2010), Wartość człowieka, Zeszyty formacji duchowej, Jesień 49.
8. John Paul II, (2000) Encyclical, Centesimus Annus, Wydawnictwo Wrocławskiej Księgarni
Archidiecezjalnej, Wrocław.
9. Klimczak, B. (2006), Etyka gospodarcza, Wydawnictwo Akademii Ekonomicznej im.
Oskara Langego we Wrocławiu, Wrocław.
10. Klimczak, B. (2008), Między ekonomią a etyką, Wydawnictwo Uniwersytetu
Ekonomicznego we Wrocławiu, Wrocław.

63rd International Scientific Conference on Economic and Social Development – "Building Resilient Society" - Zagreb, 11-12 December, 2020
372
11. Mackiewicz, H. (2012), Criteria of service value assessment, Transfer wiedzy. Science
Business Review, December.
12. Mackiewicz, H. (2014), Odpowiedzialność nauczyciela akademickiego w pracy
dydaktycznej [in:] red. M. Pluta-Olearnik, S. Wrona, Usługi 2014. Wybrane
uwarunkowania rozwoju usług, Prace naukowe Uniwersytetu Ekonomicznego we
Wrocławiu nr 354, Uniwersytet Ekonomiczny we Wrocławiu, Wrocław.
13. Olchowicz, I. , Tłaczała, A. (2009), Sprawozdawczość finansowa według krajowych i
międzynarodowych standardów, Difin, Warszawa.
14. Polańska, A. (1995), Ekonomia pracy w zarządzaniu, Wydawnictwo uniwersytetu
Gdańskiego, Gdańsk.
15. Polańska, A. (1997), O modelach w zarządzaniu personelem [in] Zeszyty Naukowe
Wyższej szkoły administracji i Biznesu w Gdyni, nr 1. Retrived 30.09.2011 from
http://www.wsaib.pl/files/biblioteka/zasoby_cyfrowe/Zeszyt%20Naukowy2.pdf
16. Polańska, A. (2018), Godna praca tajemniczym skarbem człowieka, Wydawnictwo
Wyzszej szkoły Administracji i Biznesu im. E. Kwiatkowskiego, Gdynia.
17. Porter, M.E., Kramer, M.K. (2011), Creating shared value, Harvard Business Review,
January-February. Retrived 30.09.2011 from
http://www.fsg.org/tabid/191/ArticleId/241/Default.aspx?srpush=true
18. Rogoziński, K. (2000). Usługi rynkowe, Wydawnictwo Akademii Ekonomicznej w
Poznaniu, Poznań.
19. Rogoziński, K. (2001), Usługi pod presja technologii, Marketing i Rynek nr 7.
20. Rogoziński, K. (2006), Zarządzanie relacjami w usługach, Difin, Warszawa.
21. Rogoziński, K. (2007) Zarządzanie organizacją usługową – próba wypełnienia luki
poznawczej [in:] Współczesne zarządzanie, no 3, Retrived 09.12.2020 from
http://www.uslugi.ue.poznan.pl/file/129_189179007.pdf
22. Simon, H. (1996), Zarządzanie cenami, Wydawnictwo Naukowe PWN, Warszawa.
23. Steinmann, H., Schreyögg, G. (1995), Zarządzanie. Podstawy kierowania
przedsiębiorstwem. Koncepcje, funkcje, przykłady, Oficyna Wydawnicza Politechniki
Wrocławskiej, Wrocław.
24. Tischner, J. (2011), Myślenie według wartości, Wydawnictwo Znak, Kraków.
25. Tokarz A. (2010), Zasoby ludzkie jako jeden z czynników determinujących innowacyjność
przedsiębiorstw usługowych, Zeszyty Naukowe 145, Wydawnictwo Uniwersytetu
Ekonomicznego w Poznaniu, Poznań.

63rd International Scientific Conference on Economic and Social Development – "Building Resilient Society" - Zagreb, 11-12 December, 2020
373
ANALYSIS AND CHALLENGES OF INTRODUCING DIGITAL
TAXATION IN EUROPEAN UNION COUNTRIES
Mario Hak
Professor, Ministry of Finance, Tax Administration, Croatia
ABSTRACT
The article analyzes the introduction of digital taxation on the member states of the European
Union. The digital economy is a collective term for all economic transactions that take place
happening on the Internet. It is also known as the Web economy or the Internet economy. With
the advent of technology and the process of globalization digital and traditional economies
merge into one. New ways of doing business in the virtual and digital world economy caused
the emergence of a tax on digital services (hereinafter: digital tax). A solution is being sought
internationally and globally, which is certainly a better and more systematic approach,
however in this text we will see that states have decided to introduce a digital tax on their own.
Keywords: digital taxation, digital economy, virtual and digital world, corporate taxation rules
1. INTRODUCTION
The global economy is rapidly becoming digital and, as a result, new ways of doing business
have emerged. Digital companies are characterised by the fact that their operations are strongly
linked to the internet. In particular, digital business models rely to a large extent on the ability
to conduct activities remotely and with limited or no physical presence, on the contribution of
end-users to value creation, and on the importance of intangible assets. The current corporate
taxation rules were mainly developed during the 20th century for traditional businesses. They
are based on the idea that taxation should take place where value is created. However, the
application of the current rules to the digital economy has led to a misalignment between the
place where profits are taxed and the place where value is created, notably in the case of
business models heavily reliant on user participation. It has therefore become evident that the
current corporate tax rules for taxing the profits of the digital economy are inadequate and need
to be reviewed. That review constitutes an important element of the given that the digital single
market needs a modern and stable tax framework for the digital economy to stimulate
innovation, tackle market fragmentation and allow all players to tap into the new market
dynamics under fair and balanced conditions.
2. METHOD OF RESEARCH OF INTRODUCING DIGITAL TAXATION
The starting point is data and forecasts published by Statista on revenue in different digital
markets. ( UNCTAD and OECD Digital Economy Outlook, p. 14) Statista classifies the digital
market into 8 main categories (e-services, e-commerce, digital media, digital advertising, e-
travel, connected car, e-health, smart home), which are further broken down in subcategories.
Cloud computing is covered separately. For e-payment there has been no reliable data on
revenues earned in the sector (only on transaction volumes). Note that e-commerce, connected
car, e-health, and smart home all relate to applications for physical goods and are not within the
scope of this exercise. The table below shows how these categories relate to the business models
used in this impact assessment. As reference year, Statista forecasts for 2019 were used. All
estimates are static, that is they do not take into account any behavioural responses. It is
important to determine whether the tax issues related to the digital economy could be
sufficiently tackled by the implementation and rigid execution of anti-tax avoidance
regulations, inter alia transfer pricing rules (Schön, W., p. 72). The digitalisation of the global
economy is happening fast and permeates almost all areas of society.

63rd International Scientific Conference on Economic and Social Development – "Building Resilient Society" - Zagreb, 11-12 December, 2020
374
Although the size of the 'digital economy' is still relatively small - estimates revolve around 4-
5% of value added - businesses of all kinds now derive much of their value from intangible
assets, information and data. As a result, the digital economy displays a very strong growth
path. Close to a third of the growth of Europe's overall industrial output is already due to the
uptake of digital technologies. (Vandermerwe, S. and Rada, J. p. 18). Between 2006 and 2016,
digital advertising revenue in Europe has multiplied by more than 5. (IAB Europe and IHS
Markit). Among other things, (digital) taxes should be designed such that companies can easily
determine which tax burden will apply if they provide services in a particular country (Zöchling,
Plott, Rosar, & Dziurdź, p. 1-19). There is no well-defined digital sector as such. Notably, the
Information and Communication Technology (ICT) sector is no synonym for the digital
economy. Digital companies should not be considered pre-dominantly as ICT companies. Many
companies commonly considered as digital companies do not belong to the ICT sector. The
2017 World Investment Report (UNCTAD, 2017a and 2017b) has developed a methodology to
classify international companies into (1) digital companies, (2) IT and telecoms companies
(both enablers of the global digital economy) and (3) 'other multinational companies'. IT and
telecoms companies are broadly equivalent to the ICT sector. They are either IT hardware
manufacturers or software developers/providers of IT services, or they are providers of
telecommunication infrastructure and connectivity. Digital companies are characterised by the
nature of their operations, which are strongly linked to the internet. The report further
distinguishes between providers of internet platforms, e-commerce, digital solutions and digital
content. European companies may forfeit competitiveness by losing ground to competitors from
other countries and continents (Becker, J., & Englisch, J., p. 8). Focussing on the top companies
in each category clearly shows the much more dynamic revenue growth in the digital sector.
Based on a unique assignment of companies into one of the categories, UNCTAD (2017b) has
produced new lists of top 100 multinationals in the categories 'IT and telecoms' and 'digital'.
Table (1) reports summary statistics for the largest companies in each category. Average
revenue growth was around 14% for the top digital firms, compared to around 3% for IT and
telecom enterprises and 0.2% for other multinational enterprises, although total revenue by the
largest digital companies is still considerably lower than that of the other sectors. The table also
reports the 'international footprint' and the relevance of intangible assets, discussed in the next
subsection.
Table 1: Revenue growth, international footprint and relevance of intangible assets of largest
multinational companies (Based on UNCTAD (2017a and 2017b) and Bureau van Dijk Orbis
database, Total revenue for the latest available year for the top companies in each category
in $ billion.
Type of MNE Total revenue Annual
revenue
growth
International
footprint
Relevance of
intangible assets
Digital 872 14.2% 2.1 3.1
IT&Telecoms 2825 3.1% 2.2 1.2
Other 5682 0.2% 1.1 1.4
'Digital' and 'IT&Telecoms' each consist of 100 companies. The category 'Other' only
includes 83 companies, since some of the companies on UNCTAD's usual list of top 100
global companies belong to the first two categories. Annual average growth is measured over
the latest 7 available years. International footprint is the ratio of the share of foreign sales in
total sales to the share of foreign assets in total assets. The relevance of intangible assets is
computed as the market capitalisation over equity book value minus 1)

63rd International Scientific Conference on Economic and Social Development – "Building Resilient Society" - Zagreb, 11-12 December, 2020
375
Doing so for the three categories of largest global companies shows that, compared to the
traditional non-IT companies, digital companies, have a much larger share of sales earned
outside their home country relative to the assets they hold abroad.
3. SPECIFICITIES OF DIGITAL BUSINESS MODELS IN RELATION TO
TAXATION
The main characteristics of digital business models - as compared to more traditional ones - are
their ability to conduct activities remotely, the contribution of internet users in their value
creation, the importance of intangible assets and a tendency to winner-takes-most dynamics.
Businesses in the digital economy can easily conduct activity remotely and are therefore very
active in cross-border trade. Little physical presence is required to sell into a market. From one
click on the computer, consumers can order goods and services from all over the world,
translating into new market reach. For digital services more specifically, this is even more acute
as the delivery of the service itself requires no or little physical presence. Such activities used
to be mostly conducted locally in the destination location, and are now more and more
conducted remotely in the country of origin (at source), although increasingly relying on
consumer information from the destination country. As a result, businesses of the digital
economy have a fundamentally different international footprint, with far fewer assets in the
location of their foreign sales. One way to measure this phenomenon is by measuring the share
of foreign assets in total assets against the share of foreign sales in total sales. The relevance of
user contributions is central, materialising through the mass of adopters, the provision of
personal data and other forms of user contributions to the production process. Participating in
a platform or a network creates a value. As opposed to the conventional 'value chain' business
model where value is generated by the supplier of a product or a service, a large part of the
value derived by users of an online platform is created by other users.
4. RESEARCH ON THE IMPACT OF THE INTRODUCTION OF DIGITAL
TAXATION IN INDIVIDUAL COUNTRIES OF THE EUROPEAN UNION
The implementation of national digital taxes is likely to be accompanied by numerous
undesirable side-effects (Kofler, Mayr, & Schlager, p. 57). Therefore, it is important to
determine which policy tools might better level the playing field and ensure a fair share of the
tax revenues from digital businesses.
Table 2: List of European Union countries that have introduced digital taxation (author
research)
Country
Domestic
Revenue
Threshold
Tax Rate Scope Status and essential features
AT €25 million 5%
Online advertising
services • Effective January 1, 2020;
• The Digital Tax Act (“Digitalsteuergesetz 2020”) is based on
the European Commission's proposal on the digital services
tax from March 2019;
• Online advertising services provided by online advertisers in
Austria in exchange for payment are taxable (starting from 1
January 2020) (The law is limited to online advertising
services provided within Austria, and online advertising
services are considered to be provided within Austria if was
received on the device of a user with an Austrian IP address,
and in terms of content and design (also) is directed towards
Austrian users);
• Online advertising services are considered to be ads placed on
the digital interface, in particular in the form of advertising on
signs, advertising on search engines and similar advertising
services; taxpayers are companies that provide or contribute to
online advertising services, which within one financial year

63rd International Scientific Conference on Economic and Social Development – "Building Resilient Society" - Zagreb, 11-12 December, 2020
376
Country
Domestic
Revenue
Threshold
Tax Rate Scope Status and essential features
have a worldwide turnover of at least 750 million euros, while
in the country they have a turnover of at least 25 million euros
from fees earned by providing online advertising services;
• The tax base for digital tax assessment is the fee that the
online advertising service provider receives from the
customer.
BE €50 million in
the EU 3%
Sales of user data • Proposed → has not yet entered into force, nor is there any
indication of when it could; on 23 January 2019, a bill was
submitted to the House of Representatives seeking to
introduce a temporary tax at Belgian level on the most
important digital services of the “internet giants” who are
currently evading taxes in the EU;
• The proposal mainly targets internet giants. The tax is targeted
at companies with a total global revenue of more than € 750
million and a total taxable income in the EU of at least € 50
million. The company is responsible for DST in Belgium
when the customer is in Belgium at the time of providing the
taxable service (localization based on IP address).
CZ
CZK 100
million (aprox.
€4 million)
7%
1. Targeted advertising
via digital interface;
2. Use of a multilateral
digital interface; and
3. Sales of user data
• CZ Government approved the proposal, it still needs to be
approved by the Parliament → it is expected to enter into
force in mid-2020;
• The draft law specifies a minimum threshold for the taxation
of certain digital services. For the provision of targeted
advertising services and the sale of user data, the amount of
payment for a particular service provided in the Czech
Republic should exceed CZK 5 million. Use of multilateral
digital interfaces is subject to digital services tax if the
number of user accounts on the interface exceeds 200,000;
• The tax would apply to companies with a global turnover of
more than EUR 750 million and a tax base relating to taxable
digital services provided in the Czech Republic of over CZK
100 million (approximately EUR 4 million).
FR €25 million 3%
1. Making the "digital
interface" available;
and
2. Targeted
Advertising Service
• Retroactively entered into force on 1 January 2019, however
its implementation has been temporarily postponed until the
end of 2020 due to US threats to impose high tariffs on French
products; the French DST recognizes two categories of
taxable digital services: 1. a “digital interface” service and 2. a
“targeted advertising” service.
• The law defines the provision of a “digital interface” as
providing, by electronic communications, a digital interface
that allows users to contact and interact with other users,
especially for the purpose of delivering goods or providing
services directly between those users, while defining a
“targeted advertising” service as services marketed to
advertisers or their agents for the purpose of placing on a
digital advertising interface targeted based on user data
collected or generated when such sites are visited. These
services may include, in particular, the purchase, storage and
placement of advertisements, advertising and performance
monitoring, and user data management and transmission
services;
• Taxpayers are digital companies with global gross revenues
from digital services of at least € 750 million and of at least €
25 million in France.
HU N/A 7.5% Advertising
• In 2014, Hungary introduced an advertising tax, which is a
special sales tax applicable to the broadcasting or publication
of advertisements in Hungary;
• Business entities that broadcast or publish advertisements are
subject to this tax, ie, in particular, newspapers, audiovisual
media and billboards;
• The taxable amount of tax is the net turnover in the financial
year generated by the broadcasting or publication of
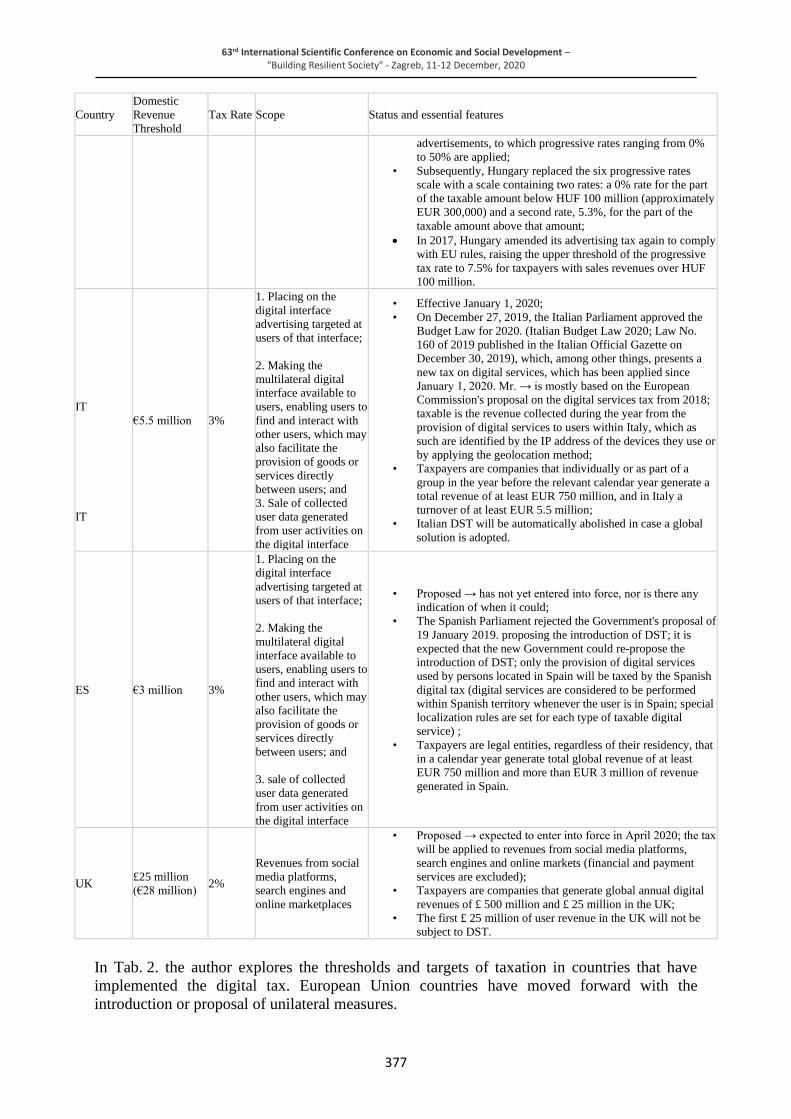
63rd International Scientific Conference on Economic and Social Development – "Building Resilient Society" - Zagreb, 11-12 December, 2020
377
Country
Domestic
Revenue
Threshold
Tax Rate Scope Status and essential features
advertisements, to which progressive rates ranging from 0%
to 50% are applied;
• Subsequently, Hungary replaced the six progressive rates
scale with a scale containing two rates: a 0% rate for the part
of the taxable amount below HUF 100 million (approximately
EUR 300,000) and a second rate, 5.3%, for the part of the
taxable amount above that amount;
• In 2017, Hungary amended its advertising tax again to comply
with EU rules, raising the upper threshold of the progressive
tax rate to 7.5% for taxpayers with sales revenues over HUF
100 million.
IT
IT
€5.5 million 3%
1. Placing on the
digital interface
advertising targeted at
users of that interface;
2. Making the
multilateral digital
interface available to
users, enabling users to
find and interact with
other users, which may
also facilitate the
provision of goods or
services directly
between users; and
3. Sale of collected
user data generated
from user activities on
the digital interface
• Effective January 1, 2020;
• On December 27, 2019, the Italian Parliament approved the
Budget Law for 2020. (Italian Budget Law 2020; Law No.
160 of 2019 published in the Italian Official Gazette on
December 30, 2019), which, among other things, presents a
new tax on digital services, which has been applied since
January 1, 2020. Mr. → is mostly based on the European
Commission's proposal on the digital services tax from 2018;
taxable is the revenue collected during the year from the
provision of digital services to users within Italy, which as
such are identified by the IP address of the devices they use or
by applying the geolocation method;
• Taxpayers are companies that individually or as part of a
group in the year before the relevant calendar year generate a
total revenue of at least EUR 750 million, and in Italy a
turnover of at least EUR 5.5 million;
• Italian DST will be automatically abolished in case a global
solution is adopted.
ES €3 million 3%
1. Placing on the
digital interface
advertising targeted at
users of that interface;
2. Making the
multilateral digital
interface available to
users, enabling users to
find and interact with
other users, which may
also facilitate the
provision of goods or
services directly
between users; and
3. sale of collected
user data generated
from user activities on
the digital interface
• Proposed → has not yet entered into force, nor is there any
indication of when it could;
• The Spanish Parliament rejected the Government's proposal of
19 January 2019. proposing the introduction of DST; it is
expected that the new Government could re-propose the
introduction of DST; only the provision of digital services
used by persons located in Spain will be taxed by the Spanish
digital tax (digital services are considered to be performed
within Spanish territory whenever the user is in Spain; special
localization rules are set for each type of taxable digital
service) ;
• Taxpayers are legal entities, regardless of their residency, that
in a calendar year generate total global revenue of at least
EUR 750 million and more than EUR 3 million of revenue
generated in Spain.
UK £25 million
(€28 million) 2%
Revenues from social
media platforms,
search engines and
online marketplaces
• Proposed → expected to enter into force in April 2020; the tax
will be applied to revenues from social media platforms,
search engines and online markets (financial and payment
services are excluded);
• Taxpayers are companies that generate global annual digital
revenues of £ 500 million and £ 25 million in the UK;
• The first £ 25 million of user revenue in the UK will not be
subject to DST.
In Tab. 2. the author explores the thresholds and targets of taxation in countries that have
implemented the digital tax. European Union countries have moved forward with the
introduction or proposal of unilateral measures.

63rd International Scientific Conference on Economic and Social Development – "Building Resilient Society" - Zagreb, 11-12 December, 2020
378
This legislation has primarily served two aims, namely allocating an appropriate share of the
tax revenues from digital services to the particular country and reducing tax inequality between
domestic and digital business models. The national digital taxes implemented and proposed in
the European Union territory can be allocated to three groups, including the tax type, the tax
scope and the tax base.
5. CONSLUSION
Until the implementation of a common and coordinated action at EU level, which may take
some time to agree, Member States introduce unilateral measures to address the challenges of
taxing the digital economy companies. EU action is necessary in order to mitigate the
fragmentation of the single market and the creation of distortions of competition within the EU
due to the adoption of such unilateral actions at national level. The preferred option would be
consistent with the principle of proportionality. As follows from the subsidiarity test, it is not
possible for Member States to address the problem without hampering the single market.
Moreover, the present proposal aims at setting a common structure of the tax, narrowly defined
with thresholds not to unjustifiably hurt companies, while leaving sufficient margin of
manoeuvre for Member States when it comes to actual setting of certain administrative aspects
related to the measure, such as accounting and reporting obligations, and also concerning the
prevention of evasion, avoidance, and abuse.
LITERATURE:
1. Becker, J., Englisch, J. (2018). EU Digital Services Tax: A Populist and Flawed Proposal.
Kluwer International Tax Blog. Retrieved 26.11.2020. from
https://www.kluwertaxblog.com
2. IAB Europe and IHS Markit (2017), 'The economic contribution of digital advertising in
Europe', Retrieved 19.09.2019 from
http://iabsverige.se/project/the-economic-contribution-of-digital-advertising-in-europe/
3. Kofler, G., Mayr, G., & Schlager, C. (2017). Taxation of the Digital Economy: “Quick
Fixes” or Long-Term Solution?, European Taxation, 57. Retrieved from
https://research.ibfd.org/#/doc?url=/collections/et/html/et_2017_12_e2_1.html.
4. Schön, W. (2018) Ten Questions About Why and How to Tax the Digitalized Economy,
Bulletin for International Taxation, 72. Retrieved 26.11.2020. from
https://research.ibfd.org/#/doc?url=/collections/bit/html/bit_2018_04_int_1.html
5. UNCTAD (2017a), 'World Investment Report 2017: Investment and the Digital Economy',
United Nations, New York and Geneva, Retrieved 20.11.2020. from
https://www.statista.com/download/outlook/whiterpaper/Fullpage/2/219/102/2_219_102.
pdf)
6. UNCTAD (2017b), 'The Top 100 Digital MNEs', Technical annex to the World Investment
Report 2017, United Nations, New York and Geneva, Retrieved 20.11.2020. from
https://www.statista.com/download/outlook/whiterpaper/Fullpage/2/219/102/2_219_102.
pdf)
7. UNCTAD (2017c), 'Information Economy Report 2017: Digitalization, Trade and
Development', United Nations, New York and Geneva, Retrieved 20.11.2020. from
https://www.statista.com/download/outlook/whiterpaper/Fullpage/2/219/102/2_219_102.
pdf)
8. UNCTAD and OECD Digital Economy Outlook, (2017) Projections for these developments
can be found inter alia in the Statista Digital Market Outlook, (2017a,2017b), Retrieved
20.11.2020. from https://www.statista.com/download/outlook/whiterpaper/Fullpage/2/219
/102/2_219_102.pdf)

63rd International Scientific Conference on Economic and Social Development – "Building Resilient Society" - Zagreb, 11-12 December, 2020
379
DESIGNING AND VALIDATING AN INSTRUMENT FOR THE
EVALUATION OF BUSINESS PROCESS MANAGEMENT AND
CUSTOMER EXPERIENCE MANAGEMENT CONVERGENCE
APPROACH
Dino Pavlic
University of Split, Faculty of Economics, Business and Tourism, Croatia
Maja Cukusic
University of Split, Faculty of Economics, Business and Tourism, Croatia
ABSTRACT
Following the design and the operationalisation of a novel approach for Business Process
Management (BPM) and Customer Experience Management (CXM) convergence, in this
paper, we present a series of steps that were carried out to design and validate a research
instrument for its evaluation. After an extensive literature review and focus group in the first
phase, interviews with experts and card sorting study were then organised to devise a
mechanism for the evaluation of the new approach. The initial research instrument was then
tested for validity and reliability. The focus of the paper is reporting on the results of card
sorting that were used to formulate a final research instrument to be distributed to identified
experts, BPM and CXM consultants in SouthEast Europe.
Keywords: BPM, CXM, content validity, construct validity, card sorting
1. INTRODUCTION
The convergence approach of Business Process Management (BPM) and Customer Experience
Management (CXM) is a new concept based on the notion that the identification, discovery,
analysis, redesign, and control of business processes should be performed along with the
identification, discovery, analysis, redesign, and control of customer experience (Davis, 2011).
The need for meaningful involvement of customers, as well as consideration for the entire
customer journeys within the business transformation programmes and business process
optimisation initiatives, is acknowledged in multiple studies (Becker et al., 2011; Bergh, Thijs
& Viaene, 2014; Gersch, Hewing & Schöler, 2011; Gloppen, Lindquister & Daae, 2016;
Johnston & Kong, 2011; Neubauer, 2009; Norton & Pine II, 2013; Schmiedel, Vom Brocke &
Recker, 2014; Trkman, Mertens, Viaene & Gemmel, 2015). The research gap, specifically the
lack of a comprehensive approach for the convergence of two different fields – BPM and CXM,
was addressed in authors’ earlier studies (Pavlic & Cukusic, 2019a, 2019b), where a theoretical
framework, as well as possible operationalisation (using a series of process models) of the
BPM-CXM convergence approach, was formulated. The framework was developed through
qualitative research and by following the design science principles, including a systematic
literature review, a focus group with experts, model operationalisation through prototyping a
set of process models in a specific tool, validation with experts, proof-of-concept
implementation and a case study followed by interviews with experts. The resulting new BPM-
CXM convergence approach is based on the lifecycle of BPM (Dumas, La Rosa, Mendling &
Reijers, 2018) whereby each BPM lifecycle phase is augmented with a CXM overlay (Pavlic
& Cukusic, 2019b). Even though the initial feedback from the users and experts, consultants,
was overwhelmingly positive, the issue of measuring the potential effects and the perceived
benefits that would stem from following the new approach remained. With that purpose, this
study was conducted attempting to formulate a research instrument that would be used to

63rd International Scientific Conference on Economic and Social Development – "Building Resilient Society" - Zagreb, 11-12 December, 2020
380
evaluate the BPM-CXM convergence approach and the effects of using the approach; all
compared to the traditional BPM and CXM methods. The design process of the research
instrument included standard research phases such as literature analysis, organising a focus
group with experts and closed card sorting to perform content and construct validity as well as
reliability testing, all presented in the paper. Accordingly, the paper presents the methodological
considerations and the procedure in Section 2, the results of the tests in Section 3 and
conclusions and future plans in Section 4.
2. DESIGN OF THE INSTRUMENT FOR BPM-CXM APPROACH EVALUATION
2.1. The contents of the research instrument and the general procedure
By conducting an extensive literature review, followed by a focus group and interviews with
experts, the initial set of constructs and items to be included in the initial version of the research
instrument were identified. Five initially identified constructs that are relevant for comparisons
of traditional BPM and CXM initiatives, as opposed to the new BPM-CXM convergent
approach, are briefly outlined below with references:
• Functional silos effect: Functional silos effect within the organisations deals with the
insufficient flow of information, knowledge and resources between the functional
organisational units, where the functional organisational units act as silos (Maze, Smadi,
Burke & Macgillivray, 2008; Stewart, 2014).
• Innovation: Innovation stands for the creation of new knowledge, processes and ideas to
enable new business outcomes which have a goal of improving the internal business
processes and structures to create market-driven products and services (Plessis, 2007).
• Organisational performance: Organisational performance considers the capabilities of
organisations to achieve their goals (Wade & Recardo, 2001). Organisational performance
can be divided into financial and non-financial (Hernaus, Pejić Bach & Bosilj-Vukšić, 2012;
Kihn, 2010). While financial performance includes financial measures such and revenue,
profit, costs, market share and more, non-financial organisational performance such as the
relationship with employees and customers are at least equally important as the financial
ones (Maskell, 1991).
• Alignment of business processes and needs of the customer: Alignment of business
processes and the needs of the customers reflects the alignment between the strategy and
operations of internal business processes and initiatives with the perspective of the customer
(Botha & Rensburg, 2010).
• Customer experience: Customer experience is a multidimensional construct which is
oriented on cognitive, emotional, sensory and social responses of the customer on the offer
of the organisation during the entire journey of the customer (Lemon & Verhoef, 2016).
After the initial set of variables and indicators was defined and discussed (through an extensive
literature review, focus group, interviews with experts), content and construct validity, as well
as reliability, had to be checked to prepare the research instrument. Closed card sorting was
performed with the procedure presented in the next section. Initially, card sorting was
developed by psychologists as a methodology for knowledge organisation and categorisation
(Wood & Wood, 2008). Within the closed card sorting, participants are presented with the list
of items and constructs where the items should be placed (Spencer, 2009). Experts or key
stakeholders then group the items according to their similarity or eliminate the items which do
not fit within the predefined constructs (Straub, Boudreau & Gefen, 2004). Closed card sorting
procedure was deemed appropriate considering the expert knowledge of the main author of the
study in this domain, as well as the available results of the qualitative research phase, whereby
only minor adjustments to the items and constructs were expected (Wood & Wood, 2008).

63rd International Scientific Conference on Economic and Social Development – "Building Resilient Society" - Zagreb, 11-12 December, 2020
381
Closed card sorting was performed with 15 experts from the BPM and CXM domains, having
at least five years of experience in both BPM and CXM domains. Experts have then considered
the previously identified set of items for evaluating the implications of the new approach.
2.2. Procedure for testing the validity and reliability of the research instrument
Validity and reliability testing were performed based on the results of the closed card sorting
procedure. Generally, validity stands for the characteristic of an instrument to measure what is
considered it measures (Cohen, Manion & Morrison, 2013). In terms of content validity, it
signals that the items of an instrument actually measure the defined constructs (Haynes, Richard
& Kubany, 1995). In terms of construct validity, it checks if the instrument measures the
variables (constructs) that it should be measuring (Cook & Campbell, 1979). In other words,
with construct validity, it is checked if the instrument measures the intended constructs. Content
validity was checked by the main author, longtime BPM consultant, and by an expert group
that participated in the in-depth interviews and focus groups. It was supported by calculations
of the content validity ratio (CVR) (Lawshe, 1975) and average relative importance values
(Lewis, Snyder & Rainer, 1995). For every item, it was checked whether the item was relevant
and important for the evaluation of BPM-CXM convergence approach. Construct validity was
checked following the closed card sorting method by calculating the hit ratios. Hit ratios were
used to check how many items are assigned to each construct (Moore & Benbasat, 1991), and
to which construct or a variable each item belongs to. Except for the validity checks, reliability
check of the measurement instrument was performed. Reliability stands for the property of the
test to provide stable and consistent results that should be an actual result rather than a mistake
in the measurement (Carmines & Zeller, 1979). Reliability of the measurement instrument was
checked by calculating the Fleiss’ Kappa coefficient. Fleiss’ Kappa coefficient is used to check
the agreement between more than two respondents (Fleiss, 1971). The described procedure was
assessed as appropriate, as it was used and verified in a similar context, as presented in the
studies by Orehovački (2013) and Pažur Aničić (2017). The two studies were used as a
foundation for the preparation of the matrix (i.e. the MS Excel form) for conducting the closed
card sorting in this study.
2.3. Closed card sorting procedure
Even though card sorting procedure is in some instances performed in two iterations as an
additional check for robustness (Petter, Straub & Rai, 2007), authors have decided to proceed
with one iteration considering the number of previous interactions in the process of forming the
instrument. The consistency of the results in the first iteration was also in favour of this decision.
Compared to an open card sorting procedure, closed card sorting is used when researchers have
the data or experience based on which they can suggest the initial constructs or categories
(Wood & Wood, 2008), or the constructs are known in advance (Fincher & Tenenberg, 2005;
Morente-Molinera, Ríos-Aguilar, González-Crespo & Herrera-Viedma, 2019; Zimmermann,
2016). Furthermore, closed card sorting is also used when only the minor content changes or
additions are expected compared to the existing content, all thanks to the existing knowledge
or the research (Spencer, 2009). Before the form was sent to the participants, pre-testing with
the purpose to avoid grammatical mistakes, ensure that the sentences are understandable and
redefining the constructs and items where necessary was done with two experts. Closed card
sorting procedure was carried out in a way that the participating experts were sent a request for
participation by e-mail, which also included a paper (Pavlic & Cukusic, 2019b) with the detailed
description and operationalisation of the proposed BPM-CXM convergence approach. The e-
mail had also included an MS Excel form to collect the results.

63rd International Scientific Conference on Economic and Social Development – "Building Resilient Society" - Zagreb, 11-12 December, 2020
382
Several of the participants already participated in an earlier stage of the research – focus group,
thus meeting the criterion for the validation of respondents in part (Harry Torrace, 2012;
Merriam & Tisdell, 2015). Total of fifteen experts participated in the process, this being an
adequate number, according to Nielsen (2004).
3. RESULTS OF THE CLOSED CARD SORTING STUDY
3.1. Content validity results
As a part of the closed card sorting procedure, content validity check was performed by
calculating the content validity ratio (CVR) as well as the average relative importance. The
participants have determined relative importance for each of the 62 initially proposed items by
using the following scale: 1 – not relevant; 2 – important (but not essential); 3 – essential; 0 –
cannot answer. The relative importance of each item was determined to calculate the CVR. The
formula by Lawshe (1975) was used:
CVR = (n-N/2)/(N/2)
Here, n stands for the frequency or the number of participants who have scored the item as 2 –
important (but not essential) and 3 – essential, while the N stands for the total number of
respondents. As in the studies by Pažur Aničić (2017) and Orehovački (2013), CVR was
modified to include the ratings 2 and 3 (instead of 3 exclusively). Taking into account the
recommended values on the significance level of = 0.05 and based on the sample of 15
respondents, CVR had to be at least 0.49 to accept the item as relevant (Lawshe, 1975). The
content validity index (CVI), which is an arithmetic mean of CVR values for each item (Lewis
et al., 1995) was 0.75 based on all of the 62 items. Even though the result is a relatively high
CVI, to make the instrument more applicable in future use, certain items were eliminated in the
following way:
1) All of the items with CVR<0.49 were eliminated (twelve items were thus eliminated).
2) All of the items with the average relative importance less than 2 were eliminated.
Considering there is no single rule for the critical values within this phase, authors have
chosen values lower than 2 according to the personal judgement, following the
recommendations in Orehovački (2013). One item was eliminated in this phase.
CVI for the remaining 49 items is 0.85, higher than before the elimination of items. The average
relative importance for the remaining items was 2.48, higher than before the elimination (2.37).
Comments from experts collected through the process were accepted, resulting in correcting
minor writing mistakes and unclarities with the used terminology. The remaining items with
CVR and average relative importance values are presented in Table 1.
Table following on the next page

63rd International Scientific Conference on Economic and Social Development – "Building Resilient Society" - Zagreb, 11-12 December, 2020
383
Table 1: Remaining items with CVR and average relative importance after the analysis
Item
(The question: “By using the BPM-CXM convergent approach…”) CVR
Average
relative
importance
1. Business process awareness within the organisation would increase. 1 2.6
2. Customer experience awareness within the organisation would increase. 1 2.73
3. Coordination between the BPM and CXM organisational units would improve. 1 2.8
4. Cooperation between the BPM and CXM organisational units would improve. 1 2.87
5. Communication between the BPM and CXM organisational units would improve. 1 2.93
6. Mutual capability development between the BPM and CXM organisational units
would improve. 1 2.6
7. The connection between the BPM and CXM organisational units would improve. 0.73 2.4
8. The number of new identified processes would increase. 0.73 2.2
9. The number of new technologies introduced would increase. 0.87 2.27
10. The use of innovative resources would increase. 0.87 2.27
11. Creation of new knowledge would increase. 1 2.67
12. Application of new knowledge would increase. 1 2.73
13. The number of new launched products would increase. 0.73 2.33
14. The number of new launched services would increase. 0.73 2.33
15. Investment in research and development (net worth) would increase. 0.6 2
16. Return on assets (ROA%) within the organisation would increase. 0.6 2.4
17. Value-added per employee within the organisation would increase. 0.73 2.4
18. Sales growth rate within the organisation would increase. 0.87 2.53
19. Profitability within the organisation would improve. 0.73 2.4
20. Market share of the organisation would increase. 0.6 2.13
21. Cost within the organisation would be reduced. 0.73 2.33
22. Sales growth within the organisation would exceed competitors’. 0.6 2
23. Market share of the organisation would exceed competitors’. 0.73 2
24. The profitability of the organisation would exceed competitors’. 0.6 2.07
25. Relationship with suppliers would improve. 0.6 2.13
26. Work productivity of employees would increase. 0.87 2.4
27. Employees’ trust in leadership would increase. 0.87 2.2
28. Work organisation would become more efficient. 1 2.8
29. Employees would be more prepared to go the extra mile for the organisation. 0.87 2.07
30. Employees would become more satisfied with the situation/work conditions within
the organisation. 0.6 2.13
31. Learning ability and adaptability of employees would increase. 0.87 2.4
32. The number of customer complaints within a certain period would decrease. 1 2.87
33. Speed of dealing with customer complaints would increase. 1 2.67
34. The reputation of the organisation in the eyes of the customers would increase. 1 2.87
35. The overall competitive position of the organisation would improve. 1 2.67
36. The organisation would become more aligned to customer needs. 1 2.93
37. The organisation would become more aligned to customer expectations. 0.87 2.67
38. BPM initiatives would become more oriented to the goals of the customer. 1 2.93
39. Customer contribution to the development of competences within the organisation
would increase. 0.73 2.2
40. There would be an increased value for the customers. 1 2.73
41. Customer orientation would improve. 0.73 2.4
42. The relation between internal processes and external customer journeys would be
established. 1 2.87
43. Alignment of KPIs between the BPM & CXM organisational units would improve. 1 2.53
44. Social experience for the customers would improve. 0.6 2.13
45. Customer satisfaction would increase. 1 2.87
46. Customer trust would increase. 1 2.6
47. Customer loyalty would increase. 1 2.53
48. Customer retention would increase. 1 2.73
49. Customer acquisition would increase. 1 2.47

63rd International Scientific Conference on Economic and Social Development – "Building Resilient Society" - Zagreb, 11-12 December, 2020
384
3.2. Construct validity results
The data collected through the closed card sorting procedure was also used for construct validity
and reliability checks. The respondents were asked to group the items in one of the six proposed
groups or constructs presented in section 2 of the paper: functional silos effect, innovation,
organisational performance (financial), organisational performance (non-financial), alignment
of business processes and customer needs, and customer experience. The performed
calculations include the hit ratio and Fleiss’ Kappa. The table with hit ratios per construct for
each of the remaining items is presented in Table 2. While performing calculations, missing
values were assigned to the category Other. Even though the literature does not provide
standards in terms of the critical values for accepting the hit ratio calculations, the total hit ratio
of 0.75 can be considered as acceptable according to previous studies (Orehovački. 2013; Pažur
Aničić. 2017).
Table 2: Hit ratios per constructs
Fu
nct
ion
al
silo
s
effe
ct
Inn
ova
tio
n
Org
an
iza
tio
nal
per
form
an
ce
(fin
an
cia
l)
Org
an
iza
tio
nal
per
form
an
ce
(no
n-f
ina
nci
al)
Ali
gn
men
t o
f
bu
sin
ess
pro
cess
es a
nd
cust
om
er n
eed
s
Cu
sto
mer
exp
erie
nce
Oth
er
Total
number
of hits
Hit
ratio
Functional silos effect 64 3 0 8 25 5 0 105 0.61
Innovation 3 95 8 7 0 2 5 120 0.79
Organizational performance
(financial) 0 0 120 11 2 0 2 135 0.89
Organizational performance
(non-financial) 3 6 9 107 9 27 4 165 0.65
Alignment of business
processes and customer needs 9 3 0 8 83 16 1 120 0.69
Customer experience 0 1 2 8 2 77 0 90 0.86
Total hit ratio 0.75
For the remaining items listed above in Table 1, Fleiss Kappa values were:
Percent overall agreement = 63.03%
Free-marginal kappa = 0.57
95% CI for free-marginal kappa [0.50, 0.64]
Fixed-marginal kappa = 0.56
95% CI for fixed-marginal kappa [0.54, 0.57]
According to previous studies (Landis & Koch, 1977; Altman, 1991). when considering the
acceptable Fleiss Kappa values, the following thresholds are in place:
• Very weak for values below 0.21,
• Weak for values from 0.21 to 0.40,
• Good for values from 0.41 to 0.60,
• Very good for values from 0.61 to 0.80,
• Excellent for values above 0.80.
In view of that, the rate of agreement between the participants taking into account Fleiss Kappa
is very good (63.03%). By analysing the individual hit ratios and Fleiss Kappa values, minor
modifications of the measurement instrument were carried out. The final list of measurement
items (48) of the instrument, grouped into constructs, is presented in Table 3.

63rd International Scientific Conference on Economic and Social Development – "Building Resilient Society" - Zagreb, 11-12 December, 2020
385
Table 3: The final list of research instrument items (48) grouped into constructs Construct Item (The question: “By using the BPM-CXM convergent approach…”)
Functional
silos effect
Business process management awareness within the organisation would increase.
Customer experience management awareness within the organisation would increase.
Coordination between the BPM and CXM organisational units would improve.
Cooperation between the BPM and CXM organisational units would improve.
Communication between the BPM and CXM organisational units would improve.
Mutual capability development between the BPM and CXM organisational units would improve.
The connection between the BPM and CXM organisational units would improve.
Innovation
The number of new identified processes would increase.
The number of new technologies introduced would increase.
Application of innovative resources would increase.
Creation of new knowledge would increase.
Application of new knowledge would increase.
The number of new launched products/services would increase.
Investment in research and development (net worth) would increase.
Organisational
performance
(financial)
Return on assets (ROA%) within the organisation would increase.
Value-added per employee within the organisation would increase.
Sales growth rate within the organisation would increase.
Profitability within the organisation would improve.
Market share of the organisation would increase.
Cost within the organisation would be reduced.
Sales growth within the organisation would exceed competitors’.
Market share of the organisation would exceed competitors’.
The profitability of the organisation would exceed competitors’.
Organisational
performance
(non-financial)
Relationship with suppliers would improve.
Work productivity of employees would increase.
Employees’ trust in leadership would increase.
Work organisation would become more efficient.
Employees would be more prepared to go the extra mile for the organisation.
Employees would become more satisfied with the situation/work conditions within the
organisation.
Learning ability and adaptability of employees would increase.
The reputation of the organisation in the eyes of the customers would increase.
The overall competitive position of the organisation would improve.
Alignment of
business
processes and
customer needs
The organisation would become more aligned to customer needs.
The organisation would become more aligned to customer expectations.
BPM initiatives would become more oriented to the goals of the customer.
Customer contribution to the development of competences within the organisation would increase.
The internal organisation would become more customer-oriented.
The relation between internal processes and external customer journeys would be established.
Alignment of KPIs between the BPM & CXM organisational units would improve.
Customer
experience
Social experience for the customers would improve.
Customer satisfaction would increase.
Customer trust would increase.
Customer loyalty would increase.
Customer retention would increase.
Customer acquisition would increase.
The number of customer complaints within a certain period would decrease.
Speed of dealing with customer complaints would increase.
There would be an increased value for the customers.
4. CONCLUSIONS AND FUTURE WORK
An instrument for evaluating the new BPM-CXM convergence approach compared to the
traditional BPM and CXM approaches was developed through multiple iterations: an extensive
literature review, and a focus group of which the results were presented elsewhere, followed by
interviews with experts and the study presented in this paper using closed card sorting

63rd International Scientific Conference on Economic and Social Development – "Building Resilient Society" - Zagreb, 11-12 December, 2020
386
procedure. As was described in the paper, the initial list with 62 items identified into five
distinct categories was then analysed quantitatively and qualitatively, and subsequently reduced
to a list of 48 items across six constructs. In the process, the measurement instrument was
checked for the content and construct validity, and the final version has been confirmed as
reliable. Consequently, the instrument can be used in the subsequent phases of the research –
to evaluate the proposed BPM-CXM convergence approach compared to the traditional
approaches, as well as the implications of using the proposed BPM-CXM approach. What
follows is the quantitative research phase with 30 organisations in SouthEast Europe that have
extensive experience in conducting both BPM and CXM projects to provide relevant insights
and identify the most important benefits of the new approach.
ACKNOWLEDGEMENT: This research was supported by the Croatian Science Foundation
[grant UIP-2017-05-7625].
LITERATURE:
1. Altman, D. G. (1991). Practical Statistics for Medical Research. Chapman Hall.
2. Becker, J., Niehaves, B., Malsbender, A., Ortbach, K., Plattfaut, R., & Pöppelbuß, J. (2011).
Taking a BPM Lifecycle View on Service Productivity: Results from a Literature Analysis.
Proceedings of the 11th International RESER Conference, 1–20.
3. Bergh, J. Van Den, Thijs, S., & Viaene, S. (2014). Transforming Through Processes
Leading Voices on BPM, People and Technology. London: Springer International
Publishing.
4. Botha, G. ., & Rensburg, A. C. van. (2010). Proposed Business Process Improvement Model
With Integrated Customer Experience Management. South African Journal of Industrial
Engineering, 21(1), 45–57.
5. Carmines, E. ., & Zeller, R. . (1979). Reliability and validity assessment (17th ed.). SAGE
Publications.
6. Cohen, L., Manion, L., & Morrison, K. (2013). Research methods in education.
Professional Development in Education (6th ed., Vol. 38). Routledge.
https://doi.org/10.1080/19415257.2011.643130
7. Cook, T. D., & Campbell, D. T. (1979). Quasi-experimentation: Design and analysis issues
for field settings. Boston: Houghton Mifflin.
8. Davis, R. (2011). It’s the Customer Journey That Counts. A BPTrends Column, 1–5.
9. Dumas, M., La Rosa, M., Mendling, J., & Reijers, H. A. (2018). Fundamentals of business
process management. Berlin: Springer-Verlag Berlin Heidelberg.
10. Fincher, S., & Tenenberg, J. (2005). Making sense of card sorting data. Expert Systems,
22(3), 89–93.
11. Fleiss, J. L. (1971). Measuring nominal scale agreement among many raters. Psychological
Bulletin, 1–5. Retrieved from papers://e7d065ae-9998-4287-8af0-c9fa85af8e96/Paper/
p44071
12. Gersch, M., Hewing, M., & Schöler, B. (2011). Business Process Blueprinting – an
enhanced view on process performance. Business Process Management Journal, 17(5),
732–747.
13. Gloppen, J., Lindquister, B., & Daae, H.-P. (2016). The customer journey as a tool for
business innovation and transformation. In R. DeFillippi, A. Rieple, & P. Wikström (Eds.),
International Perspectives on Business Innovation and Disruption in Design (pp. 118–136).
14. Harry Torrace. (2012). Triangulation, respondent validation, and democratic participation
in mixed methods research Harry Torrance, Manchester Metropolitan University, UK 1.
Journal of Mixed Methods Research, 6(2), 111–123.

63rd International Scientific Conference on Economic and Social Development – "Building Resilient Society" - Zagreb, 11-12 December, 2020
387
15. Haynes, S. ., Richard, D. C. ., & Kubany, E. . (1995). Content validity in psychological
assessment: A functional approach to concepts and methods. Psychological Assessment,
Vol. 7(No. 3), 238–247.
16. Hernaus, T., Pejić Bach, M., & Bosilj-Vukšić, V. (2012). Influence of strategic approach to
BPM on financial and non-financial performance. Baltic Journal of Management, 7(4),
376–396. https://doi.org/10.1108/17465261211272148
17. Johnston, R., & Kong, X. (2011). The Customer Experience : A Road Map for
Improvement. Managing Service Quality, 21(1), 5–24.
18. Kihn, L.-A. (2010). Performance outcomes in empirical management accounting research.
International Journal of Productivity and Performance Management.
19. Landis, J. R., & Koch, G. G. (1977). The Measurement of Observer Agreement for
Categorical Data. Biometrics, 33(1), 159. https://doi.org/10.2307/2529310
20. Lawshe, C. H. (1975). A Quantitative Approach To Content Validity. Personnel
Psychology, 28(4), 563–575. https://doi.org/10.1111/j.1744-6570.1975.tb01393.x
21. Lemon, K. N., & Verhoef, P. C. (2016). Understanding Customer Experience and the
Customer Journey. Journal of Marketing, 80(JM-MSI Special Issue), 1–62.
22. Lewis, B. R., Snyder, C. A., & Rainer, R. K. (1995). An empirical assessment of the
information resource management construct. Journal of Management Information Systems,
12(1), 199–223. https://doi.org/10.1080/07421222.1995.11518075
23. Maskell, B. H. (1991). Performance measurement for world class manufacturing: a model
for American companies. Productivity Press.
24. Maze, T. H., Smadi, O., Burke, N., & Macgillivray, I. (2008). Use of functional silos to
optimize agency decision making. Final Report MRUTC, 05(05).
25. Merriam, S., & Tisdell, E. (2015). Qualitative research: A guide to design and
implementation. Psychologist. John Wiley & Sons, Inc.
26. Moore, G. C., & Benbasat, I. (1991). Development of an instrument to measure the
perceptions of adopting an information technology innovation. Information Systems
Research, 2, 192–222.
27. Morente-Molinera, J. A., Ríos-Aguilar, S., González-Crespo, R., & Herrera-Viedma, E.
(2019). Dealing with group decision-making environments that have a high amount of
alternatives using card-sorting techniques. Expert Systems with Applications, 127, 187–198.
https://doi.org/10.1016/j.eswa.2019.03.023
28. Neubauer, T. (2009). An empirical study about the status of business process management.
Business Process Management Journal, 15(2), 166–183.
29. Nielsen, J. (2004). Card sorting: How many users to test. Jakob Nielsen’s Alertbox.
Retrieved from https://www.nngroup.com/articles/card-sorting-how-many-users-to-test/
30. Norton, D. W., & Pine II, B. J. (2013). Using the customer journey to road test and refine
the business model. Strategy & Leadership, 41(2), 12–17.
31. Orehovački, T. (2013). Methodology for evaluating the quality in use of web 2.0.
applications. Faculty of Organization and Informatics.
32. Pavlic, D., & Cukusic, M. (2019a). Conceptualizing the Convergence Model of Business
Process Management and Customer Experience Management. In C. Di Ciccio, R.
Gabryelczyk, L. García-Bañuelos, T. Hernaus, R. Hull, M. Indihar Štemberger, … M.
Staples (Eds.), Business Process Management: Blockchain and Central and Eastern Europe
Forum Conceptualizing. Springer Nature Switzerland AG.
33. Pavlic, D., & Cukusic, M. (2019b). Developing a Structured Approach to Converging
Business Process Management and Customer Experience Management Initiatives. In J.
Gordijn, W. Guédria, & H. A. Proper (Eds.), The Practice of Enterprise Modeling
Developing. Springer Nature Switzerland AG.

63rd International Scientific Conference on Economic and Social Development – "Building Resilient Society" - Zagreb, 11-12 December, 2020
388
34. Pažur Aničić, K. (2017). Supporting Higher Education Graduates’ Early Careers: Strategic
Framework and Maturity Model for the Field of Information and Communication
Technologies. Faculty of Organization and Informatics.
35. Petter, S., Straub, D. W., & Rai, A. (2007). Specifying Formative Constructs in Information
Systems Research Stacie, (December). Retrieved from
https://scholarworks.gsu.edu/cgi/viewcontent.cgi?article=1016&context=nutrition_master
sprojects
36. Plessis, M. (2007). The role of knowledge management in innovation The Authors. Journal
of Knowledge Management. https://doi.org/10.1006/bbrc.2002.6651
37. Schmiedel, T., Vom Brocke, J., & Recker, J. (2014). Development and validation of an
instrument to measure organizational cultures’ support of Business Process Management.
Information and Management, 51(1), 43–56.
38. Spencer, D. (2009). Card Sorting: Designing Usable Categories. Rosenfeld Media.
Rosenfeld Media.
39. Stewart, R. H. (2014). Organizational silos within NCAA division I athletic departments.
https://doi.org/10.1017/CBO9781107415324.004
40. Straub, D., Boudreau, M.-C., & Gefen, D. (2004). Validation Guidelines for IS Positivist
Research. Communications of the Association for Information Systems, 13(March).
https://doi.org/10.17705/1cais.01324
41. Trkman, P., Mertens, W., Viaene, S., & Gemmel, P. (2015). From business process
management to customer process management. Business Process Management Journal,
21(2), 250–266.
42. Wade, D., & Recardo, R. (2001). Corporate Performance Management How to Build a
Better Organization Through Measurement-Driven Strategic Alignment. Elsevier Inc.
https://doi.org/10.1016/b978-0-87719-386-9.50015-x
43. Wood, J. R., & Wood, L. E. (2008). Card Sorting: Current Practices and Beyond History
and Assumptions. Journal of Usability Studies, 4(1), 1–6.
44. Zimmermann, T. (2016). Card-sorting: From text to themes. Perspectives on Data Science
for Software Engineering, 137–141. https://doi.org/10.1016/b978-0-12-804206-9.00027-1

63rd International Scientific Conference on Economic and Social Development – "Building Resilient Society" - Zagreb, 11-12 December, 2020
389
EMPIRICAL ANALYSIS OF TOURISM IMPACT ON CROATIAN GDP
Damira Dukec
Assistant Professor at Polytechnic of Međimurje in Čakovec,
Bana Josipa Jelačića 22a, 40 000 Čakovec, Croatia
Damira Kecek
Assistant Professor at University North,
104. brigade 1, 42 000 Varaždin, Croatia
Igor Klopotan
Assistant Professor at Polytechnic of Međimurje in Čakovec,
Bana Josipa Jelačića 22a, 40 000 Čakovec, Croatia
ABSTRACT
For Croatian economy, tourism sector is recognized as an important income and employment
generator. In this paper the impact of the tourism sector on the Croatian GDP was studied by
using regression analysis. A multiple linear regression model for the period 1995 to 2017 was
developed. Variable GDP was considered as dependent variable, while gross capital formation
and gross value added for accommodation and food services were included in the model as
independent variables as well as dummy variable which represents the recession years caused
by financial crisis. Results of the conducted analysis indicate that designed multiple linear
regression model is appropriate for analysing and forecasting Croatian GDP. All predictors
are statistically significant and 99.2 % variations of GDP are explained by the changes in
predictors. The proposed multiple linear regression model could be of great benefit for
economic policy makers in developing both short term measures and long term strategies aimed
to promote economic growth.
Keywords: Tourism, Croatia, GDP, regression analysis, economic growth
1. INTRODUCTION
Tourism plays an important role in many economies and in most of them is the most important
source of income. According to Goeldner and Ritchie (2009), tourism is the world's largest
industry characterized by rapid changes driven by new technologies and increased supply of
tourist destinations. Tourism can be defined in many ways. Therefore, the United Nations
World Tourism Organization created a glossary of tourism terms according to which tourism is
defined as follows: “Tourism is a social, cultural and economic phenomenon which entails the
movement of people to countries or places outside their usual environment for personal or
business/professional purposes. These people are called visitors (which may be either tourists
or excursionists; residents or non-residents) and tourism has to do with their activities, some of
which involve tourism expenditure.” (United Nations World Tourism Organization, 2008). Due
to the favorable location and natural beauties, warm summers and moderately cold winters,
Croatia is considered an important tourist destination. Tourism is one of the most important
industry in Croatian economy and international demand for tourism in Croatia is more income
elastic compared to other Mediterranean countries (Orsini and Ostojić, 2018). For more
intensive development and stronger promotion of the competitiveness of Croatian tourism,
policy makers at all levels of government need to act to address the existing disadvantages and
enhance the quality and extent of Croatian tourism supply.

63rd International Scientific Conference on Economic and Social Development – "Building Resilient Society" - Zagreb, 11-12 December, 2020
390
The paper is organized as follows. The introduction is followed by an overview of the recent
and relevant literature of tourism importance on the growth and development of national
economies. In section 3 the research methodology and data sources are described, while the
empirical results are presented in section 4. In the conclusion final remarks are provided.
2. LITERATURE REVIEW
In the recent and relevant empirical research related to the significance of tourism for the
national economies, different economic and econometric methods have been used, including
regression models (Kuang and Tsai, 2016; Popescu and Plesoianu, 2017; Kozhokulov et al.,
2019; Manzoor et al., 2019; Ren et al., 2019), input-output models and tourism satellite account
(Munjal, 2013; Figini, 2019; Chou and Huang, 2011), computable general equilibrium models
(Pratt, 2013; Meng, 2014; Gül, 2015). In Kumar and Hussain (2014), overview and comparison
of input-output models, Keynesian models, exports base models, computable general
equilibrium models, ad hoc models and money generation model for assessment of the
economic impact of tourism on the overall economy have been presented. Analysis of the
impact and importance of tourism on Croatian economy in domestic literature is primarily based
on the regression models and input-output analysis supplemented by other scientific methods.
The review of the relevant and recent literature of tourism effects on Croatian economy is given
in the continuation. According to Baldigara and Koić (2015) international tourist flows,
especially tourists from Germany, represent a significant source of profit in Croatia. Therefore,
authors analyzed basic determinants of German tourist demand to Croatia by using polynomial
regression model. They estimated annual number of arrivals and overnight stays German tourist
in Croatia with a two second degree polynomial model. By using multiple linear regression
model, Jelušić (2017) analyzed international tourist expenditures in Croatia and domestic
tourist expenditures abroad. As the most significant variables in the proposed model gross
national product at inbound market and foreign exchange rate stand out. Šverko Grdić and
Krstinić Nižić (2017) analyzed the impact of climate change on tourism demand in Croatia.
More precisely, authors estimated the impact of rising temperatures on the number of tourists
in Croatia in the future applying regression model and exponential regression analysis. Results
of the analysis indicate that rising temperatures will have a positive impact on the number of
tourists on the coastal and mountainous in Croatia, while Zagreb will not be affected.
Relationship between tourism and climate change in coastal and continental part of Croatia was
researched in Krstinić Nižić and Šverko Grdić (2018). Results of the regression and correlation
analysis indicated strong correlation between tourism in the coastal part of Croatia and climate
parameters and less significant correlation between tourism in the continental part and climate
parameters. Considering the time period, there was a less statistically significant correlation
between tourism and climate parameters in winter than in summer. To provide better insight
how to stimulate the development of industries that promote tourism, how to extend the tourist
season and how to curb the gray economy in Croatia, Pavlić et al. (2014) developed an
economic growth model with variables tourist arrivals, real effective exchange rate,
employment, gross fixed capital formation, openness of the economy and real gross domestic
product included. Results of the study indicate long-run equilibrium relationship stability
between variables tourist arrivals, openness of the economy and real effective exchange rate
and gross domestic product and short-run causality between variables openness of the economy
and gross domestic product and between real effective exchange rate and gross domestic
product. In order to quantify economic effects of tourism to the Croatian economy, Gatti (2013)
developed computable general equilibrium model. Obtained results showed that if international
tourism demand increases than positive effect on the household welfare and moderate effects
on income distribution arise. Author also concluded that tourism, without investing in other
industries, will not contribute to significant economic development in the short term.

63rd International Scientific Conference on Economic and Social Development – "Building Resilient Society" - Zagreb, 11-12 December, 2020
391
Based on the input-output methodology, Mikulić et al. (2017) estimated direct, indirect and
induced effects of foreign tourist demand on Croatian economy in terms of output, gross value
added and employment. Authors concluded that without tourism, decline in gross value added
and employment in the observed recession period would be more intense. Effects of foreign
tourist demand were most significant for sectors accommodation and food services, retail trade,
transportation and personal services. Similar research was conducted in Ivandić and Šutalo
(2018). Based on the tourism satellite and input-output models authors estimated effect of
tourism on the creation of Croatian GDP and effects of tourism consumption on other Croatian
productive sectors. Estimated results indicate great significance of tourism sector for the
Croatian economy and positive impact of tourism consumption on sectors that are related to
tourism and on other sectors that are not specific to tourism.
3. DATA AND METHODOLOGY
Empirical part of the paper analyses the role of tourism sector in Croatian economy. The
underlying methodology is multiple linear regression. The regression equation in its general
form, given 𝑛 observations, is:
𝑌𝑡 = 𝛽0 + 𝛽1𝑋𝑡1 + 𝛽2𝑋𝑡2 + ⋯ + 𝛽𝑘 𝑋𝑡𝑘 + 휀𝑡, 𝑡 = 1, … , 𝑛 (1)
For the purpose of the research presented in this paper, following econometric model is used:
𝑌 = 𝛽0 + 𝛽1 𝐼𝑁𝑉 + 𝛽2 𝑇𝑂𝑈𝑅𝐼𝑆𝑀 + 𝛽3 𝐷𝑈𝑀𝑀𝑌 (2)
where 𝑌 is output, 𝐼𝑁𝑉 are investments, 𝑇𝑂𝑈𝑅𝐼𝑆𝑀 represents the tourism sector and 𝐷𝑈𝑀𝑀𝑌
stands for dummy variable which represents the recession years caused by financial crisis of
2008. Croatian Bureau of Statistics data are used for the model. Real GDP is used as the measure
of output, gross capital formation for investment and gross value added for accommodation and
food services for tourism. The time frame of the analysis is from 1996 to 2017. Dummy variable
is inserted for the period from 2009 to 2013. In next chapter, results of regression analysis are
discussed.
4. RESULTS AND DISCUSSION
In the Table 1 the descriptive statistics for the variables used in the model is shown. For each
variable mean values and standard deviations are calculated. Standard deviation is a measure
of dispersion of the data. Analysis of the values in the Tables 1 and 2 leads to conclusion that
the variation of the data is small. Also, the number of observations for each variable is shown.
Table 1: Descriptive statistics (output of the statistical programme SPSS)
Table 2 shows the determination coefficient R2 = 0.992 which means that 99.2 % of all GDP
variations can be explained by the variations predictors used in the model. Results of the
regression analysis indicate that there is strong positive relationship between variables used,
which is also shown by the multiple correlation coefficient R = 0.996. Also, the value of Durbin-
Watson (1.566) leads to conclusion that there is no autocorrelation of residuals.
Mean Std. Deviation N
GDP 263412.68 79592.661 22
INV 59330.59 19962.534 22
TOURISM 10211.64 4792.246 22
DUMMY 0.23 0.429 22

63rd International Scientific Conference on Economic and Social Development – "Building Resilient Society" - Zagreb, 11-12 December, 2020
392
Table 2: Model Summary (output of the statistical programme SPSS)
Model R R Square
Adjusted R
Square
Std. Error of the
Estimate Durbin-Watson
1 0.996a 0.992 0.991 7550.289 1.566
a. Predictors: (Constant), DUMMY, TOURISM, INV
b. Dependent Variable: GDP
Analysis of variance is shown in the Table 3. Table contains the F ratio, which shows the
significance of the predictors of the model. The value of the F ratio leads to the conclusion that
at least one of the predictor is significant (with a significance level of 𝛼 < 0.01).
Table 3: ANOVA (output of the statistical programme SPSS) Model Sum of Squares df Mean Square F Sig.
1 Regression 132008701137.435 3 44002900379.145 771.888 0.000b
Residual 1026123681.338 18 57006871.185
Total 133034824818.773 21
a. Dependent Variable: GDP
b. Predictors: (Constant), DUMMY, TOURISM, INV
Table 4 shows the parameters of the model. With help of 𝛽 coefficients, the equation of the
model can be specified:
𝑌 = 60683.537 + 1.554 𝐼𝑁𝑉 + 10.306 𝑇𝑂𝑈𝑅𝐼𝑆𝑀 + 23337.016 𝐷𝑈𝑀𝑀𝑌 (3)
The equation shows the impact of each predictor on GDP. For example, if the value of
investment is increased by 1 unit, GDP will increase by 1.554 units. The table contains the t-
ratios. The t-ratios show the significance of each predictor in the model. The results show that
all variables are significant. Beta coefficients can be used for analysis of significance of each
predictor in the model. Beta coefficients show how many standard deviations would GDP
change if one of the predictors changes by one standard deviation. Because all beta coefficients
are measured in standard deviations the impact of each predictor on GDP can be compared. If,
for example, investment increases by one standard deviation, GDP will increase by 0.390
standard deviations. In addition, it shows that the predictor tourism is more significant than the
predictor investment.
Table 4: Model parameters (output of the statistical programme SPSS)
Model
Unstandardized Coefficients
Standardized
Coefficients
t Sig. B Std. Error Beta
1 (Constant) 60683.537 5205.178 11.658 0.000
INV 1.554 0.126 0.390 12.371 0.000
TOURISM 10.306 0.521 0.621 19.793 0.000
DUMMY 23337.016 4069.591 0.126 5.734 0.000
Table 4 (continued) shows confidence intervals for coefficients which indicates the precision
of the evaluated model.
Table 4 (continued): Model parameters (output of the statistical programme SPSS)
Model
95,0% Confidence Interval for B
Lower Bound Upper Bound
1 (Constant) 49747,862 71619,211
INV 1,290 1,818
TOURISM 9,212 11,400
DUMMY 14787,123 31886,910

63rd International Scientific Conference on Economic and Social Development – "Building Resilient Society" - Zagreb, 11-12 December, 2020
393
The values of Tolerance and VIF (Table 5) indicate that there is no multicolinearity present in
the estimated model.
Table 5: Collinearity Statistics (output of the statistical programme SPSS)
Model
Collinearity Statistics
Tolerance VIF
1 (Constant)
INV 0.432 2.316
TOURISM 0.436 2.293
DUMMY 0.891 1.122
a. Dependent Variable: GDP
Histogram (Figure 1) shows normal distribution of regression residuals as does the Normal P –
P Plot (Figure 2).
Figure 1: Histogram (output of the statistical programme SPSS)
Figure 2: Normal P-P Plot of Regression standardized Residual (output of the statistical
programme SPSS)
On the next figures partial regression scatterplots for the independent variables are shown.
Scatterplots show the relationship between variables GDP and investment and GDP and
tourism. The scatterplot shows strong positive relationship between variables GDP and INV.
Also, there is a strong positive relationship between variables GDP and TOURISM.

63rd International Scientific Conference on Economic and Social Development – "Building Resilient Society" - Zagreb, 11-12 December, 2020
394
Figure 3: Partial Regression Plot for variable INV (output of the statistical programme SPSS)
Figure 4: Partial Regression Plot for variable TOURISM (output of the statistical programme
SPSS)
5. CONCLUSION
Tourism is an important sector in Croatian economy. It is considered as significant income and
employment generator. Tourism generates almost a fifth of GDP of Croatia. There are many
misconceptions about the impact that it has on the economy as a hole. Croatia, as a Tourism
oriented economy lacks empirical research on the subject. The research presented in this paper
is an attempt to overcome this gap. There are several ways to empirical analysis of the
determinants of GDP growth of a certain economy. Among these, growth regressions are
considered as a useful tool to approach the problem. In this paper regression analysis was
applied to analyze the impact of the tourism sector on the Croatian GDP. Multiple linear
regression model was developed, with GDP as dependent variable and gross capital formation,
gross value added and dummy variable representing the recession years as independent
variables. Results of the regression analysis indicate that designed multiple linear regression
model is appropriate for analyzing and forecasting GDP in Croatia. The estimated model shows
no autocorrelation of residuals and also no multicolinearity between predictors. The residuals
are normally distributed. All independent variables included in the model are statistically
significant. Coefficient of determination has the estimated value of 0.992 meaning that 99.2 %
variations of GDP are explained by the changes in predictors. The proposed model could be
useful for economic policy makers for promotion and strengthening of tourism potential in
Croatia. In addition to the model developed in this paper the authors suggest the development
of more complex models that would help gain deeper understanding and insight into the role of
Tourism in fostering economic growth of Croatia.

63rd International Scientific Conference on Economic and Social Development – "Building Resilient Society" - Zagreb, 11-12 December, 2020
395
LITERATURE:
1. Baldigara, T. and Koić, M. (2015). Modelling the international tourism demand in Croatia
using a polynomial regression analysis. Turističko poslovanje, 15, (p. 29-38).
2. Chou, C-E. and Huang, Y-C. (2011). Accurately Estimate Tourism Impacts: Tourism
Satellite Account and Input-Output Analysis. Travel and Tourism Research Association:
Advancing Tourism Research Globally, 36.
3. Figini, P. (2019). The economic impact of tourism in the European Union. Final report,
CAST-Centre for Advanced Studies in Tourism.
4. Gatti, P. (2013). Tourism, welfare and income distribution: The case of Croatia. Tourism,
61(1), (p. 53-71).
5. Goeldner, C. R. and Ritchie, J. R. B. (2009). Tourism: Principles, Practices, Philosophies.
John Wiley & Sons, Inc., Hoboken, New Jersey.
6. Gül, H. (2015). Effects of foreign demand increase in the tourism industry: a CGE approach
to Turkey. An International Journal of Tourism and Hospitality Research, 26, (p. 598-611).
7. Ivandić, N. and Šutalo, I. (2018). The contribution of tourism to the Croatian economy: an
IO apparoach. Ekonomski pregled, 69(1), (p. 20-42).
8. Jelušić, A. (2017). Modelling tourist consumption to achieve economic growth and external
balance: case of Croatia. Tourism and Hospitality Management, 23(1), (p. 87-104).
9. Kozhokulov et al. (2019). Assessment of Tourism Impact on the Socio-Economic Spheres
of the Issyk-Kul Region (Kyrgyzstan). Sustainability, 11(14), 3886.
10. Krstinić Nižić, M. and Šverko Grdić, Z. (2018). Winter Tourism in Croatia: Is It Possible?
Sustainability, 10, 3563.
11. Kuang, T. and Tsai, Y-F. (2016). The effect of tourism growth on economic growth: A
quantile regression analysis. Travel and Tourism Research Association: Advancing
Tourism Research Globally, 37.
12. Kumar, J. and Hussain, K. (2014), Evaluating tourism’s economic effects: Comparison of
different approaches. Procedia - Social and Behavioral Sciences, 144, (p. 360-365).
13. Manzoor et al. (2019). The Contribution of Sustainable Tourism to Economic Growth and
Employment in Pakistan. Int J Environ Res Public Healt, 16(19), 3785.
14. Meng, S. (2014). The role of inbound tourism in the singaporean economy: a computable
general equilibrium (cge) assessment. Journal of Travel & Tourism Marketing, 31, (p.
1071-1089).
15. Mikulić, D., Keček, D. and Žajdela Hrustek, N. (2017). Overall contribution of the foreign
tourist demand on Croatian economy. ToSEE – Tourism in Southern and Eastern Europe,
4, (p. 393-407).
16. Munjal, P. (2013). Measuring the Economic Impact of the Tourism Industry in India Using
the Tourism Satellite Account and Input-Output Analysis. Tourism Economics, 19(6), (p.
1345-1359).
17. Orsini, K. and Ostojić, V. (2018). Croatia’s Tourism Industry: Beyond the Sun and Sea.
European Economy Economic Brief, 036. Luxembourg: Publications Office of the
European Union.
18. Pavlić, I., Svilokos, T. and Suman Tolić, M. (2014). Tourism, Real Effective Exchange Rate
and Economic Growth: Empirical Evidence for Croatia. International Journal of Tourism
Research, 17, (p. 282-291).
19. Popescu, A. and Plesoianu, D. (2017). An Econometric Analysis between Tourism Income
and Romania’s GDP. In: 30th IBIMA Conference, Madrid, Spain.
20. Pratt, S. (2013). Estimating Tourism Impacts using CGE Models: A Historical Review and
Future Developments. Handbook of Tourism Economics: Analysis, new applications and
case studies. World Scientific Pub Co Inc.

63rd International Scientific Conference on Economic and Social Development – "Building Resilient Society" - Zagreb, 11-12 December, 2020
396
21. Ren et al. (2019). The Impact of Tourism Quality on Economic Development and
Environment: Evidence from Mediterranean Countries. Sustainability, 11, 2296.
22. Šverko Grdić, Z. and Krstinić Nižić, M. (2017). Development of tourist demand in
correlation with climate change in the Rrepublic of Croatia. Ekonomski pregled, 67(1), (p.
27-43).
23. United Nations World Tourism Organization. (2008). GLOSSARY OF TOURISM
TERMS. Retrieved 20.01.2020. from https://www.unwto.org/glossary-tourism-terms.
24. Croatian Bureau of Statistics (2019). First Release: Annual Gross Domestic Product, 1995
– 2017, Revised Data. Retrieved 20.01.2020. from www.dzs.hr

63rd International Scientific Conference on Economic and Social Development – "Building Resilient Society" - Zagreb, 11-12 December, 2020
397
MARITIME TOURISM IN THE TIME OF COVID-19 PANDEMIC IN
THE BALTIC SEA REGION – CHALLENGES FOR FERRY AND
CRUISE OPERATORS
Ilona Urbanyi-Popiolek
Gdynia Maritime University, Poland
ABSTRACT
Maritime tourism has been growing in Baltic Sea Region for last decades. The sector comprises
two segments, ferry shipping and cruise operation. In 2019 more than 49 million passengers
were transported by ferries in prime international and domestic services. Cruise sector
reported 5,90 million passengers visited Baltic ports on board cruise vessels. In previous
decades changes in external factors determining operations in maritime tourism were to a
certain extent predictable. COVID-19 epidemic started unexpectedly and created new
challenges for companies involved in both sectors. The latter factor suddenly hit the cruise and
ferry businesses. The purpose of the paper is to research into the operations in the time of
pandemic and evaluate the activities of the operators to reduce the negative effects in turnover
decline. The paper begins with introduction (Section 1) and theoretical background of maritime
tourism (Section 2). The main body comprises presentation of the Baltic ferry and cruise
operations, as well as discussed the management of operations in time of pandemic. The
methods used in this study are the analyses of literature, analyses of original data and in-depth
interviews.
Keywords: Maritime tourism, Baltic Sea Region, Management, Ferry and cruise business,
Pandemia, COVID-19
1. INTRODUCTION
Maritime tourism includes sea voyages by various kinds of ships to tourist destinations. The
main sectors are cruise and ferry shipping. The cruise industry has shown dynamic growth for
last twenty five years. Total demand for cruising grew from 4.5 million passengers in 1995 to
9.91 million in 2001 (Miotke-Dzięgiel, 2002) and more than doubled in next decade to 20,6
million in 2011 (The Cruise Industry, 2012). The global number of cruise passengers in 2019
increased to 30 million (Shippax Market 20, 2020). The main regions of cruising are: the North
America with sub-markets: the Caribbean, the Bahamas, the west and east coasts of North
America, the European market with Mediterranean and Baltic prime submarkets, the Asian and
Pacific markets. The Caribbean is the biggest destination with the market share of about 35,4%
of cruise travellers in 2019. Due to climate and tourist conditions the region is a year round
operation. The second leading region is Europe. The share of Mediterranean amounted to 15,8
% and the region has become a year round destination due to climate and culture. The other sub
market where cruising is developed is Northern Europe with 11,3 % share in 2019 (Shippax
Market 20, 2020). The second segment of maritime tourism concerns ferry industry. The
distinctive feature of this type of shipping is transport of passengers and cargo by one ship using
ro-ro technology for loading and discharging wheeled units and private cars. In 2019 around
2226,3 million passengers were carried by ferries all over the world. Main regions of ferry
operation are Mediterranean with 486 million passengers in 2019, North Europe - 376 million
passengers, America – 305 million and South East Asia – 992 million (Shippax Market 20,
2020). It should be emphasized that in such destinations as America, Asia or Pacific ferries are
used as means of transport only. Maritime tourism based on ferry shipping is strongly developed
in Europe, particularly in Baltic Sea Region, North Sea, and English Channel as well as in
Mediterranean.

63rd International Scientific Conference on Economic and Social Development – "Building Resilient Society" - Zagreb, 11-12 December, 2020
398
In last two decades the maritime travelling has become the fastest growing sector of tourism
industry. Key determinats traffic of developments result from economic, social and political
factors. Economic factors are connected with incomes. Demand for tourists travel is generated
by relatively high earnings. In general an economic activity and growing incomes create the
effective demand. Social factors arise from the increase in free time, fatigue of city life and
work, longer life expectancy. Cruising and sea voyages are perceived as a way for spending
time and exploration of interesting places. Stabilization of the political situation in cruise and
ferry destinations is another opportunity for maritime tourism (Urbanyi-Popiołek, 2014).
2. THEORETICAL BACKGROUND OF MARITIME TOURISM
Cruising is a shipping dedicated for pleasure and exploration voyages. The cruise ship can be
defined as a vessel regularly used for cruise activities and the trip lasts longer than one day.
Furthermore the ship is not used in ordinary liner shipping for transport passengers between
two or more ports ([Market:12], 2012). The organization Cruise Europe defines cruising as "a
voyage of at least 60 hours by a seagoing vessel, mainly for pleasure. No cargo/rolling stock
will be transported but only passengers with tickets that should include accommodation and all
meals. The cruise voyage must include at least two visiting ports apart from the starting and
ending port" (Kizielewicz, 2013). Cruise shipping is recognized as one of the prime leisure
segments in contemporary tourist products. Kizielewicz states that trips on cruise ships are
considered to be the crown segment of the maritime tourism market (Kizielewicz, 2013).
Stapford emphasises the difference between cruise ships and other merchant ships. It is the only
segment that "deals directly with consumers and its competitors are not other shipping
companies but other holiday providers (Stapford, 2009). The cruise industry is one of the fastest
growing maritime businesses (Esteve-Peres & Garcia-Sanchez, 2017) as well as tourist
segments. The advantage of cruise tourism is characterised by mass-industrialisation in leisure
activities (Dragovic, Skuric & Kofjac, 2014). Most of the studies concerning cruise industry
concentrate either on factors attracting cruise passengers from the perspective of ports of calls
or on studying geographical destinations and sub-markets (e.g. Castillo-Manzano, Fageda &
Gonzalez-Laxe, 2014, Studzieniecki & Wanagos, 2017, Brida, Pulina, & Riano, 2013, Sun,
Fenga & Gauri, 2014, Dragovic, Skuric & Kofjac, 2014). Some papers investigate the
cooperation and integration of cruise ports (Wang, Pallis & Notteboom, 2015, Kizielewicz,
2016) as well as integration in the cruise supply chain (Wang & Zeng, 2017). The cruise
shipping is considered as a unique tourist product as it comprises three basic elements including
transport, onboard services and leisure as well as land exploration of attractive tourist places
(Esteve-Perez & Garcia Sanches, 2015). Ferry operation is defined as a type of liner shipping
where passengers and cargo form one market. Ferries ply the regular routes, usually between
two or three ports according to schedules. (Urbanyi -Popiołek, 2009). Kotowska states that the
ferries transport two segments passengers and cargo (Kotowska, 2014), while Stapford points
out that ferries transport people, goods and vehicles over short distances by sea (Stapford,
2009). Passenger traffic is usually analysed in terms of tourism functions of ferry shipping
(Wild & Dearing, 2000, Kizielewicz & Urbanyi-Popiołek, 2015). Pantouvakis states that ferry
passengers form satisfaction perceptions on the basis of their evaluation of four primary
dimensions: service quality, price, convenience and availability (Pantouvakis, 2007). Detailed
research on market segmentation has been carried out by Kizielewicz and et al. The authors
analysed the generic structure of the tourist demand for ferry travel in terms of demographic
variables and purchasing behaviour of passengers on-board ferries (Kizielewicz and et al.,
2017). The passenger demand is created by people travelling in different purposes, e.g. visit
chosen destination in connection with various needs, package trips, shopping, business.

63rd International Scientific Conference on Economic and Social Development – "Building Resilient Society" - Zagreb, 11-12 December, 2020
399
The ferry travellers are divided into categories (Urbanyi-Popiołek, 2018):
• liner passengers – travellers taking a trip in various reasons (visit an interesting destination,
participation in culture or sport event, visit relatives etc.), ferry crossing is only a part of
whole trip,
• cruise passengers – travellers participating in package trips of diverse nature, e.g. round
trips for pleasure, trips with short stay in port of destination etc.,
• conference passengers – participants in conferences and seminars organized on-board
within liner trips,
• shopping passengers – people who travel to purchase commodities on-board or in port of
destination,
• business passengers – passengers travelling in connection with their professional activities,
in this category lorry drivers are included.
The presented selection is based on the prime factor generating the demand. In practice,
assigning the travellers to given category is not clear because passengers travelling e.g. as
conference participants also do some shopping and enjoy entertainment. The assignment of a
traveller to a given segment results from the main transport need (Urbanyi-Popiołek, 2018)
The presented marine tourism segments differ in terms of organization of trips and demand-
driven factors. In cruise shipping the aims of trips are leisure, exploration and on-board
entertainment. The ferry passengers apart from former, travel for more wider purposes. Ferries
service fixed links between two or three ports of calls and ply the routes according to schedules
and mini cruises are provided within scheduled services whereas cruise shipping comprises
voyages including several destinations and ports, trips last - up to one, two weeks or even
longer. The other feature is origin of passengers. Ferry business is based primarily on Baltic
Sea Region residents while cruise shipping passengers are mainly outside quests with origin
from west and partly south European countries and Americans, Canadians and travellers from
Asia, mainly from China and Japan.
3. METHODOLOGY
The paper focuses on the Baltic Sea maritime tourism. Ferry industry as well as cruise shipping
are important sectors of international tourism in the region. Baltic cruises are distinguished from
other markets by the aim of trips, attractiveness of the itineraries and shore programmes.
Moreover both types of cruises differ in terms of voyage organisation, programmes, as well
as structure and determinants creating the tourism demand. The study focuses on the impact of
COVID-19 on cruise business in Baltic Sea Region and concerns the activities of ferry and
cruise operators in the time of pandemic. The purpose of the paper is to analyse the challenges
faced by the ferry and cruise operators and what operational solutions were implemented by
them to minimize the negative effects after stopping the passenger traffic. The cargo turover of
ferry shipping is beyond the scope of the study. The research questions are formulated as
follows:
• How did the pandemic affect the activity of ferry and cruise industry in the Baltic Sea
Region?
• What actions were undertaken by operators to reduce the negative effects of COVID-19
pandemic?
The research methods were the analysis of literature concerning ferry and cruise industry,
analysis of statistics and interviews. The data were collected primarily from the ShipPax
Information, known publisher and provider of consulting services for ferry and cruise industry,
as well as from interim half year reports of selected operators and cruise organisations. In-depth
interviews were conducted with chosen operators` representatives on -line.

63rd International Scientific Conference on Economic and Social Development – "Building Resilient Society" - Zagreb, 11-12 December, 2020
400
4. FERRY AND CRUISE INDUSTRY IN THE BALTIC SEA
4.1. Ferry activities in the Baltic Sea Region
Baltic Sea constitutes one of leading ferry market. In 2019 275,054 million passengers and
105,6 million private cars were transported in the region. The numbers include the whole
turnover with short routes between islands and mainland. On international and main domestic
Danish and Swedish ferry lines (e.g. Bornholm and Gotland) important for tourism, around 49
million passengers and 9 million cars were carried (ShippaxMarket 20, 2020). The activity of
the business is all year round. Ferry industry in the Baltic Sea concentrates in three prime ferry
areas (Urbanyi-Popiołek, 2018, ShippaxMarket 20, 2020):
• West Baltic - includes routes from Denmark to Sweden, Norway and Germany, services
from Sweden to Norway and Germany and Germany – Norway connection; the west market
accounts for 50% in passenger and 62% in freight traffic,
• East Baltic - covers services from Sweden to Finland, Estonia and Latvia, from Estonia
to Finland and Russia; the east market accounts to 44% of passenger and about 19% of
freight turnover,
• South Baltic/ Central Baltic - comprises lines between Sweden and Poland, as well as from
Sweden to Lithuania and the connections between Germany and Lithuania, Latvia and
Finland; the central market constitutes the 6% of passenger transport and about 19% of
freight.
These markets differ in terms of the demand for transport services and the functions performed
by the ferry lines. In west and south Baltic cargo turnover dominates. Both markets accounts
for 81% of ferry loads in region. Most services are cargo oriented routes. An exceptions are
lines from Norway to Sweden Denmark and Germany where passenger traffic dominates due
to tax-free sales and cruise trips offers. The Eastern Baltic Sea is characterized by the highest
concentration of ferry tourism. The situation results from several reasons. For many decades
the Swedes and Finns have undertaken ferry trips due to the possibility of making purchases in
the duty-free ferry shops. Tax-free shopping is still preserved in this area for lines connecting
Sweden with Finland and Estonia and calling at ports in the Aland Islands. Moreover, the
purpose of the journey undertaken by the Scandinavians is the journey itself and the attractions
on the ferry as well as shopping, not only in ferry shops, but also in Estonia and Latvia due to
lower prices. The ferry conference market is highly developed in Nordic countries due to on-
board attractions. Similar demand is observed on services from Norway to European Union
countries, where duty - free sales prevail in motivations of trips. Baltic ferry business is
concentrated. According to Shippax data, in January 2020, 16 major carriers operated on the
main international and domestic markets. In terms of transport capacity and market share in
passenger sector the leaders are Tallink Group, Viking Line, Color Line, Stena Line, DFDS
Seaways and Fjord Line. The network of ferry connections included 60 services with 116 active
ferries of different types - ro-pax, cruise-roro and high-speed.
4.2. Cruise activities in the Baltic Sea Region
The number of cruise passengers visiting the BSR amounted to 5,90 million in 2019 and the
total number increased by 9,1% y/y, while the number of calls amounted to 2 768 and grew by
3%. This is a highest number ever achieved (Cruise Baltic, 2020). Baltic cruise market is
seasonal. Due to climate the cruise operations in Baltic last about five months – from May to
September. However during three past years the increase in the season has been visible.
Moreover some cruises are offered in off-season time, e.g. occasional trips in Christmas and
New Year time. Prime destinations are capitals such as Copenhagen, Stockholm, Helsinki,
Tallinn as well as attractive tourists resorts like St. Petersburg, Gdansk, Gdynia, Rostock or
smaller destinations – Turku, Visby, Kalmar, Wismar or Roenne.

63rd International Scientific Conference on Economic and Social Development – "Building Resilient Society" - Zagreb, 11-12 December, 2020
401
Most Baltic ports are typical ports of calls, where ships visit the chosen destinations during
cruises, e.g. St. Petersburg, Klaipeda, Riga, Gdansk, Gdynia, Mariehamn, Visby, Arendal. The
others, like Copenhagen, Kiel, Rostock and partly Helsinki and Stockholm – apart from being
ports of call – are also turnaround ports, where passengers embark and disembark. Most Baltic
cruises last 7 - 10 days and include 5-6 ports of call. According to Cruise Baltic, Baltic cruise
ports can be classified by the number of calls as small, medium, large and extra-large. The latter
are Copenhagen with 348 calls and 940 thousand passengers, St. Petersburg – 341 calls and
649 thousand visitors, Stockholm – 279 calls and 619 thousand passengers, Helsinki – 303
and 520 thousand travellers and Tallinn – 338 calls and 635 thousand passengers (Cruise Baltic,
2020). The majority of carriers operated medium-sized ships up to 1000-2500 passengers which
is typical for Baltic cruises. The next segments comprises ships carrying over 2000 visitors and
less than 1000 respectively. However during last 5 years the growing number of large cruise
ships as well as small cruisers is observed in Baltic cruise operations and the share of former
segment dropped to 40% last year. The prime cruise operators are Aida Cruises, Costa Crociere,
MSC Crociere, Princess Cruices, as well as P&O Cruices, Tui Cruises, Norwegian Cruise Line
among others. Each company operates in season from one to four ships, offering various cruises
in term of destinations duration, port stay and programme. In off-Baltic season, the ships
operate in dfferent areas, particularly in Caribbean and Mediterranean.
5. MANAGEMENT OF CRUISE BUSSINES OPERATION IN COVID 19 TIME
5.1. Ferry sector
The COVID-19 pandemic has caused great disruption to maritime tourism in the Baltic Sea
Region. Both cruise and ferry businesses were affected by the new situation. However the
former was hit more strongly as ferry ships transport cargo as well.
In the beginning of March 2020 all countries in Baltic Sea Region had taken far-reaching
measures which had directly influenced the maritime tourism. Nearly all Baltic states closed
the borders and introduced entry restrictions. Furthermore the countries were placed in
lockdown. The new situation has strongly affected the sector, however the negative impact on
both segments differs in longer time. The ferry companies were forced to undertake actions to
minimalize the effects of coronavirus crisis. The measures were as follows:
• temporarily suspension of services, laid – up of ferries and reduction sailings,
• restart of services in the bigging of June and operate according to pandemic requirements,
• seasonal destinations introduced by some companies,
• focus on cargo segment,
• reduction of the employment.
In first months of pandemic, the passenger traffic was stopped, only residents and persons going
in business purposes were able to travel. They use ferries still active on some routes as air traffic
was closed. All mini trips and mini holidays were cancelled. The majority of passenger –
oriented ferry links were suspended and the cruise ferries were laid-up. Ferry links from Sweden
to Finland, Estonia and Latvia were ceased, as these countries closed the borders and
introduced restrictions in travelling. Helsinki – Stockholm operated both by Tallink – Silja and
Viking Line, as well as Tallinn – Stockholm and Riga – Stockholm operated by Tallink are the
examples. Seven of the thirteen Tallink ships were temporarily sidelined in Tallinn, Helsinki,
Stockholm and Riga. Likewise four Viking Line ferries from seven were laid up from mid-
March to early June. The rest of fleet operated as cargo ships. Alike Norway was one of the
first countries in the region to close its borders. As a result the international services operated
by Color Line, Fiord Line, DFDS Seaways and Stena Line to Sweden, Denmark and Germany
were temporarily discontinued, e.g. Sandefjord – Stromstad, Oslo – Kiel, Oslo – Copenhagen.
All cruise ferries were sidelined in Norwegian and Danish ferry terminals.

63rd International Scientific Conference on Economic and Social Development – "Building Resilient Society" - Zagreb, 11-12 December, 2020
402
Moreover a number of services were ceased permanently, e.g. passenger link between
Norwegian capitol Oslo and Frederikshaven in Denmark as well as service between Trelleborg
in Sweden and Sassnitz in Germany. From the mid-June the Baltic states began to lift the
travel restrictions, the passenger- oriented ferry services were gradually restarted. Among
others were Oslo – Kiel operated by Color Line or Copenhagen – Oslo serviced by DFDS
Seaways. Moreover DFDS included call to Frederikshaven on the latter route. The Sandeford
– Stromstad route remained suspended as the latter Sweden port was located in red zone. Tallink
made the largest reorganisation of its network, as well as offered new summer cruise
destinations. The first was the Helsinki – Riga route operated every second day by cruise ro-
pax Silja Serenade, normally plying Helsinki – Stockholm service. The Stockholm – Visby
route was the other new summer destination. The cruises we rounded via Marienhamn, which
enables tax – free sales on board and were dedicated to Swedes. The other ferry cruises were
offered on Tallinn – Helsinki - Marienhamn route and Tallinn – Turku with short call at
Langnas at Aland Island for tax – free sales. Similar network for summer season offered Viking
Line. The iconic Helsinki – Stockholm link was suspended during summer season due to further
travel restrictions and Stockholm still being the red zone. According to the rules, travel of
Swedish citizens to Finland has been restricted. In addition to work-related or other essential
travel, entry was allowed e.g. for persons who own a property or residence, however persons
arriving from Sweden were encouraged to spend 14 days in conditions corresponding to
quarantine. In autumn seasonal routes were ceased. The increasing number of COVID-19 cases
across Europe resulted in decrease of demand for trips again. The governments recommended
people to avoid any unnecessary travel and imposed new travel restrictions. The falling
passenger numbers also results from psychological determinants – passengers fear virus
infection. As a consequence the companies again reduced number of sailings or discontinued
the tours and sidelined some ships, e.g. Viking Line has decided to cancel all 20-hour cruises
with the Viking Cinderella from 16 November 2020 until 3 February 2021. Moreover Tallink
will suspend the operation on the Tallinn-Stockholm-Riga-Stockholm-Tallinn loop and the
Tallinn-Helsinki route from 1 January 2021. The company’s decision comes as the operation
of the vessels between Estonia, Sweden and Latvia has become financially unfeasible in the
current pandemic situation and due to tightening travel restrictions once again in Estonia,
Finland, Sweden and Latvia, making passenger numbers plummet.
Table 1: Ferry turnover of selected operators in 2019 – 2020
Operator H1 2020 H1 2019 Q3 2020 Q3 2019
Tallink Group 1 988 212 4 507 615 1 314 301 2 974 790
Color Line * 621 781 1 634 408
DFDS * 342 607 428 255
Viking Line 998 483 2 772 427 643 369 2 125 254
*data for Q3 not reported
(Source: own elaboration based on: DFDS Q2 2020 Interim Report – DFDS; Interim Report
Q2 2020, Tallink Grupp AS; Interim Report Q3 2020, Tallink Grupp AS; Half-year Financial
Report Viking Line, 2020; Viking Line Business Review January–September 2020; Color
Line Interim Report 2020)
The decrease in traffic resulted in decline in revenues. Tallink reported 3.4% fall in incomes
in the Q1 from route operation and drop by 75% in Q2 compared to the same periods in 2019.
The biggest contributors to the overall revenue fall were the 82% drop in shop and restaurant
sales, 81% drop in tickets sales (Q2 Tallink, 2020). During the Q3, the group’s ticket revenue
decreased by 58.6%, onboard sales by 50.6%, cargo revenue by 21.5% and hotel
accommodation revenue by 73.2% compared to the same period in 2019 (Q3 Tallink, 2020).

63rd International Scientific Conference on Economic and Social Development – "Building Resilient Society" - Zagreb, 11-12 December, 2020
403
Viking Line results show similar decrease. Passenger-related revenue decreased respectively
by 89% during the second quarter and by 67% in third compared with 2019. (Viking Line,
2020). The other passenger - oriented carries were affected alike. The COVID-19 pandemic
affected the employment in ferry industry. Some operators were forced to reduce the staff, e.g.
Norwegian Color Line laid off temporarily 2000 people with an economic stimulus package to
secure salaries while Tallink reduced workload and remuneration of Estonian and Latvian
personnel to 70% for two months, Sweden staff to 40-50%, and Finish were on unpaid leave,
except the staff on duty on vessels. The reduction of the employment on board and ashore made
it possible to cut costs in the most affected weeks from mid-March till June. It is estimated that
the crew costs of cruise ferries have a 20-25% share in operating costs of the vessels. The
actions resulted in average 15 % decline of operating costs, depending of the carrier. Lower
operating cost savings come from the need to maintain the skeleton crew on sidelined ferries.
5.2. Cruise sector
Cruise shipping has been affected more deeply than ferry business. This sector in early spring
is usually non-active in the Baltic Sea and the ships are employed in other destinations. The
restrictions in travelling, sealed borders meant that the cruise carriers did not start operating in
the region. As was stated, many Baltic countries have introduced quarantine. Consequently, the
entry of cruise ships into ports such as St. Petersburg, Tallinn, Helsinki, Stockholm or
Copenhagen became impossible. Americans, Japanese and Chinese taking part in sea voyages
in the Baltic come to Europe as part of fly cruises. Air traffic stopped in spring and uncertain
perspectives in pandemic situation resulted in booking cancellation. Likewise, Europeans
cancelled their cruises after cases of the COVID-19 disease were reported on several cruise
vessels. In late summer a few lines restarted the operation. Only three operators were active in
Baltic region. All of them are German based and offered cruises only for Europeans. Aida
Cruises made several 4 days trips with three ships ( AIDAperla, AIDAmar and AIDAblu)
dedicated for Germans only without disembarking. The cruises took place with an adjusted
passenger capacity and without calling at other ports. Another was Hapag Lloyd brand with
two ships (Europa and Europa2) visiting German, Danish, Swedish and Polish ports. The
passenger capacity are 400 of the former vessel and 516 of the latter. The pandemic
requirements lower the number of travellers to 60 and 80 respectively. The third one was Mein
Schiff operated two ships offering “ blue cruises ” without shore excursions. The other ships
were laid up for whole season.
6. CONCLUSION
The COVID-19 pandemic deeply affected the maritime tourism in the Baltic Sea Region. The
sector was strongly hit by the crisis resulting from the travelling restrictions introduced by the
states. Both sectors were affected, however the cruise industry more deeply. The carriers has
undertaken several activities to adapt to the new market conditions. Ferry operators oriented on
passenger transport and on-board services laid up the vessels and temporarily suspended the
operation. Only ro-paxes with greater cargo capacity were in service and operate as cargo ships.
In the late spring some services were restarted and in summer months new destinations were
offered to safe the peak season and improve the incomes. The seasonal destinations were
suspended in September. Moreover the ferry business was supported by state aid. The ferry
connections between Finland and Sweden, as well as between Finland and Estonia are regarded
as prime elements in supply chains of essential products, as food, medicines etc. and ferry
companies were granted by the states to maintain a number of ships in service to carry freight.
Freight oriented services lost passenger incomes however the cargo transportation segment was
affected less. Cruise sector discontinue operation and only a few ships have made voyages in
the Baltic Sea under the sanitary regime during season.

63rd International Scientific Conference on Economic and Social Development – "Building Resilient Society" - Zagreb, 11-12 December, 2020
404
Suspension of cruise activity concern all destination in the world according to travel restriction,
closed borders and ceased air flights making impossible tourist to get to embarking ports. The
trips were cancelled and ships sidelines, some of vessels were sent was for demolition. The
COVID-19 crisis has damaged the maritime tourism, particularly cruise industry. It is
impossible to predict further activity in both sectors. Global economy is expected to go into
recession. This will definitely weaken the demand for trips. Maritime tourism may experience
a retreat as smaller number of people will travel, particularly on large cruise ships. For both
segment of maritime tourism particularly for cruise lines, customer behaviour as well as
economic activity are the key elements for the companies to operate in the post COVID-19
time.
LITERATURE:
1. Brida, J. G., Pulina, M., Riaño, E., Aguirre, S. (2013), Cruise passengers in a homeport: A
market analysis. In Tourism Geographies., vol.15, no. 1, pp. 68-87.
2. Castillo-Monzano, J.I., Fageda, X., Gonzales, F. (2014). An analysys of the determinants
of cruise traffic : An empirical application to the Spanish port system. In Transportation
Research Part E. vol. 66, pp.115-125.
3. Color Line Interim Report 2020. (2020). Oslo: Color Line A.S. pdf. Retrieved 9.10.2020
from https://www.colorline.no/polopoly.
4. Cruise Baltic Market Review 2020. (2020). Copenhagen: Cruise Baltic. Retrieved
10.10.2020 from https://www.cruisebaltic.com/modularpages/reports.
5. Dragovic, B., Skuric, M., Kofjac D. (2014). A proposed simulation –based operational
policy for cruise ships in the port of Kotor. In Maritime Policy & Management. vol. 41,
no. 6, pp.560.
6. Esteve-Perez, J., Garcia-Sanchez A. (2015). Cruise market: Stakeholders and the role of
ports and tourists hinterland. In Maritime Economis & Logistics. vol. 17, no. 3, pp. 371-
388.
7. Esteve-Perez, J., Garcia-Sanchez, A. (2017). Characteristics and consequences of the
cruise traffic seasonality on ports: the Spanish Mediterranean case. In Maritime Policy &
Management. vol. 44. no. 3-4., p.358-372.
8. DFDS Q2 2020 Interim Report. (2020)., Copenhagen: DFDS Seaways. pdf. Retrieved
10.9.2020 from https://www.dfds.com/en/about.
9. Interim Report Q2 2020. (2020). Tallinn: Tallink Group AS. Pdf. Retrieved 7.08.2020 from
https://www.tallink.com/investors/for-investors.
10. Interim Report Q3 2020. (2020). Tallinn: Tallink Group AS. Pdf. Retrieved 20.11.2020
from https://www.tallink.com/investors/for-investors.
11. Half-year Financial Report Viking Line. (2020). Marienhamn: Viking Line. pdf. Retrieved
10.11.2020 from https://www.vikingline.com/investors/
12. Kizielewicz, J.(2016). Regional Experiences in the management of cruise ships ports in
costal destinations. In Proceedings of the 12thEuropean Conference on management,
leadership and governance ( ECMLG 2016), Book Series: Proceedings of the Conference
on European Management Leadership and Governance [online]. Romania, pp. 125-132.
Retrieved 10.11.2020 from https://azdoc.site/proceedings-of-the-12-th-european-
conference-on-management-l.html.
13. Kizielewicz, J. (2013). Cruise ship tourism – a case study Poland. In Scientific Journals
Maritime University of Szczecin. vol.35, no.107, pp. 65-75.
14. Kizielewicz, J., Urbanyi-Popiołek, I. (2015). Rynek usług morskiej żeglugi wycieczkowej.
Warszawa: PWN. (in Polish).

63rd International Scientific Conference on Economic and Social Development – "Building Resilient Society" - Zagreb, 11-12 December, 2020
405
15. Kizielewicz, J., Haahti, A., Luković. T., Gracan. D. (2017). The segmentation of the
demand for ferry travel – a case study of Stena Line. In Economic Research- Ekonomska
Istrazivanja, vo.30, no 1. pp. 1003–1020. Retrieved 10.09.2020 from
https://www.researchgate.net/
16. Kotowska, I. (2014). Żegluga morska bliskiego zasięgu w świetle idei zrównoważonego
rozwoju transportu. Szczecin: WNAM. (in Polish).
17. [Market:12] Statistics Market report & outlook for ferry, cruise, ro-ro and hi-speed
shipping. (2012). Halmstad: Shippax Information.
18. Miotke-Dzięgiel, J. (2002). Maritime Tourism. Gdańsk: WUG.(in Polish).
19. Pantouvakis, A.M. (2007). Who pays the ferryman? An analysis of the ferry passenger's
selection dilemma. In Maritime Policy & Management. vol.34. no.6. pp. 591-612.
20. Shippax Market 20. The 2019 Ferry, Cruise, Ro-Ro and High-Speed Year in Review with
Analyses and Statistics. (2020). Halmstad: Shippax.
21. Stapford M. (2009). Maritime economics. London-New York: Routledge Taylor & Francis
Group.
22. Studzieniecki, T., Wanagos, M. (2017). The tourism attractiveness of the Baltic Sea Region
as a destination for Polish tourists. In Proceedings of the 20th International Colloquium
on Regional Sciences 2017. Kurdejov: Masaryk University, Faculty of Economics and
Administration, 2017, pp. 640-645.
23. Sun, X., Fenga, X., Gauri, D. K. (2014). The cruise industry in China: Efforts, progress and
challenges. In International Journal of Hospitality Management. vol. 42, pp. 71-84.
24. Urbanyi-Popiołek, I. (2018). Challenges for Polish ferry market development in Baltic Sea
Region. SHS Web of Conferences 58, 01030. GLOBMAR 2018. Retrieved 12.09.2020 from
https://www.researchgate.net/.
25. Urbanyi‐Popiołek I. (2009). Ferry shipping in motorways of the sea concept – The Baltic
Sea case. In Maritime Transport IV, Ricardo Rodriguez‐Martos Dauer, Ricard Mari
Sagarra, Francese Xavier Martinem de Osés, Universitat Politecnica de Catalunya,
Barcelona pp. 657‐672.
26. Urbanyi-Popiołek I. (2014). Cruise industry in the City of Gdynia, the implications for
sustainable logistic services and spatial development. 1st International Conference Green
Cities 2014 – Green Logistics for Greener Cities. In Procedia Social and Behavioral
Science. vol. 151. pp. 342 – 350
27. Viking Line Business Review January–September 2020 (2020), Marienhamn, Viking Line.
pdf. Retrieved 15.11.2020 from https://www.vikingline.com/investors/.
28. Wang, G., Pallis, A., Notteboom, T. (2015). Cooperation and vertical integration in cruise
ports. In Paper presented at the International Association of Maritime Economists Annual
Conference (IAME). Kuala Lumpur, 2015. [cit.2018-01-12]. Retrieved 11.01.2020 from
https://www.mar-economists.org/.
29. Wang, G., Zeng, Q. ( 2017). A Vertical Integration Pricing Model on a Cruise Supply
Chain. In Paper presented at the International Association of Maritime Economists Annual
Conference (IAME). Kyoto, June 2017. . Retrieved 12.09.2020 from https://www.mar-
economists.org/.
30. Wild, P., Dearing. J. (2000) Development of and prospects for cruising in Europe, In
Maritime Policy & Management. vol. 27. no. 4. pp. 315-333.
31. The cruise industry, contribution of cruise tourism to the economies of Europe. (2012).
Copenhagen: Cruise Council.

63rd International Scientific Conference on Economic and Social Development – "Building Resilient Society" - Zagreb, 11-12 December, 2020
406
THE ROLE OF DIGITALIZATION FOR SMART PORT CONCEPT
Adrianna Karas
Gdynia Maritime University, Poland
ABSTRACT
The transformation of modern seaports includes many factors, starting with those occurring in
the economy, state policy, the environment of seaports, international supply chains, but also a
number of stimulants, i.e. innovation, new technologies, sustainable development or
competitiveness. The digital transformation in recent years has entered the port area with
impetus and will doubtless determine the quality of port service in the near future. At the same
time, diversified port environments such as port authorities, terminals, shipping lines, transport
companies, logistics companies and other service providers must treat the implementation of
technology as a long-term process to develop. The comprehensive range of technologies leaves
great flexibility for improvements, but significant changes can only come about with
collaboration and integration between ports and other actors in the supply chain. The aim of
the article is to show that smart ports are another inevitable step to changes in the broadly
understood functioning of ports, and the concept of smart ports is an irreversible trend that sets
the direction of development of modern seaports. This article provides an overview of the latest
digital technologies taking shape in some of the most modern seaports such as the Port of
Hamburg and the Port of Rotterdam. Additionally, the article aims to analyze decision-making
strategies to propel digital transformation in seaports.
Keywords: digitization, digital transformation, seaports, smart ports
1. INTRODUCTION
The world is currently undergoing a digital transformation and the ongoing digitization affects
all areas of social and economic life. Although societies and economies have undergone many
different changes over the years. For many decades, the development of technology has been
boldly entering new areas including port areas. In recent years, the possibility of further
development of seaports and shipping has been determined by modern infrastructure,
automatization, access from the sea and land, environmental protection and digitalization.
Digitalization has great potential to increase the efficiency and flexibility of maritime transport
chains. In this way, it opens up an opportunity to meet contemporary challenges for ports.
Thanks to digital solutions, it is possible to increase the efficiency of operation of the port's
land-sea supply chains, but also to simplify complex processes. Digital networking of seaports
brings additional opportunities to improve efficiency and security, and through the targeted
exchange of information and data ports can develop and create new business models. Modern
ports are being transformed into smart ports, which is synonymous with creating solutions
corresponding to current and future challenges. Intelligent solutions require integration on
many levels, starting with the social, economic and technological dimensions. The existing
solutions in the area of ports focus on digitalization, which are an essential element for ports to
aspire to the implementation of the Smart Port concept. Modern seaports are focused on the
integration of system solutions. Digital platforms, applications are starting to play a major role
in many ports ranging from management to facilitate cargo operations including the integration
of port entities (Heilig et al., 2017, p. 1341). However, the success of digital transformation lies
not only in the use of advanced technologies and methods, but above all in the adaptation of
organizational aspects, according to the idea “digital technology is the means to an end, it is not
the end”.

63rd International Scientific Conference on Economic and Social Development – "Building Resilient Society" - Zagreb, 11-12 December, 2020
407
2. MODELS OF DIGITAL TRANSFORMATION
Today we live in a world of ubiquitous digital platforms connected by networks to cloud
computing, big data, sensors and intelligent devices. We are a part of the world connected to a
lot of data, information and knowledge. This connection of digital intensity and the abundance
of people and data has been named "Internet of Things". Technological innovations that have
been taking shape over the past decades have come along with the development of new systems,
applications, tools, methods and they support business in various ways. On the one hand,
enterprises face a real challenge, as they are now dealing with an increasing amount of data but
on the other hand, they are supported by technologies that ensure greater efficiency.
Undoubtedly, these big data sets cover a variety of areas such as energy, environment, transport,
health care, trade, smart cities, communication, logistics and a community of constant
technological change requires flexibility (OECD 2016, pp. 8-35).
2.1. Digitization vs. Digitalization
The greatest discovery of the 20th century technology was the computer, when in the 1980s
computerization accelerated extremely. Computers entered the revolutionary idea of converting
analog signals to digital form (Tilson et al., 2010, p.749). In the case of digitization and
digitalization, two letters make a big difference. Understanding the differences between the two
approaches is crucial as digitization is the conversion of analog to digital, whereas digitalization
is the use of digital technologies and digitized data (Heilig et al., 2017, p. 1342). Not only digital
processing of existing data but also the ability of digital technology to collect data and make
better business decisions. Digitalization certainly improves processes, allows for the
simplification, collection, dissemination, analysis, decision making and coordination of tasks.
Digitization Digitalization
Definition conversion analog signals, data and
documents to digital form
transformation proccess, use digital
technologies to change a business
model and provide new revenue and
value
Examples - handwritten or typewritten text
into digital form
- scanning a photograph
- analyze data collected by
transferring PDF document from
computer to cloud and sharing it with
many people
- collecting data from clients to
analyze it, preparing individual offers
or marketing campaigns
Table 1: Digitalization vs. Digitalization
(Source: Gartner Glossary, 2020 and Truqcapp, 2020)
2.2. 4S – Key dimensions of digital strategies
The classification of digital transformation activities distinguishes four key dimensions of
digital strategies that shape the thinking of digital business strategy: the scope of digital business
strategy, the scale of digital business strategy, speed of digital business strategy and sources of
business value creation (Bharadwaj et al., 2013, p. 478).
• The scope of the digital strategies The scope of digital strategies includes the definition
of the product portfolio as well as the diversification of activities. The scope of the digital
business strategy helps to imagine relationships with companies, industries, IT
infrastructure, internal and external environment. The scope gives an overview of how
business is impacted by digital technologies. The adoption or emergence of digital platforms
can lead to the creation of new alliances (Heilig et al., 2017, p. 1342).

63rd International Scientific Conference on Economic and Social Development – "Building Resilient Society" - Zagreb, 11-12 December, 2020
408
• One of Key Questions on Scope Digital Business Strategy: “How well does digital business
strategy exploit the digitization of products and services, and the information around
them?” (Bharadwaj et al.,2013, p. 478).
• The scale of the digital strategies. When it comes to the scale of digital strategies, it should
be seen as opportunities to deal with information overload through ubiquitous connectivity
and computer technologies. Additionally, it can be supported by alliances and partnerships
by sharing a digital platform.
• One of Key Questions on Scale Digital Business Strategy: ”How well does digital business
strategy take advantage of data, information, and knowledge abundance?” (Bharadwaj et
al.,2013, p. 478).
• Speed of digital strategies. Speed is considered as the speed of products introduced to the
market, but also as the speed of making decisions based on the efficient flow of information.
Speed becomes important when it comes to responding to customer requests, and slowness
can mean customers will go away. One of Key Questions on Speed Digital Business
Strategy: “How effective is digital business strategy in accelerating new product launches?”
(Bharadwaj et al.,2013, p. 478).
• Sources of value creation. Digital strategies and related transformations contribute to ways
of creating value. First of all, digital transformation may lead to a redefinition of the scope
of activities, product and service portfolio, but also the creation of business goals, e.g.
customer satisfaction.
• One of Key Questions on Sources Digital Business Strategy: “How effective is digital
business strategy in leveraging value from multisided business models?” (Bharadwaj et
al.,2013, p. 478).
3. DIGITAL TRANSFORMATION IN SEAPORTS
Innovation is rapidly entering the fields of everyday life, but also changing the industry and the
port sector. Thanks to the implementation of innovations, the port sector records savings,
quality increase, development and increased efficiency of entities in the maritime supply chain.
More than just reduce the costs of using ports, but technology allows to increase the safety of
people staying there. Currently, interesting trends are the automation of container terminals, the
use of sensors and sensors, creating models of the so-called Digital Twin, autonomous ship
solutions, artificial intelligence algorithms using external data sources, using the potential of
computing clouds, robotization of warehouses, use of drones.
Figure 1: Overview of industry actors involved
(Source: Carlan, Sys, Vanelslander, Roumboutsos, 2017, p. 6)
63rd International Scientific Conference on Economic and Social Development – "Building Resilient Society" - Zagreb, 11-12 December, 2020
409
In the coming years, innovation will be a key factor, in addition to costs, capacity, geographic
location or increasing ship sizes and cargo volumes (Agatić, Kolanović, 2020 p. 95). This is
what forces maritime ports to move towards digital technologies. Digital innovations in seaports
should be considered not only as technologies and methods, but also as tools, e.g.
communication platforms that will support the flow of goods, exchange of information between
port stakeholders or ensure the safe transfer of electronic documents. Analyzing the digital
transformation in seaports is important to understand that communication is very important and
only by working together can actors involved in the port community system benefit. Opening
opportunities for cooperation to competing port stakeholders is one of the challenges
accompanying the implementation of digital innovations (Carlan et al., 2017, pp. 6-9). Digital
technologies pose a number of challenges as ports have a wide range of smart port technologies
to choose from but the key issues are the right choice of technology suited to the port. The needs
of ports may vary, they may result from the location, the position of competitors, and the
services offered. Port needs are also influenced by factors such as size, level of maturity and
the degree of competition from surrounding ports (Boston Consulting Group, 2018). Sea ports,
as complex and technologically advanced facilities, also affect the surroundings in which they
are located (Skiba, 2019, p. 460).
4. KEY TECHNOLOGIES CONNECTED TO SMART PORTS
Ports, terminals and ships are of key importance for the global economy, (In 2018 global
seaborne trade volume was estimated at approximately 11 billion metric tons) (UNCTAD,
2019), as well as intelligent technologies that allow responding to the constantly growing
requirements and competitiveness of entities . In order to meet current and future challenges,
ports and terminals are investing resources in smart technologies to turn into "smart ports" and
this is undoubtedly the next step of the inevitable changes in the broadly understood functioning
of ports. Modern ports are transforming into Smart Ports, which means creating solutions to
meet the current and future challenges they face. The idea behind Smart Ports is not only the
implementation and management of new technologies, but also digitization. Smart Port is a new
management model that integrates a number of innovative tools used at the technological and
organizational level (Karaś, 2020, pp. 27-28). Solutions in the area of ports mainly focus on
improving efficiency, accessibility, increasing competitiveness and caring for the environment.
Although the modern market is full of innovation technologies, and many of them have
universal applications, ports vary in their activities and require custom solutions, so it is
important that terminals and port authorities work together to implement the appropriate
technologies, methods and tools. As part of the concept of digitization and the transition to the
concept of "Smart Port", technologies such as: Internet of Things (IoT), Big data, sensors,
Application programming interface (API), Real-time data, Mobile devices, Cloud computing.
Figure following on the next page

63rd International Scientific Conference on Economic and Social Development – "Building Resilient Society" - Zagreb, 11-12 December, 2020
410
Figure 2: Key digital technologies
(Source: own study)
The high quality of services provided by the port operators in Hamburg last year contributed to
the positive result of transshipment turnover. Thanks to its investments, the Port of Hamburg is
one of the most modern hubs in international maritime trade, driving digital solutions that
guarantee smooth and efficient operation. The systems used by HPA are leading technologies
in the world, and the digital trend also ensures that the port maintains a leading position in
Germany and Europe. In addition, the smartPort philosophy is constantly developed and
adapted by HPA and additionaly the port has now reached a degree of digitization of 95 percent.
The smartPort platform developed by HPA combines economic and ecological aspects in three
sub-sectors: traffic, infrastructure and flow of goods. The smartPort platform combines the
following functionalities (Hamburg Port Authority, 2020):
• Navigation in real-time – users moving around the port, including truck drivers, use
personalized navigation to ensure smooth traffic flow. In addition to information on traffic
in and around the port, system users have access to information on parking lots,
infrastructure and bridge closures.
• Shore power from renewable energies – by powering cruise ships from shore with
renewable energy sources, the environmental impact is significantly reduced. Ships are
supplied with electricity through a transformer station and a mobile transfer mechanism
located in the Altona cruise ship terminal.
• Intelligent railway point – frequently used port queue points are equipped with sensors
that transmit data in real time to a central IT system, thus providing information on the
status and consumption of key operational intersections. Thanks to the ongoing data
transfer, it is possible to identify repairs and necessary maintenance work.
• The mobile all-purpose sensor – a mobile GPS sensor that wirelessly transmits data to the
HPA IT system allows for fleet management, measurements of temperature, speed, wind
direction, air pollution and flow status of the Elbe River.
• Smart maintenance – port infrastructure is monitored by mobile devices such as tablets
and smartphones. The devices automatically send measurements to IT systems, where data
is processed, stored and edited. Measurements allow you to control roads, bridges or tracks.
The purpose of the measurements is to ensure the efficiency of the maintenance processes.
• Virtual depot – a virtual warehouse helps to optimize the movement of empty containers,
which are unnecessarily burdened by the environment through truck transport. The system
is cloud-based, informing participating operators which containers are to be delivered back
to the warehouse.

63rd International Scientific Conference on Economic and Social Development – "Building Resilient Society" - Zagreb, 11-12 December, 2020
411
• Port Monitor – the software allows you to keep all port stakeholders informed about the
position of ships, data on the water level, berths, current construction sites, planned dives
and the height and width of bridges.
• E-mobility in the port – introducing e-mobility to passenger and freight traffic in the port
area using electric vehicles, which are becoming more and more common in transport.
• Parking for professionals – the system allows for comprehensive management of parking
lots, while ensuring optimal use of parking spaces for trucks in the port.
• Renewable energies – effective use and expansion of the existing energy networks, and
above all, the possibility of producing renewable energy - wind energy, solar energy,
biomass.
Digital solutions are also implemented in the Port of Rotterdam. The Port of Rotterdam uses
the Port Forward platform, offering digital solutions for shippers, freight forwarders and traders,
enabling port authorities to manage port operations more efficiently and safer and to reduce
costs, handle ships, trains and inland vessels faster (Port of Rotterdam, 2020).
• Portinsider – the platform provides real-time information, integrating the port community,
shortening the time of ship operations and increasing the number of berths. Thanks to the
use of the platform, all ship and cargo declarations are handled in one system, providing all
information regarding port charges, customs clearance, cargo manipulation and inspections.
The system safely enables communication between enterprises and representatives of port
service supply centers.
• PortXchange – the platform provides shipping companies, agents, terminals and service
providers with a common space where users can exchange information about ships arrivals.
The individual timeline of each ship presents all events occurring during the call to port -
from the ship's arrival in the port and its stay in the port to the departure from the port.
Thanks to the dashboard, users can use the information to effectively plan and edit activities
related to the port's call. PorXchange ensures shorter time of ship calls, predictability of
terminal operations, improved communication between participants, reduced CO2
emissions.
• Navigate – provides insight into the different routes dedicated to worldwide container
shipping via Rotterdam and helps users find, compare and select the best route options. The
Navigate platform contains a directory of companies that operate in and around the Port of
Rotterdam. The goal of Navigate is to optimize container transport. Navigate shows direct
connections via shortsea and deepsea with 550 ports worldwide.
• Boxinsider – provides accurate data, thanks to which users have direct access to
information, while eliminating manual typing and searching of container data, which
reduces the time by 20-50%. The system informs about undesirable events on an ongoing
basis, so that shippers and carriers can plan operational processes.
• Timetoport – offers a reliable solution for accurately predicting ships arrivals based on AIS
signals. This enables port authorities and the port community to optimize the planning and
maximum use of berths, people, tugs, pilots and other service providers. Timetoport
provides information 5 days prior to ship arrival with an error of 4h.
5. CONCLUSION
Certainly, digital technologies are inherent in the largest and most modern ports in the world,
although many ports are trying to keep up with the leaders. In the case of other ports, the
introduction of digital technologies is certainly advisable, and the transformation process
should start with improvements in the field of electronic document management, the use of
Internet of Things, artificial intelligence, automation processes, Big Data, sensors, mobile
devices, robots, applications and platforms.

63rd International Scientific Conference on Economic and Social Development – "Building Resilient Society" - Zagreb, 11-12 December, 2020
412
These solutions bring a number of improvements, ensure a significant improvement in the
efficiency of ports, terminals, port stakeholders and participants in international supply chains.
The most important step in the digitalization of seaports is to identify, assess and understand
the impact and role of digital technologies on port operations and business strategy. The area
of the digital revolution is a key element in the transformation of ports towards the
implementation of the Smart Port concept only on the condition of cooperation and integration
of port entities. Undoubtedly, digital transformation requires great openness, courage and
readiness for change.
LITERATURE:
1. Agatić A., Kolanović I. (2020). Improving the seaport service quality by implementing
digital technologies. Scientific Journal of Maritime Research 34, pp. 93-101
2. Bharadwaj, A., El Sawy, O.A., Pavlou, P.A., Venkatraman, N. (2013). Toward a next
generation of insights. Digital business strategy 37(2), pp. 471-482
3. Boston Consulting Group. (2020). To Get Smart, Ports Go Digital. Retrieved 17.11.2020
from https://www.bcg.com/publications/2018/toget-smart-ports-go-digital.aspx
4. Carlan, V., Sys, C., Vanelslander, T., Roumboutsos, A. (2017). Digital innovation in the
port sector: Barriers and facilitators. Antwerp: Competition and regulation in network
industries, pp. 6-9
5. Deloitte. (2017). Smart Ports Point of View By Deloitte Port Services. Retrieved 23.09.2020
from https://www2.deloitte.com/content/dam/Deloitte/nl/Documents/energy-resources/
deloitte-nl-er-port-services-smart-ports.pdf
6. Digitization vs. digitalization: Differences, definitions and examples. Retrieved 20.10.2020
from https://www.truqcapp.com/digitization-vs-digitalization-differences-definitions-and-
examples/
7. Heilig, L., Schwarze, S., Voß, S. (2017). An analysis of digital transformation in the history
and future of modern ports. In Proceedings of the 50th Hawaii International Conference on
System Sciences, pp. 1341-1350
8. Ilin I., Jahn C., Weigell J., Kalyazina S. (2019). Digital Technology Implementation for
Smart City and Smart Port Cooperation, Atlantis Highlights in Computer Sciences Vol. 1,
pp. 498-501
9. Karaś A. (2020). Smart Port as a Key to the Future Development of Modern Ports. The
International Journal on Marine Navigation and Safety of Sea Transportation Vol.14, Nr 1,
pp. 27-31
10. OECD. (2016). The Internet Of Things: Seizing The Benefits And Addressing The
Challenges, pp. 8-35
11. Skiba S. (2019). Seaport - City Cooperation On The Example Of The City Of Gdynia,
Varazdin: Varazdin Development and Entrepreneurship Agency, pp. 460 - 467
12. Tilson, D., Lyytinen, K., Sørensen, C. (2010). Research commentary–digital
infrastructures: The missing IS research agenda. Information Systems Research, 21(4), pp.
748-759
13. UNCTAD, World seaborn trade, Retrieved 10.10.2020 from https://stats.unctad.org/
handbook/MaritimeTransport/WorldSeaborneTrade.html
14. Website of Hamburg Port Authority, Retrieved 17.11.2020 from https://www.hamburg-
port-authority.de/en/hpa-360/smartport/
15. Website of Port of Rotterdam, Retrieved 22.11.2020 from
https://www.portofrotterdam.com/en/port-forward/products
16. Website of Gartner Glossary, Retrieved 27.11.2020 from https://www.gartner.com/en

63rd International Scientific Conference on Economic and Social Development – "Building Resilient Society" - Zagreb, 11-12 December, 2020
413
MARKET FOR PRO BONO LEGAL SERVICES IN CROATIA – WHAT
IS THE PLACE OF SMALL BUSINESS CLINICS
Anamarija Delic
Sveučilište Josipa Jurja Strossmayera u Osijeku,
Ekonomski fakultet u Osijeku, Croatia
ABSTRACT
Although part of every legal education in Croatia, law clinics have different roles and places
within communities. Small business clinics in Croatia are at an intersection of different service
providers – business support institutions, state institutions (chambers of commerce and state
administration offices), and professional associations. All these institutions provide pro bono
legal and economic advice to small and medium-sized enterprises (SMEs) in Croatia. Despite
high competition and rather low entry barriers in the advice providers sector, a significant
number of new entrants starts to offer their services in this sector. Finding one’s place in such
a highly saturated market demands good strategy, well-defined services, good management and
clearly profiled competitive advantage. Using secondary data, the goal of this paper is to check
where and how a small business clinic in Croatia can place itself within the community.
Through primary data and interviews with all mentors and students involved in the Small
Business Clinic of Josip Juraj Strossmayer University in Osijek, major issues and challenges
will be analysed and used to draw conclusions in defining the place of clinics in the market of
professional service providers in Croatia.
Keywords: clinical education, pro bono services, services for SMEs, small business clinics
1. INTRODUCTION
Small and medium-sized enterprises (SMEs) in Croatia enjoy support of 473 different business
support institutions:1development agencies, business incubators, entrepreneurial centres,
entrepreneurial zones, technology parks and centres, centres of competence, etc. All these,
business support institutions have a common goal – »to create quality, user oriented
entrepreneurial environment by implementing programs focused on the development of SME
sector«.2 Business support institutions provide different services for their user, i.e. SME sector:
business advice, information, working space, co-working space, infrastructure, more favourable
land prices, legal advice, organization of networking events, etc. According to the BOND report
on business support organization’s services (2018), SMEs usually seek for information or
advice on sources of financing, management of EU projects, preparation of business plans,
networking and education. Majority of those services are on pro bono basis for owners of SMEs
or start-ups, since business support institutions are established by local, regional or national
government, which financially support their work. On the other side of the pro bono services
for SMEs, there are law clinics, which also provide advice and represent connection between
university and business sector. Law clinics are part of almost every law school in the world,
focused on providing legal advice (legal help) for minority groups in the society – migrants,
asylum seekers, start-up entrepreneurs, people with lower incomes, immigrants, etc. Law
clinics also provide the »window into the real world« for law students and ensure them practical
and experiential learning while studying law. Law clinics have arisen from the dissatisfaction
of American law students in 1960-ties, which asked for more practical approach in their
education.
1 The single register of entrepreneurial infrastructure, http://reg.mingo.hr/pi/public/#, October 30, 2020 2 Law on the improvement of entrepreneurial infrastructure (NN 93/2013, NN 114/13, NN 41/14 i NN 57/18)

63rd International Scientific Conference on Economic and Social Development – "Building Resilient Society" - Zagreb, 11-12 December, 2020
414
Clinical way of learning was widely accepted as the model that can prepare student for their
future occupation. Croatian law clinics are defined with the Law of free legal aid (NN 143/13
and NN 98/19), in which free legal advice can be provided by governing bodies, individuals
(lawyers) and law clinics. Law also defines the free legal advice as “submission, legal advice
and general legal information”, but only for clients that from different reasons cannot represent
themselves in front of the Court.
2. PRO BONO SERVICE MARKET IN CROATIA
Providing business or legal advice for SMEs is usually seen as a service that helps SMEs in
meeting their business objectives (Bennett and Robson, 1999). That definition clearly
distinguishes advice from general information. External advice also contains a range of
competencies that »support the SME's intangible resources, providing a potential source of
competitive advantage« (Gooderham et al., 2004, p. 7). Clients (SMEs) seek for an external
help »to perform some work that they do not have skills to do.« (Czerniawska, 2002, p. 10)
Armbruster (2006) lists three reasons to hire external expert: to get advice, to solve problems
and improve the company. Other reasons, according to O'Mahoney and Markham (2013), are
to provide an original thinking (45%), to get an objective perspective (34%), to fill in for
management (17%), to gain access to a methodology (17%) and to validate an internal decision
(10%). SMEs, according to Birley and Westhead (1992) and Storey (1994), have a greater need
for external help (advice from an expert), but also are more reluctant to seek for it. Aronoff and
Ward (1994) identified several reasons that hinder owners of SMEs to use external help: lack
of trust in experts, fear of sharing ideas and information with persons outside of the company
and relying on advice from a friend, bankers and attorneys. Owners of SMEs, according to
Deakins et al. (2001) research, usually need help with financial management and how to use
financial data in decision-making processes and in this field help from an external expert in
more than needed. In order to increase the use of external professional help, a number of
government institutions offered their help (Bennett and Robson, 1999). Those institutions offer
free or subsidized services in order to overcome this lack of demand. In Croatia, government
used the same thinking while creating the big network of business support institutions. On every
8.880 inhabitants there is one business support institution offering pro bono advice for SMEs.
But, as results of the Global Entrepreneurship Monitor (GEM)3 show, the number of business
support institutions does not guarantee the quality of the advice (Croatia has the worst grade
for entrepreneurial infrastructure out of 18 countries in the GEM research). Entrepreneurial
infrastructure in Croatia is acting rather as an obstacle , then as supporting factor (Croatia
Consultancy Market Study, 2014, p. 71). Owners of the SMEs in Croatia report, according to
conclusions in Croatia Consultancy Market Study (2014), legal issues, financial management,
sales and marketing issues as most pressing problems. In the process of solving those problems,
majority of SME owners (67%) desided to solve problems on their own. Although owners of
the SMEs in Croatia were familiar with the offer of advice providers (consultants and business
support organizations), they were reluctant to hire external experts. Despite subsidizied services
and number of business support institututions, Blackburn et al. (2010) found out that the most
frequently used source of external help within SMEs are accountants. Owners of the SMEs do
not easy share information about the company and problems. Accountants work closely with
the owners of SMEs, they share information about the company and over time time build long-
term relationships. Relationship and trust are among most important criteria when choosing and
purchase advisory service (Bennett and Robson, 1999). In addition to that, Marriot and Marriot
(2000), claim that owners of SMEs are reluctant to change accountant even when they are not
satisfied.
3 Singer et al. (2017), What makes Croatia a (non)entrepreneurial country? GEM Croatia 2017, http://www.cepor.hr/wp-
content/uploads/2015/03/EN-GEM-2017-za-web.pdf, accessed on October 30,2020

63rd International Scientific Conference on Economic and Social Development – "Building Resilient Society" - Zagreb, 11-12 December, 2020
415
On the Croatian consultancy market, legal aid is also provided by non-profit organizations and
law clinics. In the register of institutions for providing free legal aid, there are 54 non-profit
organizations and law clinics that also “compete” on the pro bono consultancy market. Legal
issues are among most pressing issues in Croatian SMEs and therefore those institutions slowly
position themselves among other pro bono advice providers. On that pretty saturated market,
advice also offer Chamber of commerce and Chamber of crafts. Although their services are not
completely free, they can cover almost every aspect and problem in SMEs. Membership in
chambers is obligatory, arranged according to the law, but owners of the SMEs rarely rely on
these institutions when in need for external advice. Results from Croatia Consultancy Market
Study (2014) show that owners of SMEs have the least confidence in state institutions, although
information about legal regulation, SMEs usually search in state administration offices.
Although not part of the pro bono advice service market, in 2012, there were 2.799 professional
consulting companies in Croatia (Croatia Consultancy Market Study, 2014, p. 43), that were
employing 4.852 employees. Professional consulting companies usually hired by big
companies for the audit and expert advice purposes. SMEs rarely seek advice in professional
consulting companies. Because of their “relative lack of purchasing power, they are seen as
unattractive clients” (Gooderham et al., 2004, p. 7). Jevnaker (1996) reports that 75% of
Norwegian professional consulting companies has no contact with SMEs. On the other side,
SMEs also see themselves as not enough interesting for professional consultants (Aronoff and
Ward, 1994). Croatian SMEs also claim that they are not familiar with the work of professional
consulting companies. In the supply gap between state administration offices and chambers of
commerce on one side in which owners of the SMEs do not have confidence and business
support organizations on the other side, could be a niche for institution and organizations like
small business clinics. Small business clinics could fill the gap on advice service market,
focusing on legal issues of SMEs and offering that advice on pro bono basis.
3. SMALL BUSINESS CLINICS
From their beginnings in 1960-ties when primary goals was to enable practical work, covering
usually civil law issues (Jelinić, 2014), law clinics today can cover almost every aspect of legal
issues and aid, providing pro bono advice for different groups of clients. Primary goal of law
clinics is to teach students how to practice law, but also to help the community in which they
operate. With the raising importance of the SME sector in the world, law clinics spread their
field of work on legal issues in that sector, also, diversifing themselves into small business
clinics. Researching the work of law clinics, Weinstein (1999) argues that today companies
operate in an increasingly complex world, in which advice providers need to expand their
traditional approaches to problem solving. Weinstein (1999) stressed out that today’s problems
are not one-dimensional and in their solving interdiscplinary approach is the only way to finding
solution. Lawyers and law clinics cannot have the knowledge and skills that would allow them
to identify each aspect of the problem (Weinstein, 1999, p.320). Therefore, Winestein (1999)
suggests formation of interdiscplinary clinics that could solve problems creatively and avoid
“narrowness of vision” (Weinstein, 1999, p.322). On the other side, in order to prepare students
for practical work in the future, law clinics needed to make a shift from traditional way of
teaching toward teaching that will enable acquiring different skills, needed for solving today’s
complex problems: legal analysis and reasoning, legal research, factual investigation,
communication, counselling, negotiation, litigation and alternative dispute resolution
procedures, organization and management of legal work and recognizing and resolving ethical
dilemmas (Hovannisian, 2004). According to Schlossberg (2003) interdisplinary approach
ensures learning some skills usually connected with the consulting industry, such as planning
in consultation with the client, strategic thinking and problem solving, that can help in reducing
the risk of a possible dispute in future.

63rd International Scientific Conference on Economic and Social Development – "Building Resilient Society" - Zagreb, 11-12 December, 2020
416
This goals could be reached only trough interdiscplinary approach, i.e. interdisciplinary clinics.
In 2013, Faculty of Law in Osijek and Faculty of Economics in Osijek founded interdisciplinary
Josip Juraj Strossmayer Legal-economic clinic, focused on providing legal and economic
advice for SME from the environment. This was one of the first interdisplinary clinics in the
world and the project that had two goals: to offer quality, complete advice (legal and economic
view on the problem) and to better prepare student for labour market, by educating so called
“hybrid professionals” prepared for solving more complex problems. In the period from the
November 2013 till June 2020 more then 200 clients, owners of SMEs or start-ups, got the
advice or information and more then 250 students had an opportunity to learn and work in the
Legal-economic clinic. The clinic operates as a contract between two Faculties, but cooperates
with lawyers, judges from the Trade court, and business support institutions in Osijek-Baranja
county.
Picture 1: Number of cases (advice provided) from 2013-2019; Source: Author’s research
Researching reasons for joining the Legal-economic clinics among student in September 2020
for the purposes of this paper, student stressed out the possibility for practical work (40%),
opportunity to combine theoretical and practical knowledge (31%), quality of extracurricular
activities on university (4,8%) and networking with colleagues from other deapertments and
with clients (14,3%). In the Legal-economic clinic, students have to work in joint teams, solving
together problems and sharing the views on the problems and solutions. Interdiscplinary
approach consider useful 35,71 % of students, while 47,62% thinks that this approach provides
very good results, but also find it difficult. In the Clinic students need to use acguired theoretical
knowledge, since Clinic is available only for students on graduate study. Unfortunatelly, only
50 % students think that previously acquired knowledges are usefull while working with clients
and 45,24 % consider that the opportunity to work in Clinic ensures them advantage over other
students. This is also the reason that their final experience in the Clinic, students graded with
the highest grades – 47,62 % graded experience with the grade 5 (extremely positive and useful)
and 38,1% with the grade 4 (positive and useful). In order to find out where to position the
Legal-economic clinic on the pro bono advice market, it was necessary to check satissfaction
of the clients, i.e. owners of the SMEs, but also to find out what kind of the advice they find
usefull and helpful.
4. METHODOLOGY
The goals of this paper is to detect the place of the Josip Juraj Strossmayer University Legal-
economic clinic on the pro bono advice market. Croatian advice service market is characterized
by great number of business support institutions, that offer free of charge or subsidized advice
service, those work is supported by government on national and local level. Owners of SMEs
usually use advice services from that institutions for preparing business plans or EU projects.
0 5 10 15 20 25 30 35 40
2013/2014
2014/2015
2015/2016
2016/2017
2017/2018
2018/2019
2019/2020
Advice provided
Year

63rd International Scientific Conference on Economic and Social Development – "Building Resilient Society" - Zagreb, 11-12 December, 2020
417
On the other side of the consulting market there are professional consultants that charge for
their services, but they do not focus their services toward SME sector. On the intersection of
those two poles on the advice service market, there are law clinics, that offer usually legal aid
on pro bono basis. What kind of advice law clinics should offer and do owners of SMEs really
need this kind of advice are research questions that sould be answered in this paper. For the
purpose of market analysis, secondary data, mainly reports were used. BOND report (2018) and
Croatia Consultancy Market Study (2014) were also used in order to find out what sort of advice
owners of SMEs would like to get and business support institutions and consultants usually do
not provide. Opinions and attitutes of the owners of SMEs about the Legal-economic clinic,
work with students and advice that they have received were collected through interviews with
18 clients. There was 66,7% female respondents and 33,3% male respondents in the sample.
Respondents were usually younger persons – 46,67 % of them was born after 1990-ties and
predominantly were from urban areas (85,14%). Clients in the sample had different issues –
from the decision about choosing legal form for the business till the liquidation of the company.
The most common question from the clients was connected with starting business – legal form
and preparation of the business and marketing plan. Finally, results from different reports and
data collected through in-depth interviews were used for reaching a final conclusion. In
conclusion part of the paper, there are also recommendations for further research. Limitations
of the choosen research methods could be in the answers of the interviewees, who tend to give
benignant responses, rather then completely honest. When asked about their experience, all of
them stressed out that did not had great expectations since the consultants in the clinic were
students itself and the service was on pro bono basis.
5. RESULTS
In order to find out what kind of advice owners of SMEs would like to receive, the results from
BOND report (2018) were used. Owners of SMEs were asked what sort of advice they need,
but can not get in business support institutions.
Picture 2: Type of the advice that business support instiuttions do not provide and owners of
SMEs would like to obtain; Source: BOND report (2018), p. 46.
0 5 10 15 20 25 30 35 40
HRM
commercialization of innovations
IT
organization of study visits
lean management
advice about specific technologies
Quality systems
Marketing and selling
education
Lobbying
internatialization
financial management
mentoring of start-ups
audit of EU projects
R&D
networking
mentoring in preparation of business plans
public procurement
preparation of EU projects
accountancy and taxes
legal advice

63rd International Scientific Conference on Economic and Social Development – "Building Resilient Society" - Zagreb, 11-12 December, 2020
418
While owners of SMEs need specific advice, especially legal ownes, business support
institutions agree that this should not be their task. Namely, business support institutions have
to support local government and their development projects, as their founders. Business support
institutioins claim that those are two different aspects of supporting SME sector and it is not
possible to do both. Specialization of business support organization in advice providing service
could help to overcome this discrepancy or creating clusters of business support organizations
that will cover individual subjects and areas. Example of good praxis are specialized business
incubators that support specific industry. For the purpose of this paper, clients were interviewed
about their satissfaction with the service of the Legal-economic clinic. Respondents were asked
about reliability of the advice they obtained in the Clinic. Majority of them, 60%, consider
received advice reliable, while 13,3 % consider it not reliable. But despite that, 46,7% of the
clients responded that they would choose Clinic again while in search for business or legal
advice. Main complaint on the advice provided by students and mentors in the Clinic is that
advice are too broad, and to not provide specific answer on the issue, but rather information
that should easy clients decision-making process.
Picture 3: Clients satisfaction with the received advice; Source: Author’s research
Respondents were also asked about their suggestion for improving work of the Clinic.
Respondents suggest more detailed research about the issue, better marketing, digitalization of
the communication and web page with the Q&A option. One of the suggestions is that students
should have a big picture and make scenario analysis for different decisions. All respondents
support work of the Legal-economic clinic and trust that this way of learning and serving in the
community will better prepare students for the labour market.
6. CONCLUSION AND RECOMMENDATIONS FOR FURTHER RESEARCH
Owners of SMEs are more reluctant to use the service of external experts, but usually need it
more than big companies. In their search for an advice, accountants, thanks to built long-term
relationship enjoy the biggest confidence. On the intersection of different advice providers,
there are also law clinics, that offer free legal aid. From the research results from secondary,
but also primary research, one can conclude that owners of SMEs need complete and clear
advice, followed by scenario analysis for different solutions and decisions that owners of SMEs
can make. Business support institution should build their expertise in specific industry fields,
in order to build confidence, but also provide advice on specific issues in SMEs.
0 10 20 30 40 50
not satisfied at all
not satisfied
neither satisfied, neither not satisfied
satisfied
extremely satisfied
%

63rd International Scientific Conference on Economic and Social Development – "Building Resilient Society" - Zagreb, 11-12 December, 2020
419
Legal issues should not be in domain of business support institutions, but transferred on experts
– lawyers and law clinics. According to results in this paper, there is a place, a niche, on the pro
bono market for law clinics, but providing advice that are simple and easy understandable for
owners of SMEs. Law clinics should be more visible on the market, providing legal advice that
helps owners of SMEs in reaching decisions. In further research in the field of pro bono advice
market, it would be interesting to better understand the process of solving legal issues in the
SMEs and whether accountants also assist them in that process, too. Owners of SMEs
emphasize the need for mentoring, but business support institutions do not offer that kind of
service. Is there on the advice market also place for the consultants that could be mentors and
teachers? Further researches should provide answer on that question, too.
LITERATURE:
1. Alpeza, M., Mikrut, M., Oberman Peterka, S., Delić, A. (2014). Croatia Consultancy
Market Study, European Bank for Reconstruction and Development, HAMAG INVEST and
CEPOR, Zagreb
2. Armbruster, T. (2006). The Economics and Sociology of Management Consulting,
Cambridge. Cambridge University Press
3. Aronoff, C.E., Ward, J. L. (1994). How to Choose and Use Advisers: Getting the Best
Professional Family Business Advice. Family Business Consulting Group, FBCG
Publications, USA
4. Bennett, R., Robson, P. (1999). Intensity of Interaction in Supply of Business Advice and
Client Impact: A Comparison of Consultancy, Business Associations and Government
Support Initiatives for SMEs . ESRC Centre for Business Research, University of
Cambridge, Working Paper No.142, pp. 1-48.
5. Birley, S., Westhead, P. (1992). A comparison of new firms in ‘assisted’ and non-assisted
areas in Great Britain. Entrepreneurship and Regional Development, 4, pp. 299-338.
6. BOND, report (2018). Analysis of current system of business support institutions, HAMAG
BICRO, Zagreb
7. Czerniawska, F. (2002). The Intelligent Client: Managing your Management Consultant.
London, Kogan Page
8. Deakins, D., Logan, D. and Steele, L. (2001). The Financial Management of the Small
Enterprise. ACCA Research Report No. 64. London: The Association of Chartered
Certified Accountants, Certified Accountants Educational Trust.
9. Gooderham, P.N., Tobiassen, A., Doving, E., Nordhang, O. (2004). Accountants as Source
of Business Advice for Small Firms. International Small Business Journal, vol 22 (1), pp. 5-
22
10. Hovannisian, L. (2004). Clinical Legal Education and the Bologna Process. PILI Papers,
No.2
11. Jelinić, Z. (2014). Integrirano kliničko obrazovanje studenata prava i ekonomije - Prikaz
projekta Pravno-ekonomske klinike Pravnog i Ekonomskog fakulteta u Osijeku. Pravni
vjesnik, 30 (3-4), pp. 285-292.
12. Jevnaker, B. (1996). Private-sector: Consultancies in O. Nordhaug and P. N. Gooderham
(eds) Competence Development in Private-sector Firms. Oslo, Cappelen Akademisk Forlag
13. Law of free legal help (NN 143/13, NN 98/19)
14. Law on the improvement of entrepreneurial infrastructure (NN 93/2013, NN 114/13, NN
41/14 i NN 57/18)
15. Marriott, N., Marriott, P. (2000). Professional Accountants and the Development of a
Management Accounting Service for the Small Firm: Barriers and Possibilities.
Management Accounting Research 11(4): 475–92.

63rd International Scientific Conference on Economic and Social Development – "Building Resilient Society" - Zagreb, 11-12 December, 2020
420
16. O'Mahoney, J., Markham, C. (2013). Management Consultancy,. Oxford, Oxford
University Press
17. Schlossberg, D. (2003). An Examination of Transactional Law Clinics and Interdisciplinary
Education. Washington Journal of Law & Policy, 11, pp. 195-236
18. Singer, S., Šarlija, N., Pfeifer, S., Oberman Peterka, S. (2017). What makes Croatia a
(non)entrepreneurial country? GEM Croatia 2017. Retrieved 30.10.2020 from
http://www.cepor.hr/wp-content/uploads/2015/03/EN-GEM-2017-za-web.pdf.
19. Storey, D.J. (1994). Understanding the small business sector. Routledge, London, UK
20. The single register of entrepreneurial infrastructure. Retrieved 30.10.2020 from
http://reg.mingo.hr/pi/public/#.
21. Weinstein, J. (1999). Coming of Age: Recognizing the Importance of Interdisciplinary
Education in Law Practice. Washington Law Review, 74(2), pp. 319-366.

63rd International Scientific Conference on Economic and Social Development – "Building Resilient Society" - Zagreb, 11-12 December, 2020
421
URBAN MOBILITY MANAGEMENT DURING THE CORONAVIRUS
PANDEMIC: THE IMPACT OF COVID-19 ON THE ECONOMIC,
ECOLOGICAL AND SOCIAL DIMENSIONS OF TRANSPORT
Michal Kuzia
Gdynia Maritime University, Poland
ABSTRACT
The coronavirus pandemic has affected many spheres of human life. Undoubtedly, one of the
directly and diametrically transformed areas turned out to be transport. Traveling has changed
significantly both in the context of long distance (international and intercity travels) and short
distance (travelling to work, school, shopping, etc.). Countries have implemented numerous
transport restrictions, but at the same time, new initiatives have emerged in some cities to
support sustainable forms of travel, e.g. widening the footpath or subsidizing the purchase of
bicycles. The aim of this article is to trace and analyse changes that occurred in urban mobility
management as a result of Covid-19. These changes concern city authorities and public
transport operators as well as large and small private companies. The impact of the pandemic
on the economic, ecological and social dimensions of transport has proven to be ambiguous,
affecting urban mobility in a negative way (e.g. travel difficulties, restrictions in public
transport) as well as leading to some positive changes (e.g. lower air pollution in the urban
areas).
Keywords: Covid-19, Mobility management, Transport, Urban mobility
1. INTRODUCTION
Since the new coronavirus (SARS-CoV-2 pathogen) appeared in Wuhan (Hubei, China) at the
end of 2019, it has been spreading rapidly worldwide. The World Health Organization (WHO)
named this new contagion COVID-19, on 30 January 2020 officially declared that the COVID-
19 epidemic was a public health emergency of international concern. On 11 March WHO
assessed that COVID-19 can be characterized as a global pandemic (World Health
Organization, 2020). To tackle the Coronavirus pandemic, countries across the world have
implemented a range of stringent policies to slow the spread of the virus by enforcing physical
distance between people. In terms of countermeasures, lockdowns and reductions of social
activities are meant to flatten the curve of infection, protect residents and to mitigate economic
damage (European Commission, 2020; Anderson et al., 2020; Matteo et al., 2020). These
measures include school and workplace closures, cancellation of events and public gatherings,
restrictions on public transport. ‘Social distancing’ is now a widely used term an also a strategy
adopted to keep a suitable distance from others and avoiding unnecessary trips. As a result,
COVID-19 has a disruptive impacts on the society, economy and urban systems. Undoubtedly,
one of the directly and diametrically transformed areas turned out to be transport. The pandemic
has had an unprecedented effect on people's mobility across the globe. The majority of
governments have imposed severe restrictions on both local and long-distance traveling. This
travel restriction has significantly limited people's mobility. On the other hand, new initiatives
have emerged in some cities to support sustainable forms of travel, e.g. widening the footpath
or subsidizing the purchase of bicycles. The aim of this article is to study the changes that have
occurred in urban mobility management as a result of Covid-19. These changes concern city
authorities and public transport operators as well as large and small private companies.

63rd International Scientific Conference on Economic and Social Development – "Building Resilient Society" - Zagreb, 11-12 December, 2020
422
2. ANALYSIS OF CHANGES IN URBAN MOBILITY IN RESPONSE TO COVID-19
PANDEMIC
The coronavirus outbreak has had widespread impact on the transport sector worldwide and
corresponding measures have been widely investigated by many maritime, railway and urban
transport researchers and organizations (Zhang, 2020). The crisis has affected all forms of
transport, from cars, bikes and public transport in cities, to buses, trains and planes nationally
and internationally. Global road transport activity was almost 50% below the 2019 average by
the end of March 2020 (International Energy Agency, 2020). A substantial reduction of
passenger demand has been observed (for both leisure and business travel), due to a
combination of the government imposed lockdowns and restrictions - the modes of mass
transportation has been limited (figure 1). European air traffic decreased by about 90% in March
and 73% in August (Airports Council International, 2020). Meanwhile, the total trips generated
in Australia dropped to just over 50%. The UK claimed that government restricted policies
account for 60% reduction of driving and walking traffic, and 80% reduction of transit (Arimura
et al., 2020). Underground journeys has declined by 95% in London (Abu-Rayash et al., 2020).
In North America, it has been calculated that around 50% of Canadians are working from home
due to COVID-19 and individuals made 1.62 trips/day/person compared to 3.33
trips/day/person in the pre-pandemic period (Fatmi, 2020). Major American cities have been
following similar trajectory to Canadian cities, after closures had taken effect in March.
2.1. Public transport restrictions and closures
While geographical conditions and data vary, a coherent pattern emerges that public transport
has suffered particularly hard compared to private cars and other modes of transportation. For
the first time in history, public transport has been so drastically limited in cities. Most countries
in the world have imposed restrictions on public transport or have completely suspended
transport connections. Public transport stations and vehicles are recognized as high-risk
environments for transmission of COVID-19 due to the limited physical space available, the
abundance of surfaces that help spread the virus, and the limited testing of crew and passengers
who use the system. Furthermore, bus and tram drivers are among the group of professions with
the highest risk of being infected (Jenelius et al., 2020). Figure 1 shows the closures of public
transport at the time of the rapid development of the epidemic on April 19, 2020. Most
restrictions were implemented in African, Asian and South American countries. Some countries
that initially managed to contain the pandemic, introduced restrictions later, such as China (May
10) and Australia (May 18).
Figure following on the next page

63rd International Scientific Conference on Economic and Social Development – "Building Resilient Society" - Zagreb, 11-12 December, 2020
423
Figure 16:Public transport closures during the Covid-19 pandemic, Apr 19,2020
(Source: Our World in Data)
2.2. Data from mobility service providers
Under normal circumstances, countless applications help people navigate through cities and
around the planet, aggregating data and calculating public transport routes or flights
connections. In times of Covid-19, these applications has brought an entirely new role: data
from Citymapper, Moovit, Google Maps and Apple Maps can be used to measure the impact
of the coronavirus on mobility. Mobility service providers have published data based on
geographical location, travel planner queries or app usage.
2.2.1. COVID-19 Community Mobility Reports
Google provides “COVID-19 Community Mobility Reports“ collecting data from users who
have opted-in to Location History for their Google Account. The company has produced a
regularly updated dataset that shows how peoples’ movement have changed throughout the
pandemic. Changes for each day are compared to a baseline, which is the median value, for the
corresponding day of the week, during the 5-week period Jan 3–Feb 6, 2020 (Google, 2020).
Google analyses mobility trends for:
• Retail and recreation (retail): restaurants, cafes, shopping centres, theme parks, museums,
libraries, and movie theatres
• Grocery and pharmacy (grocery): grocery markets, food warehouses, farmers markets,
specialty food shops, drug stores, and pharmacies
• Parks (parks): national parks, public beaches, marinas, dog parks, plazas, and public
Gardens
• Workplaces (workplaces): places of work
• Residential (residential): places of residence
• Transit stations (transit): public transport hubs such as subway, bus, and train stations
The most relevant data for this article relates to the transit trend, is presented below (figure 2).
The diagram was prepared by the European Commission and presents data from 4 November,
2020.

63rd International Scientific Conference on Economic and Social Development – "Building Resilient Society" - Zagreb, 11-12 December, 2020
424
The largest decrease of traffic in public transport hubs was registered in Spain and amounted to
84%. French, Italian and Portuguese societies reduced their visits over 70% whereas
Lithuanians, Czechs and Swedes are located on the other end of the spectrum with 33%, 36%
and 37% decline respectively.
Figure 17: Mobility trends on 04/11/20: percentage changes from baseline: transit
(Source: European Commission)
Using the same data, it has been calculated that Australia also recorded large declines in public
transport hubs such as subway, bus, and train stations. The largest reduction occurred at the end
of April and amounted to over 60%, while at the end of November a decrease of 40% was
observed (figure 3).
Figure 18: Transit stations: How did the number of visitors change since the beginning of
the pandemic?, Nov 27, 2020
(Source: Our World in Data)

63rd International Scientific Conference on Economic and Social Development – "Building Resilient Society" - Zagreb, 11-12 December, 2020
425
2.2.2. Citymapper mobility index
The Citymapper Mobility Index is calculated by comparing trips planned in the Citymapper
application to a recent typical usage period (Citymapper, 2020). The application has allowed to
compare the mobility index of US cities most affected by the coronavirus. As in other major
cities in the world, a significant decrease in the movement of people is visible from the end of
February to the end of March. In June, there is a slow increase in mobility due to lifting of
restrictions on public transport.
Figure 19: Mobility changes in American cities in response to COVID-19
(Source: Abu-Rayash, 2020)
2.2.3. Apple mobility trend reports and Moovit Public Transit Index
Apple’s mobility trend reports show how human mobility has changed in countries and cities
worldwide since 13 January 2020 (Apple, 2020). It is designed to help mitigate the spread of
COVID-19. The reports specify three forms of mobility: driving, walking and public transport
(transit). Brazil, a country strongly affected by the coronavirus pandemic, has been selected for
the urban mobility analysis (figure 5). At the very beginning of the pandemic, a peak is visible
in travels on foot (an increase by over 60%) as well as in car travels (an increase by 40%).
Public transport journeys have been limited due to the risk of infection. Then, as a result of
lockdown, traveling was almost completely suspended (a decrease of over 60%). There is an
increase in travels from summer to autumn, but public transport remains in the greatest
regression compared to walking and driving.
Figure following on the next page

63rd International Scientific Conference on Economic and Social Development – "Building Resilient Society" - Zagreb, 11-12 December, 2020
426
Figure 20: Brazil. Change in routing requests since January 13, 2020
(Source: Apple, 2020)
More detailed data for public transport are provided by the Moovit Public Transit Index
(Moovit, 2020). Moovit analyses the repercussions of Coronavirus on public transport ridership
worldwide, relative to the typical usage before the outbreak began (the week prior to January
15th). The graph below presents 10 Brazilian cities: Sao Paulo, Rio, Belo Horizonte, Curitiba,
Porto Alegre, Fortaleza, Campinas, Recife, Brasilia, Salvador. The results are in line with data
presented by Apple. The greatest drop reached almost 80% in May for the city of Fortaleza. In
late November, the number of public transport passengers in the city of Brasilia had almost
recovered to pre-pandemic levels.
Figure 21: Impact of Coronavirus (COVID-19) on Public Transit usage in 10 Brazilian cities
(Source: Moovit)
2.3. Data from regional public transport authorities
Unlike many countries, Sweden has opted for a strategy relying mainly on recommendations
rather than mandatory restrictions. Public transport services were generally operated, however,
people were advised to avoid travel with public transport. The data obtained from regional
public transport authorities allowed to calculate the change in the number of trips in Stockholm

63rd International Scientific Conference on Economic and Social Development – "Building Resilient Society" - Zagreb, 11-12 December, 2020
427
in various modes of transport: trains, trams and LRT (Light Rail Transit), metro (underground)
and buses (Jenelius et al., 2020). The calculation of daily public transport ridership is based on
ticket validation data from the digital ticket system. Ridership for both metro and commuter
trains fell around 60% mid-March compared to the same period in 2019 (figure 7).
Figure 22: Stockholm, relative change 2020/2019
(Source: Jenelius et al., 2020)
2.4. Data from surveys of mobility
Surveys of mobility patterns have been conducted in many countries, e.g., Switzerland, Chile,
Sweden (Jenelius et al., 2020) and Poland (Borkowski et al., 2020). Citizens were asked about
travel behaviour and mode preferences. The results of one of the larger studies are presented
below (Abdullah et al., 2020). Responses were collected from various countries around the
world through an online questionnaire survey. Work was the primary travel destination for most
respondents (58%) prior to COVID-19, however, shopping became the primary purpose of
traveling for 44% of the respondents during COVID‐19. The majority of respondents (36%)
used public transport for their primary travel purposes before COVID‐19 and a sharp decline
in public transport use was observed during COVID‐19. On the other hand, the use of other
sustainable forms of transport such as cycling and walking has risen (figure 8).
Figure 23: Primary purpose of traveling before and during COVID-19 pandemic (left side).
Mode for primary outdoor trips before and during COVID-19 pandemic (right side).
(Source: Abdullah et al., 2020)
2.5. Bike-sharing ridership
The pandemic has affected bike-sharing systems in cites, nevertheless, bike-sharing systems
have proved to be more resilient than public transport systems. For example, in Budapest public
transport experienced the greatest reduction in demand (80%), while cycling (own bike) and
bike-sharing system saw the lowest decrease (23% and 2%, respectively) (Bucsky, 2020).

63rd International Scientific Conference on Economic and Social Development – "Building Resilient Society" - Zagreb, 11-12 December, 2020
428
The case-study of New York's Citi Bike noticed less significant ridership drop in comparison
to a underground (71% vs 90% ridership drop)(Teixeira, 2020). Moreover, the study reveals a
continued growth in the average trip duration, from a 13-minute daily average at the beginning
of March to a 19-minute average by the end of the month (figure 9). Additionally, the study
found compelling evidence of a possible modal transfer from some underground users to the
bike-sharing system.
Figure 24: Variation on Citi Bike average daily trip duration (minutes) versus its daily
ridership throughout March 2020
(Source: Teixeira, 2020)
3. THE EFFECTS OF COVID-19 ON THE ECONOMIC, ECOLOGICAL AND SOCIAL
DIMENSIONS OF TRANSPORT
The comprehensive effects of the pandemic will be assessed in the future, however, some have
already been observable. These effects appeal to the economic, ecological and social
dimensions of transport and have both positive and negative results. According to the paradigm
of sustainable development, humanity should strive to reduce air pollution, which has been
observed as a result of travel restrictions. In addition, in many cities around the world, adequate
urban mobility management has improved the conditions of travel for pedestrians and cyclists.
On the other hand, the observed increase in the share of private car trips contradicts the idea of
sustainable mobility.
3.1. The economic dimension
Economic activities have been largely stopped. The baseline forecast envisions a 5.2 percent
contraction in global GDP in 2020 (The World Bank Group, 2020). Important feature of the
current landscape is the historic collapse in oil demand and oil prices. All changes occurring as
a result of a pandemic have affect transport, which is one of the key sectors of the economy.
The International Civil Aviation Organization (ICAO) estimates that during the first half of
2020, compared to their original forecast, there will be an overall reduction of 47% to 58% of
seats offered by airlines, 503 to 607 million passengers, and a potential loss of gross of operating
revenues of airlines of 112 to 135 billion USD (ICAO, 2020). In the context of urban mobility,
reductions in revenues from the sale of public transport tickets and parking fees have been
noticed (Jenelius et al., 2020). Chicago has experienced a steep 52% decline in the number of
parking tickets being issued (American City and County, 2020).
3.2. The ecological dimension
The transportation sector has been halted for the past few months, resulting in significant GHG
reductions and energy savings, as the transportation industry accounts for 60% of global oil
demand (Skiba, 2019). In addition, the global outbreak of the coronavirus pandemic has led to

63rd International Scientific Conference on Economic and Social Development – "Building Resilient Society" - Zagreb, 11-12 December, 2020
429
a significant reduction of traffic and traffic-related urban air pollution. NO2 emissions were
reduced by up to 60% in the city of Santander (Aloi et al., 2020). Sudden change in NO2
emissions related to reduction of urban traffic due to infection protection measures was also
detected in Düsseldorf, Germany (Naethe et al., 2020) and in many other countries e.g. New
Zealand (8-17% decrease in PM2.5; 7-20% decrease in PM10), South Korea (10% reduction in
PM2.5 and 25% reduction in PM10) (Beria et al., 2020). Furthermore, the French study has
determined the concentration of PM2.5 and PM10 linked to COVID-19-related deaths. The
results showed evidence of a direct relationship between air pollution and COVID-19 mortality
in France, confirming previous research regarding environmental factors involved in viral
infection spread (Magazzino et al., 2020). The same results have been obtained in London:
short-term exposure to air pollution (both NO2 and PM2.5) is significantly correlated with an
increased risk of contracting and dying from COVID-19 (Sasidharan at al., 2020).
3.3. The social dimension
The ongoing COVID-19 pandemic is having a major impact on health, but has also affected
numerous social phenomena on an almost unprecedented scale. The full societal impact
COVID-19 pandemic is laid bare in urban mobility patterns. Pandemic may help to shift
policies on urban mobility towards more environmentally friendly and citizen-focused
solutions. Now, social distancing has led many municipalities to introduce new cycle paths and
widen pavements. In Turin 95 km of new cycle paths were planned and the flow of bikes
increased by 6.9% in August, compared to the same period in 2019. In Pamplona two important
axes of the city have been extended for the use of the pedestrians and cyclers. To help cyclists,
the municipality has built six modular parks, provided with charging systems for electrical bikes
(Stardust Project, 2020). The city of Milan has announced that 35 km of streets will be
transformed, with a rapid, experimental citywide expansion of cycling and walking space to
protect residents (The Guardian, 2020). Similar actions for sustainable mobility and mobility
management have been undertaken in New Zealand, Poland, Germany and many other
countries. In addition, Milan awarded a bonus of 500 euros for the purchase of a new bicycle
for residents. A positive effect of the pandemic is also a decrease in car accidents. Early
lockdown period have witnessed a downfall in road fatality in countries such as France (56%),
Norway (54%), London (36%), Ireland, Israel etc. compared to the month of 2019 (Dam et al.,
2020). Traffic accidents were reduced (by up to 67%) in city of Santadner (Aloi et al., 2020).
4. CONCLUSION
The COVID-19 pandemic has prompted authorities around the globe to impose restrictions on
transport and mobility at an unprecedented scale. The crisis has changed already people’s
transport behaviours in dramatic ways, with large reductions in aviation and public transport
use and growth in use of private cars and active transport modes (e.g., walking and bicycles).
People tend to use safer (in terms of infection) transport modes during pandemic. As lockdowns
are lifted, policy will be crucial in determining whether mobility changes triggered by Covid-
19 are positive or negative, in terms of their impacts energy use, safety and long-term
environmental and health outcomes. There is a risk of a decline in the sustainability of mobility
in urban areas. It is not known when does the demand levels for public transport systems will
recover. On the other hand, comprehensive study proved that when ridership reduces by more
than 40%, buses cannot be “greener” travel modal than cars in the post-COVID-19 future (Sui
et al., 2020). Finally, it may be crucial to monitor changes in travel habits: will teleworking
increase? Will travel patterns change for leisure, shopping, etc.?
63rd International Scientific Conference on Economic and Social Development – "Building Resilient Society" - Zagreb, 11-12 December, 2020
430
LITERATURE:
1. Abdullah, M., Dias, C., Muley, D., Shahin, Md. (2020). Exploring the impacts of COVID-
19 on travel behavior and mode preferences. Publisher: Transportation Research
Interdisciplinary Perspectives
2. Abu-Rayash, A., Dincer, I. (2020). Analysis of mobility trends during the COVID-19
coronavirus pandemic: Exploring the impacts on global aviation and travel in selected
cities. Publisher: Energy Research & Social Science
3. Airports Council International. (2020). Airport traffic. Retrieved 26.11.2020 from
https://www.aci-europe.org/44-industry-data/40-airport-traffic.html#link_tab
4. American City and County. (2020). Parking revenues: The unexpected casualty of COVID-
19. Retrieved 26.11.2020 from https://www.americancityandcounty.com/2020/11/25/
parking-revenues-the-unexpected-casualty-of-covid-19/#
5. Aloi, A., et al. (2020). Effects of the COVID-19 Lockdown on Urban Mobility: Empirical
Evidence from the City of Santander (Spain). Publisher: MDPI, Sustainability
6. Apple. (2020). Mobility Trends Reports. Retrieved 30.11.2020 from
https://covid19.apple.com/mobility
7. Arimura, M., Ha, T., Okumura, K., Asada, T., (2020). Changes in urban mobility in
Sapporo city, Japan due to the Covid-19 emergency declarations. Publisher: Transportation
Research Interdisciplinary Perspectives
8. Anderson, R.M., Heesterbeek, H., Klinkenberg, D., Hollingsworth, T.D. (2020). How will
country-based mitigation measures influence the course of the COVID-19 epidemic?
Publisher: Lancet.
9. Beria, P., Lunkar, V. (2020). Presence and mobility of the population during the first wave
of Covid-19 outbreak and lockdown in Italy. Publisher: Sustainable Cities and Society
10. Borkowski, P., Jażdżewska-Gutta, M., Szmelter-Jarosz, A. (2020). Lockdowned: Everyday
mobility changes in response to COVID-19. Publisher: Journal of Transport Geography
11. Bucsky, P. (2020). Modal share changes due to COVID-19: The case of Budapest.
Publisher: Transportation Research Interdisciplinary Perspectives
12. Citymapper. (2020). Citymapper Mobility Index. Retrieved 21.11.2020 from
https://citymapper.com/cmi
13. Dam, P., et al. (2020). COVID-19: Impact on transport and mental health. Publisher:
Journal of Transport & Health
14. European Commission. (2020). Coronavirus response: travel and transportation. Retrieved
25.11.2020 from https://ec.europa.eu/info/live-work-travel-eu/health/coronavirus-response
/travel-and-transportation_en.
15. European Commission. (2020). The effect of COVID-19 confinement policies on community
mobility trends in the EU. Retrieved 25.11.2020 from https://publications.jrc.ec.europa.eu/
repository/bitstream/JRC120972/jrc120972_covid_techreport_final.pdf
16. Fatmi, M. (2020). COVID-19 impact on urban mobility. Publisher: Journal of Urban
Management
17. Google. (2020). COVID-19 Community Mobility Reports. Retrieved 25.11.2020 from
https://www.google.com/covid19/mobility/
18. ICAO. (2020). Effects of Novel Coronavirus (Covid-19) on Civil Aviation: Economic
Impact Analysis. Retrieved 25.11.2020 from https://www.icao.int/sustainability/
Documents/COVID-19/ICAO_Coronavirus_Econ_Impact.pdf
19. International Energy Agency. (2020). Changes in transport behaviour during the Covid-19
crisis. Retrieved 25.11.2020 from https://www.iea.org/articles/changes-in-transport-
behaviour-during-the-covid-19-crisis
63rd International Scientific Conference on Economic and Social Development – "Building Resilient Society" - Zagreb, 11-12 December, 2020
431
20. Jenelius, E., Cebecauer, M. (2020). Impacts of COVID-19 on public transport ridership in
Sweden: Analysis of ticket validations, sales and passenger counts. Publisher:
Transportation Research Interdisciplinary Perspectives
21. Magazzino, C., Mele, M., Schneider, N. (2020). The relationship between air pollution and
COVID-19-related deaths: An application to three French cities. Publisher: Applied Energy
22. Matteo, C., Jessica, T.D., Marco, A., Corrado, G., Maria, L., Stefano, M., (2020). The effect
of travel restrictions on the spread of the 2019 novel coronavirus (COVID-19) outbreak.
Publisher: Science
23. Moovit. (2020). Moovit Public Transit Index. Retrieved 30.11.2020 from
https://moovitapp.com/insights/en/Moovit_Insights_Public_Transit_Index-countries
24. Naethe, P., Delaney, M., Julitta, T. (2020). Changes of NOx in urban air detected with
monitoring VIS-NIR field spectrometer during the coronavirus pandemic: A case study in
Germany. Publisher: Science of the Total Environment
25. Our World in Data. (2020). Google Mobility Trends: How has the pandemic changed the
movement of people around the world? Retrieved 25.11.2020 from
https://ourworldindata.org/covid-mobility-trends
26. Our World in Data. (2020). Public transport closures during the Covid-19 pandemic.
Retrieved 25.11.2020 from https://ourworldindata.org/grapher/public-transport-
covid?stackMode=absolute&time=2020-04-19®ion=World
27. Sasidharan, M., Singh, A., Torbaghan, M. E., Parlikad, A. K. (2020). A vulnerability-based
approach to human-mobility reduction for countering COVID-19 transmission in London
while considering local air quality. Publisher: Science of the Total Environment
28. Skiba, S. (2019). Relacje handlowo-transportowe państw Azji Centralnej u Unią
Europejską. Publisher: Przedsiębiorczość i Zarządzanie
29. Stardust Project. (2020). How the Covid-19 pandemic is changing urban mobility. Retrieved
22.11.2020 from http://stardustproject.eu/news/how-covid19-is-changing-urban-mobility/
30. Sui, Y., et al. (2020). Mining urban sustainable performance: Spatio-temporal emission
potential changes of urban transit buses in post-COVID-19 future. Publisher: Applied
Energy
31. Teixeira, J, F., Lopes, M. (2020). The link between bike sharing and subway use during the
COVID-19 pandemic: The case-study of New York's Citi Bike. Publisher: Transportation
Research Interdisciplinary Perspectives
32. The Guardian. (2020). Milan announces ambitious scheme to reduce car use after
lockdown. Retrieved 21.11.2020 from https://www.theguardian.com/world/2020/apr/
21/milan-seeks-to-prevent-post-crisis-return-of-traffic-pollution
33. The World Bank Group. (2020). The Global Economic Outlook During the COVID-19
Pandemic: A Changed World. Retrieved 25.11.2020 from https://www.worldbank.org/
en/news/feature/2020/06/08/the-global-economic-outlook-during-the-covid-19-pandemic-
a-changed-world
34. World Health Organization. (2020). Archived: WHO Timeline-COVID-19. Retrieved
23.11.2020 from https://www.who.int/news/item/27-04-2020-who-timeline---covid-19
35. Zhang, J. (2020). Transport policymaking that accounts for COVID-19 and future public
health threats: A PASS approach. Publisher: Transport Policy

63rd International Scientific Conference on Economic and Social Development – "Building Resilient Society" - Zagreb, 11-12 December, 2020
432
USING THE BALANCED SCORECARD FOR TRANSLATING
STRATEGY INTO ACTIONS AND FOR EXERCISING OF EFFECTIVE
CONTROL
Venelin Terziev
Georgi Rakovski Military Academy, Sofia, Bulgaria
University of Rousse, Rousse, Bulgaria
Kaneff University Hospital, Rousse, Bulgaria
Russian Academy of Natural History, Moscow, Russia
Marin Georgiev
Kaneff University Hospital, Rousse, Bulgaria
Olga Andreeva
Rostov State University of Economics, Rostov-on-Don, Russia
ABSTRACT
The main role of Balanced Scorecards (BSC) as a tool for strategic management and control
is associated with their essence of operationalized and synthesized expression of the strategy,
which sets good enough prerequisites for metrifying their implementation. The model of the
card, which implies identifying key factors of success and controllable parameters deriving
from them, their target values and initiatives for their implementation is considered as a good
enough basis for regulation and control over the strategy implementation.
Keywords: Balanced scorecard, Performance measurement, Strategic management, Control,
Organization
1. INTRODUCTION The very first thoughts on the concept of a Balanced scorecard prove that any organization can
be analysed through specific perspectives and the BSC model sets the strongest possible
connection between short-term operational control and a long-term strategy. This way, the
organization focuses on a set of critical key coefficients that reflect the state and tendencies in
certain planned areas. In other words, the company is forced to control and analyse everyday
operations, since they influence the long-term development and the strategic perspectives.
Therefore, the concept of a Balanced Scorecard contains three time dimensions that analyse
registered results, control the present activity and are focused on the future.
2. BALANCED SCORECARD AS A TOOL FOR STRATEGIC MANAGEMENT AND
CONTROL
The Balanced Scorecard (Fig. 1) is a way to reach a consensus and implement control as to how
to develop one organization that follows its strategy. There is an excessive number of key
coefficients in business and public sector. The difference is in focusing on a deliberately chosen
set of criteria – very few to be observed – and on using them to achieve and share a common
view of the organization`s strategy for its future development. The approved set of criteria,
formed on the basis of a necessary and reasonable balance, reflects the strategic choice of the
organization. The selected criteria can be considered as an addition to financial control and as
a means to reduce the risk of harmful short-term approach while at the same time they provide
a clear idea to the organization`s employees about their work, hidden expectations and the

63rd International Scientific Conference on Economic and Social Development – "Building Resilient Society" - Zagreb, 11-12 December, 2020
433
future of the company. Some scientists (Horvath & Partner, 2000) argue about changing the
approach from financial to strategic control, i.e. to focus attention on the overall organizational
strategy instead on a specific direction in management. The question affects the nature of the
economy more than the monetary method. A good economy implies good resource
management.
Figure 1: The Balanced Scorecard Framework
Contemporary organizations are much more than just a smart investment of capital. It is
important for every leading manager to know how to manage talent, market position and
accumulated knowledge. The perfection of a simple concept predetermines the universal
character of the BSC model and its wide application, timely demonstrating the tangible and
intangible benefits of combining financial and non-financial criteria. In most organizations the
processes of strategic planning and operational financing exist independently of each other and
separate organizational structures are involved with them. The process of strategic planning is
constant, sets long-term plans, goals and strategic initiatives and is usually implemented by
deepening significant trends registered on an annual basis. On the same basis the top
management approves the budget of the organization. It consists almost entirely of numerical
financial indicators, which usually mark the connection of the strategic plan with the
organizational goals. If an organization wants to establish a link between its actions and
strategy, its strategic planning should be linked to operational funding. “The processes of
determining strategic goals represent the aspiration of the business unit to achieve excellent
results in terms of strategic indicators of the opportunities that form its BSC” (Muller, 2000).
Organizations use resources and implement initiatives to ignore the differences between the
current situation and the indirect goals for a future period. One of the most essential alternatives
for providing real control over the strategies validity and strategic planning effectiveness is
determining specific short-term goals regarding the parameters of the BSC. These interim
controls are a real illustration of the top executive management performance about the pace and
results of current programmes and initiatives for strategic indicators. Such detailed short-term
financial planning is important, but the budget process must include the expected efficiency of
the other areas included in the card structuring. This means that the executive management must
provide, as part of integrated planning and budgeting, short-term monthly or quarterly tasks for
performance and efficiency indicators for its users, innovation and operational processes, and
systems and organization to achieve synchronization between employees. These key stages of
planning for the next year express the expectations for short-term achievements on the long-
term process of implementation of the strategy chosen by the enterprise. If the process of setting
long-term goals is carried out correctly, the short-term budgeting process will consist of
bringing the first year of the multiannual plan into current budgets for the goals and indicators
in all areas of the BSC.

63rd International Scientific Conference on Economic and Social Development – "Building Resilient Society" - Zagreb, 11-12 December, 2020
434
Targeting the necessary conference link between strategy and budget, a new direction for
improving the BSC model is emerging. In this process, two management problems are taking
place simultaneously:
• First. Increasing the operational and tactical efficiency and related budgets.
• Second. Implementation of successful strategic development through reasonable strategic
planning. The combination of the two solutions defines a new content and functionality of
the BSC as a tool for strategy management and control.
In this line of thought, the relationship between strategy and budget, strategic planning and
budgeting is a procedure based on effective analysis and detailing to make the smooth transition
from a high-level strategy to the creation of a budget for ongoing activities. The strategy defines
the course of organizational development for a 3-5 year period of its implementation, while the
annual budget provides the first year of this process and marks the links between current and
strategic goals. The BSC was originally developed to provide managers with structured
information about performance criteria based on a combination of leading and lagging
indicators. However, since its introduction, the BSC has gradually grown from a means of
organizing criteria into a strategic control mechanism. It has evolved in terms of its
construction, as well as the process of development and models for use. This evolution goes
through three stages, becoming what the author now calls a third-generation BSC. Third-
generation BSC still is a methodology for managing and assessing the progress of organizations
on their way to achieving strategic goals. It takes years of practical experience and scientific
work to overcome the drawbacks of the original model, which is most often associated with the
unsuccessful application of BSC as an effective and efficient tool for corporate governance and
control. Typical problems have already been resolved, such as lack of proprietary attitude
towards management, monitoring only financial criteria and the inability to force the
management system to develop and improve. The ideas of the third-generation BSC are based
on the following key concepts for activity management and strategic development control. The
model`s importance is based on the following points of the organizational management content:
• Causality: identifying and developing activities needed to achieve key results and
implement strategies.
• Training: using feedback to find ways to improve and refine work.
• Ownership: using consensus so that everyone knows what needs to be done and is fully
involved in the process.
• Communication: providing clear and unambiguous information to reveal the goals and
optimize the organizational activity.
A significant breakthrough during the evolution of BSC is the realization that successful use of
this tool depends not only on the use of proper methods for selection of the criteria included in
it, but also on the fact whether organizations properly implement management processes that
allow the card to be effectively used by managers. These statements cause the development of
BSC as a “framework for management and control”, which proves the hypotheses by deriving
them from the following factors:
• clear definition of “desired state” or strategic destination (positioning);
• medium-term strategic objectives, subject to assessment, decomposed into activities, results
and, if necessary, into standard perspectives (Kaplan, Norton, 2004);
• specific and clearly defined goals, interpreted on the basis of vision, mission and strategy;
• priority initiatives related to the structuring and implementation of strategic goals;
• analysis of the expectations and organizational needs and on this basis development of
criteria requirements for determining key characteristics, set as a system of criteria.

63rd International Scientific Conference on Economic and Social Development – "Building Resilient Society" - Zagreb, 11-12 December, 2020
435
Effective BSC of the latest generation are those that are developed with the active participation
of the management team who will use them to manage the enterprise. The application of a
technologically sound and appropriate development process is crucial to success. It is
recommended to use a simplified process (Kaplan, Norton, 2004), according to which the
management team itself determines the “content”, which largely implies a positive and timely
result. The appropriate and effective management and control model of BSC registers certain
gaps and problems, solution of which is a way to its improvement and enrichment in terms of
contents and functionality. Is it possible to define and develop strategic goals of the organization
to control its strategic development, by engaging all staff and so that all these actions lead to
success and stable development? BSC is a modern management and control model through
which we can accomplish this task. Together with the Balanced scorecard it is possible to
perform flexible and effective management and strategic control using not numerous yet
suitable indicators. A starting point in the implementation of effective management and control
is the balanced combination of different in nature necessary indicators reflecting the activities
of the organization and the development of a logical system such as BSC based on proven
causality. The implementation of this process and its specific details comes along with certain
issues, the analysis and solutions to which are an alternative for improving the BSC as a model
of real control. “Everyone acquainted with the life of an organization knows that there are many
control systems that affect its daily activities. However, there is a lack of a systematic
understanding of why and how these systems are used as a means to achieve certain
programmes” (Simons, 1995). By organizing their management system based on the structure
of BSC, managers can achieve their main goal - putting the strategy into action and control over
this process. When organizations turn their strategic vision into action, this crucial transition
helps them realize the real upswing and gain real benefits from developing and implementing
strategically balanced cards. The results of the initially developed BSC always lead to a series
of management processes that mobilize and reorient the organizational efforts. The
development of the initial BSC in an organization is achieved on the basis of systematic
processes that create consensus and provide clarity on how the mission and strategy can be
brought into a system of current goals and indicators. As a result of an in-depth study of good
practices among organizations that have implemented and used Balanced cards, a generalized
model of five principles (Kaplan, Norton, 2001) has been established. Organizations could
follow these principles in transforming their strategy into specific actions and implementing
real, strategic control. According to the first principle the change must begin at the highest level.
The idea is that senior management initiates implementation of the strategy, by setting the
organization`s vision and goals in the first place, by demonstrating personal interest and
engaging the staff with the forthcoming change. The second principle states that the strategy
must be interpreted, i.e. described in details, linked to deadlines and operational plans. At this
stage, an organization develops strategic cards, that analyse the connections between the
individual elements of the strategy, defines the goals and their measures and identifies strategic
initiatives. The third principle is based on the necessity of an organization to be in a state that
allows it to implement corporate strategy. At this stage it is obligatory to develop BSC with
indicators for lower in the hierarchy business units, i.e. departments, workshops, in order to
identify opportunities for synergies to achieve maximum added value. The fourth principle
expresses the need for strategy implementation to become an essential part of the activity of
each employee in the organization. This is a difficult process due to the fact that it involves the
development of individual Balanced Cards, which contain individual goals and consider the
relationship between each employee's personal contribution to the implementation of the
company's strategy. It should be noted that the practical application of Balanced cards as a form
of individual development and control has meaning and logical explanation, especially for key
individual positions (consultants, sales representatives, etc.), where their activities have a

63rd International Scientific Conference on Economic and Social Development – "Building Resilient Society" - Zagreb, 11-12 December, 2020
436
significant impact on organizational efficiency due to which the application of BSC is
financially secured and objectively necessary. An essential point here is to find the intersection
between individual and corporate values. Success at this stage is critical because although the
strategy is defined by management, its implementation depends on the staff working in the
organization. By aligning and consolidating the goals and incentives at the individual level with
those of the organization, effective transparency of communications and maximum
effectiveness of management and control is achieved. The fifth principle is of a general nature,
imperatively stating that the strategy must become an ongoing and continuously evolving
process. “It is at this point that various practices related to resource management, the process
of learning organization and the updating of control initiatives and activities are being
developed” (Botta, 2001).
3. CONCLUSION
The aforementioned statements lead to the following conclusions (Terziev, Georgiev, 2017;
Terziev et al. 2017a; Zahariev et al. 2020; Laktionova et al. 2019):
• First, the main role of the Balanced Scorecard as a tool for strategic management and control
is associated with their essence of operationalized and synthesized expression of the
strategy, which sets good enough prerequisites for metrifying its implementation. The
model of the card, which helps identify the key success factors and the resulting basic
controllable parameters, their target values and initiatives for their implementation, is
considered as a good enough basis for regulation and control over the strategy
implementation. As long as this model is considered a function of an already existing
strategy, the balanced scorecard fits perfectly into the idea of the strategy as a “big model”,
a “plan” and a “position” functioning as a tool for strategy implementation. In principle,
this role of the card serves the manifestation of control as negative feedback at the strategic
level.
• Second, the Balanced Scorecard as a tool for strategic management and control entirely fits
into the existing views on elements of the control function, including those of the leading
Bulgarian researchers. The fundamental novelty that they introduce, as mentioned above, is
related to the applied theoretical and practical approaches to operationalize the norm of the
system in a strategic aspect, i.e. in terms of the first element of the control function. In this
regard, we should emphasize the leading role of this element in the manifestation of control
in different areas and at different organizational levels, which is particularly common in
Bulgarian research and especially in those by M. Dinev. Until the emergence of Balanced
Scorecards, this element of the control function is either considered fragmentarily or is
absent in the theoretical developments on the structure of the control function in numerous
foreign sources.
• Third, the specifics of developing the Balanced Scorecard create sufficient preconditions
for their active role as a tool for effective management and control over the very process of
strategy development. This role can be significant even in the context of the implementation
of strategy concepts such as “big model”, “plan” and “position”. This is because in the
process of operationalization of the strategy and determination of the key controllable
parameters included in the card, it is required to prove the causal relationships between them
and the impact of changes in their meanings on the target results of the organization.
Experience shows that in most cases this leads to rethinking, redefining and refining the
strategy itself. In this sense, the development of the card sends feedback control signals to
the strategy itself, i.e. plays the role of positive feedback in the process of its improvement
even before the stage of its development.
• Fourth, being a generalized expression of the strategy, the card has no analogue among the
known strategic tools for clear, specific and accessible presentation of strategic intentions

63rd International Scientific Conference on Economic and Social Development – "Building Resilient Society" - Zagreb, 11-12 December, 2020
437
among the staff of the organization at all organizational levels. The chain included in the
process: “key success factors> key indicators and interconnections between them> target
values of indicators> strategic initiatives to achieve the target values”, creates extremely
favourable conditions for the development and unification of “intellectual models” in the
organization. In this context, the Balanced Scorecard can be considered as a tool for
implementation of a “learning organization” concept. From this point of view, the very
process of developing the card down the hierarchical structure of the organization can be
seen as a process of controlling the views of different employee categories about the success
factors and ways to master them. In other words, being a tool for strategic management and
control, the card creates prerequisites not only for analysis and control over behaviour, but
also for its deep conditioning in the form of "intellectual models" of success. This is again
a role of negative feedback, which contributes to the clear understanding of the strategy and
the ways for its implementation at different organization`s levels by the senior management
and initiates means to manage the perception of problems and control this whole
understanding.
• Fifth, implementation of the Balanced Scorecard as a tool for organizational communication
in accordance with the “learning organization” concept creates favourable conditions for
manifestation of control over the strategy implementation as a positive feedback. As a clear,
specific and accessible manifestation of the strategy, the card not only "transfers" strategic
intentions from top to bottom in the hierarchy of the organization, but also draws from the
bottom up the initiatives for changes in the strategy. In this sense, the Balanced Scorecard
serves as a tool mainly for controlling the adequacy of the strategy in the process of its
implementation. From this point of view, it is necessary to conclude that as a tool for
strategic control the card is able to serve equally the application of the strategy concepts
such as “big model”, “plan” and “position” and the application of the strategy concept
“emerging or developing”. This makes the card a universal tool for management and
control, which naturally fits into the implementation of modern views on strategic
management, regardless of their specifics and differences (Terziev, Stoyanov, Georgiev,
2017b-c; Terziev et al. 2017d).
LITERATURE: 1. Horvath & Partner. (2000). Balanced Scorecard umsetzen. Stuttgart, 2000.
2. Muller, A. (2000а). Strategisches Management mit der Balanced Scorecard. Stuttgart,
2000.
3. Kaplan, R., Norton, D. (2004). Strategy maps: converting intangible assets into tangible
outcomes, HBRP, 2004.
4. Simons, Robert. (1995). Levers of Control: How Managers Use Innovative Control Systems
to Drive Strategic Renewal, (Boston: Harvard Business School Press, 1995).
5. Kaplan, R., Norton, D. (2001). Having Trouble with Your Strategy? Then Map It! Harvard
Business Review, 2001, I-II.
6. Botta, V. (2001). Balanced Controlling. IS-Report 3/2001.
7. Terziev, V., Georgiev, M. (2017). Highlights of the evolution of the “Balanced
Scorecard”idea as a model for managing strategy development and control. // SOCIOINT
2017- 4th In-ternational Conference on Education, Social Sciences and Humanities 10-12
July 2017- Du-bai, UAE, OCERINT- International Organization Center of Academic
Research, Istanbul, Turkey, 2017, pp. 607-610, ISBN: 978-605-82433-1-6.
63rd International Scientific Conference on Economic and Social Development – "Building Resilient Society" - Zagreb, 11-12 December, 2020
438
8. Terziev, V., Nichev, N., Stoyanov, E., Georgiev, M. (2017a). A general principle of the
development process of balanced scorecards as an instrument of control. // Proceedings of
ADVED 2017- 3rd International Conference on Advances in Education and Social Sciences
9-11 October 2017- Istanbul, Turkey. International Organization Center of Academic
Research, www.ocerint.org, 2017, pp. 690-694, ISBN: 978-605-82433-0-9.
9. Zahariev, A., Zveryаkov, M., Prodanov, S., Zaharieva, G., Angelov, P., Zarkova, S.,
Petrova, M. (2020). Debt management evaluation through Support Vector Machines: on
the example of Italy and Greece. // Entrepreneurship and Sustainability Issues 7(3): 2382-
2393. https://doi.org/10.9770/jesi.2020.7.3(61).
10. Laktionova, O., Dobrovolskyi, O., Karpova, T. S., Zahariev, A. (2019). Cost Efficiency of
Applying Trade Finance for Agricultural Supply Chains. // Management Theory and
Studies for Rural Business and Infrastructure Development, 41(1), 62-73.
https://doi.org/10.15544/mts.2019.06.
11. Terziev, V., Stoyanov, E., Georgiev, M. (2017b). Prerequisites for the development of the
balanced scorecard model. // Scientific journal «Economics and finance». Topical issues
of contemporary science: Collection of scientific articles, C.E.I.M., Valencia, Venezuela,
2017, pp. 55-61, ISBN 978-0-9942661-1-8.
12. Terziev, V., Stoyanov, E., Georgiev, M. (2017c). Prerequisites for the implementation of
the balanced scorecard model. // Scientific journal «Economics and finance». Topical
issues of contemporary science: Collection of scientific articles, C.E.I.M., Valencia,
Venezuela, 2017, pp. 61-68, ISBN 978-0-9942661-1-8.
13. Terziev, V., Banabakova, V., Latyshev, O., Georgiev, M. (2017d). Opportunities of
application of the balanced scorecard in management and control. // Proceedings of
ADVED 2017- 3rd International Conference on Advances in Education and Social
Sciences. International Organization Center of Academic Research, www.ocerint.org,
2017, pp. 773-791, ISBN: 978-605-82433-0-9.
63rd International Scientific Conference on Economic and Social Development – "Building Resilient Society" - Zagreb, 11-12 December, 2020
439
GOVERNMENT EXPENDITURE EFFICIENCY AND
MACROECONOMIC PERFORMANCE OF BALKAN COUNTRIES:
DEA APPROACH
Presiana Nenkova
University of National and World Economy, Bulgaria
Gergana Mihaylova-Borisova
University of National and World Economy, Bulgaria
ABSTRACT
Public sector performance and efficiency is of significant interest not only to policy makers but
also to all economic agents. In recent decades, special attention has again been paid to public
sector spending which leads to high levels of economic growth, high employment, and price
stability. The last crisis periods also raise the question of better management of public
resources to achieve economic policy objectives and to foster economic recovery and
macroeconomic stability. In many countries, the main tool used to influence the exit from crises
and to stimulate the economy was government expenditures. The current study uses the non-
parametric approach Data Envelopment Analysis (DEA) to investigate and evaluate the
countries’ technical efficiency based on one input – total government expenditure in % of GDP
and several macroeconomic outputs. We measure the relative macroeconomic performance of
12 Balkan countries and compares them for the period 2007-2019. The results show that the
efficiency of the Balkan countries is decreasing over time. Increasing differences in the
countries’ efficiency is also observed together with the fact that bigger governments or
countries with higher government expenditures relative to GDP tend to be less efficient.
Keywords: efficiency, government expenditures, fiscal policy, DEA, Balkan countries
1. INTRODUCTION
Efficient use of public resources leads to higher economic growth, higher employment, and
price stability. The analysis of public sector performance and efficiency of government
spending is of particular importance since general increase in government expenditures does
not necessarily lead to an increase in public welfare and economic development (Baciu,
Botezat, 2014). The performance or efficiency of the public sector is also important with regard
to the competition for mobile factors as labor and capital, which move freely around the world.
Inefficiencies due to an oversized public sector could be attributed to the fact that part of public
funds spending provides no benefits to taxpayers. Inefficient public sectors could not attract
mobile factors and in a globalized world this would put bigger restrictions on tax revenue
collection. The crises observed in recent decades: the financial crisis that began in the United
States in 2008 and turned into a global financial crisis affecting all countries in the world; the
European debt crisis in 2012-2013, and the current economic crisis due to coronavirus pandemic
also raise the question of better budget management and efficiency of the government
expenditures. One of the main tools used to influence the exit from crises and to stimulate the
economy is government spending. After the significant strain put on government expenditure
to alleviate the consequences of economic crises the wave of consolidation undergone by public
budgets in many countries led to significant cut in essential public service delivery. One
alternative to public expenditures decrease is more efficient use of public resources and better
public sector performance, i.e. to produce better results given a certain public spending.

63rd International Scientific Conference on Economic and Social Development – "Building Resilient Society" - Zagreb, 11-12 December, 2020
440
The current study uses the non-parametric approach Data Envelopment Analysis (DEA) to
evaluate the countries’ technical efficiency based on several macroeconomic output indicators
and one input indicator. We compare the relative macroeconomic performance of 12 countries,
namely Bulgaria, Romania, Slovenia, Croatia, Greece, Albania, Serbia, Bosnia and
Herzegovina, North Macedonia, Montenegro, Kosovo and Turkey, with all or part of these
countries located within the Balkan Peninsula, during the period 2007-2019. Our research is
based on two hypotheses. The first hypothesis is that the efficiency of government expenditures
decreases over time, due to crisis periods, requiring higher state participation in the economy.
The second hypothesis is that countries with a bigger public sector or higher share of
government expenditure to GDP possess lower efficiency. The study tries to contribute to the
existing literature on efficiency of government expenditures and macroeconomic performance
of countries in two ways. First, we measure the efficiency of government expenditures and
macroeconomic performance of all countries lying on the Balkan Peninsula. Only few of Balkan
countries such as Bulgaria, Romania, Greece, Slovenia, Slovakia, have been included in some
efficiency studies conducted at European Union level (Baciu, Botezat, 2014; Halaskova et al.,
2018). Second, we cover a relatively long period of time including more than ten years, starting
in 2007. The current study is organized as follows: The second section gives a short overview
of existing literature on public sector efficiency. The specifics of the methodology used to
determine the technical efficiency of countries as a decision-making unit is presented in the
third section. The fourth section summarizes the main steps of the research conducted and
explains the results. The last section concludes.
2. LITERATURE REVIEW
Studies measuring the efficiency of governments have mainly focused on specific areas of the
public sector services provision, while studies examining the global performance of a country,
and its determinants have attracted less attention in the past. During the last ten years there is a
growing number of studies that use different techniques to measure the efficiency of
government expenditures and to assess the efficiency and effectiveness of countries’ fiscal
policy as well as countries’ macroeconomic performance as a whole. Among the economic
studies performed to measure the public sector efficiency we can distinguish several groups
based on the methodology used. The first group comprises studies, focused on the use of a
composite indicator consisting of several sub-indicators, which reflects important public sector
activities (Afroso et al., 2003; Afroso et al., 2006; Afroso et al., 2007; Baciu and Botezat, 2014;
Hauner, Kyobe, 2008). Two subtypes of research stand out. The first subtype, or the so-called
macro approach aims to calculate the efficiency of total government expenditures. The second
subtype - micro approach aims to measure the efficiency of a specific category of government
expenditures such as healthcare, research and development, education, etc. The second group
of studies is concentrated on calculating the efficiency of government expenditures using the
non-parametric method "Data envelopment analysis (DEA)" (Baciu and Botezat, 2014; Afonso
et al., 2006; Afonso et al., 2019; Halaskova et al., 2018; Raber, 2017; Hauner, Kyobe, 2008;
Wang, Alvi, 2011; Lovell et al., 1995; Mohamad, Said, 2011; Montes et al., 2019; Ouertani et
al., 2018; Boueri et al., 2014; Herrera, Ouedraogo, 2018; Herrera, Pang, 2005; Mattina,
Gunnarsson, 2007; Hu et al., 2020). The third group of studies measures the efficiency of
government expenditures through the use of the so-called parametric approach “Stochastic
Frontier Approach (SFA)” (Grigoli et. al., 2013), and the fourth group of applies another non-
parametric method, the Free Disposal Hull1 (FDH) (Herrera, Ouedraogo, 2018; Herrera, Pang,
2005; Afroso et al., 2003).
1 Data Envelope Analysis (DEA) and Free Disposal Hull (FDH) are the used nonparametric methods, used to measure
efficiency. They are based on the definition of a production frontier (Mihaylova-Borisova, 2015).

63rd International Scientific Conference on Economic and Social Development – "Building Resilient Society" - Zagreb, 11-12 December, 2020
441
Lovell et al. (1995) and Mohamad et al. (2011) apply Data Envelopment Analysis (DEA)
method for the purposes of the macroeconomic performance assessment by defining almost the
same outputs and inputs. Based on Lovell et al. (1995) who concluded that DEA "... is fully
appropriate for the analysis of the macroeconomic performance" of the countries, we also apply
DEA to calculate the efficiency of the Balkan countries for the period of 2007 through 2019.
3. METHODOLOGY AND DATA USED
In order to measure the efficiency of decision-making units it is first necessary to decide on the
approach to construct a best practice frontier and second to define the appropriate set of inputs
and outputs.
3.1. Data Envelopment Analysis
The technique used in current study for the purpose of technical efficiency measurement of
government expenditures is the non-parametric approach Data Envelopment Analysis (DEA).
The DEA approach is a method, based on liner programming for efficiency measurement of
respective production units, so-called decision-making units (DMUs), in relation to a specific
efficiency benchmark derived from the most efficient units included in the model. The most
efficient units define the production frontier. The DEA approach is usually applied to non-profit
units, in particular universities, hospitals, etc., but in the last thirty years it is actively applied
for profit-making units. In the present study government is considered as a DMU or producer,
using specific inputs in order to produce the respective amount of outputs. The DEA approach
is not based on a preliminary formulation of the production function form. Thus, there is no
possibility of error in this respect. However, the approach has a strong dependence on extreme
observations, which makes it difficult to distinguish whether the deviation from the production
frontier, defined by the model, is due to inefficiency or random errors. The DEA approach has
a number of advantages. One of them is the ability to use multiple inputs and outputs without
specifying the significance of these factors (Kumar, Gulati, 2008; Lin, Lee, Chiu, 2009). In
addition, the DEA approach can be used to analyze relatively small samples of production units.
So, it is appropriate to use the DEA approach for our sample comprising 12 Balkan countries
instead of methods such as the Stochastic Frontier Approach (SFA), based on predefinition of
the production function such as the Cobb-Douglas production function or another type of
production function. The method uses inputs and outputs of the production units. It selects the
units, lying on the efficiency frontier and measures the efficiency of the individual units in
relation to it. There are two forms of the method in particular output-oriented DEA approach
and input-oriented DEA approach. The output-oriented DEA approach minimizes inputs to
achieve the specific outputs. The input-oriented DEA approach maximizes outputs by keeping
inputs at their current levels. The DEA approach calculates the technical efficiency of the
production units, which takes value of 0 to 1. The production units, having technical efficiency
of 1, lie on the production frontier. Production units can work under constant return to scale
(CRS) or under variable return to scale (VRS). If the production units use one input in order to
produce one output it is effective if it lies on the production frontier. On Figure 1, production
units A, B and C are technically efficient, but they produce with a different return to scale.
Production unit A is technically efficient, but it lies on this part of the production frontier, which
corresponds to an increasing return to scale. Production unit B is technically efficient, but it lies
on this part of the production frontier, which corresponds to a decreasing return to scale.
Production unit C is technically efficient and operates at technologically optimal scale of
production or at constant return to scale.

63rd International Scientific Conference on Economic and Social Development – "Building Resilient Society" - Zagreb, 11-12 December, 2020
442
Figure 1: Constant and variable return to scale
(Source: Coelli et al. (2005), Nenovsky, Mihaylova, Ivanov (2008))
3.2. Data used
The study uses annual data for 12 Balkan countries, in particular Bulgaria, Romania, Slovenia,
Croatia, Greece, Albania, Serbia, Bosnia and Herzegovina, North Macedonia, Montenegro,
Kosovo and Turkey. The period covered by the study is 2007-2019. The macroeconomic
performance of a country is characterized by main macroeconomic indicators such as economic
growth rate, inflation, measured by the consumer price index, employment and trade balance,
which are the objectives of the country’s economic policy. The objectives could be reached by
using the monetary policy and fiscal policy. As the purpose of the paper is to investigate the
efficiency of the government sector in Balkan countries, the fiscal policy performed by the
government will be taken into consideration. For the purpose of the study one input, in
particular government expenditures as a % of GDP, will be used, as well as four outputs. We
use the methodology applied by Mohamad and Said (2011). Similar approach to define inputs
and outputs was used by Lovell et al. (1995).
The variables used are:
Input (X): Total government expenditures as % of GDP.
Output 1 (Y1): GDP, real growth rate, %.
Output 2 (Y2): The ratio of exports to imports, used as a proxy for trade balance.
Output 3 (Y3): Inflation, measured by consumer price index (CPI), annual, %.
Output 4 (Y4): Employment to population ratio, 15+, total (%).
The standard deviation of the selected indicators is presented on Table 1. In respect to the value
of the government expenditures to GDP there is a high standard deviation among Balkan
countries in the period 2007-2017. There is high standard deviation in respect to the GDP
growth rate in the period 2008-2013 and in respect to the employment ratio in the period 2007-
2013.
Table following on the next page
B

63rd International Scientific Conference on Economic and Social Development – "Building Resilient Society" - Zagreb, 11-12 December, 2020
443
Public expenditures to
GDP, %
GDP growth
(%)
Exports to
Imports Inflation
Employment
to population
ratio (%)
2007 8,39 1,43 0,18 2,36 9,10
2008 7,89 3,06 0,20 2,96 9,29
2009 8,02 3,44 0,20 2,91 8,49
2010 8,04 2,99 0,19 2,31 8,16
2011 8,51 3,46 0,21 2,59 7,91
2012 8,66 2,66 0,22 2,24 7,89
2013 11,07 2,04 0,22 2,61 6,93
2014 8,19 1,40 0,26 2,77 7,25
2015 8,40 1,30 0,28 2,46 7,76
2016 7,25 1,28 0,28 2,45 7,17
2017 6,72 1,63 0,34 2,80 7,13
2018 6,57 1,04 0,61 4,25 7,43
2019 6,67 1,01 0,83 4,08 7,14
Table 1: Standard deviation of indicators
(Source: Authors’ calculations)
Balkan countries reported relatively high economic growth rate for the period 2007-2019. On
average they were less affected by the global financial crisis - in 2009 the Balkan countries
reported an economic decline of 2.9%, which made their recovery easier, while the EU
countries registered a drop of 4.3%, according to the Eurostat’s data. During the period under
review among the top performers with respect to economic growth were Kosovo, Romania and
Albania (Figure 2).
Figure 2: Average economic growth rate, 2007-2019
(Source: World Bank, Authors’ calculations)
Albania and Romania also were the countries that registered high employment to population
ratio, characterized also with price stability (the average inflation of 2.3% was reported in
Albania in the period 2007-2019 and 2.2% in Romania) (Figure 3 and Figure 4).
-2
-1
0
1
2
3
4
5

63rd International Scientific Conference on Economic and Social Development – "Building Resilient Society" - Zagreb, 11-12 December, 2020
444
Figure 3: Average employment to population ratio, 2007-2019
(Source: World Bank, Kosovo Agency of Statistics2, Authors’ calculations)
Figure 4: Average inflation, 2007-2019
(Source: World Bank, Authors’ calculations)
Figure 5: Exports to imports,2007-2019
(Source: World Bank, Authors’calculations)
Turkey is the top performer in respect to exports to imports ratio, showing its export orientation
(Figure 5), especially during the years 2015 through 2019, which contributed to a higher
economic growth rates during these years.
2 For the purpose of employment measurement, the national methodology is used, due to lack of data, based on the
International Labour Organization’s methodology.
0102030405060
0
2
4
6
8
10
12
00.20.40.60.8
11.21.41.6
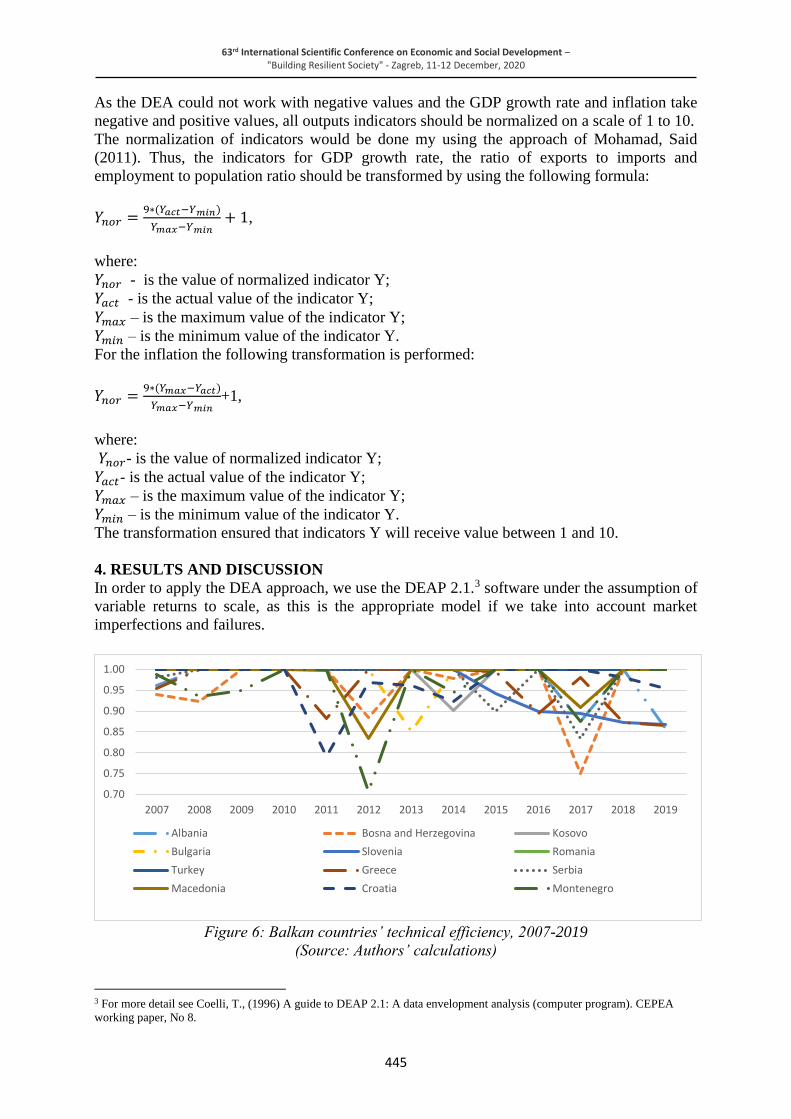
63rd International Scientific Conference on Economic and Social Development – "Building Resilient Society" - Zagreb, 11-12 December, 2020
445
As the DEA could not work with negative values and the GDP growth rate and inflation take
negative and positive values, all outputs indicators should be normalized on a scale of 1 to 10.
The normalization of indicators would be done my using the approach of Mohamad, Said
(2011). Thus, the indicators for GDP growth rate, the ratio of exports to imports and
employment to population ratio should be transformed by using the following formula:
𝑌𝑛𝑜𝑟 =9∗(𝑌𝑎𝑐𝑡−𝑌𝑚𝑖𝑛)
𝑌𝑚𝑎𝑥−𝑌𝑚𝑖𝑛+ 1,
where:
𝑌𝑛𝑜𝑟 - is the value of normalized indicator Y;
𝑌𝑎𝑐𝑡 - is the actual value of the indicator Y;
𝑌𝑚𝑎𝑥 – is the maximum value of the indicator Y;
𝑌𝑚𝑖𝑛 – is the minimum value of the indicator Y.
For the inflation the following transformation is performed:
𝑌𝑛𝑜𝑟 =9∗(𝑌𝑚𝑎𝑥−𝑌𝑎𝑐𝑡)
𝑌𝑚𝑎𝑥−𝑌𝑚𝑖𝑛+1,
where:
𝑌𝑛𝑜𝑟- is the value of normalized indicator Y;
𝑌𝑎𝑐𝑡- is the actual value of the indicator Y;
𝑌𝑚𝑎𝑥 – is the maximum value of the indicator Y;
𝑌𝑚𝑖𝑛 – is the minimum value of the indicator Y.
The transformation ensured that indicators Y will receive value between 1 and 10.
4. RESULTS AND DISCUSSION
In order to apply the DEA approach, we use the DEAP 2.1.3 software under the assumption of
variable returns to scale, as this is the appropriate model if we take into account market
imperfections and failures.
Figure 6: Balkan countries’ technical efficiency, 2007-2019
(Source: Authors’ calculations)
3 For more detail see Coelli, T., (1996) A guide to DEAP 2.1: A data envelopment analysis (computer program). CEPEA
working paper, No 8.
0.70
0.75
0.80
0.85
0.90
0.95
1.00
2007 2008 2009 2010 2011 2012 2013 2014 2015 2016 2017 2018 2019
Albania Bosna and Herzegovina Kosovo
Bulgaria Slovenia Romania
Turkey Greece Serbia
Macedonia Croatia Montenegro

63rd International Scientific Conference on Economic and Social Development – "Building Resilient Society" - Zagreb, 11-12 December, 2020
446
The information presented on fig.6 depicts an increasing difference between the estimated
technical efficiency scores during the time period under review, i.e. there is a divergence of the
technical efficiency of Balkan countries. After 2010 the efficiency scores of the following three
countries – Bosna and Herzegovina, Montenegro and Greece are in contrast with the scores of
the remaining countries.
Figure 7: Technical efficiency, 2007-2019
(Source: Authors’ calculations)
The number of efficient units, lying on the production frontier, decreases from 12 in 2010 to 8
in 2019. Thus, the overall efficiency of Balkan countries also drops from 1 in 2010 to 0.962 in
2019 (Figure 7), which means that the countries used effectively all resources in 2010 and
ineffectively 3.8% of its inputs in 2019 to produce the respective level of outputs.
The countries with the highest technical efficiency of 1 during the period under review and
lying on the production frontier, are Romania and Turkey. Albania and Kosovo are also among
the top performance, having average technical efficiency of 0.99. The main feature of these
countries as compared with the other Balkan countries (Bulgaria, Slovenia, Croatia, Greece,
Serbia, Bosnia and Herzegovina, North Macedonia and Montenegro) is the smaller public
sector and the lower government expenditures as % of GDP (Figure 8).
Figure 8: Government expenditures in % of GDP, 2007-2019
(Source: World Bank, IMF, European Commission, Authors’ calculations)
Romania, Turkey, Albania and Kosovo have average technical efficiency of 0.99 and their
government expenditures as a % of GDP accounted for about 32% on average for the period
2007-2019. At the same time, the other countries have lower technical efficiency with
government expenditures accounting for 43.6% of GDP on average for the whole period.
Bosnia and Herzegovina, Greece and Montenegro are the countries, having the worst average
0.90
0.92
0.94
0.96
0.98
1.00
2007 2008 2009 2010 2011 2012 2013 2014 2015 2016 2017 2018 2019
25.0
30.0
35.0
40.0
45.0
50.0
2007 2008 2009 2010 2011 2012 2013 2014 2015 2016 2017 2018 2019
Romania, Turkey, Kosovo, Albania
Others (Bulgaria, Slovenia, Croatia, Greece, Serbia, Bosnia and Herzegovina, North Macedonia and Montenegro)

63rd International Scientific Conference on Economic and Social Development – "Building Resilient Society" - Zagreb, 11-12 December, 2020
447
efficiency during the period under review – on the average the share of their government
expenditures in GDP is about 47%. Thus, we could come to the conclusion that countries, that
have higher government expenditures relative to GDP or so-called large governments have
lower countries’ efficiency.
5. CONCLUSION
Using the DEA approach, we have estimated the technical efficiency of government
expenditures of 12 Balkan countries, in particular Bulgaria, Romania, Slovenia, Croatia,
Greece, Albania, Serbia, Bosnia and Herzegovina, North Macedonia, Montenegro, Kosovo and
Turkey. The years covered is characterized by the presence of two crisis periods - the global
financial crisis in 2008 and the European debt crisis in 2012-2013. The results show that the
Balkan countries reported a decrease in their technical efficiency during the years 2007 through
2019, starting from relatively high technical efficiency scores in 2007 and reaching its lowest
level in 2017. In addition, there was a divergence of the technical efficiency of the Balkan
countries during the period under review. The number of efficient countries, which lie on the
production frontier decrease over time. Countries, which had higher government expenditures
as a % of the GDP, had lower technical efficiency in particular Bosnia and Herzegovina, Greece
and Montenegro, showing worse macroeconomic performance as an objective of their fiscal
policy.
LITERATURE:
1. Afonso, A, Schuknecht, L., Tanzi, V. (2003) Public sector efficiency: an international
compariso, European Central Bank, Working paper 242.
2. Afonso, A, Schuknecht, L., Tanzi, V. (2006) Public sector efficiency. Evidence for new eu
member states and emerging markets, Working paper series, No 581, January.
3. Afonso, A., Schuknecht, L., Tanzi, V. (2007) Public Sector Efficiency: An International
Comparison, Fraser Alert.
4. Afonso, A., Jalles, J., Venancio, A. (2019) Taxation and Public Spending Efficiency: An
International Comparison, REM working paper series, 080-2019.
5. Baciu, L. Botezat, A. (2014) A Comparative Analysis of the Public Spending Efficiency of
the New EU Member States: A DEA Approach
6. Boueri, R., Dowell, M., Pineda, E., Bastos, F. (2014) Analysis of public spending. An
evaluation methodology for measuring the efficiency of Brazilian state spending on
education. Inter-American Development Bank, Discussion Papers, 361.
7. Coelli, T., (1996) A guide to DEAP 2.1: A data envelopment analysis (computer program).
CEPEA working paper, No 8.
8. Coelli T., Rao, D.S. P., O’Donnell Chr., Batesse, G. An introduction to efficiency and
productivity analysis. Springer, 2005.
9. Grigoli, Fr., Kapsoli, J. (2013) Waste Not, Want Not: The Efficiency of Health Expenditure
in Emerging and Developing Economies. IMF Working paper, 187.
10. Hauner, H., Kyobe, A. (2008) Determinants of Government Efficiency, IMF working
papers, 228.
11. Halaskova, М., Halaskova, R., Prokop, V. (2018) Evaluation of Efficiency in Selected
Areas of Public Services in European Union Countries, Sustainability, 10.
12. Herrera, S, Ouedraogo, A (2018) Efficiency of Public Spending in Education, Health, and
Infrastructure. An International Benchmarking Exercise. World Bank Group, Policy
Research Working Paper, 8586.
13. Herrera, S., Pang, G. (2005) Efficiency of Public Spending in Developing Countries: An
Efficiency Frontier Approach. World Bank Policy Research Working Paper 3645, June.

63rd International Scientific Conference on Economic and Social Development – "Building Resilient Society" - Zagreb, 11-12 December, 2020
448
14. Hu, Y.,Wu, Y., Zhou, W., Li, T., Li, L. (2020) A three-stage DEA-based efficiency
evaluation of social security expenditure in China. PLOS one.
15. Kumar G., Gulati, R. (2008) An examination of technical, pure technical, and scale
efficiencies in Indian public sector banks using Data envelopment analysis. Eurasian
Journal of Business and Econometrics, 1(2) 33-69.
16. Lin, Tyr., Chia-Chi Lee, Tscui-Fen Chiu. (2009) Application of DEA in analyzing a bank’s
operating performance. Expert systems with applications, 36.
17. Lovell, C. A. K., Pastor, J. T., Turner, J. A. (1995) Measuring macroeconomic performance
in the OECD: A comparison of European and non-European countries, European Journal
of Operational Research, 87, pp. 507-518.
18. Mattina, T., Gunnarsson, V. (2007) Budget Rigidity and Expenditure Efficiency in
Slovenia. IMF Working paper, 131.
19. Mihaylova-Borisova, G. (2014) Bank efficiency and the economic growth in terms of the
currency borad in Bulgaria. Publishing complex – UNWE [in Bulgarian].
20. Mohamad, N. H., Said, F. B. (2011) Assessing Macroeconomic Performance of OIC
Member Countries Using Data Envelopment Analysis, DEA, Journal of Economic
Cooperation and Development, 32, 4, pp. 21-50.
21. Montes, G., Bastos, J., Oliveira, A. (2019) Fiscal transparency, government effectiveness
and government spending efficiency: Some international evidence based on panel data
approach. Economic Modeling, 79, pp. 211-225.
22. Nenovsky, N., Mihaylova, G., Ivanov, M. Evalution of the banks’ efficiency during the
twenties: a DEA approach. Greece Central Bank, Working Papers, 82, 2008.
23. Ouertani, M., Naifar, N., Haddad, H. (2018) Assessing government spending efficiency and
explaining inefficiency scores: DEA-bootstrap analysis in the case of Saudi Arabia. Cogent
Economics&Finance, 6:1.
24. Rabar. D, (2017), An overview of data envelopment analysis application in studies on the
socio-economic performance of OECD countries, Economic Research.
25. Wang, E., Alvi, E. (2011) Relative Efficiency of Government Spending and Its
Determinants. Evidence from OECD and Asian Countries.

63rd International Scientific Conference on Economic and Social Development – "Building Resilient Society" - Zagreb, 11-12 December, 2020
449
A FLEXIBLE TIME MANAGEMENT MODEL PROPOSAL
Luis Filipe Sardinha
Instituto Superior de Administração e Línguas,
CIISAL (ISAL Research Center),
Rua do Comboio nº 5 - 9050–053 Funchal – Madeira, Portugal
Aurea Sousa
Universidade dos Açores,
CEEAplA (Centre of Applied Economics Studies of the Atlantic),
Ponta Delgada Campus,
Rua de Mãe de Deus 9500-321 Ponta Delgada, Portugal
Eduardo Leite
Universidade da Madeira, School of Technology and Management,
CiTUR (Center for Research, Development and Innovation in Tourism),
Penteada University Campus,
9020-105 Funchal | RAM, Portugal
Humberto Nuno Rito Ribeiro
ESTGA, GOVCOPP, Universidade de Aveiro, Santiago University Campus,
3810-193 Aveiro, Portugal
Andreia Carvalho
Instituto Superior de Administração e Línguas, CIISAL (ISAL Research Center),
Rua do Comboio nº 5 - 9050–053 Funchal – Madeira, Portugal
ABSTRACT
The current globalized working context, the complexity of organizations, the existence of teams
with heterogeneous knowledge and skills, multidisciplinary academics, knowledge workers,
and the uniqueness of labour, make it necessary for the employee to have prior self-recognition
in favour of better time management (TM). The main objective of this work is to present a
proposal for a new flexible TM model, which considered the comparative analysis of different
TM models, as well as the study of Philip Zimbardo’s time perspectives. For this purpose, the
strengths and weaknesses of several models in the literature were analysed, in order to build
an improved proposal, essentially in terms of time and individuality. In fact, in general, it was
found that the current models do not distinguish between different temporal perspectives, not
alluding to the uniqueness of each human being. Thus, to overcome some of the limitations of
the current existing models, the proposed model is based on three pillars: time perspective (TP),
self-recognition and TM behaviours. The preliminary results of the investigation indicate that,
in this way, the proposed flexible time management model may become a more suitable
personalized tool.
Keywords: Time management models, Time perspective, Decision-making, Time management,
Behaviour and Self-recognition

63rd International Scientific Conference on Economic and Social Development – "Building Resilient Society" - Zagreb, 11-12 December, 2020
450
1. INTRODUCTION
Despite the contemporaneousness of the subject, time management (TM) was already discussed
in the 1950s and 1960s by several authors, with proposals for new ways of dealing with time
issues (e.g., Drucker, 2019; Lakein, 1974 ; Mackenzie & Nickerson, 2009). The growing
concern over TM is evident in theoretical and practical publications (e.g., Aeon & Aguinis,
2017; Boniwell & Osin, 2015; Claessens, Van Eerde, Rutte, & Roe, 2007). Some authors’
approach focuses on the need to incorporate time into theoretical models. On the other hand,
there are authors who focus on how people in organizations manage their time and how their
effort can be improved (Claessens, Van Eerde, Rutte, & Roe, 2004). These authors
demonstrated that TM behaviours have a positive effect on perceived time control, job
satisfaction, stress reduction, job performance, although some results are contradictory.
According to Aeon & Aguinis (2017), the investigations do not consider the structures and time
norms of organizations, therefore they produce inconsistent conclusions about whether TM
actually has a positive effect on job performance. Time-related individual differences show that
some people are less likely to benefit from training in TM. Temporal decision-making shows
that some by-products of training in TM can be harmful in terms of job performance. It should
also be noted that future research should highlight the extent to which time-related individual
differences (e.g., time perspective) affect TM. In general, the purpose of time management is
to apply a limited time to the process of achieving life goals and achieving better results,
efficiency and effectiveness. In other words, this effect is the result of the determined
expectation, efficiency is obtained at the lowest cost and performance is the best expected result
at the lowest cost. It is clear, therefore, that scientific and reasonable time management will
have an important impact, and even a decisive influence, on the quality of life and the
achievement of life goals (Wu, 2018). The employees of an organization play an important role
(e.g., Sousa, Batista, Medeiros, & Bacelar-Nicolau, 2017). According to Sousa (2009), we live
in a “society of organizations”. In this context, emerging organizations, as well as those that
operate in the market, in order to survive and stand out from the competition, must present
competitive advantages over third parties. Besides these reasons, organizations must be able to
sustainably deliver more value to their customers. It is in this context that this research is
conducted. The objective is to develop a proposal for a flexible TM model based on a set of
good TM practices duly analysed. As specific objectives, the following were distinguished:
planning and systematizing a set of good TM practices. This paper presents, in the first section,
a theoretical framework, followed by the methodology. The results are presented afterwards.
Finally, following the conclusions, TM limitations are discussed and suggestions regarding
future research developments are outlined.
2. LITERATURE REVIEW
2.1. Organizational culture
An organization reveals itself as a social group in which there is a functional division of labour
and which aims to achieve, through its synchronized performance, certain objectives. From the
notion of organization, three essential characteristics are highlighted: physical resources,
human resources and organizational structure. Its efficiency and effectiveness depend on the
correct allocation of available means and resources. One of the biggest challenges for an
organization is to achieve its objectives and those of its employees, so before entering the
market, an organization must define the foundations to perpetuate itself. The set formed by the
mission, vision and values summarizes the organization's identity, its culture. Bigliardi,
Dormio, Galati, & Schiuma (2012) mention that one of the factors that can influence the
relationship between organizational commitment and job satisfaction is organizational culture.
However, organizational culture differs from one organization to another.

63rd International Scientific Conference on Economic and Social Development – "Building Resilient Society" - Zagreb, 11-12 December, 2020
451
Matsumoto & Juang (2017) conventionally explain culture as a set of values, attitudes and
behaviours that are shared by a group of people and communicated between generations.
Likewise, more recent studies on organizational culture have focused more on intangible
qualities, such as values, behaviours and attitudes, which help in decision-making and
development processes (Bendak, Shikhli, & Abdel-Razek, 2020). Thus, a leader must take these
variations into account and understand whether to focus on the entire organizational culture or
assess different subcultures to determine where there are points in common.
2.2. Time Perspective
The time perspective (TP), measured with the ZTPI (Zimbardo Time Perspective Inventory), is
considered a variable that considers individual differences, such as personality (Shores & Scott,
2007). TP allows individuals to organize their daily lives in a coherent, orderly and meaningful
way, translating into an “essential cognitive process, through which people receive, interpret
and negotiate their physical and social worlds” (Holman & Zimbardo, 2009). According to
Keough, Zimbardo, & Boyd (1999), TP “is the process, often unconscious, by which the
continuous flow of personal and social experiences is decomposed or used in selected categories
or time frames that help to give order, coherence and meaning to these events”. The ZTPI is a
structured questionnaire that includes motivational, emotional, cognitive and social processes
that determine TP (Zimbardo & Boyd, 1999). According to these authors, the exploratory factor
analysis of the different dimensions revealed five main factors: Past-Negative (PN) - negative
and aversive view of the past; Present-Hedonistic (PH) - hedonistic and risk-taking attitude
towards time and life, with little concern for future consequences; Future (F) - individuals
focused on future goals and rewards. They attach importance to the consequences,
contingencies and results of current decisions; Past-Positive (PP) - reflects a warm, pleasant,
sentimental and nostalgic attitude towards the past, with an emphasis on maintaining
relationships with family and friends; Present-Fatalistic (PF) - fatalistic, helpless and hopeless
attitude towards life and the future. Different time perspectives are associated with different
health and risk behaviours. The PP perspective was positively associated with positive
affection, less anxiety, life satisfaction and friendliness (Hamilton, Kives, Micevski, & Grace,
2003) and negatively associated with low levels of life satisfaction, depression, unhappiness,
family conflicts and low social support (Desmyter & De Raedt, 2012; Holman & Zimbardo,
2009; Zhang & Howell, 2011). PN presents a negative and aversive view of the past (Zimbardo
& Boyd, 2008). Individuals with a PH dimension are positively associated with risk-seeking
behaviours, alcohol and drug use (e.g., Themis Apostolidis, Fieulaine, Simonin, & Rolland,
2006; Fieulaine & Martinez, 2010; Keough, Zimbardo, & Boyd, 1999). The PF perspective is
positively associated with destructive health behaviours, aggression, anxiety, suicidal
tendencies and depression (e.g., Henson, Carey, Carey, & Maisto, 2006; Laghi, Baiocco,
D'Alessio, & Gurrieri, 2009) and physical activity (Hamilton et al., 2003) and negatively
associated with the consideration of future consequences (Zimbardo & Boyd, 1999), academic
results (Mello & Worrell, 2006) and environmental behaviour (Corral-Verdugo, Fraijo-Sing, &
Pinheiro, 2006). The Future perspective is positively associated with superior academic
performance, less risky behaviour, self-control and protective behaviours and health promotion
(e.g., exercise, diet) (e.g., Hamilton, Kives, Micevski, & Grace, 2003), self-efficacy,
motivation, organizational skills, sense of responsibility and planning for academic activities
(e.g., Cheng, Shein, & Chiou, 2012; Mello & Worrell, 2006), and environmental attitudes and
behaviours (Corral-Verdugo et al., 2006). On the other hand, the Future dimension is negatively
correlated with news and the search for feelings, anxiety and depression (Zimbardo & Boyd,
1999), age (Hamilton et al., 2003), substance use (Keough et al., 1999) and risky driving
(Zimbardo, Keough, & Boyd, 1997). The temporal dimensions, expressed by the five
dimensions of the ZTPI, demonstrate that individuals can differ from each other in terms of the

63rd International Scientific Conference on Economic and Social Development – "Building Resilient Society" - Zagreb, 11-12 December, 2020
452
degree to which they fit into a specific dimension. Human behaviour slightly presents all TP
dimensions instead of a pure expression of any particular dimension (Zimbardo & Boyd, 2008).
However, Zimbardo & Boyd (1999) state that when one perspective is predominant over the
others, a skewed and dysfunctional TP appears. On the other hand, a balanced TP allows the
flexibility to switch between different time perspectives, depending on the situation, needs and
values. These authors present an ideal time profile, supported by different investigations: High
"Past-Positive" perspective; Moderate-high "Future” and "Present-Hedonistic" perspectives;
Low “Past-Negative” and “Present-Fatalistic” perspectives. This profile has differentiating
advantages: (i) a sense of a positive past allows to develop roots and to know one's individuality
over time and places. It provides a sense of continuity in life and allows being connected to the
family, tradition and cultural heritage; (ii) a future perspective allows us to imagine a future full
of hope, optimism and power. The future offers the ability to deal with unexpected challenges
that may come one’s way; (iii) a hedonistic present generates energy and joy at being alive.
This energy leads to exploring people, places and oneself. The hedonistic present is an
affirmation of life, in moderation, as it opens the senses to the appreciation of nature and the
pleasure of human sexuality. Several studies seek to analyse the equilibrium between balanced
temporal perspectives and temporal orientations, and it should be noted that some of these
investigations suggest that individuals with balanced temporal perspectives have a higher level
of subjective well-being compared to less balanced ones (e.g., Boniwell et al., 2010; Stolarski
et al., 2016; Jia Zhang, Howell, & Stolarski, 2013). Bajec (2019) explored the relationship
between various time perspectives and TM behaviours (setting goals and priorities,
programming and planning, preference for organization and perceived control of time), in order
to determine whether TP is an indicator of TM behaviours and TM behaviours are predicted
beyond the five major personality traits. It was demonstrated that the F, PH and PN perspectives
foresee the establishment of goals and priorities and the scheduling and planning; the PF, F and
PH perspectives predict the preference for the organization, and the PF perspective predicts the
perceived control of time beyond the five major personality factors. These authors refer that the
time perspective F is the one that most contributes to explain the behaviours of TM, followed
by the perspectives PH, NP and PF. Future-oriented individuals invest more time in planning,
organizing and understanding that they are in control of time. PH promotes organization and
goal setting, while decreasing the preference for organized work. PN orientation, on the other
hand, results in a low control of perceived time and a low preference for organization.
2.3. Decision in the organizational context
The decision-making process within an organization is a complex, multifaceted, uncertain
activity and with a certain degree of risk. However, decision-making is a competency and
competencies can be improved. The more experienced in decision-making, the more familiar
with the tools and processes that improve confidence (Ahmed & Omotunde, 2012). Varlamova
(2008) sought to understand the relationship between TM and decision processes and to identify
which aspects of the decision processes are related to TM. The results indicated that the
effectiveness of the decision processes depends partially on the factors of TM. From a practical
perspective, "the results identified aspects of TM (e.g., setting goals, perceived control of time,
the role of organizational supervision) that seem to positively affect decision-making
processes".
2.4. Time Management Models - Considerations about some models
Proper use of time is critical in terms of performance in several areas (Muste, 2019). This author
states that the idea of TM goes beyond its control, moving towards improving the quality of life
of individuals. The theme of the TM deserved the attention of contemporary society, with
several authors proposing different TM models (Jianing Zhang & Hailong, 2018).

63rd International Scientific Conference on Economic and Social Development – "Building Resilient Society" - Zagreb, 11-12 December, 2020
453
Some of these models are referenced in Table 1, which was developed based on the research
conducted by Gilberto Flores (2011). Although they have similar views, these models have
some divergences in terms of methodology, elements and terminology.
TM Model’s Authors
Main Points
Addressed Brief description of the variables
La
kei
n (
197
4)
Hu
mm
el (
20
13
)
Ma
can
(1
99
4)
Co
vey
(2
01
7b
)
Dru
cker
(2
01
9)
Sei
wer
t et
al.
(20
08
)
Cy
gle
r (2
005
)
Ba
rbo
sa (
20
18
)
All
en (
201
8)
TP It allows to organize daily life in a
coherent, orderly and meaningful
way, translating into an “essential
cognitive process through which
people receive, interpret and
negotiate their physical and social
worlds” (Zimbardo & Boyd, 2008).
Paradigm of
importance
Covey (2017b), through the TM
matrix, formalizes that human
activities can be guided by urgency
and / or importance. It is intended to
change the paradigm from urgent to
important, starting to value the time
factor and placing priorities in first
place.
X X X X X
Mission, values
and objectives
Defining the mission, vision and
personal goals. Vision is essential to
bring a sense of effectiveness to the
management of daily activities.
X X X X X
Annual roles
and goals
Roles must be defined based on the
mission, vision and objectives,
assuming that the achievement of
goals and activities, covering the
various areas and individual
dimensions, enables a balanced and
quality life. Goal setting is essential
for daily actions.
X X X X
Planning It can be done at different levels
(strategic, tactical and operational). It
is an indispensable role in the
effective TM process.
X X X X X X X X
Prioritization Prioritizing activities from a weekly
or daily perspective X X X X X X
Daily execution Performing activities daily. X X X X X X X X
Organization Organizing environments, as well as
daily information. X X X X X
Denial and
delegation of
tasks
Essential to deal with excess daily
tasks. X X X X X
Behavioural
aspects
Most TM models mention the
influence of the way individuals deal
with daily activities, different ways
and behaviours, and how to deal with
procrastination.
X X X X X X
Control and
evaluation
Checking for deviations or non-
conformities and making the
necessary corrections.
X X X
Table 1: Main points covered in the TM models
(Source: Adapted from Gilberto Flores, 2011)

63rd International Scientific Conference on Economic and Social Development – "Building Resilient Society" - Zagreb, 11-12 December, 2020
454
Most of the aspects presented are referred to in the models considered in this analysis. However,
it should be noted that none of the models presented refers to the temporal perspective.
Regarding Lakein's ABC model, it is not functional. At the end of the day, individuals
performed many activities A and some B, but rarely C (they are optional and often set aside).
There is some sense of frustration and failure when activities A and B are not carried out
(Barbosa, 2018). Hummel does not present a complete TM model, focusing only on the
planning, prioritization and importance of activities / tasks, on a daily and / or weekly basis.
Macan, through three TM pillars, found that the perceived control of time influences several
activities in a work context. He did not present many references as to the uniqueness of each
one at the TP level, as well as other personal aspects that may influence his TM. Covey's model,
on the other hand, does not address the organization of environments and information, nor does
it explain TM techniques for dealing with time thieves (Estrada, Flores, & Schimith, 2011).
According to Augustin (2008, p. 42), “The habits presented are basic and cover most of the
fundamental principles of human effectiveness. They represent the internalization of the correct
principles, on which happiness and success are based. If well worked, these habits promise to
lead the person to the maximum of beneficial results, in the long run”. Drucker presents an
effectiveness-centred perspective, focusing his attention on the optimization of TM in carrying
out the activities. The manager must be aware that he/she is dealing with people and
relationships between people, in order to correctly align the individual potential with the
objectives of the organization. Seiwert addresses superficially behavioural issues, because,
despite providing important solutions on self-discipline and healthy habits, he does not address
other essential points, such as procrastination and perfectionism (Estrada et al., 2011). Seiwert
presents a model divided into four categories with different nomenclatures from the other
models. It mentions the elements that make up each of the categories, but does not explain each
one in detail (Augustin, 2008). The Cygler model presents areas that are circumscribed in a
larger context, but does not comment on these contexts (Augustin, 2008). Barbosa presents a
complete TM model, focusing on several variables that allow optimizing TM. However,
according to Flores (2011), it does not present sensitivity to the control / evaluation of the
process. Allen presents a model that relates TM and productivity. Its focus on activity leaves
aside some variables that are related to the uniqueness of each individual that can influence TM.
The model we propose intends to overcome some possible limitations of the currently existing
models. The development of a flexible TM model considers the analysis of different TM models
and Philip Zimbardo’s time perspectives. It was found that the current models do not distinguish
between different temporal perspectives, not respecting the uniqueness of each human being
(vid. Figure 1 below). The current models are based on the assumption that all individuals have
the same characteristics and motivation for a TM approach focused on activities, which may be
considered to be the tip of the iceberg only.
Figure following on the next page

63rd International Scientific Conference on Economic and Social Development – "Building Resilient Society" - Zagreb, 11-12 December, 2020
455
Figure 1: A new perspective on TM
(Source: Own elaboration)
3. A PROPOSAL FOR A FLEXIBLE TIME MANAGEMENT MODEL
The literature review carried out on the subject allowed to check the state of the art on the topic,
identify possible gaps, as well as to present solutions for them. In this investigation, in order to
develop a flexible TM model, different aforementioned TM models were analysed, which
present a sequential logical method, with well-defined steps and phases for practical
application. The choice of models referenced in Table 1 does not exclude the existence of other
scientific studies, but the characteristics presented do not correspond to the proposed model to
be developed. This study may be classified as an exploratory research, since it is used to study
models and from there, create a new model version. As for the approach, this research is
classified as qualitative, insofar as it is based on the fact that human actions have a value and
aim at a meaning, which cannot be captured by simple cause-and-effect relationships. The
proposed model is based on three pillars: the notion of temporal perspective, self-recognition
and TM (vid. Figure 2 below).
Figure 2: The three pillars of the proposed Flexible TM model
(Source: Own elaboration)

63rd International Scientific Conference on Economic and Social Development – "Building Resilient Society" - Zagreb, 11-12 December, 2020
456
3.1. Notion of TP
The various studies carried out have shown that a balanced TP translates into benefits for
individuals (Boniwell et al., 2010). It should also be noted that Zimbardo & Boyd (2008) argue
that the transition between perspectives is possible and present a set of recommendations.
According to Bajec (2019), training in TM should considers the notion of TP. It is possible to
change behaviours in TM based on temporal perspectives.
3.2. Self-recognition
At the beginning of the twentieth century, there were few specialized activities and individuals
adapted what existed (Cunha, Cunha, Rego, Neves, & Cabral-Cardoso, 2007; Drucker, 2019).
Currently, there are numerous areas of knowledge, making it possible to choose at a
professional level something according to vocations and preferences. It is only by doing what
one really like and demonstrating skills that one’s may perform an extraordinary job. On the
other hand, the range of professions makes decision-making difficult. Today, large
organizations depend to a large extent on intellectual work. “More and more, people were
educated in the sense of using knowledge, theories and concepts, more than physical strength
or manual skill…” (Drucker, 2019, p. 31). Intellectual work is not defined by quantity or
expense, but by results. The individual who is fully aware of his/her knowledge, skills and
abilities may have better TM skills. The uniqueness of the human being translates into countless
ways of being and thinking. Drucker (2019) states that "making forces productive is equally
important when it comes to the individual's abilities and work habits". When individuals reach
adulthood, they already know when they are more productive, whether in the morning, in the
afternoon or at night; if they work better with long or short deadlines, if for a meeting they need
all the detailed information or a brief summary, “some are ‘readers’ and others are ‘listeners’”.
Many of these habits mirror the fundamentals of each person's personality. Just as a company
when it establishes its mission, vision and values, an individual must seek, through self-
recognition, to establish a mission, vision and values. This allows a correct adaptation to
different work contexts and optimization of activities, when facing other sociological contexts
(Covey, 2017b; Drucker, 2019). Taking a leadership perspective within one’s field of action,
based on an explicit statement of one’s mission, vision and values, allows for an optimization
of the activities developed (Morris, 2009; Schmitt, Highhouse, & Weiner, 2013).
3.3. Time management
Some TM-related variables were identified as transversal to the TM models: planning
(maximizing activities and results), greater efficiency, productivity, a balance between
professional and personal life, the paradigm of importance, awareness of time (Aeon & Aguinis,
2017; Boniwell & Osin, 2015; Claessens et al., 2007; Hawkins & Klas, 1997; Malkoc &
Tonietto, 2019; Rodrigues et al., 2018). Thus, for an effective and efficient TM, the following
principles must be considered: 1. Time awareness (temporal perspectives); 2. Mission, vision
and personal goals; 3. Paradigm of importance; 4. Planning and prioritization (maximizing and
prioritizing activities, avoiding wasted time); 5. Conscious decision-making; 6. Balance
between personal and work life; 7. Organizational culture (how one manages and looks at time)
- Employee accountability (proactivity within the field of work, choosing the best time to work).
4. CONCLUSIONS
The current globalized working context, the complexity of organizations and teams endowed
with heterogeneity of knowledge, multidisciplinary academics, knowledge workers and the
uniqueness of employees, make it necessary for the employee to have prior self-recognition in
favour of a better TM. It is necessary to balance the personal, social and work life, motivation,
notion of TP and uniqueness of each individual.

63rd International Scientific Conference on Economic and Social Development – "Building Resilient Society" - Zagreb, 11-12 December, 2020
457
Claessens et al. (2007) refer that the results of the various studies on TM are not uniform. The
non-uniformity of the results leads to the interpretation that the uniqueness of each of the
stakeholders is a variable that may be influencing. Drucker, quoted by (Covey, 2017a), says
that the evolution of scientific knowledge has allowed for new working conditions, new
equipment and specializations for employees. Currently, Covey (2017a) refers to the age of the
“knowledge worker”. Knowledge work leverages all other investments made by an
organization or a family. Intellectual work is not defined by quantity or expense, but by results.
This evolution of knowledge and endowment of technical and scientific competencies in the
most varied areas has led to the empowerment (conscious decision-making based on
information) of employees, increasing their participation and responsibility in the culture and
results of organizations. Its efficiency and effectiveness can be achieved through the correct use
of time by the employee. A study by Varlamova (2008) found that the effectiveness of decision-
making processes depends partially on TM factors. According to Aeon & Aguinis (2017), three
variables can influence TM: temporal norms of the organization, time-related individual
differences (temporal perspectives) and temporal decision-making. The model proposed here
intends to integrate a holistic view on TM by adding a set of good practices on TM allowing
individuals to better self-recognize. TM cannot be taught, but it can be learned. An individual's
predisposition is necessary for the assimilation and application of good practices in TM. The
flexible TM model was based on the various models analysed and theoretical concepts on the
topic and presents a holistic perspective, addressing different contexts that may influence TM
in other contexts. For more effective TM models, time should not be devoted to schematics and
to-do lists, but to the importance of conscious decision-making. When a mindfulness posture is
adopted, decisions are made consciously, allowing the decision-maker to start other activities
without remaining in expectation of the decision. The exploration of TM does not end with this
work. The proposed model needs to be applied on a large scale and in different contexts. Its
holistic and flexible perspective will allow it to adapt to different situations. Furthermore, this
proposed model requires validation in order to obtain a broader set of indicators, results and
effects.
ACKNOWLEDGEMENT: This paper is financed by Portuguese national funds through FCT
– Fundação para a Ciência e a Tecnologia, I.P., project number UIDB/00685/2020.
LITERATURE:
1. Aeon, B., & Aguinis, H. (2017). It´s about time: New Perspectives and insights on time
management. Academy of Management Perspectives, 31(4), 309–330.
2. Ahmed, M. T., & Omotunde, H. (2012). Theories And Strategies of Good Decision Making.
International Journal of Scientific & Technology Research, 1(10), 51–54.
3. Allen, D. (2018). GTD Fazer bem as coisas. (Conjuntura atual, Ed.). Lisboa.
4. Apostolidis, T., Fieulaine, N., Simonin, L., & Rolland, G. (2006). Cannabis use, time
perspective and risk perception: Evidence of a moderating effect. Psychology and Health,
21(5), 571–592. https://doi.org/10.1080/14768320500422683
5. Augustin, E. (2008). Planejamento Pessoal E Sua Ligação Com O Planejamento
Estratégico Organizacional. Universidade Federal de Santa Maria. Retrieved from
https://repositorio.ufsm.br/bitstream/handle/1/8076/EZIANESAMARAAUGUSTIN.pdf
6. Bajec, B. (2019). Relationship Between Time Perspective and Time Management
Behaviours. Psihologija, 52(2), 197–215.
7. Barbosa, C. (2018). A tríade do tempo. Buzz Editora.

63rd International Scientific Conference on Economic and Social Development – "Building Resilient Society" - Zagreb, 11-12 December, 2020
458
8. Bendak, S., Shikhli, A. M., & Abdel-Razek, R. H. (2020). How changing organizational
culture can enhance innovation? Development of the innovative culture enhancement
framework. Cogent Business and Management, 7(1).
https://doi.org/10.1080/23311975.2020.1712125
9. Bigliardi, B., Dormio, A. I., Galati, F., & Schiuma, G. (2012). The impact of organizational
culture on the job satisfaction of knowledge workers. The Journal of Information and
Knowledge Management Systems, 42(1), 36–51.
https://doi.org/10.1108/03055721211207752
10. Boniwell, I., Osin, E., Alex Linley, P., & Ivanchenko, G. V. (2010). A question of balance:
Time perspective and well-being in British and Russian samples. Journal of Positive
Psychology, 5(1), 24–40. https://doi.org/10.1080/17439760903271181
11. Boniwell, I., & Osin, E. N. (2015). Beyond time management: time use, performance and
well-being. Organizational Psychology, 5(3), 85–104.
12. Cheng, Y. Y., Shein, P. P., & Chiou, W. Bin. (2012). Escaping the impulse to immediate
gratification: The prospect concept promotes a future-oriented mindset, prompting an
inclination towards delayed gratification. British Journal of Psychology, 103(1), 129–141.
https://doi.org/10.1111/j.2044-8295.2011.02067.x
13. Claessens, B., Van Eerde, W., Rutte, C., & Roe, R. (2004). Planning behavior and perceived
control of time at work. Journal of Organizational Behavior, 25(8), 937–950.
https://doi.org/10.1002/job.292
14. Claessens, B., Van Eerde, W., Rutte, C., & Roe, R. A. (2007). A review of the time
management literature. Emerald, 36(2), 255–276.
https://doi.org/10.1108/00483480710726136
15. Corral-Verdugo, V., Fraijo-Sing, B., & Pinheiro, J. Q. (2006). Sustainable Behavior and
Time Perspective: Present, Past, and Future Orientations and Their Relationship with Water
Conservation Behavior. Interamerican Journal of Psychology, 40(2), 139–147.
16. Covey, S. (2017a). O 8o hábito da eficácia à grandeza. (G. Valente, Ed.) (1a). Rio de
Janeiro: Gradiva.
17. Covey, S. (2017b). Os 7 Hábitos das Pessoas Altamente Eficazes Lições poderosas para a
transformação pessoal. (Gradiva, Ed.).
18. Cunha, M., Cunha, R., Rego, A., Neves, P., & Cabral-Cardoso, C. (2007). Manual do
Comportamento Organizacional e Gestão. (E. RH, Ed.) (6a Ed.). Lisboa.
19. Cygler, J. (2005). Quem Mexeu na Minha Vida? A fórmula do sucesso e da felicidade, sem
estresse. (Alegro, Ed.). Rio de Janeiro.
20. Desmyter, F., & De Raedt, R. (2012). The relationship between time perspective and
subjective well-being of older adults. Psychologica Belgica, 52(1), 19–38.
https://doi.org/10.5334/pb-52-1-19
21. Drucker, P. (2019). O Gestor Eficaz. (C. A. Editora, Ed.). Lisboa: Papelmunde.
22. Estrada, R., Flores, G., & Schimith, C. (2011). Gestão do tempo como apoio ao
planejamento estratégico pessoal. Revista de Administração Da UFSM, 4(2), 315–332.
https://doi.org/10.5902/198346593349
23. Fieulaine, N., & Martinez, F. (2010). Time under control: Time perspective and desire for
control in substance use. Addictive Behaviors, 35(8), 799–802.
https://doi.org/10.1016/j.addbeh.2010.03.022
24. Flores, G. T. (2011). Gestão do Tempo como Contribuição ao Planejamento Estratégico
Pessoal. Universidade Federal de Santa Maria. Retrieved from
https://repositorio.ufsm.br/bitstream/handle/1/4577/FLORES%2CGILBERTOTIMM.pdf?
sequence=1&isAllowed=y
63rd International Scientific Conference on Economic and Social Development – "Building Resilient Society" - Zagreb, 11-12 December, 2020
459
25. Hamilton, J. M., Kives, K. D., Micevski, V., & Grace, S. L. (2003). Time perspective and
health-promoting behavior in a cardiac rehabilitation population. Behavioral Medicine,
28(4), 132–139. https://doi.org/10.1080/08964280309596051
26. Hawkins, F., & Klas, L. (1997). Time Management as a Stressor for Helping Professionals:
Implications for Employment. Journal of Employment Counselling, 34(1), 2–6.
https://doi.org/10.1002/j.2161-1920.1997.tb00451.x
27. Henson, J. M., Carey, M. P., Carey, K. B., & Maisto, S. A. (2006). Associations among
health behaviors and time perspective in young adults: Model testing with boot-strapping
replication. Journal of Behavioral Medicine, 29(2), 127–137.
https://doi.org/10.1007/s10865-005-9027-2
28. Holman, E. A., & Zimbardo, P. G. (2009). The social language of time: The time
perspective-social network connection. Basic and Applied Social Psychology, 31(2), 136–
147. https://doi.org/10.1080/01973530902880415
29. Hummel, C. (2013). Tyranny of the Urgent. IVP Books.
30. Keough, K. A., Zimbardo, P. G., & Boyd, J. N. (1999). Who’s smoking, drinking, and using
drugs? Time perspective as a predictor of substance use. Basic and Applied Social
Psychology, 21(2), 149–164. https://doi.org/10.1207/S15324834BA210207
31. Laghi, F., Baiocco, R., D’Alessio, M., & Gurrieri, G. (2009). Suicidal ideation and time
perspective in high school students. European Psychiatry, 24(1), 41–46.
https://doi.org/10.1016/j.eurpsy.2008.08.006
32. Lakein, A. (1974). How to get control of your time and your life (1th ed.). New York: The
New American Library.
33. Macan, T. (1994). Time management: test of a process model. Journal of Applied
Psychology, 79(June 1994), 381–391. https://doi.org/10.1037/0021-9010.79.3.381
34. Mackenzie, A., & Nickerson, P. (2009). The Time Trap: The Classic Book on Time
Management. (Amacon, Ed.) (4th ed.). New York. Retrieved from http://www.amazon.ca/
exec/obidos/redirect?tag=citeulike09-20&path=ASIN/081447926X
35. Malkoc, S. A., & Tonietto, G. N. (2019). Activity versus outcome maximization in time
management. Current Opinion in Psychology, 26, 49–53.
https://doi.org/10.1016/j.copsyc.2018.04.017
36. Matsumoto, D., & Juang, L. (2017). Culture and Psychology. Identical Twins (Sixth Edit).
Boston: Cengage Learning.
37. Mello, Z. R., & Worrell, F. C. (2006). The Relationship of Time Perspective to Age , Gender
, and Academic Achievement ... Psychology, 29(3), 271–289.
38. Morris, T. (2009). Se Aristóteles Fosse Administrador da General Motors - A alma do
negócio. (D. Quixote, Ed.). Alfragide: Guide Artes Grágicas, Lda.
39. Muste, D. (2019). Time Management applied in education. In The European Proceedings
of Social & Behavioural Sciences (pp. 77–82).
40. Rodrigues, A. S., Corrêa, J., Mendonça, A., Carlos, A., Geanie, M., & Rocha, M. (2018).
Gestão do tempo aplicada à produtividade, qualidade de vida e desempenho: Análise de
publicações do banco de dados da CAPES e do Google Académico. In Congresso
Internacional de Administração. Retrieved from
https://admpg.com.br/2019/anais/2018/arquivos/06022018_190629_5b131a853d259.pdf
41. Schmitt, N., Highhouse, S., & Weiner, I. (2013). Handbook of psychology industrial and
organizational psychology (second edi). New Jersey: John Wiley & Sons.
42. Seiwert, L., & McGee-Cooper, A. (2008). Como chegar depressa, indo devagar. (Centro
Atlântico, Ed.) (1a ed.). Lsiboa: Papelmunde – SMG, Lda.
43. Shores, K., & Scott, D. (2007). The relationship of individual time perspective and
recreation experience preferences. Journal of Leisure Research, 39(1), 28–59.
https://doi.org/10.1080/00222216.2007.11950097

63rd International Scientific Conference on Economic and Social Development – "Building Resilient Society" - Zagreb, 11-12 December, 2020
460
44. Sousa, A. (2009). Introdução à Gestão. (Verbo, Ed.) (1a Edição). Lisboa.
45. Sousa, Á., Batista, G., Medeiros, M., & Bacelar-Nicolau, H. (2017). Classificação de Dados
de Natureza Complexa no Contexto da Avaliação 360o. In 24th APDR Congress
“Intellectual Capital and Regional Development: New landscapes and challenges for space
planning (pp. 814–819).
46. Stolarski, M., Vowinckel, J., Jankowski, K. S., & Zajenkowski, M. (2016). Mind the
balance, be contented: Balanced time perspective mediates the relationship between
mindfulness and life satisfaction. Personality and Individual Differences, 93, 27–31.
https://doi.org/10.1016/j.paid.2015.09.039
47. Varlamova, V. (2008). The Relationship between Time Management and Decision-Making
Processes. University of Canterbury.
48. Wu, Y. (2018). Analysis on the Problems and Countermeasures of College Students’ Time
Management. In International Conference on Education, Management and Information
Technology (pp. 819–822).
49. Zhang, J. W., & Howell, R. T. (2011). Do time perspectives predict unique variance in life
satisfaction beyond personality traits? Personality and Individual Differences, 50(8), 1261–
1266. https://doi.org/10.1016/j.paid.2011.02.021
50. Zhang, Jia, Howell, R., & Stolarski, M. (2013). Comparing Three Methods to Measure a
Balanced Time Perspective: The Relationship Between a Balanced Time. Journal of Hap,
(14), 169–184. https://doi.org/10.1007/s10902-012-9322-x
51. Zhang, Jianing, & Hailong, J. (2018). Study on the Time Management and Self-controlled
Learning of Students in Local Colleges and Universities in Transition. In Advances in Social
Science, Education and Humanities Research (Vol. 205, pp. 188–192).
52. Zimbardo, P., & Boyd, J. (2008). The Time Paradox. (Free Pass, Ed.). New York.
53. Zimbardo, P. G., & Boyd, J. (1999). Putting Time in Perspective: A Valid , Reliable
Individual-Differences Metric. Journal of Personality and Social Psychology, 77(6), 1271–
1288. https://doi.org/10.1037/0022-3514.77.6.1271
54. Zimbardo, P. G., Keough, K. A., & Boyd, J. N. (1997). Present time perspective as a
predictor of risky driving. Personality and Individual Differences, 23(6), 1007–1023.
https://doi.org/10.1016/S0191-8869(97)00113-X

63rd International Scientific Conference on Economic and Social Development – "Building Resilient Society" - Zagreb, 11-12 December, 2020
461
CONCEPTUALIZATION OF SOFT SKILLS FOR TOURISM
EMPLOYEES'
Valentina Kraljic
Graduated from University of Rijeka,
Faculty of Tourism and Hospitality Management, Croatia
Ana Cuic Tankovic
University of Rijeka, Faculty of Tourism and Hospitality Management, Croatia
Marina Perisic Prodan
University of Rijeka, Faculty of Tourism and Hospitality Management, Croatia
ABSTRACT
Soft skills are most often associated with the characteristics, attitudes, and abilities
characterizing communication and relationship with people. They allow the individual to adapt
to a dynamic environment and effectively cope with the challenges of professional and private
life, and in this way, to perform well and communicate successfully in their environment.
Besides having professional knowledge, tourism service providers need to have expressed soft
skills such as kindness, professionalism, a positive attitude, and others' understanding. Because
not enough attention is paid to the impact and importance of soft skills, this research seeks to
offer a conceptual representation of the soft skills needed by all service providers in today's
dynamic business environment.
Keywords: soft skills, service marketing, conceptualization
1. INTRODUCTION
In the dynamic and changing world, technical competencies alone are no longer enough for
employees to achieve successful business and outstanding business results that every
organization strives for success. As a set of characteristics, attitudes, and abilities, soft skills
allow individuals to communicate with others, develop, learn successfully, and achieve their
goals (Moss & Tilly, 1996). In this way, they help an individual adapt to the situation to cope
effectively with professional and everyday life (Hurrell, 2016). The importance of soft skills
needed to work in tourism and hospitality has been researched for many years and includes a
wide range of interpersonal and social qualities and competencies. A large number of such
researches highlight soft skills as crucial competencies (Wilks & Hemsworth, 2011; Sisson &
Adams, 2013; Weber et al., 2013), and among them, the communication skills of tourism
service providers are ranked in very high positions (Robles, 2012; Majid et al., 2012; Succi and
Canovi, 2019). Awareness of the importance of soft skills is still underdeveloped. Therefore,
there are differences in the importance of soft skills and their ranking between managers and
young people entering the labor market (Raybould & Wilkins, 2006; Succi & Canovi, 2019;
Suh, West & Shin, 2012). It is not easy to define soft skills accurately because they consist of
many elements. Different authors also use different names for these skills, such as generic
(Raybould & Wilkins, 2006), social (Deming, 2017), interpersonal (Levasseur, 2001; Hayes,
2002; Testa and Sipe, 2012), twenty-first-century skills (Moore & Morton, 2015). Different
definitions of soft skills include the definition of skills that allow an individual to understand
his actions better and work with others (Muzio & Fisher, 2009). On the other hand, as all non-
technical characteristics and behaviors of an individual that are necessary for successful career

63rd International Scientific Conference on Economic and Social Development – "Building Resilient Society" - Zagreb, 11-12 December, 2020
462
coordination and which allows him to effectively use technical skills and knowledge (Klaus et
al., 2007) or targeted behaviors that an individual uses when interacting with others to achieve
the desired goal (Hayes, 2002). Ranade et al. (2010) identify soft skills as behavior that make
employees more effective in what they do. Also, they point out that the development of soft
skills has a significant impact on achieving the goals of individuals, teams, and organizations.
Organizations that recognize the importance of soft skills can improve the candidate selection
process, facilitate hiring, improve the organization's development program, and reduce
operating costs and increase their profitability (Weber et al., 2009). This research seeks to
present a conceptual framework of soft skills required for tourism professionals in the current
dynamic market, without addressing communication skills, which require separate analysis.
2. LITERATURE REVIEW
Services in tourism and hospitality are often viewed through two components - one focusing on
the technical aspect such as wait time, cleanliness, and organization. In contrast, the other
focuses on the interpersonal aspect that includes service providers' relationship with tourists.
Intangibility and the human element in service delivery are some of the main features of service
industries (Nickson, Warhurst & Dutton, 2005). As part of the tourism product, the human
element, which includes a desire to work, love of work, and emotional intelligence, is crucial
for providing quality tourism services (Laškarin Ažić, 2018). Testa and Sipe (2012) state that a
tourist service must include both components to have a high-quality level and meet tourists'
needs. From their perspective, the service's technical aspect is expected, while the expressed
interpersonal aspect often exceeds their expectations about the service. Quality tourism service
is achieved when tourists feel satisfied and keep coming back, using the service again or
recommend it to others (Fuller and Smith (1991). According to this, tourism service providers
need to recognize and make decisions on the spot about what they think will please certain
people, stimulate positive emotions in them and thus contribute to their satisfaction with the
overall tourism service (Nickson, Warhurst & Dutton, 2005). The importance of the human
element and soft skills in tourism and hospitality is recognized by Burns (1997), who explains
how tourism service providers become an integral part of the final tourism product: tourism
service providers are expected to be kind and understanding and to be in a positive, friendly
and even playful mood. These skills are often not recognized as skills, but rather as part of the
natural order of tourism services, even though they create a standard of quality and distinguish
successful tourism organizations (Burns, 1997). Tas (1988) divided tourism service providers'
competencies into three categories: essential competencies, competencies of considerable
importance, and moderate importance competencies. All the skills that were in the essential
category, six of them, were soft skills: (1) Manages guest problems with understanding and
sensitivity; (2) Maintains professional and ethical standards in the work environment; (3)
Demonstrates professional appearance and poise; (4) Communicates effectively, both in writing
and orally; (5) Develops positive customer relations; (6) Strives to achieve a positive working
relationship with employees based on perceptions of work interactions. Most recent research
(Baum, 1990; Christou & Eaton 2000; Kay & Russette, 2000; Christou, 2002; Testa & Sipe,
2012) divides the knowledge, skills, and abilities needed to work in tourism hospitality into two
categories - hard and soft skills. Hard skills represent specific professional abilities that can be
learned, usually require the acquisition of knowledge, and are significantly influenced by the
intelligence quotient (Ciappei & Cinque, 2014). Unlike hard skills, soft skills are difficult to
measure or prove because they are closely related to an individual's attitudes and result from
their personality, preferences, and experiences (Balcar, 2016). Although many authors and
employers are increasingly emphasizing the importance of soft skills over hard ones, it cannot
be said that soft skills are a substitute for hard skills (Andrews & Higson, 2010). They are
complementary, and so combined soft and hard skills create potential and lead to success.
63rd International Scientific Conference on Economic and Social Development – "Building Resilient Society" - Zagreb, 11-12 December, 2020
463
People who develop both soft and hard skills can continuously learn and develop. In this way,
hard skills allow an individual to be what he is, and on the other hand, soft skills allow him to
act as an individual, to be different from others, and they give him the necessary flexibility to
be able to develop and to keep up with the changing environment. By synthesizing research,
we can identify essential soft skills groups that are an integral part of business communication,
where the most commonly mentioned skills are communication skills (listening, presentation,
negotiation skills, and verbal and nonverbal communication skills), interpersonal skills
(teamwork, providing services, conflict resolution), emotional intelligence (self-control,
working under pressure, empathy, adaptation) and professionalism (Tesone & Ricci, 2005;
Weber et al., 2009; Wilks & Hemsworth, 2011; Robles, 2012; Testa & Sipe, 2012; Weber et
al., 2013; Wang & Tsai, 2014; Succi & Canovi, 2019; Weber, Lee & Crawford; 2019).
2.1. Interpersonal skills
Interpersonal skills include all forms of behavior that enable an individual to efficiently and
constructively participate in social life and resolve conflicts where necessary (Goleman, 2010).
They are composed of various competencies that facilitate communication and are thus crucial
for inclusion in society, building and maintaining quality interpersonal and business
relationships, personal fulfillment and development, and achieving desired business results.
Jukić (2012) believes that interpersonal skills are crucial in developing good business relations
and cooperation opportunities among employees.
Interpersonal skills can be divided into four basic categories - developing good relationships,
influencing others, counseling and training, and networking (Bahtijarević-Šiber, Sikavica &
Pološki-Vokić, 2008). In addition to basic interpersonal skills, we can include conflict
management, group, time management, and employee motivation (Jukić, 2012).
2.1.1. Developing good relationships and cooperation
Teamwork involves a group of people working together on specific tasks, and their product in
the form of synergy allows for greater speed of decision-making and the flow of information
within the organization. In this way, creativity, usability, and productivity are enabled, which
no individual can offer on their own (Turkalj, Fosić & Marinković, 2012). Johnson and Johnson
(2006) consider that a team comprises a series of interpersonal interactions, structured to
achieve the set goals. Rozman, Kovač & Koletnik (1993) describe a team's main characteristics
that they must have to be successful: they state that the work tasks must be goal-oriented, and
team members must identify with the goals of teamwork in order to successfully solve work
tasks. A team's success depends on its members' internal connection, where large teams, due to
connectivity problems, may have less efficiency. Teams can be composed of two to twelve
members, and according to most authors, the optimal number is six members. However,
regardless of the number of members, the team cannot function without quality communication,
mutual exchange of information, experiences, knowledge, and trust. Trust is the foundation of
interpersonal relationships and is most often based on the interrelationship of information,
social influence, and control.
2.1.2. Giving and receiving useful feedback
Feedback is a direct management tool used to guide and monitor employee behavior and
progress. Its essential purpose is to give another person information about our impression of
their behavior and actions (Žižak, Vizek Vidović & Ajduković, 2012). Feedback is necessary
to motivate employees, encourage positive behavior, raise awareness of employee behavior,
encourage thinking about behavior, and achieve long-term goals and development, and without
feedback, it is impossible to maintain or improve performance (Ružić, 2007). In addition to
feedback, good performance is also influenced by appropriate rewards, which encourage

63rd International Scientific Conference on Economic and Social Development – "Building Resilient Society" - Zagreb, 11-12 December, 2020
464
additional effort to achieve the desired results. Nevertheless, unlike the reward itself, the
feedback also encourages the development of individual employee competencies. Just like
giving, receiving feedback can be extremely helpful. Only by listening and accepting
information it is possible to reach the desired goal - regardless of whether it is a promotion,
salary increase, education, or something else. Appropriate feedback directs the employees to
personal and professional development (Ružić, 2007).
2.1.3. Motivation
Emotions move people to achieve their goals, and motives trigger perception and shaping
activities, which means that great work begins with great emotions (Goleman, 2010). Human
motives are most often based on needs, whether conscious or subconscious, and motivation
mainly refers to a whole set of instincts, needs, desires, or other forces. Motivation is vital for
high business standards, it encourages creativity, innovation, and it is significant for the
professional development of employees and their retention in the company (Buntak, Drožđek
& Kovačić, 2013). If a person is unmotivated, it cannot give his maximum contribution, leading
to lower business results. The task of management is to choose the right motivation techniques,
depending on the specific circumstances (Žižak, Vizek Vidović & Ajduković, 2012).
2.2. Emotional intelligence
Goleman (1997) described emotional intelligence as competencies such as the ability to self-
motivate and persist despite difficulties and frustrations; restraining impulsivity and postponing
moments of receiving a reward; regulating moods, and preventing agitation from blocking the
ability to think; compassion and hope. Feelings are psychic processes related to the senses and
are often a reflection of a person's objective reality that occurs when a person assesses that
something significant and important is happening, while emotions have a subjective character
related to a person's personality. They occur in a state of excitement caused by a subjectively
significant stimulus or reaction to an event (Hercigonja, 2018). People who have highly
developed emotional intelligence can manage their emotions, clearly talk about them, explain
them, and understand different emotions' patterns. Based on the research (Goleman, 1998), 67%
of the skills considered key to business excellence is emotional skills. He also explains how
emotional skills can be achieved based on emotional intelligence, and emotional intelligence
lies in five elements: self-awareness, motivation, self-control, empathy, and adaptability
(Goleman, 2010). One of the specifics of emotional intelligence is the assumption that, unlike
IQ, emotional intelligence can develop (Takšić, Mohorić & Munjas, 2006).
2.2.1. Intrapersonal intelligence
The ability to manage own mood, temperament, motivation, and intentions and, as such, the
ability to create an accurate model of assessing own personality and own abilities is called
intrapersonal intelligence (Hercigonja, 2018). A person who possesses a high level of
intrapersonal intelligence can access their own emotions and feelings and recognize,
understand, and control their behavior. Self-awareness is a skill related to knowing their inner
state, preferences, talents, and insight (Goleman, 2010). A person who possesses emotional
self-awareness can recognize their inner feelings and, in this way, consciously influence their
own decisions and actions. Self-control refers to the control of personal attitudes, instincts, and
potentials that may interfere. A person who can control feelings and instincts can also manage
impulsive and restless urges, accept changes, and take responsibility for their actions (Goleman,
2010). Panek (2014) states that people with highly developed self-control and better anger
management show better psychological adjustment and also have more self-esteem. Motivation
is an inner urge that encourages an individual to behave in a way by which he can achieve his
goals and meet his needs (Tudor et al., 2010), and it consists of three essential elements -

63rd International Scientific Conference on Economic and Social Development – "Building Resilient Society" - Zagreb, 11-12 December, 2020
465
strength, persistence, and goal orientation (Pupavac, 2015). Each person has their unique
desires and needs that motivate them and give them the will to change. Goleman (2010) defined
motivation as an emotional tendency that leads to goal achievement and, at the same time,
makes it easier to achieve them.
2.2.2. Interpersonal intelligence
Interpersonal intelligence primarily refers to the ability to perceive differences in others in terms
of their mood, temperament, motivation, and intentions that allow for understanding and
working with others (Hercigonja, 2018). A person who possesses a high level of interpersonal
intelligence possesses the ability to understand others: what motivates them, how they function,
how to cooperate with them (Goleman, 1997). Empathy is the awareness of the feelings,
interests, and needs of others. Although some authors consider it a personality trait, empathy
can also be understood as an emotional and cognitive reaction stimulated by someone's
experience (Brdar & Pokrajac-Bulian, 1993). This ability, which allows us to know what
someone else is feeling, is accessible in a very wide range of life domains (Goleman, 1997).
Empathy includes identifying other people's feelings, their emotional understanding, personal
interpretation, unconditional acceptance, respect, and honesty without the presence of
condemnation (Ionnidou and Konstantikaki, 2008). Assertiveness is a skill that allows people
to fight for themselves and their interests without harming others and is manifested through a
positive attitude, direct communication, goal orientation, and the ability to interact (Čanić,
2017). Assertive people can accept disagreements as a regular and everyday occurrence and
that everyone has the right to their own opinion. In such situations, they try to maintain equality,
considering the need to maintain their self-esteem and the self-esteem of the interlocutor
(Miljković-Krečar and Kolega, 2013).
2.2.3. Stress management
Stress stimulates several physical, emotional, and cognitive reactions in the body, ultimately
preventing the successful performance of tasks and reducing life quality and may even
contribute to developing certain diseases (Telebec, 2016). A person's stress reaction can be
recognized by some of its most common symptoms - dilated pupils, sweating, increased heart
rate, rapid breathing, muscle tension, a state of heightened sensitivity and concentration (Pašić,
2007). Stress management is a skill that contributes to better coping with various stressors and
different factors that cause stress in a person and their consequences, which can contribute to a
better quality of life, productivity, and health. The causes of stress at work can be different -
from the job itself, its quantity and pace, working hours, work-life balance, organizational
culture, interpersonal relationships, role in society to the position, earnings, or lack of progress
in his career (Juras et al., 2009). One way to manage stress is to deal with the source of the
stress itself - some stressful situations can be prevented or at least mitigated. Depending on the
goal, coping with stress can be divided into three groups: problem-oriented coping; coping
focused on emotions; avoidance (Telebec, 2016). Various educations and stress management
training lead to stress reduction by relieving stressors, and in this way, common risk factors and
predictable stress-related problems can be avoided (Juras et al., 2009).
2.2.4. Change management
Adaptation is no longer just a matter of personality or coping mechanism but has become
imperative in the business environment and synonymous with success (Calarco & Gurvis,
2006). In addition to the quotient of intelligence and emotional intelligence, the notion of the
quotient of adaptability also appeared. The adaptability quotient primarily refers to an
individual's ability to absorb new information and adapt to changes in real-time (Forbes,
15/6/2020).

63rd International Scientific Conference on Economic and Social Development – "Building Resilient Society" - Zagreb, 11-12 December, 2020
466
Adaptability describes an individual's ability to distinguish the irrelevant, overcome difficulties,
and reject knowledge that does not benefit him, which is very important when a large amount
of information surrounds us. This may mean developing new skills, a new way of interacting,
or something else needed to overcome difficulties and adopt new information. (Burke, Pierce
& Salas, 2006). Adaptability can mean developing new skills, a new way of interacting, or
something else needed to overcome difficulties and adopt new information. People with
developed adaptability quotient are open-minded and very curious, and often their motivation
encourages others to explore the world around them. Calarco and Gurvis (2006) explain three
necessary adaptability components - cognitive, emotional, and dispositional adaptability.
Cognitive adaptability refers to using different thinking strategies and mental frameworks and
indicates an interest in adopting new approaches, insight and utilization of new information and
connections, and a tendency to good collaboration. Emotional adaptability is the ability to deal
with their own and others' emotions and feelings and implies adjusting and considering all
participants' emotions that have a significant impact on the outcome of communication.
Dispositional adaptability is based on a person's ability to remain optimistic, where change is
seen as an opportunity rather than a threat. In order to make change management successful,
the individual must understand the change process itself. It is necessary to strengthen the forces
that drive change in order to increase the success of change, ensuring competitive pressure, new
technologies, and weaken the resistance forces that prevent or slow down change, such as fear
of new or loss of status and power, habits (Levasseur, 2001).
2.3. Professionalism
In modern business, politeness, business etiquette, work ethic, and a positive attitude
significantly contribute to good business relations and successful business operations. Guffey
and Loewy (2016) highlighted six main workplace behavior dimensions: courtesy and respect,
appearance and appeal, tolerance and tact, honesty and ethics, reliability and diligence,
collegiality, and sharing.
2.3.1. Business ethics
Standards for ethical and socially responsible behavior are a part of every individual, and the
attitudes, norms, and beliefs of that person influence his ethical decision-making and moral
development (Aleksić, 2007). Work ethic and questions of what is ethical and what is unethical
arise from the contradiction of business practice and the conflict of interest of individuals and
organizational goals. In this context, work ethic considers personal and social; public moral and
private needs; ethics of the common good and personal interests; higher goals of the human
community and current benefits; benefits of imminent goals and meaning of long-term actions
(Osredečki, 2000). On the one hand, it is an action that aims at own well-being, material
success, and satisfaction of own needs, and on the other hand, it is an action that involves a
moral dimension. Such a course of action means obtaining direct or indirect personal benefit
but also benefit others. Therefore, business ethics means acting by the spiritual, sociological,
and natural laws of man and his environment (Aleksić, 2007).
2.3.2. Constructive conflict resolution
Conflicts are an inevitable part of professional relationships, and even the most capable, most
moral, or most intelligent people sometimes cannot agree with each other on the conclusions
that need to be made (Žitinski, 2010). At the same time, conflict can contribute to a better
understanding between the conflicting parties; primarily, it leads to a better understanding of
their desires and needs and the desires and needs of others. Conflicts can be approached
constructively or destructively (Žižak, Vizek Vidović & Ajduković, 2012). The most common
causes of conflict include differences in opinions, core beliefs, and standards applied when
63rd International Scientific Conference on Economic and Social Development – "Building Resilient Society" - Zagreb, 11-12 December, 2020
467
evaluating, selecting, or deciding. Robbins and Judge (2010) believe that there are five
fundamental causes of a conflict situation: conflict of opinion, conflict of interest, personalities,
communication, structural problems. They also state that conflicts of interest and conflicts of
opinion are the only justified sources of conflicts. In conflicts, it is necessary to recognize the
chance for development and find a resolution for accumulated problems. That is why a good
manager often encourages conflicts himself and dissolves them in cooperation with team
members, where he can control and reduce their consequences (Lamza-Maronić & Glavaš,
2008). Most conflict resolution strategies are directly related to negative emotions, from
resentment, intolerance and anger to fear, disappointment, and anxiety, only the problem
resolution strategy is related to positive emotions such as relief, pride, satisfaction (Žižak, Vizek
Vidović & Ajduković, 2012). Relationships based on mutual respect is a foundation for
constructive conflict resolution through agreement and cooperation. In such an environment,
conflicted sides feel confident enough to express negative feelings such as anxiety, fear, or
dissatisfaction, but without a hostile tone toward the other side. Both sides, in such an
environment, can recognize a sign of goodwill and respect differences in opinions and attitudes
(Žižak, Vizek Vidović & Ajduković, 2012).
2.3.3. Time management
People who do not plan their time are often brought into a 'time constraint' and find themselves
in a position where they are not able to complete the agreed work obligations or look for a
shortened path, and by such behavior, even the most successful communicators reduce their
effectiveness (Osredečki, 2000). Time management implies effective use of the time envisioned
to perform certain activities, and it most often involves two phases (Francis-Smythe and
Robertson, 1999: 4): (1) time planning and (2) monitoring the plan. It is essential to beware of
'time thieves' who negatively affect the optimality of the realization of work tasks and thus
achieve goals. Gohn (1996) believes that time thieves are unproductive habits, problematic
people, and poorly written corporate policies. Time management in the literature is often
imposed as a critical organizational resource nowadays (Guoqing & Yongxin, 2000).
Successful time management contributes to a better quality of work with less effort, meeting
deadlines, lower frequency of errors, better balancing between business and private life,
reducing stress and tension at work, and achieving the desired goals.
3. CONCLUSION
Tourism and catering are labor-intensive services that require direct communication while
working with people. Modern tourism business places various challenges to tourism service
providers where they must possess more than just technical knowledge and competencies to
perform tasks. Each person has certain qualities and abilities that make us who we are and
characterize our attitudes, habits, and how we communicate with people. Soft skills are a
precondition for successful business performance, so each individual must focus on their
improvement and continuous development. A tourism product becomes an experience that
tourists perceive, and tourism service providers are an integral part of that product. That is why
they are often expected to be kind, understanding, and friendly and to recognize and make
decisions on the spot about what they think will please certain people, stimulate positive
emotions in them and thus contribute to the satisfaction of tourists with communication and
overall provided service. Soft skills can be divided into three essential groups that are an integral
part of business communication if we exclude communication skills. The first group refers to
the interpersonal skills needed to participate in teamwork, develop good relationships and
cooperation, provide services to others, motivate others. Emotional intelligence includes
intrapersonal and interpersonal intelligence related to self-control, possession of empathy,
ability to work under pressure, and ability to adapt.

63rd International Scientific Conference on Economic and Social Development – "Building Resilient Society" - Zagreb, 11-12 December, 2020
468
The third group of soft skills refers to professionalism, which is most often defined through the
possession of work ethic and knowledge of business etiquette and the ability to resolve conflicts
and manage time constructively. Starting from this conceptual review of constructs, which
includes the literature researched in this field so far, the aim was to provide future and current
tourism service providers with a comprehensive overview of the reach of the science of soft
skills. Further research imposes the challenge of analyzing soft skills in the digital and online
environment, the communication skills of new generations, and the interdependence of these
constructs.
ACKNOWLEDGEMENT: This paper was funded under the project line ZIP UNIRI of the
University of Rijeka, for the project ZIP-UNIRI-116-4-19.
LITERATURE:
1. Aleksić, A. (2007). Poslovna etika – element uspješnog poslovanja. Zbornik Ekonomskog
fakulteta u Zagrebu. Vol. 5, No. 1, pp. 419-429.
2. Andrews, J., Higson, H. (2010). Graduate Employability, Soft Skills Versus Hard Business
Knowledge: A European Study. Higher Education in Europe. Vol. 33, No. 4, pp. 411-422.
3. Bahtijarević-Šiber, F, Sikavica, P., Pološki-Vokić, N. (2008). Suvremeni menadžment:
Vještine, sustavi i izazovi. Zagreb: Školska knjiga.
4. Balcar, J. (2016). Is it better to invest in hard or soft skills?. The Economic and Labour
Relations Review. Vol. 27, No. 4. pp. 453–470.
5. Baum, T. (1990). Competencies for Hotel Management: Induppy Expectations of
Education. International Journal of Contemporary Hospitality Management. Vol. 2, No. 4.,
pp. 3-8.
6. Brdar, I., Pokrajac-Bulian, A. (1993). Predstavlja li empatija dio socijalne kompetencije?
Godišnjak Zavoda za psihologiju, Vol. 2, pp. 23-29.
7. Buntak, K., Drožđek, I. i Kovačić, R. (2013). Materijalna motivacija u funkciji upravljanja
ljudskim potencijalima. Tehnički glasnik. Vol. 7, No. 1, pp. 56-63.
8. Burke, C. S., Pierce, L. G., Salas, E. (2006). Understanding adaptability: A prerequisite for
effective performance within complex environments. Emerald Group Publishing. Vol. 6,
pp. 3-39.
9. Burns, M. P. (1997). Hard‐skills, soft‐skills: undervaluing hospitality's 'service with a
smile'. Progress in Tourism and Hospitality Research. Vol. 3, No. 3, pp. 239-248.
10. Calarco, A., Gurvis, J. (2006). Adaptability: Responding effectively to change. Greensboro:
Center for Creative Leadership.
11. Čanić, D. (2017). Asertivno upravljanje ljudskim resursima u knjižnici. Vjesnik bibliotekara
Hrvatske. Vol. 60, No. 2-3, pp. 279-293.
12. Christou, E. (2002). Revisiting Competencies for Hospitality Management: Contemporary
Views of the Stakeholders. Journal of Hospitality &Tourism Education. Vol. 14, No. 1, pp.
25-32.
13. Christou, E., Eaton, J. (2000). Management Competencies for Graduate Trainees. Annals
of Tourism Research. Vol. 27, No. 4, pp. 1058-1061.
14. Ciappei, C., Cinque, M. (2014). Soft skills per il governo dell’agire. Milano: Franco Angeli.
15. Demnig, D. J. (2017). The Growing Importance of Social Skills in the Labor Market. The
Quarterly Journal of Economics. Vol. 132, No. 4, pp. 1593-1640.
16. Forbes (2019) How (and Why) to Boost Your Adaptability Quotient. Retrieved 15.06.2020
from https://www.forbes.com/sites/robertcerone/2019/12/20/how-and-why-to-boost-your-
adaptability-quotient/#116c29576918,

63rd International Scientific Conference on Economic and Social Development – "Building Resilient Society" - Zagreb, 11-12 December, 2020
469
17. Francis-Smythe, J. A., Robertson, I. T. (1999). On the relationship between time
management and time estimation. British Journal of Psychology, Vol. 90, No. 3, pp. 333-
346.
18. Fuller, L., Smith, V. (1991). Consumers' Reports: Management by Customers in a Changing
Economy. Work, Employment & Society. Vol. 5, No. 1, pp. 1-16.
19. Gohn, C. (1996). Offering time-management tips for tired managers, Nation's Restaurant
News. Vol. 30, No. 19, pp. 44.
20. Goleman, D. (1998). What makes a leader? Harvard Business Review. Vol. 76, No. 6, pp.
92-102.
21. Goleman, D. (2010). Emocionalna inteligencija u poslu. Zagreb: Mozaik knjiga.
22. Guffey, M., Lowey, D. (2016). Essentials of Business Communication. Deseto izdanje.
Boston: Cengage Learning.
23. Guoqing, Y., Yongxin, Z. (2000). Gender differences of China's managers in time
management. Women in Management Review. Vol. 15, No. 1, pp. 33-43.
24. Hayes, J. (2002). Interpersonal Skills at Work. Second edition. East Sussex: Routledge.
25. Hercigonja, Z. (2018). Emocionalna inteligencija u odgoju i obrazovanju. Varaždin: Fronta
Impress.
26. Hurrell, S. A. (2016). Rethinking the soft skills deficit blame game: Employers, skills
withdrawal and the reporting of soft skills gaps. Human Relations, Vol. 69, No. 3, 605-628.
27. Ioannidou, F., & Konstantikaki, V. (2008). Empathy and emotional intelligence: What is it
really about?. International Journal of caring sciences, Vol. 1, No. 3, 118.
28. Jukić, D. (2012) Uloga interpersonalnih vještina u suvremenom školskom menadžmentu.
Ekonomska misao i praksa. Vol. 21, No. 1, pp. 157-178.
29. Juras, K., Knežević, B., Golubić, R., Milošević, M., & Mustajbegović, J. (2009). Stres na
radu: mjere prepoznavanja, rješenja i prevencija. Sigurnost: časopis za sigurnost u radnoj i
životnoj okolini, Vol. 51, No.2, pp. 121-126.
30. Kay, C., Russette, J. (2000) Hospitality-management competencies: Identifying managers'
essential skills. Cornell Hotel and restaurant administration quarterly. Vol. 41, No. 2, pp.
52-63.
31. Klaus, P. (2007). The hard truth about soft skills: Workplace lessons smart people wish
they'd learned sooner. New York, NY: Harper Collins.
32. Lamza-Maronić, M., Glavaš, J. (2008). Poslovno komuniciranje. Osijek: Studio HS internet
d.o.o.; Ekonomski fakultet u Osijeku.
33. Laškarin Ažić, M. (2018). Upravljanje odnosima s gostima u turizmu i ugostiteljstvu.
Rijeka: Sveučilište u Rijeci, Fakultet za menadžment u turizmu i ugostiteljstvu, Opatija.
34. Levasseur, R. E. (2001). People Skills: Change Management Tools – Lewin's Change
Model. Interfaces. Vol. 31, No. 4, pp. 71-73.
35. Majid, S., Liming, Z., Tong, S., Raihana, S. (2012). Importance of Soft Skills for Education
and Career Success. International Journal for Cross-Disciplinary Subjects in Education.
Vol. 2, No. 2, pp. 1036-1042.
36. Miljković-Krečar, I., Kolega, M. (2013). Psihologija u poslovnom okruženju. Zagreb:
Grupa VERN d.o.o.
37. Moore, T., Morton, J. (2015). The myth of job readiness? Written communication,
employability, and the 'skills gap' in higher education. Studies in Higher Education. Vol.
42, No. 3, pp. 591-609.
38. Moss, P., Tilly, C. (1996). "Soft" skills and race: An investigation of black men's
employment problems. Work and Occupations. Vol. 23, No. 3, pp. 252-276.
39. Muzio, E., Fisher, D. (2009). Soft Skill Quantification (SSQ): Human Performance vs.
Metric. Cost Engineering; Vol. 51, No. 3, pp. 26-31.

63rd International Scientific Conference on Economic and Social Development – "Building Resilient Society" - Zagreb, 11-12 December, 2020
470
40. Nickson, D., Warhurst, C., Dutton, E. (2005). The importance of attitude and appearance in
the service encounter in retail and hospitality. Managing Service Quality. Vol. 15, No. 2,
pp. 195-208.
41. Osredečki, E. (2000). Poslovno komuniciranje & poslovni bonton. Samobor: Naklada Edo.
42. Panek, E. (2014). Left to their own devices: College students "guilty pleasure" media use
and time management. Communication Research. Vol. 41, No. 4, pp. 561-577.
43. Pašić, M. (2007). Pobijedite stres. Zagreb: Dušević i Kršovnik.
44. Pupavac, D. (2015). The ghost of Herzberg motivational theory: motivators and
demotivators. International Journal Vallis Aurea, Vol.1, No. 1, 15-25.
45. Ranade, S. et al. (2010). Mapping competencies. Mechanical engineering. Vol. 132, No. 2,
pp. 30-34.
46. Raybould, M. Wilkins, H. (2006). Generic Skills for Hospitality Management: A
Comparative Study of Management Expectations and Student Perceptions. Journal of
Hospitality and Tourism Management. Vol. 13, No. 2, pp. 177-188.
47. Robbins, P. S., Judge, A. T. (2010). Organizacijsko ponašanje. Dvanaesto izdanje, Zagreb:
Mate d.o.o.
48. Robles, M. M., (2012). Executive Perceptions of the Top 10 Soft Skills Needed in Today's
Workplace. Business Communication Quarterly. Vol. 75, No. 4, pp. 453–465.
49. Rozman, R., Kovač, J., Koletnik, F. (1993). Management. Ljubljana: Gospodarski vestnik.
50. Ružić, B. (2007). Povratna informacija – temelj za profesionalni razvoj, Poslovni savjetnik.
51. Sisson, L. G., Adams, A.R. (2013). Essential Hospitality Management Competencies: The
Importance of Soft Skills. Journal of Hospitality & Tourism Education. Vol. 25, pp. 131–
145.
52. Succi, C., Canovi, M. (2019). Soft skills to enhance graduate employability: Comparing
students and employers perceptions. Studies in higher education. pp. 1-14.
53. Suh, E., West, J. J., Shin, J. (2012). Important competency requirements for managers in
the hospitality industry. Journal of Hospitality, Leisure, Sport & Tourism Education. Vol.
11, pp. 101–112.
54. Takšić, V., Mohorić, T., Munjas, R. (2006). Emocionalna inteligencija: teorija,
operacionalizacija, primjena i povezanost s pozitivnom psihologijom. Društvena
istraživanja. Vol. 4-5, No. 84-85, pp. 729-752.
55. Tas, R. F. (1988). Teaching Future Managers. Cornell Hotel and Restaurant Administration
Quarterly. Vol. 29, No. 2, pp. 41–43.
56. Telebec, S. (2016). Sigurnost i zaštita na radu: Stres na radu. Kemija u industriji: Časopis
kemičara i kemijskih inženjera Hrvatske. Vol. 65, No. 1-2, pp. 115-118.
57. Tesone, D. V., Ricci, P. (2005). Job Competency Expectations for Hospitality and Tourism
Employees: Perceptions of Educational Preparation. Journal of Human Resources in
Hospitality & Tourism. Vol. 4, No. 2, pp. 53-62.
58. Testa, M. R., Sipe, L. (2012). Service-leadership competencies for hospitality and tourism
management. International Journal of Hospitality Management. Vol. 31, pp. 648-658.
59. Tudor, G. et al. (2010) Vođenje i motiviranje ljudi. Zagreb: M.E.P. d.o.o.
60. Turkalj, Ž., Fosić, I., Marinković, R. (2012). Transformacija organizacije u timski
organizacijski pristup i efikasno korištenje timskim radom u kontekstu okružja. Ekonomski
vjesnik: časopis Ekonomskog fakulteta u Osijeku. Vol. 15, pp. 247-260.
61. Wang, Y., Tsai, C. (2014). Employability of Hospitality Graduates: Student and Industry
Perspectives. Journal of Hospitality & Tourism Education. Vol. 26, pp. 125-135.
62. Weber, M. R. et al. (2009). An exploratory study identifying soft skill competencies in
entry-level managers. Tourism and Hospitality Research. Vol. 9, No. 4, pp. 353–361.

63rd International Scientific Conference on Economic and Social Development – "Building Resilient Society" - Zagreb, 11-12 December, 2020
471
63. Weber, M. R., Crawford, A., Lee, J., & Dennison, D. (2013). An exploratory analysis of
soft skill competencies needed for the hospitality industry. Journal of Human Resources in
Hospitality & Tourism, Vol. 12, No. 4, 313-332.
64. Weber, M. R., Lee, J. J., Crawford, A. (2019). A suggested best practices for enhancing
performance of soft skills with entry-level hospitality managers. Anatolia: An International
Journal of Tourism and Hospitality Research. Vol. 31, No. 1, pp. 76-87.
65. Wilks, D., Hemsworth, K. (2011). Soft Skills as Key Competencies in Hospitality Higher
Education: Matching Demand and Supply. Tourism & Management Studies. Vol. 7, pp.
131-139
66. Žitinski, M. (2010). Kultura poslovnog komuniciranja. Dubrovnik: Sveučilište u
Dubrovniku.
67. Žižak, A., Vizek Vidović, V., Ajduković, A. (2012). Interpersonalna komunikacija u
profesionalnom kontekstu. Zagreb: Sveučilište u Zagrebu, Edukacijsko-rehabilitacijski
fakultet.

63rd International Scientific Conference on Economic and Social Development – "Building Resilient Society" - Zagreb, 11-12 December, 2020
472
ELECTRONIC FREIGHT EXCHANGES IN THE BUSINESS ACTIVITY
IN TSL SECTOR
Sławomir Skiba
Gdynia Maritime University, Poland
ABSTRACT
The increasing role of trade in the global economy poses new challenges for the entire TSL
sector, in particular for all modes of transport. The efficiency of trade depends on the efficiency
and effectiveness of the commodity exchange whose effects can be expressed in the form of
optimization of logistics costs (Skiba, 2013, pp. 999-1006). The benefits of globalization and
increased transport efficiency reflect particularly clearly in road transport, where the smooth
flow of goods is viewed as a top priority. In response to competition, road-transport companies
must not only live up to qualitative and quantitative challenges, but also deal with the issue of
costs. The effectiveness of the performed transport tasks depends to an increasingly greater
extent on the degree of use of innovative ICTs. These technologies are primarily software
applications that support the work of carriers, shippers and logisticians. One of the examples
of the use of IT solutions in logistics are electronic freight exchanges, enabling not just a more
efficient flow of information and new business relationships, but also contributing to the
optimization of logistics costs. The article takes up the problem of electronic freight exchanges
as safe, virtual markets that favor the growth of road transport in Europe and serve as an
important element of cost optimization in transport. The main goal of the article is to present
the forms and types of mechanisms of electronic freight exchanges, as well as to identify the
risks and benefits of using electronic exchanges in the TSL sector.
Keywords: Electronic freight exchanges, TSL sector
1. THE ESSENCE AND MODELS OF ONLINE FREIGHT EXCHANGES
Many interpretations of the term electronic freight exchange can be found in the literature. One
of the first such attempts defines the term electronic exchange as an area where a possible range
of actions spans across various areas of activity of individual enterprises. Exchange websites
are online platforms for signaling free cargo spaces and free loads, with the goal for users to
choose the offer that best suits the needs of their company. Freight exchanges offer facilities
that accelerate and secure transactions by providing additional services and access to extended
applications (Lewandowski, Dziechciarz, 2011, pp. 1125-1126). In another interpretation,
freight exchanges are seen as indispensable market tools for many carriers and shipping
companies, where global platforms help create business ties and consolidate the economy
(Karaś, 2020, pp. 425-430). The platforms’ main feature comes down to posting information
on loads and free vehicles ready to fulfill transport services, as well as to providing contact
details of dispatchers. Electronic exchanges can also be interpreted as an e-commerce tool,
where electronic auction uses the reverse bidding mechanism with the aim of lowering the
purchase prices of goods and services. The freight rate is usually determined by auction of both
interested parties, although in most cases it is the offeror who determines the starting rate. The
reverse auction mechanism often enables obtaining better transaction terms than with traditional
negotiations, with the formal process of negotiating being reduced to a minimum
(Książkiewicz, 2011, pp. 264). Bearing in mind all these definitions, it could be said that an
electronic freight exchange is a kind of virtual market in which the exchange of information
and transport offers occurs. It is a tool that not only enables access to the pan-European freight
market and streamlines the offer selection process, but also a system which enables
simultaneous communication between many contractors.
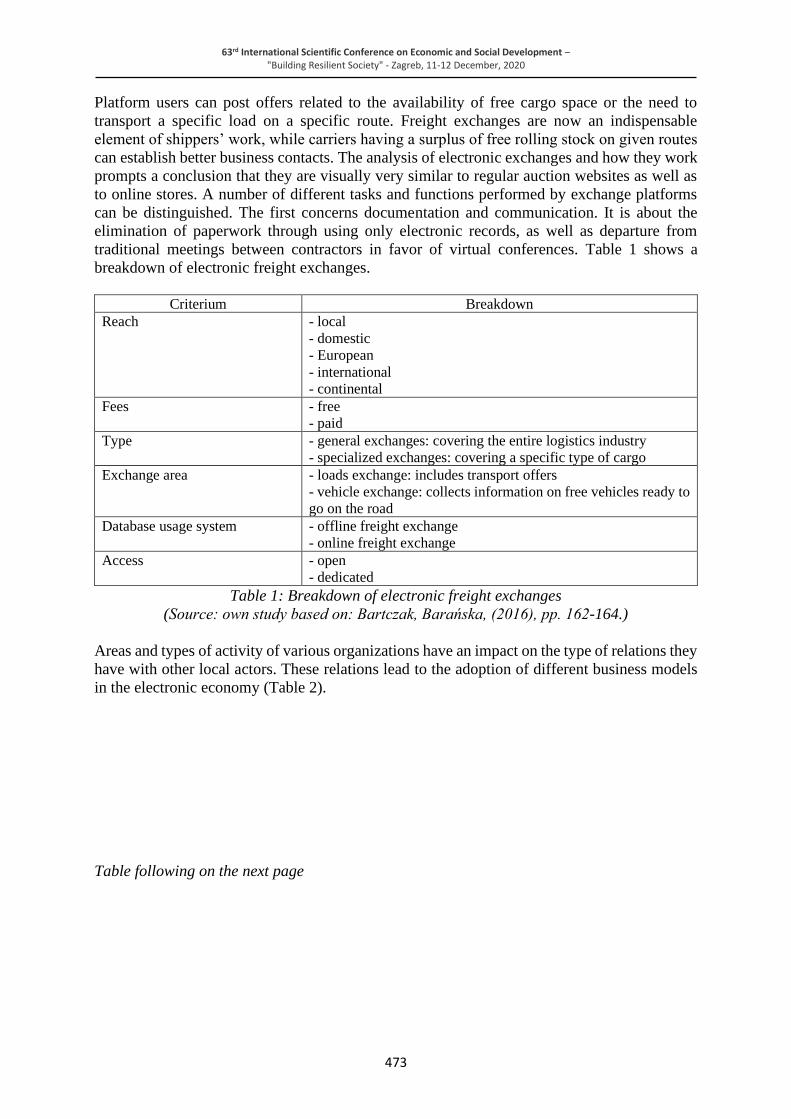
63rd International Scientific Conference on Economic and Social Development – "Building Resilient Society" - Zagreb, 11-12 December, 2020
473
Platform users can post offers related to the availability of free cargo space or the need to
transport a specific load on a specific route. Freight exchanges are now an indispensable
element of shippers’ work, while carriers having a surplus of free rolling stock on given routes
can establish better business contacts. The analysis of electronic exchanges and how they work
prompts a conclusion that they are visually very similar to regular auction websites as well as
to online stores. A number of different tasks and functions performed by exchange platforms
can be distinguished. The first concerns documentation and communication. It is about the
elimination of paperwork through using only electronic records, as well as departure from
traditional meetings between contractors in favor of virtual conferences. Table 1 shows a
breakdown of electronic freight exchanges.
Criterium Breakdown
Reach - local
- domestic
- European
- international
- continental
Fees - free
- paid
Type - general exchanges: covering the entire logistics industry
- specialized exchanges: covering a specific type of cargo
Exchange area - loads exchange: includes transport offers
- vehicle exchange: collects information on free vehicles ready to
go on the road
Database usage system - offline freight exchange
- online freight exchange
Access - open
- dedicated
Table 1: Breakdown of electronic freight exchanges
(Source: own study based on: Bartczak, Barańska, (2016), pp. 162-164.)
Areas and types of activity of various organizations have an impact on the type of relations they
have with other local actors. These relations lead to the adoption of different business models
in the electronic economy (Table 2).
Table following on the next page

63rd International Scientific Conference on Economic and Social Development – "Building Resilient Society" - Zagreb, 11-12 December, 2020
474
Government (G) Business (B) Customer (C) G
over
nm
ent
(G)
G2G
Process coordination,
internal document
flow
G2B
Flow of economic information
G2C
Flow of
administrative
information
Busi
nes
s (B
)
B2G
Public procurement
B2B
Conventional e-business,
relations between entities consist
in concluding and fulfilling
orders, payments and
establishing business contacts
B2C
Conventional e-
commerce,
transactions
concluded between
businesses and
individual customers
Cust
om
er (
C)
C2G
Taxes
C2B
Price comparison, transactions
between individual consumers,
organized and controlled by
business entities
C2C
Online auctions,
social networks, area
of activity - trade
from private users
(purchase and sale
transactions)
Table 2: Relations between the main actors in the electronic economy
(Source: own study based on: Combe, (2006), p. 67.)
Each business entity offering services online uses a specific business model which answers the
basic question of how to generate income. Lack of a clearly defined business model is one of
the most common barriers to successful e-business activity (Nojszewski, 2006). It is crucial to
distinguish three actors (government, business and customer) and their mutual relations. The
relationships that occur are the most important elements of the economic environment in which
the company operates within a network. The nature of concluding transactions on the electronic
exchange market can be associated with the B2B (Business-to-Business) model, since the
platforms act as a virtual, central online market whose main distinguishing feature is the fact
that many entrepreneurs operate simultaneously on both its ends (as service providers and
service recipients). A common synonym for electronic freight exchange is the term Electronic
Trading Hub (Szpringer, 2005, pp. 112). B2B systems are an offer tool for manufacturers, trade
intermediaries, distributors and wholesalers. On the other hand, they are also used as a
purchasing, bidding and auction platform. B2B platforms have a number of advantages, most
notably:
• streamlining and improving communication with business partners,
• automated control of trade exchange standards,
• improved management of relationships between business partners,
• reducing fulfillment time,
• automating the processes of order placement, ordering, invoicing etc. (Mamcarz, 2008, p.
4).
B2B markets are characteristic in that they require relatively low entry costs and yet high exit
costs. Low entry costs are often due to the fact that they are financed to a large extent from the
operator’s own resources to lure in potential contractors. On the other hand, the exit barrier is
most often created by clauses in participation agreements (e.g. an agreement imposing a

63rd International Scientific Conference on Economic and Social Development – "Building Resilient Society" - Zagreb, 11-12 December, 2020
475
minimum period of market access) (Salomon, 2001). The way of organizing trade in B2B
relations is most often implemented via two models: auction-tender and catalog. Special
combinations of these models are purchasing cooperatives (purchasing alliances), barter
markets and vertical markets (commodity exchanges - including freight exchanges).
2. BENEFITS AND RISKS FOR USERS OF ELECTRONIC FREIGHT EXCHANGES
The Internet is nowadays an effective and common trading mechanism. Electronic freight
exchanges provide a platform for B2B transactions with a view to breaking satisfactory profit.
With Industry 4.0 already settled in, Internet users focus on high-parameter network
connections and mobility of applications. Operators of electronic exchanges follow suit, as
these factors are prerequisites for gaining competitive advantage. The expectations to be met
by these platforms are becoming increasingly higher and are constantly changing. Regardless
of the size and reach of the website, operators also incur costs and struggle with many obstacles
(Skiba, 2020, 339-344). The first such threat emerges at the initial stage of functioning in
cyberspace, namely the difficulties associated with attracting a decent number of users. The
stock exchange itself is not an attractive solution - it is the users who ultimately decide its
success and popularity. Competition is another threat. The desire to make the platform stand
out and the expectations of users require a number of improvements and tweaks as well as
introduction of versatile and mobile solutions that call for significant investment outlays. This
last one does not concern the operator directly, but instead rests on the network provider.
Possibilities offered by online platforms are largely neutralized by the need to pay monthly
subscription fees for access. The impact of the virtual market on the company's operations is
significant, but online orders should not be the only source of income. Diversification of income
sources can be an important determinant of competitiveness in the TSL market. A useful feature
offered by freight exchanges is a barometer that provides users with access to information about
the current market demand and supply to better adjust the freight rates. In addition to reducing
empty runs, it is also possible to obtain offers for less-than-container loads (LCLs) and merge
them into loads that fill the entire cargo space. Another important benefit is the possibility of
acquiring permanent business partners. Recurring issues with drivers or high minimum-wage
rates do not leave transport and shipping companies with much room to maneuver. Long-term
relationships and contracts concluded via exchange platforms have therefore a positive effect
not only for the carrier, but also for the client (Starkowski, Zielińska, 2016). In the era of
Industry 4.0, the range of the Internet should be considered infinite. We cannot currently
imagine the economy without access to online resources. And while universal access to the
worldwide web comes with many benefits, it also poses serious threats, including cyber attacks
that defy computer security. As a result, using protective shields – or firewalls - on websites
becomes necessary. In practice, however, the effectiveness of this type of protection depends
on the skills of the hacker (Sosnowski, Nowakowski, 2015, pp. 169-170). Users of exchange
platforms should be aware of partners with whom they enter into transactions. The main issues
are associated with receiving payment for services as well as theft of transport loads by
fraudulent carriers. It is then no wonder that ensuring the security of all exchange participants
has become a top priority. The expectations of transport companies towards exchange operators
have to do primarily with minimizing the risk resulting from centering into business contracts
with new partners whose profiles cannot be sufficiently trusted. This is where verification of
company documents from both the client and the contractor becomes markedly important.
When concluding a transaction, the party ordering freight to a new carrier may also be hesitant
about the quality of services provided (Sosnowski, Nowakowski, 2015, pp. 160-161). Doubts
may arise regarding timely substitution of the means of transport, delivery time, loss or damage
of goods (Kuzia, 2019, pp. 294-300). Failure to keep deadlines may lead to costly warehouse
downtimes and therefore lack of smooth shipments.

63rd International Scientific Conference on Economic and Social Development – "Building Resilient Society" - Zagreb, 11-12 December, 2020
476
This is similar in the case of damage to the parcel where costs may arise due to disposal works,
repair or re-transport. Late payment of receivables is one of the most common issues for
contractors. Additionally, the flow of funds in TSL companies usually takes as many as 60 days,
meaning difficulties for subcontractors to stay afloat financially. In order to address these
problems, freight exchange platforms allow in their offer for broader interference in the scope
of transport contracts by selecting those users who meet the condition of transferring payments
within the statutory period of 30 days applicable in Poland (Sosnowski, Nowakowski, 2015,
pp. 162).
Table 3 shows the benefits and risks associated with using electronic freight exchanges.
Benefits Risks
- access to the market anytime anywhere,
- freight barometer,
- access to a rich cargo offer and businesses placing
orders in one place,
- speed of searching for offers,
- freedom of information exchange,
- mobile application available,
- convenient access to the communicator,
- possibility of acquiring new business partners,
- possibility of planning transport throughout Europe,
- ability to choose customers and service providers,
- access to additional services (route planning,
transaction settlement),
- access to current offers,
- comparing and negotiating freight rates,
- cost reduction (time, empty runs),
-relatively inexpensive acquisition of business
partners,
- user records,
- ability to verify reliability and solvency of
contractors,
- possibility of purchasing additional services, such as
debt collection.
- chance of dealing with dishonest contractors,
- performing services contrary to arrangements,
- non-payment for services ,
- subscription fees to access the platform
- access to the Internet,
- threat of malware and hacking attack
Table 3: Benefits and risks of using freight exchanges.
(Source: own elaboration based on: Bartczak, Barańska, (2016), pp. 163-164.)
Operators of freight exchanges offer different security systems and packages, including
solutions such as:
• securing access to the account with login and password,
• detailed verification of new users: verification of all users is to ensure a secure transaction
environment. Most often it requires providing company setup documents, transport license,
carrier insurance, forwarder insurance, time in business, etc.,
• company catalogs containing detailed information about exchange platform users: activity
profile, credibility,
• user forums: cross-evaluation of contractors. This tool enables simple and effective user
analysis. Rankings are often created based on ratings and reviews, with the possibility of
excluding unreliable or fraudulent entities from the group,
• debt collection services: concerning assistance in the recovery of funds from unpaid
invoices (Kos, B., 2011, pp. 592-594),
• remote monitoring of the order fulfillment status: applies to all operations related to the
performance of the service and the tracking of formal activities.

63rd International Scientific Conference on Economic and Social Development – "Building Resilient Society" - Zagreb, 11-12 December, 2020
477
All these services and solutions are aimed at improving the security of business operations
conducted via electronic freight exchanges while showing how serious operators are about the
security of their exchange platforms.
3. CONCLUSION
The current market situation forces businesses to maximize the use of freight potential in road
transport while minimizing the volume of road traffic and reducing fuel consumption and
greenhouse emissions. By implementing these assumptions, companies focus not only on
solutions related to modern and environment-friendly rolling stock, but also on innovative tele-
information technologies such as freight exchanges. Electronic freight exchanges strive to
provide full security of transactions concluded via their platforms. In addition, their very
existence has made the work of shipping and transport companies easier. However, despite the
rapidly growing road transport market, TSL companies are still facing number of barriers, such
as: shortage of drivers, rigorous procedures on international markets and high costs related to
running transport activities. On the other hand, the development of electronic freight exchanges
has triggered an increase in the volume of road transport in Europe while also helping to solve
problems related to insufficient rolling stock. As exchange services will continue to grow, so
will the innovation activities pursued by platform operators. Modern mapping technologies and
integration of telematic systems are becoming the norm. Exchange platforms have always been
quick to embrace innovative solutions, including mobile, and this is not likely to change in the
near future. Further development of exchange platforms in the area of buyer-and-seller
verification by operators is expected.
LITERATURE:
1. Bartczak, K., Barańska, A., (2016), Wpływ giełd transportowych na funkcjonowanie
przedsiębiorstw z branży logistycznej, Logistyka, 2016 No. 1, pp. 163-172.
2. Combe, C., (2006), Introduction to E-business, Management and Strategy, Elsevier,
London-Oxford.
3. Dojszewski, D., (2006), Przegląd modeli e-biznesowych, Retrieved 05.11.2020 from
https://www. www.e-mentor.edu.pl/artykul/index/numer/17/id/375.
4. Karaś, A., (2020), Investment directions for the development of seaports, Economic and
Social Development: Book of Proceedings, Porto, pp. 425-430.
5. Kos, B., (2011), Internetowe giełdy transportowe w działalności przedsiębiorstw TSL
(Transport-Spedycja-Logistyka), [from:] Zeszyty Naukowe Uniwersytetu Szczecińskiego.
Ekonomiczne Problemy Usług, Wydawnictwo Naukowe Uniwersytetu Szczecińskiego,
Szczecin, pp. 587-595.
6. Książkiewicz, D., (2011), Rola Internetu w usługach logistycznych, [from:] Usługi
logistyczne – teoria i praktyka, Rydzkowski, W., Biblioteka logistyka, Poznań.
7. Kuzia, M., (2019), Urban mobility model in the context of global trends, Economic and
Social Development: Book of Proceedings, Moskwa, pp. 294-300.
8. Mamcarz, P., (2008), Rynek elektronicznych systemów B2B, Polska Agencja Rozwoju
Przedsiębiorczości, Warsaw.
9. Salomon, A., (2001), Rynek B2B – stan obecny i perspektywy rozwoju, Namiary na morze
i handel, No. 17/568.
10. Skiba, S. (2013), Analiza ograniczeń i możliwości związanych z ewidencją kosztów
logistyki, Logistyka, 2013/6, pp. 999-1006.
11. Skiba, S. (2020), Outsourcing as a method of recruitment in the tsl sector, Economic and
Social Development: Book of Proceedings, Porto, pp. 339-344.
12. Sosnowski, J., Nowakowski, Ł., (2015), Elektroniczne giełdy transportowe, Difin, Warsaw.

63rd International Scientific Conference on Economic and Social Development – "Building Resilient Society" - Zagreb, 11-12 December, 2020
478
13. Starkowski, D., Zielińska, J., (2016), Wykorzystanie giełdy transportowej Wtransnet w
systemie planowania operacji transportowej przez spedytora w przedsiębiorstwie
transportowym i spedycyjnym z wykorzystaniem elektronicznego biznesu, Autobusy, No.
12/2016, pp. 1863-1870.
14. Szpinger, W., (2005), Prowadzenie działalności gospodarczej w Internecie, Wydawnictwo
Difin, Warsaw.

63rd International Scientific Conference on Economic and Social Development – "Building Resilient Society" - Zagreb, 11-12 December, 2020
479
COMPETITIVENESS OF SCIENTIFIC AND PEDAGOGICAL
WORKERS IN THE CONDITIONS OF FORMATION OF THE
NATIONAL SYSTEM OF QUALIFICATIONS
Svetlana Sotnikova
Novosibirsk State University of Economy and Management, Russian Federation
Elena Mikhailova
Novosibirsk State University of Economy and Management, Russian Federation
ABSTRACT
The purpose of this conceptual article is the analysis of very tectonics of independent
assessment of qualification. Independent assessment of qualification is considered as the tool
of assessment of competitiveness of human resources of the higher school. The term
«assessment of competitiveness of teachers» was not widely adopted still in domestic practice
owing to high methodological and methodical uncertainty. For methodical judgment of the
mechanism of assessment of competitiveness of human resources of the higher school the
primary value has knowledge of parameters of a status and characteristics of very tectonics of
independent assessment of qualification. The very tectonics of independent assessment of
qualification is integrated formations of components, correlation and which interaction causes
validation of qualification of the persons claiming for implementation of a pedagogical type of
work. In article the role of independent assessment of qualification as independent branch of
business assessment of competitiveness of employees of the higher school is justified. In article
the authoring interpretation and interpretation of social and economic contents, an entity of
backbone components of very tectonics of independent assessment of qualification is given. The
author’s research allows to develop understanding of need and a role of independent
assessment of qualification as method of assessment of competitiveness of teachers.
Independent assessment of qualification allows to operate with technologies of detection and
assessment of anomaly of supply and demand of qualifications in the market of teaching work.
Independent assessment of qualification allows to create connections of the higher education
with labor market and civil society.
Keywords: higher education, national system of qualifications, market of educational
programs, market of qualifications, independent assessment of qualification, employee
assessment
1. INTRODUCTION
The global labour market, as an element of the global economy, is undergoing significant
changes, leading to a competitive rivalry between national labour markets, as the external
environment of the national market becomes more complex, global integration processes are
intensifying and international economic ties are developing. Integration processes are
accompanied by an increase in the disproportions between labour supply and labour demand
and, therefore, an increase in the imbalances in the levels of labor productivity between different
countries, in the levels of income and material wealth inequality within and between countries,
a rising shadow employment, etc. National labour markets are becoming an important tool in
countries' confrontation for leadership in economic development. The need to protect the
national labour market requires the formation of a modern, transparent system of recognition
of the qualifications of Russian citizens by other WTO member countries, as well as those of
citizens of WTO member countries in Russia, which complies with basic international

63rd International Scientific Conference on Economic and Social Development – "Building Resilient Society" - Zagreb, 11-12 December, 2020
480
approaches. In this regard, the role of higher education can hardly to be overestimated, since it
is designed to be a tool for shaping the national qualification market and the main incentive for
the formation of long-term competitive advantages of the country's human resources. By
recognising the qualification of an employee as capital, the society encourages the education
system to carry out capital-saving labour training processes and to react to the behaviour of
state and non-state institutions on the labour market in order to meet their need for competitive
employees. As a matter of fact, there is an objective need in Russian society to move from a
market of educational programmes, where an employee's qualification is determined by the
volume and structure of residual knowledge of mastered educational disciplines in an
educational institution (i.e. diploma), to a market of qualifications, where the value of
knowledge, skills, professional skills and experience of an employee is determined by his or
her real readiness for quality work within the frameworks of a certain work activity or
profession (Table 1).
Comparing criteria Educational programme market Qualification market
Target Mastering a certain type of
professional activity
Satisfying market needs for the
quality of human resources
Object of the
competition
Educational program – a set of
basic characteristics of education
(volume, content, planned results),
organizational and pedagogical
conditions, forms of certification
Qualification of an employee - level
of knowledge, competencies,
professional skills and experience
Subject-matter of
competitionи
Official recognition in the form of a
diploma/certificate of mastering a
certain type of professional activity
Labour efficiency as recognition of
learning outcomes that link education
to the labour market and civil society
Descriptors Residual knowledge assessment Execution of labor duties or
employment action
Supply side Educational institutions Organizations that carry out
educational activities (including
training centers for professional
qualification, activities in the
workplace).
Self-education .
Demand side Employable citizens wishing and
mastering an educational program
Market need for workforce provided
with wage and living funds
Price Price of the educational program Estimated (assumed) increase in
income, reflecting the efficiency of
possession of a certain qualification
Market organisation
principle
National educational levels National qualification levels
Attitude to non-
formal learning
Non-formal education is not
recognized
Recognition of non-formal learning
(self-learning)
Market benefit
Continuity of educational programs
at different levels
Creation of conditions for labor
mobility of able-bodied people,
international and intersectoral
comparability of qualification levels
Market limitations Mismatches between labor supply
and labor demand
Bulky infrastructure
Market management
target
Training of bachelors, specialists,
masters, researchers
Balance of demand for workers'
qualification from the labor market
and supply of qualifications from the
education and training system
Table 1: Comparative characteristics of the present «educational programme market» and
the forthcoming «qualification market»

63rd International Scientific Conference on Economic and Social Development – "Building Resilient Society" - Zagreb, 11-12 December, 2020
481
The transition to the qualification market raises broader issues. These are, firstly, to improve
the competitiveness of the national economy, labour productivity and quality of life by bringing
together market requirements for the quality of human resources and the content of vocational
education and training programmes; secondly, to facilitate labour mobility of Russian and
foreign citizens through the creation of conditions for international and inter-sectoral
comparability of qualification levels. A change in the key benchmarks in education «leads to
complication of the content of teaching work and changes in its traditional functions» [Bagirova
A.P., et al., 2016, p.3].
2. SETTING THE RESEARCH OBJECTIVE
The most important condition for the transition from the market for educational programmes is
the competitiveness of the university's scientific and pedagogical workers (hereinafter – the
SPW). Competitiveness of the SPW is the ability of teachers to maintain or strengthen the
position of an educational service in the market. Both the efficiency of education and the
competitiveness of higher education institutions depend on their competitiveness. The current
status of human resources in higher education does not quite match the trends in the accelerating
process of knowledge renewal. Despite the growing scale of the higher education system and
the development of postgraduate and doctoral studies, science and higher education are facing
an acute shortage of highly qualified scientific and scientific-pedagogical personnel.
Insufficient social and material assessment of university educators' work, their low standard of
living and quality of life have provoked an outflow of highly qualified pedagogical staff from
higher education to other areas of activity. Deterioration of the qualification characteristics of
scientific and pedagogical personnel of higher education institutions, observed in recent years,
is accompanied by the physical ageing of the scientific and pedagogical staff of higher
education institutions: the average age of university educators is steadily increasing, while the
share of educators under 35 years of age with a PhD degree is not high. The actions taken to
ensure the competitiveness of the SPW are in most cases formal. The number of participants in
conferences at various levels has decreased due to the lack of sufficient funds for such events
at universities. Educators are less and less frequently attending training centres that are not
located in the city. Moreover, educators' desire to work together to ensure a decent standard of
living leaves them little time for research and development, professional development and self-
development. At the same time, in modern economic conditions, a large amount of professional
knowledge is not simply used; it is becoming more and more specific, which makes it difficult
to transfer intellectual resources from educators to students. In order to effectively train
specialists to work in the economy, educators no longer have enough personal experience,
intuition and training programmes, which include exchange of experience at scientific and
methodological conferences, round tables, communication with colleagues at special seminars,
allowing them to demonstrate their own achievements, achieve their recognition and receive
new incentives for development. A modern teacher is professionally responsible not only for
transferring, storing and using knowledge, but also for multiplying it. Modern educators need
to have, maintain and periodically update classical knowledge in the professional field and at
the same time rebuild their own lifestyle and work style in relation to market requirements.
Without an assessment of the SPW's competitiveness, effective and high-quality teaching in
modern conditions is impossible. Thus, reforming the national education system necessitates
the establishment and development of a new approach to assessing the competitiveness of the
SPW in higher education. The estimation of competitiveness of SPW becomes one of the main
social and economic factors of preservation and development of the best traditions of higher
education institution, its scientific schools.

63rd International Scientific Conference on Economic and Social Development – "Building Resilient Society" - Zagreb, 11-12 December, 2020
482
The higher education institutions which will be able to adjust an effective system of an
estimation of competitiveness of the educators, can adapt to changing conditions, will generate
image of attractive high school, and business structures, in turn, will be interested in mutually
advantageous cooperation with higher school.
3. COMPETITIVENESS OF SCIENTIFIC AND PEDAGOGICAL WORKERS: A
METHODOLOGICAL APPROACH TO ITS EVALUATION
Despite the growing interest in the theoretical, methodological and applied issues of increasing
the competitiveness of the SPW, the process of institutionalisation of its conceptual and
terminological apparatus has not yet been completed. The analysis of available literature on the
considered problem allows to ascertain, that use of the term «competitiveness» SPW (the
educator, the faculty, the personnel of higher education institution, human resources of higher
school, etc.) is widespread enough phenomenon. In their majority, scientists and practitioners
adhere to and develop the point of view on the competitiveness of higher education institution
educators proposed by Ulyanovsk researchers under the guidance of Professor V.N. Lazarev.
Competitiveness of higher education institution staff is understood as «a complex characteristic
reflecting the degree of development of scientific and pedagogical potential of higher education
institution pedagogical staff, determining its ability to carry out scientific and pedagogical
activities and ensuring the achievement of the quality level of educational services that meet
the established standards of education and consumer demands, and the objectives of the higher
education institution» [Lazarev V.N., Pirogova .V., 2010, p.12]. In this regard, the indicators
of competitiveness of university educators are the availability of scientists and honorary titles,
the number of prepared and published abstracts of reports, articles, monographs, textbooks,
manuals, organization, holding and participation in scientific and practical conferences at
various levels, the amount of funds for research, the number of trained personnel of higher
qualification through postgraduate and doctoral studies, the number of defended theses for a
degree, etc. [Abakumova N.N., 2014, pp. 162-172; Bedrachuk I.A., Mitina O.V., 2015, pp.39-
52; Lazarev V.N., Pirogova .V., 2010, p.12; Milyaeva L. G., Milyaev V. D., 2014, pp.14-21;
Naidenko I. S., Zadorozhna E. K., Kuizheva S. K., 2017, pp.479-488; Ozernikova T.G.,
Gainullina O.I., 2011, pp.28-32; Petsol'dt K., Vorob'eva I. V., Inozemtseva E. S., 2010, pp.433-
438]. However, it should be noted that the competitiveness of the SPW is due not only to the
qualitative characteristics of the workforce, which most fully correspond to the improvement
of the quality of higher education, but also to the socio-economic and production conditions
under which the abilities of educators in this work are used. In this regard, the competitiveness
of the SPW should be understood as the ability of educators to achieve corporate achievements
in work that contribute to the implementation of organizational goals of the university in the
most effective way. The competitive advantage of the SPW is those creative competencies of
educators and the properties of teaching, which create a certain advantage for the university
over the SPW of competitive universities in the implementation of the educational programme.
The competitive advantage of the SPW is, therefore, relative, determined in comparison with
the SPW of a competitor higher education institution which holds the best position in a
particular market for educational services. The competitive advantage of the SPW can be
considered in the personal (static) and activity (process) contexts. Personal competitiveness
pC exists as a potential for pedagogical activities. It defines a educator's ability to perform his
or her functions with quality and with minimal mistakes (without errors), to master new things
successfully and to adapt quickly to changing conditions. This competitiveness reflects the
multifaceted, complex characteristics of teachers' work opportunities in different situations and
with different subjects of educational activity – colleagues, management, subordinates,
students, representatives of companies and other higher education institutions.

63rd International Scientific Conference on Economic and Social Development – "Building Resilient Society" - Zagreb, 11-12 December, 2020
483
The prospects for the formation of a renewed and unified qualification space for the SPW of
higher education dictate the need to identify indicators for assessing personal competitiveness,
which will open up in connection with the adoption of the professional standard «Educators of
vocational training, vocational education and additional vocational training» approved by Order
№ 608n of the Ministry of Labour and Social Protection of the Russian Federation dated 8
September 2015. Personal competitiveness for the SPW of higher education
),,,( 4321 ccccfCp = must meet the following qualification requirements:
• the authority and responsibility (с1), reflecting the requirements for the general competence
of the SPW and characterising the degree of independence of an employee in his or her
professional activities, the scope of functions performed by the employee, and the share of
autonomous work without the supervision of experienced qualified employees;
• the nature of skills (с2), which reflect the complexity of professional activity, the
multiplicity (variability) of ways to solve professional tasks, the need to choose or develop
these ways in the uncertain and unpredictable development of the working situation;
• the nature of knowledge (с3), describing the volume and complexity of the information
used, the innovativeness and abstractedness of knowledge in professional activity in the
context of the increasingly complex process of transferring intellectual resources from
educators to students;
• the main ways to achieve a level of qualification (с4) are typical educational trajectories for
mastering a certain qualification. These include, for example, master's or specialist's
programmes, additional professional programmes, postgraduate (adjunct) training for
scientific and pedagogical staff, residency programmes, apprenticeship programmes and
practical experience.
Operational competitiveness оС is an economic form of implementing the personal
competitiveness of an educator in its joint movement with material factors. It is the extent to
which personal competitiveness is brought into a functioning state. Operational
competitiveness, being a complex intellectual, practical and socially conditioned substance that
ensures effective educator practice, not only determines the result of the educator's activity, but
also the very course of his thinking and activity. The professional standard «Educator of
vocational training, vocational education and additional vocational training» sets out the need
to assess performance competitiveness in the ),,,,,( BDEHIJfСо = following six
generalised job functions:
1) postgraduate (adjunct), residency, apprenticeship and additional professional programme
oriented towards the relevant qualification level (J);
2) teaching in the bachelor's, specialist's, master's and additional professional programmes
focused on the relevant qualification level (I);
3) teaching in the bachelor's degree programmes and additional professional programmes
focused on the relevant qualification level (H);
4) conducting vocational guidance activities with schoolchildren and their parents (legal
representatives) (E);
5) organisational and pedagogical support for a group (course) of students in higher education
programmes (D);
6) organisation and implementation of the training and production process in the
implementation of educational programmes of various levels and directions (B).
The SPW's personal and operational competitiveness is characterised not only by the presence
of certain components (subsystems), but also by complete links between them.

63rd International Scientific Conference on Economic and Social Development – "Building Resilient Society" - Zagreb, 11-12 December, 2020
484
The competitive advantages of the SPW are inextricably linked to the personality of the
educator and can be formed and developed both in the process of mastering formal vocational
training programmes and in the course of work as experience is gained. At the same time, the
formed competitive advantages may not manifest themselves as the ability to provide
qualitatively increasing educational services over time. Also, when implemented at work, the
competitive advantages of teachers are subject to changes: some of their characteristics acquire
new properties that cause the dynamics of teaching efficiency. Thus, in order to gain and
maintain an advantage in modern education, it is necessary to have advantages both in the
personal (static) and activity (process) context of competitiveness. In other words, the high
parameters of the creative competencies of the SPW itself will not give the university a
competitive advantage in the field of human resources if the parameters of the organization of
pedagogical activities do not act as factors in the implementation of these competencies.
Otherwise, a educator 's productive creative activity will be replaced by formal performance of
duties, where the only motive in work is the desire to protect one's own status and income, one's
current position. Thus, the essence of the approach to management of competitiveness SPW
consists in correctly defining directions of search and realisation of SPW’s long-term
competitive advantages of higher education institution and not to lose time and forces, moving
in a wrong direction. According to this approach, not all educators are of equal value to the
university, and therefore it makes no sense to invest in the human capital of those who give the
minimum return on the invested capital. Competitiveness programmes should therefore be
different for different segments of educators and appeal to the values that are most common
among members of this segment. At least four strategies for increasing the competitiveness of
educators can be identified depending on personal competitiveness pC and operational
competitiveness оС (Table 2).
Strategic orientation of
the university
Competitive advantages of educators
Available New (potential)
Preservation of the
educational services
market
Specialization of
qualification
Diversification of
qualifications
Expansion of the
educational services
market
Trans-professionalisation of
qualifications
Expansion of qualification
Table 2: Strategies to extend the life cycle of corporate competitiveness of the SPW
The strategy for Specialization of qualification implies that the educator who offers the highest
quality of functional work provides the greatest benefit to the university. In this regard, the
university supports and encourages the use of various models of accumulation of human capital
by research and pedagogical staff in a particular professional field of activity. The strategy for
Diversification of qualifications involves the expansion of teaching experience associated with
the expansion of tools and areas of scientific and pedagogical activity, i.e. mastering
competitive advantages related to the performance of work, the so-called «horizontal» level of
complexity, namely, teaching, methodological, research, career guidance and organizational
and educational. Essentially, this strategy is related to building scientific, methodological and
pedagogical competencies. The strategy for Trans-professionalisation of qualifications is
focused on accumulating and using new competitive advantages that open up to educators,
allowing for a change in work with the lowest economic and social costs in the changing
conditions of the university's external and internal environment.

63rd International Scientific Conference on Economic and Social Development – "Building Resilient Society" - Zagreb, 11-12 December, 2020
485
This strategy assumes the acquisition of qualifications in a related profession. In an environment
where a university cannot guarantee that all the best educators will work in line with increased
competitive advantages in the foreseeable future, the strategy for Expansion of qualification is
becoming increasingly relevant. This strategy involves extending the life cycle of individual
educator competitiveness through the use of outsourcing schemes and expanding the geography
of higher education institutions of employment. In an innovative economy where changes are
taking place more and more quickly, those higher education institutions that not only attract the
best educators, but also know how to make full use of their potential by developing and
improving the strengths of their SPW are likely to have competitive staff. Maintenance of
competitiveness SPW of high school is one of the main purposes of strategic management of
human resources (as it is critical for success of education in the global market) [Masalova Yu.
A., 2015, p. 81].
4. INDEPENDENT QUALIFICATION ASSESSMENT AS A TOOL TO IMPROVE
THE COMPETITIVENESS OF THE SPW
An analysis of the available literature on labour evaluation in the Norilsk Industrial District
makes it possible to state that methods of assessing the results of pedagogical work
[Abakumova N.N., 2014, pp. 162-172; Bedrachuk I.A., Mitina O.V., 2015, pp.39-52; Milyaeva
L. G., Milyaev V. D., 2014, pp.14-21; Naidenko I. S., Zadorozhna E. K., Kuizheva S. K., 2017,
pp.479-488; Ozernikova T.G., Gainullina O.I., 2011, pp.28-32; Petsol'dt K., Vorob'eva I. V.,
Inozemtseva E. S., 2010, pp.433-438] and methods of educator competences (subject,
methodical, personal-communication, expert-consulting, managerial, etc.) [Bagirova A. P. et
al, 2016, pp. 129-131; Popova E. A., Ibragimova M. Kh., 2017, pp.53-64], which are aimed at
making managerial decisions to stimulate efficient work, prevail. These methods are based on
programme and other documents of the Ministry of Education and Science of the Russian
Federation, strategic goals set by the Government of the Russian Federation, as well as local
intrauniversity regulations. At the same time, there are practically no approaches to assessing
their competitiveness in the existing methods of assessing the SPW, i.e. to recognising that the
qualification requirements for an employee applying for pedagogical work are not only met,
but also represent a competitive advantage over educators who are competitors. An independent
assessment of their qualifications can be used as a methodological approach to assess the
competitiveness of the SPW. The key elements of the National Competence Assessment (NCА)
system were reflected in the adoption on 3 July 2016. The State Duma of the Federal Law
«About NCА», the subject of which is the relations arising during the NCА of employees or
persons applying for a certain type of employment. This draft law has conceptually defined the
status of an NCА as a completely different system that does not replace the certification of
employees of organisations that has existed since the planned economy and is still in force. The
need to understand the mechanism for assessing the competitiveness of the SPW of higher
education involves learning the parameters of the state and characteristics of the architectonics
of independent qualification assessment. Architectonics of independent qualification
assessment is an integrated education of components, the interrelation and interaction of which
leads to the validation of the qualification of an able-bodied person who applies for a certain
type of work. Architectonics' knowledge makes it possible to identify system-forming elements
that express the deep essence of qualification assessment and reveal the nature of internal unity
of components, interrelation and interaction of which determines the functional properties that
contribute to the formation of effective educational and career trajectories [Shaimakova Zh. B.,
2009, pp. 49-50] for each able-bodied citizen in order to meet the needs of the labour market as
human resources. NCА of able-bodied employees applying for scientific and pedagogical work
are a targeted process of confirming that the qualitative parameters of an employee's
qualification (knowledge, skills, professional skills and experience) meet the provisions of the

63rd International Scientific Conference on Economic and Social Development – "Building Resilient Society" - Zagreb, 11-12 December, 2020
486
professional standard1 or the qualification requirements established by federal laws and other
regulatory legal acts of the Russian Federation. The NCА has at least an information and
motivation function. The draft law does not provide for a fixed administrative function. The
information function of the NCА is to create an information infrastructure for the development
of management decisions on how to achieve the various qualification levels and how to expand
the set of qualifications themselves, and to inform all interested parties about these decisions.
It should be noted that the identification of the most optimal (suitable) vectors for achieving the
relevant (market) level of qualification in various life situations will not necessarily be linked
only to mastering the heights of professionalism (raising the qualification level) and the
successful progressive advancement of an employee «forward and up» on the organizational
and service ladder (promotion, improvement of social status, increase in remuneration, etc.).
The vector may also cover the sequence of qualification levels, firstly, the 'horizontal' scale of
complexity of work, i.e. the complex of knowledge, skills and experience in performing work
related to related occupations of equal complexity; secondly, the 'vertical' scale of complexity
of work, i.e. raising (lowering) the qualification level both when mastering a new, more
complex profession and within the profession by mastering work functions which require more
responsibility and independence, or by mastering advanced work methods and techniques,
increasing the service area and mastering related operations and functions. The transition from
one qualification level to another (both with and without changing the educational and career
paths) is not a border with clearly defined contours, but rather a zone of growth and/or
enrichment of features (structural elements) of the previous level at the new qualification level.
Since the structural elements of the previous qualification level are inherited by the new one,
the information function makes it possible to identify the competitive qualification advantages
of an employee and those areas of his/her work which may significantly affect the measure of
individual contribution to market goals. In addition, the information function of the NCА makes
it possible to create an information base for international, state and inter-sectoral comparability
of the SPW qualification levels of different countries, recognition of the equivalence of
educational programmes in terms of their content, and the competence of the assessment
subjects of a country to certify vocational education and training programmes. The motivation
function is an important means of regulating the economic behaviour of the SPW and higher
education institutions. On the one hand, the NCА encourages the SPW, who are aware of the
limits of freedom and responsibility for self-fulfilment, to master and improve their professional
activities, to master the various skills, competencies that complement and develop them, to set
boundaries and forms and to focus on achieving competitive sustainability2. This situation
promotes «the development of competition between employees for a more advantageous area
of application of their competitive advantages on the basis of free work and the growth of
personal income. A peculiar form of economic coercion is being developed to find a market
niche for the employee, which favours his competitiveness and provides him with a sustainable
competitive advantage in the market» [Sotnikova S.I., 2014, p. 46]. Ultimately, the motivational
function contributes to the formation of the SPW's internal world (needs, values, orientations,
etc.), moral qualities and work morality through income differentiation and qualification and
professional status depending on the employee's qualification assessment. On the other hand,
NCА is interested in preserving and multiplying intellectual capital both through recognition of
informal education, inheritance of structural elements (units) of qualifications in the process of
changing scientific and pedagogical educational and career paths (professional and functional
rotation) and spontaneous, random and unorganised process of improvement of knowledge,
1 A professional standard is a characteristic of the qualification required for an employee to perform a certain type of activity
(see: Article 195.1 of the Russian Labour Code). 2 Competitive stability is an employee's ability to maintain and develop competitive advantages when changing jobs or working
in changing conditions.

63rd International Scientific Conference on Economic and Social Development – "Building Resilient Society" - Zagreb, 11-12 December, 2020
487
skills, professional skills, accumulation of public work experience, development of proposals
to improve the production and commercial activities of the company, temporary performance
of a certain service role at a level that is not rigidly formalised in the organizational structure;
organization of internships for potential managers with leading organizational managers, etc.
This assessment serves as a protection against stagnation in educational activities, helps to
accumulate resources for creativity and creation, encouraging the identification of new
opportunities to improve the competitiveness of the internal labor market. Interested
participants in NCА are at least the lecturer himself, the head of the department and the
university rectorate. Each of the parties involved solves its own private tasks. Educator – takes
an opportunity to get an opinion on his or her level of qualification, possible ways to improve
it and express professional expectations. The head of department as the direct head – to define
qualifying potential of subordinates of SPW, to reveal requirements in their development, the
facts and reasons of low efficiency of labour activity. Rectorate – to provide the consecutive,
organised approach to measurement of SPW qualification and working out of programs on its
improvement taking into account strategy of development of higher education institution. NCА
as a formalized process for objectively confirming the compliance of an applicant's
qualification with the provisions of a professional standard or the qualification requirements
established by federal laws and other regulatory legal acts of the Russian Federation in
accordance with Federal Law № 238-FZ «About NCА», ideally there can be no one-off («once
for life»), as scientific and technological progress requires employees to master new
knowledge, skills, professional skills and experience, which must be confirmed in the course of
their work. Apparently, the periodicity standards must be defined for each type of work and
recorded in the relevant professional standard. An NCА is effective if its organization meets
certain requirements:
• independence – means that the qualification assessment centre, as an independent entity,
exercises the powers granted to it by the NCА, regardless of any natural or legal persons,
based on the beliefs derived from a clear knowledge of the law and the specific current
situation. Independence means that any influence on the procedure and results of
qualification assessment by a qualification applicant, specific employer, educational
organisation, etc. is excluded;
• voluntary – provides for the free expression of the will of an able-bodied citizen who has
applied (including on a referral from the employer) to a qualification assessment centre to
confirm his or her qualifications in accordance with the procedure established by Federal
Law № 238-FZ «About NCА» dated 3 July 2016;
• accessibility – this implies the establishment of a certain guarantee and compensation for
employees when they go through the NCА and the creation of the necessary number of
appropriate qualification assessment centres;
• competence – means a clear understanding by experts of their rights and obligations,
opportunities and limitations, knowledge of the essence of a certain type of work and the
specifics of its manifestation in specific conditions and situations, possession of the
evaluation tools for carrying out NCАs, techniques and productive technologies for
performing functional duties;
• openness – means consistent and timely provision of information in a form that provides
easy and accessible public perception of the activities (goals, objectives, plans and results)
of the National Qualification Development Agency, professional qualification councils and
qualification assessment centres, access to which is not specifically restricted by federal
laws, acts of the President and Government of the Russian Federation;
• impartiality – presupposes the presence of an objective position of experts formed using
scientifically based tools and technology that are adequate for the purpose of evaluation and

63rd International Scientific Conference on Economic and Social Development – "Building Resilient Society" - Zagreb, 11-12 December, 2020
488
are independent of the subjective opinion or requirements of the applicant, a particular
employer, an educational organization or other third parties;
• confidentiality – provides for the protection of personal data and does not allow for the
deliberate or accidental dissemination of information that could compromise a qualification
applicant, a particular employer, an educational organization, etc.
The goal of NCА is to validate the educator's compliance with the requirements of the labour
market, as reflected in federal laws and other regulatory acts of the Russian Federation, in order
to build an educational and career path. An inventory of the educator's qualifications is carried
out using a dichotomous assessment scale («meets – does not meet») based on the «qualification
– professional standard» criterion. The subject of an NCА is a qualification assessment centre,
i.e. a legal entity that carries out NOC activities in accordance with Federal Law No. 238-FZ
«About NCА». An NCА is carried out by the qualification assessment centre in the form of a
professional examination in accordance with the procedure established by the Government of
the Russian Federation. As a rule, the professional examination takes place in three stages: the
first stage, the entrance stage, the purpose of which is to fill in an electronic questionnaire,
download the required set of assessment tools, and also a technical examination of the set of
documents, establishing their compliance with the requirements of the professional standard;
the second stage, the theoretical stage, the purpose of which is to computer test existing
knowledge and process the results of this test; and the third stage, the practical stage, the
purpose of which is to evaluate the performance of a work sample, a practical task, and the
results of this examination. The NCАof higher school educators will improve the level of
teaching and the prestige of Russian education, as well as the competitiveness of Russian
universities both in the domestic and international markets.
5. CONCLUSION
Thus, one of the key tasks in establishing a national market for qualifications should be to
develop a coherent and consistent system of NCАs, which will ensure the constant growth of
the competitiveness of higher education educators. And it is precisely this system that creates
the basis for the development of an updated and unified qualification space in the Norilsk
Industrial District that uses technologies to detect and assess an anomalies in the supply and
demand for higher education educators' qualifications on the labour market, in order to identify
unique opportunities to form competitive advantages. It is necessary to face a reality which
consists that educational institutions should constantly reveal competitive advantages and
vulnerable positions in qualification of the SPW so that to predict, simulate and choose the most
effective ways helping each teacher to become more productive and to reach the market
purposes taking into account favorable (an input in a new segment of the labour market, the
unsatisfied consumer demand in a labour force, labour diversification, etc.) and unfavourable
opportunities (reduced demand for labour, growing unemployment, falling living standards for
the working population, vulnerability to competition, unfavourable demographic situation,
etc.). In a changing business environment, the NCА, recognizing the strategic value of human
resources quality, is a complex and multidimensional phenomenon designed to «serve as a
passport to professional competence» [Sotnikova S.I., Volyanskii G.N., 2012, pp. 45-55] of
SPW. The prospects that open up in this connection dictate the need for further knowledge and
competent organization of the NCА's architecture, which makes it possible to obtain relevant
information for management decisions aimed at improving the efficiency and competitiveness
of the educational business.

63rd International Scientific Conference on Economic and Social Development – "Building Resilient Society" - Zagreb, 11-12 December, 2020
489
LITERATURE:
1. Abakumova N. N. (2014). Effektivnyi kontrakt v vysshem obrazovanii: «za» i «protiv»
[The effective contract in the higher education: pro and contra]. Vestnik NGUEU [Vestnik
NSUEM], No. 3, pp. 162-172.
2. Bagirova A. P., Klyuev A.K., Notman A.K., etc. (2016). Prepodavatel'skii trud v
sovremennoi Rossii: transformatsiya soderzhaniya i otsenki: monografiya [Teaching work
in modern Russia: transformation of contents and assessment], M-vo obrazovaniya i nauki
Ros. Federatsii, Ural. federal. un-t., Ekaterinburg, Izd-vo Ural. un-ta.
3. Bedrachuk I. A., Mitina O. V. (2015). Effektivnyi kontrakt s prepodavatelem kak
instrument povysheniya effektivnosti deyatel'nosti vuza [Effective contract with the teacher
as instrument of increase in efficiency of activity of higher education institution].
Universitetskoe upravlenie: praktika i analiz [University management: practice and
analysis]. No. 1, pp. 39-52.
4. Lazarev V. N., Pirogova E. V. (2010). Upravlenie konkurentosposobnost'yu personala
vysshego uchebnogo zavedeniya [Management of competitiveness of personnel of a higher
educational institution]. Ul'yanovsk, UlGTU.
5. Masalova Yu. A. (2015). Sistema upravleniya kachestvom chelovecheskikh resursov
[Quality management system of human resources]. Vestnik Omskogo universiteta. Seriya:
Ekonomika [Herald of Omsk university, series «Economics»]. No.1. pp. 81-85.
6. Milyaeva L. G., Milyaev V. D. (2014). Otsenka dolevogo vklada nauchno-
pedagogicheskikh rabotnikov vysshikh uchebnykh zavedenii v dostizhenie analiziruemykh
pokazatelei obrazovatel'noi programmy [Assessment of the share contribution of scientific
and pedagogical workers of higher education institutions in achievement of analyzed
indicators of the educational program]. Gumanizatsiya obrazovaniya [Humanization of
education]. No. 3, pp. 14-21.
7. Naidenko I. S., Zadorozhna E. K., Kuizheva S. K. (2017). Ekonomiko-matematicheskie
metody v individualizirovannoi otsenke chelovecheskogo kapitala vuza [Economic-
mathematical methods in the individualized assessment of university''s human capital].
Kreativnaya ekonomika [Creative Economy]. Vol. 11, No. 4, pp. 479-488.
8. Ozernikova T.G., Gainullina O.I. (2011). Razvitie stimulirovaniya truda professorsko-
prepodavatel'skogo sostava vuzov na osnove sistemy sbalansirovannykh pokazatelei
[Development of university faculty motivation based on balanced score card]. Izvestiya
Irkutskoi gosudarstvennoi ekonomicheskoi akademii (Baikal'skii gosudarstvennyi
universitet ekonomiki i prava)[ Bulletin of Baikal state university]. No. 5, pp. 28-32.
9. Petsol'dt K., Vorob'eva I. V., Inozemtseva E. S. (2010). Reputatsiya prepodavatelya i ee rol'
v povyshenii konkurentosposobnosti vuza na mirovom rynke obrazovatel'nykh uslug
[Professor's reputation and its role in increasing the competitiveness of the higher
educational institution on the market for educational services]. Problemy sovremennoi
ekonomiki [Problems of modern economy]. No. 2, pp. 433-438.
10. Popova E. A., Ibragimova M. Kh. (2017). Otsenka personala kak neobkhodimyi element
sistemy strategicheskogo upravleniya universitetom [Personnel evaluation as an essential
element of the university strategic management]. Universitetskoe upravlenie: praktika i
analiz [University management: practice and analysis]. No. 2, pp. 53-64
11. Soveshchanie po voprosu razrabotki profstandartov ot 9 dekabrya 2013 goda [Meeting on
development of professional standards of December 9, 2013], available at:
http://kremlin.ru/events/president/news/19812
12. Sotnikova S. I., Volyanskii G. N. (2012). Dvizhenie personala kak mekhanizm povysheniya
korporativnoi konkurentosposobnosti v nestabil'noi srede [The movement of personnel as
the mechanism of increase in corporate competitiveness in the unstable environment].
Vestnik NGUEU [Vestnik NSUEM]. No. 2, pp. 45-55.

63rd International Scientific Conference on Economic and Social Development – "Building Resilient Society" - Zagreb, 11-12 December, 2020
490
13. Sotnikova S.I. (2014). O kar'ernom prostranstve v rossiiskom obshchestve [About career
space in the Russian society]. Izvestiya Baykal'skogo gosudarstvennogo universiteta
[Bulletin of Baikal state university]. No. 3, pp. 46-52.
14. Shaimakova Zh.B. (2009). Rol' innovatsionnoi kompetentnosti v razvitii
konkurentosposobnosti prepodavatelya vysshei shkoly [Role of innovative competence of
development of competitiveness of the teacher of the higher school], Doctor’s thesis,
Tambov.

Supported by:


![MAQUINA DIGITALES Y MAQUINAS ANALOGICAS [12249]](https://static.fdokumen.com/doc/165x107/63453bf9df19c083b107f873/maquina-digitales-y-maquinas-analogicas-12249.jpg)