INSTITUTE FOR MONETARY AND ECONOMIC STUDIES
33
IMES DISCUSSION PAPER SERIES INSTITUTE FOR MONETARY AND ECONOMIC STUDIES BANK OF JAPAN C.P.O BOX 203 TOKYO 100-8630 JAPAN The Japanese Economy in a World of Knowledge-Based Growth Charles I. JONES Discussion Paper No. 98-E-16
-
Upload
independent -
Category
Documents
-
view
0 -
download
0
Transcript of INSTITUTE FOR MONETARY AND ECONOMIC STUDIES

IMES DISCUSSION PAPER SERIES
INSTITUTE FOR MONETARY AND ECONOMIC STUDIES
BANK OF JAPAN
C.P.O BOX 203 TOKYO
100-8630 JAPAN
The Japanese Economy in a World
of Knowledge-Based Growth
Charles I. JONES
Discussion Paper No. 98-E-16

NOTE: IMES Discussion Paper Series is circulated in
order to stimulate discussion and comments. Views
expressed in Discussion Paper Series are those of
authors and do not necessarily reflect those of
the Bank of Japan or the Institute for Monetary
and Economic Studies.
IMES Discussion Paper Series 98-E-16
December 1998
The Japanese Economy in a World
of Knowledge-Based Growth
Charles I. JONES*
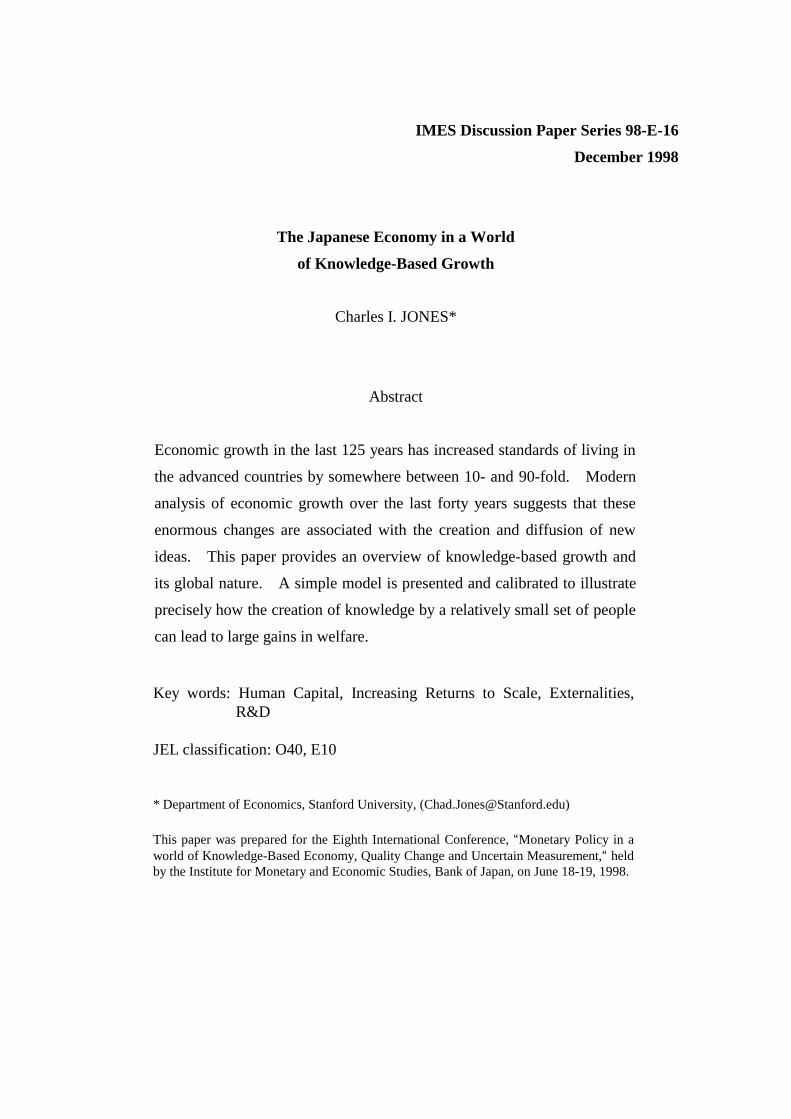
Abstract
Economic growth in the last 125 years has increased standards of living in
the advanced countries by somewhere between 10- and 90-fold. Modern
analysis of economic growth over the last forty years suggests that these
enormous changes are associated with the creation and diffusion of new
ideas. This paper provides an overview of knowledge-based growth and
its global nature. A simple model is presented and calibrated to illustrate
precisely how the creation of knowledge by a relatively small set of people
can lead to large gains in welfare.
Key words: Human Capital, Increasing Returns to Scale, Externalities,R&D
JEL classification: O40, E10
* Department of Economics, Stanford University, ([email protected])
This paper was prepared for the Eighth International Conference, “Monetary Policy in aworld of Knowledge-Based Economy, Quality Change and Uncertain Measurement,“ heldby the Institute for Monetary and Economic Studies, Bank of Japan, on June 18-19, 1998.

1 Introduction
At least since Solow (1956) and Swan (1956), economists have understood that growth
in multifactor productivity is essential to sustained growth in per capita income. The
question asked in modern growth theory is basically, “Where does this multifactor
productivity growth come from?” The growth literature contains many answers to
this question, ranging from learning-by-doing (Arrow 1962a) to human capital accu-
mulation (Lucas 1988) to externalities to public capital. An additional possibility,
however, is that productivity growth results from the discovery of new ideas. This is
the possibility that is examined in detail in this paper.
The recent examination of idea-based growth models in the growth literature is
influenced tremendously by the work of Romer (1986, 1990). Romer himself is careful
to give credit to a large body of earlier work that includes Arrow (1962b), Phelps
(1966), Shell (1966), Nordhaus (1969), and others. And much important work has
extended Romer’s contributions, including Grossman and Helpman (1991) and Aghion
and Howitt (1992). More broadly, work on idea-based economic growth encompasses
a wide range of research, far too broad to review here.1 Suffice it to say that much of
this work has been carried out by participants of this conference.
This paper presents an overview of knowledge-based growth, both at a conceptual
level and through the presentation and calibration of a simple growth model. Section 2
reviews the important insights that arise when we think of growth as resulting from the
creation of new ideas. Issues such as increasing returns to scale, knowledge spillovers
and externalities, imperfect competition, and property rights are placed at the center
1A more detailed review can be found in Jones (1998), among other places.
1

of our attention.
Section 3 outlines a simple model of knowledge-based growth to examine these
issues more formally. The increasing returns to scale associated with the nonrivalry
(or infinite expansibility) of ideas is shown to be an essential feature of idea-based
growth. We see not only that growth in per capita income results from growth in the
stock of ideas, but also that the growth in the stock of ideas results from growth in
the world’s research efforts. The global nature of idea-based growth is important from
the demand side as well. The fact that entrepreneurs like Bill Gates can sell their
creations in a large world market raises the return to research and stimulates research
activity throughout the world.
Section 4 provides a simple quantitative look at the idea-based growth model.
We see not only that research effort in the G-5 countries (France, Germany, Japan,
the United Kingdom, and the United States) has been growing in the last thirty-five
years, but also that research intensity — the fraction of the G-5 population engaged in
research — has also been growing. Japan is an important component of this growth,
making up about 15 percent of G-5 research activity in 1965 but more than 25 percent
in 1990.
A simple experiment at the end of the paper emphasizes the importance of re-
search effort and the potential magnitude of the gains, both social and private, from
research activity. While measurement problems make precise interpretation difficult,
the exercise suggests that a modest shift of labor into research in Japan that costs
about 1/30th of a percent of Japanese GDP could raise G-5 GDP by about 1 percent
in the long run. This number is perhaps too large to be believed, but it is suggestive
2

that large returns to research can be obtained if we can simply figure out the best way
to capture them.
2 Knowledge-Based Growth
What is an idea? In idea-based growth models, an idea is typically defined as the
“instructions” for transforming basic raw materials in an economy such as labor or
capital into either a new kind of good, a better version of an existing good, or a larger
quantity of existing goods. The nature of these instructions is often not important.
What matters is that the economy can now use a given collection of raw materials to
produce a higher quantity of (quality-adjusted) goods and greater utility.
2.1 The Economics of Ideas
My sense is that the most important insight of the idea-based growth literature can
be summarized very concisely by the following relationships:
Ideas −→ Nonrivalrous −→ IRS −→ Imperfect Competition. (1)
Each of these links will be examined in turn.
The first link indicates that a fundamental property of ideas is that they are non-
rivalrous. Recall that a good is rivalrous if one person’s use of the good diminishes or
eliminates the potential for someone else to use the good simultaneously. Most goods
that we think of are rivalrous: an airplane seat on a particular flight at a particular
time, a unit of computer processing power, or the live performance of Beethoven’s
Fifth Symphony by the Tokyo Philharmonic Orchestra.
3

In contrast, ideas are not like most other economic goods. They are nonrivalrous
in that one person’s use of an idea does not in any way diminish the usefulness of the
idea to someone else simultaneously. Examples include the fundamental theorem of
calculus, the just-in-time inventory method, and the sequence of musical notes that
make up the Fifth Symphony. While your sitting in the front row, center seat for
a performance of the symphony means that I cannot be sitting there, there is no
technological limitation that precludes several different orchestras from performing
the symphony simultaneously. The instructions for performing the symphony are
nonrivalrous. Drawing on a letter written by Thomas Jefferson in 1813 brought to his
attention by Paul David, Quah (1996) uses the term “infinite expansibility” in place
of nonrivalry: once an idea is created, it can be expanded infinitely to any scale of
production.
The second link in equation (1) states that the nonrivalrous nature of ideas implies
that production of goods in the economy is characterized by increasing returns to scale.
Let Y be the quantity of output (or GDP) produced by an economy, let A represent
the level of knowledge in the economy, and let X represent a vector of rivalrous inputs
that are used to produce output, such as capital and labor. We might relate inputs
and outputs using a production function such as
Y = F (A, X). (2)
The standard replication argument says that in order to double the output pro-
duced in this fashion, we simply duplicate every rivalrous input. We build an identical
factory and hire an identical number of workers, and we obtain twice the output. This
argument is used to justify an assumption of constant returns to scale in X. That is,
4

for any number λ > 1, F (A, λX) = λY .
But what happens if we also double the stock of knowledge in the economy? Pro-
vided the marginal product of knowledge is always positive, it is easy to see that
F (λA, λX) > λY . If we double both knowledge and all rivalrous inputs, we will more
than double output. Production is characterized by increasing returns to scale. No-
tice that the nonrivalry or infinite expansibility of ideas is essential to this argument.
One can double output simply by building a new factory and duplicating the number
of workers because the instructions for producing the output do not need to be re-
produced or invented again. The instructions can be used at any scale of production
once they have been created.
For example, consider the production of the compact disc player by Sony. Produc-
ing the very first CD player required an enormous research investment. One might
think of the invention as the discovery of the precise instructions for assembling a CD
player. After the invention, subsequent units could be produced much more cheaply
because the instructions did not need to be reinvented. This is the hallmark of in-
creasing returns to scale.
The final link in equation (1) connects increasing returns to scale and imperfect
competition. It is well known that in the presence of increasing returns to scale,
all factors cannot be paid their marginal products; firms would make negative profits
under these circumstances. From a modeling standpoint, there are two ways to handle
increasing returns. We can assume the increasing returns are entirely external and
maintain perfect competition. This is the case in the Arrow (1962) learning-by-doing
story or in Shell (1966), where ideas are thought of not only as nonrivalrous, but also
5

as nonexcludable; i.e. as pure public goods. However, in part because of the patent
system and in part because of trade secrets, inventors seem to be able to capture some
part of the value of a new idea. For either of these reasons, an inventor may have,
at least temporarily, some market power. This suggests the second way of handling
increasing returns: imperfect competition.
The importance of imperfect competition in the economics of ideas has been long
understood. If Sony is required to sell CD players at marginal cost, there will be no
way to recoup the large fixed cost that is incurred in order to invent the CD player in
the first place. Some ex post market power allows Sony to earn quasi-rents that make
the invention worthwhile.
2.2 Some Policy Implications
From the previous section, it is clear that the economics of ideas is very different from
the economics of wheat or other traditional, rivalrous goods. Ideas are different in that
they are nonrivalrous, which leads to increasing returns and imperfect competition.
And ideas are different in that they are only partially excludable. Issues related to
property rights and spillovers naturally arise. The individual or organization that
creates a new idea may not be fully compensated on the margin for the social value of
the idea. This may occur both because of the direct benefits of the idea to consumers,
but also because future researchers benefit from the knowledge created by current
researchers (the “standing on shoulders” effect alluded to by Isaac Newton).
A large body of research reviewed by Griliches (1992) and Nadiri (1993), among
others, generally finds that the social rates of return to research are appreciably greater
6

than the private rate of return. Jones and Williams (1998) argue that the difference
between these rates of return indicates that firms may underinvest in research by at
least a factor of two, with much larger factors possible.
This raises the very interesting but very difficult question of what is to be done.
The patent system is one policy response that grants monopoly power to an inventor
for a limited period of time in order to allow the inventor to capture some of the social
value that is created. But this system is far from perfect. Patents are in effect for
only a short period of time, they require costly adjudication by the legal system for
their scope to be defined, they can be “invented around,” and they slow the adoption
and diffusion of the idea because the price of the good is kept above marginal cost.
Kremer (1996) proposes a novel mechanism through which the government purchases
some patents from the private sector and then places them in the public domain. The
purchase price could be set to reflect the social value of the innovation, if that can
be determined. An example that Paul Romer has provided is the polymerase chain
reaction (PCR). Biotech researchers in private as well as university and government
settings use the PCR technique extensively, but at a price which is much higher than
the underlying marginal cost. It might make sense for both the U.S. and Japanese
governments to purchase a license covering all current and future domestic use of the
idea and then allow researchers to use the idea without paying an additional fee.
More generally, it is important to recognize that the patent system and the way
in which a government attempts to line up private and social returns to research are
essentially ideas themselves. And there is no reason to think that the best ideas have
already been discovered and implemented.
7

3 A Simple Model
This section presents a simple model of idea-based growth to illustrate some of the
themes highlighted above as well as some of the important results developed in the
idea-based growth literature.2 It is helpful to view the model as a toy experiment,
like that which a chemist might set up in a laboratory. We will build a miniature
economy populated with simple economic agents and endowed with simple production
possibilities. At the appropriate time, we will flip the “ON” switch and then watch
the toy economy to see how it behaves. Key parameters in the model will be picked
so as to match some elements of the data for Japan, the United States, and other
advanced economies, so that when we conduct experiments with the toy model, they
may have some relevance for the way economic growth works in the world today.
3.1 The Economic Environment
Suppose our toy model consists of a number of separate “countries” or economies, all
of which are basically similar. Each economy produces a consumption/capital good
that is identical to that produced in other countries. Each economy also produces
ideas which are shared across economies. This sharing of ideas is the only way the
different economies interact.
The first piece of the economic environment in this model is a production tech-
nology for an output/consumption good. We assume that some quantity Y of this
good is produced by combining capital K and labor LY with the available stock of
2The model is largely taken from Jones (1995, 1998).
8

knowledge A:
Y = AσKαL1−αY , (3)
where σ > 0 and 0 < α < 1 are parameters of the production function. This kind of
production function can be motivated in a number of different ways. In particular, it
is worth noting that it emerges from a Romer (1990)-style setup in which output is
produced by combining labor and an expanding range of intermediate capital goods,
where A indicates the range of goods for which designs have been invented. Notice
that the production function exhibits constant returns to scale to the rivalrous inputs
K and LY , and therefore increasing returns to scale to the inputs and technology
together. As discussed above, this critical feature of the model results from the fact
that the nonrivalrous stock of knowledge A can be used at any scale of production
without having to be reproduced.
The next part of the economic environment describes how the various inputs are
themselves “produced.” For capital and labor, we follow the standard setup of Solow
(1956). Capital is simply the accumulation of foregone consumption:
K = sKY − dK, K0 > 0, (4)
where 0 < sK < 1 is the saving/investment rate in the economy and d > 0 is a
parameter measuring the rate of depreciation of capital.
One can easily allow utility-maximizing agents to choose a time path for the saving
rate sK . Alternatively, one can follow Solow (1956) and take the allocative decisions
to be given exogenously. This is the method pursued here. We will assume that sK
(as well as other allocative decisions) are simply exogenous parameters of the model.
9
Looking ahead, it also greatly simplifies the analysis to assume that the fraction of the
population that works as researchers to produce new ideas is exogenously given. In
this simple model, we will not undertake the very important analysis of the economic
incentives that lead individuals to produce ideas. We only pause here to note that
such analysis is one of the main contributions of recent work on economic growth.
Let L be the total quantity of labor in a particular economy, and assume that it
grows exogenously over time at rate n > 0:
L = L0ent, L0 > 0. (5)
Every economy in this toy world will have the same rate of population growth.
In addition to producing output, labor in each economy can also be used to produce
new ideas or new knowledge. However, unlike the production of goods, the production
of ideas occurs at the “world” level. This way of modeling ideas is motivated by the
simple but important fact that ideas used in any particular economy are invented
throughout the world. Singapore does not grow simply because of ideas invented by
Singaporeans. Rather, Singapore benefits from ideas created in Japan, the United
States, etc. Once this consideration is introduced, issues of technology transfer and
the diffusion of ideas become extremely important. In the simple model analyzed here,
we finesse this issue by assuming instantaneous diffusion of knowledge. As soon as a
new idea is invented, it becomes useful in every economy in the world. This is clearly
a weakness of the model, but there are already enough things going on that it is a
convenient simplification to make at the moment.
Let A represent the total stock of ideas discovered in the world. Then, A represents
the number of new ideas invented at a point in time. We assume that new ideas are
10

produced according to
A = δR, (6)
where R is the total number of researchers throughout the world looking for new ideas
and δ measures the number of new ideas that can be produced by a single unit of
research effort. We assume that the economy begins at time 0 with some stock of
ideas A0 > 0 already given.
While individual researchers, who are small relative to the aggregate, might take
δ as given, one can imagine that the productivity of research might depend on char-
acteristics of the economy. For example, the productivity of research may depend on
the number of ideas discovered in the past, i.e. δ = δAφ. A value of φ > 0 would
indicate that ideas discovered in the past raise the productivity of current research
effort. Such positive “knowledge spillovers” probably characterize at least some ideas,
such as the discovery of calculus or the semiconductor. On the other hand, it is also
possible that φ is negative. For instance, suppose that the best ideas are discovered
first and then it is harder and harder to find a truly original and useful idea. This
case might correspond to what has been called “fishing out”: in a fixed pool of fish,
as more fish are caught it becomes harder and harder to catch a new fish. Finally,
one could also imagine that the knowledge spillovers and fishing out concerns offset,
in which case one might want to consider φ = 0 so that the productivity of research
is simply some constant δ > 0.
Another consideration in the production of ideas is the possibility of duplicative
research. If we double the number of researchers looking for new ideas at a point
in time, will we in expectation double the number of new ideas that get discovered?
11

Perhaps not. This congestion effect can be included in the model by supposing that
it is Rλ that enters the production function, where 0 < λ ≤ 1 potentially captures the
duplication effect. Therefore, we replace equation (6) with
A = δRλAφ. (7)
We use the notation LA to represent a particular economy’s stock of researchers,
so that R is simply the sum of LA across countries. The resource constraint for any
particular economy is
LY + LA = L. (8)
Finally, we assume that a constant fraction of the labor force works in research:
LA = sAL (9)
and therefore LY = (1 − sA)L.
3.2 The Balanced Growth Path
Given this setup, one can show that the economy will converge over time to a balanced
growth path, i.e. a situation in which all variables are growing at constant exponential
rates. This is the situation that we will focus on.
Along a balanced growth path, it is easy to show that the following relationships
hold:
gy = gk =σ
1 − αgA, (10)
where gx denotes the exponential growth rate of some placeholder variable x along a
balanced growth path, and lower case letters correspond to the “per capita” version
12

of the upper case letters. For example, y ≡ Y/L denotes output per capita. The
first equality in this equation comes from the capital accumulation equation (K/K is
constant only if Y/K is constant). The second equality comes from log-differentiating
the production function.
Equation (10) illustrates the Solow (1956) result that long-run growth in per capita
income results from growth in productivity. Here, however, productivity is related to
the stock of ideas, and per capita income grows in the long-run only if the stock of
ideas that can be used in the economy grows. Therefore, we have
Result 1. Long-run growth in per capita income occurs because the stock
of ideas (or knowledge) in the economy grows in the long-run.
What, then, determines the growth rate of ideas along a balanced growth path?
To answer this question, rewrite equation (7) as
A
A= δ
Rλ
A1−φ. (11)
By definition, A/A will be constant along a balanced growth path. But this will be the
case only if the numerator and denominator on the right-hand-side of equation (11)
grow at the same rate. Therefore,
gA =λ
1 − φgR. (12)
That is, the growth rate of the stock of ideas is proportional to the growth rate of the
number of researchers.
Combining this last equation with (10), we find:
gy = γgR, (13)
13

where γ ≡ σ1−α
λ1−φ
. This gives us our second main result:
Result 2. Long-run growth in the stock of ideas and therefore in per capita
income is proportional to the long-run growth rate of the world’s stock of
researchers.
The intuition for this result is straightforward. Researchers produce ideas, and
growth in the stock of ideas requires growth in the number of researchers. A simple
example illustrates the point. Consider the case in which λ = 1 and φ = 0. Therefore,
the productivity of research is constant. Suppose that each researcher produces one
new idea every period. If the number of researchers is constant, then the stock of
ideas will rise over time, but at a declining rate: for example, if there are 10 new ideas
each period and the economy begins with a stock of 100 ideas, then the growth rate
will be very high initially, but will decline as the stock of ideas accumulates. If each
researcher produces one new idea, then clearly sustained growth in the stock of ideas
will require sustained growth in the effective number of researchers.
One can also solve this model for the (growing) level of per capita income along
a balanced growth path. The first part of this argument is exactly that in Solow
(1956). From the capital accumulation equation, equation (4), one can easily see that
the capital-output ratio along a balanced growth path is equal to sK/(n + gy + d).
Substituting this into the production function, one finds
y∗(t) =
(sK
n + gy + d
) α1−α
A∗(t)σ
1−α , (14)
where the time index t is explicitly included to indicate which variables are changing
over time, and the superscript ∗ indicates a value along a balanced growth path.
14

Notice that log-differentiating this relationship gives (part of) equation (10): output
per worker along the balanced growth path is proportional to the stock of ideas raised
to some power.
The value of A∗(t) can be found by rewriting equation (11). Notice that this
equation implies that
A∗(t) =
(δ
gA
) 11−φ
R(t)λ
1−φ . (15)
That is, the stock of ideas along a balanced growth path is proportional to the number
of researchers (raised to some power).
Combining these last two equations, we have the solution for the level of output
per capita along a balanced growth path:
y∗(t) =
(sK
n + gy + d
) α1−α
(δ
gA
) γλ
R(t)γ, (16)
where γ ≡ σ1−α
λ1−φ
. This gives us our third main result:
Result 3. The level of output per capita along a balanced growth path is
proportional to the world’s effective number of researchers, raised to the
power γ.
As above, the number of researchers determines the number of ideas, and the number
of ideas determines the level of per capita income.
4 Relating the Model to Data
In this section, we consider how the simple toy model outlined above can help us to
interpret various facts observed about the advanced countries of the world.
15

4.1 The World’s Effective Research Stock
Based on the results given so far, a critical determinant of economic growth is the
world’s effective research stock. Economies grow because of growth in the stock of
ideas, and this stock grows because of growth in R. The question, then, is why does
R grow over time?
There are at least three sources of growth in R. First, the number of (world)
researchers can grow simply because the population of the world is growing. Second,
the number of researchers can grow because of a rising research intensity — a rise
in the fraction of the population that searches for new ideas. Finally, the effective
number of researchers may grow if the quality of the researchers grows, for example
because of human capital accumulation.
As a historical matter, all three of these sources appear to be relevant. The first
two are quite easy to document. Figure 1 shows the rise in population and researchers
for the G-5 countries of France, (West) Germany, Japan, the United Kingdom, and the
United States. For present purposes, these aggregates will represent “world” research
effort. This is likely to be a conservative judgment since one suspects that an increasing
number of countries are now capable of conducting frontier research.
One sees in the figure two things. First, there is a basic rise in the population of
the G-5 countries, at an average rate of 0.8 percent per year during the period 1965
to 1991. This means that more people are available to conduct research, which should
serve as a source of research and idea growth. Second, there has been an even larger
rise in the number of researchers in the G-5 countries. The series plotted is the number
of scientists and engineers engaged in R&D, according to the U.S. National Science
16

Foundation.3 The number of researchers has grown at an average annual rate of 3.4
percent over the 1965 to 1991 period, increasing by nearly a factor of two and a half.
The implication of these two facts is a rise in research intensity in the G-5 countries,
defined as the fraction of the population that works as researchers. This implication
is illustrated in Figure 2. Research intensity rises from slightly less than two-tenths of
one percent of the population in 1965 to slightly less than four-tenths of one percent
in 1991, roughly doubling.
This observation is quite striking and is consistent with the popular notion that
the importance of “knowledge” and ideas is rising. It is interesting to speculate on
the causes of the rise in research intensity. Jones (1997) proposes that the increased
openness and development of the world economy is one likely source: the scale of the
market over which an innovator can spread the fixed cost of research is much larger
today than thirty years ago, and is likely to be even larger in the future. Transportation
and communication costs are lower, barriers to international trade have fallen, and
the fraction of the world’s population that has an income greater than the poverty
line has risen. These changes raise the return to research and could explain the rise
in research intensity.
Growth in the world’s stock of researchers, R, can then easily explain the growth
in the world’s stock of ideas, which underlies growth in per capita income.
3There are enormous difficulties in measurement in this respect. Who really counts as a researcher?And are researchers counted in the same way across countries? These issues are ignored here.
17

4.2 The Magnitude of Long-Run Level Effects
In the long-run, a country’s growth rate is determined by the rate of growth of the
world’s stock of ideas. Therefore, in this model, all countries share the same long-
run growth rate. This is not to say that differences in policies are not important,
however. Differences in policies translate into differences in the level of income across
countries. As one simple example of this, the United States and Malawi grew at nearly
identical rates over the period 1960 to 1990. The enormous differences in policies and
institutions between these two countries is reflected in the fact that per capita income
in Malawi is only about 3 percent of that in the United States.
These differences are reflected explicitly in equation (16), reproduced here:
y∗(t) =
(sK
n + gy + d
) α1−α
(δ
gA
) γλ
R(t)γ. (17)
While income levels are proportional to the world’s effective stock of researchers, the
factor of proportionality depends on country-specific variables. In this simple model,
the main country-specific variable is the investment rate in physical capital, but in
more general models, investment in human capital and barriers to technology transfer
will presumably matter as well.
Although the model predicts that all countries will share the same long-run growth
rate, this does not mean that countries cannot grow at different rates for long periods
of time, such as decades. In the model, such growth differences are understood as
transition dynamics. Consider a country that begins on a balanced growth path
with a low investment rate (or with low human capital investment and high barriers
to technology transfer). According to the equation above, the country will therefore
18

have a low income level. If this country undergoes a reform which raises its investment
rate, its long-run income level will rise. In the medium run, the country’s growth rate
will be faster than the rate implied by the world stock of ideas as the country transits
to its higher income level.
This is simply the result of simple transition dynamics like that in the standard
Solow (1956) model: countries grow more rapidly the further they are below their
steady state balanced growth path. As they approach the balanced growth path, the
growth rate declines to the long-run growth rate, determined as above by the growth
rate of world research effort.
One might naturally inquire as to the magnitude of the long-run level effects. For
example, if a country raises its investment rate, by how much does its level of income
along the balanced growth path rise in the long run? Or, more pertinent to the R&D
spirit of the model, if a country raises its own research intensity, what is the effect on
the long-run level of income?
The first of these questions is straightforward to answer, so we begin by considering
the investment rate. According to equation (17), the elasticity of per capita income
along a balanced growth path with respect to the investment rate is α/(1− α). With
perfect competition, α corresponds to the capital share of income (and even in many
models with imperfect competition it can be computed as one minus labor’s share
of income), so it is conventional to pick a value of α = 1/3. This means that the
elasticity is 1/2, so that it is the square root of the investment rate that affects the
level of income in equation (17): doubling the investment rate will, in the long-run,
result in the level of income being higher by a factor of√
2, or about 40 percent higher
19

than what it would otherwise have been.
To conduct the same exercise for a country’s own research effort is slightly more
complicated because it is world research effort rather than an individual country’s
effort that matters in the long run. For this exercise, we will be more specific and
focus on an increase in Japanese research intensity.
If research intensity is measured simply as the number of scientists and engineers
engaged in R&D (as above), then
R = LA + LA, (18)
where LA will denote the number of researchers in Japan and LA will denote the
number of researchers in the rest of the world. (This “overbar” notation will continue
to be used to denote the rest of the world.) With some algebraic manipulation, this
equation can be rewritten as
R = (sA` + sA¯)Lw, (19)
where sA denotes the fraction of a country’s population that works in research and
` denotes the fraction of the G-5 population that lives in a particular country. Lw
stands for the G-5 population as a whole. Therefore, this equation simply says that
G-5 research intensity R/Lw is a weighted average of Japan’s research intensity and
the rest of the G-5’s research intensity, where the weights reflect population shares.
In this simple model, a rise in Japanese research intensity will raise the number of
researchers in the world and therefore raise the number of new ideas that get produced.
To determine the magnitude of the effect, however, we need to know several things.
First, from equation (17), we need to know the elasticity γ in order to translate the
20
rise in research intensity into a rise in income. Second, we need to know the elements
in equation (19) so that we can determine by how much world research intensity is
raised.
Recall that γ is a function of four parameters in the model; in particular, it is
equal to σ1−α
λ1−φ
. It is very difficult to obtain values for each of these parameters
individually. However, also recall that γ multiplied by the growth rate of the research
stock is equal to the growth rate of per capita income in the long run. Based on recent
data on U.S. growth, and using a measure of the growth rate of research effort, Jones
(1997) calculates a rough value for γ that is about 1/3. This is the value we will use.
The elements of equation (19) are reported in Table 1, together with some addi-
tional statistics. Japan’s share of the G-5 population is about 22 percent, while its
share of the G-5 research effort is 25 percent. This difference reflects the fact that
research intensity sA in Japan is 0.34 percent, slightly higher than the average of 0.31
percent in the other G-5 countries. Another interesting statistic in this table is the
contribution of G-5 research effort to patents granted in the United States. Only
59 percent of patents in the United States granted to the G-5 countries originate in
the United States. The remainder, the bulk of which are Japanese, originate from
foreign research efforts. This emphasizes the importance of a global perspective in
understanding the contribution of idea-based growth.4
Now consider the following experiment. Suppose we raise Japanese research inten-
sity from 0.34 percent to 0.39 percent, i.e. by 5 percentage points or about 15 percent
of its level in 1987. Because Japan’s population is only 22 percent of the G-5 total,
4A more detailed analysis of this last statistic can be found in Eaton and Kortum (1994).
21

this raises G-5 research intensity by only about 1 percentage point, from 0.32 percent
to 0.33 percent.
This means that G-5 research intensity rises by about 3 percent. Now recall that
the elasticity of balanced growth path income with respect to research, the parameter
γ, is about 1/3. This means that the net effect on Japan (and the entire G-5) in the
long run is a rise in balanced growth path income by about 1 percent.
Is this a big number or a small number? For this purpose, it is helpful to measure
the shift in labor in units of GDP instead of bodies. We are moving .05 percent of
Japan’s labor force. To get a cost, we multiply by the total wage bill in Japan, which
is about 2/3 of Japan’s GDP (recall, we’re assuming α = 1/3). Therefore, the cost
of this experiment is about .05*2/3=.033 percent of Japan’s GDP each period. In
exchange, we get (eventually) a 1 percent higher G-5 GDP each period, or perhaps
even a 1 percent higher world GDP. With such calculations, it is not hard to see why
economists’ generally find large social returns to R&D!5
An important qualification of this calculation is that it hinges on the magnitude of
research effort being measured correctly. If research effort is mismeasured by a factor
of 10, so that, for example, 3.2 percent of the G-5 population works in research instead
of 0.32 percent, then the cost of this improvement will be mismeasured by a factor
of 10 as well. Of course, the calculated gain is so large as to appear to be robust to
even an order of magnitude mismeasurement, but one needs to recognize this degree
5One must be careful in evaluating this statement. While it is possible to calculate the socialreturn to R&D from the production possibilities of the model and observations on allocations, onemust also say something about the private rate of return in order to determine whether or not thereis too little research. This requires an analysis of the market economy. Still, most of the evidencesupports the claim that social rates of return to research are much greater than private rates ofreturn.
22

of uncertainty in the calculation.
Along these lines, one might wonder if it is plausible to think that less than one
percent of the population is essentially responsible for creating the ideas that underlie
all of economic growth. On the one hand, this seems extraordinarily low. Any time
someone creates a new business, one might think of this as a contribution to knowledge.
The creation of the Big Mac by MacDonald’s was a very valuable idea that probably
didn’t show up in the research statistics. On the other hand, one can also think of key
individuals whose creations were extremely valuable, such as Isaac Newton, Thomas
Edison, and Kyota Sugimoto, the inventor of the Japanese typewriter.
A very important question to ask is how much of this increase would be captured
by Japan’s researchers (which is relevant for whether or not they will undertake this
change by themselves) and by Japan’s economy as a whole. For this latter question,
a natural minimum estimate would be 1 percent of Japan’s own GDP, so even the
domestic social return to research seems very high.
A final question to ask in this environment is how long does it take to reach the
long-run? The answer is that it depends on the detailed parameterization of the simple
model. Growth rates can (obviously) either be very high for a short period of time or
not very high for a longer period of time. With a relatively low social discount rate,
the differences along this front are relatively unimportant.
5 Conclusion
Economic growth has resulted in the last 125 years in enormous increases in standards
of living. According to Maddison (1995), U.S. per capita income is higher today by
23

a factor of 10 than in 1870, and Japanese per capita income is higher by a factor of
26. If the prices indices that are used to compute these ratios overstate inflation by
one percent per year on average, then U.S. income would have risen by a factor of 35
and Japanese income by a factor of 90. Understanding these extraordinary changes is
clearly one of the most important problems in economics.
Research on economic growth over the last 50 years points to the importance
of knowledge and ideas as the source of these enormous improvements in incomes.
Economic growth occurs as we discover newer and better ways to use the resources
at our disposal. A central source of the growth in ideas that underlies the growth in
per capita income is the growth in the number of researchers throughout the world.
In the G-5 countries alone, there are nearly two and a half times more researchers in
1991 than in 1965. And this rise is surely augmented by the increase in researchers
made possible by the increased development of economies outside of the G-5.
The continued growth and development of the world economy suggests that the
market for new ideas continues to expand. In particular, the rapid growth of China
and India, with 40 percent of the world’s population, represents an enormous potential
source of research and demand for the products of innovation.
Simple calculations, as well as detailed studies, suggest that the social returns
to research, both domestically and worldwide, are enormous, and potentially much
larger than the private returns. This wedge suggests that private agents may not have
appropriate incentives to engage in the search for new ideas. One implication is that
the search for new institutions and arrangements to encourage the creation of new
ideas could be one of the most socially valuable activities around.
24

Table 1: Data on the G-5 Economies (Percentages)
— Shares of the G-5 — ResearchPopulation Researchers U.S. Patents Intensity
1990 1987 1990 sA, 1987
Japan 22 25 24 0.34Rest of G-5 78 75 76 0.31
U.S.A. 46 53 59 0.36W. Germany 12 10 9 0.27France 10 6 4 0.20U.K. 10 6 3 0.24
Notes: These data are taken from National Science Board(1993) and the Penn World Tables Mark 5.6.
25

Figure 1: Researchers and Population in the G-5 Countries
G−5 Researchers (1965=100)
G−5 Population (1965=100)
1965 1970 1975 1980 1985 1990 1995100
150
200
250
Source: Research data comes from the National Science Board (1993, 1996). The data arespliced together at the year 1979 and log-linearly interpolated for some countries. Populationdata is taken from the Penn World Tables Version 5.6 of Summers and Heston (1991).
26

Figure 2: Research Intensity in the G-5 Countries
1965 1970 1975 1980 1985 1990 19951.6
1.8
2
2.2
2.4
2.6
2.8
3
3.2
3.4
3.6x 10
−3
G−
5 R
esea
rch
Inte
nsity
: R
esea
rche
rs /
Pop
ulat
ion
Source: See notes to Figure 1.
27

6 References
Aghion, P., and Howitt, P. (1992) ‘A Model of Growth through Creative Destruction,’
Econometrica 60 (March):323–351
Arrow, K.J. (1962a) ‘The Economic Implications of Learning by Doing.’ Review
of Economic Studies 29 (June):153–173
Arrow, K.J. (1962b) ‘Economic Welfare and the Allocation of Resources for Inven-
tion.’ In R.R. Nelson, ed., The Rate and Direction of Inventive Activity (Princeton,
N.J.: Princeton University Press)
Eaton, J., and Kortum, S.S. (1994) ‘International Patenting and Technology Dif-
fusion.’ Boston University mimeo
Griliches, Z. (1992) ‘The Search for R&D Spillovers.’ Scandinavian Journal of
Economics 94:29–47
Grossman, G.M., and Helpman, E. (1991) Innovation and Growth in the Global
Economy (Cambridge, MA: MIT Press)
Jones, C.I. (1995) ‘R&D-Based Models of Economic Growth.’ Journal of Political
Economy 103 (August):759–784
Jones, C.I. (1997) ‘The Upcoming Slowdown in U.S. Economic Growth.’ NBER
Working Paper No. 6284
Jones, C.I. (1998) Introduction to Economic Growth (New York: W.W. Norton
and Co.)
Jones, C.I., and Williams, J.C. (1998) ‘Measuring the Social Return to R&D.’
Quarterly Journal of Economics forthcoming
Kremer, M. (1996) ‘A Mechanism for Encouraging Innovation.’ M.I.T. working
28

paper
Lucas, R.E. (1988) ‘On the Mechanics of Economic Development.’ Journal of
Monetary Economics 22:3–42
Maddison, A. (1995) Monitoring the World Economy 1820-1992 (Paris: Organiza-
tion for Economic Cooperation and Development)
Nadiri, M.I. (1993) ‘Innovations and Technological Spillovers.’ NBER Working
Paper No. 4423
National Science Board (1993) Science & Engineering Indicators – 1993 (Wash-
ington D.C.: U.S. Government Printing Office)
National Science Board (1996) Science & Engineering Indicators – 1996 (Wash-
ington D.C.: U.S. Government Printing Office)
Nordhaus, W.D. (1969) ‘An Economic Theory of Technological Change.’ American
Economic Association Papers and Proceedings 59 (May):18–28
Phelps, E.S. (1966) ‘Models of Technical Progress and the Golden Rule of Re-
search.’ Review of Economic Studies 33 (April):133–45
Quah, D.T. (1996) ‘The Invisible Hand and the Weightless Economy.’ LSE Eco-
nomics Department mimeo
Romer, P.M. (1986) ‘Increasing Returns and Long-Run Growth.’ Journal of Po-
litical Economy 94 (October):1002–1037
Romer, P.M. (1990) ‘Endogenous Technological Change.’ Journal of Political
Economy 98 (October):S71–S102
Shell, K. (1966) ‘Toward a Theory of Inventive Activity and Capital Accumulation.’
American Economic Association Papers and Proceedings 56:62–68
29
Solow, R.M. (1956) ‘A Contribution to the Theory of Economic Growth.’ Quarterly
Journal of Economics 70 (February):65–94
Summers, R., and Heston, A. (1991) ‘The Penn World Table (Mark 5): An Ex-
panded Set of International Comparisons: 1950–1988.’ Quarterly Journal of Eco-
nomics 106 (May):327–368
Swan, T.W. (1956) ‘Economic Growth and Capital Accumulation.’ The Economic
Record 32 (November):334–361
30