MASTER MONETARY AND FINANCIAL ECONOMICS ...
45
MASTER MONETARY AND FINANCIAL ECONOMICS MASTER´S FINAL WORK DISSERTATION ECONOMICALLY JUSTIFIED EQUITY INVESTMENT STRATEGIES CAPABLE OF WITHSTANDING GROWING INTEREST RATE ENVIRONMENT CHI NAM YAU OCTOBER- 2019
-
Upload
khangminh22 -
Category
Documents
-
view
0 -
download
0
Transcript of MASTER MONETARY AND FINANCIAL ECONOMICS ...

MASTER
MONETARY AND FINANCIAL ECONOMICS
MASTER´S FINAL WORK
DISSERTATION
ECONOMICALLY JUSTIFIED EQUITY INVESTMENT STRATEGIES
CAPABLE OF WITHSTANDING GROWING INTEREST RATE
ENVIRONMENT CHI NAM YAU
OCTOBER- 2019

MASTER
MONETARY AND FINANCIAL ECONOMICS
MASTER´S FINAL WORK
DISSERTATION
ECONOMICALLY JUSTIFIED EQUITY INVESTMENT STRATEGIES
CAPABLE OF WITHSTANDING GROWING INTEREST RATE
ENVIRONMENT CHI NAM YAU SUPERVISION:
MARIYA GUBAREVA
OCTOBER- 2019

i
ABSTRACT
This thesis proposes an approach for selection of stocks that could serve as a
natural hedge for fixed income portfolios to minimize rising interest rate risk. The
developed approach is applied to the case of US equity markets. Based on
macroeconomic analysis, vector autoregressive model and Granger causality tests, and
financial analysis, it is concluded that US financial sector is the optimal choice among
all sectors that have strong correlations with interest rates. The thesis’ results could be
useful for interest rate risk management of the investment portfolios under the growing
interest rate environment, in particular, and for investment industry professionals.
Keywords: Stock returns, interest and inflation rates, interest rate risk, vector
autoregressive model, Granger causality test
JEL: G01, G11, G12, C21

ii
Table of Contents
Abstract ............................................................................................................................ i
Table of Contents ............................................................................................................ ii
Table of Figures ............................................................................................................. iv
1 Introduction ................................................................................................................... 1
2 Literature review ........................................................................................................... 2
2.1 Random walk model and efficient market hypothesis ........................................... 2
2.2 Theoretical relationship between stock returns, interest rate and inflation rate .... 3
2.3 Non-linear interest rate sensitivity and lag effect of interest rate changes ............ 4
2.4 New evidence against the theoretical relationship between stock returns and
interest rate changes ........................................................................................................ 6
2.5 Differences of interest rate sensitivity in various countries and industries ............. 7
2.6 Interest rate exposure of US stock markets in different time periods .................... 8
2.7 Zero interest rate and the Lost Decade of Japanese stock market ......................... 9
2.8 Equity investment strategy .................................................................................. 11
3 Methodology ............................................................................................................... 13
3.1 Macroeconomic analysis ..................................................................................... 13
3.2 Vector autoregressive model and Granger causality test .................................... 13
3.3 Financial analysis ................................................................................................ 14
4 Data ............................................................................................................................. 15
5. Analysis of results and discussion ............................................................................. 16
5.1 Macroeconomic analysis ..................................................................................... 16

iii
5.1.1 US economic outlook ............................................................................... 16
5.1.2 PE ratio of US energy sector, crude oil price and inflation rate .............. 22
5.1.3 PE ratio of US financial sector and inflation rate .................................... 24
5.1.4 PE ratio of US stock market and inflation rate ....................................... 25
5.2 Result from VAR model and Granger causality test ........................................... 27
5.2.1 VAR model and Granger causality test for US energy sector ................ 27
5.2.2 VAR model and Granger causality test for US financial sector ............. 30
5.2.3 VAR model and Granger causality test US stock market ....................... 31
5.3 Financial analysis .................................................................................................. 33
6 Conclusion ................................................................................................................. 35
References ..................................................................................................................... 36

iv
Table of Figures
FIGURE 1 – Nikkei index from 1970 to 2019 ............................................................... 10
FIGURE 2 – Historical Fed fund rate ............................................................................ 17
FIGURE 3 – Historical US inflation rate ....................................................................... 17
FIGURE 4 – Historical S&P 500 index ......................................................................... 18
FIGURE 5 – Historical CAPE ratio and US long-term interest rate.............................. 19
FIGURE 6 – Historical US unemployment rate ............................................................ 20
FIGURE 7 – Historical US 10-year Treasury yield ....................................................... 21
FIGURE 8 – Historical US real GDP growth ................................................................ 21
FIGURE 9 – Historical US GDP growth ....................................................................... 21
FIGURE 10 – PE ratio of US Energy Sector Benchmark S&P 500 energy index, 2009-
2019 ................................................................................................................................ 22
FIGURE 11 – Historical Crude oil price, 2009-2019 .................................................... 22
FIGURE 12 – Average PE of S&P 500 energy index versus inflation rate,2009-2019 23
FIGURE 13 – Scatter plot of PE ratio of S&P 500 energy index and inflation ............. 23
FIGURE 14 – PE ratio of S&P 500 energy index versus inflation rate, 2009-2019 ...... 24
FIGURE 15 – Histogram chart of average PE ratio of S&P 500 financial index and
inflation .......................................................................................................................... 25
FIGURE 16 – PE ratio of S&P 500 financial index versus inflation rate, 2009-2019 .. 25
FIGURE 17 – PE ratio of S&P 500 index, 2009-2019 .................................................. 26
FIGURE 18 – Average PE of S&P 500 index versus inflation rate, 2009-2019 ........... 26
FIGURE 19 – PE ratio of S&P 500 index versus inflation rate, 2009-2019 ................. 27

Chi Nam, Yau Economically Justified Equity Investment Strategies
Capable Of Withstanding Growing Interest Rate Environment
1
1 INTRODUCTION
Equity investment is generally referred to the buying and holding of stocks by
investors in anticipation of receiving dividends and capital gains. It is commonly
believed that stocks are not a good investment tool to hedge against rising interest rate
risk. Campell (1987) suggests that excess return on 20-year Treasury bond and stock
returns move together, and expected standard deviation of stock returns is much larger
than that of bonds based on linear regression model.
However, recent studies have shown the possibility of short-term gains from
stock investment when interest rates rise. Interest rate is the amount a lender charges a
borrower for the borrower’s use of lender’s assets expressed as a percentage of the
principal. Interest rates affect financial cost, income and profitability of businesses
because cost of borrowing is determined by interest rates. However, businesses may gain
higher profits if the growth of interest income is higher than the growth of interest
expense under rising interest rates environment.
Increasing interest rates is a measure of monetary policy by central banks to lower
inflation rate. Inflation rate has a considerable impact on the purchasing power of
consumers, investors and savers. It also influences business profitability and
competitiveness in the international market. Friedman (1970) famously stated that
inflation is always a monetary phenomenon and it can be produced only by a more rapid
increase in the quantity of money than in output. However, inflation may erode
investment returns and thus the consideration of real interest rate and expected inflation
rate is important for the formulation of investment strategies.
This thesis follows the approach developed in Ferrer et al. (2016a, 2016b and
2017) in order to construct an optimal equity investment strategy under rising but low
interest rates environment. The strategy is supported by macroeconomic analysis, vector
autoregressive (VAR) model and financial analysis. The developed approach is applied

Chi Nam, Yau Economically Justified Equity Investment Strategies
Capable Of Withstanding Growing Interest Rate Environment
2
to the US economy. Our results show that financial sector stocks represent a natural
hedge for investment portfolio against adverse moves in interest rates.
The rest of the thesis is structured as follows. Section 2 presents the literature
review. Section 3 explains the methodology. Section 4 describes the employed data set.
Section 5 provides the analysis and discussion. Section 6 concludes the thesis.
2 LITERATURE REVIEW
The studies of stock returns could be categorized into eight domains based on the
different aspects of the areas of studies. Studies of stock price movements in the 60s
focused on efficient market hypothesis and random walk model (Fama 1965 and
Samuelson 1965). Their research on the relationship between macroeconomic variables
and stock returns became a theoretical framework for the later studies and inspired
countless research on the relationship between interest rates, inflation and stock returns
(Fama 1981; Flannery and James 1984; Benderly and Zwick 1985). New statistical
models shed light on the non-linear relationship between interest rates and stock returns
(Martin and Keon 1977; Bartram 2002; Elyasiani and Mansur 1998; Siklos and Kwok
1998; Alaganar and Bhar 2003). Moreover, studies after Global Financial Crisis (GFC)
challenge the theoretical framework with empirical evidence (Nissim and Penman 2010;
Borio et al. 2015; Tripathi and Kumar 2014). Recent studies illustrate the differences of
interest rate sensitivity in various industries, countries and time periods (Ferrer et al.
2016a; Ferrer et al. 2016b; Ferrer et al. 2017; Boothe et al. 2018; Camilleri et al. 2019;
Willis and Cao 2019; Hotchkis & Wiley 2017; Koo 2008). Financial ratios such as
Cyclically Adjusted Price to Earnings (CAPE), Price to Earnings (PE), Price to Book
(PB) and Debt to Equity (D/E) ratios are essential for fundamental analysis and stock
selection (Bunn and Shiller 2014; Jivraj and Shiller 2017; Graham 1973). Below we
present the description of the above-mentioned eight domains of equity research studies.
2.1 Random walk model and efficient market hypothesis
For more than five decades, there has been numerous research on the relationship
between interest rate changes and stock returns. Fama (1965) advocates efficient market

Chi Nam, Yau Economically Justified Equity Investment Strategies
Capable Of Withstanding Growing Interest Rate Environment
3
theory and that stock prices follow a random walk model based on empirical evidence
between 1897 and 1957. The theory states that stock price fluctuation is explained by the
price convergence to fundamental value. Samuelson (1965) argues that the randomness
and unpredictability of stock price variations can simply be explained by competitions
between investors. Samuelson (1965) believes that the best estimation of tomorrow’s
stock price is today’s price (see also Delcey 2019). Both Fama’s and Samuelson’s
efficient market hypothesis and random walk theory may not be valid because Miller
(1979) argues that there is information asymmetry in the US stock market. Furthermore,
Alam (2009) shows that stock markets in a total of 15 developed and developing
countries do not follow random walk model from January 1998 to March 2003. The
results of his research are summarized in Table I below.
TABLE I: Relationship between interest rates and share prices in different countries,
1998-2003
Relationship between
interest rate and share
price
Relationship between changes
of interest rate and changes of
share price
Japan Positive Negative
Bangladesh, Colombia,
Italy and South Africa
Negative Negative
Australia, Canada,
Chile, Germany,
Jamaica, Mexica, Spain
and Venezuela
Negative No relationship
Philippine No relationship No relationship
Malaysia No relationship Negative
Source: Alam (2009)
Table I illustrates that none of the countries in the study, except Japan, has a
positive relationship between changes of interest rates and change of share price. For this
reason, it would be interesting to examine this unique phenomenon in Japanese stock
market.
2.2 Theoretical relationship between stock returns, interest rate and inflation rate
Fama (1965) suggests that stock returns should be related to economic
fundamentals. It was commonly believed that stock returns in US and other countries
could be affected by macroeconomic factors such as interest rates, exchange rates,

Chi Nam, Yau Economically Justified Equity Investment Strategies
Capable Of Withstanding Growing Interest Rate Environment
4
inflation rates and unemployment rates. This belief inspired a lot of research on the
relationship between various macroeconomic variables and equity returns. Fama (1981)
illustrates that there is a negative correlation between short-term interest rate (3 month
US Treasury bills yield) and stock return. The sample period of his research is from
1953-1971. Flannery and James (1984) expands Fama’s research and examine the
relationship between interest rate sensitivity of common stock (67 US commercial bank
stocks). They also analyze the maturity composition of the firm’s holdings of nominal
contract with a linear regression model and a data set from 1976 to 1981. Their research
supports Fama’s theory and suggests that interest rate sensitivity is significantly related
to the maturity mismatch of the bank asset and liabilities. This implies that exogenous
factors such as interest rate may have a significant impact on the stock returns.
Moreover, Fama (1981) suggests that high maturity composition of net nominal
assets reflects high interest rate sensitivity of a firm’s common stock in US. He believes
that stock market returns should be negatively correlated with expected inflation, which
is often reflected by the short-term interest rate. His regression analysis shows the
negative effect of unexpected monthly, quarterly and annual inflation on expected real
stock returns. He discovered that current and past real activity is important for inflation
regressions but not for stock return regressions. Also, he suggests that in an efficient and
forward looking market, stock returns are positively related to expected earnings and
output growth. Based on Fama’s research, Benderly and Zwick (1985) investigate the
real balance effect on US stock returns from 1954 to 1981. The real balance effect refers
to the direct effect of real money balances on private expenditure, demand for goods and
asset price. Their analysis supports Fama’s theory of negative relationship between stock
returns and output. However, Berderly and Zwick (1985) argue that the direction of effect
is from inflation to output, not vice versa. Also, the real balance effect has a delayed
impact on the economy.
2.3 Non-linear interest rate sensitivity and lag effect of interest rate changes
Martin and Keon (1977) suggest that there are major differences in interest rate
sensitivity among different stocks. Moreover, Bartram (2002) points out that many

Chi Nam, Yau Economically Justified Equity Investment Strategies
Capable Of Withstanding Growing Interest Rate Environment
5
previous studies which focus on industry portfolio and indices are problematic because
firms have different exposures within the same industry. Bartram (2002) covers the
period of 1987-1995. Its samples include 490 non-financial corporations and 67 financial
intermediaries in Germany. He concludes that there are more firms that have non-linear
interest rate exposure than firms that have linear interest rate exposure. He also illustrates
that there is a negative relationship between interest rate exposure and levels of corporate
liquidity. However, financial leverage does not have a significant relationship with
interest rate exposure for non-financial firms.
Thus, it is justifiable that more and more researchers use sophisticated non-linear
statistical models to examine the causal link, lag effect and the impact of interest rate
changes on stock returns. Elyasiani and Mansur (1998) investigate the effect of interest
rate and interest rate volatility on bank stock’s monthly return (including dividend) with
a Generalized Autoregressive Conditional Heteroskedasticity in Mean (GARCH-M) and
an Autoregressive Conditional Heteroskedasticity (ARCH) model. Their models do not
have the restrictive assumption of linearity, independence, and constant conditional
variance. The sample of their research consists of 56 commercial bank stocks that have
been traded on the New York and American stock exchanges from January 1970 to
December 1992. Their result demonstrates that long-term interest rates (10-year Treasury
composite yield) has a significant negative impact on bank stock return. Also, interest
rate volatility determines bank stock return volatility and stock risk premium except
regional bank portfolio. Siklos and Kwok (1998) test Fama’s (1981) hypotheses with
vector auto-regressions (VAR) and Granger causality test with quarterly US data from
1960 to 1992. Their analysis is consistent with Fama (1981) but shows evidence against
Benderly and Zwick’s (1985) delayed real balance sheet effect.
Alaganar and Bhar (2003) adopt causality-in-variance test and GARCH (1, 1)
model to show the direction and lags in information flow between financial sector returns
and interest rates in G7 countries from 1990 to 2000. Their result shows that a short lag
of 1 week in causality at the mean level from interest rate to sector returns in the US
markets, and long-term yield has significant explanatory power except in Canada’s
banking and insurance industries, France’s and USA’s financial sectors. For the financial
sectors in Canada, France, Germany and the USA, banking and insurance industries show

Chi Nam, Yau Economically Justified Equity Investment Strategies
Capable Of Withstanding Growing Interest Rate Environment
6
two-way causality at the mean level. The sector returns from the industries in the US
show both mean and volatility causation from sector returns and to interest rates and has
at least 12 weeks lead. They emphasize that in order to model unexpected interest rate,
lagged equity return should be used as additional explanatory variables.
2.4 New evidence against the theoretical relationship between stock returns and
interest rate changes
After the GFC, more studies have shown evidence against negative correlation
between interest rate changes and stock returns. This signals a challenge to Fama’s theory
and previous studies. Nissim and Penman (2010) illustrate that there is a positive
relationship between unexpected change in interest rate and unexpected earnings in the
1st and 2nd year of interest rate change. They explain that operating income rises more
than operating expense in short term when interest rate rises. Only when 2 years have
passed after the unexpected interest rate change, will the correlation between unexpected
interest rate changes and earnings turn negative for 5 years. Their result is based on the
data in US stock market from 1964 to 2001 and time-series regression test of cross-
sectional mean of unexpected earnings (except financial firms) and unexpected change
in interest rate. Borio et al. (2015) illustrate that monetary policy had a positive effect
on return on asset ratio (ROA) in 2009 and 2010 but ROA turned negative from 2011 to
2014. Their research supports Nissim and Penman (2010)’s findings. Borio et al. (2015)
analyze the effect of monetary policy on 109 international banks in 14 countries over the
period of 1995 to 2012 with a non-linear approach. They explain that there is a positive
relationship between interest rate structure (3-month rate and 10-year government bond
yield) and bank profitability because short term interest rate leads to an increase in
interest income and ROA in short term, but also leads to an increase in unfavorable
increase in loan loss provisions, debt service costs and default probabilities in the long
run.
Tripathi and Kumar (2014) test Fama’s theory in BRICS (Brazil, Russia, India,
China and South Africa) over the time period of January 2000 to September 2013.
Quarterly data is analyzed with Johansen integration test to test the co-integrating
relationship between stock index and inflation rate in BRICS. They find positive
Chi Nam, Yau Economically Justified Equity Investment Strategies
Capable Of Withstanding Growing Interest Rate Environment
7
relationship between inflation rate and stock returns in China and India but negative
relationship in Russia and Brazil. This implies that Fama’s theory may not hold up in
some countries. Their result also shows that changes in inflation rates lead to stock
market movement in the short run, and that equity is not a good hedge against inflation
in the long run in BRICS.
2.5 Differences of interest rate sensitivity in various countries and industries
Recent research focus on examining the interest rate exposure of different
industries and countries. Ferrer et al. (2016a, 2016b, 2017) cover this area using
advanced statistical analysis such as quantile analysis (Ferrer et al. 2016a), wavelets
model (Ferrer et al. 2016b), and Granger causality test (Ferrer et al. 2017).
Ferrer et al. (2016a) illustrate that some industries’ interest rate sensitivity had
changed after the 2008 US financial crisis. They show that energy, health care and
information technology stocks become positively sensitive to interest rate changes (10-
year treasury yield). Energy sector return has a significant positive relationship with real
interest rate changes while utilities sector return has a significant negative correlation in
both pre-crisis (2003-2007 August) and post-crisis period (September 2007-2013). Also,
health care and information technology have positive significant interest rate sensitivity
in the post crisis period. Their findings are supported by empirical evidence by Boothe
et al. (2018).
Ferrer et al. (2016b) examine the relationship between interest rate (10-year
government bond yield) changes and stock returns (mainly bank stocks) across European
countries from January 1993 to December 2012. They demonstrated that the UK is the
country with the strongest interdependence between long-term bond yields and equity
returns (significant positive linkage of 1 or 2 years since 2000s), followed by Germany,
France, the Netherlands and Spain. In contrast, this linkage is much weaker for Portugal,
Ireland and Greece. They believe the reason why there is a weak linkage in those

Chi Nam, Yau Economically Justified Equity Investment Strategies
Capable Of Withstanding Growing Interest Rate Environment
8
countries is that the trading volume, capitalization and liquidity are low in the stock
exchanges of those countries.
Camilleri et al. (2019) show that the link between stock returns and inflation rate
is significant in 5 European countries (Belgium, France, Portugal, Netherlands and
Germany) over the sample period from 1999 to 2017 with VAR model and Granger
causality test. They suggest that stock returns have a lagged positive impact on inflation
rate. Their analysis also reveals that inflation rate has a lagged negative impact on stock
prices in France and Portugal. It means that policy makers may increase interest rates due
to higher inflation rate, which leads to a decrease in stock prices. Moreover, they show
that in the case of Germany and Portugal, there are significant contemporaneous
relationship between long-term interest rate and stock prices. The relationships are
negative in Belgium and Portugal while other countries have positive relationships
between the variables. Also, they argue that lagged long-term interest rates do not have
a significant explanatory power on stock prices in most of the sample countries.
Ferrer et al. (2017) illustrate that there is a bidirectional Granger causal links
between stock returns (daily closing price of S&P500) and 10-year treasury yield. The
bidirectional causal links imply that long-term interest rate and stock return is interrelated.
Moreover, the research observed that the links became stronger before the beginning of
the GFC as stock investors shifted their equity investment to US treasury bonds. This
flight to quality phenomenon led to a decrease in stock price and 10-year treasury yield.
The positive relationship between stock return and long-term interest rate became more
significant before the crisis. The sample period of this research ranges from January 1993
and December 2014.
2.6 Interest rate exposure of US stocks in different time periods
Willis and Cao (2015) show that US stocks become less interest rate sensitive in
post 1984 period due to structural changes in financial markets and industries. Their
research brings two important discoveries: 1) the transmission of short term interest rate
(federal fund rate) to long-term interest rates (10-year treasury yield) has changed. Long-
Chi Nam, Yau Economically Justified Equity Investment Strategies
Capable Of Withstanding Growing Interest Rate Environment
9
term interest rates do not move in the same direction as short-term rates. 2) The impact
of long-term interest rates on the economy has a longer lag in post 1984 period. The
framework used for their analysis is a VAR model with a sample period of January 1960
to December 2007. Data from the post-2007 period are excluded because the federal
funds rate has been constrained at the zero lower bound (ZLB) during this period.
Regression analysis by capital management company Hotchkis & Wiley (2017)
support Willis and Cao (2015)’s study. The regression analysis shows that the negative
correlation between S&P 500 P/E ratio and 10-year Treasury bill yield is weak between
1963 and 2016. However, the negative relationship is much stronger during rising rates
period (1963-1981) and falling rates period (1982-2000). The relationship is positive but
weak in low rate period (2001-2017). Hotchkis & Wiley (2017) suggest changes of
interest rates have an insignificant impact on share price if interest rates have fallen below
a certain threshold. More importantly, the analysis shows that value stocks outperform
growth stocks when interest rate rise, and that small value stocks outperform small
growth stocks regardless of the changes of interest rates.
Value stocks are appealing because their stock prices are below their fundamental
values. Fundamental values of the stocks can be estimated by the firms’ financials such
as earnings, dividends and sales revenue. Other the other hand, growth stocks are defined
as stocks that have higher growth potential than the industry average. Generally, growth
companies have significantly high positive cash flow but pay small or no dividends in
order to retain funds for reinvestment and company expansion.
2.7 Zero and negative interest rate in Japan
Japan’s economy suffered long-term recession between 1990 and 2012, see
the respective Nikkei index behavior in Figure 1.

Chi Nam, Yau Economically Justified Equity Investment Strategies
Capable Of Withstanding Growing Interest Rate Environment
10
FIGURE 1: Nikkei index from 1970 to 2019
(Source: Bloomberg Terminal)
The Bank of Japan implemented stimulative monetary policy to fight recession.
The short term interest rate in Japan fell dramatically from 6% in AUG1990 to nearly
zero in FEB1999 (Reuters 2018) and below zero in 2016 and 2019. However, the
Japanese stocks returns had a falling trend from 1990 to 2012 under the low and negative
interest rates. This phenomenon contradicts Fama (1981)’s theoretical relationship
between interest rates and stock returns.
Koo (2008) explains that zero interest rate could not vitalize the economy and the
stock market because Japan was suffering from the balance sheet recession. There were
not enough borrowers although interest rates were nearly zero. Companies paid down
debt at the rate of several tens of trillion yen a year and households were not willing to
spend their deposits and savings. This led to a deflationary spiral which dragged down
stock market returns. Monetary policy was useless in this scenario and fiscal stimulus
was needed to make an economic recovery. This means that in the balance sheet
recession, the relationship between interest rate and stock returns is not negative. Stock
returns did not rise although interest rates had fallen to zero while higher interest rate
would further depress the stock market. Therefore, the relationship between short term
0
5000
10000
15000
20000
25000
30000
35000
40000
45000
19
70
19
72
19
74
19
76
19
78
19
80
19
82
19
84
19
86
19
88
19
90
19
92
19
94
19
96
19
98
20
00
20
02
20
04
20
06
20
08
20
10
20
12
20
14
20
16
20
18
Nikkei Index, 1970-2019
Chi Nam, Yau Economically Justified Equity Investment Strategies
Capable Of Withstanding Growing Interest Rate Environment
11
interest rates and stock prices is different from the theoretical relationship under zero
interest rates environment.
2.8 Equity investment strategy
To select stocks that hedge against rising interest risk, financial indicators such
as CAPE, PE and PB ratios should be considered because it is important to know the
potential return and risk of the stocks indicated by the ratios. Bunn and Shiller (2014)
investigate the forecasting power of CAPE ratio in industrial, utilities and the railroad
sectors in the US from 1872 to 2013. CAPE ratio is a useful tool for market valuation
because it is inflation adjusted and is calculated by dividing real S&P500 price index
(numerator) by the moving 10-years average of real reported earnings (denominator).
The authors suggest that stock price will fall in the long-term if the CAPE ratio is high.
In other words, CAPE ratio reflects whether a stock is undervalued or overvalued. Also,
the ratio may predict the future inflation adjusted financial performance of the stock.
Bunn and Shiller (2014) propose an equity investment strategy that overweights sectors
with low relative CAPE ratio and underweighs sectors with high relative CAPE ratio.
They also warn investors to be wary of value trap and momentum effect. Their
investment strategy generate 1.09% excess real annual return than market benchmark
over the period.
Jivraj and Shiller (2017) break the CAPE investment strategy into 4 steps. The
first step is to obtain sector data such as sector index and earnings to calculate CAPE and
relative CAPE ratios for 10 sectors. The second step is to select 5 most undervalued
sectors based on the relative CAPE ratio. The third step is to remove sector with the
lowest momentum in the past 12 months as a momentum filter to avoid value trap. The
final step is to equally weight the remaining 4 sectors and rebalance the portfolio
monthly.
Graham (1973) was considered to be the best book of equity investment by
Warren Buffet. Graham (1973) advocate that value stocks with low debt, PE and PB
ratios are more attractive because the low ratios indicate healthy financial status of the
company. The higher the PE and PB ratios, the more expensive are the stocks. Suppose

Chi Nam, Yau Economically Justified Equity Investment Strategies
Capable Of Withstanding Growing Interest Rate Environment
12
stock A’s PE and PB ratios are 10 and stock B, which is identical to stock A, has higher
PE and PB ratios of 12; stock A is more attractive to stock B because it is relatively
cheaper.
In summary, numerous studies have shown that stock returns are influenced by
macroeconomic factors. The macroeconomic factors that affect most sectors and stocks
are GDP growth, interest rates and inflation rate. Fama (1965) suggests that stock return
should be related to macroeconomic factors. Fama (1981) believes that stock returns are
negatively correlated to expected inflation and short-term interest rate. Flannery and
James (1984) advocates that interest rate sensitivity of US commercial banks are
dependent on their debt structures and maturities. Alaganar and Bhar (2003) shows that
long-term interest rate has a significant impact on US financial sector. Nissim and
Penman (2010) demonstrate that interest rate shock has a short-term positive impact on
international banks’ profits. However, Koo (2008) argues that Japanese stock market was
not sensitive to interest rate changes because firms have high level of financial leverage.
Therefore, it is essential to analyze the impact of macroeconomic factors on the stock
market.
Studies after the GFC show that equity returns may have positive correlations
with interest rates. (Nissim and Penman 2010; Borio et al. 2015 and Ferrer et al. 2016a).
Moreover, stock returns may increase under rising interest rate environment because
interest rate changes may have a positive impact on stock returns for a short period of 2
years. Also, value stocks outperform growth stocks and should be a good hedging tool
against rising interest rate for fixed income portfolio (Graham 1973; Willis and Cao 2015;
Hotchkis & Wiley 2017). For international stock markets, there are contradictory results
in Asian, European and other stock markets (Alam 2009; Batram 2002; Alaganar and
Bhar 2003; Ferrer et al. 2016b). In particular, this thesis will focus on analyzing US
sectors in order to formulate an equity investment strategy that benefits from rising
interest rate environment.

Chi Nam, Yau Economically Justified Equity Investment Strategies
Capable Of Withstanding Growing Interest Rate Environment
13
3. METHODOLOGY
There is no such economic theory that could fully explain why the correlation
between interest rate changes and stock returns is different in various countries and
sectors. The theoretical negative correlation between interest rates changes and stock
returns is often attributed to changes in the discount rate, a denominator effect in equity
valuation models such as dividend discount models. The major disadvantages of the
prominent discount models are: 1) the unrealistic assumption of constant dividend
growth 2) no consideration of other important factors that determine a firm’s
competitiveness. Therefore, this thesis adopts several distinct approaches to examine the
relationship between interest rates and stock prices. Namely, this thesis seeks investment
opportunities under rising interest rates environment by the use of macroeconomic
analysis, VAR model and Granger causality test, and financial analysis.
3.1 Macroeconomic analysis
The first component of our approach is the macroeconomic analysis, which is
based on the economic outlook of US economy and the study on PE ratio versus inflation
rate. The economic outlook involves analyses of short-term interest rate (FED fund rate),
mid-term interest rate (US 5-year generic Treasury yield), long-term interest rate (US 10-
year Treasury yield), inflation rate, equity market (S&P 500 indices), CAPE ratio versus
long-term interest rate (US 10-year Treasury constant maturity rate), GDP growth and
unemployment rate. The economic outlook is important for creating an equity investment
strategy that hedges against rising interest rate risk because studies have shown that
macroeconomic factors such as interest rates and inflation rate have significant impacts
on stock returns.
3.2 Vector autoregressive model and Granger causality test
The second element of the proposed approaches to construct an investment
portfolio resilient to growing interest rate environment is VAR model and Granger
causality test. Factors such as interest rates, inflation, crude oil price and S&P 500 indices
are analyzed.

Chi Nam, Yau Economically Justified Equity Investment Strategies
Capable Of Withstanding Growing Interest Rate Environment
14
The VAR model is employed to test the lead-lag effect of macroeconomic
variables such as crude oil price, US 10-year Treasury yield, 5-year Treasury yield, short-
term interest rate and inflation rate on stock prices. VAR model is a multivariate linear
time series model. According to Brooks (2008), the advantages of VAR model are 1) all
variables are endogenous 2) VAR model is more flexible than univariate model as VAR
model allows dependent variable to be explained by more variables than just its own lag
variables 3) strong predictability of out-of-sample data. However, VAR model is only
accurate for analyzing stationary data. Stationary data is defined as the data that has
constant statistical properties such as mean, variance and autocorrelation over time. The
typical specification of VAR model could be presented as follows:
𝑦1𝑡 = 𝛽10 + 𝛽11 𝑦1𝑡−1 + ⋯ + 𝛽1𝑘 𝑦1𝑡−𝑘 + 𝛼11 𝑦2𝑡−1 + ⋯ + 𝛼1𝑘 𝑦2𝑡−𝑘 + 𝑢1𝑡
𝑦2𝑡 = 𝛽20 + 𝛽21 𝑦2𝑡−1 + ⋯ + 𝛽2𝑘 𝑦2𝑡−𝑘 + 𝛼21 𝑦1𝑡−1 + ⋯ + 𝛼2𝑘 𝑦1𝑡−𝑘 + 𝑢2𝑡
𝑦1𝑡 𝑎𝑛𝑑 𝑦2𝑡 𝑎𝑟𝑒 𝑡ℎ𝑒 𝑣𝑎𝑟𝑖𝑎𝑏𝑙𝑒 𝑜𝑏𝑠𝑒𝑟𝑣𝑎𝑡𝑖𝑜𝑛𝑠
𝑢1𝑡 𝑎𝑛𝑑 𝑢2𝑡 𝑎𝑟𝑒 𝑡ℎ𝑒 𝑟𝑒𝑠𝑖𝑑𝑢𝑎𝑙 𝑡𝑒𝑟𝑚𝑠
We also apply Granger causality test on VAR model to test the causal link
between the variables. Brooks (2008) states that if y1 causes y2, lags of y1 should be
significant in the equation for y2. If this is the case and not vice versa, there is a
unidirectional causality from y1 to y2. Granger causality means that the lag of y1 is
capable of predicting y2. This is important to note that granger causality does not mean
that y1 causes y2. The null hypothesis of Granger causality test is that the explanatory
variables do not ‘granger cause’ the dependent variable. The null hypothesis will be
rejected if the t-statistics exceed the critical t value at a given confidence level.
3.3 Financial analysis
The third dimension of the proposed methodology is related to the financial
analysis. We examine the financial indicators such as total return, PE and PB ratios of
the sector benchmarks. PE ratio is calculated by dividing current stock price by previous

Chi Nam, Yau Economically Justified Equity Investment Strategies
Capable Of Withstanding Growing Interest Rate Environment
15
year’s earnings while PB ratio is calculated by dividing stock price by the book value per
share. Generally, low PE and PB ratios signify that the stock is undervalued. We also
analyzes the percentage change in total liabilities in order to discover the impact of
interest rates on firms’ debt structure.
4. DATA
According to Ferrer et al. (2016a) and Boothe et al. (2018), US energy and
financial sectors have the most significant positive relationships with interest rates.
Therefore, this thesis will focus on analyzing US energy and financial sectors.
We analyze the stock performance in US energy and financial sectors over 2009
and 2019. Our samples consist of 3 US stock index benchmarks. Data series of stock
prices, crude oil prices, US unemployment, inflation, interest rates are obtained from
Bloomberg. , Gross domestic product (GDP) and real GDP US Federal Reserve are
publicly available data from Economic Data Bank (FRED) database. Fed fund rate, 5-
year US generic bond yield and 10-year US treasury yield represent short term interest
rates, mid-term yield and long-term interest rates respectively.
We use the S&P500 energy sector GICS (Global Industry Classification
Standard) level 1 index (Bloomberg ticker: S5ENRS) as the proxy for US energy sector
performance. The S&P500 financials sector GICS level 1 index (Bloomberg ticker:
SPFINL) represents the financial sector returns. The S&P500 index is employed as the
proxy of US stock market. All the proxies are employed to measure sector performance
and the correlation between interest rates, inflation and stock prices. The list of leading
companies in different sectors is based on Fortune 500.
In order to examine the impact of inflation rate changes on US stock performance,
we employ the percentage change of consumer price index (CPI). The CPI is a measure
of the weighted average price changes of a basket of consumer goods and services.
Historical inflation rates are available from Bloomberg Terminal. Stock prices and
inflation rate are inter-correlated as rise in stock price may cause higher inflation while

Chi Nam, Yau Economically Justified Equity Investment Strategies
Capable Of Withstanding Growing Interest Rate Environment
16
high inflation may undermine future stock returns and leads to an increase in interest
rates (Fama 1981; Camilleri et al. 2019). We also examine the historical relationships
between inflation and the PE ratios of US stock market, US energy and financial sectors
between October 2009 and August 2019. S&P 500 is employed as the proxy for the US
stock market. We adopt S&P 500 energy and financial indices as the proxies of US
energy sector and financial sector respectively.
GDP is the market value of finished goods and services within a country. Higher
GDP growth often signifies better economic condition of a country. The US GDP growth
is calculated by the percentage change of real GDP per quarter. Real GDP is adjusted by
inflation to account for the impact of inflation on the economic output. The US GDP and
real GDP are obtained from FRED database while the growths are calculated by the
author.
CAPE ratios are obtained from Shiller (2019)’s database. The database contains
useful information such as historical real dividend yield, real S&P500 index and real
earnings. CAPE ratio provides an overview of stock market performance and predicts
long-term stock returns.
5. ANALYSIS OF RESULTS AND DISCUSSION
This section presents the results of the methodology applied to US equity market and
respective discussions.
5.1 Macroeconomic analysis
5.1.1 US economic outlook
In the US, federal funds rate serves as anchor for the overnight interest rates of
borrowing and lending activities between banks. Hence, federal funds rate is an important
benchmark for financial market. It affects the supply of available funds as well as
influences inflation rate and long-term interest rate. In accordance with Figure 2, the
federal funds rate fell from its peak of around 19% in 1980s to close to zero percent in
2009. The federal funds rate was maintained at around zero percent until 2016.

Chi Nam, Yau Economically Justified Equity Investment Strategies
Capable Of Withstanding Growing Interest Rate Environment
17
Afterwards, the fund rate rose to 2.5% in January 2019 but then decreased to 1.75% in
October 2019.
Source: Bloomberg Terminal
Figure 3 below depicts the US inflation rate over the period of 1960 to 2018. The
US Fed implemented monetary policy by adjusting interest rate to inflation in order to
fight stagflation (high unemployment and inflation rates). As a result, inflation fell to the
target rate of around 2% in 2004 while short term interest rate also fell to a very low level
of approximately 1%. However, under the low interest rate environment, real estate
bubble started to form. Although Fed increased the short-term interest rate to 5.25% in
2006, the bubble busted and triggered US financial crisis and Global Financial Crisis
(GFC) 2007-2008.
Figure 3 Historical US inflation rate
Source: Bloomberg Terminal
Figure 2 Historical FED fund rate
0
5
10
15
20
25
19
71
19
73
19
75
19
77
19
79
19
81
19
83
19
85
19
87
19
89
19
91
19
93
19
95
19
97
19
99
20
01
20
03
20
05
20
07
20
09
20
11
20
13
20
15
20
17
20
19
FED FUND RATE
-5
0
5
10
15
20
19
64
19
66
19
68
19
70
19
72
19
74
19
76
19
78
19
80
19
82
19
84
19
86
19
88
19
90
19
92
19
94
19
96
19
98
20
00
20
02
20
04
20
06
20
08
20
10
20
12
20
14
20
16
20
18
US INFLATION RATE

Chi Nam, Yau Economically Justified Equity Investment Strategies
Capable Of Withstanding Growing Interest Rate Environment
18
US economy and stock market suffered due to GFC caused by the sub-prime
mortgage crisis. S&P 500 index decreased by more than 50% from 1500 to around 700
points between 2007 and 2009 (see Figure 4 below). However, the low interest rate
environment between 2008 and 2015 restored investors’ confidence in US equity
investments. As a result, S&P index exhibits all times high at about 3000 points in 2019,
doubling the before GFC index level. Therefore, in general, it would be of interest to
investigate how equity valuations depend on interest rate and, in particular, which stocks
may benefit most from rising interest rate environment.
Figure 4 Historical S&P 500 index
Source: Bloomberg Terminal
Despite the relationship between interest rate and stock return is controversial,
there is a consensus that higher stock returns may lead to higher inflation rate and that
inflation rate has a lagged negative impact on stock prices (Fama 1981; Camilleri et al.
2019). Generally, central banks increase interest rate if they predict inflation rate will
exceed their target in the future. However, increase in interest rate does not effectively
prevent US economy and stock market from overheat.
Colombo (2018) warns that financial crises often occur after interest hikes. He
also suggests that interest rate hike may cause financial crisis. However, his analysis is
not accurate due to several biases. For example, Colombo (2018) is subject to hindsight
bias because it is impossible to know when the interest rate reaches the peak and when
the financial crisis will occur. Interest rate falls when financial crisis occurs; that is the
only moment we know interest rate has reached the climax. Also, Colombo (2018) fails
0
1000
2000
3000
4000
19
64
19
66
19
68
19
70
19
72
19
74
19
76
19
78
19
80
19
82
19
84
19
86
19
88
19
90
19
92
19
94
19
96
19
98
20
00
20
02
20
04
20
06
20
08
20
10
20
12
20
14
20
16
20
18
S&P500

Chi Nam, Yau Economically Justified Equity Investment Strategies
Capable Of Withstanding Growing Interest Rate Environment
19
to understand a simple statistical concept: correlation does not imply causation. Short-
term and long-term interest rates and inflation rate are useful signals that reflect the status
of economy. However, they are never the only culprit of financial crisis. Market bubbles
seem to be a more plausible explanation.
Source: online data by Shiller’s database (http://www.econ.yale.edu/~shiller/data.htm)
According to Figure 5 above, the long-term interest rate has been experiencing a
falling trend since 1981 while there were ups and downs for CAPE ratio. The CAPE ratio
increased dramatically from the bottom of 6.64 in 1982 to the historical peak of 43.83 in
2000. The bust of dot com bubble in 2000 led to a staggering fall of CAPE ratio. The
CAPE ratio fell to 21.21 in 2003 and recovered to 27.32 in 2007. However, the 2008 US
financial crisis led to another significant fall of CAPE ratio. The ratio plummeted to 13.32
in 2009 but picked up a rising trend afterwards and reached 28.95 in 2019. The graph
shows that the CAPE ratios move independently from long-term interest rates (US 10-
year Treasury constant maturity rate). This implicates that the impact of long-term
interest rate on US stock market return could be insignificant.
Figure 5 Historical CAPE ratio and US long-term interest rate

Chi Nam, Yau Economically Justified Equity Investment Strategies
Capable Of Withstanding Growing Interest Rate Environment
20
Source: Bloomberg Terminal
Figure 6 below shows that there is a decreasing trend in US unemployment rate
since 2010. This signals a favorable positive economic growth because lower
unemployment rate indicates that the working population becomes larger, which lead to
higher level of economic output in the future.
Overall, the macroeconomic factors implicate that the US economy is currently
at the late expansion phase of the business cycle. Figure 3 illustrates a positive short-term
economic outlook as the inflation rate is maintained near the target of 2%. S&P 500 index
(see Figure 4) has a dramatic growth since 2010 while short term interest rate (see Figure
2) increased from 0% to 2.5% between 2015 and early 2019 but was recently reduced to
approximately 1.75% in October 2019. However, Figure 7 below shows that long-term
interest rate has fallen to the rather closed to the zero bottom level. It implies that
investors are pessimistic about the US economy in the long run. Moreover, Figure 8
shows that the quarterly US real GDP growth has been below 1% for more than 3 years
while Figure 9 depicts that the quarterly nominal US GDP growth has been below 2%
for over 13 years. The slow real GDP growth implies that the US economy has already
entered a mature phase.
0
2
4
6
8
10
12
19
63
19
65
19
67
19
69
19
71
19
73
19
75
19
77
19
79
19
81
19
83
19
85
19
87
19
89
19
91
19
93
19
95
19
97
19
99
20
01
20
03
20
05
20
07
20
09
20
11
20
13
20
15
20
17
20
19
US UNEMPLOYMENT RATE
Figure 6 Historical US unemployment rate

Chi Nam, Yau Economically Justified Equity Investment Strategies
Capable Of Withstanding Growing Interest Rate Environment
21
Source: Bloomberg Terminal
Source: FRED database and author’s calculation
Source: FRED database and author’s calculation
0
5
10
15
20
19
63
19
65
19
67
19
69
19
71
19
73
19
75
19
77
19
79
19
81
19
83
19
85
19
87
19
89
19
91
19
93
19
95
19
97
19
99
20
01
20
03
20
05
20
07
20
09
20
11
20
13
20
15
20
17
20
19
10 YEAR US TREASURY YIELD
Figure 7 Historical 10-year US Treasury yield
-3.00%
-2.00%
-1.00%
0.00%
1.00%
2.00%
3.00%
4.00%
5.00%
19
47
19
49
19
52
19
54
19
57
19
59
19
62
19
65
19
67
19
70
19
72
19
75
19
78
19
80
19
83
19
85
19
88
19
90
19
93
19
96
19
98
20
01
20
03
20
06
20
09
20
11
20
14
20
16
US Real GDP growth
-3.00%
-2.00%
-1.00%
0.00%
1.00%
2.00%
3.00%
4.00%
5.00%
6.00%
7.00%
19
47
19
49
19
52
19
55
19
58
19
61
19
64
19
66
19
69
19
72
19
75
19
78
19
81
19
83
19
86
19
89
19
92
19
95
19
98
20
00
20
03
20
06
20
09
20
12
20
15
20
17
US GDP growth
Figure 8 Historical US Real GDP growth
Figure 9 Historical nominal US GDP growth

Chi Nam, Yau Economically Justified Equity Investment Strategies
Capable Of Withstanding Growing Interest Rate Environment
22
5.1.2 PE ratio of US energy sector, crude oil price and inflation rate
Based on Figure 10, the PE ratio of US energy sector skyrocketed in 2016. The
dramatic increase in PE ratio could be explained by the decrease in oil price in 2016 when
the oil price fell to the bottom of $30 per barrel (see Figure 11). Thus, changes in oil price
may have a considerable impact on US energy stock returns.
Figure 10 PE ratio of US Energy Sector Benchmark S&P 500 Energy index, 2009-2019
Source: Bloomberg Terminal
Source: FRED database
Figure 11 Historical US crude oil price. 2009-2019
0.00
20.00
40.00
60.00
80.00
100.00
120.00
20
09
20
10
20
10
20
11
20
11
20
11
20
12
20
12
20
13
20
13
20
13
20
14
20
14
20
15
20
15
20
16
20
16
20
16
20
17
20
17
20
18
20
18
20
18
20
19
20
19
US crude oil price
0.00
20.00
40.00
60.00
80.00
100.00
120.00
140.00
160.00
20
09
20
10
20
10
20
11
20
11
20
11
20
12
20
12
20
13
20
13
20
13
20
14
20
14
20
15
20
15
20
16
20
16
20
16
20
17
20
17
20
18
20
18
20
18
20
19
PE ratio of US energy sector

Chi Nam, Yau Economically Justified Equity Investment Strategies
Capable Of Withstanding Growing Interest Rate Environment
23
Additionally, changes in inflation rate may significantly influence US energy
stock returns. Figure 12 and 13 below illustrate that the highest average monthly PE ratios
are observed for inflation rate intervals of 0.5%-1% and 2%-2.5% during the period
2009-2019. On the other hand, the graphs show that lowest PE ratios are observed for
inflation higher than 3%. The highest PE ratio observable in Figure 12 and 13 could be
explained by the plummeting oil price in 2016. Figure 10 also depicts that the volatility
of PE ratio was the highest during the 2016 oil shock and the inflation rate at that time
was positive and rather low.
Source: Bloomberg Terminal and author’s calculation
Source: Bloomberg Terminal and author’s calculation
Figure 12 Average PE of S&P 500 energy index versus inflation rate, 2009-2019
Figure 13 PE ratio of S&P 500 energy index versus inflation rate, 2009-2019
16.3919.52
37.48
22.8225.66
35.69
25.07
12.83 12.82
0.00
5.00
10.00
15.00
20.00
25.00
30.00
35.00
40.00
<=0 0-0.5% 0.5-1% 1-1.5% 1.5-2% 2-2.5% 2.5-3% 3-3.5% 3.5-4%
Ave
rage
PE
rati
o
Inflation interval
Average PE ratio of US energy sector and inflation
0.00
20.00
40.00
60.00
80.00
100.00
120.00
140.00
160.00
-0.50% 0.00% 0.50% 1.00% 1.50% 2.00% 2.50% 3.00% 3.50% 4.00% 4.50%
PE
rati
o
Inflation
PE ratio of US energy sector and inflation

Chi Nam, Yau Economically Justified Equity Investment Strategies
Capable Of Withstanding Growing Interest Rate Environment
24
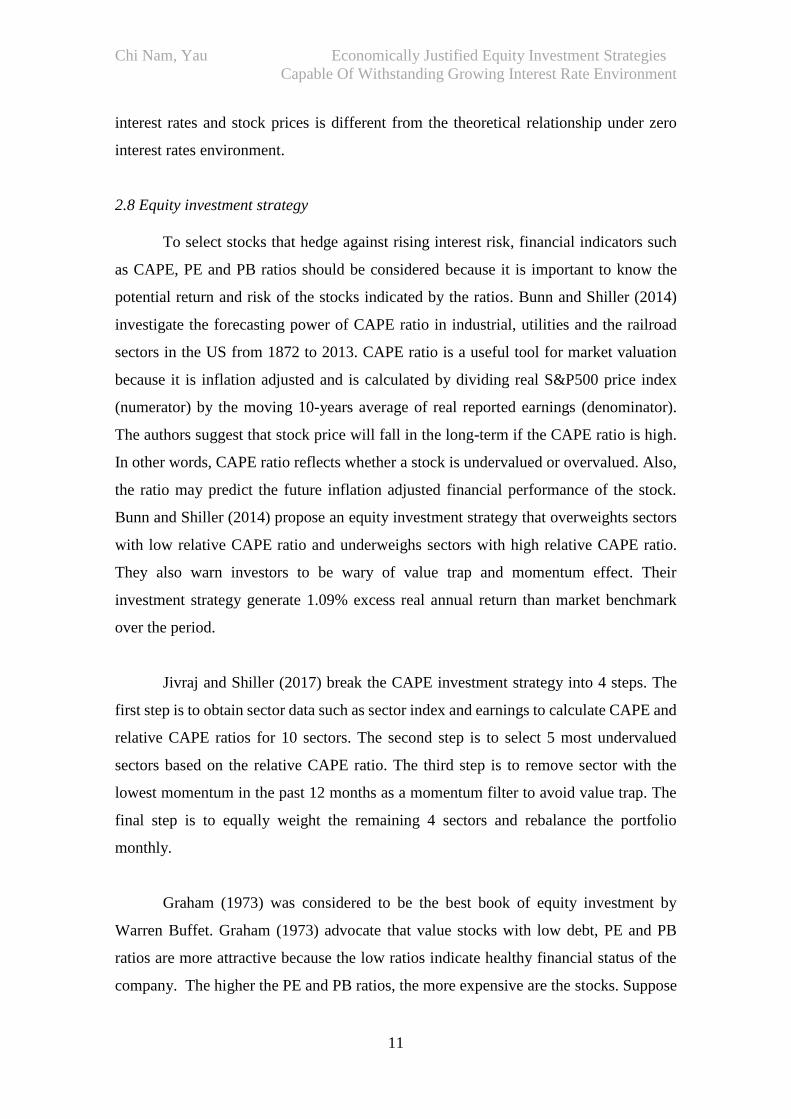
5.1.3 PE ratio of US financial sector and inflation rate
Figure 14 below demonstrates that the PE ratio of US financial sector
plummeted from the peak of over 40 to less than 15 after the GFC. At first glance, the
significant fall of PE ratio is favorable to value stock investors.
Source: Bloomberg Terminal
Based on Figure 15, the highest average PE ratio of US financial sector is
observed for the inflation interval of 2-3%. Compared with US energy sector, US
financial sector has lower average PE ratios for inflation interval of less than zero percent
to 3% (see Figure 12 and 15). The highest PE ratio of US financial sector is 19.56 for the
inflation interval of 2.5-3%, i.e., for higher inflation rates than those subjacent to the local
maxima in Figure 12. In line with it, US financial sector has slightly higher PE ratio than
US energy sector for the inflation interval of 3-4%. Figure 13 and 16 also show that the
PE ratios of US financial sector are likely to be less volatile than US energy sector’s PE
ratio.
0.00
5.00
10.00
15.00
20.00
25.00
30.00
35.00
40.00
45.00
20
09
20
10
20
10
20
11
20
11
20
12
20
12
20
12
20
13
20
13
20
14
20
14
20
14
20
15
20
15
20
16
20
16
20
17
20
17
20
17
20
18
20
18
20
19
20
19
PE ratio of US financial sector
Figure 14 PE ratio of S&P 500 financial index, 2009-2019
Chi Nam, Yau Economically Justified Equity Investment Strategies
Capable Of Withstanding Growing Interest Rate Environment
25
Source: Bloomberg Terminal and author’s calculation
Source: Bloomberg Terminal and author’s calculation
5.1.4 PE ratio of US stock market and inflation rate
Figure 17 below illustrates that the PE ratio of US stock market fell to less than
15 after the GFC but started to rise in 2011 until 2018. The PE ratio reached 22.93 in
January 2018 but decreased to 16.48 at the end of 2018. Then, the ratio increased to
around 20 in 2019. US financial sector had the lowest PE in recent period (2014-2019)
(see Figure 10, 14 and 17). Although it is not clearly shown by the graphs, the US
energy sector had the lowest PE between May 2011 and July 2013.
15.00 15.22 14.81 14.49 14.0317.80
19.56
14.29 14.84
0.00
5.00
10.00
15.00
20.00
25.00
<=0 0-0.5% 0.5-1% 1-1.5% 1.5-2% 2-2.5% 2.5-3% 3-3.5% 3.5-4%
Ave
rage
PE
rati
o
Inflation interval
Average PE ratio of US financial sector and inflation
Figure 15 Histogram chart of average PE of S&P 500 financial index and inflation rate, 2009-2019
0.00
5.00
10.00
15.00
20.00
25.00
30.00
35.00
40.00
45.00
-0.50% 0.00% 0.50% 1.00% 1.50% 2.00% 2.50% 3.00% 3.50% 4.00% 4.50%
PE
rati
o
Inflation
PE ratio of US financial sector and inflation
Figure 16 PE ratio of S&P 500 financial index versus inflation rate, 2009-2019

Chi Nam, Yau Economically Justified Equity Investment Strategies
Capable Of Withstanding Growing Interest Rate Environment
26
Source: Bloomberg Terminal
In accordance with Figure 18 below, the average PE ratio of US stock market is
slightly higher under inflation interval of 2-2.5%. The ratio is the lowest when the
inflation rate is around 3-3.5%. It is noteworthy that the second highest average PE ratios
of energy and financial sectors are observed for inflation interval of 2-2.5% while the
second lowest ratios of the sectors are observed for inflation interval of 3-3.5% (see
Figure 12, 15 and 18). This implicates that based on value investment strategy, the US
stock market may be the most attractive when the inflation rate is around 3-3.5%, while
the entire stock market may become less attractive when the inflation rate is around 2%
to 2.5%. However, the inflation rates in 2019 varies within 1.5% to 2%, the range for
which US financial sector has the lowest average PE ratios.
Source: Bloomberg Terminal and author’s calculation
0.00
5.00
10.00
15.00
20.00
25.00
30.00
20
09
20
10
20
10
20
11
20
11
20
11
20
12
20
12
20
13
20
13
20
13
20
14
20
14
20
15
20
15
20
16
20
16
20
16
20
17
20
17
20
18
20
18
20
18
20
19
PE ratio of US stock market
Figure 17 PE ratio of S&P 500 index, 2009-2019
18.94 18.51 18.9316.55 17.79
19.2517.46
14.24 14.39
0.00
5.00
10.00
15.00
20.00
25.00
<=0 0-0.5% 0.5-1% 1-1.5% 1.5-2% 2-2.5% 2.5-3% 3-3.5% 3.5-4%
Ave
age
PE
Inflation interval
Average PE ratio of US stock market and inflation
Figure 18 Average PE of S&P 500 index versus inflation rate, 2009-2019

Chi Nam, Yau Economically Justified Equity Investment Strategies
Capable Of Withstanding Growing Interest Rate Environment
27
According to Figure 19, it appears that the PE ratios of US stock market is not
volatile between 2009 and 2019. It is interesting to note that US energy and financial
sectors’ PE ratios seem to be more volatile than US stock market’s PE ratios (see Figure
13, 16 and 19). The US energy sector’s PE ratios are more volatile possibly due to the
oil shock in 2016.
Source: Bloomberg Terminal and author’s calculation
5.2 Results from VAR model and Granger causality test
5.2.1 VAR model and Granger causality test for US energy sector
Table II below summarizes the result of VAR model and Granger causality test
for US energy sector between January 2010 and August 2019. Only the statistically
significant variables (stationary data) are reported for Table II and other tables in section
5.2. The variables are considered to be statistically significant if their T-ratios exceed the
critical T-ratio of 1.98 with 116 observations at 95% confidence level under a two-tailed
test (null hypothesis: coefficient = 0; alternative hypothesis: coefficient ≠ 0). The critical
t-value is 1.658 at 90% confidence level. Monthly data of the variables such as 10-year
US Treasury yield, 5-year US Treasury yield, inflation rate and fund rate are employed
as explanatory variable in order to examine their impact on the returns of US stock
market, energy and financial sectors. For US energy sector, crude oil price is adopted as
an additional explanatory variable.
0.00
5.00
10.00
15.00
20.00
25.00
30.00
-0.50% 0.00% 0.50% 1.00% 1.50% 2.00% 2.50% 3.00% 3.50% 4.00% 4.50%
PE
rati
o
Inflation
PE ratio of US stock market and inflation
Figure 19 PE ratio of S&P 500 index versus inflation rate, 2009-2019

Chi Nam, Yau Economically Justified Equity Investment Strategies
Capable Of Withstanding Growing Interest Rate Environment
28
TABLE II: Summary of VAR model and Granger causality test for US energy sector,
2010-2019
*significant at 90% confidence level
Source: Bloomberg Terminal and author’s calculation
Table II illustrates that 1 month lag of US 5-year Treasury yield, 2 month lag of
US fund rate, 1 and 2 month lags of crude oil price and 1 month lag of changes in crude
oil price have significant explanatory power on US energy sector returns. The negative
coefficients of US 5-year Treasury yield (1 month lag) and US fund rate (2 month lag)
indicate that there is an inverse relationship between interest rates and energy sector
returns, which supports Fama (1981)’s theoretical framework. It is noteworthy that the
crude oil price has a positive 1-month lag effect and a negative 2-month lag effect on US
energy stock returns. Moreover, the R squared on Table II demonstrates that the monthly
US energy stock return has weak correlations with the lags of US 5-year Treasury yield
and fund rate, while lags of crude oil price and changes in crude oil price have
considerably stronger correlations with US energy stock returns.
Dependent
variable
Explanatory
variable
Coefficient T-ratio R2 Granger
causality
test
S&P 500
energy index
monthly
return
US 5-year Treasury
yield(t-1)
-1.50 -1.69* 0.028 Fail to
reject null
hypothesis
S&P 500
energy index
monthly
return
US fund rate (t-2) -18.56 -1.69* 0.043 Fail to
reject null
hypothesis
S&P 500
energy index
monthly
return
Crude oil price(t-1) 0.0058 5.74 0.23 Reject the
null
hypothesis
S&P 500
energy index
monthly
return
Crude oil price(t-2) -0.0056 -5.59 0.23 Reject the
null
hypothesis
S&P 500
energy index
monthly
return
Changes in crude
oil price(t-1)
0.0056 5.63 0.22 Reject the
null
hypothesis
Chi Nam, Yau Economically Justified Equity Investment Strategies
Capable Of Withstanding Growing Interest Rate Environment
29
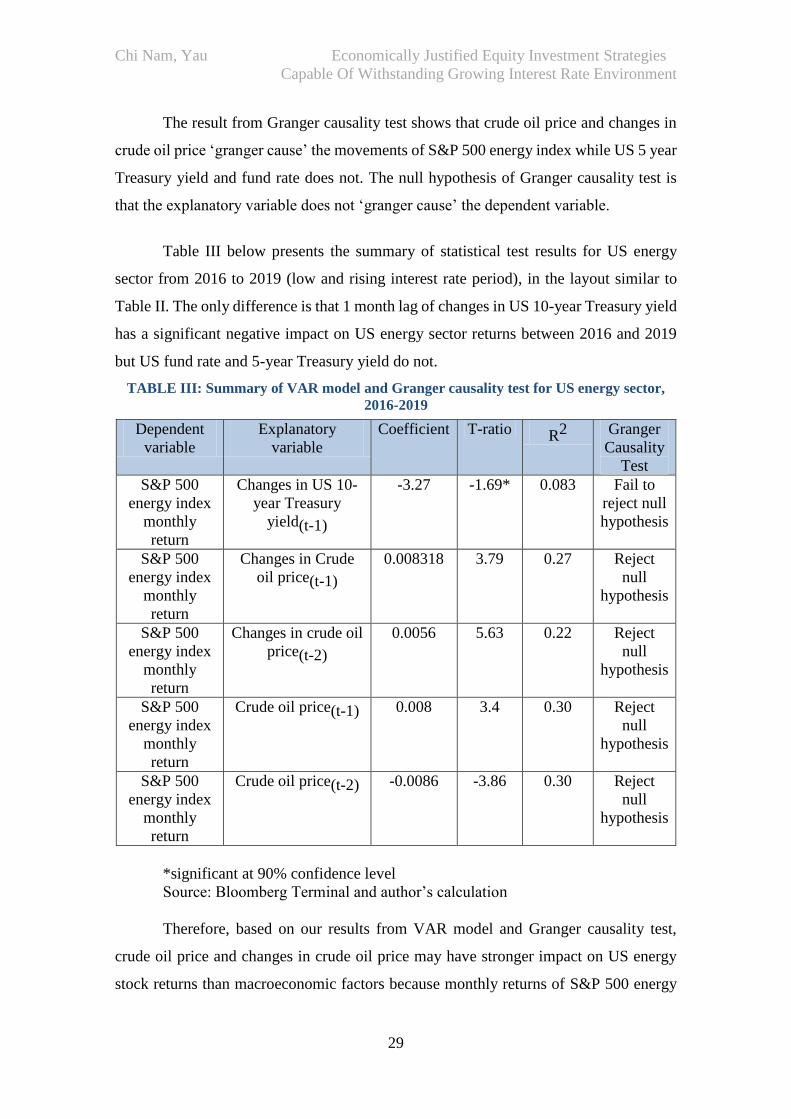
The result from Granger causality test shows that crude oil price and changes in
crude oil price ‘granger cause’ the movements of S&P 500 energy index while US 5 year
Treasury yield and fund rate does not. The null hypothesis of Granger causality test is
that the explanatory variable does not ‘granger cause’ the dependent variable.
Table III below presents the summary of statistical test results for US energy
sector from 2016 to 2019 (low and rising interest rate period), in the layout similar to
Table II. The only difference is that 1 month lag of changes in US 10-year Treasury yield
has a significant negative impact on US energy sector returns between 2016 and 2019
but US fund rate and 5-year Treasury yield do not.
TABLE III: Summary of VAR model and Granger causality test for US energy sector,
2016-2019
*significant at 90% confidence level
Source: Bloomberg Terminal and author’s calculation
Therefore, based on our results from VAR model and Granger causality test,
crude oil price and changes in crude oil price may have stronger impact on US energy
stock returns than macroeconomic factors because monthly returns of S&P 500 energy
Dependent
variable
Explanatory
variable
Coefficient T-ratio R2 Granger
Causality
Test
S&P 500
energy index
monthly
return
Changes in US 10-
year Treasury
yield(t-1)
-3.27 -1.69* 0.083 Fail to
reject null
hypothesis
S&P 500
energy index
monthly
return
Changes in Crude
oil price(t-1)
0.008318 3.79 0.27 Reject
null
hypothesis
S&P 500
energy index
monthly
return
Changes in crude oil
price(t-2)
0.0056 5.63 0.22 Reject
null
hypothesis
S&P 500
energy index
monthly
return
Crude oil price(t-1) 0.008 3.4 0.30 Reject
null
hypothesis
S&P 500
energy index
monthly
return
Crude oil price(t-2) -0.0086 -3.86 0.30 Reject
null
hypothesis

Chi Nam, Yau Economically Justified Equity Investment Strategies
Capable Of Withstanding Growing Interest Rate Environment
30
index are “Granger caused” by the crude oil price and changes in crude oil price, and not
by interest rates, fund rate or inflation.
5.2.2 VAR model and Granger causality test for US financial sector
Tables IV and V below illustrate that US 10-year and 5-year Treasury yield have
significant positive lag impact on US financial sector return for 2010-2019 and 2016-
2019.
TABLE IV: Summary of VAR model and Granger causality test for US financial sector,
2010-2019
Source: Bloomberg Terminal and author’s calculation
TABLE V: Summary of VAR model and Granger causality test for US financial sector,
2016-2019
Source: Bloomberg Terminal and author’s calculation
Dependent
variable
Explanatory
variable
Coefficient T-ratio R2 Granger
Causality Test
S&P 500
financial
index
monthly
return
US 10-year
Treasury yield(t-1)
2.10 2.54 0.067 Reject null
hypothesis
S&P 500
financial
index
monthly
return
US 5-year Treasury
yield(t-1)
1.648 2.20 0.054 Reject null
hypothesis
S&P 500
financial
index
monthly
return
Inflation rate(t-1) 2.865 1.81* 0.052 Fail to reject null
hypothesis
Dependent
variable
Explanatory
variable
Coefficient T-ratio R2 Granger Causality
Test
S&P 500
financial
index
monthly
return
US 10-year
Treasury yield(t-1)
3.21 1.98 0.11 Reject null
hypothesis
S&P 500
financial
index
monthly
return
US 5-year Treasury
yield(t-1)
2.42 1.88* 0.10 Reject null
hypothesis

Chi Nam, Yau Economically Justified Equity Investment Strategies
Capable Of Withstanding Growing Interest Rate Environment
31
The long-term and mid-term interest rates ‘granger cause’ the US financial stock
returns over the same time periods. Compared with the results for US energy sector, the
results for US financial sector are strikingly different. Interest rates have negative lag
impacts on US energy stock prices but have positive lag effect on financial stock returns.
Although interest rates do not ‘granger cause’ US energy stock price movements, they
‘granger cause’ changes in US financial stocks price.
Furthermore, the R squared on Table V is reasonably higher than the R squared
on Table IV. This implicates that the correlations between US financial stock returns and
interest rates become stronger in recent years (2016-2019).
5.2.3 VAR model and Granger causality test for US stock market
TABLE VI: Summary of VAR model and Granger causality test for US stock market,
2016-2019
Source: Bloomberg Terminal and author’s calculation
The tested macroeconomic variables have significant explanatory power on S&P
500 index between 2016 and 2019 but the power is insignificant over 2009-2019. Table
VI above demonstrates that US 10-year Treasury yield and changes in fund rate have
negative lag effect on the US stock market. However, they do not ‘granger cause’ the US
stock price movements. Nonetheless, the R squared of test for US stock market is
Dependent
variable
Explanatory
variable
Coefficient T-ratio R2 Granger
Causality Test
S&P 500
index
monthly
return
US 10-year
Treasury yield(t-1)
-5.357 -1.822* 0.40 Fail to reject
null
hypothesis
S&P 500
index
monthly
return
US 10-year
Treasury yield(t-5)
-6.85 -2.20 0.40 Fail to reject
null
hypothesis
S&P 500
index
monthly
return
Changes in US fund
rate(t-3)
-19.20 -2.41 0.65 Fail to reject
null
hypothesis
S&P 500
index
monthly
return
Changes in US fund
rate(t-12)
-15.91 -2.09 0.65 Fail to reject
null
hypothesis

Chi Nam, Yau Economically Justified Equity Investment Strategies
Capable Of Withstanding Growing Interest Rate Environment
32
substantially higher than the R squared from the tests for US energy and financial sectors.
This indicates that the correlation between interest rates and stock returns become
stronger in recent years (2016-2019) under low and rising interest rate environment.
Willis and Cao (2015) suggest that US stocks become less interest rate sensitive between
1984 and 2007 based on VAR model. Willis and Cao (2015) do not analyze the data in
post-2007 period because they believe that interest rate sensitivity of US stocks may
change drastically under low interest rate environment. Therefore, our result from Table
VI supports Willis and Cao (2015)’s insight.
It is also worth noting that, interestingly enough, the changes in US fund rates
have stronger explanatory power and higher statistical significance than long-run US 10-
year Treasury yield. The explanation of this phenomenon does not enter in the scope of
the presented research, but further investigation of this subject seems to be highly
desirable.
Overall, our results from VAR model and Granger causality test show that
interest rates have positive lag impact on US financial sector returns, and have negative
lag impact on US energy stock returns and US stock prices. Furthermore, interest rates
‘granger cause’ the price movements of US financial stocks. Thus, US financial stocks
appear to be the optimal choice for our equity investment strategy that hedges against
rising interest rate risk. However, financial indicators, which will be discussed in the
section below, should also be examined before we reach our conclusion.

Chi Nam, Yau Economically Justified Equity Investment Strategies
Capable Of Withstanding Growing Interest Rate Environment
33
5.3 Financial analysis
Table VII: Financial indicators of sector benchmarks
Source: S&P Dow Jones indices (https://us.spindices.com), Bloomberg Terminal and
Fortune 500
Table VII above illustrates that US financial sector is the most favorable based
on value investment strategy due to its low PB and PE ratios. However, US financial
sector has lower annual total returns and higher annualized risk than the US stock market.
Table VIII: Financial leverage of sector benchmarks
Source: Bloomberg Terminal and author’s calculation
As interest rates determine the borrowing cost, interest income and interest
expense of firms, it is important to examine the changes in total liabilities in the US stock
market under rising interest rates environment. The rise of total liabilities in US financial
Index 10-
years
annual
total
return
5-years
annual
total
return
5-years
Annualized
risk
(Standard
Deviation)
10-years
Annualized
risk
(Standard
Deviation)
PB PE Leading
Companies
S&P
500
energy
0.66% -9.23% 20.15% 19.48% 1.55 15.73 Exxon Mobil
, Chevron
Corp
S&P
500
financial
8.75% 8.3081
%
16.24% 16.95% 1.43 13.47 Berkshire
Hathaway,
Bank of
America
S&P
500 13.24
%
10.84% 11.93% 12.55% 3.42 19.77 Microsoft
Corp, Apple
Inc.,
Inc.
Index 2014 2015 2016 2017 2018 2019
S&P
500
energy
% change
in Total
Liabilities
5.37% -10.33% -1.18% -8.18% -
5.11%
3.45%
S&P
500
financial
3.08% -1.65% 27.33% 5.19% 3.15% 3.91%
S&P
500
5.88% 2.09% 6.80% 4.81% 3.17% 4.34%

Chi Nam, Yau Economically Justified Equity Investment Strategies
Capable Of Withstanding Growing Interest Rate Environment
34
market and US stock market under low and rising interest rate environment from 2016
to 20019 are possibly favorable. The S&P 500 index has reached its pinnacle of over
3,000 points. The Japanese stock market, which is also under the influence of low interest
rate environment, has not yet fully recovered from the loss from the bust of asset bubble
in 1992. Koo (2008) suggests that Japanese stock prices were stale after the bust because
firms’ objective switched from profit making to paying down debts. Stock prices moved
downward along with the interest rates after the bust. That is possibly the reason why
Alam (2009) states that Japanese stock market has a positive relationship with interest
rate.
Based on financial analysis, S&P 500 index replication and investment in US
financial sector could be optimal for hedging against rising interest rate. Although US
financial sector has lower return than the S&P 500 index’s benchmark return, it has lower
PE and PB ratios.

Chi Nam, Yau Economically Justified Equity Investment Strategies
Capable Of Withstanding Growing Interest Rate Environment
35
6. CONCLUSION
This thesis proposes the three-fold methodology to be employed in order to find
the optimal investment strategy that withstands growing interest rate environment. This
approach is based on macroeconomic analysis, VAR model and Granger causality test,
and financial analysis. This methodology is applied to the US equity market.
The performed study illustrates that US financial stocks are the most suitable for
hedging risks of rising interest rate. US financial stocks have the lowest average PE ratios
for the inflation interval of 1.5-2%, which happens to be the range of inflation rate in
2019. They have a historically verified potential to be resilient to rising interest rates.
Additionally, based on our result from VAR model, interest rates have positive
lag impacts on US financial stock returns. Moreover, in accordance with Granger
causality test, the interest rates ‘granger cause’ the US financial stock returns.
Furthermore, according to financial analysis, US financial sector has lower PE ratios and
PB ratios than energy sector and US stock market benchmark. US financial sector also
had a significant growth in total liabilities in 2016 which could be favorable based on the
observations from Japan stock market. However, our analyses are dependent on historical
data and observations which do not guarantee future performance. Therefore, investors
should not neglect the looming threat of tail risks and ‘black swan’ effect.

Chi Nam, Yau Economically Justified Equity Investment Strategies
Capable Of Withstanding Growing Interest Rate Environment
36
References
Alaganar, V. T. and Bhar, R., (2003). An international study of causality-in-variance:
Interest rate and financial sector returns, Journal of Economics and Finance 27 (1), 39-
55.
Alam, M. (2009). Relationship between Interest Rate and Stock Price: Empirical
Evidence from Developed and Developing Countries, International Journal of Business
and Management 4 (3), 43-51.
Baghai, P., Erzan, O. and Kwek, J.H. (2018). North American asset management in
2018: The New Great Game, McKinsey & Company,
<https://www.mckinsey.com/~/media/McKinsey/Industries/Financial%20Services/Our
%20Insights/The%20new%20Great%20Game%20in%20North%20American%20asset
%20management/North-American-asset-management-2018-vf.ashx> [accessed:
10OCT2019]
Bartram, S. (2002). The Interest Rate Exposure of Nonfinancial Corporations, Review
of Finance 6 (1), 101-125.
Boothe, J., Doll, R.C. and Bowie, K.L. (2018). Positioning equity portfolios for when
rates rise, Nuveen, < https://www.nuveen.com/positioning-equity-portfolios-for-when-
rates-rise> [accessed: 10/10/2019]
Borio, C., Gambacorta, L. and Hofmann, B. (2015). The influence of monetary policy
on bank profitability, Bank for international settlements 514.
<https://www.researchgate.net/publication/317745528_The_influence_of_monetary_po
licy_on_bank_profitability> [accessed: 10/10/2019]
Brooks, C. (2008). Introductory Econometrics for Finance 2nd Edition, Cambridge
University Press, New York.
Bunn, O.D. and Shiller, R.J. (2014). Changing Times, Changing Values: A Historical
Analysis Of Sectors Within The Us Stock Market 1872-2013, Nber Working Paper
Series, National Bureau Of Economic Research, Cambridge. <
https://www.nber.org/papers/w20370.pdf> [accessed: 10/10/2019]
Camilleri, S.J., Scicluna, N. and Bai, Y. (2019). Do stock markets lead or lag
macroeconomic variables? Evidence from select European countries, North American
Journal of Economics
and Finance 48, 170-186.
Colombo, J. (2018). How Interest Rate Hikes Will Trigger The Next Financial Crisis,
Forbes,
<https://www.forbes.com/sites/jessecolombo/2018/09/27/how-interest-rate-hikes-will-
trigger-the-next-financial-crisis/#1a3f863f6717> [accessed: 10/10/2019]

Chi Nam, Yau Economically Justified Equity Investment Strategies
Capable Of Withstanding Growing Interest Rate Environment
37
Delcey, T. (2019). Samuelson vs Fama on the Efficient Market Hypothesis: The Point
of View of Expertise, Economia 9 (1), 37-58.
Eccles, B. (2019). Concentration In The Asset Management Industry: Implications for
Corporate Engagement, Forbes,
<https://www.forbes.com/sites/bobeccles/2019/04/17/concentration-in-the-asset-
management-industry-implications-for-corporate-engagement/#bc7d8ea402f5>
[accessed: 10/10/2019]
Edward, M. Miller. (1979). A Simple Counter Example to the Random Walk Theory,
Financial Analysts Journal 35 (4), 55-67.
Elyasiani, E. and Mansur, I. (1998). Sensitivity of the bank stock returns distribution to
changes in the level and volatility of interest rate: A GARCH-M model, Journal of
Banking and Finance 22, 535-563.
Energy Industry Spotlight, (2019). US Department of Commerce and International
Trade Administration 2019.
< https://www.selectusa.gov/energy-industry-united-states> [accessed: 10/10/2019]
Equity Investing in a Rising Rate Environment, Hotchkis & Wiley, (2017). <
https://www.hwcm.com/assets/documents/Marketing-Pieces/White-Papers/2017-
Equity-Investing-and-Interest-Rates.pdf> [accessed: 10/10/2019]
Fama, E. (1965). Random walks in stock market prices, JSTOR [Database], Financial
Analyst Journal 21 (5), 55-59.
<https://www.jstor.org/stable/4469865?seq=1#page_scan_tab_contents> [accessed:
10/10/2019]
Fama, E. (1981). Stock return, Real activity, Inflation, and Money, JSTOR [Database],
The American Economic Review71 (4), 545-565.
Ferrer R., Bolos, V.J. and Benitez, R. (2016b). Interest rate changes and stock returns:
A European
multi-country study with wavelets, International Review of Economics and Finance
44, 1-12.
Ferrer, R., Jammazi, R., Jareño, F. and Hammoudeh, S.M. (2017). Main driving factors
of the interest rate-stock market Granger causality, International Review of Financial
Analysis 52, 260-280.
Ferrer, R., Miroslavovaa, S. and Jareño, F. (2016a). US stock market sensitivity to
interest and inflation rates: a quantile regression approach, Applied Economics 48,
2469-2481.
Flannery, M.J. and James, C.M. (1984). The effect of interest rate changes on the
common stock returns of financial institutions, The Journal of Finance 39 (4), 1141-
1153.

Chi Nam, Yau Economically Justified Equity Investment Strategies
Capable Of Withstanding Growing Interest Rate Environment
38
Friedman, M. (1970). The Counter-Revolution in Monetary Theory, the Institute of
Economic Affairs, IEA Occasional Paper, no. 33. London,
<https://miltonfriedman.hoover.org/friedman_images/Collections/2016c21/IEA_1970.p
df> [accessed: 10/10/2019]
Graham, B. (1973). and updated by Zweig, J. (2003), The Intelligent Investor, Harper
Business Essentials, Revised Edition, New York
Oyedele, A. (2018). Morgan Stanley Has 4 Strategies For How Clients Can Withstand
The Impact Of Higher Interest Rates’, Business Insider,
<https://www.businessinsider.com/how-to-invest-amid-rising-interest-rates-morgan-
stanley-2018-10> [accessed: 10/10/2019]
Jivraj, F. and Shiler, R. J. (2017). The Mnay Colours of CAPE, Yale ICF, Working
paper No.2018-22, accessed on 23SEP2019, <
https://papers.ssrn.com/sol3/papers.cfm?abstract_id=3258404> [accessed: 10/10/2019]
Koo, R.C. (2009). The Holy Grail of Macro Economics, 1st Ed. Singapore: John Wiley
& Sons (Asia).
Krauss, C. and Reed, S. (2016). Exxon Mobil’s Profits Fall and BP Cites Low Oil
Prices in $3.3 Billion Loss, The New York Times, <
https://www.nytimes.com/2016/02/03/business/energy-environment/oil-company-
earnings.html> [accessed: 10/10/2019]
Ma, Y.R., Zhang, D., Ji, Q. and Pan, J. (2019). Spillovers between oil and stock returns
in the US energy sector: Does idiosyncratic information matter?, Energy Economics 81,
536-544.
Martin, J.D. and Keown, A.J. (1977). Interest Rate Sensitivity and Portfolio Risk, The
Journal of Financial and Quantitative Analysis 12 (2), 181-195.
Miller, E.M. (1979). A Simple Counter Example to the Random Walk Theory,
Financial Analysts Journal 35 (4), 55-56.
Monthly Energy Review, U.S. Energy Information Administration, (September 2019).
<https://www.eia.gov/totalenergy/data/monthly/pdf/mer.pdf> [accessed: 10/10/2019]
Nissim, D. and Penman, S.H. (2003). The Association between Changes in Interest
Rates, Earnings, and Equity Values, Contemporary Accounting Research 20 (4), 775–
804.
Chi Nam, Yau Economically Justified Equity Investment Strategies
Capable Of Withstanding Growing Interest Rate Environment
39
Reuters, (2018). TIMELINE: Bank of Japan policy moves since 1973, Reuters,
<https://www.reuters.com/article/us-financial-japan-boj/timeline-bank-of-japan-policy-
moves-since-1973-idUSTRE49S18W20081029> [accessed: 10/10/2019]
Shiller, R. (2019). Online Data Robert Shiller, accesed on 28AUG 2019,
<http://www.econ.yale.edu/~shiller/data.htm> [accessed: 10/10/2019]
Siklos, P.L. and Kwok, B., (1998). Stock returns and inflation: a new test of competing
hypotheses, Applied Financial Economics 9 (6), 597-581.
Sweeney, R. J., and Warga, A. D. (1986). The pricing of interest rate risk: Evidence
from the stock market, Journal of Finance 41 (2), 393–410.
Tripathi, V. and Kumar, A. (2014). Relationship between Inflation and Stock Returns –
Evidence from BRICS markets using Panel Co integration Test, International Journal
of Accounting and Financial Reporting 4 (2), 647-658.
Willis, J. and Cao, G. (2015). Has the U.S. economy become less interest rate
sensitive?, Economic Review, issue Q II, 5-36.