Chapter 7 - Economic Research Institute for ASEAN and East ...
32
Chapter 7 Financing and Burden Sharing Mechanism of the Vientiane─Hanoi Expressway Narong Pomlaktong July 2019 This chapter should be cited as Pomlaktong, N. (2019), ‘Maximisation of Economic Benefits and Industrial Development Strategies through the Vientiane─Hanoi Expressway: The Case of Thailand’, in Ambashi, M. (ed.), Vientiane─Hanoi Expressway Project., ERIA Research Project Report FY2018 no.3, Jakarta: ERIA, pp.122─152.
-
Upload
khangminh22 -
Category
Documents
-
view
1 -
download
0
Transcript of Chapter 7 - Economic Research Institute for ASEAN and East ...
Chapter 7
Financing and Burden Sharing Mechanism of the
Vientiane─Hanoi Expressway
Narong Pomlaktong
July 2019
This chapter should be cited as
Pomlaktong, N. (2019), ‘Maximisation of Economic Benefits and Industrial Development
Strategies through the Vientiane─Hanoi Expressway: The Case of Thailand’, in Ambashi, M.
(ed.), Vientiane─Hanoi Expressway Project., ERIA Research Project Report FY2018 no.3, Jakarta:
ERIA, pp.122─152.

122
Chapter 7
Financing and Burden Sharing Mechanism of the
Vientiane–Hanoi Expressway
Narong Pomlaktong
1. Introduction
This chapter examines methods for setting up pragmatic models for investment in cross-border
surface transport infrastructure. The focus is on the route connecting three major cities – Bangkok,
Vientiane, and Hanoi – of neighbouring countries. The development transcends national borders and
is regional in character. A strategic and operational framework for supplying international public goods
and mobilising financial resources is thus crucial for successful cooperative development. This is
because the costs and benefits of cross-border projects may be perceived as unequally distributed
amongst the countries concerned, making the financial arrangements difficult to negotiate. This is
especially true for transport infrastructure development projects, which are not always financially
sustainable and often need government support. The challenge is, therefore, to agree on how to share
the costs and benefits amongst the participating countries. Ultimately, taxpayers are better off if the
project can be conditioned to be financially viable for private investment.
2. Goals of Transport Infrastructure Provisions
Transport infrastructure has a positive effect on the attractiveness, competitiveness, and economic
growth of countries. Apart from opening up new business opportunities, it improves people’s standard
of living by facilitating access to essential resources such as schools, hospitals, and markets. There is,
however, a growing gap between the need and actual level of investment in new transport
infrastructure or the modernisation, operation, and maintenance of existing transport infrastructure.
This is particularly true for developing countries.
123
Available funding from traditional sources falls short of investment needs. As a consequence,
governments in both developed and developing countries around the world have been looking for
alternative models to procure public services. One common aim is to find better ways to deliver
services of the desired quality with the lowest burden possible on the public budget. The provision of
public services involves performing a number of tasks. These include:
(i) defining the project objectives,
(ii) designing the infrastructure,
(iii) financing the project,
(iv) constructing the infrastructure,
(v) maintaining the infrastructure,
(vi) operating the facilities to provide the services, and
(vii) paying for the services.
This does not imply that the government must carry out all these tasks. Some of the tasks are
‘sovereign’ in that they are fundamentally the government’s responsibility, and the government’s role
typically involves high-level decision-making regarding the use of public funds as well as the overall
monitoring and regulation of outcomes. This is in contrast to ‘operational’ tasks, which need not be
directly executed by the government. Traffic management, toll collection, and construction and
maintenance services are examples. Whatever infrastructure tasks the government delegates to the
private sector, providing infrastructure services with the available resources at the cheapest delivery
cost is important.
The following equation shows a possible mixed objective of enterprises that provide infrastructure. It
assumes that private shareholders of the enterprise maximise profits while the public authority
pursues welfare maximisation. The two groups of representatives arrive at a compromise, which is a
mixed objective function where both profit and social welfare carry the %age weight of their
respective supporters. The amount of x%age shareholding reflects the bargaining power in favour of
welfare maximising, whereas the 1-x represents maximisation of profits.
θ = x(CS + PS) + (1 − x)π
124
where CS = consumer surplus, PS = producer surplus, π = infrastructure operating firm’s profit, x
=%age representative of the government’s proposed welfare maximising, and 1 − x =%age
representative of the profit maximising of the firm operating the infrastructure.
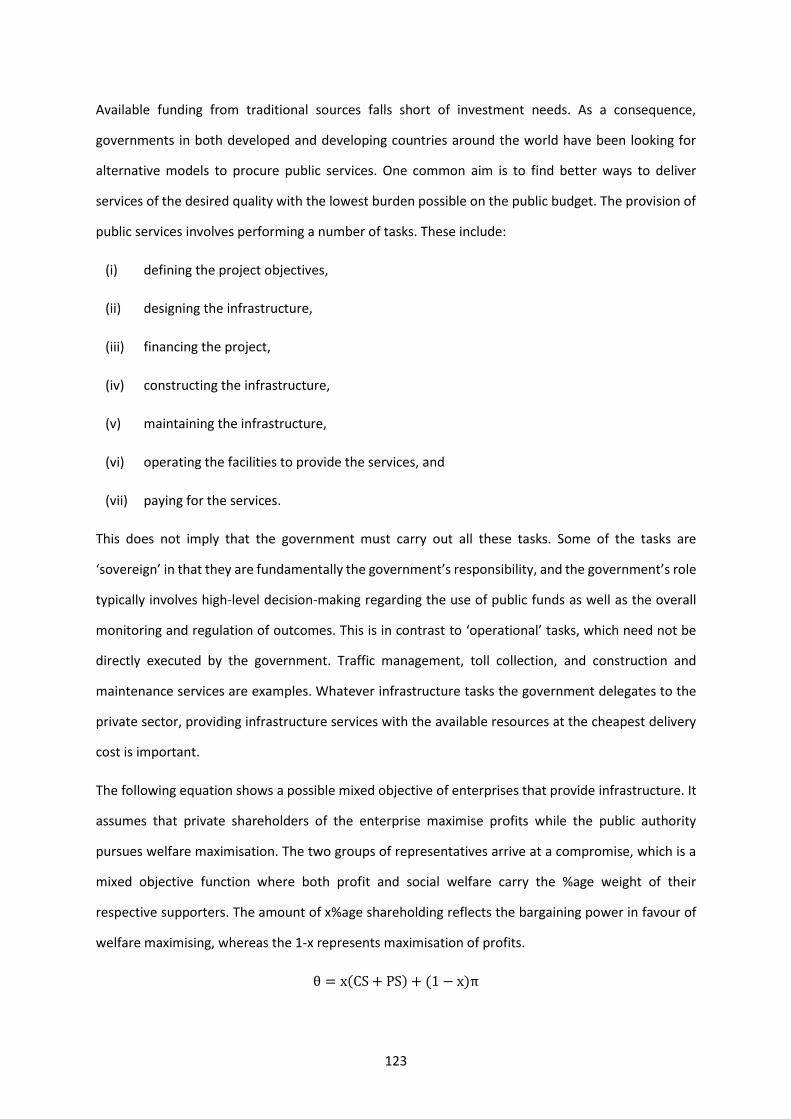
With good contract design, the mixed enterprise may opt to pursue welfare maximising regardless of
the percentage share of the public. Japan offers a good example of how to pursue welfare maximising
under the mixed enterprise arrangement. According to Morisugi (2006), Japan’s motorway network
has been developed by four main public corporations since the 1950s. Given their rising debts, at $350
billion, six private motorway companies were established in 2005. A holding company, Japan
Expressway Holding and Debt Repayment Agency (JEHDRA), was also established as an independent
administrative agency renting assets to the six private companies that are responsible for constructing
and managing expressways and toll collection (Figure 7.1). The goal of JEHDRA is to repay debts over
a 45-year period, then transfer the expressways back to the government and dissolve. The mission is
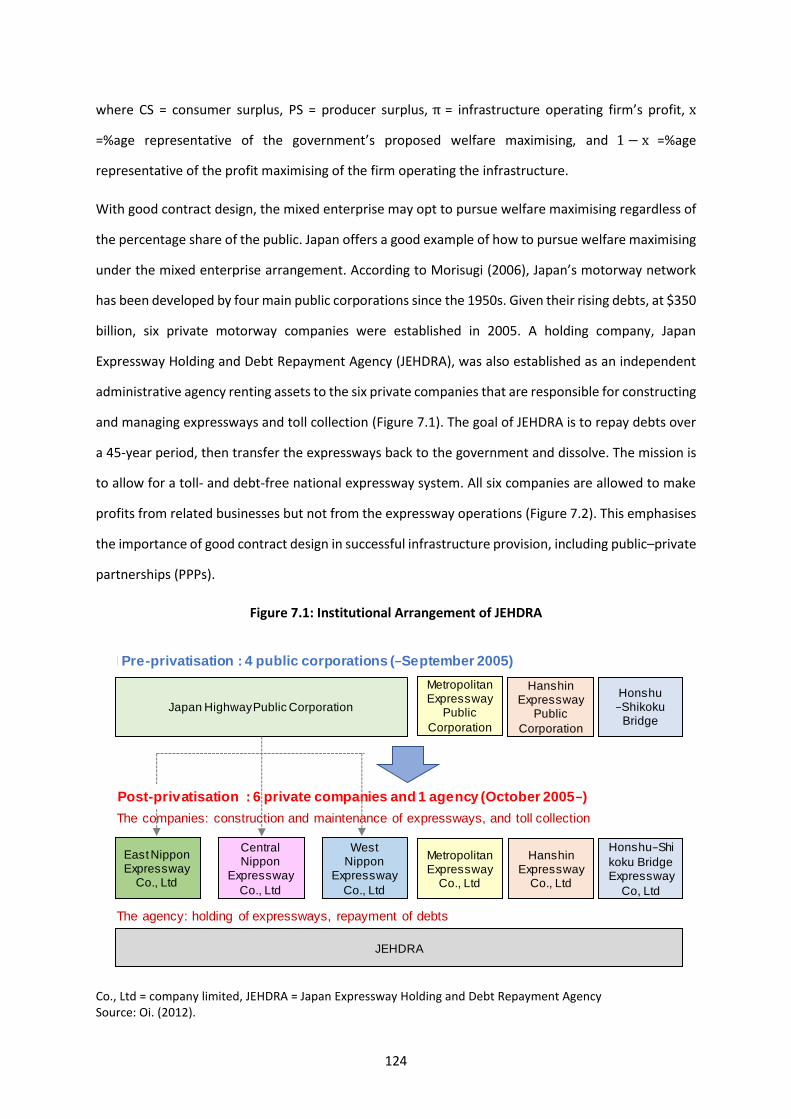
to allow for a toll- and debt-free national expressway system. All six companies are allowed to make
profits from related businesses but not from the expressway operations (Figure 7.2). This emphasises
the importance of good contract design in successful infrastructure provision, including public–private
partnerships (PPPs).
Figure 7.1: Institutional Arrangement of JEHDRA
Co., Ltd = company limited, JEHDRA = Japan Expressway Holding and Debt Repayment Agency Source: Oi. (2012).
Pre-pribvatisation: 4 public corporations (−September 2005)
Japan Highway Public Corporation
Metropolitan Expressway
Public
Corporation
Hanshin Expressway
Public
Corporation
Honshu−Shikoku
Bridge
Honshu−Shi
koku Bridge Expressway
Co, Ltd
East Nippon Expressway
Co., Ltd
Central Nippon
Expressway
Co., Ltd
West Nippon
Expressway
Co., Ltd
MetropolitanExpressway
Co., Ltd
Hanshin Expressway
Co., Ltd
Post-pribvatisation: 6 private companies and 1 agency (October 2005−)
The companies: construction and maintenance of expressways, and toll collection
The agency: holding of expressways, repayment of debts
JEHDRA
Pre-privatisation
Post-privatisation
125
Figure 7.2: Framework of JEHDRA’s Operations
JEHDRA = Japan Expressway Holding and Debt Repayment Agency. Source: Oi (2012).
3. Risks and Financing Options over the Project Life Cycle
Distinguishing between the two roles (sovereign and operation) has opened up various options for the
provision of infrastructure. This depends on the extent to which the execution of operational tasks
remains under direct political control. The highest degree of political control is observed when all the
above-mentioned tasks are carried out by the government ministry using its own resources. Reducing
government control can be done in two ways: outsourcing and devolution.
With outsourcing, the government is responsible for infrastructure provision but delegates the
responsibility of some specified operational activities to private companies for a limited period based
on contractual arrangements, while devolution refers to the transfer of responsibility for the provision
of infrastructure to organisations that are not directly under the control of government officials.
Outsourcing comes in many levels: contracting out, design–build arrangements, and PPPs. With
varying degrees of independence, these include government state-owned enterprises, mixed
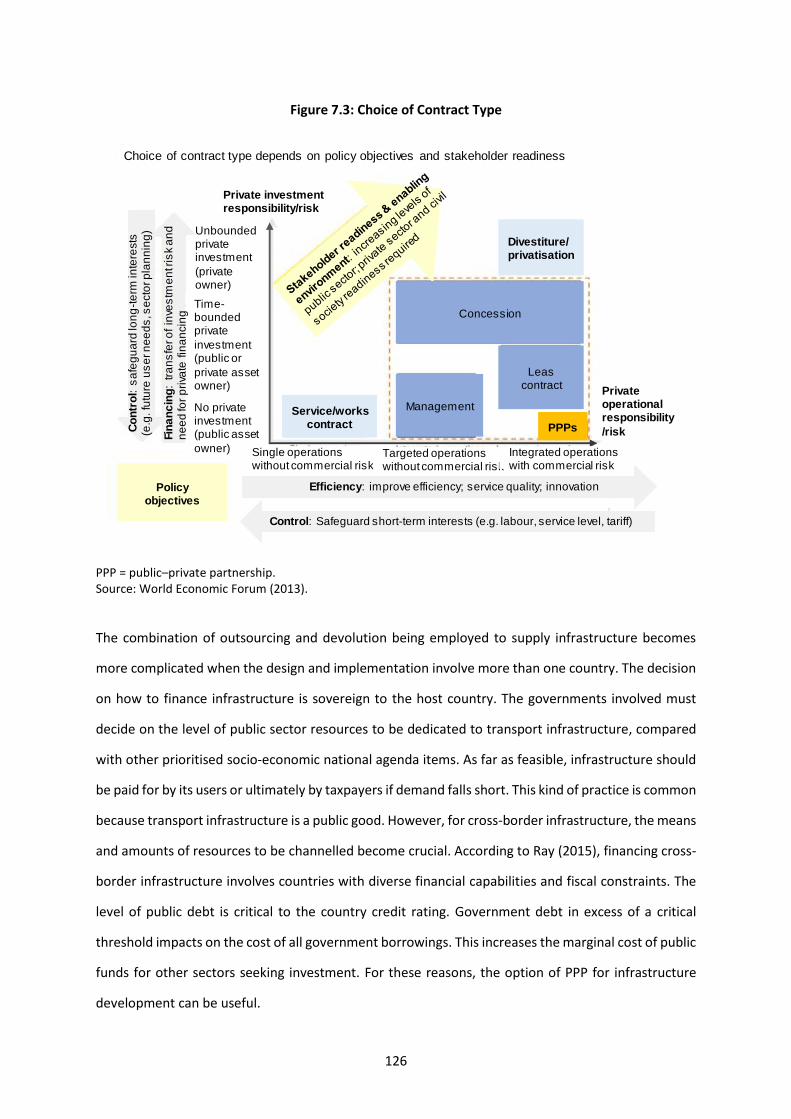
companies, and private owner–operators. The choice of contract type depends on the policy
objectives and degree of stakeholder readiness, as shown in Figure 7.3.
JEHDRA
Expressway companies
(including C−NEXCO)
Revenues from other activities
License fee
Leasing expressway assets
Toll revenue
Operating and maintenance cost
Expressway companies are supposed not to make any profit or loss by expressway
operation
Rest area business
Travel business
Credit card business
Consulting etc.
They are allowed to make profits only by other business such as rest area management.
126
Figure 7.3: Choice of Contract Type
PPP = public–private partnership. Source: World Economic Forum (2013).
The combination of outsourcing and devolution being employed to supply infrastructure becomes
more complicated when the design and implementation involve more than one country. The decision
on how to finance infrastructure is sovereign to the host country. The governments involved must
decide on the level of public sector resources to be dedicated to transport infrastructure, compared
with other prioritised socio-economic national agenda items. As far as feasible, infrastructure should
be paid for by its users or ultimately by taxpayers if demand falls short. This kind of practice is common
because transport infrastructure is a public good. However, for cross-border infrastructure, the means
and amounts of resources to be channelled become crucial. According to Ray (2015), financing cross-
border infrastructure involves countries with diverse financial capabilities and fiscal constraints. The
level of public debt is critical to the country credit rating. Government debt in excess of a critical
threshold impacts on the cost of all government borrowings. This increases the marginal cost of public
funds for other sectors seeking investment. For these reasons, the option of PPP for infrastructure
development can be useful.
Choice of contract type depends on policy objectives and stakeholder readiness
Private investment responsibility/risk
Unboundedprivate investment
(private owner)
No privateinvestment(public asset
owner)
Time-bounded private
investment (public or
private asset owner) Private
operationalresponsibility
/risk
Efficiency: improve efficiency; service quality; innovation
Control: Safeguard short-term interests (e.g. labour, service level, tariff)
Policyobjectives
Divestiture/privatisation
Concession
Management
Leascontract
Service/workscontractC
on
tro
l: s
afe
gu
ard
lon
g-t
erm
inte
rests
(e
.g. fu
ture
us
er n
ee
ds
, se
cto
r p
lan
nin
g)
Fin
an
cin
g:
tra
ns
fer o
f in
ves
tme
nt r
isk a
nd
n
ee
d fo
r p
riva
te f
ina
ncin
g
PPPs
Single operationswithout commercial risk
Targeted operations without commercial risk
Integrated operations with commercial risk
127
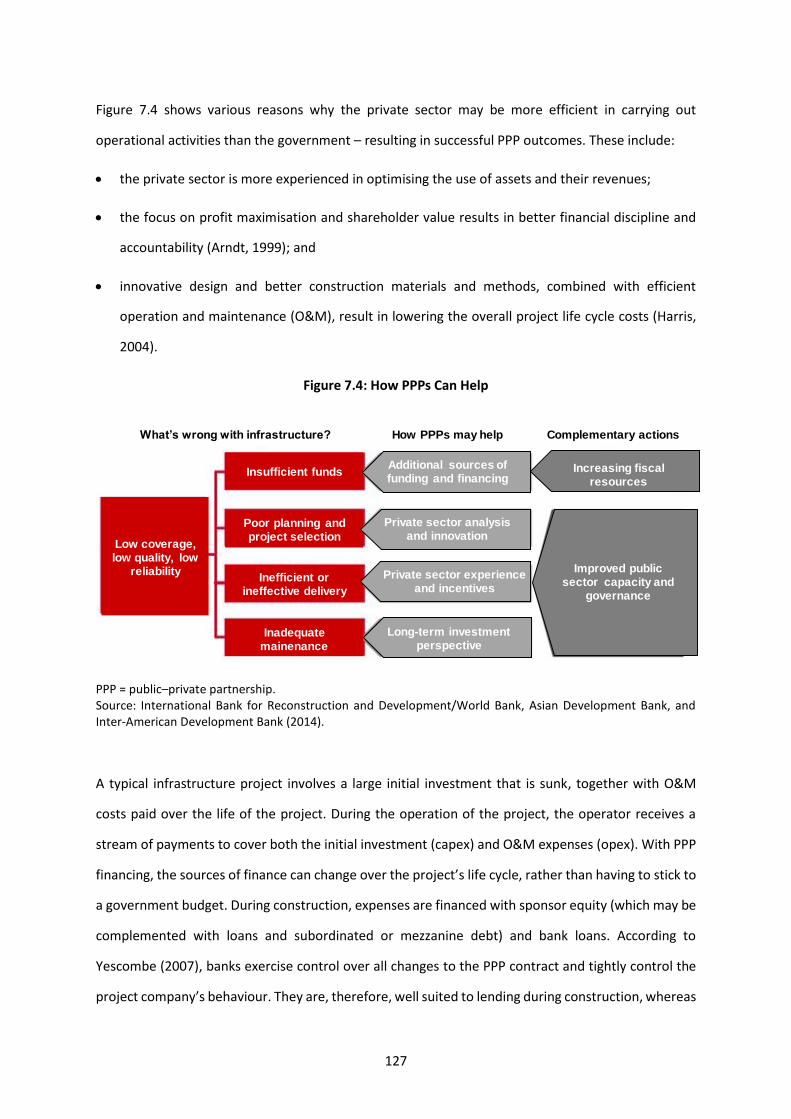
Figure 7.4 shows various reasons why the private sector may be more efficient in carrying out
operational activities than the government – resulting in successful PPP outcomes. These include:
• the private sector is more experienced in optimising the use of assets and their revenues;
• the focus on profit maximisation and shareholder value results in better financial discipline and
accountability (Arndt, 1999); and
• innovative design and better construction materials and methods, combined with efficient
operation and maintenance (O&M), result in lowering the overall project life cycle costs (Harris,
2004).
Figure 7.4: How PPPs Can Help
PPP = public–private partnership. Source: International Bank for Reconstruction and Development/World Bank, Asian Development Bank, and Inter-American Development Bank (2014).
A typical infrastructure project involves a large initial investment that is sunk, together with O&M
costs paid over the life of the project. During the operation of the project, the operator receives a
stream of payments to cover both the initial investment (capex) and O&M expenses (opex). With PPP
financing, the sources of finance can change over the project’s life cycle, rather than having to stick to
a government budget. During construction, expenses are financed with sponsor equity (which may be
complemented with loans and subordinated or mezzanine debt) and bank loans. According to
Yescombe (2007), banks exercise control over all changes to the PPP contract and tightly control the
project company’s behaviour. They are, therefore, well suited to lending during construction, whereas
Low coverage, low quality, low
reliability
Insufficient funds
Poor planning and project selection
Inefficient or ineffective delivery
Inadequate mainenance
Additional sources of funding and financing
Private sector analysis and innovation
Private sector experience and incentives
Long-term investment perspective
Increasing fiscal resources
Improved public sector capacity and
governance
What’s wrong with infrastructure? How PPPs may help Complementary actions
128
bondholders are better suited to financing the project during its operational phase. This is because
bondholders only have control over issues that may significantly affect the security of cash flows.
Regarding sharing of public–private financial commitments, the challenge is how to reach a reasonable
agreement when the operation is socio-economically beneficial but not financially viable. This is
common amongst various types of infrastructure development projects and is particularly true for
transport infrastructure development. Infrastructure is designed for a long economic life, while its
traffic only builds up gradually to the design capacity. This creates a host of risks and returns, and
suggests that the revenue stream from operations may fall short. It is also common for the
government to contribute to the funding of infrastructure projects from its budget pool at the expense
of other public services. It would be different, however, if the capital market offered financing on a
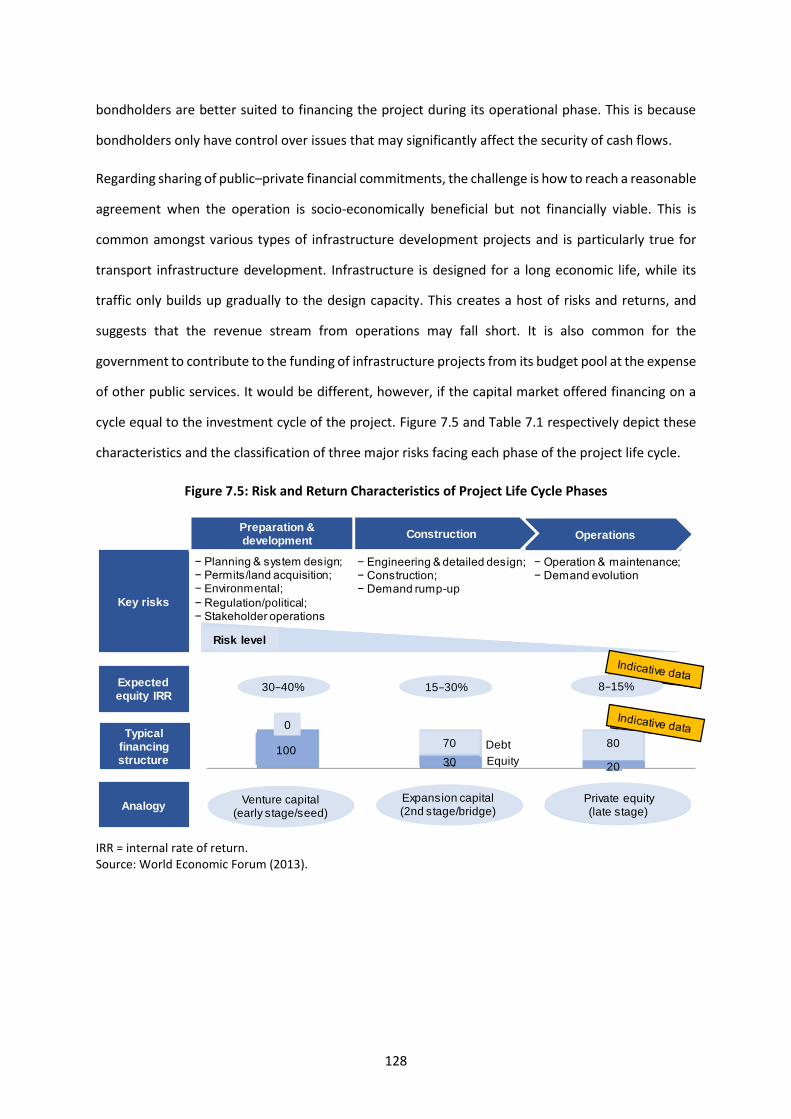
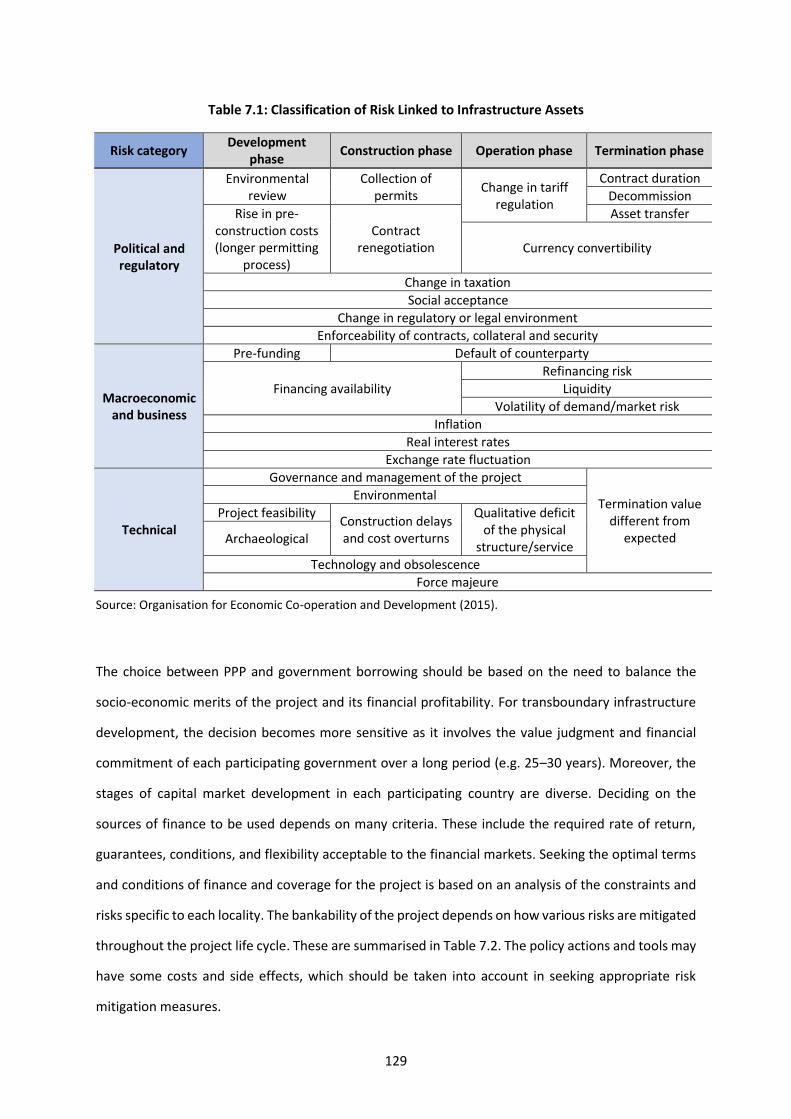
cycle equal to the investment cycle of the project. Figure 7.5 and Table 7.1 respectively depict these
characteristics and the classification of three major risks facing each phase of the project life cycle.
Figure 7.5: Risk and Return Characteristics of Project Life Cycle Phases
IRR = internal rate of return. Source: World Economic Forum (2013).
Key risks
Expected equity IRR
Typical financing structure
Analogy
Preparation & development
Operations Construction
− Planning & system design; − Permits/land acquisition; − Environmental;
− Regulation/political;− Stakeholder operations
− Engineering & detailed design; − Construction; − Demand rump-up
− Operation & maintenance; − Demand evolution
30−40% 15−30% 8−15%
Risk level
0
10070
30
80
20
Venture capital(early stage/seed)
Expansion capital(2nd stage/bridge)
Private equity(late stage)
Debt
Equity
129
Table 7.1: Classification of Risk Linked to Infrastructure Assets
Risk category Development
phase Construction phase Operation phase Termination phase
Political and regulatory
Environmental review
Collection of permits
Change in tariff regulation
Contract duration
Decommission
Rise in pre-construction costs (longer permitting
process)
Contract renegotiation
Asset transfer
Currency convertibility
Change in taxation
Social acceptance
Change in regulatory or legal environment
Enforceability of contracts, collateral and security
Macroeconomic and business
Pre-funding Default of counterparty
Financing availability
Refinancing risk
Liquidity
Volatility of demand/market risk
Inflation
Real interest rates
Exchange rate fluctuation
Technical
Governance and management of the project
Termination value different from
expected
Environmental
Project feasibility Construction delays and cost overturns
Qualitative deficit of the physical
structure/service Archaeological
Technology and obsolescence
Force majeure
Source: Organisation for Economic Co-operation and Development (2015).
The choice between PPP and government borrowing should be based on the need to balance the
socio-economic merits of the project and its financial profitability. For transboundary infrastructure
development, the decision becomes more sensitive as it involves the value judgment and financial
commitment of each participating government over a long period (e.g. 25–30 years). Moreover, the
stages of capital market development in each participating country are diverse. Deciding on the
sources of finance to be used depends on many criteria. These include the required rate of return,
guarantees, conditions, and flexibility acceptable to the financial markets. Seeking the optimal terms
and conditions of finance and coverage for the project is based on an analysis of the constraints and
risks specific to each locality. The bankability of the project depends on how various risks are mitigated
throughout the project life cycle. These are summarised in Table 7.2. The policy actions and tools may
have some costs and side effects, which should be taken into account in seeking appropriate risk
mitigation measures.
130
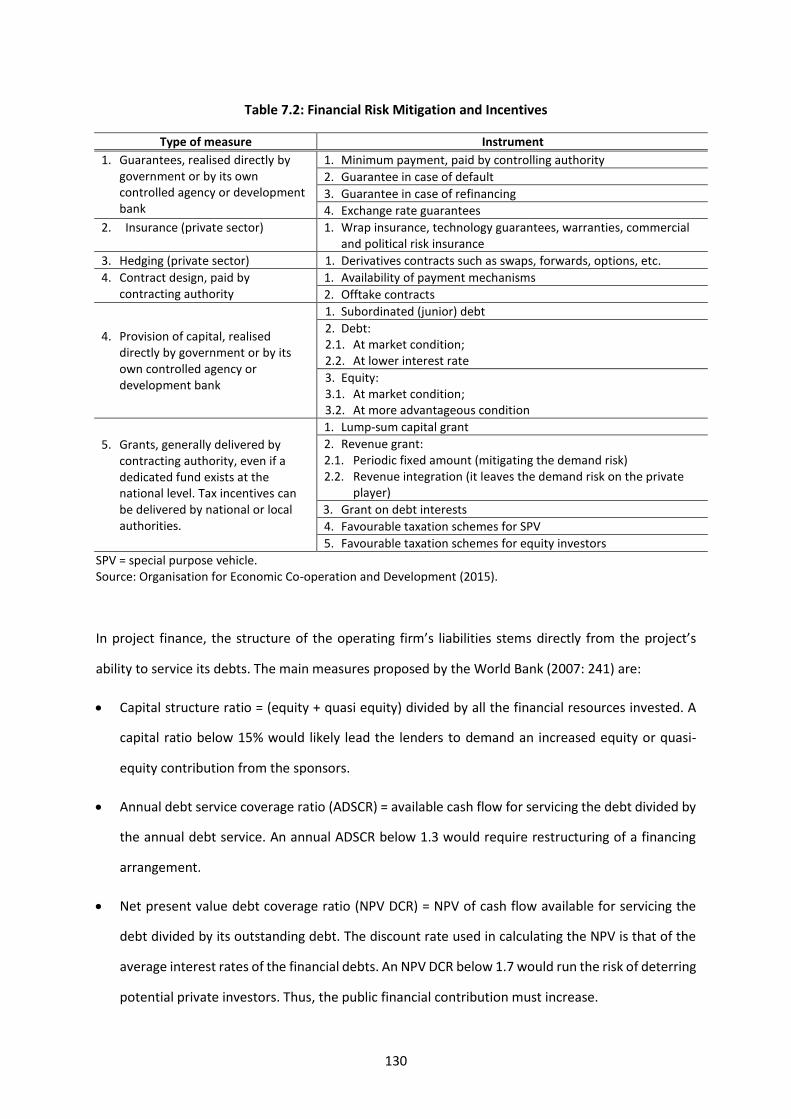
Table 7.2: Financial Risk Mitigation and Incentives
Type of measure Instrument
1. Guarantees, realised directly by government or by its own controlled agency or development bank
1. Minimum payment, paid by controlling authority
2. Guarantee in case of default
3. Guarantee in case of refinancing
4. Exchange rate guarantees
2. Insurance (private sector) 1. Wrap insurance, technology guarantees, warranties, commercial and political risk insurance
3. Hedging (private sector) 1. Derivatives contracts such as swaps, forwards, options, etc.
4. Contract design, paid by contracting authority
1. Availability of payment mechanisms
2. Offtake contracts
4. Provision of capital, realised directly by government or by its own controlled agency or development bank
1. Subordinated (junior) debt
2. Debt: 2.1. At market condition; 2.2. At lower interest rate
3. Equity: 3.1. At market condition; 3.2. At more advantageous condition
5. Grants, generally delivered by contracting authority, even if a dedicated fund exists at the national level. Tax incentives can be delivered by national or local authorities.
1. Lump-sum capital grant
2. Revenue grant: 2.1. Periodic fixed amount (mitigating the demand risk) 2.2. Revenue integration (it leaves the demand risk on the private
player)
3. Grant on debt interests
4. Favourable taxation schemes for SPV
5. Favourable taxation schemes for equity investors
SPV = special purpose vehicle. Source: Organisation for Economic Co-operation and Development (2015).
In project finance, the structure of the operating firm’s liabilities stems directly from the project’s
ability to service its debts. The main measures proposed by the World Bank (2007: 241) are:
• Capital structure ratio = (equity + quasi equity) divided by all the financial resources invested. A
capital ratio below 15% would likely lead the lenders to demand an increased equity or quasi-
equity contribution from the sponsors.
• Annual debt service coverage ratio (ADSCR) = available cash flow for servicing the debt divided by
the annual debt service. An annual ADSCR below 1.3 would require restructuring of a financing
arrangement.
• Net present value debt coverage ratio (NPV DCR) = NPV of cash flow available for servicing the
debt divided by its outstanding debt. The discount rate used in calculating the NPV is that of the
average interest rates of the financial debts. An NPV DCR below 1.7 would run the risk of deterring
potential private investors. Thus, the public financial contribution must increase.
131
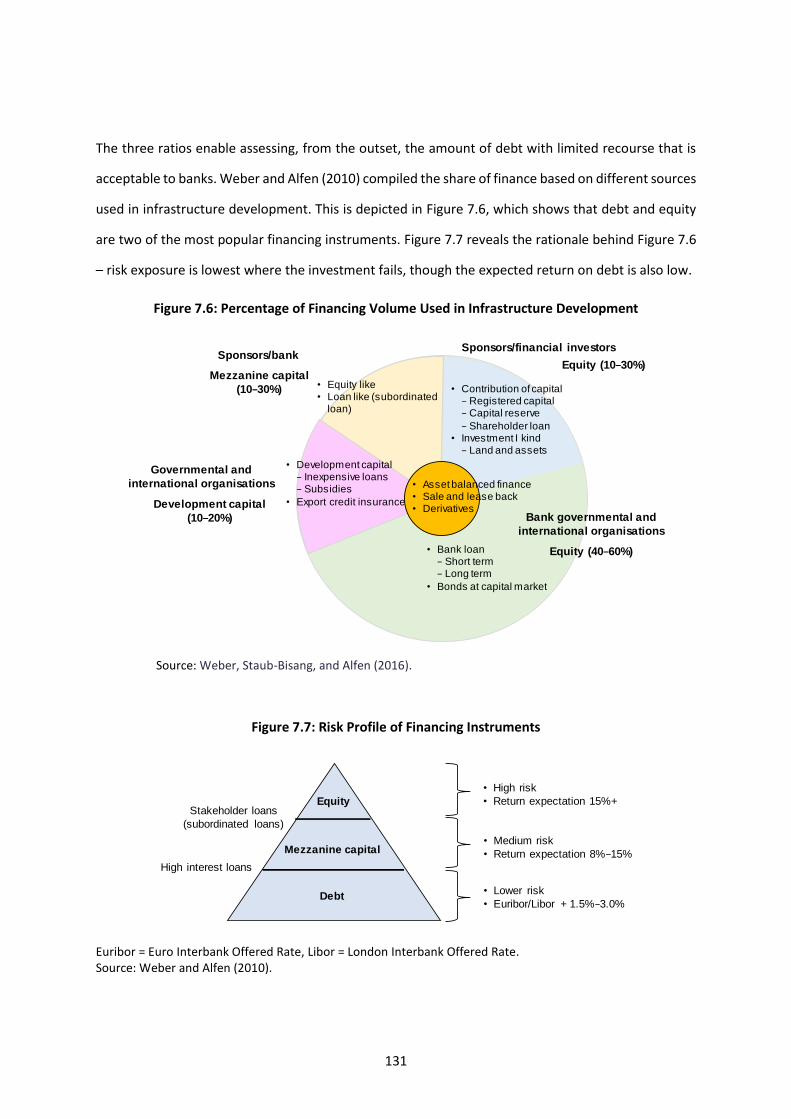
The three ratios enable assessing, from the outset, the amount of debt with limited recourse that is
acceptable to banks. Weber and Alfen (2010) compiled the share of finance based on different sources
used in infrastructure development. This is depicted in Figure 7.6, which shows that debt and equity
are two of the most popular financing instruments. Figure 7.7 reveals the rationale behind Figure 7.6
– risk exposure is lowest where the investment fails, though the expected return on debt is also low.
Figure 7.6: Percentage of Financing Volume Used in Infrastructure Development
Source: Weber, Staub-Bisang, and Alfen (2016).
Figure 7.7: Risk Profile of Financing Instruments
Euribor = Euro Interbank Offered Rate, Libor = London Interbank Offered Rate. Source: Weber and Alfen (2010).
• Bank loan− Short term− Long term
• Bonds at capital market
• Contribution of capital− Registered capital− Capital reserve
− Shareholder loan• Investment I kind
− Land and assets
• Equity like• Loan like (subordinated
loan)
• Development capital− Inexpensive loans− Subsidies
• Export credit insurance
• Asset balanced finance• Sale and lease back• Derivatives
Sponsors/financial investors
Equity (10−30%)
Bank governmental and
international organisations
Equity (40−60%)
Governmental and
international organisations
Development capital
(10−20%)
Sponsors/bank
Mezzanine capital
(10−30%)
Debt
Mezzanine capital
EquityStakeholder loans
(subordinated loans)
High interest loans
• Lower risk
• Euribor/Libor + 1.5%−3.0%
• Medium risk
• Return expectation 8%−15%
• High risk
• Return expectation 15%+
132
4. Financing the Provision of Infrastructure
Yescombe (2007) pointed out that a financial technique called project finance, based on lending
against the cash flow of a project, is both legally and economically self-contained. Some economic
characteristics of most PPP projects include (i) high sunk costs with little value for the alternative usage,
(ii) subcontracted tasks during construction and operation, and (iii) efficient bundling of construction
and operation. Bundling incentivises investors to internalise O&M costs at the design stage to ensure
that the project life cycle costs are minimised. The growth and spread of PPPs are thus closely linked
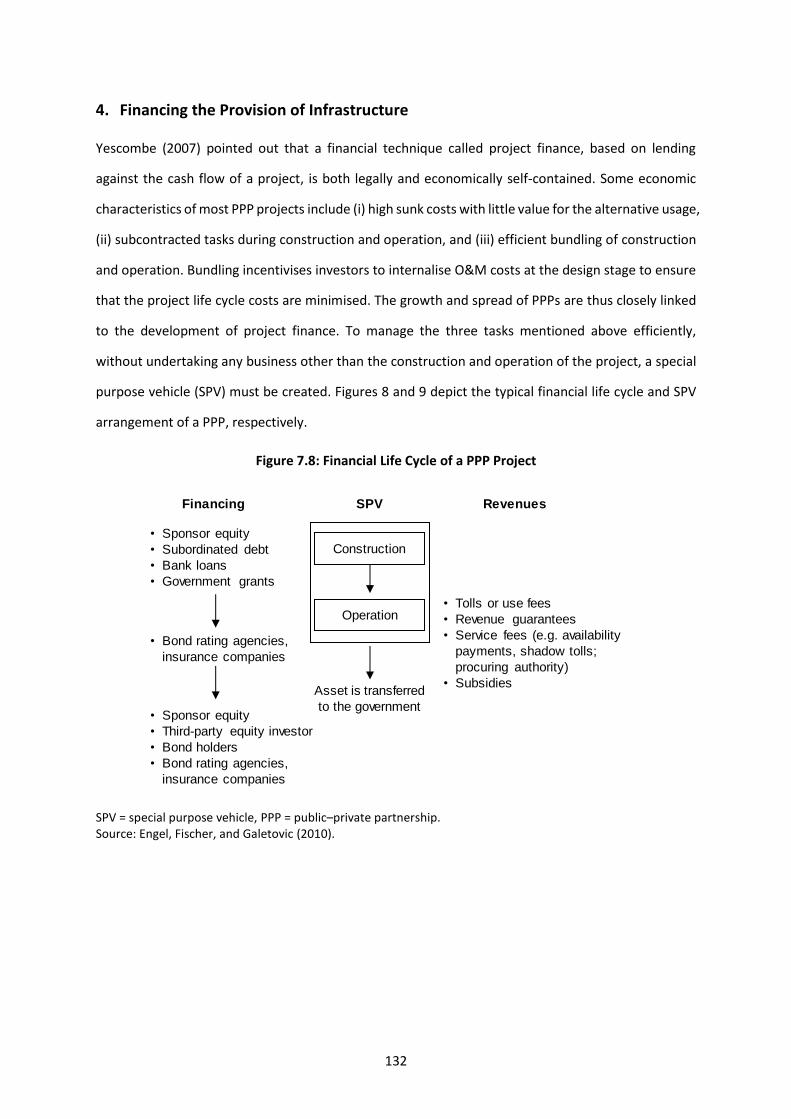
to the development of project finance. To manage the three tasks mentioned above efficiently,
without undertaking any business other than the construction and operation of the project, a special
purpose vehicle (SPV) must be created. Figures 8 and 9 depict the typical financial life cycle and SPV
arrangement of a PPP, respectively.
Figure 7.8: Financial Life Cycle of a PPP Project
SPV = special purpose vehicle, PPP = public–private partnership. Source: Engel, Fischer, and Galetovic (2010).
Construction
Operation
SPV
• Tolls or use fees
• Revenue guarantees
• Service fees (e.g. availability
payments, shadow tolls;
procuring authority)
• Subsidies
Revenues
Asset is transferred
to the government
• Sponsor equity
• Subordinated debt
• Bank loans
• Government grants
• Bond rating agencies,
insurance companies
Financing
• Sponsor equity
• Third-party equity investor
• Bond holders
• Bond rating agencies,
insurance companies
133
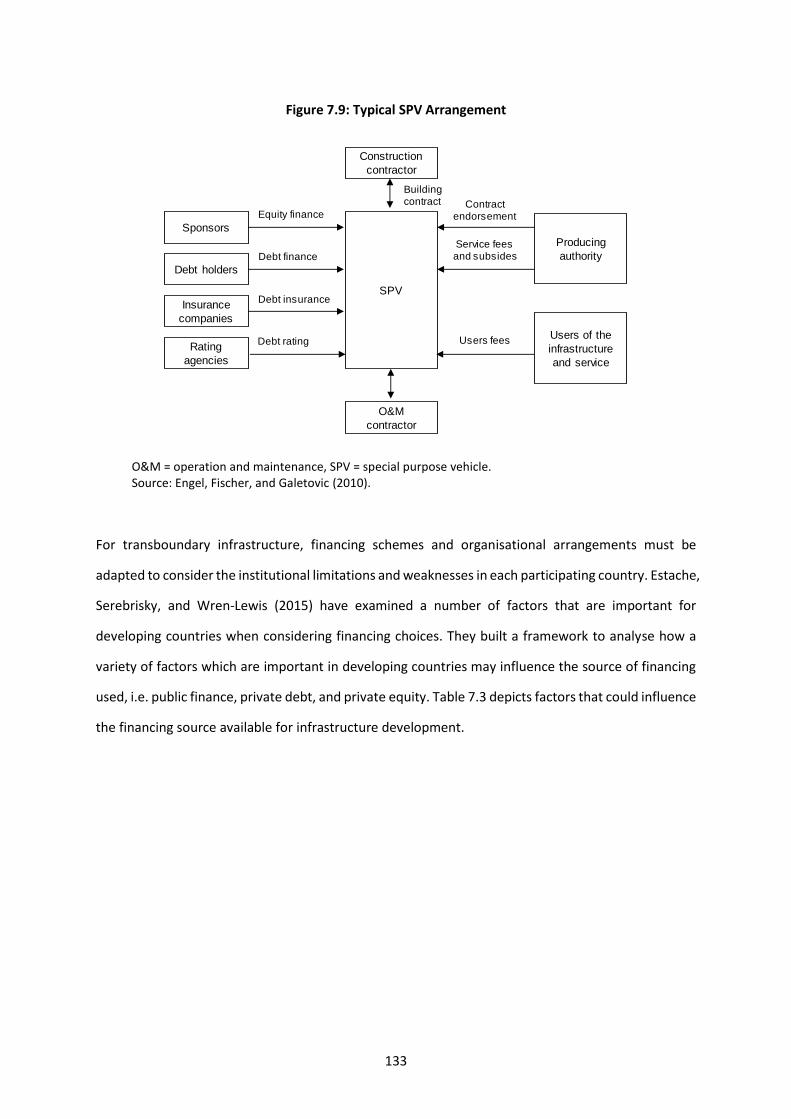
Figure 7.9: Typical SPV Arrangement
O&M = operation and maintenance, SPV = special purpose vehicle. Source: Engel, Fischer, and Galetovic (2010).
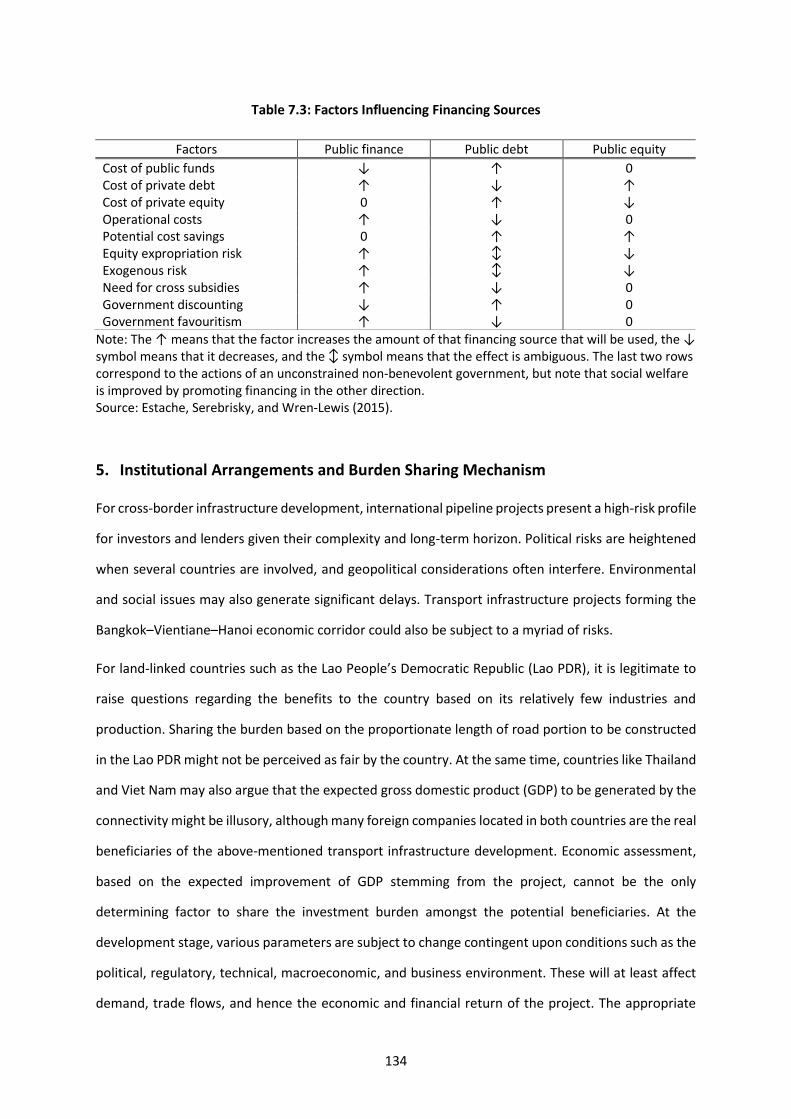
For transboundary infrastructure, financing schemes and organisational arrangements must be
adapted to consider the institutional limitations and weaknesses in each participating country. Estache,
Serebrisky, and Wren-Lewis (2015) have examined a number of factors that are important for
developing countries when considering financing choices. They built a framework to analyse how a
variety of factors which are important in developing countries may influence the source of financing
used, i.e. public finance, private debt, and private equity. Table 7.3 depicts factors that could influence
the financing source available for infrastructure development.
Construction
contractor
O&M
contractor
Building contract
Sponsors
Debt holders
Insurance
companies
Rating
agencies
Equity finance
Debt finance
Debt insurance
Debt rating
SPV
Contractendorsement
Service fees and subsides
Users fees
Producing
authority
Users of the
infrastructure
and service
134
Table 7.3: Factors Influencing Financing Sources
Note: The ↑ means that the factor increases the amount of that financing source that will be used, the ↓ symbol means that it decreases, and the ↕ symbol means that the effect is ambiguous. The last two rows correspond to the actions of an unconstrained non-benevolent government, but note that social welfare is improved by promoting financing in the other direction. Source: Estache, Serebrisky, and Wren-Lewis (2015).
5. Institutional Arrangements and Burden Sharing Mechanism
For cross-border infrastructure development, international pipeline projects present a high-risk profile
for investors and lenders given their complexity and long-term horizon. Political risks are heightened
when several countries are involved, and geopolitical considerations often interfere. Environmental
and social issues may also generate significant delays. Transport infrastructure projects forming the
Bangkok–Vientiane–Hanoi economic corridor could also be subject to a myriad of risks.
For land-linked countries such as the Lao People’s Democratic Republic (Lao PDR), it is legitimate to
raise questions regarding the benefits to the country based on its relatively few industries and
production. Sharing the burden based on the proportionate length of road portion to be constructed
in the Lao PDR might not be perceived as fair by the country. At the same time, countries like Thailand
and Viet Nam may also argue that the expected gross domestic product (GDP) to be generated by the
connectivity might be illusory, although many foreign companies located in both countries are the real
beneficiaries of the above-mentioned transport infrastructure development. Economic assessment,
based on the expected improvement of GDP stemming from the project, cannot be the only
determining factor to share the investment burden amongst the potential beneficiaries. At the
development stage, various parameters are subject to change contingent upon conditions such as the
political, regulatory, technical, macroeconomic, and business environment. These will at least affect
demand, trade flows, and hence the economic and financial return of the project. The appropriate
Factors Public finance Public debt Public equity
Cost of public funds ↓ ↑ 0 Cost of private debt ↑ ↓ ↑ Cost of private equity 0 ↑ ↓ Operational costs ↑ ↓ 0 Potential cost savings 0 ↑ ↑ Equity expropriation risk ↑ ↕ ↓ Exogenous risk ↑ ↕ ↓ Need for cross subsidies ↑ ↓ 0 Government discounting ↓ ↑ 0 Government favouritism ↑ ↓ 0
135
approach to deal with various inherent uncertainties is to set up an enterprise that is flexible enough
to adapt to the changing conditions, yet able to ensure that the interests of stakeholders are well
represented.
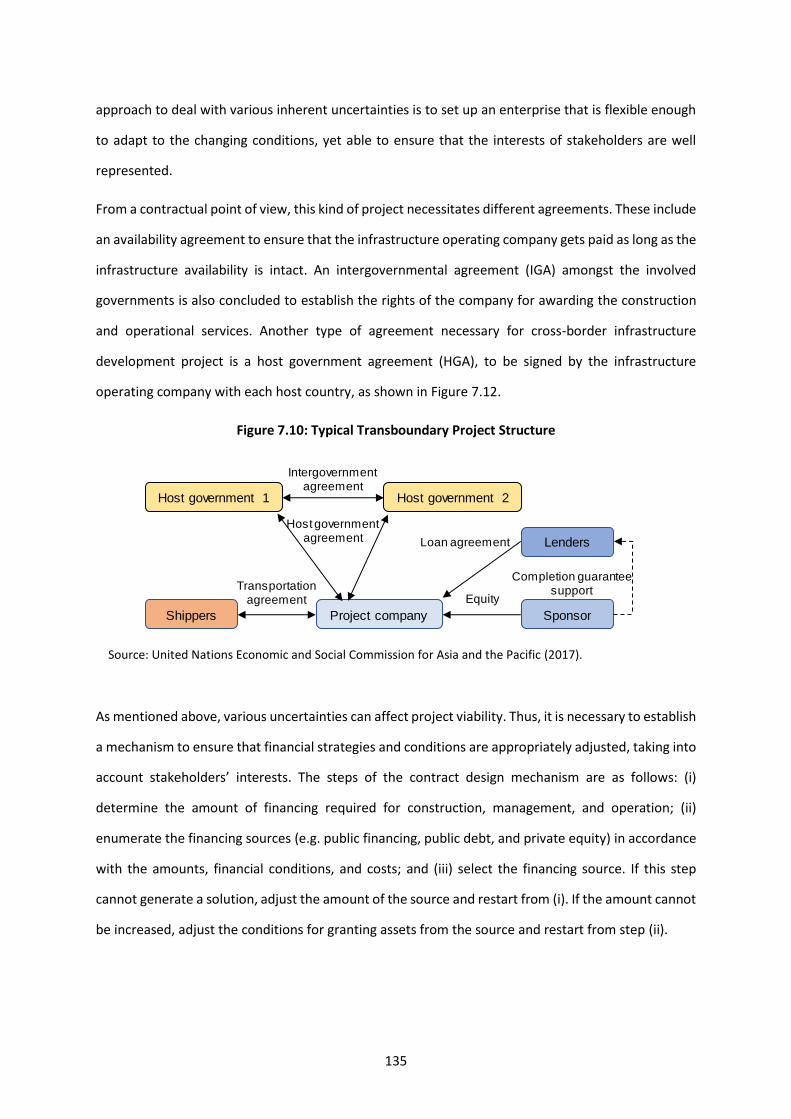
From a contractual point of view, this kind of project necessitates different agreements. These include
an availability agreement to ensure that the infrastructure operating company gets paid as long as the
infrastructure availability is intact. An intergovernmental agreement (IGA) amongst the involved
governments is also concluded to establish the rights of the company for awarding the construction
and operational services. Another type of agreement necessary for cross-border infrastructure
development project is a host government agreement (HGA), to be signed by the infrastructure
operating company with each host country, as shown in Figure 7.12.
Figure 7.10: Typical Transboundary Project Structure
Source: United Nations Economic and Social Commission for Asia and the Pacific (2017).
As mentioned above, various uncertainties can affect project viability. Thus, it is necessary to establish
a mechanism to ensure that financial strategies and conditions are appropriately adjusted, taking into
account stakeholders’ interests. The steps of the contract design mechanism are as follows: (i)
determine the amount of financing required for construction, management, and operation; (ii)
enumerate the financing sources (e.g. public financing, public debt, and private equity) in accordance
with the amounts, financial conditions, and costs; and (iii) select the financing source. If this step
cannot generate a solution, adjust the amount of the source and restart from (i). If the amount cannot
be increased, adjust the conditions for granting assets from the source and restart from step (ii).
Host government 1 Host government 2
Transportation agreement
Shippers Project company Sponsor
Lenders
Intergovernmentagreement
Equity
Loan agreement
Host government agreement
Completion guarantee support
136
It should be noted that the financing strategy mentioned is necessary but not sufficient to ensure
successful project implementation. A good contract design has a clear allocation of responsibilities
and risks between stakeholders, a workable price adjustment mechanism, performance-based
measurement, fair rewards and penalties, appropriate contract duration, and a dispute settlement
mechanism, all of which should be considered.
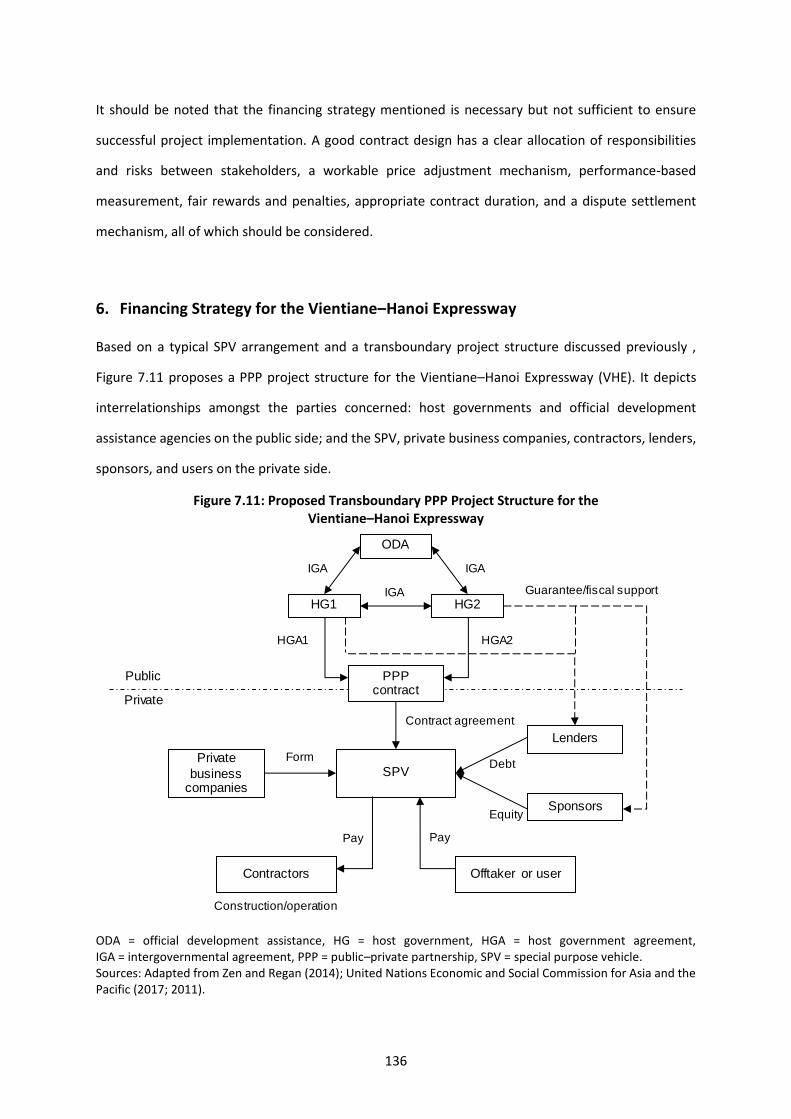
6. Financing Strategy for the Vientiane–Hanoi Expressway
Based on a typical SPV arrangement and a transboundary project structure discussed previously ,
Figure 7.11 proposes a PPP project structure for the Vientiane–Hanoi Expressway (VHE). It depicts
interrelationships amongst the parties concerned: host governments and official development
assistance agencies on the public side; and the SPV, private business companies, contractors, lenders,
sponsors, and users on the private side.
Figure 7.11: Proposed Transboundary PPP Project Structure for the Vientiane–Hanoi Expressway
ODA = official development assistance, HG = host government, HGA = host government agreement, IGA = intergovernmental agreement, PPP = public–private partnership, SPV = special purpose vehicle. Sources: Adapted from Zen and Regan (2014); United Nations Economic and Social Commission for Asia and the Pacific (2017; 2011).
ODA
HG1 HG2
PPPcontract
IGAIGA
IGA
SPVPrivate
business companies
Form
Lenders
Sponsors
Debt
Equity
Contract agreement
HGA2HGA1
Guarantee/fiscal support
Public
Private
Offtaker or userContractors
Construction/operation
PayPay
137
The public side has two types of agreement: the IGA and the HGA. Both agreements aim to assist in
facilitating project-specific negotiations and implementation, which make infrastructure projects
foreseeable and transparent with respect to practices in cross-border infrastructure construction,
operation, and investment. The alignment of both agreements is a necessary condition to shorten the
lead time for the mobilisation of project-specific investment. This results in a reduction in the cost of
project implementation. It is important to emphasise that the IGA and HGA are interdependent and
are designed to represent a single package.
The IGA represents a treaty model which is governed by public international law. The treaty spells out
the interrelationships amongst the states through whose territories an identified portion of the
infrastructure system is to be constructed and operated. Issues dealt with by the IGA model include
co-operation, the provision of land rights, the harmonisation of tax structures applicable to the project,
and issues relevant to project implementation. On the other hand, the HGA model is an agreement
between each state within whose territory a portion of the infrastructure system is to be realised and
the project investors. The HGA model deals mainly with issues concerning the project activities within
the territory of each state. The entry into force of the HGA is conditioned on the IGA by expanding on
some of the issues identified in the IGA model. Issues dealt with in the HGA model include various
governmental obligations (e.g. guarantee and fiscal support), investor duties, environmental and
other relevant standards, liability, termination, and issues relevant to the implementation of the
project in each territory.
It is important to note that the two models have to be structured with the aim of striking a reasonable
balance between the obligations of the public side wishing to attract essential and/or competitive
investment and the rights of private investors prepared to invest. The underlying principle is to
enhance a sustainable allocation of risk (refer to previous discussion regarding Figures 5 and Tables 1
and 2) and fairness in the distribution of the overall benefits amongst parties engaged in the project.
The development of international transport and logistics includes the three dimensions of
interconnectivity, interoperability, and market access. Increasingly, governments seek to cooperate
across borders on transportation. The IGA and HGA facilitate the harmonisation of transport
infrastructure as the interoperability dimension. Consequently, increasing cross-border transportation
enhances performance and utilisation, such as cost and time reductions.
138
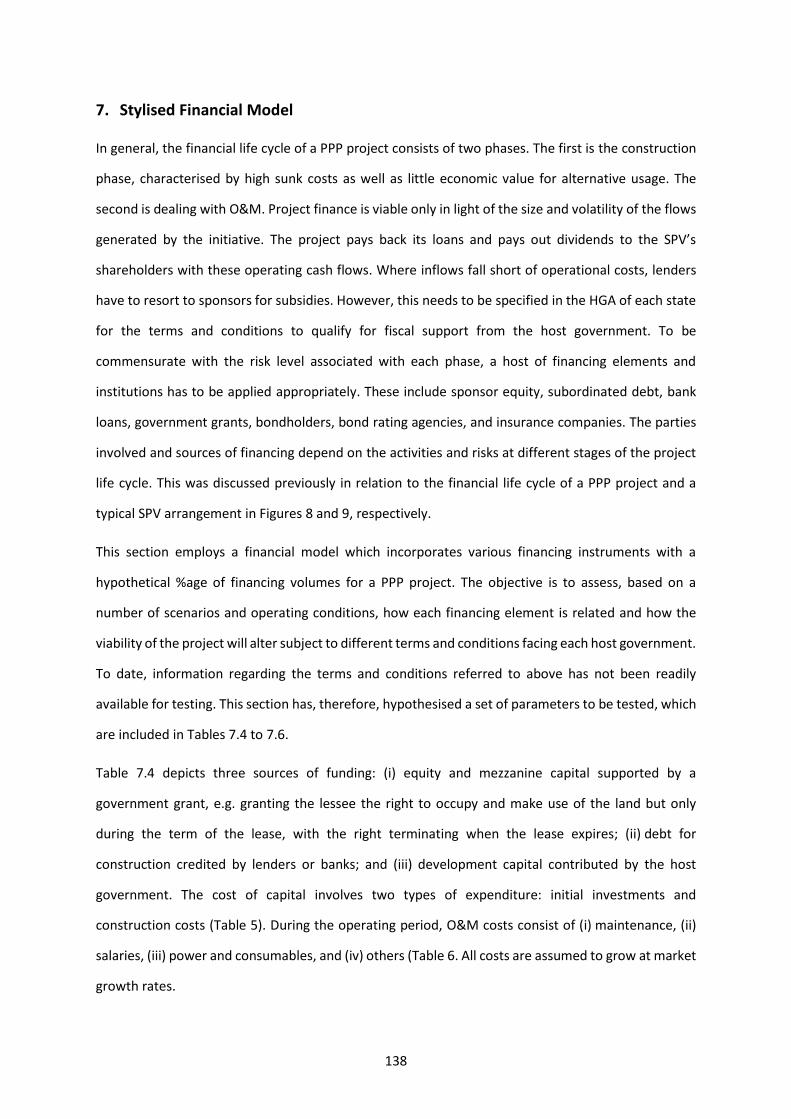
7. Stylised Financial Model
In general, the financial life cycle of a PPP project consists of two phases. The first is the construction
phase, characterised by high sunk costs as well as little economic value for alternative usage. The
second is dealing with O&M. Project finance is viable only in light of the size and volatility of the flows
generated by the initiative. The project pays back its loans and pays out dividends to the SPV’s
shareholders with these operating cash flows. Where inflows fall short of operational costs, lenders
have to resort to sponsors for subsidies. However, this needs to be specified in the HGA of each state
for the terms and conditions to qualify for fiscal support from the host government. To be
commensurate with the risk level associated with each phase, a host of financing elements and
institutions has to be applied appropriately. These include sponsor equity, subordinated debt, bank
loans, government grants, bondholders, bond rating agencies, and insurance companies. The parties
involved and sources of financing depend on the activities and risks at different stages of the project
life cycle. This was discussed previously in relation to the financial life cycle of a PPP project and a
typical SPV arrangement in Figures 8 and 9, respectively.
This section employs a financial model which incorporates various financing instruments with a
hypothetical %age of financing volumes for a PPP project. The objective is to assess, based on a
number of scenarios and operating conditions, how each financing element is related and how the
viability of the project will alter subject to different terms and conditions facing each host government.
To date, information regarding the terms and conditions referred to above has not been readily
available for testing. This section has, therefore, hypothesised a set of parameters to be tested, which
are included in Tables 7.4 to 7.6.
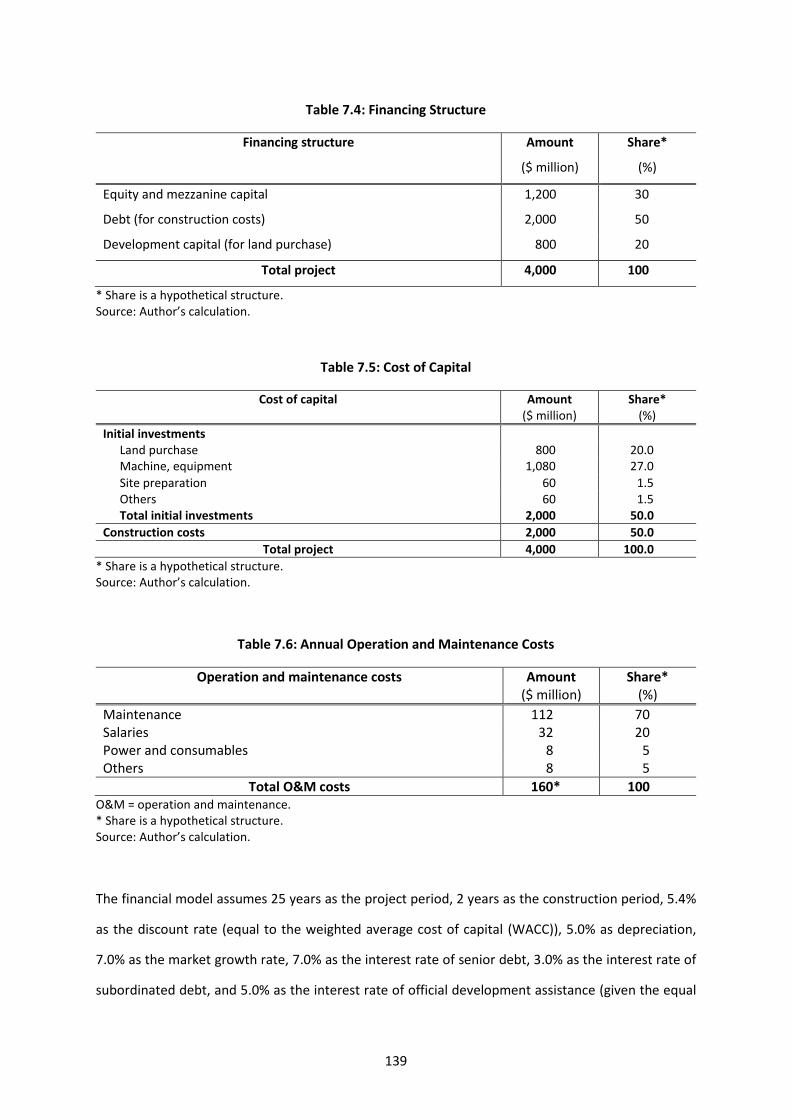
Table 7.4 depicts three sources of funding: (i) equity and mezzanine capital supported by a
government grant, e.g. granting the lessee the right to occupy and make use of the land but only
during the term of the lease, with the right terminating when the lease expires; (ii) debt for
construction credited by lenders or banks; and (iii) development capital contributed by the host
government. The cost of capital involves two types of expenditure: initial investments and
construction costs (Table 5). During the operating period, O&M costs consist of (i) maintenance, (ii)
salaries, (iii) power and consumables, and (iv) others (Table 6. All costs are assumed to grow at market
growth rates.
139
Table 7.4: Financing Structure
Financing structure Amount
($ million)
Share*
(%)
Equity and mezzanine capital 1,200 30
Debt (for construction costs) 2,000 50
Development capital (for land purchase) 800 20
Total project 4,000 100
* Share is a hypothetical structure. Source: Author’s calculation.
Table 7.5: Cost of Capital
Cost of capital Amount ($ million)
Share* (%)
Initial investments Land purchase 800 20.0 Machine, equipment 1,080 27.0
Site preparation 60 1.5 Others 60 1.5 Total initial investments 2,000 50.0
Construction costs 2,000 50.0
Total project 4,000 100.0
* Share is a hypothetical structure. Source: Author’s calculation.
Table 7.6: Annual Operation and Maintenance Costs
Operation and maintenance costs Amount ($ million)
Share* (%)
Maintenance 112 70 Salaries 32 20 Power and consumables 8 5 Others 8 5
Total O&M costs 160* 100 O&M = operation and maintenance. * Share is a hypothetical structure. Source: Author’s calculation.
The financial model assumes 25 years as the project period, 2 years as the construction period, 5.4%
as the discount rate (equal to the weighted average cost of capital (WACC)), 5.0% as depreciation,
7.0% as the market growth rate, 7.0% as the interest rate of senior debt, 3.0% as the interest rate of
subordinated debt, and 5.0% as the interest rate of official development assistance (given the equal
140
interest rate for both host governments). The share of the cost of capital between host government 1
(Government of Viet Nam) and host government 2 (Government of the Lao PDR) in the SPV is assumed
to be 20:80, respectively. This share is based on the length and hence the construction cost in each
host country.
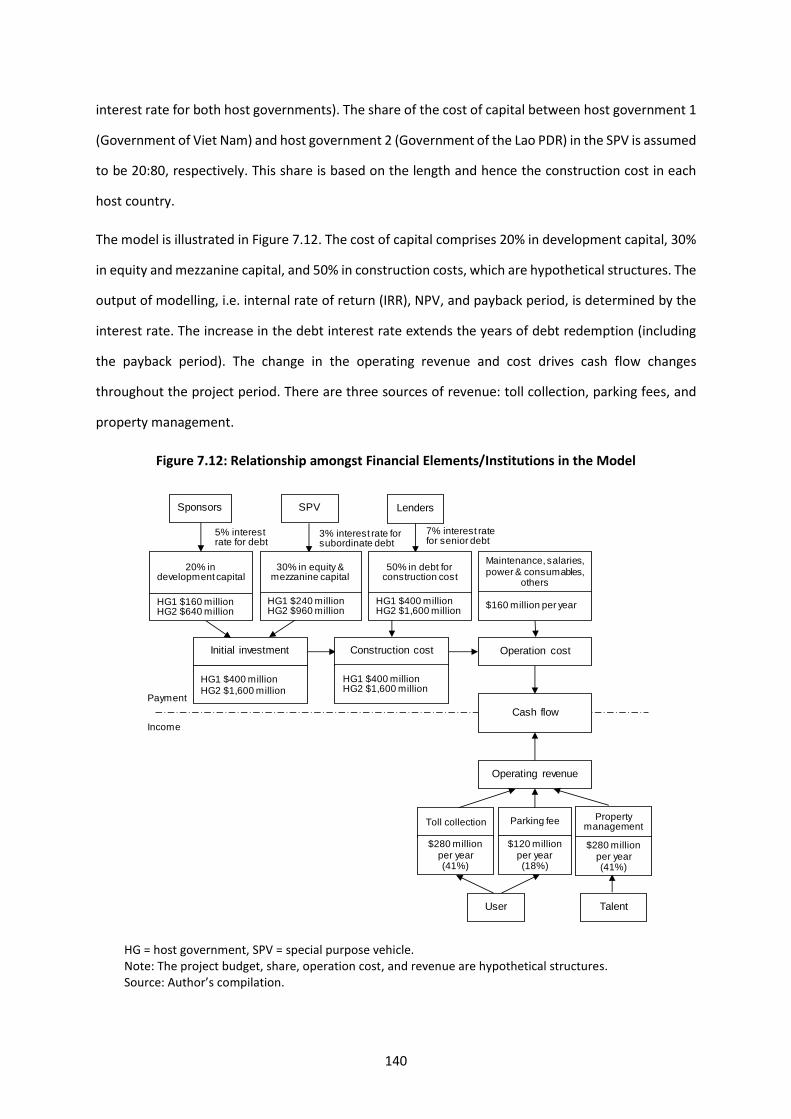
The model is illustrated in Figure 7.12. The cost of capital comprises 20% in development capital, 30%
in equity and mezzanine capital, and 50% in construction costs, which are hypothetical structures. The
output of modelling, i.e. internal rate of return (IRR), NPV, and payback period, is determined by the
interest rate. The increase in the debt interest rate extends the years of debt redemption (including
the payback period). The change in the operating revenue and cost drives cash flow changes
throughout the project period. There are three sources of revenue: toll collection, parking fees, and
property management.
Figure 7.12: Relationship amongst Financial Elements/Institutions in the Model
HG = host government, SPV = special purpose vehicle. Note: The project budget, share, operation cost, and revenue are hypothetical structures. Source: Author’s compilation.
Initial investment Construction cost Operation cost
Operating revenue
20% in development capital
30% in equity & mezzanine capital
Sponsors SPV
5% interest rate for debt
3% interest rate for subordinate debt
50% in debt for construction cost
Lenders
7% interest rate for senior debt
Maintenance, salaries, power & consumables,
others
User Talent
HG1 $400 millionHG2 $1,600 million
HG1 $400 millionHG2 $1,600 million
Cash flow
Toll collection Parking fee Property management
Payment
Income
HG1 $160 millionHG2 $640 million
HG1 $240 millionHG2 $960 million
HG1 $400 millionHG2 $1,600 million
$160 million per year
$280 million per year (41%)
$120 million per year (18%)
$280 million per year (41%)
141
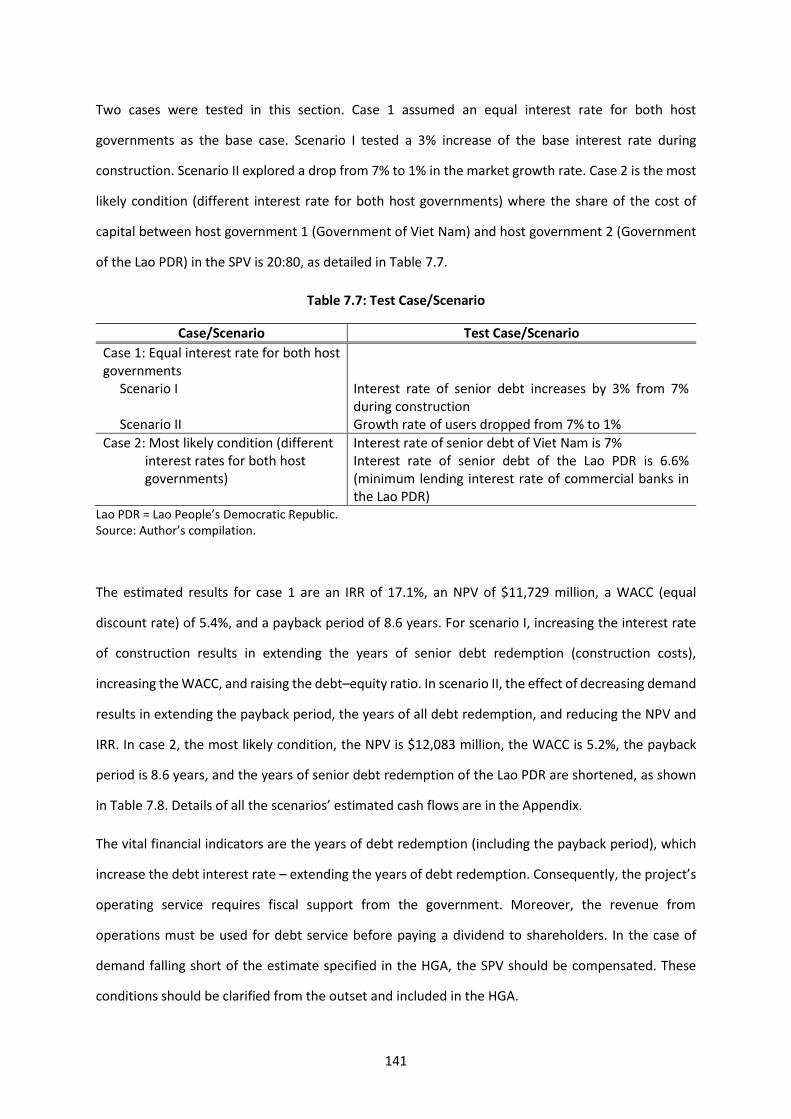
Two cases were tested in this section. Case 1 assumed an equal interest rate for both host
governments as the base case. Scenario I tested a 3% increase of the base interest rate during
construction. Scenario II explored a drop from 7% to 1% in the market growth rate. Case 2 is the most
likely condition (different interest rate for both host governments) where the share of the cost of
capital between host government 1 (Government of Viet Nam) and host government 2 (Government
of the Lao PDR) in the SPV is 20:80, as detailed in Table 7.7.
Table 7.7: Test Case/Scenario
Case/Scenario Test Case/Scenario
Case 1: Equal interest rate for both host governments
Scenario I Interest rate of senior debt increases by 3% from 7% during construction
Scenario II Growth rate of users dropped from 7% to 1%
Case 2: Most likely condition (different interest rates for both host governments)
Interest rate of senior debt of Viet Nam is 7% Interest rate of senior debt of the Lao PDR is 6.6% (minimum lending interest rate of commercial banks in the Lao PDR)
Lao PDR = Lao People’s Democratic Republic. Source: Author’s compilation.
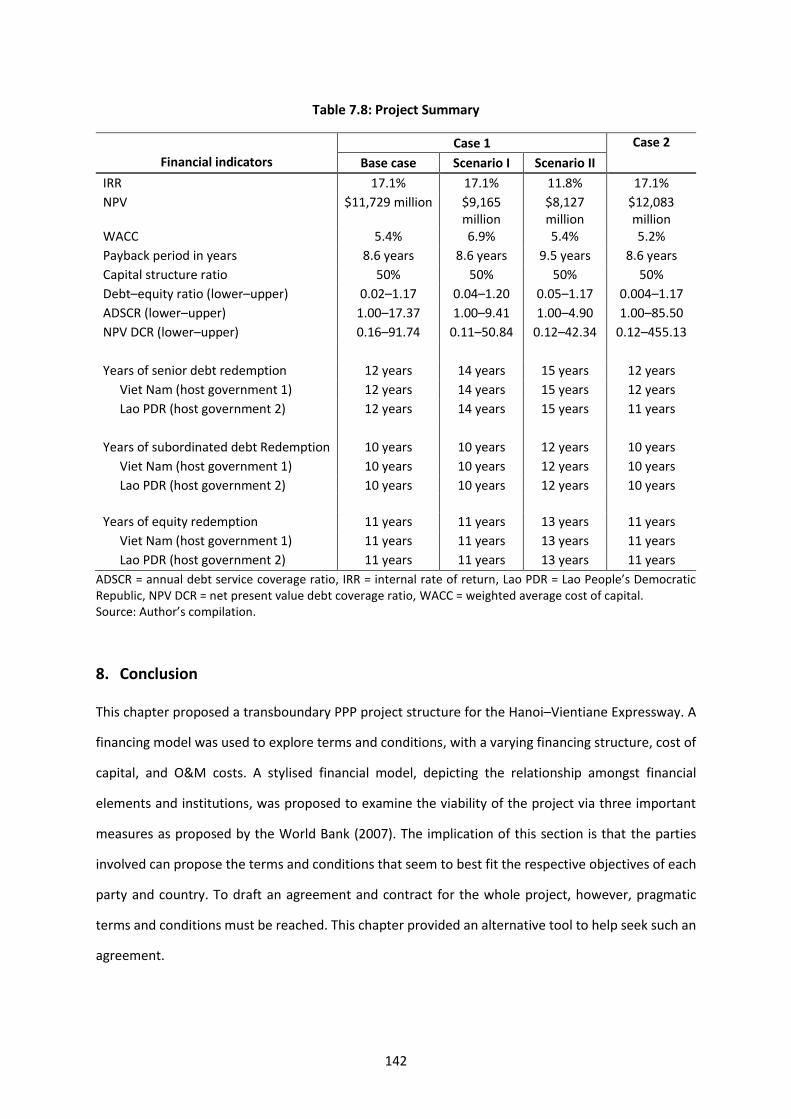
The estimated results for case 1 are an IRR of 17.1%, an NPV of $11,729 million, a WACC (equal
discount rate) of 5.4%, and a payback period of 8.6 years. For scenario I, increasing the interest rate
of construction results in extending the years of senior debt redemption (construction costs),
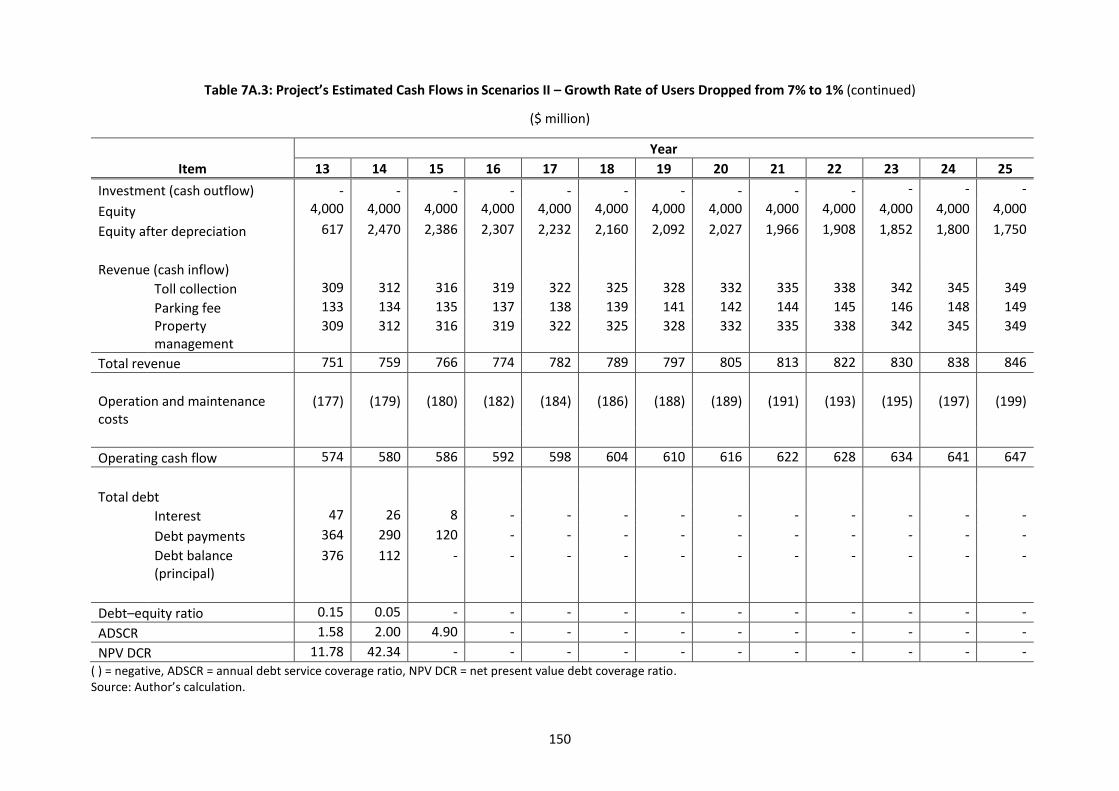
increasing the WACC, and raising the debt–equity ratio. In scenario II, the effect of decreasing demand
results in extending the payback period, the years of all debt redemption, and reducing the NPV and
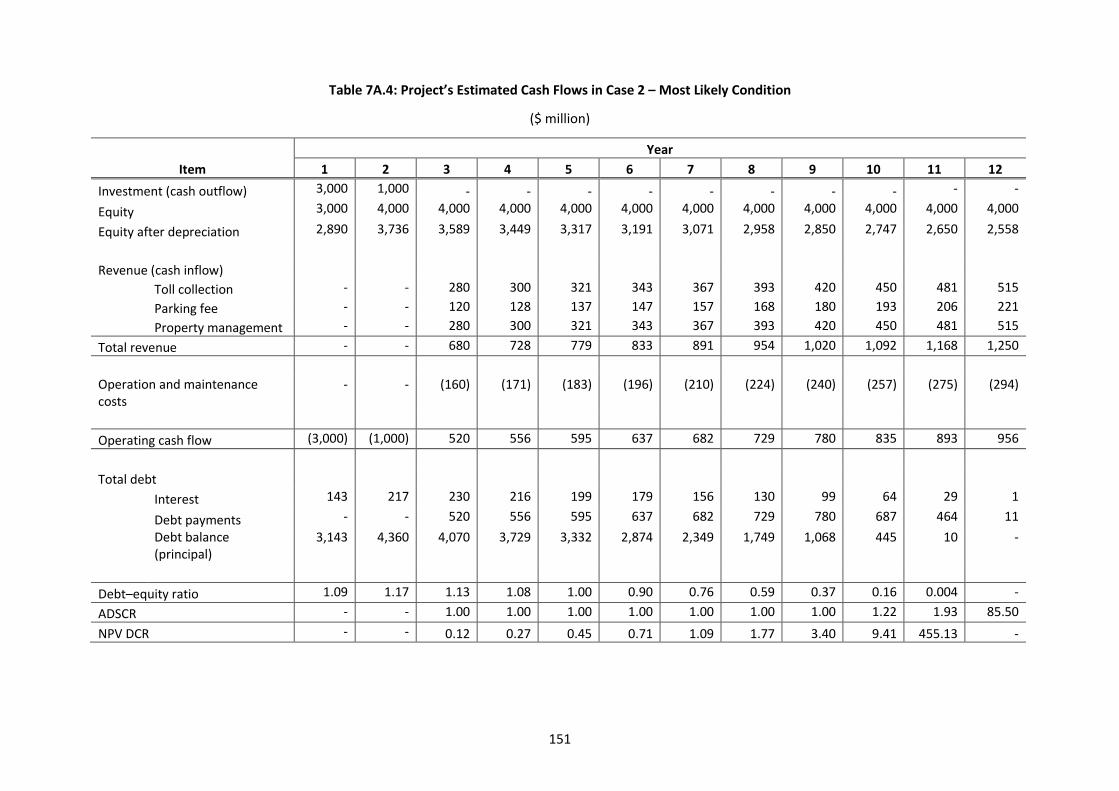
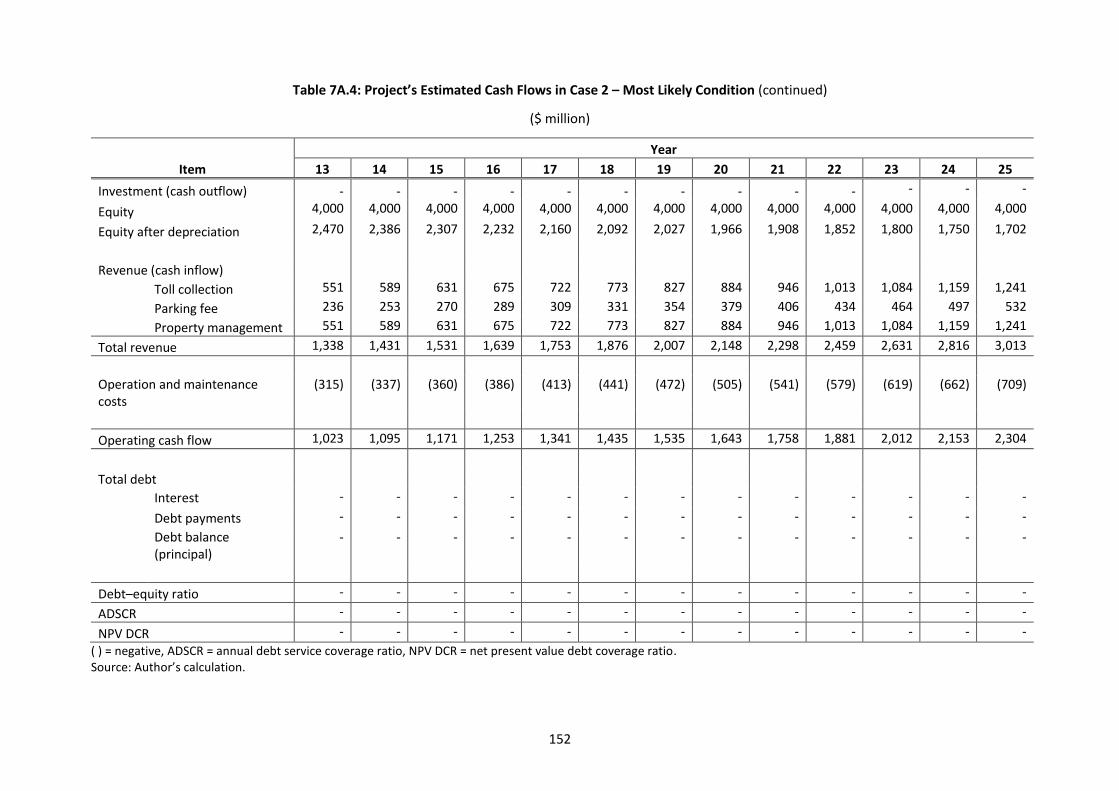
IRR. In case 2, the most likely condition, the NPV is $12,083 million, the WACC is 5.2%, the payback
period is 8.6 years, and the years of senior debt redemption of the Lao PDR are shortened, as shown
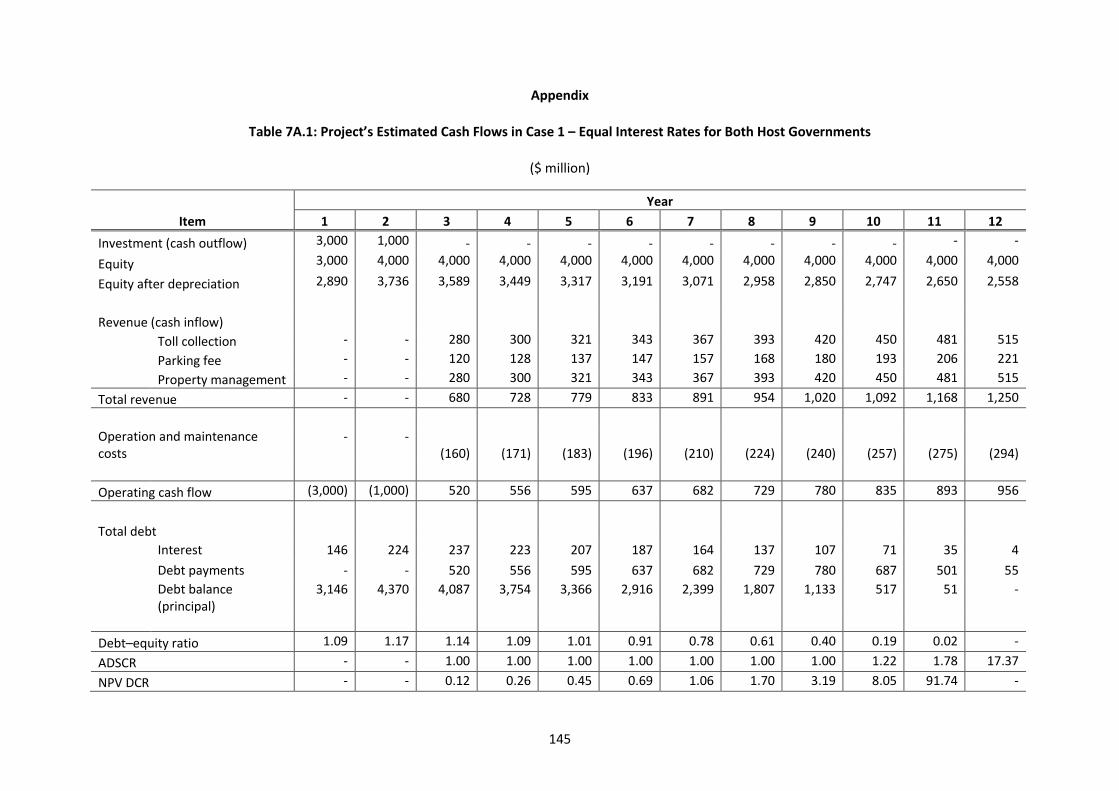
in Table 7.8. Details of all the scenarios’ estimated cash flows are in the Appendix.
The vital financial indicators are the years of debt redemption (including the payback period), which
increase the debt interest rate – extending the years of debt redemption. Consequently, the project’s
operating service requires fiscal support from the government. Moreover, the revenue from
operations must be used for debt service before paying a dividend to shareholders. In the case of
demand falling short of the estimate specified in the HGA, the SPV should be compensated. These
conditions should be clarified from the outset and included in the HGA.
142
Table 7.8: Project Summary
Case 1 Case 2
Financial indicators Base case Scenario I Scenario II
IRR 17.1% 17.1% 11.8% 17.1%
NPV $11,729 million $9,165 million
$8,127 million
$12,083 million
WACC 5.4% 6.9% 5.4% 5.2%
Payback period in years 8.6 years 8.6 years 9.5 years 8.6 years
Capital structure ratio 50% 50% 50% 50%
Debt–equity ratio (lower–upper) 0.02–1.17 0.04–1.20 0.05–1.17 0.004–1.17
ADSCR (lower–upper) 1.00–17.37 1.00–9.41 1.00–4.90 1.00–85.50
NPV DCR (lower–upper) 0.16–91.74 0.11–50.84 0.12–42.34 0.12–455.13
Years of senior debt redemption 12 years 14 years 15 years 12 years
Viet Nam (host government 1) 12 years 14 years 15 years 12 years
Lao PDR (host government 2) 12 years 14 years 15 years 11 years
Years of subordinated debt Redemption 10 years 10 years 12 years 10 years
Viet Nam (host government 1) 10 years 10 years 12 years 10 years
Lao PDR (host government 2) 10 years 10 years 12 years 10 years
Years of equity redemption 11 years 11 years 13 years 11 years
Viet Nam (host government 1) 11 years 11 years 13 years 11 years
Lao PDR (host government 2) 11 years 11 years 13 years 11 years
ADSCR = annual debt service coverage ratio, IRR = internal rate of return, Lao PDR = Lao People’s Democratic Republic, NPV DCR = net present value debt coverage ratio, WACC = weighted average cost of capital. Source: Author’s compilation.
8. Conclusion
This chapter proposed a transboundary PPP project structure for the Hanoi–Vientiane Expressway. A
financing model was used to explore terms and conditions, with a varying financing structure, cost of
capital, and O&M costs. A stylised financial model, depicting the relationship amongst financial
elements and institutions, was proposed to examine the viability of the project via three important
measures as proposed by the World Bank (2007). The implication of this section is that the parties
involved can propose the terms and conditions that seem to best fit the respective objectives of each
party and country. To draft an agreement and contract for the whole project, however, pragmatic
terms and conditions must be reached. This chapter provided an alternative tool to help seek such an
agreement.
143
References
Arndt, R. (2000), ‘Is Build-Own-Operate-Transfer a Solution to Local Governments’ Infrastructure
Funding Problems?’, Australian Civil Engineering Transactions, 42, pp.19–25.
Engel, E., R. Fischer, and A. Galetovic (2010), ‘The Economics of Infrastructure Finance: Public–Private
Partnerships versus Public Provision’, Public and Private financing of Infrastructure: Evolution
and Economics of Private Infrastructure Finance. EIB Papers, 15(1), pp.40–69.
Estache, A., T. Serebrisky, and L. Wren-Lewis (2015), ‘Financing Infrastructure in Developing Countries’,
Oxford Review of Economic Policy, 31(3–4), pp.279–304.
Harris, S. (2007), ‘Public Private Partnerships: Delivering Better Infrastructure Services’, Working Paper.
Washington, DC: Inter-American Development Bank.
International Bank for Reconstruction and Development/World Bank, Asian Development Bank, and
Inter-American Development Bank (2014), Public–Private Partnerships Reference Guide,
Version 2.0. Washington, DC and Manila: World Bank, Asian Development Bank, and Inter-
American Development Bank. https://openknowledge.worldbank.org/handle/10986/20118
(accessed 20 February 2019).
Morisugi, H. (2006), ‘Privatization of Four Road-Related Public Corporations in Japan’, presentation to
the workshop on Innovations in Project Delivery and Financing for Surface Transportation
Networks, US Transportation Research Board Annual Meeting, 22 January, Washington, DC.
Oi, T. (2012), ‘Privatization of Japan’s Expressway Company and Its Financing Scheme’, paper
presented at IBTTA 80th Annual Meeting and Exhibition, 10 September.
Organisation for Economic Co-operation and Development (2015), Infrastructure Financing
Instruments and Incentives. Paris: OECD. http://www.oecd.org/finance/private-
pensions/Infrastructure-Financing-Instruments-and-Incentives.pdf (accessed 20 February
2019).
Ray, S. (2015), ‘Infrastructure Finance and Financial Sector Development’, ADBI Working Paper Series,
No. 522. Tokyo: Asian Development Bank
Institute.https://www.adb.org/sites/default/files/publication/159842/adbi-wp522.pdf
(accessed 20 February 2019).
United Nations Economic and Social Commission for Asia and the Pacific (2011), A Guidebook on
Public–Private Partnership in Infrastructure. Bangkok: UNESCAP.
http://www.oecd.org/finance/private-pensions/Infrastructure-Financing-Instruments-and-Incentives.pdf
144
https://www.unescap.org/resources/guidebook-public-private-partnership-infrastructure
(accessed 20 February 2019).
United Nations Economic and Social Commission for Asia and the Pacific (2017), Public–Private
Partnerships for Cross-Border Infrastructure Development. Bangkok:
UNESCAP.https://www.unescap.org/resources/public-private-partnerships-cross-border-
infrastructure-development (accessed 20 February 2019).
Weber, B. and H.W. Alfen (2010), Infrastructure as an Asset Class: Investment Strategy, Project Finance
and PPP. Chichester, United Kingdom: John Wiley and Sons, Ltd.
Weber, B., M. Staub-Bisang, and H.W. Alfen (2016), Infrastructure as an Asset Class: Investment
Strategy, Sustainability, Project Finance and PPP, 2nd Edition. Chichester, United Kingdom:
John Wiley and Sons, Ltd.
World Bank (2007), Port Reform Toolkit, Second Edition. Module 5: Financial Implications of Port
Reform. Washington, DC: World Bank.
https://ppiaf.org/sites/ppiaf.org/files/documents/toolkits/Portoolkit/Toolkit/pdf/modules/0
5_TOOLKIT_Module5.pdf (accessed 20 February 2019).
World Economic Forum (2013), Strategic Infrastructure Steps to Prepare and Accelerate Public–Private
Partnerships. Cologny, Switzerland: World Economic
Forum.https://www.weforum.org/reports/strategic-infrastructure-steps-prepare-and-
accelerate-public-private-partnerships (accessed 20 February 2019).
Yescombe, E.R. (2007), Public–Private Partnerships: Principles of Policy and Finance. Oxford, United
Kingdom: Butterworth–Heinemann.
Zen, F. and M. Regan, eds. (2014), ASEAN Public Private Partnership Guidelines. Jakarta: Economic
Research Institute for ASEAN and East Asia (ERIA).http://www.eria.org/publications/asean-
ppp-guidelines/ (accessed 20 February 2019).
145
Appendix
Table 7A.1: Project’s Estimated Cash Flows in Case 1 – Equal Interest Rates for Both Host Governments
($ million)
Year
Item 1 2 3 4 5 6 7 8 9 10 11 12
Investment (cash outflow) 3,000 1,000 - - - - - - - - - -
Equity
3,000 4,000 4,000 4,000 4,000 4,000 4,000 4,000 4,000 4,000 4,000 4,000
Equity after depreciation 2,890 3,736 3,589 3,449 3,317 3,191 3,071 2,958 2,850 2,747 2,650 2,558
Revenue (cash inflow)
Toll collection - - 280 300 321 343 367 393 420 450 481 515
Parking fee - - 120 128 137 147 157 168 180 193 206 221
Property management - - 280 300 321 343 367 393 420 450 481 515
Total revenue - - 680 728 779 833 891 954 1,020 1,092 1,168 1,250
Operation and maintenance costs
- - (160) (171) (183) (196) (210) (224) (240) (257) (275) (294)
Operating cash flow (3,000) (1,000) 520 556 595 637 682 729 780 835 893 956
Total debt
Interest 146 224 237 223 207 187 164 137 107 71 35 4
Debt payments - - 520 556 595 637 682 729 780 687 501 55
Debt balance (principal)
3,146 4,370 4,087 3,754 3,366 2,916 2,399 1,807 1,133 517 51 -
Debt–equity ratio 1.09 1.17 1.14 1.09 1.01 0.91 0.78 0.61 0.40 0.19 0.02 -
ADSCR - - 1.00 1.00 1.00 1.00 1.00 1.00 1.00 1.22 1.78 17.37
NPV DCR - - 0.12 0.26 0.45 0.69 1.06 1.70 3.19 8.05 91.74 -
146
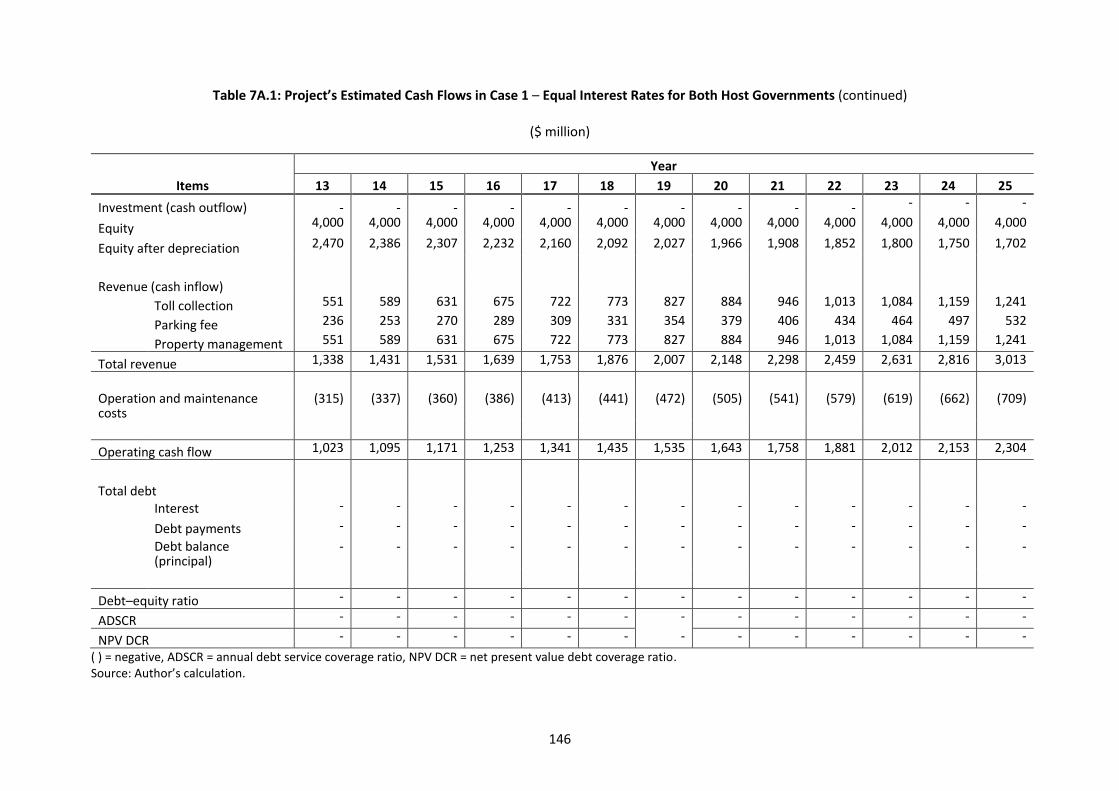
Table 7A.1: Project’s Estimated Cash Flows in Case 1 – Equal Interest Rates for Both Host Governments (continued)
($ million)
Year
Items 13 14 15 16 17 18 19 20 21 22 23 24 25
Investment (cash outflow) - - - - - - - - - - - - -
Equity 4,000 4,000 4,000 4,000 4,000 4,000 4,000 4,000 4,000 4,000 4,000 4,000 4,000
Equity after depreciation 2,470 2,386 2,307 2,232 2,160 2,092 2,027 1,966 1,908 1,852 1,800 1,750 1,702
Revenue (cash inflow)
Toll collection 551 589 631 675 722 773 827 884 946 1,013 1,084 1,159 1,241
Parking fee 236 253 270 289 309 331 354 379 406 434 464 497 532
Property management 551 589 631 675 722 773 827 884 946 1,013 1,084 1,159 1,241
Total revenue 1,338 1,431 1,531 1,639 1,753 1,876 2,007 2,148 2,298 2,459 2,631 2,816 3,013
Operation and maintenance costs
(315) (337) (360) (386) (413) (441) (472) (505) (541) (579) (619) (662) (709)
Operating cash flow 1,023 1,095 1,171 1,253 1,341 1,435 1,535 1,643 1,758 1,881 2,012 2,153 2,304
Total debt
Interest - - - - - - - - - - - - -
Debt payments - - - - - - - - - - - - -
Debt balance (principal)
- - - - - - - - - - - - -
Debt–equity ratio - - - - - - - - - - - - -
ADSCR - - - - - - - - - - - - -
NPV DCR - - - - - - - - - - - - -
( ) = negative, ADSCR = annual debt service coverage ratio, NPV DCR = net present value debt coverage ratio. Source: Author’s calculation.
147
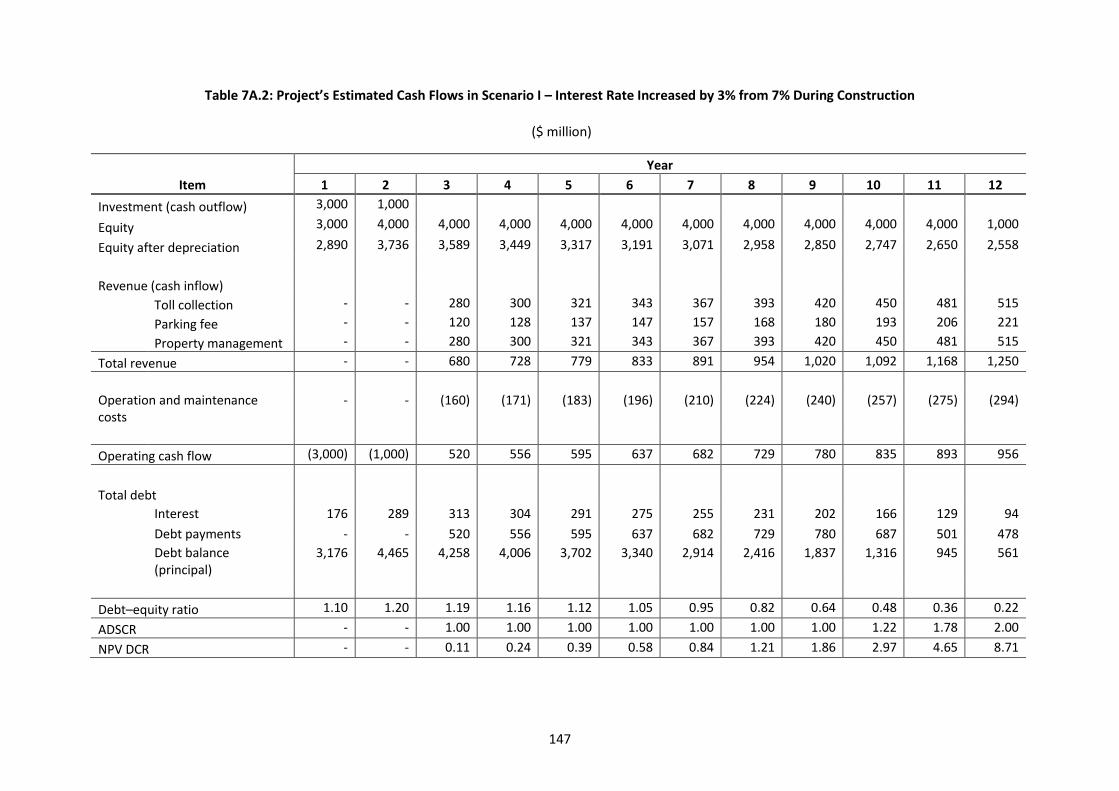
Table 7A.2: Project’s Estimated Cash Flows in Scenario I – Interest Rate Increased by 3% from 7% During Construction
($ million)
Year
Item 1 2 3 4 5 6 7 8 9 10 11 12
Investment (cash outflow) 3,000 1,000
Equity
3,000 4,000 4,000 4,000 4,000 4,000 4,000 4,000 4,000 4,000 4,000 1,000
Equity after depreciation 2,890 3,736 3,589 3,449 3,317 3,191 3,071 2,958 2,850 2,747 2,650 2,558
Revenue (cash inflow)
Toll collection - - 280 300 321 343 367 393 420 450 481 515
Parking fee - - 120 128 137 147 157 168 180 193 206 221
Property management - - 280 300 321 343 367 393 420 450 481 515
Total revenue - - 680 728 779 833 891 954 1,020 1,092 1,168 1,250
Operation and maintenance costs
- - (160) (171) (183) (196) (210) (224) (240) (257) (275) (294)
Operating cash flow (3,000) (1,000) 520 556 595 637 682 729 780 835 893 956
Total debt
Interest 176 289 313 304 291 275 255 231 202 166 129 94
Debt payments - - 520 556 595 637 682 729 780 687 501 478
Debt balance (principal)
3,176 4,465 4,258 4,006 3,702 3,340 2,914 2,416 1,837 1,316 945 561
Debt–equity ratio 1.10 1.20 1.19 1.16 1.12 1.05 0.95 0.82 0.64 0.48 0.36 0.22
ADSCR - - 1.00 1.00 1.00 1.00 1.00 1.00 1.00 1.22 1.78 2.00
NPV DCR - - 0.11 0.24 0.39 0.58 0.84 1.21 1.86 2.97 4.65 8.71
148
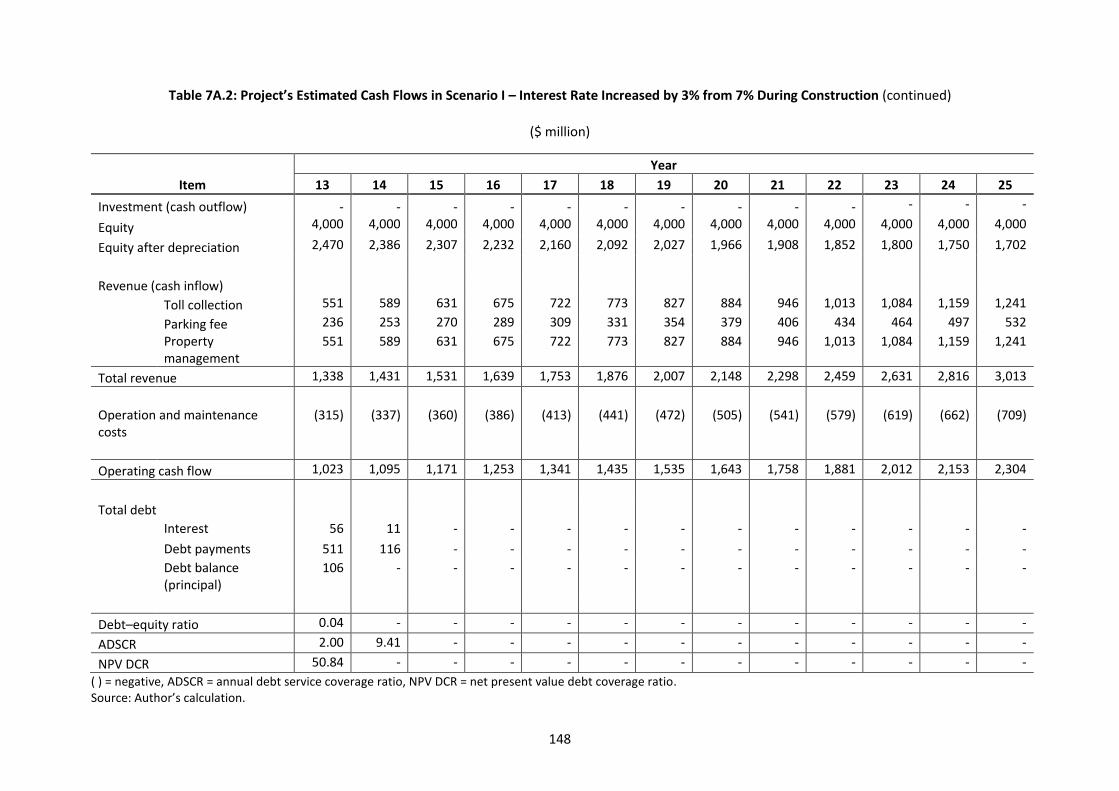
Table 7A.2: Project’s Estimated Cash Flows in Scenario I – Interest Rate Increased by 3% from 7% During Construction (continued)
($ million)
Year
Item 13 14 15 16 17 18 19 20 21 22 23 24 25
Investment (cash outflow) - - - - - - - - - - - - -
Equity 4,000 4,000 4,000 4,000 4,000 4,000 4,000 4,000 4,000 4,000 4,000 4,000 4,000
Equity after depreciation 2,470 2,386 2,307 2,232 2,160 2,092 2,027 1,966 1,908 1,852 1,800 1,750 1,702
Revenue (cash inflow)
Toll collection 551 589 631 675 722 773 827 884 946 1,013 1,084 1,159 1,241
Parking fee 236 253 270 289 309 331 354 379 406 434 464 497 532
Property management
551 589 631 675 722 773 827 884 946 1,013 1,084 1,159 1,241
Total revenue 1,338 1,431 1,531 1,639 1,753 1,876 2,007 2,148 2,298 2,459 2,631 2,816 3,013
Operation and maintenance costs
(315) (337) (360) (386) (413) (441) (472) (505) (541) (579) (619) (662) (709)
Operating cash flow 1,023 1,095 1,171 1,253 1,341 1,435 1,535 1,643 1,758 1,881 2,012 2,153 2,304
Total debt
Interest 56 11 - - - - - - - - - - -
Debt payments 511 116 - - - - - - - - - - -
Debt balance (principal)
106 - - - - - - - - - - - -
Debt–equity ratio 0.04 - - - - - - - - - - - -
ADSCR 2.00 9.41 - - - - - - - - - - -
NPV DCR 50.84 - - - - - - - - - - - -
( ) = negative, ADSCR = annual debt service coverage ratio, NPV DCR = net present value debt coverage ratio. Source: Author’s calculation.
149
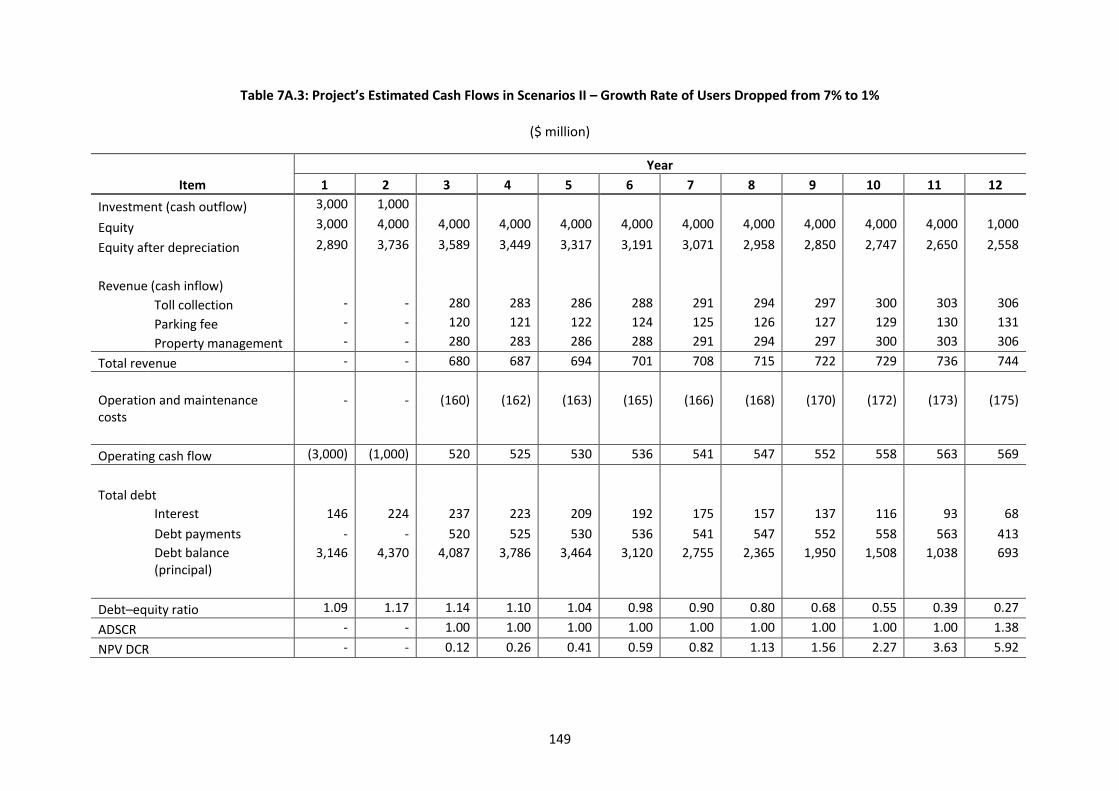
Table 7A.3: Project’s Estimated Cash Flows in Scenarios II – Growth Rate of Users Dropped from 7% to 1%
($ million)
Year
Item 1 2 3 4 5 6 7 8 9 10 11 12
Investment (cash outflow) 3,000 1,000
Equity
3,000 4,000 4,000 4,000 4,000 4,000 4,000 4,000 4,000 4,000 4,000 1,000
Equity after depreciation 2,890 3,736 3,589 3,449 3,317 3,191 3,071 2,958 2,850 2,747 2,650 2,558
Revenue (cash inflow)
Toll collection - - 280 283 286 288 291 294 297 300 303 306
Parking fee - - 120 121 122 124 125 126 127 129 130 131
Property management - - 280 283 286 288 291 294 297 300 303 306
Total revenue - - 680 687 694 701 708 715 722 729 736 744
Operation and maintenance costs
- - (160) (162) (163) (165) (166) (168) (170) (172) (173) (175)
Operating cash flow (3,000) (1,000) 520 525 530 536 541 547 552 558 563 569
Total debt
Interest 146 224 237 223 209 192 175 157 137 116 93 68
Debt payments - - 520 525 530 536 541 547 552 558 563 413
Debt balance (principal)
3,146 4,370 4,087 3,786 3,464 3,120 2,755 2,365 1,950 1,508 1,038 693
Debt–equity ratio 1.09 1.17 1.14 1.10 1.04 0.98 0.90 0.80 0.68 0.55 0.39 0.27
ADSCR - - 1.00 1.00 1.00 1.00 1.00 1.00 1.00 1.00 1.00 1.38
NPV DCR - - 0.12 0.26 0.41 0.59 0.82 1.13 1.56 2.27 3.63 5.92
150
Table 7A.3: Project’s Estimated Cash Flows in Scenarios II – Growth Rate of Users Dropped from 7% to 1% (continued)
($ million)
Year
Item 13 14 15 16 17 18 19 20 21 22 23 24 25
Investment (cash outflow) - - - - - - - - - - - - -
Equity 4,000 4,000 4,000 4,000 4,000 4,000 4,000 4,000 4,000 4,000 4,000 4,000 4,000
Equity after depreciation 617 2,470 2,386 2,307 2,232 2,160 2,092 2,027 1,966 1,908 1,852 1,800 1,750
Revenue (cash inflow)
Toll collection 309 312 316 319 322 325 328 332 335 338 342 345 349
Parking fee 133 134 135 137 138 139 141 142 144 145 146 148 149
Property management
309 312 316 319 322 325 328 332 335 338 342 345 349
Total revenue 751 759 766 774 782 789 797 805 813 822 830 838 846
Operation and maintenance costs
(177) (179) (180) (182) (184) (186) (188) (189) (191) (193) (195) (197) (199)
Operating cash flow 574 580 586 592 598 604 610 616 622 628 634 641 647
Total debt
Interest 47 26 8 - - - - - - - - - -
Debt payments 364 290 120 - - - - - - - - - -
Debt balance (principal)
376 112 - - - - - - - - - - -
Debt–equity ratio 0.15 0.05 - - - - - - - - - - -
ADSCR 1.58 2.00 4.90 - - - - - - - - - -
NPV DCR 11.78 42.34 - - - - - - - - - - -
( ) = negative, ADSCR = annual debt service coverage ratio, NPV DCR = net present value debt coverage ratio. Source: Author’s calculation.
151
Table 7A.4: Project’s Estimated Cash Flows in Case 2 – Most Likely Condition
($ million)
Year
Item 1 2 3 4 5 6 7 8 9 10 11 12
Investment (cash outflow) 3,000 1,000 - - - - - - - - - -
Equity 3,000 4,000 4,000 4,000 4,000 4,000 4,000 4,000 4,000 4,000 4,000 4,000
Equity after depreciation 2,890 3,736 3,589 3,449 3,317 3,191 3,071 2,958 2,850 2,747 2,650 2,558
Revenue (cash inflow)
Toll collection - - 280 300 321 343 367 393 420 450 481 515
Parking fee - - 120 128 137 147 157 168 180 193 206 221
Property management - - 280 300 321 343 367 393 420 450 481 515
Total revenue - - 680 728 779 833 891 954 1,020 1,092 1,168 1,250
Operation and maintenance costs
- - (160) (171) (183) (196) (210) (224) (240) (257) (275) (294)
Operating cash flow (3,000) (1,000) 520 556 595 637 682 729 780 835 893 956
Total debt
Interest 143 217 230 216 199 179 156 130 99 64 29 1
Debt payments - - 520 556 595 637 682 729 780 687 464 11
Debt balance (principal)
3,143 4,360 4,070 3,729 3,332 2,874 2,349 1,749 1,068 445 10 -
Debt–equity ratio 1.09 1.17 1.13 1.08 1.00 0.90 0.76 0.59 0.37 0.16 0.004 -
ADSCR - - 1.00 1.00 1.00 1.00 1.00 1.00 1.00 1.22 1.93 85.50
NPV DCR - - 0.12 0.27 0.45 0.71 1.09 1.77 3.40 9.41 455.13 -
152
Table 7A.4: Project’s Estimated Cash Flows in Case 2 – Most Likely Condition (continued)
($ million)
Year
Item 13 14 15 16 17 18 19 20 21 22 23 24 25
Investment (cash outflow) - - - - - - - - - - - - -
Equity 4,000 4,000 4,000 4,000 4,000 4,000 4,000 4,000 4,000 4,000 4,000 4,000 4,000
Equity after depreciation 2,470 2,386 2,307 2,232 2,160 2,092 2,027 1,966 1,908 1,852 1,800 1,750 1,702
Revenue (cash inflow)
Toll collection 551 589 631 675 722 773 827 884 946 1,013 1,084 1,159 1,241
Parking fee 236 253 270 289 309 331 354 379 406 434 464 497 532
Property management 551 589 631 675 722 773 827 884 946 1,013 1,084 1,159 1,241
Total revenue 1,338 1,431 1,531 1,639 1,753 1,876 2,007 2,148 2,298 2,459 2,631 2,816 3,013
Operation and maintenance costs
(315) (337) (360) (386) (413) (441) (472) (505) (541) (579) (619) (662) (709)
Operating cash flow 1,023 1,095 1,171 1,253 1,341 1,435 1,535 1,643 1,758 1,881 2,012 2,153 2,304
Total debt
Interest - - - - - - - - - - - - -
Debt payments - - - - - - - - - - - - -
Debt balance (principal)
- - - - - - - - - - - - -
Debt–equity ratio - - - - - - - - - - - - -
ADSCR - - - - - - - - - - - - -
NPV DCR - - - - - - - - - - - - -
( ) = negative, ADSCR = annual debt service coverage ratio, NPV DCR = net present value debt coverage ratio. Source: Author’s calculation.