TRACING THE PROGRESS TOWARD THE ASEAN ...
245
ERIA Research Project Report 2009, No.3 TRACING THE PROGRESS TOWARD THE ASEAN ECONOMIC COMMUNITY Edited by SHUJIRO URATA MISA OKABE March 2010
-
Upload
khangminh22 -
Category
Documents
-
view
3 -
download
0
Transcript of TRACING THE PROGRESS TOWARD THE ASEAN ...

ERIA Research Project Report 2009, No.3 TRACING THE PROGRESS TOWARD THE ASEAN ECONOMIC COMMUNITY
Edited by SHUJIRO URATA MISA OKABE March 2010
i
TABLE OF CONTENTS
Table of Contents i
List of Project Members ii
Executive Summary iii
CHAPTER 1. Tracing the Progress towards the ASEAN Economic Community 1
Shujiro Urata and Misa Okabe
CHAPTER 2. Services Liberalization toward the ASEAN Economic Community 28
Philippa Dee
CHAPTER 3. Trade Facilitation toward the ASEAN Economic Community 125
Patricia Sourdin and Richard Pomfret
CHAPTER 4. Investment Climate Study of ASEAN Member Countries 162
Shujiro Urata and Mitsuyo Ando
CHAPTER 5. Background Data for Constructing Quantitative Measures 233
Project Members

ii
LIST OF PROJECT MEMBERS
DR. SHUJIRO URATA (PROJECT LEADER): Professor, Graduate School of Asia-Pacific Studies, Waseda University, Japan; Senior Research Advisor to the Executive Director, Economic Research Institute for ASEAN and East Asia (ERIA), Indonesia.
DR. MISA OKABE: Associate Researcher, Economic Research Institute for ASEAN and East Asia (ERIA), Indonesia.
DR. PHILIPPA DEE: Consultant, Crawford School of Economics and Government, Australian National University, Australia.
DR. PATRICIA SOURDIN: Adjunct Professor, School of Advanced International Studies, The Johns Hopkins University Bologna Center, Italy.
DR. RICHARD POMFRET: Professor, School of Economics, University of Adelaide, Australia.
MR. SHAZALI SULAIMAN: Partner, KPMG, Brunei Darussalam.
DR. CHAP SOTHARITH: Research Director, Cambodian Institute for Cooperation and Peace (CICP), Cambodia.
DR. RAYMOND ATJE: Head, Department of Economics, Centre for Strategic and International Studies (CSIS), Indonesia.
DR. LEEBER LEEBOUAPAO, Deputy Director General, National Economic Research Institute (NERI), Lao PDR
DR. ZAKARIAH ABDUL RASHID: Executive Director, Malaysian Institute of Economic Research (MIER), Malaysia.
DR. KAN ZAW: Rector, Yangon Institute of Economics (YIE), Myanmar.
DR. JOSEF T. YAP: President, Philippine Institute for Development Studies (PIDS), the Philippines.
DR. HANK LIM: Senior Research Fellow, Singapore Institute of International Affairs (SIIA), Singapore.
DR. WISARN PUPPHAVESA: Advisor, Thailand Development Research Institute (TDRI), Thailand.
DR. VO TRI THANH: Deputy Director General, Central Institute of Economic Management (CIEM), Vietnam.

iii
EXECUTIVE SUMMARY
1. The Background and objective of the project
The success of long-term stable economic development in ASEAN countries depends on both the stimulation of intra-regional demand, and to opening up the region to outside demand. The ASEAN Economic Community has the potential to meet these conditions for achieving long-term stable development in this region. Free flows of goods, services, investment, capital and skilled labor would promote both regional domestic demand on the one hand and the competitiveness and attractiveness of this region in the global market on the other. At the same time, ASEAN has the potential to play an important role in re-balancing the global economy, by promoting demand growth in the regional market. In light of recent challenges in this region, we have analyzed the progress of liberalization in major sectors as the region moves toward the ASEAN Economic Community (AEC).
The objective of this research project is to develop quantitative measures regarding three core elements of the ASEAN Blueprint, in order to trace the progress toward the AEC. These elements are the free flow of services, goods, and investment. The expected role of our quantitative measures is to facilitate the implementation of the AEC Blueprint by ASEAN countries. In the process of implementing the Blueprint, progress toward the goals needs to be made clear, in order to ensure that all members continue implementing the necessary policy measures, and to prevent any member countries from falling behind. Quantitative measures can play a useful role in highlighting milestones and signposts on the path towards the ultimate goals.
Regarding the degree of free flow of services, we have studied air transportation, maritime services, and telecommunication services by developing restrictiveness indices. In the case of the freedom of flow of goods, we have analyzed logistics service liberalization, focusing on customs procedures and national Single Windows. Trade cost estimation between ASEAN countries and major trading partners has been carried out using commodity trade statistics. The freedom of flow of investment has been studied by focusing on quantitative measures of FDI restriction and investment-related issues in order to provide assessments of FDI policy regimes and the FDI policy environments of the ASEAN countries. Our quantitative measures have been developed using various methods, such as questionnaires, statistical analyses, and firm-level surveys. There has been close collaboration with many researchers from various countries including 10 ASEAN countries.

iv
2. Major findings There are significant challenges associated with examination of the degree of liberalization
inherent in policy regimes. First, there are vast amounts of information related to regulations and treatments. Second, we must collect necessary information, based on interviews with sectoral experts, in order to clarify the actual situation and to obtain correct interpretations, because administrative documents and other information often include many technical issues and much technical language. In order to cope with these challenges, we have collected the information on actual policies in close collaboration with researchers from 10 ASEAN countries. In addition, quantitative analyses based on statistical and firm-level data have been conducted to provide a broad-ranging overview.
2.1 Free Flow of Services Air Transportation Services: Although most ASEAN countries appear relatively liberal, there are still barriers remaining, which are increasingly preventing effective competition.
We found that only two countries have so far ratified the ASEAN Multilateral Agreement. There are also still two countries that have retained the option to impose restrictions on international and domestic charter flights, although charter flights are not as significant factors in the competitive environment as they used to be. In addition, government subsidies for domestic airlines are still one of many remaining problems. Maritime Services: Regarding restrictions on trade in mode 1 (cross-border trade), only three countries have stated that they will grant exemptions from cargo restrictions. Concerning restrictions on mode 3 (commercial presence), there is no ASEAN country meeting the Blueprint target by 2010 in all maritime services. In most countries, port operations are still government-owned. In addition, half of the ASEAN countries retain discriminatory licensing conditions for foreign suppliers. Telecommunication Services: Only two countries meet the Blueprint’s target in respect of foreign equity limits on investment in telecommunication service providers. Most countries are relatively even-handed in their regulation of facilities-based and resale-based services. However, only a minority of ASEAN countries have moved comprehensively to general, rather than individual, licensing of telecommunications providers. 2.2 Free Flow of Goods Customs Clearance: All countries are participating in regional cooperation efforts to simplify and harmonize customs clearance and to introduce mutual recognition of conformance assessments, and most countries are participating in efforts to introduce National Single Windows, and integrate these into an ASEAN Single Window. However, there are variations
v
caused by differences in levels of development, such as the degree of usage of electronic filing of customs documentation. In addition, although most ASEAN counties are relatively transparent about their trade regulations in general, very few are fully transparent about ex-post performance, such as measures of customs clearance time. Trade Cost estimation: The trade cost of ASEAN countries has been on a declining trend as a whole. In addition, the various trade costs in the ASEAN countries appear to be converging to the lowest cost country. Building on the calculation of the trade cost in ASEAN, we found the presence of a scale effect in trade cost. In addition, the low general quality level of institutions and infrastructure of the ASEAN countries increases trade cost, particularly for seaborne trade. These results suggest that efficient logistics and distribution, as well as improvement of quality of institution and infrastructure are important factors for trade cost reduction. 2.3 Free Flow of Investment
Based on examination of legal documents relating to FDI, plus additional supplementary information collected from the ASEAN countries, FDI policy regimes in each country were assessed, and the scores to describe the degree of their openness were constructed. We found that ASEAN countries have restrictive FDI regimes in the areas of the movement of investors, and screening and appraisal procedures. There are wide variations among countries in scores for these areas, and for the area of national treatment.
Restriction on market access is considered to be the most important policy relating to inward FDI, and regulations are rather relaxed in the manufacturing sector compared to the high levels of restriction found in the public and service sectors. Although variations among countries are found, tight restrictions are often imposed in service sectors such as information and communication.
In addition, it was found through firm-level survey that various sorts of indirect barriers to FDI still exist in this region, and that the main problems are concerned with FDI facilitation. There is plenty of room to improve FDI facilitation, in particular institutional problems, such as lack of transparency, and implementation problems such as complicated procedures.
3. Policy Implications Air Transportation Services: • There are as yet only a few countries meeting the ASEAN Blueprint targets. ASEAN
members should work towards further reform of their air services agreements, and should achieve much greater transparency in their provisions.

vi
Maritime Services: • There are only a few counties that have stated that they grant exemptions from restrictions
on cabotage (freight transport between two points in the same country). Therefore, ASEAN countries should make more effort to reduce the scope of these restrictions. Also, all countries should be looking to meet the Blueprint target of allowing at least 51% foreign ownership of maritime services companies by 2010.
Telecommunication Services: • Most countries have not been able to meet the Blueprint’s foreign equity targets in all
telecommunication services, even on an MFN (Most Favored Nation) basis. The remaining restrictions on foreign equity limits should be phased out. Also, the problem of the persistence of very high market shares held by incumbent service suppliers needs to be solved.
Customs clearance: • There are large variations in the extent to which countries have set targets, used information
technology, and performed risk assessments is customs clearance. These variations partly reflect levels of development of technology. Region-wide technology cooperation in these fields is necessary to eliminate these differences in ability to implement reforms
• There is room for improvement in transparency relating to ex-post performance. In addition, the publication of clearance times would provide an acid test as to whether ASEAN cooperation efforts are achieving their ultimate aim.
Trade Cost • Ad valorem trade costs have a tendency to decrease and converge to the lowest-cost country.
For further reduction in trade cost, the efficiency of the logistics and distributions sectors, and the quality of infrastructure related to transportation, such as port infrastructure, roads and railroads, should be improved.
FDI Climate • In order to promote FDI policy liberalization, the ASEAN countries should use various
existing frameworks. In particular, ASEAN should use the ASEAN Comprehensive Investment Agreement (ACIA).
• To overcome obstacles concerning FDI facilitation, the ASEAN countries should actively use various cooperation programs with developed countries to improve the human resources engaged in the implementation and enforcement of FDI policies.
• Monitoring of the achievement of FDI liberalization and facilitation has to be emphasized, in order to achieve a freer FDI environment.

1
CHAPTER 1
Overview: Tracing the Progress toward the ASEAN Economic Community
Shujiro Urata Graduate School of Asia-Pacific Studies, Waseda University,
Economic Research Institute for ASEAN and East Asia
Misa Okabe Economic Research Institute for ASEAN and East Asia
The objective of this Chapter is to provide an overview of the ERIA Research Project,”Tracing the
Progress toward the ASEAN Economic Community”. After looking at the current situation of the ASEAN
economies in the global market, we review the scope and visions of the ASEAN Economic Community
(AEC) based on the ASEAN Blueprint. The objective of our research project is to develop quantitative
measures regarding three core elements of a key characteristic of the ASEAN Blueprint, that is, the free
flow of services, goods, and investment, in order to trace the progress toward the AEC. Concerning the
free flow of services, we have studied three key service sectors, namely air transportation, maritime
services and telecommunication services, to map the existing policy space. Mapping actual policies in
these examinations helps to indicate the extent of real policy reform that will be needed in each ASEAN
member country in order to achieve the liberalization laid out in the AEC Blueprint. As for the free flow
of goods, our project has conducted research on the progress of trade facilitation in each ASEAN country
by examining two issues, that is, an examination of implementation status of the ASEAN Single Window in
each country, and quantitative analysis of trade costs between ASEAN countries and outside major
trading partners. Regarding the free flow of investment, we have investigated and evaluated the
restrictiveness of FDI policy regimes and environments in the ASEAN countries based on a questionnaire
survey and study of the relevant legal documents. In the light of these findings, we present several
policy implications for the implementation of the AEC Blueprint.

2
1. Introduction
The global financial crisis originated from the collapse of the housing market, and the
subsequent liquidity and confidence crisis in the US has triggered a chain reaction of economic
turmoil in the global economy. Although the financial and economic crises hit the US, Europe
and Japan immediately and significantly, ASEAN economies have been affected rather indirectly
through shrinking exports brought about by the collapse of demand in major global markets.
According to Asian Development Outlook 2009, updated in September 2009, the average GDP
growth rate in Southeast Asian countries is estimated to have been 0.1% in 2009, while it was
4.1% in 2008. Likewise, the World Bank reported in the Prospects for the Global Economy 2010
that the simple average GDP growth rates at market price for seven countries from ASEAN is
estimated to have been 1.04% in 2009, while it was at 4.3% in 2008. Due to the collapse in
external demand in late 2008 and early 2009, slowdown of the larger export-oriented economies,
Malaysia, Singapore and Thailand, and energy exporter, Brunei Darussalam, and Cambodia
which depends on tourism, clothing exports and FDI, is relatively serious, and negative GDP
growth rates are expected in these economies in 20091
Based on the experiences gained from the Asian financial crisis, countries in this region have
restrained foreign debt growing and engaged in regional financial cooperation, in order to
prevent the resurgence of a crisis. Therefore, currency and financial market turmoil in this global
.
Most of the ASEAN economies, however, have already begun to rebound from the downturn
since the middle of 2009. According to the Asia Economic Monitor in December 2009, by the
Asian Development Bank, in 2010 the GDP growth rates of nine ASEAN countries are expected
to be restored and mark positive values. Indonesia, the Lao PDR and Vietnam are projected to
attain at least a 5% GDP growth rate. This strong rebounding is due to timely and forceful fiscal
stimulus programs and easing monetary policies by the governments in this region, and
improving the external economic environment. Generally speaking, economic decline in the
ASEAN countries has been much less serious and recovery is much quicker than with the Asian
financial crisis in 2007/2008. The current challenge in this region is to maintain economic
recovery and to realize stable long-term growth.
1 ADB outlook 2009 updated.

3
financial crisis was not as significant as in the Asian financial crisis. However, the impact of the
global financial crisis in this region resulting from a reduction in international trade has severely
affected the economies of ASEAN countries. Sharp decreases of exports to the US and EU areas
have demonstrated vulnerability in the East Asian region including ASEAN countries. In other
words, this region’s high dependency on external demand should be reduced to realize stable
long-term growth. East Asian economies, including ASEAN members, need to rebalance sources
of growth by stimulating domestic demand.
The export dependency of ASEAN countries is relatively high. The average share of exports in
the total GDP of eight ASEAN countries (except Singapore and Myanmar) is 63%, much higher
than the world average of 30%. In addition, ASEAN countries’ share of regional trade in each
production stage, i.e., capital goods, intermediate goods and consumption goods are still
relatively low compared to EU and NAFTA (Table1). Taking the size of population and growth
of the middle income class into consideration, potential domestic demand in ASEAN countries
remains big, and there seems to be plenty of scope for expanding regional trade2
Notes: Calculated by UN Commodity trade statistics at BEC. As for ASEAN, Laos and Myanmar does not
included because of data availability.
. Regional
economic integration into ASEAN can thus be a key to promoting domestic demand and
rebalancing sources of demand in this region.
Table 1: Share of regional trade in 2008.
2 The populations of the ASEAN 10, the EU27 and NAFTA in 2008 are 575million, 497 million and 444 million respectively. Moreover, the Asian Development Bank’s key indicator in 2009 states that “The emergence of a large and rapidly growing urban middle class in the region is a key to increasing domestic demand”.
Capital goods Intermediate goods
Consumption goods Capital goods Intermediate
goodsConsumption
goods Capital goods Intermediate goods
Consumption goods
Export Export Export22.54% 25.50% 16.76% 46.51% 57.05% 63.56% 42.70% 49.56% 53.74%
Import Import Import16.15% 21.05% 30.86% 51.82% 49.67% 54.49% 29.85% 37.17% 22.21%
ASEAN EU15 NAFTA

4
At the same time, regional economic integration among the ASEAN countries should be open
to non-ASEAN countries. Foreign direct investment from outside the region, and extra-regional
trade remain the most essential factors influencing the development of the ASEAN countries,
since they also bring about technological progress and high value-added production. Moreover,
improving cooperative economic relations with very competitive neighboring countries,
particularly China and India, is central to the realization of long-term stable economic
development in the ASEAN countries. As stated in the ASEAN Economic Community Blueprint,
ASEAN should act in accordance with the principals of being open and outward-looking in
establishing the ASEAN Economic Community, and the ASEAN should also be a region fully
integrated into the global economy.
The success of long-term stable economic development in ASEAN countries depends on both
stimulation of intra-regional demand and opening up to outside the region. The ASEAN
Economic Community, which aims to become a single market and have production integrated
into the global market so as to achieve high competitiveness and equitable development, has the
potential to meet the conditions for realizing long-term stable development in this region.
Achieving a free flow of goods, service, investment, capital and skilled labor promotes both
regional domestic demand on the one hand and the competitiveness and attractiveness of this
region in the global market on the other. At the same time, ASEAN has the potential to play an
important role in re-balancing the global economy by promoting the large demand in the regional
market. In light of these recent challenges in this region, we have analyzed the progress of the
degree of liberalization in major sectors as the region moves toward the ASEAN Economic
Community (AEC).
The remainder of this chapter is organized as follows: Section 2 describes the targets of the
AEC by reviewing the scope and structure of the AEC Blueprint. Section 3 introduces an outline
for and objectives of our research project. Sections 4 summarizes the key findings of each study
on the three core elements, namely free flow of services, trade and investment. Based on the
discussion in Section 4, we derive policy implications before discussing a general policy
recommendations in Section 5.
5
2. The ASEAN Economic Community and the AEC Blueprint
The vision of the ASEAN Economic Community has started to proceed toward the realization
since the Bali summit in October 2003, at which the ASEAN leaders stated that the ASEAN
Economic Community should be the goal of regional economic integration by 2020.
Subsequently, development of a single and coherent blueprint with clearly targets, and gives
implementation timelines for, advancing the AEC by 2015 was agreed at the economic ministers’
meeting in August 2006. At the 12th
The ASEAN Blueprint describes the vision of the AEC, which is the realization of the end goal
of economic integration, and establishes ASEAN as a single market and production base in
which there is a free flow of goods, services and investments, a freer flow of capital, equitable
economic development and reduced poverty and socio-economic disparities, as declared in the
ASEAN Vision 2020, agreed at the ASEAN Summit in 1997. Relevant sectoral ministerial
bodies have responsibility for implementation, and the ASEAN Economic Ministers are
accountable for the overall implementation of the Blueprint. The Secretary General of ASEAN
must report the progress to relevant ministerial meetings and at the summit. Major means for
accomplishment of the Blueprint could be its supervision and surveillance mechanism, led by the
ASEAN secretariat. The execution of evaluation functions by using the AEC scorecards, which
are used to assess the progress of the work plan for the AEC.
ASEAN Summit in 2007, the leaders signed the Cebu
Declaration on the Acceleration of the Establishment of an AEC by 2015, and then adopted the
ASEAN Economic Blueprint at the 13th ASEAN Summit in the same year, to serve as a
coherent master plan to guide the establishment of the AEC.
The AEC Blue print presents the visions of the AEC, as well as work plans and strategic
schedules for its implementation. Table 2 shows the key characteristics of the Blueprint, namely,
A) establishment of a single market and production base, B) realization of a highly competitive
economic region, C) achievement of equitable economic development and D) full integration
into the global economy. Each characteristic consists of several core elements and each core
element has its objectives, action plans and strategic schedules. The strategic schedule in four-
phased stages by 2015 is set in details under each core elements. While the expected objective of
the blueprint is expected to play a role of an indicator of the goals and timeframes for developing
the AEC, it is not a detailed agreement with clearly defined targets based on lengthy up-front

6
negotiations in consideration of the gaps existing amongst Member countries (Soesastro, 2007).
Soesastro (2007) also pointed out that the Blueprint still has some vaguely defined goals and
missing milestones, therefore signposts should be set up along the road to indicate the progress in
achieving the goals.
Table 2; 4 key characteristics and core elements of the AEC blueprint.
A. Single market and production base A1. Free flow of goods (9 Strategic approaches) A2. Free flow of services (3 strategic approaches) A3.Free flow of investment (5 strategic approaches) A4. Freer flow of capital (7 strategic approaches) A5. Free flow of skilled labor A6. Priority of integration sectors A7. Food, agriculture and forestry
B. Competitive Economic Region B1. Competition policy B2. Consumer protection B3. Intellectual priority rights B4. Infrastructure development (10 strategic approaches) B5. Taxation B6. E-commerce
C. Equitable economic Development C1. SME development C2. Initiative for ASEAN Integration
D. Integration into the Global Economy D1.Coherent approach towards external economic relations D2. Enhanced participation in global supply networks
Source: the AEC Blueprint.
Behind the proposal for the AEC has been rising concern that ASEAN economies lost their
competitiveness against emerging markets such as China. Despite this strong common incentive,
development gaps amongst member countries may often become an impediment to the
implementation of the Blueprint. The actual implementing agencies, the governments of member
countries, differ in their ability to implement the Blueprint, and there is no penalty for any
defaulting defined in the Blueprint or in other agreements and the ASEAN Charter, which took
effect in 2008 and defines the AEC. The biggest and most indispensable challenge for

7
accomplishment of the Blueprint is to ensure implementation in each member country. Besides,
the ASEAN evaluates and reports the progress in implementation by members. The ASEAN
Scorecards, which are to monitor the implementation of the Blueprint, have not been disclosed
publicly. It might be necessary to disclose the progresses made under the Blueprint in order to
successfully achieve the AEC.
3. The Objectives of this Research Project
This research project is an extension of the research conducted over the last two years. An
ERIA test-run project “Deepening Economic Integration” in FY2007 recognized the ASEAN’s
initiatives toward establishing the AEC as a crucial step in deepening economic integration in
East Asia. In the second phase of the project, conducted in FY2008, quantitative measures
regarding key policy pillars in the AEC Blueprint were developed, in order to complement the
AEC Scorecard being developed by the ASEAN Secretariat. These quantitative measures can be
described as an ERIA version of the AEC Scorecard (ERIA/AEC Scorecard). The project
focused on the restrictions in the three core elements, categorized into a key characteristic of
“Single market and production base”, that is, trade in services, trade facilitation and FDI policy,
and examined the current state of policy across countries and the changes over-time change
within countries. Building on these studies, this project aims to extend and update the
quantitative measures on the above three core elements in order to trace the progress toward the
AEC over a wider range of sectors and time. Our quantitative measures are designed 1) to
visualize the process of policy reforms, following the AEC Blueprint; 2) to provide a framework
on which milestones and end goals of each element can be defined; and 3) to evaluate the current
state and the progress vis-à-vis the milestones and end goals.
The most important aspect of our quantitative measures is their use as an indicator of progress
towards goals, rather than a ranking across countries. The expected role of our quantitative
measures is to facilitate the implementation of the AEC Blueprint. In the process of
implementing of the Blueprint, the progress should be indicated on the road toward the goals in
order to ensure that all members continue implementing the necessary policy measures, and to

8
prevent any member countries from falling behind. The quantitative measures can play a useful
role in providing the milestones and signposts to achieve the goals.
The quantitative measures are also useful for econometric analysis of regulations/ liberalization
in each sector. Since the quantitative measures are based on detailed research, on refined
classifications for each sector, we can investigate the different impacts of policy reforms, as
outlined by the Blueprint, with for the purpose of deriving implications of how to prioritize and
improve the wide-ranging policy reforms in the Blueprint.
In addition, when we look at the Blueprint and its quantitative measures from the view point of
mechanism design, we can utilize the quantitative measures to improve the mechanism of
realizing the AEC designed by the Blueprint. The key to success in creating the AEC is that the
mechanism designed by the Blueprint should provide the member countries incentives to
implement it. The quantitative measures enable us to assess the degree of progress made toward
achieving the AEC and to identify the problem of the mechanisms applied in the member
countries. In other words, we can check whether the mechanism fulfill both incentive
compatibility and participation constraints for all member countries by using the quantitative
measures.
This project consists of studies on three elements as noted above, that is, the quantitative
measures relating to the degree of free flow of services, free flow of goods and free flow of
investment. Regarding the degree of free flow of services investigated by Philippa Dee (Chapter
2 of this report), air transportation service, maritime transportation service, and
telecommunication services are studied by developing restrictiveness indices. As for the degree
of free flow of goods, analysis on logistics service liberalization focusing on custom procedures
and national Single Windows, is conducted by Philippa Dee (Chapter 2), while trade cost
estimation between ASEAN countries and major trading partners is undertaken by Patricia
Sourdin and Richard Pomfret (Chapter 3). The study on trade cost provides restrictiveness
indices of trade facilitation systems, and quantitative measures on the cost of trade in goods. Air
transportation service and logistics service are listed among the priority integration sectors of the
ASEAN Framework Agreement on Services (AFAS). In terms of the degree of free flow of
investment, studies on the quantitative measures of FDI restriction and investment-related issues
are conducted by Shujiro Urata and Mitsuyo Ando (Chapter 4). They present assessments of FDI

9
policy regimes and the FDI policy environments of the ASEAN member countries. Chapter 5
provides background data, which were used to construct our quantitative measures for Chapters 2
to 4. The data are developed by working with country study members and research members of
this project.
4. Key Findings in Each Study on Three Core Elements
4.1 Free Flow of Services
Promotion of the free flow of services is an essential factor in the realization of free flow of
goods and investment, capital and skilled labor, which are core elements for one of the principal
pillars of the single market and production base defined by the ASEAN Blueprint. The ASEAN
Framework Agreement on Services (AFAS), which were signed in 1995, defined that the object
of liberalization in trade in services as being to improve the efficiency and competitiveness of
services, increase their production capacity, and diversify sources of service supply and
destinations of service demand within and outside ASEAN3
Dee (2010) examines three key service sectors, namely air transport, maritime services, and
telecommunications services, to map the existing policy space
. The share of service sectors in
industrial structures has increased in most of the member countries of the ASEAN, and thus
improvement of service sector competitiveness is one of the critical issues in this region.
4. Mapping actual policies in these
examinations helps to indicate the extent of real policy reform that will be needed in each
ASEAN member country in order to achieve the liberalization laid out in the AEC Blueprint.
There are significant challenges associated with examination of the degree of liberalization of
service sectors from the view of policy regimes. First, there are vast amounts of information
related to regulations and treatments of the service sector5
3 See for details, http://www.aseansec.org/6628.htm 4 Dee (2010) also investigates the implementation of the ASEAN Single Window. This is more related to the section 1.5, free flow of goods, and we review the results of this sector in section 1.5. 5 These regulatory restrictions preventing integration are categorize as follows; Derogations from national treatment which causes discrimination against foreign providers, limitations on market access which limits the number of service suppliers, service transactions, people employed and foreign equity participation, and anti-competitive domestic regulation.
. Service trades are classified into 4
modes, i.e., cross-border trade (mode1), consumption abroad (mode2), commercial presence

10
(mode3) and movement of natural persons (mode4). We need to study administrative documents
and other information on all modes for each service sector. Second, we must collect necessary
information, based on interviews with sectoral experts in order to clarify the actual situation and
to obtain correct interpretation because administrative documents and other information on
service trade often includes many technical issues and much technical language, particularly on
transportation and telecommunication services. It is also necessary to pay careful attention to
differences between the engineering approach and the economic approach. Dee (2010) has
collected the information on actual policies by using questionnaires, which were completed for
each ASEAN economy over the period September 2009 to March 2010 by researchers contracted
by ERIA.
4.1.1 Air transport services
Air transport service is one of the priority sectors under the AEC Blueprint. Recognizing the
cost of restriction imposed by air services agreements, a growing number of countries are
negotiating more liberal agreements. Also domestic aviation services have been liberalized in
ways such as allowing additional entry on domestic routes, and privatization of government-
owned carriers. The questionnaire studies by Dee (2010) cover actual barriers to trade in air
transport services. Table 3 presents an extract of the scorecard for air transport by Dee (2010).

11
Table 3: Score of Restrictions on Trade in Air Transport Services (%)
Source: Excerpt from Table 2 inDee (2010)
Bru
nei
Cam
bodi
a
Indo
nesi
a
Lao
PD
R
Mal
aysi
a
Mya
nmar
Phi
lippi
nes
Sin
gapo
re
Tha
iland
Vie
tnam
Ave
rage
S.D
.
A. Commercial presence (mode 3) 18 9 0 55 32 27 0 18 0 18 18 17.2
B. Cross-border trade (Mode 1) 33 33 100 33 67 33 100 0 33 33 47 32.2
C. Movement of persons (mode 4) – intra-corp. transferees 100 50 100 50 100 50 50 0 50 50 60 31.6
E. Ownership 54 73 45 67 72 44 26 2 24 80 49 25.6
F. Regulation 24 16 21 32 16 37 21 5 21 68 26 17.2
TOTAL 40 44 32 55 51 38 22 6 19 61 37 17.3

12
From the result, we find that only two countries; Singapore and Thailand have so far ratified
the ASEAN Multilateral Agreement. Meanwhile, Indonesia and the Philippines have retained to
impose restrictions on international and domestic charter flights, although charter flights are not
as significant factors in the competitive pressures as they used to be. Dee (2010) also examines
the restrictions on commercial presence (mode 3). Giving an example of Singapore she points
out that effective liberalization of mode 3 in air services not only requires the reform of
investment law, but also requires the reform of withholding clauses in air services.
Although most ASEAN countries appear relatively liberal, there are still remaining barriers,
which are becoming increasingly to prevent effective competition. In addition, government
subsidies of domestic airlines are still one of remaining problems.
4.1.2 Maritime Services
Regulatory restrictions on shipping services have been shown to be costly, particularly to
developing countries. Also, regulatory restrictions on port services inflate the cost of maritime
shipping. Improvement of maritime services by elimination of restrictions and promotion of
competition are also considered an important pillar of the ASEAN as a single market.
Dee (2010) examines restrictions on the entry of new service providers and restrictions on the
legal form of establishment, in a variety of maritime services separately; international shipping,
cabotage, internal waterways, port superstructure, cargo handling services, storage and
warehousing, freight forwarding, pilotage, towing and tying, and the maintenance and repair of
vessels. Table 4 is excerpted from Table 4 in Dee (2010) and presents summary restrictiveness
scores.

13
Table 4: Score of Restrictions on Trade in Maritime Services (%)
Source: Excerpt from Table 4 in Dee (2010)
Cam
bodi
a
Indo
nesi
a
Mal
aysi
a
Mya
nmar
Phi
lippi
nes
Sin
gapo
re
Tha
iland
Vie
tnam
Ave
rage
Movement of intra-corporate transferees (mode 4) 71.7 33.3 61.7 68.3 58.3 45.0 68.3 55.0 57.7INTERNATIONAL SHIPPING (TOTAL) 14.3 28.6 26.9 20.0 24.9 2.9 31.5 40.0 23.6CABOTAGE (TOTAL) 13.0 26.2 36.5 52.2 30.4 na 27.8 54.3 34.4INTERNAL WATERWAYS (TOTAL) 0.0 53.3 22.7 73.3 40.0 na 36.0 30.1 36.5PORT SUPERSTRUCTURE (TOTAL) 41.7 16.8 11.7 75.0 35.0 66.7 16.8 29.3 36.6CARGO HANDLING (TOTAL) 0.0 16.8 11.7 16.7 26.7 0.0 16.8 29.3 14.7STORAGE AND WAREHOUSING (TOTAL) 0.0 16.8 11.7 16.7 10.0 66.7 16.8 29.3 21.0FREIGHT FORWARDING (TOTAL) 0.0 16.8 11.7 16.7 26.7 0.0 16.8 29.3 14.7PILOTAGE, TOWING AND TYING (TOTAL) 91.7 50.0 11.7 91.7 26.7 66.7 16.8 66.7 52.7MAINTENANCE AND REPAIR (TOTAL) 0.0 16.8 11.7 16.7 18.3 0.0 16.8 29.3 13.7PORT OPERATION (TOTAL) 47.9 49.2 6.3 50.4 58.3 16.7 36.0 52.1 39.6TOTAL 21.9 30.8 19.2 41.9 31.8 17.6 26.5 41.1 28.9

14
Regarding restrictions on trade in mode 1, only three countries; Cambodia, Indonesia and
Thailand have stated that they will grant exemptions from cargo restrictions. Concerning
restrictions on mode 3, there is no ASEAN economy meeting the Blueprint target by 2010 in all
maritime services. In most countries, port operations are still government-owned. Dee (2010)
points out that a half of the ASEAN countries retain discriminatory licensing conditions for
foreign suppliers.
4.1.3 Telecommunication services
Actual barriers on those telecommunication services recognized as being trade-impeding are
investigated in Dee (2010). Restrictions on the entry of new service providers are examined for a
variety of telecommunication services separately; that is, domestic fixed line services,
international services, mobile services using various technologies, data services, leased lines,
internet access services and Voice over Internet Protocol telephony. Table 5 is excerpted from
Table 6 in Dee (2010) and presents a summary restrictiveness scores.
Table 5: Score of Restrictions on Trade in Telecommunication Services (%)
Source: Excerpt from Table 6 in Dee (2010)
Bru
nei
Cam
bodi
a
Indo
nesi
a
Lao
PD
R
Mal
aysi
a
Mya
nmar
Phi
lippi
nes
Sin
gapo
re
Tha
iland
Vie
tnam
Ave
rage
FACILITIES-BASED SERVICES (TOTAL) 20 24 18 94 20 80 22 0 21 18 32A. Commercial presence (mode 3) 4 35 4 96 4 96 0 0 4 4 25B. Cross-border trade (mode 1) 0 100 100 100 100 100 50 0 50 50 65C. Ownership 26 17 19 92 26 70 30 0 26 25 33D. Regulation - licensing 100 4 100 100 0 100 100 0 100 0 60
RESALE-BASED SERVICES (TOTAL) 18 45 17 99 20 96 23 1 3 18 34A. Commercial presence (mode 3) 4 62 4 96 4 96 0 0 4 4 27B. Cross-border trade (mode 1) 0 100 100 100 100 100 100 0 50 50 70C. Ownership 26 33 19 100 26 95 30 0 0 25 35D. Regulation - licensing 100 73 100 100 0 100 100 50 0 0 62
LEASED LINES AND PRIVATE NETWORKS (TOTAL) 22 22 33 11 33 11 0 33 44 22 23A. Commercial presence (mode 3) 22 22 33 11 33 11 0 33 44 22 23
GENERAL (TOTAL) 34 42 23 59 52 92 58 44 52 43 50D. Regulation - licensing 50 50 75 50 50 75 25 25 50 50 50D. Regulation - other 23 45 15 65 55 95 73 55 55 45 53Market structure 92 8 8 33 33 92 8 0 33 17 33
TOTAL 21 35 19 87 25 85 26 8 19 21 35

15
Regarding restrictions related to the targets of the ASEAN Blueprint, a majority of countries
score poorly on restrictions on mode 1 trade. However, Dee (2010) points out that the relevant
restriction on mode1 trade in telecommunication services is by now a technical restriction that
has very little real relevance. As for the existence of foreign equity limits on investment in
telecommunication service providers, only two countries; Singapore and Vietnam, currently meet
the Blueprint’s target. Dee (2010) indicates that most countries are relatively even-handed in
their regulation of facilities-based and resale-based services, however, only a minority of
ASEAN countries have moved comprehensively to general rather than individual licensing of
telecommunications providers.
4.2 Free Flow of Goods
As stated in the ASEAN Blueprint, a single market for goods and services will facilitate the
development of production networks in the ASEAN and enhance ASEAN’s capacity as a part of
the global supply chain; therefore, free flow of goods which is one of the principal means of
achieving a single market and production base is regarded as an indispensable element. A broad
range of issues is encompassed in the scope of the free flow of goods indicated in the ASEAN
Blueprint, not only the elimination of tariffs on all intra-ASEAN goods, but also non-tariff
barriers6
6 ASEAN Trade In Goods Agreement signed in 2009 sets out the details of schedules of elimination of non-tariff barriers. See (http://www.aseansec.org/22223.pdf).
, rules of origin, trade facilitation by customs procedures and related information flows,
customs integration, the ASEAN Single Window, and standards and technical barriers. Our
project has conducted research on the progress of trade facilitation in each ASEAN country by
examining two issues, that is, an examination of implementation status of the ASEAN Single
Window in each country, and quantitative analysis of trade costs between ASEAN countries and
outside major trading partners. Examination of the implementation of the ASEAN Single
Window by Dee (2010) is conducted by questionnaires as the previous section, while
quantitative analysis on trade costs by Sourdin and Pomfret (2010) used commodity trade
statistics classified by transportation mode. The former deals with the Single Window program,
in which concrete schedules and actions are set in the Blueprint, and the latter is relevant to the

16
more comprehensive issues of trade facilitation, including not only transaction cost related trade
in goods, but also the productivity of transportation services.
4.2.1 The ASEAN Single Window
Dee (2010) examines the status of implementation of the ASEAN Single Window in the same
way as in the previous section 4.1 on studies on the other service sectors. Based on
questionnaires covering customs clearance about implementation of the National Single
Windows and on cooperation to achieve and the ASEAN Single Window, the current status of
implementation of the National Single Windows in member countries, transparency and due
process, and each country’s participation in regional cooperation efforts toward an ASEAN
Single Window are examined. Table 6 is a summary of the scorecards on implementation of
ASEAN Single Window of each country, excerpted from Table 8 in Dee (2010)7
All countries are participating in regional cooperation efforts to simplify and harmonize
customs clearances and to introduce mutual recognition of conformance assessments, and most
countries are participating in efforts to introduce National Single Windows and integrate these
into and ASEAN Single Window. However, there are variations which are caused by differences
of levels of development, such as the degree of usage of electronic filing of customs
documentation. In general, Dee (2010) points out that although most ASEAN counties are
relatively transparent about their trade regulations, very few are fully transparent about ex post
performance such as measures of customs clearance time.
.
7 Contrary to the restriction indexes of 4.1, this index is an implementation index. Thus a higher score denotes a ‘better’ rather than a ‘worse’ outcome. See more details Dee (2010).

17
Table 6: Summary of implementation of ASEAN Single Window (%)
Source: Excerpt from Table 8 in Dee (2010)
Bru
nei
Cam
bodi
a
Indo
nesi
a
Lao
PD
R
Mal
aysi
a
Mya
nmar
Phi
lippi
nes
Sin
gapo
re
Tha
iland
Vie
tnam
Ave
rage
I. National Policy 73 45 78 43 83 48 90 60 81 46 64
A. National Single Window 73 38 65 42 81 50 92 62 78 47 63
B. Transparency and due process 71 57 100 43 86 43 86 57 86 43 67
II. Regional Cooperation 90 90 90 90 90 80 100 100 90 90 91
TOTAL 76 54 80 52 84 54 92 68 83 54 70

18
4.2.2 Trade cost in the ASEAN member countries.
Sourdin and Pomfret (2010) develop a composite indicator of trade cost for each individual
ASEAN countries based on the gap between cif (cost insurance, freight) and fob (free on board)
values at the HS6 digit level of ASEAN exports to third countries; namely, Australia, Brazil,
Chile and the U.S. Although the cif/fob measures should be treated as a benchmark rather than a
perfect indicator to capture the impact of a country’s commitment to trade facilitation, this
measurement of trade cost is suitable as an operational definition using universally acceptable
concepts, and approximating the cost of international trade as it includes transport and logistics
costs, which may be driven by technical improvements as well as by improved policies and
procedures. Table 7 shows the average trade cost of ASEAN countries.
On average, the trade cost of ASEAN countries has been on a declining trend between 1990-
2008 as a whole. Sourdin and Pomfret (2010) also find that ad valorem trade cost for imports
arriving by air are lower than by sea, and fell slightly faster compared to imports arriving by sea.
In addition, they pointed out that variation in trade costs in the ASEAN countries appears to be
converging to the lowest cost country, Singapore. Building on the calculation of the trade cost in
the ASEAN countries, Sourdin and Pomfret (2010) conduct a regression analysis to find the
determinants of ad valorem trade cost. They find that the longer the distance of transport and the
larger the degree of bulkiness of an imported product, the more trade cost increases. By contrast,
the larger the size of bilateral imports, the smaller the trade cost found. This result indicates the
presence of a scale effect in trade cost. In addition, the low level of general quality of institutions
and infrastructure of the ASEAN countries increases trade cost for seaborne only. These results
suggest that efficient logistics and distributions, as well as besides improvement of quality of
institution and infrastructure are important factors for trade cost reduction particularly in trade by
sea, which is still major means of transportation of goods.
Based on the analysis of trade costs in ASEAN countries, Sourdin and Pomfret (2010) draw an
implication for the scorecards being developed by the ASEAN secretariat to achieve the AEC
Blueprint. They suggest the importance of an indicator, which can be used to provide the
benchmark of best practice for reducing trade cost.

19
Table 7: Average trade cost of ASEAN countries during 1990-2008.
Source: Sourdin and Pomfret (2010)
Year Brunei Indonesia KHM Lao PDR Myanmar Malaysia Philippines Singapore Thailand Vietnam ASEAN
1990 0.072 0.102 0.176 0.104 0.049 0.05 0.074 0.03 0.059 0.072 0.054
1995 0.045 0.073 0.077 0.08 0.048 0.032 0.052 0.021 0.046 0.067 0.039
2000 0.062 0.082 0.066 0.076 0.051 0.035 0.039 0.022 0.062 0.069 0.045
2005 0.047 0.079 0.061 0.033 0.054 0.032 0.05 0.028 0.059 0.08 0.048
2006 0.043 0.069 0.064 0.029 0.045 0.03 0.047 0.026 0.055 0.072 0.045
2007 0.035 0.064 0.055 0.051 0.045 0.031 0.045 0.026 0.047 0.067 0.043
2008 0.036 0.059 0.056 0.048 0.05 0.032 0.047 0.028 0.047 0.066 0.044
20
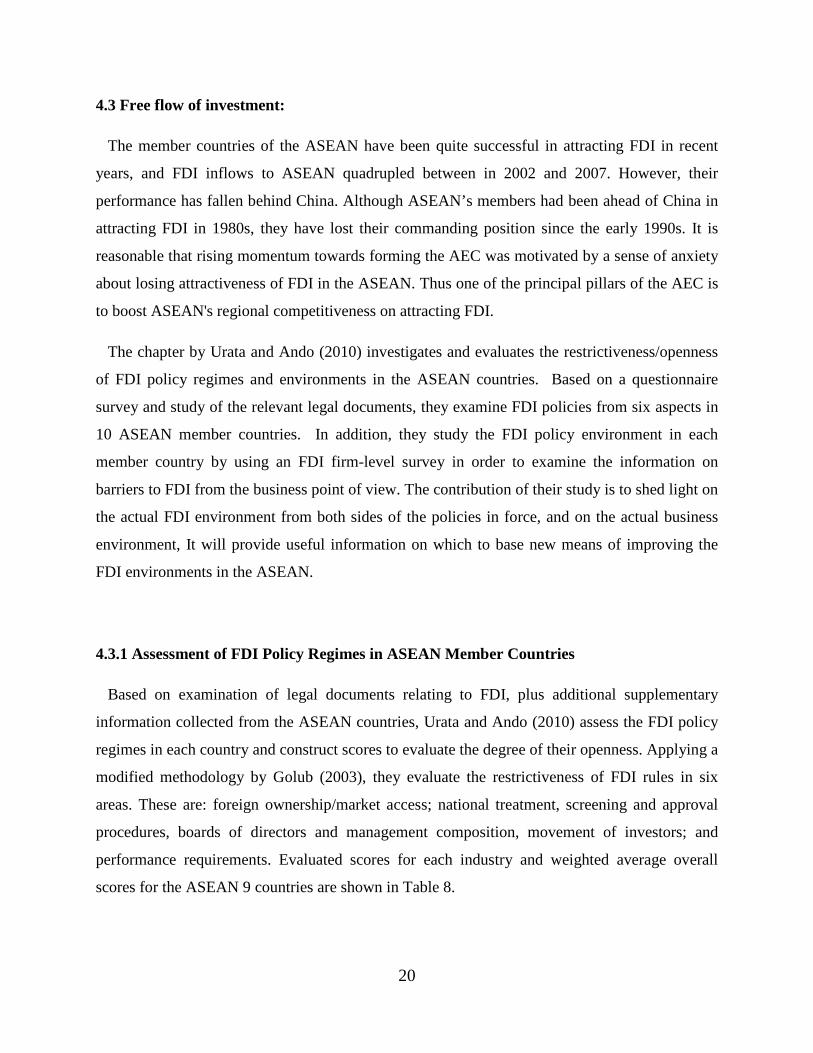
4.3 Free flow of investment:
The member countries of the ASEAN have been quite successful in attracting FDI in recent
years, and FDI inflows to ASEAN quadrupled between in 2002 and 2007. However, their
performance has fallen behind China. Although ASEAN’s members had been ahead of China in
attracting FDI in 1980s, they have lost their commanding position since the early 1990s. It is
reasonable that rising momentum towards forming the AEC was motivated by a sense of anxiety
about losing attractiveness of FDI in the ASEAN. Thus one of the principal pillars of the AEC is
to boost ASEAN's regional competitiveness on attracting FDI.
The chapter by Urata and Ando (2010) investigates and evaluates the restrictiveness/openness
of FDI policy regimes and environments in the ASEAN countries. Based on a questionnaire
survey and study of the relevant legal documents, they examine FDI policies from six aspects in
10 ASEAN member countries. In addition, they study the FDI policy environment in each
member country by using an FDI firm-level survey in order to examine the information on
barriers to FDI from the business point of view. The contribution of their study is to shed light on
the actual FDI environment from both sides of the policies in force, and on the actual business
environment, It will provide useful information on which to base new means of improving the
FDI environments in the ASEAN.
4.3.1 Assessment of FDI Policy Regimes in ASEAN Member Countries
Based on examination of legal documents relating to FDI, plus additional supplementary
information collected from the ASEAN countries, Urata and Ando (2010) assess the FDI policy
regimes in each country and construct scores to evaluate the degree of their openness. Applying a
modified methodology by Golub (2003), they evaluate the restrictiveness of FDI rules in six
areas. These are: foreign ownership/market access; national treatment, screening and approval
procedures, boards of directors and management composition, movement of investors; and
performance requirements. Evaluated scores for each industry and weighted average overall
scores for the ASEAN 9 countries are shown in Table 8.

21
Table 8: Restrictions on FDI rules by six areas.
Source: Urata and Ando (2010)
Note: Scores of service are simple average of all service sectors. The higher the values are, the higher the restrictions are imposed.
Brunei Cambodia Indonesia Lao, PDR Malaysia Myanmar Philippines Singapore Thailand Vietnam Average Standard deviation
Market access, total 0.24 0.14 0.36 0.39 0.32 0.38 0.26 0.20 0.42 0.34 0.31 0.09Agriculture, forestry and fishing 0.10 0.10 0.40 0.50 0.10 0.45 0.35 0.00 0.50 0.20 0.27 0.19Mining and quarrying 0.02 0.20 0.04 0.30 0.20 0.55 0.30 0.00 0.34 0.10 0.21 0.17Manufacturing 0.05 0.10 0.21 0.27 0.13 0.09 0.10 0.00 0.16 0.05 0.12 0.08Services 0.26 0.15 0.44 0.38 0.39 0.42 0.29 0.26 0.49 0.42 0.35 0.11
National treatment, total 0.80 0.18 0.20 0.41 0.83 0.40 0.28 0.14 0.00 0.26 0.35 0.27Agriculture, forestry and fishing 0.75 0.00 0.00 0.75 1.00 0.75 0.75 0.00 0.00 0.00 0.40 0.43Mining and quarrying 0.75 0.75 0.00 0.00 1.00 0.40 0.75 0.00 0.00 0.15 0.38 0.40Manufacturing 0.75 0.00 0.14 0.00 0.78 0.04 0.00 0.03 0.00 0.05 0.18 0.31Services 0.81 0.19 0.25 0.43 0.92 0.45 0.21 0.19 0.00 0.33 0.38 0.29
Screening & appraisal, total 0.43 0.62 0.79 0.61 0.25 0.92 0.11 0.15 0.50 0.36 0.48 0.27Agriculture, forestry and fishing 0.00 0.75 0.75 0.50 0.10 0.90 0.10 0.00 0.50 0.35 0.40 0.34Mining and quarrying 0.18 0.10 0.75 0.50 1.00 0.97 0.10 0.00 0.50 0.70 0.48 0.37Manufacturing 0.19 0.10 0.75 0.50 0.21 0.90 0.00 0.01 0.50 0.15 0.33 0.31Services 0.52 0.66 0.80 0.61 0.25 0.92 0.13 0.20 0.50 0.40 0.50 0.26
Board of directors, total 0.59 0.00 0.31 0.25 0.40 0.40 0.52 0.36 0.00 0.29 0.31 0.19Agriculture, forestry and fishing 0.50 0.00 0.25 0.00 0.10 0.10 0.50 0.25 0.00 0.25 0.20 0.19Mining and quarrying 0.50 0.00 0.05 0.00 0.10 0.46 0.50 0.25 0.00 0.05 0.19 0.22Manufacturing 0.50 0.00 0.14 0.00 0.21 0.14 0.50 0.25 0.00 0.00 0.17 0.20Services 0.62 0.00 0.38 0.27 0.50 0.47 0.53 0.39 0.00 0.36 0.35 0.21
Movement of investors, total 0.18 0.75 0.55 0.79 0.56 0.71 0.04 0.07 0.81 0.47 0.49 0.30Agriculture, forestry and fishing 0.00 0.75 0.50 0.75 0.60 0.60 0.00 0.00 1.00 0.40 0.46 0.36Mining and quarrying 0.00 0.75 0.50 0.75 0.60 0.76 0.00 0.00 0.95 0.25 0.46 0.36Manufacturing 0.00 0.75 0.50 0.75 0.30 0.62 0.00 0.00 0.79 0.20 0.39 0.33Services 0.24 0.75 0.56 0.79 0.64 0.74 0.06 0.10 0.79 0.54 0.52 0.29
Performance requirement, total 0.18 0.12 0.26 0.25 0.23 0.28 0.11 0.09 0.00 0.15 0.17 0.09Agriculture, forestry and fishing 0.00 0.10 0.10 0.00 0.25 0.00 0.25 0.00 0.00 0.10 0.08 0.10Mining and quarrying 0.00 0.25 0.10 0.00 0.10 0.40 0.25 0.00 0.00 0.05 0.12 0.14Manufacturing 0.00 0.10 0.14 0.10 0.34 0.04 0.25 0.00 0.00 0.05 0.10 0.11Services 0.24 0.11 0.30 0.25 0.26 0.35 0.09 0.12 0.00 0.19 0.19 0.11
0.394 0.242 0.375 0.428 0.438 0.463 0.237 0.175 0.300 0.315 0.339 0.100Total Score of all sectors

22
As Urata and Ando (2010) point out, ASEAN countries have restrictive FDI regimes in the
areas of the movement of investors and the screening and appraisal procedures, and there are
wide variations in scores for these areas, and for national treatment, among countries.
Restrictions on market access is considered to be the most important policy towards inward FDI,
and regulations are rather relaxed in manufacturing sector compared to the high levels of
restriction found in the public sectors and service sectors. Although variations among countries
are found, tight restrictions are often imposed in service sectors such as information and
communication.
The examination on FDI regimes by Urata and Ando (2010) clearly shows that the degree of
restriction/openness varies widely by country and sectors. They suggest that screening and
appraisal which are found to be serious impediments in many countries, and market access
regulations which are more restrictive in service sectors, should be improved. Service sectors, in
particular, have taken up an important role in economic activity in ASEAN countries; therefore
provision of greater market access should be improved in order to promote allocative and
technical efficiency.
Urata and Ando (2010) analyze the FDI environment of ASEAN countries by using the
information from a survey conducted on Japanese firms8
8 The survey were “Issues and Request for Trade and Investment Activities by Country/Region” conducted by the Japan machinery Center (JMC) for Trade and Investment. See more details in Chapter 4, Urata and Ando (2010).
. They categorize the problems and
obstacles faced by Japanese firms operating in ASEAN countries into two groups, each
consisting of four categories of problems related to FDI liberalization and six categories of
problems related to FDI facilitation, based on literature surveys and discussions. Table 9
compares the results of their analysis in 2009, 2008 and 2005.

23
Table 9: Assessment of FDI Invest Climate of ASEAN Countries by ten categories, in 2005, 2008 and 2009.
Source: Urata and Ando (2010)
Total
2009 2005 2009 2008 2009 2005 2009 2008 2009 2005 2009 2008 2009 2005 2009 2005 2009 2005 2009 2005 2009
(a) The number of Japanese affiliates in each country 1 10 659 6 759 10 419 991 1,577 332 4,764
(b) Issues to be solved for FDI liberalization and facilitationFDI liberalization 0 0 0 0 17 10 0 0 11 17 8 7 10 11 1 3 19 16 8 16 138
i) Restrictions on foreign entry 0 0 0 0 10 5 0 0 5 4 2 2 7 6 0 1 8 6 3 5 59
ii) Performance requirements 0 0 0 0 3 2 0 0 3 5 0 0 0 2 0 0 3 1 2 5 21
iii) Restrictions on overseas remittances and controls on foreign currency transactions 0 0 0 0 2 1 0 0 1 4 6 5 2 1 0 0 5 3 2 4 32
iv) Restrictions on the movement of people and employment requirements 0 0 0 0 2 2 0 0 2 4 0 0 1 2 1 2 3 6 1 2 26
FDI facilitation 0 1 14 16 51 52 4 4 44 36 20 21 42 37 6 6 50 53 58 34 515
v) Lack of transparency in policies and regulations concerning investment (institutional problems) 0 1 5 5 13 14 0 1 13 10 8 8 7 10 0 1 12 14 18 6 140
vi) Complicated and/or delayed procedures with respect to investment-related regulations (implementation problems) 0 0 3 5 23 21 1 1 14 14 7 7 16 12 0 0 24 24 19 14 191
vii) Insufficient protection of intellectual property rights 0 0 0 0 1 4 0 0 2 3 0 0 3 1 0 0 1 2 1 2 18
viii) Labor regulations and related practices excessively favorable to workers 0 0 0 0 2 3 0 0 5 5 0 0 10 6 3 3 3 3 4 2 47
ix) Underdeveloped infrastructure, shortages of human resources, and insufficient investment incentives 0 0 6 6 9 8 3 2 8 4 5 5 6 8 3 2 9 9 13 8 106
x) Restricted competition and price controls 0 0 0 0 3 2 0 0 2 0 0 1 0 0 0 0 1 1 3 2 13
Total 0 1 14 16 68 62 4 4 55 53 28 28 52 48 7 9 69 69 66 50 653
MalaysiaLaosIndonesiaCambodiaBrunei Viet NamThailandSingaporePhilippinesMyammar
24
Their results show that various sorts of indirect barriers to FDI exist in this region,
and the main problems are concerned with FDI facilitation. They point out that this
result indicates that there is plenty of room to improve FDI facilitation in order to
promote inward FDI in ASEAN. In particular, institutional problems such as lack of
transparency and implementation problems such as complicated procedures, need to
be resolved to promote investment activity. They also find that an access to the
necessary infrastructure, human resources, and investment incentives are important
factors for firms in making the decision for entering a new market or expanding
operations. Compared to the results of their previous studies (Urata, Ando and Ito
(2007) and Urata and Ando (2009)), it is found that seven countries in ASEAN as a
whole experienced a decline in the number of issues directly hindering FDI, while
they saw the increase in the number of issues indirectly doing so. They point out that
this result suggests that improvement of the FDI investment climate has been
achieved in ASEAN, but that more indirect barriers to FDI have emerged.
Judging from the lower number of the incidents concerning FDI related problems
faced by Japanese firms compared to the previous year, ASEAN economies, on the
whole seem to have improved their explicit FDI climate. However, their challenge is
to remove indirect barriers to FDI, which still remain and have even increased.
Addressing these challenges are steps toward the realization of the ASEAN’s short
and middle term goal, than is, to become an FDI-attractive region.
5. Policy Implications
The ERIA research project “Tracing the progress toward the ASEAN Economic
Community” has aimed to evaluate the degree of implementation of the ASEAN
Blueprint particularly in the free flow of service, goods and investment. Our
quantitative measure is conducted by applying various methods such as
questionnaires, statistical analyses, and firm-level surveys with close collaboration
with many researchers from various countries including 10 ASEAN countries in
order to ensure the objectivity and stringency of the analysis. Below we review and
25
summarize several policy implications of each study, then discuss on overall research
results.
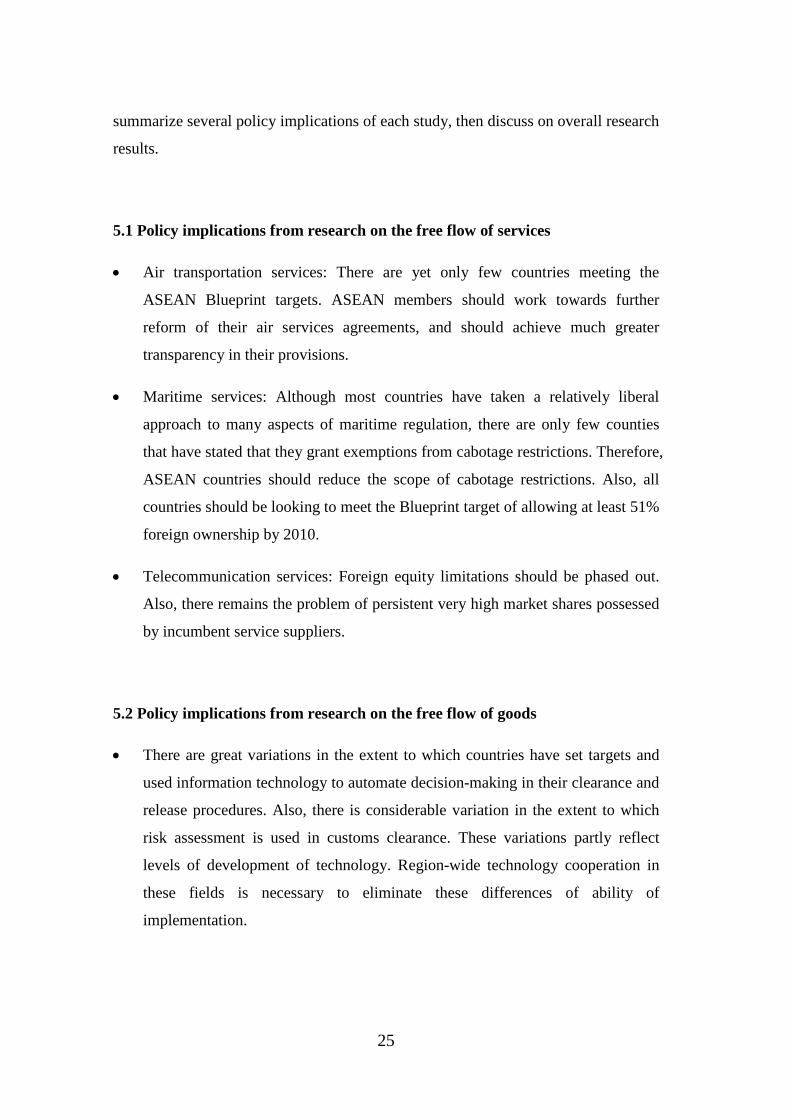
5.1 Policy implications from research on the free flow of services
• Air transportation services: There are yet only few countries meeting the
ASEAN Blueprint targets. ASEAN members should work towards further
reform of their air services agreements, and should achieve much greater
transparency in their provisions.
• Maritime services: Although most countries have taken a relatively liberal
approach to many aspects of maritime regulation, there are only few counties
that have stated that they grant exemptions from cabotage restrictions. Therefore,
ASEAN countries should reduce the scope of cabotage restrictions. Also, all
countries should be looking to meet the Blueprint target of allowing at least 51%
foreign ownership by 2010.
• Telecommunication services: Foreign equity limitations should be phased out.
Also, there remains the problem of persistent very high market shares possessed
by incumbent service suppliers.
5.2 Policy implications from research on the free flow of goods
• There are great variations in the extent to which countries have set targets and
used information technology to automate decision-making in their clearance and
release procedures. Also, there is considerable variation in the extent to which
risk assessment is used in customs clearance. These variations partly reflect
levels of development of technology. Region-wide technology cooperation in
these fields is necessary to eliminate these differences of ability of
implementation.

26
• There is room for improvement in transparency relating to ex-post performance.
In addition, the publication of clearance times would provide the acid test as to
whether ASEAN cooperation efforts were achieving their ultimate aims.
• Judging from estimations of trade cost in ASEAN countries, ad valorem trade
costs have a tendency to decrease and converge to the lowest-cost country. For
further reduction of this trade cost, efficiency of logistics and distributions
sectors, and quality of infrastructure related to transportation such as port
infrastructure, roads and railroad should be generally improved.
5.3 Policy implications from research on the free flow of investment
• In order to promote FDI policy liberalization, the ASEAN countries should use
various existing frameworks. In particular, ASEAN should use the ASEAN
Comprehensive Investment Agreement (ACIA).
• To overcome obstacles concerning FDI facilitation, the ASEAN countries
should actively use various cooperation programs with developed countries to
improve the human resources engaged in the implementation and enforcement of
FDI policies.
• Monitoring of the achievement of FDI liberalization and facilitation has to be
emphasized, in order to achieve a freer FDI environment.
5.4 General discussion
There is still a lot of variation in the progress of elimination of restrictions among
the ASEAN on the whole. The research results of each chapter suggest that many
direct or indirect restrictions still remain and lack of transparency impedes goods,
services and investment from movement freely in this region. Judging from overall
results, ASEAN members should make greater efforts toward the goal of the ASEAN
Blueprint as scheduled, and should promote regional corporation. For this purpose,
monitoring system by using quantitative measures should be constructed for all

27
elements of the ASEAN Blueprint in order to highlight concrete policy measures
required. In addition, the information on quantitative measures should be made
available for the public, so that not only policy makers, but also private sectors and
consumers may understand the situation correctly.
Furthermore, there are more than a few cases in which the differences in the levels
of economic development impede the ASEAN members from acting in concert for
the introduction of new technology and systems toward regional integration such as
the ASEAN Single Window project. The ASEAN members should strengthen
technology cooperation necessary for regional integration such as introducing a
common electronic filing system of customs documents, development of
port/road/railroad infrastructure, in order to decrease the gap of ability of
implementation of common integration among the member countries.
References
Asian Development bank (2009), Asian Development Outlook 2009 Update:
Broadening Openness for a Resilent Asia.
Asian Development Bank (2009), Asia Economic Monitor December 2009, Manila,
Philippines http://aric.adb.org/pdf/aem/dec09/Dec_AEM_complete.pdf.
Dee, P., 2010, Services Liberalization toward the ASEAN Economic Community,
Chapter 2 of this report.
Kawai, M., 2008, Global Financial Crisis and Implications for ASEAN, ASEAN
Studies Centre Report No. 6, 2009, Institute of Southeast Asian Studies,
Singapore.
Soesastro, H., 2007, Implementing the ASEAN Economic Community Blueprint,
ERIA Research Project Report 2007, No.1-2, Chapter 3.
Sourdin, P. and Pomfret, R., 2010, Trade Facilitation toward the ASEAN Economic
Community, Chapter 3 of this report.
Urata, S. and Ando, M., 2010, Investment Climate Study of ASEAN Member
Countries, Chapter 4 of this report.
World Bank, 2010, Global Economic Prospects 2010: Crisis, Finance, and Growth.
Washington, D.C.: January 21,http://go.worldbank.org/OE8NEB3JP0.

28
CHAPTER 2
Services Liberalization
toward the ASEAN Economic Community
PHILIPPA DEE Crawford School of Economics and Government
The Australian National University
The purpose of this paper is to map the existing policy space in three key services sectors — air transport, maritime services (both shipping and port services), and telecommunications services — as well as to provide evidence on whether the implementation of the ASEAN Single Window is helping to achieve the broader objectives of the revised Kyoto Convention on customs procedures. By mapping actual policies, the paper gives an indication of the extent of real policy reform that will be needed in each ASEAN member country in order to achieve the liberalization targets laid out in the ASEAN Economic Community Blueprint. Some of the key findings and recommendations of the paper are as follows.
According to survey responses, only one ASEAN country meets the Blueprint target of allowing at least 70 per cent foreign ownership in domestically established air services companies by 2010. However, effective liberalization of trade in air services not only requires the reform of investment laws, it also requires the reform of withholding clauses in air services agreements so that at minimum, they allow substantial ownership by an ASEAN community of interests. ASEAN members should be working towards further reform of their air services agreements, and should be demanding much greater transparency of their provisions.
Most countries of the region have taken a relatively liberal approach to many aspects of maritime regulation. But few have stated that they grant exemptions from cabotage restrictions. ASEAN members should be looking to expand the scope of these exemptions, given how costly cabotage restrictions have been shown to be for developing countries. No ASEAN country meets the Blueprint target of allowing at least 51 per cent foreign ownership by 2010 in all maritime services. However, some countries meet it for some services.
Only two ASEAN countries currently meet the Blueprint’s foreign equity targets in all telecommunications services. The remaining restrictions on foreign equity

29
limits are hard to understand, given the extent of existing competition in most countries, even in fixed line services. These restrictions should be phased out. The persistence of very high market shares of incumbent service suppliers in a few ASEAN countries is perhaps indicative of remaining problems with general regulation in those countries.
There is little apparent variation in countries’ participation in formal ASEAN efforts to improve customs clearance procedures. Differences arise in the extent to which this participation is translating into better customs procedures on the ground. The publication of clearance times would provide the acid test as to whether ASEAN cooperation efforts were achieving their ultimate aims. This should be a priority for all ASEAN members.
1. Services Targets in the ASEAN Economic Blueprint
The establishment of the ASEAN Economic Community is intended to deepen
economic integration in East Asia as a whole. To achieve that end, the ASEAN
Economic Community Blueprint lays out an ambitious reform agenda designed to
establish an ASEAN single market. It envisages the free flow of services, investment,
and skilled labour, along with the free flow of goods and the freer flow of capital.
In services, it is intended that by 2015, there should be substantially no
restriction to ASEAN services suppliers in providing services and in establishing
companies across national borders within the region, subject to domestic regulations.
For four priority sectors — air transport, healthcare, e-ASEAN and tourism — this
target is to be achieved earlier, by 2010. For logistics services, the target is to be
achieved by 2013.
The blueprint contains detail about the scheduled sequence of events by which
these targets are to be achieved. Liberalization is to occur through consecutive
rounds of negotiations, every two years. The number of sectors to be liberalized is to
be expanded in each round. For each new group of sectors, the liberalization
commitments are to include:
• no restrictions on service delivery via mode 1 (cross-border trade, where
neither the producer nor the consumer moves, and trade often occurs via the
internet) and mode 2 (consumption abroad, where the consumer moves

30
temporarily to the country of the producer), except where there are bona fide
regulatory reasons, such as public safety;
• gradual expansion of the foreign (ASEAN) equity participation permitted in
each sector, to be no less than 70 per cent by 2010 in the four priority sectors,
and to be no less than 51 per cent by 2010 and 70 per cent by 2015 in all
other sectors; and
• progressive removal of other limitations on market access via mode 3
(commercial presence, where the producer sets up a permanent commercial
presence in the country of the consumer) by 2015.
The negotiations are also to set the parameters of liberalization for limitations on
national treatment (ie liberalization involving the removal of discrimination against
foreign providers), liberalization of service delivery via mode 4 (the movement of
natural persons, whereby the individual service provider moves temporarily to the
country of the consumer) and the liberalization of horizontal limitations on market
access (ie limitations that apply across a range of services sectors, possibly affecting
both domestic and foreign providers) by 2009. Commitments are then to be made
according to these parameters from 2009.
The blueprint allows for some overall flexibilities in achieving these objectives,
including via an ASEAN minus X formula (where countries that are ready to
liberalize can proceed first and be joined by others later). In financial services, the
process of liberalization should also take place with due respect for national policy
objectives and the level of economic and financial sector development of the
individual members.
The key purpose of this paper is to map the existing policy space in three key
services sectors — air transport, maritime services (both shipping and port services),
and telecommunications services — as well as to provide evidence on whether the
implementation of the ASEAN Single Window is helping to achieve the broader
objectives of the revised Kyoto Convention on customs procedures. The air transport
sector is one of the priority sectors to be liberalized by 2010, while maritime and
telecommunications services and customs clearance are key components of the
logistics chain. By mapping actual policies, the exercise gives an indication of the
extent of real policy reform that will be needed in each ASEAN member country in

31
order to achieve the liberalization targets laid out in the ASEAN Economic
Community Blueprint.
Note that the ASEAN countries have recently finalized their seventh package of
commitments under the ASEAN Framework Agreement on Services. In some
respects, these commitments go further than the broad targets outlined in the ASEAN
Economic Community Blueprint, because they make specific commitments on
national treatment and market access for each mode of service delivery in each sector.
But in other respects, the seventh package of commitments still lags the targets
outlined in the Blueprint. In particular, the limits on foreign equity participation in
the seventh package are often less that would be required by the Blueprint in 2010.
The current exercise maps the existing policy space in each sector, not just with
respect to foreign equity limits, but also with respect to some of the more common
limitations on national treatment and market access by mode of service delivery in
these sectors.
Note too that in many ASEAN countries, the commitments made under the
ASEAN Framework Agreement on Services have tended to lag behind actual
practice (although this gap is closing over time). Thus an examination of current
commitments in the seventh package could potentially overstate the amount of real
reform required to meet the Blueprint’s liberalization targets. By examining actual
practice, the current exercise avoids this source of overstatement. However, the
current exercise maps existing policies on a most-favoured nation (MFN) basis,
meaning that it maps policies without taking into account any real, binding
preferences that have been granted to other ASEAN member countries. Because of
this, it might overstate the amount of real reform required to meet the Blueprint’s
liberalization targets, if those targets are to be met on a purely preferential basis (ie
via commitments that apply only to other ASEAN member countries). However, this
is not a foregone conclusion. Many services trade barriers are difficult or impossible
to liberalize on a preferential basis. Some services trade barriers would be unwise to
liberalize on a preferential basis. And the wording of the Blueprint itself only
suggests preferential liberalization in the case of foreign equity limits.
The information on actual policies affecting trade in air transport, maritime and
telecommunications services, and on the actual implementation of the ASEAN

32
Single Window, has been collected using four separate questionnaires. The
questionnaire instruments are reproduced at the end of this report. The questionnaires
were completed for each ASEAN economy over the period September 2009 to
March 2010 by researchers contracted by the Economic Research Institute for
ASEAN and East Asia (ERIA). Complete responses were received for all
questionnaires from all countries, with the exception of maritime in Brunei. The
researchers involved in the project, whose hard work is gratefully acknowledged, are
as follows:
• Brunei — Shazali Sulaiman, KPMG Brunei;
• Cambodia — Chap Sotharith and Chiek Chansamphors, Cambodian Institute
for Cooperation and Peace;
• Indonesia — Raymond Atje, Mochamad Pasha and Ira Titiheruw, Centre for
Strategic and International Studies;
• Lao PDR — Leeber Leebouapao, National Economic Research Institute;
• Malaysia — Zakariah Abdul Rashid, Samirul Ariff Bin Othman,
Musalmah Johan and Bashirah
• Myanmar — Kan Zaw, Daw Win Myint and Nu Nu Lwin, Yangon Institute
of Economics;
Lwin Thida Nwe, Malaysian Institute of
Economic Research;
• Philippines — Josef T. Yap, Erlinda M. Medalla and Gilberto M. Llanto,
Philippine Institute of Development Studies;
• Singapore — Hank Lim and Tay Yi Xun, Singapore Institute of International
Affairs;
• Thailand — Wisarn Pupphavesa and Jirawat Panpiemras, Thailand
Development Research Institute, and
• Vietnam — Vo Tri Thanh and Trinh Quang Long, Central Institute of
Economic Management.
The survey responses, along with any accompanying explanatory notes that were
provided by the survey respondents, have been compiled in four spreadsheets, one
for each survey. The spreadsheets are an integral part of the output of this project.
They make transparent and publicly available both the detailed qualitative
information contained in the survey responses, as well as the methods by which

33
summary indexes have been generated. It is anticipated that scrutiny of this detailed
information by stakeholders in the ASEAN region will lead to greater general
understanding of the policies and practices affecting air transport, maritime,
telecommunications and customs clearance in each economy.
It should be stressed, however, that the relative rankings of countries in the
results should be regarded as indicative, rather than definitive. Despite efforts to
develop a common understanding about the survey questions among the respondents,
there is inevitable variation in the ways in which questions have been interpreted,
and in the depth and quality of responses.
The following sections summarize the survey results for each of the sectors
under study. Each section begins with a discussion of the relevant regulatory regimes
in that sector. As will be seen, regulatory restrictions can reduce contestability and
performance and limit trade in these services in ways that go far beyond the standard
definitions of barriers to trade in services. Each section then describes the survey
instrument and the survey results. A final section draws together the main findings
and key recommendations for achieving the services targets of the ASEAN
Economic Community Blueprint.
2. Air Transport
2.1. Key features of the regulatory regime for air transport
Air transport is a priority sector under the ASEAN Economic Community
Blueprint, although commitments are being negotiated separately from those under
the ASEAN Framework Agreement of Services. Its inclusion in the Blueprint is
notable, because a large portion of the sector is typically carved out of services
agreements, including the General Agreement on Trade in Services (GATS) under
the WTO. Instead, international air transport (the most intensely traded portion of the
sector) has been regulated for over 50 years by a system of bilateral air services
arrangements, largely outside the multilateral framework of trading rules. The
bilateral system developed because international air flights require international
cooperation to provide the necessary infrastructure and air traffic rights. However,

34
the bilateral system has also created various limits on competition and trade in
aviation services.
Recent studies have catalogued the key restrictions imposed by bilateral air
services agreements, and have quantified the costs of these restrictions in terms of
their impact on air fares and traffic volumes. While air services agreements cover a
wide range of topics that would be deemed legitimate targets of regulation (such as
aviation security, incident investigation, immigration and control of travel
documents), they also include seven key features that have been identified by the
WTO Secretariat (WTO 2006) as restricting scheduled air passenger services.
• Designation governs the right to designate one (single designation) or more
than one (multiple designation) airline from the home country to operate the
agreed services between the two countries.
• Withholding defines the ownership conditions required for the designated
airline(s) of the foreign country to be allowed to operate the agreed services.
Restrictive conditions require substantial ownership and effective control to
be vested in the designating country or its nationals, meaning that the
designated airline is the ‘flag carrier’ of that country. More liberal regimes
are the community of interests and principal place of business regimes.
Community of interests still requires substantial ownership and effective
control, but it can be vested in one or more of a group of countries that are
defined in the agreement. The principal place of business regime removes the
substantial ownership requirement, but still requires the designated airline to
be incorporated in the designating country, and to have its principal place of
business there. It is thus (by a small margin) the most liberal regime, though
it falls far short of the relatively generous ‘rules of origin’ typically written
into services trade agreements. These would typically require only
‘substantial business’ in the designated country, irrespective of ownership.
• Grant of rights that defines the rights to provide air services between two
countries. The dimensions in which air services agreements are generally
being liberalized is in the granting of the fifth, sixth and seventh freedoms
and cabotage. The fifth freedom is the freedom to carry passengers between
two countries by an airline of a third country on a route with origin or

35
destination in its home country. The sixth freedom is the freedom to carry
passengers between two countries by an airline of a third country on a route
that goes via its home country. (Note that sixth freedoms can also be
constructed via a combination of the third and fourth freedoms from different
bilateral agreements, and so are rarely specified explicitly.) The seventh
freedom is the freedom to carry passengers between two countries by an
airline of a third country on a route with no connection to its home country.
Cabotage is the freedom to carry passengers within a country by an airline of
another country on a route with origin or destination in its home country.
• Capacity clause that identifies the regime to determine the capacity of an
agreed service, where capacity refers to the volume of traffic, frequency of
service and/or aircraft type. Sorted from the most restrictive to the most
liberal regime, three commonly used capacity clauses are predetermination,
Bermuda 1 and free determination. Predetermination requires that capacity is
agreed or approved by the two governments or regulatory agencies prior to
the service commencing. Bermuda 1 gives limited rights to the designated
airlines to set their capacity without government approval. Free
determination allows the designated airlines to determine capacity outside of
regulatory control.
• Tariff approval refers to the regime of fare setting. The most restrictive
regime is dual approval, whereby the aeronautical authorities of both
countries have to approve a fare before it can be applied. The most liberal
regime is free pricing, where fares are not subject to the approval of either
aeronautical authority. Intermediate regimes are country of origin
disapproval (where fares may be disapproved only by the country of origin),
dual disapproval (where both countries have to disapprove the fares in order
to make them ineffective), and zone pricing (where parties agree to approve
fares falling within a specific range and meeting certain characteristics, while
outside this zone one or a combination of the other regimes may apply).
• Statistics provides rules on exchange of statistics between countries or their
airlines. If exchange of statistics is (or can be) requested, it is a sign that the
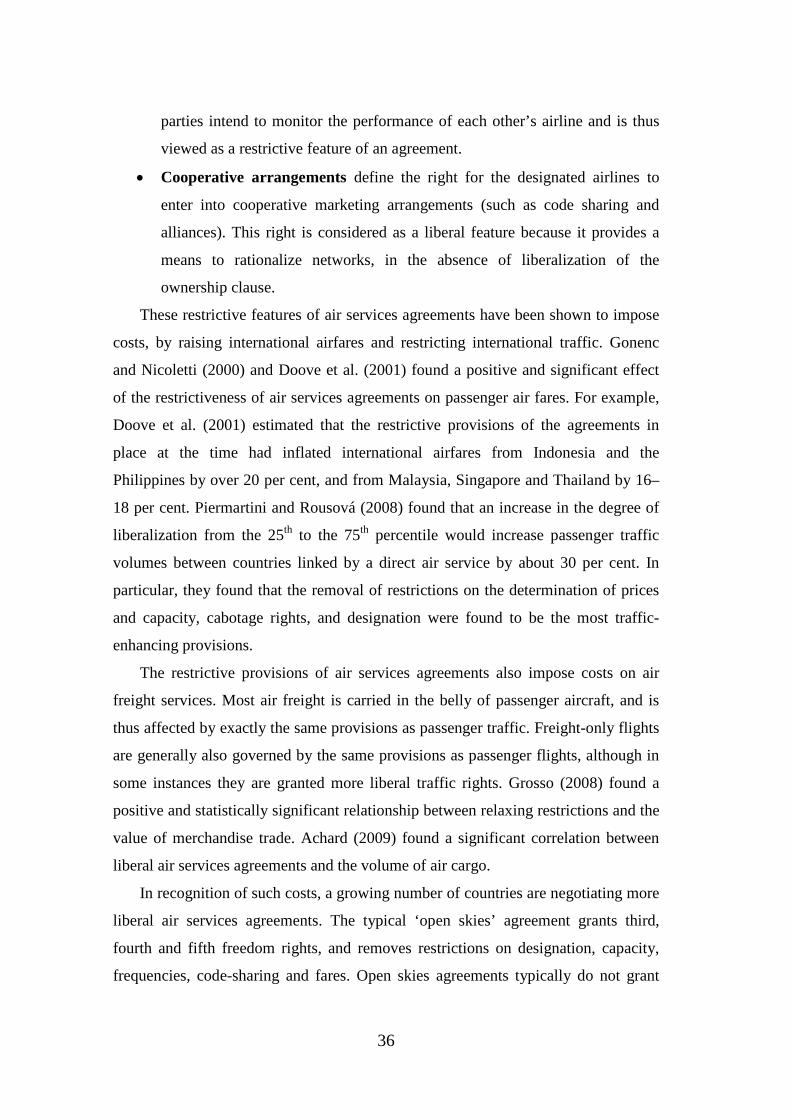
36
parties intend to monitor the performance of each other’s airline and is thus
viewed as a restrictive feature of an agreement.
• Cooperative arrangements define the right for the designated airlines to
enter into cooperative marketing arrangements (such as code sharing and
alliances). This right is considered as a liberal feature because it provides a
means to rationalize networks, in the absence of liberalization of the
ownership clause.
These restrictive features of air services agreements have been shown to impose
costs, by raising international airfares and restricting international traffic. Gonenc
and Nicoletti (2000) and Doove et al. (2001) found a positive and significant effect
of the restrictiveness of air services agreements on passenger air fares. For example,
Doove et al. (2001) estimated that the restrictive provisions of the agreements in
place at the time had inflated international airfares from Indonesia and the
Philippines by over 20 per cent, and from Malaysia, Singapore and Thailand by 16–
18 per cent. Piermartini and Rousová (2008) found that an increase in the degree of
liberalization from the 25th to the 75th
The restrictive provisions of air services agreements also impose costs on air
freight services. Most air freight is carried in the belly of passenger aircraft, and is
thus affected by exactly the same provisions as passenger traffic. Freight-only flights
are generally also governed by the same provisions as passenger flights, although in
some instances they are granted more liberal traffic rights. Grosso (2008) found a
positive and statistically significant relationship between relaxing restrictions and the
value of merchandise trade. Achard (2009) found a significant correlation between
liberal air services agreements and the volume of air cargo.
percentile would increase passenger traffic
volumes between countries linked by a direct air service by about 30 per cent. In
particular, they found that the removal of restrictions on the determination of prices
and capacity, cabotage rights, and designation were found to be the most traffic-
enhancing provisions.
In recognition of such costs, a growing number of countries are negotiating more
liberal air services agreements. The typical ‘open skies’ agreement grants third,
fourth and fifth freedom rights, and removes restrictions on designation, capacity,
frequencies, code-sharing and fares. Open skies agreements typically do not grant

37
cabotage rights, nor lift foreign ownership restrictions on domestic airlines. Seventh
freedom rights are sometimes included, but often restricted to cargo-only traffic.
Increasingly, countries have also liberalized their domestic aviation services,
which they can do on a unilateral basis. Such liberalization has typically included
allowing additional domestic and foreign entry on domestic routes, particularly by
low cost carriers, and freeing up restrictions on domestic air fares. Sometimes,
liberalization has also included the full or partial privatization of government-owned
carriers.
As air services proper have been liberalized, restrictions on the operation of
airport services have become more binding constraints to economic performance.
When the incumbent airlines own, or control access to, airport services (such as
gateways, landing slots, and baggage and freight handling services), they can
exercise this control to thwart competition by new entrants, even when formal
regulatory restrictions on entry have been removed. Increasingly, the operation of
airport services has been removed from the control of incumbent airlines, been
placed under independent regulatory control, and made more contestable in various
ways, even if ownership of airports has stayed in government hands. Some of the
ways that services have been made more contestable include having concession
arrangements for baggage handling and other services, and auctioning flight slots and
gate slots.
2.2. Scorecard for air transport
As can be seen from the above, regulatory restrictions can reduce contestability
and limit trade in air transport services in ways that go far beyond the standard
GATS definitions of barriers to trade in services. The questionnaire covering actual
barriers to trade in air transport services therefore asks about a range of regulatory
policies, whether or not they would be seen as formal barriers to trade in services.
Under commercial presence, the questionnaire asks whether there are restrictions
on the entry of new service providers wanting to establish commercially, whether
they are domestically-owned, foreign-invested or both. The question covers a variety
of air transport services separately — international passenger services (both
scheduled and charter services), international freight-only services, domestic
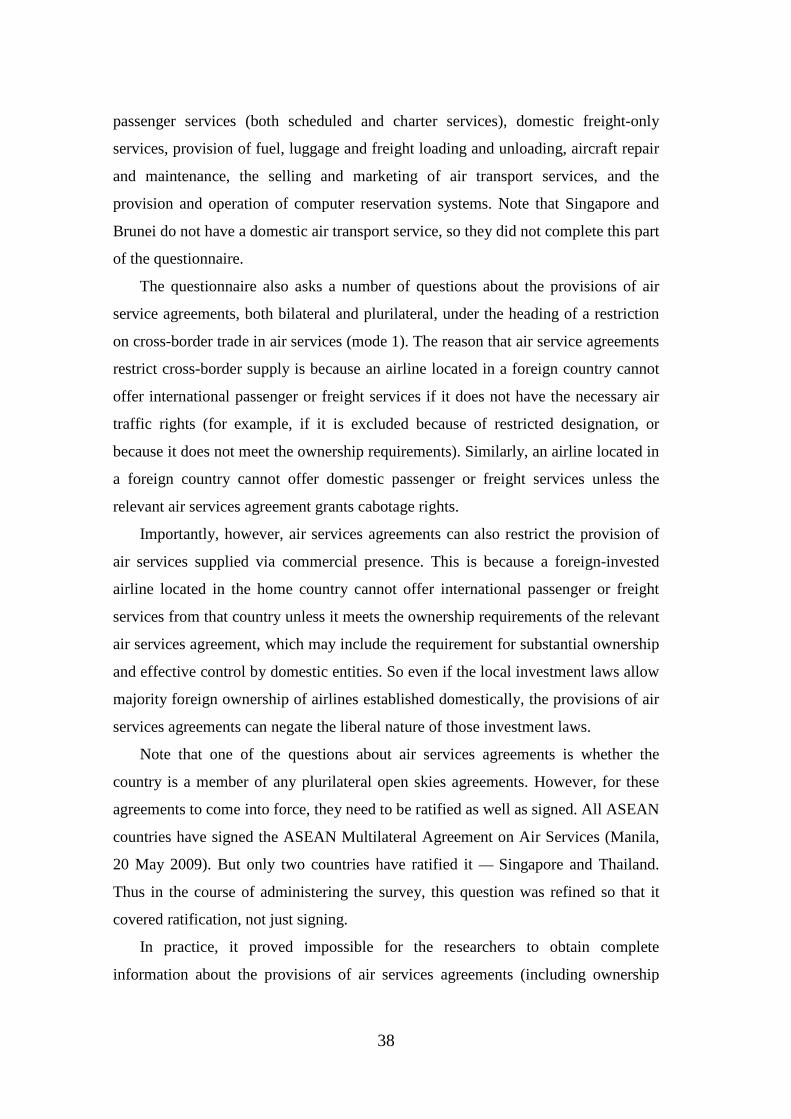
38
passenger services (both scheduled and charter services), domestic freight-only
services, provision of fuel, luggage and freight loading and unloading, aircraft repair
and maintenance, the selling and marketing of air transport services, and the
provision and operation of computer reservation systems. Note that Singapore and
Brunei do not have a domestic air transport service, so they did not complete this part
of the questionnaire.
The questionnaire also asks a number of questions about the provisions of air
service agreements, both bilateral and plurilateral, under the heading of a restriction
on cross-border trade in air services (mode 1). The reason that air service agreements
restrict cross-border supply is because an airline located in a foreign country cannot
offer international passenger or freight services if it does not have the necessary air
traffic rights (for example, if it is excluded because of restricted designation, or
because it does not meet the ownership requirements). Similarly, an airline located in
a foreign country cannot offer domestic passenger or freight services unless the
relevant air services agreement grants cabotage rights.
Importantly, however, air services agreements can also restrict the provision of
air services supplied via commercial presence. This is because a foreign-invested
airline located in the home country cannot offer international passenger or freight
services from that country unless it meets the ownership requirements of the relevant
air services agreement, which may include the requirement for substantial ownership
and effective control by domestic entities. So even if the local investment laws allow
majority foreign ownership of airlines established domestically, the provisions of air
services agreements can negate the liberal nature of those investment laws.
Note that one of the questions about air services agreements is whether the
country is a member of any plurilateral open skies agreements. However, for these
agreements to come into force, they need to be ratified as well as signed. All ASEAN
countries have signed the ASEAN Multilateral Agreement on Air Services (Manila,
20 May 2009). But only two countries have ratified it — Singapore and Thailand.
Thus in the course of administering the survey, this question was refined so that it
covered ratification, not just signing.
In practice, it proved impossible for the researchers to obtain complete
information about the provisions of air services agreements (including ownership
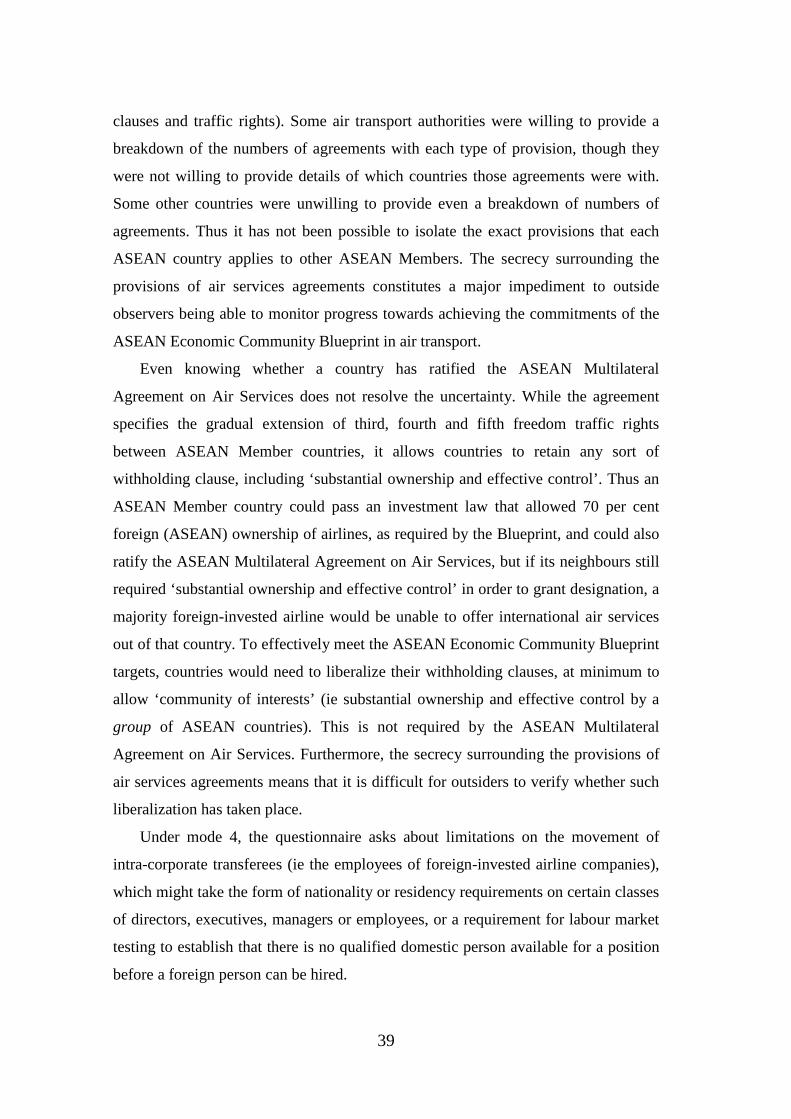
39
clauses and traffic rights). Some air transport authorities were willing to provide a
breakdown of the numbers of agreements with each type of provision, though they
were not willing to provide details of which countries those agreements were with.
Some other countries were unwilling to provide even a breakdown of numbers of
agreements. Thus it has not been possible to isolate the exact provisions that each
ASEAN country applies to other ASEAN Members. The secrecy surrounding the
provisions of air services agreements constitutes a major impediment to outside
observers being able to monitor progress towards achieving the commitments of the
ASEAN Economic Community Blueprint in air transport.
Even knowing whether a country has ratified the ASEAN Multilateral
Agreement on Air Services does not resolve the uncertainty. While the agreement
specifies the gradual extension of third, fourth and fifth freedom traffic rights
between ASEAN Member countries, it allows countries to retain any sort of
withholding clause, including ‘substantial ownership and effective control’. Thus an
ASEAN Member country could pass an investment law that allowed 70 per cent
foreign (ASEAN) ownership of airlines, as required by the Blueprint, and could also
ratify the ASEAN Multilateral Agreement on Air Services, but if its neighbours still
required ‘substantial ownership and effective control’ in order to grant designation, a
majority foreign-invested airline would be unable to offer international air services
out of that country. To effectively meet the ASEAN Economic Community Blueprint
targets, countries would need to liberalize their withholding clauses, at minimum to
allow ‘community of interests’ (ie substantial ownership and effective control by a
group of ASEAN countries). This is not required by the ASEAN Multilateral
Agreement on Air Services. Furthermore, the secrecy surrounding the provisions of
air services agreements means that it is difficult for outsiders to verify whether such
liberalization has taken place.
Under mode 4, the questionnaire asks about limitations on the movement of
intra-corporate transferees (ie the employees of foreign-invested airline companies),
which might take the form of nationality or residency requirements on certain classes
of directors, executives, managers or employees, or a requirement for labour market
testing to establish that there is no qualified domestic person available for a position
before a foreign person can be hired.

40
Under ownership restrictions, the questionnaire asks whether there are maximum
limits on the equity participation of either private domestic or foreign shareholders in
locally established air services firms. This question covers the full variety of air
transport services separately. As just noted, however, the provisions of investment
laws are not necessarily the binding constraint to whether majority foreign-invested
firms can offer international air transport services. The questionnaire also asks
whether governments have retained special voting rights in airlines. Finally, it asks
about the ownership structure of the top 5 international airports — whether they are
publicly or privately owned, and whether they are publicly or privately operated.
In the final section, the questionnaire also asks about potentially anti-competitive
aspects of the domestic regulatory regime. It covers how flight slots and gate slots
are allocated, whether alliances and code-sharing are allowed, and whether airfares
are regulated. It also asks whether the licensing conditions (if any) for foreign–
invested operators of the various air services differ from the conditions for domestic
operators. It covers so-called ‘State aids’ to the industry — whether governments
subsidize domestic airlines or cover their operating losses. Finally, it asks about
whether large airlines have universal service obligations, because this can potentially
distort the contestability of the local market.
2.3. Scorecard results for air transport
As noted earlier, the detailed responses (including comments) are recorded in
separate spreadsheets. For ease of summarizing the survey responses, the qualitative
information about trade restrictions and regulatory regimes has been coded in a zero-
one fashion, where for each question, a score of 1 has been assigned if the restriction
applies, and 0 if it does not. These detailed results are shown in Table 1.
Sometimes an intermediate score is assigned for intermediate stages of
restrictiveness. In the case of air transport services, partial scores are assigned as
follows. For private and foreign equity restrictions, partial scores are allocated in
inverse proportion to the equity limitation. For example, if equity participation is
limited to 25 per cent, then a score of 0.75 is assigned, while if equity participation is
allowed to reach 75 per cent, then a score of 0.25 is assigned. If there are limitations
on equity participation, but no numerical limited is stated, this is taken as a sign that

41
bureaucratic discretion is involved, and this is taken to be relatively restrictive — it
is assumed to be equivalent to a 25 per cent equity limit, and so receives a score of
0.75. When scoring the ownership structure of airports, public ownership but private
operation receives an intermediate score of 0.5, while public ownership and
operation receives a score of 1.0, and private ownership and operation receives a
score of 0. When scoring the allocation of flight and gate slots, auctioning receives a
score of 0, allocation at the discretion of an independent authority, or some
combination of grandfathering and auctioning, both receive a partial score of 0.5.
Other allocation methods (such as by flag carrier discretion) receive a score of 1.0.

42
Table 1: Restrictions on Trade in Air Transport Services (Index 0-1)
Bru
nei
Cam
bodi
a
Indo
nesi
a
Lao
PD
R
Mal
aysi
a
Mya
nmar
Phi
lippi
nes
Sin
gapo
re
Tha
iland
Vie
tnam
Ave
rage
1Are there policy restrictions to new entry (via commercial establishment)?
Any firm?
International air passenger transport (scheduled services) 0 0 0 0 0 0 0 0 0 0 0
International air passenger (non-scheduled charter services) 0 0 0 0 0 0 0 0 0 0 0
International air freight (all-cargo carriers, express delivery) 0 0 0 0 0 0 0 0 0 0 0
Domestic air transport (scheduled services) na 0 0 1 0 0 0 na 0 0 0.13
Domestic air transport (non-scheduled charter services) na 0 0 1 0 0 0 na 0 0 0.13
Domestic air freight (all-cargo carriers, express delivery) na 0 0 1 0 0 0 na 0 0 0.13
Provision of fuel 1 1 na 1 0 1 0 0 0 0 0.44
Luggage and freight loading and unloading 0 0 0 1 0 1 0 1 0 0 0.3
Aircraft repair and maintenance 0 0 0 1 0 0 0 1 0 0 0.2
Selling and marketing of air transport services 0 0 0 0 0 0 0 0 0 0 0
Computer reservation system 1 0 0 0 0 1 0 0 0 0 0.2
Foreign firms?
International air passenger transport (scheduled services) 0 0 0 0 1 0 0 0 0 0 0.1
International air passenger (non-scheduled charter services) 0 0 0 0 1 0 0 0 0 0 0.1
International air freight (all-cargo carriers, express delivery) 0 0 0 0 1 0 0 0 0 0 0.1
Domestic air transport (scheduled services) na 0 0 1 1 0 0 na 0 1 0.38
Domestic air transport (non-scheduled charter services) na 0 0 1 1 0 0 na 0 1 0.38
Domestic air freight (all-cargo carriers, express delivery) na 0 0 1 1 0 0 na 0 1 0.38
Provision of fuel 1 1 na 1 0 1 0 0 0 1 0.56
Luggage and freight loading and unloading 0 0 0 1 1 1 0 1 0 0 0.4
Aircraft repair and maintenance 0 0 0 1 0 0 0 1 0 0 0.2
Selling and marketing of air transport services 0 0 0 0 0 0 0 0 0 0 0
Computer reservation system 1 0 0 0 0 1 0 0 0 0 0.2
3 Are there restrictions on cross-border supply by foreign service providers in non-scheduled (charter) market?
International air passenger (non-scheduled charter services) 0 0 1 0 0 0 1 0 1 0 0.3
Domestic air transport (non-scheduled charter services) na 0 1 0 1 0 1 na 0 0 0.385
Has the country ratified the ASEAN Multilateral Agreement on Air Services? 1 1 1 1 1 1 1 0 0 1 0.8
7Are there residency or nationality requirements or quotas for personnel employed by locally established foreign airline companies? 1 1 1 1 1 0 1 0 1 1 0.8
8Are there categories of intra-corporate transferees whose entry and stay is subject to labour market tests? 1 0 1 0 1 1 0 0 0 0 0.4
9 Is private ownership in the provision of services through commercial establishment allowed?
Existing operators
International air passenger transport (scheduled services) 0.75 0.75 0.75 0.75 0.75 0 0 0 0 1 0.48
International air passenger (non-scheduled charter services) 0.75 0.75 0.75 0.75 0.75 0 0 0 0 1 0.48
International air freight (all-cargo carriers, express delivery) 0.75 0.75 0.75 0.75 0.75 0 0 0 0 1 0.48
Domestic air transport (scheduled services) na 0.75 0.75 1 0.75 0 0 0 0 0.75 0.44
Domestic air transport (non-scheduled charter services) na 0.75 0.75 1 1 0 0 0 0 0.75 0.47
Domestic air freight (all-cargo carriers, express delivery) na 0.75 0.75 1 1 0 0 0 0 0.75 0.47
Provision of fuel 0.5 0.75 0.75 0.75 0.75 1 0 0 0 1 0.55
Luggage and freight loading and unloading 0.75 0.75 0.75 0.75 0.75 0 0 0 0 0.75 0.45
Aircraft repair and maintenance 0.75 0.75 0.75 0.75 0.75 0 0 0 0 1 0.48
A. Commercial presence (mode 3) - restrictions on entry
B. Restrictions on cross-border trade (mode 1)
C. Restrictions on the movt of intra-corporate transferees of foreign-invested companies (mode 4)
D. Ownership

43
Table 1 (Continued): Restrictions on Trade in Air Transport Services (Index 0-1)
Bru
nei
Cam
bodi
a
Indo
nesi
a
Lao
PD
R
Mal
aysi
a
Mya
nmar
Phi
lippi
nes
Sin
gapo
re
Tha
iland
Vie
tnam
Ave
rage
Selling and marketing of air transport services 0.75 0.75 0.75 0 0.75 0 0 0 0 0.75 0.38
Computer reservation system 0.75 0.75 0.75 0 0.75 1 0 0 0 0.75 0.48
New entrants
International air passenger transport (scheduled services) 0.75 0.75 0 0.75 0.75 0 0 0 0 0.75 0.38
International air passenger (non-scheduled charter services) 0.75 0.75 0 0.75 0.75 0 0 0 0 0.75 0.38
International air freight (all-cargo carriers, express delivery) 0.75 0.75 0 0.75 0.75 0 0 0 0 0.75 0.38
Domestic air transport (scheduled services) na 0.75 0 1 0.75 0 0 0 0 0.75 0.36
Domestic air transport (non-scheduled charter services) na 0.75 0 1 1 0 0 0 0 0.75 0.39
Domestic air freight (all-cargo carriers, express delivery) na 0.75 0 1 1 0 0 0 0 0.75 0.39
Provision of fuel 0.5 0.75 0 0.75 0.75 1 0 0 0 0.75 0.45
Luggage and freight loading and unloading 0.75 0.75 0 0.75 0.75 0 0 0 0 0.75 0.38
Aircraft repair and maintenance 0.75 0.75 0 0.75 0.75 0 0 0 0 0.75 0.38
Selling and marketing of air transport services 0.75 0.75 0 0 0.75 0 0 0 0 0.75 0.3
Computer reservation system 0.75 0.75 0 0 0.75 1 0 0 0 0.75 0.410 Is foreign ownership in the provision of services through commercial establishment
allowed?
Existing operators
International air passenger transport (scheduled services) 0.75 0.75 0.51 0.75 0.55 0.51 0.6 0 0.51 0.75 0.57
International air passenger (non-scheduled charter services) 0.75 0.75 0.51 0.75 0.51 0.51 0.6 0 0.51 0.75 0.56
International air freight (all-cargo carriers, express delivery) 0.75 0.75 0.51 0.75 0.51 0.51 0.6 0 0.51 0.75 0.56
Domestic air transport (scheduled services) na 0.75 0.51 1 0.51 0.51 0.6 na 0.51 1 0.67
Domestic air transport (non-scheduled charter services) na 0.75 0.51 1 1 0.51 0.6 na 0.51 1 0.74
Domestic air freight (all-cargo carriers, express delivery) na 0.75 0.51 1 1 0.51 0.6 na 0.51 1 0.74
Provision of fuel 0.5 0.75 0.51 0.51 0.51 1 0.6 0 0.51 1 0.59
Luggage and freight loading and unloading 0.75 0.75 0.51 0.51 1 1 0.6 0 0.51 0.75 0.64
Aircraft repair and maintenance 0.75 0.75 0.51 0.75 0.51 0.75 0.6 0 0.51 0.49 0.56
Selling and marketing of air transport services 0.75 0.75 0.51 0 0.51 0.75 0 0 0.51 0.75 0.45
Computer reservation system 0.75 0.75 0.51 0 0.51 1 0 0 0.51 0.75 0.48
New entrants
International air passenger transport (scheduled services) 0.75 0.75 0.51 0.75 0.55 0.51 0.6 0 0.51 0.75 0.57
International air passenger (non-scheduled charter services) 0.75 0.75 0.51 0.75 0.51 0.51 0.6 0 0.51 0.75 0.56
International air freight (all-cargo carriers, express delivery) 0.75 0.75 0.51 0.75 0.51 0.51 0.6 0 0.51 0.75 0.56
Domestic air transport (scheduled services) na 0.75 0.51 1 0.51 0.51 0.6 na 0.51 1 0.67
Domestic air transport (non-scheduled charter services) na 0.75 0.51 1 1 0.51 0.6 na 0.51 1 0.74
Domestic air freight (all-cargo carriers, express delivery) na 0.75 0.51 1 1 0.51 0.6 na 0.51 1 0.74
Provision of fuel 0.5 0.75 0.51 0.51 0.51 1 0.6 0 0.51 1 0.59
Luggage and freight loading and unloading 0.75 0.75 0.51 0.51 1 1 0.6 0 0.51 0.75 0.64
Aircraft repair and maintenance 0.75 0.75 0.51 0.75 0.51 0.75 0.6 0 0.51 0.49 0.56
Selling and marketing of air transport services 0.75 0.75 0.51 0 0.51 0.75 0 0 0.51 0.75 0.45
Computer reservation system 0.75 0.75 0.51 0 0.51 1 0 0 0.51 0.75 0.4811
Does the government have a special government voting right in the airlines? 1 0 0 1 1 0 0 0 0 0 0.312 Ownership structure for up to the 5 most important international airports in terms of
traffic (average) 1 0.7 1 1 0.5 1 1 0.75 0 1 0.8
14How are flight slots allocated in airports? 1 0 1 0.5 1 1 1 0.5 1 0.5 0.75
15How are gate slots allocated in airports? 0.5 0 1 0.5 1 1 1 0.5 1 0.5 0.7
17Price regulation
a. Does the govt regulate airfares? - on domestic routes na 1 0 1 0 0 1 na 1 1 0.63
- on international routes 0 1 0 0 0 0 1 0 1 0 0.3
If yes to a), is fare discounting allowed? - on domestic routes 0 0 0 0 0 0 0 na 0 0 0
- on international routes 0 0 0 0 0 0 0 0 0 0 0
E. Regulation
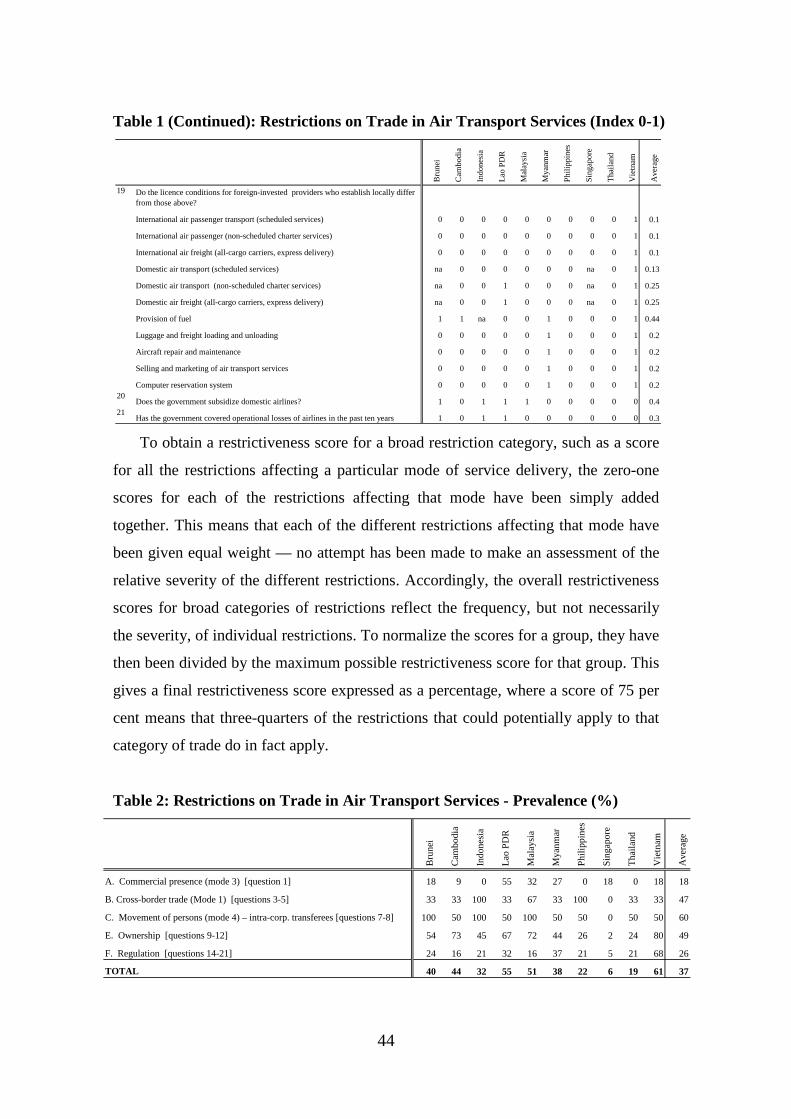
44
Table 1 (Continued): Restrictions on Trade in Air Transport Services (Index 0-1)
To obtain a restrictiveness score for a broad restriction category, such as a score
for all the restrictions affecting a particular mode of service delivery, the zero-one
scores for each of the restrictions affecting that mode have been simply added
together. This means that each of the different restrictions affecting that mode have
been given equal weight — no attempt has been made to make an assessment of the
relative severity of the different restrictions. Accordingly, the overall restrictiveness
scores for broad categories of restrictions reflect the frequency, but not necessarily
the severity, of individual restrictions. To normalize the scores for a group, they have
then been divided by the maximum possible restrictiveness score for that group. This
gives a final restrictiveness score expressed as a percentage, where a score of 75 per
cent means that three-quarters of the restrictions that could potentially apply to that
category of trade do in fact apply.
Table 2: Restrictions on Trade in Air Transport Services - Prevalence (%)
Bru
nei
Cam
bodi
a
Indo
nesi
a
Lao
PD
R
Mal
aysi
a
Mya
nmar
Phi
lippi
nes
Sin
gapo
re
Tha
iland
Vie
tnam
Ave
rage
19 Do the licence conditions for foreign-invested providers who establish locally differ from those above?
International air passenger transport (scheduled services) 0 0 0 0 0 0 0 0 0 1 0.1
International air passenger (non-scheduled charter services) 0 0 0 0 0 0 0 0 0 1 0.1
International air freight (all-cargo carriers, express delivery) 0 0 0 0 0 0 0 0 0 1 0.1
Domestic air transport (scheduled services) na 0 0 0 0 0 0 na 0 1 0.13
Domestic air transport (non-scheduled charter services) na 0 0 1 0 0 0 na 0 1 0.25
Domestic air freight (all-cargo carriers, express delivery) na 0 0 1 0 0 0 na 0 1 0.25
Provision of fuel 1 1 na 0 0 1 0 0 0 1 0.44
Luggage and freight loading and unloading 0 0 0 0 0 1 0 0 0 1 0.2
Aircraft repair and maintenance 0 0 0 0 0 1 0 0 0 1 0.2
Selling and marketing of air transport services 0 0 0 0 0 1 0 0 0 1 0.2
Computer reservation system 0 0 0 0 0 1 0 0 0 1 0.220
Does the government subsidize domestic airlines? 1 0 1 1 1 0 0 0 0 0 0.421
Has the government covered operational losses of airlines in the past ten years 1 0 1 1 0 0 0 0 0 0 0.3 B
rune
i
Cam
bodi
a
Indo
nesi
a
Lao
PD
R
Mal
aysi
a
Mya
nmar
Phi
lippi
nes
Sin
gapo
re
Tha
iland
Vie
tnam
Ave
rage
A. Commercial presence (mode 3) [question 1] 18 9 0 55 32 27 0 18 0 18 18
B. Cross-border trade (Mode 1) [questions 3-5] 33 33 100 33 67 33 100 0 33 33 47
C. Movement of persons (mode 4) – intra-corp. transferees [questions 7-8] 100 50 100 50 100 50 50 0 50 50 60
E. Ownership [questions 9-12] 54 73 45 67 72 44 26 2 24 80 49
F. Regulation [questions 14-21] 24 16 21 32 16 37 21 5 21 68 26
TOTAL 40 44 32 55 51 38 22 6 19 61 37

45
Turning to the explicit targets of the ASEAN Economic Community Blueprint, it
has been difficult to assess the full extent of barriers to trade in cross-border (mode
1) services, primarily because of the difficulty of getting full information on the
provisions of current air services agreements. The information in Tables 1 and 2
reflects only the presence of restrictions on international and domestic charter flights,
as well as whether a country as ratified the ASEAN Multilateral Agreements on Air
Services. As noted above, only two countries have so far ratified the agreement —
Singapore and Thailand. Two countries also retain restrictions on international and
domestic charter flights — Indonesia and the Philippines — although with the
development of low cost carriers, charter flights are not as important a source of
competitive pressures as they used to be.
Restrictions on the consumption of air transport services abroad are virtually
non-existent, other than through restrictions on the outward movement of consumers
themselves. Hence they have not been canvassed in this study.
Turning next to the various types of restrictions on commercial presence (mode
3), ownership restrictions are the most prevalent, and other kinds of regulatory
restrictions on entry less so. According to the survey responses, only one country —
Singapore — explicitly meets the Blueprint target of allowing at least 70 per cent
foreign ownership in domestically established air services companies by 2010. But
note that if Singapore were actually to achieve 70 per cent foreign ownership of its
international airline, it could well be prevented from supplying international air
services to other ASEAN countries, even if they had ratified the ASEAN Multilateral
Agreements on Air Services. This is because that agreement allows them to retain
withholding clauses that would require Singapore to have ‘substantial ownership and
effective control’ of Singapore Airlines by Singaporean entities in order to be a
designated airline. Effective liberalization of mode 3 trade in air services not only
requires the reform of investment laws, it also requires the reform of withholding
clauses in air services agreements, so that at minimum, they allow substantial
ownership by an ASEAN community of interests.
Many ASEAN countries also retain other types of regulatory restrictions on
domestic and/or foreign entry into various air services, although these restrictions are
more common for domestic air transport and ground-based services than they are for

46
international air services. Lao PDR has the most extensive regulatory restrictions,
followed by Malaysia (which has regulatory restrictions on foreign entry into a range
of services), and Myanmar (which restricts commercial entry into provision of fuel,
luggage handling and computer reservation systems).
As in many other services sectors, restrictions on the movement of people
remain one of the most prevalent of all types of trade restrictions. Brunei, Indonesia
and Malaysia retain both nationality requirements and labour market tests for various
categories of managers and/or employees of foreign-invested firms. Only Singapore
has a relatively liberal treatment of intra-corporate transferees.
Looking beyond trade barriers (strictly defined) to look at domestic regulatory
regimes that could also be anti-competitive, most ASEAN countries appear relatively
liberal. This is mainly because few retain strict government controls on air fares, and
most do not impose discriminatory licensing conditions on foreign services suppliers
(a notable exception here being Vietnam). Nevertheless, in most ASEAN countries
(except Cambodia), the allocation of flight and gate slots is still done in ways that
could potentially be anti-competitive. This is becoming an increasingly important
barrier to effective competition. Furthermore, government subsidization of domestic
airlines is still common, not just in small countries (Brunei, Lao PDR), but also in
larger ones (Indonesia, Malaysia).
3. Maritime
3.1. Key features of the regulatory regime for maritime services
Shipping is another sector that is subject to a web of restrictive regulations that
impose considerable costs, but have so far proved largely immune to bilateral or
multilateral trade agreements. Donovan (undated) describes the historical
development of government regulation of shipping in the United States, which has
one of the most restrictive regulatory regimes in the world. PDP Australia and
Meyrick and Associates (2005) give a detailed description of the development of
shipping regulation in ASEAN. They note that by comparison to other regions, the

47
policy environment in which intra-ASEAN shipping operates is relatively liberal,
although cabotage restrictions remain a key market distortion.
McGuire, Schuele and Smith (2000) survey the maritime policy regimes in a
number of APEC, Latin American and European countries. They describe the key
restrictions affecting shipping services as follows.
• Right to fly the national flag. This requires ships to be registered or licensed
to provide maritime services on domestic and international routes. The
conditions on registration may include legitimate requirements such as
meeting seaworthiness and safety requirements, but also include restrictions
such as having a commercial presence in the domestic economy, and the ship
being built and/or owned domestically.
• Cabotage restrictions. These restrict shipping services on domestic and
coastal routes to vessels that meet certain conditions. Shipping services
between domestic ports may be required to be carried out by domestically
owned, operated, built and/or crewed ships.
• Conferences. These are private sector arrangements between shippers that
are supposed to facilitate the planning and coordination of shipping traffic,
but typically also include anti-competitive provisions. They can be open or
closed. Open conferences set freight rates, but allow unrestricted entry and
exit. Closed conferences set freight rates, allocate cargo and restrict
membership. Governments that have enacted general competition laws
usually permit the existence of conferences through exemptions from the
price setting and collusion provisions of their domestic competition
legislation.
• UN Convention on a Code of Conduct for Liner Conferences (UN Liner
Code). This stipulates that conference trade between two economies can
allocate cargo according to the 40:40:20 rule, whereby 40 per cent of tonnage
is reserved for the national flag lines of each economy and 20 per cent is
allocated to liner ships from a third country.
• Cargo sharing. These are other types of arrangements that stipulate the
allocation of cargo on particular routes between parties to bilateral and
multilateral agreements.

48
• Bilateral agreements. These are agreements between two economies that
primarily restrict the supply of shipping services and the allocation of cargo.
Some bilateral agreements also restrict the use of port facilities.
Few ASEAN countries have general competition law or any legislative
framework for regulating the behaviour of shipping conferences. However, in recent
times conferences have been subjected to increasing competition. They no longer
dominate shipping routes, and are no longer regarded as the impediments to maritime
performance that they once were. PDP Australia and Meyrick and Associates (2005)
note that within ASEAN, cargo reservation measures have been very significantly
reduced and in many cases completely abandoned. Similarly, a growing number of
ASEAN economies have ‘open’ ship registries, which means that local ship
registration is no longer tightly tied to local ownership of the shipping company. This
leaves cabotage restrictions, along with inadequate and aging infrastructure, as the
main impediments to economic performance in shipping services.
These regulatory restrictions on shipping services have been shown to be costly,
particularly to developing countries. Kang (2000) found that the maritime restrictions
imposed by goods exporting countries appear to have a much greater impact on
bilateral shipping margins (as measured by cif/fob ratios) than those imposed by
importing countries. He also found that in exporting countries, lowering restrictions
such as cabotage and port services restrictions had a greater effect on margins than
reducing restrictions on the commercial presence of foreign suppliers. In several
applications of these findings, the sum total of restrictions on shipping and port
services was found to have inflated shipping costs by around 30 per cent in Morocco
(Dee 2006), and by around 26 per cent in Indonesia (Dee 2008).
Regulatory restrictions on port services can also inflate the cost of maritime
shipping. Juhel (1999) describes the ways in which contestability is typically
introduced into port services, and the way this interacts with the ownership of port
assets. The coastal land and sea-land interface areas required by ports are typically
retained in government ownership, so as to facilitate long-term planning and to
optimize the use of coastal areas from an economic, social and environmental
perspective. The basic infrastructure assets established on public land, such as
breakwaters, channels, docks and inland transport connections, are also likely to be

49
in public ownership. On the other hand, all other operational infrastructure, including
berths, could be privately owned. Given that these are located on public land, there
needs to be adequate leasing or concessioning arrangements, with contractual periods
appropriate for the financial depreciation of the private assets. All superstructure,
such as buildings, cranes and other pieces of equipment, can also be privately owned.
Contestability can be introduced into port operations by the way in which
portions of the port area are allocated to private superstructure operators for specific
periods of time, whether or not they plan to build their own facilities. If port traffic is
enough to warrant it, several operators with equivalent handling capacity can be
allowed to set up and compete for port traffic in the market. Where traffic only
warrants a single operator, there can still be competition for the market, by having
competition for the right to hold the concession to operate. However, if there is
effective competition between ports, or between a single port and other modes of
transport, this may be sufficient to prevent abuses of monopoly power in port
operations.
Thus there are typically three different models of port operation, which allow
increasing levels of contestability and harnessing of private sector investment
potential:
• Services port. Here the Port Authority owns all assets and supplies services
by directly hiring employees.
• Tool port. Here the Port Authority owns the infrastructure and superstructure,
and private firms provide services by renting port assets through concessions
and licenses.
• Landlord port. Here the Port Authority owns and manages the infrastructure,
private firms are able to own superstructure and provide services, as well as
renting port assets by concessions or licences.
Note that when reforms aim to convert a service port to a tool or landlord port,
provision needs to be made to allow new private sector entrants access to the
facilities once owned and operated by the incumbent port operator.
Restrictive port operating conditions can also impose costs on shippers. One
method of inflating costs is by the mandatory provision of, and charging for, services
(pilotage, towing, tug assistance, navigation aids, berthing, waste disposal, anchorage,

50
casting off), whether or not they are strictly needed. Another is by restrictions on
access to ports, or restrictions on the cargoes that particular ports can handle.
As noted, regulatory restrictions on port operations have been shown to be costly.
Clark, Dollar and Micco (2004) showed first that port efficiency is an important
determinant of shipping costs — improving port efficiency from the 25th to the 75th
percentile would reduce shipping costs by 12 per cent. They then showed that port
inefficiency was linked to excessive regulation, as well as to the prevalence of
organized crime and the general condition of a country’s infrastructure.
3.2. Scorecard for maritime services
The questionnaire covering actual barriers to trade in maritime services likewise
asks about a range of regulatory policies, whether or not they would be seen as
formal barriers to trade in services. The questionnaire was completed for all ASEAN
countries except Lao PDR, which is landlocked, and Brunei, which did not provide
consistent answers.
Under commercial presence, the questionnaire asks whether there are restrictions
on the entry of new service providers wanting to establish commercially, whether
they are domestically-owned, foreign-invested or both. The question covers a variety
of maritime services separately — international shipping, cabotage (the provision of
coastal shipping services), internal waterways, port superstructure, cargo handling
services, storage and warehousing, freight forwarding, pilotage, towing and tying,
and the maintenance and repair of vessels. The questionnaire also asks questions
about restrictions on the legal forms of establishment, which are recognized by the
GATS as restrictions on market access.
Under cross-border trade in shipping services (mode 1), the questionnaire asks
about the presence of cargo sharing arrangements, whether the country imposes
reciprocity requirements on the other countries providing cross-border services, and
whether there are other selective restrictions imposed by government for retaliatory
purposes. Few countries have completely liberalized cabotage restrictions, but a
growing number of countries are gradually reducing the severity of the restrictions
by granting exemptions on a case-by-case basis. So the questionnaire also asks
whether such exemptions are available. Finally, this section of the questionnaire asks

51
about the mandatory provision of port services, and restricted access to ports, as
these restrictions can adversely affect cross-border shipping.
Under mode 4, the questionnaire asks about limitations on the movement of
intra-corporate transferees (ie the employees of foreign-invested shipping
companies), which might take the form of nationality or residency requirements on
certain classes of directors, executives, managers or employees. It also asks about the
permitted length of short- or long-term stay for such transferees, an aspect of the
regulatory regime that is typically set horizontally by immigration departments,
rather than by maritime regulation.
Under ownership restrictions, the questionnaire asks whether there are maximum
limits on the equity participation of either private domestic or foreign shareholders in
locally established maritime companies. This question covers the full variety of
maritime services separately. It also asks whether the five most important ports
follow a service port, tool port or landlord port model.
In the final section, the questionnaire asks about potentially anti-competitive
aspects of the domestic regulatory regime. It asks what conditions are required to fly
the national flag, whether an ‘open’ registry system is in place, and whether goods
exporters and importers receive concessional treatment if they use national flagged
vessels. It asks about the regulatory treatment of liner shipping conferences. It asks
about whether terminal handling charges are regulated by government, and whether
there are restrictions on port activities. It asks about the presence of discriminatory
licensing requirements for foreign providers, whether cross-border provision requires
the appointment of a domestic shipping agent, whether there are restrictions on who
can carry non-commercial (eg government) cargoes, and whether governments have
subsidized or covered the operating losses of local shipping companies.
3.3. Scorecard results for maritime services
As with air transport services, the qualitative information about trade restrictions
and regulatory regimes has been coded in a zero-one fashion, where for each
question, a score of 1 has been assigned if the restriction applies, and 0 if it does not.
These detailed results are shown in Table 3.
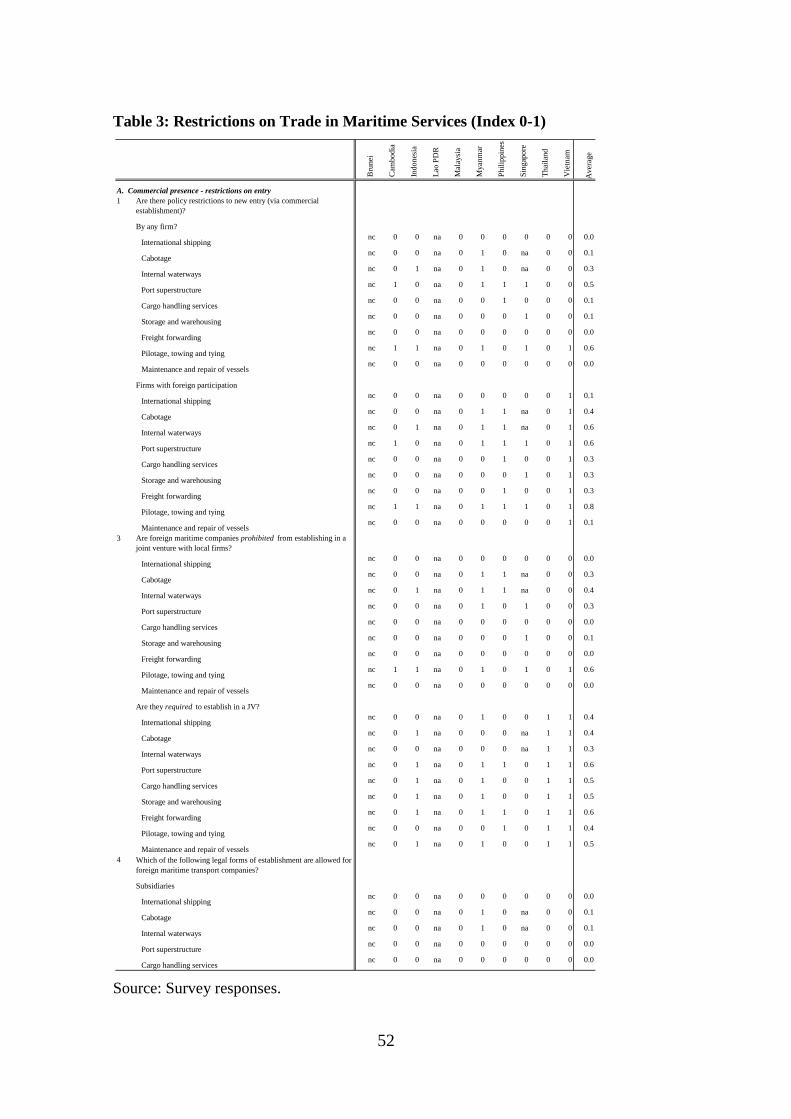
52
Table 3: Restrictions on Trade in Maritime Services (Index 0-1)
Source: Survey responses.
Bru
nei
Cam
bodi
a
Indo
nesi
a
Lao
PD
R
Mal
aysi
a
Mya
nmar
Phi
lippi
nes
Sin
gapo
re
Tha
iland
Vie
tnam
Ave
rage
1 Are there policy restrictions to new entry (via commercial establishment)?
By any firm?
International shippingnc 0 0 na 0 0 0 0 0 0 0.0
Cabotagenc 0 0 na 0 1 0 na 0 0 0.1
Internal waterwaysnc 0 1 na 0 1 0 na 0 0 0.3
Port superstructurenc 1 0 na 0 1 1 1 0 0 0.5
Cargo handling servicesnc 0 0 na 0 0 1 0 0 0 0.1
Storage and warehousingnc 0 0 na 0 0 0 1 0 0 0.1
Freight forwardingnc 0 0 na 0 0 0 0 0 0 0.0
Pilotage, towing and tyingnc 1 1 na 0 1 0 1 0 1 0.6
Maintenance and repair of vesselsnc 0 0 na 0 0 0 0 0 0 0.0
Firms with foreign participation
International shippingnc 0 0 na 0 0 0 0 0 1 0.1
Cabotagenc 0 0 na 0 1 1 na 0 1 0.4
Internal waterwaysnc 0 1 na 0 1 1 na 0 1 0.6
Port superstructurenc 1 0 na 0 1 1 1 0 1 0.6
Cargo handling servicesnc 0 0 na 0 0 1 0 0 1 0.3
Storage and warehousingnc 0 0 na 0 0 0 1 0 1 0.3
Freight forwardingnc 0 0 na 0 0 1 0 0 1 0.3
Pilotage, towing and tyingnc 1 1 na 0 1 1 1 0 1 0.8
Maintenance and repair of vesselsnc 0 0 na 0 0 0 0 0 1 0.1
3 Are foreign maritime companies prohibited from establishing in a joint venture with local firms?
International shippingnc 0 0 na 0 0 0 0 0 0 0.0
Cabotagenc 0 0 na 0 1 1 na 0 0 0.3
Internal waterwaysnc 0 1 na 0 1 1 na 0 0 0.4
Port superstructurenc 0 0 na 0 1 0 1 0 0 0.3
Cargo handling servicesnc 0 0 na 0 0 0 0 0 0 0.0
Storage and warehousingnc 0 0 na 0 0 0 1 0 0 0.1
Freight forwardingnc 0 0 na 0 0 0 0 0 0 0.0
Pilotage, towing and tyingnc 1 1 na 0 1 0 1 0 1 0.6
Maintenance and repair of vesselsnc 0 0 na 0 0 0 0 0 0 0.0
Are they required to establish in a JV?
International shippingnc 0 0 na 0 1 0 0 1 1 0.4
Cabotagenc 0 1 na 0 0 0 na 1 1 0.4
Internal waterwaysnc 0 0 na 0 0 0 na 1 1 0.3
Port superstructurenc 0 1 na 0 1 1 0 1 1 0.6
Cargo handling servicesnc 0 1 na 0 1 0 0 1 1 0.5
Storage and warehousingnc 0 1 na 0 1 0 0 1 1 0.5
Freight forwardingnc 0 1 na 0 1 1 0 1 1 0.6
Pilotage, towing and tyingnc 0 0 na 0 0 1 0 1 1 0.4
Maintenance and repair of vesselsnc 0 1 na 0 1 0 0 1 1 0.5
4 Which of the following legal forms of establishment are allowed for foreign maritime transport companies?
Subsidiaries
International shippingnc 0 0 na 0 0 0 0 0 0 0.0
Cabotagenc 0 0 na 0 1 0 na 0 0 0.1
Internal waterwaysnc 0 0 na 0 1 0 na 0 0 0.1
Port superstructurenc 0 0 na 0 0 0 0 0 0 0.0
Cargo handling servicesnc 0 0 na 0 0 0 0 0 0 0.0
A. Commercial presence - restrictions on entry

53
Table 3 (Continued): Restrictions on Trade in Maritime Services (Index 0-1)
Source: Survey responses.
Bru
nei
Cam
bodi
a
Indo
nesi
a
Lao
PD
R
Mal
aysi
a
Mya
nmar
Phi
lippi
nes
Sin
gapo
re
Tha
iland
Vie
tnam
Ave
rage
Storage and warehousingnc 0 0 na 0 0 0 0 0 0 0.0
Freight forwardingnc 0 0 na 0 0 0 0 0 0 0.0
Pilotage, towing and tyingnc 1 0 na 0 1 0 0 0 0 0.3
Maintenance and repair of vesselsnc 0 0 na 0 0 0 0 0 0 0.0
Branches
International shippingnc 0 0 na 0 0 0 0 0 0 0.0
Cabotagenc 0 0 na 0 1 0 na 0 0 0.1
Internal waterwaysnc 0 0 na 0 1 0 na 0 0 0.1
Port superstructurenc 0 0 na 0 1 0 0 0 0 0.1
Cargo handling servicesnc 0 0 na 0 0 0 0 0 0 0.0
Storage and warehousingnc 0 0 na 0 0 0 0 0 0 0.0
Freight forwardingnc 0 0 na 0 0 0 0 0 0 0.0
Pilotage, towing and tyingnc 1 0 na 0 1 0 0 0 0 0.3
Maintenance and repair of vesselsnc 0 0 na 0 0 0 0 0 0 0.0
Representative offices
International shippingnc 0 0 na 0 0 0 0 0 0 0.0
Cabotagenc 0 0 na 0 1 0 na 0 0 0.1
Internal waterwaysnc 0 0 na 0 1 0 na 0 0 0.1
Port superstructurenc 0 0 na 0 1 0 0 0 0 0.1
Cargo handling servicesnc 0 0 na 0 0 0 0 0 0 0.0
Storage and warehousingnc 0 0 na 0 0 0 0 0 0 0.0
Freight forwardingnc 0 0 na 0 0 0 0 0 0 0.0
Pilotage, towing and tyingnc 1 0 na 0 1 0 0 0 0 0.3
Maintenance and repair of vesselsnc 0 0 na 0 0 0 0 0 0 0.0
5 Describe restrictions on cross-border supply imposed on foreign shipping companies:
International Shipping
Application of principle of reciprocitync 0 0 na 1 0 0 0 0 1 0.3
Restrictions on the number of foreign suppliersnc 0 0 na 0 0 0 0 0 1 0.1
Are exemptions from cabotage restrictions available? nc na na na na na na na na na na
Party to UN Liner Code, but Article 2 not appliednc 1 0 na 0 0 0 0 0 1 0.3
UN Liner Code applied, including Article 2 nc 0 0 na 1 0 0 0 0 1 0.3
Bilateral agreements including cargo-sharing clauses nc 0 0 na 0 0 0 0 0 1 0.1
Cargo reservation if different from the application of UN Liner Code and bilateral agreements
nc 1 0 na 0 0 1 0 1 1 0.5
Selective restrictions imposed by government for retaliatory purposes
nc 1 0 na 0 0 0 0 0 1 0.3
Cabotage
Application of principle of reciprocitync 0 0 na 1 na na na 0 1 0.4
Restrictions on the number of foreign suppliersnc 0 1 na 0 na na na 0 1 0.4
Are exemptions from cabotage restrictions available? nc 0 0 na 1 1 1 na 0 1 0.6
Party to UN Liner Code, but Article 2 not applied nc 1 0 na 0 na na na 0 1 0.4
UN Liner Code applied, including Article 2 nc 0 0 na 1 na na na 0 1 0.4
Bilateral agreements including cargo-sharing clauses nc 0 0 na 0 na na na 0 1 0.2
Cargo reservation if different from the application of UN Liner Code and bilateral agreements
nc 1 0 na 0 na na na 1 1 0.6
Selective restrictions imposed by government for retaliatory purposes
nc 1 0 na 0 na na na 0 1 0.4
7 Are the following services mandatory for ships entering the port (main port only)?
Pilotagenc 1 1 na 0 1 1 0 1 1 0.8
Towingnc 0 1 na 0 1 1 0 1 1 0.6
B. Restrictions on cross-border trade (mode 1)

54
Table 3 (Continued): Restrictions on Trade in Maritime Services (Index 0-1)
Source: Survey responses.
Bru
nei
Cam
bodi
a
Indo
nesi
a
Lao
PD
R
Mal
aysi
a
Mya
nmar
Phi
lippi
nes
Sin
gapo
re
Tha
iland
Vie
tnam
Ave
rage
Tug assistancenc 1 0 na 0 1 1 0 1 1 0.6
Navigation aidsnc 1 1 na 0 1 1 0 1 1 0.8
Berthingnc 1 1 na 0 1 1 0 1 1 0.8
Waste disposalnc 1 0 na 0 1 1 0 1 1 0.6
Anchoragenc 1 1 na 0 1 1 0 1 1 0.8
Casting offnc 1 1 na 0 1 1 0 1 1 0.8
Is access to service discriminatory for foreign carriers as opposed to domestic ones?
Pilotagenc 0 0 na 0 0 0 0 0 0 0.0
Towingnc 0 0 na 0 0 0 0 0 0 0.0
Tug assistancenc 0 0 na 0 0 0 0 0 0 0.0
Navigation aidsnc 0 0 na 0 0 0 0 0 0 0.0
Berthingnc 0 0 na 0 0 0 0 0 0 0.0
Waste disposalnc 0 0 na 0 0 0 0 0 0 0.0
Anchoragenc 0 0 na 0 0 0 0 0 0 0.0
Casting offnc 0 0 na 0 0 0 0 0 0 0.0
Are there restrictions on domestic ships getting access to ports?nc 0 0 na 0 0 0 0 0 0 0.0
Are there restrictions on foreign ships getting access to ports?nc 0 0 na 0 0 1 0 0 0 0.1
8 Are there residency or nationality requirements or quotas for any categories of personnel employed by locally established foreign maritime transport services companies?
nc 1 1 na 1 1 1 0 1 1 0.9
9 The permitted length of short-term visit (in days) for foreign personnel (eg shipping agents), and the permitted length of long-term stay (in years) of foreign intra-corporate transferees.
Short-termnc 0.75 0 na 0.25 0.25 0.75 0.75 0.25 0.25 0.4
Long-termnc 0.4 0 na 0.6 0.8 0 0.6 0.8 0.4 0.5
10 Is private ownership in the provision of services through commercial establishment allowed?
Existing operators
International shippingnc 0 0 na 0 0 0 0 0 0 0.0
Cabotagenc 0 0 na 0 0 0 na 0 0 0.0
Internal waterwaysnc 0 0 na 0 0 0 na 0 0 0.0
Port superstructurenc 0 0 na 0 0 0 1 0 0 0.1
Cargo handling servicesnc 0 0 na 0 0 0 0 0 0 0.0
Storage and warehousingnc 0 0 na 0 0 0 1 0 0 0.1
Freight forwardingnc 0 0 na 0 0 0 0 0 0 0.0
Pilotage, towing and tyingnc 1 0 na 0 1 0 1 0 1 0.5
Maintenance and repair of vesselsnc 0 0 na 0 0 0 0 0 0 0.0
New entrants
International shippingnc 0 0 na 0 0 0 0 0 0 0.0
Cabotagenc 0 0 na 0 0 0 na 0 0 0.0
Internal waterwaysnc 0 0 na 0 0 0 na 0 0 0.0
Port superstructurenc 1 0 na 0 0 0 1 0 0 0.3
Cargo handling servicesnc 0 0 na 0 0 0 0 0 0 0.0
Storage and warehousingnc 0 0 na 0 0 0 1 0 0 0.1
Freight forwardingnc 0 0 na 0 0 0 0 0 0 0.0
Pilotage, towing and tyingnc 1 0 na 0 1 0 1 0 1 0.5
Maintenance and repair of vesselsnc 0 0 na 0 0 0 0 0 0 0.0
C. Restrictions on movement of intra-corporate transferees (mode 4)
D. Ownership
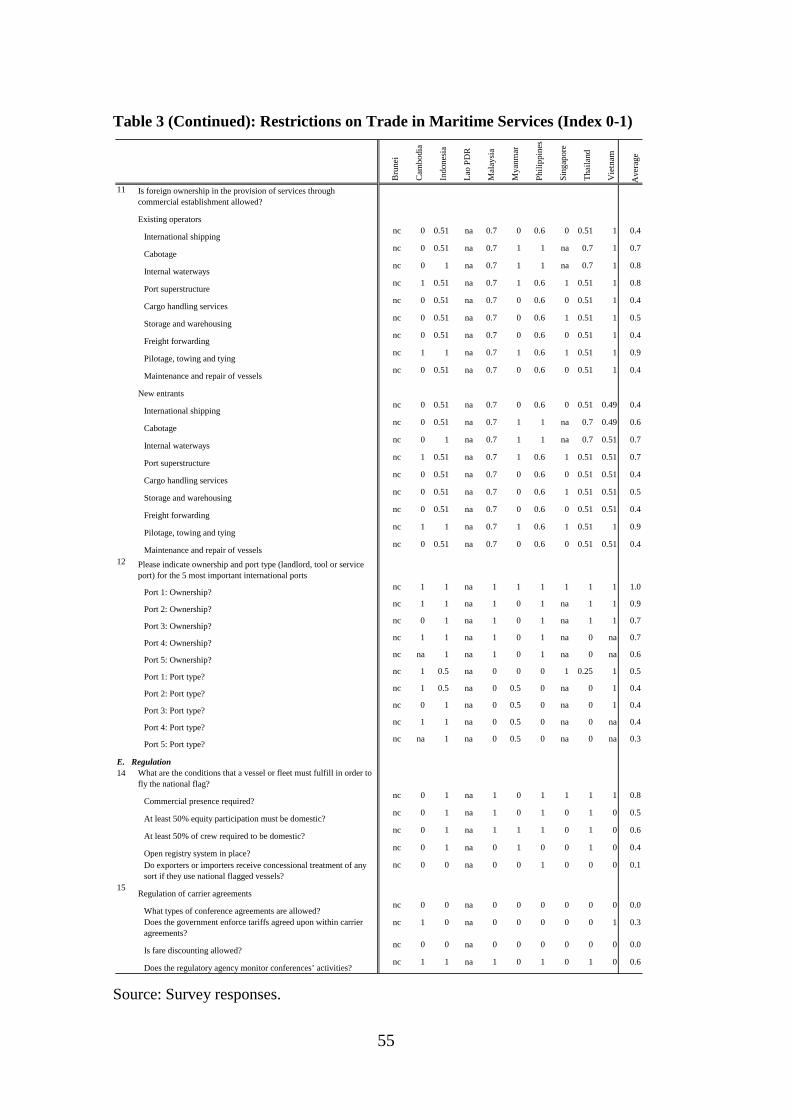
55
Table 3 (Continued): Restrictions on Trade in Maritime Services (Index 0-1)
Source: Survey responses.
Bru
nei
Cam
bodi
a
Indo
nesi
a
Lao
PD
R
Mal
aysi
a
Mya
nmar
Phi
lippi
nes
Sin
gapo
re
Tha
iland
Vie
tnam
Ave
rage
11 Is foreign ownership in the provision of services through commercial establishment allowed?
Existing operators
International shippingnc 0 0.51 na 0.7 0 0.6 0 0.51 1 0.4
Cabotagenc 0 0.51 na 0.7 1 1 na 0.7 1 0.7
Internal waterwaysnc 0 1 na 0.7 1 1 na 0.7 1 0.8
Port superstructurenc 1 0.51 na 0.7 1 0.6 1 0.51 1 0.8
Cargo handling servicesnc 0 0.51 na 0.7 0 0.6 0 0.51 1 0.4
Storage and warehousingnc 0 0.51 na 0.7 0 0.6 1 0.51 1 0.5
Freight forwardingnc 0 0.51 na 0.7 0 0.6 0 0.51 1 0.4
Pilotage, towing and tyingnc 1 1 na 0.7 1 0.6 1 0.51 1 0.9
Maintenance and repair of vesselsnc 0 0.51 na 0.7 0 0.6 0 0.51 1 0.4
New entrants
International shippingnc 0 0.51 na 0.7 0 0.6 0 0.51 0.49 0.4
Cabotagenc 0 0.51 na 0.7 1 1 na 0.7 0.49 0.6
Internal waterwaysnc 0 1 na 0.7 1 1 na 0.7 0.51 0.7
Port superstructurenc 1 0.51 na 0.7 1 0.6 1 0.51 0.51 0.7
Cargo handling servicesnc 0 0.51 na 0.7 0 0.6 0 0.51 0.51 0.4
Storage and warehousingnc 0 0.51 na 0.7 0 0.6 1 0.51 0.51 0.5
Freight forwardingnc 0 0.51 na 0.7 0 0.6 0 0.51 0.51 0.4
Pilotage, towing and tyingnc 1 1 na 0.7 1 0.6 1 0.51 1 0.9
Maintenance and repair of vesselsnc 0 0.51 na 0.7 0 0.6 0 0.51 0.51 0.4
12 Please indicate ownership and port type (landlord, tool or service port) for the 5 most important international ports
Port 1: Ownership? nc 1 1 na 1 1 1 1 1 1 1.0
Port 2: Ownership? nc 1 1 na 1 0 1 na 1 1 0.9
Port 3: Ownership? nc 0 1 na 1 0 1 na 1 1 0.7
Port 4: Ownership? nc 1 1 na 1 0 1 na 0 na 0.7
Port 5: Ownership? nc na 1 na 1 0 1 na 0 na 0.6
Port 1: Port type? nc 1 0.5 na 0 0 0 1 0.25 1 0.5
Port 2: Port type? nc 1 0.5 na 0 0.5 0 na 0 1 0.4
Port 3: Port type? nc 0 1 na 0 0.5 0 na 0 1 0.4
Port 4: Port type? nc 1 1 na 0 0.5 0 na 0 na 0.4
Port 5: Port type? nc na 1 na 0 0.5 0 na 0 na 0.3
14 What are the conditions that a vessel or fleet must fulfill in order to fly the national flag?
Commercial presence required?nc 0 1 na 1 0 1 1 1 1 0.8
At least 50% equity participation must be domestic?nc 0 1 na 1 0 1 0 1 0 0.5
At least 50% of crew required to be domestic?nc 0 1 na 1 1 1 0 1 0 0.6
Open registry system in place?nc 0 1 na 0 1 0 0 1 0 0.4
Do exporters or importers receive concessional treatment of any sort if they use national flagged vessels?
nc 0 0 na 0 0 1 0 0 0 0.1
15Regulation of carrier agreements
What types of conference agreements are allowed?nc 0 0 na 0 0 0 0 0 0 0.0
Does the government enforce tariffs agreed upon within carrier agreements?
nc 1 0 na 0 0 0 0 0 1 0.3
Is fare discounting allowed?nc 0 0 na 0 0 0 0 0 0 0.0
Does the regulatory agency monitor conferences’ activities?nc 1 1 na 1 0 1 0 1 0 0.6
E. Regulation

56
Table 3 (Continued): Restrictions on Trade in Maritime Services (Index 0-1)
Source: Survey responses.
Sometimes an intermediate score is assigned for intermediate stages of
restrictiveness. In the case of maritime services, partial scores have been assigned as
follows. For private and foreign equity restrictions, the partial scoring system is the
same as in air transport. For the permitted short-term stay of foreign personnel, a
score of 0.75 denotes a stay of 30 days or less, a score of 0.5 denotes a stay of 60
Bru
nei
Cam
bodi
a
Indo
nesi
a
Lao
PD
R
Mal
aysi
a
Mya
nmar
Phi
lippi
nes
Sin
gapo
re
Tha
iland
Vie
tnam
Ave
rage
16Regulation of port services
Are terminal handling costs regulated by government?nc 1 1 na 0 1 1 1 0 1 0.8
Are terminal handling costs non-negotiable?nc 1 1 na 0 1 1 1 0 1 0.8
Are terminals restricted in the activities they can undertake (eg only container operations)?
nc 0 1 na 0 1 1 0 0 0 0.4
Are private ports prohibited from handling general cargo, or able to handle general cargo on payment of a fee?
nc 1 1 na 0.5 0.5 1 0 0 0.5 0.6
18 Do the licence conditions for foreign-invested providers who establish locally differ from those for local providers?
International shippingnc 0 1 na 0 1 0 0 0 0 0.3
Cabotagenc 0 1 na 1 1 1 na 0 0 0.6
Internal waterwaysnc 0 1 na 0 1 1 na 0 0 0.4
Port superstructurenc 0 0 na 0 1 0 1 0 0 0.3
Cargo handling servicesnc 0 0 na 0 1 0 0 0 0 0.1
Storage and warehousingnc 0 0 na 0 1 0 1 0 0 0.3
Freight forwardingnc 0 0 na 0 1 0 0 0 0 0.1
Pilotage, towing and tyingnc 1 1 na 0 1 0 1 0 0 0.5
Maintenance and repair of vesselsnc 0 0 na 0 1 1 0 0 0 0.3
19 Do the licence conditions for foreign cross-border providers differ from those for local providers?
International shippingnc 0 1 na 0 1 0 0 0 1 0.4
Cabotagenc 0 1 na 1 1 1 na 1 1 0.9
Internal waterwaysnc 0 1 na 0 1 1 na 1 1 0.7
20 Does the provision of shipping services by domestic or foreign providers require the appointment of a domestic shipping agent?
Domestic providers
International shippingnc 0 0 na 1 1 0 0 1 0 0.4
Cabotagenc 0 0 na 1 1 0 na 1 0 0.4
Internal waterwaysnc 0 0 na 1 1 0 na 1 0 0.4
Foreign providers
International shippingnc 0 1 na 1 0 1 0 1 0 0.5
Cabotagenc 0 1 na 1 0 0 na 1 0 0.4
Internal waterwaysnc 0 1 na 1 0 0 na 1 0 0.4
21 Restrictions on the transportation of non-commercial (eg government, defence) cargoes.
nc 0 0 na 0 1 0.5 0 1 0.5 0.4
22Does the government subsidise domestic shipping companies?
nc 0 1 na 0 0 0 0 0 0 0.1
23 Has the government covered operational losses of shipping companies in the past ten years?
nc 0 0 na 0 0 0 0 0 0 0.0

57
days or less, and a score of 0.25 denotes a stay of 90 days or less. For the permitted
long-term stay of intra-corporate transferees, a score of 0.8 denotes a stay of 1 year
or less, a score of 0.6 denotes a stay of 2 years or less, and a score of 0.4 denotes a
stay of 3 years or less, and a score of 0.2 denotes a stay of 4 years or less. When
scoring the ownership and operation of ports, public ownership has been scored as 1
and private ownership as 0, while a service port has been scored as 1, a tool port as
0.5 and a landlord port as 0. The scores shown are the average scores across the top
five ports. For restrictions on whether private ports can handle general cargo, an
intermediate score of 0.5 denotes that payment of a fee is required. For restrictions
on the carriage of non-commercial cargoes, an intermediate score of 0.5 denotes that
limited restrictions apply.
Summary restrictiveness scores for broad categories of restrictions have also
been obtained using the same methods as for air transport. The results are shown in
Table 4. The summary scores have been compiled for each maritime service
separately, because of the potentially wide variation in the degree of restrictiveness
across different services.
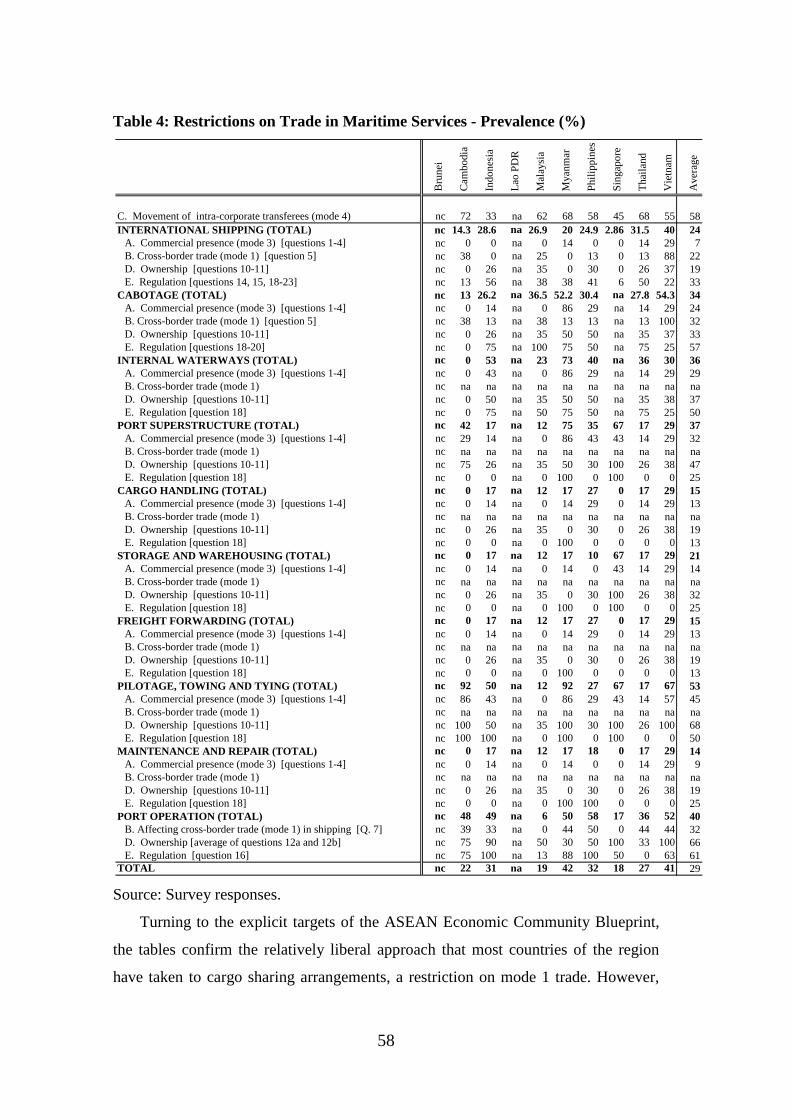
58
Table 4: Restrictions on Trade in Maritime Services - Prevalence (%)
Source: Survey responses.
Turning to the explicit targets of the ASEAN Economic Community Blueprint,
the tables confirm the relatively liberal approach that most countries of the region
have taken to cargo sharing arrangements, a restriction on mode 1 trade. However,
Bru
nei
Cam
bodi
a
Indo
nesi
a
Lao
PD
R
Mal
aysi
a
Mya
nmar
Phi
lippi
nes
Sin
gapo
re
Tha
iland
Vie
tnam
Ave
rage
C. Movement of intra-corporate transferees (mode 4) nc 72 33 na 62 68 58 45 68 55 58INTERNATIONAL SHIPPING (TOTAL) nc 14.3 28.6 na 26.9 20 24.9 2.86 31.5 40 24
A. Commercial presence (mode 3) [questions 1-4] nc 0 0 na 0 14 0 0 14 29 7B. Cross-border trade (mode 1) [question 5] nc 38 0 na 25 0 13 0 13 88 22D. Ownership [questions 10-11] nc 0 26 na 35 0 30 0 26 37 19E. Regulation [questions 14, 15, 18-23] nc 13 56 na 38 38 41 6 50 22 33
CABOTAGE (TOTAL) nc 13 26.2 na 36.5 52.2 30.4 na 27.8 54.3 34A. Commercial presence (mode 3) [questions 1-4] nc 0 14 na 0 86 29 na 14 29 24B. Cross-border trade (mode 1) [question 5] nc 38 13 na 38 13 13 na 13 100 32D. Ownership [questions 10-11] nc 0 26 na 35 50 50 na 35 37 33E. Regulation [questions 18-20] nc 0 75 na 100 75 50 na 75 25 57
INTERNAL WATERWAYS (TOTAL) nc 0 53 na 23 73 40 na 36 30 36A. Commercial presence (mode 3) [questions 1-4] nc 0 43 na 0 86 29 na 14 29 29B. Cross-border trade (mode 1) nc na na na na na na na na na naD. Ownership [questions 10-11] nc 0 50 na 35 50 50 na 35 38 37E. Regulation [question 18] nc 0 75 na 50 75 50 na 75 25 50
PORT SUPERSTRUCTURE (TOTAL) nc 42 17 na 12 75 35 67 17 29 37A. Commercial presence (mode 3) [questions 1-4] nc 29 14 na 0 86 43 43 14 29 32B. Cross-border trade (mode 1) nc na na na na na na na na na naD. Ownership [questions 10-11] nc 75 26 na 35 50 30 100 26 38 47E. Regulation [question 18] nc 0 0 na 0 100 0 100 0 0 25
CARGO HANDLING (TOTAL) nc 0 17 na 12 17 27 0 17 29 15A. Commercial presence (mode 3) [questions 1-4] nc 0 14 na 0 14 29 0 14 29 13B. Cross-border trade (mode 1) nc na na na na na na na na na naD. Ownership [questions 10-11] nc 0 26 na 35 0 30 0 26 38 19E. Regulation [question 18] nc 0 0 na 0 100 0 0 0 0 13
STORAGE AND WAREHOUSING (TOTAL) nc 0 17 na 12 17 10 67 17 29 21A. Commercial presence (mode 3) [questions 1-4] nc 0 14 na 0 14 0 43 14 29 14B. Cross-border trade (mode 1) nc na na na na na na na na na naD. Ownership [questions 10-11] nc 0 26 na 35 0 30 100 26 38 32E. Regulation [question 18] nc 0 0 na 0 100 0 100 0 0 25
FREIGHT FORWARDING (TOTAL) nc 0 17 na 12 17 27 0 17 29 15A. Commercial presence (mode 3) [questions 1-4] nc 0 14 na 0 14 29 0 14 29 13B. Cross-border trade (mode 1) nc na na na na na na na na na naD. Ownership [questions 10-11] nc 0 26 na 35 0 30 0 26 38 19E. Regulation [question 18] nc 0 0 na 0 100 0 0 0 0 13
PILOTAGE, TOWING AND TYING (TOTAL) nc 92 50 na 12 92 27 67 17 67 53A. Commercial presence (mode 3) [questions 1-4] nc 86 43 na 0 86 29 43 14 57 45B. Cross-border trade (mode 1) nc na na na na na na na na na naD. Ownership [questions 10-11] nc 100 50 na 35 100 30 100 26 100 68E. Regulation [question 18] nc 100 100 na 0 100 0 100 0 0 50
MAINTENANCE AND REPAIR (TOTAL) nc 0 17 na 12 17 18 0 17 29 14A. Commercial presence (mode 3) [questions 1-4] nc 0 14 na 0 14 0 0 14 29 9B. Cross-border trade (mode 1) nc na na na na na na na na na naD. Ownership [questions 10-11] nc 0 26 na 35 0 30 0 26 38 19E. Regulation [question 18] nc 0 0 na 0 100 100 0 0 0 25
PORT OPERATION (TOTAL) nc 48 49 na 6 50 58 17 36 52 40B. Affecting cross-border trade (mode 1) in shipping [Q. 7] nc 39 33 na 0 44 50 0 44 44 32D. Ownership [average of questions 12a and 12b] nc 75 90 na 50 30 50 100 33 100 66E. Regulation [question 16] nc 75 100 na 13 88 100 50 0 63 61
TOTAL nc 22 31 na 19 42 32 18 27 41 29

59
only three ASEAN countries — Cambodia, Indonesia and Thailand — have stated
that they grant exemptions from cabotage restrictions, although Indonesia appears to
be in the process of phasing the exemptions out. In addition, Vietnam does not allow
cross-border provision of maritime services. Vietnam does not have a deep sea port,
so most goods are transported to Singapore and Hong Kong before going to the end
points. Foreign firms usually provide cross-border services via a Vietnamese (wholly
domestic) agency, who does everything on behalf of foreign suppliers in Vietnam
and earns a commission from the foreign partners.
Restrictions on the consumption of maritime transport services abroad are
virtually non-existent, other than through restrictions on the outward movement of
consumers themselves. Hence they have not been canvassed in this study.
Turning next to the various types of restrictions on commercial presence (mode
3), ownership restrictions are slightly more prevalent than other kinds of regulatory
restrictions on entry. According to the survey responses, no ASEAN economy meets
the Blueprint target of allowing at least 51 per cent foreign ownership by 2010 in all
maritime services. However, some countries meet the target for at least some
services, including Cambodia, Singapore, Vietnam and (in principle) Myanmar. In
most countries, port operations are still government owned. But some countries have
moved to a landlord port model for at least some ports, including Cambodia,
Malaysia, the Philippines and Thailand. Regulatory restrictions on entry (other than
equity limits) are most prevalent in port superstructure services and pilotage, towing
and tying.
Looking beyond trade barriers (strictly defined) to look at domestic regulatory
regimes that could also be anti-competitive, half of the ASEAN countries retain
discriminatory licensing conditions on foreign suppliers (or prohibit foreign entry)
for at least some services — these are Cambodia, Indonesia, Myanmar, the
Philippines and Singapore. A majority of ASEAN countries require at least some
types of shippers to be represented by a domestic shipping agent. A minority retain
restrictions on the transportation of non-commercial cargoes. Fewer governments
subsidize shipping companies than they do domestic airlines. However, most
governments retain relatively heavy regulation of port services.

60
4. Telecommunications
4.1. Key features of the regulatory regime for telecommunications
One of the key rationales for regulatory intervention in fixed line
telecommunications has been that, depending on the size of the market, at least some
components of the network have had the characteristics of a so-called ‘natural
monopoly’. This means that a single provider can serve the market at lower cost that
two or more providers. But regulatory oversight is then required to ensure that a
single provider does not abuse its monopoly power.
A second key rationale has been a concern for equity — to ensure that all
individuals (or groups) have access to telecommunications services at reasonable
cost (commensurate with their incomes, and irrespective of the cost of providing
them with the service). This is the so-called universal service obligation of
telecommunications carriers. In markets where penetration was low, this type of
intervention also had an efficiency rationale. The value to subscribers of connecting
to the network increases with the size of the network. Such ‘network externalities’
were also seen to justify some degree of subsidization of telecommunications
services so as to increase the size of the network.
In the past, these twin objectives were often met by having all
telecommunications services provided by a government department, often in
conjunction with postal services.
As reflected in the WTO Reference Paper on telecommunications, the reforms of
the 1990s recognized that not all elements of the network had natural monopoly
characteristics, and that efficiency gains could be had by introducing competition
into those components of the network that were not natural monopolies. However,
competitors would still need access to the monopoly elements in order to provide a
full retail service. So a regulatory access regime was required to ensure that the
incumbent provider did not use its control over the ‘bottleneck’ or ‘essential’ facility
to thwart competition in downstream markets. The access regime was to provide
competitors with access to essential facilities at access charges that were cost-based
and non-discriminatory. In many networks, the key natural monopoly element was
the so-called ‘last mile’ — the twisted copper wire connecting each subscriber to the

61
network, although in small markets other components of the network could also be
natural monopolies. The appropriate regulation of access charges is a complex issue,
although sometimes made more complex than necessary when access charges (as a
single policy instrument) are used to pursue multiple objectives (eg Dee and Findlay
2008).
A related requirement for promoting contestability was to ensure the general
interconnectivity of the facilities of various competitors, whether or not they
constituted essential facilities. This was required so the subscribers of one provider
could make calls to subscribers of all other providers, irrespective of the ownership
of the various network components involved. Various regulatory principles were also
developed to ensure that interconnection charges were not used by the incumbent to
preserve network dominance (eg Economides, Lopomo and Woroch 1996, ITU
2000).
A further component of these reforms was ensuring number portability, so that
retail subscribers could take their original phone number with them if they switched
providers. This was necessary to reduce the cost of ‘shopping around’, and thus to
increase the competitive pressures on providers.
A key supporting component of these pro-competitive reforms was to revise the
ways in which universal service obligations were met. To that point, they had often
been met by cross-subsidies built into the retail prices of telecommunications
services. Typically, local call prices were kept too low (relative to costs) and no
monthly subscriber access charge was imposed that would help to cover the fixed
costs of the network. These pricing decisions, typically designed to help the poor,
were at least partially funded by having prices of long distance and international calls
that were too high (relative to costs). With the introduction of competition, these
cross-subsidies provided competitors with a chance to cherry-pick the lucrative,
long-distance parts of the market, and left incumbents with fewer options to cover
their fixed costs. Their response was often to inflate the wholesale access prices
charged to competitors for access to the essential facility. Of course, this worked to
defeat the introduction of competition. A key reform component of the 1990s was
therefore to ‘re-balance’ retail prices to remove the cross-subsidies and to ensure that
fixed costs were covered, and to find other ways to fund universal service obligations

62
— typically either directly from the government budget, or through an industry levy
imposed on all service providers.
Since then, a number of technological advances have in some ways radically
transformed the industry. The first key development has been the phenomenal
growth of mobile telephony. This technology has few natural monopoly elements, so
it has allowed extensive entry by new providers. The cost of mobile handsets has
come down to such an extent that they are now within the reach of the very poorest.
The availability of pre-paid phone cards means that it is now a low-risk business to
provide such services to the very poorest. Data from the International
Telecommunications Union (www.itu.int/ITU-D/icteye/Default.aspx) shows that the
market penetration of mobile telephony (measured by the number of subscribers per
100 of the population) far exceeds that of fixed line telephony in virtually all markets.
And in some countries, the penetration of fixed line telephony has actually fallen
recently, as individuals have relinquished fixed lines in favour of mobile-only
services.
To the extent that mobile services provide a close substitute to fixed line services,
competition from this source can discipline the behaviour of fixed line service
providers and reduce the need for regulatory intervention or oversight. The two
services are close substitutes for individuals and perhaps even households. But
businesses of any size typically also need fixed line connections to meet the sheer
volume of their voice and data needs. Most governments have therefore retained the
kind of regulatory structures described in the WTO Reference Paper.
A second key development has been the growth of internet, particularly
broadband, services. These services, which combine developments in the size and
nature of the ‘pipe’ with developments in switching and signal transmission
technology, have made it technologically meaningless to distinguish voice from data
traffic. This is the essence of ‘convergence’. So now there is an imperative for
regulatory structures to acknowledge this convergence. The key way in which this is
happening is in the move from ‘individual’ to ‘general’ or ‘class’ licensing, not just
for carrier licences, but also for licences to access the spectrum required for mobile
and fixed wireless technologies. Typically, individual licences were not only
attached to a particular technology, they were also attached to a particular service.

63
General licenses are less tied to particular services, and will often allow both voice
and data transmission, although most governments are not yet ready to include
broadcasting services in the bundle.
There is also a growing choice of technologies for delivering broadband services.
Somewhat against initial expectations, technological developments have greatly
expanded the capacity of the twisted copper wire, so that within OECD countries
(which have extensive conventional networks), the overwhelming majority of
broadband services are delivered by DSL technology, a technology that still uses the
‘last mile’ (OECD 2008). Fibre optic cables offer the prospect of even higher speeds
and capacity, but virtually the entire fibre optic network is likely have natural
monopoly characteristics, at least for initial levels of usage. Finally, fixed wireless
technologies can offer broadband services at a lower capital cost than wired
technologies, though at slower speed and not necessarily at lower operating cost
(ITU 2001). They are also subject to the same problem of spectrum congestion as
mobile services, a problem that is becoming endemic in cities such as Jakarta.
This proliferation of delivery technologies has also provided an imperative for
regulatory structures to be ‘technology-neutral’. This is also facilitated by the move
from ‘individual’ to ‘general’ or ‘class’ licensing, since general licenses are typically
no longer tied to a particular technology.
But there are limits on the extent to which regulatory structures can be
completely technology-neutral. This is because a key rationale for regulatory
intervention remains dealing with ‘natural monopoly’ components of the network,
and the nature and extent of the natural monopoly problem depends on the particular
technology in question. Furthermore, as new technologies emerge, regulation must
strike a balance between promoting static and dynamic efficiency. Static efficiency
requires ensuring maximum use of existing facilities that have natural monopoly
characteristics. Dynamic efficiency requires ensuring that providers have sufficient
incentives to make risky investments in new capacity and new technologies, by
receiving sufficient reward for taking such risks.
Services trade reform is one way of promoting the contestability of markets. The
potential benefits have been shown to be significant. Mattoo, Rathindran and
Subramanian (2001) estimated that countries with fully open telecommunications
64
and financial sectors grow up to 1.5 percentage points faster than other countries.
The analysis of Warren (2000) suggests that in the ASEAN 5, the regulatory
restrictions then affecting domestic new entrants would have raised the prices of their
services by an average of over 10 per cent, while the additional discrimination
(including foreign equity limits) against foreign-invested suppliers would have raised
the cost of their services by more than 80 per cent.
However, in telecommunications services, there is no ‘one-size-fits-all’ best
approach to regulation, given the rapid development and proliferation of
technologies. The most recent ITU survey of trends in reform (ITU 2008) stresses the
importance of ensuring interconnectivity across all technologies and all providers, to
maximize the use that will be made of any particular facility. The report is subtitled
‘Six Degrees of Sharing’, and notes (p. 1):
“In a way, many regulatory practices can be viewed as sharing. What is new and
innovative is their application to meet the needs of developing countries. What is the
same is that they use time-tested, pro-competitive tools, such as the regulation of
essential or bottleneck facilities, transparency, and the promotion of collocation and
interconnection”.
Nevertheless, there is considerable current uncertainty about which technologies
may become dominant in the future, and as noted, the scope of such regulation
depends on the technology. Countries may not necessarily be sure to ‘pick the best
winner’, but they can at least ensure that their regulatory regimes are internally
consistent. For example, countries making a serious commitment to fibre optic
technologies could need to put more regulatory effort into access regimes that
countries relying more on mobile and fixed wireless technologies. But designing a
regulatory framework may also depend on whether the national backbone provider
competes with other service providers for end users (in which case they have an
incentive to block competitors), or whether the backbone provider does not service
end users (and therefore has an incentive to sell as much capacity as possible to those
that do). There are many more such considerations to be taken into account.
In what follows, the scorecard for telecommunications monitors some of the
regulatory settings that have been instrumental in promoting contestability in many

65
circumstances. However, it needs to be recognized that the best, or most internally
consistent, regulatory regime may still vary significantly from country to country.
4.2. Scorecard for telecommunications services
The questionnaire covering actual barriers to trade in telecommunications
services thus asks about a range of regulatory policies. Many of these have been
recognized as being trade-promoting by the WTO Reference Paper on
Telecommunications.
Under commercial presence, the questionnaire asks whether there are restrictions
on the entry of new service providers wanting to establish commercially, whether
they are domestically-owned, foreign-invested or both. The question covers a variety
of telecommunications services separately — domestic fixed line services (local and
long-distance), international services (wire/cable and satellite), mobile services using
various technologies, data services (both fixed and wireless), leased lines, internet
access services and VoIP (Voice over the Internet Protocol) telephony.
The questionnaire also asks these questions separately for facilities-based
services, ie services offered by suppliers who own most or all of the transmission
capacity used, and resale-based services, ie services offered by suppliers that lease
transmission capacity from facilities-based operators and use those facilities
(typically with their own switches and routers) to provide services to third parties.
Some countries have encouraged resale-based services, particularly in the early
stages of reform, in order to put competitive pressure on the pricing structures of
incumbents. Other countries have wanted to promote facilities-based competition,
and so have restricted or prohibited resale-based services.
This section also asks about restrictions on the ability of non-
telecommunications businesses to lease lines or build private networks to meet their
own internal communications needs. It also asks about whether such businesses are
restricted from connecting their own internal networks to the outside world through
the public switched telecommunications network.
Finally, this section asks about whether providers of some services (either
facilities-based or resale-based) are restricted from offering services in other
66
segments of the market. It also asks about restrictions on the legal form of
establishment, in particular whether these differ for foreign-invested companies.
It is generally difficult to trade telecommunications services cross-border,
without a commercial presence. This is because phone calls are initiated at home,
using home-based infrastructure. About the only way that cross-border (mode 1)
trade can occur is via call-back. This is where a caller phones an overseas operator,
who then calls the subscriber back and connects them to their intended party. In this
way, the substantive call is initiated overseas (although the home subscriber can still
be charged by the operator for the service). Call-back used to be an effective way to
circumvent high international call charges, and perhaps for this reason, it was (and
still is) banned in many countries. However, it is of far less relevance today. Firstly,
technological advances in conventional telephony have allowed significantly more
domestic competition, which has dramatically reduced international call charges.
Secondly, much more effective competition is now being provided by VoIP
telephony, which is a service requiring a domestic commercial presence.
Nevertheless, for completeness, the questionnaire asks about restrictions on call-back
services.
Under ownership restrictions, the questionnaire asks whether there are maximum
limits on the equity participation of either private domestic or foreign shareholders in
locally established telecommunications companies. This question covers the full
variety of telecommunications services separately, and also covers facilities-based
and resale-based services.
In the final policy section, the questionnaire asks about various aspects of the
domestic regulatory regime. It asks whether carrier licences and spectrum licences
are ‘individual’ or ‘general’. It asks whether any licences grant exclusive (ie
monopoly) rights, and whether separate licences are required for each state/province.
It asks about the presence of discriminatory licensing requirements for foreign
providers. It also asks about restrictions on the transfer of carrier licences, and
whether spectrum trading occurs. Finally, this section has questions covering the
regulation of network interconnection (such as whether these are regulated, and
which pricing principles apply), the regulation of end-user tariffs (such as whether

67
tariffs have been rebalanced), and the regulation of universal service (such as which
instruments are used).
Finally, unlike the questionnaires for other services, this questionnaire asks about
market structures in telecommunications. As noted above, there is no one-size-fits-all
regulatory structure, although there are some common elements that have proved to
be pro-competitive in many circumstances. What matters as much as the individual
regulatory elements is their overall coherence. There have been instances in the past
where countries have been able to tick most of the boxes in terms of fulfilling the
requirements of the WTO Reference Paper on Telecommunications, but incumbents
have been able to retain a dominant position because of internal inconsistency, or
because key pieces of the regulatory puzzle have been missing. The questionnaire
requests a variety of information about market structure, but in practice only three
pieces of information were able to be collected on a consistent basis — the market
share of the dominant fixed line service provider, the market share of the dominant
mobile service provider, and the number of providers of VoIP telephony.
4.3. Scorecard results for telecommunications services
As with previous services, the qualitative information about trade restrictions
and regulatory regimes has been coded in a zero-one fashion, where for each
question, a score of 1 has been assigned if the restriction applies, and 0 if it does not.
These detailed results are shown in Table 5.
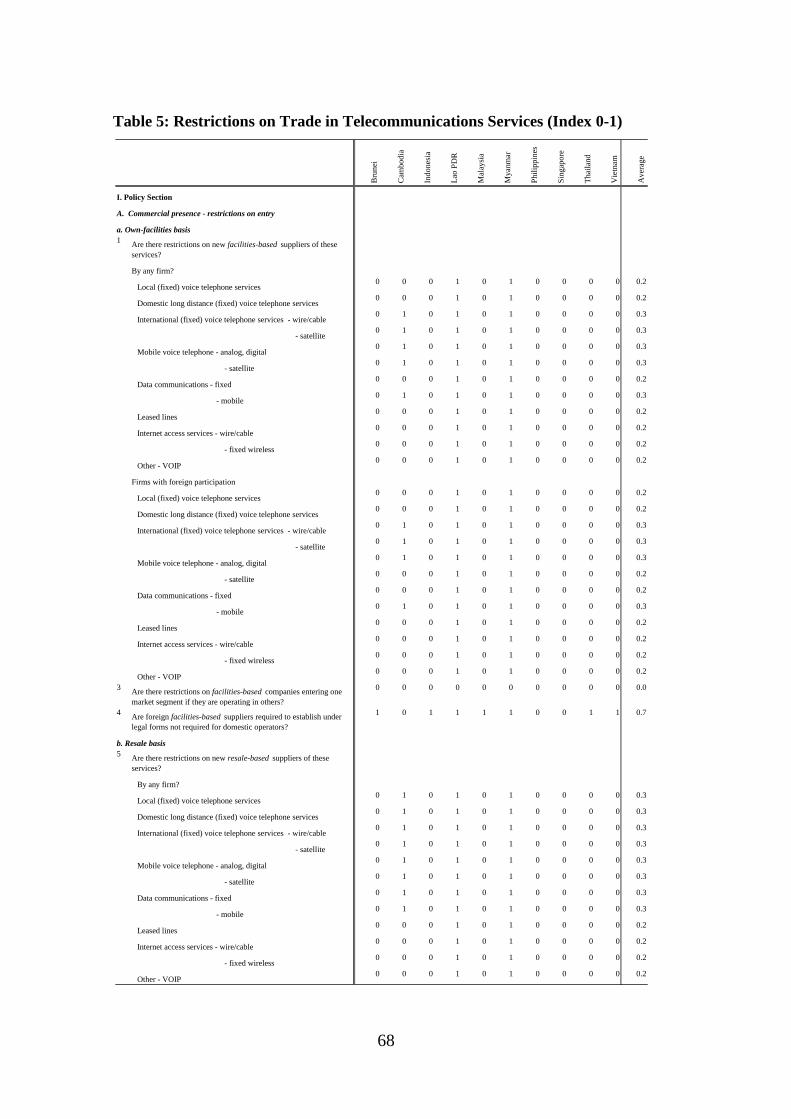
68
Table 5: Restrictions on Trade in Telecommunications Services (Index 0-1)
Bru
nei
Cam
bodi
a
Indo
nesi
a
Lao
PD
R
Mal
aysi
a
Mya
nmar
Phi
lippi
nes
Sin
gapo
re
Tha
iland
Vie
tnam
Ave
rage
1 Are there restrictions on new facilities-based suppliers of these services?
By any firm?
Local (fixed) voice telephone services0 0 0 1 0 1 0 0 0 0 0.2
Domestic long distance (fixed) voice telephone services0 0 0 1 0 1 0 0 0 0 0.2
International (fixed) voice telephone services - wire/cable0 1 0 1 0 1 0 0 0 0 0.3
- satellite0 1 0 1 0 1 0 0 0 0 0.3
Mobile voice telephone - analog, digital0 1 0 1 0 1 0 0 0 0 0.3
- satellite0 1 0 1 0 1 0 0 0 0 0.3
Data communications - fixed0 0 0 1 0 1 0 0 0 0 0.2
- mobile0 1 0 1 0 1 0 0 0 0 0.3
Leased lines0 0 0 1 0 1 0 0 0 0 0.2
Internet access services - wire/cable0 0 0 1 0 1 0 0 0 0 0.2
- fixed wireless0 0 0 1 0 1 0 0 0 0 0.2
Other - VOIP0 0 0 1 0 1 0 0 0 0 0.2
Firms with foreign participation
Local (fixed) voice telephone services0 0 0 1 0 1 0 0 0 0 0.2
Domestic long distance (fixed) voice telephone services0 0 0 1 0 1 0 0 0 0 0.2
International (fixed) voice telephone services - wire/cable0 1 0 1 0 1 0 0 0 0 0.3
- satellite0 1 0 1 0 1 0 0 0 0 0.3
Mobile voice telephone - analog, digital0 1 0 1 0 1 0 0 0 0 0.3
- satellite0 0 0 1 0 1 0 0 0 0 0.2
Data communications - fixed0 0 0 1 0 1 0 0 0 0 0.2
- mobile0 1 0 1 0 1 0 0 0 0 0.3
Leased lines0 0 0 1 0 1 0 0 0 0 0.2
Internet access services - wire/cable0 0 0 1 0 1 0 0 0 0 0.2
- fixed wireless0 0 0 1 0 1 0 0 0 0 0.2
Other - VOIP0 0 0 1 0 1 0 0 0 0 0.2
3 Are there restrictions on facilities-based companies entering one market segment if they are operating in others?
0 0 0 0 0 0 0 0 0 0 0.0
4 Are foreign facilities-based suppliers required to establish under legal forms not required for domestic operators?
1 0 1 1 1 1 0 0 1 1 0.7
5 Are there restrictions on new resale-based suppliers of these services?
By any firm?
Local (fixed) voice telephone services0 1 0 1 0 1 0 0 0 0 0.3
Domestic long distance (fixed) voice telephone services0 1 0 1 0 1 0 0 0 0 0.3
International (fixed) voice telephone services - wire/cable0 1 0 1 0 1 0 0 0 0 0.3
- satellite0 1 0 1 0 1 0 0 0 0 0.3
Mobile voice telephone - analog, digital0 1 0 1 0 1 0 0 0 0 0.3
- satellite0 1 0 1 0 1 0 0 0 0 0.3
Data communications - fixed0 1 0 1 0 1 0 0 0 0 0.3
- mobile0 1 0 1 0 1 0 0 0 0 0.3
Leased lines0 0 0 1 0 1 0 0 0 0 0.2
Internet access services - wire/cable0 0 0 1 0 1 0 0 0 0 0.2
- fixed wireless0 0 0 1 0 1 0 0 0 0 0.2
Other - VOIP0 0 0 1 0 1 0 0 0 0 0.2
I. Policy Section
A. Commercial presence - restrictions on entry
a. Own-facilities basis
b. Resale basis

69
Table 5 (Continued): Restrictions on Trade in Telecommunications Services
(Index 0-1)
Bru
nei
Cam
bodi
a
Indo
nesi
a
Lao
PD
R
Mal
aysi
a
Mya
nmar
Phi
lippi
nes
Sin
gapo
re
Tha
iland
Vie
tnam
Ave
rage
Firms with foreign participation
Local (fixed) voice telephone services0 1 0 1 0 1 0 0 0 0 0.3
Domestic long distance (fixed) voice telephone services0 1 0 1 0 1 0 0 0 0 0.3
International (fixed) voice telephone services - wire/cable0 1 0 1 0 1 0 0 0 0 0.3
- satellite0 1 0 1 0 1 0 0 0 0 0.3
Mobile voice telephone - analog, digital0 1 0 1 0 1 0 0 0 0 0.3
- satellite0 1 0 1 0 1 0 0 0 0 0.3
Data communications - fixed0 1 0 1 0 1 0 0 0 0 0.3
- mobile0 1 0 1 0 1 0 0 0 0 0.3
Leased lines0 0 0 1 0 1 0 0 0 0 0.2
Internet access services - wire/cable0 0 0 1 0 1 0 0 0 0 0.2
- fixed wireless0 0 0 1 0 1 0 0 0 0 0.2
Other - VOIP0 0 0 1 0 1 0 0 0 0 0.2
7 Are there restrictions on resale-based companies entering one market segment if they are operating in others?
0 0 0 0 0 0 0 0 0 0 0.0
8 Are foreign resale-based suppliers required to establish under legal forms not required for domestic operators?
1 0 1 1 1 1 0 0 1 1 0.7
9 Are companies permitted to operate private networks of leased lines between their various premises?
0 0 0 0 0 0 0 0 0 0 0.0
Is prior authorization required?1 1 0 0 1 0 0 0 1 0 0.4
10 Are companies permitted to operate private networks of “own facilities” between their various premises?
0 0 0 1 0 0 0 0 0 0 0.1
Is prior authorization required?1 1 0 0 1 1 0 1 1 0 0.6
11 What types of affiliated firms may be connected to the same private network?
Parent/holding companies, subsidiaries and branches0 0 0 0 0 0 0 0 0 0 0.0
As above plus affiliates with minority ownership0 0 0 0 0 0 0 1 0 1 0.2
Close user groups regardless of ownership linkages0 0 1 0 0 0 0 1 0 1 0.3
12 Is interconnection of these private networks to the public switched network permitted?
At one end?0 0 1 0 0 0 0 0 1 0 0.2
Both ends? 0 0 1 0 1 0 0 0 1 0 0.3
13 Are there restrictions on the cross-border supply of facilities-based services, e.g., callback?
0 1 1 1 1 1 1 0 1 1 0.8
14 Are there routing restrictions (e.g., having to use the incumbent’s international gateways)?
0 1 1 1 1 1 0 0 0 0 0.5
a. Resale basis16 Are there restrictions on the cross-border supply of resale-based
services, e.g., callback?
0 1 1 1 1 1 1 0 1 1 0.8
17 Are there routing restrictions (e.g., having to use the incumbent’s international gateways)?
0 1 1 1 1 1 1 0 0 0 0.6
20 Is private (ie non-government) ownership of facilities-based telecom service suppliers allowed?
Existing operators
Local (fixed) voice telephone services0 0 0 0.75 0 0.4 0 0 0 0 0.1
Domestic long distance (fixed) voice telephone services0 0 0 0.75 0 0.4 0 0 0 0 0.1
International (fixed) voice telephone services - wire/cable0 0 0 1 0 0.4 0 0 0 0 0.1
- satellite0 0 0 1 0 0.4 0 0 0 0 0.1
Mobile voice telephone - analog, digital0 0 0 0.75 0 0.4 0 0 0 0 0.1
- satellite0 0 0 1 0 0.4 0 0 0 0 0.1
c. Leased lines and private networks
B. Restrictions on cross-border trade (mode 1)
a. Own-facilities basis
C. Ownership

70
Table 5 (Continued): Restrictions on Trade in Telecommunications Services
(Index 0-1)
Bru
nei
Cam
bodi
a
Indo
nesi
a
Lao
PD
R
Mal
aysi
a
Mya
nmar
Phi
lippi
nes
Sin
gapo
re
Tha
iland
Vie
tnam
Ave
rage
Data communications - fixed0 0 0 0.75 0 0.4 0 0 0 0 0.1
- mobile0 0 0 0.75 0 0.4 0 0 0 0 0.1
Leased lines0 0 0 0.75 0 0.4 0 0 0 0 0.1
Internet access services - wire/cable0 0 0 0.75 0 0.4 0 0 0 0 0.1
- fixed wireless0 0 0 0.75 0 0.4 0 0 0 0 0.1
Other - VOIP0 0 0 1 0 0.4 0 0 0 0 0.1
New entrants
Local (fixed) voice telephone services0 0 0 1 0 1 0 0 0 0 0.2
Domestic long distance (fixed) voice telephone services0 0 0 1 0 1 0 0 0 0 0.2
International (fixed) voice telephone services - wire/cable0 1 0 1 0 1 0 0 0 0 0.3
- satellite0 1 0 1 0 1 0 0 0 0 0.3
Mobile voice telephone - analog, digital0 1 0 1 0 1 0 0 0 0 0.3
- satellite0 1 0 1 0 1 0 0 0 0 0.3
Data communications - fixed0 0 0 1 0 1 0 0 0 0 0.2
- mobile0 0 0 1 0 1 0 0 0 0 0.2
Leased lines0 0 0 1 0 1 0 0 0 0 0.2
Internet access services - wire/cable0 0 0 1 0 1 0 0 0 0 0.2
- fixed wireless0 0 0 1 0 1 0 0 0 0 0.2
Other - VOIP0 0 0 1 0 1 0 0 0 0 0.2
21 Is foreign ownership of facilities-based telecom service suppliers allowed?
Existing operators
Local (fixed) voice telephone services0.51 0 0.51 0.75 0.51 0.4 0.6 0 0.51 0.49 0.4
Domestic long distance (fixed) voice telephone services 0.51 0 0.51 0.75 0.51 0.4 0.6 0 0.51 0.49 0.4
International (fixed) voice telephone services - wire/cable0.51 0 0.51 1 0.51 0.4 0.6 0 0.51 0.49 0.5
- satellite0.51 0 0.51 1 0.51 0.4 0.6 0 0.51 0.49 0.5
Mobile voice telephone - analog, digital0.51 0 0.35 0.75 0.51 0.4 0.6 0 0.51 0.49 0.4
- satellite0.51 0 0.35 1 0.51 0.4 0.6 0 0.51 0.49 0.4
Data communications - fixed0.51 0 0.05 0.75 0.51 0.4 0.6 0 0.51 0.49 0.4
- mobile0.51 0 0.05 0.75 0.51 0.4 0.6 0 0.51 0.49 0.4
Leased lines0.51 0 0.51 0.75 0.51 0.4 0.6 0 0.51 0.49 0.4
Internet access services - wire/cable0.51 0 0.35 0.75 0.51 0.4 0.6 0 0.51 0.49 0.4
- fixed wireless0.51 0 0.35 0.75 0.51 0.4 0.6 0 0.51 0.49 0.4
Other - VOIP0.51 0 0.51 1 0.51 0.4 0.6 0 0.51 0.49 0.5
New entrants
Local (fixed) voice telephone services0.51 0 0.51 1 0.51 1 0.6 0 0.51 0.49 0.5
Domestic long distance (fixed) voice telephone services0.51 0 0.51 1 0.51 1 0.6 0 0.51 0.49 0.5
International (fixed) voice telephone services - wire/cable0.51 1 0.51 1 0.51 1 0.6 0 0.51 0.49 0.6
- satellite0.51 1 0.51 1 0.51 1 0.6 0 0.51 0.49 0.6
Mobile voice telephone - analog, digital0.51 1 0.35 1 0.51 1 0.6 0 0.51 0.49 0.6
- satellite0.51 1 0.35 1 0.51 1 0.6 0 0.51 0.49 0.6
Data communications - fixed0.51 0 0.05 1 0.51 1 0.6 0 0.51 0.49 0.5
- mobile0.51 0 0.05 1 0.51 1 0.6 0 0.51 0.49 0.5
Leased lines0.51 0 0.51 1 0.51 1 0.6 0 0.51 0.49 0.5
Internet access services - wire/cable0.51 0 0.35 1 0.51 1 0.6 0 0.51 0.49 0.5
- fixed wireless0.51 0 0.35 1 0.51 1 0.6 0 0.51 0.49 0.5
Other - VOIP0.51 0 0.51 1 0.51 1 0.6 0 0.51 0.49 0.5
22 Is private (ie non-government) ownership of resale-based telecom service suppliers allowed?
Existing operators
Local (fixed) voice telephone services0 0 0 1 0 1 0 0 0 0 0.2
Domestic long distance (fixed) voice telephone services0 0 0 1 0 1 0 0 0 0 0.2
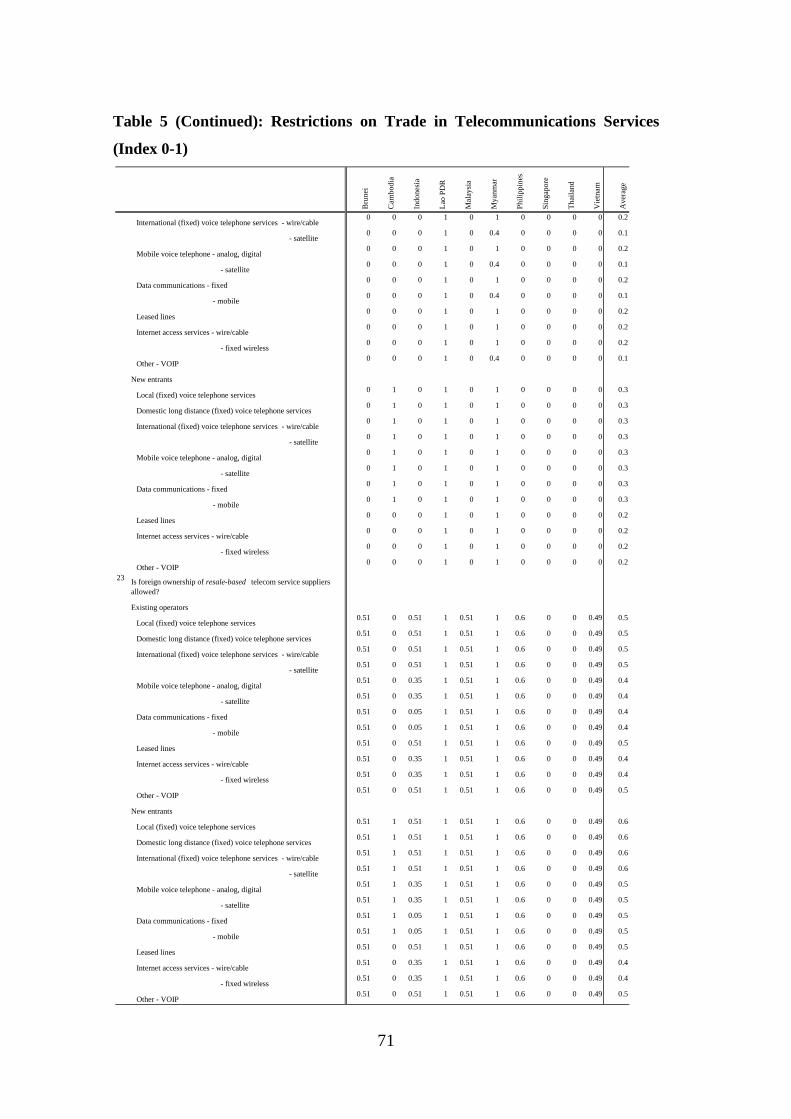
71
Table 5 (Continued): Restrictions on Trade in Telecommunications Services
(Index 0-1)
Bru
nei
Cam
bodi
a
Indo
nesi
a
Lao
PD
R
Mal
aysi
a
Mya
nmar
Phi
lippi
nes
Sin
gapo
re
Tha
iland
Vie
tnam
Ave
rage
International (fixed) voice telephone services - wire/cable0 0 0 1 0 1 0 0 0 0 0.2
- satellite0 0 0 1 0 0.4 0 0 0 0 0.1
Mobile voice telephone - analog, digital0 0 0 1 0 1 0 0 0 0 0.2
- satellite0 0 0 1 0 0.4 0 0 0 0 0.1
Data communications - fixed0 0 0 1 0 1 0 0 0 0 0.2
- mobile0 0 0 1 0 0.4 0 0 0 0 0.1
Leased lines0 0 0 1 0 1 0 0 0 0 0.2
Internet access services - wire/cable0 0 0 1 0 1 0 0 0 0 0.2
- fixed wireless0 0 0 1 0 1 0 0 0 0 0.2
Other - VOIP0 0 0 1 0 0.4 0 0 0 0 0.1
New entrants
Local (fixed) voice telephone services0 1 0 1 0 1 0 0 0 0 0.3
Domestic long distance (fixed) voice telephone services0 1 0 1 0 1 0 0 0 0 0.3
International (fixed) voice telephone services - wire/cable0 1 0 1 0 1 0 0 0 0 0.3
- satellite0 1 0 1 0 1 0 0 0 0 0.3
Mobile voice telephone - analog, digital0 1 0 1 0 1 0 0 0 0 0.3
- satellite0 1 0 1 0 1 0 0 0 0 0.3
Data communications - fixed0 1 0 1 0 1 0 0 0 0 0.3
- mobile0 1 0 1 0 1 0 0 0 0 0.3
Leased lines0 0 0 1 0 1 0 0 0 0 0.2
Internet access services - wire/cable0 0 0 1 0 1 0 0 0 0 0.2
- fixed wireless0 0 0 1 0 1 0 0 0 0 0.2
Other - VOIP0 0 0 1 0 1 0 0 0 0 0.2
23 Is foreign ownership of resale-based telecom service suppliers allowed?
Existing operators
Local (fixed) voice telephone services0.51 0 0.51 1 0.51 1 0.6 0 0 0.49 0.5
Domestic long distance (fixed) voice telephone services0.51 0 0.51 1 0.51 1 0.6 0 0 0.49 0.5
International (fixed) voice telephone services - wire/cable0.51 0 0.51 1 0.51 1 0.6 0 0 0.49 0.5
- satellite0.51 0 0.51 1 0.51 1 0.6 0 0 0.49 0.5
Mobile voice telephone - analog, digital0.51 0 0.35 1 0.51 1 0.6 0 0 0.49 0.4
- satellite0.51 0 0.35 1 0.51 1 0.6 0 0 0.49 0.4
Data communications - fixed0.51 0 0.05 1 0.51 1 0.6 0 0 0.49 0.4
- mobile0.51 0 0.05 1 0.51 1 0.6 0 0 0.49 0.4
Leased lines0.51 0 0.51 1 0.51 1 0.6 0 0 0.49 0.5
Internet access services - wire/cable0.51 0 0.35 1 0.51 1 0.6 0 0 0.49 0.4
- fixed wireless0.51 0 0.35 1 0.51 1 0.6 0 0 0.49 0.4
Other - VOIP0.51 0 0.51 1 0.51 1 0.6 0 0 0.49 0.5
New entrants
Local (fixed) voice telephone services0.51 1 0.51 1 0.51 1 0.6 0 0 0.49 0.6
Domestic long distance (fixed) voice telephone services0.51 1 0.51 1 0.51 1 0.6 0 0 0.49 0.6
International (fixed) voice telephone services - wire/cable0.51 1 0.51 1 0.51 1 0.6 0 0 0.49 0.6
- satellite0.51 1 0.51 1 0.51 1 0.6 0 0 0.49 0.6
Mobile voice telephone - analog, digital0.51 1 0.35 1 0.51 1 0.6 0 0 0.49 0.5
- satellite0.51 1 0.35 1 0.51 1 0.6 0 0 0.49 0.5
Data communications - fixed0.51 1 0.05 1 0.51 1 0.6 0 0 0.49 0.5
- mobile0.51 1 0.05 1 0.51 1 0.6 0 0 0.49 0.5
Leased lines0.51 0 0.51 1 0.51 1 0.6 0 0 0.49 0.5
Internet access services - wire/cable0.51 0 0.35 1 0.51 1 0.6 0 0 0.49 0.4
- fixed wireless0.51 0 0.35 1 0.51 1 0.6 0 0 0.49 0.4
Other - VOIP0.51 0 0.51 1 0.51 1 0.6 0 0 0.49 0.5

72
Table 5 (Continued): Restrictions on Trade in Telecommunications Services
(Index 0-1)
Bru
nei
Cam
bodi
a
Indo
nesi
a
Lao
PD
R
Mal
aysi
a
Mya
nmar
Phi
lippi
nes
Sin
gapo
re
Tha
iland
Vie
tnam
Ave
rage
25 a. Are individual or general/class operating licenses required for the provision of various services? Facilities-based
1 0.083 1 1 0 1 1 0 1 0 0.6
b. Are individual or general/class operating licenses required for the provision of various services? Resale-based
1 0.727 1 1 0 1 1 0.5 0 0 0.6
26 When spectrum licenses are required for the provision of services, are they individual or general/class use licenses.
1 0 1 1 0 1 1 0 1 0 0.6
27
Do any licences grant exclusive rights?
0 1 1 0 0 1 0 0 0 0 0.3
28 Are separate licenses required to establish branches in each state/province?
0 0 0 0 0 0 0 0 0 1 0.1
30 Are foreign-owned suppliers subject to different licensing conditions from domestic suppliers?
0 0 0 0 1 0 0 0 0 0 0.1
31 Once the licenses have been allocated, are there restrictions on firms’ ability to sell or otherwise transfer these licenses?
1 0 1 1 0 1 0 1 1 1 0.7
Does spectrum trading occur?1 1 1 1 1 1 1 0 1 0 0.8
32 How are interconnection agreements among service providers determined?
Between fixed line service providers0.5 0.5 0.5 1 0.5 1 0 0.5 0.5 0.5 0.6
Between mobile and fixed line carriers0.5 0.5 0.5 1 0.5 1 0 0.5 0.5 0.5 0.6
Between mobile carriers0.5 0.5 0.5 1 0.5 1 0 0.5 0.5 0.5 0.6
Between internet service providers0.5 0.5 0.5 1 0.5 1 0 0.5 0 0.5 0.5
34Which of the following interconnection pricing rules apply?
Between fixed line service providers
Reciprocal pricing0 0 0 1 1 1 1 1 1 0 0.6
Unbundling0 1 0 0 0 1 1 1 0 1 0.5
Imputation0 1 0 1 1 1 1 0 1 1 0.7
Between mobile and fixed line carriers
Reciprocal pricing0 0 0 1 1 1 1 1 1 0 0.6
Unbundling0 1 0 0 0 1 1 1 0 1 0.5
Imputation0 1 0 1 1 1 1 0 1 1 0.7
Between mobile carriers
Reciprocal pricing0 0 0 1 1 1 1 1 1 0 0.6
Unbundling0 1 0 0 0 1 1 1 0 1 0.5
Imputation0 1 0 1 1 1 1 0 1 1 0.7
35Other aspects of interconnection
Are reference agreements publicly available? 1 1 0 0 1 1 1 0 0 1 0.6
Are mobile phone carriers allowed to charge for incoming mobile calls?
0 0 1 0 1 1 0 0 0 0 0.3
36 How are end used tariffs determined in your country?
For fixed line calls0.5 0 0 1 0.5 1 1 1 1 0 0.6
For mobile calls0.5 0 0 1 0 1 1 1 1 0 0.6
37Tariff rebalancing
Are fixed line providers allowed to charge a subscriber access charge (eg per month) as well as a charge per call?
0 0 0 0 0 1 1 0 0 0 0.2
Have tariffs been rebalanced, or are there plans to rebalance them?
0 0 0 1 0 1 1 1 1 0 0.5
39 What are the policy instruments used to pursue the universal service objective?
0.5 0 0 0 0.5 0 0.5 0 0.5 0 0.2
D. Regulation
b. Licensing
c. Regulation of network interconnection
d. Regulation of end-user tariffs
e. Universal Service
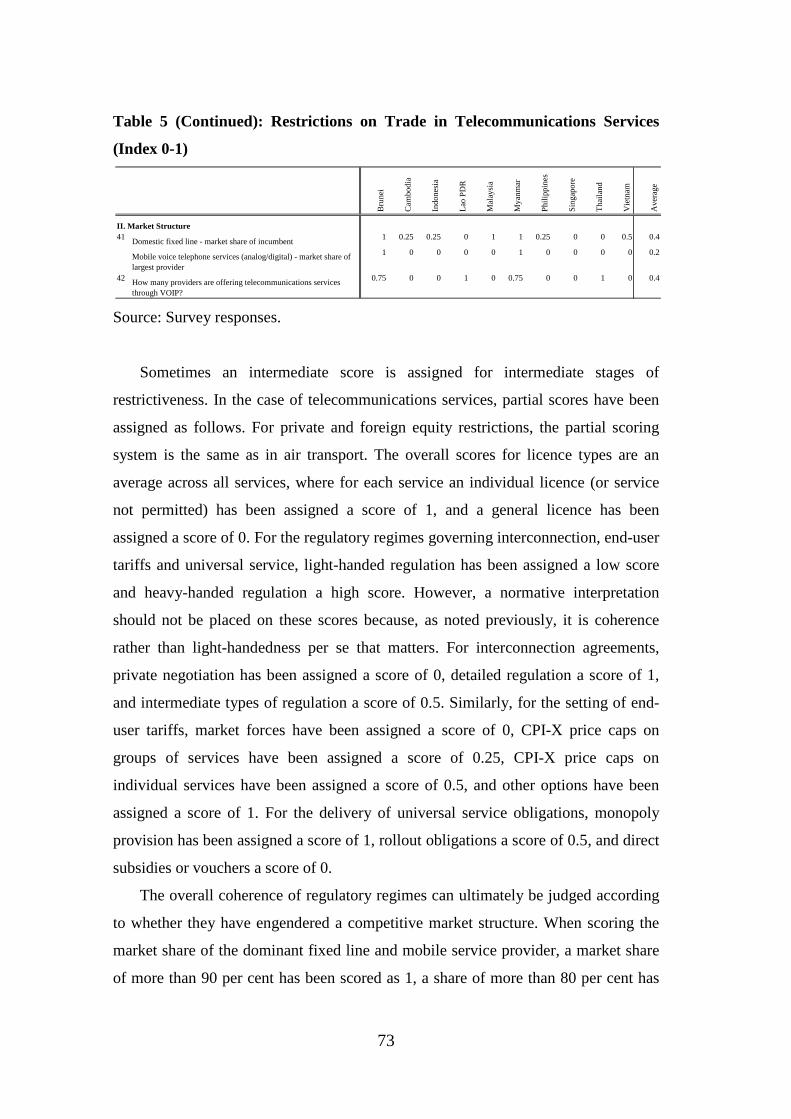
73
Table 5 (Continued): Restrictions on Trade in Telecommunications Services
(Index 0-1)
Source: Survey responses.
Sometimes an intermediate score is assigned for intermediate stages of
restrictiveness. In the case of telecommunications services, partial scores have been
assigned as follows. For private and foreign equity restrictions, the partial scoring
system is the same as in air transport. The overall scores for licence types are an
average across all services, where for each service an individual licence (or service
not permitted) has been assigned a score of 1, and a general licence has been
assigned a score of 0. For the regulatory regimes governing interconnection, end-user
tariffs and universal service, light-handed regulation has been assigned a low score
and heavy-handed regulation a high score. However, a normative interpretation
should not be placed on these scores because, as noted previously, it is coherence
rather than light-handedness per se that matters. For interconnection agreements,
private negotiation has been assigned a score of 0, detailed regulation a score of 1,
and intermediate types of regulation a score of 0.5. Similarly, for the setting of end-
user tariffs, market forces have been assigned a score of 0, CPI-X price caps on
groups of services have been assigned a score of 0.25, CPI-X price caps on
individual services have been assigned a score of 0.5, and other options have been
assigned a score of 1. For the delivery of universal service obligations, monopoly
provision has been assigned a score of 1, rollout obligations a score of 0.5, and direct
subsidies or vouchers a score of 0.
The overall coherence of regulatory regimes can ultimately be judged according
to whether they have engendered a competitive market structure. When scoring the
market share of the dominant fixed line and mobile service provider, a market share
of more than 90 per cent has been scored as 1, a share of more than 80 per cent has
Bru
nei
Cam
bodi
a
Indo
nesi
a
Lao
PD
R
Mal
aysi
a
Mya
nmar
Phi
lippi
nes
Sin
gapo
re
Tha
iland
Vie
tnam
Ave
rage
41 Domestic fixed line - market share of incumbent 1 0.25 0.25 0 1 1 0.25 0 0 0.5 0.4
Mobile voice telephone services (analog/digital) - market share of largest provider
1 0 0 0 0 1 0 0 0 0 0.2
42 How many providers are offering telecommunications services through VOIP?
0.75 0 0 1 0 0.75 0 0 1 0 0.4
II. Market Structure
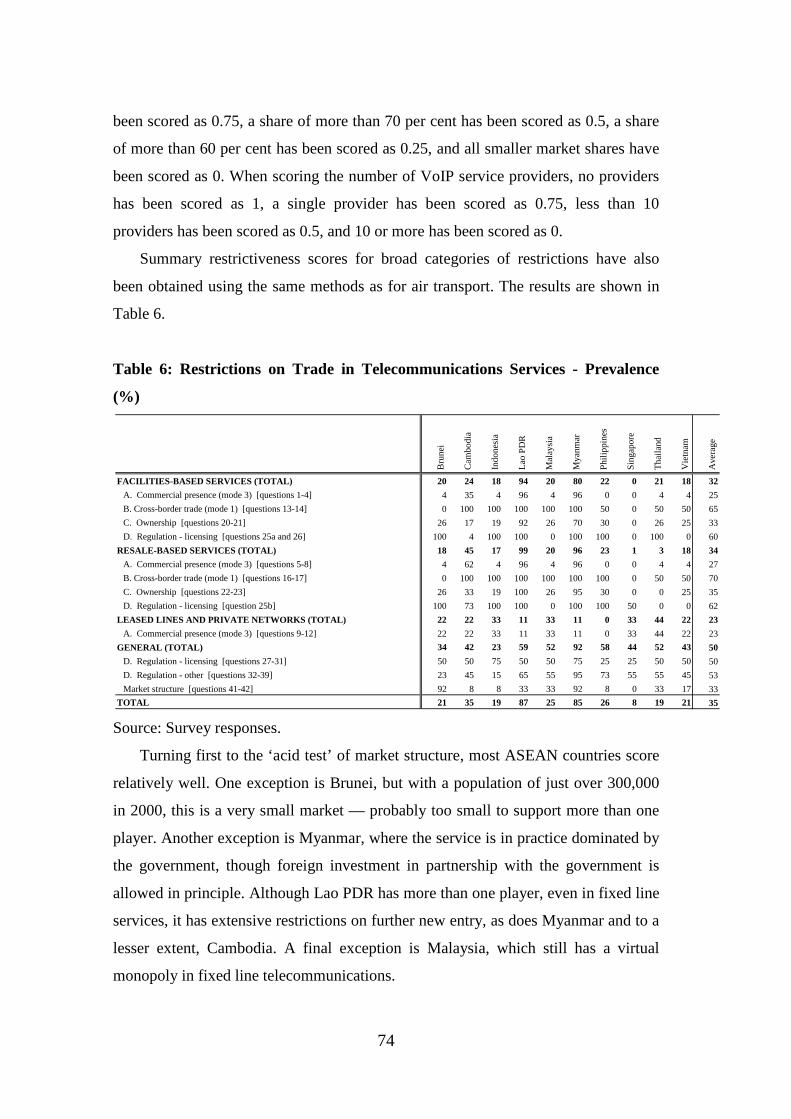
74
been scored as 0.75, a share of more than 70 per cent has been scored as 0.5, a share
of more than 60 per cent has been scored as 0.25, and all smaller market shares have
been scored as 0. When scoring the number of VoIP service providers, no providers
has been scored as 1, a single provider has been scored as 0.75, less than 10
providers has been scored as 0.5, and 10 or more has been scored as 0.
Summary restrictiveness scores for broad categories of restrictions have also
been obtained using the same methods as for air transport. The results are shown in
Table 6.
Table 6: Restrictions on Trade in Telecommunications Services - Prevalence
(%)
Source: Survey responses.
Turning first to the ‘acid test’ of market structure, most ASEAN countries score
relatively well. One exception is Brunei, but with a population of just over 300,000
in 2000, this is a very small market — probably too small to support more than one
player. Another exception is Myanmar, where the service is in practice dominated by
the government, though foreign investment in partnership with the government is
allowed in principle. Although Lao PDR has more than one player, even in fixed line
services, it has extensive restrictions on further new entry, as does Myanmar and to a
lesser extent, Cambodia. A final exception is Malaysia, which still has a virtual
monopoly in fixed line telecommunications.
Bru
nei
Cam
bodi
a
Indo
nesi
a
Lao
PD
R
Mal
aysi
a
Mya
nmar
Phi
lippi
nes
Sin
gapo
re
Tha
iland
Vie
tnam
Ave
rage
FACILITIES-BASED SERVICES (TOTAL) 20 24 18 94 20 80 22 0 21 18 32A. Commercial presence (mode 3) [questions 1-4] 4 35 4 96 4 96 0 0 4 4 25B. Cross-border trade (mode 1) [questions 13-14] 0 100 100 100 100 100 50 0 50 50 65C. Ownership [questions 20-21] 26 17 19 92 26 70 30 0 26 25 33D. Regulation - licensing [questions 25a and 26] 100 4 100 100 0 100 100 0 100 0 60
RESALE-BASED SERVICES (TOTAL) 18 45 17 99 20 96 23 1 3 18 34A. Commercial presence (mode 3) [questions 5-8] 4 62 4 96 4 96 0 0 4 4 27B. Cross-border trade (mode 1) [questions 16-17] 0 100 100 100 100 100 100 0 50 50 70C. Ownership [questions 22-23] 26 33 19 100 26 95 30 0 0 25 35D. Regulation - licensing [question 25b] 100 73 100 100 0 100 100 50 0 0 62
LEASED LINES AND PRIVATE NETWORKS (TOTAL) 22 22 33 11 33 11 0 33 44 22 23A. Commercial presence (mode 3) [questions 9-12] 22 22 33 11 33 11 0 33 44 22 23
GENERAL (TOTAL) 34 42 23 59 52 92 58 44 52 43 50D. Regulation - licensing [questions 27-31] 50 50 75 50 50 75 25 25 50 50 50D. Regulation - other [questions 32-39] 23 45 15 65 55 95 73 55 55 45 53Market structure [questions 41-42] 92 8 8 33 33 92 8 0 33 17 33
TOTAL 21 35 19 87 25 85 26 8 19 21 35

75
Turning next to the other explicit targets of the ASEAN Economic Community
Blueprint, a majority of countries score poorly on restrictions on cross-border (mode
1) trade in telecommunications services. However, as noted earlier, the relevant
restriction to this mode of trade is by now a technical restriction that has very little
real relevance. Similarly, restrictions on the consumption of telecommunications
services abroad (mode 2) are non-existent (other than through restrictions on the
outward movement of consumers themselves), so have not been canvassed in the
questionnaire.
Table 5 shows the situation regarding foreign equity limits on investment in
existing or new telecommunications service providers. Cambodia, Lao PDR and
Myanmar have total bans on foreign investment in new provision of at least some
telecommunications services. The Philippines limits foreign equity to 40 per cent in
all services. Four more countries limit foreign investment in at least some services to
49 per cent, which is less than the 51 per cent target for 2010 prescribed in the
Blueprint. These are Brunei, Indonesia, Malaysia and Thailand. Thus only two
ASEAN countries — Singapore and Vietnam — currently meet the Blueprint’s
foreign equity targets in telecommunications, at least on an MFN basis. This is hard
to understand, given the extent of existing competition in most countries, even in
fixed line services.
As far as regulation is concerned, most countries are relatively even-handed in
their regulation of facilities-based and resale-based services, and most have a
relatively liberal treatment of leased lines and private networks. However, only a
minority of ASEAN members have moved comprehensively to general rather than
individual licensing of telecommunications providers — these are Cambodia,
Malaysia, Singapore and Vietnam. Malaysia is the one ASEAN country that still
applies discriminatory licensing requirements to foreign-invested suppliers.
In terms of general regulation, Indonesia, Brunei, and to a lesser extent
Cambodia and Vietnam apply relatively light-handed regulation to
telecommunications suppliers. However, as noted previously, no normative
interpretation should necessarily be placed on this result. Instead, the very high
market share of the incumbent fixed line service supplier in Malaysia is perhaps most
indicative of a problem with general regulation.

76
5. Implementation of the ASEAN Single Window
5.1. Key features of the regulatory regime for customs clearance
Business surveys routinely identify high money and time costs of customs
clearance procedures as key contributors to an inefficient logistics chain. Recent
business surveys within ASEAN were summarized in Findlay (2009). This summary
noted that border procedures continue to be pervasive and critically affect both goods
and services business across ASEAN. The procedures themselves are numerous and
still need to be reduced or rationalized or streamlined. “The ASEAN Single Window
program illustrates this difficulty, since national Single Windows still need to be
realized in all member countries. The national Single Window program is a priority.”
(Findlay 2009, p. 103)
Blueprints for simplifying and harmonizing customs procedures have been
available for decades. The Kyoto Convention entered into force in 1974, and was
revised in 1999 as the blueprint for modern and efficient customs procedures in the
21st
• transparency and predictability of customs actions;
century. The revised Kyoto Convention entered into force in 2006, and
elaborates several key governing principles, including:
• standardization and simplification of the goods declaration and supporting
documents;
• simplified procedures for authorized persons;
• maximum use of information technology;
• minimum necessary customs control to ensure compliance with regulations;
• use of risk management and audit based controls;
• coordinated interventions with other border agencies; and
• partnership with the trade.
Significant progress has been made in ASEAN over the years, including the
harmonization of tariff nomenclature, customs valuation, establishment of post-audit
clearance system in all member countries, implementation of a green lane for
ASEAN trade, and common customs formalities for transit goods (CIE 2006).

77
In 2005, ASEAN agreed to establish the ASEAN Single Window to further
expedite customs procedures within ASEAN. This was to involve setting up a single
clearance channel for goods for the ASEAN 6 by 2008, and newer members by 2012.
The ASEAN Single Window presupposes the existence of national Single
Windows that can be interconnected. National Single Windows are to allow:
• a single point of entry for submission of data and information;
• re-use of data and information to avoid repeated keying-in of data;
• single synchronous processing of data and information; and
• quick and easy release and clearance of cargo.
The National Single Windows are to coordinate the processing of information
and data across six major areas:
• customs;
• permit issuing agencies/other government agencies;
• banking and insurance agencies;
• transport community;
• trading community; and
• ASEAN/International link.
5.2. Scorecard for customs clearance
The questionnaire covering customs clearance asks about implementation of
National Single Windows, and cooperation to achieve an ASEAN Single Window.
Information about the current state of play is available on the ASEAN Secretariat’s
website (see www.aseansec.org/Fact%20Sheet/AEC/2009-AEC-018.pdf). The
current questionnaire adds value by not only asking about progress towards the
above-stated goals of the National Single Window, but also whether this has
facilitated achieving the broader aims of the revised Kyoto Convention. Key to these
aims is maximising the use of information technology and minimizing the scope for
bureaucratic intervention, not just to speed up customs clearance procedures, but also
to reduce the opportunities for informal payments.
The first section of the questionnaire asks about implementation of National
Single Windows, on either a pilot basis or at all points of entry, and what this has
contributed to achieving the broader goals of the revised Kyoto Convention. It asks

78
about the extent to which information can be submitted electronically, and about the
extent of multiple handling and/or multiple keying that might still take place ‘behind’
the single window. It then asks a series of questions about how clearance and release
procedures might thereby have been streamlined and automated. Specifically it asks
whether there is a time limit for the approval of declarations, whether performance is
measured against target, whether there is a fast-lane procedure for regular importers
with a good track record, and critically, whether duty can be paid via electronic funds
transfer, and whether there is automatic release of goods once duty is paid. These key
steps were identified in the survey by Findlay (2009). Finally, it asks a series of
questions about the risk assessment methods employed. Specifically, it asks whether
there are clearly identified risk assessment criteria for cargo inspection, whether pre-
arrival information is used in risk assessment, whether selection for assessment is
done electronically, based on risk criteria, whether X-ray equipment is used in
examination, and whether manual inspection is subject to time limits. These steps
were also identified in the survey by Findlay (2009)
The next section of the questionnaire asks about transparency and due process.
There is a series of questions about the online availability of information about trade
regulations, and the availability of feedback and appeals mechanisms for importers,
freight forwarders and transport operators. Critically, this section also asks whether
performance is measured ex post. Specifically, it asks whether customs clearance
times are measured according to the World Customs Organization’s (WCO) time-
release methodology, and whether clearance times (however measured) are made
public. As with telecommunications regulation, trade regulation involves a series of
interconnected processes, and overall performance can remain poor if one
component is missing. Therefore, it is critical not just to monitor the implementation
of individual components, but also to measure overall performance, and to make this
publicly available for scrutiny. According to the survey results, only half of ASEAN
members measure clearance times according to WCO methodology, and even fewer
make such data public.
In the final section, the questionnaire asks about a country’s participation in
regional cooperation efforts towards an ASEAN Single Window. This includes not
only participating in pilot schemes, but also working towards streamlining and

79
harmonizing customs marking requirements, and working towards mutual
recognition of conformance assessments.
5.3. Scorecard results for customs clearance
As with the previous services, the qualitative information about customs
clearance procedures has been coded in a zero-one fashion. Contrary to previous
services, a higher score denotes a ‘better’ rather than a ‘worse’ outcome. Thus a
score of 1 has been assigned if a streamlining or improvement measure has been
implemented, and 0 if it has not, so the index is an implementation index rather than
a restriction index. The detailed results are shown in Table 7.
Table 7: Implementation of ASEAN Single Window
Source: Survey responses.
Bru
nei
Cam
bodi
a
Indo
nesi
a
Lao
PD
R
Mal
aysi
a
Mya
nmar
Phi
lippi
nes
Sin
gapo
re
Tha
iland
Vie
tnam
Ave
rage
1 Is there a single point of entry for the submission of all data and information required to move goods across borders?
0.5 0.5 0.5 0.5 0.5 0 1 1 0.5 0.5 0.6
2 How must the data be submitted? 0.5 0.5 0.5 0 0.5 0 1 1 0.5 0.5 0.53 How is the data processed? 1 1 1 1 1 1 1 1 0.2 0.6 0.94 Clearance and release
Is there a time limit for approval of declarations? 1 0 1 1 1 1 1 1 0 1 0.8
Is actual performance measured against target? 1 0 1 1 1 1 1 0 1 0 0.7
Fast-lane procedure for importers with good track record? 1 0 1 1 1 1 1 0 1 0 0.7
Can duty payment be made by electronic funds transfer? 1 0 0 0 1 0 1 1 1 0 0.5
Automatic release of goods once payment received? 1 1 0 0 1 0 1 1 1 0 0.65 Risk assessment
Clearly identified risk assessment criteria for cargo inspection? 0.5 0.5 1 0.5 1 0.5 1 0 1 0.5 0.7Pre-arrival information used in risk assessment? 0.5 0.5 0 0 0.5 0 1 1 1 1 0.6
Selection for examination electronic, based on risk criteria? 0.5 0 1 0 0.5 0 1 0 1 0 0.4
Is X-ray equipment used in examination? 0.5 1 1 0 0.5 1 1 1 1 1 0.8
Is manual inspection subject to time limits? 0.5 0 0.5 0.5 1 1 0 0 1 1 0.6
6 Trade regulationIs trade regulation available online? 1 1 1 1 1 1 1 1 1 1 1.0
Is there provision for online feedback from importers etc? 1 1 1 0 1 0 1 1 1 0 0.7
Is there a telephone hotline for queries about procedures? 1 1 1 0 1 0 1 1 1 0 0.7Formal system of consultation between Customs and industry participants? 1 1 1 1 1 0 1 1 1 0 0.8
Is there a system of appeals in Customs matters? 1 0 1 0 1 1 1 0 1 1 0.77 Performance
Clearance times measured according to WCO methodology? 0 0 1 0 1 0 1 0 1 1 0.5Is the data made public? 0 0 1 1 0 1 0 0 0 0 0.3
8Is your country participating in the ASEAN Single Window?
0.5 0.5 0.5 0.5 0.5 0 1 1 0.5 0.5 0.6
9 Is your country working towards streamlining and harmonising Customs marking requirements within ASEAN?
Developing preferred approach at national level? 1 1 1 1 1 1 1 1 1 1 1.0
Participating in regional discussions? 1 1 1 1 1 1 1 1 1 1 1.010 Is your country working towards mutual recognition of conformance
assessments within ASEAN? Developing preferred approach at national level? 1 1 1 1 1 1 1 1 1 1 1.0
Participating in regional discussions? 1 1 1 1 1 1 1 1 1 1 1.0
(0=no implementation, 1=full implementation)
B. Transparency and due process
II. Regional Cooperation
I. National Policy A. National Single Window

80
Sometimes an intermediate score is assigned for intermediate stages of
implementation. In the case of customs clearance, a partial score of 0.5 has been
assigned if a country has participated in a particular national or regional
improvement activity on a pilot basis, rather than at all points of entry. A score of 0.5
has been assigned if data submission is only partially electronic. Finally, a score of
0.5 has been assigned if a particular risk assessment measure is undertaken only
sometimes, rather than always.
Summary restrictiveness scores for broad categories of customs clearance
improvement measures have been obtained using the same methods as for air
transport. The results are shown in Table 8.
Table 8: Implementation of ASEAN Single Window - Prevalence (%)
Source: Survey responses.
The two tables indicate, not surprisingly, that there is little apparent variation in
countries’ participation in formal ASEAN efforts to improve customs procedures.
All countries are participating in regional cooperation efforts to simplify and
harmonize customs documentation and to introduce mutual recognition of
conformance assessments. Most countries are participating in efforts to introduce
National Single Windows and integrate these into an ASEAN Single Window (the
exception is Myanmar).
Differences arise in the extent to which this participation is translating into better
customs procedures on the ground. There is little variation in the responses to the
question about the number of times data is handled or keyed in ‘behind’ the window,
indicating that this question was too simplistic to capture some of the issues involved.
More revealing is the fact that only two countries have fully electronic filing of
customs documentation — Singapore and the Philippines. Similarly, there is
Bru
nei
Cam
bodi
a
Indo
nesi
a
Lao
PD
R
Mal
aysi
a
Mya
nmar
Phi
lippi
nes
Sin
gapo
re
Tha
iland
Vie
tnam
Ave
rage
I. National Policy 73 45 78 43 83 48 90 60 81 46 64A. National Single Window [questions 1-5] 73 38 65 42 81 50 92 62 78 47 63B. Transparency and due process [questions 6-7] 71 57 100 43 86 43 86 57 86 43 67II. Regional Cooperation [questions 8-10] 90 90 90 90 90 80 100 100 90 90 91TOTAL 76 54 80 52 84 54 92 68 83 54 70

81
considerable variation in the extent to which countries have set targets and used
information technology to automate decision-making in their clearance and release
procedures, although this variation partly reflects levels of development. Brunei,
Malaysia and the Philippines do the best on this score. Singapore apparently does
less well, though this may simply reflect the reticence of Singapore customs
authorities to provide full information. Cambodia and Vietnam have made the least
progress on setting targets and automating decision-making.
There is also considerable variation in the extent to which risk assessment is
used in customs clearance. The Philippines and Thailand do well. Singapore’s
responses reflect the unwillingness of the Singapore customs authorities to reveal the
existence and nature of any risk assessment criteria.
Most ASEAN countries are relatively transparent about their trade regulation.
But very few are fully transparent about ex post performance, as measured by
customs clearance times. Apparently only Indonesia measures these according to
WCO methodology and makes the results public. Lao PDR and Myanmar are
reported as making information public, though they do not use WCO methodology.
By contrast, Malaysia, the Philippines, Thailand and Vietnam measure clearance
times, but do not make the results public. As noted above, the publication of
clearance times would provide the acid test as to whether ASEAN cooperation
efforts were achieving their ultimate aims.
6. Summary and Conclusions
The key purpose of this paper has been to map the existing policy space in three
key services sectors — air transport, maritime services (both shipping and port
services), and telecommunications services — as well as to provide evidence on
whether the implementation of the ASEAN Single Window is helping to achieve the
broader objectives of the revised Kyoto Convention on customs procedures. The air
transport sector is one of the priority sectors to be liberalized by 2010, while
maritime and telecommunications services and customs clearance are key
components of the logistics chain.

82
Air transport is regulated by bilateral and plurilateral air services agreements
that have been negotiated largely outside of the normal disciplines of services trade
agreements, and are typically far less liberal than such agreements, particularly in
their ‘rules of origin’. The ownership provisions of air services agreements can
significantly limit the ability of foreign service providers to offer international or
domestic passenger and freight services, either cross-border or by commercial
presence. The restrictions embodied in air services agreements have been shown to
be costly.
According to the survey responses, only one country — Singapore — explicitly
meets the Blueprint target of allowing at least 70 per cent foreign ownership in
domestically established air services companies by 2010. But if Singapore were
actually to achieve 70 per cent foreign ownership of its international airline, it could
well be prevented from supplying international air services to other ASEAN
countries, even if they had ratified the ASEAN Multilateral Agreements on Air
Services. This is because that multilateral agreement allows them to retain
withholding clauses in their air services agreements that would require Singapore to
have ‘substantial ownership and effective control’ of Singapore Airlines by
Singaporean entities in order to provide services.
Therefore, effective liberalization of mode 3 trade in air services not only
requires the reform of investment laws, it also requires the reform of withholding
clauses in air services agreements so that at minimum, they allow substantial
ownership by an ASEAN community of interests. Currently, the secrecy surrounding
the provisions of air services agreements makes it very difficult for outside observers
to monitor such progress. ASEAN members should be working towards the further
reform of their air services agreements, and should be demanding much greater
transparency of their provisions.
As in many other services, restrictions on the movement of people remain one of
the most prevalent of all types of trade restrictions. Looking beyond trade barriers
(strictly defined) to look at domestic regulatory regimes, most ASEAN countries
allocate flight and gate slots in ways that could potentially be anti-competitive. This
is becoming an increasingly important barrier to effective competition.

83
In maritime services, most countries of the region have taken a relatively liberal
approach to cargo sharing arrangements, a restriction on mode 1 trade. However,
only three ASEAN countries — Cambodia, Indonesia and Thailand — have stated
that they grant exemptions from cabotage restrictions, and Indonesia appears to be in
the process of phasing the exemptions out. Nevertheless, cabotage restrictions have
been shown to be costly, particularly for developing countries, and ASEAN members
should be looking to expand the scope of exemptions on such restrictions.
According to the survey responses, no ASEAN economy meets the Blueprint
target of allowing at least 51 per cent foreign ownership by 2010 in all maritime
services. However, some countries meet the target for at least some services,
including Cambodia, Singapore, Vietnam and (in principle) Myanmar. Some
countries have moved to a relatively liberal landlord port model for at least some
ports, including Cambodia, Malaysia, the Philippines and Thailand. Regulatory
restrictions on entry (other than equity limits) are most prevalent in port
superstructure services and pilotage, towing and tying.
In telecommunications, the ‘acid test’ of whether regulatory structures have
promoted contestability is whether they have diluted the market shares of incumbent
providers. Here most ASEAN countries score relatively well, except for Brunei
(which has a very small market), Myanmar (where the service is in practice
dominated by the government) and Malaysia (which still has a virtual monopoly in
fixed line telecommunications).
Only two ASEAN countries — Singapore and Vietnam — currently meet the
Blueprint’s foreign equity targets in all telecommunications services, at least on an
MFN basis. The remaining restrictions on foreign equity limits are hard to
understand, given the extent of existing competition in most countries, even in fixed
line services, and should be phased out.
As far as regulation is concerned, most countries are relatively even-handed in
their regulation of facilities-based and resale-based services. However, only a
minority of ASEAN members have moved comprehensively to general rather than
individual licensing of telecommunications, a move that can promote convergence
and ensure the technological neutrality of regulation. Some countries apply relatively
light-handed regulation to telecommunications suppliers, although no normative
84
interpretation should necessarily be placed on this result, since regulatory coherence
is more important that light- or heavy-handedness per se. The persistence of very
high market shares of incumbent service suppliers is perhaps most indicative of
remaining problems with general regulation.
There is little apparent variation in countries’ participation in formal ASEAN
efforts to improve customs clearance procedures. Differences arise in the extent to
which this participation is translating into better customs procedures on the ground.
Only two countries report having fully electronic filing of customs documentation.
Similarly, there is considerable variation in the extent to which countries have set
targets and used information technology to automate decision-making in their
clearance and release procedures, although this variation partly reflects levels of
development. There is also considerable variation in the extent to which risk
assessment is used in customs clearance.
Most ASEAN countries are relatively transparent about their trade regulation.
But very few are fully transparent about ex post performance, as measured by
customs clearance times. The publication of clearance times would provide the acid
test as to whether ASEAN cooperation efforts were achieving their ultimate aims,
and should be a priority for ASEAN members.
85
References Achard, Pascal (2009) “The Regulation of International Air Cargo Services.” Mimeo.
Paris: Sciences Po.
CIE (Centre for International Economics) (2006) “Harmonization and Integration of
Customs Cargo Processing Policies and Practices in the ASEAN Region.”
REPSF Project No. 04/002, Final Report. Singapore: ASEAN Secretariat.
Clark, X., D. Dollar and A. Micco (2004) “Port Efficiency, Maritime Transport Costs,
and Bilateral Trade.” Journal of Development Economics 75, 417–50.
Dee, P. (2006) “The Economy-wide Effects of Moroccan Services Sector Reforms.”
Paper prepared for the World Bank. Canberra: The Australian National
University.
Dee, P. (2008) “Benchmarking and Assessing Indonesia’s Regulation of Services.”
Paper prepared for the World Bank. Canberra: The Australian National
University.
Dee, P. and C. Findlay (2008) “Trade in Infrastructure Services: A Conceptual
Framework.” In A Handbook of International Trade in Services, eds A. Mattoo,
R. Stern and G. Zanini. Oxford: Oxford University Press.
Donovan, Arthur (undated) “Intermodal Transportation in Historical Perspective.”
Mimeo. Starkville MS: National Centre for Intermodal Transportation,
Mississippi State University.
Doove, S., O. Gabbitas, D. Nguyen-Hong and J. Owen, J. (2001) “Price Effects of
Regulation: International Air Passenger Transport, Telecommunications and
Electricity Supply.” Productivity Commission Staff Research Paper. Canberra:
Ausinfo.
Economides, N., G. Lopomo and G. Woroch (1996) “Regulatory Pricing Rules to
Neutralize Network Dominance.” Industrial and Corporate Change 5, no. 4:
1013–28.
Findlay, C. (2009) “Trade Facilitation.” In Deepening East Asian Economic
Integration, eds J. Corbett and S. Umezaki. Jakarta: ERIA.
Gonenc, R., and G. Nicoletti (2000) “Regulation, Market Structure and Performance
in Air Passenger Transport.” Working Paper No. 254, ECO/WKP(2000)27,
86
Economics Department. Paris: Organization for Economic Cooperation and
Development.
Grosso, Massimo Geloso (2008) “Liberalising Air Cargo Services in APEC. ” GEM
Working Paper. Paris: Sciences Po.
ITU (International Telecommunications Union) (2000) “Fixed-Mobile
Interconnection Workshop.” Document WFMI/04, ITU New Initiatives Program
20–22 September 2000. Geneva: International Telecommunications Union.
ITU (2001) “Regulatory Implications of Broadband Workshop.” Document 3, ITU
New Initiatives Program 2–4 May 2001. Geneva: International
Telecommunications Union.
ITU (2008) Trends on Telecommunication Reform 2008. Geneva: International
Telecommunications Union.
Juhel, Marc (1999) “Globalization, Privatization and Restructuring of Ports.” Mimeo.
Washington DC: World Bank.
Kang, Jong-Soon (2000) “Price Impact of Restrictions on Maritime Transport
Services.” In Impediments to Trade in Services, Measurement and Policy
Implications, eds C. Findlay and T. Warren. London and New York: Routledge.
Mattoo, A., R. Rathindran and A. Subramanian (2001) “Measuring Services Trade
Liberalization and its Impact on Economic Growth: An Illustration.” World
Bank Working Paper No. 2655. Washington DC: World Bank.
McGuire, G., M. Schuele and T. Smith (2000) “Restrictiveness of International
Trade in Maritime Services.” In Impediments to Trade in Services, Measurement
and Policy Implications, eds C. Findlay and T. Warren. London and New York:
Routledge.
OECD (2008) Broadband Growth and Policies in OECD Countries: Ministerial
Background Report, Paris: OECD.
PDP Australia Pty Ltd and Meyrick and Associates (2005) “Promoting Efficient and
Competitive Intra-ASEAN Shipping Services.” REPSF Project No. 04/001, Final
Report. Singapore: ASEAN Secretariat.
Piermartini, Roberta and Linda Rousová (2008) “Liberalization of Air Transport
Services and Passenger Traffic.” Staff Working Paper ERSD-2008-06,
Economic Research and Statistics Division. Geneva: World Trade Organization.

87
Warren, T. 2000 “The Impact on Output of Impediments to Trade and Investment in
Telecommunications Services.” In Impediments to Trade in Services,
Measurement and Policy Implications, eds C. Findlay and T. Warren. London
and New York: Routledge.
WTO (World Trade Organization) (2006) “Second Review of the Air Transport
Annex: Developments in the Air Transport Sector (Part Two), Quantitative Air
Services Agreements Review (QUASAR).” Volumes I and II, Note by the
Secretariat, S/C/W/270/Add.1. Geneva: World Trade Organization.

Chapter2: Appendix1- Questionnaire form, air transportation.
88
ERIA TRADE IN SERVICES SECTORAL QUESTIONNAIRE – AIR TRANSPORT SERVICES
COVERAGE (CPC Codes) 10.C. Air Transport Services a. Passenger transportation 731 b. Freight transportation 732 c. Rental of aircraft with crew 734 d. Maintenance and repair of aircraft 8868** e. Supporting services for air transport 746 10.H. Services Auxiliary to all Modes of Transport a. Cargo-handling services 741 b. Storage and warehouse services 742 c. Freight transport agency services 748 d. Other 749 Notes: ** The service specified constitutes only a part of the total range of activities covered by the CPC item number. INTRODUCTION The questionnaire covers the conditions of competition in the sector, notably policy restrictions on entry; restrictions on ownership, private and foreign; and regulation, including air services agreements and regulations governing the allocation of landing slots. Note (1)
: Please give information for the current year only. Please record actual practice.
Note (2)
: Whenever a question is not applicable, (eg because the particular activity or institution is not allowed), please indicate using ‘NA’, rather than leaving the cell blank. Please also explain why the question is not applicable.
Note (3)
: Where reporting monetary values, please note currency.
Note (4)
: If insufficient space is provided, please attach additional information on separate sheets.
SUGGESTED INFORMATION SOURCES Government department in charge of regulating domestic and/or international airline services and/or airports. Independent national or regional regulatory body overseeing these activities (if different from the above institution) A domestically-owned airline company (if necessary) A foreign-invested airline company (if necessary) A domestically-owned or foreign-invested airport management company (if necessary)

Chapter2: Appendix1- Questionnaire form, air transportation.
89
A. Commercial presence (mode 3) - restrictions on entry 1. Are there policy restrictions to new entry (refer only to operators wanting to establish commercially)? Service
Entry by any Firm
If yes, total number of firms allowed
Entry by firms with foreign participation1
If yes, number of firms with foreign participation allowed
International air passenger transport (scheduled services)2
No Yes
No Yes
International air passenger transport (non-scheduled charter services)
No Yes No Yes
International air freight transport2,3
No Yes
No Yes
Domestic air transport (scheduled services)
No Yes No Yes
Domestic air transport (non-scheduled charter services)
No Yes No Yes
Domestic air freight transport No Yes 3 No Yes Provision of fuel No Yes No Yes Luggage and freight loading and unloading
No Yes No Yes
Aircraft repair and maintenance No Yes No Yes Selling and marketing of air transport services
No Yes No Yes
Computer reservation system No Yes No Yes 2. If entry is restricted, what are the reasons provided by the government? Use the definitions below to fill in the table: 1—To give protected operators time to prepare for competition. 2—To increase government revenue from privatization or license fees. 3—Exclusive rights believed necessary to attract (strategic) investment. 4—It is believed that market can sustain only a limited number of operators. 5—Strategic activity reserved to the state. Service
Reasons 1 2 3 4 5 Other (describe in brief)
International air passenger transport (scheduled services)
International air passenger transport (non-scheduled charter services)
International air freight transport
Domestic air transport (scheduled services)
Domestic air transport (non-scheduled charter services)
Domestic air freight transport Provision of fuel
1 This category also includes branches and subsidiaries of foreign suppliers. 2 Include designation among restrictions. 3 All-cargo carriers, express delivery companies.

Chapter2: Appendix1- Questionnaire form, air transportation.
90
Luggage and freight loading and unloading
Aircraft repair and maintenance Selling and marketing of air transport services
Computer reservation system B. Restrictions on cross-border trade (mode 1) 3. Are there restrictions on cross-border supply by foreign service providers in non-scheduled (charter) air transport market?
Entry by foreign firm If yes, total number of foreign providers allowed
If yes, reason for restriction4
International air passenger transport (non-scheduled charter services)
No Yes
Domestic air transport (non-scheduled charter services)
No Yes
4. Bilateral Air Service Agreements (ASAs). If there is not enough space, please attach the answer separately.
Type of bilateral ASAs Number of signed, but not operational, bilateral ASAs
Number of operational bilateral ASAs
Predetermined (TP)5
Bermuda (B)6
“Point to Point” Open Skies (POS)7
“Multiple Point” Open Skies (MOS)8
Other (please state)
4 Use reason codes in question 2. 5 each country designates one single company to operate on the bilateral route; limited number of points/routes operated by designated airlines as listed in the bilateral’s annex; capacity and frequency to be agreed ex ante; few 5th freedom granted 6 each country designates one or several airlines on each route; limited number of points/routes operated by designated airlines as listed in the bilateral’s annex; there is no ex ante capacity control on each route, capacity offered is often negotiated via commercial agreements between airlines; several 5th freedoms may be granted, but total capacity must be proportional to the needs of the main bilateral route 7 multiple designation of airlines; free access to designated routes, between specific points, either departure or arrival points may be left open and unrestricted; no frequency or capacity control; extensive 5th freedom rights are granted 8 multiple designation of airlines; airlines can fly on any route between two states; no frequency or capacity control; unrestricted 5th freedom
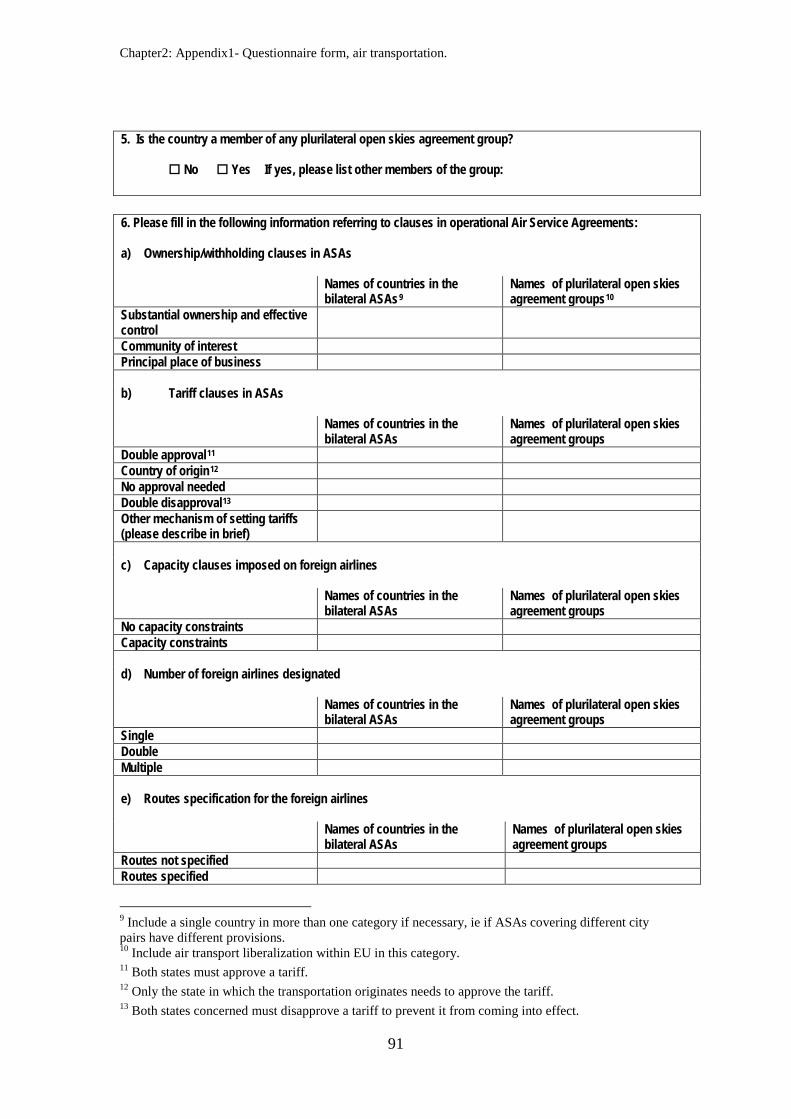
Chapter2: Appendix1- Questionnaire form, air transportation.
91
5. Is the country a member of any plurilateral open skies agreement group? No Yes If yes, please list other members of the group: 6. Please fill in the following information referring to clauses in operational Air Service Agreements: a) Ownership/withholding clauses in ASAs Names of countries in the
bilateral ASAs9Names of plurilateral open skies agreement groups 10
Substantial ownership and effective control
Community of interest Principal place of business b) Tariff clauses in ASAs
Names of countries in the bilateral ASAs
Names of plurilateral open skies agreement groups
Double approval11 Country of origin12 No approval needed Double disapproval13 Other mechanism of setting tariffs (please describe in brief)
c) Capacity clauses imposed on foreign airlines Names of countries in the
bilateral ASAs Names of plurilateral open skies agreement groups
No capacity constraints Capacity constraints d) Number of foreign airlines designated Names of countries in the
bilateral ASAs Names of plurilateral open skies agreement groups
Single Double Multiple e) Routes specification for the foreign airlines Names of countries in the
bilateral ASAs Names of plurilateral open skies agreement groups
Routes not specified Routes specified
9 Include a single country in more than one category if necessary, ie if ASAs covering different city pairs have different provisions. 10 Include air transport liberalization within EU in this category. 11 Both states must approve a tariff. 12 Only the state in which the transportation originates needs to approve the tariff. 13 Both states concerned must disapprove a tariff to prevent it from coming into effect.

Chapter2: Appendix1- Questionnaire form, air transportation.
92
f) Frequency of flights for the foreign airlines Names of countries in the
bilateral ASAs Names of plurilateral open skies agreement groups
Frequency not limited Frequency limited g) Freedoms of the air granted to foreign airlines for passenger traffic
Names of countries in the bilateral ASAs Unrestricted freedom Restricted freedom (eg only to
capital cities – please state) Third freedoms14
Fourth freedoms15
Fifth freedom16
Sixth freedom17
Seventh freedom18
Cabotage19
h) Freedoms of the air granted to foreign airlines for freight traffic (where different from above)
Names of countries in the bilateral ASAs Unrestricted freedom Restricted freedom (please state)
Third freedoms
Fourth freedoms
Fifth freedom
Sixth freedom
Seventh freedom
Cabotage
14 The right of an airline of one country to carry traffic (passenger, cargo, mail) from its country to another country. 15 The right of an airline of one country to carry traffic (passenger, cargo, mail) from another country to its own country. 16 The right of an airline of one country to carry traffic between two other countries providing the flight originates and terminates in its own country. 17 The right of an airline of one country to carry traffic between two other countries via its own country. 18 The right of an airline of one country to carry traffic between two other countries without the flight originating or terminating in its own country. 19 The right of an airline of one country to carry domestic traffic between two points within the territory of another country.

Chapter2: Appendix1- Questionnaire form, air transportation.
93
C. Restrictions on the movement of intra-corporate transferees of foreign-invested companies (mode 4) 7. Are there residency or nationality requirements or quotas for any of the following categories of personnel employed by locally established foreign airline transport services companies? Minimum number/percentage of nationals/residents
(please specify) Members of the board of directors Executives Managers Skilled workers Unskilled workers Other staff (specify):
8. Identify the categories of intra-corporate transferees whose entry and stay is subject to labour market tests? Members of the board of directors Executives Managers Skilled workers Unskilled workers Other staff (specify):
D. Ownership 9. Is private ownership in the provision of services through commercial establishment allowed? Services
Existing operators
Maximum private equity permitted (%)
New entrants
Maximum private equity permitted (%)
International air passenger transport (scheduled services)
No Yes No Yes
International air passenger transport (non-scheduled charter services)
No Yes No Yes
International air freight transport No Yes No Yes Domestic air transport (scheduled services)
No Yes No Yes
Domestic air transport (non-scheduled charter services)
Domestic air freight transport Provision of fuel No Yes No Yes Luggage and freight loading and unloading
No Yes No Yes
Aircraft repair and maintenance No Yes No Yes Selling and marketing of air transport services
No Yes No Yes
Computer reservation system No Yes No Yes
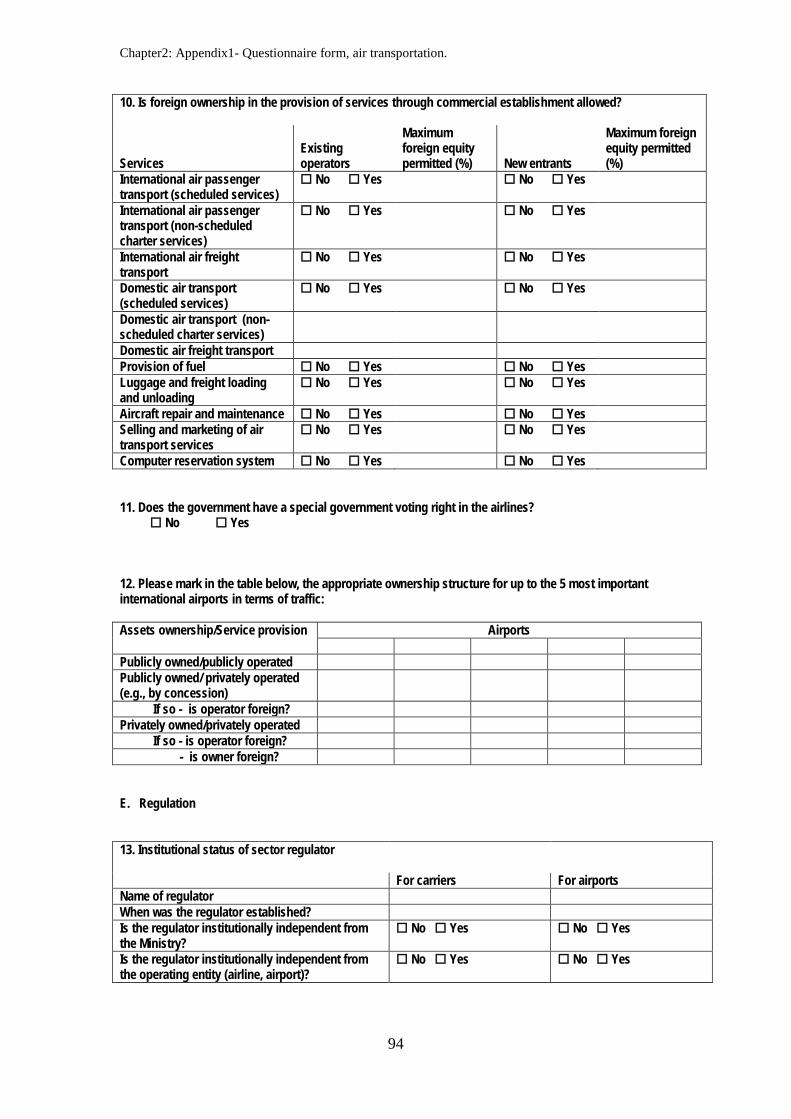
Chapter2: Appendix1- Questionnaire form, air transportation.
94
10. Is foreign ownership in the provision of services through commercial establishment allowed? Services
Existing operators
Maximum foreign equity permitted (%)
New entrants
Maximum foreign equity permitted (%)
International air passenger transport (scheduled services)
No Yes No Yes
International air passenger transport (non-scheduled charter services)
No Yes No Yes
International air freight transport
No Yes No Yes
Domestic air transport (scheduled services)
No Yes No Yes
Domestic air transport (non-scheduled charter services)
Domestic air freight transport Provision of fuel No Yes No Yes Luggage and freight loading and unloading
No Yes No Yes
Aircraft repair and maintenance No Yes No Yes Selling and marketing of air transport services
No Yes No Yes
Computer reservation system No Yes No Yes 11. Does the government have a special government voting right in the airlines? No Yes 12. Please mark in the table below, the appropriate ownership structure for up to the 5 most important international airports in terms of traffic: Assets ownership/Service provision Airports
Publicly owned/publicly operated Publicly owned/ privately operated (e.g., by concession)
If so - is operator foreign? Privately owned/privately operated If so - is operator foreign?
- is owner foreign? E. Regulation 13. Institutional status of sector regulator
For carriers For airports Name of regulator When was the regulator established? Is the regulator institutionally independent from the Ministry?
No Yes No Yes
Is the regulator institutionally independent from the operating entity (airline, airport)?
No Yes No Yes

Chapter2: Appendix1- Questionnaire form, air transportation.
95
14. How are flight slots allocated in airports? By grandfathering rights By slot auction By a combination of grandfathering rights and slot auction By authorities discretion By flag carrier discretion By airport discretion By IATA guidelines20 Other:_______________________________ 15. How are gate slots allocated in airports? By grandfathering rights By slot auction By a combination of grandfathering rights and slot auction By authorities discretion By flag carrier discretion By airport discretion By IATA guidelines Other:_______________________________ 16. Carrier alliances a) Are alliances and other carrier agreements allowed? No Yes b) Are carrier agreements exempted from competition law? No Yes c) Is codesharing allowed? No Yes 17. Price regulation a) Does the government regulate airfares? On domestic routes No Yes On international routes No Yes b) If yes to a), is fare discounting allowed? On domestic routes No Yes On international routes No Yes
20 The IATA regime which has no legal status or enforcement mechanisms, is essentially based on the criteria of past performance, together with some simple rules intended to create openings for new entrants and to ensure that slots are not sterilized and left unused by companies (the ‘use’ or ‘lose’ principle).

Chapter2: Appendix1- Questionnaire form, air transportation.
96
18. What licence conditions must new domestic entrants fulfill? Service
Payment of license fee (indicate amount in local currency)
Other (describe in brief)
International air passenger transport (scheduled services)
International air passenger transport (non-scheduled charter services)
International air freight transport Domestic air transport (scheduled services)
Domestic air transport (non-scheduled charter services)
Domestic air freight transport Provision of fuel Luggage and freight loading and unloading
Aircraft repair and maintenance Selling and marketing of air transport services
Computer reservation system 19. Do the licence conditions for foreign-invested providers who establish locally differ from those above (tick whichever applies)?
Foreign providers not allowed
Conditions same
Conditions differ
Describe difference
International air passenger transport (scheduled services)
International air passenger transport (non-scheduled charter services)
International air freight transport
Domestic air transport (scheduled services)
Domestic air transport (non-scheduled charter services)
Domestic air freight transport Provision of fuel Luggage and freight loading and unloading
Aircraft repair and maintenance Selling and marketing of air transport services
Computer reservation system 20. Does the government subsidize domestic airlines? No Yes If yes, please indicate the airlines.

Chapter2: Appendix1- Questionnaire form, air transportation.
97
21. Has the government covered operational losses of airlines in the past ten years? No Yes If yes, please indicate the amount in each of the last ten years. 22. Does the government oblige large national airlines to provide universal service? No Yes How does the government define universal service (or universal access)? 23. Please provide separately the texts of all bilateral and plurilateral air service agreements signed since 2002. If you have any queries about this questionnaire, please contact: Dr Philippa Dee Crawford School of Economics and Government Australian National University Ph: 61-2-6125 8598 Fax: 61-2-6125-0767 Email: [email protected]

Chapter2: Appendix2- Questionnaire form, Maritime services
98
ERIA TRADE IN SERVICES SECTORAL QUESTIONNAIRE – MARITIME SERVICES - FINAL
The questionnaire covers both maritime shipping and onshore maritime services (eg cargo handling, other port services). COVERAGE (CPC Codes) 10.A. Maritime Transport Services
a. Passenger transportation 7211 b. Freight transportation 7212 c. Rental of vessels with crew 7213 d. Maintenance and repair of vessels 8868** e. Pushing and towing services 7214 f. Supporting services for maritime transport 745**
10.B Internal Waterways Transport a. Passenger transportation 7221 b. Freight transportation 7222 c. Rental of vessels with crew 7223 d. Maintenance and repair of vessels 8868** e. Pushing and towing services 7224 f. Supporting services for internal waterway transport 745** 10.H. Services Auxiliary to all Modes of Transport a. Cargo-handling services 741 b. Storage and warehouse services 742 c. Freight transport agency services 748 d. Other 749 Notes: ** The service specified constitutes only a part of the total range of activities covered by the CPC item number. Port services require the construction, ownership and maintenance of port infrastructure and superstructure. In some countries, ownership and service provision (eg cargo handling) are vested in the same public entity. In other countries, there is private participation in the ownership and/or operation of port superstructure and perhaps infrastructure. Where there is private participation in its operation but not ownership, private firms typically rent port assets through concessions and/or licences. In this questionnaire, the construction/ownership of port superstructure/infrastructure (terminals, cranes) is treated as an additional activity, potentially distinct from its operation. INTRODUCTION The questionnaire covers the conditions of competition in the sector, notably policy restrictions on entry; restrictions on ownership, private and foreign; and regulation, including regulations governing shipping conferences and conditions required to carry the national flag. Note (1)
: Please give information for the current year only. Please record actual practice.
Note (2)
: Whenever a question is not applicable, (eg because the particular activity or institution is not allowed), please indicate using ‘NA’, rather than leaving the cell blank. Please also explain why the question is not applicable.
Note (3)
: Where reporting monetary values, please note currency.
Note (4)
: If insufficient space is provided, please attach additional information on separate sheets.

Chapter2: Appendix2- Questionnaire form, Maritime services
99
SUGGESTED INFORMATION SOURCES Government department in charge of regulating maritime shipping and/or port services Independent national or regional regulatory body overseeing maritime shipping and/or port services (if different from the above institution) A domestically-owned shipping company (if necessary) A foreign-invested shipping company (if necessary) A domestically-owned or foreign-invested onshore maritime service company (if necessary)

Chapter2: Appendix2- Questionnaire form, Maritime services
100
A. Commercial presence (mode 3) - restrictions on entry 1. Are there policy restrictions to new entry (refer only to commercially-established operators)? Service
Entry by any firm
If yes, total number of firms allowed
Entry by firms with foreign participation1
If yes, number of firms with foreign participation allowed
International shipping No Yes No Yes Cabotage2 No Yes No Yes Internal waterways No Yes No Yes Port superstructure No Yes No Yes Cargo handling services No Yes No Yes Storage and warehousing No Yes No Yes Freight forwarding No Yes No Yes Pilotage, towing and tying No Yes No Yes Maintenance and repair of vessels
No Yes No Yes
2. If entry is restricted, what are the reasons provided by the government? Use the definitions below to fill in the table: 1—To give the incumbent(s) time to prepare for competition. 2—To increase government revenue from privatization or license fees 3—Exclusive rights believed necessary to attract (strategic) investment. If so, please specify how many and how long exclusive rights are provided.
Reasons 1 2 3 Other (describe in brief)
International shipping Cabotage Internal waterways Port superstructure Cargo handling Storage and warehousing Freight forwarding Pilotage, towing and tying Maintenance and repair 3. Are foreign maritime companies prohibited from establishing in a joint venture with local firms? Are they required to establish in a JV? Are there restrictions on JVs (eg equity limits) JV prohibited? JV required? Restrictions on JVs International shipping No Yes No Yes Cabotage No Yes No Yes Internal waterways No Yes No Yes Port superstructure No Yes No Yes Cargo handling No Yes No Yes Storage and warehousing No Yes No Yes Freight forwarding No Yes No Yes Pilotage, towing and tying No Yes No Yes Maintenance and repair No Yes No Yes
1 This category also includes branches and subsidiaries of foreign suppliers. 2 Trade transit of a vessel along the coast (coastal trading), from one port to another within the territorial limits of a single nation.
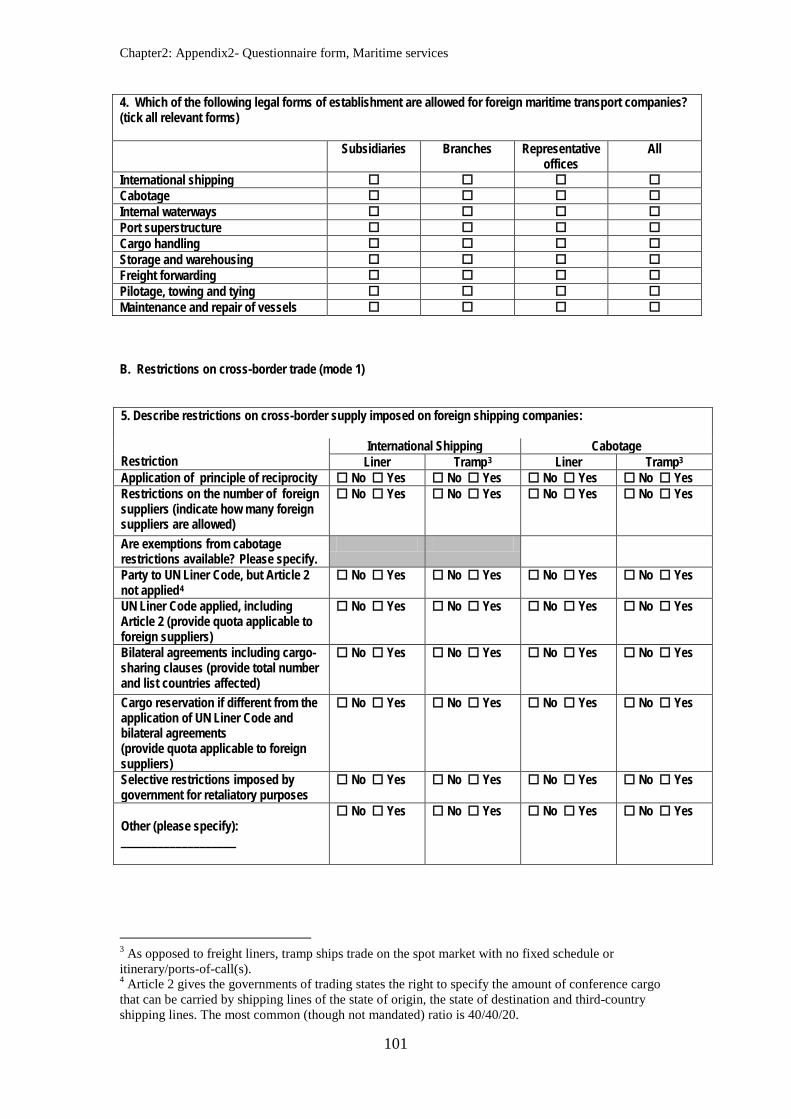
Chapter2: Appendix2- Questionnaire form, Maritime services
101
4. Which of the following legal forms of establishment are allowed for foreign maritime transport companies? (tick all relevant forms) Subsidiaries Branches Representative
offices All
International shipping Cabotage Internal waterways Port superstructure Cargo handling Storage and warehousing Freight forwarding Pilotage, towing and tying Maintenance and repair of vessels B. Restrictions on cross-border trade (mode 1) 5. Describe restrictions on cross-border supply imposed on foreign shipping companies: Restriction
International Shipping Cabotage Liner Tramp3 Liner Tramp3
Application of principle of reciprocity No Yes No Yes No Yes No Yes Restrictions on the number of foreign suppliers (indicate how many foreign suppliers are allowed)
No Yes No Yes No Yes No Yes
Are exemptions from cabotage restrictions available? Please specify.
Party to UN Liner Code, but Article 2 not applied4
No Yes
No Yes No Yes No Yes
UN Liner Code applied, including Article 2 (provide quota applicable to foreign suppliers)
No Yes No Yes No Yes No Yes
Bilateral agreements including cargo-sharing clauses (provide total number and list countries affected)
No Yes No Yes No Yes No Yes
Cargo reservation if different from the application of UN Liner Code and bilateral agreements (provide quota applicable to foreign suppliers)
No Yes No Yes No Yes No Yes
Selective restrictions imposed by government for retaliatory purposes
No Yes No Yes No Yes No Yes
Other (please specify): ___________________
No Yes No Yes No Yes No Yes
3 As opposed to freight liners, tramp ships trade on the spot market with no fixed schedule or itinerary/ports-of-call(s). 4 Article 2 gives the governments of trading states the right to specify the amount of conference cargo that can be carried by shipping lines of the state of origin, the state of destination and third-country shipping lines. The most common (though not mandated) ratio is 40/40/20.

Chapter2: Appendix2- Questionnaire form, Maritime services
102
6. If cross-border entry is restricted, what are the reasons provided by the government? International Shipping Cabotage To give the incumbent(s) time to prepare for competition.
No Yes No Yes
For national security reasons. No Yes No Yes Other (please specify) 7. Please fill in the following table with information referring to any of the top 3 main international ports (in terms of traffic): Port service
Are the following services mandatory for ships entering the port (main port only)?
Is access to service discriminatory for foreign carriers as opposed to domestic ones?
Pilotage No Yes No Yes Towing No Yes No Yes Tug assistance No Yes No Yes Navigation aids No Yes No Yes Berthing No Yes No Yes Waste disposal No Yes No Yes Anchorage No Yes No Yes Casting off No Yes No Yes Are there restrictions on domestic ships getting access to ports? No Yes Are there restrictions on foreign ships getting access to ports? No Yes C. Restrictions on the movement of intra-corporate transferees of foreign-invested companies (mode 4) 8. Are there residency or nationality requirements or quotas for any of the following categories of personnel employed by locally established foreign maritime transport services companies? Minimum number/percentage of nationals/residents
(please specify) Members of the board of directors Executives Managers Skilled workers Unskilled workers Other staff (specify):
9. Identify the permitted length of short-term visit (in days) for foreign personnel (eg shipping agents). Identify the permitted length of long-term stay (in years) of foreign intra-corporate transferees. Short-term Long-term

Chapter2: Appendix2- Questionnaire form, Maritime services
103
D. Ownership 10. Is private ownership in the provision of services through commercial establishment allowed?
Existing operators
Maximum private equity permitted (%)
New entrants
Maximum private equity permitted (%)
International shipping No Yes No Yes Cabotage No Yes No Yes Internal waterways No Yes No Yes Port superstructure No Yes No Yes Cargo handling No Yes No Yes Storage and warehousing No Yes No Yes Freight forwarding No Yes No Yes Pilotage, towing and tying No Yes No Yes Maintenance and repair of vessels
No Yes No Yes
11. Is foreign ownership in the provision of services through commercial establishment allowed?
Existing operators
Maximum foreign equity permitted (%)
New entrants
Maximum foreign equity permitted (%)
International shipping No Yes No Yes Cabotage No Yes No Yes Internal waterways No Yes No Yes Port superstructure No Yes No Yes Cargo handling No Yes No Yes Storage and warehousing No Yes No Yes Freight forwarding No Yes No Yes Pilotage, towing and tying No Yes No Yes Maintenance and repair of vessels
No Yes No Yes
12. Please fill in the table below, for the 5 most important international maritime ports with respect to the amount of traffic. Port Port Authority Port type5 Public Private Landlord Tool Service Other Public Private Landlord Tool Service Other Public Private Landlord Tool Service Other Public Private Landlord Tool Service Other Public Private Landlord Tool Service Other
5 In the case of landlord ports, the port authority typically owns and manages infrastructure, private firms are able to own superstructure, and provide port services as well as rent port assets by concessions or licenses. In the case of tool ports, port authority owns infrastructure and super structure, private firms provide services by renting port assets through concessions and licenses. In the case of service ports, the port authority owns assets and supplies services by directly hiring employees.

Chapter2: Appendix2- Questionnaire form, Maritime services
104
E Regulation 13. Characteristics of the sector regulator Institutional status of sector regulator For carriers For ports Name of regulator When was the regulator established? Is the regulator institutionally independent of the Ministry?6
No Yes
No Yes
Is the regulator institutionally independent of the operating entity (shipping company, port operator)?
No Yes No Yes
14. What are the conditions that a vessel or fleet must fulfill in order to fly the national flag7 (if a national merchant fleet does not exist or an “open registry” 8 system is in place, please specify). Please tick all that apply. Commercial presence required? No Yes At least 50% equity participation must be domestic? No Yes At least 50% of crew required to be domestic? No Yes Other (please state): National merchant fleet does not exist? No Yes Open registry system in place? No Yes Do exporters or importers receive concessional treatment of any sort if they use national flagged vessels?
No Yes
15. Regulation of carrier agreements Do agreements between transport carriers (such as conferences9 No Yes ) benefit from exemptions to competition law? If yes, what types of carrier agreements benefit from exemptions? What types of conference agreements are allowed? Open? No Yes Closed? No Yes Both open and closed? No Yes Are tariffs established by carrier agreements required to be filed or notified? No Yes Open registry system in place? No Yes Does the government enforce tariffs agreed upon within carrier agreements? No Yes Is fare discounting allowed? No Yes Does the regulatory agency monitor conferences’ activities? No Yes
6 ‘Institutionally independent’ means that the regulator is not part of the ministry and is not linked to the operating entity (national carriers/port authorities) 7 ‘Flagged’ fleets are where countries exercise effective State control. 8 ‘Open registries’ are where countries do not exercise effective ‘flag’ or State control over fleets. 9 Shipping ‘Conferences’ are integrated cartels fixing prices and frequencies, that are open to new entrants on US routes and closed in the rest of the world. They often enjoy anti-trust immunity and benefit from block exemption from competition authorities on the basis that it is thought by some that they constitute a factor of stability and a source of technical progress and services to customers.
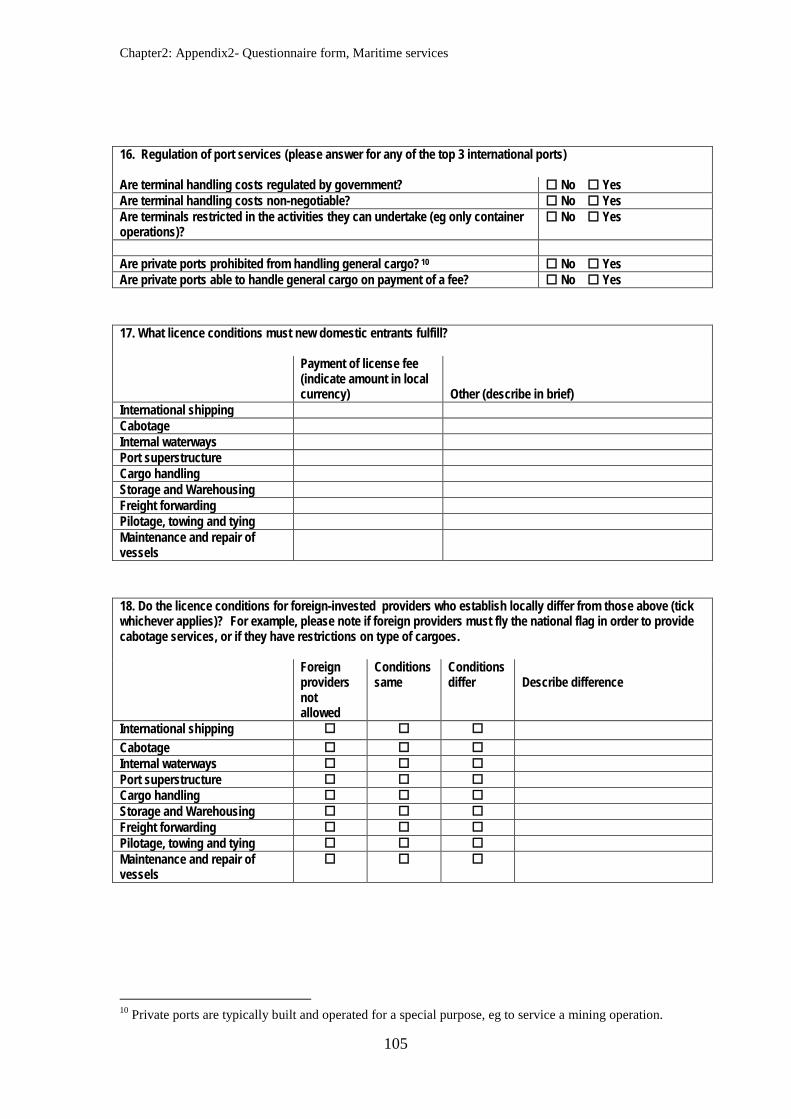
Chapter2: Appendix2- Questionnaire form, Maritime services
105
16. Regulation of port services (please answer for any of the top 3 international ports) Are terminal handling costs regulated by government? No Yes Are terminal handling costs non-negotiable? No Yes Are terminals restricted in the activities they can undertake (eg only container operations)?
No Yes
Are private ports prohibited from handling general cargo?10 No Yes Are private ports able to handle general cargo on payment of a fee? No Yes 17. What licence conditions must new domestic entrants fulfill?
Payment of license fee (indicate amount in local currency)
Other (describe in brief)
International shipping Cabotage Internal waterways Port superstructure Cargo handling Storage and Warehousing Freight forwarding Pilotage, towing and tying Maintenance and repair of vessels
18. Do the licence conditions for foreign-invested providers who establish locally differ from those above (tick whichever applies)? For example, please note if foreign providers must fly the national flag in order to provide cabotage services, or if they have restrictions on type of cargoes.
Foreign providers not allowed
Conditions same
Conditions differ
Describe difference
International shipping Cabotage Internal waterways Port superstructure Cargo handling Storage and Warehousing Freight forwarding Pilotage, towing and tying Maintenance and repair of vessels
10 Private ports are typically built and operated for a special purpose, eg to service a mining operation.

Chapter2: Appendix2- Questionnaire form, Maritime services
106
19. Do the licence conditions for foreign cross-border providers differ from those above (tick whichever applies)? For example, please note if foreign providers must fly the national flag in order to provide cabotage services, or if they have restrictions on type of cargoes.
Foreign providers not allowed
Conditions same
Conditions differ
Describe difference
International shipping Cabotage Internal waterways 20. Does the provision of shipping services by domestic or foreign providers require the appointment of a domestic shipping agent? Domestic providers Foreign providers International shipping No Yes No Yes Cabotage No Yes No Yes Internal waterways No Yes No Yes If yes, briefly describe the conditions the agent must fulfill.
21. Restrictions on the transportation of non-commercial (eg government, defence) cargoes. Tick whichever applies. No private shipping service supplier can carry non-commercial cargoes? Yes No Only national flagged suppliers can carry non-commercial cargoes? Yes No Other restrictions on commercial shipping companies carrying non-commercial cargoes? Please describe
No restrictions on commercial shipping companies carrying non-commercial cargoes?
Yes No
22. Does the government subsidise domestic shipping companies? No Yes If yes, please indicate the shipping company. 23. Has the government covered operational losses of shipping companies in the past ten years? No Yes If yes, please indicate the amount in each of these past ten years. If you have any queries about this questionnaire, please contact: Dr Philippa Dee Crawford School of Economics and Government Australian National University Ph: 61-2-6125 8598 Fax: 61-2-6125-0767 Email: [email protected]

Chapter2: Appendix3- Questionnaire form, Telecommunications
107
ERIA TRADE IN SERVICES SECTORAL QUESTIONNAIRE – TELECOMMUNICATIONS - FINAL
COVERAGE (CPC Codes) 2.C. Telecommunications Services
a. Voice telephone services 7521 b. Packet-switched data transmission services 7523** c. Circuit-switched data transmission services 7523** d. Telex services 7523** e. Telegraph services 7522 f. Facsimile services 7521**+7529** g. Private leased circuit services 7522**+7523** h. Electronic mail 7523** i. Voice mail 7523** j. On-line information and data base retrieval 7523** k. Electronic data interchange (EDI) 7523** l. Enhanced/value-added facsimile services, incl. 7523** store and forward, store and retrieve m. Code and protocol conversion n.a. n. On-line information and/or data processing (incl. transaction processing) 843** o. Other
Notes: ** The service specified constitutes only a part of the total range of activities covered by the CPC item number. INTRODUCTION The questionnaire is divided into two parts. • The policy section covers the conditions of competition in the sector, notably policy restrictions on entry;
restrictions on ownership, private and foreign; and regulation, including measures to ensure access to the network, and measures to achieve social objectives such as universal access.
• The market structure section covers information on the number of firms, their market shares and actual ownership patterns.
Note (1)
: Please give information for the current year only.
Note (2)
: Whenever a question is not applicable, (eg because the particular activity or institution is not allowed), please indicate using ‘NA’, rather than leaving the cell blank.
Note (3)
: Where reporting monetary values, please note currency.
Note (4)
: If insufficient space is provided, please attach additional information on separate sheets.
SUGGESTED INFORMATION SOURCES Government department in charge of regulating telecommunications. Independent national or regional regulatory body overseeing telecommunications (if different from the above institution) A domestically-owned and/or foreign-invested telecommunications company (if necessary)

Chapter2: Appendix3- Questionnaire form, Telecommunications
108
I. Policy Section A. Commercial presence (mode 3) - restrictions on entry a. Own-facilities basis 1. Are there restrictions on new facilities-based1 suppliers of telecommunication services in any of the sub-sectors listed below (other than associated with scarcity of spectrum – see Q. 26)? Sub-sectors
Entry by any firm?
Total number of firms allowed?
Entry by any foreign firm?
Total number of firms allowed?
Local (fixed) voice telephone services
No Yes No Yes
Domestic long distance (fixed) voice telephone services
No Yes No Yes
International (fixed) voice telephone services
No Yes No Yes
- wire/cable No Yes No Yes - satellite No Yes No Yes
Mobile voice telephone - analog, digital No Yes No Yes - satellite No Yes No Yes
Data communications - fixed No Yes No Yes - mobile No Yes No Yes
Leased lines2 No Yes No Yes Internet access services
- wire/cable No Yes No Yes - fixed wireless No Yes No Yes
Others (eg VoIP, please specify) - No Yes No Yes - No Yes No Yes - No Yes No Yes
2. If facilities-based entry is restricted, what are the reasons provided by the government?. To ensure/increase government revenue from state-owned service supplier(s) Yes No To increase government revenue from privatization of state-owned suppliers Yes No Exclusive rights believed necessary to attract (strategic) investment Yes No To give state- or locally- owned service suppliers time to prepare for competition Yes No To ensure/increase government revenue from license fees Yes No Exclusive rights believed necessary to ensure the provision of universal service Yes No Exclusive rights believed necessary to ensure national security Yes No No perceived economic need for new service suppliers Yes No Other (please state) 1 This refers to suppliers who own most or all of the transmission capacity used. 2 Leased line services are defined as the ability of telecom service suppliers to sell or lease circuits for any type of bulk network capacity (cable, satellite, wireless) to third parties. Restrictions on the ability to resell leased line capacity are covered in question 5.

Chapter2: Appendix3- Questionnaire form, Telecommunications
109
3. Are there any restrictions on facilities-based companies offering services in certain market segments if they are operating in another market segment (or others) (e.g., local, long distance, international, mobile)? No Yes If yes, please explain the nature of and reason for these restrictions: 4. Are foreign facilities-based telecom service suppliers required to establish under certain legal forms that are not required for domestic operators? If yes, please indicate: corporation unincorporated branch joint venture partnership trust association sole proprietorship b. Resale basis 5. Are there restrictions on new resale-based3 suppliers of telecommunication services in any of the sub-sectors listed below? Sub-sectors
Entry by any firm?
Total number of firms allowed?
Entry by any foreign firm?
Total number of firms allowed?
Local (fixed) voice telephone services
No Yes No Yes
Domestic long distance (fixed) voice telephone services
No Yes No Yes
International (fixed) voice telephone services
No Yes No Yes
- wire/cable No Yes No Yes - satellite No Yes No Yes
Mobile voice telephone - analog, digital No Yes No Yes - satellite No Yes No Yes
Data communications - fixed No Yes No Yes - mobile No Yes No Yes
Leased lines No Yes No Yes Internet access services
- wire/cable No Yes No Yes - fixed wireless No Yes No Yes
Others (eg VoIP, please specify) - No Yes No Yes - No Yes No Yes - No Yes No Yes
6. If resale-based entry is restricted, what are the reasons provided by the government?. To encourage facilities-based competition Yes No To ensure/increase government revenue from state-owned service supplier(s) Yes No To increase government revenue from privatization of state-owned suppliers Yes No Exclusive rights believed necessary to attract (strategic) investment Yes No 3 This refers to firms that lease capacity from facilities-based operators and use the leased capacity to provide services to third parties. Resellers may own switches and routers, but they do not own transmission facilities other than terminal equipment.

Chapter2: Appendix3- Questionnaire form, Telecommunications
110
To give state- or locally- owned service suppliers time to prepare for competition Yes No To ensure/increase government revenue from license fees Yes No Exclusive rights believed necessary to ensure the provision of universal service Yes No Exclusive rights believed necessary to ensure national security Yes No No perceived economic need for new service suppliers Yes No Other (please state) 7. Are there any restrictions on resale-based companies offering services in certain market segments if they are operating in another market segment (or others) (e.g., local, long distance, international, mobile)? No Yes If yes, please explain the nature of and reason for these restrictions: 8. Are foreign resale-based telecom service suppliers required to establish under certain legal forms that are not required for domestic operators? If yes, please indicate: corporation unincorporated branch joint venture partnership trust association sole proprietorship c. .Leased lines and private networks 9. Are companies permitted to operate private networks of leased lines between their various premises? No Yes If yes, is prior authorization required? Explain how this authorization is obtained. _____________________________________________________________________________________ 10. Are companies permitted to operate private networks of “own facilities” between their various premises? No Yes If yes, is prior authorization required? Explain how this authorization is. _____________________________________________________________________________________ 11. What types of affiliated firms may be connected to the same private network?. Parent/holding companies, subsidiaries and branches Yes No Those companies above and affiliates in which there is minority ownership Yes No Is there a minimum percentage ownership required in order to be connected? Yes No If yes, please specify the percentage: Close user groups of self-selecting companies and affiliates regardless of ownership linkages
Yes No
12. Is interconnection of these private networks to the public switched network permitted? At one end? Yes No Both ends? Yes No If yes, what conditions apply?

Chapter2: Appendix3- Questionnaire form, Telecommunications
111
B. Restrictions on cross-border trade (mode 1) a. Own-facilities basis 13. Are there restrictions on the cross-border supply or consumption of telecommunication services over the networks of facilities-based service suppliers in any of the sub-sectors listed above, e.g., callback? No Yes If yes, please describe: _______________________________________________________________ 14. Are there routing restrictions (e.g., do new facilities-based entrants have to use the incumbent carrier’s international circuits or gateways, or are they free to choose how to route their international traffic)? No Yes If yes, please describe: _______________________________________________________________ 15. Is there an expiry date for such restrictions? No Yes If yes, please describe: _______________________________________________________________ a. Resale basis 16. Are there restrictions on the cross-border supply or consumption of telecommunication services over the networks of resale-based service suppliers in any of the sub-sectors listed above, e.g., callback? No Yes If yes, please describe: _______________________________________________________________ 17. Are there routing restrictions (e.g., do resellers have to use the incumbent carrier’s international circuits or gateways, or are they free to choose how to route their international traffic)? No Yes If yes, please describe: _______________________________________________________________ 18. Is there an expiry date for such restrictions? No Yes If yes, please describe: _______________________________________________________________ 19. Reasons for restrictions on cross-border competition (whether for facilities-based or resale-based services) To ensure/increase government revenue from state-owned service supplier(s) Yes No To increase government revenue from privatization of state-owned suppliers Yes No Exclusive rights believed necessary to attract (strategic) investment Yes No To give state- or locally- owned service suppliers time to prepare for competition Yes No To ensure/increase government revenue from license fees Yes No Exclusive rights believed necessary to ensure the provision of universal service Yes No Other (please state)

Chapter2: Appendix3- Questionnaire form, Telecommunications
112
C. Ownership 20. Is private ownership of facilities-based telecom service suppliers allowed?
Existing operators Maximum private equity permitted (%)
New entrants
Maximum private equity permitted (%)
Local (fixed) voice telephone services
No Yes No Yes
Domestic long distance (fixed) voice telephone services
No Yes No Yes
International (fixed) voice telephone services
No Yes No Yes
- wire/cable No Yes No Yes - satellite No Yes No Yes Mobile voice telephone
- analog, digital No Yes No Yes - satellite No Yes No Yes Data communications
- fixed No Yes No Yes - mobile No Yes No Yes Leased lines No Yes No Yes Internet access services
- wire/cable No Yes No Yes - fixed wireless No Yes No Yes Others (eg VoIP, please specify):
- No Yes No Yes - No Yes No Yes - No Yes No Yes 21. Is foreign ownership of facilities-based telecom service suppliers allowed?
Existing operators Maximum private equity permitted (%)
New entrants
Maximum private equity permitted (%)
Local (fixed) voice telephone services
No Yes No Yes
Domestic long distance (fixed) voice telephone services
No Yes No Yes
International (fixed) voice telephone services
No Yes No Yes
- wire/cable No Yes No Yes - satellite No Yes No Yes Mobile voice telephone
- analog, digital No Yes No Yes - satellite No Yes No Yes

Chapter2: Appendix3- Questionnaire form, Telecommunications
113
Data communications
- fixed No Yes No Yes - mobile No Yes No Yes Leased lines No Yes No Yes Internet access services
- wire/cable No Yes No Yes - fixed wireless No Yes No Yes Others (eg VoIP, please specify):
- No Yes No Yes - No Yes No Yes - No Yes No Yes 22. Is private ownership of resale-based telecom service suppliers allowed?
Existing operators Maximum private equity permitted (%)
New entrants
Maximum private equity permitted (%)
Local (fixed) voice telephone services
No Yes No Yes
Domestic long distance (fixed) voice telephone services
No Yes No Yes
International (fixed) voice telephone services
No Yes No Yes
- wire/cable No Yes No Yes - satellite No Yes No Yes Mobile voice telephone
- analog, digital No Yes No Yes - satellite No Yes No Yes Data communications
- fixed No Yes No Yes - mobile No Yes No Yes Leased lines No Yes No Yes Internet access services
- wire/cable No Yes No Yes - fixed wireless No Yes No Yes Others (eg VoIP, please specify):
- No Yes No Yes - No Yes No Yes - No Yes No Yes

Chapter2: Appendix3- Questionnaire form, Telecommunications
114
23. Is foreign ownership of resale-based telecom service suppliers allowed?
Existing operators Maximum private equity permitted (%)
New entrants
Maximum private equity permitted (%)
Local (fixed) voice telephone services
No Yes No Yes
Domestic long distance (fixed) voice telephone services
No Yes No Yes
International (fixed) voice telephone services
- wire/cable No Yes No Yes - satellite No Yes No Yes Mobile voice telephone
- analog, digital No Yes No Yes - satellite No Yes No Yes Data communications
- fixed No Yes No Yes - mobile No Yes No Yes Leased lines No Yes No Yes Internet access services
- wire/cable No Yes No Yes - fixed wireless No Yes No Yes Others (eg VoIP, please specify):
- No Yes No Yes - No Yes No Yes - No Yes No Yes D. Regulation a. The regulator 24. Characteristics of the sector regulator Name of regulator When was the regulator established? Is the regulator institutionally separate from the ministry responsible for telecommunications
No Yes ?
If yes, when was the regulator made separate? Are the decisions of the regulator self-executing, or must they be approved by the ministry or government before they can take effect
Self-executing Need Ministry approval

Chapter2: Appendix3- Questionnaire form, Telecommunications
115
b. Licensing 25. Are individual or general/class operating licenses required for the provision of the following services?4
Service Sub-sector
What type of selection process is used (include bureaucratic discretion under ‘beauty contest’)?
Type of Licence Required5 Type of Selection Process Local (fixed) voice telephone services - facilities based
Individual General
Auction “Beauty Contest” Combination First come, first served
Local (fixed) voice telephone services - resale based
Individual General
Auction “Beauty Contest” Combination First come, first served
Domestic long distance (fixed) voice telephone services - facilities based
Individual General
Auction “Beauty Contest” Combination First come, first served
Domestic long distance (fixed) voice telephone services - resale based
Individual General
Auction “Beauty Contest” Combination First come, first served
International (fixed) voice telephone services - wire/cable - facilities based
Individual General
Auction “Beauty Contest” Combination First come, first served
International (fixed) voice telephone services - wire/cable - resale based
Individual General
Auction “Beauty Contest” Combination First come, first served
International (fixed) voice telephone services - satellite - facilities based
Individual General
Auction “Beauty Contest” Combination First come, first served
International (fixed) voice telephone services - satellite -resale based
Individual General
Auction “Beauty Contest” Combination First come, first served
Mobile voice telephone – analog/digital - facilities based
Individual General
Auction “Beauty Contest” Combination First come, first served
4 Operating licences are for purposes of supplying a service. They are distinct from radiocommunications/ spectrum licences for the use of radio frequencies. 5 Individual (or operator-specific) licenses are generally customized and detailed (and may be specific to a particular technology), are frequently granted through some sort of competitive selection process, and are typically used when a regulator has an interest in ensuring a service is provided in a particular manner (eg where the operator is deemed to have market power). General authorisations (or class licences) establish general conditions of operation, typically including consumer protection, and are generally issued without a competitive selection process to all qualified entities.

Chapter2: Appendix3- Questionnaire form, Telecommunications
116
Mobile voice telephone – analog/digital - resale based
Individual General
Auction “Beauty Contest” Combination First come, first served
Mobile voice telephone - satellite - facilities based
Individual General
Auction “Beauty Contest” Combination First come, first served
Mobile voice telephone - satellite -resale based
Individual General
Auction “Beauty Contest” Combination First come, first served
Data communications - fixed - facilities based
Individual General
Auction “Beauty Contest” Combination First come, first served
Data communications - fixed - resale based
Individual General
Auction “Beauty Contest” Combination First come, first served
Data communications - mobile - facilities based
Individual General
Auction “Beauty Contest” Combination First come, first served
Data communications - mobile - resale based
Individual General
Auction “Beauty Contest” Combination First come, first served
Leased lines - facilities based Individual General
Auction “Beauty Contest” Combination First come, first served
Leased lines -resale based Individual General
Auction “Beauty Contest” Combination First come, first served
Internet access services - - wire/cable - facilities based
Individual General
Auction “Beauty Contest” Combination First come, first served
Internet access services - - wire/cable - resale based
Individual General
Auction “Beauty Contest” Combination First come, first served

Chapter2: Appendix3- Questionnaire form, Telecommunications
117
Internet access services - - fixed wireless - facilities based
Individual General
Auction “Beauty Contest” Combination First come, first served
Internet access services - - fixed wireless - resale based
Individual General
Auction “Beauty Contest” Combination First come, first served
Others (eg VoIP, please specify)-
Individual General
Auction “Beauty Contest” Combination First come, first served
- Individual General
Auction “Beauty Contest” Combination First come, first served
Individual General
Auction “Beauty Contest” Combination First come, first served
26. When spectrum licenses are required for the provision of the following services, what processes are required (include bureaucratic discretion under ‘beauty contest’)?6
Service Sub-sector
The service providers in this context are all facilities-based, in that they all must hold a spectrum licence.
Type of Licence Required Type of Selection Process Local (fixed) voice telephone services
Individual General
Auction “Beauty Contest” Combination First come, first served
Long Distance (fixed) voice telephone services
Individual General
Auction “Beauty Contest” Combination First come, first served
International (fixed) voice telephone services - satellite
Individual General
Auction “Beauty Contest” Combination First come, first served
Mobile voice telephone - analog/digital
Individual General
Auction “Beauty Contest” Combination First come, first served
Mobile voice telephone - satellite
Individual General
Auction “Beauty Contest” Combination First come, first served
Data communications - fixed Individual General
Auction “Beauty Contest” Combination First come, first served
6 Operating licences are for purposes of supplying a service. They are distinct from radiocommunications/ spectrum licences for the use of radio frequencies.

Chapter2: Appendix3- Questionnaire form, Telecommunications
118
Data communications - mobile Individual General
Auction “Beauty Contest” Combination First come, first served
Internet access services - - fixed wireless
Individual General
Auction “Beauty Contest” Combination First come, first served
Others (eg VoIP, please specify) Individual General
Auction “Beauty Contest” Combination First come, first served
Individual General
Auction “Beauty Contest” Combination First come, first served
Individual General
Auction “Beauty Contest” Combination First come, first served
27. Do any licences grant exclusive rights? No Yes If yes, please indicate the nature of those exclusive rights, the relevant market
segments and when the exclusive rights will expire. ________________________________________________________________________________________
28. Are separate licenses required to establish branches in each state/province? No Yes 29. Specify the main licensing conditions new entrants must fulfill. Payment of license fee? No Yes Presentation of detailed business plan? No Yes Network coverage / satellite footprint requirements No Yes Minimum capital? No Yes Safeguards against anti-competitive behaviour? No Yes Compatible home country regulation? No Yes Other (please state): 30. Are foreign-owned telecommunication service suppliers subject to different licensing conditions from domestic suppliers? No Yes If yes, please specify what additional requirements have to be met by foreign suppliers ______________________________________________________________________________________________

Chapter2: Appendix3- Questionnaire form, Telecommunications
119
31. Once the licenses have been allocated, are there restrictions on firms’ ability to sell, dispose of, or otherwise transfer these licenses? No Yes If yes, please explain the policy and methods allowed: Does spectrum trading occur? No Yes c. Regulation of network interconnection 32. How are interconnection agreements among service providers determined?
Between fixed line service providers
Between mobile and fixed line carriers
Between mobile carriers
Between internet service providers
Private negotiation between parties?
No Yes No Yes No Yes No Yes
Private negotiation, but general terms set by regulatory agency?
No Yes No Yes No Yes No Yes
Detailed terms set by regulatory agency?
No Yes No Yes No Yes No Yes
Other (please specify): 33. Which of the following aspects of interconnection are set by the regulatory agency?
Between fixed line service providers
Between mobile and fixed line carriers
Between mobile carriers
Between internet service providers
Technical standards? No Yes No Yes No Yes No Yes Procedures for interconnection? No Yes No Yes No Yes No Yes Time frames for interconnection? No Yes No Yes No Yes No Yes Points of interconnection? No Yes No Yes No Yes No Yes Price of interconnection? No Yes No Yes No Yes No Yes Other (please specify): 34. Which of the following interconnection pricing rules apply in your country?
Between fixed line service providers
Between mobile and fixed line carriers
Between mobile carriers
Reciprocal pricing7 No Yes No Yes No Yes Unbundling8 No Yes No Yes No Yes Imputation9 No Yes No Yes No Yes Other (please specify):
7 Reciprocal pricing requires that all networks charge the same amount to terminate calls coming from other networks. 8 Unbundling requires the dominant network operator to sell network components independently of each other, so that rival networks are not forced to buy services they do not need. 9 Imputation rules are designed to eliminate any markup on services components sold to competing firms over and above the implicit charges for internal use — and should tend to equalize prices charged by direct competitors.
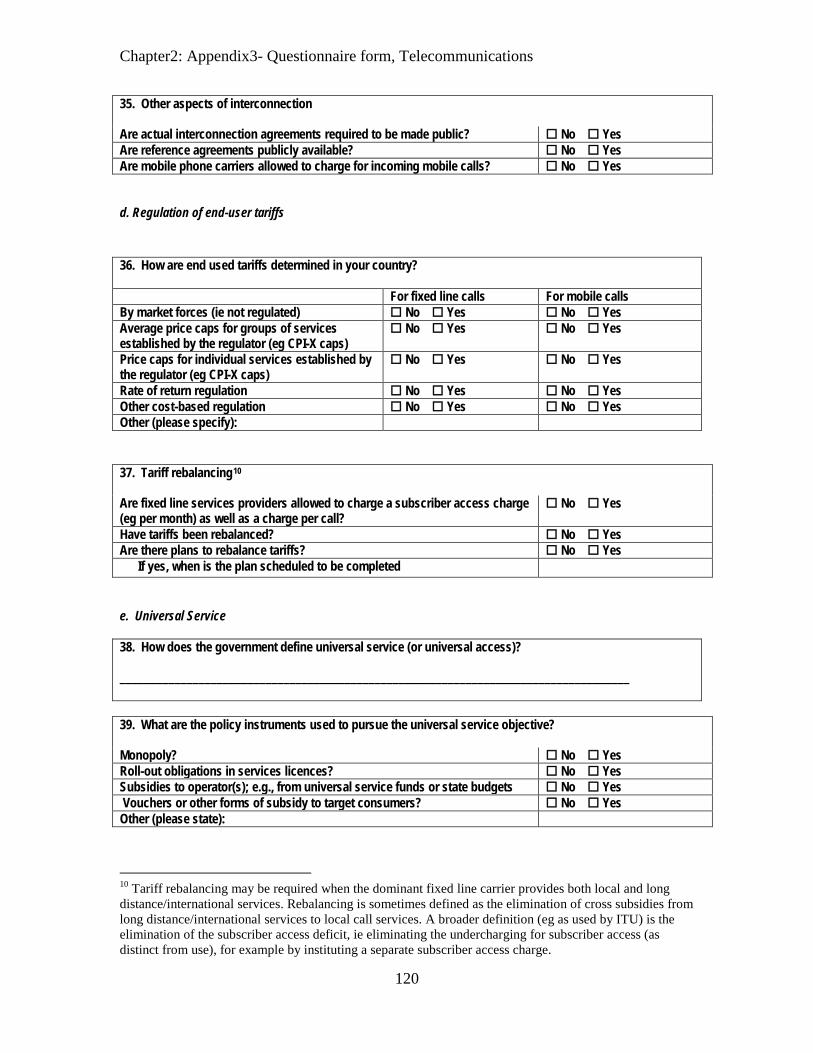
Chapter2: Appendix3- Questionnaire form, Telecommunications
120
35. Other aspects of interconnection Are actual interconnection agreements required to be made public? No Yes Are reference agreements publicly available? No Yes Are mobile phone carriers allowed to charge for incoming mobile calls? No Yes d. Regulation of end-user tariffs 36. How are end used tariffs determined in your country? For fixed line calls For mobile calls By market forces (ie not regulated) No Yes No Yes Average price caps for groups of services established by the regulator (eg CPI-X caps)
No Yes No Yes
Price caps for individual services established by the regulator (eg CPI-X caps)
No Yes No Yes
Rate of return regulation No Yes No Yes Other cost-based regulation No Yes No Yes Other (please specify): 37. Tariff rebalancing10 Are fixed line services providers allowed to charge a subscriber access charge (eg per month) as well as a charge per call?
No Yes
Have tariffs been rebalanced? No Yes Are there plans to rebalance tariffs? No Yes If yes, when is the plan scheduled to be completed e. Universal Service 38. How does the government define universal service (or universal access)? ____________________________________________________________________________________ 39. What are the policy instruments used to pursue the universal service objective? Monopoly? No Yes Roll-out obligations in services licences? No Yes Subsidies to operator(s); e.g., from universal service funds or state budgets No Yes Vouchers or other forms of subsidy to target consumers? No Yes Other (please state):
10 Tariff rebalancing may be required when the dominant fixed line carrier provides both local and long distance/international services. Rebalancing is sometimes defined as the elimination of cross subsidies from long distance/international services to local call services. A broader definition (eg as used by ITU) is the elimination of the subscriber access deficit, ie eliminating the undercharging for subscriber access (as distinct from use), for example by instituting a separate subscriber access charge.

Chapter2: Appendix3- Questionnaire form, Telecommunications
121
40. On which service suppliers are universal service obligations imposed?? Incumbent operator? No Yes Private operators offering local services? No Yes Private operators offering long distance and international services? No Yes Other (please state): II. Market Structure 41. Please list the characteristics of all facilities-based operators providing the following services. Name of firm Year of service
commencement Market share Owners of capital and their
respective shares (domestic/foreign/ government)
Domestic fixed line
International fixed line (combine with above only if necessary)
Mobile voice telephone services (analog/digital) 42. Other How many providers are offering telecommunications services through networks other than the public switched network?
VoIP Through cable TV network By satellite Other (eg through electricity networks – please state) ________________ How many internet service providers are there? If you have any queries about this questionnaire, please contact: Dr Philippa Dee Crawford School of Economics and Government Australian National University Ph: 61-2-6125 8598 Fax: 61-2-6125-0767 Email: [email protected]
Chapter2: Appendix4- Questionnaire form, ASEAN Single Window
122
ERIA TRADE IN SERVICES SECTORAL QUESTIONNAIRE – ASEAN SINGLE WINDOW
COVERAGE This questionnaire covers regulations and procedures that have been identified in business surveys as providing the most prevalent and/or significant barriers to the movement of goods across borders within the ASEAN region. The research findings were summarised in the chapter on Trade Facilitation in ERIA Research Project Report 2008 No. 1 on Deepening East Asian Economic Integration. INTRODUCTION The questionnaire is divided into two parts. • The national policy section covers progress toward achieving a National Single Window for goods
clearance, the introduction of electronic information exchange and management, and the development of transparency in trade regulation.
• The regional cooperation section covers national progress towards participating in an ASEAN Single Window, towards streamlining and harmonising Customs marking requirements, and towards granting mutual recognition of conformance assessments of whether goods meet each country’s technical requirements.
Note (1)
: Please give information for the current year only.
Note (2)
: Whenever a question is not applicable, (eg because the particular activity or institution is not allowed), please indicate using ‘NA’, rather than leaving the cell blank. Please also explain why the question is not applicable.
Note (3)
: Where reporting monetary values, please note currency.
Note (4)
: If insufficient space is provided, please attach additional information on separate sheets.
SUGGESTED INFORMATION SOURCES Government department in charge of Customs Other agencies involved in the clearance of goods at borders, ie banks, insurance companies, port authorities, other agencies involved in issuing permits, transport companies, importers A logistics company (if necessary)

Chapter2: Appendix4- Questionnaire form, ASEAN Single Window
123
I. National Policy A. National Single Window 1. Is there a single point of entry for the submission of all data and information required to move goods across borders? Pilot scheme (eg only at some ports)? No Yes Full implementation at all points of entry? No Yes 2. How must the data be submitted? Paper? No Yes Electronically? No Yes Mix of both? No Yes 3. How is the data processed? Entered into a single database for use by all relevant agencies? No Yes Entered into two separate databases (or passed on twice) for different purposes?
No Yes
Entered into three separate databases (or passed on three times) for different purposes?
No Yes
Entered into four separate databases (or passed on four times) for different purposes?
No Yes
Entered into five or more separate databases (or passed on five or more times) for different purposes?
No Yes
4. Clearance and release Is there a time limit for approval of declarations? No Yes Is actual performance measured against target? No Yes Is there a fast-lane procedure for regular importers with a good track record? No Yes Can duty payment be made by electronic funds transfer? No Yes Is there automatic release of goods once payment is received? No Yes 5. Risk assessment No Sometimes Yes Are there clearly identified risk assessment criteria for cargo inspection?
Is pre-arrival information used in risk assessment? Is selection for examination done electronically, based on risk criteria?
Is X-ray equipment used in examination Is manual inspection subject to time limits? B. Transparency and due process 6. Trade regulation Is trade regulation available online? No Yes How often is the website updated – please state (eg monthly, annually) Is there provision for online feedback from importers etc? No Yes
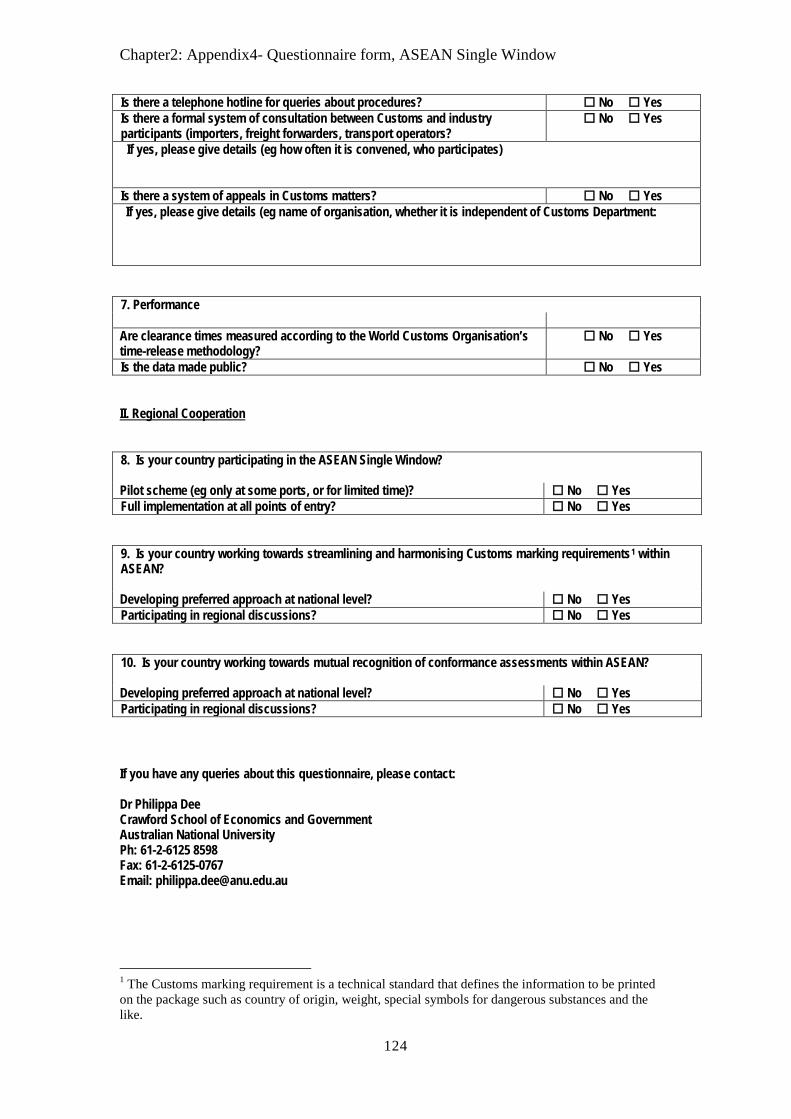
Chapter2: Appendix4- Questionnaire form, ASEAN Single Window
124
Is there a telephone hotline for queries about procedures? No Yes Is there a formal system of consultation between Customs and industry participants (importers, freight forwarders, transport operators?
No Yes
If yes, please give details (eg how often it is convened, who participates)
Is there a system of appeals in Customs matters? No Yes If yes, please give details (eg name of organisation, whether it is independent of Customs Department: 7. Performance Are clearance times measured according to the World Customs Organisation’s time-release methodology?
No Yes
Is the data made public? No Yes II. Regional Cooperation 8. Is your country participating in the ASEAN Single Window? Pilot scheme (eg only at some ports, or for limited time)? No Yes Full implementation at all points of entry? No Yes 9. Is your country working towards streamlining and harmonising Customs marking requirements1 within ASEAN? Developing preferred approach at national level? No Yes Participating in regional discussions? No Yes 10. Is your country working towards mutual recognition of conformance assessments within ASEAN? Developing preferred approach at national level? No Yes Participating in regional discussions? No Yes If you have any queries about this questionnaire, please contact: Dr Philippa Dee Crawford School of Economics and Government Australian National University Ph: 61-2-6125 8598 Fax: 61-2-6125-0767 Email: [email protected]
1 The Customs marking requirement is a technical standard that defines the information to be printed on the package such as country of origin, weight, special symbols for dangerous substances and the like.

125
Trade Facilitation toward the ASEAN Economic Community
PATRICIA SOURDIN
School of Advanced International Studies, Bologna Center,
The Johns Hopkins University
RICHARD POMFRET
School of Economics, University of Adelaide
Establishment of the ASEAN Economic Community (AEC) hinges largely on successful and on-
time implementation of the AEC Blueprint. A monitoring system is a vital component of effective implementation. This paper contributes to the monitoring debate by (1) developing a composite indicator of trade costs for each individual ASEAN member country, which indicates success in trade facilitation and can be used to assess proximity to regional best practice, and (2) comparing the composite indicator with the AEC Scorecard approach endorsed by ASEAN member countries.
The Index of Trade Costs is based on the gap between cif and fob values of ASEAN exports to third countries using import data from the USA, Australia, Brazil and Chile for 1990-2008. We conduct econometric analysis to better understand why trade costs vary across countries and to compare the ASEAN members’ record to the global average. Trade costs vary between ASEAN members, but the results indicated substantial reduction, converging on the lowest-cost trader (Singapore) and coinciding with increased attention to trade facilitation in ASEAN during the 1990s.
The Index of Trade Costs and the Scorecard approach are complementary. The Index of Trade Costs is a simple scalar measure of trade costs, which indicates success in trade facilitation and can be used to assess proximity to regional or global best practice. The Scorecard approach indicates whether governments have implemented specific measures, such as mutual recognition agreements, or ratified ASEAN decisions that are critical to establishing the AEC.

126
1. Introduction Establishment of the ASEAN Economic Community (AEC) hinges largely on
successful and on-time implementation of the AEC Blueprint. A monitoring system is a
vital component of effective implementation. This paper contributes to the monitoring
debate in two ways. First, we develop a composite indicator of trade costs for each
individual ASEAN member country. Second, we compare and contrast the composite
indicator with the AEC Scorecard approach to monitoring.
The indicator of trade costs in Sections 2-4 is based on the gap between cif and fob
values of ASEAN exports to third countries. The cif/fob gap is a commonly used aggregate
measure of trade costs, i.e. the difference between the costs of a domestic and an
international transaction apart from tariffs and behind-the-border costs. In an earlier paper
(ERIA Discussion Paper Series ERIA-DP-2009-12, April 2009), we set out the case for
using such a measure of trade costs and reported results using Australian import data.
Although there are many definitions of trade costs and of trade facilitation, the cif/fob gap
is suitable as an operational definition, using universally acceptable concepts and
approximating the cost of international as opposed to domestic trade. It includes transport
and logistics costs which may be driven by technical improvements as well as by improved
policies and procedures. The cif/fob measure should be treated as a benchmark rather than a
perfect way to capture the impact of trade facilitation commitments.
We conducted econometric analysis of the cif/fob measure to better understand why
trade costs vary across countries and to compare the ASEAN members’ record to the global
average during the period 1990-2007. The results indicated variation in trade costs between
ASEAN members, but also substantial reduction of trade costs, converging on the lowest
cost trader (Singapore) and coinciding with increased attention to trade facilitation in
ASEAN during the 1990s. The present paper aims to establish whether any biases arose
from using Australian data, and to refine the measure further.
The next section reports cif/fob trade cost measures for ASEAN countries based on
import data from the USA, Australia, Brazil and Chile. Section 3 conducts econometric
analysis of the determinants of trade costs and Section 4 reports an Index of Trade Costs.
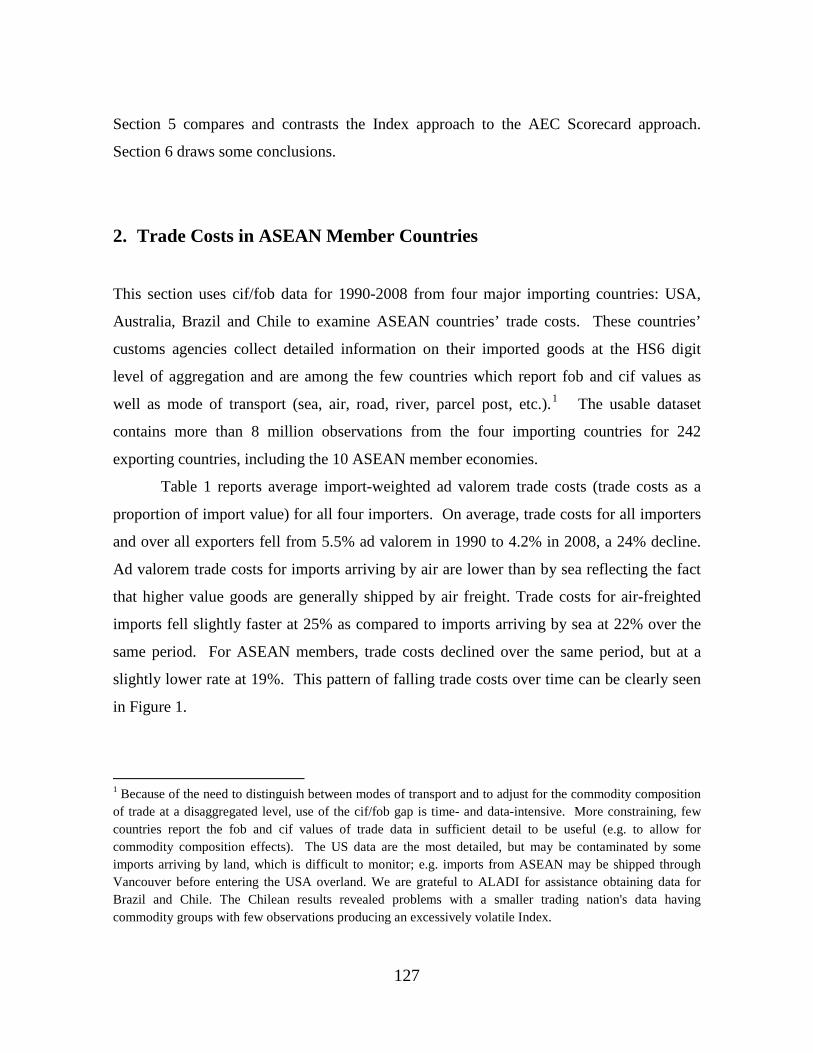
127
Section 5 compares and contrasts the Index approach to the AEC Scorecard approach.
Section 6 draws some conclusions.
2. Trade Costs in ASEAN Member Countries
This section uses cif/fob data for 1990-2008 from four major importing countries: USA,
Australia, Brazil and Chile to examine ASEAN countries’ trade costs. These countries’
customs agencies collect detailed information on their imported goods at the HS6 digit
level of aggregation and are among the few countries which report fob and cif values as
well as mode of transport (sea, air, road, river, parcel post, etc.).1
1 Because of the need to distinguish between modes of transport and to adjust for the commodity composition of trade at a disaggregated level, use of the cif/fob gap is time- and data-intensive. More constraining, few countries report the fob and cif values of trade data in sufficient detail to be useful (e.g. to allow for commodity composition effects). The US data are the most detailed, but may be contaminated by some imports arriving by land, which is difficult to monitor; e.g. imports from ASEAN may be shipped through Vancouver before entering the USA overland. We are grateful to ALADI for assistance obtaining data for Brazil and Chile. The Chilean results revealed problems with a smaller trading nation's data having commodity groups with few observations producing an excessively volatile Index.
The usable dataset
contains more than 8 million observations from the four importing countries for 242
exporting countries, including the 10 ASEAN member economies.
Table 1 reports average import-weighted ad valorem trade costs (trade costs as a
proportion of import value) for all four importers. On average, trade costs for all importers
and over all exporters fell from 5.5% ad valorem in 1990 to 4.2% in 2008, a 24% decline.
Ad valorem trade costs for imports arriving by air are lower than by sea reflecting the fact
that higher value goods are generally shipped by air freight. Trade costs for air-freighted
imports fell slightly faster at 25% as compared to imports arriving by sea at 22% over the
same period. For ASEAN members, trade costs declined over the same period, but at a
slightly lower rate at 19%. This pattern of falling trade costs over time can be clearly seen
in Figure 1.

128
Table 1: Average trade costs. All importers. Year All Air Sea ASEAN Year All Air Sea ASEAN
1990 0.055 0.044 0.058 0.054 2000 0.045 0.029 0.054 0.045 1991 0.054 0.043 0.058 0.052 2001 0.046 0.028 0.054 0.046 1992 0.050 0.041 0.054 0.048 2002 0.044 0.031 0.050 0.045 1993 0.050 0.040 0.054 0.045 2003 0.047 0.030 0.055 0.047 1994 0.049 0.038 0.054 0.042 2004 0.050 0.031 0.057 0.050 1995 0.050 0.038 0.055 0.039 2005 0.048 0.030 0.055 0.048 1996 0.044 0.033 0.049 0.035 2006 0.044 0.029 0.050 0.045 1997 0.044 0.033 0.049 0.035 2007 0.042 0.029 0.047 0.043 1998 0.046 0.031 0.053 0.037 2008 0.042 0.030 0.045 0.044 1999 0.045 0.031 0.053 0.043
Note: import weighted ad valorem trade costs; ad valorem trade costs =
Figure 1: Average Trade costs, all importers, 1990-2008.
Since we have four importing countries, it is instructive to examine how trade costs
vary by importing country. Sourdin and Pomfret (2009) using only Australian import data
found average weighted trade costs ranging from 8% in 1990 to 5% in 2007. Table A1 in
the Appendix reports average trade costs by importing country. Imports into the USA
exhibit the lowest ad valorem trade costs followed by Australia, Brazil and Chile, with
Australia and Brazil experiencing the largest fall since 1990 and little change over the
period for Chilean imports. Since the USA is the largest of the four markets, the higher
volume of trade to the USA contributes to lower trade costs when the data are aggregated.
cif∑fob∑
− 1

129
The variation in trade costs across importing country points to the importance of both the
exporting and importing country in the determination of trade costs.
Turning to ASEAN member countries, Table 2 highlights the variation in ad
valorem trade costs among the individual ASEAN countries’ exports to Australia, USA,
Chile and Brazil from 1990-2008. Weighted average ad valorem trade costs for individual
Asian trading partners in 1990-2008 are reported in Appendix Table A2. The final column
in Table 2 presents the ASEAN average. While there is a large variation in trade costs in
1990, by 2008 the ASEAN economies' trade costs appear to be converging. Graphically,
Table 2 results are presented in Figures 2 and 3 along with the global (i.e. for all exporters)
averages. For the original five ASEAN members there is a substantial decline in trade costs
during the 1990s and convergence towards the lowest cost country, Singapore, although in
the 2000s there is no clear trend. For the other five ASEAN member countries it is harder
to identify a trend due to the higher volatility – especially for Laos and Cambodia –
reflecting the small number of trade items.
Table 2: Average import weighted trade costs ASEAN countries. 1990-2008. Year BRN IDN KHM LAO MMR MYS PHL SGP THA VNM ASEAN 1990 0.072 0.102 0.176 0.104 0.049 0.05 0.074 0.03 0.059 0.072 0.054 1991 0.073 0.102 0.013 0.033 0.084 0.047 0.071 0.028 0.057 0.127 0.052 1992 0.056 0.085 0.029 0.075 0.046 0.041 0.063 0.025 0.055 0.085 0.048 1993 0.056 0.083 0.096 0.065 0.042 0.038 0.059 0.023 0.054 0.076 0.045 1994 0.036 0.079 0.067 0.074 0.046 0.035 0.055 0.023 0.05 0.087 0.042 1995 0.045 0.073 0.077 0.08 0.048 0.032 0.052 0.021 0.046 0.067 0.039 1996 0.042 0.067 0.064 0.073 0.053 0.031 0.042 0.017 0.043 0.077 0.035 1997 0.04 0.066 0.066 0.057 0.057 0.031 0.036 0.018 0.039 0.073 0.035 1998 0.063 0.07 0.062 0.051 0.058 0.031 0.033 0.019 0.043 0.079 0.037 1999 0.069 0.081 0.072 0.053 0.061 0.033 0.038 0.022 0.059 0.065 0.043 2000 0.062 0.082 0.066 0.076 0.051 0.035 0.039 0.022 0.062 0.069 0.045 2001 0.072 0.08 0.057 0.066 0.043 0.036 0.04 0.023 0.059 0.084 0.046 2002 0.058 0.074 0.07 0.06 0.044 0.032 0.041 0.024 0.061 0.071 0.045 2003 0.061 0.074 0.058 0.072 0.043 0.032 0.043 0.027 0.061 0.077 0.047 2004 0.07 0.081 0.063 0.088 0.048 0.035 0.049 0.027 0.062 0.084 0.050 2005 0.047 0.079 0.061 0.033 0.054 0.032 0.05 0.028 0.059 0.08 0.048 2006 0.043 0.069 0.064 0.029 0.045 0.03 0.047 0.026 0.055 0.072 0.045 2007 0.035 0.064 0.055 0.051 0.045 0.031 0.045 0.026 0.047 0.067 0.043 2008 0.036 0.059 0.056 0.048 0.05 0.032 0.047 0.028 0.047 0.066 0.044

130
Figure 2: Average trade costs for exports to USA, Australia, Chile and Brazil, 1990-2008. Indonesia, Malaysia, Philippines, Singapore, and Thailand.
Figure 3: Average trade costs for exports to USA, Australia, Chile and Brazil, 1990-2008. Brunei, Cambodia, Lao PDR, Myanmar, Viet Nam.

131
3. Why Do Trade Costs Vary? Econometric Analysis of Trade Cost
Determination
In this section we analyze econometrically the determinants of ad valorem trade costs.
There are many factors contributing to the level of ad valorem trade costs. Our modeling
strategy follows earlier studies in that we model trade costs as a function of exogenous
factors such as distance or landlockedness and endogenous factors such as trade volumes
and institutional variables that are directly thought to influence trade costs.2
For ASEAN
member countries for 2008 we estimate trade cost functions based on the following:
(1)
in which ad valorem trade costs for commodity k from country i to
country j depend on the distance between the two countries , a dummy for
landlocked exporting countries to proxy added border crossings , the value to weight ratio for commodity k from exporting country i to importing country j ( )kilogramsin by weight divided valuecifVW k
ij = since for a given weight, a higher value
good will have lower ad valorem trade costs, total bilateral imports from the exporting country to the importing country to capture scale effects, and measures of
either institutional quality or indicators capturing trade facilitation measures in the exporting country.
We use three measures of general institution or infrastructure quality aimed at
capturing any trade-enabling or trade-cost-reducing factors present in the exporting country.
The first measure is the Enabling Trade Index (ETI) from the World Economic Forum. The
ETI is designed to measure the “institutions, policies, and services facilitating the free flow
of goods over borders and to final destinations”. 3
2 For example, Korinek and Sourdin (2009), Sourdin and Pomfret (2009), Clark, Dollar and Micco (2004), Fink, Mattoo and Neagu (2002), Wilmsmeier and Hoffmann (2008), Hummels (2007), Hummels, Lygovysky and Skiba (2009), Micco and Perez (2002), Mirza and Habib (2009), Moreira, Volpe and Blyde (2008) and Wilmsmeier, Hoffmann and Sanchez (2006).
The index is composed of four
3 The Global Enabling Trade Report 2009, World Economic Forum. Of the importing countries, Australia ranks 14th overall, USA 16th, Chile 19th and Brazil 87th out of the 121 countries included in the survey. For the ASEAN economies, Singapore ranks 1st place overall followed by Malaysia (28), Thailand (50), Indonesia
cif − fob( ) fob( )ij
k= f distij ,importsij ,VWij
k, llocki,institutionsi( )
cif − fob( ) fob( )ij
k
distij( )
llocki( )
importsij( )

132
subindexes to capture the main enablers of trade; (1) market access, (2) border
administration, (3) transport and communications infrastructure, and (4) the business
environment. We use the 2009 index which is the latest available and relates to the year
2008. A higher value of the index indicates higher quality trade enabling measures in place
and therefore we expect a negative relationship between the ETI and ad valorem trade costs.
The second institutional variable we use is a measure of overall infrastructure
quality from the World Economic Forum’s Global Competitiveness Report. The
infrastructure index is one of the components of the Global Competitiveness Index and is
made up of indexes relating to the quality of port infrastructure, telephony, electricity
supply, air transport infrastructure, roads and railroad infrastructure.4
The third measure is the Corruptions Perceptions Index from Transparency
International which indicates the degree of public sector corruption as perceived by the
business community and country analysts.
A higher index is
indicative of higher quality infrastructure and we therefore expect a negative relationship
between ad valorem trade costs and the infrastructure quality index.
5
For 2008, we rank the ASEAN countries according to the level of average ad
valorem trade costs for sea and air and by each of the indexes outlined above. Tables 3 and
4 report the rankings for ASEAN-6 countries for air and sea freighted exports respectively.
Spearman rank correlation tests for airfreighted goods confirm that the rankings are not
independent and are statistically significant for all ranking pairs except for the CPI ranking.
On the other hand, for sea-transported goods, the rankings are statistically independent only
for the CPI – trade costs pair of rankings.
This index is measured on a scale from 0 – 10,
with a higher number indicating less corruption.
6
(62), Philippines (82), Viet Nam (89) and Cambodia (91). Laos, Myanmar and Brunei were not included in the survey and therefore not included in the econometric analysis. 4 Of the ASEAN countries, Singapore ranks 2nd overall, Malaysia (19), Thailand (35), Brunei (39), Cambodia (82), Philippines (94), Indonesia (96) and Viet Nam (98). Laos and Myanmar were not represented. 5 Singapore ranks 4th, Thailand (40), Malaysia (47), Viet Nam (121), Indonesia (126), Philippines (141), Laos (151), Cambodia (166) and Myanmar (178). 6 Results of the tests are available upon request.

133
Table 3: 2008 Rankings for air freighted goods.
Country
Ad valorem
Trade costs
Enabling
Trade index Overall
infrastructure
Corruptions Perceptions
Index Air
infrastructure
SGP 1 1 1 1 1 MYS 2 2 2 2 2 PHL 3 5 4 6 5 THA 4 3 3 3 3 IDN 5 4 5 5 4
VNM 6 6 6 4 6
Table 4: 2008 Rankings for sea freighted goods.
Country
Ad valorem trade costs
Enabling Trade index
Overall infrastructure
Corruptions Perceptions
Index
Port
infrastructure
SGP 1 1 1 1 1 MYS 2 2 2 2 2 VNM 3 6 8 4 8 THA 4 3 3 3 4 PHL 5 5 6 6 6 IDN 6 4 7 5 7
Table 5 presents regression results using 2008 data for ASEAN countries. Three
models are estimated each of which take the different institution/infrastructure variables
into consideration. For each model, three different equations are estimated; one which
includes the full sample and two models where the sample is split into goods arriving by
sea and goods arriving by air.7
7 The reported data does not include 6-digit product groups which are not traded (zero flows) and as such the omitted trade flows may represent goods whose trade costs are prohibitively high. If this is correct, then our estimates are likely biased downwards.
The results show that distance has the expected positive
sign and is statistically significant at the one percent level in all specifications, but has a
larger impact on goods arriving by air than on sea-shipped imports. The value to weight
ratio, which captures the degree of bulkiness of an imported product, is also statistically
significant in all equations, but has a larger impact on ad valorem trade costs for goods

134
arriving by sea. The size of bilateral imports is statistically negative in all models, pointing
to the presence of scale effects.8 For a 10 percent rise in bilateral imports, estimated trade
costs decrease by between 0.8 and 0.9 percent. This scale effect captures reduced transport
costs from higher volumes on a particular route as well as enhanced trade facilitation efforts
of important trading partners. The mode of transport, captured by a dummy variable equal
to unity for sea and zero for air indicates that sea transport is less expensive than air
transport, on average on a per value basis. The differences in coefficient values and in
goodness of fit measures (R2
In columns 1 to 3, we find that the Enabling Trade Index is negatively related to
trade costs for seaborne imports but not for airborne imports. This suggests that trade-
enabling measures may be better directed toward trade arriving by sea since the vast
majority of trade occurs by containerized vessels, and appears to not matter for goods
arriving by air. For the models where infrastructural quality is included, there are mixed
results. While it matters for seaborne trade, the sign is unexpectedly positive for airborne
trade. The simple correlation between infr and log(adval) is negative suggesting there may
be some multicollinearity in the model. Using the Transparency International measure, cpi,
the quality of institutions matters for seaborne trade but not for airborne, which is in
contrast to Sourdin and Pomfret (2009) who found that for all exporters into Australia
institutional quality mattered for airborne trade but not seaborne.
) indicate that not only the level of trade costs but also their
determinants differ according to mode of transport.
8 It is possible that the volume of imports is endogenous in a trade cost equation since higher trade volumes act to reduce trade and transport costs and higher trade costs reduce the volume of trade. Due to the lack of a suitable instrument we were not able to deal with this potential source of endogeneity bias. In addition, GMM estimation was performed with not appreciable differences in results.

135
Table 5: Baseline regressions, 2008. Dependent variable: Log (1) (2) (3) (4) (5) (6) (7) (8) (9) Sea only Air only Full sample Sea only Air only Full sample Sea only Air only Full sample Log(distance) 0.267*** 0.445*** 0.345*** 0.276*** 0.445*** 0.350*** 0.280*** 0.475*** 0.357*** (0.024) (0.055) (0.023) (0.024) (0.056) (0.023) (0.024) (0.056) (0.023) Log(imports) -0.090*** -0.086*** -0.083*** -0.086*** -0.086*** -0.080*** -0.080*** -0.077*** -0.076*** (0.005) (0.007) (0.005) (0.005) (0.007) (0.005) (0.005) (0.007) (0.005) Log(val/wgt) -0.451*** -0.269*** -0.352*** -0.451*** -0.271*** -0.353*** -0.449*** -0.269*** -0.352*** (0.013) (0.016) (0.010) (0.013) (0.016) (0.010) (0.013) (0.016) (0.010) ETI -0.078*** 0.015 -0.036*** (0.011) (0.015) (0.009) sea -1.400*** -1.401*** -1.406*** (0.021) (0.020) (0.020) infr -0.030*** 0.026*** -0.009* (0.006) (0.009) (0.005) cpi -0.027*** 0.001 -0.014*** (0.004) (0.005) (0.003) Constant -2.301*** -3.719*** -2.205*** -2.686*** -3.766*** -2.427*** -2.863*** -4.132*** -2.575*** (0.284) (0.564) (0.264) (0.284) (0.567) (0.265) (0.280) (0.570) (0.262) R-squared 0.212 0.111 0.306 0.208 0.109 0.304 0.210 0.107 0.304 N 16202 11337 27539 16252 11374 27626 16302 11403 27705
Notes: * p<0.1, ** p<0.05, *** p<0.01. 2008. ASEAN exports to all importers in the sample. All models estimated with product fixed effects.
Robust standard errors in parentheses.
cif − fob( ) fob( )

136
We next estimate a model which includes the full sample and control for
country and product unobserved heterogeneity, scale captured by imports and
bulkiness accounted for by the value to weight ratio. Table 6 reports panel fixed
effects regression for the entire panel for 1990-2008. Controlling for country-pair-
product fixed effects will capture any country-pair-product related characteristic –
the fact that a particular country-pair-product combination will be unique. The
estimating equation includes as explanatory variables the value/weight ratio of each
commodity and the total exports of each country to the importing country, as well as
year fixed effects. The negative and statistically significant time dummies in Table 6
indicate the declining trade costs associated on average with exports to the USA,
Australia, Chile and Brazil over the period 1990-2008. In general, the year dummy
coefficients are becoming more negative over time which is evidence that ad valorem
trade costs on average are decreasing over time.

137
Table 6: Panel Regressions,1990-2008: Dependent variable: Log sea air all Log(value/weight) -0.383*** -0.266*** -0.315*** (0.001) (0.001) (0.000) Log(imports) -0.057*** -0.062*** -0.069*** (0.000) (0.000) (0.000) 1991 0.003 0.020*** 0.010*** (0.003) (0.003) (0.002) 1992 -0.026*** 0.016*** -0.008*** (0.003) (0.003) (0.002) 1993 -0.058*** -0.009*** -0.033*** (0.003) (0.003) (0.002) 1994 -0.071*** -0.003 -0.036*** (0.003) (0.003) (0.002) 1995 -0.085*** 0.013*** -0.034*** (0.003) (0.003) (0.002) 1996 -0.147*** -0.070*** -0.110*** (0.003) (0.003) (0.002) 1997 -0.185*** -0.075*** -0.127*** (0.003) (0.003) (0.002) 1998 -0.222*** -0.079*** -0.146*** (0.003) (0.003) (0.002) 1999 -0.240*** -0.085*** -0.157*** (0.003) (0.003) (0.002) 2000 -0.222*** -0.120*** -0.165*** (0.003) (0.003) (0.002) 2001 -0.228*** -0.122*** -0.168*** (0.003) (0.003) (0.002) 2002 -0.294*** -0.098*** -0.189*** (0.003) (0.003) (0.002) 2003 -0.297*** -0.047*** -0.165*** (0.003) (0.003) (0.002) 2004 -0.250*** -0.033*** -0.133*** (0.003) (0.003) (0.002) 2005 -0.213*** -0.023*** -0.110*** (0.003) (0.003) (0.002) 2006 -0.255*** -0.020*** -0.129*** (0.003) (0.003) (0.002) 2007 -0.271*** 0.055*** -0.098*** (0.003) (0.003) (0.002) 2008 -0.242*** 0.128*** -0.045*** (0.003) (0.003) (0.002) sea -1.145*** (0.001) Constant -1.500*** -0.910*** -0.512*** (0.004) (0.004) (0.003) R-squared 0.036 -0.047 0.226 N 3006474 3059572 6066046
Notes: Full sample 1990-2008. Country pair-product fixed effects. * p<0.1, ** p<0.05, *** p<0.01. Robust standard errors in parentheses.
cif − fob( ) fob( )
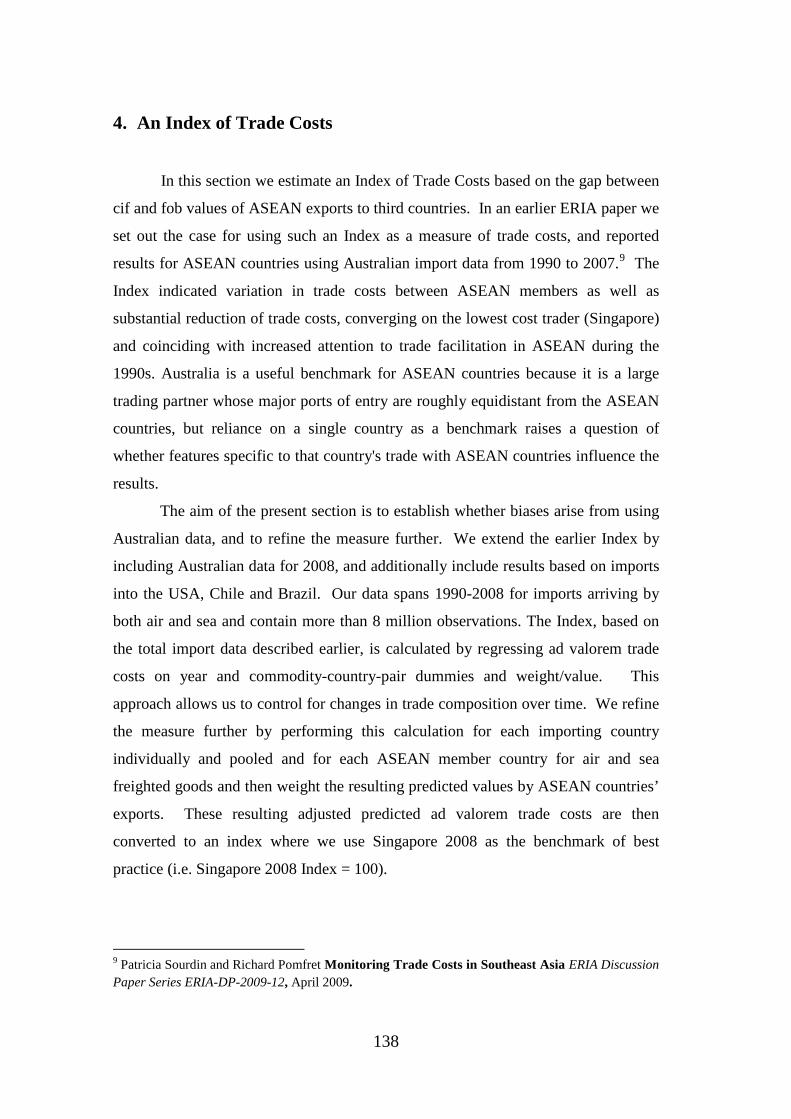
138
4. An Index of Trade Costs
In this section we estimate an Index of Trade Costs based on the gap between
cif and fob values of ASEAN exports to third countries. In an earlier ERIA paper we
set out the case for using such an Index as a measure of trade costs, and reported
results for ASEAN countries using Australian import data from 1990 to 2007.9
9 Patricia Sourdin and Richard Pomfret Monitoring Trade Costs in Southeast Asia ERIA Discussion Paper Series ERIA-DP-2009-12, April 2009.
The
Index indicated variation in trade costs between ASEAN members as well as
substantial reduction of trade costs, converging on the lowest cost trader (Singapore)
and coinciding with increased attention to trade facilitation in ASEAN during the
1990s. Australia is a useful benchmark for ASEAN countries because it is a large
trading partner whose major ports of entry are roughly equidistant from the ASEAN
countries, but reliance on a single country as a benchmark raises a question of
whether features specific to that country's trade with ASEAN countries influence the
results.
The aim of the present section is to establish whether biases arise from using
Australian data, and to refine the measure further. We extend the earlier Index by
including Australian data for 2008, and additionally include results based on imports
into the USA, Chile and Brazil. Our data spans 1990-2008 for imports arriving by
both air and sea and contain more than 8 million observations. The Index, based on
the total import data described earlier, is calculated by regressing ad valorem trade
costs on year and commodity-country-pair dummies and weight/value. This
approach allows us to control for changes in trade composition over time. We refine
the measure further by performing this calculation for each importing country
individually and pooled and for each ASEAN member country for air and sea
freighted goods and then weight the resulting predicted values by ASEAN countries’
exports. These resulting adjusted predicted ad valorem trade costs are then
converted to an index where we use Singapore 2008 as the benchmark of best
practice (i.e. Singapore 2008 Index = 100).

139
Table A3 reproduces the Index using Australian data.10
Table A4 reports the Index using US data for 1990-2008. The trade flows are
largest in the US dataset and, apart from Myanmar, this is reflected in more plausible
Index numbers for the other nine ASEAN countries as well as being able to calculate
an index for the smaller nations. For Brunei, Cambodia and Vietnam the Index is
volatile in the 1990s when trade with the USA was low, but it indicates a steady and
substantial reduction in trade costs by both modes after the turn of the century when
larger and more stable trade links become established.
For the five founder
members of ASEAN there is a clear pattern of falling trade costs over the period
1990-2008, with convergence towards the least-cost country, Singapore (Figure A2),
although relative to Singapore in 2008 the Philippines exhibits a level that is
significantly higher than the rest. The ranking among the ASEAN5 differs slightly by
mode, with Indonesia and Philippines having the highest costs for both air and
maritime transport and Malaysia jumping to first-ranked for air freight. Surprisingly,
after very high and volatile levels in the 1990s, the index for Vietnam exhibits
relatively low levels in 2008. Generally, air trade costs are more volatile than
maritime trade costs and they have a very high level initially relative to Singapore
2008. They eventually settle down but remain significantly higher than the reference
period. The Index was unable to be calculated for the newer, smaller ASEAN
members, Brunei, Laos and Myanmar, which reflects the disadvantage of smaller
datasets and fewer trade flows.
11
Table A5 reports the Index using Chilean data for 1990-2008. The results for
some ASEAN members are extremely high and volatile, (e.g. costs for Indonesia in
the early 90s associated with exporting by sea and air) and sometimes implausibly
For airborne freight the
ASEAN5 the US-based Index gives similar results to those reported above.
Singapore has the lowest trade costs, followed by Malaysia, while Indonesia has the
highest trade costs and Thai and Philippine trade costs lie between those of Malaysia
and Indonesia (Figure A3).
10 Table A3 is comparable to Appendix Table A2 in our earlier paper, apart from that the base is now 2008 instead of 2007 and we distinguish between air and sea because the econometric analysis reported in the previous section indicates significant differences in the size and determinants of trade costs according to the mode of transport. 11 The only exception to this generalization is the Index of Laotian trade costs associated with airborne exports which increases sharply between 2005 and 2008.

140
low (e.g. the cost of exporting by sea from Thailand, Vietnam and Malaysia are more
than half those of Singapore in 2008). Even for the ASEAN5 the Index exhibits
larger year-on-year fluctuations than are desirable in an index of the ASEAN
countries trade costs (Figure A4).
Table A6 reports the Index using Brazilian data for 1990-2008. For the
smaller ASEAN countries (Cambodia, Laos and Myanmar) the problem of too few
observations is pronounced as seen earlier. For the ASEAN5, however, the Brazil-
based Index presents a similar picture to the Australia-based Index, especially after
the mid-1990s when Brazil's outward-oriented economic reforms became firmly-
entrenched and Brazil emerged as one of the fast-growing large economies (BRICs).
For the ASEAN5 as a group the variance is much smaller in the 2000s than in the
1990s (Figure A5).
Two conclusions emerge from the above results. First, because reported cif-
fob gaps on individual transactions contain much "noise" from misreporting or
idiosyncratic features, the Index for an individual ASEAN country becomes more
useful when based on a larger number of observations in each commodity category.
The Index numbers for the five more recent members are less firmly based than those
for the ASEAN5, but they are becoming more useful as trade of the smaller ASEAN
countries increases and are more reliable guides post-2000 than before 2000 and for
Vietnam than for Cambodia, Laos or Myanmar. Second, in selecting an appropriate
importing country, there is little choice because few countries collect the required
data and the trade flows of even a mid-sized trading nation such as Chile appear to be
too small for our purposes.
An alternative approach to using individual importing country data is to pool
the over eight million observations in our dataset.12
12 An observation is the exports of goods in an HS 6-digit category from a country to one of the four reporting countries. Each observation has equal weight; more US observations enter into the Index and there are fewest Chilean observations.
Table 7a and 7b present the
Index of trade costs for air and sea freight with Singapore 2008 as the base. The
values indicate the falling trend of trade costs in ASEAN countries by both transport
modes (apart from air freight from Cambodia and Laos), which can be seen as
convergence to regional best practice, represented by Singapore. The pattern is
clearest for the five original ASEAN members (Figures 4a and 5a) and for Viet Nam.

141
For the four smaller trading ASEAN nations, the Index is more volatile (Figures 4b
and 5b) and less reliable due to the smaller volume of exports for those countries.
Table 7: Index of Trade Costs, adjusted for country and product effects and
weight/value (Singapore 2008 = 100). Table 7a: Import-weighted Sea Freight index
Table 7b: Import-weighted Air freight index Year BRN IDN KHM LAO MMR MYS PHL SGP THA VNM 1990 143 444 439 180 148 191 113 153 159 1991 266 498 162 149 197 115 157 574 1992 141 482 26 353 138 178 109 164 335 1993 172 514 172 119 145 165 115 157 50 1994 122 484 169 295 134 153 106 159 314 1995 260 390 648 457 1446 116 137 104 150 542 1996 237 377 835 314 351 113 130 99 153 520 1997 252 322 325 185 139 112 125 94 156 291 1998 108 215 379 144 12 99 98 97 145 500 1999 370 282 420 233 1 90 99 94 156 454 2000 348 272 386 284 1 88 95 90 155 467 2001 435 241 320 325 36 101 99 88 155 531 2002 377 257 530 298 41 108 114 96 188 505 2003 477 190 529 259 3 101 101 93 158 492 2004 378 255 532 179 23 96 121 94 149 511 2005 408 256 540 48 28 97 119 88 149 462 2006 168 241 459 47 18 90 118 75 147 413 2007 292 247 522 81 37 118 128 84 161 445 2008 130 251 568 455 85 121 143 100 157 418
Notes: Index controls for commodity-country-pair effects (commodity composition) and weight/value. The index is weighted by the value of bilateral ASEAN exports.
Year BRN IDN KHM LAO MMR MYS PHL SGP THA VNM 1990 2302 1433 454 700 768 462 540 258 447 555 1991 606 1060 744 1443 381 504 212 447 1723 1992 60 864 517 476 666 347 471 233 401 483 1993 249 904 509 410 523 301 434 257 419 280 1994 201 907 402 536 345 287 402 245 393 689 1995 123 777 829 84 367 295 418 204 355 479 1996 232 692 537 350 462 289 400 174 332 924 1997 155 585 327 299 331 289 355 190 301 481 1998 1714 648 314 187 246 325 373 227 341 593 1999 1865 688 344 244 265 316 384 212 453 402 2000 829 719 308 344 213 337 423 229 437 301 2001 734 557 291 374 318 311 394 177 413 402 2002 367 527 261 368 287 271 377 177 381 320 2003 576 531 252 252 348 281 381 132 398 333 2004 409 615 270 462 461 320 415 129 434 381 2005 347 574 260 413 385 316 411 136 427 383 2006 320 506 256 264 389 285 367 108 385 327 2007 234 480 251 434 255 272 370 114 322 306 2008 39 449 243 341 222 255 398 100 312 302

142
Figure 4a: Index of Trade Costs for Air Freight, adjusted for country and product effects, 1990-2008, ASEAN 5 (Singapore 2008=100)
Figure 4b: Index of Trade Costs for Air Freight, adjusted for country and product effects, 1990-2008, CLMV & Brunei (Singapore 2008=100)
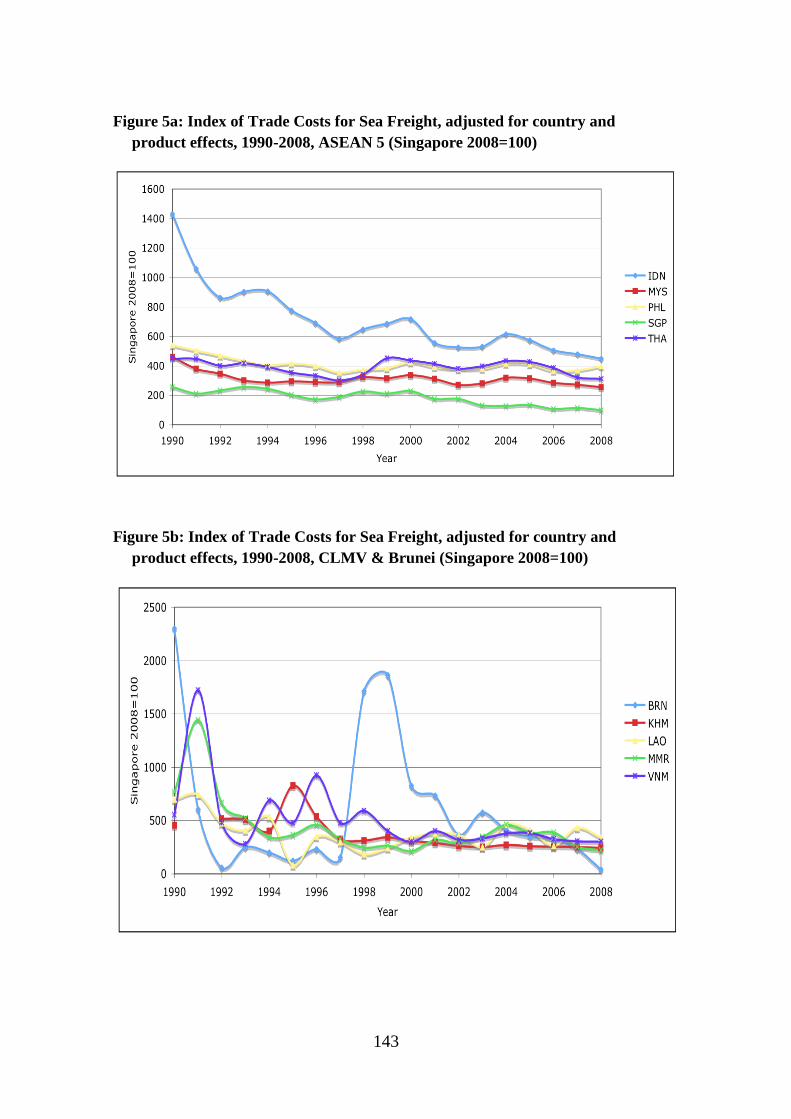
143
Figure 5a: Index of Trade Costs for Sea Freight, adjusted for country and product effects, 1990-2008, ASEAN 5 (Singapore 2008=100)
Figure 5b: Index of Trade Costs for Sea Freight, adjusted for country and product effects, 1990-2008, CLMV & Brunei (Singapore 2008=100)
144
5. The Scorecard Approach and the Index of Trade Costs
Compared
At the January 2007 Cebu Summit ASEAN members committed to creating an AEC
by 2015. The AEC was given more concrete form in November 2007 with approval
of the AEC Blueprint and signing of the ASEAN Charter which enhances the legal
status of the AEC. ASEAN members agreed to a Scorecard approach to checking
their individual progress in meeting targets and deadlines set out in the Blueprint.
In establishing the AEC, agreements need to be concluded and ratified,
institutions must be established, infrastructure put in place, and so forth. Individual
member countries must be accountable for completing actions at the appropriate time,
and some kind of Scorecard or account-keeping is essential. The Scorecard indicates
whether governments have implemented specific measures, such as mutual
recognition agreements, or ratified ASEAN decisions. Such legal or administrative
decisions are critical to establish a solid foundation for the kind of integration
envisaged in the AEC, and the target date of 2015 requires fairly rapid progress.
The broad categories identified in the AEC Blueprint (creating a single
market, creating a competitive region, fostering equitable economic development and
working towards ASEAN-centrality in external economic relations) provide a
reasonable taxonomy for dividing up the Scorecard. To become operational,
however, more specific measures must be identified which can checked off as they
are completed. Not all measures will be equally important, and they will not be
identified with equal precision, introducing some subjectivity in reporting when a
measure has actually been fully implemented.
These characteristics define the strengths and weaknesses of the Scorecard
approach. A Scorecard provides an essential checklist of measures completed,
providing a reminder to countries that are not keeping up. At the same time, if
countries become concerned about achieving good scores, there is endless
opportunity for disputing the results. Any appearance of a "league table“ is likely to
lead to argument especially by countries scoring below average, who can point to the
measures they have achieved being the more important ones or can imply that other
countries' completion of an action is superficial rather that fully realized.

145
An overarching problem with the Scorecard approach in the ASEAN context
is that it challenges ASEAN traditions of consensus and avoidance of finger-pointing.
Publishing a Scorecard, with the inevitable summaries and adding up percentage
success rates for each country, is confronting for countries which score below
average - as some must. A low score may be the result of very specific
implementation failures, even if a country has made substantial progress in trade
facilitation, while a relatively high-scoring country may retain practices that are
inimical to the AEC concept, but are not on the list of measures to be implemented
during the year in question. Because the definition of successful implementation is
imprecise for some measures, time will be wasted arguing about the numbers, rather
than addressing substantive integration issues.
The Index of Trade Costs developed in the previous sections is
complementary to the Scorecard approach. The Index provides a simple indicator of
trade costs, which can be used to show progress in trade facilitation and assess
proximity to regional or global best practice. As a single measure, it has the political
advantage over any aggregate score derived from the Scorecard in that the Index is
calculated from an independent external source with little scope for manipulation by
national policymakers to improve their country's standing.13
6. Policy Implications
The Index of Trade Costs developed in this paper and the Scorecard approach
endorsed by ASEAN member countries are complementary. Each has a strength,
which can be used in monitoring progress in creating the AEC, but neither is
adequate on its own.
The Index of Trade Costs provides a scalar measure of trade costs, which
over time indicates success in trade facilitation and can be used to assess proximity
to regional or global best practice. It is an excellent, best of its type, simple indicator.
However, as with all simple measures it must be treated with care, because the 13 There is scope for subjectivity in selecting which trading partner to use in calculating cif-fob rations and which factors (distance, commodity composition, and so forth) to control for, but the tables suggest that such design choices will not influence the results greatly.

146
results vary depending on precisely how commodity composition and so forth are
controlled for and on which importing country dataset is used. The econometric
analysis in Section 2 indicates the need to distinguish between trade costs associated
with different modes of transport, but beyond that the qualitative results about the
determinants of trade costs are robust.
The Index measures reported in Section 3 highlight the need for very large
datasets in order to produce trustworthy results. Pooling data from all available
importing-country sources may be the best way to address this requirement, but that
is data-intensive work. For ASEAN purposes our conclusion is that the Australian
data are sufficiently plentiful and unbiased to provide a good foundation for an Index
of Trade Costs.
The Index has the political advantage of being from an independent source.
The currently usable datasets are from Australasia, Latin America and the USA and
calculating the Index is a technical exercise. There is, as just mentioned, some
variation depending on the choice of data and the specific technique, but the results
do not change much. In sum, there is little scope for manipulation by national
policymakers to improve their country's standing.
The strength of the Scorecard approach lies in revealing whether governments
have implemented specific measures, such as mutual recognition agreements, or
ratified ASEAN decisions. Such legal or administrative decisions are critical to
establish a solid foundation for the kind of integration envisaged in the AEC, and the
target date of 2015 requires fairly rapid progress.
The Scorecard approach is, however, poorly suited to providing a simple
measure of progress in implementation. As it stands the four categories identified in
the Blueprint, and their sub-categories, provide a reasonable list, but once these are
replaced by more specific measures for implementation there is a serious problem of
heterogeneity; not all measures are equally important, and some may be reported
having been implemented when the action is superficial. Any attempt to synthesize
the Scorecard into a single grade, such as 40/67 (or 60% or B+) will be controversial,
because no country wants to be below-average. To avoid being below-average
countries can focus on scoring easy points or exaggerate their progress on less

147
concrete measures, but this undermines the whole purpose of a Scorecard as an
objective indicator of actions completed.
The Scorecard should be used as a checklist of measures completed, avoiding
any appearance of a "league table" and providing a reminder to countries that are not
keeping up with the group. This kind of monitoring is essential as ASEAN moves
towards creation of the AEC. The Scorecard is, however, not a measure of overall
progress in integration. Any confusion could perhaps have been pre-empted by
referring to the approach as a Checklist rather than a Scorecard.
It is desirable to have an indicator of which member country provides the
benchmark of best practice in reducing trade costs, and of the extent to which other
countries are converging towards best practice and of movements in the benchmark.
The desire for an aggregate indicator of progress towards integration lies behind the
natural instinct to summarize the Scorecard into an aggregate grade, despite the
conceptual and political flaws in such aggregation. That is precisely where the Index
of Trade Costs is useful. The Index provides an objective measure of progress in
trade facilitation, which is a reasonable proxy for economic integration.
Future research in monitoring ASEAN progress in trade facilitation should
investigate the role and policy implications of the quality of logistics services since
these can be directly influenced by policy. In addition, analysis of the existence of
restrictive and anti-competitive practices in the transport services sector and their
impact on trade costs for maritime and air services should be an important focus.
References Clark, Ximena, David Dollar and Alejandro Micco (2004) “Port efficiency, maritime
transport costs, and bilateral trade.” Journal of Development Economics no. 75.
Fink, Carsten, Aaditya Mattoo and Ileana Cristina Neagu (2002) “Trade in
International Maritime Services: How Much Does Policy Matter?” The World
Bank Economic Review, vol. 16.
Hummels, David (2007) “Transportation Costs and International Trade in the Second
Era of Globalization.” Journal of Economic Perspectives, volume 21, issue 3:
131-154

148
Hummels, David, Volodymyr Lugovskyy and Alexandre Skiba (2009) “The Trade
Reducing Effects of Market Power in International Shipping”, Journal of
Development Economics, Volume 89 (1): 84-97.
Korinek, Jane, and Patricia Sourdin (2009) “Determinants of Maritime Transport
Costs.” OECD working paper, TAD/TC/WP(2009).
Micco, Alejandro and Natalia Pérez (2002) “Determinants of Maritime Transport
Costs.” IADB Working Paper 441.
Mirza, Daniel and Habib Zitouna (2009) “Oil Prices, Geography and Endogenous
Regionalism.” mimeo, CEPII, Paris.
Moreira, Mauricio Mesquita, Christian Volpe and Juan S. Blyde (2008) “Unclogging
the Arteries: The Impact of Transport Costs on Latin American and Caribbean
Trade.” Inter-American Development Bank, Washington.
Sourdin, Patricia, and Richard Pomfret (2009) “Monitoring Trade Costs in
Southeast Asia.” ERIA Discussion Paper Series ERIA-DP-2009-12.
Wilmsmeier, Gordon, and Jan Hoffmann (2008) “Liner shipping connectivity and
port infrastructure as determinants of freight rates in the Caribbean.” Maritime
Economics and Logistics, no. 10: 130-151.
Wilmsmeier, Gordon, Jan Hoffmann and Ricardo Sanchez (2006) “The impact of
port characteristics on international maritime transport costs.” published in K.
Cullinane and W. Talley, eds., “Port Economics”, Research in Transportation
Economics, vol. 16, Elsevier.

149
APPENDIX
Table A1: Average trade costs by importing country. Import weighted. 1990-2008. USA BRAZIL AUSTRALIA CHILE
YEAR ALL ASEAN AIR SEA ALL ASEAN AIR SEA ALL ASEAN AIR SEA ALL ASEAN AIR SEA
1990 0.05 0.05 0.04 0.053 0.087 0.181 0.068 0.1 0.08 0.085 0.066 0.086 0.093 0.142 0.087 0.096
1991 0.049 0.048 0.039 0.052 0.092 0.158 0.071 0.105 0.076 0.079 0.058 0.084 0.101 0.098 0.089 0.107
1992 0.045 0.045 0.037 0.048 0.084 0.149 0.064 0.097 0.075 0.073 0.062 0.08 0.096 0.105 0.083 0.101
1993 0.045 0.042 0.036 0.049 0.081 0.086 0.073 0.089 0.073 0.071 0.061 0.077 0.093 0.1 0.08 0.096
1994 0.045 0.04 0.034 0.049 0.074 0.111 0.074 0.079 0.07 0.066 0.058 0.075 0.088 0.104 0.083 0.091
1995 0.044 0.036 0.032 0.05 0.083 0.081 0.104 0.082 0.067 0.058 0.056 0.072 0.086 0.106 0.082 0.089
1996 0.04 0.033 0.029 0.045 0.065 0.074 0.069 0.066 0.066 0.055 0.053 0.071 0.081 0.108 0.082 0.082
1997 0.039 0.032 0.029 0.045 0.061 0.069 0.067 0.063 0.066 0.057 0.054 0.071 0.08 0.101 0.081 0.081
1998 0.042 0.034 0.028 0.049 0.059 0.075 0.059 0.062 0.064 0.057 0.047 0.072 0.083 0.126 0.072 0.084
1999 0.043 0.042 0.028 0.052 0.054 0.074 0.056 0.055 0.056 0.049 0.041 0.063 0.084 0.128 0.067 0.084
2000 0.043 0.043 0.027 0.053 0.055 0.073 0.053 0.057 0.057 0.055 0.04 0.064 0.081 0.135 0.065 0.083
2001 0.043 0.044 0.025 0.052 0.057 0.067 0.052 0.059 0.057 0.06 0.04 0.064 0.085 0.13 0.065 0.085
2002 0.042 0.044 0.029 0.049 0.053 0.059 0.055 0.052 0.051 0.046 0.038 0.056 0.082 0.136 0.065 0.08
2003 0.046 0.045 0.028 0.055 0.053 0.045 0.056 0.051 0.051 0.052 0.037 0.057 0.078 0.108 0.066 0.074
2004 0.048 0.047 0.029 0.056 0.058 0.062 0.058 0.057 0.055 0.06 0.04 0.062 0.082 0.136 0.065 0.084
2005 0.046 0.046 0.028 0.054 0.055 0.056 0.054 0.055 0.055 0.054 0.039 0.061 0.075 0.16 0.064 0.075
2006 0.043 0.044 0.026 0.049 0.049 0.048 0.055 0.047 0.051 0.047 0.037 0.057 0.071 0.122 0.063 0.068
2007 0.04 0.042 0.026 0.046 0.05 0.052 0.059 0.048 0.049 0.043 0.036 0.054 0.073 0.129 0.066 0.072
2008 0.038 0.043 0.026 0.043 0.053 0.054 0.065 0.051 0.049 0.042 0.036 0.053 0.078 0.135 0.087 0.076

150
Figure A1a: Average trade costs, US imports, 1990-2008
Figure A1b: Average trade costs, Brazil imports, 1990-2008.

151
Figure A1c: Average trade costs, Australian imports, 1990-2008
Figure A1d: Average trade costs, Chilean imports, 1990-2008

152
Table A2: Average ad valorem Trade Costs; Selected Asian Economies, 1990-2008
Exporter 1990 1991 1992 1993 1994 1995 1996 1997 1998 1999 2000 2001 2002 2003 2004 2005 2006 2007 2008
AFG 0.068 0.029 0.053 0.072 0.043 0.059 0.086 0.132 0.059 0.114 0.244 0.080 0.207 0.118 0.010 0.005 0.014 0.030 0.029
BGD 0.104 0.095 0.085 0.077 0.076 0.072 0.060 0.062 0.056 0.072 0.077 0.063 0.072 0.069 0.072 0.072 0.070 0.059 0.064
BRN 0.072 0.073 0.056 0.056 0.036 0.045 0.042 0.040 0.063 0.069 0.062 0.072 0.058 0.061 0.070 0.047 0.043 0.035 0.036
BTN 0.050 0.173 0.053 0.080 0.185 0.118 0.106 0.046 0.077 0.085 0.079 0.095 0.153 0.038 0.060 0.085 0.039 0.030 0.101
CHN 0.074 0.073 0.070 0.071 0.069 0.067 0.059 0.055 0.058 0.074 0.076 0.071 0.067 0.072 0.072 0.069 0.064 0.061 0.058
HKG 0.051 0.051 0.050 0.049 0.050 0.050 0.044 0.042 0.042 0.047 0.048 0.046 0.049 0.051 0.053 0.049 0.045 0.046 0.044
IDN 0.102 0.102 0.085 0.083 0.079 0.073 0.067 0.066 0.070 0.081 0.082 0.080 0.074 0.074 0.081 0.079 0.069 0.064 0.059
IND 0.075 0.076 0.078 0.076 0.071 0.065 0.061 0.057 0.056 0.057 0.060 0.060 0.056 0.057 0.058 0.058 0.055 0.047 0.049
IRN 0.091 0.132 0.117 0.141 0.085 0.083 0.069 0.059 0.074 0.068 0.042 0.045 0.046 0.049 0.037 0.036 0.047 0.038 0.054
IRQ 0.094 0.105 0.514 0.018 0.228 0.109 0.134 0.076 0.066 0.086 0.055 0.071 0.079 0.066 0.056 0.042 0.045
ISR 0.030 0.029 0.027 0.026 0.026 0.024 0.022 0.022 0.021 0.020 0.021 0.018 0.019 0.022 0.023 0.019 0.017 0.017 0.018
JOR 0.101 0.132 0.088 0.145 0.164 0.174 0.125 0.232 0.250 0.060 0.072 0.057 0.062 0.047 0.048 0.043 0.048 0.041 0.041
JPN 0.042 0.042 0.036 0.034 0.032 0.033 0.027 0.028 0.030 0.030 0.031 0.028 0.029 0.030 0.032 0.031 0.031 0.031 0.034
KAZ 0.146 0.068 0.122 0.047 0.055 0.023 0.057 0.051 0.043 0.038 0.042 0.044 0.057 0.059 0.042 0.033 0.030
KGZ 0.059 0.065 0.032 0.023 0.020 0.034 0.064 0.141 0.090 0.045 0.135 0.066 0.060 0.149 0.079 0.082 0.061
KHM 0.176 0.013 0.029 0.096 0.067 0.077 0.064 0.066 0.062 0.072 0.066 0.057 0.070 0.058 0.063 0.061 0.064 0.055 0.056
KOR 0.045 0.045 0.043 0.043 0.041 0.035 0.034 0.035 0.042 0.043 0.039 0.041 0.040 0.040 0.039 0.043 0.043 0.042 0.043
LAO 0.104 0.033 0.075 0.065 0.074 0.080 0.073 0.057 0.051 0.053 0.076 0.066 0.060 0.072 0.088 0.033 0.029 0.051 0.048
LBN 0.042 0.052 0.054 0.061 0.069 0.055 0.050 0.045 0.035 0.056 0.047 0.042 0.083 0.052 0.079 0.071 0.070 0.060 0.045
LKA 0.083 0.085 0.089 0.077 0.075 0.068 0.062 0.058 0.053 0.067 0.072 0.059 0.063 0.066 0.064 0.065 0.065 0.056 0.057
MAC 0.057 0.058 0.051 0.052 0.052 0.051 0.046 0.043 0.039 0.050 0.052 0.047 0.062 0.055 0.059 0.057 0.050 0.045 0.045
MDV 0.072 0.059 0.070 0.082 0.089 0.073 0.082 0.090 0.112 0.056 0.065 0.054 0.069 0.038 0.047 0.048 0.420 0.613 0.115
MMR 0.049 0.084 0.046 0.042 0.046 0.048 0.053 0.057 0.058 0.061 0.051 0.043 0.044 0.043 0.048 0.054 0.045 0.045 0.050
MNG 0.059 0.061 0.057 0.089 0.096 0.073 0.078 0.068 0.072 0.102 0.083 0.063 0.063 0.062 0.057 0.063 0.063 0.053 0.046

153
MYS 0.050 0.047 0.041 0.038 0.035 0.032 0.031 0.031 0.031 0.033 0.035 0.036 0.032 0.032 0.035 0.032 0.030 0.031 0.032
NPL 0.205 0.208 0.225 0.213 0.176 0.134 0.121 0.115 0.105 0.098 0.106 0.091 0.090 0.090 0.097 0.088 0.090 0.087 0.091
PAK 0.078 0.077 0.078 0.078 0.072 0.067 0.065 0.059 0.058 0.075 0.080 0.076 0.077 0.080 0.076 0.075 0.079 0.071 0.067
PHL 0.074 0.071 0.063 0.059 0.055 0.052 0.042 0.036 0.033 0.038 0.039 0.040 0.041 0.043 0.049 0.050 0.047 0.045 0.047
PNG 0.017 0.009 0.013 0.027 0.033 0.032 0.033 0.035 0.041 0.036 0.025 0.034 0.022 0.019 0.018 0.018 0.020 0.015 0.013
PRK 0.097 0.100 0.098 0.090 0.225 0.149 0.084 0.086 0.104 0.097 0.073 0.080 0.070 0.066 0.053 0.077 0.070 0.067 0.069
RUS 0.086 0.066 0.067 0.064 0.057 0.060 0.051 0.040 0.034 0.046 0.050 0.059 0.066 0.061 0.051 0.048 0.046
SGP 0.030 0.028 0.025 0.023 0.023 0.021 0.017 0.018 0.019 0.022 0.022 0.023 0.024 0.027 0.027 0.028 0.026 0.026 0.028
SYR 0.097 0.097 0.093 0.116 0.122 0.172 0.082 0.084 0.060 0.066 0.075 0.056 0.082 0.091 0.110 0.088 0.074 0.078 0.064
THA 0.059 0.057 0.055 0.054 0.050 0.046 0.043 0.039 0.043 0.059 0.062 0.059 0.061 0.061 0.062 0.059 0.055 0.047 0.047
TJK 0.054 0.053 0.040 0.033 0.052 0.026 0.019 0.039 0.064 0.059 0.117 0.053 0.037 0.033 0.024 0.056 0.023
TUR 0.081 0.074 0.070 0.074 0.078 0.073 0.062 0.063 0.055 0.053 0.067 0.068 0.071 0.073 0.079 0.080 0.077 0.065 0.069
TWN 0.054 0.054 0.051 0.050 0.048 0.044 0.040 0.037 0.040 0.047 0.045 0.044 0.042 0.046 0.048 0.047 0.044 0.043 0.043
UZB 0.007 0.071 0.039 0.031 0.045 0.048 0.040 0.057 0.073 0.058 0.056 0.047 0.022 0.020 0.012 0.005 0.004
VNM 0.072 0.127 0.085 0.076 0.087 0.067 0.077 0.073 0.079 0.065 0.069 0.084 0.071 0.077 0.084 0.080 0.072 0.067 0.066
Notes: Average trade costs for all four importers by exporting partner; import weighted.
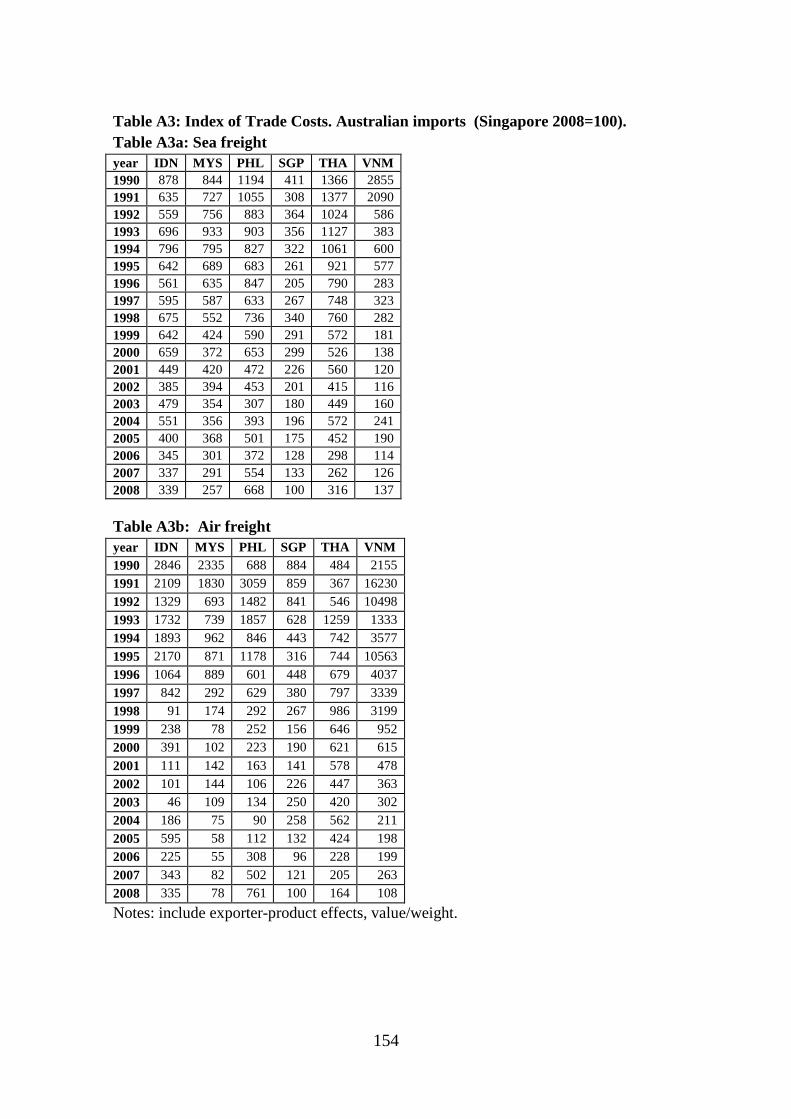
154
Table A3: Index of Trade Costs. Australian imports (Singapore 2008=100). Table A3a: Sea freight year IDN MYS PHL SGP THA VNM 1990 878 844 1194 411 1366 2855 1991 635 727 1055 308 1377 2090 1992 559 756 883 364 1024 586 1993 696 933 903 356 1127 383 1994 796 795 827 322 1061 600 1995 642 689 683 261 921 577 1996 561 635 847 205 790 283 1997 595 587 633 267 748 323 1998 675 552 736 340 760 282 1999 642 424 590 291 572 181 2000 659 372 653 299 526 138 2001 449 420 472 226 560 120 2002 385 394 453 201 415 116 2003 479 354 307 180 449 160 2004 551 356 393 196 572 241 2005 400 368 501 175 452 190 2006 345 301 372 128 298 114 2007 337 291 554 133 262 126 2008 339 257 668 100 316 137 Table A3b: Air freight year IDN MYS PHL SGP THA VNM 1990 2846 2335 688 884 484 2155 1991 2109 1830 3059 859 367 16230 1992 1329 693 1482 841 546 10498 1993 1732 739 1857 628 1259 1333 1994 1893 962 846 443 742 3577 1995 2170 871 1178 316 744 10563 1996 1064 889 601 448 679 4037 1997 842 292 629 380 797 3339 1998 91 174 292 267 986 3199 1999 238 78 252 156 646 952 2000 391 102 223 190 621 615 2001 111 142 163 141 578 478 2002 101 144 106 226 447 363 2003 46 109 134 250 420 302 2004 186 75 90 258 562 211 2005 595 58 112 132 424 198 2006 225 55 308 96 228 199 2007 343 82 502 121 205 263 2008 335 78 761 100 164 108 Notes: include exporter-product effects, value/weight.

155
Figure A2a: Index of Trade Costs, Sea, ASEAN5 (Australian imports; Singapore 2008=100)
Figure A2b: Index of Trade Costs, Air, ASEAN5 (Australian imports; Singapore 2008=100)

156
Table A4: Index of Trade Costs. USA imports (Singapore 2008=100). Table A4a: Sea freight year BRN IDN KHM LAO MYS PHL SGP THA VNM 1990 2545 672 n/a 403 301 306 162 261 n/a 1991 1521 520 n/a 469 223 290 122 247 n/a 1992 165 428 826 347 195 277 130 229 79 1993 320 416 441 292 173 249 141 232 n/a 1994 122 416 487 328 164 233 145 215 978 1995 111 354 610 47 167 246 127 200 552 1996 136 310 292 211 156 221 105 182 904 1997 96 267 221 218 168 198 117 161 592 1998 1424 304 199 138 198 205 137 191 823 1999 1732 360 229 166 228 235 159 288 740 2000 927 354 199 239 258 256 190 292 547 2001 824 300 191 291 228 242 139 252 627 2002 647 307 174 260 194 241 147 246 348 2003 848 333 171 188 227 255 120 277 310 2004 703 336 180 309 266 266 122 287 325 2005 512 312 172 279 257 259 150 283 333 2006 610 277 169 220 235 228 135 273 302 2007 591 254 168 271 229 223 139 238 252 2008 284 240 153 222 219 231 100 224 238 Table A4b: Air freight year BRN IDN KHM LAO MYS PHL SGP THA VNM 1990 153 496 557 233 158 219 108 170 n/a 1991 276 463 n/a 182 157 214 120 171 n/a 1992 137 483 44 421 147 198 110 181 n/a 1993 205 479 146 147 153 180 110 166 n/a 1994 139 451 142 312 134 169 105 168 759 1995 294 371 296 587 121 151 101 156 893 1996 253 355 1079 391 116 146 94 150 684 1997 284 339 373 217 116 132 85 153 448 1998 116 312 450 181 99 102 82 140 727 1999 422 332 491 290 97 104 93 171 714 2000 415 290 456 390 96 101 91 167 779 2001 483 289 380 410 108 111 93 161 812 2002 426 328 613 313 119 128 92 208 688 2003 575 306 577 354 107 112 92 172 628 2004 428 294 605 253 102 132 87 158 605 2005 436 268 620 204 105 121 88 155 525 2006 327 282 523 417 90 123 74 153 482 2007 344 265 568 346 122 138 83 167 529 2008 165 269 586 704 118 150 100 162 489
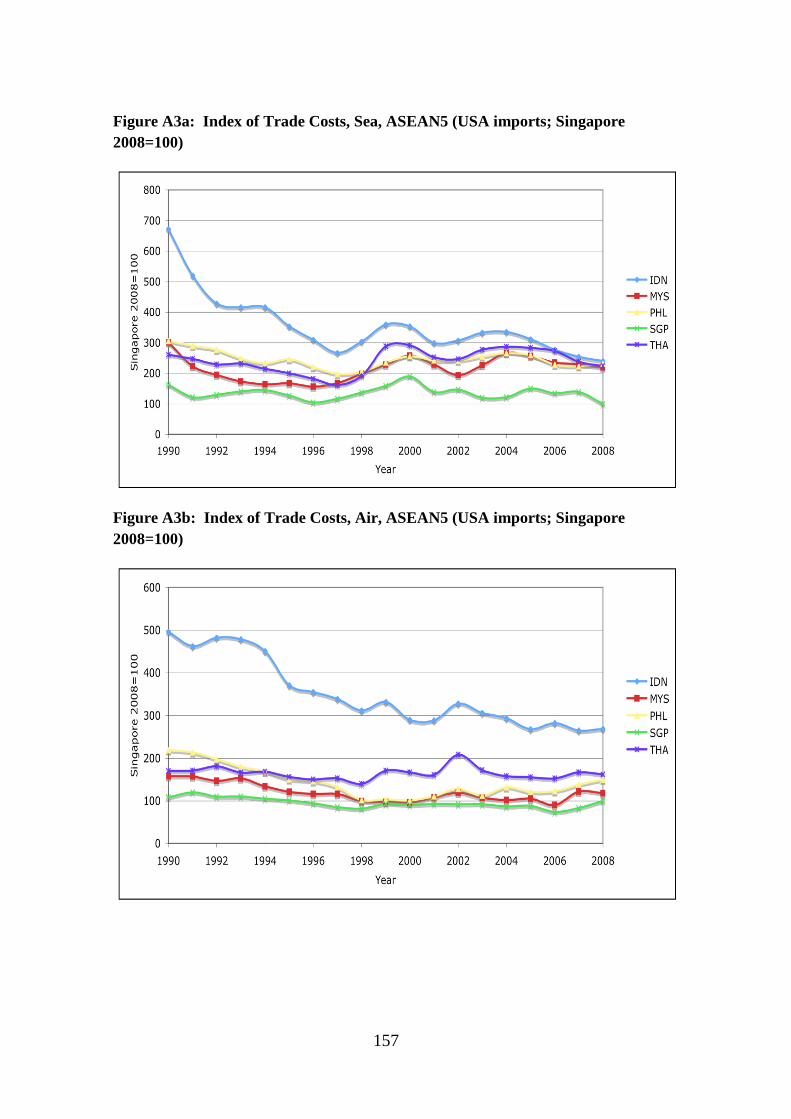
157
Figure A3a: Index of Trade Costs, Sea, ASEAN5 (USA imports; Singapore 2008=100)
Figure A3b: Index of Trade Costs, Air, ASEAN5 (USA imports; Singapore 2008=100)

158
Table A5: Index of Trade Costs. Chilean imports (Singapore 2008=100). Table A5a: Sea freight year IDN MYS PHL SGP THA VNM 1990 1036 191 157 107 195 63 1991 454 303 153 81 236 12 1992 313 317 138 70 136 80 1993 197 97 136 76 108 427 1994 224 94 123 118 118 350 1995 434 95 108 65 102 123 1996 387 76 84 60 90 236 1997 364 69 70 55 87 245 1998 428 135 95 103 114 136 1999 621 36 47 44 125 74 2000 1103 46 60 13 74 16 2001 364 23 45 17 92 21 2002 405 117 91 42 109 28 2003 212 76 55 37 119 25 2004 325 30 78 27 95 36 2005 453 94 69 56 71 60 2006 427 68 43 43 80 51 2007 431 38 166 133 64 47 2008 248 42 191 100 33 25 Table A5b: Air freight year IDN MYS PHL SGP THA VNM 1990 919 478 337 228 385 530 1991 891 410 2213 290 538 687 1992 897 453 1295 216 509 n/a 1993 997 436 666 332 272 200 1994 809 436 507 285 477 118 1995 865 220 422 265 430 66 1996 801 552 256 345 366 823 1997 637 273 227 240 422 578 1998 1023 323 308 203 435 399 1999 280 96 237 174 255 531 2000 444 27 12 23 312 82 2001 420 33 24 15 200 274 2002 221 32 44 32 144 86 2003 210 19 40 40 241 48 2004 13938 9 49 121 175 39 2005 118 11 116 42 128 148 2006 143 12 26 38 92 42 2007 127 11 38 93 148 233 2008 275 19 66 100 195 137

159
Figure A4a: Index of Trade Costs, Sea, ASEAN5 (Chilean imports; Singapore 2008=100)
Figure A4b: Index of Trade Costs, Air, ASEAN5 (Chilean imports; Singapore 2008=100)

160
Table A6: Index of Trade Costs. Brazilian imports (Singapore 2008=100). Table A6a: Sea freight
YEAR IDN KHM LAO MMR MYS PHL SGP THA VNM 1990 267 n/a n/a n/a 215 548 72 983 0 1991 301 n/a n/a 518 278 519 309 450 375 1992 304 n/a n/a n/a 172 474 221 191 529 1993 418 n/a n/a n/a 114 539 86 107 406 1994 330 121 n/a n/a 108 424 83 115 376 1995 142 166 n/a 249 118 238 48 82 295 1996 179 112 n/a 331 48 111 22 55 329 1997 172 78 n/a 257 40 144 29 47 261 1998 148 14 n/a 232 49 101 116 114 111 1999 267 118 n/a 21 48 53 48 99 98 2000 231 130 76 20 46 57 51 69 57 2001 192 96 63 89 55 84 54 78 60 2002 136 124 22 15 127 344 106 107 54 2003 102 11 5 57 55 237 112 91 106 2004 175 128 12 116 52 193 44 99 266 2005 136 24 11 104 55 45 100 61 230 2006 100 13 9 80 47 155 79 50 135 2007 99 13 208 136 48 137 68 57 237 2008 88 15 6 97 48 128 100 44 108
Table A6b: Air freight
YEAR IDN KHM LAO MMR MYS PHL SGP THA VNM 1990 507 n/a n/a n/a 514 153 438 628 n/a 1991 2288 n/a n/a n/a 594 1397 355 710 n/a 1992 2041 n/a n/a n/a 423 474 371 271 n/a 1993 2459 n/a n/a n/a 636 307 570 435 n/a 1994 2653 n/a n/a n/a 513 236 343 487 149 1995 1486 n/a n/a n/a 892 264 429 455 1231 1996 543 401 n/a n/a 433 659 464 1863 714 1997 434 454 n/a 971 117 104 211 248 108 1998 508 205 n/a 238 96 75 171 197 617 1999 612 200 n/a n/a 108 63 119 217 121 2000 376 198 n/a 79 109 74 150 191 214 2001 396 25 n/a 196 84 72 123 223 268 2002 461 136 132 122 81 35 130 165 165 2003 329 572 202 68 72 30 112 197 218 2004 429 434 310 313 96 43 107 192 269 2005 397 358 730 239 97 62 89 229 233 2006 468 444 157 162 119 73 88 191 296 2007 491 531 161 86 119 68 72 275 495 2008 461 604 166 441 120 65 100 231 469

161
Figure A5a: Index of Trade Costs, Sea, ASEAN5 (Brazilian imports; Singapore 2008=100).
Figure A5b: Index of Trade Costs, Air, ASEAN5 (Brazilian imports; Singapore 2008=100).

162
CHAPTER 4
Investment Climate Study of ASEAN Member Countries
SHUJIRO URATA Economic Research Institute for ASEAN and East Asia,
Graduate School of Asia-Pacific Studies, Waseda University
MITSUYO ANDO Faculty of Business and Commerce
Keio University
This paper analyzes the FDI environment of the ASEAN countries with a view that the
identification of impediments to FDI would provide useful information to policy makers
interested in attracting FDI. The coverage of impediments to FDI in this study includes not
only the FDI policies but also the implementation and enforcement of these policies. As for the
openness of FDI policies, we find wide variations among the ASEAN countries. Most serious
impediments are found to be the lack of transparency and complicated/delayed processing in
screening and appraisal procedures regarding FDI application. Our findings indicate the need
for further liberalization of FDI policies and promotion of facilitation measures in order to
successfully attract FDI. In order to achieve these goals, we make several suggestions. First, to
promote FDI policy liberalization, the ASEAN countries should use various existing frameworks,
such as WTO/GATT’s TRIMs agreement, BITs, and FTAs. In particular, ASEAN should use the
ASEAN Comprehensive Investment Agreement. Second, to overcome obstacles concerning FDI
facilitation, the ASEAN countries should actively use various cooperation programs with
developed countries to improve human resources engaged in the implementation and
enforcement of FDI policies. Possible multilateral and regional sources of technical assistance
in this area are the UNCTAD, OECD, and ERIA. Third, monitoring of the implementation of
FDI liberalization and facilitation measures has to be emphasized to achieve a freer FDI
environment. In this regard, a monitoring mechanism should be established in ASEAN or in
ERIA.

163
1. Introduction
Many countries are eager to attract foreign direct investment (FDI), as FDI can
contribute to economic development and growth in the FDI recipient countries. FDI has
been proven to contribute to economic growth through various channels. FDI can bring
not only financial resources for fixed investment but also technologies and managerial
know-how, which play crucial roles in promoting economic growth for the recipient
countries. Moreover, FDI enables the recipient countries to be engaged in various
networks, such as the production, sales, procurement, and information networks of
foreign multinational corporations (MNCs), major suppliers of FDI, resulting in an
improvement of efficiency in production and marketing. Indeed, in East Asia FDI has
helped enable East Asian countries to achieve high economic growth through these
factors.
The members of the Association of Southeast Asian Nations (ASEAN) have been
quite successful in attracting FDI in recent years (Figure 1.1). After reaching a trough
in 2002, FDI inflows to ASEAN continued rising noticeably until 2007. I n five years
from 2002 to 2007 FDI inflows to ASEAN more than quadrupled from $17 billion to
$69 billion (Table 1.1). In 2008 ASEAN as a whole experienced a substantial decline in
FDI inflow by approximately $10 billion or 13.8 percent from 2007. There are wide
variations in the changes in FDI inflows in 2008 among the ASEAN members, all of
which recorded a more or less steady increase prior to 2008. Indonesia achieved a
notable increase while Singapore, the Philippines and many other countries saw a
decline.

164
0
20
40
60
80
100
120
1980 1981 1982 1983 1984 1985 1986 1987 1988 1989 1990 1991 1992 1993 1994 1995 1996 1997 1998 1999 2000 2001 2002 2003 2004 2005 2006 2007 2008
$ billion
Source: UNCTAD, Foreign Direct Investment Database
Figure 1.1 FDI Inflows to ASEAN and China: 1980-2008
China
ASEAN

165
Table 1.1. Foreign Direct Investment Inflows to ASEAN and China by Country (million)
Source: UNCTAD, Foreign Direct Invesment Database
Countries 1990 1991 1992 1993 1994 1995 1996 1997 1998 1999 2000 2001 2002 2003 2004 2005 2006 2007 2008 1990-2008
Brunei 7 6 7 8 6 583 654 702 573 748 549 526 1,035 3,375 334 289 434 260 239 10,335
Cambodia 0 0 33 54 69 151 294 168 243 232 149 149 145 84 131 381 483 867 815 4,449
Indonesia 1,092 1,482 1,799 2,003 2,191 4,419 6,245 4,729 -207 -1,838 -4,495 -2,926 232 -507 1,896 8,336 4,914 6,928 7,919 44,212
Lao PDR 6 7 8 36 59 88 128 86 45 52 34 24 25 19 17 28 187 324 228 1,401
Malaysia 2,611 4,043 5,138 5,741 4,581 5,815 7,297 6,323 2,714 3,895 3,788 554 3,203 2,473 4,624 4,064 6,060 8,401 8,053 89,378
Myanmar 225 235 149 92 135 318 581 879 684 304 208 192 191 291 251 236 428 258 283 5,939
Philippines 550 556 776 1,238 1,591 1,459 1,520 1,249 1,752 1,247 2,240 195 1,542 491 688 1,854 2,921 2,916 1,520 26,305
Singapore 5,575 4,887 2,204 4,686 8,550 11,535 9,682 13,753 7,314 16,578 16,484 15,093 6,381 11,800 20,054 14,374 27,680 31,550 22,725 250,907
Thailand 2,575 2,049 2,151 1,807 1,369 2,070 2,338 3,882 7,492 6,091 3,349 5,061 3,335 5,235 5,862 8,048 9,460 11,238 10,091 93,502
Vietnam 180 375 474 926 1,945 1,780 1,803 2,587 1,700 1,484 1,289 1,300 1,200 1,450 1,610 2,021 2,400 6,739 8,050 39,314
ASEAN 12,821 13,640 12,739 16,591 20,496 28,218 30,542 34,358 22,310 28,793 23,595 20,169 17,291 24,712 35,468 39,630 54,967 69,481 59,922 656,741
China 3,487 4,366 11,008 27,515 33,767 37,521 41,729 45,257 45,463 40,319 40,715 46,878 52,743 53,505 60,630 72,406 72,715 83,521 108,312 881,851

166
Although ASEAN members have been experiencing favorable performance in
attracting FDI in recent years, except for 2008, their performance has been
overshadowed by China. After being surpassed by China in the early 1990s in terms of
FDI inflows, ASEAN has not been able to regain the commanding position it had in the
1980s. In 2008 China continued attracting FDI successfully, while FDI inflows to
ASEAN declined.
Various factors influence the attractiveness of the host country for FDI inflows1
In light of the observation that the FDI policy regime and FDI policy environment
play important roles in determining FDI inflows, this study examines and evaluates the
.
Political and economic stability is found to play an important role in attracting FDI.
Political and economic instability discourages MNCs from undertaking FDI as it
increases the risk of losing invested assets. Large market size, favorable future
economic prospects, availability of educated, well-disciplined, low-wage labor, well-
developed soft and hard infrastructure are also attractive features of the host country for
attracting FDI. Having discussed important elements in attracting FDI, one of the most
important factors is a country’s FDI policy regime. A country with many attractive
features such as large market size cannot attract FDI if the country imposes restrictions
on FDI inflows. Even if the FDI regime is open, a country has difficulty in attracting
FDI if the FDI regime of the country lacks transparency or stability. These observations
indicate the importance of the FDI policy regime as well as the FDI policy environment
in determining the attractiveness of a country for FDI inflows.
1 For example, see Urata (2006) for the determinants of FDI inflows in East Asian countries.

167
restrictiveness/openness of FDI policy regimes and environments for ASEAN countries.
We adopt two approaches to achieve our objective. In order to evaluate an FDI policy
regime, we examine FDI policies which are documented in legal documents, such as
FDI Laws, from the following six aspects: market access or right of establishment,
national treatment, screening and approval procedure, restrictions on boards of directors
as well as foreign investors, and performance requirements. To shed more light on the
FDI policy environment, we use the information on barriers to FDI available from the
survey compiled by the Japan Machinery Center for Trade and Investment (JMC), (JMC
survey hereinafter).2
The structure of the study is as follows. Section 2 reviews two comparative studies
assessing the business environment of ASEAN and other countries, to set the stage for
our analysis of FDI policy regimes and environments. This review is expected to
Use of the information provided by the companies would reveal
the true impediments to FDI. It is indeed well known, especially in developing countries,
that the presence of a law does not mean that the law is actually implemented and
enforced. By conducting these two kinds of analysis, we should be able to discern the
policy-related impediments to FDI in ASEAN countries.
It is hoped that our study would contribute to a deeper understanding of the FDI
policy regimes and FDI policy environments of ASEAN countries and to help them
formulate FDI policy. In particular, the results of this study may provide useful
information to the ASEAN country governments, which have committed to creating an
ASEAN economic community by 2015, where free flow of FDI would be realized.
2 See section 3 for a detailed explanation of the JMC survey.

168
discern the business environment in ASEAN from the global perspective. Sections 3
and 4 focus on ASEAN countries. Section 3 examines FDI policy regimes by assessing
the contents of legal frameworks, while section 4 examines FDI policy environments by
assessing the information collected from companies. Section 5 concludes the study by
presenting policy recommendations.
2. ASEAN’s Business Environment from a Global Perspective
An assessment of the business environment in ASEAN countries from a global
perspective provides useful information for understanding the problems/barriers
impeding foreign direct investment. With this in mind, this section reviews the results
of two studies by international organizations and think-tanks that have analyzed the
business environment of a large number of countries. Specifically, we take up the
following studies: Doing Business Database compiled by the World Bank (World Bank,
2010) and Global Competitiveness Report 2006-2007, 2008-2009, and 2009-2010
published by the World Economic Forum (World Economic Forum, 2006, 2008, and
2009).
Table 2.1, constructed from the Doing Business Database, presents the latest
ranking of the ease of doing business for the ASEAN10 economies in 2005, 2009, and
2010. It highlights cases with rankings lower than half of the number of sample
countries. While the overall rankings in 2010 (Table 2.1 (a)) are high for Singapore (1st

169
out of 183), Thailand (12th), and Malaysia (23rd), they are particularly low for new
ASEAN members and Indonesia and the Philippines: Laos (167th), the Philippines
(166th), Cambodia (145th), Indonesia (122nd), and Viet Nam (93rd). When the overall
rankings in 2010 are compared with those in 2009 (Table 2.1 (b)) and those in 2005
(Table 2.1 (c)), they are more or less similar to each other, except in the case of the
Philippines; this country’s ranking gradually dropped from 121st (out of 175) in 2005 to
140th (out of 181) in 2009 and 166th
(out of 183) in 2010.

170
Table 2.1. Ranking of ease of doing business ofr ASEAN economies
Data source: World Bank (2010)
Notes: average ranking is calculated for a comparison among 10 factors. Average (9) and average,
(6) show average ranking for nine countries and six countries who appear in 2005, respectively.
Bru
nei
Cam
bodi
a
Indo
nesi
a
Lao
PDR
Mal
aysi
a
Phili
ppin
es
Sing
apor
e
Thai
land
Vie
tnam
Ave
rage
(9)
Ave
rage
(6)
(a) 2010Overall ranking (out of 183 96 145 122 167 23 166 1 12 93 92 70
Ranking for 10 factorsStarting a business 153 173 161 89 88 162 4 55 116 111 98Dealing with licenses 75 145 61 115 109 111 2 13 69 78 61Employing workers 4 134 149 107 61 115 1 52 103 81 80Registering property 183 116 95 161 86 102 16 6 40 89 58Getting credit 113 87 113 150 1 127 4 71 30 77 58Protecting investors 119 73 41 182 4 132 2 12 172 82 61Paying taxes 22 58 127 113 24 135 5 88 147 80 88Trading across borders 48 127 45 168 35 68 1 12 74 64 39Enforcing contracts 160 141 146 111 59 118 13 24 32 89 65Closing a business 37 183 142 183 57 153 2 48 127 104 88
(b) 2009Overall ranking (out of 181 88 135 129 165 20 140 1 13 92 87 66
Ranking for 10 factorsStarting a business 130 169 171 92 75 155 10 44 108 106 94Dealing with licenses 72 147 80 110 104 105 2 12 67 78 62Employing workers 5 134 157 85 48 126 1 56 90 78 80Registering property 177 108 107 159 81 97 16 5 37 87 57Getting credit 109 68 109 145 1 123 5 68 43 75 58Protecting investors 113 70 53 180 4 126 2 11 170 81 61Paying taxes 35 24 116 113 21 129 5 82 140 74 82Trading across borders 42 122 37 165 29 58 1 10 67 59 34Enforcing contracts 157 136 140 111 59 114 14 25 42 89 66Closing a business 35 181 139 181 54 151 2 46 124 101 86
(c) 2005Overall ranking (out of 175 n.a. n.a. 131 n.a. 25 121 2 19 98 n.a. 66
Ranking for 10 factorsStarting a business n.a. n.a. 161 n.a. 66 99 11 23 89 n.a. 75Dealing with licenses n.a. n.a. 129 n.a. 134 112 10 6 28 n.a. 70Employing workers n.a. n.a. 141 n.a. 37 118 4 46 137 n.a. 81Registering property n.a. n.a. 118 n.a. 68 91 12 16 30 n.a. 56Getting credit n.a. n.a. 76 n.a. 3 96 7 41 76 n.a. 50Protecting investors n.a. n.a. 58 n.a. 3 151 2 33 170 n.a. 70Paying taxes n.a. n.a. 129 n.a. 49 96 8 54 116 n.a. 75Trading across borders n.a. n.a. 55 n.a. 41 61 2 97 68 n.a. 54Enforcing contracts n.a. n.a. 144 n.a. 78 50 23 43 90 n.a. 71Closing a business n.a. n.a. 126 n.a. 47 143 2 36 105 n.a. 77
171
The Doing Business Database evaluates the following 10 aspects of the business
environment: i. starting a business, ii. dealing with licenses, iii. employing workers, iv.
registering property, v. getting credit, vi. protecting investors, vii. paying taxes, ix.
enforcing contracts, and x. closing a business. The problems that need to be solved vary
among the ASEAN countries. For the ASEAN region as a whole, however, the most
serious problems are in the areas of starting a business (111th/106th on average) and
closing a business (104th/101st), for which their rankings are significantly lower than
their overall average of 92nd/87th in 2010/2009. On the other hand, interestingly, the
ranking for trading across borders is much higher than other items for ASEAN: 64th/59th
on average for ASEAN9 and 39th/34th for ASEAN6 in 2010/2009. When the rankings
in 2010 are compared with those in 2005, some items tend to improve while others
worsen. In particular, relative evaluations for trading across borders drastically
improved from 54th to 39th on average of ASEAN6 countries, while relative evaluations
for starting a business significantly worsened from 75th to 98th. These relatively high
and rapidly improving rankings for trade activities may reflect the recent efforts that
ASEAN countries have made for trade liberalization and facilitation, particularly to
create an ASEAN Economic Community (AEC) with a targeted year of 2015.3
The survey results in Table 2.2 reveal that the lengths of time required for starting a
business and closing a business are too long; for instance, it takes 116 days for Brunei
3 See Ishikawa et al.(2009) for efforts made by ASEAN countries, as a part of movements toward
AEC, to form national single windows (NSW) and ASEAN single windows (ASW), which are one-
stop services for trade at the national and ASEAN-wide level, as well as other discussion on AEC.

172
and 100 days for Laos to start a business. Many procedures are necessary, particularly
for starting a business and obtaining certain licenses, and the time requirement may be
due to the complexity of and/or delays in procedures; more than 10 kinds of procedure
are required to start a business in Brunei, the Philippines, and Vietnam, and more than
20 procedures are necessary to deal with licenses in Brunei, Malaysia, Lao PDR, the
Philippines, and Cambodia. Costs expressed as percentage of income per capita to start
a business/ dealing with licenses are also high in some countries; for example,
Cambodia for starting a business and Vietnam, Indonesia, and Lao PDR for dealing
with licenses. Moreover, high minimum capital levels discourage starting a business in
countries such as Indonesia and Cambodia. Furthermore, the degree of difficulty in
hiring and firing workers seem to be extremely high for Indonesia, and firing costs are
particularly troublesome; firing costs expressed as the number of weeks wages are as
high as 162 for Lao PDR, 108 for Indonesia, 91 for the Philippines, and 87 for Vietnam
in extreme cases.

173
Table 2.2 Components of ease of doing business and their evaluation for ASEAN economies, 2010
2010
Bru
nei
Cam
bodi
a
Indo
nesi
a
Lao
PDR
Mal
aysi
a
Phili
ppin
es
Sing
apor
e
Thai
land
Vie
tnam
Starting a Business Procedures (number) 18 9 9 7 9 15 3 7 11Time (days) 116 85 60 100 11 52 3 32 50Cost (% of income per capita) 10 138 26 12 12 28 1 6 13Min. capital (% of income per capita) 0 37 60 0 0 6 0 0 0
Dealing with Licenses Procedures (number) 32 23 14 24 25 24 11 11 13Time (days) 163 709 160 172 261 203 25 156 194Cost (% of income per capita) 5 54 195 144 7 82 20 12 248
Employing Workers Difficulty of Hiring Index (0-100) 0 44 61 11 0 56 0 33 11Rigidity of Hours Index (0-100) 0 33 0 0 0 0 0 0 13Difficulty of Firing Index (0-100) 0 30 60 50 30 30 0 0 40Rigidity of Employment Index (0-100) 0 36 40 20 10 29 0 11 21Firing costs (weeks of wages) 4 39 108 162 75 91 4 54 87
Registering Property Procedures (number) .. 7 6 9 5 8 3 2 4Time (days) .. 56 22 135 144 33 5 2 57Cost (% of property value) .. 4 11 4 3 4 3 1 1
Getting Credit Legal Rights Index (0-10) 7 8 3 4 10 3 10 4 8Credit Information Index (0-6) 0 0 4 0 6 3 9 5 4Public registry coverage (% adults) 0 0 22 0 49 0 9 0 19Private bureau coverage (% adults) 0 0 0 0 82 6 9 33 0
Protecting Investors Disclosure Index (0-10) 3 5 10 0 10 2 5 10 6Director Liability Index (0-10) 2 9 5 3 9 2 84 7 0Shareholder Suits Index (0-10) 8 2 3 2 7 8 7.9 6 2Investor Protection Index (0-10) 4 5 6 2 9 4 15 8 3
Paying Taxes Payments (number) 15 39 51 34 12 47 5 23 32Time (hours) 144 173 266 362 145 195 84 264 1050Profit tax (%) 25 19 27 25 17 25 8 29 21Labor tax and contributions (%) 6 0 11 6 16 10 15 6 19Other taxes (%) 0 4 0 3 2 14 5 3 0Total tax rate (% profit) 30 23 38 34 34 49 28 37 40
Trading Across Borders Documents for export (number) 6 11 5 9 7 8 4 4 6Time for export (days) 28 22 21 50 18 16 5 14 22Cost to export (US$ per container) 630 732 704 1860 450 816 456 625 756Documents for import (number) 6 11 6 10 7 8 4 3 8Time for import (days) 19 30 27 50 14 16 3 13 21Cost to import (US$ per container) 708 872 660 2040 450 819 439 795 940
Enforcing Contracts Procedures (number) 58 44 39 42 30 37 21 35 34Time (days) 540 401 570 443 585 842 150 479 295Cost (% of debt) 37 103 123 32 28 26 26 12 29
Closing a Business Time (years) 3 .. 6 .. 2 6 1 3 5Cost (% of estate) 4 .. 18 .. 15 38 1 36 15Recovery rate (cents on the dollar) 47 0 14 0 39 4 91 42 18
Data source: World Bank (2010).
Table 2.2. Components of Ease of Doing Business and Their Evaluation for
ASEAN Economies, 2C
Data source: World Bank (2010)
174
Even for trading across borders with relatively high ranking, there remains room for
further improvement in terms of the number of days and the costs required for export
and import processes. For instance, reduction of costs for exports and imports is
necessary particularly for Lao PDR, the Philippines, Vietnam, and Cambodia, and the
reduction of time for export and import operations is needed mainly for Lao PDR,
Cambodia, Indonesia, and Vietnam. To realize them requires the development of a
logistics-related infrastructure such as ports and roads, and improved efficiency in
customs clearance in addition to the reduction (and simplification) of tariffs and non-
tariff measures (NTMs).
Table 2.3 presents a global competitiveness index (GCI) by country and by category,
obtained from the Global Competitiveness Report, highlighting cases with rankings
lower than half of the number of sample countries. The figures in the upper portion of
Table 2.3 (a)/(b)/(c) indicate the ranking of a country among 133/134/125 countries for
the items concerned (low figures indicate high rankings), while the figures in the lower
portion of the table indicate the score (high numbers indicate high scores with 7 as the
full score). The GCI evaluates the competitiveness of countries based on three broad
categories with two to six sub-categories. The three broad categories are basic
requirements, efficiency enhancers, and innovation and sophistication factors. The sub-
categories are further broken down into the much more precise factors shown in Table
A.2.1 in the Appendix. 4
4 Factors considered as disadvantages are those ranked below 10 for Singapore with an overall
ranking in the top 10 economies, those ranked equal to or lower than the economy's overall ranking
Although the degree of competitiveness of a specific country

175
may not directly influence the investment activities of firms, competitiveness would
have a positive impact on investment decisions. Firms prefer competitive countries to
less competitive ones for the location of their operations in the global market when
considering investment decisions.
for Brunei, Malaysia, Thailand, and Indonesia with an overall ranking from 11 to 50, and those
ranked lower than 50 for Cambodia, Indonesia, the Philippines, and Viet Nam with an overall
ranking lower than 51.
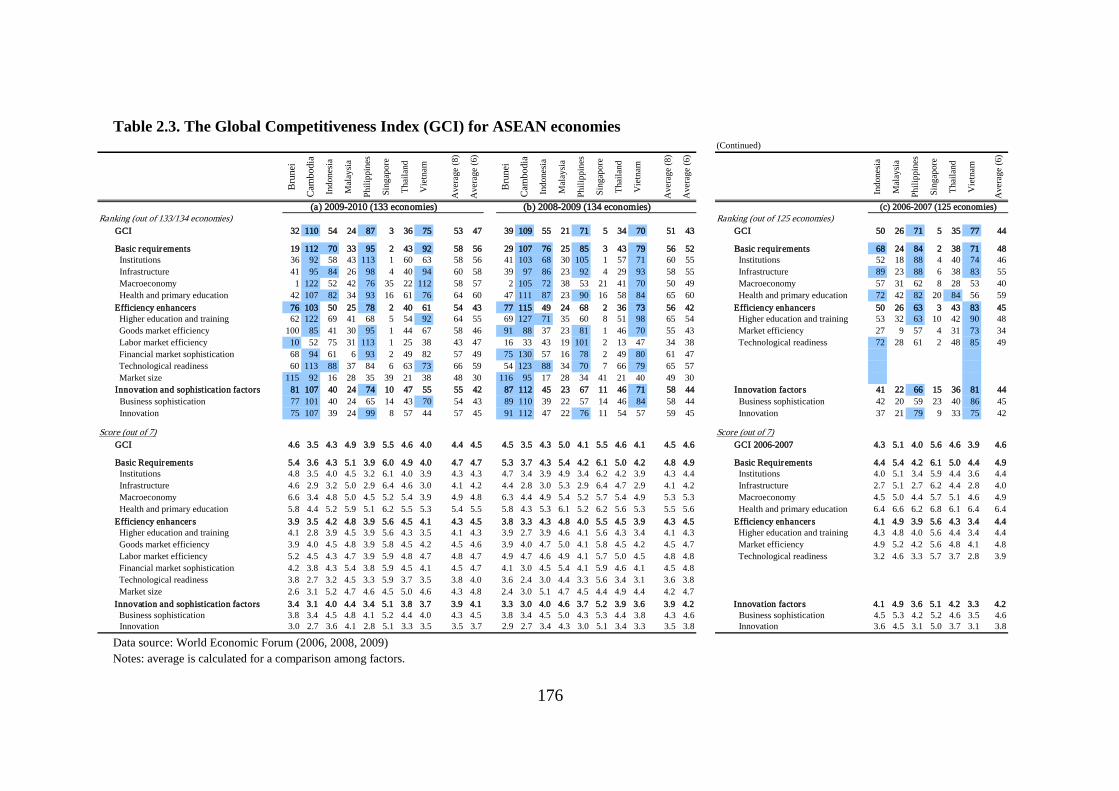
176
Table 2.3. The Global Competitiveness Index (GCI) for ASEAN economies
Data source: World Economic Forum (2006, 2008, 2009) Notes: average is calculated for a comparison among factors.
(Continued)
Bru
nei
Cam
bodi
a
Indo
nesi
a
Mal
aysi
a
Phili
ppin
es
Sing
apor
e
Thai
land
Vie
tnam
Ave
rage
(8)
Ave
rage
(6)
Bru
nei
Cam
bodi
a
Indo
nesi
a
Mal
aysi
a
Phili
ppin
es
Sing
apor
e
Thai
land
Vie
tnam
Ave
rage
(8)
Ave
rage
(6)
Indo
nesi
a
Mal
aysi
a
Phili
ppin
es
Sing
apor
e
Thai
land
Vie
tnam
Ave
rage
(6)
Ranking (out of 133/134 economies) Ranking (out of 125 economies)GCI 32 110 54 24 87 3 36 75 53 47 39 109 55 21 71 5 34 70 51 43 GCI 50 26 71 5 35 77 44
Basic requirements 19 112 70 33 95 2 43 92 58 56 29 107 76 25 85 3 43 79 56 52 Basic requirements 68 24 84 2 38 71 48 Institutions 36 92 58 43 113 1 60 63 58 56 41 103 68 30 105 1 57 71 60 55 Institutions 52 18 88 4 40 74 46 Infrastructure 41 95 84 26 98 4 40 94 60 58 39 97 86 23 92 4 29 93 58 55 Infrastructure 89 23 88 6 38 83 55 Macroeconomy 1 122 52 42 76 35 22 112 58 57 2 105 72 38 53 21 41 70 50 49 Macroeconomy 57 31 62 8 28 53 40 Health and primary education 42 107 82 34 93 16 61 76 64 60 47 111 87 23 90 16 58 84 65 60 Health and primary education 72 42 82 20 84 56 59Efficiency enhancers 76 103 50 25 78 2 40 61 54 43 77 115 49 24 68 2 36 73 56 42 Efficiency enhancers 50 26 63 3 43 83 45 Higher education and training 62 122 69 41 68 5 54 92 64 55 69 127 71 35 60 8 51 98 65 54 Higher education and training 53 32 63 10 42 90 48 Goods market efficiency 100 85 41 30 95 1 44 67 58 46 91 88 37 23 81 1 46 70 55 43 Market efficiency 27 9 57 4 31 73 34 Labor market efficiency 10 52 75 31 113 1 25 38 43 47 16 33 43 19 101 2 13 47 34 38 Technological readiness 72 28 61 2 48 85 49 Financial market sophistication 68 94 61 6 93 2 49 82 57 49 75 130 57 16 78 2 49 80 61 47 Technological readiness 60 113 88 37 84 6 63 73 66 59 54 123 88 34 70 7 66 79 65 57 Market size 115 92 16 28 35 39 21 38 48 30 116 95 17 28 34 41 21 40 49 30Innovation and sophistication factors 81 107 40 24 74 10 47 55 55 42 87 112 45 23 67 11 46 71 58 44 Innovation factors 41 22 66 15 36 81 44 Business sophistication 77 101 40 24 65 14 43 70 54 43 89 110 39 22 57 14 46 84 58 44 Business sophistication 42 20 59 23 40 86 45 Innovation 75 107 39 24 99 8 57 44 57 45 91 112 47 22 76 11 54 57 59 45 Innovation 37 21 79 9 33 75 42
Score (out of 7) Score (out of 7)GCI 4.6 3.5 4.3 4.9 3.9 5.5 4.6 4.0 4.4 4.5 4.5 3.5 4.3 5.0 4.1 5.5 4.6 4.1 4.5 4.6 GCI 2006-2007 4.3 5.1 4.0 5.6 4.6 3.9 4.6
Basic Requirements 5.4 3.6 4.3 5.1 3.9 6.0 4.9 4.0 4.7 4.7 5.3 3.7 4.3 5.4 4.2 6.1 5.0 4.2 4.8 4.9 Basic Requirements 4.4 5.4 4.2 6.1 5.0 4.4 4.9 Institutions 4.8 3.5 4.0 4.5 3.2 6.1 4.0 3.9 4.3 4.3 4.7 3.4 3.9 4.9 3.4 6.2 4.2 3.9 4.3 4.4 Institutions 4.0 5.1 3.4 5.9 4.4 3.6 4.4 Infrastructure 4.6 2.9 3.2 5.0 2.9 6.4 4.6 3.0 4.1 4.2 4.4 2.8 3.0 5.3 2.9 6.4 4.7 2.9 4.1 4.2 Infrastructure 2.7 5.1 2.7 6.2 4.4 2.8 4.0 Macroeconomy 6.6 3.4 4.8 5.0 4.5 5.2 5.4 3.9 4.9 4.8 6.3 4.4 4.9 5.4 5.2 5.7 5.4 4.9 5.3 5.3 Macroeconomy 4.5 5.0 4.4 5.7 5.1 4.6 4.9 Health and primary education 5.8 4.4 5.2 5.9 5.1 6.2 5.5 5.3 5.4 5.5 5.8 4.3 5.3 6.1 5.2 6.2 5.6 5.3 5.5 5.6 Health and primary education 6.4 6.6 6.2 6.8 6.1 6.4 6.4Efficiency enhancers 3.9 3.5 4.2 4.8 3.9 5.6 4.5 4.1 4.3 4.5 3.8 3.3 4.3 4.8 4.0 5.5 4.5 3.9 4.3 4.5 Efficiency enhancers 4.1 4.9 3.9 5.6 4.3 3.4 4.4 Higher education and training 4.1 2.8 3.9 4.5 3.9 5.6 4.3 3.5 4.1 4.3 3.9 2.7 3.9 4.6 4.1 5.6 4.3 3.4 4.1 4.3 Higher education and training 4.3 4.8 4.0 5.6 4.4 3.4 4.4 Goods market efficiency 3.9 4.0 4.5 4.8 3.9 5.8 4.5 4.2 4.5 4.6 3.9 4.0 4.7 5.0 4.1 5.8 4.5 4.2 4.5 4.7 Market efficiency 4.9 5.2 4.2 5.6 4.8 4.1 4.8 Labor market efficiency 5.2 4.5 4.3 4.7 3.9 5.9 4.8 4.7 4.8 4.7 4.9 4.7 4.6 4.9 4.1 5.7 5.0 4.5 4.8 4.8 Technological readiness 3.2 4.6 3.3 5.7 3.7 2.8 3.9 Financial market sophistication 4.2 3.8 4.3 5.4 3.8 5.9 4.5 4.1 4.5 4.7 4.1 3.0 4.5 5.4 4.1 5.9 4.6 4.1 4.5 4.8 Technological readiness 3.8 2.7 3.2 4.5 3.3 5.9 3.7 3.5 3.8 4.0 3.6 2.4 3.0 4.4 3.3 5.6 3.4 3.1 3.6 3.8 Market size 2.6 3.1 5.2 4.7 4.6 4.5 5.0 4.6 4.3 4.8 2.4 3.0 5.1 4.7 4.5 4.4 4.9 4.4 4.2 4.7Innovation and sophistication factors 3.4 3.1 4.0 4.4 3.4 5.1 3.8 3.7 3.9 4.1 3.3 3.0 4.0 4.6 3.7 5.2 3.9 3.6 3.9 4.2 Innovation factors 4.1 4.9 3.6 5.1 4.2 3.3 4.2 Business sophistication 3.8 3.4 4.5 4.8 4.1 5.2 4.4 4.0 4.3 4.5 3.8 3.4 4.5 5.0 4.3 5.3 4.4 3.8 4.3 4.6 Business sophistication 4.5 5.3 4.2 5.2 4.6 3.5 4.6 Innovation 3.0 2.7 3.6 4.1 2.8 5.1 3.3 3.5 3.5 3.7 2.9 2.7 3.4 4.3 3.0 5.1 3.4 3.3 3.5 3.8 Innovation 3.6 4.5 3.1 5.0 3.7 3.1 3.8
(a) 2009-2010 (133 economies) (b) 2008-2009 (134 economies) (c) 2006-2007 (125 economies)

177
Similarly to the rankings in Doing Business, the overall rankings in 2009-
2010/2008-2009 are high for Singapore (3rd/5th out of 133/134), Malaysia (24th/21st), and
Thailand (36th/34th), while they are particularly low for new ASEAN countries and the
Philippines, indicating unfavorable business environments in these countries: Cambodia
(110th/109h), the Philippines (87th/71st), and Vietnam (75th/70th) (Table 2.3 (a)/(b)).
When the overall rankings in 2009-2010/2008-2009 are compared with those in 2006-
2007 (Table 2.3 (c)), they are more or less similar to each other, again except for the
Philippines; the ranking worsened by more than 10places,from 71st to 87th
Based on the average figures shown in the right hand columns in Table 2.3, basic
requirements such as institutions, infrastructure, and health and primary education are
still not well developed at the sub-category level in ASEAN6 countries compared to the
rest of the world. More precisely, the factors regarded as reducing competitiveness in
many countries in Table A.2.1 involve various public institutions, such as judicial
independence, efficiency of legal framework, infrastructure (particularly the quality of
the electricity supply), and tuberculosis prevalence, various market distortions
concerning such matters as tertiary education, number of procedures and time required
for starting a business, financial market sophistication including soundness of banks,
and technological readiness such as the availability of latest technologies and broadband
internet subscribers. Improving these factors would make the countries in the region
more competitive, increasing their attractiveness for investors.
.
Table 2.4, compiled from the Global Competitiveness Report, shows the
problematic factors involved in doing business in the countries concerned. The figures

178
in the upper portion of the table indicate the percentage of respondents reporting the
presence of the problem for the item concerned, while those in the lower portion
indicate the ranking of the severity of the problem for the 15/14 items in each economy.
In the upper portion of the table, the figures registering 10 percent or above are
highlighted. 5
When the results for 2009-2010 are compared with those for 2008-
2009/2006-2007, corruption, inadequate supply of infrastructure, and inefficient
government bureaucracy are still recognized as relatively serious problems in many
ASEAN countries. Additionally, tax regulation is identified as a relatively serious
problem in many countries in 2008-2009, though it is not regarded as such in 2009-2010.
Combined with the fact that access to financing has worsened, which probably reflects
the global financial crisis starting in mid 2009, tax regulation became less serious in
comparison. These results suggest that in addition to corruption, inadequate supply of
infrastructure, and inefficient government bureaucracy, other factors such as tax
regulation and access to financing have also been regarded as serious problems
requiring improvement to facilitate business.
5 To construct this table, respondents were asked to select the five most problematic factors for
doing business in the economy, from 15/14 factors listed in the table, and to to rank them from 1
(most problematic) to 5. The results were tabulated and weighted according to the ranking assigned
by the respondents.

179
Table 2.4 The most problematic factors for doing business and their ranking for ASEAN economies
Brun
ei
Cam
bodi
a
Indo
nesia
Mal
aysia
Phili
ppin
es
Sing
apor
e
Thai
land
Vie
tnam
Ave
rage
(8)
Ave
rage
(6)
Brun
ei
Cam
bodi
a
Indo
nesia
Mal
aysia
Phili
ppin
es
Sing
apor
e
Thai
land
Vie
tnam
Ave
rage
(8)
Ave
rage
(6)
Indo
nesia
Mal
aysia
Phili
ppin
es
Sing
apor
e
Thai
land
Vie
tnam
Ave
rage
(6)
(a) 2009-2010 (b) 2008-2009 (c) 2006-2007
Percent of responsesAccess to financing 15.1 6.6 7.3 12.8 5.2 12.6 7.2 13.2 10.0 9.7 14.7 8.9 4.4 6.2 1.8 14.7 7.4 10.6 8.6 7.5 4.7 6.0 4.1 9.6 7.1 8.4 6.6Corruption 1.6 23.9 8.7 10.4 24.3 0.8 11.0 5.1 10.7 10.1 0.9 0.7 3.9 4.5 1.5 1.3 4.6 3.1 2.6 3.2 4.6 8.0 21.5 0.3 14.7 18.8 11.3Crime and theft 1.4 3.2 0.4 5.9 3.3 0.3 1.4 1.4 2.2 2.1 2.1 3.6 1.3 5.5 5.9 9.4 3.5 3.9 4.4 4.9 4.6 5.4 3.8 1.4 0.2 2.0 2.9Foreign currency regulations 2.1 1.2 5.2 3.0 0.0 4.8 1.8 3.1 2.7 3.0 0.0 2.8 0.1 0.0 0.1 0.6 0.6 0.6 0.6 0.3 4.9 8.1 0.3 2.4 2.0 3.3 3.5Government instability/coups 0.9 0.4 3.6 3.1 2.8 0.0 23.7 1.1 4.5 5.7 19.1 2.2 9.7 5.9 2.4 10.3 1.2 1.9 6.6 5.2 1.9 1.1 13.6 0.5 7.7 2.2 4.5Inadequate supply of infrastructure 7.4 8.3 14.8 5.5 15.0 6.2 2.8 16.1 9.5 10.1 2.1 24.5 10.7 14.5 23.9 0.1 10.3 9.0 11.9 11.4 20.2 5.8 15.2 6.9 6.0 13.5 11.3Inadequately educated workforce 10.7 9.6 4.7 8.0 0.7 11.9 6.7 13.1 8.2 7.5 0.7 2.6 0.1 8.3 1.9 0.2 0.8 0.9 1.9 2.0 8.1 6.7 0.8 15.9 10.2 9.5 8.5Inefficient government bureaucracy 15.3 17.4 20.2 11.3 20.6 3.4 13.3 2.9 13.1 12.0 2.4 5.0 5.0 6.5 8.7 0.8 13.0 8.2 6.2 7.0 14.1 15.4 11.8 6.4 17.8 19.0 14.1Inflation 1.9 5.9 6.1 4.4 0.6 20.3 2.0 11.5 6.6 7.5 13.7 4.9 7.5 4.7 3.8 5.2 4.1 7.7 6.5 5.5 6.0 7.5 2.1 8.0 4.3 2.2 5.0Policy instability 2.3 6.4 9.0 8.5 12.6 1.1 15.4 7.6 7.9 9.0 1.7 1.8 3.7 1.8 7.0 0.0 21.5 1.4 4.9 5.9 14.0 6.4 15.3 3.4 13.9 0.9 9.0Poor public health 0.0 2.4 0.5 1.0 2.4 0.4 0.2 2.0 1.1 1.1 0.7 4.6 6.7 6.1 6.4 7.6 5.1 6.4 5.5 6.4 n.a. n.a. n.a. n.a. n.a. n.a. n.a.Poor work ethic in national labor force 17.9 4.8 3.7 7.9 2.0 5.7 3.5 6.8 6.5 4.9 4.5 8.9 16.4 5.4 13.1 5.9 5.2 16.5 9.5 10.4 1.6 6.0 1.1 8.8 2.8 6.9 4.5Restrictive labor regulations 20.5 2.2 7.1 6.4 2.4 15.1 1.9 2.8 7.3 6.0 20.1 4.0 3.5 5.5 0.1 6.4 2.2 8.1 6.2 4.3 6.0 8.3 2.5 15.7 2.6 2.0 6.2Tax rates 1.1 2.4 1.9 6.9 3.3 7.9 2.9 5.0 3.9 4.7 1.7 7.3 7.8 8.3 3.5 35.4 8.5 17.9 11.3 13.6 2.7 7.0 4.5 8.8 2.5 3.8 4.9Tax regulations 1.9 5.3 6.8 4.9 4.8 9.4 6.3 8.2 6.0 6.7 15.6 18.3 19.3 16.7 19.7 2.2 12.1 3.7 13.5 12.3 10.5 8.3 3.7 11.9 8.2 7.7 8.4
Ranking in each economyAccess to financing 12 11 11 15 11 13 11 14 12 13 5 7 6 12 8 8 10 7 8 9 9 11 7 4 7 5 7Corruption 5 15 12 13 15 4 12 8 11 11 8 1 3 2 1 14 4 4 5 5 11 5 1 14 2 2 6Crime and theft 4 6 1 7 9 2 2 2 4 4 13 12 14 3 11 13 14 14 12 12 10 13 8 12 14 12 12Foreign currency regulations 8 2 7 2 1 7 3 6 5 4 12 15 10 13 13 10 9 11 12 11 8 4 14 11 13 9 10Government instability/coups 2 1 4 3 7 1 15 1 4 5 10 14 11 14 5 15 1 13 10 10 13 14 4 13 6 10 10Inadequate supply of infrastructure 10 12 14 6 13 9 6 15 11 11 6 3 2 11 3 7 7 2 5 5 1 12 3 8 8 3 6Inadequately educated workforce 11 13 6 11 3 12 10 13 10 9 4 4 9 6 12 2 6 3 6 6 5 8 13 1 4 4 6Inefficient government bureaucracy 13 14 15 14 14 6 13 5 12 11 3 2 1 1 2 9 3 10 4 4 2 1 5 9 1 1 3Inflation 7 9 8 4 2 15 5 12 8 8 11 5 5 4 9 1 5 1 5 4 7 6 11 7 9 10 8Policy instability 9 10 13 12 12 5 14 10 11 11 7 6 8 5 4 11 2 5 6 6 3 9 2 10 3 14 7Poor public health 1 5 2 1 6 3 1 3 3 3 15 11 15 15 15 12 15 15 14 15 n.a. n.a. n.a. n.a. n.a. n.a. n.a.Poor work ethic in national labor force 14 7 5 10 4 8 8 9 8 7 1 9 12 9 14 6 12 6 9 10 14 10 12 6 10 7 10Restrictive labor regulations 15 3 10 8 6 14 4 4 8 8 2 13 4 8 10 3 13 12 8 8 6 2 10 2 11 12 7Tax rates 3 5 3 9 9 10 7 7 7 8 9 10 13 10 7 4 11 9 9 9 12 7 6 5 12 8 8Tax regulations 7 8 9 5 10 11 9 11 9 9 14 8 7 7 6 5 8 8 8 7 4 2 9 3 5 6 5
Data source: World Economic Forum (2006, 2008, 2009) Note: From a list of the above 15/14 factors, respondents were asked to select the five most problematic for doing business in their economy and to rank them from 1 (most problematic) to 5. The results were tabulated andweighted according to the ranking assigned by the respondents. The weighted percentage of firms identified the factor as a problematic is expressed in the upper part of this table "percent of responses". Average is calculatedfor a comparison among factors. Average (8) and average (6) show average of eight countries and six countries who appear in (a) and (b), respectively.
Table 2.4. The Most Problematic Factors for Doing Business and Their Ranking for ASEAN

180
The evaluation of the business environment and competitiveness of the ASEAN
countries in this section suggests that reducing the complexity and time required for
institutional procedures, increasing labor market flexibility (reducing the burden of
labor regulations), and developing infrastructure are particularly important for
improving the investment environment.
3. Assessment of FDI Policy Regimes, based on Legal Documents
This section assesses the FDI policy regimes in ASEAN countries using the
information obtained from legal documents such as FDI Laws. In some cases
supplementary information sources, such as FDI guides, are used. The first section
describes the methodology used for the analysis and then the following section
discusses the results of the analysis.
3.1. Methodology
Several studies have assessed the restrictiveness of FDI policies. Golub (2003)
examined the restrictiveness of FDI for OECD countries in 1998/2000 by examining
rules on foreign equity, screening and approval procedure, and other restrictions
including those on boards of directors, movement of people, and input and operational
restrictions. Golub found the United Kingdom the most open country and Iceland the
least open country among 28 OECD member countries.

181
PECC (2002) evaluated FDI regimes of APEC economies by examining wide-
ranging FDI rules on market access, examination procedures, most-favored-nation
(MFN) treatment, profit repatriation, work permits, performance requirements, dispute
settlement, investment incentives, and capital exports. PECC found Hong Kong to be
the most open and Brunei the least open among 19 APEC sample economies. The
PECC study shows that the FDI regimes of developing members are more restrictive
compared to developed members.
We used a modified methodology adopted by Golub (2003). Our evaluation
method is shown in Table 3.1. We evaluated the restrictiveness of FDI rules in six
areas: foreign ownership or market access, national treatment, screening and approval
procedure, board of directors and management composition, movement of investors,
and performance requirement. Low scores indicate open FDI rules6
6 We evaluated FDI rules by sectors, then aggregated them to obtain an overall score by giving equal
weight. We used an 88 ISIC two-digit industry classification to analyze FDI rules, then aggregated
these detailed results using equal weights
. Different areas are
given different weights. In most FTAs, restrictions are imposed on ownership and
control of a local enterprise through a cap on foreign-owned equity. It is given a weight
of 0.4 while restriction on national treatment is given a weight of 0.2 for the
computation of the overall score. Meanwhile, other restrictions such as screening
procedures, composition of management, entry of investors, and performance
requirements are given 0.1 each. In this manner, this study avoided the limitations of
Golub’s analysis wherein some sectors received a score above 1, which is the highest

182
possible score for the degree of restrictiveness in his study. Our method has its own
limitations. It can be subjected to random and arbitrary weight. However, this is
assuaged by using standards on all restrictions and by careful analysis, in addition to
comparison of the results of one country with another.
All in all, 21 sectors that include 88 ISIC two-digit subsectors were evaluated in this
study.
Table 3.1. Assessment of FDI Restrictions
Table 3.1 Assessment of FDI Restrictions(Fully liberalized = 0)
Restriction on Ownership and Market Access (weight = 0.4)No foreign equity is allowed 11-19 percent is allowed 0.9Reservation on ownership and market access 0.7520-34 percent is allowed 0.635-49 percent is allowed 0.550-74 percent is allowed 0.375-99 percent is allowed 0.2No restriction but bound 0.1Commercial presence is required 0.1
No restrictions 0
National Treatment (weight = 0.2)No national treatment 1Reservation on national treatment 0.75No restrictions 0
Screening and Approval (weight = 0.1)Objections in case the investment is contrary to national interest 1Investment is required to show economic benefits before approval 0.9Reservations for future limitations 0.75Objections based on the size of investment 0.5Prior or post notification 0.1No restrictions 0
Board of Directors and Management Composition (weight = 0.1)All members of the management should be local 1Reservations for future restrictions 0.75Majority should be local 0.5At least one is local 0.25Should be locally license 0.1No restrictions 0
Movement of investors (weight = 0.1)No entry 1Less than one year 0.9Reservations for further measures on entry 0.75One to two years 0.6Three to four years 0.5More than four years but less than 10 0.2No restrictions 0
Performance requirements (weight = 0.1)Local contents 0.25Others 0.1

183
3.2. The Results
The results of our assessment are shown in Table 3.2. Overall scores for ASEAN9
countries range between 0.175 (Singapore) and 0.463 (Myanmar) with a simple average
of 0.337. Other countries register the following scores in ascending order (from more
open to more closed environment); the Philippines (0.237), Cambodia (0.242), Thailand
(0.300), Vietnam (0.315), Indonesia (0.375), Brunei (0.394), Lao, PDR (0.428),
Malaysia (0.438). As the scoring is undertaken in such a way that the low score
indicates an open FDI policy regime, our results show that FDI policy regimes in
Singapore, the Philippines, and Cambodia are relatively open, while those in Myanmar,
Malaysia and Lao PDR are relatively closed.

184
Table 3.2. Assessment of FDI Policy Regimes of ASEAN Countries
Table 3.2 Assessment of FDI Policy Regimes of ASEAN Countries
Total score Market National Screening Board of Movement Performance
access treatment & appraisal directors of investors requirement
weight 1 0.4 0.2 0.1 0.1 0.1 0.1Brunei 0.394 0.243 0.795 0.434 0.590 0.180 0.180Cambodia 0.242 0.140 0.183 0.622 0.000 0.750 0.117Indonesia 0.375 0.364 0.198 0.789 0.308 0.546 0.255Lao, PDR 0.428 0.392 0.410 0.608 0.250 0.793 0.245Malaysia 0.438 0.320 0.833 0.250 0.397 0.562 0.227Myanmar 0.463 0.378 0.401 0.921 0.399 0.714 0.284Philippines 0.237 0.257 0.279 0.112 0.519 0.043 0.107Singapore 0.175 0.197 0.143 0.154 0.356 0.074 0.091Thailand 0.300 0.423 0.000 0.500 0.000 0.805 0.000Vietnam 0.315 0.338 0.262 0.364 0.286 0.469 0.152Average 0.339 0.305 0.350 0.475 0.310 0.494 0.194Standard deviation 0.100 0.092 0.272 0.266 0.193 0.296 0.113Note: See the main text for the explanation of the scoring systemSource: Authors' computationNote: See the main text for the explanation of the scoring system
Source: Authors’ computation

185
Examining the average scores for the ASEAN countries by issue areas, one finds
that ASEAN countries have restrictive FDI regimes in the areas of the movement of
investors and the screening and appraisal procedures for FDI applications, as their
average scores are similarly high at 0.494 and 0.475, respectively, compared to an
overall average of 0.339. Having pointed out the problems with the movement of
investors and screening and appraisal procedures for FDI applications in the ASEAN
countries, it should be noted that there are wide variations in these scores among the
ASEAN countries, reflecting a diversity in the seriousness of those problems among
them, as shown by high standard deviations. Movement of investors is particularly
restrictive in Thailand, Cambodia, and Myanmar, while screening and appraisal
procedures are particularly restrictive in Myanmar, Indonesia, Cambodia and Lao, PDR.
The lack of national treatment is a serious problem in Malaysia and Brunei. In
Malaysia there are a number of cases where foreign companies are not treated equally
with local companies. For example, foreign companies are only allowed to acquire land
up to a certain amount. In several industrial sectors foreign companies are required to
form joint ventures with local companies. In Brunei the government reserves the right
to impose any restrictions with respect to national treatment. Restrictions on boards of
directors and management composition are rather severe in Brunei and the Philippines,
where the majority of board directors have to be local.
Let us examine the restriction on the right of establishment, or market access, which
is considered to be the most important policy regarding inward FDI. Table 3.3 shows
the results of our assessment of market access for the ASEAN countries by sector.

186
Before analyzing the restrictions on market access by country, we first look at
restrictions on market access by sectors for ASEAN as a whole. The sector with the
most restrictive market access regulation is found to be public administration and
defense. Electricity, gas, steam and air conditioning supply, information and
communications, and arts, entertainment, and recreation have quite restrictive regulation
of market access. By contrast, market access regulation is rather relaxed in
manufacturing and accommodation and food service activities. Turning to the market
access restrictions by country, we find that tight restrictions are imposed in Thailand,
Lao PDR, Myanmar, and Indonesia. In Thailand many sectors, except for
manufacturing, set an upper limit to foreign equity ownership, while in Lao PDR,
Myanmar and Indonesia, FDI is not allowed in several sectors. In Lao PDR, market
access is not allowed in information and communication, and public administration,
while in Myanmar market access is not allowed in the following sectors, information
and communication, financial and insurance businesses, and public administration. In
Indonesia, market access is very limited in real estate activities and public
administration.

187
Table 3.3. Assessment of Market Access in FDI Policies of ASEAN Countries
Table 3.3 Assessment of Market Access in FDI Policies of ASEAN Countries
Average Brunei Cambodia Indonesia Lao PDR Malaysia Myanmar Philippines Singapore Thailand VietnamAll sectors 0.305 0.243 0.140 0.364 0.392 0.320 0.378 0.257 0.197 0.423 0.338A - Agriculture, forestry and fishing 0.270 0.10 0.10 0.40 0.50 0.10 0.45 0.35 0.00 0.50 0.20B - Mining and quarrying 0.205 0.02 0.20 0.04 0.30 0.20 0.55 0.30 0.00 0.34 0.10C - Manufacturing 0.116 0.05 0.10 0.21 0.27 0.13 0.09 0.10 0.00 0.16 0.05D - Electricity, gas, steam and air conditioning supply 0.575 1.00 0.10 0.20 0.75 0.60 0.90 0.30 0.90 0.50 0.50E - Water supply; sewerage, waste management andremediation activities 0.330 1.00 0.10 0.05 0.10 0.70 0.10 0.30 0.25 0.50 0.20
F - Construction 0.286 0.28 0.10 0.29 0.84 0.00 0.10 0.15 0.00 0.50 0.60G - Wholesale and retail trade; repair of motor vehicles andmotorcycles 0.238 0.00 0.10 0.23 0.20 0.30 0.10 0.05 0.10 0.50 0.80
H - Transportation and storage 0.418 0.20 0.10 0.60 0.42 0.36 0.80 0.50 0.20 0.50 0.50I - Accommodation and food service activities 0.163 0.00 0.10 0.30 0.10 0.38 0.10 0.05 0.00 0.50 0.10J - Information and communication 0.445 0.00 0.20 0.53 0.47 0.60 1.00 0.40 0.25 0.50 0.50K - Financial and insurance activities 0.315 0.00 0.10 0.53 0.10 0.43 1.00 0.20 0.14 0.50 0.15L - Real estate activities 0.380 0.00 0.75 1.00 0.10 0.75 0.10 0.50 0.10 0.50 0.00M - Professional, scientific and technical activities 0.266 0.11 0.10 0.24 0.10 0.23 0.49 0.55 0.14 0.50 0.20N - Administrative and support service activities 0.260 0.00 0.10 0.60 0.28 0.10 0.55 0.35 0.02 0.50 0.10O - Public administration and defence; compulsory socialsecurity 0.770 1.00 0.10 1.00 1.00 0.60 1.00 0.50 1.00 0.50 1.00
P - Education 0.325 0.00 0.10 0.25 0.10 0.60 0.10 0.50 1.00 0.50 0.10Q - Human health and social work activities 0.227 0.00 0.10 0.62 0.10 0.00 0.10 0.15 0.00 0.50 0.70R - Arts, entertainment and recreation 0.419 0.25 0.10 0.56 1.00 0.65 0.10 0.15 0.00 0.38 1.00S - Other service activities 0.177 0.33 0.10 0.00 0.40 0.00 0.10 0.00 0.03 0.50 0.30T - Activities of households as employers; undifferentiatedgoods- and services-producing activities of households for ownuse
0.120 0.00 0.10 0.00 1.00 0.00 0.10 0.00 0.00 0.00 0.00
U - Activities of extraterritorial organizations and bodies 0.105 0.75 0.10 0.00 0.10 0.00 0.10 0.00 0.00 0.00 0.00Note: See the main text for the explanation of the scoring systemSource: Authors' computationNote: See the main text for the explanation of the scoring system
Source: Authors’ computation

188
Concerning performance requirements, Thailand does not impose any such
restrictions. Singapore imposes a minimum scale on ships owned by foreign investors.
In Cambodia, foreign investors are required to provide adequate training to Cambodian
employees, and to promote Cambodian staff to senior positions over time. In Lao PDR,
local content requirements are imposed in several manufacturing sectors such as leather
products and wood products. In Malaysia export targets, technology transfer and local
content requirements are imposed in the manufacturing sector. In the Philippines export
requirements are imposed for obtaining incentives, while preferences have to be given
to local employees in the electricity sector. In Vietnam foreign firms have to comply
with environment protection requirements.
Our analysis of FDI policy regimes for ASEAN revealed wide variations in the
openness/restrictiveness of the regimes among them. The movement of investors,
screening and appraisal are found to be serious impediments in several countries. As for
the policy on market access, it is worth noting that services sectors such as information
and communication are quite restrictive. Recognizing that service sectors occupy a
large and important part of economic activity in ASEAN countries, provision of greater
market access to foreign companies can contribute to an improvement of allocative and
technical efficiency of these countries. A justified fear of market domination by
competitive foreign companies should be dealt with appropriate competition policy.

189
4. Assessment of FDI Environments based on a Survey of Firms
This section analyzes the FDI environments of ASEAN countries by using the
information obtained from a survey conducted on Japanese firms. First, we discuss the
methodology used for the analysis and then undertake the analysis.
4.1. The Methodology and the Data used for the Analysis
We classify the problems and obstacles faced by Japanese firms operating in
ASEAN countries into ten categories (Table 4.1). The ten categories are divided into
two groups, one consisting of four categories of problems related to FDI liberalization
and six categories of problems related to FDI facilitation. This classification, which has
been proposed by Urata et al.(2007), is based on a literature survey and discussions
among the members of a committee including representatives of APEC Business
Advisory Council (ABAC) Japan, the Japan Machinery Center for Trade and
Investment (JMC), the Ministry of Trade, Investment, and Industry (METI) Japan, and
university professors (APEC Study Committee with JMC as the secretariat in 2007).
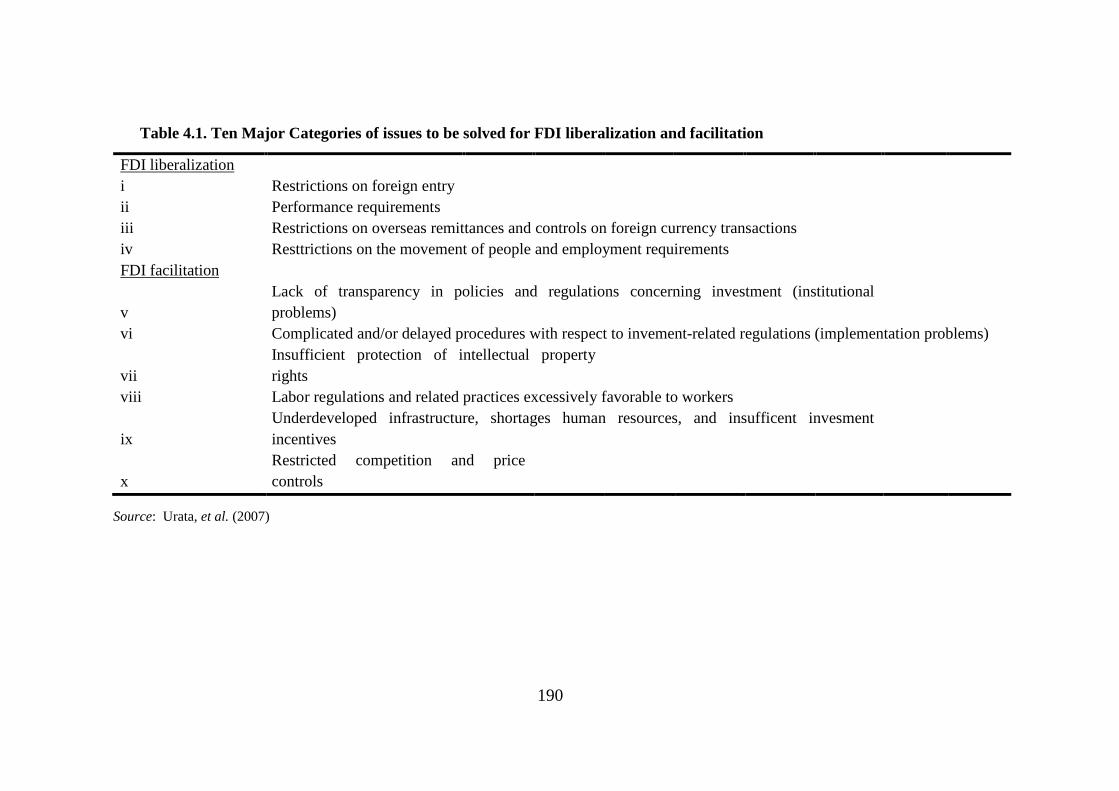
190
Table 4.1. Ten Major Categories of issues to be solved for FDI liberalization and facilitation
FDI liberalization i Restrictions on foreign entry
ii Performance requirements iii Restrictions on overseas remittances and controls on foreign currency transactions
iv Resttrictions on the movement of people and employment requirements
FDI facilitation
v
Lack of transparency in policies and regulations concerning investment (institutional problems)
vi Complicated and/or delayed procedures with respect to invement-related regulations (implementation problems)
vii Insufficient protection of intellectual property rights
viii Labor regulations and related practices excessively favorable to workers
ix Underdeveloped infrastructure, shortages human resources, and insufficent invesment incentives
x
Restricted competition and price controls
Source: Urata, et al. (2007)

191
The four categories of impediments concerning FDI liberalization are i) restrictions
on foreign entry, ii) performance requirements, iii) restrictions on overseas remittances
and controls on foreign exchange, and iv) restrictions on the movement of people and
employment requirements.7
Category i) “restrictions on foreign entry”, for instance, includes prohibited or
restricted foreign entry into specific sectors, regulations on maximum foreign ownership
ratios (foreign equity participation), joint venture requirements, minimum capital
requirements, restricted forms of commercial presence (regulations on the forms of
establishments), restrictions on land ownership by foreign-owned firms. Category ii)
“performance requirements” includes local content requirements and export
requirements/ technology transfer requirements linked with various FDI incentives.
Category iii) “restrictions on overseas remittances and controls on foreign currency
transactions” includes restrictions or difficulties in making overseas remittances,
restrictions on the possession and use of foreign currencies, difficulties in access
to/exchange of local currencies. The last category among impediments concerning FDI
liberalization is iv) “restrictions on the movement of people and employment
requirements”, which includes difficulties in obtaining and/or renewing necessary visas
for foreign representatives, and requirements on the employment of local people (or
7 Category i) corresponds to 1.restrictions on foreign entry and 21.restrictions on foreign ownership
of land in the JMC survey. Similarly, category ii) corresponds to 2.local content requirements,
3.export requirements, and 18.technology transfer requirements: category iii) 11.foreign remittances,
12.control of foreign exchange, and category iv) 16.employment in the JMC survey.
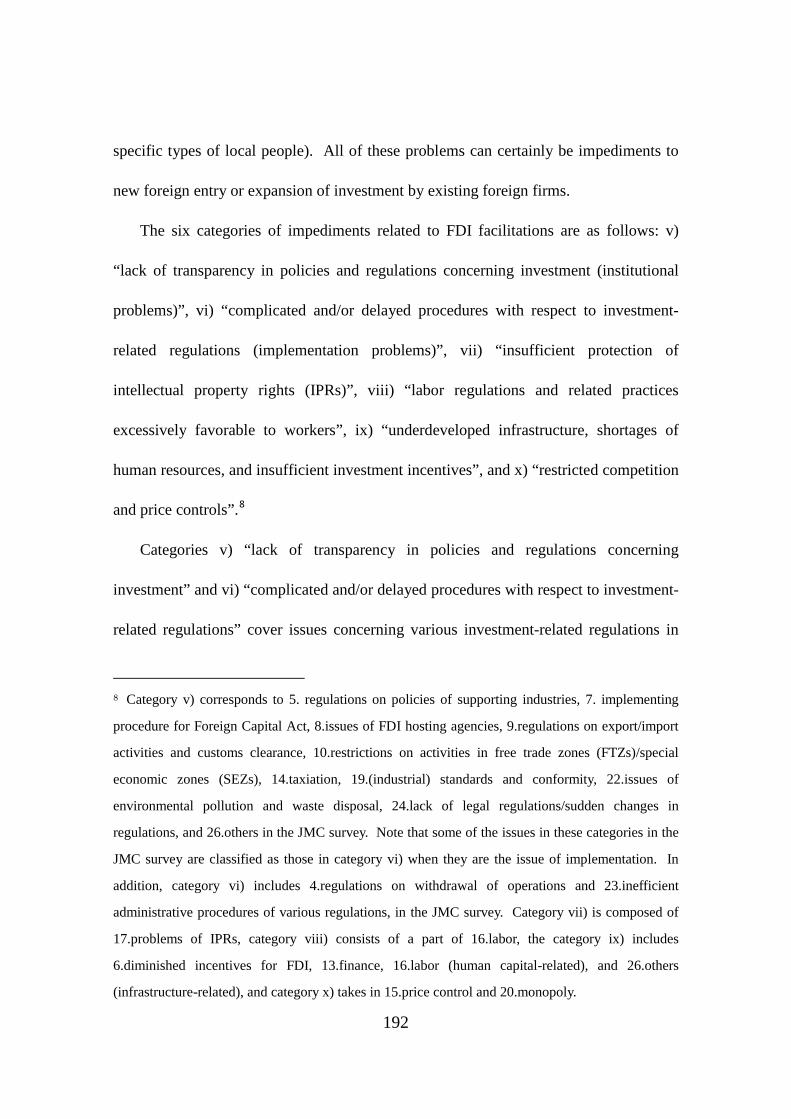
192
specific types of local people). All of these problems can certainly be impediments to
new foreign entry or expansion of investment by existing foreign firms.
The six categories of impediments related to FDI facilitations are as follows: v)
“lack of transparency in policies and regulations concerning investment (institutional
problems)”, vi) “complicated and/or delayed procedures with respect to investment-
related regulations (implementation problems)”, vii) “insufficient protection of
intellectual property rights (IPRs)”, viii) “labor regulations and related practices
excessively favorable to workers”, ix) “underdeveloped infrastructure, shortages of
human resources, and insufficient investment incentives”, and x) “restricted competition
and price controls”.8
Categories v) “lack of transparency in policies and regulations concerning
investment” and vi) “complicated and/or delayed procedures with respect to investment-
related regulations” cover issues concerning various investment-related regulations in
8 Category v) corresponds to 5. regulations on policies of supporting industries, 7. implementing
procedure for Foreign Capital Act, 8.issues of FDI hosting agencies, 9.regulations on export/import
activities and customs clearance, 10.restrictions on activities in free trade zones (FTZs)/special
economic zones (SEZs), 14.taxiation, 19.(industrial) standards and conformity, 22.issues of
environmental pollution and waste disposal, 24.lack of legal regulations/sudden changes in
regulations, and 26.others in the JMC survey. Note that some of the issues in these categories in the
JMC survey are classified as those in category vi) when they are the issue of implementation. In
addition, category vi) includes 4.regulations on withdrawal of operations and 23.inefficient
administrative procedures of various regulations, in the JMC survey. Category vii) is composed of
17.problems of IPRs, category viii) consists of a part of 16.labor, the category ix) includes
6.diminished incentives for FDI, 13.finance, 16.labor (human capital-related), and 26.others
(infrastructure-related), and category x) takes in 15.price control and 20.monopoly.

193
terms of institutional problems and implementation problems, respectively. Category v)
“lack of transparency in policies and regulations concerning investment” is specifically
concerned with sudden and/or frequent changes (without notification in advance), non-
transparency, ambiguity in various investment-related regulations and lack of certain
regulations, while category vi) “complicated and/or delayed procedures with respect to
investment-related regulations” covers problems in implementing regulations on
establishments, approval of foreign entry, taxation, customs clearance,
withdrawal/reorganization of operations, arbitrary and/or inconsistent interpretation and
implementation of various regulations, and other such matters. Examples of problems
in categories vii) “insufficient protection of IPRs”, viii) “labor regulations and related
practices excessively favorable to workers”, ix) “underdeveloped infrastructure,
shortages of human resources, and insufficient investment incentives”, and x) “restricted
competition and price controls” include the following: insufficient protection of IPRs
and issues involving patents for category vii), non-modern labor regulations that are
excessively favorable to workers, such as difficulty in firing workers, drastic/frequent
changes in minimum wage levels, never decreasing wages, and restrictions on
temporary workers for category viii), underdeveloped physical infrastructure and
logistics, shortages of human resources such as management staff and engineers, and
high turnover ratios for category ix), and oligopolistic market structure and
monopolistic pricing for category x).
Most of the problems classified into categories iv) to x) are not necessarily
discriminatory measures aimed at foreigners but are, rather, domestic problems inside

194
the borders. These impediments could, however, directly and indirectly prevent
potential investment from entering the economy. In other words, if a country solves
these problems and improves the investment climate, it would receive a larger amount
of investment than without such an improvement. Out of 10 major categories for FDI
liberalization and facilitation, six are those concerning FDI facilitation. We emphasize
the importance of implementing FDI facilitation measures, in addition to FDI
liberalization measures, as will be discussed in the following section.
We conduct the analysis based on the methodology discussed above by using
information obtained from the survey conducted by the Japan Machinery Center (JMC)
for Trade and Investment. The JMC has annually collected and compiled the detailed
survey, “Issues and Requests for Trade and Investment Activities by Country/Region”.
This survey is based on responses to the “questionnaire on the problems in trade,
investment, and production activities abroad,” conduced by the Japan Business Council
for Trade and Investment Facilitation (JBCTIF). The JBCTIF has approximately 150
industry associations as members. The respondents to the questionnaire are its members
involved in trade and FDI activities. We employ the 2009 version of the JMC survey
(JMC survey 2009 hereafter), which was conducted from December 2008 to January
2009, with responses from 38 industry associations (in the case of ASEAN10). For a
comparison, we also employ the results in Urata et al. (2007) , based on the 2005
version of this survey (JMC survey 2005 hereafter) and Urata and Ando (2009) based
on the 2008 version (JMC survey 2008).

195
4.2. The Results
Table 4.2 summarizes the results of our analysis of the investment climate in 2009
in the ASEN10 countries, showing the number of incidents by category and country.
Since the JMC survey deals with precisely the problems raised by firms in many
industry associations which are members of the BCTIF, we first collect all the
information on the countries concerned and identify the problems by country. We then
classify these problems into 10 categories and collate them for all the countries, as
shown in Table A.4.1 in the Appendix. Table 4.2 is constructed based on Table A.4.1.
For a comparison, Table 4.3 presents the results of a similar analysis of the investment
climate in 2008 and 2005.

196
Table 4.2. Investment Climate in ASEAN 10 Economies in 2009: The Number of Incidents by Category and Country
Data source: authors' calculation, based on Toyo Keizai (2008) for (a) the number of Japanese affilates abroad and JMC (2009) for (b) the issues to be solved for FDI. Note: Japanese affiliates aborad are here defined as those with Japanese ownership of no less than 10%.
Bru
nei
Cam
bodi
a
Indo
nesi
a
Laos
Mal
aysi
a
Mya
mm
ar
Phili
ppin
es
Sing
apor
e
Thai
land
Vie
t Nam
Tota
l
Shar
e by
ca
tego
ry
(a) The number of Japanese affiliates in each country 1 10 659 6 759 10 419 991 1,577 332 4,764
(b) Issues to be solved for FDI liberalization and facilitationFDI liberalization 0 0 17 0 11 8 10 1 19 8 74 20%i) Restrictions on foreign entry 0 0 10 0 5 2 7 0 8 3 35 10%
ii) Performance requirements 0 0 3 0 3 0 0 0 3 2 11 3%
iii) Restrictions on overseas remittances and controls on foreign currency transactions
0 0 2 0 1 6 2 0 5 2 18 5%
iv) Restrictions on the movement of people and employment requirements
0 0 2 0 2 0 1 1 3 1 10 3%
FDI facilitation 0 14 51 4 44 20 42 6 50 58 289 80%
v) Lack of transparency in policies and regulations concerning investment (institutional problems)
0 5 13 0 13 8 7 0 12 18 76 21%
vi) Complicated and/or delayed procedures with respect to investment-related regulations (implementation problems)
0 3 23 1 14 7 16 0 24 19 107 29%
vii) Insufficient protection of intellectual property rights 0 0 1 0 2 0 3 0 1 1 8 2%
viii) Labor regulations and related practices excessively favorable to workers
0 0 2 0 5 0 10 3 3 4 27 7%
ix) Underdeveloped infrastructure, shortages of human resources, and insufficient investment incentives
0 6 9 3 8 5 6 3 9 13 62 17%
x) Restricted competition and price controls 0 0 3 0 2 0 0 0 1 3 9 2%
Total 0 14 68 4 55 28 52 7 69 66 363 100%

197
Table 4.3. Investment Climate in ASEAN 10 Economies in 2008 and 2005 : The Number of Incidents by Category and Country Table 4.3 Investment climate in ASEAN economies in 2008 and 2005: the number of incidents by category and country
Bru
nei
Cam
bodi
a
Indo
nesi
a
Laos
Mal
aysi
a
Mya
nmar
Phili
ppin
es
Sing
apor
e
Thai
land
Vie
t Nam
Tota
l
Shar
e by
cate
gory
(%
)
Bru
nei
Indo
nesi
a
Mal
aysi
a
Phili
ppin
es
Sing
apor
e
Thai
land
Vie
t Nam
Tota
l (20
05)
Tota
l (20
08)
Tota
l (20
09)
FDI liberalization 0 0 14 0 11 7 9 1 15 9 66 21% 0 10 17 11 3 16 16 73 59 66
i) Restrictions on foreign entry 0 0 10 0 5 2 6 0 8 4 35 11% 0 5 4 6 1 6 5 27 33 33
ii) Performance requirements 0 0 2 0 3 0 0 0 2 2 9 3% 0 2 5 2 0 1 5 15 9 11
iii) Restrictions on overseas remittances and controls on foreigncurrency transactions 0 0 0 0 1 5 2 0 3 2 13 4% 0 1 4 1 0 3 4 13 8 12
iv) Restrictions on the movement of people and employmentrequirements 0 0 2 0 2 0 1 1 2 1 9 3% 0 2 4 2 2 6 2 18 9 10
FDI facilitation 0 16 28 4 33 21 48 6 45 49 250 79% 1 52 36 37 6 53 34 219 209 251
v) Lack of transparency in policies and regulations concerninginvestment (institutional problems) 0 5 5 1 8 8 11 0 14 12 64 20% 1 14 10 10 1 14 6 56 50 63
vi) Complicated and/or delayed procedures with respect toinvestment-related regulations (implementation problems) 0 5 11 1 10 7 16 0 20 18 88 28% 0 21 14 12 0 24 14 85 75 96
vii) Insufficient protection of intellectual property rights 0 0 2 0 3 0 3 0 2 1 11 3% 0 4 3 1 0 2 2 12 11 8
viii) Labor regulations and related practices excessively favorableto workers 0 0 2 0 5 0 10 3 3 4 27 9% 0 3 5 6 3 3 2 22 27 27
ix) Underdeveloped infrastructure, shortages of humanresources, and insufficient investment incentives 0 6 6 2 7 5 8 3 5 11 53 17% 0 8 4 8 2 9 8 39 40 48
x) Restricted competition and price controls 0 0 2 0 0 1 0 0 1 3 7 2% 0 2 0 0 0 1 2 5 6 9
Total 0 16 42 4 44 28 57 7 60 58 316 100% 1 62 53 48 9 69 50 292 268 317
Data source: Urata, Ando, and Ito (2007), Urata and Ando (2009), and Table 4.1.
ASEAN10 in 2008 ASEAN72005
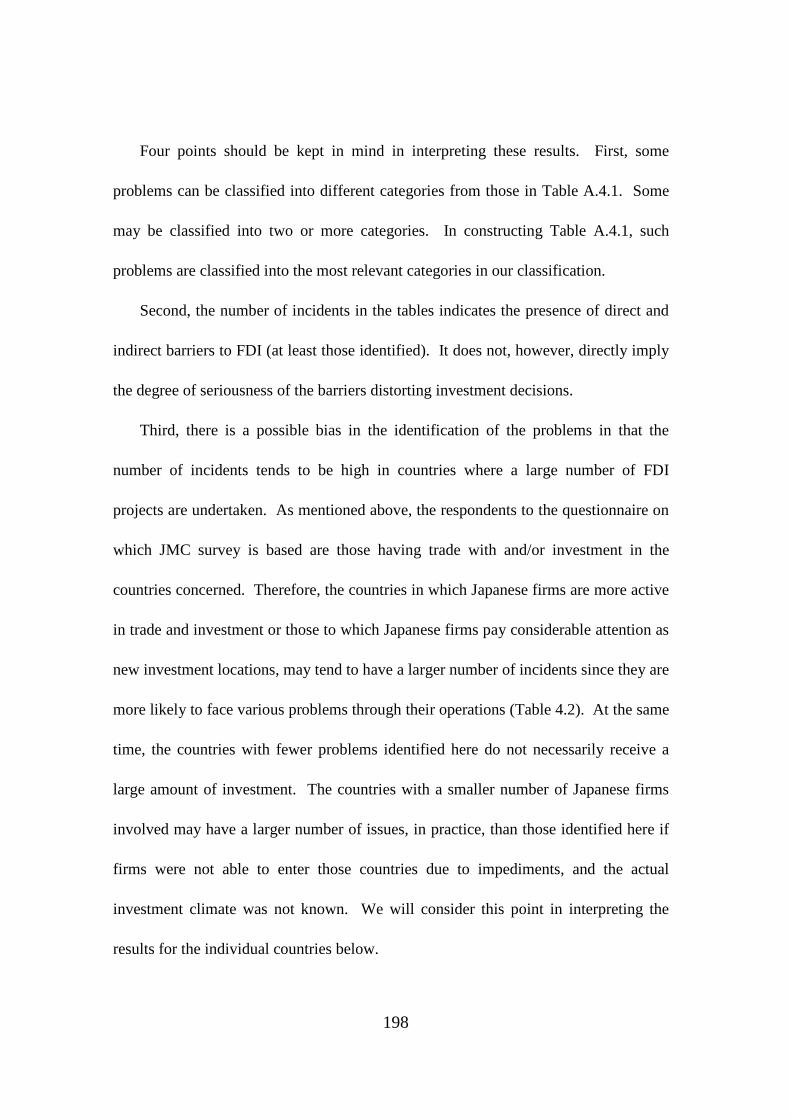
198
Four points should be kept in mind in interpreting these results. First, some
problems can be classified into different categories from those in Table A.4.1. Some
may be classified into two or more categories. In constructing Table A.4.1, such
problems are classified into the most relevant categories in our classification.
Second, the number of incidents in the tables indicates the presence of direct and
indirect barriers to FDI (at least those identified). It does not, however, directly imply
the degree of seriousness of the barriers distorting investment decisions.
Third, there is a possible bias in the identification of the problems in that the
number of incidents tends to be high in countries where a large number of FDI
projects are undertaken. As mentioned above, the respondents to the questionnaire on
which JMC survey is based are those having trade with and/or investment in the
countries concerned. Therefore, the countries in which Japanese firms are more active
in trade and investment or those to which Japanese firms pay considerable attention as
new investment locations, may tend to have a larger number of incidents since they are
more likely to face various problems through their operations (Table 4.2). At the same
time, the countries with fewer problems identified here do not necessarily receive a
large amount of investment. The countries with a smaller number of Japanese firms
involved may have a larger number of issues, in practice, than those identified here if
firms were not able to enter those countries due to impediments, and the actual
investment climate was not known. We will consider this point in interpreting the
results for the individual countries below.

199
Fourth, most problems identified are those related to manufacturing activities.
Since the major activity of most respondents is manufacturing, impediments to FDI in
non-manufacturing sectors might be underestimated.
Table 4.2 and Figure 4.1 give an overall picture of direct and indirect impediments
to investment in ASEAN10. Various sorts of indirect barriers to FDI exist in the
region: 80 percent of the total problems identified (287 out of 362) are concerned with
FDI facilitation. This finding indicates that there is plenty of room to improve FDI
facilitation in order to promote FDI in ASEAN. In particular, more than half the
problems fall into two categories v) institutional problems (lack of transparency in
policies and regulations on investment) and vi) implementation problems (complicated
and/or delayed procedures with respect to investment-related regulations; these
account for 21 percent and 30 percent of the total incidents, respectively. Although
neither institutional nor implementation problems are necessarily discriminatory
against foreign firms, as discussed above, they need to be resolved to promote
investment activity in the region.

200
Figure 4.1 Decomposition of the incidents into 10 categories: ASEAN10 in 2009
Data source: Table 4.2.Note: i) to iv) indicates four categories for FDI liberalization and v) to x) indicatessix categories for FDI facilitation. Figures express shares of each category. SeeTable 4.1 for 10 categories.
i)10% ii)
3%iii)5%
iv)3%
v)21%
vi)30%
vii)2%
viii)7%
ix)17%
x)2%
Figure 4.1. Decomposition of the incidents into 10 categories: ASEAN 10 in 2009
Data source: Table 4.2.
Note: i)to iv) indicates four categories for FDI liberalization and v) to x) indicates six categories
for FDI facilitation. Figures express shares of each category. See Table 4.1. for 10 categories.

201
The major problems identified in many countries for category v) are
underdevelopment, lack of transparency, ambiguity, sudden changes, frequent changes,
and uncertainty of various legal regulations and institutions, particularly those
concerning taxation, investment incentives, safety and environmental standards and
conformity, and financial markets, including exchange rates. The major problems for
category vi) are complexity, delay, difficulty, and inefficiency of various
administrative procedures, arbitrary interpretation in implementing regulations,
corruption, smuggling, particularly complicated customs clearance procedures,
delayed, difficult, inefficient, and complicated procedures for visa application and
renewal, import tariff reimbursement/exemption, value-added tax exemption
(including non-implementation) procedures, taxation, and withdrawal of business,
arbitrary and/or inconsistent interpretation and implementation of safety certification,
customs clearance, and arbitrary tax collection.9
Categories v) and vi) are followed by another category classified under FDI
facilitation, category ix) underdeveloped infrastructure, shortages of human resources,
and insufficient investment incentives (17 percent of total incidents). It suggests that
an access to necessary infrastructure, human resources, and investment incentives is
also an important factor for firms in making the decision to entering a new country or
expand operations in the host country. Major problems in category ix) are as
follows: difficulty in hiring and securing human resources due to shortages of
management staff and engineers, high turnover ratios, underdevelopment of industrial
9 Delays in procedures are sometimes a result of their complicated nature.

202
infrastructure such as electric power, paved roads and transportation, and ports,
insufficient investment incentives for the development of supporting industries, and
immaturity of financial markets.
Categories other than v), vi), and ix) are arranged in descending order in terms of
the percentage of the total number of incidents: category i) restrictions on foreign
entry (10 percent), category viii) labor regulations and related practices excessively
favorable to workers (7 percent), category iii) restrictions on overseas remittances and
controls on foreign currency transactions (5 percent), category ii) performance
requirements (3 percent) category iv) restrictions on the movement of people and
employment requirement (3 percent), category vii) insufficient protection of IPRs (2
percent) and category x) restricted competition and price controls (2 percent).
Although relatively low percentages for the categories for FDI liberalization imply
that issues involving direct barriers to FDI (problems preventing FDI liberalization)
are not so serious as those involving indirect barriers to FDI (problems preventing FDI
facilitation) in the region, they are critical impediments in some low-income countries.
Major problems for category i) include prohibition of or restrictions on foreign
entry (for specific sectors), restrictions on foreign ownership ratios, joint venture
requirements (with specified business partners), and restrictions on foreign ownership
of land. The problems for category viii) include difficulty in firing workers, wage-
related issues such as rapidly rising wage levels, dramatic increases in minimum wage
levels, and no allowance for lowering wage levels, and labor regulations and related
practices that are excessively favorable to workers. The problems for category iv)

203
include a nationality requirement for directors, restrictions on hiring foreigners
including requirements of hiring local people (or specific types of local people), and
difficulty and tightened issuance conditions in obtaining and/or renewing visas. The
problems for category vii) include widespread counterfeiting of goods and pirated
copying due to insufficient protection of IPRs, lack of intellectual property rights
treaties, and infringements of trademark rights and patents. Those for category ii)
include local content requirements and their strengthening, and investment incentives
linked with export requirements, technological transfer requirements, and hiring local
people. Those for category iii) include restrictions on overseas remittances and
restrictions on the amounts, payment by, and use of foreign currencies. Those for
category x) include monopolistic energy supply and discriminatory raising of its prices,
and discriminatory pricing for loads at ports.
To capture changes in the investment climate in ASEAN countries, let us compare
the patterns of pervasiveness of the identified problems in 2009, with those in 2005
provided by Urata et al.(2007) and those in 2008 provided by Urata and Ando (2009).
ASEAN countries available for a comparison between 2009/2008 and 2005 are
composed of seven countries that are the members both of ASEAN and APEC. Table
4.3 presents the results for the investment climate in 2008 in ASEAN10 and that in
2005 in ASEAN7: it shows the number of incidents by category and country. As the
figure suggests, ASEAN7 as a whole saw a decline in the number of the issues directly
preventing FDI, while it saw an increase in the number of issues indirectly preventing
FDI: the number of incidents drops from 73 to 66 for FDI liberalization, though the

204
number of incidents rises from 219 to 251 for FDI facilitation. In particular, issues
due to complicated and/or delayed procedures with respect to investment-related
regulations (implementation problems) increase from 85 to 96. This suggests that
ASEAN countries explicitly improved their investment climate, but at the same time,
more and more indirect barriers to FDI emerged, partly reflecting more active and
deepening operations by Japanese firms in ASEAN countries than before, who are
therefore more likely to face various problems through their operations.
Wide variations among the ASEAN countries, however, do exit. Although we
cannot strictly conduct a comparative analysis among the countries due to the nature
of the survey, the tables provide several interesting findings. First, various problems
have prevailed in Indonesia, Malaysia, the Philippines, Thailand, and Vietnam.
Second, among those five countries, Indonesia (from 62 to 67), the Philippines (from
48 to 53), and Vietnam (from 50 to 66) have increased in the total number of issues by
five or above. In particular, in the Philippines and Vietnam, countries recently
attracting new FDI, the number of incidents increased substantially in categories for
institutional problems, and implementation problems for investment-related policies
and regulations and labor regulations, and practices excessively favorable to workers.
Third, Indonesia and Thailand have increased in the number of issues identified in
categories for FDI liberalization and decreased in the number for FDI facilitation,
while the opposite is true for Malaysia. The Philippines and Vietnam are unchanged
or have increased in both categories for FDI liberalization and facilitation.
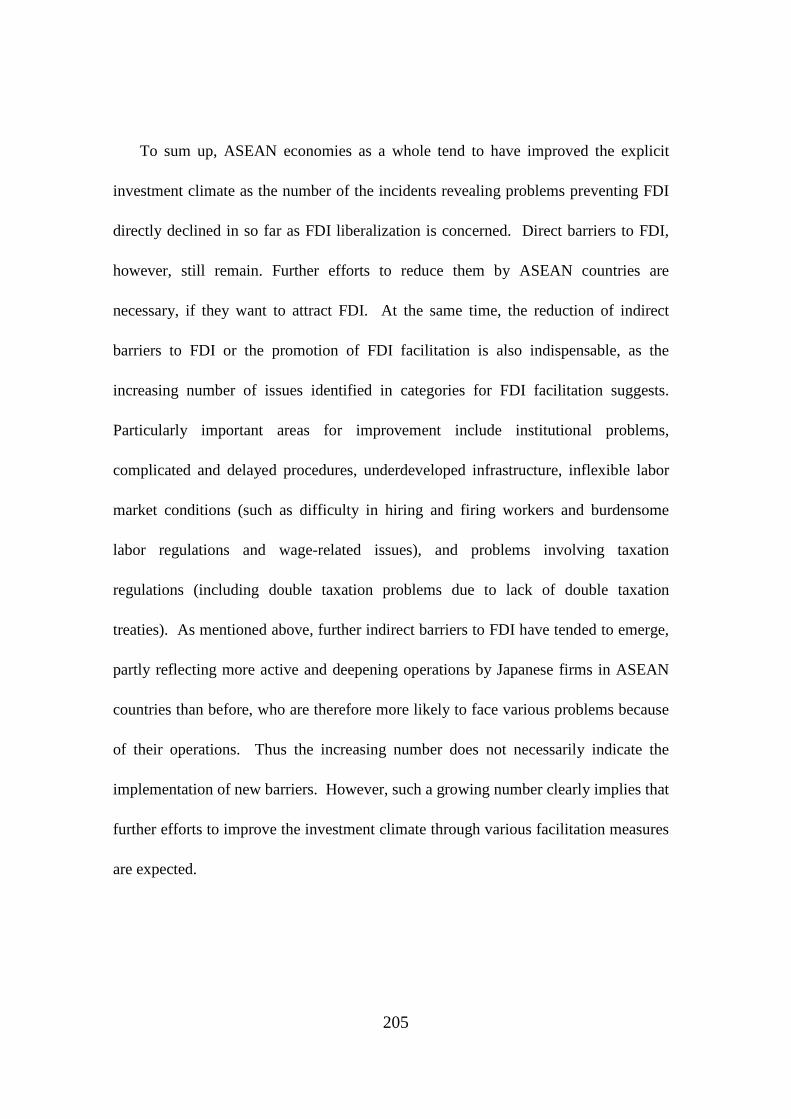
205
To sum up, ASEAN economies as a whole tend to have improved the explicit
investment climate as the number of the incidents revealing problems preventing FDI
directly declined in so far as FDI liberalization is concerned. Direct barriers to FDI,
however, still remain. Further efforts to reduce them by ASEAN countries are
necessary, if they want to attract FDI. At the same time, the reduction of indirect
barriers to FDI or the promotion of FDI facilitation is also indispensable, as the
increasing number of issues identified in categories for FDI facilitation suggests.
Particularly important areas for improvement include institutional problems,
complicated and delayed procedures, underdeveloped infrastructure, inflexible labor
market conditions (such as difficulty in hiring and firing workers and burdensome
labor regulations and wage-related issues), and problems involving taxation
regulations (including double taxation problems due to lack of double taxation
treaties). As mentioned above, further indirect barriers to FDI have tended to emerge,
partly reflecting more active and deepening operations by Japanese firms in ASEAN
countries than before, who are therefore more likely to face various problems because
of their operations. Thus the increasing number does not necessarily indicate the
implementation of new barriers. However, such a growing number clearly implies that
further efforts to improve the investment climate through various facilitation measures
are expected.

206
Discussion by country
In the following, we briefly discuss major problems by country.
For Brunei, no problems are identified in JMC Survey 2009, though one problem
was identified in JMC Survey 2005 in category v) lack of transparency in policies and
regulations concerning investment: ambiguity of government procurement procedures.
It should be noted that few Japanese affiliates operate in Brunei, leading to low
probability of incidents.
Brunei (0 incident, 1 Japanese affiliate)
10
The categories with issues identified are v) lack of transparency in policies and
regulations concerning investment (5),
Cambodia (14 incidents, 10 Japanese affiliates)
11
10 In Brunei, some non tariff measures (NTMs) are applied to many tariff lines, including technical
measures for food industries, automatic licensing measures and import quotas for machinery
industries, and automatic and non-automatic licensing measures for chemical and wooden
industries. These measures may influence the investment climate indirectly. See Ando (2009) and
Ando and Obashi (2009) for an analysis of NTMs, using frequency ratios of NTMs by type and
industry. 11 The number of incidents is shown in parenthesis.
vi) complicated and/or delayed procedures
with respect to investment-related regulations (3), and ix) underdeveloped
infrastructure, shortages of human resources, and insufficient investment incentives
(6). The examples include underdevelopment, ambiguity, and lack of transparency of
various legal regulations and institutions for category v), complexity of administrative

207
procedures of customs clearance, arbitrary interpretation in implementing customs and
taxations, and corruption for category vi), inadequate infrastructure such as electricity
supply, road and traffic, and telecommunication, and underdevelopment of financial
markets for category ix).
Major categories are vi) complicated and/or delayed procedures with respect to
investment-related regulations (23), v) lack of transparency in policies and regulations
concerning investment (13), i) restrictions on foreign entry (10), and ix)
underdeveloped infrastructure, shortages of human resources, and insufficient
investment incentives (9). While the number of incidents slightly declined in the
categories concerning FDI facilitation from 52 in 2005 to 50 in 2009, the number of
issues increased in those relating to FDI liberalization from 10 in 2005 to 14 in 2008
and 17 in 2009. As a result, the total number of incidents slightly increased from 62 in
2005 to 67 in 2009. One should note that the number of incidents of restrictions on
foreign entry, which is one of the categories for FDI liberalization, increased from 5 to
10. Such a change seems to have been caused by the introduction of a more restrictive
“new negative list” (in effect since July 2007) which specifies the sectors in which no
foreign entry is allowed, as well as sectors subject to certain conditions for foreign
equity participation, particularly in the service sectors. Examples include complexity,
delay, and inefficiency of various administrative procedures, arbitrary interpretation in
implementing regulations, and corruption under category vi), underdevelopment,
Indonesia (68 incidents, 659 Japanese affiliates)

208
ambiguity, and sudden and frequent changes of various legal regulations and
institutions under category v), restrictions on foreign ownership ratios in specific
sectors mainly in services sectors and joint venture requirements under category i),
and insufficient infrastructure under category ix).
Lao PDR (4 incidents, 6 Japanese affiliates)
The categories with issues identified are vi) complicated and/or delayed
procedures with respect to investment-related regulations (1) and ix) underdeveloped
infrastructure, shortages of human resources, and insufficient investment incentives
(3). Examples include delayed procedures for customs clearance under category vi)
and inadequate infrastructure such as road and traffic, and underdevelopment of
financial markets under category ix).
The number of incidents increased in categories for FDI facilitation, mainly in
categories covering institutional and implementation problems for investment-related
regulations. As a result, the total number of incidents slightly increased from 53 to 55
without change in the number of issues in categories for FDI liberalization. The major
categories are vi) complicated and/or delayed procedures with respect to investment-
related regulations (14), v) lack of transparency in policies and regulations concerning
investment (13), and ix) underdeveloped infrastructure, shortages of human resources,
and insufficient investment incentives (8). Examples include complexity, delays, and
Malaysia (55 incidents, 759 Japanese affiliates)
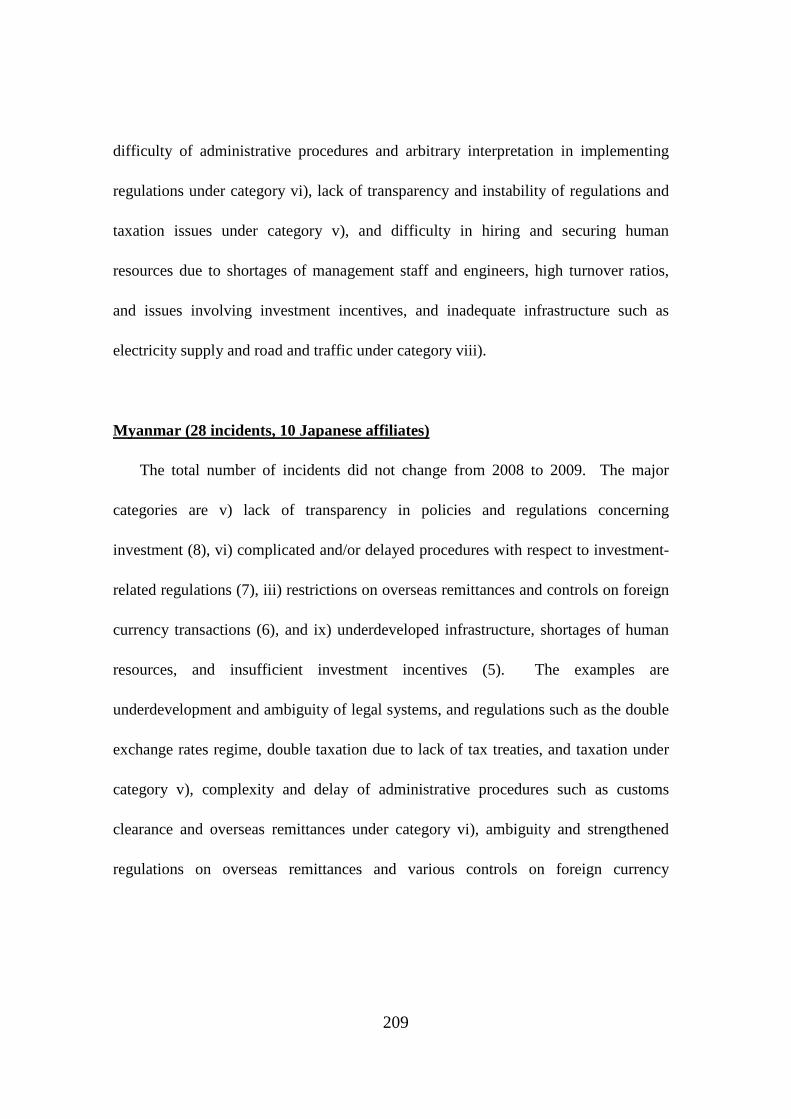
209
difficulty of administrative procedures and arbitrary interpretation in implementing
regulations under category vi), lack of transparency and instability of regulations and
taxation issues under category v), and difficulty in hiring and securing human
resources due to shortages of management staff and engineers, high turnover ratios,
and issues involving investment incentives, and inadequate infrastructure such as
electricity supply and road and traffic under category viii).
The total number of incidents did not change from 2008 to 2009. The major
categories are v) lack of transparency in policies and regulations concerning
investment (8), vi) complicated and/or delayed procedures with respect to investment-
related regulations (7), iii) restrictions on overseas remittances and controls on foreign
currency transactions (6), and ix) underdeveloped infrastructure, shortages of human
resources, and insufficient investment incentives (5). The examples are
underdevelopment and ambiguity of legal systems, and regulations such as the double
exchange rates regime, double taxation due to lack of tax treaties, and taxation under
category v), complexity and delay of administrative procedures such as customs
clearance and overseas remittances under category vi), ambiguity and strengthened
regulations on overseas remittances and various controls on foreign currency
Myanmar (28 incidents, 10 Japanese affiliates)

210
transactions under category iii), and underdevelopment or lack of infrastructure such
as electricity supply, ports, and airports under category ix).12
The number of incidents in the Philippines increased in categories for FDI
facilitation from 37 to 42, particularly due to a growing number of issues related to
implementation problems for investment-related policies and regulations and labor
regulations and practices excessively favorable to workers. Consequently, the total
number of incidents increased from 48 to 53, though the number of incidents did not
change in categories for FDI liberalization as a whole. The major categories are vi)
complicated and/or delayed procedures with respect to investment-related regulations
(16), viii) labor regulations and related practices excessively favorable to workers (10),
i) restrictions on foreign entry (8), v) lack of transparency in policies and regulations
concerning investment (7), and ix) underdeveloped infrastructure, shortages of human
resources, and insufficient investment incentives (6). The issues in the Philippines are
spread widely across many categories: complexity, delays, and inefficiency of
administrative procedures, arbitrary interpretation in implementing regulations, and
corruption under category vi), various labor restrictions under category viii), a
restrictions on foreign entry into specific sectors under category i), ambiguity, sudden
and frequent changes of regulations and standards and conformity issues under
category v), and high turnover ratios, underdeveloped infrastructure such as electricity
The Philippines (53 incidents, 419 Japanese affiliates)
12 See Ando (2009) for multiple exchange rate regimes in Myanmar.
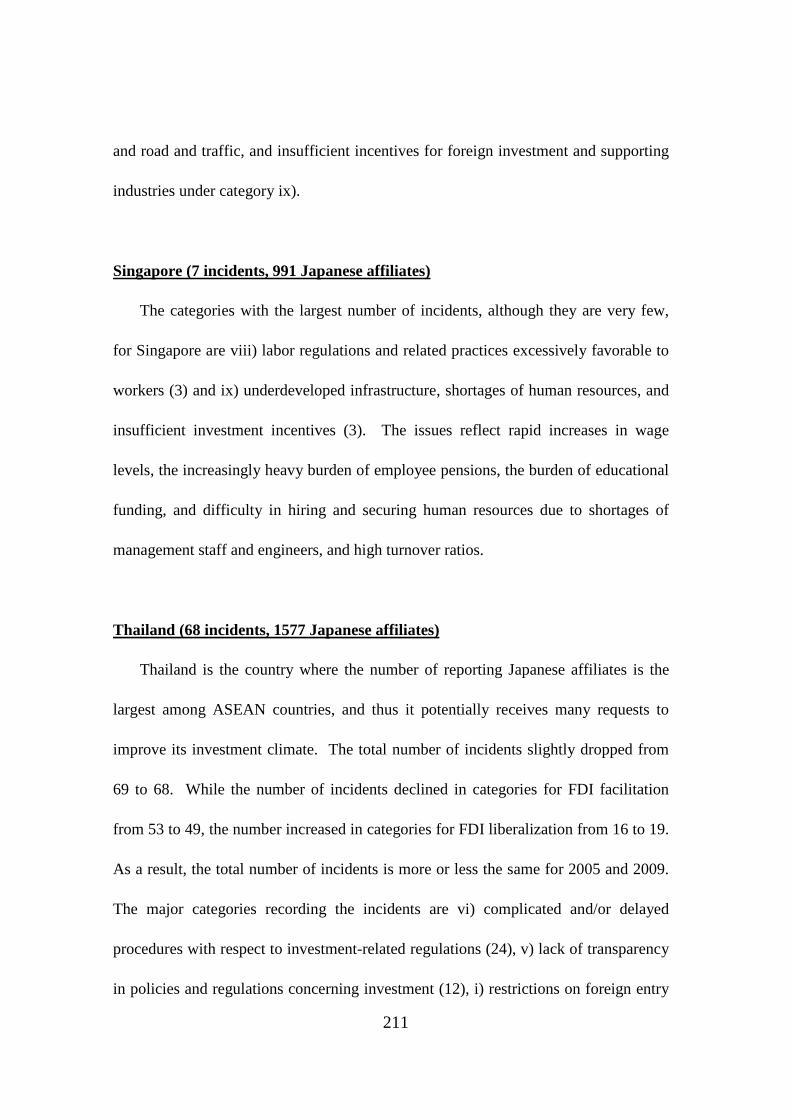
211
and road and traffic, and insufficient incentives for foreign investment and supporting
industries under category ix).
Singapore (7 incidents, 991 Japanese affiliates)
The categories with the largest number of incidents, although they are very few,
for Singapore are viii) labor regulations and related practices excessively favorable to
workers (3) and ix) underdeveloped infrastructure, shortages of human resources, and
insufficient investment incentives (3). The issues reflect rapid increases in wage
levels, the increasingly heavy burden of employee pensions, the burden of educational
funding, and difficulty in hiring and securing human resources due to shortages of
management staff and engineers, and high turnover ratios.
Thailand is the country where the number of reporting Japanese affiliates is the
largest among ASEAN countries, and thus it potentially receives many requests to
improve its investment climate. The total number of incidents slightly dropped from
69 to 68. While the number of incidents declined in categories for FDI facilitation
from 53 to 49, the number increased in categories for FDI liberalization from 16 to 19.
As a result, the total number of incidents is more or less the same for 2005 and 2009.
The major categories recording the incidents are vi) complicated and/or delayed
procedures with respect to investment-related regulations (24), v) lack of transparency
in policies and regulations concerning investment (12), i) restrictions on foreign entry
Thailand (68 incidents, 1577 Japanese affiliates)

212
(8), and ix) underdeveloped infrastructure, shortages of human resources, and
insufficient investment incentives (8). Examples include complexity and delays in
administrative procedures and arbitrary interpretation in implementing regulations
under category vi), underdevelopment and lack of transparency of various regulations
and taxation issues under category v), restrictions on foreign entry under category i),
and high turnover ratios and inadequate infrastructure under category ix).
Vietnam has been active in hosting FDI in recent years, and thus an increasingly
large number of issues are likely to be reported; the total number of incidents
gradually increased from 50 in 2005 to 58 in 2008 and 66 in 2009. The number of
incidents noticeably increased in categories for FDI facilitation from 34 to 58,
particularly due to a growing number of issues in terms of institutional problems and
implementation problems for investment-related policies and regulations, and
underdeveloped infrastructure and shortage of human resources. Consequently, the
total number of incidents increased, though the number declined in categories for FDI
liberalization as a whole from 16 to 8. Major categories registering incidents are vi)
complicated and/or delayed procedures with respect to investment-related regulations
(19), v) lack of transparency in policies and regulations concerning investment (18),
and ix) underdeveloped infrastructure, shortages of human resources, and insufficient
investment incentives (13). The examples are complexity and delay of administrative
procedures and arbitrary implementation of customs clearance under category vi),
Vietnam (66 incidents, 332 Japanese affiliates)

213
underdevelopment, ambiguity, and sudden changes in various regulations under
category v), and underdeveloped infrastructure and difficulty in hiring and securing
human resources due to shortages of management staff and engineers under category
ix).
5. Concluding Remarks and Policy Recommendations
Our analysis of the FDI climates of the ASEAN countries revealed that
impediments to FDI are found not only in the policies but also in their implementation
and enforcement. As for the openness/restrictiveness of FDI policies, we found wide
variations among the countries and sectors. One of the most important findings of our
study is the importance of impediments concerning movement of investors, and the
screening and appraisal procedures related to FDI applications. The impediments
concerning screening and appraisal concern not only the rules or policies but also the
practices in the forms of lack of transparency and complicated/delayed processing.
Our findings indicate the need for further liberalization of FDI policies and
promotion of facilitation measures for ASEAN countries in order to successfully
attract FDI. In order to achieve these goals, we would like to make several policy
recommendations. First, in order to promote FDI policy liberalization, the ASEAN
countries should use various existing frameworks, such as WTO/GATT’s TRIMs
agreement, BITs, FTAs, and other legal frameworks. In particular, ASEAN should
use the ASEAN Comprehensive Investment Agreement (ACIA). Second, to overcome

214
obstacles concerning FDI facilitation, the ASEAN countries should actively use
various cooperation programs with developed countries to improve human resources
engaged in the implementation and enforcement of FDI policies. Possible multilateral
and regional sources of technical assistance in this area may be UNCTAD, the OECD,
and ERIA. Third, monitoring of the achievement of FDI liberalization and facilitation
has to be emphasized, in order to achieve a freer FDI environment. In this regard, a
monitoring mechanism should be established in ASEAN, if it has not been established
yet, or in ERIA. Finally, firm surveys on foreign companies from various countries, in
addition to those from Japan which are utilized in our study, should be conducted to
identify FDI impediments.
References
Ando, Mitsuyo (2009) “Non-Tariff Measures and Trade and Investment Facilitation:
Current Situation and Efforts toward a Formation of AEC and Their Economic
Implications.” In ASEAN Economic Community (AEC) – Can It Play the
Central Role in East Asian Integration-, eds. Ishikawa et al, JETRO. In
Japanese.
Ando, Mitsuyo and Ayako Obashi (2009) “The Pervasiveness of Non-tariff Measures
in ASEAN: Evidences from the Inventory Approach” Presented at the
Research Workshop on Rising Non-tariff Protectionism and Crisis Recovery
December 2009, Macao, China.
Asia-Pacific Economic Cooperation (APEC) Business Advisory Council (ABAC)
(2006) ABAC Report to APEC Economic Leaders: Driving Forward a
Prosperous and Harmonized APEC Community and its attachments Checklist -
Financial Services Liberalization: Goals and Best Practices and Barriers and

215
Impediments to Foreign Direct Investment (FDI): Checklist and Recommended
Policy Response. http://www.abaconline.org/v4/content.php?ContentID=3086
Regimes of the APEC Member Economies. Singapore: APEC
Secretariat.
.
APEC Committee on Trade and Investment (2003) Guide to the Investment
http://www.apec.org/apec/enewsletter/december_vol1/inthenewse.
primarycontentparagraph.0001.LinkURL.Download.ver5.1.9).
Golub, Stephen S. (2003) “Measurement of Restrictions on Inward Foreign Direct
Investment for OECD Countries.” Economics Department Working Papers No.
357, OECD.
Ishikawa, Koichi, Kazushi Shimizu, and Seiya Sukegawa (2009) ASEAN Economic
Community (AEC) – Can It Play the Central Role in East Asian Integration -.
JETRO. In Japanese.
Japan Machinery Center for Trade and Investment (JMC) (2008) Issues and Requests
for Trade and Investment Activities by Country/Region in
2008. http://www.jmcti.org/mondai/top.html
PECC (2002) An Assessment of Impediments to Foreign Direct Investment in APEC
Member Economies, Japan :PECC.
Toyo Keizai Shinposha (2008) Kaigai Shinshutsu Kigyo Soran 2006 (Directory of
Japanese Companies Abroad by Country, 2008) In Japanese.
United Nations Conference on Trade and Development (UNCTAD) (1996) World
Investment Report, 1996: Investment, Trade and International Policy
Arrangements. Geneva and New York: United Nations.
Urata, Shujiro (2006) “FDI Flows, their Determinants, and Economic Impacts in East
Asia,” In. Multinationals and Economic Growth in East Asia, eds. Shujiro
Urata, Chia Siow Yue and Fukunari Kimura. Oxon: Routledge.
Urata, Shujiro, Mitsuyo Ando, and Kazuyori Ito (2007) Survey on Investment
Liberalization and Facilitation ‘Obstacles to FDI in the APEC Economies: A
Study Based on the JMC Firm Survey (APEC#207-CT-01.10). Singapore:

216
APECSecretariat. http://www.apec.org/apec/publications/free_downloads/2007
.html.
Urata, Shujiro, and Mitsuyo Ando (2009) “Investment Climate Study on ASEAN
Member Countries” In Deepening East Asian Economic Integration ERIA
Research Project Report 2008 No.1. eds. Jenny Corbett and So Umezaki.
Jakarta: Economic Research Institute of ASEAN and East Asia.
Urata, Shujiro and John Sasuya (2007) “An Analysis of the Restrictions on Foreign
Direct Investment in Free Trade Agreements”, RIETI Discussion Paper Series
07-E-018, forthcoming In eds. Free Trade Agreements in Asia Pacific. eds.
Christopher Findlay and Shujiro Urata. Singapore: World Scientific.
World Bank (2010) Doing Business Database. http://www.doingbusiness.org/.
World Economic Forum (2006, 2009, 2010) The Global Competitiveness Report
2006/2007, 2008/2009.

217
The Sources Used for the Analysis of FDI Policy Regime
Cambodia
Laws:
(1) Law on The Investment of the Kingdom of Cambodia, August 1994
(2) Anukret/88ANK-BK/29Dec. 1997:
Anukret (Sub Decree) on the Implementation of the Law on Investment of the United Kingdom
of Cambodia
(3) Law on the Amendment to the Law of Investment of the United Kingdom of Cambodia,
Feb. 2003
Indonesia
Laws
(1) Law of the Republic of Indonesia, Number 25 of 2007 Concerning Investment
(2) Presidential Regulation of the Republic of Indonesia, Number 77 of 2007, Concerning List
of Business Fields Closed and Open With Conditions to Investment
Lao PDR
Laws
(1) No. 11/NA: Vientiance Capital City, Date 22 October 2004
Law on the Promotion of Foreign Investment
Supporting documents
(1) UNCTAD and JBIC (2004) “Blue Book on Best Practice in Investment Promotion and
Facilitation Lao PDR”
(2) Suzuki, Motoyoshi (2007) “Lao PDR Investment Guide (LAOSU TOUSHI GAIDO)”
ASEAN-Japan Center
218
(5) Jawatankuasa Pelaburan Asing, Garis Panduan mengenai Perolehan Hartanah oleh
Kepentingan Tempatan dan Asing, Malaysian Industrial Development Authority
website,
Malaysia
Laws
(1) Laws of Malaysia, Act 327, Promotion of Investments Act 1986
(2) Laws of Malaysia, Act 156, Industrial Co-ordination Act 1975
Supporting documents
(1) Arumugam Rajenthran (2002). Malaysia: An Overview of the Legal Framework for Foreign
Direct Investment, Economics and Finance No. 5
(2) Guidelines on the Acquisition of Properties by Local and Foreign Interests, Foreign
Investment Committee
(3) Investment Regime: Malaysia, Investment Country Report Malaysia. (2004)
(4) Jawatankuasa Pelaburan Asing, Garis Panduan Mengenai Perolehan, Penggabungan dan
Pengambilalihan oleh Kepentingan Tempatan dan Asing
www.mida.gov.my
Myanmar
Laws
(1) The State Law and Order Restoration Council Law No. 10/88
The Union of Myanmar Foreign Investment Law
The 7th waning day of Tazaungmon, 1350 B.E. (30th November, 1988)
(2)The State Law and Order Restoration Council Law No. 4/94
Myanmar Citizens Investment Law
The 5th waning of Tabaung, 1355 M.E. (31st March, 1994)
(3)The State Law and Order Restoration Council Law No. 10/88
The Union of Burma Foreign Investment Law
The 7th waning day of Tazaungmon, 1350 B.E.(30th November, 1988)

219
Supporting documents
(1)ICFTU (2005) “Doing Business in or with Burma”
(2)Commerce Clearing House (CCH) Asia (2006) “Doing Business in Myanmar”
Clearing House (CCH)
(3)Japan Chamber of Commerce and JETRO Yangon Office (2007) “Myanmar
Business Guidebook”
(2) Investment Laws, BOI website,
The Philippines
Laws
(1) REPUBLIC ACT No. 7042/1991: AN ACT TO PROMOTE FOREIGN INVESTMENTS,
PRESCRIBE THE PROCEDURES FOR REGISTERING ENTERPRISES DOING
BUSINESS IN THE PHILIPPINES, AND FOR OTHER PURPOSES
(2) REPUBLIC ACT No. 8179/1996: AN ACT TO FURTHER LIBERALIZE FOREIGN
INVESTMENTS, AMENDING FOR THE PURPOSE REPUBLIC ACT NO. 7042, AND
FOR OTHER PURPOSES
(3) EXECUTIVE ORDER NO. 584/2006:PROMULGATING THE SEVENTH REGULAR
FOREIGN INVESTMENT NEGATIVE LIST
Other Supporting documents/sources
(1) FOREIGN DIRECT INVESTMENT (FDI) LAWS IN THE PHILIPPINES. A report
provided by a research institute based in the Philippines. In this report the following
resources are cited:
http://www.boi.gov.ph/
(3)Aldaba, Rafaelita (2006 ). FDI Investment Incentive System and FDI Inflows: The
Philippine Experience. PIDS Discussion Paper Series No. 2006-20
(4) http://www.fdi.net/documents/WorldBank/databases/philippines/lease.htm
(5) Laws and Policies, DTI website, http://www.dti.gov.ph/Laws_Policies.php

220
(6) PEZA website, http://www.peza.gov.ph/about_peza.htm
(7) Llanto, Gilberto (2002). Infrastructure Development: Experience and Policy Options for
the Future. PIDS Discussion Paper Series No.2002-26
(8) Milo, Melanie (2000). An Analysis of the State of Competition and Market Structure of the
Banking and Insurance Sectors. PASCN Discussion Paper Series 2001-11
(9) INVESTMENT PROPOSAL AND APPROVAL.
Taken from Chan Robles Virtual Law Library, Foreign Investment
Brief http://www.chanrobles.com/default4a.htm
(10Price Waterhouse Coopers (1999). Asia Pacific Mining
Regulations http://www.pwc.com/images/gx/eng/about/ind/energy/apacregs.pdf
(11) Price Waterhouse Coopers (PWC). 2008. How to Invest in the Philippines: A Business
Guide. Isla Lipana & Co.
Singapore
(1) Singapore EDB Investor Guide.pdf
(1) Foreign Business Act of 1999.
Thailand
Vietnam
Laws
(1) LAW ON INVESTMENT/2005:
National Assembly of the Socialist Republic of Vietnam Legislature XI, 8th
(3) DECREE OF THE GOVERNMENT No.101/2006/ND-CP OF SEPTEMBER 21,
2006: Providing for the re-registration, transformation, and registration for new
Session.
This Law regulates investment activities in Vietnam.
(2) DECREE OF THE GOVERNMENT No. 78/2006/ND-CP OF AUGUST 9, 2006:
PROVIDING FOR OFFSHORE DIRECT INVESTMENT

221
investment certificates of foreign-invested enterprises under the provisions of the
Enterprise Law and the Investment Law
(4) DECREE OF THE GOVERNMENT No. 108-2006-ND-CP OF SEPTEMBER 22, 2006:
PROVIDING DETAILED PROVISIONS AND GUIDELINES FOR IMPLEMENTATION OF
A NUMBER OF ARTICLES OF LAW ON INVESTMENT
(5) DECISION OF THE MINISTRY OF PLANNING AND INVESTMENT No. 1088-2006-
QD-BKH: ISSUING STANDARD FORMS FOR CONDUCTING INVESTMENT
PROCEDURES IN VIETNAM
(6) DECREE OF THE GOVERNMENT No: 78/2007/ND-CP OF MAY 11, 2007:
On investment in the form of Build-Operate-Transfer, Build-Transfer-Operate or Build-Transfer
contracts
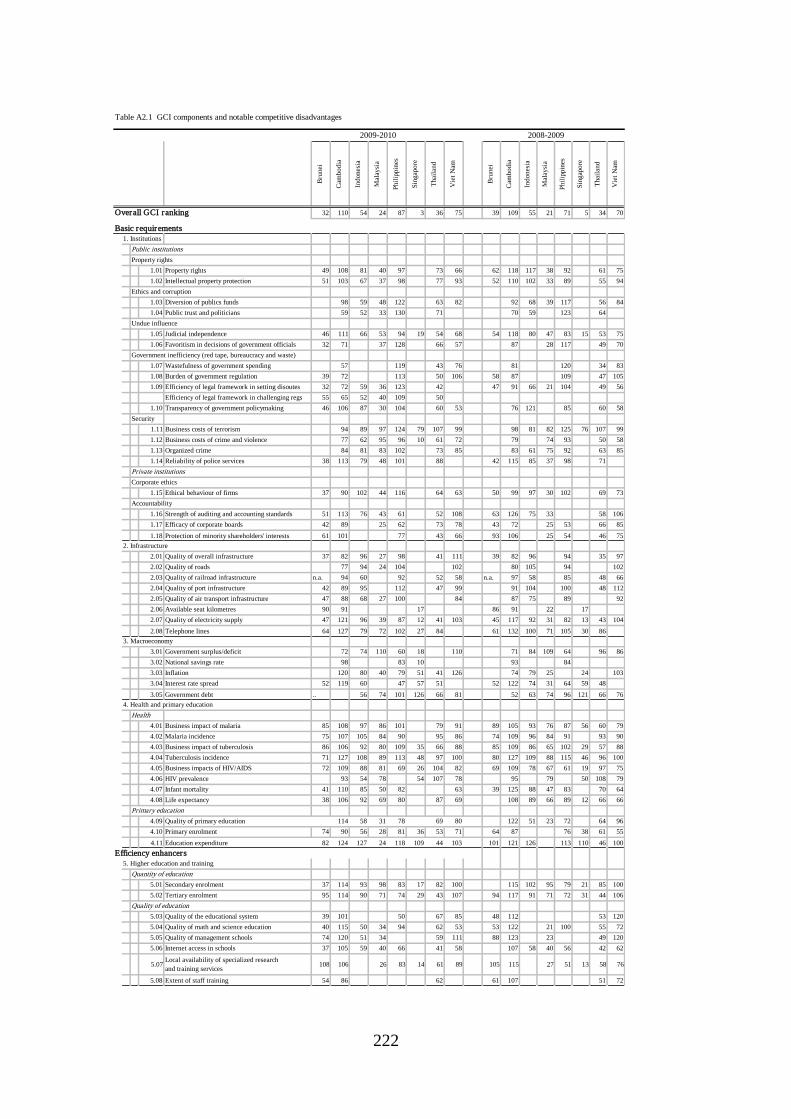
222
Table A2.1 GCI components and notable competitive disadvantages
2009-2010 2008-2009
Bru
nei
Cam
bodi
a
Indo
nesi
a
Mal
aysi
a
Phili
ppin
es
Sing
apor
e
Thai
land
Vie
t Nam
Bru
nei
Cam
bodi
a
Indo
nesi
a
Mal
aysi
a
Phili
ppin
es
Sing
apor
e
Thai
land
Vie
t Nam
Overall GCI ranking 32 110 54 24 87 3 36 75 39 109 55 21 71 5 34 70
Basic requirements1. Institutions
Public institutionsProperty rights
1.01 Property rights 49 108 81 40 97 73 66 62 118 117 38 92 61 751.02 Intellectual property protection 51 103 67 37 98 77 93 52 110 102 33 89 55 94
Ethics and corruption1.03 Diversion of publics funds 98 59 48 122 63 82 92 68 39 117 56 841.04 Public trust and politicians 59 52 33 130 71 70 59 123 64
Undue influence1.05 Judicial independence 46 111 66 53 94 19 54 68 54 118 80 47 83 15 53 751.06 Favoritism in decisions of government officials 32 71 37 128 66 57 87 28 117 49 70
Government inefficiency (red tape, bureaucracy and waste)1.07 Wastefulness of government spending 57 119 43 76 81 120 34 831.08 Burden of government regulation 39 72 113 50 106 58 87 109 47 1051.09 Efficiency of legal framework in setting disoutes 32 72 59 36 123 42 47 91 66 21 104 49 56
Efficiency of legal framework in challenging regs 55 65 52 40 109 501.10 Transparency of government policymaking 46 106 87 30 104 60 53 76 121 85 60 58
Security1.11 Business costs of terrorism 94 89 97 124 79 107 99 98 81 82 125 76 107 991.12 Business costs of crime and violence 77 62 95 96 10 61 72 79 74 93 50 581.13 Organized crime 84 81 83 102 73 85 83 61 75 92 63 851.14 Reliability of police services 38 113 79 48 101 88 42 115 85 37 98 71
Private institutionsCorporate ethics
1.15 Ethical behaviour of firms 37 90 102 44 116 64 63 50 99 97 30 102 69 73Accountability
1.16 Strength of auditing and accounting standards 51 113 76 43 61 52 108 63 126 75 33 58 1061.17 Efficacy of corporate boards 42 89 25 62 73 78 43 72 25 53 66 851.18 Protection of minority shareholders' interests 61 101 77 43 66 93 106 25 54 46 75
2. Infrastructure2.01 Quality of overall infrastructure 37 82 96 27 98 41 111 39 82 96 94 35 972.02 Quality of roads 77 94 24 104 102 80 105 94 1022.03 Quality of railroad infrastructure n.a. 94 60 92 52 58 n.a. 97 58 85 48 662.04 Quality of port infrastructure 42 89 95 112 47 99 91 104 100 48 1122.05 Quality of air transport infrastructure 47 88 68 27 100 84 87 75 89 922.06 Available seat kilometres 90 91 17 86 91 22 172.07 Quality of electricity supply 47 121 96 39 87 12 41 103 45 117 92 31 82 13 43 1042.08 Telephone lines 64 127 79 72 102 27 84 61 132 100 71 105 30 86
3. Macroeconomy3.01 Government surplus/deficit 72 74 110 60 18 110 71 84 109 64 96 863.02 National savings rate 98 83 10 93 843.03 Inflation 120 80 40 79 51 41 126 74 79 25 24 1033.04 Interest rate spread 52 119 60 47 57 51 52 122 74 31 64 59 483.05 Government debt .. 56 74 101 126 66 81 52 63 74 96 121 66 76
4. Health and primary educationHealth
4.01 Business impact of malaria 85 108 97 86 101 79 91 89 105 93 76 87 56 60 794.02 Malaria incidence 75 107 105 84 90 95 86 74 109 96 84 91 93 904.03 Business impact of tuberculosis 86 106 92 80 109 35 66 88 85 109 86 65 102 29 57 884.04 Tuberculosis incidence 71 127 108 89 113 48 97 100 80 127 109 88 115 46 96 1004.05 Business impacts of HIV/AIDS 72 109 88 81 69 26 104 82 69 109 78 67 61 19 97 754.06 HIV prevalence 93 54 78 54 107 78 95 79 50 108 794.07 Infant mortality 41 110 85 50 82 63 39 125 88 47 83 70 644.08 Life expectancy 38 106 92 69 80 87 69 108 89 66 89 12 66 66
Primary education4.09 Quality of primary education 114 58 31 78 69 80 122 51 23 72 64 964.10 Primary enrolment 74 90 56 28 81 36 53 71 64 87 76 38 61 554.11 Education expenditure 82 124 127 24 118 109 44 103 101 121 126 113 110 46 100
Efficiency enhancers5. Higher education and training
Quantity of education5.01 Secondary enrolment 37 114 93 98 83 17 82 100 115 102 95 79 21 85 1005.02 Tertiary enrolment 95 114 90 71 74 29 43 107 94 117 91 71 72 31 44 106
Quality of education5.03 Quality of the educational system 39 101 50 67 85 48 112 53 1205.04 Quality of math and science education 40 115 50 34 94 62 53 53 122 21 100 55 725.05 Quality of management schools 74 120 51 34 59 111 88 123 23 49 1205.06 Internet access in schools 37 105 59 40 66 41 58 107 58 40 56 42 62
5.07Local availability of specialized researchand training services 108 106 26 83 14 61 89 105 115 27 51 13 58 76
5.08 Extent of staff training 54 86 62 61 107 51 72

223
(Continue)
2009-2010 2008-2009
Bru
nei
Cam
bodi
a
Indo
nesi
a
Mal
aysi
a
Phili
ppin
es
Sing
apor
e
Thai
land
Vie
t Nam
Bru
nei
Cam
bodi
a
Indo
nesi
a
Mal
aysi
a
Phili
ppin
es
Sing
apor
e
Thai
land
Vie
t Nam
6. Goods Market efficiency6.01 Intensity of local competition 75 112 42 81 21 41 62 81 118 31 74 30 45 566.02 Extent of market dominance 72 88 32 108 11 59 61 88 24 104 11 606.03 Effectiveness of anti-monopoly policy 71 105 47 87 53 56 83 118 40 77 20 66 916.04 Extent and effect of taxation 50 30 68 40 65 536.05 Total tax rate 55 54 41 93 18 56 61 47 40 99 49 616.06 Number of procedures required to start a business 126 78 99 75 120 60 99 125 75 103 58 120 44 916.07 Time required to start a business 126 124 121 33 113 89 111 125 120 123 51 107 77 1056.08 Agricultural policy costs 97 70 76 526.09 Prevalence of trade barriers 40 96 83 98 80 103 80 105 70 95 101 1106.10 Trade-weighted tariff rate 45 107 71 68 50 78 126 70 107 66 72 52 81 1266.11 Prevalence of foreign ownership 108 77 68 102 80 107 121 75 67 98 89 1046.12 Business impact of rules on FDI 78 43 97 44 81 70 47 97 686.13 Burden of customs procedures 36 102 83 28 117 60 91 110 95 27 105 52 916.14 Degree of customer orientation 60 69 54 26 10 80 62 85 22 916.15 Buyer sophistication 101 58 25 73 46 99 65 23 44
7. Labor Market efficiency7.01 Cooperation in labor-employer relations 105 65 113 71 917.02 Flexibility of wage determination 33 75 92 54 96 89 79 84 79 42 108 91 1017.03 Non-wage labor costs n.a. n.a. n.a. n.a. n.a. n.a. n.a. n.a. 60 46 697.04 Rigidity of employment 92 82 68 90 87 617.05 Hiring and firing practices 78 46 110 79 42 101 397.06 Firing costs 71 119 96 109 84 104 70 117 95 108 84 1037.07 Pay and productivity 50 74 38 64 57 437.08 Reliance on professional management 65 109 55 29 61 82 82 121 22 59 957.09 Brain drain 33 51 31 104 76 55 29 116 13 887.10 Female participation in labor force 69 104 107 99 84 53 109 102 107 86 83 38
8. Financial markets sophistication8.01 Financial market sophistication 64 120 56 31 71 98 68 114 72 31 57 37 1068.02 Financing through local equity market 117 130 54 126 134 54 188.03 Ease of access to loans 42 95 88 69 62 107 65 89 11 44 918.04 Venture capital availability 62 78 87 49 50 78 95 77 12 53 598.05 Restriction on capital flows 56 85 60 68 89 80 71 62 67 75 104 848.06 Strength of investor protection 90 55 100 126 86 107 1238.07 Soundness of banks 39 114 96 38 58 43 111 61 125 121 50 72 13 75 1138.08 Regulation of securities exchanges 101 126 30 77 90 101 130 32 66 36 818.09 Legal rights index 36 98 98 83 128 52 93 52
9. Technological readiness9.01 Availability of latest technologies 51 100 72 36 57 14 53 81 59 109 61 29 52 14 50 719.02 Firm-level technology absorption 57 93 65 37 54 13 61 51 53 106 65 21 13 61 549.03 Laws relating to ICT 72 118 65 26 71 68 70 85 122 71 60 61 729.04 FDI and technology transfer 92 56 72 50 82 94 48 579.05 Mobile telephone subscribers 65 118 94 51 83 10 79 53 120 100 56 84 15 72 1149.06 Internet users 39 129 87 106 15 75 76 130 107 101 15 78 709.07 Personal computers 68 125 103 41 71 78 62 67 128 105 38 70 72 639.08 Broadband Internet subscribers 67 106 101 55 89 22 78 77 57 108 100 51 96 22 94 79
10. Market size10.01 Domestic market size 121 92 36 49 123 96 35 5310.02 Foreign market size 91 85 11 92 79 11
Innovation and sophistication factors11. Business sophistication
Networks and supporting industries11.01 Local supplier quantity 63 125 50 27 75 44 74 63 126 77 44 7911.02 Local supplier quality 78 114 58 42 77 28 40 92 82 117 57 32 64 22 40 97
Sophistication of firms' operations and strategy11.03 State of cluster development 72 55 59 78 60 5611.04 Nature of competitive advantage 50 73 31 59 13 63 105 39 86 29 16 67 12611.05 Value-chain breadth 126 101 61 12 42 77 128 88 26 14 54 9111.06 Control of international distribution 78 123 31 64 60 62 89 127 123 67 57 83 11911.07 Production process sophistication 91 111 60 33 83 13 66 73 87 107 72 27 77 14 68 9411.08 Extent of marketing 93 114 56 35 58 14 47 76 106 117 55 29 17 47 9811.09 Willingness to delegate authority 68 111 19 76 79 104 120 15 67 96
12. Innovation12.01 Capacity for innovation 91 92 25 70 18 59 103 107 53 21 63 19 6412.02 Quality of scientific research institutions 97 107 28 102 12 60 64 93 120 86 13 57 85
12.03 Company spending on research and development 70 81 61 47 92 75 5412.04 University-industry research collaboration 75 109 89 44 59 76 106 54 63 38 7012.05 Government procurement of advanced technology pro 32 76 119 58 45 85 87 110 4812.06 Availability of scientists and engineers 110 113 33 95 14 54 62 117 126 24 92 22 56 5112.07 Utility patents 90 90 87 29 78 11 68 90 88 88 84 29 68 11 69 88
Data source: World Economic Forum (2008, 2009) Note: variables considered as disadvantages are those ranked below 10 for Singapore with an overall ranking in the top 10 economies, those ranked equal to or lowerthan the economy's overall ranking for Brunei, Malaysia, Thailand, with an overall ranking from 11 to 50, and those ranked lower than 50 for Cambodia, Indonesia,the Philippines and Viet Nam with an overall ranking lower than 51.

224
Table A3.1 Assessment of FDI Policy Regimes by Country
Brunei Darussalam Total Market accessNT Screening Directors People PerformanceAll sectors 0.394 0.243 0.795 0.434 0.590 0.180 0.180A - Agriculture, forestry and fishing 0.240 0.10 0.75 0.00 0.50 0.00 0.00B - Mining and quarrying 0.226 0.02 0.75 0.18 0.50 0.00 0.00C - Manufacturing 0.239 0.05 0.75 0.19 0.50 0.00 0.00D - Electricity, gas, steam and air conditioning supply 1.000 1.00 1.00 1.00 1.00 1.00 1.00E - Water supply; sewerage, waste management and remediation activities 1.000 1.00 1.00 1.00 1.00 1.00 1.00F - Construction 0.343 0.28 0.75 0.30 0.50 0.00 0.00G - Wholesale and retail trade; repair of motor vehicles and motorcycles 0.200 0.00 0.75 0.00 0.50 0.00 0.00H - Transportation and storage 0.360 0.20 0.80 0.20 0.60 0.20 0.20I - Accommodation and food service activities 0.200 0.00 0.75 0.00 0.50 0.00 0.00J - Information and communication 0.245 0.00 0.75 0.45 0.50 0.00 0.00K - Financial and insurance activities 0.290 0.00 0.75 0.90 0.50 0.00 0.00L - Real estate activities 0.200 0.00 0.75 0.00 0.50 0.00 0.00M - Professional, scientific and technical activities 0.281 0.11 0.75 0.39 0.50 0.00 0.00N - Administrative and support service activities 0.200 0.00 0.75 0.00 0.50 0.00 0.00O - Public administration and defence; compulsory social security 1.000 1.00 1.00 1.00 1.00 1.00 1.00P - Education 0.290 0.00 0.75 0.90 0.50 0.00 0.00Q - Human health and social work activities 0.290 0.00 0.75 0.90 0.50 0.00 0.00R - Arts, entertainment and recreation 0.468 0.25 0.81 0.93 0.63 0.25 0.25S - Other service activities 0.467 0.33 0.83 0.33 0.67 0.33 0.33T - Activities of households as employers; undifferentiated goods- and services-pr 0.245 0.00 0.75 0.45 0.50 0.00 0.00U - Activities of extraterritorial organizations and bodies 0.500 0.75 0.75 0.00 0.50 0.00 0.00
Cambodia Total Market accessNT Screening Directors People PerformanceAll sectors 0.242 0.140 0.183 0.622 0.000 0.750 0.117A - Agriculture, forestry and fishing 0.200 0.10 0.00 0.75 0.00 0.75 0.10B - Mining and quarrying 0.340 0.20 0.75 0.10 0.00 0.75 0.25C - Manufacturing 0.135 0.10 0.00 0.10 0.00 0.75 0.10D - Electricity, gas, steam and air conditioning supply 0.200 0.10 0.00 0.75 0.00 0.75 0.10E - Water supply; sewerage, waste management and remediation activities 0.205 0.10 0.00 0.75 0.00 0.75 0.15F - Construction 0.200 0.10 0.00 0.75 0.00 0.75 0.10G - Wholesale and retail trade; repair of motor vehicles and motorcycles 0.285 0.10 0.75 0.10 0.00 0.75 0.10H - Transportation and storage 0.200 0.10 0.00 0.75 0.00 0.75 0.10I - Accommodation and food service activities 0.200 0.10 0.00 0.75 0.00 0.75 0.10J - Information and communication 0.267 0.20 0.35 0.32 0.00 0.75 0.10K - Financial and insurance activities 0.170 0.10 0.00 0.45 0.00 0.75 0.10L - Real estate activities 0.625 0.75 0.75 0.75 0.00 0.75 0.25M - Professional, scientific and technical activities 0.280 0.10 0.40 0.75 0.00 0.75 0.10N - Administrative and support service activities 0.220 0.10 0.10 0.75 0.00 0.75 0.10O - Public administration and defence; compulsory social security 0.350 0.10 0.75 0.75 0.00 0.75 0.10P - Education 0.200 0.10 0.00 0.75 0.00 0.75 0.10Q - Human health and social work activities 0.200 0.10 0.00 0.75 0.00 0.75 0.10R - Arts, entertainment and recreation 0.200 0.10 0.00 0.75 0.00 0.75 0.10S - Other service activities 0.200 0.10 0.00 0.75 0.00 0.75 0.10T - Activities of households as employers; undifferentiated goods- and services-pr 0.200 0.10 0.00 0.75 0.00 0.75 0.10U - Activities of extraterritorial organizations and bodies 0.200 0.10 0.00 0.75 0.00 0.75 0.10
Indonesia Total Market accessNT Screening Directors People PerformanceAll sectors 0.375 0.364 0.198 0.789 0.308 0.546 0.255A - Agriculture, forestry and fishing 0.320 0.40 0.00 0.75 0.25 0.50 0.10B - Mining and quarrying 0.156 0.04 0.00 0.75 0.05 0.50 0.10C - Manufacturing 0.265 0.21 0.14 0.75 0.14 0.50 0.14D - Electricity, gas, steam and air conditioning supply 0.221 0.20 0.00 0.75 0.06 0.50 0.10E - Water supply; sewerage, waste management and remediation activities 0.180 0.05 0.00 0.75 0.25 0.50 0.10F - Construction 0.276 0.29 0.00 0.75 0.25 0.50 0.10G - Wholesale and retail trade; repair of motor vehicles and motorcycles 0.252 0.23 0.00 0.75 0.25 0.50 0.10H - Transportation and storage 0.478 0.60 0.20 0.80 0.40 0.50 0.28I - Accommodation and Food service activities 0.280 0.30 0.00 0.75 0.25 0.50 0.10J - Information and communication 0.496 0.53 0.46 0.79 0.38 0.50 0.25K - Financial and insurance activities 0.372 0.53 0.00 0.75 0.25 0.50 0.10L - Real estate activities 0.950 1.00 1.00 1.00 1.00 0.50 1.00M - Professional, scientific and technical activities 0.256 0.24 0.00 0.75 0.25 0.50 0.10N - Administrative and support service activities 0.596 0.60 0.58 0.83 0.50 0.67 0.40O - Public administration and defence; compulsory social security 1.000 1.00 1.00 1.00 1.00 1.00 1.00P - Education 0.275 0.25 0.00 0.75 0.25 0.50 0.25Q - Human health and social work activities 0.564 0.62 0.33 0.83 0.50 0.67 0.50R - Arts, entertainment and recreation 0.533 0.56 0.44 0.81 0.44 0.63 0.33S - Other service activities 0.135 0.00 0.00 0.75 0.00 0.50 0.10T - Activities of households as employers; undifferentiated goods- and services-pr 0.135 0.00 0.00 0.75 0.00 0.50 0.10U - Activities of extraterritorial organizations and bodies 0.135 0.00 0.00 0.75 0.00 0.50 0.10

225
Lao PDR Total Market accessNT Screening Directors People PerformanceAll sectors 0.428 0.392 0.410 0.608 0.250 0.793 0.245A - Agriculture, forestry and fishing 0.475 0.50 0.75 0.50 0.00 0.75 0.00B - Mining and quarrying 0.245 0.30 0.00 0.50 0.00 0.75 0.00C - Manufacturing 0.243 0.27 0.00 0.50 0.00 0.75 0.10D - Electricity, gas, steam and air conditioning supply 0.650 0.75 0.75 0.50 0.75 0.75 0.00E - Water supply; sewerage, waste management and remediation activities 0.165 0.10 0.00 0.50 0.00 0.75 0.00F - Construction 0.813 0.84 0.92 0.84 0.67 0.75 0.67G - Wholesale and retail trade; repair of motor vehicles and motorcycles 0.230 0.20 0.00 0.50 0.00 0.75 0.25H - Transportation and storage 0.318 0.42 0.00 0.50 0.00 0.75 0.25I - Accommodation and Food service activities 0.165 0.10 0.00 0.50 0.00 0.75 0.00J - Information and communication 0.475 0.47 0.33 0.67 0.33 0.83 0.38K - Financial and insurance activities 0.315 0.10 0.75 0.50 0.00 0.75 0.00L - Real estate activities 0.315 0.10 0.75 0.50 0.00 0.75 0.00M - Professional, scientific and technical activities 0.315 0.10 0.75 0.50 0.00 0.75 0.00N - Administrative and support service activities 0.337 0.28 0.29 0.58 0.17 0.75 0.17O - Public administration and defence; compulsory social security 1.000 1.00 1.00 1.00 1.00 1.00 1.00P - Education 0.165 0.10 0.00 0.50 0.00 0.75 0.00Q - Human health and social work activities 0.165 0.10 0.00 0.50 0.00 0.75 0.00R - Arts, entertainment and recreation 1.000 1.00 1.00 1.00 1.00 1.00 1.00S - Other service activities 0.442 0.40 0.33 0.67 0.33 0.83 0.33T - Activities of households as employers; undifferentiated goods- and services-pr 1.000 1.00 1.00 1.00 1.00 1.00 1.00U - Activities of extraterritorial organizations and bodies 0.165 0.10 0.00 0.50 0.00 0.75 0.00
Malaysia Total Market accessNT Screening Directors People PerformanceAll sectors 0.438 0.320 0.833 0.250 0.397 0.562 0.227A - Agriculture, forestry and fishing 0.345 0.10 1.00 0.10 0.10 0.60 0.25B - Mining and quarrying 0.460 0.20 1.00 1.00 0.10 0.60 0.10C - Manufacturing 0.314 0.13 0.78 0.21 0.21 0.30 0.34D - Electricity, gas, steam and air conditioning supply 0.660 0.60 1.00 0.75 0.75 0.60 0.10E - Water supply; sewerage, waste management and remediation activities 0.745 0.70 1.00 0.81 0.81 0.70 0.33F - Construction 0.355 0.00 1.00 0.10 0.75 0.60 0.10G - Wholesale and retail trade; repair of motor vehicles and motorcycles 0.530 0.30 1.00 0.10 0.25 0.75 1.00H - Transportation and storage 0.509 0.36 1.00 0.10 0.70 0.60 0.25I - Accommodation and food service activities 0.562 0.38 1.00 0.50 0.75 0.60 0.25J - Information and communication 0.610 0.60 1.00 0.10 0.75 0.60 0.25K - Financial and insurance activities 0.527 0.43 1.00 0.10 0.75 0.60 0.10L - Real estate activities 0.620 0.75 1.00 0.10 0.25 0.75 0.10M - Professional, scientific and technical activities 0.331 0.23 0.39 0.29 0.36 0.71 0.25N - Administrative and support service activities 0.196 0.10 0.33 0.03 0.17 0.60 0.10O - Public administration and defence; compulsory social security 0.560 0.60 1.00 0.10 0.25 0.60 0.25P - Education 0.560 0.60 1.00 0.10 0.25 0.60 0.25Q - Human health and social work activities 0.305 0.00 1.00 0.10 0.25 0.60 0.10R - Arts, entertainment and recreation 0.713 0.65 1.00 0.55 0.63 0.80 0.55S - Other service activities 0.305 0.00 1.00 0.10 0.25 0.60 0.10T - Activities of households as employers; undifferentiated goods- and services-pr 0.000 0.00 0.00 0.00 0.00 0.00 0.00U - Activities of extraterritorial organizations and bodies 0.000 0.00 0.00 0.00 0.00 0.00 0.00
Myanmar Total Market accessNT Screening Directors People PerformanceAll sectors 0.463 0.378 0.401 0.921 0.399 0.714 0.284A - Agriculture, forestry and fishing 0.490 0.45 0.75 0.90 0.10 0.60 0.00B - Mining and quarrying 0.559 0.55 0.40 0.97 0.46 0.76 0.40C - Manufacturing 0.214 0.09 0.04 0.90 0.14 0.62 0.04D - Electricity, gas, steam and air conditioning supply 0.950 0.90 1.00 0.90 1.00 1.00 1.00E - Water supply; sewerage, waste management and remediation activities 0.200 0.10 0.00 0.90 0.10 0.60 0.00F - Construction 0.200 0.10 0.00 0.90 0.10 0.60 0.00G - Wholesale and retail trade; repair of motor vehicles and motorcycles 0.200 0.10 0.00 0.90 0.10 0.60 0.00H - Transportation and storage 0.784 0.80 0.80 0.96 0.64 0.84 0.60I - Accommodation and Food service activities 0.440 0.10 0.75 0.90 1.00 0.60 0.00J - Information and communication 1.000 1.00 1.00 1.00 1.00 1.00 1.00K - Financial and insurance activities 1.000 1.00 1.00 1.00 1.00 1.00 1.00L - Real estate activities 0.350 0.10 0.75 0.90 0.10 0.60 0.00M - Professional, scientific and technical activities 0.537 0.49 0.43 0.86 0.49 0.77 0.43N - Administrative and support service activities 0.600 0.55 0.50 0.95 0.55 0.80 0.50O - Public administration and defence; compulsory social security 1.000 1.00 1.00 1.00 1.00 1.00 1.00P - Education 0.200 0.10 0.00 0.90 0.10 0.60 0.00Q - Human health and social work activities 0.200 0.10 0.00 0.90 0.10 0.60 0.00R - Arts, entertainment and recreation 0.200 0.10 0.00 0.90 0.10 0.60 0.00S - Other service activities 0.200 0.10 0.00 0.90 0.10 0.60 0.00T - Activities of households as employers; undifferentiated goods- and services-pr 0.200 0.10 0.00 0.90 0.10 0.60 0.00U - Activities of extraterritorial organizations and bodies 0.200 0.10 0.00 0.90 0.10 0.60 0.00

226
Philippines Total Market accessNT Screening Directors People PerformanceAll sectors 0.237 0.257 0.279 0.112 0.519 0.043 0.107A - Agriculture, forestry and fishing 0.375 0.35 0.75 0.10 0.50 0.00 0.25B - Mining and quarrying 0.355 0.30 0.75 0.10 0.50 0.00 0.25C - Manufacturing 0.115 0.10 0.00 0.00 0.50 0.00 0.25D - Electricity, gas, steam and air conditioning supply 0.195 0.30 0.00 0.00 0.50 0.00 0.25E - Water supply; sewerage, waste management and remediation activities 0.220 0.30 0.20 0.10 0.50 0.00 0.00F - Construction 0.110 0.15 0.00 0.00 0.50 0.00 0.00G - Wholesale and retail trade; repair of motor vehicles and motorcycles 0.130 0.05 0.25 0.00 0.50 0.00 0.10H - Transportation and storage 0.375 0.50 0.55 0.00 0.50 0.00 0.15I - Accommodation and food service activities 0.095 0.05 0.00 0.25 0.50 0.00 0.00J - Information and communication 0.230 0.40 0.00 0.10 0.50 0.00 0.10K - Financial and insurance activities 0.145 0.20 0.00 0.15 0.40 0.00 0.10L - Real estate activities 0.400 0.50 0.75 0.00 0.50 0.00 0.00M - Professional, scientific and technical activities 0.475 0.55 0.50 0.20 0.50 0.75 0.10N - Administrative and support service activities 0.250 0.35 0.10 0.20 0.50 0.15 0.05O - Public administration and defence; compulsory social security 0.260 0.50 0.00 0.00 0.50 0.00 0.10P - Education 0.400 0.50 0.00 0.75 1.00 0.00 0.25Q - Human health and social work activities 0.150 0.15 0.00 0.15 0.50 0.00 0.25R - Arts, entertainment and recreation 0.140 0.15 0.00 0.25 0.50 0.00 0.05S - Other service activities 0.250 0.00 1.00 0.00 0.50 0.00 0.00T - Activities of households as employers; undifferentiated goods- and services-pr 0.250 0.00 1.00 0.00 0.50 0.00 0.00U - Activities of extraterritorial organizations and bodies 0.050 0.00 0.00 0.00 0.50 0.00 0.00
Singapore Total Market accessNT Screening Directors People PerformanceAll sectors 0.175 0.197 0.143 0.154 0.356 0.074 0.091A - Agriculture, forestry and fishing 0.025 0.00 0.00 0.00 0.25 0.00 0.00B - Mining and quarrying 0.025 0.00 0.00 0.00 0.25 0.00 0.00C - Manufacturing 0.032 0.00 0.03 0.01 0.25 0.00 0.00D - Electricity, gas, steam and air conditioning supply 0.685 0.90 1.00 0.75 0.25 0.00 0.25E - Water supply; sewerage, waste management and remediation activities 0.270 0.25 0.25 0.25 0.45 0.25 0.25F - Construction 0.025 0.00 0.00 0.00 0.25 0.00 0.00G - Wholesale and retail trade; repair of motor vehicles and motorcycles 0.065 0.10 0.00 0.00 0.25 0.00 0.00H - Transportation and storage 0.170 0.20 0.15 0.25 0.25 0.00 0.10I - Accommodation and Food service activities 0.025 0.00 0.00 0.00 0.25 0.00 0.00J - Information and communication 0.246 0.25 0.30 0.27 0.46 0.00 0.13K - Financial and insurance activities 0.106 0.14 0.00 0.25 0.25 0.00 0.00L - Real estate activities 0.075 0.10 0.00 0.10 0.25 0.00 0.00M - Professional, scientific and technical activities 0.169 0.14 0.14 0.17 0.40 0.14 0.14N - Administrative and support service activities 0.087 0.02 0.13 0.08 0.25 0.17 0.04O - Public administration and defence; compulsory social security 0.800 1.00 0.00 1.00 1.00 1.00 1.00P - Education 0.700 1.00 1.00 0.00 1.00 0.00 0.00Q - Human health and social work activities 0.028 0.00 0.00 0.03 0.25 0.00 0.00R - Arts, entertainment and recreation 0.025 0.00 0.00 0.00 0.25 0.00 0.00S - Other service activities 0.063 0.03 0.00 0.08 0.42 0.00 0.00T - Activities of households as employers; undifferentiated goods- and services-pr 0.025 0.00 0.00 0.00 0.25 0.00 0.00U - Activities of extraterritorial organizations and bodies 0.025 0.00 0.00 0.00 0.25 0.00 0.00
Thailand Total Market accessNT Screening Directors People PerformanceAll sectors 0.300 0.423 0.000 0.500 0.000 0.805 0.000A - Agriculture, forestry and fishing 0.350 0.50 0.00 0.50 0.00 1.00 0.00B - Mining and quarrying 0.281 0.34 0.00 0.50 0.00 0.95 0.00C - Manufacturing 0.193 0.16 0.00 0.50 0.00 0.79 0.00D - Electricity, gas, steam and air conditioning supply 0.325 0.50 0.00 0.50 0.00 0.75 0.00E - Water supply; sewerage, waste management and remediation activities 0.325 0.50 0.00 0.50 0.00 0.75 0.00F - Construction 0.350 0.50 0.00 0.50 0.00 1.00 0.00G - Wholesale and retail trade; repair of motor vehicles and motorcycles 0.325 0.50 0.00 0.50 0.00 0.75 0.00H - Transportation and storage 0.335 0.50 0.00 0.50 0.00 0.85 0.00I - Accommodation and food service activities 0.325 0.50 0.00 0.50 0.00 0.75 0.00J - Information and communication 0.325 0.50 0.00 0.50 0.00 0.75 0.00K - Financial and insurance activities 0.342 0.50 0.00 0.50 0.00 0.92 0.00L - Real estate activities 0.325 0.50 0.00 0.50 0.00 0.75 0.00M - Professional, scientific and technical activities 0.332 0.50 0.00 0.50 0.00 0.82 0.00N - Administrative and support service activities 0.333 0.50 0.00 0.50 0.00 0.83 0.00O - Public administration and defence; compulsory social security 0.325 0.50 0.00 0.50 0.00 0.75 0.00P - Education 0.325 0.50 0.00 0.50 0.00 0.75 0.00Q - Human health and social work activities 0.325 0.50 0.00 0.50 0.00 0.75 0.00R - Arts, entertainment and recreation 0.275 0.38 0.00 0.50 0.00 0.75 0.00S - Other service activities 0.325 0.50 0.00 0.50 0.00 0.75 0.00T - Activities of households as employers; undifferentiated goods- and services-pr 0.125 0.00 0.00 0.50 0.00 0.75 0.00U - Activities of extraterritorial organizations and bodies 0.125 0.00 0.00 0.50 0.00 0.75 0.00
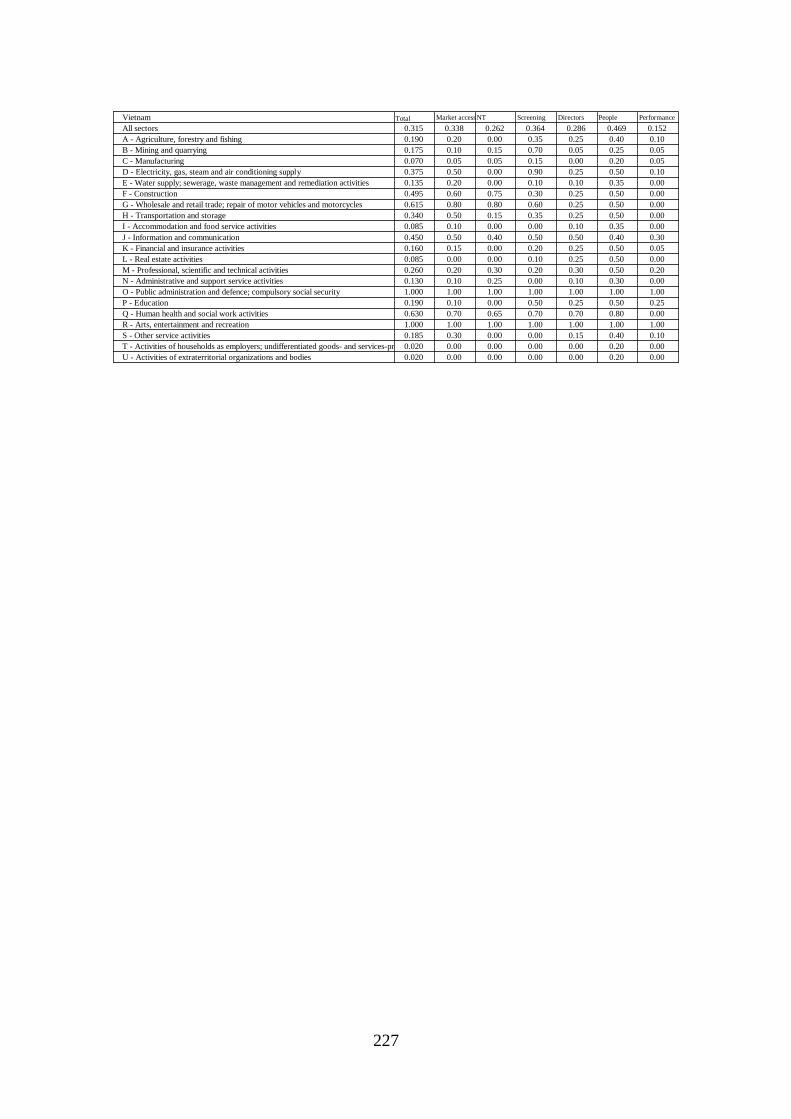
227
Vietnam Total Market accessNT Screening Directors People PerformanceAll sectors 0.315 0.338 0.262 0.364 0.286 0.469 0.152A - Agriculture, forestry and fishing 0.190 0.20 0.00 0.35 0.25 0.40 0.10B - Mining and quarrying 0.175 0.10 0.15 0.70 0.05 0.25 0.05C - Manufacturing 0.070 0.05 0.05 0.15 0.00 0.20 0.05D - Electricity, gas, steam and air conditioning supply 0.375 0.50 0.00 0.90 0.25 0.50 0.10E - Water supply; sewerage, waste management and remediation activities 0.135 0.20 0.00 0.10 0.10 0.35 0.00F - Construction 0.495 0.60 0.75 0.30 0.25 0.50 0.00G - Wholesale and retail trade; repair of motor vehicles and motorcycles 0.615 0.80 0.80 0.60 0.25 0.50 0.00H - Transportation and storage 0.340 0.50 0.15 0.35 0.25 0.50 0.00I - Accommodation and food service activities 0.085 0.10 0.00 0.00 0.10 0.35 0.00J - Information and communication 0.450 0.50 0.40 0.50 0.50 0.40 0.30K - Financial and insurance activities 0.160 0.15 0.00 0.20 0.25 0.50 0.05L - Real estate activities 0.085 0.00 0.00 0.10 0.25 0.50 0.00M - Professional, scientific and technical activities 0.260 0.20 0.30 0.20 0.30 0.50 0.20N - Administrative and support service activities 0.130 0.10 0.25 0.00 0.10 0.30 0.00O - Public administration and defence; compulsory social security 1.000 1.00 1.00 1.00 1.00 1.00 1.00P - Education 0.190 0.10 0.00 0.50 0.25 0.50 0.25Q - Human health and social work activities 0.630 0.70 0.65 0.70 0.70 0.80 0.00R - Arts, entertainment and recreation 1.000 1.00 1.00 1.00 1.00 1.00 1.00S - Other service activities 0.185 0.30 0.00 0.00 0.15 0.40 0.10T - Activities of households as employers; undifferentiated goods- and services-pr 0.020 0.00 0.00 0.00 0.00 0.20 0.00U - Activities of extraterritorial organizations and bodies 0.020 0.00 0.00 0.00 0.00 0.20 0.00
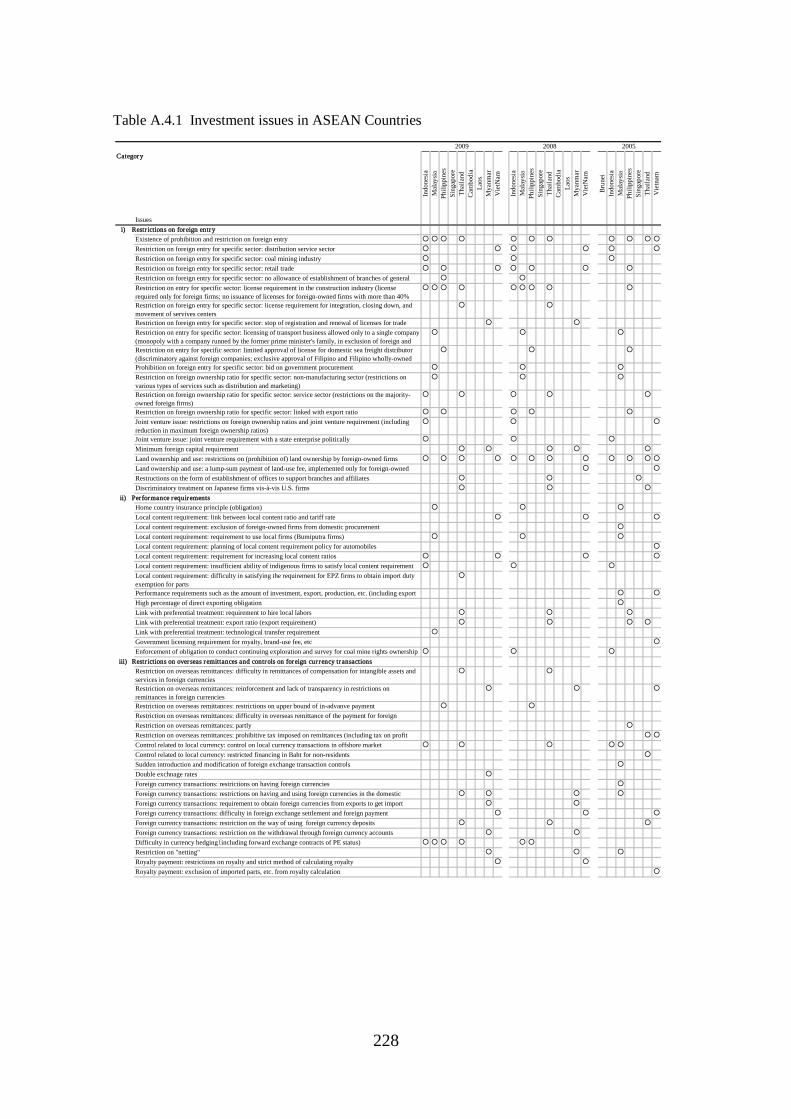
228
Table A.4.1 Investment issues in ASEAN Countries
Category
Indo
nesi
aM
alay
sia
Phili
ppin
esSi
ngap
ore
Thai
land
Cam
bodi
aLa
osM
yanm
arV
ietN
am
Indo
nesi
aM
alay
sia
Phili
ppin
esSi
ngap
ore
Thai
land
Cam
bodi
aLa
osM
yanm
arV
ietN
am
Bru
nei
Indo
nesi
aM
alay
sia
Phili
ppin
esSi
ngap
ore
Thai
land
Vie
tnam
Issuesi) Restr ictions on foreign entry
Existence of prohibition and restriction on foreign entry ○ ○ ○ ○ ○ ○ ○ ○ ○ ○ ○
Restriction on foreign entry for specific sector: distribution service sector ○ ○ ○ ○ ○ ○
Restriction on foreign entry for specific sector: coal mining industry ○ ○ ○
Restriction on foreign entry for specific sector: retail trade ○ ○ ○ ○ ○ ○ ○
Restriction on foreign entry for specific sector: no allowance of establishment of branches of general
○ ○
Restriction on entry for specific sector: license requirement in the construction industry (license required only for foreign firms; no issuance of licenses for foreign-owned firms with more than 40%
○ ○ ○ ○ ○ ○ ○ ○ ○
Restriction on foreign entry for specific sector: license requirement for integration, closing down, and movement of servives centers
○ ○
Restriction on foreign entry for specific sector: stop of registration and renewal of licenses for trade ○ ○
Restriction on entry for specific sector: licensing of transport business allowed only to a single company (monopoly with a company runned by the former prime minister's family, in exclusion of foreign and
○ ○ ○
Restriction on entry for specific sector: limited approval of license for domestic sea freight distributor (discriminatory against foreign companies; exclusive approval of Filipino and Filipino wholly-owned
○ ○ ○
Prohibition on foreign entry for specific sector: bid on government procurement ○ ○ ○
Restriction on foreign ownership ratio for specific sector: non-manufacturing sector (restrictions on various types of services such as distribution and marketing)
○ ○ ○
Restriction on foreign ownership ratio for specific sector: service sector (restrictions on the majority-owned foreign firms)
○ ○ ○ ○ ○
Restriction on foreign ownership ratio for specific sector: linked with export ratio ○ ○ ○ ○ ○
Joint venture issue: restrictions on foreign ownership ratios and joint venture requirement (including reduction in maximum foreign ownership ratios)
○ ○ ○
Joint venture issue: joint venture requirement with a state enterprise politically ○ ○ ○
Minimum foreign capital requirement ○ ○ ○ ○ ○
Land ownership and use: restrictions on (prohibition of) land ownership by foreign-owned firms ○ ○ ○ ○ ○ ○ ○ ○ ○ ○ ○ ○
Land ownership and use: a lump-sum payment of land-use fee, implemented only for foreign-owned ○ ○
Restructions on the form of establishment of offices to support branches and affiliates ○ ○ ○
Discriminatory treatment on Japanese firms vis-à-vis U.S. firms ○ ○ ○
ii) Performance requirementsHome country insurance principle (obligation) ○ ○ ○
Local content requirement: link between local content ratio and tariff rate ○ ○ ○
Local content requirement: exclusion of foreign-owned firms from domestic procurement ○
Local content requirement: requirement to use local firms (Bumiputra firms) ○ ○ ○
Local content requirement: planning of local content requirement policy for automobiles ○
Local content requirement: requirement for increasing local content ratios ○ ○ ○ ○
Local content requirement: insufficient ability of indigenous firms to satisfy local content requirement ○ ○ ○
Local content requirement: difficulty in satisfying the requirement for EPZ firms to obtain import duty exemption for parts
○
Performance requirements such as the amount of investment, export, production, etc. (including export ○ ○
High percentage of direct exporting obligation ○
Link with preferential treatment: requirement to hire local labors ○ ○ ○
Link with preferential treatment: export ratio (export requirement) ○ ○ ○ ○
Link with preferential treatment: technological transfer requirement ○
Government licensing requirement for royalty, brand-use fee, etc ○
Enforcement of obligation to conduct continuing exploration and survey for coal mine rights ownership ○ ○ ○
iii) Restr ictions on overseas remittances and controls on foreign currency transactionsRestriction on overseas remittances: difficulty in remittances of compensation for intangible assets and services in foreign currencies
○ ○
Restriction on overseas remittances: reinforcement and lack of transparency in restrictions on remittances in foreign currencies
○ ○ ○
Restriction on overseas remittances: restrictions on upper bound of in-advanve payment ○ ○
Restriction on overseas remittances: difficulty in overseas remittance of the payment for foreign Restriction on overseas remittances: partly ○
Restriction on overseas remittances: prohibitive tax imposed on remittances (including tax on profit ○ ○
Control related to local currency: control on local currency transactions in offshore market ○ ○ ○ ○ ○
Control related to local currency: restricted financing in Baht for non-residents ○
Sudden introduction and modification of foreign exchange transaction controls ○
Double exchnage rates ○
Foreign currency transactions: restrictions on having foreign currencies ○
Foreign currency transactions: restrictions on having and using foreign currencies in the domestic ○ ○ ○ ○
Foreign currency transactions: requirement to obtain foreign currencies from exports to get import ○ ○
Foreign currency transactions: difficulty in foreign exchange settlement and foreign payment ○ ○ ○
Foreign currency transactions: restriction on the way of using foreign currency deposits ○ ○ ○
Foreign currency transactions: restriction on the withdrawal through foreign currency accounts ○ ○
Difficulty in currency hedging(including forward exchange contracts of PE status) ○ ○ ○ ○ ○ ○
Restriction on "netting" ○ ○ ○
Royalty payment: restrictions on royalty and strict method of calculating royalty ○ ○
Royalty payment: exclusion of imported parts, etc. from royalty calculation ○
2009 2008 2005

229
(Continue)
Category
Indo
nesi
aM
alay
sia
Phili
ppin
esSi
ngap
ore
Thai
land
Cam
bodi
aLa
osM
yanm
arV
ietN
am
Indo
nesi
aM
alay
sia
Phili
ppin
esSi
ngap
ore
Thai
land
Cam
bodi
aLa
osM
yanm
arV
ietN
am
Bru
nei
Indo
nesi
aM
alay
sia
Phili
ppin
esSi
ngap
ore
Thai
land
Vie
tnam
Issuesiv) Restr ictions on the movement of people and employment requirements
Mandatory employment of local labor: general ○ ○ ○
Mandatory employment of local labor: employment of Malaysians with a priority (including request for handover of managing directorship)
○ ○ ○
Mandatory employment of local labor: nationality requirement of directors (including president and board members in investment trust companies)
○ ○ ○ ○
Restriction on hiring foreigners: employment quota for foreigners or restriction on foreign employment ○ ○ ○ ○ ○ ○ ○ ○
Restriction on hiring foreigners: modification and tightening of policies regarding foreign workers ○ ○ ○
Restriction on hiring foreigners: restriction on hiring and visa issuance to mainland Chinese workersVisa issue: discontinued issuance of multiple-entry visaVisa issue: application fee for re-entry Visa issue: difficulty in obtaining working visa, tightening of issuance condition (including cases of certain engineering or investors only), restriction on visa issuance
○ ○ ○ ○ ○ ○ ○
Visa issue: tightening of visa renewal (difficulty in renewal of multiple-entry visa; including suspension of renewal procedures in US)
○ ○
Visa issue: restricted entry by SMEs due to prerequisite conditions for working visa issuance ○
Visa issue: no work permit under foreign temporary workers for construction engineering ○
Visa issue: introduction of obligation to obtain entry visa ○ ○ ○
Visa issue: inconsistent procedures for visa application among embassy and consulates ○
Discriminate period of residency permit between those with and without university degree ○
v) Lack of transparency in policies and regulations concerning investment (institutional problems)Underdevelopment, lack of transparency, and delay of implementation of regulations (inadequate implementing regulations and prolonged delays in their issuance): general
○ ○ ○ ○ ○ ○ ○
Underdevelopment of legal system: implementation rules of EPA ○ ○
Underdevelopment of legal system: stock market and credit market ○ ○
Underdevelopment of legal system: regulations on mortgage, lien, and hypothec ○ ○ ○
Underdevelopment of legal system: financial system such as credit transactions ○ ○
Underdevelopment of legal system: foreign exchange system (double exchange rates) ○ ○
Underdevelopment of legal system: exchange contract ○
Underdevelopment of legal system: temporary system of opening governments' windows responsive to emergency imports
○ ○
Underdevelopment of legal system: insufficient economic system based on domestic currencies ○ ○
Underdevelopment of legal system: re-organization of operations ○
Underdevelopment of legal system: unreasonable requirement of signature for imported products under
○
Underdevelopment of legal system: delay in issuing domestic regulations for ASEAN Cosmetic ○
Underdevelopment of legal system (insufficiency): Corporate Separation Law and merger law ○
Underdevelopment of legal system (insufficiency): Building Law, and Fire Defence Law, and related
○
Underdevelopment of legal system (insufficiency): legislation about handling of chemicals and
○ ○
Underdevelopment of legal system (insufficiency): regulations on dishonor ○ ○
Underdevelopment of legal system (insufficiency): inadequate ax-related dispute settlement by the third
○
Underdevelopment of legal system (insufficiency): double taxation due to lack of tax treaty ○ ○
Underdevelopment of legal system (inadequacy): inadequate protection of depositors ○
Underdevelopment of legal system (inadequacy): obligation of issuing official receipts ○
Underdevelopment and inconsistent implementation of legal system (insufficiency): foreign exchange law and taxation system
○ ○
Lack of transparency in legal system: disapproval criteria of tax investigation ○
Lack of transparency in legal system: complicated labor law ○
Lack of transparency in legal system: ownership of land and its utilization system ○ ○
Lack of transparency in legal system: restrictions on equity transfer for joint venture companies ○
Lack of transparency in legal system: regulations on tax laws ○
Lack of transparency in legal system: investment incentives ○ ○ ○ ○ ○
Lack of transparency in legal system: withdrawal rules ○
Lack of transparency in legal system: conditions of employment ○
Lack of transparency in legal system: licenses and approvals for construction ○ ○ ○
Lack of transparency in legal system: an introduction of international practices ○ ○
Lack of transparency in legal system: disclosure of information on changes in regulations ○ ○ ○ ○
Lack of transparency in legal system: conditions on application for contract of technicaal assistance ○
Ambiguity of legal system: the date to start digital broadcasting ○ ○
Ambiguity of legal system: disparity of tariff rates among similar products ○ ○ ○
Ambiguity of legal system: introduction of emission control regulations (including unrealistic policies) ○ ○
Ambiguity of legal system: foreign exchange laws ○ ○ ○ ○ ○
Ambiguity of legal system: export restrictions ○ ○
Ambiguity of legal system: detailed information on market research in expanding business ○
Ambiguity of legal system: inconsistency between country's tariff classification and ASEAN's ○
Ambiguity of legal system: definition of tariff classification (items) ○
Ambiguity of legal system: treatment of reinvoice under the third-country FTA ○
Ambiguity of legal system: method to calculate tax ○ ○
Ambiguity of legal system: government procurement procedures ○
Ambiguity of legal system: approval and license procedures by administrative institutions ○
Ambiguity of legal system: approval and license criterion of investment-related regulations ○ ○ ○ ○ ○
Ambiguity of legal system: partnership requirement ○
Ambiguity of legal system: criteria and details of approval for divestment obligation ○
Ambiguity of legal system (insufficiency): regulations on disposal of industry wastes ○
Ambiguity of legal system (insufficiency): tariff classification for parts and components ○ ○ ○
Lack of implementation of legal system: environmental control ○
Sudden modification of legal system: general (including absence of legal stability) ○ ○
Sudden modification of legal system: capital control and other controls ○
Sudden modification of legal system: incentives for foreign investors ○
Sudden modification of legal system: raising of import tariffs ○ ○ ○
Sudden modification of legal system (introduction): new tax (value-added tax for export processing ○ ○
Sudden modification of legal system: custom clearance (e-custom clearance) ○ ○
Sudden modification of legal system (setting): sudden setting of holidays ○ ○ ○ ○ ○
Sudden modification of legal system: issues of laws and regulations without sufficient period for ○
Sudden modification of legal system: reduction of export incentives ○ ○
Sudden modification of legal system: crieria to prepare financial statements ○ ○
Sudden and frequent modification of legal system: laws and notices (general) ○ ○ ○ ○
Modification and publicity of legal system: difficulty in accessing information on regulations and
○ ○ ○
Instability of legal system: instable foreign capital law and definition of foreingers ○
Instability of legal system: possible changes in investment incentives ○ ○
Instability of legal system: automobile-related taxation system ○ ○ ○
Instability of legal system: tax holiday regime ○
Instability of legal system: possible tightning regulations on market access to the retail firms ○ ○
Instability of legal system: regulations on foreign workers ○ ○ ○
Instability of legal system: possible regulations inconsistent with WTO (requirements on investment
○ ○
2009 2008 2005

230
(Continue)
Category
Indo
nesi
aM
alay
sia
Phili
ppin
esSi
ngap
ore
Thai
land
Cam
bodi
aLa
osM
yanm
arV
ietN
am
Indo
nesi
aM
alay
sia
Phili
ppin
esSi
ngap
ore
Thai
land
Cam
bodi
aLa
osM
yanm
arV
ietN
am
Bru
nei
Indo
nesi
aM
alay
sia
Phili
ppin
esSi
ngap
ore
Thai
land
Vie
tnam
IssuesUnsatisfactory quality of local parts and components due to insufficient regulations and standards ○
Taxation issue: extremely high value-added taxs ○ ○
Taxation issue: elimination of tax exemption for imported equipments and imposition of corporate tax ○
Taxation issue: tax withholding for PE and inter-branch transactions ○
Taxation issue: tax exemption discriminatory between national and non-national cars ○ ○ ○
Taxation issue: contradictive interpretation of definition of residents under revised income tax law ○
Taxation issue: high commodity tax, registration fee, owner fee and for automobiles ○
Taxation issue: conformity requirement on accounting and tax service ○
Taxation issue: inadequate reserve criteria for taxation regulations ○
Taxation issue: persisting system of corporate tax withholding from supporting industry firms ○
Taxation issue: tax on surplus remittances ○ ○ ○
Taxation issue: commercial and export tax (local production and exports and imports) ○ ○
Taxation issue: rent tax (real estates) ○ ○
Taxation issue: no application of preferential treatment of tax treaties (exemption of corporate tax at the source for subcontractors)
○
Taxation issue: conditions on application of exise tax linked with incentive measures (eco-car policy) ○ ○
Taxation issue: tax on adverse spread ○
Taxation issue: no application of reinbursement of commodity tax for imported parts ○
Taxation issue: long-term retroactive period for tax investigation ○
Safety and environmental standards and certification issue: inadequate safety evaluation standards ○ ○ ○
Safety and environmental standards and certification issue: insufficient regulations on anti-air pollution ○ ○
Safety and environmental standards and certification issue: unique technical standard and safety certification (iron and steel, plug etc)
○ ○
Safety and environmental standards and certification issue: inconsistency with the International
○ ○
Safety and environmental standards and certification issue: unreasonable standard of waste water treatment and waste water quality management
○ ○
Safety and environmental standards and certification issue: unreasonable tightning of regulations for
○
Depreciation issue: long depreciation period ○
Depreciation issue: lack of exemplification of designated products (ambiguity) ○
Import restriction: import restriction by import quota and import licensing (build-up car, steel, and color
○ ○
Import restriction: difficulty in obaining import licenses ○ ○ ○
Import restriction: import restriction on final products by manufacturing firms ○
Export restriction ○ ○
Unilateral abrogation of international commitments ○
Long-term procedures for labor dispute ○
Limited tariff exemption for companies in the Special Economic Zones ○
Unreasonable regulations and regulations without considering technological development trend ○ ○ ○ ○
Cap on surplus reserve ○ ○
Unilateral review of PPA ○
vi) Complicated and/or delayed procedures with respect to investment-related regulations (implementation problems)Complicated procedures: regimes general ○
Complicated procedures: procedures for transactions of bonded goods between trade-processing firms ○
Complicated procedures: procedures for equipment lease and rental certification ○ ○ ○
Complicated procedures: procedures for overseas remittances ○
Complicated procedures: purchasing procedures of foreign currencies ○
Complicated procedures: approval and license procedures for merge, dissolution, or relocation of the
○ ○ ○
Complicated procedures: renewal of import licensing (short period in effective) ○ ○
Complicated procedures: preparation of invoices of imported materials for each incentives ○
Complicated procedures: obligation of pre-registration of import quota for parts that can not be
○
Complicated procedures: pre-shipment inspection ○
Complicated procedures: bidding rules for joint venture with state owned enterprises (application of
○ ○
Complicated procedures: signiture requirements to documents submitted to government agencies and ○ ○
Complicated procedures: procedures for exception of import tariffs ○ ○
Complicated procedures (too-detailed): BOI approval and reporting procedures ○ ○ ○
Complicated procedures (too-detailed): procedures for BOI tax exemption for reexports ○
Complicated procedures (too-detailed): import licensing procedures ○
Complicated procedures (too-detailed): tax payment procedures for taxation at the source ○ ○
Complicated procedures (too-detailed): obtaining export and import licensing ○
Complicated procedures: tax payment registration for foreign individuals ○
Complicated procedures (including uniqueness): state customs clearance procedures ○
Complicated and delayed procedures: customs clearance (including clearance certificate requirement,
○ ○ ○ ○ ○ ○ ○ ○ ○ ○ ○ ○ ○
Complicated and deleyed procedures: conformity and assessment ○
Complicated and delayed procedures: procedures to apply for working visa and its renewal (including
○ ○ ○ ○ ○ ○ ○ ○ ○ ○ ○ ○ ○ ○ ○
Complicated and delayed procedures: tax regulations-related procedures ○ ○ ○ ○ ○
Complicated and delayed procedures: EPTA procedures ○ ○ ○
Complicated and delayed procedures: import tariff reimbursement and tax exemption procedures ○ ○ ○ ○ ○ ○
Complicated and delayed procedures: export bounty coupon issuance procedures ○
Complicated and delayed procedures: government approval procedures for withdrawal ○ ○ ○ ○ ○ ○
Complicated and delayed procedures: BOI export and import approval and reporting procedures for products, materials, equipments, defective products and rejected materials
○ ○ ○
Complicated and delayed procedures: patent registration application procedures ○ ○
Delayed procedures: import custom clearance and cargo inspection (including uncertainty) ○ ○ ○ ○ ○ ○ ○
Delayed procedures: AICO approval procedures ○
Delayed procedures: procedures to obtain permissions (general) ○ ○ ○ ○
Delayed procedures: deleyed procedures to transfer licensing permit from central government to
○
Deleyed procedures: stock reshuffle procedure ○
Delayed procedures: certificate procedures for CEPT ○ ○
Delayed procedures: oversea payment ○ ○
Delayed procedures: permission of oversea remittance ○ ○
Delayed procedures: renewal of import licensing and automatic import licensing ○ ○ ○
Delayed procedures: safety standard and assessment ○
Delayed procedures: judgement of non-application of PE ○ ○
Delayed procedures: issuing final settlement of tax ○
Delayed procedures: approval procedures for technology transfer ○
Delayed procedures: production license issuance (partial) ○
Delayed procedures: examination of safety qualification ○
Delayed procedures: civil execution procedures ○
Delayed procedures (including difficulty): procedures for waste disposal (and its renewal) ○ ○ ○
Delayed procedures (including difficulty): procedures for prepayment of corporate tax reimbursement ○ ○ ○
Delayed procedures (including difficulty): difficulty in obtaining AICO approval ○ ○ ○
Delayed procedures (including difficulty): renewal of business license ○ ○
Delayed procedures (including non-refunding and difficulty): value-added tax reimbursement ○ ○ ○ ○ ○ ○ ○ ○ ○
Delayed procedures (including non-refunding): corporate withholding tax reimbursement procedures ○ ○ ○
2008 20052009

231
(Continue)
Category
Indo
nesi
aM
alay
sia
Phili
ppin
esSi
ngap
ore
Thai
land
Cam
bodi
aLa
osM
yanm
arV
ietN
am
Indo
nesi
aM
alay
sia
Phili
ppin
esSi
ngap
ore
Thai
land
Cam
bodi
aLa
osM
yanm
arV
ietN
am
Bru
nei
Indo
nesi
aM
alay
sia
Phili
ppin
esSi
ngap
ore
Thai
land
Vie
tnam
IssuesDifficulty in procedures: corporate tax advance declaration and payment procedures ○ ○ ○
Inefficiency of procedures (including corruption): investment approval procedures ○ ○ ○ ○ ○ ○
Inefficiency of procedures (including corruption): obtaining licenses for operations in the construction ○ ○
Disunity of procedures: inconsistent procedures and interpretation among administrative officials ○ ○ ○ ○ ○ ○
Complicated corporate tax prepayment system ○ ○ ○
Complicated banking business resulting from the regulations requiring banking transactions in rupiah ○ ○ ○
Complicated offsetting of debtors and creditors account in foreign trade transactions ○ ○ ○
Complicated handling of BOI incentives ○
Complicated approval and licensing for automobile price ○
Complicated L/C import system (iron and steel products) ○ ○ ○
Insufficient enforcement of environmental protection ○ ○
Security and environment standard, standard recognition issue: regorousness of marking systems ○
Security and environment standard, standard recognition issue: obligation to acquisition the Philippines
○
Ambiguous implementation of antitrust law ○
Arbitrary application of system: disunity of legal interpretation and implementation (including disunity and inconsistency of implementation of product safety certification system, excessive power of local
○ ○ ○ ○ ○ ○ ○ ○
Arbitrary application of system: diversity of implementation and interpretation by customs (including arbitrary tariff classification and tariff evaluation, difference with international rules, inequity of tariff
○ ○ ○ ○ ○ ○ ○ ○ ○ ○ ○ ○
Arbitrary application of system: arbitrary corporate tax examination ○ ○ ○
Arbitrary application of system: arbitrary and corrupt tax collection (including back taxes and tax on business corporations)
○ ○ ○ ○ ○ ○ ○ ○
Arbitrary application of system: extension of vaild period of license for air forwarder ○ ○
Inflexible application of systems: judgement of application fees imposed by customs ○
Disunity of legal interpretation for application of system: rules of origin ○ ○ ○
Inconsistent interpretation of legal system: inconsistent requirements among customs in accepting ASEAN's Certificate of Origin
○
Disunity of legal interpretation for application of system: acquisition of indigenous rights for land-use ○
Disunity of regulations, controls, and legal interpretation for application among relevant ministries and ○ ○ ○
Disunity of legal interpretation for application of system: discriminately application for foreigners of a
○ ○
Insufficient notification and understanding of changes in legal systems and procedures among
○
Inconsistent interpretation of regulations and laws among related officials ○
Insufficient legal enforcement (insufficient announcement of EPA Certification of Origin procedure) ○ ○ ○ ○
Inconvenience of centralized authorization rights (including disapproval of PROSEC licensing
○
Special personal connection and political bribery and corruption of public savants (including collusion and corruption in customs)
○ ○ ○ ○ ○ ○ ○ ○ ○ ○ ○ ○
Unanimous voting at the board meeting of joint ventures ○ ○ ○
Prohibitive port charge and departure tax ○ ○
Introduction of value-added tax to free trade zones ○
Heavy burden of value-added tax ○ ○ ○
Prohibitive individual income tax ○ ○
Income tax at the source for expensive expenses of the use ○
High luxury tax imposed on imported or domestically produced goods ○
Collection of technology promotion funds ○
Inconsistent tax collection ○ ○ ○
Irrational traffic regulation ○ ○
Business tax ○ ○
Difficulties in the process of reimbursement of prepaid tax and so on ○
Irrational payment due for public utility charges ○ ○
Irrationality of listed company provision ○
Existence of excessive regulations such as X-ray controls ○
Heavy burden of individual income tax ○
Restricted transfer of the equity share ○
Difficulty in obtaining plans of governments ○
Excessively strict foreign exchange control ○
Signature requirement for document submitted to government and other public offices ○
Discrimination against foreign firms provided by the Board of Investment ○
Rampant smuggling ○ ○ ○ ○ ○ ○ ○ ○
Rampant illegal import of used carsDeemed tax valuation system ○
vii) Insufficient protection of intellectual proper ty rights (IPRs)IPRs: widespread counterfeit goods and pirated copy goods due to insufficient protection of IPRs ○ ○ ○ ○ ○ ○ ○ ○ ○ ○ ○ ○ ○ ○
IPRs: insufficient crackdown on counterfeit goods at the border (including Hong Kong customs case of watches), delayed appraisal during suspension of imports and uncertainty of disposal of seized articles
○ ○ ○ ○ ○ ○
Trademark right: underdeveloped and insufficient trademark right protection system ○ ○
viii) Labor regulations and related practices excessively favorable to workersDifficulty in firing workers: retirement and firing reglations excessively protective for workers ○ ○ ○ ○ ○ ○ ○ ○ ○ ○
Difficulty in firing workers: judgment of a labor court ○ ○
Wage: absence of minimum wage system (no minimum wage system and high labor cost) ○
Wage: substantial raising, frequent and arbitrary revision and disparity control of minimum wage ○ ○ ○ ○ ○ ○ ○ ○ ○ ○
Wage: rapid increase in wage level (raising of labor cost) ○ ○ ○ ○ ○ ○ ○ ○ ○
Wage: disapproval of and difficulty in demotion and salary cut ○ ○ ○ ○ ○ ○
Strike: easy implementation of strike and long-term strike practices ○ ○ ○
Illegal strike ○ ○
Payment of costs for labor-related court ○ ○
Labor union issues:moderation of authorization to organize labor union ○
Restrictions on the period to hire temporary workers ○ ○
Irrational regulations on ages of young workers ○ ○
Labor-management agreement and practices excessively favorable to workers; difficulty in revision of conservative labor regulations and vested conditions of employment
○ ○ ○
Misuse of medical leave ○
Excessive holidays and/or work absence ○ ○ ○
Abuse of family and medical leave systemSpecificity of working time ○ ○ ○
Unreasonably high wage rates for working on holidays ○ ○ ○
Prohibition of employing contract workers ○ ○ ○
Restriction on transfer of insurance officials among companies ○ ○ ○
Greater burden of employees' pension ○ ○ ○
Burden of educational fund ○ ○ ○
Heavy burden of obligation to distribute taxable profits and profit sharing dividends to employees ○
2009 20052008

232
(Continue)
Category
Indo
nesi
aM
alay
sia
Phili
ppin
esSi
ngap
ore
Thai
land
Cam
bodi
aLa
osM
yanm
arV
ietN
am
Indo
nesi
aM
alay
sia
Phili
ppin
esSi
ngap
ore
Thai
land
Cam
bodi
aLa
osM
yanm
arV
ietN
am
Bru
nei
Indo
nesi
aM
alay
sia
Phili
ppin
esSi
ngap
ore
Thai
land
Vie
tnam
Issuesix) Underdeveloped infrastructure, shortage of human resources, and insufficient investment incentives
Difficulty in hiring and securing human resources due to shortage of management staff and engineers (including brain drain of IT engineers)
○ ○ ○ ○ ○ ○ ○ ○ ○ ○ ○ ○ ○
High turnover ratio and job hopping practices ○ ○ ○ ○ ○ ○ ○ ○ ○ ○
Infrastructure issue: underdeveloped (industrial) infrastructure (general) ○ ○ ○ ○
Infrastructure issue: increased risk of power shortages and electrical power supply (instability) ○ ○ ○ ○ ○ ○ ○ ○ ○ ○ ○ ○ ○ ○
Infrastructure issue: underdeveloped road and traffic ○ ○ ○ ○ ○ ○ ○ ○ ○ ○ ○ ○ ○ ○ ○ ○ ○ ○
Infrastructure issue: underdevelopment and lack of seaport infrastructure ○ ○ ○ ○ ○ ○
Infrastructure issue: inadequate spaces for railway and underdeveloped containerized railway ○ ○
Infrastructure issue: creaky existing infrastructure ○
Infrastructure issue: poor public physical distribution services ○
Infrastructure issue: underdeveloped intermediate distribution ○
Infrastructure issue: inadequate public sanitation ○ ○ ○ ○ ○
Infrastructure issue: runaway cost of public utilities (instability) ○
Infrastructure issue: insufficiency and underdevelopment of waste disposals ○ ○ ○ ○
Infrastructure issue: delayed delivery due to traffic jam in cities ○ ○
Infrastructure issue: underdeveloped telecommunication infrastructure/roadband internet network access ○ ○ ○ ○
Infrastructure issue: insufficient air transport infrastructure ○ ○ ○ ○
Infrastructure issue:remarkable difference between a plan to develop logistics and the progress of
○
Incentives issue: disparity of incentives in the same zone due to project-by-project grant of BOI
○
Incentives issue:shrinking of incentives for foreign investors according to the change of investment
○
Incentives issue: absence of investment incentives for the construction industry ○
Incentives issue: insufficient incentives for existing foreign-owned firms ○
Incentives issue: insufficiency, shrinking and ambiguity of incentives for foreign investors (high-tec industry; petroreum gas, oil refinery, petrochemstry)
○ ○ ○ ○ ○
Incentives issue: insuffient excemption of import tariffs imposed on capital goods within economic ○ ○
Incentives issue:elimination of tax incentives for industrial park ○
Incentive issues: review of tax exemption for parts used in producing exports, which are subject to anti-
○
Incentive issues: application of investment allowance and reinvestment allowance only for ○
Incentives issue: absence of incentives for parts manufacturer ○ ○ ○
Incentives issue: insufficient incentives for foreign finished car maker ○
Incentives issue: insufficient BOI tax incentives ○ ○
Incentives issue: insufficient tax incentives other than BOI incentives (corporate tax and withholding
○
Incentives issue: discriminatory favorable incentives for national cars ○ ○ ○
Insufficient incentive for nurture of supporting industries (including local industrial development ○ ○ ○ ○ ○ ○ ○ ○ ○
Issues of local suppliers in terms of delivery time and quality ○
High tax rate: corporate tax ○
High tax rate: individual income tax ○ ○ ○
Financial market: immature financial market ○ ○ ○ ○ ○ ○
Financial market: underdeveloped foreign currency exchange system ○ ○ ○ ○ ○ ○ ○
Financial market: underdeveloped capital market ○ ○ ○
Insufficiency of medical institutions ○ ○ ○
Public security: frequent occurrence of theft ○ ○ ○
Political instability ○
Undeveloped system to prevent disasters: Strength of Buildings, Bird flu, Dengue fever ○
x) Restr icted competition and pr ice controls Monopoly / unilateral increase in price of energy supply ○ ○
Descriminatory high pricing for electricity, water, diesel for industrial use ○
Discriminatory rise in fuel price for industrial use ○ ○ ○
Excessive government intervention for pricing systems:standard export pricing and obligation of domestic supply for coal
○
Ministrial regulation to allow price cap settings for electricity provided by state-owned power company ○
High price due to monopoly by the goverment: industrial waste disposal ○
Price reporting requirement to the Department of Commerce ○ ○ ○
Government-designated trading company system ○ ○ ○
Monopolistic pricing ○ ○ ○
Discriminate pricing for loads at ports ○ ○
Double pricing between domestic and foreign investment ○
Data source: authors' preparation, based on JMC survery 2008 and Urata, Ando, and Ito (2007).
2009 2008 2005

233
CHAPTER 5
Background Data for Constructing Quantitative Measures
This chapter consists of the list of the tables of the background data to develop the quantitative measures presented in previous chapters. The quantitative measures on free flow of services (Chapter 2) are based on the background data compiled by a team of researchers led by Dr. Philippa Dee, with close collaboration with country study members from research institutes in each ASEAN member country. The quantitative measures on free flow of goods (Chapter 2 and Chapter 3) consist of two parts. One is based on the background data compiled by a team of researchers led by Dr. Dee in the same way of the above, and the other is based on the background data estimated by Dr. Patricia Sourdin and Dr. Richard Pomfret. The quantitative measures on free flow of investment (Chapter 4) are based on the background data compiled by a team of researchers led by Dr. Shujiro Urata, with close collaboration with country study members from research institutes in each ASEAN member country. All tables are downloadable from the website of ERIA (http://www.eria.org).

234
LIST OF CONTRIBUTORS
FREE FLOW OF SERVICES
PHILIPPA DEE Crawford School of Economics and Government, Australian National University
FREE FLOW OF GOODS
PATRICIA SOURDIN School of Advanced International Studies, The Johns Hopkins University Bologna
Center RICHARD POMFRET
School of Economics, University of Adelaide
FREE FLOW OF INVESTMENT
SHUJIRO URATA Graduate School of Asia-Pacific Studies, Waseda University,
Economic Research Institute for ASEAN and East Asia
MITSUYO ANDO Faculty of Business and Commerce, Keio University
THOMAS NEKTARIOS PAPANASTASIOU
Graduate School of Asia-Pacific Studies, Waseda University
BRUNEI DARUSSALAM
SHAZALI SULAIMAN KPMG

235
CAMBODIA
CHAP SOTHARITH CHIEK CHANSAMPHORS
Cambodian Institute for Cooperation and Peace (CICP)
INDONESIA
RAYMOND ATJE MOCHAMAD PASHA
IRA TITIHERUW Centre for Strategic and International Studies (CSIS)
LAO PDR
LEEBER LEEBOUAPAO National Economic Research Institute (NERI)
MALAYSIA
ZAKARIAH ABDUL RASHID SAMIRUL ARIFF BIN OTHMAN
MUSALMAH JOHAN BASHIRAH LWIN THIDA NWE
Malaysian Institute of Economic Research (MIER)
MYANMAR
KAN ZAW DAW WIN MYINT
NU NU LWIN Yangon Institute of Economics (YIE)

236
PHILIPPINES
JOSEF T. YAP ERLINDA M. MEDALLA GILBERTO M. LLANTO
Philippine Institute for Development Studies (PIDS)
SINGAPORE
HANK LIM TAY YI XUN
Singapore Institute of International Affairs (SIIA)
THAILAND
WISARN PUPPHAVESA JIRAWAT PANPIEMRAS
Thailand Development Research Institute (TDRI)
VIETNAM
VO TRI THANH TRINH QUANG LONG
Central Institute of Economic Management (CIEM)

237
LIST OF TABLES
Table 1-1a: ERIA Trade in Services Sectoral Questionnaire-Air Transport Services.
Table 1-1b: ERIA Trade in Services Sectoral Questionnaire-Air Transport Services, Index.
Table 1-1c: ERIA Trade in Services Sectoral Questionnaire-Air Transport Services, Country
summary index
Table 1-2a: Restrictions on Trade in Air Transport Services (Index 0-1).
Table 1-2b: Restrictions on Trade in Air Transport Services, Country Summary, Prevalence (%).
Table 2-1a: ERIA Trade in Services Sectoral Questionnaire-Maritime Transport Services.
Table 2-1b: ERIA Trade in Services Sectoral Questionnaire-Maritime Transport Services, Index.
Table 2-1c: ERIA Trade in Services Sectoral Questionnaire-Maritime Transport Services,
Country summary index
Table 2-2a: Restrictions on Trade in Maritime Services (Index 0-1).
Table 2-2b: Restrictions on Trade in Maritime Services - Prevalence (%)
Table 3-1a: ERIA Trade in Services Sectoral Questionnaire-Telecommunications Services.
Table 3-1b: ERIA Trade in Services Sectoral Questionnaire-Telecommunications Services,
Index.
Table 3-1c: ERIA Trade in Services Sectoral Questionnaire-Telecommunications Services,
Country summary index.
Table 3-2a: Restrictions on Trade in Telecommunications Services (Index 0-1).
Table 3-2b: Restrictions on Trade in Telecommunications Services - Prevalence (%)
Table 4-1a: ERIA Trade in Services Sectoral Questionnaire-ASEAN Single Window
Table 4-1b: ERIA Trade in Services Sectoral Questionnaire-ASEAN Single Window, Index.
Table 4-1c: ERIA Trade in Services Sectoral Questionnaire-ASEAN Single Window, Country
summary index.
Table 4-2a: Implementation of ASEAN Single Window – Index
Table 4-2b: Implementation of ASEAN Single Window - Prevalence (%)
Table 5-1: Average trade costs by importing country. Import weighted. 1990-2008
Table 5-2: Average ad valorem Trade Costs; Selected Asian Economies, 1990-2008
Table 5-3a: Index of Trade Costs. Australian imports (Singapore 2008=100), Sea freight
Table 5-3b: Index of Trade Costs. Australian imports (Singapore 2008=100), Air freight
Table 5-4a: Index of Trade Costs. USA imports (Singapore 2008=100), Sea freight
Table 5-4b: Index of Trade Costs. USA imports (Singapore 2008=100), Air freight
Table 5-5a: Index of Trade Costs. Chilean imports (Singapore 2008=100), Sea freight
Table 5-5b: Index of Trade Costs. Chilean imports (Singapore 2008=100), Air freight
Table 5-6a: Index of Trade Costs. Brazilian imports (Singapore 2008=100), Sea freight

238
Table 5-6b: Index of Trade Costs. Brazilian imports (Singapore 2008=100), Air freight
Table 6-1: Assessment of FDI Policy Regimes of ASEAN Countries
Table 6-2: Assessment of Market Access in FDI Policies of ASEAN Countries
Table 6-3a: Assessment of FDI Policy Regimes, Brunei
Table 6-3b: Assessment of FDI Policy Regimes, Cambodia
Table 6-3c: Assessment of FDI Policy Regimes, Indonesia
Table 6-3d: Assessment of FDI Policy Regimes, Lao PDR
Table 6-3e: Assessment of FDI Policy Regimes, Malaysia
Table 6-3f: Assessment of FDI Policy Regimes, Myanmar
Table 6-3g: Assessment of FDI Policy Regimes, Philippines
Table 6-3h: Assessment of FDI Policy Regimes, Singapore
Table 6-3i: Assessment of FDI Policy Regimes, Thailand
Table 6-3j: Assessment of FDI Policy Regimes, Vietnam