
Improving the market performance of business information ...
Upload
khangminh22Category
view
3download
0
KOE – A MARKET RESEARCH BUSINESS CONCEPT
Project submitted to Universidade Católica Portuguesa to obtain a master’s degree in Communication Sciences –
Marketing and Advertising
By
Ana Rita Albuquerque Francisco Dias Leonardo
Faculty of Human Sciences
April 2022
1
KOE – A MARKET RESEARCH BUSINESS CONCEPT
Project submitted to Universidade Católica Portuguesa to obtain a master’s degree in Communication Sciences – Marketing and
Advertising
By
Ana Rita Albuquerque Francisco Dias Leonardo
Faculty of Human Sciences
Under the advisory of Prof. Patricia Dias and Prof. João Carneiro
April 2022
2
Table of Contents Table of Figures ..................................................................................................................... 4
Tables’ Index ......................................................................................................................... 6
Acknowledgements ............................................................................................................... 7
Abstract .................................................................................................................................. 8
Resumo .................................................................................................................................. 9
Introduction ......................................................................................................................... 10
Part I – Theoretical Framework ........................................................................................... 13
Chapter 1: Market Research ................................................................................................ 13
1.1. History of market research ....................................................................................... 13
1.2. Innovative Methodologies of Market Research ........................................................ 18
1.3. Mobile Market Research .......................................................................................... 22
Chapter 2 - Digital Marketing ............................................................................................. 24
3.1. Mobile marketing ..................................................................................................... 24
3.2. Social Media Marketing ........................................................................................... 26
3.3. Influencer marketing ................................................................................................. 27
3.4. Community Management ......................................................................................... 30
Chapter 3 - Mobile Applications ......................................................................................... 34
2.1. Mobile Devices and Applications ............................................................................. 34
2.2. Augmented Reality ................................................................................................... 36
2.3. Gamification ............................................................................................................. 38
Part II – Empirical Work ..................................................................................................... 47
Chapter 4 – Methodology .................................................................................................... 47
Chapter 5 - Koe .................................................................................................................... 52
Chapter 6 – Business plan ................................................................................................... 64
6.1. Business overview .................................................................................................... 64
6.2. Environment analysis ............................................................................................... 65
6.3. Competition analysis ................................................................................................ 68
6.4. Financial Review ...................................................................................................... 76
Chapter 7 - Marketing and Communication Plan ................................................................ 80
7.1. Brand DNA ............................................................................................................... 80
7.2. Consumer Analysis ................................................................................................... 83
7.3. Positioning and Differentiation ................................................................................ 91

3
7.4. Marketing Mix .......................................................................................................... 93
7.5. Communication Strategy .......................................................................................... 94
7.6. Roadmap ................................................................................................................. 100
Conclusion ......................................................................................................................... 103
Bibliographic References .................................................................................................. 107
Appendices ........................................................................................................................ 117
4
Table of Figures
Figure 1: The state of flow is achieved when a player is placed between anxiety and
boredom over a period of time (Zichermann & Cunningham, 2011). ................................. 40
Figure 2: Bartle’s player types (Zichermann & Cunningham, 2011). ................................. 41
Figure 3: User Types Hexad (Marczewski, 2015). .............................................................. 42
Figure 4: Intrinsic User Types (Marczewski, 2015). ........................................................... 43
Figure 5: Player User Sub-Types and Disruptor User Sub-Types (Marczewski, 2015). .... 44
Figure 6: Workflow with added buffers and queues (Anderson, 2010). ............................. 48
Figure 7: Kanban board with type swim lanes, indicating capacity allocation ................... 49
Figure 8: Kaban Board ........................................................................................................ 50
Figure 9: Koe’s website dark and light version ................................................................... 52
Figure 10: Koe’s website home page displays .................................................................... 53
Figure 11: Subscription page on Koe’s website .................................................................. 54
Figure 12: Join the community page on Koe’s website ....................................................... 55
Figure 13: Koe’s desktop platform homepage .................................................................... 55
Figure 14: Koe’s desktop platform login page .................................................................... 55
Figure 15: Koe’s desktop platform survey builder .............................................................. 56
Figure 16: Koe’s desktop platform Data viewer ................................................................. 57
Figure 17: Koe app login ..................................................................................................... 57
Figure 18: Koe app dashboard with menu open and notification open ............................... 58
Figure 19: Koe app survey journey ..................................................................................... 59
Figure 20: Koe app dashboard connections ......................................................................... 60
Figure 21: Koe app Levels page .......................................................................................... 60
Figure 22: Koe app dashboard connections ......................................................................... 61
Figure 23: Koe app Challenges pages ................................................................................. 62
Figure 24: Koe app Safe pages ............................................................................................ 63
Figure 25: Koe app Profile page .......................................................................................... 63
Figure 26: Koe’s golden circle ............................................................................................ 81
Figure 27: The five generations and their brand preferences .............................................. 83
Figure 28: Koe’s Instagram Profile ..................................................................................... 96
Figure 29: Instagram stories from the ambassadors ............................................................ 98

5
Figure 30: Launch and Christmas campaign poster ............................................................ 99
6
Tables’ Index Table 1: Game mechanics and game dynamics (AL-Smadi, 2014). ................................... 39
Table 2: Project’s Kaban board. .......................................................................................... 51
Table 3: Koe’s Competition. ............................................................................................... 74
Table 4: Koe’s Swot Analysis ............................................................................................. 75
Table 5: Koe’s Balance Sheet .............................................................................................. 77
Table 6: Koe’s Brand DNA ................................................................................................. 81
Table 7: Koe’s personas ...................................................................................................... 89
Table 8: Koe’s coupon consumer value hierarchy .............................................................. 90
Table 9: Koe’s extra money consumer value hierarchy ...................................................... 91
Table 10: Koe’s positioning ................................................................................................ 92
Table 11: Koe’s first quarter communication plan ............................................................ 100
Table 12: Koe’s second quarter communication plan ....................................................... 101
Table 13: Koe’s third quarter communication plan ........................................................... 101
Table 14: Koe’s quarter communication plan ................................................................... 102

7
Acknowledgements
I would like to thank my advisor Professor Patricia Dias for all the help in putting this project
together and by guiding me in the right direction, for always being kind and caring even
when was giving up and pushing me to write the parts that I did not enjoy. And to Professor
João Carneiro that help me structure the business idea.
I would like to thank my family for all the support through the journey that was this project.
In special, to my parents for providing me the means to do this master’s degree and not
letting me give up. To my grandparents, Avó Mimi and Avô Alfredo, for all the times I used
their house as an office, for all the delicious meals and the Lidl afternoon snacks to keep my
energy levels high. To my cousin, Miguel, for never doubting that I could do this and always
encouraging me to finish it. And to my uncle Roger, without whom this project’s business
plan would still be under construction, thank you so much for all the hours you spent with
me in front of the excel sheets.
I would like to thank my friends, that had to listen to my cry about how awful and hard this
marathon was for. In special to Mariana, for all the support, for all the afternoons spent in
your house working, for giving strength to finish it and calming my constant worries and
dramas. To Jéssica, for the working sessions in Starbucks and caleidoscópio, for sharing my
pain with the master’s final project and understanding that it is not a pretty ride. To Sara for
getting me out of my house to decompress, thank you for the much-needed beer. To Raquel,
Mary and Alex for sharing the same worries and making me feel like I was not the only
struggling. To Andreia for always being there for me, for the beers in Quiosque do Fonte
Nova in depression clothes.
Last but not least, I would like to thank to Tiago that showed up in the last miles of this
marathon, but his help was crucial to finish it when I just wanted to give up.
8
Abstract Koe is a project that aims to modernize the market research industry. It includes two
platforms to connect companies and respondents. The companies that subscribe Koe’s
services have access to a desktop cloud-based platform where they can build a survey, access
the collected data and correlate any data point storage in the cloud. The surveys, made by
the companies, show up in a mobile app that made for the respondents. Besides replying to
surveys, the respondents are part of a community, where there is a gamification system with
rewards and rankings to keep the users engaged. Creating a real sense of community and
belonging.
This project includes the development of a prototype for Koe, and of a communication
campaign to launch it to the market. These are supported by market research, by a simple
business plan to assess the idea’s viability, and by a marketing plan. The marketing and the
communication strategy is B2C (business to consumer) and is based on the idea of changing
the market by telling brands what they want. The plan is to combine print and digital
advertising, the print is going to be used for awareness at the launch and at Christmas because
it one of the most saturated adverting periods of the year. The digital strategy is based on
social media with company pages and ads and three influencers as brand ambassadors.
Koe is a relevant project because it gives hope to the called traditional market research
industry. It shows that by modernizing and approaching the business in a different way is
possible to stay alive and in good health.
Keywords: Market-Research, Mobile Applications, Gamification, Digital Marketing,
Market Research Surveys, Business Concept
9
Resumo
Koe é um projeto que tem como objetivo modernizar a indústria de Estudos de Mercado. O
projeto é constituído por duas plataformas que conecta empresas e participantes. As
empresas que subscrevem a Koe têm acesso a uma plataforma desktop cloud-based, em
que podem construir os seus questionários, aceder a todos os dados recolhidos ao longo do
tempo e correlacioná-los. Estes questionários estão disponíveis para resposta na aplicação
movel feita para os participantes. Para além de responderem a questionários, os
participantes fazem parte de uma comunidade onde existe um sistema de gamificação com
recompensas e rankings para mantê-los interessados. Isto promove um sentimento de
pertença à comunidade.
Este projeto inclui o desenvolvimento de um protótipo da Koe e uma campanha de
comunicação para o seu lançamento. Estes estão apoiados em estudos do mercado, um
plano de negócios simplificado para apurar a viabilidade da ideia e num plano de
marketing. O plano de marketing e comunicação está feito na ótica B2C (Business to
Consumer) e baseia-se na ideia de mudar o mercado através de comunicar a nossa opinião
às marcas. A estratégia é combinar a comunicação impressa com a digital. A comunicação
impressa tem como objetivo chamar à atenção dos participantes e iria ser usada na época
de lançamento e no Natal, por ser das épocas do ano mais saturadas em termos de
publicidade. A comunicação digital está assente nas redes sociais, com contas de Koe e
anúncios, e em três influencers que agiram como embaixadores da marca.
Koe é um projeto relevante porque dá esperança a uma indústria mais tradicional de
estudos de mercado. O projeto demonstra que modernizando a abordagem que as empresas
têm em relação aos estudos de mercado é possível manterem se vivos e em boa saúde.
Palavras-chave: Estudos de Mercado, Aplicações Moveis, Gamificação, Maketing
Digital, Questionários de Estudos de Mercado, Conceito de Negócio.
10
Introduction
This project aims to shed light into market research market nowadays and applies that
concept to the Koe app, that presents two platforms, one for companies and the other for
respondents. The literature review starts by presenting what is market research, their key
concepts and its evolution over the years. How we went from in-mail surveys to e-mail
surveys, the evolution of the CATI method and how it is still applied today, and how new
technologies impacted the profiling and research on consumer behavior, from big data and
its ethical issues to medical devices being used to measure emotions.
Although this project has a B2B component, the main source of sales for Koe, we have
decided to focus more on the B2C part of the business. Therefore, the next two chapters are
related with the mobile application dedicated to the consumers. In those, we start by
presenting what are mobile applications and what are they used for, also addressing the
human relations with mobile devices. Still in the second chapter we go over gamification,
which is a great part of Koe’s mobile application. Here, gamification is used as a way to
engage with users and to create a community. In this part, we will characterize gamification
and the elements needed to gamify something. In Koe’s app, there are rankings for points
collected and levels achieved, there are direct competitions with other users, for example,
the user who can bring more friends to the app’s community in one week. There are also
rewards for completing challenges, not only the surveys. These are created and presented to
increase the users’ engagement with the application.
Koe also supports AR (augmented reality) that is becoming trending in mobile apps. Koe is
going to leverage this technology by providing AR integration on the surveys, companies
can upload an AR model into to the survey and it is displayed on the mobile device through
the cameras. For example, a company that sells rings can upload three different models of
their rings for people to choose which one they like more. When consumers receive the
survey in the AR part, they can point the back camera to their hand and see how the different
rings look on them.
11
The last chapter of the literature review is more related to Koe’s marketing and
communication plans. It approaches the subjects of Digital Marketing. In this chapter, we
will attempt to define digital marketing as a concept in constant evolution and talk about its
characteristics. Koe’s communication and marketing plan have a strong component of digital
marketing based on social media, which is approached as a central topic in this chapter.
Social media and online communities are defined, and it is also discussed the role of online
influencers. Koe, besides having a social media strategy, also plans to partner with three
influencers, they are presented as brand ambassadors.
To develop the project, we used the Kaban framework, despite Scrum being the “parent
framework”. The differences are that Kaban is less structured and has no roles, so it adapts
better to a team of one element, as it happens in this particular project. It makes use of a
Kaban board with lines of work and columns of phases. The base concept of framework is
capacity, each card is a task and it will only moves forward in the contrition line if the column
for the next phase if the previous task is possible to be completed successfully. For example,
there is card which says color pallet, it will only move to the first phase, which is research,
if we have the possibility to do the color pallet research and so on.
As mentioned in the beginning Koe is a digital business for market research with two
platforms, one B2B-focused (business to business) and other B2C-focused (business to
consumer). The companies that subscribe Koe’s services have access to a desktop cloud-
based platform where they can build a survey, access the collected data and correlate any
data point storage in the cloud. The surveys made by the companies show up in the mobile
app made for respondents. Besides replying to survey, the respondents are part of a
community, where there is a gamification system with rewards and rankings to keep the
users engaged, also to create a sense of community and belonging.
In the business plan, we will show the projections for the company viability and explain the
business model in detail. The company will sell licenses for the desktop platform features,
the number of surveys needed and money for rewards each company has the availability to
use. There are three licenses, plus a free seven-day trial. It is a five-year activity projection
with a year zero (Y0) for Koe’s technological development. The company will achieve the
12
breakeven in the third year of activity (Y3), will have recovered all the investment done and
have profit in the fifth year of activity (Y5).
This project ending chapter is the Marketing and Communication plan, where it is explained
what Koe’s positioning in the market is and how the first year of activity will playout in
terms of Marketing and Communication. Koe aims to be an irreverent brand, the concept is
to tell the market what we want to rule it and that people communicate directly with brands
through the surveys they do. The strategy has a strong digital marketing part and social media
will play a crucial role. Some of the challenges presented on the mobile application are going
to be used to fuel social media, the #KoeQuickStats. These are short questionaries about
trending topics on the society, from sports to politics, and some of the results will be
presented in Koe’s social networks. In addition, there will be three brand ambassadors, since
working with influencers will be key to spread the word of how Koe works.
The project’s potential resides in cloud technology and AR, that make Koe unique in the
market. In the benchmark research was not found another company that could provide the
same benefits to both organizations (who makes the surveys) and consumers (who answer
the surveys). Combining multiple data points from different surveys is a great tool that can
dynamize the way organizations look at the data. In the consumers’ end, AR makes surveys
more fun and interactive. Modernizing Market research and giving it a purpose are the
differentiation points of Koe. People are not just answering survey for money, they are
telling brands what to do, they do not just have an app, they are part of a live community.
13
Part I – Theoretical Framework
Chapter 1: Market Research
Market research aims to find out how to improve the life of the consumers, employees and
stakeholders, as well as how to improve the business’ overall performance. Research is the
pursuit of the truth by analyzing all the facts needed to decide between different business
opportunities. It studies a wide range of phenomena as people, business units or interactions
and it can be categorized into formal and informal. In its formal design, the study is
conceived to a one-shot project that aims to address a specific issue in a limited period, and
researchers use systemic methods. On the other hand, in its informal design, the objective is
to collect data about an environment throughout time, to discover possible problems or
opportunities. Market research is key to predict with more accuracy important future events,
such as consumer trends. The gathering of this intelligence is crucial to good decision
making (Hair Jr et al., 2019).
West (1974) defined Market Research as a process of gathering and analyzing data about the
exchange of products and services between companies and consumers. It is the process in
which we map all the problems and facts related to this phenomenon. The importance of
Market Research lays in the need that companies have to adapt their strategies and tactics to
meet the consumers’ demands. The constant flow of information about the market
environment and its ever-changing characteristics are crucial to better understand their
target, so that the marketing operations can be fruitful.
1.1. History of market research
In 1879, Ayer & Son, one of the first advertising agencies was hired by a manufacturer of
agricultural machinery called Nichols-Shepard Company. So, to fit a proposed schedule for
their client’s advertisements needs, they were the first to sketch a market research method.
Their goal was to obtain information about grain production. They constructed a raw but
formal survey that was distributed by US states and counties through publishers and state
officials with a large and diversified sample (Lockley, 1950).
14
Not long after this first experience, in 1895, Harlow Gale was mailing questionaries to gather
opinions on advertising at the University of Minnesota. Also, around the 1900s, George B.
Waldron was already doing qualitative research for Mahin's Advertising Agency, and in
1901 the Agate Club of Chicago had Walter Dill Scott launching a program of experimental
research on advertising (Lockley, 1950).
However, the concept of what we know as market research nowadays was only established
between 1910 and 1920. In this period, there is evidence that Market Research was becoming
a more serious matter. J. George Frederick and R.O Eastman were some of the early converts
to the concept of Market Research and correspondingly the names that stand out as architects
of research methods. They started introducing formal and systematic questionaries through
postcards and interviews (Lockley, 1950).
In 1911, A. W. Shaw and Edwin F. founded the Bureau of Business Research at the Harvard
Graduate School of Business Administration, with the help of the Faculty Dean. They started
by studying the retail business due to the availability of data within the faculty. Despite these
first efforts to make Market Research an important topic in business and academia, it was
Charles Coolidge Parlin who, instead of studying a business, studied entire industries
providing a broader view of the market environment that was not available before (Lockley,
1950). In 1923, Arthur C. Nielsen founded what would become the Nielsen IQ today. It was
one of the first Market Research companies. It started by measuring product sales in stores
and then evolved to assess radio and television audiences in the 1950s (Wedel & Kannan,
2016).
These first methods are what we call traditional methods of Market Research, the paper-and-
pencil (PAPI) method. Throughout the process, it had different phases: survey design, data
collection, coding, and analysis. Nevertheless, they were time-consuming and it could take
months to finish a study with a cross-sectional survey of 1000 participants. When the first
CADAC (Computer-Assisted Data Collection) methods came along, around 1970, it
revolutionized the way market surveys were done so far (Miller & Dickson, 2001). The first
method was the CATI (Computer Assisted Telephone Interviews). This method consists of
a system of workstations connected on LAN (Local Area Network) where the data gathering

15
is being handled while the telephone interviews are taking place through a direct connection
(FINK, 1983). The information of each interview is stored in a database, on a server. The
system gathers not only the responses of the participants, but also how much time the
interview took, when the answer to each question happened, the participants' telephone
number and status, and could also control the efficiency of each workstation (Horvat et al.,
2001).
The main advantages of this new method were the possibility to have a wider sample, the
capability to handle quotas more efficiently (originating a more accurate study), the ability
to improve the surveys by introducing open-ended questions and the reduction of self-
selection bias. Furthermore, the interviewers were trained to hand over a study with higher
quality (Horvat et al., 2001).
Notwithstanding these new opportunities, the CATI method had some disadvantages, the
main one being its cost. Phone surveys were more expensive than the ones done via mail, it
caused budget problems to managers and it may have influenced them not to be early
adopters of this new method. Besides price, it is a complex system that requires a minimum
of 15 workstations and a daily flow of interviewers (Horvat et al., 2001).
Following the CATI method, in the late 1980s came the CAPI (Computer Assisted Personal
Interviews). It uses a similar software, but on a portable computer, so the interviewer has the
freedom to carry on the surveys in the most appropriate place or in the location where the
study's target is. When the survey is over, the completed interview was sent to a central
office either transmitting them through the traditional telephone lines or the files saved in a
diskette and sent by mail. This new method was designed with the same goals as the CATI
method – reducing time and costs, implementing more complex surveys and having better
control over the process to ensure the quality of the results (Baker, 1992).
Nevertheless, the pioneers of CAPI were concerned about the level of acceptance of this new
technology. They feared that the participants would think a computer may be intrusive or
could compromise their privacy. Having a machine involved would play with the
participants' responses due to the lack of eye contact, and the pace of the interview being set
16
by the speed of the computer software. Despite the original concerns on the respondents'
reaction to a computer, studies show that they had a very positive reaction to this method.
The range of emotions towards the CAPI method in comparison with the traditional paper-
and-pencil method where ranging from indifference to enthusiasm (Baker, 1992).
Face-to-face interviews (FTFI) had been the preferential method of research applied to open-
ended surveys (Baker, 1992; Baker et al., 1995). The CASI (Computer Assisted Self-
Administrated Interviews) method has shown to be more successful in an open-ended survey
about sensitive topics and as successful as FTFI in non-sensitive topics (Fairweather et al.,
2012). As it is self-administrated, the participants are more comfortable reporting and
describing potentially embarrassing, illicit, and socially judgmental behaviors. The CASI
method can help mitigate response effects and has demonstrated being more effective in
gathering data about sexual behavior and drug use related topics. In addition, the researchers
were able to reduce costs and time spent doing interviews - reaching a larger sample – and
transcribing. In spite of the privacy factor, Klein and Sobol (1996) consider that CASI can
have some disadvantages in non-sensitive topics where high levels of detail are needed, as
the interviewer is not present to guide the participant and clarify the answers, as well as the
impossibility to do follow-up questions in order to get more in-depth details.
When the internet appeared, it grew faster than any other media so far, it had 50 million
users in only 4 years of existence compared, for example, with radio that took 38 years to
achieve such a number or television that took 13 years (Horvat et al., 2001). Market Research
never had to adapt to a new medium before internet. Telephones had been around for decades
when they were introduced to market research methods. The internet allowed having a
shorter feedback time and automatic data handling that reduces input errors (Miller &
Dickson, 2001). It also cuts down costs as the internet allowed more complex questionaries
with multimedia, interactive elements, and additionally the possibility to reach participants
from all over the world with a lower budget. The internet brought new opportunities as well
as some challenges. The researchers had to ensure the right hardware, the right software and
gain expertise with the integrated market research system these studies required (Horvat et
al., 2001). They used cardboard index cards to input the information into the computer and
17
to run the analysis program. These analysis programs could take hours to be processed by a
computer (Jr et al., 2019).
In its early days, only a very short segment of the population had access to the internet and
fewer had good knowledge of how to function with it. The quality of the participants'
resources – computer and internet connection - influenced the way the surveys were
displayed and the time it took to answer them. In fact, some of the reported problems were
related to technical issues: images taking too long to load, some java applications not being
supported or crashing and overloading of the respondents' computers. The lack of
standardization throughout the distribution process might have endangered the reliability
and validity of online measures. Online methods suffer also from the same disadvantages
that the self-administrated surveys, participants may not be paying much attention to what
they are doing, they can take breaks and walk away from the survey, or even ask another
person the answer it for them (Miller & Dickson, 2001). Despite these facts, there is evidence
that the quality of data collected through self-administrated has actually improved when
compared with PAPI methods (De Leeuw, 2008).
Some of the first methods of self-administrated online surveys are disk-by-mail where the
participant receives, via postal service, a disk in their mail with the questionnaire and the
program to run it. After the participant runed and finished the survey on their computer, they
had to mail it back. Computer Assisted Panel Research (CAPR) was also an efficient method
to overcome the lack of technological equipment. A set of houses was selected to receive a
computer as well as communication apparatus so they could answer regularly to the surveys
that were sent electronically (De Leeuw, 2008).
Although data collection, management and analytics have a long history, it was the digital
economy with the exponential growth of available information that resulted in the
massification of Market Research. The increase of personal computers and smartphones
helped to distribute surveys through websites and mobile applications. Besides technological
hardware innovations, the possibility to gather mobile and online information facilitated
personalized questionaries, showed to be adaptive on response-basis questionnaires and
allowed shorter questionaries to be sent more frequently, thus having always updated
information and reducing the fatigue in answering them (Wedel & Kannan, 2016).
18
1.2. Innovative Methodologies of Market Research Neuroscience is being used in marketing to understand human behavior, these methods have
been especially insightful in the decision-making process. Usually, marketing methods
collect explicit behavioral measurements because the participants have to describe their
actions. However, many of those actions are motivated by unconscious processes that
neuroscience tools as fMRI (Functional Magnetic Resonance Imaging) or an EEG
(Electrocardiography) an uncover (Camerer & Yoon, 2015). These methods are used to
study different marketing domains such as advertising, branding, online experience, pricing,
product development and product experience. Most of the tools used in neuroscience are
expensive, the prices range from 100 hundred to 1 million euros. To measure brain activity,
an EEG, or wearable EEG, fMRI and fNIRS (Functional Near-Infrared Spectroscopy) can
be used, the EEG are the most common due to its price, which is the lowest among the
options. Also, Eye Tracking and ECG (Electrocardiogram) devices are considered as low
price. The first measures visual attention, pupil dilation and fixations, the second measures
heartbeat and blood flow. An fERS (Facial Expression Recognition Software ) measures
facial expressions and GSR (Galvanic Skin Response) skin moisture levels (Alvino et al.,
2020).
Sands and Sands (2012) used neuroscience to measure people's purchasing attitudes in the
supermarket. The participants had an EGG and eye-tracking goggles with a scene camera.
They were able to observe that the participants had the largest brain responses to items such
as alcohol, candy, frozen desserts, chips, or crackers. The largest positive emotional response
was provoked by certain food items that give us the immediacy and reward feeling, for
example, buying a can of soda out of the cooler next to the checkout. The last and third
observation was the correlation between the brain response with the first eye fixations on
food items and the decision to buy it. The chosen items activated the left frontal area of the
brain, showing a clear positive association with it. On the other hand, the opposite occurred
when an item was rejected, the same pattern was seen in the right frontal area of the brain.
With these results, supermarkets can improve their product display maps to have more profit
(Sands & Sands, 2012).

19
This type of studies can be too expensive and take too long, so, iMotion and GRAIL (Gait
Real-time Analysis Interactive Lab) are two platforms that can help with that, in which
researchers can measure brain activity and physiological responses. These platforms offer
neuroscience tools that can measure behavioral, physiological, and neurophysiological
responses during a product experiment. The first platform, iMotions, can be used in
laboratory or real-life settings, it has different versions and integrated tools that can be
changed. This platform can include more than 50 biosensors and up to 6 consumer
neuroscience tools such as Eye Tracking, Facial Expression Analysis Software, GSR, ECG
and EEG headsets. The later platform, GRAIL, stands for Gait Real-time Analysis
Interactive Lab, it uses a dual belt treadmill, VR (Virtual Reality) and motion-capture
technology. It allows the computation of parameters such as posture, muscle activation and
ground reaction forces in real-time while the subject interacts in real-time with mimics of
real-life situations through the VR. A set of multi-sensory input devices measure behavioral
and physiological responses, while output devices return motor-sensory, visual, and auditory
feedback from the subject. Despite GRAIL's functionalities, it was not used in consumer
neuroscience studies yet (Alvino et al., 2020).
Ethnography is a method that is being used by companies in complement to quantitative
analysis (Wood, 2013). This is an anthropological method dedicated to study meanings,
practices and artifact of social groups (Kozinets, 2002). It’s a method that consists in living
among the subjects of study, creating a bond of trust and intimacy, to have a better scope of
their lives and thoughts. These types of studies are usually undertaken by people with an
academic background in social sciences, as anthropology. The case of ReD Associates and
the ethnographic survey for Absolut Vodka is a great example of how this method works
and its advantages. The social scientists attended a series of house parties to observe the
people's behavior and their alcohol consuming habits (Wood, 2013).
Another way of conducting an ethnography is through social media (Dalgas, 2016), it is
called netnography. Netnography is an ethnographic study made on the internet, it adapts
the ethnography research methods to analyze computer-mediated communication to study
new communities and cultures that are emerging. In market research it is used to find out the
20
needs and what influences the decision-making process of consumer groups in social media
and online-forums (Kozinets, 2002). The commercial research methodologies based on
online data collection are on the rise for analyzing brand image and positioning due to the
socio-cultural transformation that we are living where everyone’s opinions can be read and
shared. (Casas-Romeo et al., 2014). Dalgas (2016) exposes the advantages of using
Facebook as a tool to get access and acquaintance with researchers' sites of study as the
online and offline dimensions are merging. Data obtain through Facebook is a good indicator
of the researcher's subject social life. Even if the information is not directly communicated
to the researcher, they have access to the subjects' online activity, which can raise ethical
issues in the data gathering process because the subject is not aware of when and what the
researcher is observing (Dalgas, 2016).
Ethnography and Big data are usually seen as opposite research practices in the discourse of
the Social Sciences. Big data is a quantitative, positivist, large scale method, in contrast with
ethnography that is a qualitative, interpretive and small-scale method. Despite big data
characteristics, ethnografy can be useful to zoom in on smaller communities overlooked in
surveys (Beuving, 2020). Wang (2016) believes ethnographers are key players in the Big
Data age, they know how to interpret the raw data in a human-centric perspective, keeping
the companies focused on their consumer.
In the late 1990s and early 2000s, the American government was discussing legislation for
online data. People were worried that the data capabilities of technology companies would
pose a threat to individual freedom and feared that humans would become just another
merchandise. The technological industry argued that they were capable of regulating
themselves and any government intervention would be costly and counterproductive
(Zuboff, 2015, 2018). The new communication technologies allowed research companies to
have more direct access to how consumers think and gave a better understanding of their
decision-making and their future methodologies. Actually, 69% said clearly that they were
going to focus on real-time data collection and analysis, resorting to social media,
smartphones, and big data (Zák, 2015). Dewey (2019) defines Big Data as a huge mass of
data produced on a daily basis, within the global computer networks. It is characterized by
the four "Vs" - Volume, Velocity, Variety and Veracity (Wedel & Kannan, 2016). Big data
21
can also be defined as a professional term for a large amount of high-speed information. It
is complex and variable data that needs advanced technology for acquisition, storage,
information distribution, management, and analysis. Huang (2021) considers it the best way
to obtain marketing insights and improve results. There is clear evidence that companies
were adopting big data and surveillance methods, for example, monitoring online
communities to find how member react to certain topics (Zák, 2015). The Cambridge
Analytica Scandal is a great example of monitoring online communities and making use of
big data. The British company was using the data from Facebook users to favor political
campaigns (González et al., 2019). The company built an algorithm to target voters through
psychographic profiling upon Facebook users' data, so they can influence voters (Hu, 2020).
However, some psychographic experts are skeptical of the information provided by
Cambridge Analytica had some real impact on the voting results. In their perspective,
information is only as good as what we can do with it, the campaign staff still had to be
creative to make relevant ads (Allen & Abbruzzese, 2018).
Deighton (2019) thinks that Big Data is a consequence of the digitalization of our consumer
culture, our digital footprint as information about social media activity, web browsing,
online shopping histories, smartphone apps, GPS tracking, streaming services and 'smart
home' devices. This ever-growing amount of data combined with data analytic
methodologies is seen as the "Holy Grail" of Market Research because it can enable accurate
forecasts of consumers' demands (Deighton, 2019). Zuboff calls this new form of business
Surveillance Capitalism, which is claiming personal human experiences and selling it as
human behavior data (GBH Forum Network, 2019), and claims that "This new form of
information capitalism aims to predict and modify human behavior as a means to produce
revenue and market control" (Zuboff, 2015, p. 75). The awareness of this business model
might be what jeopardizes it. The European Union already took the first steps, in May 2018,
with the General Data Protection Regulation (GDPR). If people start cutting access to their
data and their lives to what the author calls the "Big Other", companies have less information
to feed the Big Data machine. The so-called classical market research methods can leverage
this aspect, where the information participants provide to studies are shared with their
consent and control over what to share with the researchers (Zuboff, 2018).
22
Nevertheless, a combination of classical and big data methods may be the best option in
today's paradigm (Huang et al., 2021). In the 2016 US Presidential Election, the traditional
marketing methods, the polls, gave the victory to Hillary Clinton, while the analysis of
Google Trends data showed, early on the campaign, a big pro-Trump movement. Big data
was able to predict something the classical methods overlooked (Beuving, 2020). Classical
marketing methods can estimate risks and predict product success, it is focused on improving
production success, while big data helps to understand and predict the consumer's needs (
Huang et al., 2021).
1.3. Mobile Market Research
The mobile technologies have been used in market research both by respondents and
researchers. People started answering to surveys directly through their smartphones via web-
browser or an application, and also took part in CATI surveys since the number of mobile
phones has surpassed the landline phones. Researchers use them in CAPI – which is called
mCAPI – and to collect data from them – passive data gathered by the device. There can be
active and passive usage of mobile devices in market research. Active use is when the
participant uses their device to participate in the study, for example, they take pictures with
the device’s camera or use it to reply to a survey. On the other hand, passive use is
characterized by the gathering of data through the device itself. This type of research makes
use of big data mechanics, through cookies and other monitorization technology. (Poynter,
2015)
The L2L project or Listen to LAC (Listen to Latin America and the Caribbean) wanted to
reduce time and cost of gathering household data without compromising quality, using
mobile phones for crisis situations. This is crucial for decision making, governments can
adopt policies based on evidence rather than guesses or common knowledge, especially
important when decisions need to be taken in a matter of days or hours, not weeks or months.
Their study conclude that mobile surveys might be a good option in fragile environments –
areas prone to natural disasters or conflicts - because they overcome the security problems.
However, they may not be suitable to everyone, lack of electricity or financial means to buy
a smartphone are obstacles for part of the population. They have also identified the SMS
23
(Short Message Service) as the best method for this region, due to the fact that the survey is
available in the participants text message inbox, and they can answer it when they have time,
and it at a lower cost (Ballivian et al., 2015). The number of people answering web surveys
through their mobile devices has been increasing rapidly over the years (Andreadis, 2015).
Using a mobile application in the context of online surveys for market research facilitates
the access to the device’s passive data and enables the offline participant’s completion of the
survey if it has already loaded beforehand. In 2015, only 2% of surveys were optimized for
mobile used, when 25% to 30% of the respondents were already answering the surveys
through their smartphones, although it leaves out people with older phones (Poynter, 2015).
24
Chapter 2 - Digital Marketing
Digital marketing definition has been discussed by many authors due to the combination of
internet marketing and non-digital channels, what Kotler (2016) calls Marketing 4.0. He
believes that Traditional Marketing a Digital Marketing can converge. Pollák (2021) says
that the concept is the application of traditional tools of marketing to the new media that the
internet provided in the 1990s. Jerković et al. (2021) is promoting products and services
using digital channels to communicate with consumers. It is establishing and maintaining
relationships with consumers and partners by delivering digital experiences and values. The
channels used for delivery can be SEM (search engine marketing), digital advertising, online
partnerships, online public relations, e-mail brands, and social media marketing. It is
essentially carrying out marketing activities through electronic media (Jerković et al., 2021).
Digital marketing for Bădică & Mitucă (2021) is data-driven and throughout the years has
gone through a process of evolution and transformation. Right now, the authors consider to
be at the digital disruption stage of data-driven marketing. Marketing practices are supported
by market research and communication technologies, such as AI or blockchain (Bădică &
Mitucă, 2021). Douglas Guilbeault (2018) says that digital marketing appeals mainly to users
who have money to buy products online so certain demographics are more important than
others. He says that social media interfaces are designed to satisfy digital marketing needs,
by encouraging the user to share more of their data to be sold to third-party companies and
to refine their micro targets, resulting in the advertising that the users see as being super
tailored (Guilbeault, 2018).
3.1. Mobile marketing
Mobile marketing is comprehended differently from traditional marketing because of its
highly personalized content, to such a personal and emotional spectrum where the
convectional strategy of one-size-fits-all is not effective. It is estimated that in the next few
years the mobile marketing business will be worth $183 billion. Mobile devices are rich in
behavioral and environmental data, collected through built-in GPS, accelerometer, sensor,
and gyroscope, that enables the marketeers to tailor prices and promotions to each consumer
25
and carried out through mobile channels such as SMS, in-app, push, and notifications (Tong
et al., 2020).
Daniel Rowles (2017) considers mobile marketing not to be a channel like social media, but
something that has an impact on all the others marketing channels, both online and offline.
In his book, he states that to understand mobile marketing we must shift our attention from
the device itself to the human behavior. Questions like “How big does a phone need to get
before it becomes a tablet? What about if my laptop has a touchscreen? Does it then become
a tablet? What if my tablet has a keyboard? Is it still a mobile device?” (Rowles, 2017, p.
13) are meaningless to the author, what matters is the user’s journey. A successful mobile
marketing strategy must focus on what the user wants to achieve and how mobile
technologies can the helpful for that purpose.
It was estimated that in 2020, 90% of the world’s population would have a mobile phone,
which makes it easier than never for marketers to communicate with their audiences.
Nowadays, computers are yesterday’s technology and mobile devices are the main medium
(Andrews et al., 2016). As said before, mobile devices are extremely personal, they are an
important communication tool. They, usually, are at arm’s reach at all times, as they can
access digital information anywhere and at any time, so, marketers reach their consumers
anywhere and at any time correspondingly. Mobile advertising is a booming business,
consumers use their mobile devices for more than communication, they do web searches,
use applications, watch videos, among others. All of them are channels for delivering
advertising content. (Grewal et al., 2016)
Andrews et al. define mobile promotions as “information that is delivered on a mobile device
and offers an exchange of value, with the intent of driving a specific behavior in the short
term", this can also be called m-coupons. The goal of these activities is to stimulate, in the
short-term, specific consumer behaviors via mobile devices by offering an exchange of
value. All the decades-old technics of in-store flyers, mailers, loyalty card coupons, and
checkout coupons are now online and in the palm of our hands. These are great for impulse
purchases, people feel the urge to acquire certain items last-minute for a range of reasons,
financially wise via discounts or offers to induced social pressure. Studies say the less the
time to deliberate over the coupon people have, the more likelihood to give in it. That is one
26
of the reasons many online stores present special offers or coupons to clients when they are
checking out because impulse purchases are done close to the point of purchase. Making use
of geolocation technologies - GPS, GPS, Wi-Fi, beacon, latitude and longitude coordinates
of radius targeting from bid requests from ad networks, or near-field communications –
marketers found a better way to capture the clients' curiosity, by reaching out when
consumers are close to a point-of-sale via a mobile device. Consumers also search for
coupons through their mobile devices via applications. Many of these promotions are made
through price-discount giving people time to plan each item they want to buy (Andrews et
al., 2016).
3.2. Social Media Marketing
A study conducted by Moore and Craciun (2021) showed that Instagram is more about self-
promotion than communication, specifically when compared with Facebook. It tends to
fulfill the users' needs for approval and attention. The activity on Instagram is based on
following topics of interest through photographs posted by friends or strangers. Extraverted
people are confident of their social skills and prefer interacting with friends, so Instagram is
not that appealing to them because they do not feel the need for self-promotion and the social
passive interaction with strangers – having access to celebrities' content without the need for
them to follow you back or reply to your interactions. Less mentally and emotionally stable
persons are more likely to share their life details which can make them more entertaining
and therefore having a bigger number of followers and likes. They also found that people
who reported a higher level of FOMO nurture more positive attitudes towards Instagram,
they were more active, followed more accounts, and revealed more social media addiction
tendencies (Moore & Craciun, 2021).
Digital influencers are a tool of promotion often used in social media. A study from Moreira,
Stenzel, Lopes, and Oliveira (2021) aims to find if they are efficient in reducing the gap
between consumers and companies. Influencer marketing is endorsing brands on social
media, by this definition anyone with an account can be an influencer. A simple post with a
Starbucks coffee is considered by the author as influencer practice because the essence of
influencer marketing is digital word of mouth (Wood, 2016). A Nielsen study said that 92%
27
of consumers believed in recommendations from friends and family over traditional forms
of advertising (Whitler 2014). Social media influencers are known personalities and are
trusted almost as a friend because the audience as a close look into their personal lives. These
people have the power to trigger eleven times more ROI (Return on Investment) annually,
than other forms of traditional marketing (Wood, 2016).
People that become famous through their social media presence are called Social Media
Celebrities in contrast to people that become famous for their work as actors, musicians, tv
show hosts, or sports. Notwithstanding the differences, when these two types of celebrities
are compared, consumers tend to find social media celebrities more trustworthy because they
can more easily identify themselves to them.
3.3. Influencer marketing
Influencer marketing is endorsing brands on social media, by this definition anyone with an
account can be an influencer, a simple post with a Starbucks coffee is considered by the
author as influencer practice because the essence of influencer marketing is digital word of
mouth (Wood, 2016). A Nielsen study said that 92% of consumers believed in
recommendations from friends and family over traditional forms of advertising (Whitler,
2014). Social media influencers are known personalities and are trusted almost as friends
because the audience has a look into their personal lives. These people have the power to
trigger eleven times more ROI (Return on Investment) annually, than other forms of
traditional marketing (Wood, 2016). People that become famous through their social media
presence are called Social Media Celebrities in contrast to people that become famous for
their work as actors, musicians, tv show hosts, or sports. However, when these two types of
celebrities are compared consumers tend to find social media celebrities more trustworthy
because they can more easily identify themselves to them. This makes the audience form a
deep connection resulting in higher purchase intentions, because the brands of the
influencers are perceived as more real, more approachable and also more appealing to imitate
(Jin et al, 2018).
For Campbell and Farrell (2020) an influencer is a person who gets compensation for posting
on social media. The compensation can be in money or kind, such as free products, trips,
services, among others. These posts are blended in their social media profiles and appear as
28
regular lifestyle posts (Campbell and Farrell, 2020). The word influencer can be defined as
someone “who built a large network of followers, and are regarded as trusted tastemakers in
one or several niches” (De Veirman et al., 2016, p. 1) which is very similar to the concept
of micro-celebrities “everyday, ordinary internet users who accumulate a relatively large
following on blogs and social media through the textual and visual narration of their personal
lives and lifestyles, engage with their following in ‘digital’ and ‘physical’ spaces and
monetize their following by integrating ‘advertorials’ into their blogs or social media posts
and making physical paid-guest appearances at events” (Abidin, 2016, p. 3). Social media
influencers are both ordinary and famous people. Jin et al (2018) defines Instagram
influencers as “any popular Instagram character with a high number of followers, who has a
high taste in fashion and lifestyle, which enables them to monetize their appearance.” (Jin et
al, 2018, p. 4).
In 2020, 75% of the marketeers resorted to digital influencers and it is estimated that this
industry is worth more than $100 billion. Influencers are experts in creating content that
induces interaction within their audience, this talent can be worth more than six figures per
social media post. Young people consider it as an easy way to make money and are joining
the influencer community, therefore, advertising agencies are paying attention and creating
businesses that specialize in influencer marketing. (Campbell and Farrell, 2020)
The success of influencer marketing is a combination of different factors. To start, the shift
in media consumption from print to digital. Then, the reaction consumers have towards
advertising differs from online to traditional form, online consumers are goal-oriented which
makes them less prone to paying attention to a random advert. This may be a blockage for
online advertising so marketers had to come up with softer, less overt, and more authentic
ads. Is precisely here that influencers come to play. We are spending more time online and
on social media than ever before. Content in these platforms is tested in real-time because
they are open forums. The result is an emergence of talent capable of producing more
engaging and authentic content than the brand owned communication. Social media also
requires different tactics of message distribution, as it extends the decision-making process,
and the consumer needs to be lightly reminded of the product many times. The last factor
mentioned by the authors is that the internet incentivizes the formation of communities of
29
users with the same interests making it easier for influencers to find their niche and be more
effective in creating content that will appeal to their audience. (Campbell and Farrell, 2020).
There are considered five distinct types of influencers according to the size of their audience:
celebrity influencers, mega-influencers, macro-influencers, micro-influencers, and nano-
influencers (Campbell and Farrell, 2020). Celebrity influencers are individuals that have
public recognition in the real world. These people do not depend on social media networks
to experience fame, even if they use it to increase their notoriety, support their careers and
advertise products or brands. They often have over one million followers or subscribers and
partnerships with mainstream brands. Despite being perceived as less authentic and having
low engagement rates, celebrity influencers are the most expensive kind of influencer. The
brands they work with are frequently related to their work, so they have high levels of
perceived expertise. For example, a famous guitar player is endorsed by Fender and only
plays with Fender guitars. This positions the brand in an excellence and exclusivity stage,
leveraging their guitars as high quality products and the best professionals only play with
those. (Chen, 2017) Mega-influencers also have public recognition in the real world but
unlike celebrity influencers, they depend on social media to have it. They have large follower
bases with over one million followers, these are called “the everyday celebrity”. Despite
their significant audiences, they are mostly unknown to people outside their fan base. Macro-
influencers are on the verge of achieving celebrity status, they have about 100 000 to 1
million followers. These have great engagement rates, they are very selective when choosing
brands and partnerships and often act on a topic (travel, family, food, etc). Macro-influencers
charge less than mega-influencers and are the category that has the better price-return
relationship (Campbell and Farrell, 2020). Micro-influencers have a scale and scope much
smaller, but they are successful enough to make a living out of being an influencer. Their
audience is around 100 000 and 10 000 followers located close to them geographically
speaking. Most of their income comes from affiliate-link programs and partnerships with
brands. They can partner with brands from different industries because they are not as topic-
centered as macro-influencers. Many marketers are working with micro-influencers because
they are perceived as more authentic than the previous categories. They use mainly videos
to communicate with their audience, which is a good tool to show products or services
(Wissman, 2018). Lastly, the Nano-influencers, whose followers are mostly friends,
30
acquaintances, or others that live close by. These people are starting their influencer careers
or just happen to have a growing number of followers organically by doing normal social
media usage. They have less than 10 000 followers and the highest engagement rates because
nano-influencers give the audience scope of their personal lives. As they are just entering
the industry they tend to be more proactive and to be more open to unpaid jobs or free
products in exchange for some posts or videos. (Campbell and Farrell, 2020)
3.4. Community Management
Online communities are large-scale collaboration environments, these are used by us daily.
Since the 2000s online communities have been an object of interest by the scientific
community. Effective spread of information, innovation adoption, and brokerage are all
phenomena we can witness in a network.
A network can be defined as relationships between groups of humans, and online
communities became social networks where participants are represented by nodes. The
interaction between participants can vary from the type of community, for example, in
Twitter, the microblogging environment is fueled by following, being followed, retweets
and mentions. (Cottica et al., 2017) Tuten and Solomon (2018) in their book, Social Media
Marketing, define community as a “the collective participation of members who together
create value” (Tuten & Solomon, 2018, p. 132) and online communities as “as a group of
people who come together for a specific purpose, who are guided by community policies,
and who are supported by an online vehicle or host that enables virtual communication
among members” (Tuten & Solomon, 2018, p. 132). The online version of the Merriam -
Webster Dictionary defines community as unified group of people, that have the same
interests, occupation, location, political and economic concerns or common history. Social
scientists define online communities as people connecting in a cyberplace “with kindred
spirits, engage in supportive and sociable relationships with them, and imbue their activity
online with meaning, belonging, and identity” (Tuten & Solomon, 2018, p. 132). All types
of communities, online and offline, share the same important core, the feeling of membership
and the sense of proximity with other members. Being online is a way to facilitate the
members communication and provides a venue.
31
(Tuten & Solomon, 2018)
Among several online communities, we have brand communities, which are specialized,
non-geographically bound communities, based on a structured set of social relationships
among admirers of a brand. The most important aspect of a brand community is the sharing
of meaning. These communities allow the sharing of information and experiences and they
are quite effective in creating long-term relationships with consumers. People can create a
social identity through brands, so they usually join these types of communities for self-
presentation, self-expression, or to raise their self-esteem. The brands’ reach is much higher
on online communities than in offline traditional communities, their activities become more
transparent due to the fast communication and the threat that if a member is unhappy the
news will spread to the whole community. (Hakala et al., 2017)
Wirtz (2013) has identified three types of online community engagement factors. Brand-
related which are brand identification and the brand’s symbolic function to the consumer;
social which are social benefits and social identity; and functional drivers which include
benefits, uncertainty avoidance, and information quality (Wirtz et al., 2013). There are five
types of value people can get from brand online community engagement. The sense of
purpose reflects on cognitive and rational motivation. Self-discovery as in discovering their
taste and preferences through interactions with the community. Interpersonal connectivity is
based upon people’s desire to meet like-minded others, companionship, and social support.
Entertainment is centered on the need for enjoyment, they get it from engaging with the
community and by conquering the other members’ acceptance, approval, or enhancing their
status. Communities may encourage good behaviors like helping other members,
participating in joint activities, and in offline meetings, members may develop friendships
or feel empowered. (Hollebeek et al., 2017)
Digital channels can convey the sense of presence due the interaction with a computer-
mediated or computer-generated environment, as in the case of social media (Tuten &
Solomon, 2018). A study conducted in 2012 determined that about 70% of Facebook users
admitted having joined the network to follow brands, to access information on new products
and activities. Coelho et al (2018) state that people join brand communities to fulfill the need
32
for information on how to use a product and on how to receive related rewards. Consumer
engagement has been used to create and enhance consumer-brand relationships. The
technological elements of digital communities allow consumers to be active participants
(Coelho et al., 2018).
Brand communities’ engagement can be classified into three dimensions: cognition, affect,
and behavior. Cognitive engagement is related to the attention paid to the contents and the
absorption from the outside world. Attention relates to the voluntary decision of interacting
with a brand community, this requires mental space and keeps us from doing other tasks.
Absorption indicates the inability of detachment once interacting with a digital community.
This occurs when users cannot turn off social media and become addicted to the interesting
content that brands publish in those platforms. One good example of this phenomenon occurs
when brands launch challenges, like a photo competition, people will spend much more time
on the brand’s page to promote their participation, to track other members' participation
posts, and to see who won it. The affective dimension is based upon the emotions
experienced while engaging with the community. The most relevant are the enthusiasm and
the enjoyment. Enthusiasm reflects on the demonstrated interest in the community, this can
be shown through the user’s interactions with the community’s content. Enthusiasm is
contagious, if the user leaves a like or a comment on a brand’s post, it is more likely to be
shown to their friends and that increase their interaction with the post as well. Enjoyment
indicates “pleasure and happiness derived from interaction with the online brand community
and its members” (Dessart et al., 2015, p. 8). This dimension is characterized by the pleasure
users take by interacting with the community, it can be by comments on their posts and
sustaining that interaction or by seeing funny posts. Behavioral engagement is manifested
by the actions user make while in the digital community, sharing and learning are the most
important. Sharing is the exchange of experiences, content, and ideas among the community
members, online communities rely massively on these exchanges. Online communities need
a foundation of commonality to thrive creating bonds between members since these groups
of people come together to share passions (Tuten & Solomon, 2018). People may join groups
on Facebook about traveling to a specific location to share tips and helpful insight about the
area, a restaurant page relies on customers' opinions on their Facebook page about their
service and food to attract new customers. This act of sharing is defined by the author as
33
collaborative and interactive exchange and is motivated by providing resources to others,
“sharing can manifest itself through shares, comments and posts, tweets, replies or even
direct messages on Twitter or Facebook.” (Dessart et al., 2015, p. 9). All the access to
people’s emotions and knowledge starts the learning process. “Learning and improving their
skills is a key aspect of online community participation” (Dessart et al., 2015, p. 9) Members
are free to ask questions and to be answered by more experienced users or the brand itself,
they also use online communities to stay updated on the latest news and trends. Although
learning is considered a cognitive action, in terms of engagement is behavioral because the
user actively searches for information, in contrast with passivity and avoiding it common in
disengaged consumers. Lastly, we have the endorsing factor, which is characterized by
recommendations. Members can recommend or talk about products in the brand community.
In addition, endorsement goes beyond the community by itself, members can share on their
personal social media profiles the brand’s posts or products, recommend a loyalty program
or talk about their experience with the brand. (Dessart et al., 2015)
After revising these concepts, I have applied them to construct my project’s communication
strategy.
34
Chapter 3 - Mobile Applications
2.1. Mobile Devices and Applications
The mobile term has evolved from simply describing a phone to a vaster group of mobile
computed devices and services such as mobile applications or virtual assistants (Tong et al.,
2020). It is considered to be a mobile device: a phone (which can be a smartphone or a
feature phone with or without connection to the internet), a tablet and all smart wearables
(like google glasses or smart watches) (Poynter, 2015). In Portugal, smartphones have
already surpassed 50% of penetration rate and make up for 75,1% of the total mobile phone
users. This technology is considered to be in the maturity phase, so we can already take some
conclusions about its usage. We know that internet access is firstly made through mobile
applications, not browsers and that people do not want to pay for apps but do not mind in-
app purchases because they have already tried the product and know what they are buying
(Dias & Teixeira-Botelho, 2020).
The new type of consumer as a tendency to be mobile, we move around a lot and our lives
have become more fast paced. We want everything we do to be time-efficient, when we see
something we like on television we will research it on our phones, or before buying an item
in-store we search the price and quality of it (Kotler et al., 2016). Mobile phones have been
described as swiss army knives due to the various functions that they have integrated to help
us, which can be a camera, a calculator, a contact list, a clock, and so on (Ling 2004) . They
can be also called “teddy bears” because of the emotional dimension they represent to the
owner (Ling 2004). Mobile phones are an extension of ourselves (Dias 2008), we can quickly
judge someone just by looking at their phone characteristics and augment our capacities and
having our phones with us gives us comfort because we can be in touch with anyone (Vicent
2005). Although these devices have more functions than ever, communication is still the
main use for it. The internet has also contributed to keep people in touch with each other,
however, studies show that it is by phone that we contact our inner social circle (Fortunati
2002). Telephones have enabled us to express our feelings, needs, and emotions in a split
second (Dias & Teixeira-Botelho, 2020).

35
This technology has a very intrusive nature, when the phone rings or vibrates, we have the
urge to make it stop so it does not disturb us or the others around, therefore we end up
replying to a message or taking a phone call right away (Levinson 2001). It demands our
attention to communicate with others. In addition, mobile phones have also the power to
generate involvement, leading us to seek information, entertainment, or connection. The lack
of its stimuli has also side effects such as anxiety. We constantly check our phones even if
there is nothing there, just in case something pops up. FOMO (fear of missing out) is a social
phenomenon that is also responsible for our addiction to smartphones. Younger people have
developed a constant need for updates, as quick as possible. Digital technologies have
allowed us to be connected with the world in the distance of our fingertips, and we fear to
miss it. The thought of leaving our phone at home is uncomfortable and losing it provokes
anxiety, our smartphone has become the most personal and transmissible technology so far
(Dias & Teixeira-Botelho, 2020). FOMO was introduced in the early 2010s when social
networks were exponentially growing, it involves two concepts, the idea that others are
having experiences that one is not taking part in and the intense desire to stay connected with
others through social media. It is characterized by anxiety, the rumination aspect of
wondering if others are having fun without you, and the constant contact to relieve one of
those feelings to make sure they are included in others' lives, which can develop into a
compulsive obsessive disorder. Anxiety highly correlates with depression, FOMO also
potentiates boredom proneness (Elhai et al., 2021). People that are not satisfied with their
lives and with more fragile emotional health have more tendency to experience FOMO,
nearly 70% of adults have admitted having felt like they were missing out on life (Moore &
Craciun, 2021).
Mobile technologies have become a fundamental part of modern life and consumption
(Rauschnabel et al., 2019). They have developed a lot in the past few years to satisfy a
broader audience and converge different devices into one (Rauschnabel et al., 2017). A
mobile application is a software that resides in the mobile device and, most times,
downloaded from an app store (Poynter, 2015). It is a channel with anytime and anywhere
access and is more frequently used “on the go” and in public locations. They have become
an important part of companies' omnichannel strategy to build customer loyalty and to
connect with them in all the steps of the consumer journey (Gu & Kannan, 2021).

36
Nowadays, applications, like social media or dating apps, intent to connect reality with the
virtual world, we can share a photo of what we are doing in seconds or meet the love of our
life (Javornik, 2016).
2.2. Augmented Reality
New technologies can be incorporated into mobile applications that are able to provide
innovative services that are exclusive to mobile devices, like a keyless entry in hotel rooms
or app-based augmented reality (Gu & Kannan, 2021). Augmented reality (AR) in mobile
devices can bring opportunities for many industries to engage with users (Rauschnabel et
al., 2017). AR superimposes virtual elements directly into the environment in real-time
through a screen or projector visually transforming the physical reality (Javornik, 2016). It
overlaps virtual elements – like videos or images – on the real environment that we are seeing
through a screen (Flavián et al., 2019). It distinguishes itself from other forms of VR (Virtual
Reality) because it generates a "mixed reality" where it displays virtual objects in a real
environment, for example, in VR all is virtual (Yim et al., 2017).
Despite the fact that this technology has been introduced to us more recently via commercial
apps, it has been developing since the 1990s and the first-ever prototype was made by Ivan
Sutherland in 1968 (Javornik, 2016). There are different types of AR systems - image-based,
geo-location-based, and projection-based - that can be used in hand-held devices like a
smartphone. In image-based, image analysis recognizes signals in the real environment to
locate virtual information, like QR codes, labels, real objects, or landscapes. In location-
based uses geo-location from a GPS, digital compass, or accelerometer to show computer-
generated content accordingly to the users' location. Finally, the projection-based AR is more
interactive than the two first other types of AR mentioned. While the previous types only
displayed an image or video over a marker, projection-based AR enables the user to
manipulate the content in their surroundings. The gyroscope function of smartphones makes
the experience more real, with a higher sense of presence by controlling what is being
displayed just by turning their device. Also, binaural audio tries to imitate how humans
interpret sounds by generating a 3D sensation (Flavián et al., 2019).
37
The game Pokémon Go is one of the most famous examples of AR (Flavián et al., 2019). It
was the first mobile AR game to reach the top of the download charts in the applications
stores, being considered the biggest game in the United States history in 2016. This game
applies the freemium business model, meaning that users can download and play the game
for free with the addition of in-app purchases to get further features, such as more Pokéballs,
used to keep the creatures. The game consists in locating and catching creatures (Pokémons)
with your smartphone or another mobile device with a camera. With its camera, you scan
your surroundings to find hidden Pokémons that appear on your screen as if they were in
your environment. Users can also find game facilities, like a gymnasium, to engage in
combats with other players or train their creatures, so, it is meant to be played outside.
Supporters of the game claim it was a good way to increase physical activity, while critics
feared for the users' privacy and safety, because it may cause accidents due to people being
distracted (Rauschnabel et al., 2017). Players have said that the motivations to use the game
were nostalgia of their childhood when they played the first games in a Nintendo Gameboy,
which is already a portable device (Keogh, 2017). They identified other emotional reasons
to keep playing as the sense of community, friendship maintenance, and relationship
initiation. Health reasons were also pointed like an increase in physical activity and escapism
(Rauschnabel et al., 2017).
The game opened a door to other industries (Rauschnabel et al., 2017) to present their
products (Yim et al., 2017) and to simulate in their e-commerce platforms experiences that
normally only occur in in-store shopping (Hilken et al., 2017). Some cosmetic companies,
like L'Oreal and Sephora, have an AR mirror for customers to visualize how their products
will suit them at home (Yim et al., 2017). L'Oreal's Makeup Genius is a virtual mirror that
allows customers of their online platform to try on makeup. You need a device with a camera
to capture your face in order to see the products applied to your face in real-time (Hilken et
al., 2017). A study conducted by Hilken et al. (2017) showed that this feature provided an
authentic situated experience to the customers. They felt a heightened spatial presence and
an increase of the utilitarian and hedonic value perceptions of the online service experience.
AR also has the ability to align with the inherently situated nature of customers' information
processing.
38
2.3. Gamification
Interactions and two-way flows of information can be facilitated by the digital realm, to
communicate with the current and potential customers. For that, the need for engagement is
growing higher, and a good technique used to generate it is gamification (Kunkel et al.,
2021). The term was invented in 2002 by Nick Pelling, a British programmer, but only in
2010 it became mainstream concept. Although gamification is still a recent concept, the
overall notion translates to the use of game technology and game design methods outside the
gaming industry. Gamification has become a modern business practice in the last decade. It
makes use of game mechanics and elements to reward, measure, and influence user behavior,
with dynamics as goals, rules, playfulness, elements of fun, feedback, and promotions.
Gamification is characterized, according to Tóth and Tóvölgyi (2016), by six elements:
points, leaderboards, badges, avatars, levels, and process bars. Points are part of the reward
system, users gain points for their actions that are considered important by the developers.
Points are immediate feedback that the users' effort is being recognized. Leaderboards are
meant to incentivize people to do their best results possible, since the user can compare their
ranks with the other members of the community and aim to be at the top of the rank. Badges
are similar to points, they are given to users in form of a reward, but these are meant to show
off, to earn recognition from the community and not only for the platform itself. Like sports
medals, they are symbolic of an achievement. Avatars are a graphic representation of the
user in the platform, it is a form of self-expression and identity. Levels by definition are
meant to keep the game challenging and making the players learn new skills. In gamification,
it is used to show how experienced that user is. Finally, process bars are part of the feedback
system, they communicate to the user how long until the next step or level. Also says what
the user has accomplished so far (Tóth & Tóvölgyi, 2016). Nike+ is a great example of
turning running into fun. The app makes it a daily contest by tracking exercise statistics abd
assigning achievement points. The application even allows users to interface with avatars
(Jagoda, 2020).
Gamification uses intrinsic rewards to sustain engagement because they engage people at an
emotional level (Burke, 2014). The use of the PBL triad, which stands for Points, Badges,
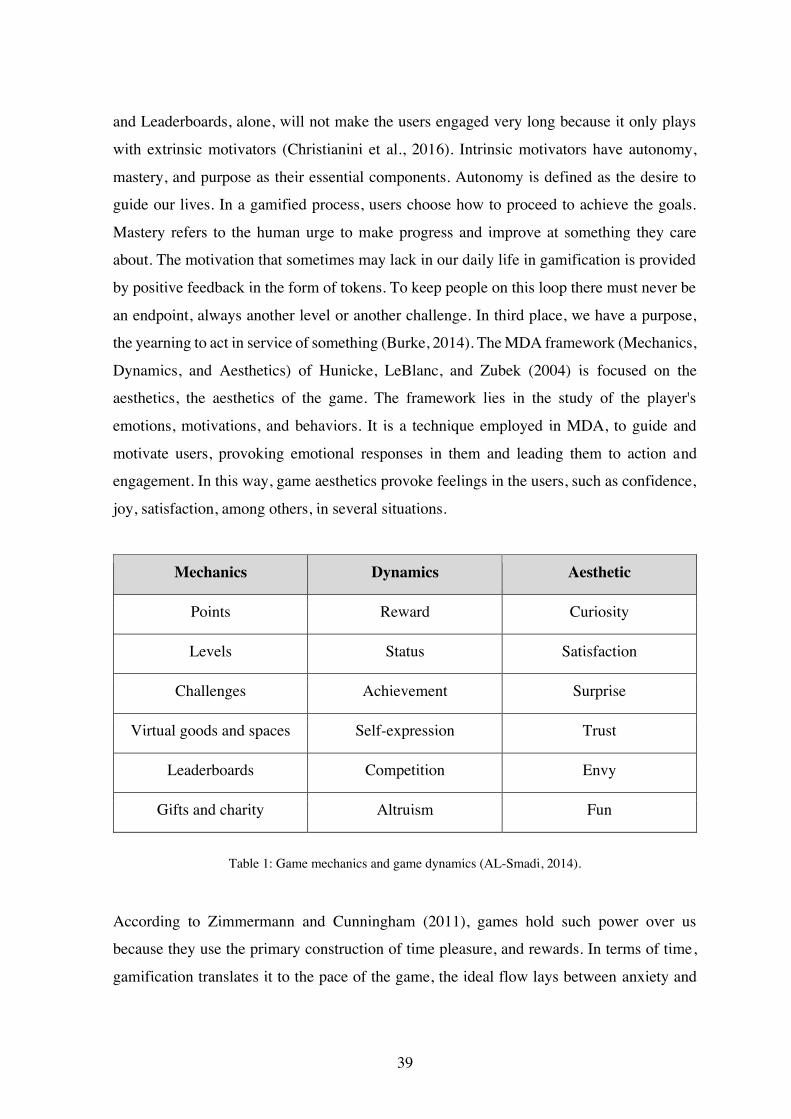
39
and Leaderboards, alone, will not make the users engaged very long because it only plays
with extrinsic motivators (Christianini et al., 2016). Intrinsic motivators have autonomy,
mastery, and purpose as their essential components. Autonomy is defined as the desire to
guide our lives. In a gamified process, users choose how to proceed to achieve the goals.
Mastery refers to the human urge to make progress and improve at something they care
about. The motivation that sometimes may lack in our daily life in gamification is provided
by positive feedback in the form of tokens. To keep people on this loop there must never be
an endpoint, always another level or another challenge. In third place, we have a purpose,
the yearning to act in service of something (Burke, 2014). The MDA framework (Mechanics,
Dynamics, and Aesthetics) of Hunicke, LeBlanc, and Zubek (2004) is focused on the
aesthetics, the aesthetics of the game. The framework lies in the study of the player's
emotions, motivations, and behaviors. It is a technique employed in MDA, to guide and
motivate users, provoking emotional responses in them and leading them to action and
engagement. In this way, game aesthetics provoke feelings in the users, such as confidence,
joy, satisfaction, among others, in several situations.
Mechanics Dynamics Aesthetic
Points Reward Curiosity
Levels Status Satisfaction
Challenges Achievement Surprise
Virtual goods and spaces Self-expression Trust
Leaderboards Competition Envy
Gifts and charity Altruism Fun
Table 1: Game mechanics and game dynamics (AL-Smadi, 2014).
According to Zimmermann and Cunningham (2011), games hold such power over us
because they use the primary construction of time pleasure, and rewards. In terms of time,
gamification translates it to the pace of the game, the ideal flow lays between anxiety and
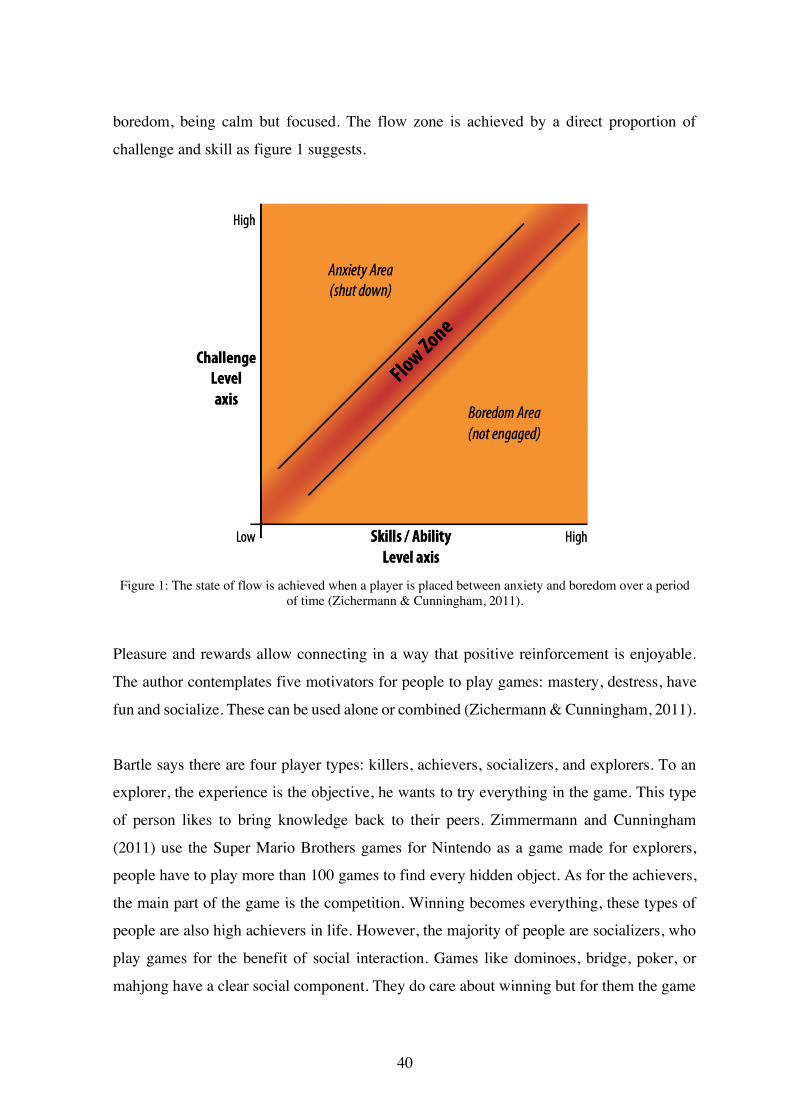
40
boredom, being calm but focused. The flow zone is achieved by a direct proportion of
challenge and skill as figure 1 suggests.
Figure 1: The state of flow is achieved when a player is placed between anxiety and boredom over a period of time (Zichermann & Cunningham, 2011).
Pleasure and rewards allow connecting in a way that positive reinforcement is enjoyable.
The author contemplates five motivators for people to play games: mastery, destress, have
fun and socialize. These can be used alone or combined (Zichermann & Cunningham, 2011).
Bartle says there are four player types: killers, achievers, socializers, and explorers. To an
explorer, the experience is the objective, he wants to try everything in the game. This type
of person likes to bring knowledge back to their peers. Zimmermann and Cunningham
(2011) use the Super Mario Brothers games for Nintendo as a game made for explorers,
people have to play more than 100 games to find every hidden object. As for the achievers,
the main part of the game is the competition. Winning becomes everything, these types of
people are also high achievers in life. However, the majority of people are socializers, who
play games for the benefit of social interaction. Games like dominoes, bridge, poker, or
mahjong have a clear social component. They do care about winning but for them the game
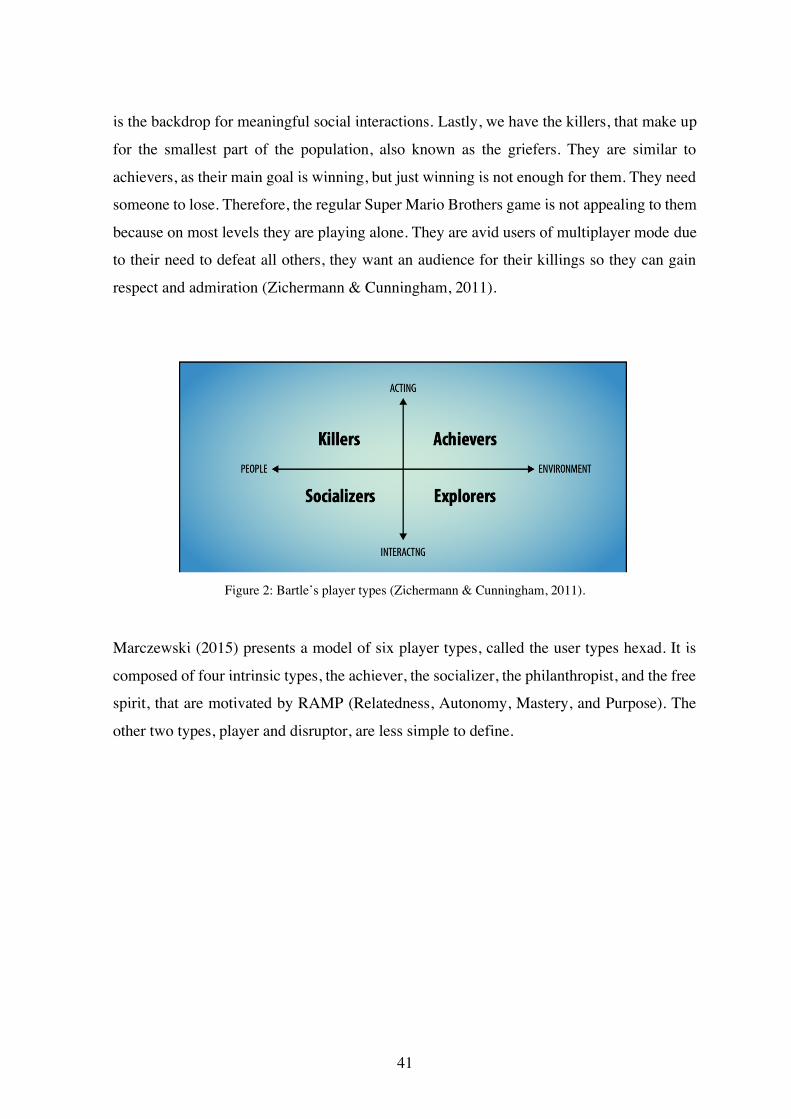
41
is the backdrop for meaningful social interactions. Lastly, we have the killers, that make up
for the smallest part of the population, also known as the griefers. They are similar to
achievers, as their main goal is winning, but just winning is not enough for them. They need
someone to lose. Therefore, the regular Super Mario Brothers game is not appealing to them
because on most levels they are playing alone. They are avid users of multiplayer mode due
to their need to defeat all others, they want an audience for their killings so they can gain
respect and admiration (Zichermann & Cunningham, 2011).
Figure 2: Bartle’s player types (Zichermann & Cunningham, 2011).
Marczewski (2015) presents a model of six player types, called the user types hexad. It is
composed of four intrinsic types, the achiever, the socializer, the philanthropist, and the free
spirit, that are motivated by RAMP (Relatedness, Autonomy, Mastery, and Purpose). The
other two types, player and disruptor, are less simple to define.
42
Figure 3: User Types Hexad (Marczewski, 2015).
The achiever, the socializer, the philanthropist, and the free spirit players are motivated by
intrinsic factors. The author defines achievers as the ones who are moved by mastery, they
want to be the best at all things or at least achieve everything within the system. They do
this primarily for themselves, they see the other players as part of the system that just needs
to be surpassed and so, this type of player is not bothered to show off their achievements to
others. A socializer is a person who wants to interact with others. These are the ones that
are most important to the internal social networks and great for engagement, these people
are moved by relatedness. The philanthropists want a system that makes them feel a sense
of altruism, that allows them to enrich other people, they are moved by purpose and are eager
to feel like they are part of something bigger. These types of players will answer questions
on forums just to feel they are helping. Lastly, the free spirits like to have autonomy and can
be divided into two subtypes: creators and explorers. Creators seek self-expression, they will
have the best avatar customization and personalize the content as much as they can. The
explorers want to explore the system without a predefined journey, these are the type of
players that find the holes in the system.
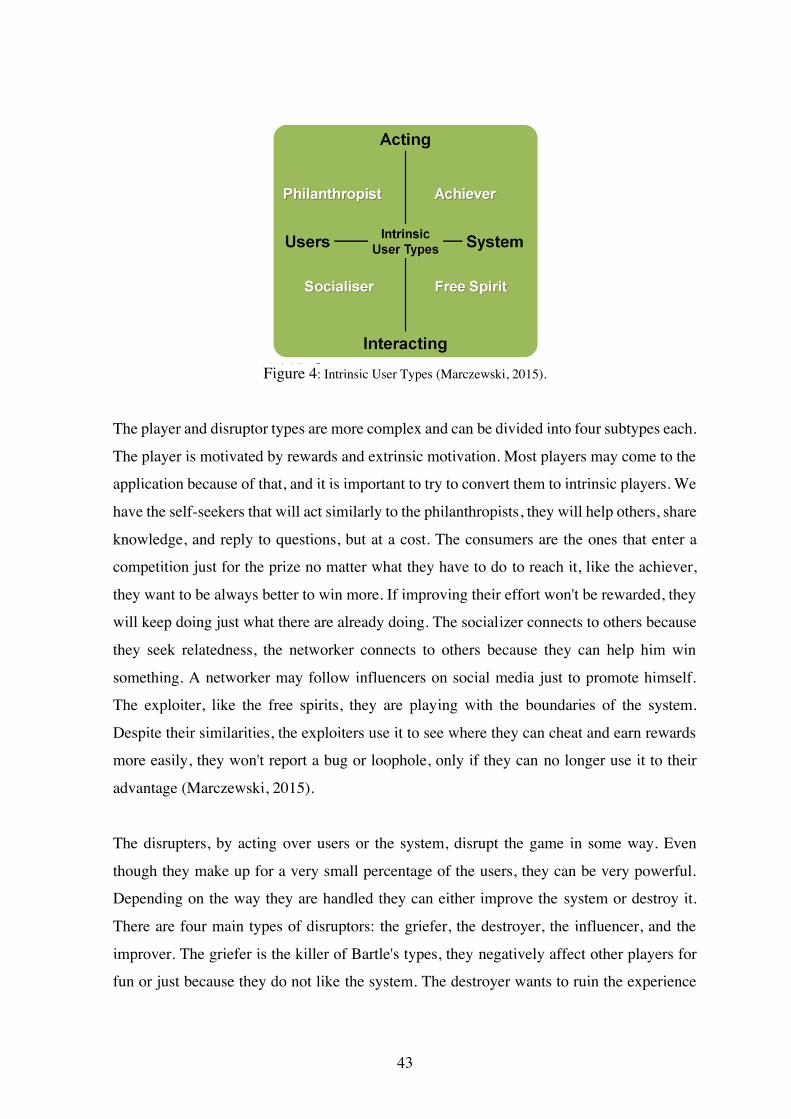
43
Figure 4: Intrinsic User Types (Marczewski, 2015).
The player and disruptor types are more complex and can be divided into four subtypes each.
The player is motivated by rewards and extrinsic motivation. Most players may come to the
application because of that, and it is important to try to convert them to intrinsic players. We
have the self-seekers that will act similarly to the philanthropists, they will help others, share
knowledge, and reply to questions, but at a cost. The consumers are the ones that enter a
competition just for the prize no matter what they have to do to reach it, like the achiever,
they want to be always better to win more. If improving their effort won't be rewarded, they
will keep doing just what there are already doing. The socializer connects to others because
they seek relatedness, the networker connects to others because they can help him win
something. A networker may follow influencers on social media just to promote himself.
The exploiter, like the free spirits, they are playing with the boundaries of the system.
Despite their similarities, the exploiters use it to see where they can cheat and earn rewards
more easily, they won't report a bug or loophole, only if they can no longer use it to their
advantage (Marczewski, 2015).
The disrupters, by acting over users or the system, disrupt the game in some way. Even
though they make up for a very small percentage of the users, they can be very powerful.
Depending on the way they are handled they can either improve the system or destroy it.
There are four main types of disruptors: the griefer, the destroyer, the influencer, and the
improver. The griefer is the killer of Bartle's types, they negatively affect other players for
fun or just because they do not like the system. The destroyer wants to ruin the experience
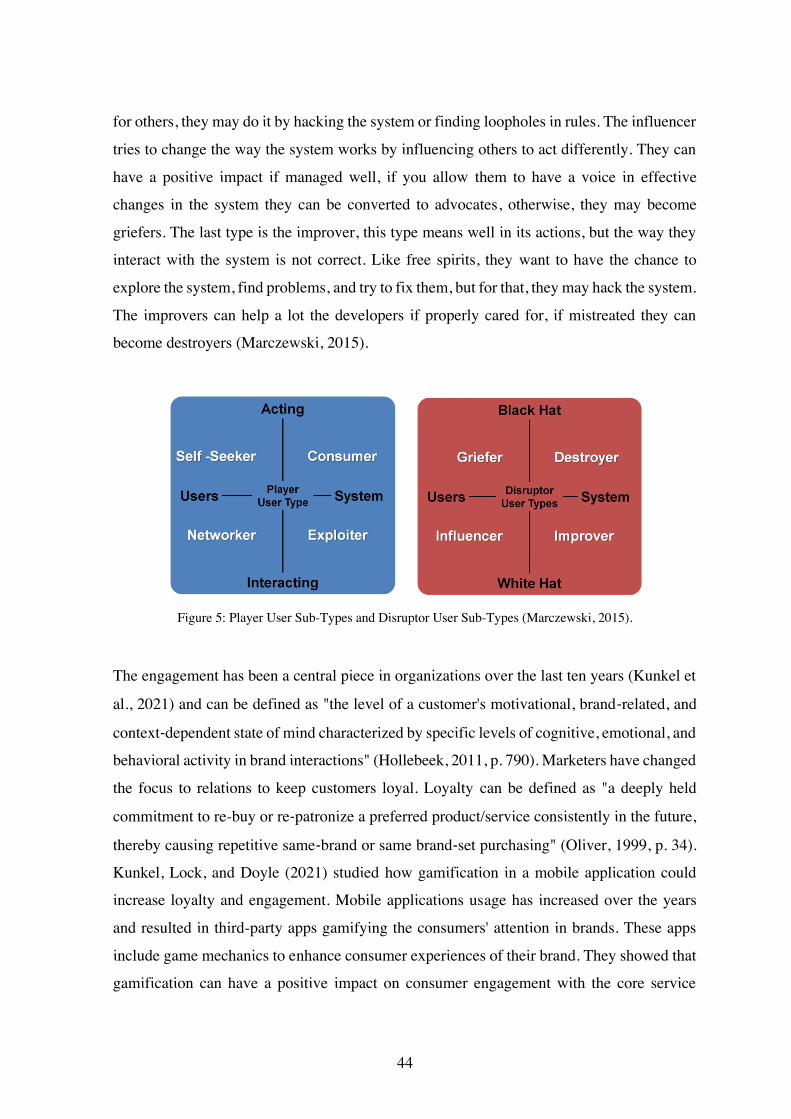
44
for others, they may do it by hacking the system or finding loopholes in rules. The influencer
tries to change the way the system works by influencing others to act differently. They can
have a positive impact if managed well, if you allow them to have a voice in effective
changes in the system they can be converted to advocates, otherwise, they may become
griefers. The last type is the improver, this type means well in its actions, but the way they
interact with the system is not correct. Like free spirits, they want to have the chance to
explore the system, find problems, and try to fix them, but for that, they may hack the system.
The improvers can help a lot the developers if properly cared for, if mistreated they can
become destroyers (Marczewski, 2015).
Figure 5: Player User Sub-Types and Disruptor User Sub-Types (Marczewski, 2015).
The engagement has been a central piece in organizations over the last ten years (Kunkel et
al., 2021) and can be defined as "the level of a customer's motivational, brand-related, and
context-dependent state of mind characterized by specific levels of cognitive, emotional, and
behavioral activity in brand interactions" (Hollebeek, 2011, p. 790). Marketers have changed
the focus to relations to keep customers loyal. Loyalty can be defined as "a deeply held
commitment to re-buy or re-patronize a preferred product/service consistently in the future,
thereby causing repetitive same-brand or same brand-set purchasing" (Oliver, 1999, p. 34).
Kunkel, Lock, and Doyle (2021) studied how gamification in a mobile application could
increase loyalty and engagement. Mobile applications usage has increased over the years
and resulted in third-party apps gamifying the consumers' attention in brands. These apps
include game mechanics to enhance consumer experiences of their brand. They showed that
gamification can have a positive impact on consumer engagement with the core service

45
provider. Also, achievement-orientated activities within the app tend to increase customers'
loyalty towards the core service. In addition, the four most common motivators for keeping
on using the app were rewards, competition, sense of achievement, and gaining knowledge,
these created not only engagement but also a sense of identity (Kunkel et al., 2021).

46
47
Part II – Empirical Work Chapter 4 – Methodology
I chose to the Kaban methodology to do this project because despite being designed for
teamwork, it can be adapted for a single person project due to the lack of fixed roles. Sjøberg
et al. (2012), in their study concluded that replacing Scrum with Kaban at an IT company
with experience in Agile methods resulted in an improvement in productivity. As I also have
professional experience with Agile methods, it seemed a great solution for my project. I will
use it as an organizational tool in order to keep my project coherent and on track.
Kaban is a methodology that came from Agile. It still preserves some flexibility principles
but has more structure. This concept was first developed in the production lines of Toyota
factories in the 1940s and then, around 2003, it was updated and brought to the modern
world by David J. Anderson. It is a very visual method – it makes use of the Kaban board,
Kaban card and Kaban swim lanes – all of which aim to deliver high quality results by
painting a picture of the workflow process so that bottlenecks can be identified early on in
the development process. It operates on six general practices: visualization, limiting work in
progress, flow management, making policies explicit, feedback loops, collaborative, or
experimental evolution (Anderson, 2010).
The cornerstone concept of Kaban is capacity over demand, which is known as the pull
system. This means that new work is put on hold until there is capacity to handle it instead
of being pushed due to the demand. The Imperial Palace Gardens is a great example of the
pull system, they have a limited capacity of visitors, so that the park wardens can maintain
it in good conditions, avoiding damages caused by overcrowding and foot traffic. Each
visitor is given an admission card, all the visitors arriving after the park reaches its full
capacity have to wait until the someone leaves so their admission card can be reutilized. This
is applied in Kaban by setting a fixed number of cards accordingly to the work capacity of
the team and each card represents one task. This means they can only start a new piece of
work if there is an available card, otherwise the task gets in the waiting queue. Every time a
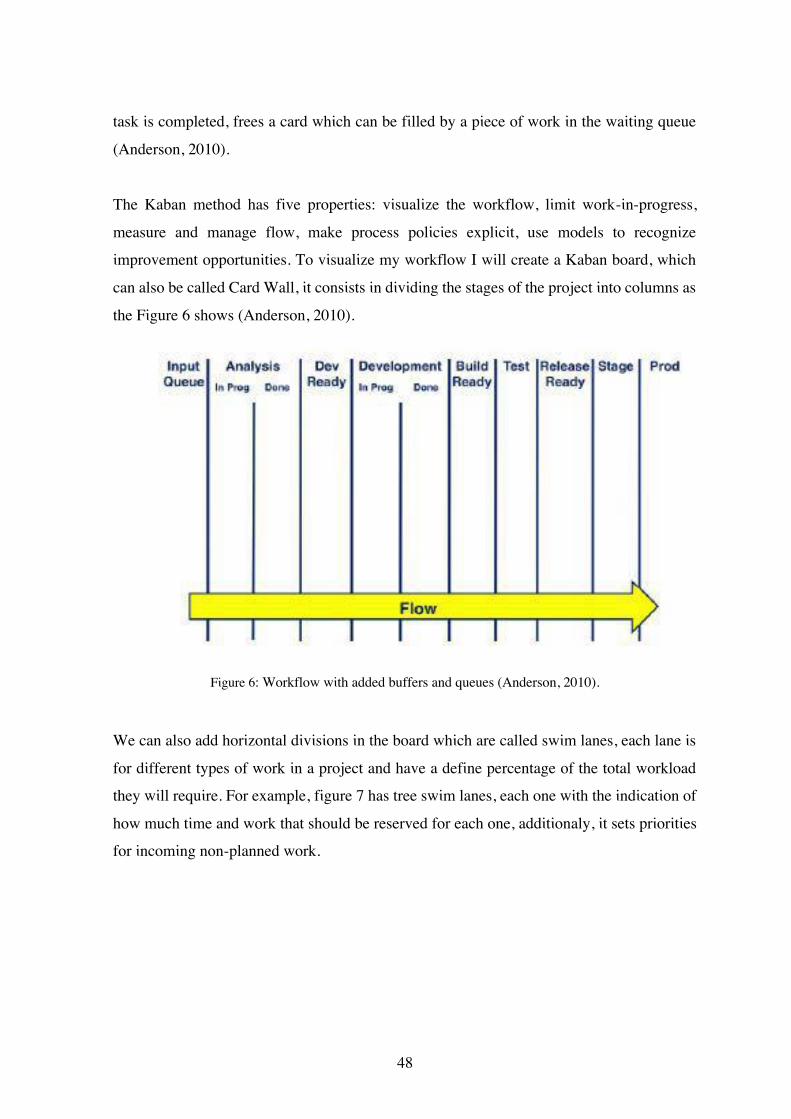
48
task is completed, frees a card which can be filled by a piece of work in the waiting queue
(Anderson, 2010).
The Kaban method has five properties: visualize the workflow, limit work-in-progress,
measure and manage flow, make process policies explicit, use models to recognize
improvement opportunities. To visualize my workflow I will create a Kaban board, which
can also be called Card Wall, it consists in dividing the stages of the project into columns as
the Figure 6 shows (Anderson, 2010).
Figure 6: Workflow with added buffers and queues (Anderson, 2010).
We can also add horizontal divisions in the board which are called swim lanes, each lane is
for different types of work in a project and have a define percentage of the total workload
they will require. For example, figure 7 has tree swim lanes, each one with the indication of
how much time and work that should be reserved for each one, additionaly, it sets priorities
for incoming non-planned work.
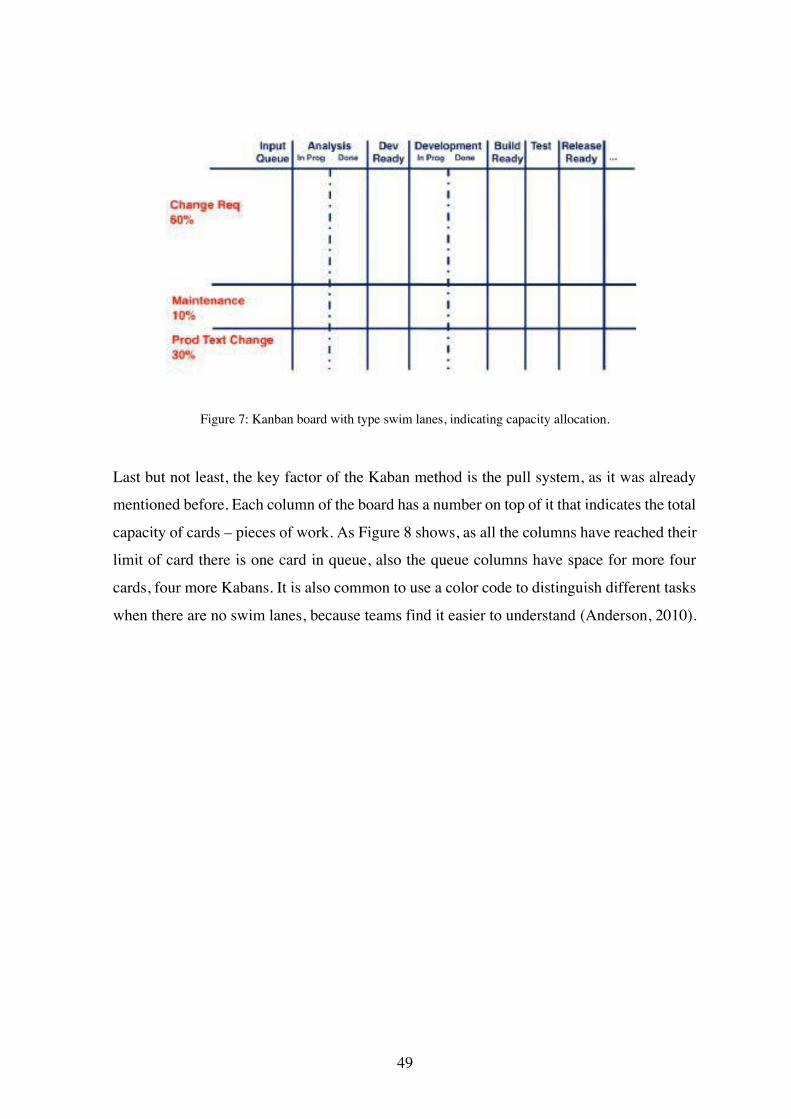
49
Figure 7: Kanban board with type swim lanes, indicating capacity allocation.
Last but not least, the key factor of the Kaban method is the pull system, as it was already
mentioned before. Each column of the board has a number on top of it that indicates the total
capacity of cards – pieces of work. As Figure 8 shows, as all the columns have reached their
limit of card there is one card in queue, also the queue columns have space for more four
cards, four more Kabans. It is also common to use a color code to distinguish different tasks
when there are no swim lanes, because teams find it easier to understand (Anderson, 2010).
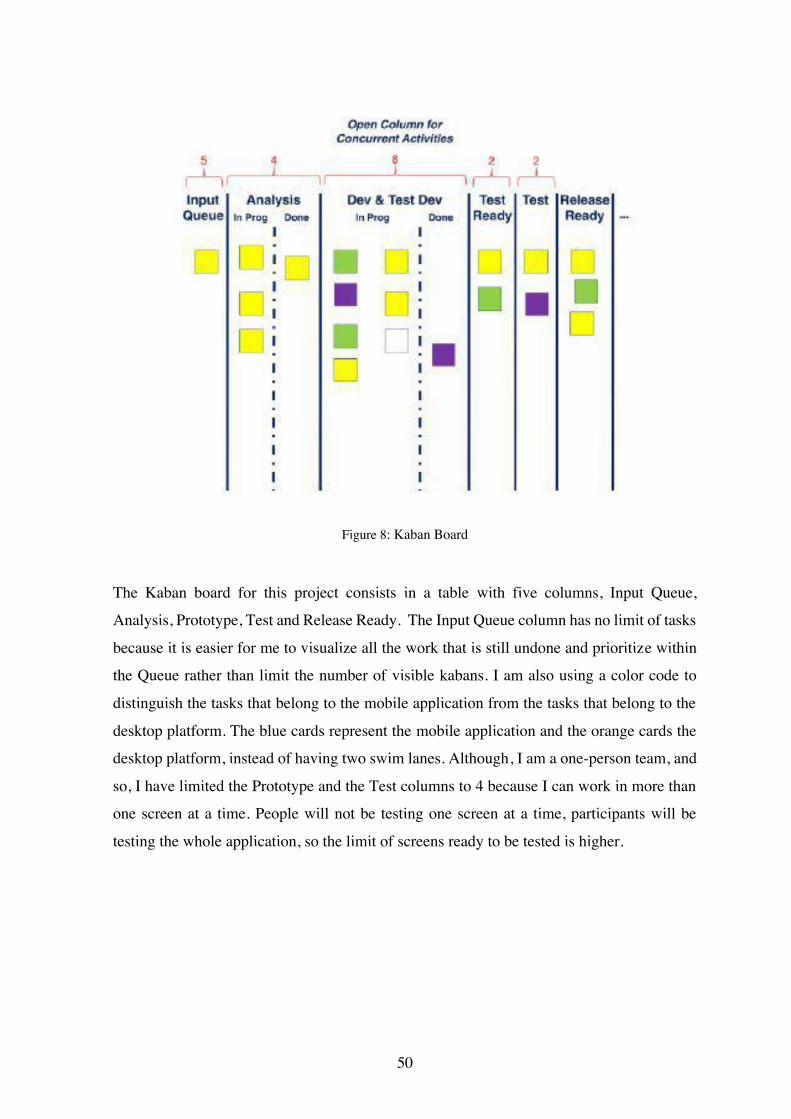
50
Figure 8: Kaban Board
The Kaban board for this project consists in a table with five columns, Input Queue,
Analysis, Prototype, Test and Release Ready. The Input Queue column has no limit of tasks
because it is easier for me to visualize all the work that is still undone and prioritize within
the Queue rather than limit the number of visible kabans. I am also using a color code to
distinguish the tasks that belong to the mobile application from the tasks that belong to the
desktop platform. The blue cards represent the mobile application and the orange cards the
desktop platform, instead of having two swim lanes. Although, I am a one-person team, and
so, I have limited the Prototype and the Test columns to 4 because I can work in more than
one screen at a time. People will not be testing one screen at a time, participants will be
testing the whole application, so the limit of screens ready to be tested is higher.
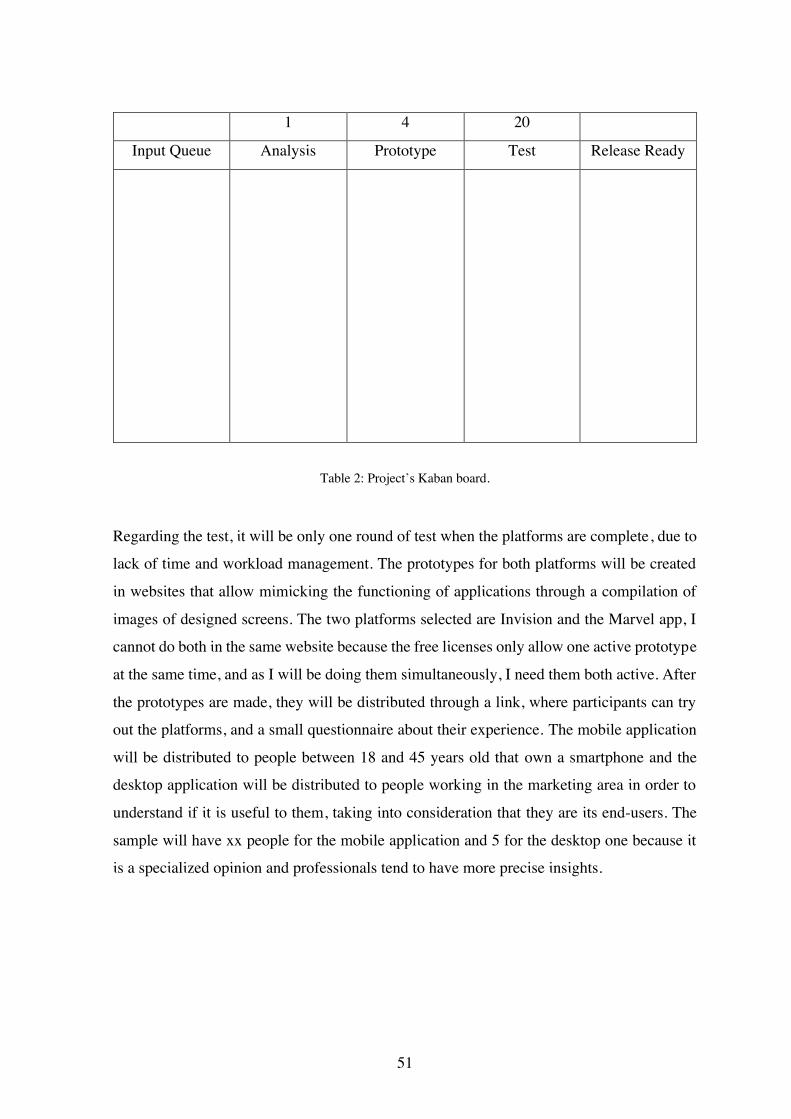
51
1 4 20
Input Queue Analysis Prototype Test Release Ready
Table 2: Project’s Kaban board.
Regarding the test, it will be only one round of test when the platforms are complete, due to
lack of time and workload management. The prototypes for both platforms will be created
in websites that allow mimicking the functioning of applications through a compilation of
images of designed screens. The two platforms selected are Invision and the Marvel app, I
cannot do both in the same website because the free licenses only allow one active prototype
at the same time, and as I will be doing them simultaneously, I need them both active. After
the prototypes are made, they will be distributed through a link, where participants can try
out the platforms, and a small questionnaire about their experience. The mobile application
will be distributed to people between 18 and 45 years old that own a smartphone and the
desktop application will be distributed to people working in the marketing area in order to
understand if it is useful to them, taking into consideration that they are its end-users. The
sample will have xx people for the mobile application and 5 for the desktop one because it
is a specialized opinion and professionals tend to have more precise insights.
desktop
app
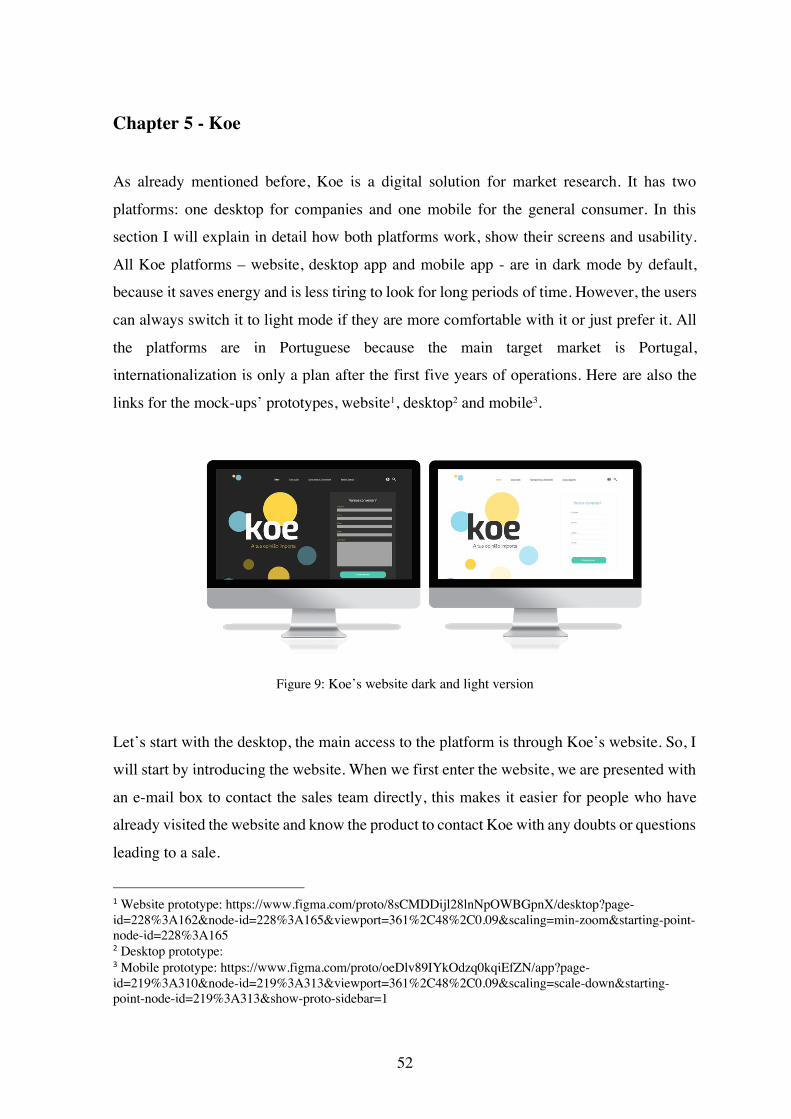
52
Chapter 5 - Koe
As already mentioned before, Koe is a digital solution for market research. It has two
platforms: one desktop for companies and one mobile for the general consumer. In this
section I will explain in detail how both platforms work, show their screens and usability.
All Koe platforms – website, desktop app and mobile app - are in dark mode by default,
because it saves energy and is less tiring to look for long periods of time. However, the users
can always switch it to light mode if they are more comfortable with it or just prefer it. All
the platforms are in Portuguese because the main target market is Portugal,
internationalization is only a plan after the first five years of operations. Here are also the
links for the mock-ups’ prototypes, website1, desktop2 and mobile3.
Figure 9: Koe’s website dark and light version
Let’s start with the desktop, the main access to the platform is through Koe’s website. So, I
will start by introducing the website. When we first enter the website, we are presented with
an e-mail box to contact the sales team directly, this makes it easier for people who have
already visited the website and know the product to contact Koe with any doubts or questions
leading to a sale.
1 Website prototype: https://www.figma.com/proto/8sCMDDijl28lnNpOWBGpnX/desktop?page-id=228%3A162&node-id=228%3A165&viewport=361%2C48%2C0.09&scaling=min-zoom&starting-point-node-id=228%3A165 2 Desktop prototype: 3 Mobile prototype: https://www.figma.com/proto/oeDlv89IYkOdzq0kqiEfZN/app?page-id=219%3A310&node-id=219%3A313&viewport=361%2C48%2C0.09&scaling=scale-down&starting-point-node-id=219%3A313&show-proto-sidebar=1
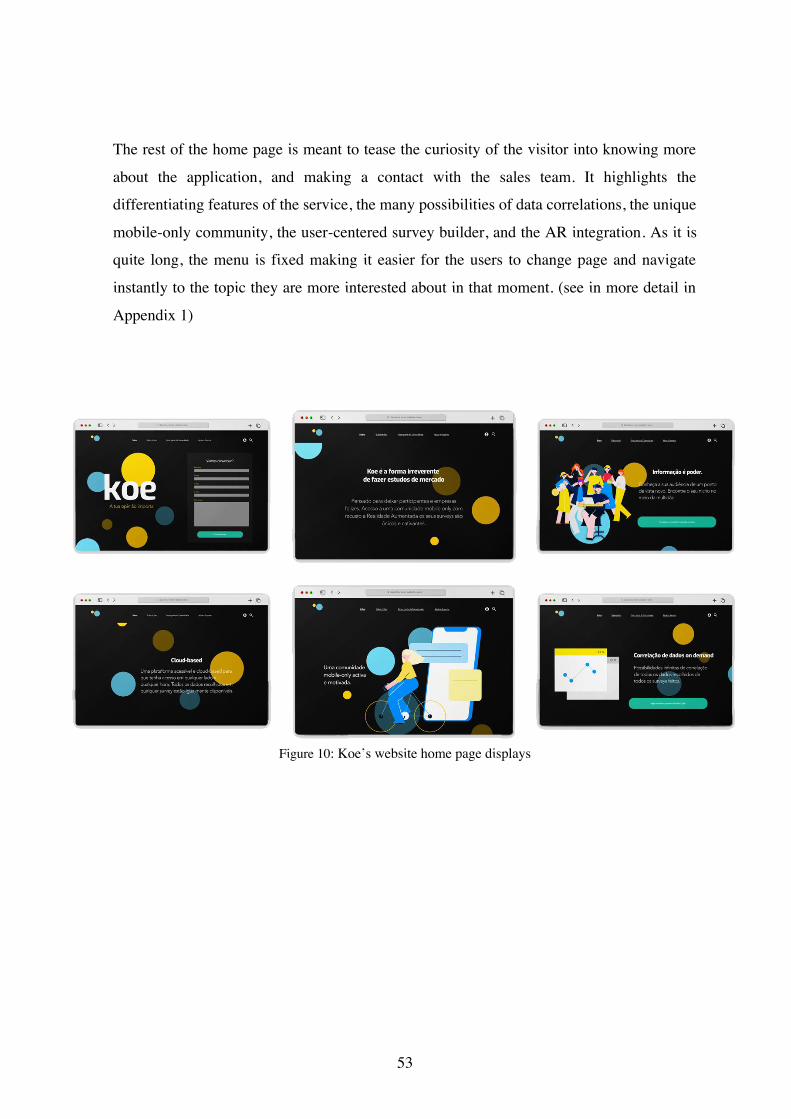
53
The rest of the home page is meant to tease the curiosity of the visitor into knowing more
about the application, and making a contact with the sales team. It highlights the
differentiating features of the service, the many possibilities of data correlations, the unique
mobile-only community, the user-centered survey builder, and the AR integration. As it is
quite long, the menu is fixed making it easier for the users to change page and navigate
instantly to the topic they are more interested about in that moment. (see in more detail in
Appendix 1)
Figure 10: Koe’s website home page displays
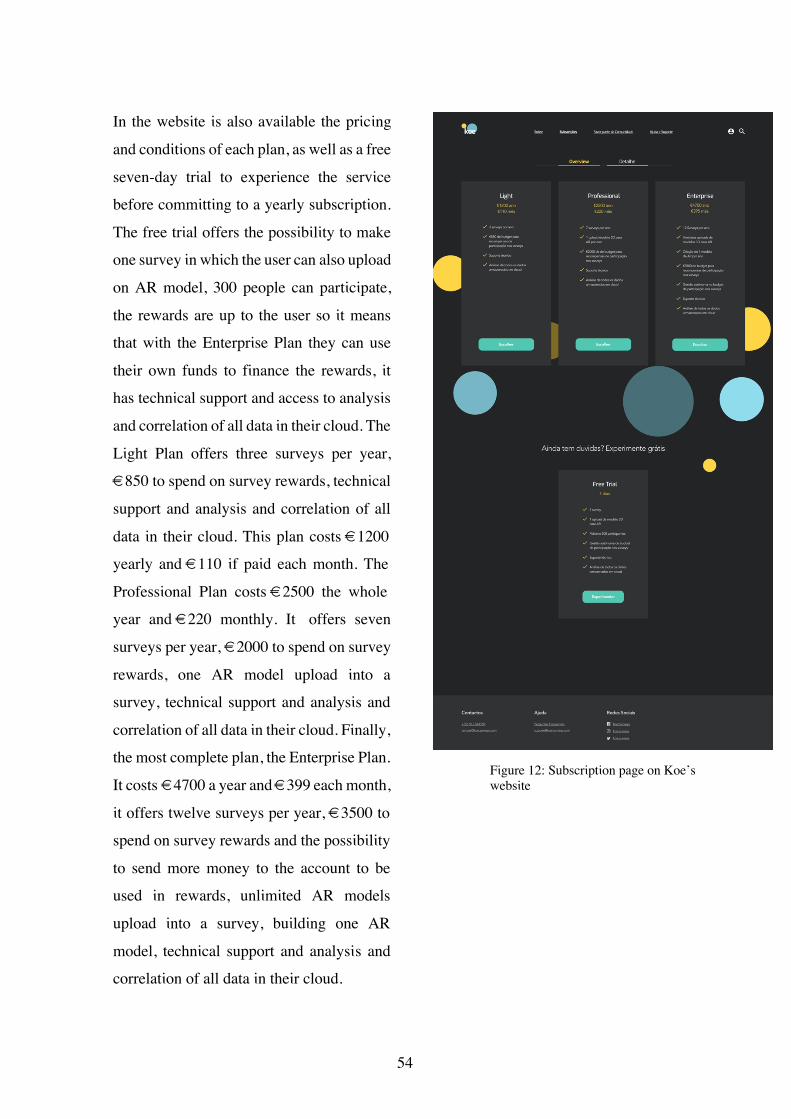
54
In the website is also available the pricing
and conditions of each plan, as well as a free
seven-day trial to experience the service
before committing to a yearly subscription.
The free trial offers the possibility to make
one survey in which the user can also upload
on AR model, 300 people can participate,
the rewards are up to the user so it means
that with the Enterprise Plan they can use
their own funds to finance the rewards, it
has technical support and access to analysis
and correlation of all data in their cloud. The
Light Plan offers three surveys per year,
€850 to spend on survey rewards, technical
support and analysis and correlation of all
data in their cloud. This plan costs €1200
yearly and €110 if paid each month. The
Professional Plan costs €2500 the whole
year and €220 monthly. It offers seven
surveys per year, €2000 to spend on survey
rewards, one AR model upload into a
survey, technical support and analysis and
correlation of all data in their cloud. Finally,
the most complete plan, the Enterprise Plan.
It costs €4700 a year and €399 each month,
it offers twelve surveys per year, €3500 to
spend on survey rewards and the possibility
to send more money to the account to be
used in rewards, unlimited AR models
upload into a survey, building one AR
model, technical support and analysis and
correlation of all data in their cloud.
Figure 12: Subscription page on Koe’s website
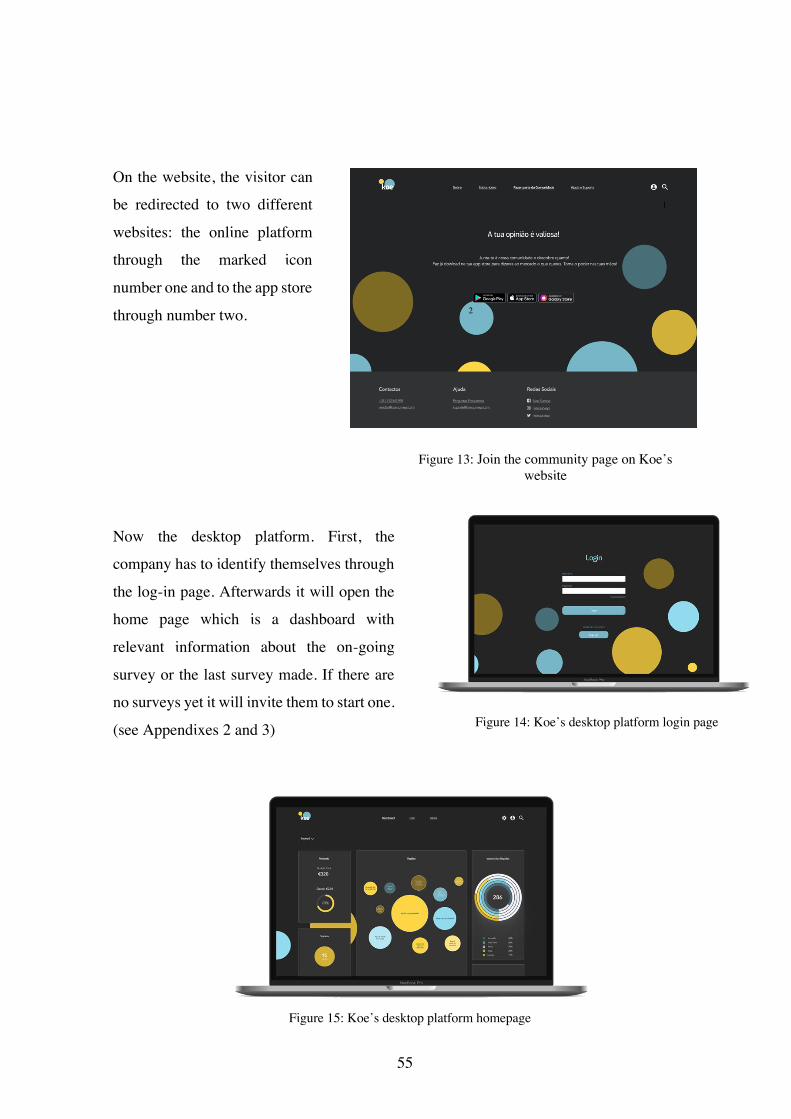
55
On the website, the visitor can
be redirected to two different
websites: the online platform
through the marked icon
number one and to the app store
through number two.
Now the desktop platform. First, the
company has to identify themselves through
the log-in page. Afterwards it will open the
home page which is a dashboard with
relevant information about the on-going
survey or the last survey made. If there are
no surveys yet it will invite them to start one.
(see Appendixes 2 and 3)
1
2
Figure 13: Join the community page on Koe’s website
Figure 15: Koe’s desktop platform homepage
Figure 14: Koe’s desktop platform login page

56
Clicking on “Criar” on the menu on top of the page, it will open the survey builder, where
the companies can choose a template or make a questionary from scratch. In the template
and the blank survey options there are modules to add to the questionary made in drag-and-
drop fashion. Each template is customizable to the user’s needs. In the figure below, we can
see an example of how to build a survey. There is a preview of how it is going to look in a
smartphone screen and an example of how the drag-and-drop elements would work. (see
Appendix 4)
Lastly, the data analysis part, the third option in the left menu. By default, it will show the
data from the on-going survey or the last one made. To correlate different data points, we
have to look on the side menu to our left, then select the survey. When we click on “Procurar
Survey” number one (1), a list of the exiting surveys will open in pop-up and when we select
one (1) the option of showing all data from that survey or to only choose the data from one
question. Users can add as many data points to a graph as they like, by clicking on number
two (2). After the user had added all the data points wanted by clicking on number three (3)
a graph will be presented on the right side of the screen. By clicking on number four (4) we
can delete a graph. (see Appendix 5)
Figure 16: Koe’s desktop platform survey builder
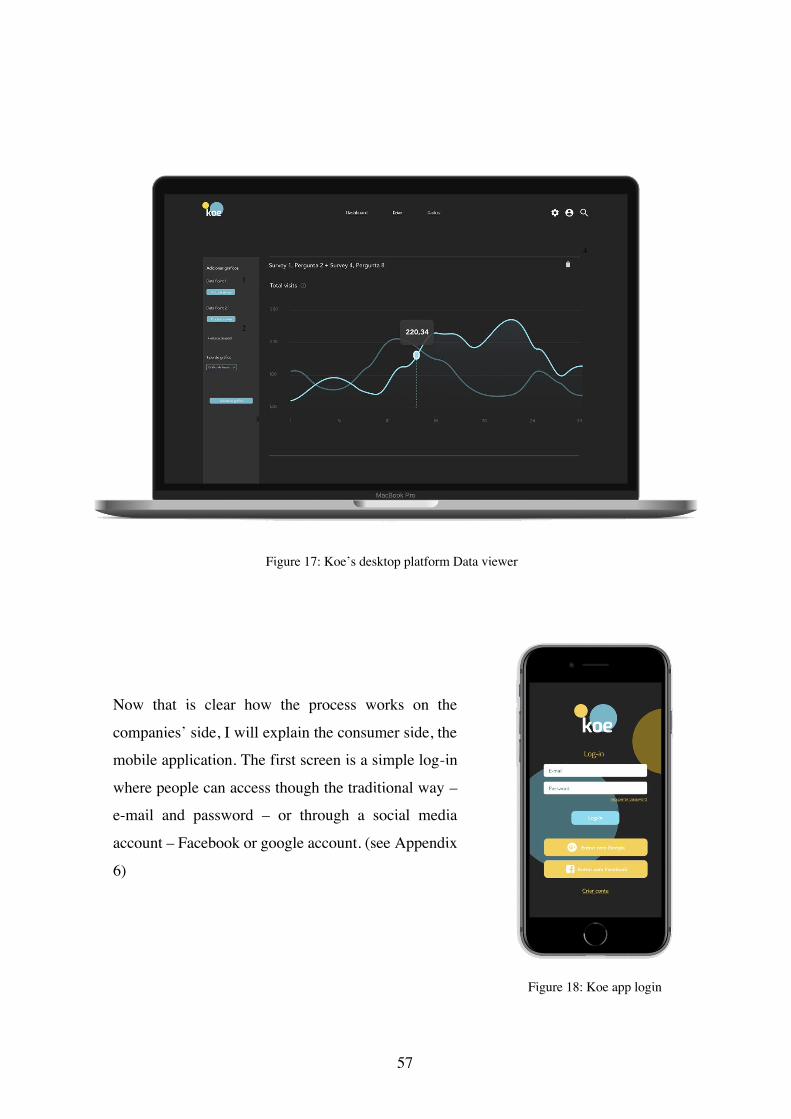
57
Now that is clear how the process works on the
companies’ side, I will explain the consumer side, the
mobile application. The first screen is a simple log-in
where people can access though the traditional way –
e-mail and password – or through a social media
account – Facebook or google account. (see Appendix
6)
1
2
3
4
Figure 17: Koe’s desktop platform Data viewer
Figure 18: Koe app login

58
After the authentication the user lands on the homepage, the center screen bellow. There are
two constant elements throughout the user journey the menu on number one (1) and the
notification bell on number two (2). If you click on number one (1) a menu will open with
seven options: home, Desafios, Niveis, Cofre, Perfil, Defenições and Ajuda, that are the
highway of this app, the user can change to any of these pages anytime. By taping on number
two (2) the user will see all the recent events, a new challenge or a challenge that is about to
expire, a new questionary or a new qualification on the ranking. If the user clicks on the
notification it lands on the respective page or opens the respective questionary. (see
Appendixes 7, 8 and 9)
On the home page the user can see all the available surveys paid or Koe quick stats. When
the user wants to reply to a survey, they just have to tap on it and the specs of the survey as
average time spent, the rewards, among others, will appear. If the user agrees with what is
written they can click on number one (1) to go to the survey, if they change their minds and
do not want to reply to the survey anymore, they can either click on the menu, which is
1 2
1
2
Figure 19: Koe app dashboard with menu open and notification open
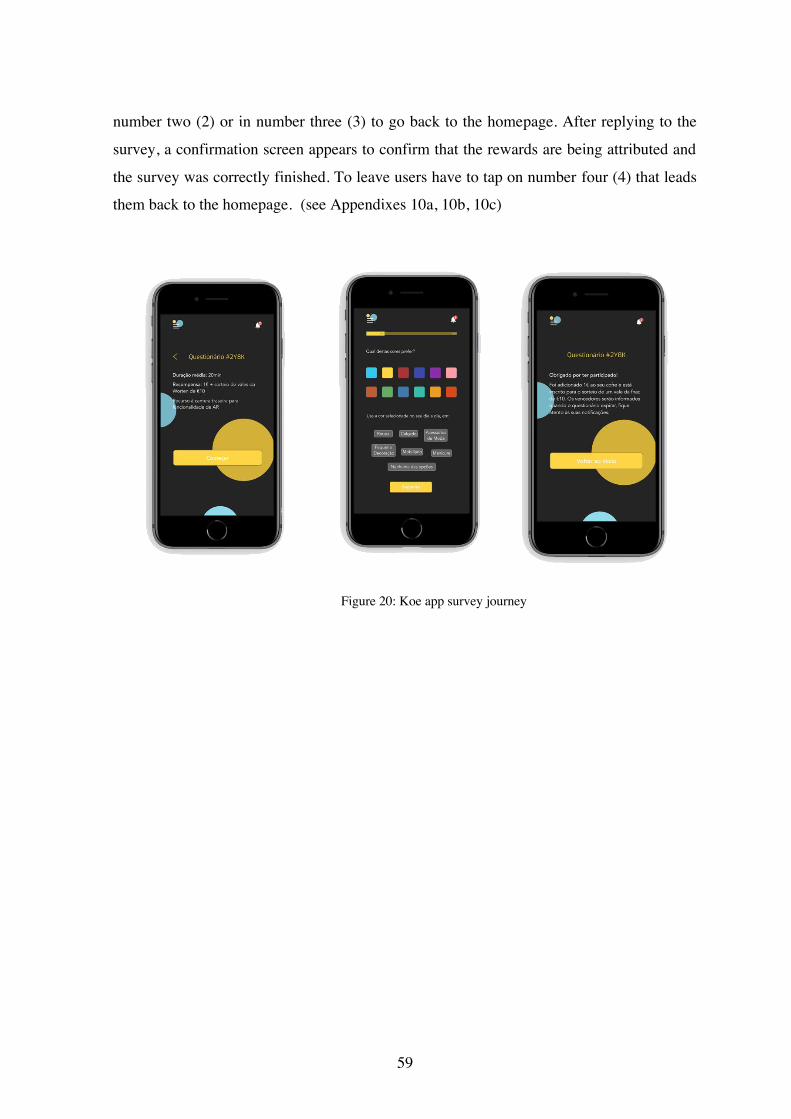
59
number two (2) or in number three (3) to go back to the homepage. After replying to the
survey, a confirmation screen appears to confirm that the rewards are being attributed and
the survey was correctly finished. To leave users have to tap on number four (4) that leads
them back to the homepage. (see Appendixes 10a, 10b, 10c)
Figure 20: Koe app survey journey
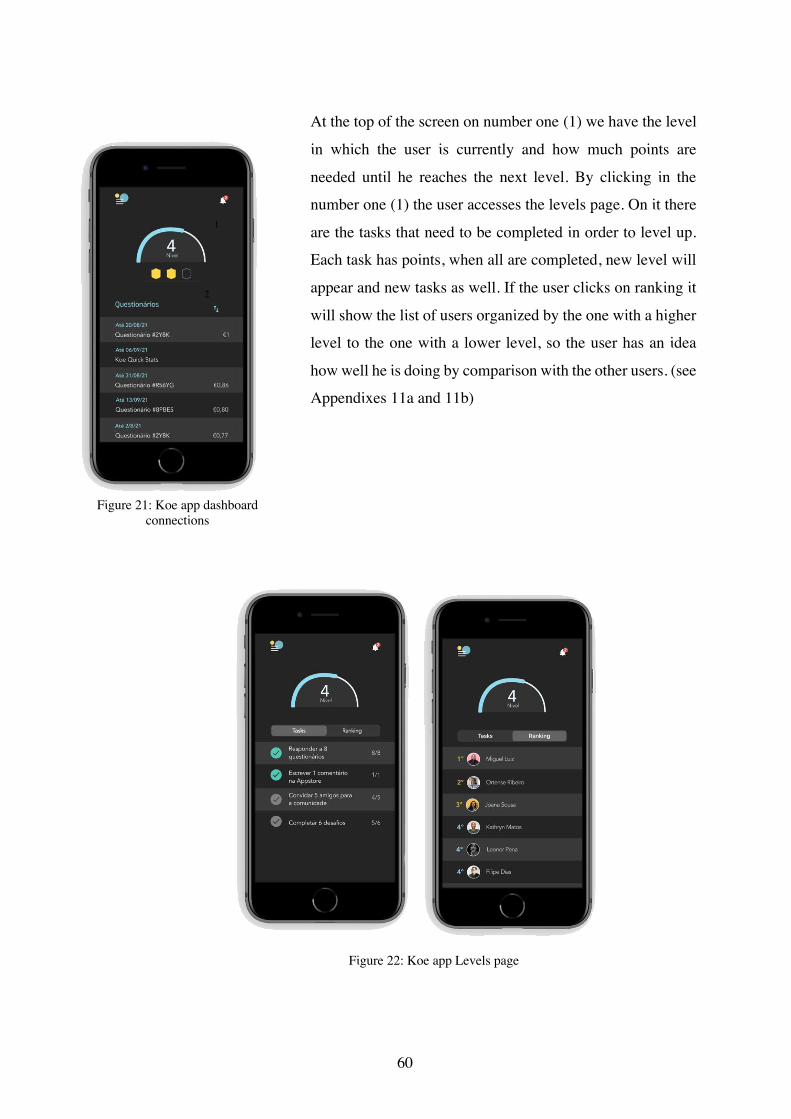
60
At the top of the screen on number one (1) we have the level
in which the user is currently and how much points are
needed until he reaches the next level. By clicking in the
number one (1) the user accesses the levels page. On it there
are the tasks that need to be completed in order to level up.
Each task has points, when all are completed, new level will
appear and new tasks as well. If the user clicks on ranking it
will show the list of users organized by the one with a higher
level to the one with a lower level, so the user has an idea
how well he is doing by comparison with the other users. (see
Appendixes 11a and 11b)
1
2
Figure 21: Koe app dashboard connections
Figure 22: Koe app Levels page
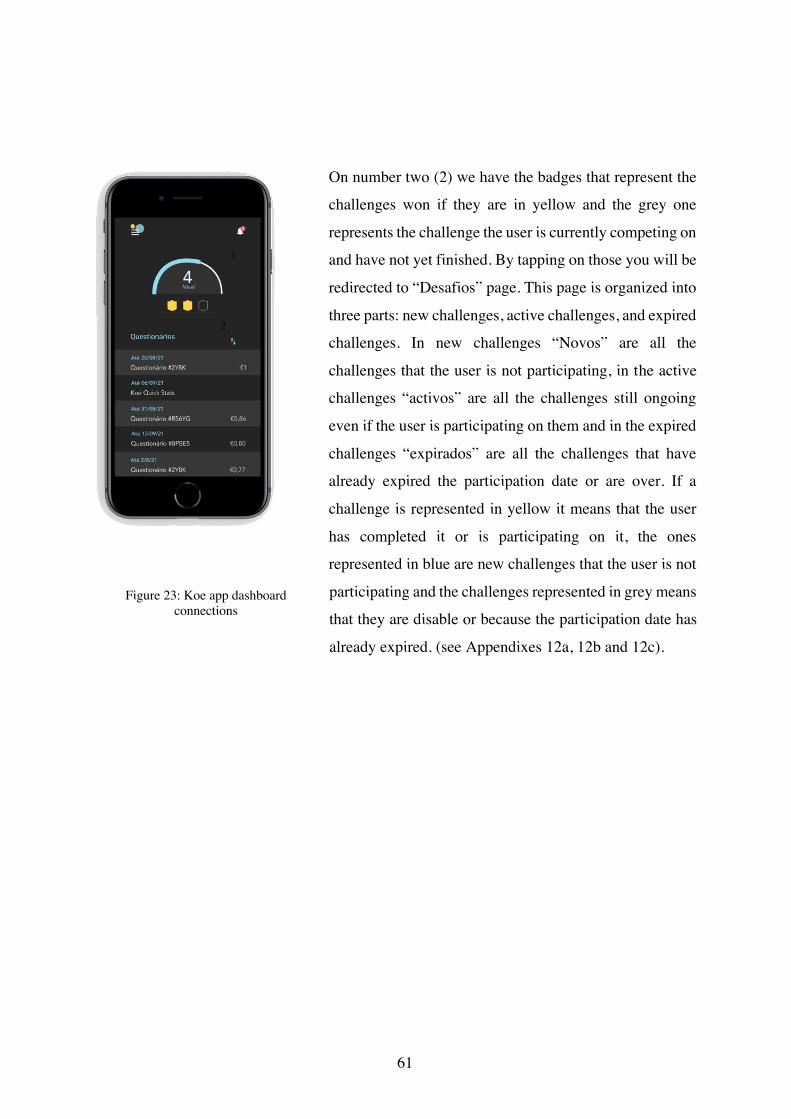
61
On number two (2) we have the badges that represent the
challenges won if they are in yellow and the grey one
represents the challenge the user is currently competing on
and have not yet finished. By tapping on those you will be
redirected to “Desafios” page. This page is organized into
three parts: new challenges, active challenges, and expired
challenges. In new challenges “Novos” are all the
challenges that the user is not participating, in the active
challenges “activos” are all the challenges still ongoing
even if the user is participating on them and in the expired
challenges “expirados” are all the challenges that have
already expired the participation date or are over. If a
challenge is represented in yellow it means that the user
has completed it or is participating on it, the ones
represented in blue are new challenges that the user is not
participating and the challenges represented in grey means
that they are disable or because the participation date has
already expired. (see Appendixes 12a, 12b and 12c).
1
2
Figure 23: Koe app dashboard connections

62
All the rewards earned are keep in the safe, the Portuguese word for it is “Cofre”. In the
“Cofre” in number one (1) we can see how much money the user has accumulated in the
app. The user can transfer it by tapping on number one (1) that leads to a balance sheet with
a record of all the movements done so far, the money earned and the money transferred.
They can use PayPal, Google Pay, Apple Pay or a Revolute account to take the money out
of the application by tapping on number two (2) “transferir”. If the user clicks on the arrow
on number three (3), they will go back to the previous page. To use a coupon the user just
needs to tap on the coupon they want to use and, at the store, scan the QR Code. Once it is
used it disappears from the application. (see Appendixes 13a, 13b and 13c)
Figure 24: Koe app Challenges pages
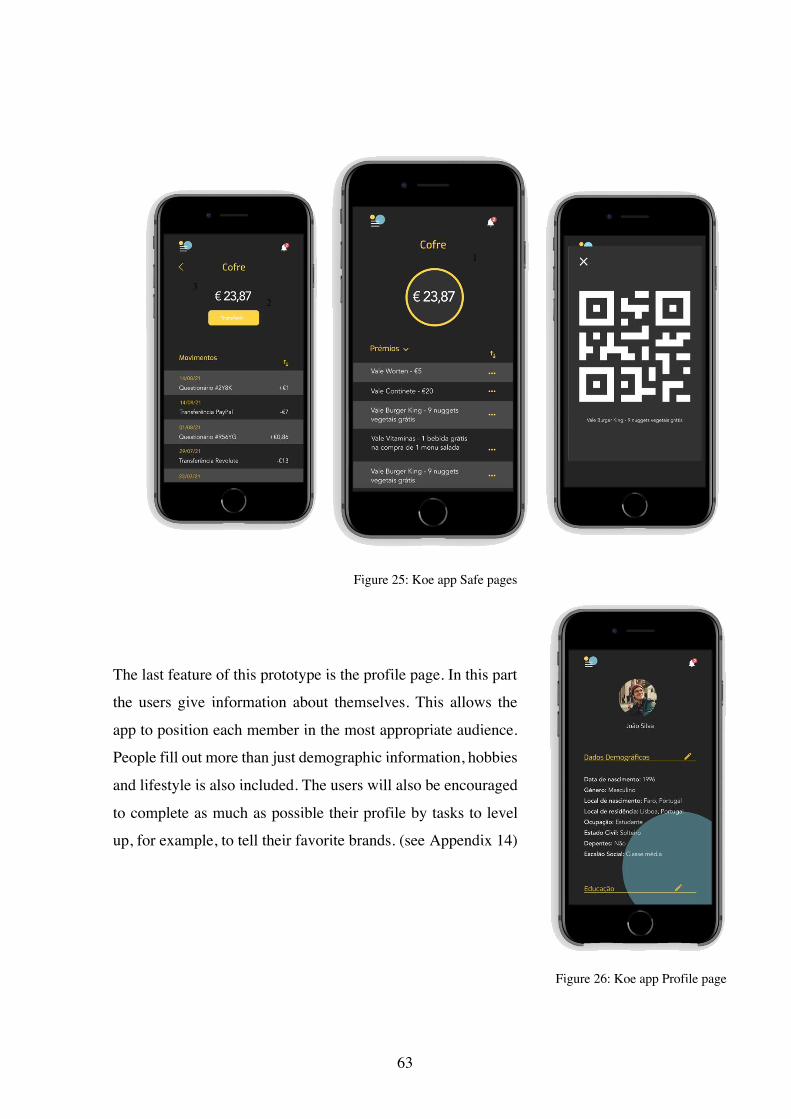
63
The last feature of this prototype is the profile page. In this part
the users give information about themselves. This allows the
app to position each member in the most appropriate audience.
People fill out more than just demographic information, hobbies
and lifestyle is also included. The users will also be encouraged
to complete as much as possible their profile by tasks to level
up, for example, to tell their favorite brands. (see Appendix 14)
1
2 3
Figure 25: Koe app Safe pages
Figure 26: Koe app Profile page
64
Chapter 6 – Business plan
6.1. Business overview
Koe is going to make market research fun and fast. The market research market in Portugal
is estimated to be worth €104 156 120,84 in 2021. Since I only had access to the values
from 2006 and the growth rate from 2005 to 2006, I did a conservative estimate using a
constant growth rate of 3.30% year to obtain a value for 2021 until the end of Koe’s
projections in 2026 (see table in Appendix 16).
It is a digital business that provides market research tools. It is divided into two segments:
the client segment, and the community segment. Koe understands as the client segment the
B2B aspect of the business, corresponding to the companies which subscribe the services.
There is a specialized desktop platform in which they can create their surveys and see all the
data collected in real time. It is cloud-based, so it storages the surveys made, the templates
created and all the data gathered so far. This allows them to correlate any data point from
any survey with the help of AI technology to create personalised reports and analysis. The
survey builder follows UX (User Experience) and UI (User Interface) principles that provide
a coherent image to the surveys that the respondents receive. With that, we want to achieve
non-bias replies, reduce drop-out rates, and make more appealing and engaging
questionaries. Koe wants to democratize market research, without professional help all the
brands have similar chances to make a non-boring and effective study. To have access to a
panel and a well-built survey is expensive and takes time to get the results back, cheaper
digital options are never as complete, they only offer the survey builder or the panel. In
addition, it allows the integration of Augmented Reality in the surveys, where people can
see the products or other projections through their smartphone camera. Companies just need
to upload a 3d model to make their studies next level.
Regarding the community segment, it has a dedicated mobile application for people to
answer the surveys. In this app, the respondents can not only reply to surveys but also earn
money and rewards and compete with other member of the community. The gamification
aspect makes them more engaged in using the application to be part of a community and
65
therefor they reply more faster and to more surveys due to paying attention to the updates.
There are two types of competition with the user itself through the levels and directly with
other through the challenges. The user can pass levels by completing small tasks to earn
points, each level has their specific tasks as inviting someone to join Koe or answer a certain
number of surveys. User show-off their levels in the competitions ranking, from time-to-
time Koe will have challenges that any user, regardless their level, can participate and the
performance of each one is going to be displayed in a ranking list, where the level, the
username and the profile picture is shown. You may not need to be at the top of the ranking
to win a challenge some you can complete the task and win badges besides a non-monetary
reward.
6.2. Environment analysis
To have a better understanding of the challenges ahead, I have executed a macro and
microenvironment analysis. As Koe will be operating in Portugal, I have focused the analysis
on the national scene. The macro-environment is composed of indirect factors that may
influence the company’s ability to be successful. I chose the PEST analysis, which stands
for Political forces, Economical forces and Socio-Cultural forces, Technological
Environment. PEST analysis is used to evaluate and understand the macro-environmental
factors that can have a profound impact on company performance. This tool is especially
useful when starting a new business or entering a market. It is often paired with other
analytical tools to provide a clear view of the internal and external factors, such as SWOT
analysis that will be presented further on (Barros, 2021).
PEST Analysis
Political Environment
The political environment in Portugal was relatively stable, it has a democratic government,
and the ruling party since 2015 is Partido Socialista, a center-left party and it is part of the
European Union. In in the end of October the 2022 Nacional Budget did not get the
Parliament approval resulting in a political crisis and new elections in January 2022.
66
Regarding the financial authority, Portugal has a very solid taxing mechanism, it has one of
the highest taxing policies on companies and individual citizens in Europe. The VAT (Valeu
Added Tax) for consumer products is 23%, and the company has to pay 21% Company
Income Tax (IRC – Imposto Sobre o Rendimento das Pessoas Coletivas) and 23.75% on
each employees’ salary as social security contribution (TSU – Taxa Social Única).
Economic Environment
The past economic crisis that was marked the financial rescue has fostered an entrepreneurial
and innovative spirit in the country, which is still present today. Portugal is the second
country in the European Union with the highest birth rate of new companies. According to
data shared by Eurostat, Portugal has a birth rate of new companies of 15.75%, compared to
a European Union average of 9.3%. In 2019 there was a 6,4% increase in comparison with
the previous year’s number of new companies in Portugal, it was a national record. (Agência
Lusa, 2020)
The global economy has been retracting due to the Covid-19 pandemic in 2020. The impact
of the Coronavirus pandemic on the Portuguese economy, according to the Finch rating
agency, should halt the improving trends seen in recent years in public debt, gross domestic
product, and the soundness of the financial system. This is caused mainly because of the
dependence on tourism. Therefore, a recession in the order of 3.9% is expected, although the
forecasts previously released by the International Monetary Fund for the Portuguese
economy were more pessimistic and pointed to an 8% contraction in 2020 (Fitch, 2020).
According to the Banco de Portugal, it is expected that the county’s economy begins to grow
again as soon as the global situation stabilizes (Santos, 2020).
When Portugal joined the EU in 1986, the country could start benefiting from the support of
the European regional policy. According to the European Union itself, this policy is aimed
at all regions in the EU, involving several objectives, among them, promoting economic
growth and employment. To avoid increasing even further Portugal’s debt, it is receiving
monetary aid from the European Union (PRR – Plano de Recuperação e Resiliência) of about
67
€16 643 million which will boost the country’s economy. Part of the PRR money is destined
to companies and one of the priorities is Digital Transitions and Innovation (Teixeira, 2021).
The minimum wage in Portugal is €665 and the medium wage is around €1000 which are
both low when compared with the rest of the EU countries. In addition, there is a lack of
offer in part-time jobs. Koe is an easy way to have extra money in the end of the month.
Social and Cultural Environment
According to the Global Entrepreneurship Monitor (GEM) study, within Europe, Lisbon
stands out as the fifth European capital with the largest hub of startups, only behind London,
Berlin, Paris, and Copenhagen. When it comes to innovation, Lisbon is considered the
European technological capital, with more and more global giants of the sector establishing
themselves in the city, such as Volkswagen, Google, Mercedes-Benz, or Uber. Since 2016,
the capital has also hosted the largest conference on technology in Europe, the Web Summit,
which should be held in the city until at least 2028. The IT (Information Technology) market
grew faster than the quantity of available qualified tech human resources. So many
companies have being recruiting Brazilian operatives because of their skills, willingness to
move to Portugal and they already speak Portuguese.
Due to covid working from home became the new normal for many families around the
world. Portuguese people complained about the extra costs on gas and electricity as well as
lack of boundaries between work and personal life. Therefor a new law was recently
approved that makes it illegal for managers and employers to contact their employees after
working hour, also makes the company pay the employees an extra allowance for gas,
electricity, and office material.
Despite the global crisis, the unemployment rates are low at 6.8% in the second trimester of
2021 (Pordata, 2021). The Portuguese people buying power is relatively low in comparison
to other European countries, which is an advantage for people to join the Koe community in
order to earn some extra liquidity. Internet use on mobile devices has been growing
significantly in the last 4 years, 74% of Portuguese households have access to the internet.
Of most of the families with children and living in the Lisbon metropolitan area, about 82%
68
have access to the internet. If we look at usage percentages, 74% of people between 16 and
74 years old have already used the Internet, this shows a growing percentage of older people
joining the online world. In 2019 70% of the internet users were also on social media (INE,
2019).
Technological Environment
There are good infrastructures in Portugal and good mobile and internet coverage in most
parts of the country. About 80% of the population has access to the internet and the speed
and capacity of it are also good.
In recent years, some of the technological trends have been Data Science and Artificial
Intelligence – known as AI. According to Laurent Stefani, Artificial Intelligence Specialist
at Accenture, AI is nothing more than the perfect combination of machine and man, which
frees the employees to work on more complex tasks instead of standard processes. The use
of this technology provides several opportunities such as improving customer relations,
faster reaction time, increasing productivity of the company itself, and better data collection.
On the other hand, it can also be difficult to implement and use to its full potential, especially
by smaller companies. In addition, it needs to be constantly updated as the company grows
and changes its processes. AI can be a factor of differentiation from the market, as smaller
companies may struggle to have their own AI platform, they can subscribe to third-party
platforms to fulfill their needs.
6.3. Competition analysis
Survey Monkey is one of Koe’s direct competitor in the B2B context. This platform enables
you to create your surveys from scratch or using a template made by specialists in the area,
they have 15 types of different questions available for the companies to complete their
surveys and make them more unique. Users have to create an account to access it and choose
between the different subscription plans. There are three personal plans from €39 to €99
monthly, and also three other business plans that start from €30 monthly per user up to a
negotiable personalized price if the organization is too big. In these traditional plans, users
or companies have to find their own audience to get replies. Survey Monkey licenses do not
69
provide a distribution option, only a survey builder, data analysis, and data export. The
platform has an extra paid feature for distribution, the SurveyMonkey Audience, in which
users can select or build a survey to be distributed to the platform’s global panel of
individuals that match the required target. 4
Question-Pro is an online research software that combines a survey builder with an analytics
tool and a survey distribution service. Due to its characteristics, it is probably the most direct
competition to Koe. They make available pre-made survey templates or users can create their
own with a variety of logical questions, survey styles, and options such as switching the
questions’ order to get different survey versions for respondents, and survey translation if
needed. The surveys are responsive to devices and they are able to gather the devices’
passive data. They have a mobile application for companies to make and manage their data
too. Besides having their own panel available to their subscribers, companies can create their
audiences by recruiting or buying new members and setting up focus groups. Companies are
also able to create a reward system for their surveys. The data gathered can be exported to
Excel, SPSS, and CVS. The software also allows for API integrations of other tools as
Salesforce, Microsoft Dynamics, or Tableau. These services availability are pending on each
type of license organizations subscribe, there are 3 types of licenses. I tried to contact the
company for pricing information but it was not available. 5
Qualtrics XM claims to be the most used survey builder in academic and corporate research,
XM stands for Experience Manager. With an intuitive and well-designed application, it is
easy to make surveys and analyze data with their automations. It is divided into industries’
needs, organizations can subscribe Qualtrics CoreXM, which is the basic product, Qualtrics
DesignXM is built to scout what products, services, and experiences customers and
employees want next, Qualtrics CustomerXM is designed for customer’s satisfaction,
Qualtrics EmployeeXM is for employee satisfaction and talent retention, Qualtrics
ProductXM is for product performance and improvement, Qualtrics BrandXM is for
perception and brand awareness and, finally, Qualtrics XM Services create a Qualtrics
platform tailored for each organization’s needs, if they are not met by any of the other
4 SurveyMonkey website 5 Question-Pro website
70
products. Qualtrics does not have a community to distribute the surveys and you can access
the service through a license. They also offer free of charge research results on global topic
on their website. I tried to contact the company for pricing information but it was not
available. 6
Google Forms is probably the most popular survey builder nowadays, it is completely free
and has 9 question types to integrate into the survey, as well as the possibility to put YouTube
videos in it. Google does not provide an audience to distribute the survey, people can export
it as a link, HTML for website integration, and e-mail. The results are presented in simple
graphics in real-time and can be exported to Google Sheets. All the information is kept in
the users’ Google Drive.
Typeform markets itself as a design-friendly form, a non-boring alternative to classic
surveys. Their surveys are presented question by question as if in a conversation, the
respondents have no idea where it is going to lead them, they only have the process bar with
a percentage of how much they have completed already. This can be a good method for
relatively short questionaries, but if you are doing a longer study, people might quit mid-
way through it because they cannot feel the end of it, it may feel like a never-ending survey.
Typeform offers 4 different plans, Free, Basic, Plus, and Business, that range from €0 to
€75 a month. The plans vary in the number of users allowed, integrations enabled, custom
service support, and file upload storage capacity. In terms of the survey distribution, it is the
organizations' responsibility as they don´t have a community or provide access to one from
a third party. Each organization can export their survey as a web link, HTLM, or e-mail. To
analyze the collected data, they have to work with an analysis tool that has a Typeform
integration because the platform does not perform data treatment on its own. 7
Marktest Investimentos, SGPS is the leader of market research in Portugal, it is one of the
biggest national companies with an established reputation. It is the biggest Portuguese group
in the segment and has different companies inside, each has a different specialization, media
audience measurement, monitoring of advertising investments, regular studies (barometers)
6 Qualtrics website 7 Typeform website
71
in the areas of Telecommunications, Banking, Insurance, Modern Distribution, panels in the
area of Internet and pricing studies and retail auditing, among other. The companies are
Marktest, Markdata and Medialog, Media Monitor, and Marktest Angola. Koe will be
competing with Marktest, which develops benchmark studies for the telecommunications,
banking, insurance, and retail sectors, and also provides standard market metrics for media
audience for press, radio, and internet. It also develops studies in the advertising area, with
methodologies to evaluate advertising effectiveness, and offers customized solutions
through its client management service. These studies can be carried out by telephone, over
the Internet, or in person, and are certified by CAEM (Comissão de Análise de Estudos de
Media). Marktest has their community to distribute their research to and obtain results. This
community receives monetary incentives or gift cards to reply to the surveys, anyone can
enroll in their website and then receive the surveys through e-mail or phone call because
they do not have a mobile application. They also make available for the general public some
of the research conducted by them as a “teaser”, because if the free access is not enough for
you, companies and students can request the full-study or even access to one not available
on their website. I tried to contact the company for pricing information but it was not
available. 8
Comunidade Netsonda is what is called a full agency, they do 360º degrees work, from
concept to non-digital approaches. They perform several types of interviews as online, in-
person, telephone, and even postal interviews. Their segment that is in direct competition
with Koe is the AD-HOC, in which new products, packaging, and concepts are tested, as
well as price range, advertising studies (previous and post), market segmentation and niche
finding, brand positioning, consumer profile (habits and attitudes) and customer satisfaction.
Comunidade Netsonda also provides personal client management, in which specialists help
organizations not only to build their surveys but also with the strategy and data analysis. The
platform has its community of respondents which they use to distribute the surveys. People
can enroll in their website and are paid small amounts €0,50 up to €3 to reply to online or
phone surveys. The online surveys are mainly distributed via e-mail and more recently
through their mobile application as well. The people from the community do not engage with
each other, can only retrieve their money when they have collected at least €5, and the only
8 Marktest website
72
method available is through a PayPal account. They also make available for the general
public some of the research conducted by them. I tried to contact the company for pricing
information but it was not available. 9
Other online communities distribute third-party surveys to their audience. Adsviews is
specialized in distributing advertising research, they do not have a mobile application and
the participants receive in average €3 for a 15-minute online survey. 10
Sondar works with Social Entities and supports startups. They have an interactive
community with their Facebook group, and internal competitions. Sondar rewards their
participants with credits that can be converted to money or experiences as going to the
cinema, concerts, or acts of charity, if you choose money, you make the transference by
PayPal. I tried to contact the company for reward value information but it was not available.
As Marktest and Comunidade Netsonda, they give access to some of the results of the
research performed, some are free access, other for members only, and others you can pay
to access them. 11
Triaba is a Norwegian company present in 86 countries today, in cooperation with Cint AB.
They are specialized in distributing surveys. They have a mobile app in which people can
reply to the questionaries or receive them by e-mail. They promote competitions and
challenges inside their community, such as the 2021 Summer Competition, in which people
could win extra money if they talked about Triaba online, it could be a social media post, a
blog entry or a review. The payments are made only through PayPal and you can only
retrieve the money when you have accumulated at least €10. Each participant can earn about
€0,20 to €4 by replying to a survey.12
9 Comunidade Netsonda website 10 Adsview website 11 Sondar website 12 Triaba website
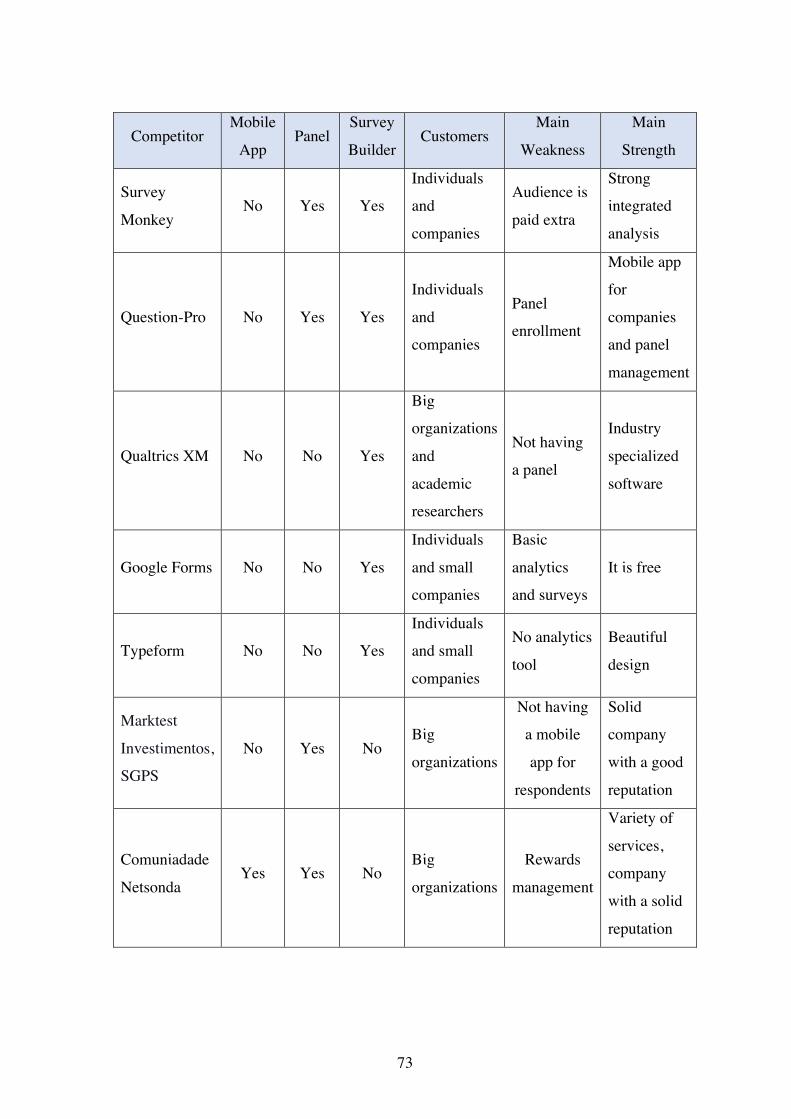
73
Competitor Mobile
App Panel
Survey
Builder Customers
Main
Weakness
Main
Strength
Survey
Monkey No Yes Yes
Individuals
and
companies
Audience is
paid extra
Strong
integrated
analysis
Question-Pro No Yes Yes
Individuals
and
companies
Panel
enrollment
Mobile app
for
companies
and panel
management
Qualtrics XM No No Yes
Big
organizations
and
academic
researchers
Not having
a panel
Industry
specialized
software
Google Forms No No Yes
Individuals
and small
companies
Basic
analytics
and surveys
It is free
Typeform No No Yes
Individuals
and small
companies
No analytics
tool
Beautiful
design
Marktest
Investimentos,
SGPS
No Yes No Big
organizations
Not having
a mobile
app for
respondents
Solid
company
with a good
reputation
Comuniadade
Netsonda Yes Yes No
Big
organizations
Rewards
management
Variety of
services,
company
with a solid
reputation

74
Adsview No Yes No
Other
research
companies
Being only a
survey
distributer
Good
reward
system
Sondar No Yes No
Companies
and Social
Institutions
Outdated
website
image
Charity,
group
Triaba Yes Yes No Companies
Panel
enrollment,
outdated
website
image
Community
engagement,
global panel
Table 3: Koe’s Competition.
Swot Analysis
Positive
Negative
Internal
Strengths Innovative product for companies and
participants, it gives more autonomy to
companies to own their data and used it as
they like and it provides an engaging
experience to the participants through the
gamification concept of the mobile
application.
The fact that the participants have access to
the surveys through a mobile application is
more comfortable for them and can reply in a
shorter time which is an advantage for the
companies because they receive the survey
results and answers in real-time.
Weakness It is an innovative product for companies so it is
expected to have some inertia from them on the
early product stage. Due to being a new way of
doing things it also requires consumer education,
so that making our own survey and controlling our
data freely becomes ordinary.
Offering only mobile surveys to companies may
exclude some part of the population that is not so
tech-wise. Therefore, Koe may not cover all the
target audiences in the Portuguese market.
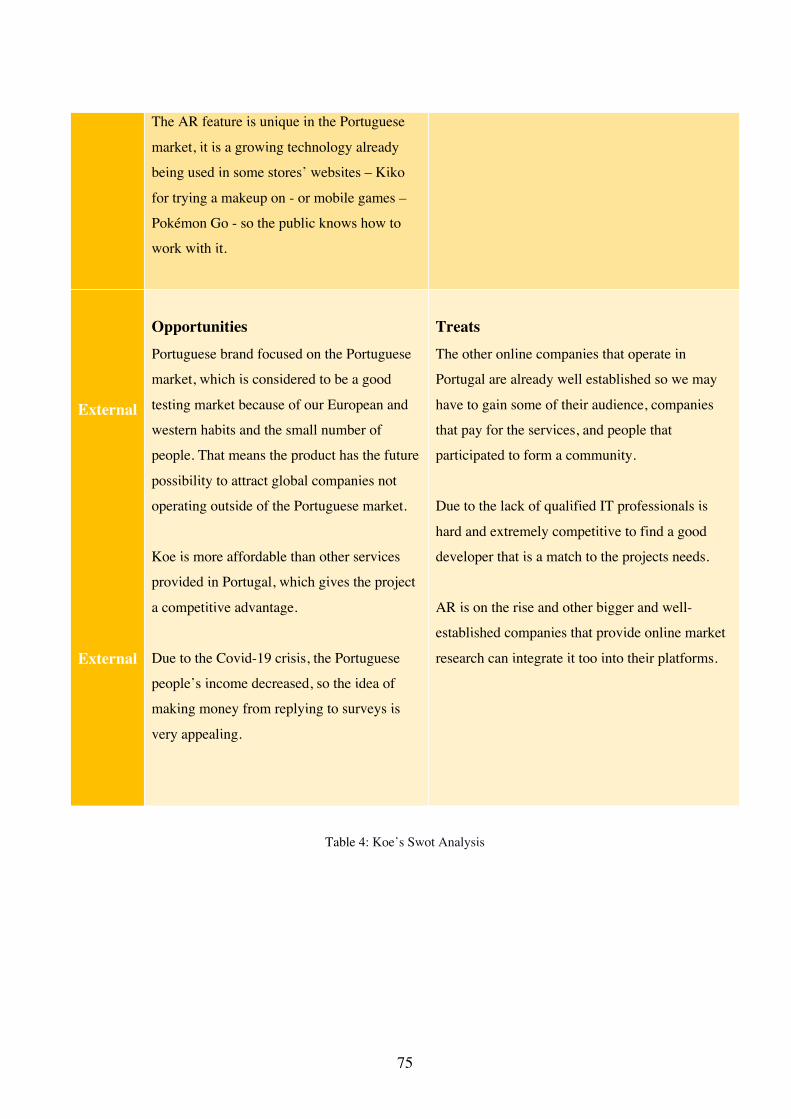
75
The AR feature is unique in the Portuguese
market, it is a growing technology already
being used in some stores’ websites – Kiko
for trying a makeup on - or mobile games –
Pokémon Go - so the public knows how to
work with it.
External
External
Opportunities Portuguese brand focused on the Portuguese
market, which is considered to be a good
testing market because of our European and
western habits and the small number of
people. That means the product has the future
possibility to attract global companies not
operating outside of the Portuguese market.
Koe is more affordable than other services
provided in Portugal, which gives the project
a competitive advantage.
Due to the Covid-19 crisis, the Portuguese
people’s income decreased, so the idea of
making money from replying to surveys is
very appealing.
Treats The other online companies that operate in
Portugal are already well established so we may
have to gain some of their audience, companies
that pay for the services, and people that
participated to form a community.
Due to the lack of qualified IT professionals is
hard and extremely competitive to find a good
developer that is a match to the projects needs.
AR is on the rise and other bigger and well-
established companies that provide online market
research can integrate it too into their platforms.
Table 4: Koe’s Swot Analysis
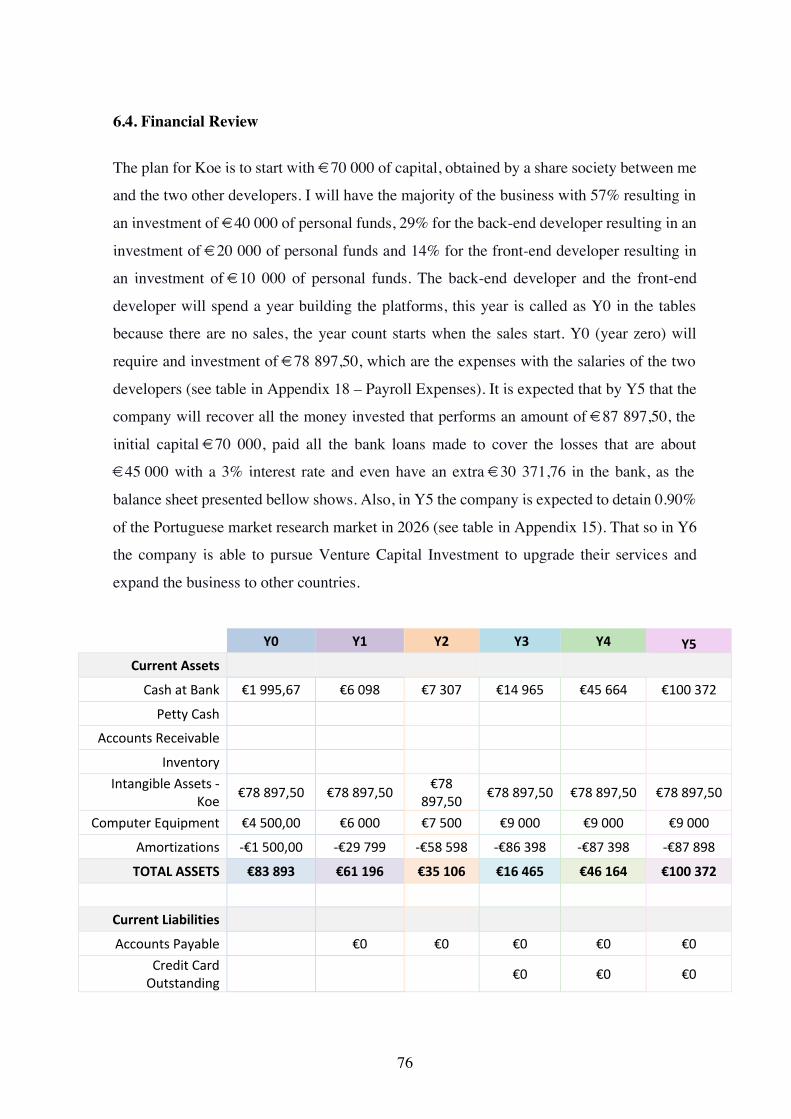
76
6.4. Financial Review
The plan for Koe is to start with €70 000 of capital, obtained by a share society between me
and the two other developers. I will have the majority of the business with 57% resulting in
an investment of €40 000 of personal funds, 29% for the back-end developer resulting in an
investment of €20 000 of personal funds and 14% for the front-end developer resulting in
an investment of €10 000 of personal funds. The back-end developer and the front-end
developer will spend a year building the platforms, this year is called as Y0 in the tables
because there are no sales, the year count starts when the sales start. Y0 (year zero) will
require and investment of €78 897,50, which are the expenses with the salaries of the two
developers (see table in Appendix 18 – Payroll Expenses). It is expected that by Y5 that the
company will recover all the money invested that performs an amount of €87 897,50, the
initial capital €70 000, paid all the bank loans made to cover the losses that are about
€45 000 with a 3% interest rate and even have an extra €30 371,76 in the bank, as the
balance sheet presented bellow shows. Also, in Y5 the company is expected to detain 0.90%
of the Portuguese market research market in 2026 (see table in Appendix 15). That so in Y6
the company is able to pursue Venture Capital Investment to upgrade their services and
expand the business to other countries.
Y0 Y1 Y2 Y3 Y4 Y5
Current Assets
Cash at Bank €1 995,67 €6 098 €7 307 €14 965 €45 664 €100 372
Petty Cash
Accounts Receivable
Inventory Intangible Assets -
Koe €78 897,50 €78 897,50 €78 897,50 €78 897,50 €78 897,50 €78 897,50
Computer Equipment €4 500,00 €6 000 €7 500 €9 000 €9 000 €9 000
Amortizations -€1 500,00 -€29 799 -€58 598 -€86 398 -€87 398 -€87 898
TOTAL ASSETS €83 893 €61 196 €35 106 €16 465 €46 164 €100 372
Current Liabilities
Accounts Payable €0 €0 €0 €0 €0 Credit Card
Outstanding €0 €0 €0
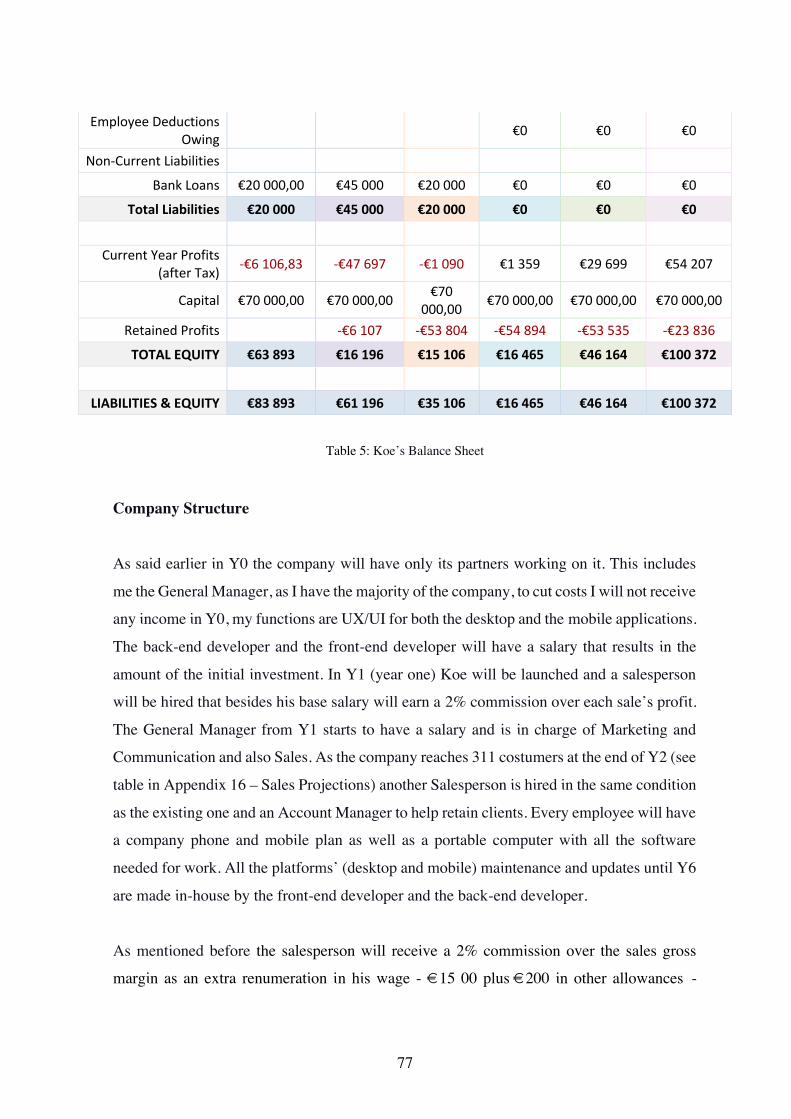
77
Employee Deductions Owing €0 €0 €0
Non-Current Liabilities
Bank Loans €20 000,00 €45 000 €20 000 €0 €0 €0
Total Liabilities €20 000 €45 000 €20 000 €0 €0 €0
Current Year Profits
(after Tax) -€6 106,83 -€47 697 -€1 090 €1 359 €29 699 €54 207
Capital €70 000,00 €70 000,00 €70 000,00 €70 000,00 €70 000,00 €70 000,00
Retained Profits -€6 107 -€53 804 -€54 894 -€53 535 -€23 836
TOTAL EQUITY €63 893 €16 196 €15 106 €16 465 €46 164 €100 372
LIABILITIES & EQUITY €83 893 €61 196 €35 106 €16 465 €46 164 €100 372
Table 5: Koe’s Balance Sheet
Company Structure
As said earlier in Y0 the company will have only its partners working on it. This includes
me the General Manager, as I have the majority of the company, to cut costs I will not receive
any income in Y0, my functions are UX/UI for both the desktop and the mobile applications.
The back-end developer and the front-end developer will have a salary that results in the
amount of the initial investment. In Y1 (year one) Koe will be launched and a salesperson
will be hired that besides his base salary will earn a 2% commission over each sale’s profit.
The General Manager from Y1 starts to have a salary and is in charge of Marketing and
Communication and also Sales. As the company reaches 311 costumers at the end of Y2 (see
table in Appendix 16 – Sales Projections) another Salesperson is hired in the same condition
as the existing one and an Account Manager to help retain clients. Every employee will have
a company phone and mobile plan as well as a portable computer with all the software
needed for work. All the platforms’ (desktop and mobile) maintenance and updates until Y6
are made in-house by the front-end developer and the back-end developer.
As mentioned before the salesperson will receive a 2% commission over the sales gross
margin as an extra renumeration in his wage - €15 00 plus €200 in other allowances -

78
according to his performance. In the third year one more salesperson is going to be hired in
the same conditions as the existing one. The CEO will earn €2 500 plus €200 in other
allowances, the back-end developer will earn €2 500 plus €200 in other allowances, the
front-end developer will earn €1 800 plus €200 in other allowances and the Account
Manager will earn €1 500 plus €200 in other allowances. In these other allowances is
included the home-office expenses that the companies have to pay their employees.
For simplification of the projections all the salaries remain the same through the 6-year
period presented (see table in Appendix 18 – Payroll Expenses).
Profit and Losses
In order to cut costs, it will function on the home-office basis, so there are no expenses
related with a venue, as rent, furniture, and other related costs (see table in Appendix 17 –
General Expenses). This way also gives people more freedom to manage their day and as it
is a small team is easier to touch points and align objectives online. However, it will have
expenses on equipment as computers and mobile phones, and mobile phone licenses.
Koe will have three yearly licenses, Light, Professional and Enterprise. The Light plan
includes a €850 budget to spend on rewards for the respondents of the surveys. It also allows
for seven surveys a year, data analysis and customer service. The Professional plan includes
a €2000 budget to spend on rewards for the respondents of the surveys. It has the same
features as the light plan plus the possibility to upload a 3D model to integrate an AR model
in the surveys. Finally, the Enterprise plan the most complete plan of all, it includes twelve
surveys a year, a €3500 budget to spend on rewards for the respondents that can be increase
by the company’s own money if needed. It has the same features as the Professional plan
plus the possibility to upload as many 3D models as they want to integrate AR models in the
surveys. To simplify the process the VAT was not considered. (see table in Appendix 16 –
Sales Projections)
Each plan as a cost of sale and still our prices are lower than the competition that for a single
market research study with audience will charge about € 2 500. Each license budget for
rewards is its cost of sale, for the the Light Plan has €850, the Professional Plan has €2000
79
and the Enterprise Plan has €350. These are the values considered in the cost of sales and
remained the same as the licenses’ prices throughout the three years. As in the sales
framework, the costs of sales were understood in the same cash basis method and considered
all the sales made along the year as revenue of that year. (see table in Appendix 16 – Sales
Projections)
In order to simplify the calculus, I worked on a cash basis and considered all sales made
along the year as the total revenue of that year. I did not consider any price grown and
inflation during the three years, so they remain the same.
The Sales results presented on Appendix 16 (Sales Projections) are achieved due to a growth
rate in sales, from Y1 (year 1) to Y2 (year 2) due to the strong marketing campaign that
created brand awareness the sales increase 10% on the Light Plan, 15% on the Professional
plan and 5% on the Enterprise plan. From Y3 to Y2 the sales grow even further by virtue of
hiring an extra person for the sales department in combination with the marketing strategy.
The Light plan grows 15%, the Professional plan 20% and the Enterprise plan 10%. As Koe
gets more stablished in the market it is expected a decrease in the growth rate because the
strategy changes to client retention through the Account Manager hired in Y3, so in Y4 the
Light plan grows 10%, the Professional plan 15% and the Enterprise plan 7% and in Y5 the
Light plan grows 3%, the Professional plan 10% and the Enterprise plan 5%.
80
Chapter 7 - Marketing and Communication Plan
Koe has two segments regarding the marketing strategy, the B2B (business to business)
segment that is applied to the desktop platform where the consumers make and analyze their
surveys, and the B2C one that applies to the mobile application where a community of
respondents is going to be built. For the Marketing and Communication Plan I choose to
focus only on the mobile application because B2C strategies are more diverse. Also, because
the Business plan is already focused more on the B2B part of the project, this way my thesis
is more balanced.
7.1. Brand DNA
According to Binney (2010) in the Māori culture is believed that every person is born with
Mana which is a supernatural gift, Mana is determined by a person’s origins and family
three. The names reflect their ancestors, therefore their Mana. Due to this, it is common for
Māori people to change their names frequently to adapt to a new cultural situation or have
access to a certain resource. The world-famous Maori tattoos are called Tā Mako, they are
symbols of status, lineage, and origin. It’s a way for the Māori people to express their
identity.
Koe means “you” in the Māori language, Koe aims to represent each person with all their
facades and give them an individual identity and space to express what they think about
brands or products. The design of the application does not resemble any of Māori’s
traditional symbols and visual identity because of cultural appropriation, in order to avoid a
public relations scandal at the launch of the application killing the business before it had
even a chance to thrive. Instead, it serves as inspiration for the concepts of the application,
as for example showing each user’s level, the Tā Mako is a sign of pride, and showing off
your achievements is something to be proud of.
In Koe it is believed that each person is unique, each one of us have our own Mana, and we
all have a place for us. The mobile application mission is to give people a voice, so they can
bend the market to their needs, it provides that through market research surveys. The values
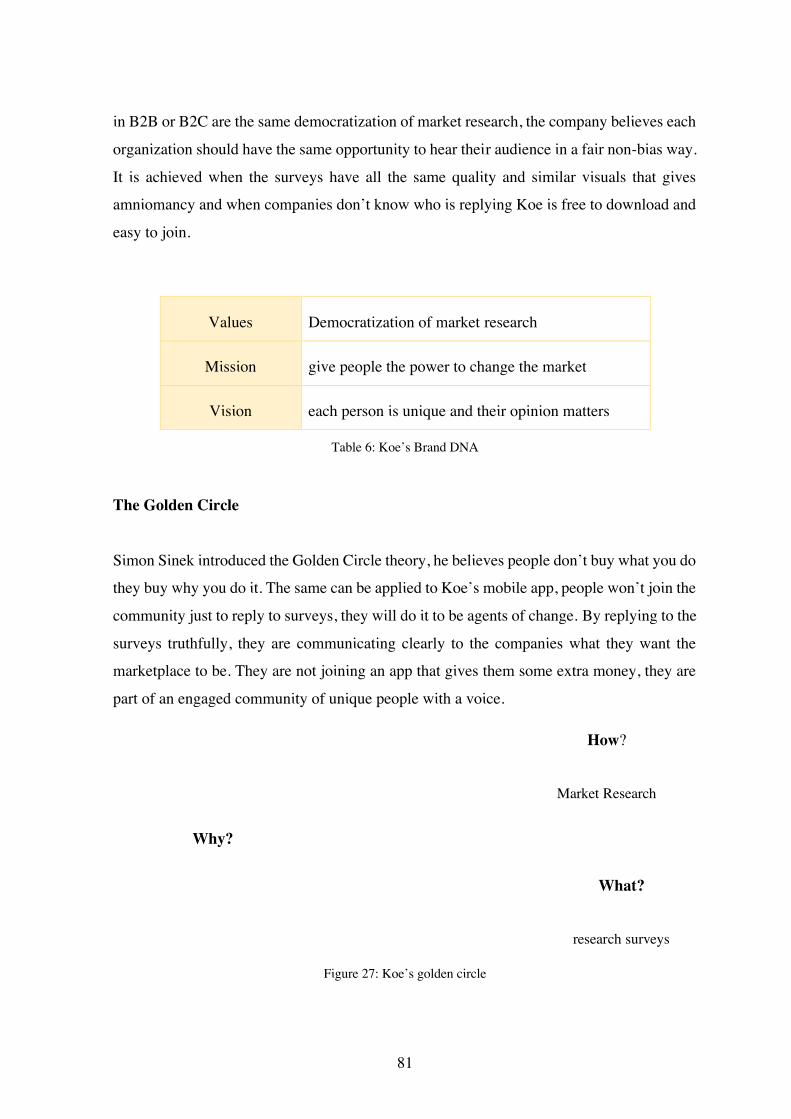
81
in B2B or B2C are the same democratization of market research, the company believes each
organization should have the same opportunity to hear their audience in a fair non-bias way.
It is achieved when the surveys have all the same quality and similar visuals that gives
amniomancy and when companies don’t know who is replying Koe is free to download and
easy to join.
Table 6: Koe’s Brand DNA
The Golden Circle
Simon Sinek introduced the Golden Circle theory, he believes people don’t buy what you do
they buy why you do it. The same can be applied to Koe’s mobile app, people won’t join the
community just to reply to surveys, they will do it to be agents of change. By replying to the
surveys truthfully, they are communicating clearly to the companies what they want the
marketplace to be. They are not joining an app that gives them some extra money, they are
part of an engaged community of unique people with a voice.
Figure 27: Koe’s golden circle
Values Democratization of market research
Mission give people the power to change the market
Vision each person is unique and their opinion matters
What?
Distribute market research surveys
Why?
Consumer’s opinions matter
How? Giving people a voice though
Market Research
82
Functional and Symbolic Dimensions
The perception of the value of the brand at symbolic and functional levels it’s crucial in the
DNA analysis. This happens in two ways: a tangible value that can be attributed to the
products or services, such as diversity in the surveys, rewards and good design, and the
intangible value that is attributed to the company, as innovative, or inclusive, the latest
generates the biggest differentiation factors. However, for this to happen it is necessary that
the functional dimension (what is the brand) and the symbolic dimension (what it represents
for consumers and potential consumers) to be aligned.
Therefore, the functional dimension relates to the functional benefits of the product which
is the mobile application in itself. The mobile application in its functional core dimension is
reduced to a platform where people can reply to market research survey anywhere them want
and earn rewards by doing it. Other aspects of application performance can be taken in
account, as the overall design that as light colors that have a soothing effect and way is built
making it effortless to navigate enabling people to stay longer on the app without getting
tired. If with look at the rewards topic, giving people more options to retrieve their money
are good functional aspects that the competition is still lacking. Most of the other companies
rely only on PayPal when nowadays people use the most diverse ways to save their money
online as Google and Apple pay and Revolute that is changing the banking landscape.
Introducing the gamification into the market research world transforms Koe in more than
just a survey application is a community. And this sense of belonging to something that is
Koe’s mobile application symbolic dimension. Koe’s concept is every person is unique and
the market should hear you to please you. What it puts in play where is changing the market
to fit you, not you just fitting in. With Koe I want people to belong in a community of change,
giving opinions not just for companies’ profit, but to make them please you. In contrast with
big data analytics that you don’t control what information the companies have about you, in
Koe’s mobile app the people are in control of what they share and what they want to say to
the brands.
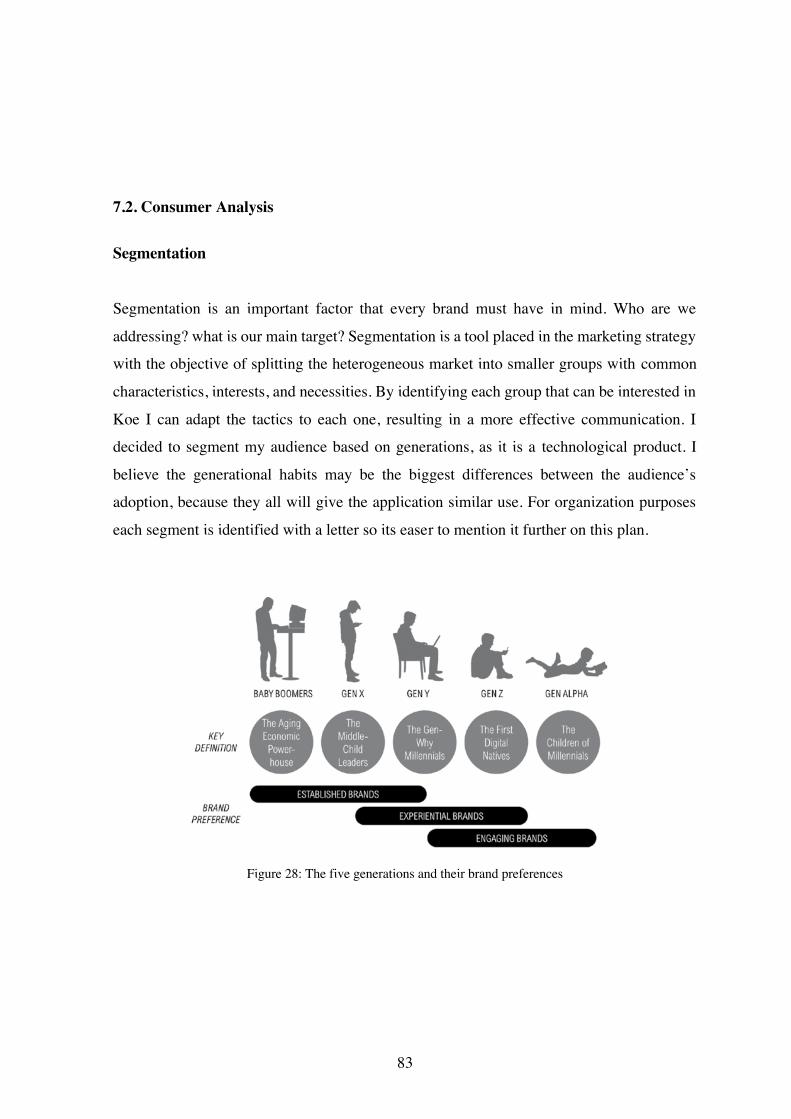
83
7.2. Consumer Analysis
Segmentation
Segmentation is an important factor that every brand must have in mind. Who are we
addressing? what is our main target? Segmentation is a tool placed in the marketing strategy
with the objective of splitting the heterogeneous market into smaller groups with common
characteristics, interests, and necessities. By identifying each group that can be interested in
Koe I can adapt the tactics to each one, resulting in a more effective communication. I
decided to segment my audience based on generations, as it is a technological product. I
believe the generational habits may be the biggest differences between the audience’s
adoption, because they all will give the application similar use. For organization purposes
each segment is identified with a letter so its easer to mention it further on this plan.
Figure 28: The five generations and their brand preferences
84
Segment A: Gen X
Kotler calls generation X “the middle child leaders” because they are overshadowed by the
popularity of the previous and next generations, the baby boomers and the millennials, and
often forgotten by marketeers. These are people born between 1965 and 1980 and grew up
in economic uncertainty but entered the workforce in a better economic situation. Nowadays
they are one of the most influential generations in the workforce. They have strong work
ethics and when finding it difficult to move up the corporate ladder, due to boomers delaying
their retirement they started their own business. They are known to have strong friendship
bounds due to growing up in a household where both parents worked or are divorced. They
prone to adapt to new technologies as they have experienced many technology shifts. From
one channel tv, to color tv to smart TV, from making mixtapes, to CDs and Walkman, to
watching music videos on MTV, to YouTube and Mp3 to streaming and so on (Kotler et al.,
2021). So, they are expecting the next new thing and embracing it.
It is very usual for this generation to be quite comfortable with their smartphones and
shopping online as well, so tech-savvy would not be a problem. They are most frequently
online during their free time, such as lunch breaks and afternoon. They first used the internet
to in their workplace, now they used it also to check the news, use social media, basically to
be update with what’s going on. As they are comfortable in their carriers by now, the money
may not need it. However, they do online shopping and coupons as extra money in online
paying methods accounts may be interesting.
Segment B: Gen Y/ Millennials
Generation Y is wildly known as Millennials because they spent their childhood and
adolescence in the beginning of the new millennium. They belong to another baby boom
period also known as the echo boomers, even though less significant than the baby boomers.
Kotler considers the group of people born between 1981 and 1996 to be Millennials. Like
the baby boomers they can be divided into the older and the younger millennials. The older
were born in the 80s and are alike with the previous generation, the gen X. They also adapt

85
to a non-digital childhood to the digital world. The younger millennials were born in the 90s,
they had contact with the internet at a younger age and have more similarities with the next
generation, Gen Z. (Kotler et al., 2021)
Millennials are keener on collecting experiences than material items. They are the first
generation to be associated to social media at their core. They used to be connected to others
and compare their lives and experiences. Therefor they can be easily influenced by others
and engage in the peer mentality. (Kotler et al., 2021)
They do their research before buying or get associated with a brand. The ethics and values
are very important, and this generation is known for embracing causes, as the environmental
protection and social rights. They make up for the majority of the workforce nowadays and
are seen as hard to work with because they need to believe and enjoy what they do. Even
though they are highly qualified career progression is almost frozen with the previous
generations holding all the higher positions. Millennials in Portugal are known to be
entrepreneurs and taking risks to create a job that suits them. Also, because they entered the
workforce in very unstable times where there was a big economic crisis. The younger
millennials that just entered the last few years have seen the struggles of their parents and
other relatives. So they tend to expect the worse in terms of finding a good job and create
their own opportunities. (Kotler et al., 2021)
Koe’s concept of telling the market what they want will appeal to them, they have the
opportunity to make the brands suit them. Due to the low income that characterizes this
generation is something that can be taken in advantage, the rewards will appeal to them as
easy extra money in the end of the month. The competition aspects are also important as
they spend the day comparing their lives with the lives of their friends, having a higher rank
or more badges give them the validation they crave.
Segment C: Gen Z
Kotler defines the Gen Z, also known as Centennials, as the group of people born between
1997 to 2009 and are the largest generation today. As some are still underage and Koe’s
rewards are in money, so the target group is just from 1997 to 2003, which are in their
86
majority university students. As the previous generation they remember the financial crisis
struggles so they are cautious with their finances.
They are considered to be the first digital natives because they were born when the internet
was already becoming mainstream. As Gen Z was introduced to the internet at a very young
age, they see no boundaries between online and offline. Because of this this generation does
not like things that are too perfect or too curated, they want to feel real-life authenticity in
the digital content. They are keen on giving access to their personal data in order to receive
personalize content that is convenient to them. As the Millennials, Centennials have strong
concerns about social change and environmental sustainability.
Their lives are exposed, and they are used to consume content all the time and in multiple
screens. It is common to be having dinner, while the Tv is on in some streaming platform
and sending messages on social media. They consume everything online from learning
materials, to shopping, news or entertainment.
Segment D: Baby Boomers
The last segment is the one with the lowest expected adoption rate, but they are needed in
order to have a diverse panel. The baby boomers were born between 1946 and 1964 and the
term refers to the high birth rate following the second world war. Kotler divides this
generation into two groups, the early boomers who had their adolescent years in the 60s and
the late boomers who had their adolescent years in the 70s (Kotler et al., 2021). This
distinction may be relevant in Portugal too, because of the revolution of 25 th of April of 1974
that took down the dictatorship regime that ruled the country for 40 years. The early boomers
have their defining years in a completely different environment than the late boomers. Unlike
in America the early boomers are more conservator than the late boomers that grew up in an
environment of revolutions and change.
The late boomers are the ones to be target, because the chances they have a Revolute, PayPal,
Google Pay or Apple pay account are higher for being younger. They are still in the
workforce so there are used to computers and the changes they have a smartphone are higher
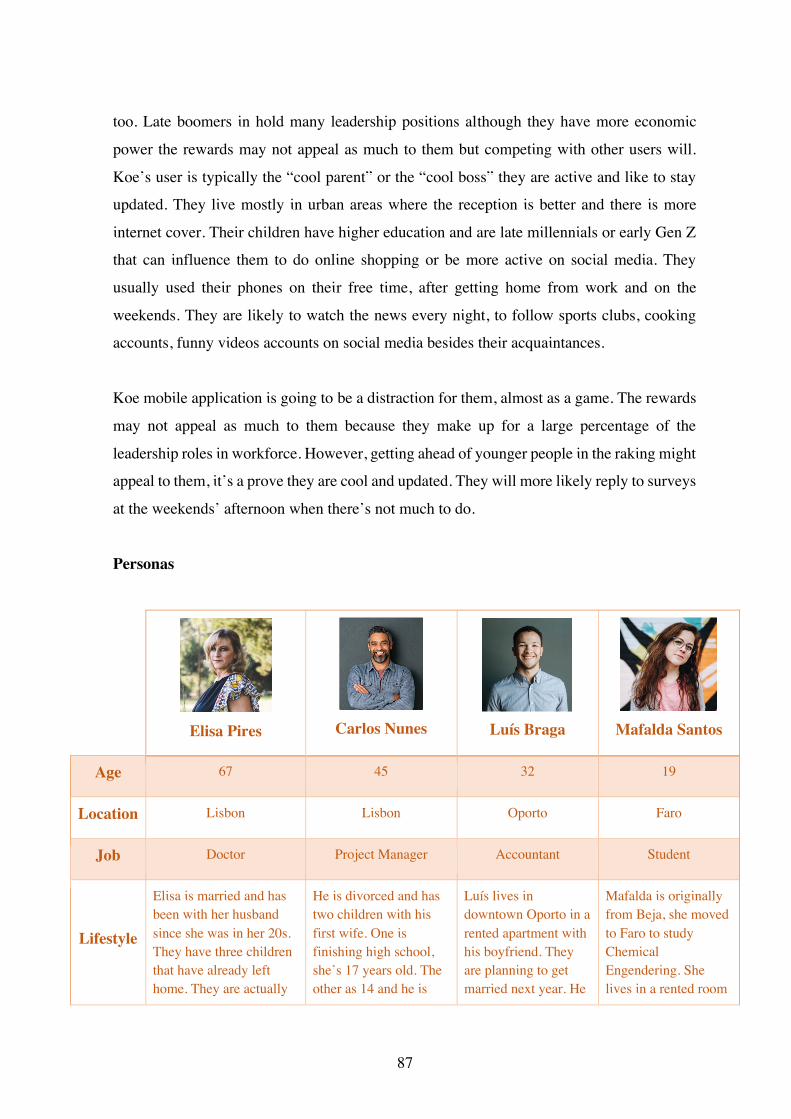
87
too. Late boomers in hold many leadership positions although they have more economic
power the rewards may not appeal as much to them but competing with other users will.
Koe’s user is typically the “cool parent” or the “cool boss” they are active and like to stay
updated. They live mostly in urban areas where the reception is better and there is more
internet cover. Their children have higher education and are late millennials or early Gen Z
that can influence them to do online shopping or be more active on social media. They
usually used their phones on their free time, after getting home from work and on the
weekends. They are likely to watch the news every night, to follow sports clubs, cooking
accounts, funny videos accounts on social media besides their acquaintances.
Koe mobile application is going to be a distraction for them, almost as a game. The rewards
may not appeal as much to them because they make up for a large percentage of the
leadership roles in workforce. However, getting ahead of younger people in the raking might
appeal to them, it’s a prove they are cool and updated. They will more likely reply to surveys
at the weekends’ afternoon when there’s not much to do.
Personas
Elisa Pires
Carlos Nunes
Luís Braga
Mafalda Santos
Age 67 45 32 19
Location Lisbon Lisbon Oporto Faro
Job Doctor Project Manager Accountant Student
Lifestyle
Elisa is married and has been with her husband since she was in her 20s. They have three children that have already left home. They are actually
He is divorced and has two children with his first wife. One is finishing high school, she’s 17 years old. The other as 14 and he is
Luís lives in downtown Oporto in a rented apartment with his boyfriend. They are planning to get married next year. He
Mafalda is originally from Beja, she moved to Faro to study Chemical Engendering. She lives in a rented room
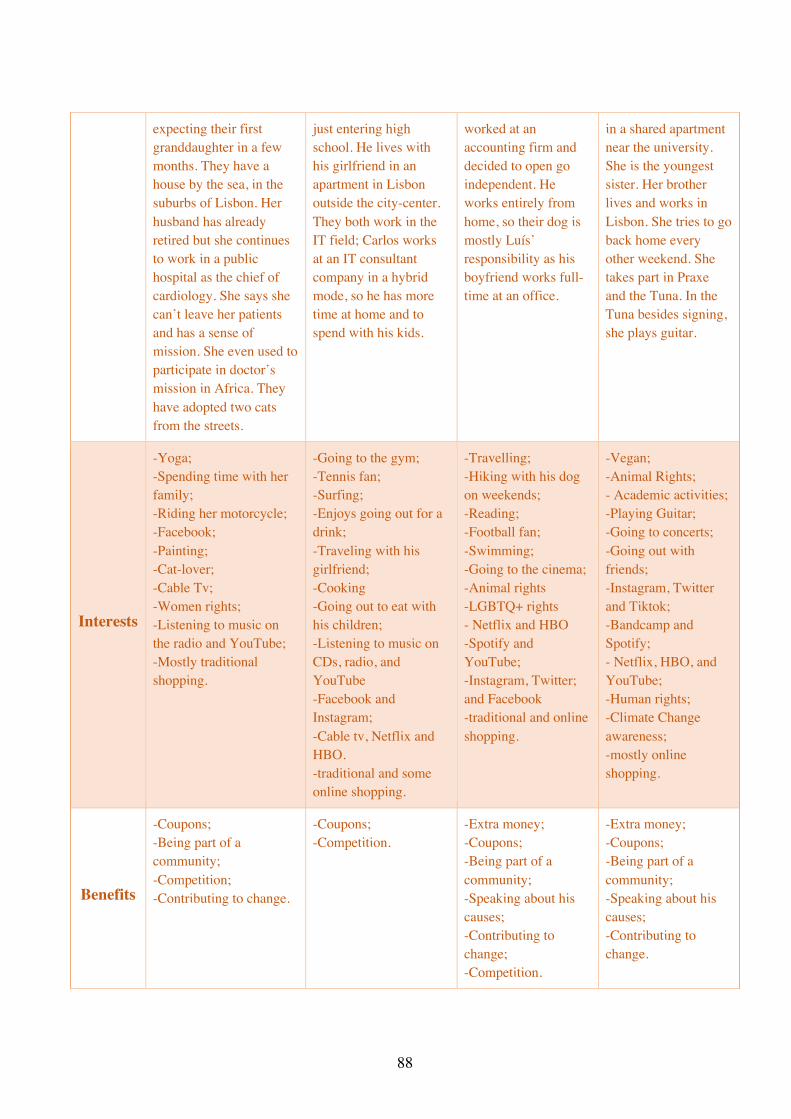
88
expecting their first granddaughter in a few months. They have a house by the sea, in the suburbs of Lisbon. Her husband has already retired but she continues to work in a public hospital as the chief of cardiology. She says she can’t leave her patients and has a sense of mission. She even used to participate in doctor’s mission in Africa. They have adopted two cats from the streets.
just entering high school. He lives with his girlfriend in an apartment in Lisbon outside the city-center. They both work in the IT field; Carlos works at an IT consultant company in a hybrid mode, so he has more time at home and to spend with his kids.
worked at an accounting firm and decided to open go independent. He works entirely from home, so their dog is mostly Luís’ responsibility as his boyfriend works full-time at an office.
in a shared apartment near the university. She is the youngest sister. Her brother lives and works in Lisbon. She tries to go back home every other weekend. She takes part in Praxe and the Tuna. In the Tuna besides signing, she plays guitar.
Interests
-Yoga; -Spending time with her family; -Riding her motorcycle; -Facebook; -Painting; -Cat-lover; -Cable Tv; -Women rights; -Listening to music on the radio and YouTube; -Mostly traditional shopping.
-Going to the gym; -Tennis fan; -Surfing; -Enjoys going out for a drink; -Traveling with his girlfriend; -Cooking -Going out to eat with his children; -Listening to music on CDs, radio, and YouTube -Facebook and Instagram; -Cable tv, Netflix and HBO. -traditional and some online shopping.
-Travelling; -Hiking with his dog on weekends; -Reading; -Football fan; -Swimming; -Going to the cinema; -Animal rights -LGBTQ+ rights - Netflix and HBO -Spotify and YouTube; -Instagram, Twitter; and Facebook -traditional and online shopping.
-Vegan; -Animal Rights; - Academic activities; -Playing Guitar; -Going to concerts; -Going out with friends; -Instagram, Twitter and Tiktok; -Bandcamp and Spotify; - Netflix, HBO, and YouTube; -Human rights; -Climate Change awareness; -mostly online shopping.
Benefits
-Coupons; -Being part of a community; -Competition; -Contributing to change.
-Coupons; -Competition.
-Extra money; -Coupons; -Being part of a community; -Speaking about his causes; -Contributing to change; -Competition.
-Extra money; -Coupons; -Being part of a community; -Speaking about his causes; -Contributing to change.
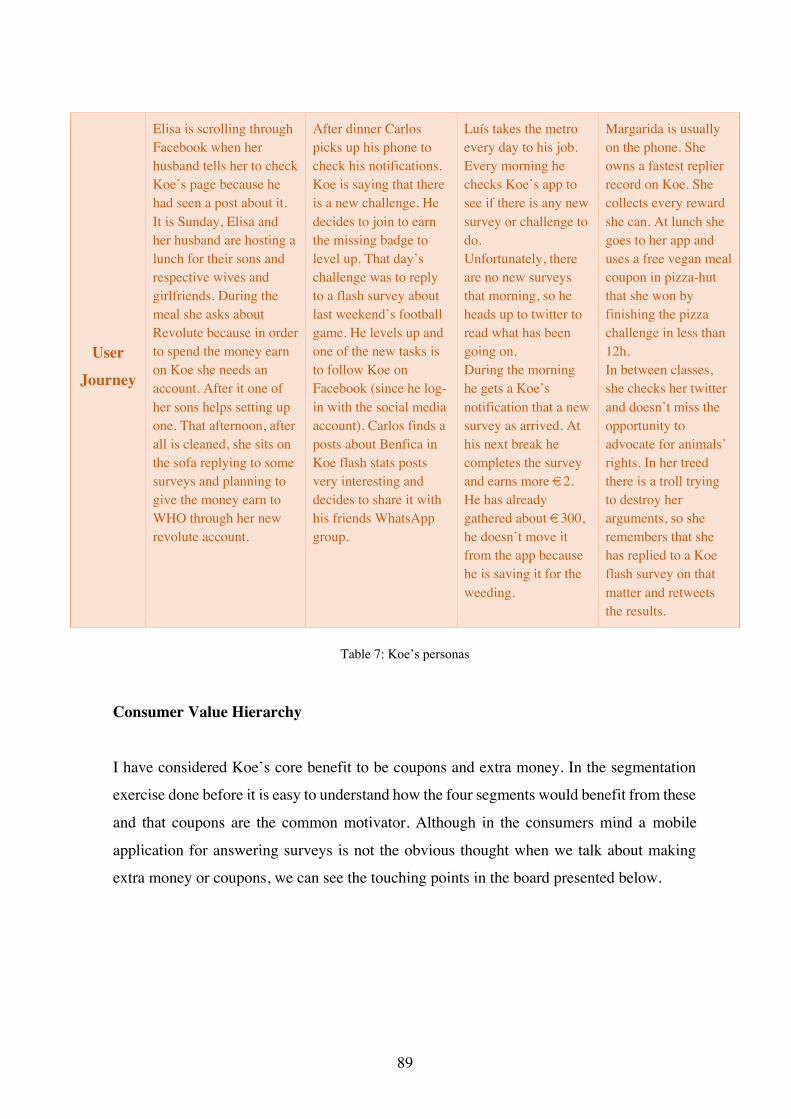
89
User
Journey
Elisa is scrolling through Facebook when her husband tells her to check Koe’s page because he had seen a post about it. It is Sunday, Elisa and her husband are hosting a lunch for their sons and respective wives and girlfriends. During the meal she asks about Revolute because in order to spend the money earn on Koe she needs an account. After it one of her sons helps setting up one. That afternoon, after all is cleaned, she sits on the sofa replying to some surveys and planning to give the money earn to WHO through her new revolute account.
After dinner Carlos picks up his phone to check his notifications. Koe is saying that there is a new challenge. He decides to join to earn the missing badge to level up. That day’s challenge was to reply to a flash survey about last weekend’s football game. He levels up and one of the new tasks is to follow Koe on Facebook (since he log-in with the social media account). Carlos finds a posts about Benfica in Koe flash stats posts very interesting and decides to share it with his friends WhatsApp group.
Luís takes the metro every day to his job. Every morning he checks Koe’s app to see if there is any new survey or challenge to do. Unfortunately, there are no new surveys that morning, so he heads up to twitter to read what has been going on. During the morning he gets a Koe’s notification that a new survey as arrived. At his next break he completes the survey and earns more €2. He has already gathered about €300, he doesn’t move it from the app because he is saving it for the weeding.
Margarida is usually on the phone. She owns a fastest replier record on Koe. She collects every reward she can. At lunch she goes to her app and uses a free vegan meal coupon in pizza-hut that she won by finishing the pizza challenge in less than 12h. In between classes, she checks her twitter and doesn’t miss the opportunity to advocate for animals’ rights. In her treed there is a troll trying to destroy her arguments, so she remembers that she has replied to a Koe flash survey on that matter and retweets the results.
Table 7: Koe’s personas
Consumer Value Hierarchy
I have considered Koe’s core benefit to be coupons and extra money. In the segmentation
exercise done before it is easy to understand how the four segments would benefit from these
and that coupons are the common motivator. Although in the consumers mind a mobile
application for answering surveys is not the obvious thought when we talk about making
extra money or coupons, we can see the touching points in the board presented below.
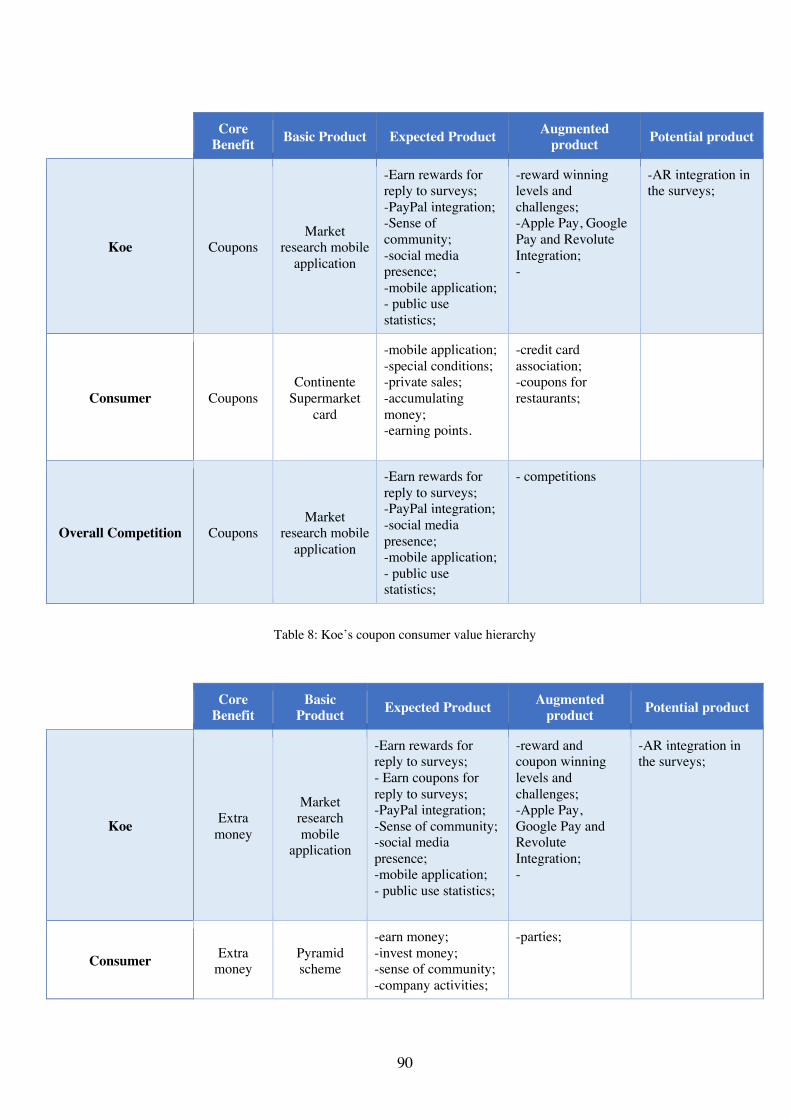
90
Core Benefit Basic Product Expected Product Augmented
product Potential product
Koe Coupons Market
research mobile application
-Earn rewards for reply to surveys; -PayPal integration; -Sense of community; -social media presence; -mobile application; - public use statistics;
-reward winning levels and challenges; -Apple Pay, Google Pay and Revolute Integration; -
-AR integration in the surveys;
Consumer Coupons Continente
Supermarket card
-mobile application; -special conditions; -private sales; -accumulating money; -earning points.
-credit card association; -coupons for restaurants;
Overall Competition Coupons Market
research mobile application
-Earn rewards for reply to surveys; -PayPal integration; -social media presence; -mobile application; - public use statistics;
- competitions
Table 8: Koe’s coupon consumer value hierarchy
Core Benefit
Basic Product Expected Product Augmented
product Potential product
Koe Extra money
Market research mobile
application
-Earn rewards for reply to surveys; - Earn coupons for reply to surveys; -PayPal integration; -Sense of community; -social media presence; -mobile application; - public use statistics;
-reward and coupon winning levels and challenges; -Apple Pay, Google Pay and Revolute Integration; -
-AR integration in the surveys;
Consumer Extra money
Pyramid scheme
-earn money; -invest money; -sense of community; -company activities;
-parties;
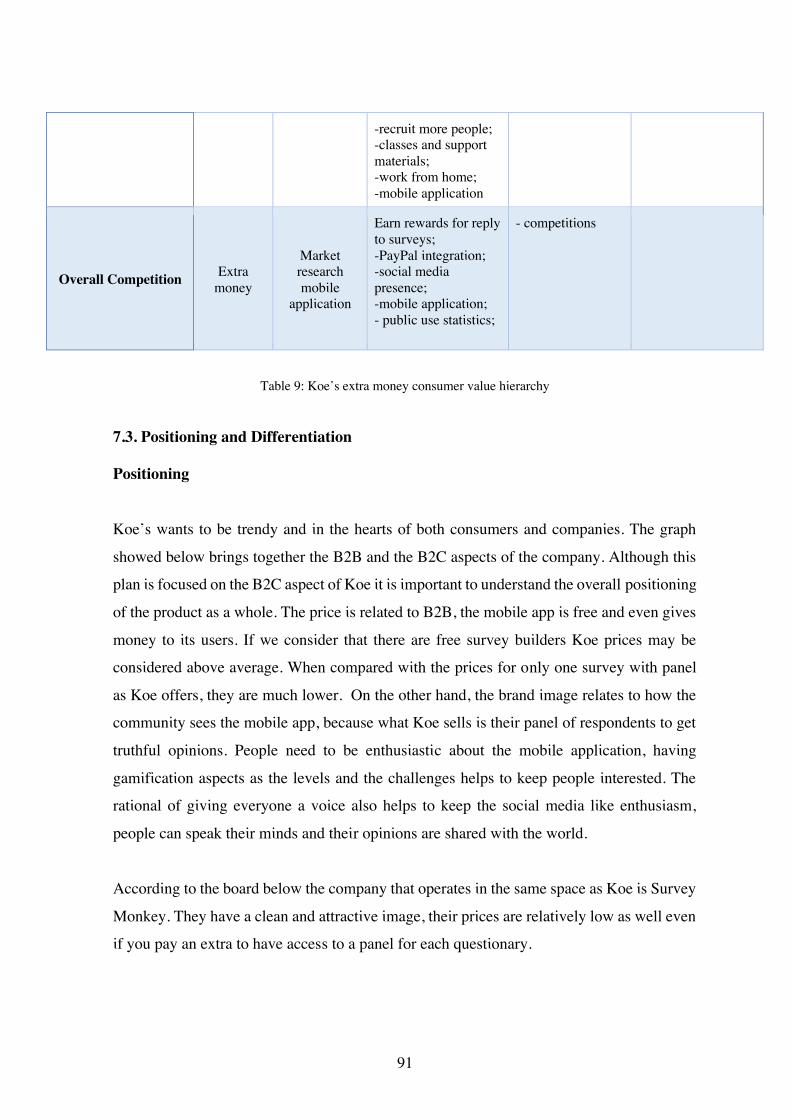
91
-recruit more people; -classes and support materials; -work from home; -mobile application
Overall Competition Extra money
Market research mobile
application
Earn rewards for reply to surveys; -PayPal integration; -social media presence; -mobile application; - public use statistics;
- competitions
Table 9: Koe’s extra money consumer value hierarchy
7.3. Positioning and Differentiation Positioning
Koe’s wants to be trendy and in the hearts of both consumers and companies. The graph
showed below brings together the B2B and the B2C aspects of the company. Although this
plan is focused on the B2C aspect of Koe it is important to understand the overall positioning
of the product as a whole. The price is related to B2B, the mobile app is free and even gives
money to its users. If we consider that there are free survey builders Koe prices may be
considered above average. When compared with the prices for only one survey with panel
as Koe offers, they are much lower. On the other hand, the brand image relates to how the
community sees the mobile app, because what Koe sells is their panel of respondents to get
truthful opinions. People need to be enthusiastic about the mobile application, having
gamification aspects as the levels and the challenges helps to keep people interested. The
rational of giving everyone a voice also helps to keep the social media like enthusiasm,
people can speak their minds and their opinions are shared with the world.
According to the board below the company that operates in the same space as Koe is Survey
Monkey. They have a clean and attractive image, their prices are relatively low as well even
if you pay an extra to have access to a panel for each questionary.
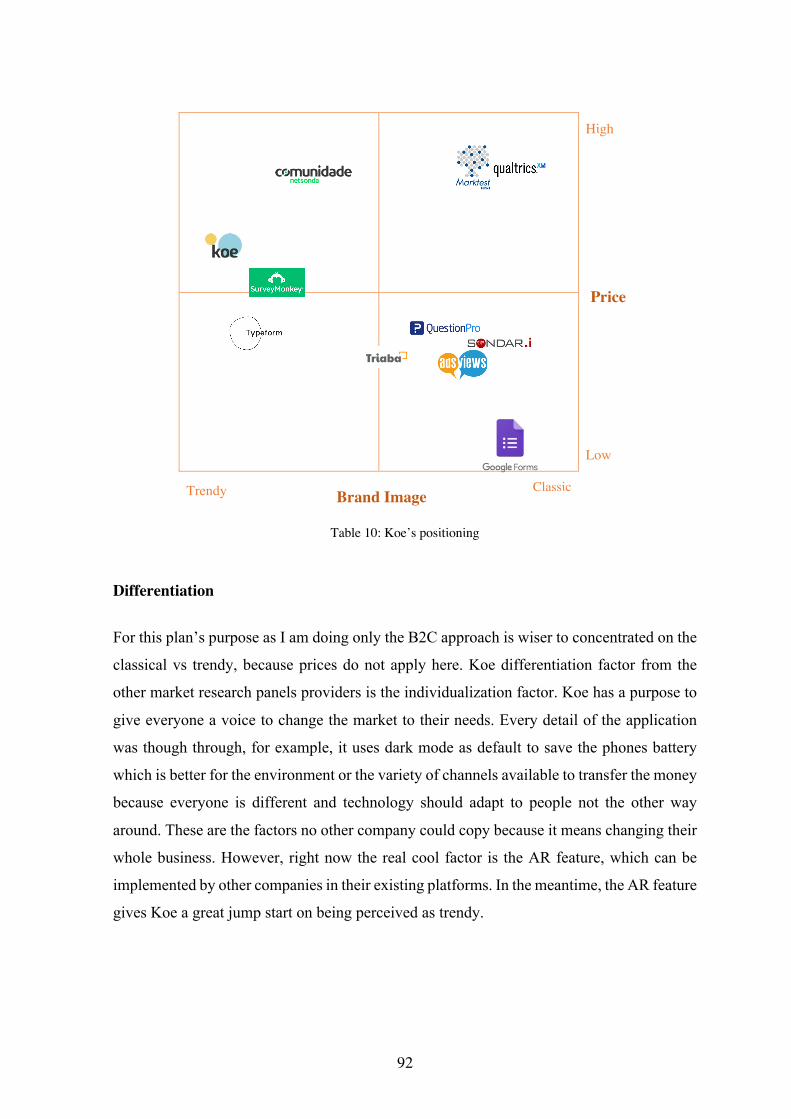
92
High
Low
Trendy Classic
Table 10: Koe’s positioning
Differentiation
For this plan’s purpose as I am doing only the B2C approach is wiser to concentrated on the
classical vs trendy, because prices do not apply here. Koe differentiation factor from the
other market research panels providers is the individualization factor. Koe has a purpose to
give everyone a voice to change the market to their needs. Every detail of the application
was though through, for example, it uses dark mode as default to save the phones battery
which is better for the environment or the variety of channels available to transfer the money
because everyone is different and technology should adapt to people not the other way
around. These are the factors no other company could copy because it means changing their
whole business. However, right now the real cool factor is the AR feature, which can be
implemented by other companies in their existing platforms. In the meantime, the AR feature
gives Koe a great jump start on being perceived as trendy.
Brand Image
Price
93
7.4. Marketing Mix Distribution and Pricing
The application is going to be available in the Apple app store and the Google App store so
all the smartphone users can download it. The costs of doing so are contemplated on the
expenses sheet in Appendix 17, for the google store the company has to pay a one-time fee
and for the Apple store the company has to pay a yearly fee.
In terms of pricing the app is free to use with no in-app purchases. This allows that all people
are able to fully experience the app reaching a bigger and more diverse audience. Koe is able
to do that because the revenue come from the subscription companies pay to make and
distribute surveys to Koe’s community.
Promotion
In this part I will explain how I will make people become users and growth the community
and how I will keep people engaged with the mobile application and not forget about after
two or three uses.
For the first challenge besides on relying on the communication strategy that’s going to be
explained ahead, there are some measures that can be taken to increase the community
growth rate. I have used the gamification principles to create levels and challenges in the
application. The levels are infinite and made of predefined tasks. The difficulty and the
number of tasks to complete are promotionally higher as the user levels up. When a level is
completed, the user earns a coupon. Let’s have a look at the first three tasks as an example:
- Level 1: Invite three friends, complete the hobbies on your profile, reply to a
survey.
- Level 2: reply to one Koe quick stats, enter a challenge, reply to three surveys,
evaluate the app.
- Level 3: Transfer money from rewards, win a challenge, reply to three Koe quick
stats.
94
In addition to the levels there are challenges that by completing or winning them, depending
on the challenge, the user wins coupons or rewards. The challenges about bringing friends
into the community are for each friend that joins using the user’s code translates into a week
where all the money the user makes by replying to surveys is doubled. The challenges where
user compete with each other like the fastest replier or the one the brings more people into
the community, there will be prices to the first three places, for the podium. Each place may
wins a different reward or they can all win the same. The best way to win coupons is through
challenges. Every time a user finishes a challenge or wins it – depending on the challenge –
they will earn a badge. Some challenges will not be rewarded because people will need to
do them in order to level up, but they still earn a badge. To better explain I have created three
examples of challenges:
- Two weeks challenge: Reply to all surveys and koe quick stats that you receive
for two weeks and receive a €5 Worten coupon.
- The influencer challenge: The top three users that bring more friends to the app
in May, will have their earning double for the whole month of June.
- Koe quick stats challenge: Reply to all koe quick stats that you have on your
profile for a week.
These are meant to keep people engaged with the app and feel motivated to bring others.
The odds of commenting with friends and family about something you are enjoying and have
fu using are greater. The coupons are meant to be used in-store, this is also tactical because
it marked people say the name of the app and someone nearby can hear it and see it gives
discounts, an indirect form of word-of-mouth.
7.5. Communication Strategy
The Communication Strategy I will be presenting is focused on Millennials. Despite
simplification aspects of the thesis, Generation Y is the biggest in work force, savvy with
their phones and hold much of the buying power.
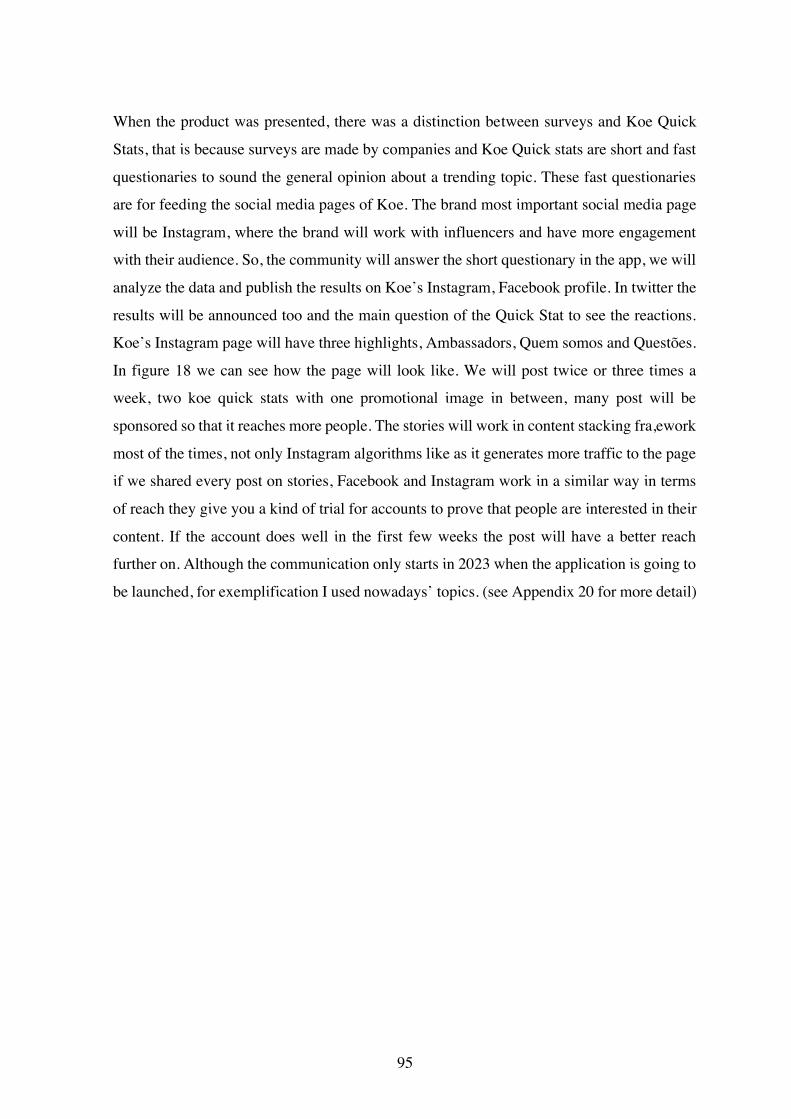
95
When the product was presented, there was a distinction between surveys and Koe Quick
Stats, that is because surveys are made by companies and Koe Quick stats are short and fast
questionaries to sound the general opinion about a trending topic. These fast questionaries
are for feeding the social media pages of Koe. The brand most important social media page
will be Instagram, where the brand will work with influencers and have more engagement
with their audience. So, the community will answer the short questionary in the app, we will
analyze the data and publish the results on Koe’s Instagram, Facebook profile. In twitter the
results will be announced too and the main question of the Quick Stat to see the reactions.
Koe’s Instagram page will have three highlights, Ambassadors, Quem somos and Questões.
In figure 18 we can see how the page will look like. We will post twice or three times a
week, two koe quick stats with one promotional image in between, many post will be
sponsored so that it reaches more people. The stories will work in content stacking fra,ework
most of the times, not only Instagram algorithms like as it generates more traffic to the page
if we shared every post on stories, Facebook and Instagram work in a similar way in terms
of reach they give you a kind of trial for accounts to prove that people are interested in their
content. If the account does well in the first few weeks the post will have a better reach
further on. Although the communication only starts in 2023 when the application is going to
be launched, for exemplification I used nowadays’ topics. (see Appendix 20 for more detail)
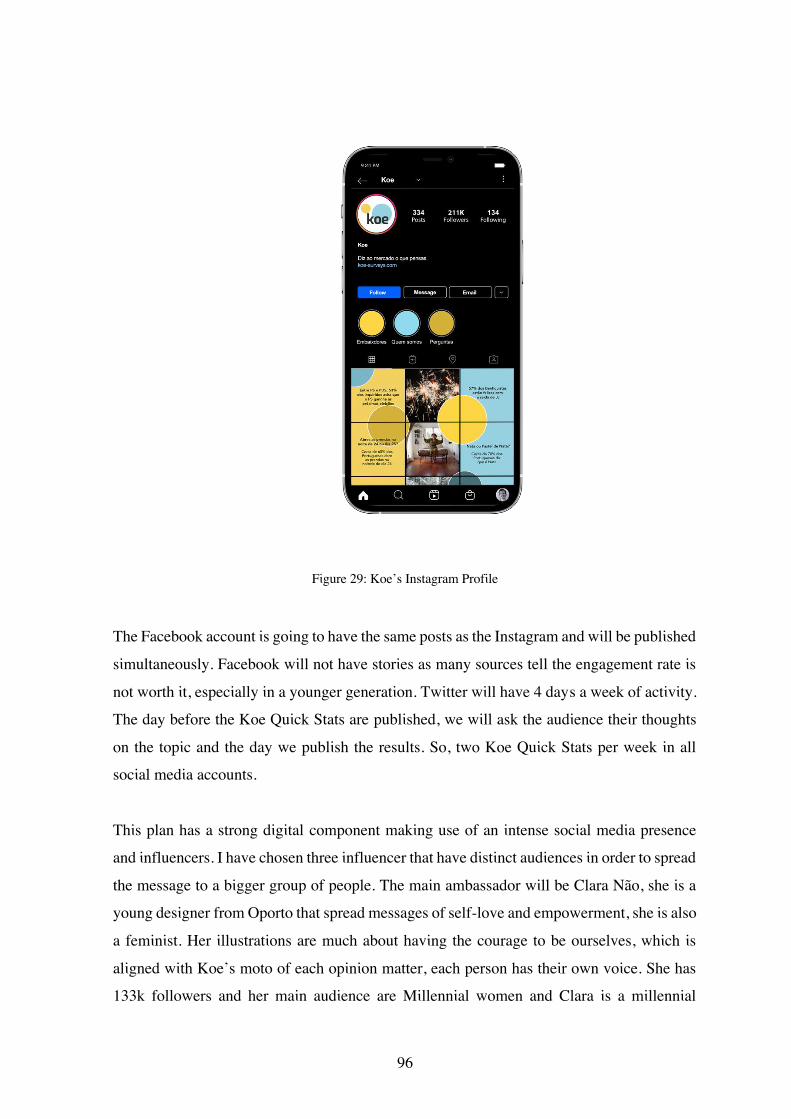
96
Figure 29: Koe’s Instagram Profile
The Facebook account is going to have the same posts as the Instagram and will be published
simultaneously. Facebook will not have stories as many sources tell the engagement rate is
not worth it, especially in a younger generation. Twitter will have 4 days a week of activity.
The day before the Koe Quick Stats are published, we will ask the audience their thoughts
on the topic and the day we publish the results. So, two Koe Quick Stats per week in all
social media accounts.
This plan has a strong digital component making use of an intense social media presence
and influencers. I have chosen three influencer that have distinct audiences in order to spread
the message to a bigger group of people. The main ambassador will be Clara Não, she is a
young designer from Oporto that spread messages of self-love and empowerment, she is also
a feminist. Her illustrations are much about having the courage to be ourselves, which is
aligned with Koe’s moto of each opinion matter, each person has their own voice. She has
133k followers and her main audience are Millennial women and Clara is a millennial
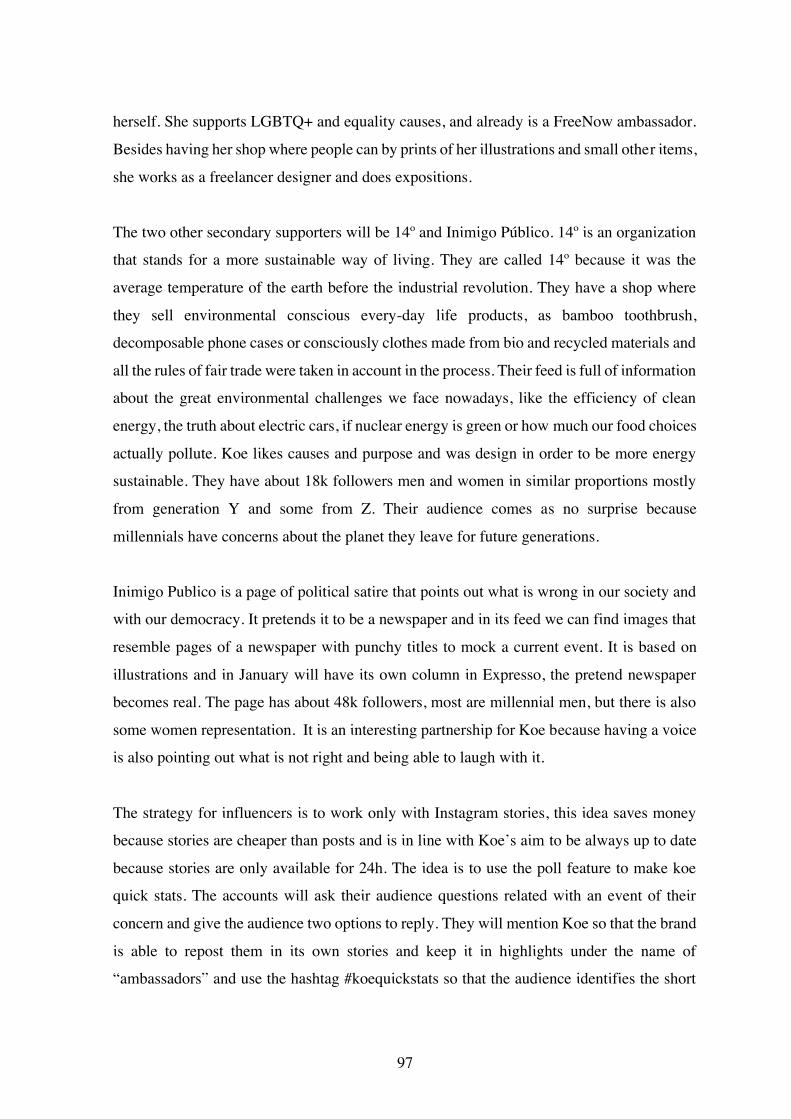
97
herself. She supports LGBTQ+ and equality causes, and already is a FreeNow ambassador.
Besides having her shop where people can by prints of her illustrations and small other items,
she works as a freelancer designer and does expositions.
The two other secondary supporters will be 14º and Inimigo Público. 14º is an organization
that stands for a more sustainable way of living. They are called 14º because it was the
average temperature of the earth before the industrial revolution. They have a shop where
they sell environmental conscious every-day life products, as bamboo toothbrush,
decomposable phone cases or consciously clothes made from bio and recycled materials and
all the rules of fair trade were taken in account in the process. Their feed is full of information
about the great environmental challenges we face nowadays, like the efficiency of clean
energy, the truth about electric cars, if nuclear energy is green or how much our food choices
actually pollute. Koe likes causes and purpose and was design in order to be more energy
sustainable. They have about 18k followers men and women in similar proportions mostly
from generation Y and some from Z. Their audience comes as no surprise because
millennials have concerns about the planet they leave for future generations.
Inimigo Publico is a page of political satire that points out what is wrong in our society and
with our democracy. It pretends it to be a newspaper and in its feed we can find images that
resemble pages of a newspaper with punchy titles to mock a current event. It is based on
illustrations and in January will have its own column in Expresso, the pretend newspaper
becomes real. The page has about 48k followers, most are millennial men, but there is also
some women representation. It is an interesting partnership for Koe because having a voice
is also pointing out what is not right and being able to laugh with it.
The strategy for influencers is to work only with Instagram stories, this idea saves money
because stories are cheaper than posts and is in line with Koe’s aim to be always up to date
because stories are only available for 24h. The idea is to use the poll feature to make koe
quick stats. The accounts will ask their audience questions related with an event of their
concern and give the audience two options to reply. They will mention Koe so that the brand
is able to repost them in its own stories and keep it in highlights under the name of
“ambassadors” and use the hashtag #koequickstats so that the audience identifies the short
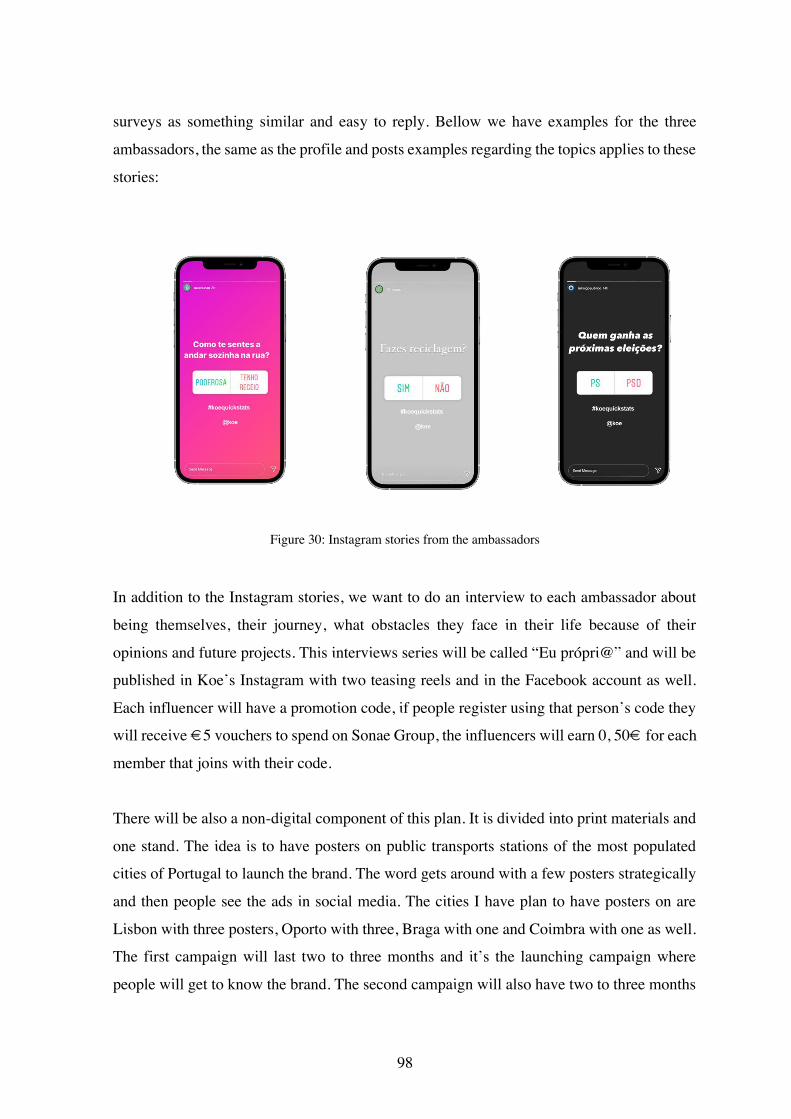
98
surveys as something similar and easy to reply. Bellow we have examples for the three
ambassadors, the same as the profile and posts examples regarding the topics applies to these
stories:
Figure 30: Instagram stories from the ambassadors
In addition to the Instagram stories, we want to do an interview to each ambassador about
being themselves, their journey, what obstacles they face in their life because of their
opinions and future projects. This interviews series will be called “Eu própri@” and will be
published in Koe’s Instagram with two teasing reels and in the Facebook account as well.
Each influencer will have a promotion code, if people register using that person’s code they
will receive €5 vouchers to spend on Sonae Group, the influencers will earn 0, 50€ for each
member that joins with their code.
There will be also a non-digital component of this plan. It is divided into print materials and
one stand. The idea is to have posters on public transports stations of the most populated
cities of Portugal to launch the brand. The word gets around with a few posters strategically
and then people see the ads in social media. The cities I have plan to have posters on are
Lisbon with three posters, Oporto with three, Braga with one and Coimbra with one as well.
The first campaign will last two to three months and it’s the launching campaign where
people will get to know the brand. The second campaign will also have two to three months
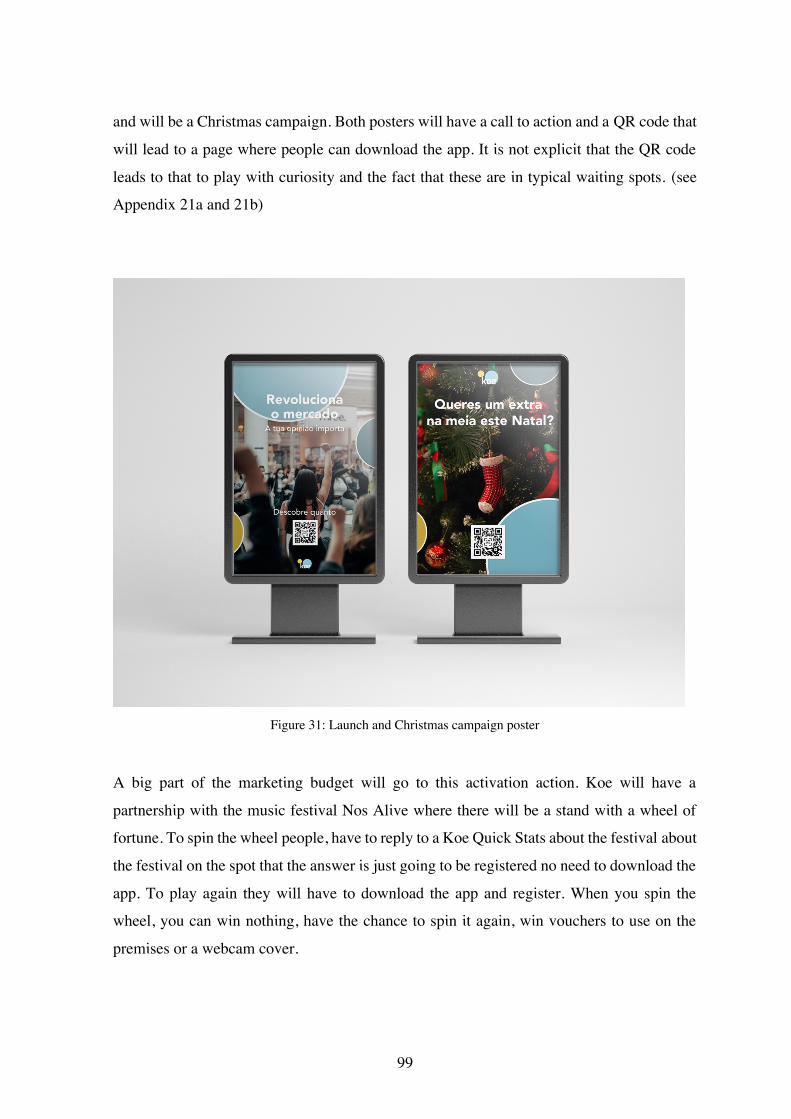
99
and will be a Christmas campaign. Both posters will have a call to action and a QR code that
will lead to a page where people can download the app. It is not explicit that the QR code
leads to that to play with curiosity and the fact that these are in typical waiting spots. (see
Appendix 21a and 21b)
Figure 31: Launch and Christmas campaign poster
A big part of the marketing budget will go to this activation action. Koe will have a
partnership with the music festival Nos Alive where there will be a stand with a wheel of
fortune. To spin the wheel people, have to reply to a Koe Quick Stats about the festival about
the festival on the spot that the answer is just going to be registered no need to download the
app. To play again they will have to download the app and register. When you spin the
wheel, you can win nothing, have the chance to spin it again, win vouchers to use on the
premises or a webcam cover.
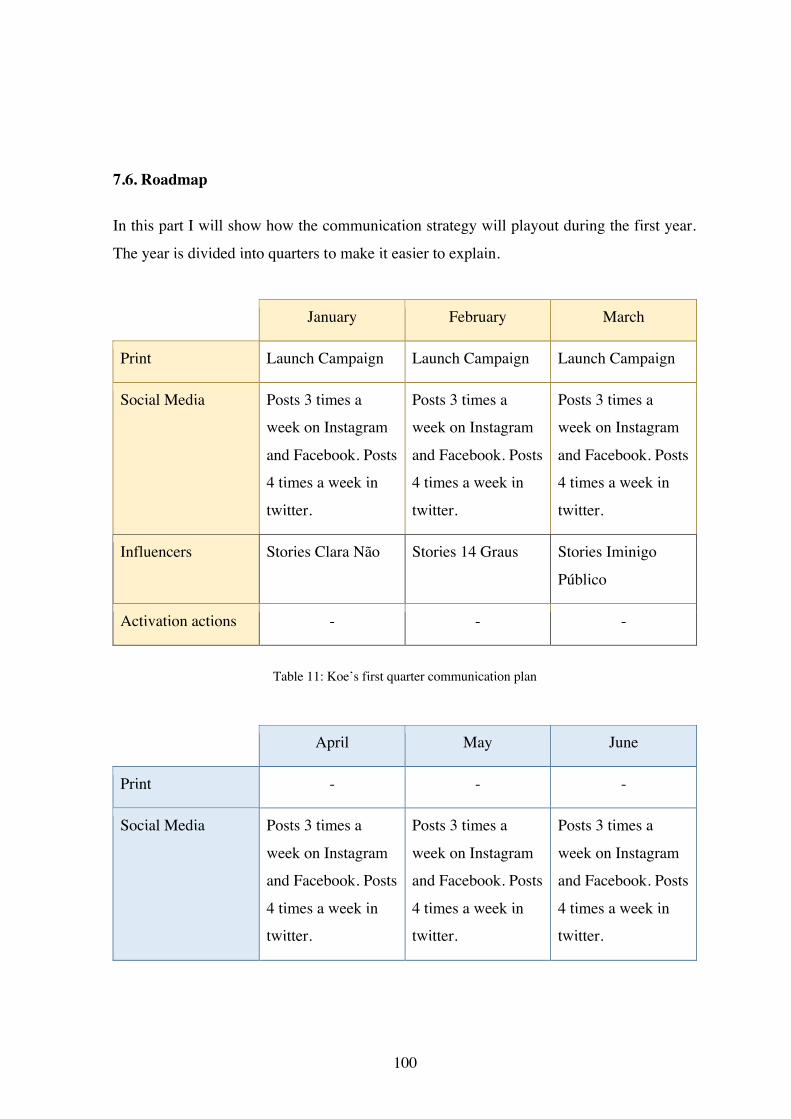
100
7.6. Roadmap
In this part I will show how the communication strategy will playout during the first year.
The year is divided into quarters to make it easier to explain.
January February March
Print Launch Campaign Launch Campaign Launch Campaign
Social Media Posts 3 times a
week on Instagram
and Facebook. Posts
4 times a week in
twitter.
Posts 3 times a
week on Instagram
and Facebook. Posts
4 times a week in
twitter.
Posts 3 times a
week on Instagram
and Facebook. Posts
4 times a week in
twitter.
Influencers Stories Clara Não Stories 14 Graus Stories Iminigo
Público
Activation actions - - -
Table 11: Koe’s first quarter communication plan
April May June
Print - - -
Social Media Posts 3 times a
week on Instagram
and Facebook. Posts
4 times a week in
twitter.
Posts 3 times a
week on Instagram
and Facebook. Posts
4 times a week in
twitter.
Posts 3 times a
week on Instagram
and Facebook. Posts
4 times a week in
twitter.
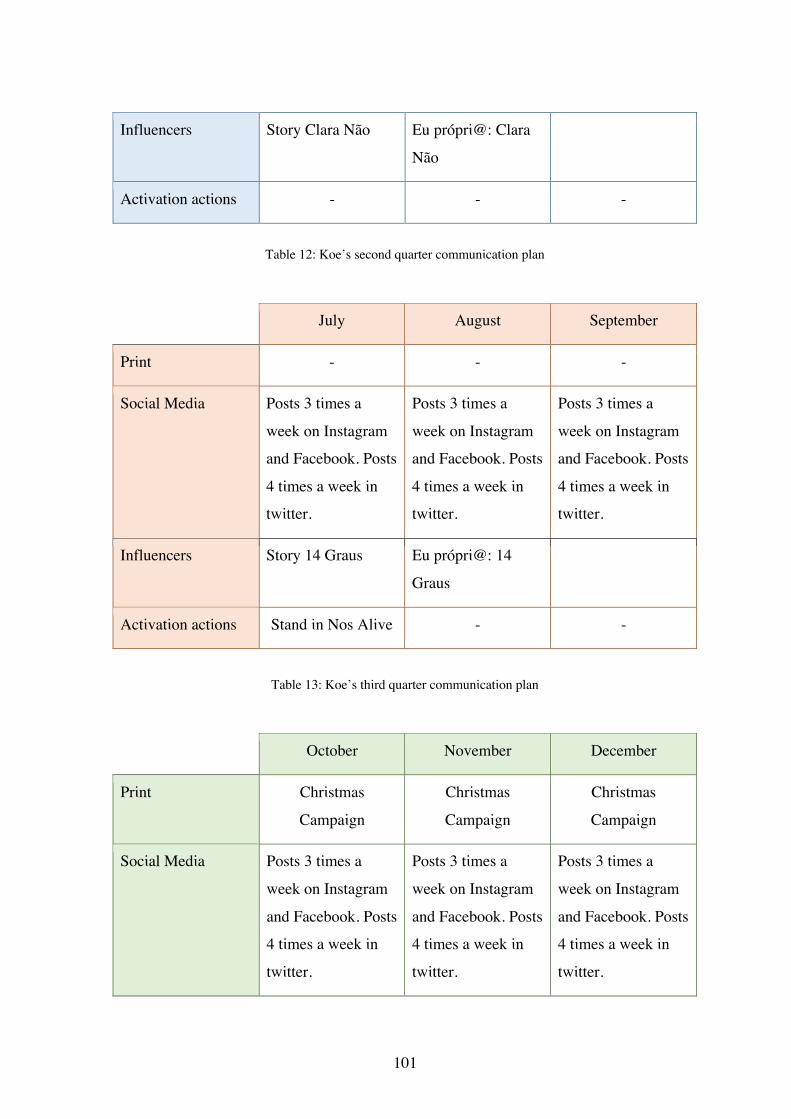
101
Influencers Story Clara Não Eu própri@: Clara
Não
Activation actions - - -
Table 12: Koe’s second quarter communication plan
July August September
Print - - -
Social Media Posts 3 times a
week on Instagram
and Facebook. Posts
4 times a week in
twitter.
Posts 3 times a
week on Instagram
and Facebook. Posts
4 times a week in
twitter.
Posts 3 times a
week on Instagram
and Facebook. Posts
4 times a week in
twitter.
Influencers Story 14 Graus Eu própri@: 14
Graus
Activation actions Stand in Nos Alive - -
Table 13: Koe’s third quarter communication plan
October November December
Print Christmas
Campaign
Christmas
Campaign
Christmas
Campaign
Social Media Posts 3 times a
week on Instagram
and Facebook. Posts
4 times a week in
twitter.
Posts 3 times a
week on Instagram
and Facebook. Posts
4 times a week in
twitter.
Posts 3 times a
week on Instagram
and Facebook. Posts
4 times a week in
twitter.

102
Influencers Story Iminigo
Público
Eu própri@:
Inimigo Publico
Activation actions - - -
Table 14: Koe’s quarter communication plan
103
Conclusion
From this project, we can understand that market research is still a discipline in evolution
to adapt to the present needs. Koe aims to represent this adaption to the 2020s, where
companies still need to gather information on consumers that big data does not cover and
make use of the technology available.
From the projections presented in the business plan, Koe has what it takes to be successful.
It is predicted that the Portuguese market for market research would have a growing rate of
3,30% that for simplicity purposes was calculated as constant. Which means that in 2023,
when Koe would star its activity, it will enter a €111 143 850,83 market. In the last year of
the projections, Y5 (year five), Koe will have 0,90% of market share in Portugal.
There is some competition in this sector but Koe differentiates itself by the services that
provides and the prices. Koe combines survey design with an audience to distribute it,
most of the other online platforms are mostly survey builder which have no audience for
distribution or just audience distributers with no survey builder. The ones that combine the
two elements are traditional market research companies and sell individual studies at
expensive prices, one specific budget per study. Koe is different because not only
combines the two services, as the license system allows for Koe’s prices to be more
affordable, companies can make at least 3 surveys up to 12 yearly, with reward money
already included. It also allows companies to relate any data point storage in their cloud
collected form the surveys made.
Koe will need €70 000 of initial capital from personal funds. The founding staff would
have ownership of the company and contribute to the initial capital. We used the year zero
concept to develop the platforms, the team will be composed by the funding staff already
mentioned, which includes the author, a back-end developer and a front-end developer. Y0
will require an investment of €78 897,50, which are the expenses with the salaries of the
two developers. I have estimated that Koe will reach a breakeven in the third year of
activity and by the fifth year of activity will have a gross profit of €292 688,38. Also in
the fifth year, the company will recover all the money invested. This performs a total
104
amount of €87 897,50, the initial capital €70 000, paid all the bank loans made to cover
the losses that are about €45 000 with a 3% interest rate. When reaching the fifth year of
activity the company would have six employees, a back-end developer, a front-end
developer, a general manager and two sales representatives and a surplus of €30 371,76.
In terms of marketing and communication the message is clear, Koe is about individuality
and being ourselves. The word Koe means “you” in Māori that believes each person is born
with their own Mana, which is a supernatural gift. Koe’s mission is to give people the power
to bend the market to their will, by communicating their needs and desires in a process they
have full control of, in contrast with big data. Koe positions itself as trendy, so that people
can transfer the money earn on the mobile application through Apple pay, Google pay and
Revolute, besides the traditional options of PayPal and bank debit. It uses AR a feature that
at this time none of the competitors are using.
The plan presented is to be applied during Y1 (year one) and has traditional marketing tactics
as well as digital ones. This plan is focused on creating brand awareness in the B2C market,
the mobile application target. The digital strategy is to keep the audience engaged by stirring
and asking for opinion on hot topics. The mobile app challenges play a big part in this due
to the #KoeQuickStats that are short questionaries to collect opinions on trending topics like,
who is going to win the next elections. The results are share in social media in the form of
post on Instagram and Facebook, and as tweets on Twitter. Twitter will also be a tool of
conversation starter, the trending topics are discussed and the poll done by Koe Quick Stats
shows the general opinion of people about the topic. In addition, Koe will have three
ambassadors, based on Instagram, Clara Não, 14º and Inimigo Público, each one covers a
segment of conversation topics and follows the Koe mindset of being true to ourselves. The
influencers’ actions will the more concentrated on the first trimester of the year to give a
boast of visibility to the brand. Then there will be two more actions for each influencer
throughout the year, a story and an interview. The interview is to be posted on social media,
it is called “Eu propri@” and the plan is for the ambassadors to talk about their journey and
motivations in life.
105
The more traditional approach aims to bring awareness to the brand’s existence. The plan is
in the first and last trimester of the year to have print advertising on public transports stations
and stops. As people there usually are just waiting for the train, bus or metro to arrive they
have time to look at the poster and scan the QR code in the poster to download the app. The
first trimester poster is for launching the brand and the last trimester of the year poster is
Christmas related. The action that we am expecting to bring more users is the stand in NOS
Alive music festival in July. We want to make a partnership with the festival that consists in
people evaluating it through a Koe survey. Koe will have a stand and a wheel with prizes, to
spin it people will have answer to a Koe Quick Stat where the answer is collected on the
spot, no need to download the app. To play again and win more prizes people will have to
download the application and register.
We think the Koe projects shows that big data still hasn’t won the market research field all
by itself and that more traditional methods of market research have a chance to thrive in the
next years if they modernize.
With this project we can understand the influence of brand communication, it transforms a
boring survey into an act of rebellion, of sharing our desires to bend the market to our will.
This projects future is to be fully available online to inspire others to do projects as their
master’s thesis and to be useful to other students when researching topics approached in
here.

106
107
Bibliographic References
Allen, J., & Abbruzzese, J. (2018, March 20). Cambridge Analytica’s effectiveness called
into question despite alleged Facebook data harvesting. NBC News.
https://www.nbcnews.com/politics/politics-news/cambridge-analytica-s-effectiveness-
called-question-despite-alleged-facebook-data-n858256
Alvino, L., Pavone, L., Abhishta, A., & Robben, H. (2020). Picking Your Brains: Where and
How Neuroscience Tools Can Enhance Marketing Research. Frontiers in Neuroscience, 14.
https://doi.org/10.3389/fnins.2020.577666
AL-Smadi, M. (2014). GAMEDUCATION: Using Game Mechanics and Dynamics to
Enhance Online Learning.
Anderson, D. J. (2010). Kanban: Successful Evolutionary Change for Your Technology
Business. Blue Hole Press. https://books.google.pt/books?id=RJ0VUkfUWZkC
Andreadis, I. (2015). Comparison of Response Times between Desktop and Smartphone
Users. In D. Toninelli, Robert Pinter, & P. de Pedraza (Eds.), Mobile Research Methods (pp.
63–80). Ubiquity Press. https://www.jstor.org/stable/j.ctv3t5r9n.10
Andrews, M., Goehring, J., Hui, S., Pancras, J., & Thornswood, L. (2016). Mobile
Promotions: A Framework and Research Priorities. Journal of Interactive Marketing, 34,
15–24. https://doi.org/10.1016/j.intmar.2016.03.004
Bădică, A. L., & Mitucă, M. O. (2021). IOT-Enhanced Digital Marketing Conceptual
Framework. BRAIN: Broad Research in Artificial Intelligence & Neuroscience, 12(4), 509–
531. https://doi.org/10.18662/brain/12.4/262
Baker, R. P. (1992). New Technology in Survey Research: Computer-Assisted Personal
Interviewing (CAPI). In Social Science Computer Review (Vol. 10, Issue 2, pp. 145–157).
108
Baker, R. P., Norman, M. B., & Johnson, R. A. (1995). Computer-assisted Personal
Interviewing: An Experimental Evaluation of Data Quality and Cost. Journal of Official
Statistics, 11, 4, Pp. 413-431.
http://www.websm.org/db/12/3069/Web%20Survey%20Bibliography/Computerassisted_P
ersonal_Interviewing_An_Experimental_Evaluation_of_Data_Quality_and_Cost/
Ballivian, A., Azevedo, J. P., & Durbin, W. (2015). Using Mobile Phones for High-
Frequency Data Collection. In D. Toninelli, R. Pinter, & P. de Pedraza (Eds.), Mobile
Research Methods (pp. 21–40). Ubiquity Press. https://www.jstor.org/stable/j.ctv3t5r9n.8
Beuving, J. J. (2020). Ethnography’s future in the big data era. Information, Communication
& Society, 23(11), 1625–1639. https://doi.org/10.1080/1369118X.2019.1602664
Burke, B. (2014). Gamify: How ti can motivate people to do Extraordinary Things. Gartner,
Inc.
Camarer, C., & Yoon, C. (2015). Introduction to the ‘Journal of Marketing Research’ Special
Issue on Neuroscience and Marketing. Journal of Marketing Research, 52(4), 423–426.
Casas-Romeo, A., Gázquez-Abad, J. C., Forgas-Coll, S., & Huertas-García, R. (2014). La
netnografía como herramienta de investigación en contextos on-line: Una aplicación al
análisis de la imagen de los servicios públicos de transporte. Innovar: Revista de Ciencias
Administrativas y Sociales, 24(52), 89–101.
Christianini, S. N., Grande, F. C. D., & Américo, M. (2016). Desenvolvimento de sistemas
gamificados com foco no edutretenimento e no jogador: Uma análise dos arquétipos de
Bartle e Marczewski. Revista Ibero-Americana de Estudos em Educação, 363–373.
https://doi.org/10.21723/RIAEE.v11.esp.1.p363
Coelho, P. S., Rita, P., & Santos, Z. R. (2018). On the relationship between consumer-brand
identification, brand community, and brand loyalty. Journal of Retailing and Consumer
Services, 43, 101–110. https://doi.org/10.1016/j.jretconser.2018.03.011

109
Cottica, A., Melançon, G., & Renoust, B. (2017). Online community management as social
network design: Testing for the signature of management activities in online communities.
Applied Network Science, 2(1), 30. https://doi.org/10.1007/s41109-017-0049-9
Dalgas, K. M. (2016). Au Pairs on Facebook: Ethnographic use of social media in politicised
fields. Nordic Journal of Migration Research, 6(3), 175–182. https://doi.org/10.1515/njmr-
2016-0023
De Leeuw, E. (2008). The effect of computer-assisted interviewing on data quality: A review
of the evidence.
Deighton, J. (2019). Big data. Consumption Markets & Culture, 22(1), 68–73.
https://doi.org/10.1080/10253866.2017.1422902
Dessart, L., Veloutsou, C., & Morgan-Thomas, A. (2015). Consumer engagement in online
brand communities: A social media perspective. Journal of Product & Brand Management,
24(1), 28–42. https://doi.org/10.1108/JPBM-06-2014-0635
Dewey, J., PhD. (2019). Big data. In Salem Press Encyclopedia. Salem Press.
https://widgets.ebscohost.com/prod/customerspecific/ns000290/authentication/index.php?u
rl=https%3a%2f%2fsearch.ebscohost.com%2flogin.aspx%3fdirect%3dtrue%26db%3ders
%26AN%3d89677523%26lang%3dpt-pt%26site%3deds-live%26scope%3dsite
Dias, P. (2008). O Telemóvel e o Quotidiano. Lisboa: Paulus Editora.
Dias, P., & Teixeira-Botelho, I. (2020). Smarting—Como o mobile marketing está a mudar
Portugal (1st ed.). Edições Sílabo, Lda.
Elhai, J. D., Yang, H., & Montag, C. (2021). Fear of missing out (FOMO): Overview,
theoretical underpinnings, and literature review on relations with severity of negative
110
affectivity and problematic technology use. Revista Brasileira de Psiquiatria, 43(2), 203–
209. https://doi.org/10.1590/1516-4446-2020-0870
Fairweather, J., Rinne, T., & Steel, G. (2012). Computer-Assisted, Self-Interviewing (CASI)
Compared to Face-to-Face Interviewing (FTFI) with Open-Ended, Non-Sensitive Questions.
International Journal of Qualitative Methods, 11(3), 280–291. Publicly Available Content
Database. https://doi.org/10.1177/160940691201100307
Fink, J. C. (1983). CATI’s First Decade: The Chilton Experience. Sociological Methods &
Research, 12(2), 153–168. https://doi.org/10.1177/0049124183012002004
GBH Forum Network. (2019, May 2). Shoshana Zuboff: Surveillance Capitalism and Our
Democracy. https://www.youtube.com/watch?v=uJwf6oLvc2Q
Flavián, C., Ibáñez-Sánchez, S., & Orús, C. (2019). The impact of virtual, augmented and
mixed reality technologies on the customer experience. Journal of Business Research, 100,
547–560. https://doi.org/10.1016/j.jbusres.2018.10.050
Fortunati, L. (2002). «The mobile phone: Towards new categories and social relations».
Information, Communication & Society 5(4), 513-528.
González, F., Yu, Y., Figueroa, A., López, C., & Aragon, C. (2019). Global Reactions to the
Cambridge Analytica Scandal: An Inter-Language Social Media Study. Companion
Proceedings of The 2019 World Wide Web Conference, 799–806.
https://doi.org/10.1145/3308560.3316456
Grewal, D., Bart, Y., Spann, M., & Zubcsek, P. P. (2016). Mobile Advertising: A Framework
and Research Agenda. Journal of Interactive Marketing, 34, 3–14.
https://doi.org/10.1016/j.intmar.2016.03.003
Guilbeault, D. (2018). Digital Marketing in the Disinformation Age. Journal of International
Affairs, 71(1.5), 33–42.
111
Hair Jr, J. F., Page, M., & Brunsveld, N. (2019). Essentials of Business Research Methods.
Routledge.
Hakala, H., Niemi, L., & Kohtamäki, M. (2017). Online brand community practices and the
construction of brand legitimacy. Marketing Theory, 17(4), 537–558.
https://doi.org/10.1177/1470593117705695
Hilken, T., de Ruyter, K., Chylinski, M., Mahr, D., & Keeling, D. I. (2017). Augmenting the
eye of the beholder: Exploring the strategic potential of augmented reality to enhance online
service experiences. Journal of the Academy of Marketing Science, 45(6), 884–905.
https://doi.org/10.1007/s11747-017-0541-x
Hollebeek, L. D. (2011). Demystifying customer brand engagement: Exploring the loyalty
nexus. Journal of Marketing Management, 27(7–8), 785–807.
https://doi.org/10.1080/0267257X.2010.500132
Hollebeek, L. D., Juric, B., & Tang, W. (2017). Virtual brand community engagement
practices: A refined typology and model. Journal of Services Marketing, 31(3), 204–217.
https://doi.org/10.1108/JSM-01-2016-0006
Horvat, J., Markovic, S., & Perencevic, M. (2001). CADAC methods in market research.
Proceedings of the 23rd International Conference on Information Technology Interfaces,
2001. ITI 2001., 223–230 vol.1. https://doi.org/10.1109/ITI.2001.938022
Hu, M. (2020). Cambridge Analytica’s black box. Big Data & Society, 7(2),
2053951720938091. https://doi.org/10.1177/2053951720938091
Hunicke, R., LeBlanc, M., & Zubek, R. (2004). MDA: A Formal Approach to Game Design
and Game Research. Procedings of the AAAI, 1–11.
Jagoda, P. (2020). Experimental Games Critique: Play, and Design in the Age of
Gamification. The University of Chicago Press.
112
Javornik, A. (2016). ‘It’s an illusion, but it looks real!’ Consumer affective, cognitive and
behavioural responses to augmented reality applications. Journal of Marketing
Management, 32(9–10), 987–1011. https://doi.org/10.1080/0267257X.2016.1174726
Jerković, D., Arnaut, E., & Dukić, S. (2021). The Impact of Focusing on the Digital
Marketing in the Function of Increasing Economic Efficiency and Effectiveness of
Companies in Bosnia and Herzegovina. International Journal of Sales, Retailing &
Marketing, 10(2), 36–47.
Keogh, B. (2017). Pokémon Go, the novelty of nostalgia, and the ubiquity of the smartphone.
Mobile Media & Communication, 5(1), 38–41. https://doi.org/10.1177/2050157916678025
Klein, G., & Sobol, M. G. (1996). Bias in computer-assisted surveys. IEEE Transactions on
Systems, Man, and Cybernetics - Part A: Systems and Humans, 26(5), 566–571.
https://doi.org/10.1109/3468.531904
Kotler, Philip., Kartajaya, Hermawan., & Setiawan, Iwan. (2016). Marketing 4.0: Moving
from Traditional to Digital. Wiley. https://books.google.pt/books?id=8_8JvgAACAAJ
Kozinets, R. V. (2002). The Field behind the Screen: Using Netnography for Marketing
Research in Online Communities. Journal of Marketing Research, 39(1), 61–72.
Kunkel, T., Lock, D., & Doyle, J. P. (2021). Gamification via mobile applications: A
longitudinal examination of its impact on attitudinal loyalty and behavior toward a core
service. Psychology & Marketing. https://doi.org/10.1002/mar.21467
Levinson, P. (2001). Digital McLuhan: A guide to the information Millenium. London:
Routledge.
Ling, R. (2004). The Mobile Connection: The cell phone’s impact on society. São
Francisco: Elsevier.
113
Lockley, L. C. (1950). Notes on the History of Marketing Research. Journal of Marketing,
14(5), 733–736. https://doi.org/10.2307/1246952
Marczewski, A. (2015). User Types. In Even Ninja Monkeys Like to Play: Gamification,
Game Thinking and Motivational Design (1st ed., pp. 65–80). CreatSpace Indepent
Publishing Platform. https://www.gamified.uk/even-ninja-monkeys-like-to-play/
Miller, T. W., & Dickson, P. R. (2001). On-Line Market Research. International Journal of
Electronic Commerce, 5(3), 139–167.
Moore, K., & Craciun, G. (2021). Fear of Missing Out and Personality as Predictors of Social
Networking Sites Usage: The Instagram Case. Psychological Reports, 124(4), 1761–1787.
https://doi.org/10.1177/0033294120936184
Moreira, I., Stenzel, P., Lopes, J. M., & Oliveira, J. (2021). Do digital influencers
successfully contribute to reducing the gap between customers and companies? Brazilian
Business Review (Portuguese Edition), 18(6), 662–678.
https://doi.org/10.15728/bbr.2021.18.6.4
Oliver, R. L. (1999). Whence Consumer Loyalty? Journal of Marketing, 63, 33–44. JSTOR.
https://doi.org/10.2307/1252099
Pin-Yuan Huang, Hsiao-Chi Ling, & Ruei-Yuan Wang. (2021). Effective Combination and
Analysis of ‘Big Data’ and ‘Classic Marketing’. International Journal of Organizational
Innovation, 13(3), 125–131.
Poynter, R. (2015). The Utilization of Mobile Technology and Approaches in Commercial
Market Research. In D. Toninelli, R. Pinter, & P. de Pedraza (Eds.), Mobile Research
Methods (pp. 11–20). Ubiquity Press. https://www.jstor.org/stable/j.ctv3t5r9n.7
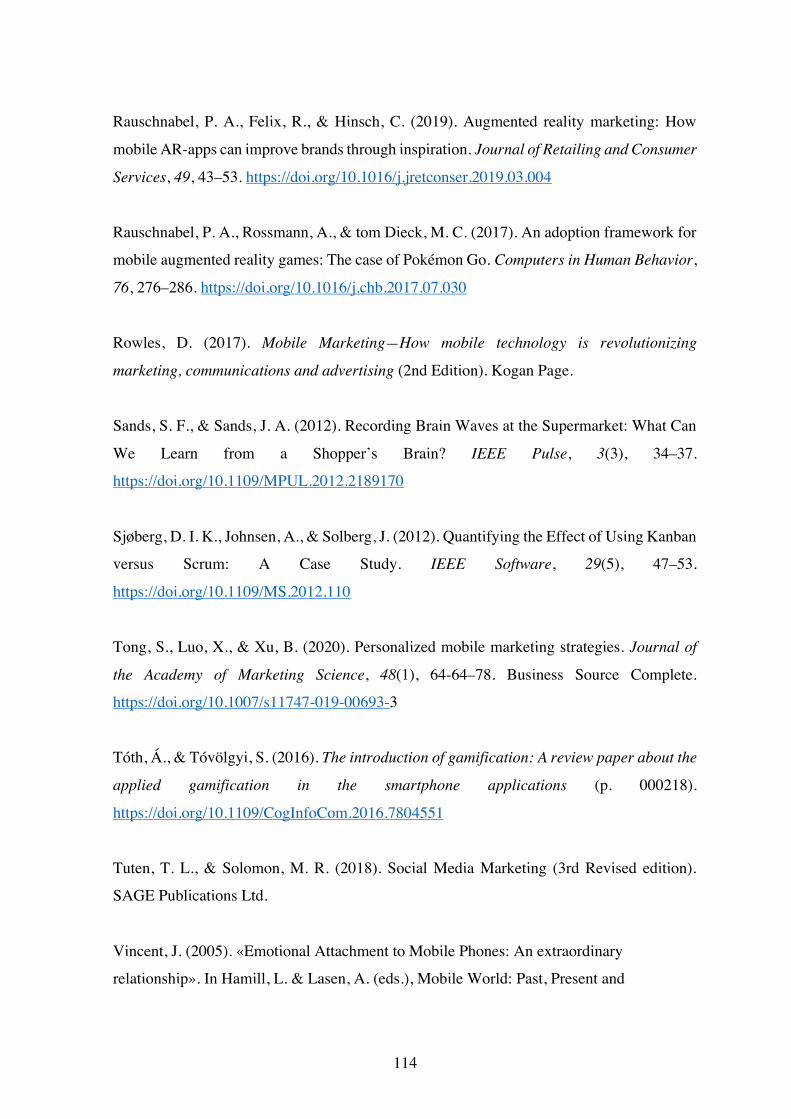
114
Rauschnabel, P. A., Felix, R., & Hinsch, C. (2019). Augmented reality marketing: How
mobile AR-apps can improve brands through inspiration. Journal of Retailing and Consumer
Services, 49, 43–53. https://doi.org/10.1016/j.jretconser.2019.03.004
Rauschnabel, P. A., Rossmann, A., & tom Dieck, M. C. (2017). An adoption framework for
mobile augmented reality games: The case of Pokémon Go. Computers in Human Behavior,
76, 276–286. https://doi.org/10.1016/j.chb.2017.07.030
Rowles, D. (2017). Mobile Marketing—How mobile technology is revolutionizing
marketing, communications and advertising (2nd Edition). Kogan Page.
Sands, S. F., & Sands, J. A. (2012). Recording Brain Waves at the Supermarket: What Can
We Learn from a Shopper’s Brain? IEEE Pulse, 3(3), 34–37.
https://doi.org/10.1109/MPUL.2012.2189170
Sjøberg, D. I. K., Johnsen, A., & Solberg, J. (2012). Quantifying the Effect of Using Kanban
versus Scrum: A Case Study. IEEE Software, 29(5), 47–53.
https://doi.org/10.1109/MS.2012.110
Tong, S., Luo, X., & Xu, B. (2020). Personalized mobile marketing strategies. Journal of
the Academy of Marketing Science, 48(1), 64-64–78. Business Source Complete.
https://doi.org/10.1007/s11747-019-00693-3
Tóth, Á., & Tóvölgyi, S. (2016). The introduction of gamification: A review paper about the
applied gamification in the smartphone applications (p. 000218).
https://doi.org/10.1109/CogInfoCom.2016.7804551
Tuten, T. L., & Solomon, M. R. (2018). Social Media Marketing (3rd Revised edition).
SAGE Publications Ltd.
Vincent, J. (2005). «Emotional Attachment to Mobile Phones: An extraordinary
relationship». In Hamill, L. & Lasen, A. (eds.), Mobile World: Past, Present and
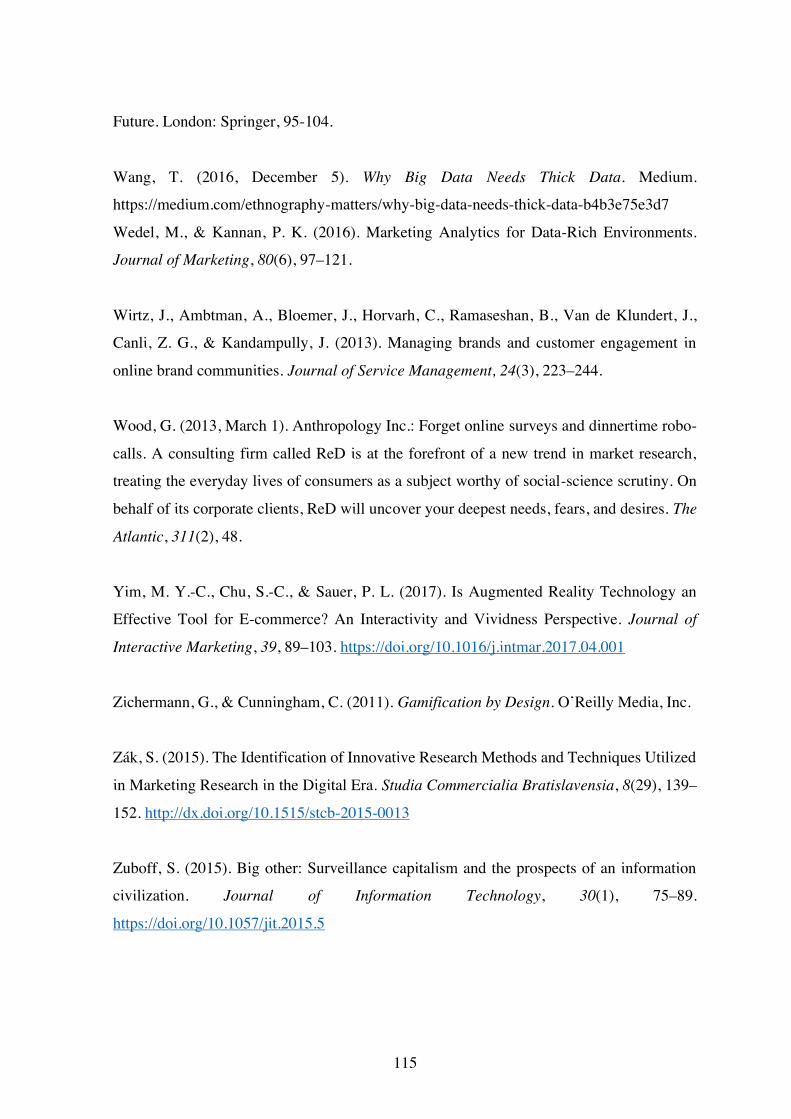
115
Future. London: Springer, 95-104.
Wang, T. (2016, December 5). Why Big Data Needs Thick Data. Medium.
https://medium.com/ethnography-matters/why-big-data-needs-thick-data-b4b3e75e3d7
Wedel, M., & Kannan, P. K. (2016). Marketing Analytics for Data-Rich Environments.
Journal of Marketing, 80(6), 97–121.
Wirtz, J., Ambtman, A., Bloemer, J., Horvarh, C., Ramaseshan, B., Van de Klundert, J.,
Canli, Z. G., & Kandampully, J. (2013). Managing brands and customer engagement in
online brand communities. Journal of Service Management, 24(3), 223–244.
Wood, G. (2013, March 1). Anthropology Inc.: Forget online surveys and dinnertime robo-
calls. A consulting firm called ReD is at the forefront of a new trend in market research,
treating the everyday lives of consumers as a subject worthy of social-science scrutiny. On
behalf of its corporate clients, ReD will uncover your deepest needs, fears, and desires. The
Atlantic, 311(2), 48.
Yim, M. Y.-C., Chu, S.-C., & Sauer, P. L. (2017). Is Augmented Reality Technology an
Effective Tool for E-commerce? An Interactivity and Vividness Perspective. Journal of
Interactive Marketing, 39, 89–103. https://doi.org/10.1016/j.intmar.2017.04.001
Zichermann, G., & Cunningham, C. (2011). Gamification by Design. O’Reilly Media, Inc.
Zák, S. (2015). The Identification of Innovative Research Methods and Techniques Utilized
in Marketing Research in the Digital Era. Studia Commercialia Bratislavensia, 8(29), 139–
152. http://dx.doi.org/10.1515/stcb-2015-0013
Zuboff, S. (2015). Big other: Surveillance capitalism and the prospects of an information
civilization. Journal of Information Technology, 30(1), 75–89.
https://doi.org/10.1057/jit.2015.5

116
Zuboff, S. (2018). The age of surveillance capitalism: The fight for a human future at the
new frontier of power (Profile Books Ltd, Ed.; Vol. 129, Issue 5, p. 1515).
https://doi.org/10.1093/sf/soz037
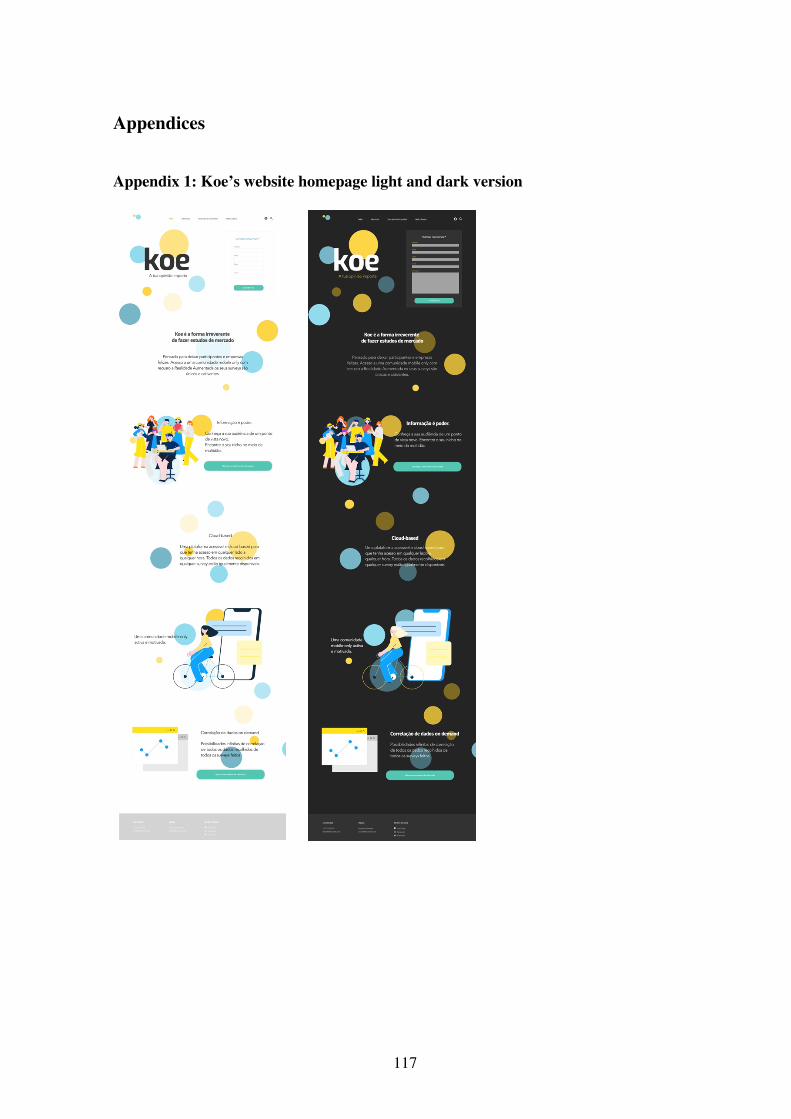
117
Appendices
Appendix 1: Koe’s website homepage light and dark version
118
Appendix 2: Koe’s desktop platform login
Appendix 3: Koe’s desktop platform dashboard
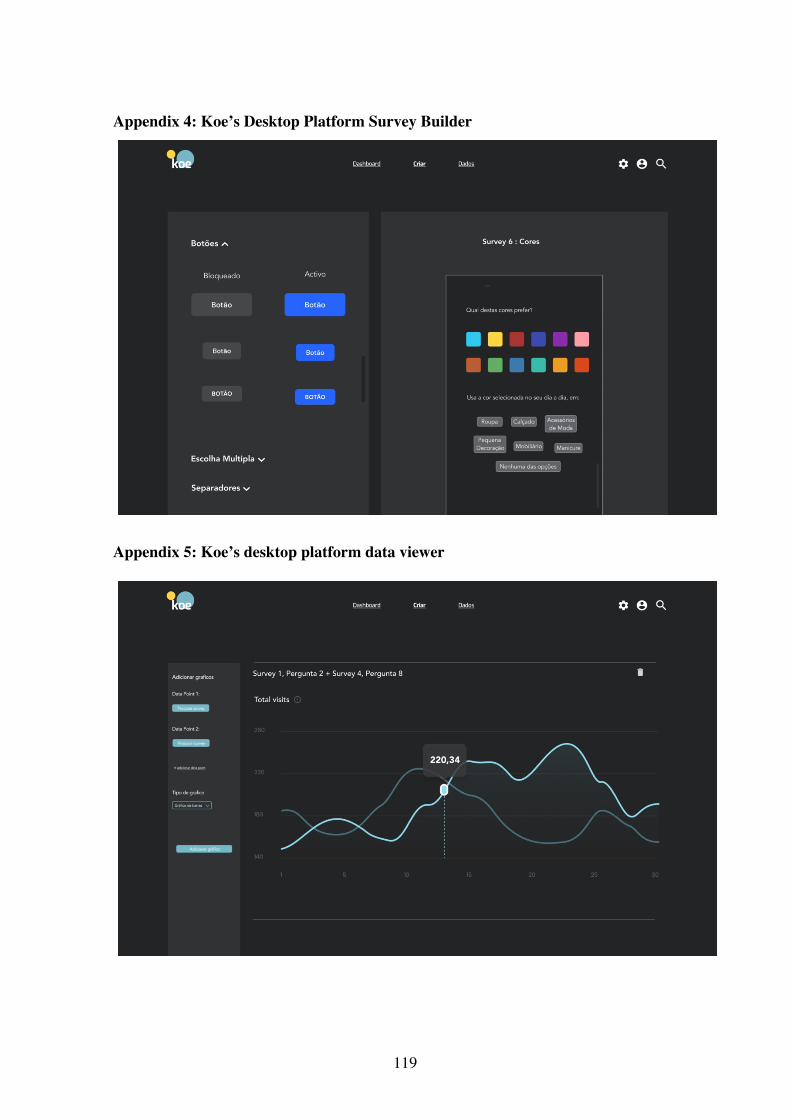
119
Appendix 4: Koe’s Desktop Platform Survey Builder
Appendix 5: Koe’s desktop platform data viewer
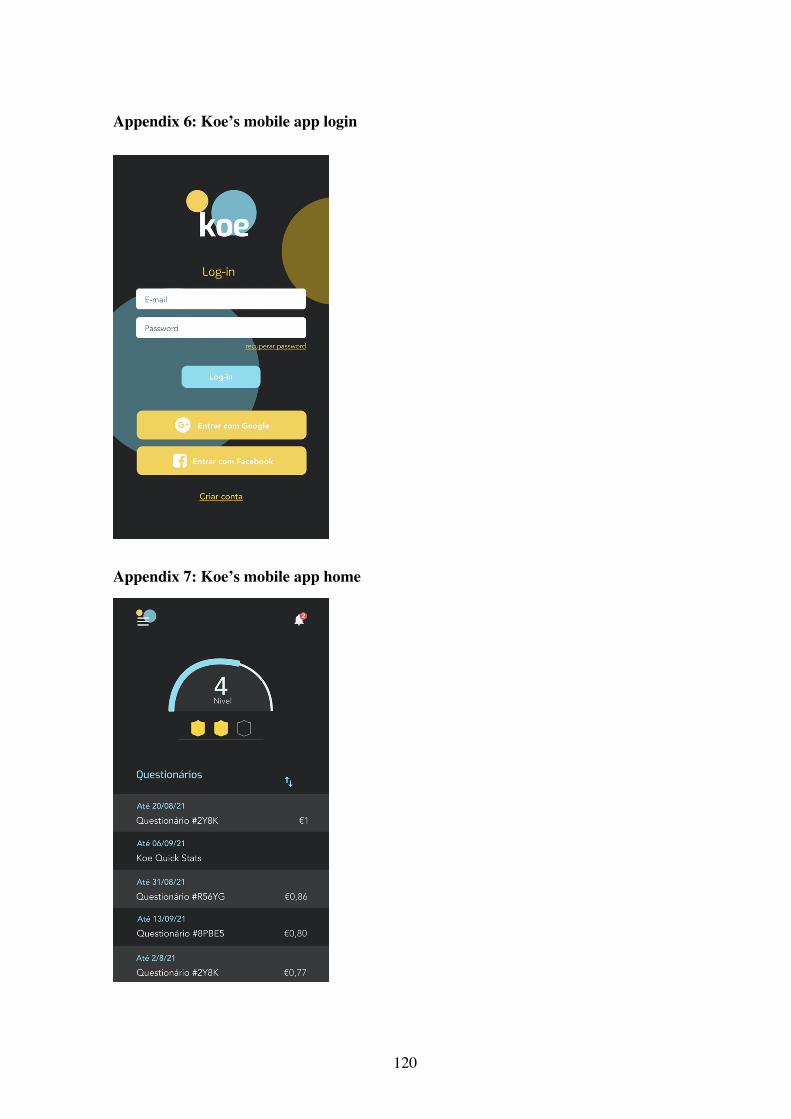
120
Appendix 6: Koe’s mobile app login
Appendix 7: Koe’s mobile app home
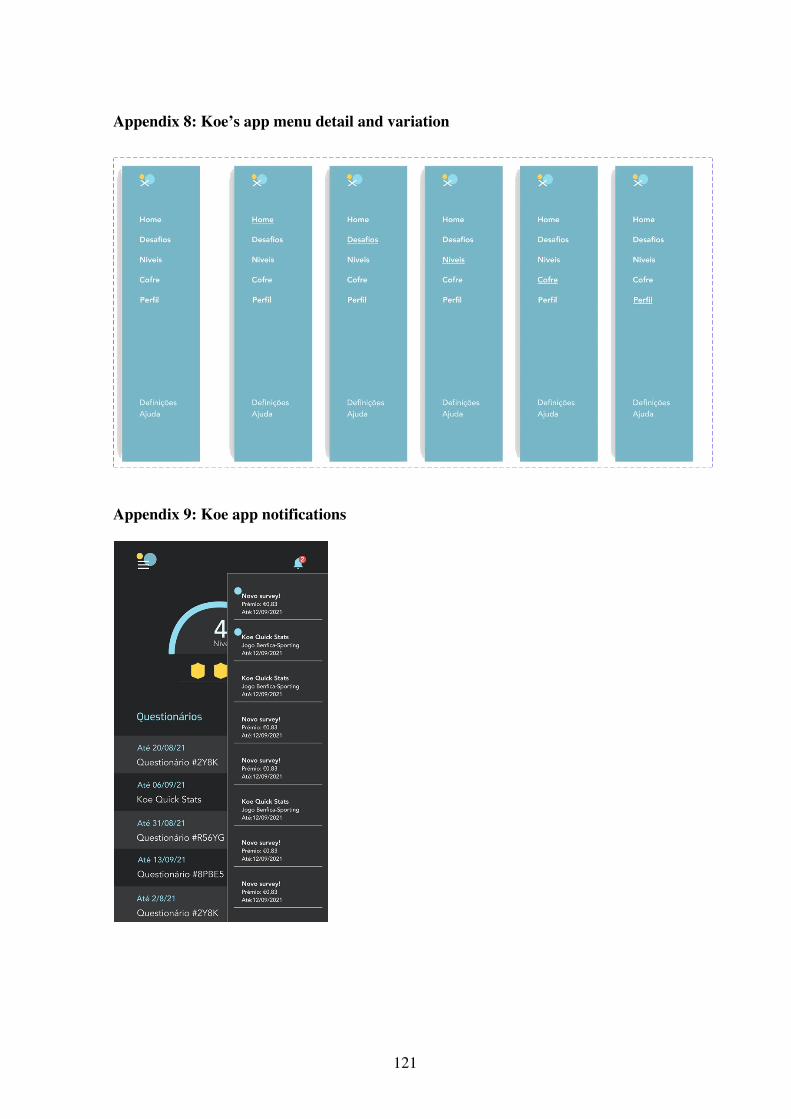
121
Appendix 8: Koe’s app menu detail and variation
Appendix 9: Koe app notifications
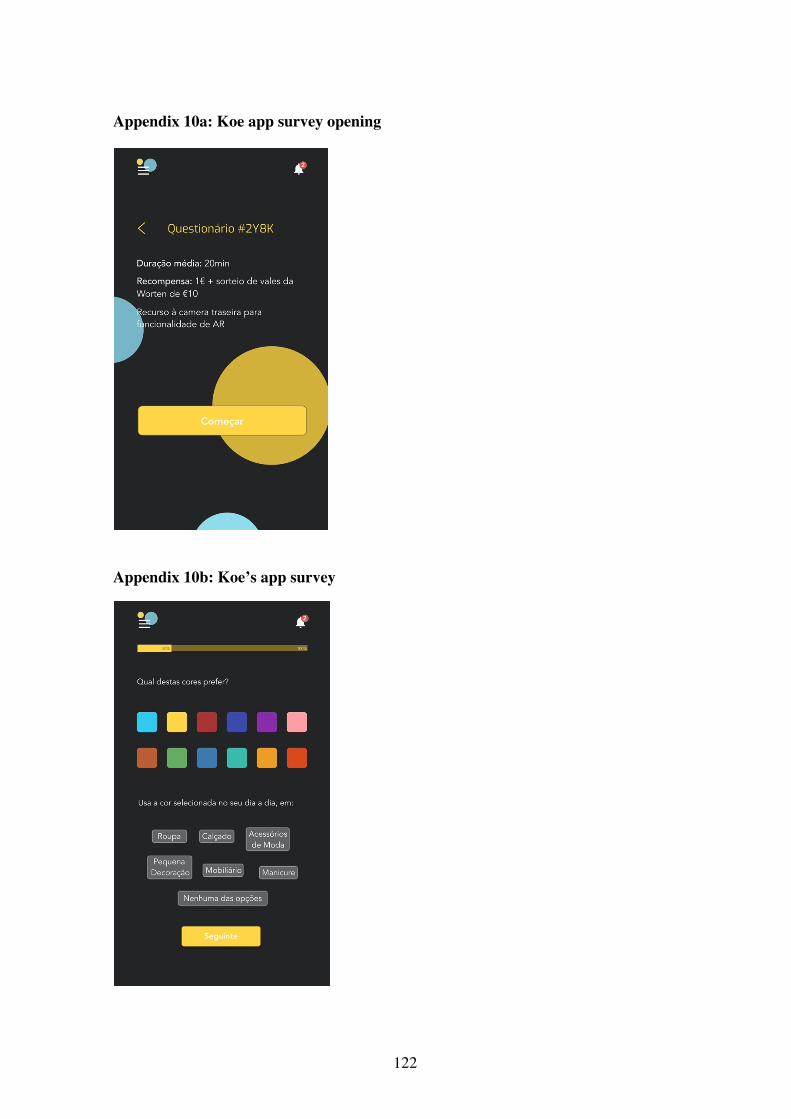
122
Appendix 10a: Koe app survey opening
Appendix 10b: Koe’s app survey

123
Appendix 10c: Koe’s app survey closing
Appendix 11a: Koe’s app Level tasks

124
Appendix 11b: Koe’s app Level ranking
Appendix 12a: Koe app New Challenges
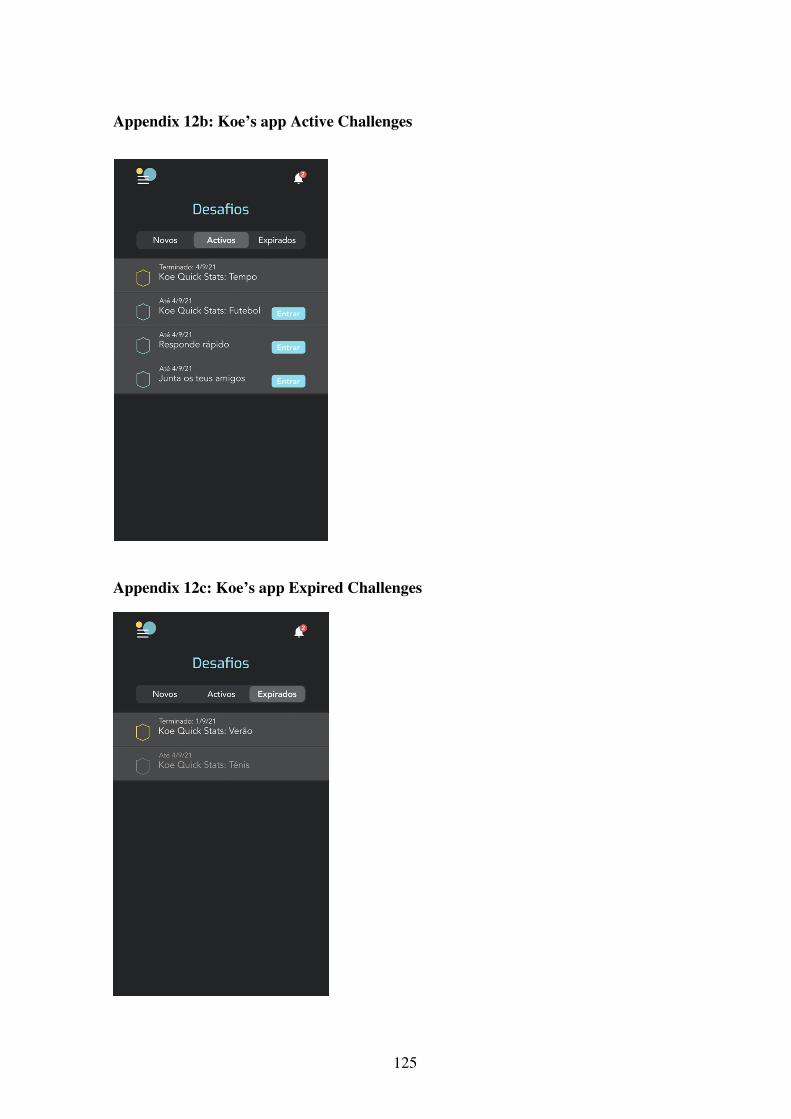
125
Appendix 12b: Koe’s app Active Challenges
Appendix 12c: Koe’s app Expired Challenges
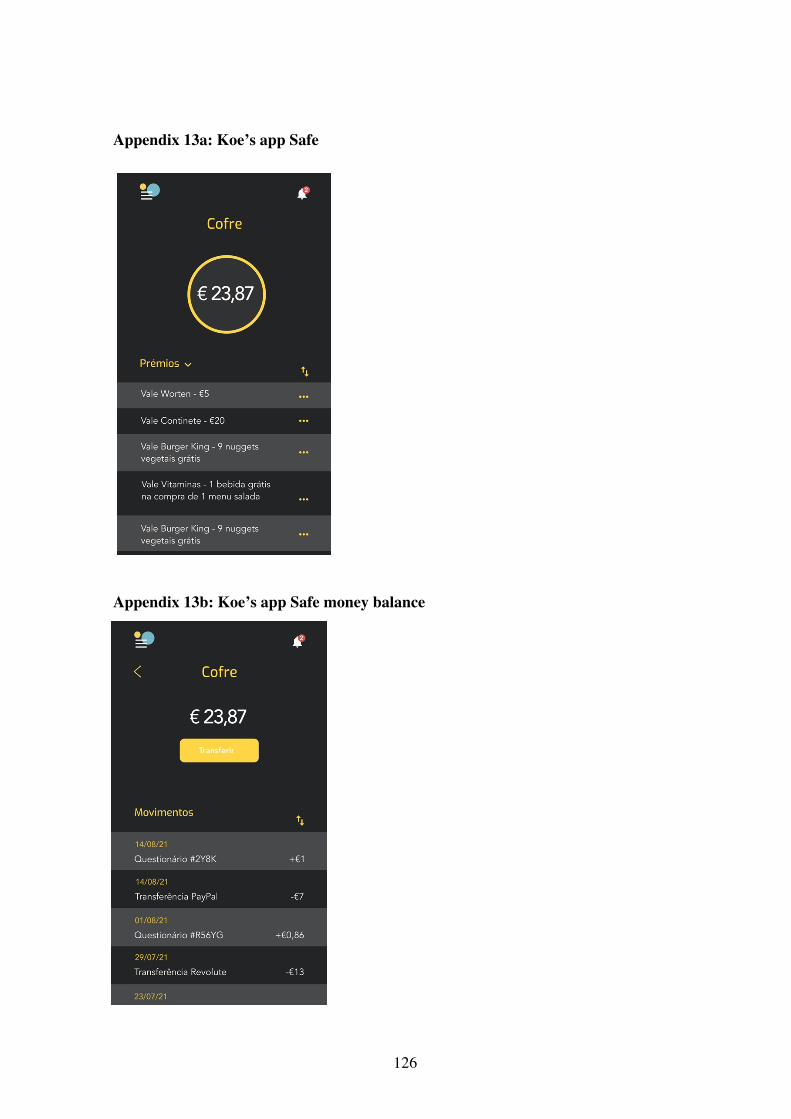
126
Appendix 13a: Koe’s app Safe
Appendix 13b: Koe’s app Safe money balance
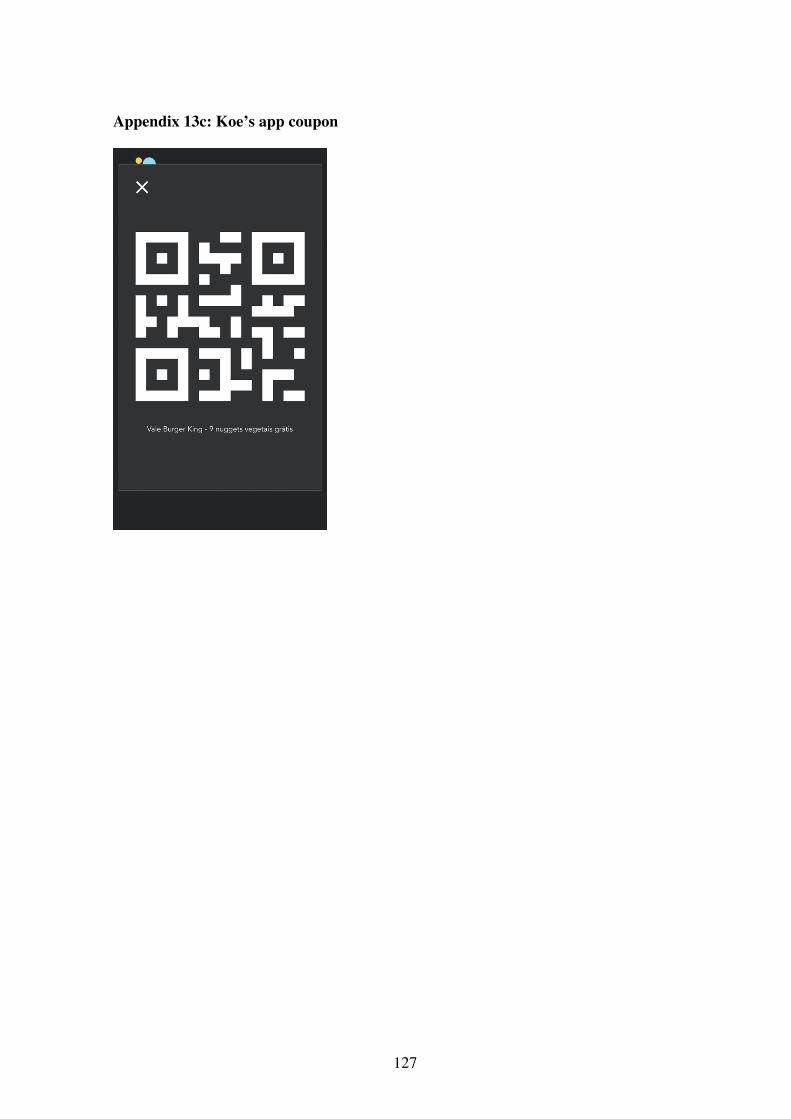
127
Appendix 13c: Koe’s app coupon
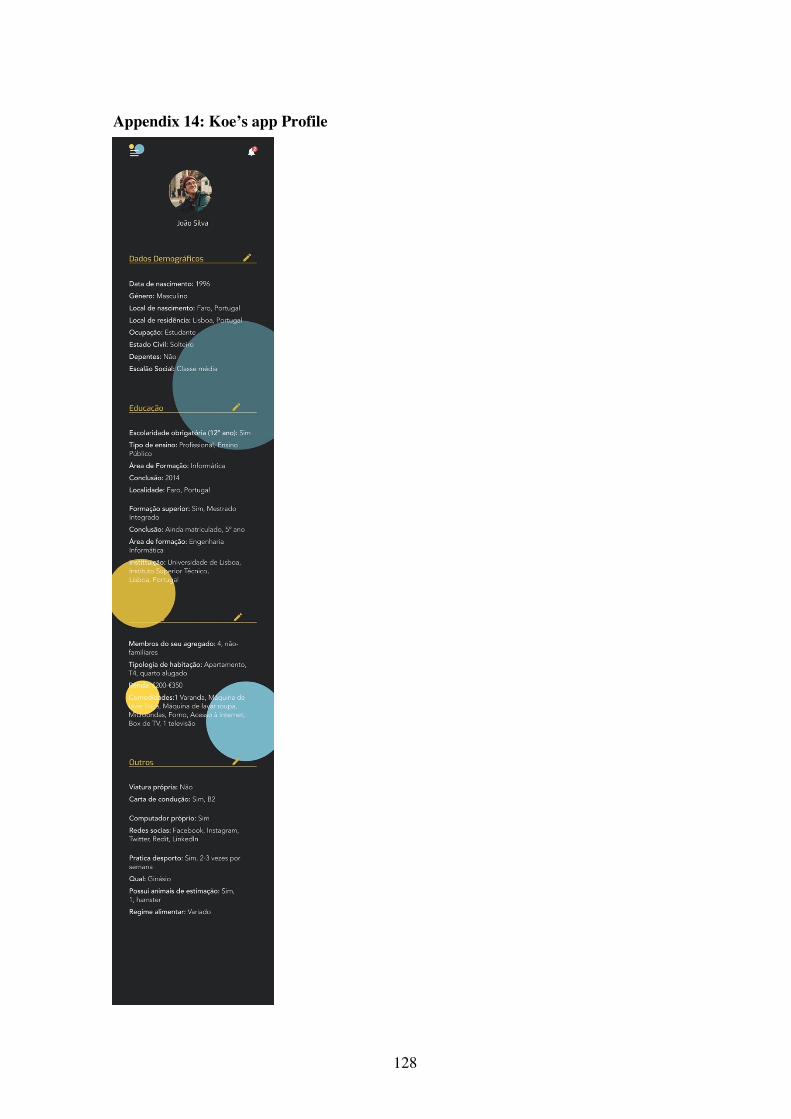
128
Appendix 14: Koe’s app Profile
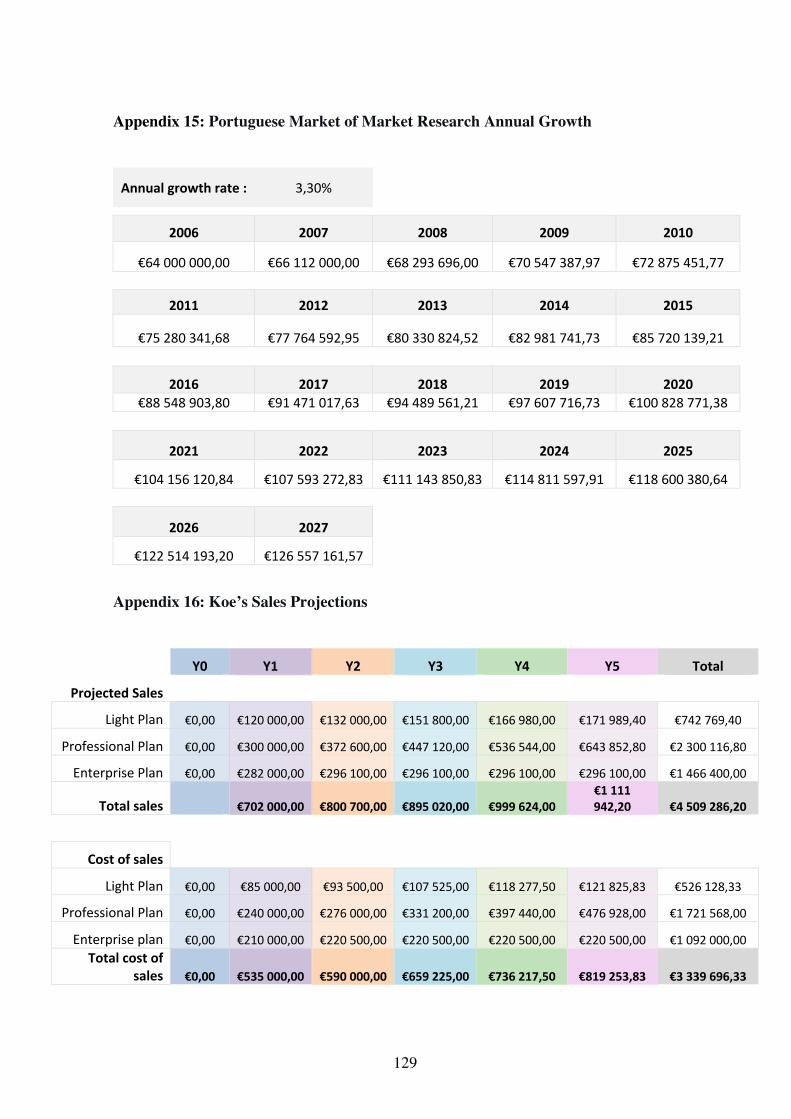
129
Appendix 15: Portuguese Market of Market Research Annual Growth
Annual growth rate : 3,30%
2006 2007 2008 2009 2010
€64 000 000,00 €66 112 000,00 €68 293 696,00 €70 547 387,97 €72 875 451,77
2011 2012 2013 2014 2015
€75 280 341,68 €77 764 592,95 €80 330 824,52 €82 981 741,73 €85 720 139,21
2016 2017 2018 2019 2020 €88 548 903,80 €91 471 017,63 €94 489 561,21 €97 607 716,73 €100 828 771,38
2021 2022 2023 2024 2025
€104 156 120,84 €107 593 272,83 €111 143 850,83 €114 811 597,91 €118 600 380,64
2026 2027
€122 514 193,20 €126 557 161,57
Appendix 16: Koe’s Sales Projections
Y0 Y1 Y2 Y3 Y4 Y5 Total
Projected Sales
Light Plan €0,00 €120 000,00 €132 000,00 €151 800,00 €166 980,00 €171 989,40 €742 769,40
Professional Plan €0,00 €300 000,00 €372 600,00 €447 120,00 €536 544,00 €643 852,80 €2 300 116,80
Enterprise Plan €0,00 €282 000,00 €296 100,00 €296 100,00 €296 100,00 €296 100,00 €1 466 400,00
Total sales €702 000,00 €800 700,00 €895 020,00 €999 624,00 €1 111 942,20 €4 509 286,20
Cost of sales
Light Plan €0,00 €85 000,00 €93 500,00 €107 525,00 €118 277,50 €121 825,83 €526 128,33
Professional Plan €0,00 €240 000,00 €276 000,00 €331 200,00 €397 440,00 €476 928,00 €1 721 568,00
Enterprise plan €0,00 €210 000,00 €220 500,00 €220 500,00 €220 500,00 €220 500,00 €1 092 000,00 Total cost of
sales €0,00 €535 000,00 €590 000,00 €659 225,00 €736 217,50 €819 253,83 €3 339 696,33
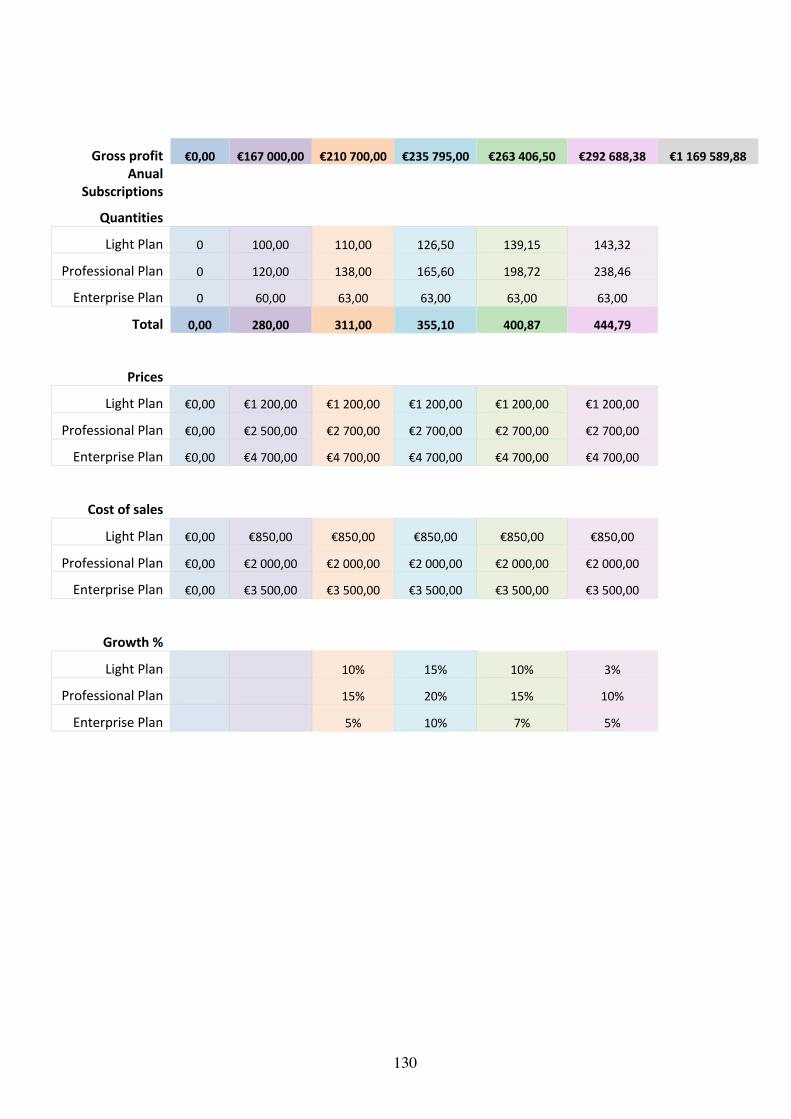
130
Gross profit €0,00 €167 000,00 €210 700,00 €235 795,00 €263 406,50 €292 688,38 €1 169 589,88
Anual Subscriptions
Quantities
Light Plan 0 100,00 110,00 126,50 139,15 143,32
Professional Plan 0 120,00 138,00 165,60 198,72 238,46
Enterprise Plan 0 60,00 63,00 63,00 63,00 63,00
Total 0,00 280,00 311,00 355,10 400,87 444,79
Prices
Light Plan €0,00 €1 200,00 €1 200,00 €1 200,00 €1 200,00 €1 200,00
Professional Plan €0,00 €2 500,00 €2 700,00 €2 700,00 €2 700,00 €2 700,00
Enterprise Plan €0,00 €4 700,00 €4 700,00 €4 700,00 €4 700,00 €4 700,00
Cost of sales
Light Plan €0,00 €850,00 €850,00 €850,00 €850,00 €850,00
Professional Plan €0,00 €2 000,00 €2 000,00 €2 000,00 €2 000,00 €2 000,00
Enterprise Plan €0,00 €3 500,00 €3 500,00 €3 500,00 €3 500,00 €3 500,00
Growth %
Light Plan 10% 15% 10% 3%
Professional Plan 15% 20% 15% 10%
Enterprise Plan 5% 10% 7% 5%
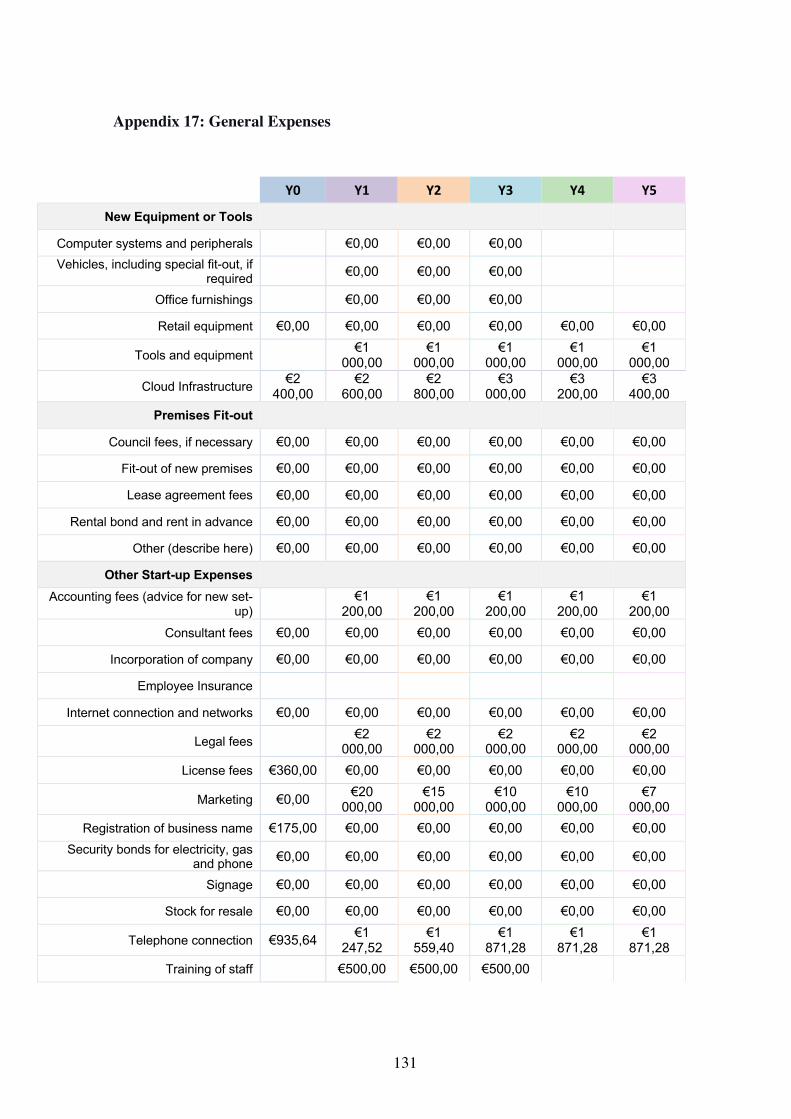
131
Appendix 17: General Expenses
Y0 Y1 Y2 Y3 Y4 Y5 New Equipment or Tools
Computer systems and peripherals €0,00 €0,00 €0,00 Vehicles, including special fit-out, if
required €0,00 €0,00 €0,00
Office furnishings €0,00 €0,00 €0,00 Retail equipment €0,00 €0,00 €0,00 €0,00 €0,00 €0,00
Tools and equipment €1 000,00
€1 000,00
€1 000,00
€1 000,00
€1 000,00
Cloud Infrastructure €2 400,00
€2 600,00
€2 800,00
€3 000,00
€3 200,00
€3 400,00
Premises Fit-out Council fees, if necessary €0,00 €0,00 €0,00 €0,00 €0,00 €0,00
Fit-out of new premises €0,00 €0,00 €0,00 €0,00 €0,00 €0,00 Lease agreement fees €0,00 €0,00 €0,00 €0,00 €0,00 €0,00
Rental bond and rent in advance €0,00 €0,00 €0,00 €0,00 €0,00 €0,00 Other (describe here) €0,00 €0,00 €0,00 €0,00 €0,00 €0,00
Other Start-up Expenses Accounting fees (advice for new set-
up) €1 200,00
€1 200,00
€1 200,00
€1 200,00
€1 200,00
Consultant fees €0,00 €0,00 €0,00 €0,00 €0,00 €0,00 Incorporation of company €0,00 €0,00 €0,00 €0,00 €0,00 €0,00
Employee Insurance Internet connection and networks €0,00 €0,00 €0,00 €0,00 €0,00 €0,00
Legal fees €2 000,00
€2 000,00
€2 000,00
€2 000,00
€2 000,00
License fees €360,00 €0,00 €0,00 €0,00 €0,00 €0,00 Marketing €0,00 €20
000,00 €15
000,00 €10
000,00 €10
000,00 €7
000,00 Registration of business name €175,00 €0,00 €0,00 €0,00 €0,00 €0,00
Security bonds for electricity, gas and phone €0,00 €0,00 €0,00 €0,00 €0,00 €0,00
Signage €0,00 €0,00 €0,00 €0,00 €0,00 €0,00
Stock for resale €0,00 €0,00 €0,00 €0,00 €0,00 €0,00 Telephone connection €935,64 €1
247,52 €1
559,40 €1
871,28 €1
871,28 €1
871,28 Training of staff €500,00 €500,00 €500,00

132
Website domain and E-mail €27,82 €57,86 €57,86 €57,86 €57,86 €57,86 App Stores €108,37 €86,52 €86,52 €86,52 €86,52 €86,52
TOTAL €4 006,83
€28 691,90
€24 203,78
€19 715,66
€19 415,66
€16 615,66 €112 649,49
Appendix 18: Payroll Expenses
Y0
Gross Salary
Social Security
Other Allowences Total
Back-end developer €2 500,00 €593,75 €200,00 €45 512,50
Front-end €1 800,00 €427,50 €200,00 €33 385,00
€78 897,50
Y1
Gross Salary
Social Security
Other Allowences Total
Back-end developer €2 500,00 €593,75 €200,00 €45 512,50
Front-end €1 800,00 €427,50 €200,00 €33 385,00
General manager €2 500,00 €593,75 €200,00 €45 512,50
Sales 1 €1 500,00 €356,25 €200,00 €28 187,50
€152 597,50
Comissions €278,33 €66,10 €4 133,25
€156 730,75
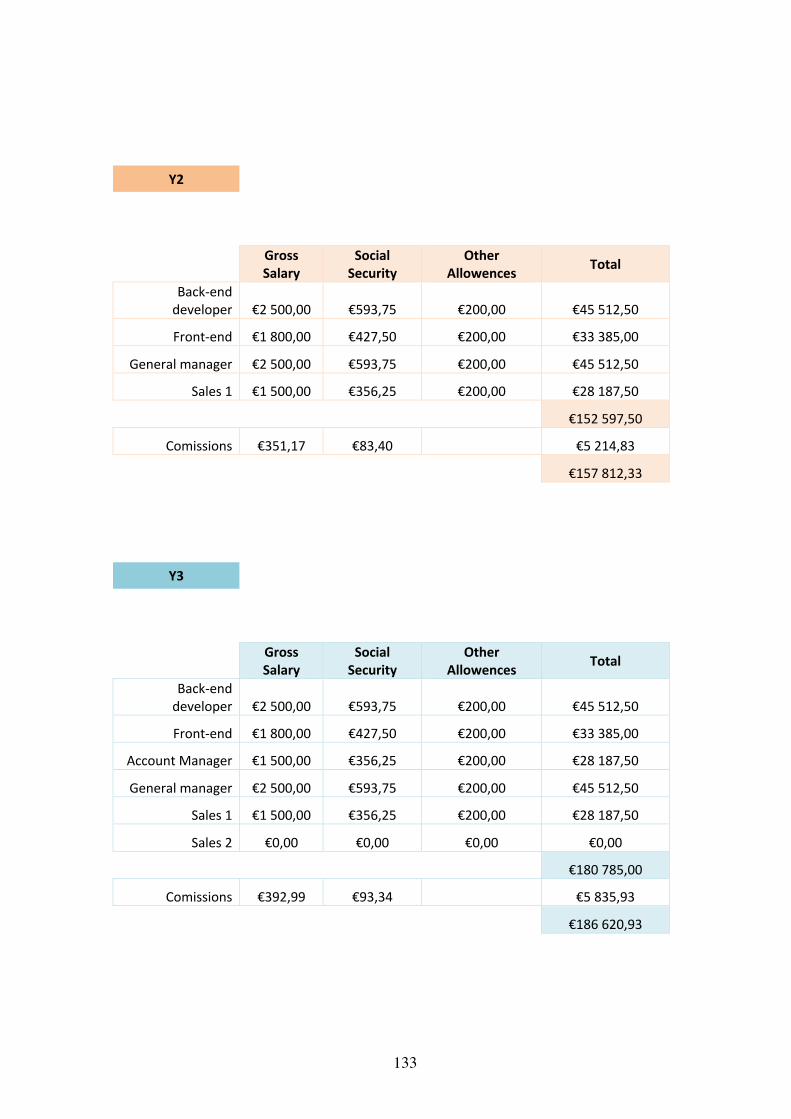
133
Y2
Gross Salary
Social Security
Other Allowences Total
Back-end developer €2 500,00 €593,75 €200,00 €45 512,50
Front-end €1 800,00 €427,50 €200,00 €33 385,00
General manager €2 500,00 €593,75 €200,00 €45 512,50
Sales 1 €1 500,00 €356,25 €200,00 €28 187,50
€152 597,50
Comissions €351,17 €83,40 €5 214,83
€157 812,33
Y3
Gross Salary
Social Security
Other Allowences Total
Back-end developer €2 500,00 €593,75 €200,00 €45 512,50
Front-end €1 800,00 €427,50 €200,00 €33 385,00
Account Manager €1 500,00 €356,25 €200,00 €28 187,50
General manager €2 500,00 €593,75 €200,00 €45 512,50
Sales 1 €1 500,00 €356,25 €200,00 €28 187,50
Sales 2 €0,00 €0,00 €0,00 €0,00
€180 785,00
Comissions €392,99 €93,34 €5 835,93
€186 620,93

134
Y4
Gross Salary
Social Security
Other Allowences Total
Back-end developer €2 500,00 €593,75 €200,00 €45 512,50
Front-end €1 800,00 €427,50 €200,00 €33 385,00
Account Manager €1 500,00 €356,25 €200,00 €28 187,50
General manager €2 500,00 €593,75 €200,00 €45 512,50
Sales 1 €1 500,00 €356,25 €200,00 €28 187,50
Sales 2 €1 500,00 €356,25 €0,00 €25 987,50
€206 772,50
Comissions €439,01 €104,27 €6 519,31
€213 291,81
Y5
Gross Salary
Social Security
Other Allowences Total
Back-end developer €2 500,00 €593,75 €200,00 €45 512,50
Front-end €1 800,00 €427,50 €200,00 €33 385,00
Account Manager €1 500,00 €356,25 €200,00 €28 187,50
General manager €2 500,00 €593,75 €200,00 €45 512,50
Sales 1 €1 500,00 €356,25 €200,00 €28 187,50
Sales 2 €1 500,00 €356,25 €0,00 €25 987,50
€206 772,50
Comissions €439,01 €104,27 €6 519,31
€213 291,81
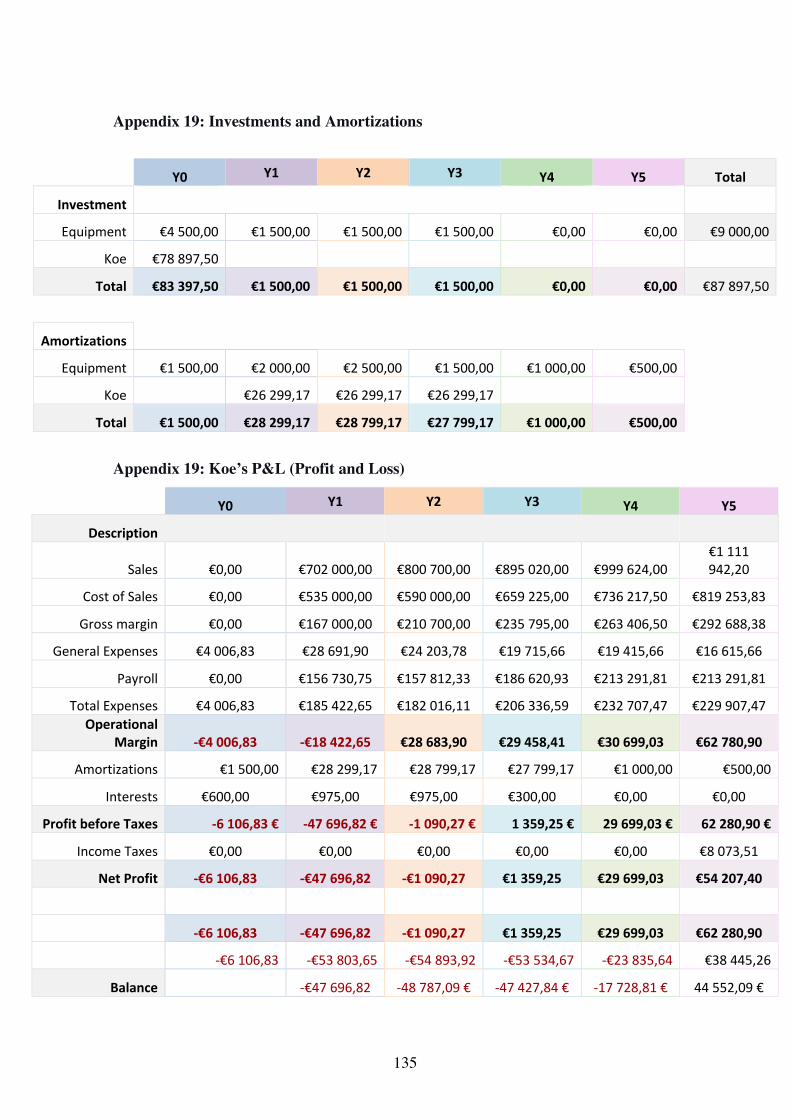
135
Appendix 19: Investments and Amortizations
Y0 Y1 Y2 Y3 Y4 Y5 Total
Investment
Equipment €4 500,00 €1 500,00 €1 500,00 €1 500,00 €0,00 €0,00 €9 000,00
Koe €78 897,50
Total €83 397,50 €1 500,00 €1 500,00 €1 500,00 €0,00 €0,00 €87 897,50
Amortizations
Equipment €1 500,00 €2 000,00 €2 500,00 €1 500,00 €1 000,00 €500,00
Koe €26 299,17 €26 299,17 €26 299,17
Total €1 500,00 €28 299,17 €28 799,17 €27 799,17 €1 000,00 €500,00
Appendix 19: Koe’s P&L (Profit and Loss)
Y0 Y1 Y2 Y3 Y4 Y5
Description
Sales €0,00 €702 000,00 €800 700,00 €895 020,00 €999 624,00 €1 111 942,20
Cost of Sales €0,00 €535 000,00 €590 000,00 €659 225,00 €736 217,50 €819 253,83
Gross margin €0,00 €167 000,00 €210 700,00 €235 795,00 €263 406,50 €292 688,38
General Expenses €4 006,83 €28 691,90 €24 203,78 €19 715,66 €19 415,66 €16 615,66
Payroll €0,00 €156 730,75 €157 812,33 €186 620,93 €213 291,81 €213 291,81
Total Expenses €4 006,83 €185 422,65 €182 016,11 €206 336,59 €232 707,47 €229 907,47 Operational
Margin -€4 006,83 -€18 422,65 €28 683,90 €29 458,41 €30 699,03 €62 780,90
Amortizations €1 500,00 €28 299,17 €28 799,17 €27 799,17 €1 000,00 €500,00
Interests €600,00 €975,00 €975,00 €300,00 €0,00 €0,00
Profit before Taxes -6 106,83 € -47 696,82 € -1 090,27 € 1 359,25 € 29 699,03 € 62 280,90 €
Income Taxes €0,00 €0,00 €0,00 €0,00 €0,00 €8 073,51
Net Profit -€6 106,83 -€47 696,82 -€1 090,27 €1 359,25 €29 699,03 €54 207,40
-€6 106,83 -€47 696,82 -€1 090,27 €1 359,25 €29 699,03 €62 280,90
-€6 106,83 -€53 803,65 -€54 893,92 -€53 534,67 -€23 835,64 €38 445,26
Balance -€47 696,82 -48 787,09 € -47 427,84 € -17 728,81 € 44 552,09 €
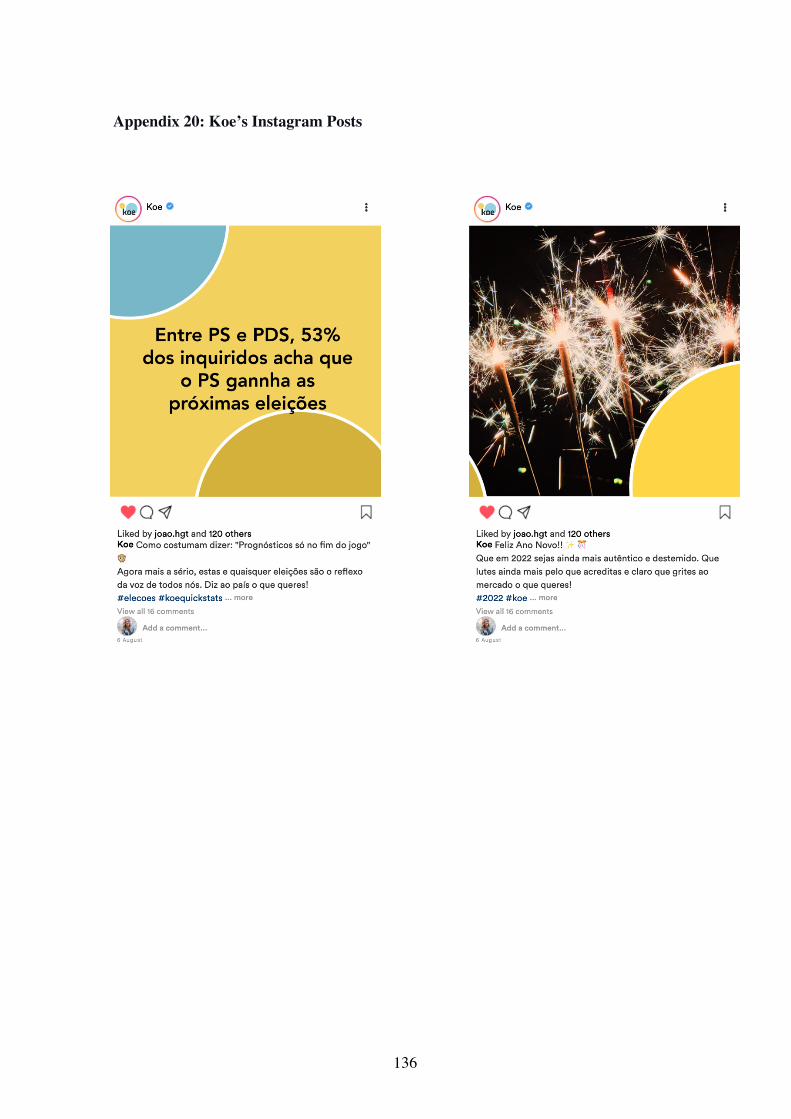
136
Appendix 20: Koe’s Instagram Posts
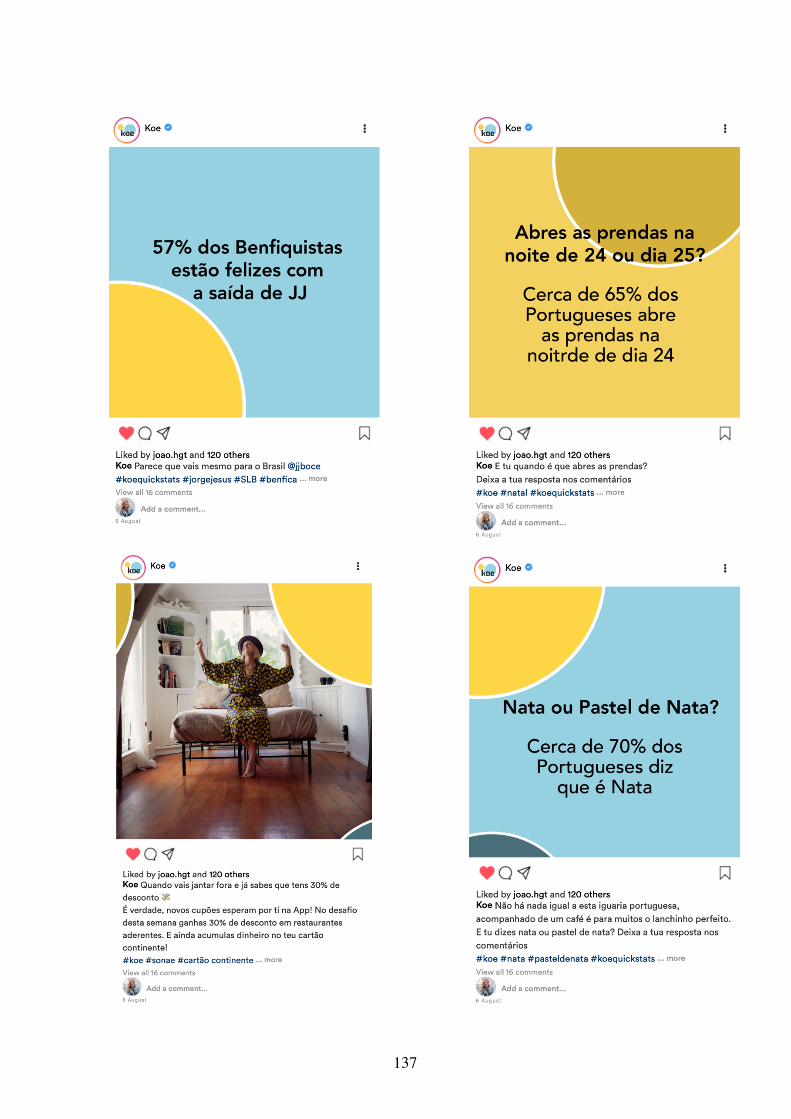
137

138
Appendix 21a: Koe’s Launch Campaign Posters
Appendix 21b: Koe’s Christmas Campaign Posters

139
Copyright © 2022 FDOKUMEN