Agile MPC system linking manufacturing and market strategies
Upload
khangminh22Category
view
1download
0
1
Business strategies of incumbents in the market for electric vehicles: Opportunities and incentives for sustainable innovation Authors: dr. Joeri Wesseling, dr. Eva Niesten, dr. Jan Faber, Prof.dr. Marko Hekkert This paper focuses on the relation between large car manufacturers’ incentive and opportunity to innovate and their Electric Vehicle (EV) business strategies. We analyze how environmental regulation and the firm’s incentive (measured by net income) and opportunity to innovate (measured by EV asset position, determined from a combination of patent, partnership and prototype data) affect EV sales over the period 1990-2011. During the EV’s R&D period in the 1990s, large car manufacturers that were regulated by the full Zero Emission Vehicle mandate developed a significantly stronger EV asset position, but did not sell significantly more EVs than their rivals. During the EV’s commercialization period (2007-2011), large car manufacturers with both a strong incentive and a strong opportunity to innovate sold significantly more EVs. Based on these results, the paper offers a typology of business strategies, several managerial implications and recommendations for policy makers to stimulate sustainable development. Keywords: ‘Business strategy’; ‘electric vehicle’; ‘sustainable development’; ‘incumbents’; ‘radical innovation’; ‘environmental policy’ 1. Introduction Electric Vehicles (EVs) are an important technological solution to our unsustainable mobility system. The EV constitutes a radical innovation that completely differs from the established Internal Combustion Engine Vehicle (ICEV) (Bakker et al., 2012a). Radical innovations build on a completely new technology (Tushman and Anderson, 1986) and tend to be competence-destroying for incumbents, because these innovations require radically different skills when compared to the established technology (Henderson and Clark, 1990). The competence-destroying nature of radical innovations has led several scholars to conclude that incumbents are inhibited from pursuing radical innovations (e.g. Ahuja and Lampert, 2001; Christensen, 1997; Henderson, 1993; Nelson and Winter, 1982; Schaltegger and Wagner, 2011), while others have argued that some incumbents do have an opportunity to radically innovate (e.g. Chandy and Tellis, 2000). In this study we aim to determine why some incumbent car manufacturers do radically innovate in the field of EVs, and others do not. The literature on incumbents and innovation has analyzed incumbents as a homogeneous group. We contribute to this literature by studying the differences between incumbents in their decision to pursue radical and sustainable innovations. For a large car manufacturer to exploit an innovation as the EV, it needs both an incentive and an opportunity to innovate (Swann, 2009). The incentive to innovate refers to the incentive of firms to enhance their competitiveness and increase their market share by introducing innovations (Swann, 2009: 218). The opportunity to innovate refers to the investments a firm can make to support innovation (Swann, 2009). Firms reveal their opportunity to innovate by the amount of assets they have
2
built up in a particular technology (Lieberman and Montgomery, 1998; Silverman, 1999). The literature suggests that incumbents may have an opportunity to innovate (Chandy and Tellis, 2000), i.e. the assets necessary to exploit an innovation, but not the incentive, because they do not want to cannibalize on their own profitable products that are built on the existing technology (Ali, 1994; Chandy and Tellis, 1998; Reinganum, 1983). In recent history, the EV experienced several periods of increased interest by large car manufacturers, triggered by factors such as regulation, competition and technological development (Mom, 2004; Wesseling et al., in press; Kemp, 2005). In the 1990s, regulations were implemented that triggered large car manufacturers to develop more sustainable vehicles. The Californian Air Resources Board’s (CARB) introduction of the Zero Emission Vehicle (ZEV) mandate in 1990 is an important piece of legislation in this respect. Since 2007 several large car manufacturers have pursued the commercialization of the EV, driven by new technological developments (Wesseling et al., in press). In this study we aim to gain more insight in what drives incumbent car manufacturers to radically innovate in the EV market. We pose the following research question: ‘How did the incentive and opportunity to innovate affect large car manufacturers’ decision to mass market EVs over the period 1990-2011?’. We measure the incentive and opportunity to innovate by using a comprehensive set of data on, respectively, the profitability of car manufacturers in the ICEV regime, and on patents, prototypes and partnerships as proxies for the asset position of incumbent car manufacturers. We use this data in combination with data on EV sales, to analyze the impact of incentive and opportunity to innovate on incumbents’ decision to mass market EVs. We focus our study on the timeframe 1990-2011 to compare the incentive and opportunity to innovate over different periods of EV interest. On the basis of our quantitative analyses and using this timeframe, we identify three different types of business strategies of the large car manufacturers, i.e. the first mover, quick follower and laggard strategies. In our typology of business strategies, we show how these strategies are determined by the firms’ incentive and opportunity to innovate. The paper is structured as follows. In the following section, we formulate hypotheses on car manufacturers’ incentive and opportunity to innovate, and discuss the literature on business strategies. In the section on methods, we discuss the operationalization of our concepts and the data collection and analysis. The section on results presents our findings resulting from a series of nonparametric tests to study our hypotheses, and a more qualitative analysis of large car manufacturers’ business strategies. The two final sections offer a conclusion and present some limitations and suggestions for future research. Theoretical framework In this section, we argue that a firm requires both an incentive and an opportunity to radically innovate, and stress that the incentive and opportunity to innovate determine the business strategy of the firm, be it a first mover, quick follower or laggard strategy (Freeman and Soete, 1997; Lieberman and Montgomery, 1998). We
3
also discuss how car manufacturers’ business strategies can be affected differently by the market and regulatory developments that took place throughout the timeframe of this study. The incentive and opportunity to radically innovate The incentive to innovate refers to the incentive of firms to enhance their competitiveness and market share by introducing innovations (Swann, 2009: 218). Profitable firms with a strong competitive position in the established technology have less incentive to radically innovate (Chandy and Tellis, 2000), as radical and competence-destroying innovations endanger their competitive positions in the established technology (Tushman and Anderson, 1986). However, for firms with inferior competitive positions, radical innovation may be a means to escape their income-restraining situation in the existing market (Swann, 2009; Mensch, 1979; Barley, 1986). We expect that firms with a stronger incentive to innovate (i.e. less profitable firms), will introduce more EVs into the market. According to Swann (2009), an opportunity to innovate depends on the financial possibilities of a firm to invest in innovation, and can be measured by a firm’s capital available for investments in R&D. However, before firms are able to introduce an innovation into the market, they need to invest capital in assets that facilitate the development of an innovative technology. In line with the resource-based view of the firm, we therefore consider the assets of a firm as a more direct measure of the firm’s opportunity to innovate (e.g. Silverman, 1999). A firm’s opportunity to innovate is determined by its unique and difficult to imitate resources, i.e. its assets that are necessary for the exploitation of the radical innovation (Teece et al., 1997). The aggregate of a firm’s assets is referred to as its asset position, comprising technological, infrastructural, complementary and reputational assets. Technological assets entail protected knowledge necessary for the development and application of an innovation (Pavitt, 1998), e.g. EV specific knowledge. Infrastructural assets refer to the technologies necessary for infrastructure-dependent innovations to operate profitably (Teece, 2006), e.g. an EV’s charging infrastructure (Egbue and Long, 2012). Complementary assets are crucial to profit from innovations and include, for example, distribution channels, marketing and manufacturing facilities (Pinkse and Kolk 2010; Rothaermel, 2001). Finally, reputational assets result from the company’s alignment with existing norms and values, which forms customers’ perception of the company, especially their brand experience (Teece et al., 1997). The strategic importance of these four assets has been acknowledged in the field of EVs for technological assets (Wesseling et al., in press; Van Den Hoed, 2005), infrastructural assets (Egbue and Long, 2012; Pohl and Yarime, 2012), complementary assets (Dyerson and Pilkington, 2005) and reputational assets (Bakker, 2010). We expect that firms with a stronger opportunity to innovate, (i.e. firms with a greater EV-related asset position), will introduce more EVs into the market. Business strategies The business strategy of a firm dictates how the firm intends to exploit a radical innovation; a firm may employ different business strategies for different innovations
4
(Freeman and Soete, 1997; Lieberman and Montgomery, 1998; Teece et al., 1997). In the literature on business strategies, a distinction is made between three types of business strategies: first movers, quick followers and laggards (Robinson and Chiang, 2002). First movers intend to become mass-market pioneers and subsequently stay ahead of competitors through technological lead-time (Freeman and Soete, 1997; Golder and Tellis, 1993). Firms with a quick follower strategy leave the decision of exploiting a radical innovation open, until a first mover goes to the market. Quick followers attempt to avoid the costly mistakes made by first movers and quickly follow them onto the market (Freeman and Soete, 1997; Lieberman and Montgomery, 1998). Laggards are less engaged in innovative activities and attempt to acquire rents from reducing overall costs by minimizing R&D. They enter the market last (Freeman and Soete, 1997; Jovanovic and MacDonald, 1994). Relating these three business strategies to the concepts of incentive and opportunity to innovate and to the case of EVs, we expect firms with a strong incentive and a strong opportunity to radically innovate to adopt a first mover EV strategy as these firms are most willing and able to bear the costs and risks of pioneering the radical innovation and its necessary infrastructure. Firms with some incentive and opportunity to innovate are likely to employ a quick follower strategy, as they may not be willing or able to pioneer the innovation, but do not want to fall behind on their more innovative rivals. Firms with little incentive and/or little opportunity to innovate are expected to employ a laggard strategy, as they are not willing and/or not able to introduce the radical innovation into the market. External impacts on strategies The incentives and opportunities of firms to innovate, and their business strategies, may be influenced by factors external to the firm. Firms operate in a system of regulatory, market and technological components that changes over time and influences the business strategies of firms (Hekkert et al., 2007). Especially in the field of EVs, significant regulatory, market and technological developments have taken place over the period 1990-2011 (Magnusson and Berggren, 2011; Wells and Nieuwenhuis, 2012; Wesseling et al., in press). During the 1990s, EV developments were especially stimulated by regulatory developments, as substantial consumer demand for EVs was lacking (Collantes and Sperling, 2008) and technological hurdles needed to be overcome (Dyerson and Pilkington, 2005). The most influential policy was a technology-forcing, ‘command and control’ (Prakash and Kollman, 2004) regulation called the Zero Emission Vehicle (ZEV) mandate, introduced by the Californian Air Resources Board (CARB) in 1990 (Collantes and Sperling, 2008; Hoogma, 2000; Kemp, 2005). The regulation mandated a stepwise increase in sales of EVs over the period 1998-2003 (CARB, 1990). This mandate fully applied to car manufacturers that sold more than 35,000 vehicles in California per year and included Chrysler, Ford, General Motors, Honda, Mazda, Nissan, and Toyota (Collantes and Sperling, 2008). However, in 1996 oil companies and car manufacturers lobbied against the continuation of this mandate, resulting in relaxation and extension of the mandated targets (Hoogma, 2000). Because of this decrease in regulatory pressure, car manufacturers lost interest in EVs and started to refocus on HEVs and HFCVs (Dijk and Yarime, 2010; Wesseling et al., in press). Technological and market uncertainty prevented car manufacturers from exploiting
5
EVs more extensively during the 1990s (Dyerson and Pilkington, 2005). Because EV developments during the 1990s were primarily triggered by the ZEV mandate, we formulate the following hypothesis: Hypothesis 1: Large car manufacturers that fell under the full ZEV mandate will have a) developed a stronger opportunity to innovate and b) will have marketed more EVs during the 1990s than large car manufacturers that did not fall under this mandate. In the late 2000s, car manufacturers regained interest in the EV (Wesseling et al., in press). During this period car manufacturers were not triggered by stringent technology-push regulation. Instead, car manufacturers saw market opportunities emerge for the EV (Magnusson and Berggren, 2011). These opportunities emerged because technological hurdles like battery costs (Gärling and Thøgersen, 2001) were partly overcome due to developments in other sectors (Magnusson and Berggren, 2011). Furthermore, tax rebates for consumers supported the adoption of EVs (Magnusson and Berggren, 2011; Sierzchula et al., 2012b). The fact that EVs became an emerging market opportunity in the late 2000s implies that large car manufacturers may now attempt to exploit the commercialization of EVs, and especially car manufacturers with an incentive and opportunity to innovate. We formulate the second hypothesis as follows: Hypothesis 2: Large car manufacturers that have a stronger incentive and opportunity to innovate will have marketed more EVs than their competitors during the early stage of EV commercialization. Methods In this section, we discuss the research design, operationalization, data collection and analysis. Research design and operationalization Technological development of low emission vehicles has been studied using indicators like patent applications, prototypes, production models and partnerships (Bakker, 2010; Bakker et al., 2012b; Frenken et al., 2004; Sierzchula et al., 2012a; Wesseling et al., in press). So far, however, no research has yet attempted to combine these different indicators. In this paper, we use a combination of indicators, presented in table 1, which enabled us to study more comprehensively the differences in incentive and opportunity to innovate and in the EV business strategies of large car manufacturers. Our analysis focuses on the period 1990-2011, because 1990 marks the start of a period of renewed interest in the EV, caused by the CARB’s ZEV mandate (Hoogma, 2000). We define large car manufacturers as car manufacturers producing more than a million personal vehicles in the year 2011. In 2010 and 2011, the same fifteen car manufacturers fit this definition (OICA, 2011; OICA, 2012). We study each of these firms, meaning that our research sample matches our research population. These firms accounted for 84.4% of all personal vehicle sales in 2011, and include Toyota, Volkswagen, General Motors, Hyundai, Honda, PSA, Nissan, Ford, Suzuki, Renault, Fiat, BMW, Daimler AG, Mazda and Mitsubishi (OICA, 2012).
6
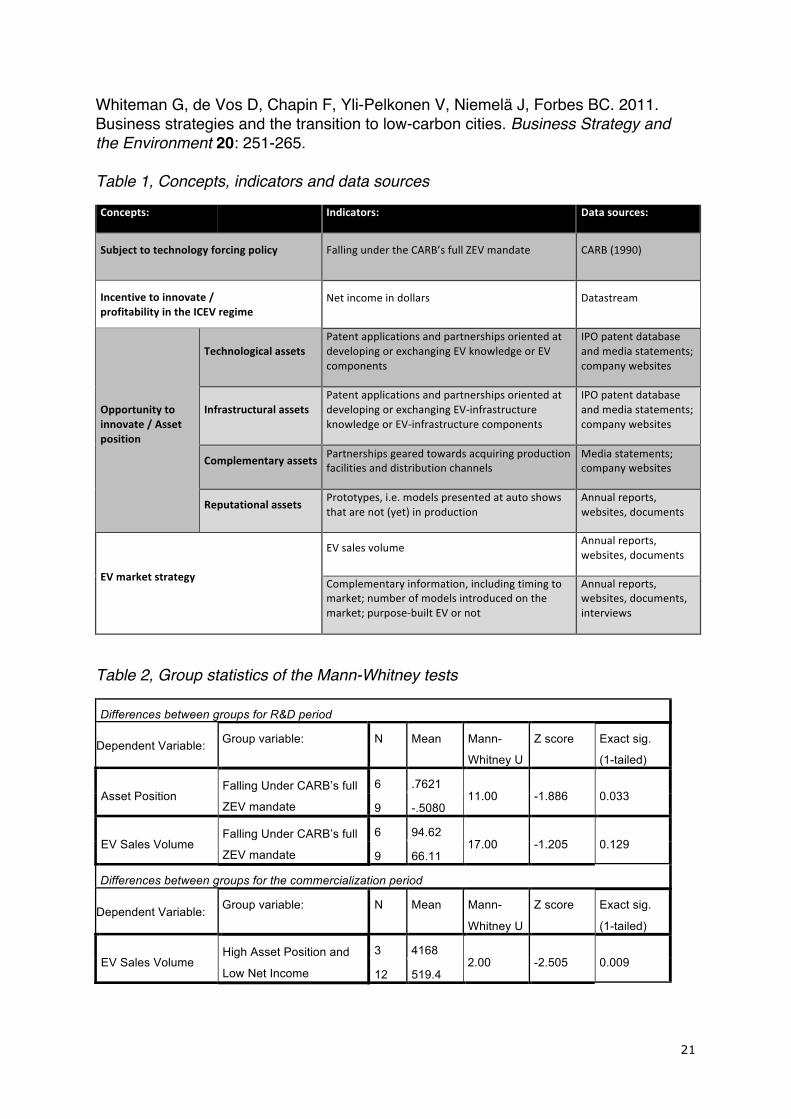
Table 1 displays how each of the concepts, discussed in the previous section, is operationalized into their respective indicators and what sources are employed to retrieve data on these indicators. First, whether a firm was subject to technology forcing policy was measured by whether it fell under the full ZEV mandate. Six of the fifteen car manufacturers fell under this restriction. Second, the incentive to innovate, approached by a firm’s profitability in the ICEV regime was measured by the firm’s net income. ICEVs account for more than 95% of vehicle sales (Pohl and Yarime, 2012) and net income of a firm is therefore considered a good indicator for its profitability in the ICEV regime. Third, the opportunity to innovate, or asset position, is comprised of several types of assets, each with its specific indicators. Technological assets encompass knowledge and components related to the EV itself. They may be developed internally, measured by patents, or externally, measured by partnerships. Infrastructural assets were measured by patent applications and partnerships aimed not at the EV itself, but at its charging infrastructure and compatibility with this infrastructure. Complementary assets were measured by partnerships geared towards acquiring assets that are necessary to exploit an innovation, like production facilities and distribution channels. Reputational assets are measured by prototypes, which are models presented at auto-shows that, at the time of presentation, were not (yet) in production. Prototypes of low emission vehicles have an important signaling role; they boost company reputation and influence external actors, like policymakers and consumers (Bakker et al., 2012b; Autoweek, 2013; General Motors, 2012; Volkswagen, 2012). Creating an innovative and sustainable company image was key to promoting prototypes (Ibid.). Fourth, the firm’s EV business strategy was measured by its EV sales volume. Complementary information, including the moment the vehicle was first commercially available; the number of models introduced into the market; and whether the EVs sold are purpose-built EVs or based on an ICEV model, will be used to classify the exact EV business strategies of large car manufacturers. Table 1, Concepts, indicators and data sources. [Insert Table 1 here] Data collection Data on car manufacturers’ annual net income in dollars were obtained from the global financial database Datastream of Thomson Reuters. Worldwide patent data were collected using the International Patent Office's (IPO) Global Patent Index program. We used patent applications instead of patent grants, because a significant amount of patent documents do not provide information on patent grants at the time of indexing (European Patent Office, 2013). A publication level filter excluded patent applications that were withdrawn during the period of secrecy. To select patent applications related to technological and infrastructural assets, we used a search query based on EVs and EV infrastructure respectively. Due to the 18-month period of secrecy and processing time of patent applications, the database does not include all patent applications of recent years. We controlled for the decreasing trend in patent applications by dividing the number of EV and infrastructure related patent applications of each large car manufacturer in
7
every year by the total amount of patent applications of the fifteen car manufacturers in the same year. Our patent study resulted in 7611 patent applications. Partnership data were collected from ‘all major world publications’ in the LexisNexis media database. Such media-oriented data collection approaches have been applied to construct various professional databases (Schilling, 2009) and have yielded reliable results for inter-firm analyses (Hagedoorn, 2002; Rice and Galvin, 2006). We applied a search query that contains any combination of words that include 1) any term synonymous with or comparable to ‘partnership’; and ‘electric vehicle’; and 2) to further narrow down the results and improve relevance the articles should include the term ‘battery or batteries’1. This query provided 6151 articles that were published in the period 1990-2011. Each article was scanned for relevant partnerships. Company websites and annual reports were consulted for additional information. We included only reports of partnerships that had already been formed, announcements of future formations were omitted, and double counts of partnerships were excluded. This resulted in 171 relevant partnerships. Based on the work of Sierzchula et al. (2012b), prototype data were collected using different sources, including government reports, annual reports, websites, auto-shows, newspaper articles, company press releases or personal contacts with the manufacturer. Combining these sources allows for a broader coverage of prototype models and the triangulation that is needed to pinpoint the exact date of each prototype’s release. A total of 126 prototypes were included. EV sales data were based on websites, documents and car companies’ annual reports. These sales data were collected in 2012 and attributed to each production model’s year of market introduction. Sales data of a total of 37 commercialized EV production models were included in our database. To get more information on car manufacturers’ business strategies, besides consulting websites, documents and annual reports, we conducted complementary interviews with managers of car manufacturers. Data analysis To test our hypotheses, we took several interrelated steps. First, we defined periods in the car manufacturers’ R&D and commercialization trends, to highlight significant changes in EV strategies over time and to focus our analysis on periods of interest. We measured R&D trends by our indicators for technological assets; trends in commercialization were measured by EV sales per production model year. Second, we conducted a Principal Component Analysis (PCA) to aggregate the data on the different types of assets into one component representing asset position. Use of PCA for this purpose was supported as all indicators that made up the asset position correlated well with each other (p<0.05) and the Scree-plot’s inflexion point suggested the use of one component. The Kaiser-Meyer-Olkin measure showed a score of 0.711, which according to Hutcheson and Sofroniou 1 These search terms refer to the most important component of the EV, and often form the basis in patent analyses to acquire EV related patents (Oltra and Saint Jean, 2009).
8
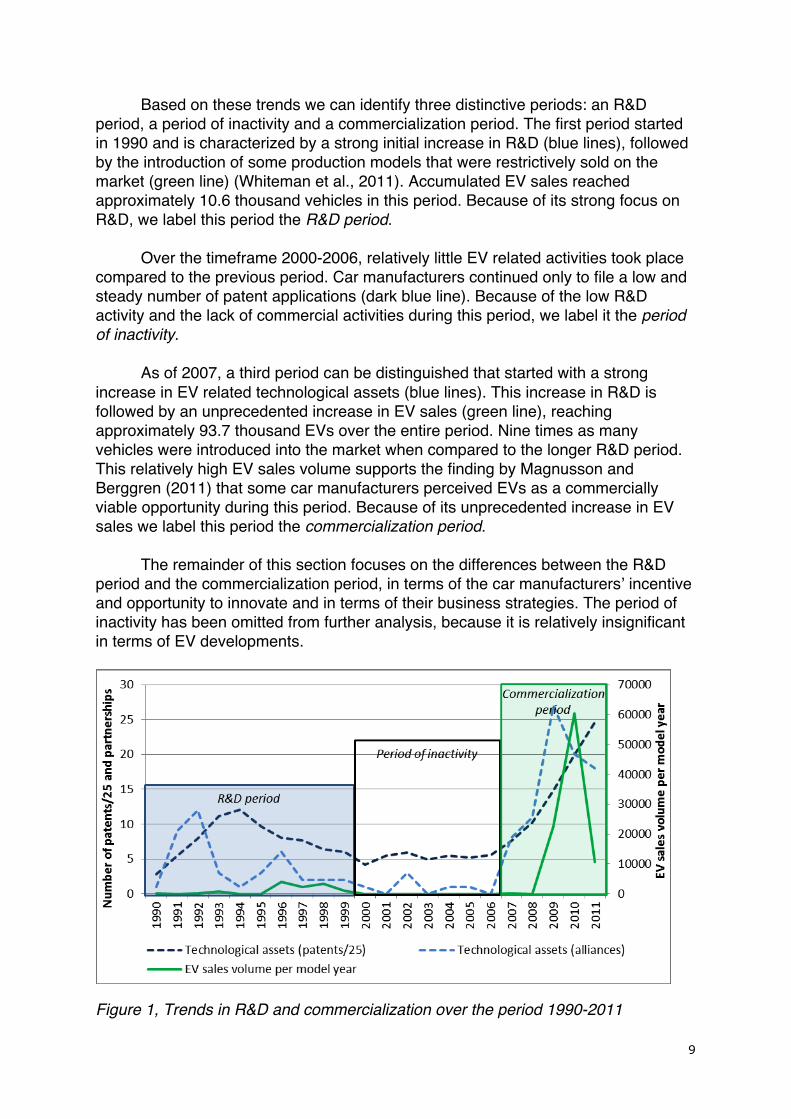
(1999) yields a reliable factor. Bartlett’s test of sphericity confirmed that correlations between the indicators were sufficiently large for PCA (p<0.001). The component explained 61.5% of the indicators’ total variance. In the third step of the analysis we tested our hypotheses using nonparametric Mann-Whitney tests, because our data are not normally distributed and the Mann-Whitney test is, for our purposes, the most powerful nonparametric test for smaller samples (Mann and Whitney, 1947). Mann-Whitney tests have yielded reliable results for samples smaller than 15 (e.g. Bocken et al. 2012). Levene’s tests show that for each between groups comparison the requirement of homogeneity was met, as the variances between groups were not significantly different. Because we tested predefined hypotheses, the 1-tailed exact significance values could be used to determine the significance levels of the between group differences. To test Hypothesis 1, we created a group of firms that fell under the full ZEV restriction and a group of firms that did not fall under the restriction; we compared them in terms of asset position and EV sales. To test Hypothesis 2, whether firms with a strong incentive and opportunity to innovate will have commercialized more EVs during the period of commercialization, we first created two groups of firms. One group of firms was created with a below average net income and an above average asset position (i.e. strong incentive and opportunity to innovate). The EV sales of this group are compared to those of a group that comprises the remainder of the population of large car manufacturers. Fourth, to analyze how different car manufacturers’ business strategies relate to their incentive and opportunity to innovate, we plot each firm’s profitability in the ICEV regime against its asset position and its EV sales, to identify clusters of strategies. To gain more in-depth insight in business strategies, we link our quantitative data to more qualitative data on individual firms’ EV strategies. Results This section presents the periods of EV development in terms of trends in R&D and commercialization, the results of the Mann-Whitney tests that were used to test our hypotheses, and it categorizes the business strategies of large car manufacturers. Periods of R&D and commercialization Figure 1 displays the trends in the aggregated R&D and commercialization endeavors of the population of large car manufacturers over the period 1990-2011. Displayed on the left-hand y-axis, large car manufacturers’ R&D trends, measured by their technological assets, are presented in broken, blue lines. The dark blue line represents technological assets measured by large car manufacturers’ total number of EV related patent applications, divided by 25 to fit the graph. The light blue line represents technological assets measured by large car manufacturers’ EV related partnerships. The commercialization trend is presented in green with EV sales volume per model year2, depicted on the right hand y-axis.
2 The model year refers to the year an EV production model was introduced into the market.
9
Based on these trends we can identify three distinctive periods: an R&D period, a period of inactivity and a commercialization period. The first period started in 1990 and is characterized by a strong initial increase in R&D (blue lines), followed by the introduction of some production models that were restrictively sold on the market (green line) (Whiteman et al., 2011). Accumulated EV sales reached approximately 10.6 thousand vehicles in this period. Because of its strong focus on R&D, we label this period the R&D period. Over the timeframe 2000-2006, relatively little EV related activities took place compared to the previous period. Car manufacturers continued only to file a low and steady number of patent applications (dark blue line). Because of the low R&D activity and the lack of commercial activities during this period, we label it the period of inactivity. As of 2007, a third period can be distinguished that started with a strong increase in EV related technological assets (blue lines). This increase in R&D is followed by an unprecedented increase in EV sales (green line), reaching approximately 93.7 thousand EVs over the entire period. Nine times as many vehicles were introduced into the market when compared to the longer R&D period. This relatively high EV sales volume supports the finding by Magnusson and Berggren (2011) that some car manufacturers perceived EVs as a commercially viable opportunity during this period. Because of its unprecedented increase in EV sales we label this period the commercialization period. The remainder of this section focuses on the differences between the R&D period and the commercialization period, in terms of the car manufacturers’ incentive and opportunity to innovate and in terms of their business strategies. The period of inactivity has been omitted from further analysis, because it is relatively insignificant in terms of EV developments.
Figure 1, Trends in R&D and commercialization over the period 1990-2011
10
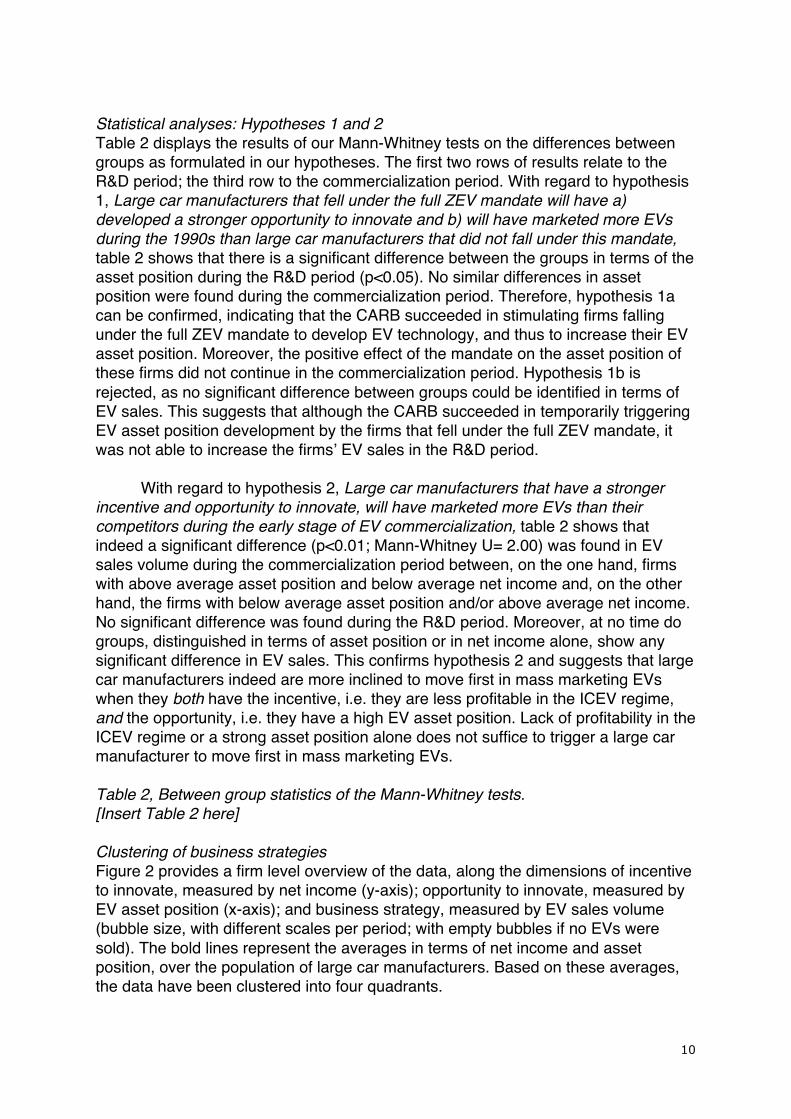
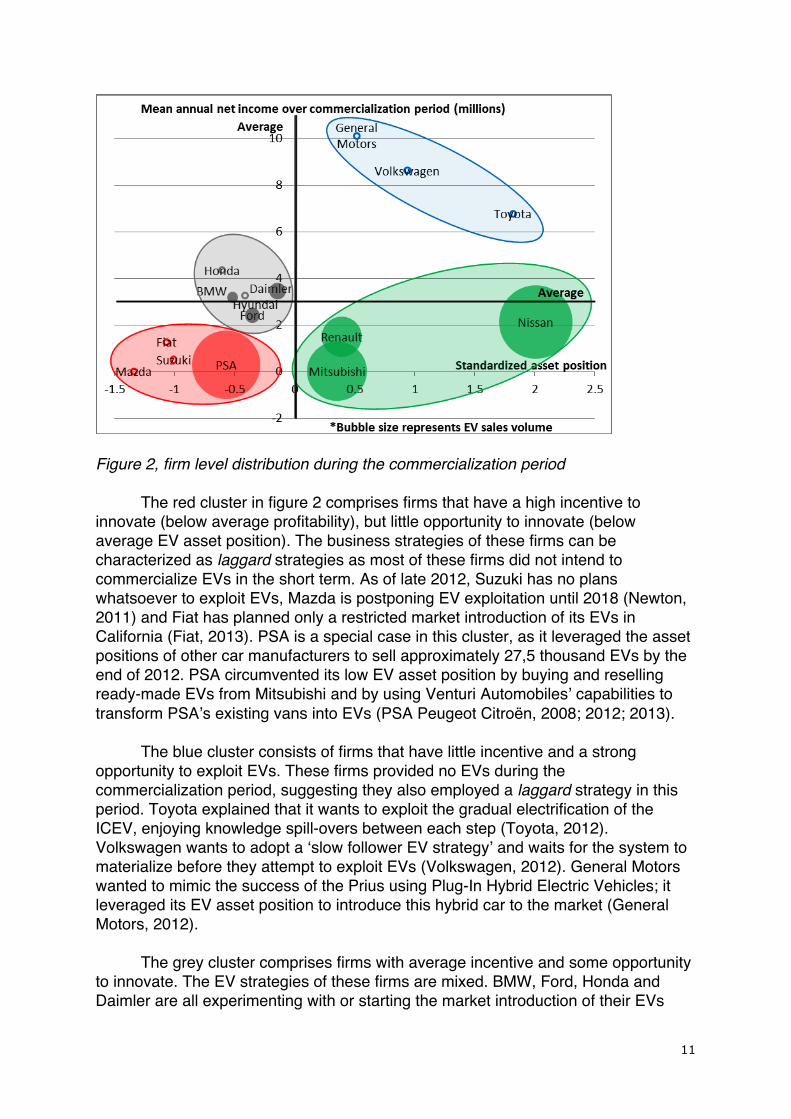
Statistical analyses: Hypotheses 1 and 2 Table 2 displays the results of our Mann-Whitney tests on the differences between groups as formulated in our hypotheses. The first two rows of results relate to the R&D period; the third row to the commercialization period. With regard to hypothesis 1, Large car manufacturers that fell under the full ZEV mandate will have a) developed a stronger opportunity to innovate and b) will have marketed more EVs during the 1990s than large car manufacturers that did not fall under this mandate, table 2 shows that there is a significant difference between the groups in terms of the asset position during the R&D period (p<0.05). No similar differences in asset position were found during the commercialization period. Therefore, hypothesis 1a can be confirmed, indicating that the CARB succeeded in stimulating firms falling under the full ZEV mandate to develop EV technology, and thus to increase their EV asset position. Moreover, the positive effect of the mandate on the asset position of these firms did not continue in the commercialization period. Hypothesis 1b is rejected, as no significant difference between groups could be identified in terms of EV sales. This suggests that although the CARB succeeded in temporarily triggering EV asset position development by the firms that fell under the full ZEV mandate, it was not able to increase the firms’ EV sales in the R&D period. With regard to hypothesis 2, Large car manufacturers that have a stronger incentive and opportunity to innovate, will have marketed more EVs than their competitors during the early stage of EV commercialization, table 2 shows that indeed a significant difference (p<0.01; Mann-Whitney U= 2.00) was found in EV sales volume during the commercialization period between, on the one hand, firms with above average asset position and below average net income and, on the other hand, the firms with below average asset position and/or above average net income. No significant difference was found during the R&D period. Moreover, at no time do groups, distinguished in terms of asset position or in net income alone, show any significant difference in EV sales. This confirms hypothesis 2 and suggests that large car manufacturers indeed are more inclined to move first in mass marketing EVs when they both have the incentive, i.e. they are less profitable in the ICEV regime, and the opportunity, i.e. they have a high EV asset position. Lack of profitability in the ICEV regime or a strong asset position alone does not suffice to trigger a large car manufacturer to move first in mass marketing EVs. Table 2, Between group statistics of the Mann-Whitney tests. [Insert Table 2 here] Clustering of business strategies Figure 2 provides a firm level overview of the data, along the dimensions of incentive to innovate, measured by net income (y-axis); opportunity to innovate, measured by EV asset position (x-axis); and business strategy, measured by EV sales volume (bubble size, with different scales per period; with empty bubbles if no EVs were sold). The bold lines represent the averages in terms of net income and asset position, over the population of large car manufacturers. Based on these averages, the data have been clustered into four quadrants.
11
Figure 2, firm level distribution during the commercialization period The red cluster in figure 2 comprises firms that have a high incentive to innovate (below average profitability), but little opportunity to innovate (below average EV asset position). The business strategies of these firms can be characterized as laggard strategies as most of these firms did not intend to commercialize EVs in the short term. As of late 2012, Suzuki has no plans whatsoever to exploit EVs, Mazda is postponing EV exploitation until 2018 (Newton, 2011) and Fiat has planned only a restricted market introduction of its EVs in California (Fiat, 2013). PSA is a special case in this cluster, as it leveraged the asset positions of other car manufacturers to sell approximately 27,5 thousand EVs by the end of 2012. PSA circumvented its low EV asset position by buying and reselling ready-made EVs from Mitsubishi and by using Venturi Automobiles’ capabilities to transform PSA’s existing vans into EVs (PSA Peugeot Citroën, 2008; 2012; 2013). The blue cluster consists of firms that have little incentive and a strong opportunity to exploit EVs. These firms provided no EVs during the commercialization period, suggesting they also employed a laggard strategy in this period. Toyota explained that it wants to exploit the gradual electrification of the ICEV, enjoying knowledge spill-overs between each step (Toyota, 2012). Volkswagen wants to adopt a ‘slow follower EV strategy’ and waits for the system to materialize before they attempt to exploit EVs (Volkswagen, 2012). General Motors wanted to mimic the success of the Prius using Plug-In Hybrid Electric Vehicles; it leveraged its EV asset position to introduce this hybrid car to the market (General Motors, 2012). The grey cluster comprises firms with average incentive and some opportunity to innovate. The EV strategies of these firms are mixed. BMW, Ford, Honda and Daimler are all experimenting with or starting the market introduction of their EVs
12
(BMW, 2013; Daimler, 2013; Ford, 2013; Honda, 2013), whereas Hyundai focuses only on the introduction of Hydrogen Fuel Cell Vehicles (Hyundai Motors, 2011), another zero-emission and radically-innovative vehicle. During the commercialization period, the grey cluster overall is closer to marketing their EVs than the firms in the blue and the red cluster (with the exception of PSA), while being less exploitative than the green cluster. We classify the firms in the grey cluster therefore as quick followers. The firms in the green cluster have a high incentive to innovate as well as a strong asset position. In accordance with confirmed hypothesis 2, each of these firms has introduced a large number of EVs compared to other car manufacturers. Their business strategy is therefore classified as a first mover strategy. Mitsubishi quickly developed a strong asset position during the commercialization period, which enabled it to pioneer in mass marketing EVs (Mitsubishi Corporation, 2011). In a contractual agreement PSA initially ordered 100.000 EVs from Mitsubishi (Roberts, 2012). Renault engaged in a partnership with Nissan, which already had a strong asset position during the R&D period, to jointly exploit the commercialization of EVs. Nissan used its strong asset position to commercially exploit the first purpose-built EV, selling approximately 32 thousand models by the end of 2012 (Nissan Global, 2013). Renault had a more diversified strategy towards marketing EVs and launched four very different models on the market between late 2010 and 2013. In conclusion, we find that first movers (green cluster) have a high incentive and opportunity to innovate, while quick followers (grey cluster) have some incentive and some opportunity to innovate. Moreover, two types of laggards can be identified. The red cluster generally comprised laggards with high incentive to innovate, but with little opportunity. The blue cluster comprised laggards with no incentive to innovate, but with sufficient opportunity. Discussion In this Discussion Section we highlight the contributions made in this paper, suggest some areas for future research and provide several policy and business strategy recommendations. Contributions and Future Research Suggestions This paper contributes to the literature on innovation by incumbent firms, by explaining differences in the introduction of a radical innovation by incumbents, using the concepts of incentive and opportunity to innovate. Previous studies used these concepts only to explain differences in radical innovativeness between incumbents and new entrants (Chandy and Tellis, 2000; Henderson, 1993). We have shown that the incentive and opportunity to innovate explain differences in the exploitation of EVs between different incumbents and that radical innovation comes especially from the less profitable firms. Another contribution of this paper is that we interpret the opportunity to innovate in terms of firms’ asset positions, based on an extensive set of data on patent applications, partnerships, and prototypes, instead of firms’ access to financial funds. This paper contributes to the strategic management literature on business strategies, by linking the opportunity and incentive to innovate to business
13
strategy and refining the business strategy typology by distinguishing between laggards with an incentive to innovate but no opportunity, and laggards with an opportunity to innovate and no incentive. In addition to these contributions, this paper also has several limitations that may highlight interesting areas for future research. First, firms may exhibit differences in their tendencies to patent and their willingness to publish strategic decisions. This could have affected our patent and our media statements database. Therefore, our findings must be carefully interpreted. Future developments that account for these firm level differences provide a fruitful area for further research. Second, we have labeled the period 2007-2011 a period of EV commercialization, but we do not imply that the EV has been successfully commercialized. We only argue that the commercialization of the EV has been initiated. To illustrate, the best-selling EV sold approximately 32.000 units by the end of 2012, equaling 0.05% of 2011’s annual personal vehicle sales (OICA, 2011). Third, we cannot explain why firms falling under the full ZEV mandate did not have significantly higher EV sales than the other firms during this period, despite their higher opportunity to innovate. Car manufacturers may have attempted to strategically keep their EV sales low while lobbying against the ZEV mandate, arguing there would not be sufficient demand for EVs (Collantes and Sperling, 2008; Boschert, 2006). Further research should consider this context of lobbying activities. Finally, future research could also address collaboration activities of incumbents – an important means to obtain assets (Halme and Korpela, 2013). We found that PSA had unexpectedly high sales despite their relatively low opportunity to innovate, because they relied on the asset position of other car manufacturers to market EVs. We recommend further research to focus more explicitly on the decision to develop assets internally or to access them externally, and study how this affects the opportunity to innovate and the business strategy. Policy Recommendations This study found that although the technology-push ZEV mandate resulted in more EV asset development, it was not successful in getting more EVs on the market in the 1990s. Moreover, we found that firms that are unsuccessful in the ICEV regime are the ones to mass market EVs because they have the incentive to do so. Based on these findings, we recommend policy makers to complement technology-push regulations with demand-pull regulations that focus on shaping public and customer opinion (Oberhofer and Fürst, 2013), providing financial, infrastructural and other supporting regulations like preferential parking and carpool lane access (Firnkorn and Müller, 2012). Such supportive complementary regulations will enhance the economic viability of currently less profitable firms by improving EV sales on which these firms may become more dependent. These policy measures support the less profitable firms in their possibly risky EV strategy, and thereby reduce the firms’ chance to fail and their need to apply for government bailouts. These policy measures will also support the transition towards a sustainable transportation system based on a larger share of EVs. Moreover, such regulations will drive firms’ sustainable strategies (Ervin et al., 2013) and may prevent non-compliance and defensive behavior (Pedersen et al., 2013; Smink et al., 2013) towards stand-alone technology-push policies that force firms to sell products that lack demand.
14
Business Strategy Recommendations This study found that the less profitable firms in the ICEV regime that have a strong EV asset position, are mass marketing EVs. So far, however, EV sales have been low. To increase EV demand, car manufacturers may want to step up their lobbying for more EV supporting regulations, like the ones discussed above. Another way of reducing risks, by minimizing costs of investment and promoting industry standards in the small emerging EV market, is to engage in more collaboration (Gold et al. 2010; Halme and Korpela, 2013; Harms et al. 2013) – a strategy employed in the Nissan-Renault alliance and the EV-contract between Mitsubishi and PSA. We advise the more profitable firms that lack EV commercialization incentives to continue building their EV asset position. This enables them to enter the EV market quickly and prevent losing large market share when the EV market takes off. An effective way to build this EV asset position would be to collaborate with first movers, which allows the more profitable firms to stay on top of contemporary developments and determine when to enter the EV market. These recommendations can be generalized to firms pioneering in sustainable development in an attempt to outcompete their rivals. To enhance the success of their investments, these firms should lobby for environmental policy that supports demand for sustainable innovations. Additionally, when investment costs are high and demand is still low, collaboration between innovators may serve to reduce costs and promote the creation of industry standards (Harms et al. 2013; Sampson 2005). Conclusion In this study, we analyzed the incentive and opportunity to innovate of large car manufacturers and their strategies to market EVs over the period 1990-2011. We proposed that firms with a stronger incentive and a stronger opportunity to innovate introduce more EVs into the market. The incentive to innovate is measured by a firm’s income in the ICEV regime, and the opportunity to innovate by a firm’s EV asset position. We find that during the EV’s R&D period in the 1990s, regulatory pressures triggered large car manufacturers to develop EV related assets. Although this constitutes an increase in their opportunity to innovate, it did not result in significantly higher EV sales. As of 2007, during the EV’s commercialization period, large car manufacturers with a strong opportunity and a strong incentive to innovate, i.e. firms with below average net income and an above average asset position, have significantly higher EV sales than firms with either a low incentive and/or a low opportunity to innovate. Firms with a strong opportunity and a strong incentive to innovate adopted a first-mover strategy. Large car manufacturers with some incentive and opportunity to innovate tended to pursue a quick follower strategy, whereas firms with either little incentive or little opportunity followed a laggard strategy. In this paper we make important contributions to the literature on business strategy by explaining why some incumbents radically innovate and others do not, and by refining the business strategy typology in several ways: we relate the different business strategies to firms’ opportunity and incentive to innovate, and we distinguish between laggards that have no incentive and laggards that have no opportunity to innovate. We contribute to methodology by providing new ways of operationalizatign the opportunity to innovate. We provide recommendations for
15
policy makers to effectively stimulate sustainable development and for incumbents to successfully engage in sustainable innovation. Acknowledgements This research was sponsored by Netherlands Organization for Scientific Research (NWO). We want to thank Will Sierzchula for his prototype data and suggestions on the paper. References Ahuja G, Lampert C. 2001. Entrepreneurship in the large corporation: A longitudinal study of how established firms create breakthrough inventions. Strategic Management Journal 22: 521-543. Ali A, 1994. Pioneering versus incremental innovation: Review and research propositions. Journal of Product Innovation Management 11: 46-61. Autoweek journalist, 2013. Interview in person on 25 January 2013. Bakker S. 2010. The car industry and the blow-out of the hydrogen hype. Energy Policy 38: 6540-6544. Bakker S, van Lente H. Engels, R., 2012a. Competition in a technological niche: The cars of the future. Technology Analysis and Strategic Management 24: 421-434. Bakker S, Van Lente H, Meeus M. 2012b. Dominance in the prototyping phase - The case of hydrogen passenger cars. Research Policy 41: 871-883. Barley S. 1986. Technology as an occasion for structuring: Evidence from observations of CT scanners and the social order of radiology departments. Administrative Science Quarterly 31: 78-108. BMW. 2013. BMW ActiveE. 2013. http://www.bmwusa.com/activee (20 June 2013) Bocken N, Allwood J, Willey A, King J. 2012. Development of a tool for rapidly assessing the implementation difficulty and emissions benefits of innovations. Technovation 32: 19-31. Boschert S. 2006 Plug-in Hybrids: The Cars That Will Recharge America. New Society Publishers: Gabriola Island. CARB. 1990. Final regulation order. low-emission vehicles and clean fuels. California exhaust emission standards and test procedures for 1988 and subsequent model passenger cars, light-duty trucks, and medium-duty vehicles. California Air Resources Board. Chandy R, Tellis GJ. 1998. Organizing for radical product innovation: the overlooked role of willingness to cannibalize. Journal of Marketing Research 35: 474-487.
16
Chandy RK, Tellis GJ. 2000. The incumbent's curse? Incumbency, size, and radical product innovation. Journal of Marketing 64: 1-17. Christensen C. 1997. The innovator's dilemma: when new technologies cause great firms to fail. Harvard Business School Press: Boston, Mass. Collantes G, Sperling D. 2008. The origin of California's zero emission vehicle mandate. Transportation Research Part A: Policy and Practice 42: 1302-1313. Daimler. 2013. Zero emissions, full emotions: Electric vehicles. 2013. https://www.daimler.com/technology-and-innovation/drive-technologies/battery-electric-drives (20 June 2013) Dijk M, Yarime M. 2010. The emergence of hybrid-electric cars: Innovation path creation through co-evolution of supply and demand. Technological Forecasting and Social Change 77: 1371-1390. Dyerson R. Pilkington A. 2005. Gales of creative destruction and the opportunistic incumbent: The case of electric vehicles in California. Technology Analysis and Strategic Management 17: 391-408. Egbue O, Long S. 2012. Barriers to widespread adoption of electric vehicles: An analysis of consumer attitudes and perceptions. Energy Policy 48: 717-729. Ervin D, Wu J, Khanna M, Jones C, Wirkkala T. 2013. Motivations and barriers to corporate environmental management. Business Strategy and the Environment 22: 390-409. Fiat. 2013. Meet the 2013 Fiat 500e. 2013. http://www.fiatusa.com/en/2013/500e/ (20 June 2013) Firnkorn J, Müller M. 2012. Selling mobility instead of cars: new business strategies of automakers and the impact on private vehicle holding. Business Strategy and the Environment 21: 264-80. Ford. 2013. Model: Focus electric. 2013. http://www.ford.com/cars/focus/trim/electric/ (20 June 2013) Freeman C, Soete L. 1997. The Economics of Industrial Innovation. 3rd edition. Routledge: Abingdon. Frenken K, Hekkert M, Godfroij P. 2004. R&D portfolios in environmentally friendly automotive propulsion: Variety, competition and policy implications. Technological Forecasting and Social Change 71: 485-507. Gärling A, Thøgersen J. 2001. Marketing of electric vehicles. Business Strategy and the Environment 10: 53-65.
17
General Motors former vice president, 2012. Interview over the phone on 7 July 2012. Gold S, Seuring, S, Beske, P. 2010. Sustainable supply chain management and inter-organizational resources: A literature review. Corporate Social Responsibility and Environmental Management, 17: 230-245. Golder P, Tellis GJ. 1993. Pioneer advantage: Marketing logic or marketing legend? Journal of Marketing Research 30: 158-170. Hagedoorn J. 2002. Inter-firm R&D partnerships: an overview of major trends and patterns since 1960. Research Policy 31: 477-492. Halme M, Korpela M. 2013. In press. Responsible innovation toward sustainable development in small and medium-sized enterprises: a resource perspective. Business Strategy and the Environment. Harms, D, Hanse, E, Schaltegger S. 2013. Strategies in sustainable supply chain management: An empirical investigation of large German companies. Corporate Social Responsibility and Environmental Management, 20: 205-218. Hekkert M, Suurs R, Negro S, Kuhlmann S, Smits R. 2007. Functions of innovation systems: A new approach for analysing technological change. Technological Forecasting and Social Change 74: 413-432. Henderson R. 1993. Underinvestment and incompetence as responses to radical innovation: Evidence from the photolithographic alignment equipment industry. The RAND Journal of Economics 24: 248-270. Henderson R, Clark K. 1990. Architectural innovation: The reconfiguration of existing product technologies and the failure of established firms. Administrative Science Quarterly 35: 9-30. Honda. 2013. Honda Fit EV. 2013. http://automobiles.honda.com/fit-ev/ (20 June 2013) Hoogma R. 2000. Exploiting Technological Niches, Strategies for Experimental Introduction of Electric Vehicles. Twente University Press: Enschede. Hutcheson G, Sofroniou N. 1999. The Multivariate Social Scientist: Introductory Statistics using Generalized Linear Models. SAGE Publications Limited: New York. Hyundai Motors 2011. Hyundai IX35 fuel cell. 2013. http://www.hyundainews.com/us/en-us/Media/PressRelease.aspx?mediaid=38232&title=hyundai-ix35-fuel-cell (20 June 2013)
18
Jovanovic B, MacDonald G. 1994. The life-cycle of a competitive industry. Journal of Political Economy 102: 322-347. Kemp R. 2005. Zero emission vehicle mandate in California: misguided policy or example of enlightened leadership?, in Time Strategies, Innovation and Environmental Policy, Sartorius C, Zundel S (ed). Edward Elgar: Cheltenham. Lieberman M, Montgomery D. 1998. First-mover (dis)advantages: Retrospective and link with the resource-based view. Strategic Management Journal 19: 1111-1125. Magnusson T, Berggren C. 2011. entering an era of ferment - radical vs incrementalist strategies in automotive power train development. Technology Analysis and Strategic Management 23: 313-330. Mann H, Whitney D. 1947. On a test of whether one of two random variables is stochastically larger than the other. The annals of mathematical statistics 18: 50-60. Mensch G. 1979. Stalemate in Technology: Innovations Overcome the Depression. Ballinger: Cambridge. Mitsubishi Corporation. 2011. Annual report 2010, Creating sustainable corporate value. http://www.mitsubishicorp.com/jp/en/ir/library/ar/pdf/archives/ar2010.pdf Mom G. 2004. The Electric Vehicle: Technology and Expectations in the Automobile Age. John Hopkins University Press: Baltimore. Nelson R, Winter S. 1982. An Evolutionary Theory of Economic Change. Harvard University Press: Harvard. Newton B. 2011. The new Mazda2 EV keeps the zoom-zoom, but does it quietly. 2013. Drivecom. au http://news.drive.com.au/drive/green-motoring/first-drive-mazda-goes-electric-20111205-1of0l.html. (20 June 2013) Nissan Global. 2013. Annual report 2012. Oberhofer P, Fürst E. 2013. Sustainable development in the transport sector: influencing environmental behaviour and performance. Business Strategy and the Environment 22: 374-389. OICA. 2011. World motor vehicle production 2010. OICA. 2012. World motor vehicle production 2011. Oltra V, Saint Jean M. 2009. Variety of technological trajectories in low emission vehicles (LEVs): a patent data analysis. Journal of Cleaner Production 17: 201-213.
19
Pavitt K. 1998. Technologies, products and organization in the innovating firm: what Adam Smith tells us and Joseph Schumpeter doesn't. Industrial and Corporate Change 7: 433-452. Pedersen E, Neergaard P, Pedersen J, Gwozdz W. 2013. Conformance and deviance: Company responses to institutional pressures for corporate social responsibility reporting. Business Strategy and the Environment 22: 357-73. Pinkse J, Kolk A. 2010. Challenges and trade-offs in corporate innovation for climate change. Business Strategy and the Environment 19: 261–272. Pohl H, Yarime M. 2012. Integrating innovation system and management concepts: The development of electric and hybrid electric vehicles in Japan. Technological Forecasting and Social Change 79: 1431-1446. Prakash A, Kollman K. 2004. Policy modes, firms and the natural environment. Business Strategy and the Environment 13: 107-128. PSA Peugeot Citroën. 2008. Venturi Automobiles in partnership with PSA Peugeot Citroën, pre-selected in international EV tender. 2013. PSA Peugeot Citroën. 2012. Sustainable development and annual report 2011. PSA Peugeot Citroën. 2013. 2012 Annual report. Reinganum J. 1983. Uncertain innovation and the persistence of monopoly. The American Economic Review 73: 739-748. Rice J, Galvin P. 2006. Alliance patterns during industry life cycle emergence: the case of Ericsson and Nokia. Technovation 26: 384-395. Roberts G. 2012. Japan: Mitsubishi confirms 'temporary' halt to PSA-branded i-MiEVs. Just Auto, 2013. Robinson W, Chiang J. 2002. Product development strategies for established market pioneers, early followers, and late entrants. Strategic Management Journal 23: 855-866. Rothaermel F. 2001. Complementary assets, strategic alliances, and the incumbent’s advantage: an empirical study of industry and firm effects in the biopharmaceutical industry. Research Policy 30: 1235-1251. Sampson R. 2005. Experience effects and collaborative returns in R&D alliances. Strategic Management Journal 26: 1009–1031.
Schaltegger S, Wagner M. 2011. Sustainable entrepreneurship and sustainability innovation: Categories and interactions. Business Strategy and the Environment 20: 222-237.
20
Schilling M. 2009. Understanding the alliance data. Strategic Management Journal 30: 233-260. Sierzchula W, Bakker S, Maat K, van Wee B. 2012a. The competitive environment of electric vehicles: An analysis of prototype and production models. Environmental Innovation and Societal Transitions 2: 49-65. Sierzchula W, Bakker S, Maat K, Van Wee B, 2012b. Technological diversity of emerging eco-innovations: A case study of the automobile industry. Journal of Cleaner Production 37: 211-220. Silverman B. 1999. Technological resources and the direction of corporate diversification: Toward an integration of the resource-based view and transaction cost economics. Management Science 45: 1109-1124. Smink M, Hekkert M, Negro S, in press Keeping sustainable innovation on a leash? Exploring incumbents’ institutional strategies. Business Strategy and the Environment. Swann G. 2009. The Economics of Innovation: An Introduction. Edward Elgar Publishing: Cheltenham. Teece D. 2006. Reflections on "Profiting from Innovation". Research Policy 35: 1131-1146. Teece D, Pisano G, Shuen A. 1997. Dynamic capabilities and strategic management. Strategic Management Journal 18: 509-533. Toyota. 2012. Toyota's electrification strategy, Ecomobielbeurs presentation at AHOY, Rotterdam. Tushman M, Anderson P. 1986. Technological discontinuities and organizational environments. Administrative Science Quarterly 31: 439-465. Van Den Hoed R. 2005. Commitment to fuel cell technology?: How to interpret carmakers' efforts in this radical technology. Journal of Power Sources 141: 265-271. Volkswagen’s managers future powertrains department, 2012. Interview in person on 20 March 2012. Wells P, Nieuwenhuis P. 2012. Transition failure: Understanding continuity in the automotive industry. Technological Forecasting and Social Change 79: 1681-1692. Wesseling J, Faber J, Hekkert M, in press. How competitive forces sustain electric vehicle development. Technological Forecasting and Social Change.
21
Whiteman G, de Vos D, Chapin F, Yli-Pelkonen V, Niemelä J, Forbes BC. 2011. Business strategies and the transition to low-carbon cities. Business Strategy and the Environment 20: 251-265. Table 1, Concepts, indicators and data sources Concepts: Indicators: Datasources:
Subjecttotechnologyforcingpolicy FallingundertheCARB’sfullZEVmandate CARB(1990)
Incentivetoinnovate/profitabilityintheICEVregime
Netincomeindollars Datastream
Opportunitytoinnovate/Assetposition
TechnologicalassetsPatentapplicationsandpartnershipsorientedatdevelopingorexchangingEVknowledgeorEVcomponents
IPOpatentdatabaseandmediastatements;companywebsites
InfrastructuralassetsPatentapplicationsandpartnershipsorientedatdevelopingorexchangingEV-infrastructureknowledgeorEV-infrastructurecomponents
IPOpatentdatabaseandmediastatements;companywebsites
Complementaryassets Partnershipsgearedtowardsacquiringproductionfacilitiesanddistributionchannels
Mediastatements;companywebsites
Reputationalassets Prototypes,i.e.modelspresentedatautoshowsthatarenot(yet)inproduction
Annualreports,websites,documents
EVmarketstrategy
EVsalesvolume Annualreports,websites,documents
Complementaryinformation,includingtimingtomarket;numberofmodelsintroducedonthemarket;purpose-builtEVornot
Annualreports,websites,documents,interviews
Table 2, Group statistics of the Mann-Whitney tests
Differences between groups for R&D period
Dependent Variable: Group variable: N Mean Mann-
Whitney U
Z score Exact sig.
(1-tailed)
Asset Position Falling Under CARB’s full
ZEV mandate
6 .7621 11.00 -1.886 0.033
9 -.5080
EV Sales Volume Falling Under CARB’s full
ZEV mandate
6 94.62 17.00 -1.205 0.129
9 66.11
Differences between groups for the commercialization period
Dependent Variable: Group variable: N Mean Mann-
Whitney U
Z score Exact sig.
(1-tailed)
EV Sales Volume High Asset Position and
Low Net Income
3 4168 2.00 -2.505 0.009
12 519.4
Copyright © 2022 FDOKUMEN