Agile Estimation: Beyond the Myths Part 1 Agile Estimation ... - QSM
Upload
independentCategory
view
0download
0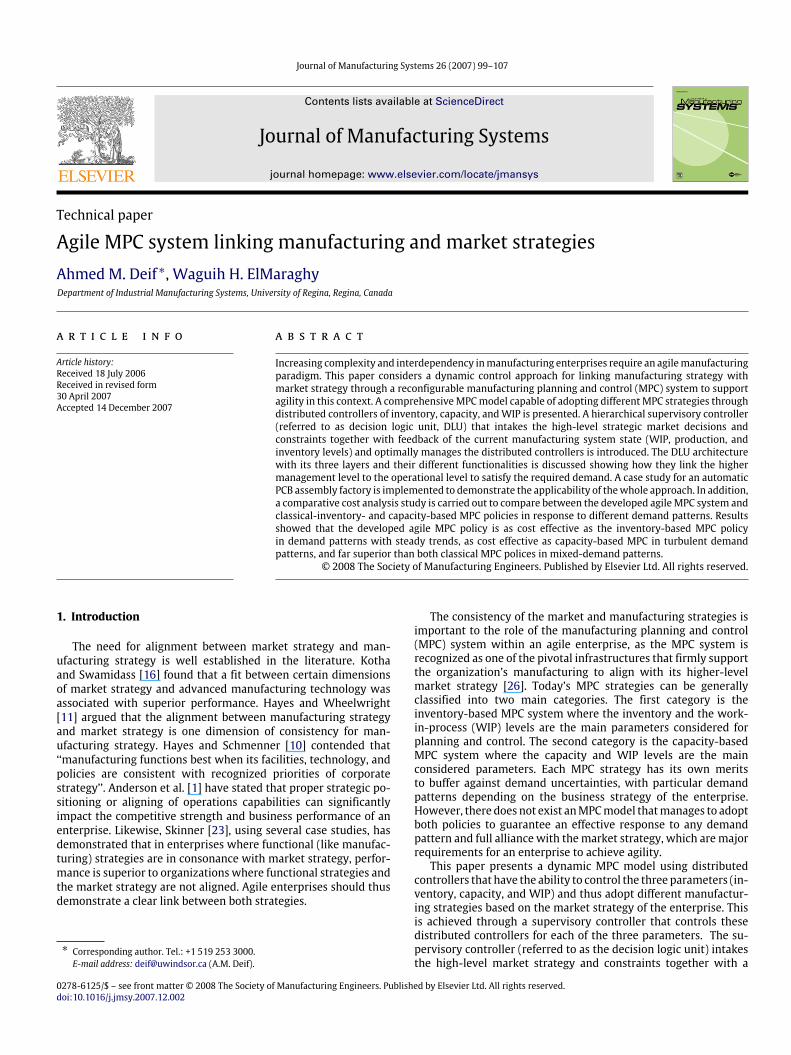
Journal of Manufacturing Systems 26 (2007) 99–107
Contents lists available at ScienceDirect
Journal of Manufacturing Systems
journal homepage: www.elsevier.com/locate/jmansys
Technical paper
Agile MPC system linking manufacturing and market strategiesAhmed M. Deif ∗, Waguih H. ElMaraghyDepartment of Industrial Manufacturing Systems, University of Regina, Regina, Canada
a r t i c l e i n f o
Article history:Received 18 July 2006Received in revised form30 April 2007Accepted 14 December 2007
a b s t r a c t
Increasing complexity and interdependency inmanufacturing enterprises require an agilemanufacturingparadigm. This paper considers a dynamic control approach for linking manufacturing strategy withmarket strategy through a reconfigurable manufacturing planning and control (MPC) system to supportagility in this context. A comprehensiveMPCmodel capable of adopting differentMPC strategies throughdistributed controllers of inventory, capacity, andWIP is presented. A hierarchical supervisory controller(referred to as decision logic unit, DLU) that intakes the high-level strategic market decisions andconstraints together with feedback of the current manufacturing system state (WIP, production, andinventory levels) and optimally manages the distributed controllers is introduced. The DLU architecturewith its three layers and their different functionalities is discussed showing how they link the highermanagement level to the operational level to satisfy the required demand. A case study for an automaticPCB assembly factory is implemented to demonstrate the applicability of thewhole approach. In addition,a comparative cost analysis study is carried out to compare between the developed agileMPC system andclassical-inventory- and capacity-based MPC policies in response to different demand patterns. Resultsshowed that the developed agile MPC policy is as cost effective as the inventory-based MPC policyin demand patterns with steady trends, as cost effective as capacity-based MPC in turbulent demandpatterns, and far superior than both classical MPC polices in mixed-demand patterns.
© 2008 The Society of Manufacturing Engineers. Published by Elsevier Ltd. All rights reserved.
1. Introduction
The need for alignment between market strategy and man-ufacturing strategy is well established in the literature. Kothaand Swamidass [16] found that a fit between certain dimensionsof market strategy and advanced manufacturing technology wasassociated with superior performance. Hayes and Wheelwright[11] argued that the alignment between manufacturing strategyand market strategy is one dimension of consistency for man-ufacturing strategy. Hayes and Schmenner [10] contended that‘‘manufacturing functions best when its facilities, technology, andpolicies are consistent with recognized priorities of corporatestrategy’’. Anderson et al. [1] have stated that proper strategic po-sitioning or aligning of operations capabilities can significantlyimpact the competitive strength and business performance of anenterprise. Likewise, Skinner [23], using several case studies, hasdemonstrated that in enterprises where functional (like manufac-turing) strategies are in consonance with market strategy, perfor-mance is superior to organizations where functional strategies andthe market strategy are not aligned. Agile enterprises should thusdemonstrate a clear link between both strategies.
∗ Corresponding author. Tel.: +1 519 253 3000.E-mail address: [email protected] (A.M. Deif).
0278-6125/$ – see front matter© 2008 The Society of Manufacturing Engineers. Publidoi:10.1016/j.jmsy.2007.12.002
The consistency of the market and manufacturing strategies isimportant to the role of the manufacturing planning and control(MPC) system within an agile enterprise, as the MPC system isrecognized as one of the pivotal infrastructures that firmly supportthe organization’s manufacturing to align with its higher-levelmarket strategy [26]. Today’s MPC strategies can be generallyclassified into two main categories. The first category is theinventory-based MPC system where the inventory and the work-in-process (WIP) levels are the main parameters considered forplanning and control. The second category is the capacity-basedMPC system where the capacity and WIP levels are the mainconsidered parameters. Each MPC strategy has its own meritsto buffer against demand uncertainties, with particular demandpatterns depending on the business strategy of the enterprise.However, there does not exist anMPCmodel thatmanages to adoptboth policies to guarantee an effective response to any demandpattern and full alliance with themarket strategy, which are majorrequirements for an enterprise to achieve agility.
This paper presents a dynamic MPC model using distributedcontrollers that have the ability to control the three parameters (in-ventory, capacity, and WIP) and thus adopt different manufactur-ing strategies based on the market strategy of the enterprise. Thisis achieved through a supervisory controller that controls thesedistributed controllers for each of the three parameters. The su-pervisory controller (referred to as the decision logic unit) intakesthe high-level market strategy and constraints together with a
shed by Elsevier Ltd. All rights reserved.

100 A.M. Deif, W.H. ElMaraghy / Journal of Manufacturing Systems 26 (2007) 99–107
feedback of the current manufacturing system state and optimallyadapts themanufacturing system to the optimal suitable operationpolicy at these conditions.
2. Literature review
The application of control-theoretic approaches inmanufactur-ing systems have been excessively researched on the operationaland machine levels but not as much on the system and enterpriselevels. These approaches are important in the agile manufactur-ing paradigm because agile manufacturing systems need to be dy-namic and controllable to achieve agility objectives. Distributedcontrol is one of the control theory approaches that have the poten-tial to model, analyze, and control agile manufacturing through anetwork of interconnected controllers. Previous work showed theapplication of a distributed control approach to traditional manu-facturing systems on both an operational level as well as a systemlevel.
Examples of distributed control applications on the operationallevel include Duffie, Prabhu, and Kaltjob [7], where they solvedthe problem of controlling arrival times in heterarchical manufac-turing systems by modeling and developing a system where thedynamics of autonomous controllers and the physical interac-tions between entities in the system combine to create systembehavior that is seemingly chaotic, but favorable. In similar heter-archical manufacturing systems, Prabhu [21] developed amodel ofdistributed cooperative control that was generic and characterizeddynamics of job shops with multiple processing steps and paralleldissimilar machines. Global stability conditions for such nonlin-ear control systems have been established using results from theLyapunov theory. Wysk and Smith [31] developed a formal func-tional characterization of the general shop floor control problemin discrete manufacturing that incorporates different distributedcontrollers forworkstations and their equipment on the shop floor.The control approach attempts to control the planning, scheduling,and execution activities on the shop floor based on process plan-ning. The previous approachwasmodified and appliedwith the aidof simulation to control hybrid manufacturing systems inMoreno-Lizaeanzu et al. [17]. A distributed control approach has been alsoused for a manufacturing systems scheduling problem Ioannidiset al. [12]. A set of fuzzy controllers has been derived to reduceWIPand synchronize the production system’s operation. Tsourveloudis,and Valavanis et al. [25] extended the previous work anddeveloped a two-level control architecturewith a supervisory con-troller at the higher level of production used to tune the oper-ation of the lower-level distributed fuzzy controllers. Bruccoleri,Amico and Perrone [2] proposed a distributed intelligent controlapproach, which is an agent-based system, to deal with ‘‘out ofthe ordinary’’ events in the production process in reconfigurablemanufacturing systems. The approach relied on the reconfigura-tion ability of the system to maintain the production flow in suchevents. The previous approach was extended to include other pro-duction scenarios in [3].
Various researches attempted to manipulate a distributedcontrol approach on a system level to control inventory, WIP,and capacity (the main manufacturing control parameters) inmanufacturing systems through modeling controllers for each ofthese parameters. Examples include the APIOBPCS (AutomaticPipeline, Inventory and Order-Based Production Control System)model developed by John, Towill, and Naim [13] used to controlsupply chain management as in [6], inventory control as in [24],and aggregate planning as in [5]. Also, the funnel model ofmanufacturing systems developed by Wiendahl [27] is anothermodel that adopted the same control approach with the help oflogistic operating curves developed by Nyhuis [20] to control WIPand backlog in manufacturing systems in [28,29]. Another single-
workstation model developed by Duffie and Falu [8] for closed-loop PPC was used to control WIP and backlog in discrete andcontinuous time domains in [22] and [14], respectively, and wasextended to multiple workstations in [15].
The reviewed literatures show that the previous distributedcontrol approaches focused only on events occurring on the shopfloor (from an operational or system perspective) and how tocontrol them; thus, in an agile enterprise context there is a needto link this manufacturing level with the high marketing level ina seamless way. Such a link will maintain the alignment betweenthe strategies in both levels, as discussed earlier. In addition, itis shown from an MPC standpoint that these approaches wereable only to focus on either one strategy (like capacity-based,WIP-based, or inventory-based strategy) or managed to combinetwo of them together, but none managed to deal with all threestrategies simultaneously. To deal with different market strategiesand various demand patterns, there is a need to have an MPCmodel that is able to control the three parameters and in turn adoptdifferent MPC strategies based on the market need. In this paper, adynamic MPCmodel is presented to address these two needs in anagile enterprise.
3. Agile MPC model
The dynamic modeling of the agile MPC system aims atconstructing a model in which different planning and controlconfigurations can be realized with respect to a higher-levelmarket strategy. The system model shown in Fig. 1 includes thethree main controlled variables that can work individually or twoat a time based on the decision of the decision logic unit todetermine the desired production rate (DPR). The variables arework in process (WIP), capacity rate of the system, and finishedinventory level.
The proposed general structure of the agile MPC system can bedescribed as being composed of two main operational layers inaddition to a decision logic unit that links these two layerswith thehigher management layer. The first operation layer is the default(or servo control) layer where the control of the manufacturingsystem is only based on controlling the WIP level by observingthe current level with the target level (based on Little’s law). Theother layer (intelligent control layer) involves two controllers, thefirst being an inventory controller that compares the inventorylevel with the required level based on the service level offeredto the customers, and the second being a capacity controllerthat ensures that the production rate matches the demand (orthe order rate). Either can work with the servo control layer orby itself, creating five different MPC configurations or strategies:WIP-based policy, capacity-based policy, inventory-based policy,capacity/WIP-based policy, and inventory/WIP-based policy.
The selection between these strategies is decided by the DLUthrough engaging and disengaging the controllers of each policy.Furthermore, the DLU provides the system with the referencecontrol points and the updates of the order rate (OR) and shipmenttime (TST) based on demand data from the higher managementlevel, and at the same time collects all of the data of the currentsystem to help in deciding the optimal MPC configuration.
The production process is modeled as a pipeline where theoutflow is lagged by the production lead time, TLT. Simulationresults of similar production systems showed an exponentialpipeline lag used in this model to be an appropriate compromisebetween complexity and accuracy [30]. In addition, an exponentialdelay is also assumed for capacity installation/uninstallation time,TD, because capacity scalability cannot be assumed to happeninstantaneously.
The main purpose of any manufacturing planning and controlsystem is to set plans and to group control actions to adjust
A.M. Deif, W.H. ElMaraghy / Journal of Manufacturing Systems 26 (2007) 99–107 101
Fig. 1. Agile MPC system model.
the desired production rate (DPR) to meet the demand patternsspecified by marketing. In the proposed model, DPR is the sum ofthe expected losses (which in this case are the expected order rates,OR) plus adjustments in theproduction-rate level. The adjustmentscan be in the WIP level, in the actual production-rate (PR) level, inthe finished inventory level, or any combination of the previousparameters based on the MPC policy selected by the DLU. Theadjustments to the DPR are actually the values of the differentcontrollers’ gains in each policy.
It is important also to note that the proposed approach hasa continuous time model while its control is a discrete-actionone. The continuous time modeling is justified due to the level ofabstraction of themodel that dealswith the tactical rather than theoperational level.
Eqs. (1)–(4) list the transfer functions derived for the developedagile MPC system configurations. Without losing the generality,two basic assumptions were made. First, the expected lead timeis assumed to be equal to the actual one (TLT = TLT∗). Second,the shipment rate is set to be equal to the order rate (SR = OR).These assumptions aremade only for a better understanding of theproblem. The proposed model does not have any limitations withrespect to considering the case of any linear or nonlinear relationbetween the variables. More details of the model and its analysiscan be found in [4].
Capacity-based MPC system
PRCap∗
=GCT−1
LT T−1D
S2 + S(T−1LT + T−1
D ) + (1 + GC )T−1LT T−1
D
. (1)
Finished-inventory-based MPC system
II∗
=GIT−1
LT
S2 + S(T−1LT + T−1
ST ) + GIT−1LT
. (2)
Capacity/WIP-based MPC system
PRCap∗
=GW (T−1
D + S) + GCT−1LT T−1
D
S2 + S(T−1D + T−1
LT + GW ) + (GWTLT + GC + 1)T−1LT T−1
D
.
(3)
Finished inventory/WIP-based MPC system
II∗
=GIT−1
LT
S2 + S(GW + T−1LT + T−1
ST ) + (GIT−1LT )
. (4)
Fig. 2. Architecture of proposed decision logic unit (DLU).
4. Architecture for the DLU
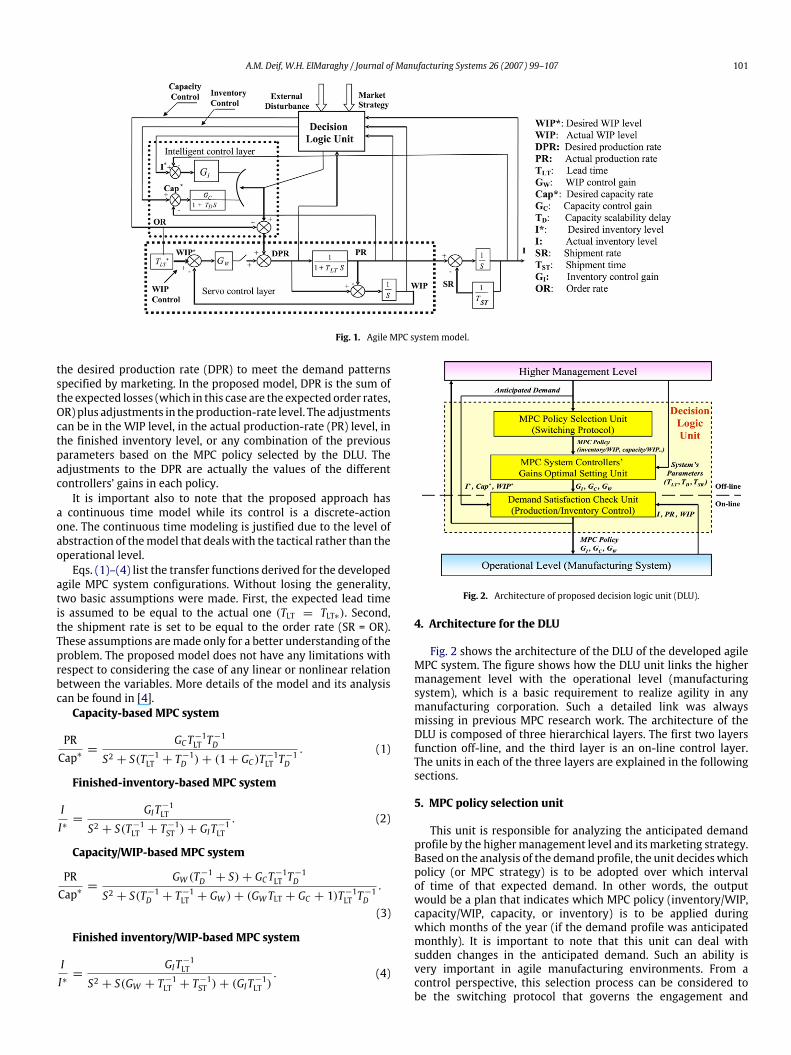
Fig. 2 shows the architecture of the DLU of the developed agileMPC system. The figure shows how the DLU unit links the highermanagement level with the operational level (manufacturingsystem), which is a basic requirement to realize agility in anymanufacturing corporation. Such a detailed link was alwaysmissing in previous MPC research work. The architecture of theDLU is composed of three hierarchical layers. The first two layersfunction off-line, and the third layer is an on-line control layer.The units in each of the three layers are explained in the followingsections.
5. MPC policy selection unit
This unit is responsible for analyzing the anticipated demandprofile by the highermanagement level and itsmarketing strategy.Based on the analysis of the demand profile, the unit decideswhichpolicy (or MPC strategy) is to be adopted over which intervalof time of that expected demand. In other words, the outputwould be a plan that indicates which MPC policy (inventory/WIP,capacity/WIP, capacity, or inventory) is to be applied duringwhich months of the year (if the demand profile was anticipatedmonthly). It is important to note that this unit can deal withsudden changes in the anticipated demand. Such an ability isvery important in agile manufacturing environments. From acontrol perspective, this selection process can be considered tobe the switching protocol that governs the engagement and

102 A.M. Deif, W.H. ElMaraghy / Journal of Manufacturing Systems 26 (2007) 99–107
Table 1Natural frequency and damping ratio of the different agile MPC systems policies
MPC system policy Natural frequency Damping ratio
Inventory ωn =
√GITLT
ξ =1
2ωn
(1TLT
+1
TSR
)Capacity ωn =
√1+GCTLTTD
ξ =1
2ωn
(1TLT
+1TD
)Inventory/WIP ωn =
√GITLT
ξ =1
2ωn
(1TLT
+1
TSR+ GW
)Capacity/WIP ωn =
√GW TLT+GC+1
TLTTDξ =
12ωn
(1TLT
+1TD
+ GW
)
disengagement of the distributed controllers involved in thedeveloped MPC system.
The switching algorithm (based on segmentation) receives theset of anticipated demand data from the higher management leveland starts with the first three points (or months) and tests theabsolute error of these points with their calculated regression line.If the error is relatively small, this means that the demand withinthis range is of a steady trend, and thus an inventory-based policyis selected. On the other hand if this error shows high values, thismeans that the demand experiences great variations and, thus, acapacity-based policy is better to hedge against these variations inthis demand period. It is important to note that the value of theerror in this algorithm depends on the degree of market sensitivitythe enterprise would like to have in its marketing strategy.
After the decision is taken for the first three demand data, thealgorithm will check the next two data with the last point of thepreviously tested three points, and the same regression analysisis carried out. The analysis will keep on exploring the demanddata until the whole planning period (all anticipated demands) iscovered and divided into different regions, where a specific MPCpolicy is applied to each region.
6. MPC controllers’ gains setting unit
This can be considered the heart of the developedDLU. This unitis responsible for deciding on the optimal values of the distributedcontrollers’ gains in the developed MPC system. By ‘‘optimal’’ it ismeant the value of the gains that will satisfy the competing agilityobjectives of responsiveness and cost effectiveness.
From a dynamic analysis standpoint, the responsiveness of thedeveloped dynamic system can be expressed by the rise time[Eq. (5)]. By definition, this is the time it takes the system to risefrom 10% to 90% of its target value [19]. This measure can be usedas an indicator of how fast the system can respond to 90% of therequired demand and, therefore, the degree of its responsiveness.
tΓ ,10,90∼= =0.8 + 2.5ξ
ωn0 ≤ ξ ≤ 1. (5)
In addition, one of the cost aspects of production can bereflected in the value of the production overshoot measure [Eq.(6)]. The maximum overshoot, or sometimes called the percentovershoot, is the amount that thewaveformovershoots the steady-state, or final, value of the time required to reach maximumpeak, expressed as a percentage of the steady-state value [19].This measure directly describes the maximum amount of excessproduction the system will encounter to respond to a suddenchange in demand.
%OS = e−(ξπ/√
1−ξ2)∗ 100. (6)
The objective function (7) thus will aim to minimize the risetime and at the same time minimize the production overshoot.Each objective will take a specific weight, a, based on the strategyof the higher-level management as mentioned before. This unit isresponsible for that multi-objective optimization activity. As for
the constraints, they are mainly the stability constraints and themanufacturing system’s constraints on capacity and input rate.
Min : α
(0.8 + 2.5ξ
ωn
)+ (1 − α)
(e−(ξπ/
√1−ξ2)
∗ 100)
. (7)
To calculate the values of the parameters of Eq. (7), Table 1shows the natural frequency and damping ratio of differentMPC strategies or policies. From the table, one can realize thatthe optimization process is a function of the manufacturingtime-based parameters (lead time, scalability delay time, andshipment time), and thus it can be altered (or changed) based onstrategic decisions from the higher marketing level to invest in themanufacturing system or change market policy in order to changethese parameters and, in turn, change the values of the controllers’gains.
The MPC system controllers’ gains optimal setting unit receivesfrom the MPC policy selection unit the plan with the selected MPCpolicies, and based on each policy (or strategy) it calls the model(or the transfer function) of that configuration and manipulates itin the optimization process. The output is the controllers’ gainsfor each strategy based on the given manufacturing system’sparameters and aligned with the market strategy.
7. MPC demand satisfaction check unit
This layer is actually responsible for checking that the currentproduction-rate or inventory level satisfies the required demand—and this is why it takes place on-line. The check is based oncomparing the current production level with the required capacityrate, the currentWIP level with the idealWIP level, and the currentinventory levelwith the target inventory level based onwhichMPCpolicy is being adopted. These reference levels are calculated basedon the anticipated demand, and thus, meeting these levels meanssatisfying the market demand.
Based on the discrepancy between the compared levels, adecision is made to compensate for that discrepancy through thepreviously calculated control gain values. The decision indicateswhich gain is to be implemented and for how long in order tomeetthe required level. This process is carried out on an interactive basiswith the operational level. The manufacturing system updates thisunit in the DLUwith the current status of the system, and based onthe previously fed data of the demand, a control action is decided.Thus, this unit is mainly responsible for what is known in theliterature ofMPCas production control. Sudden changes in demandare accounted for through this unit through the continuous updateof the required inventory, WIP, and capacity levels based on thecurrent demand. The flowchart for the algorithms of the differentunits in the DLU architecture is shown in Appendix A.
8. Application and analysis of the developed agile controlapproach
8.1. Application to automatic PCB assembly factory
Next, application of the agile MPC system that has beendeveloped will be illustrated using a real industrial case study
A.M. Deif, W.H. ElMaraghy / Journal of Manufacturing Systems 26 (2007) 99–107 103
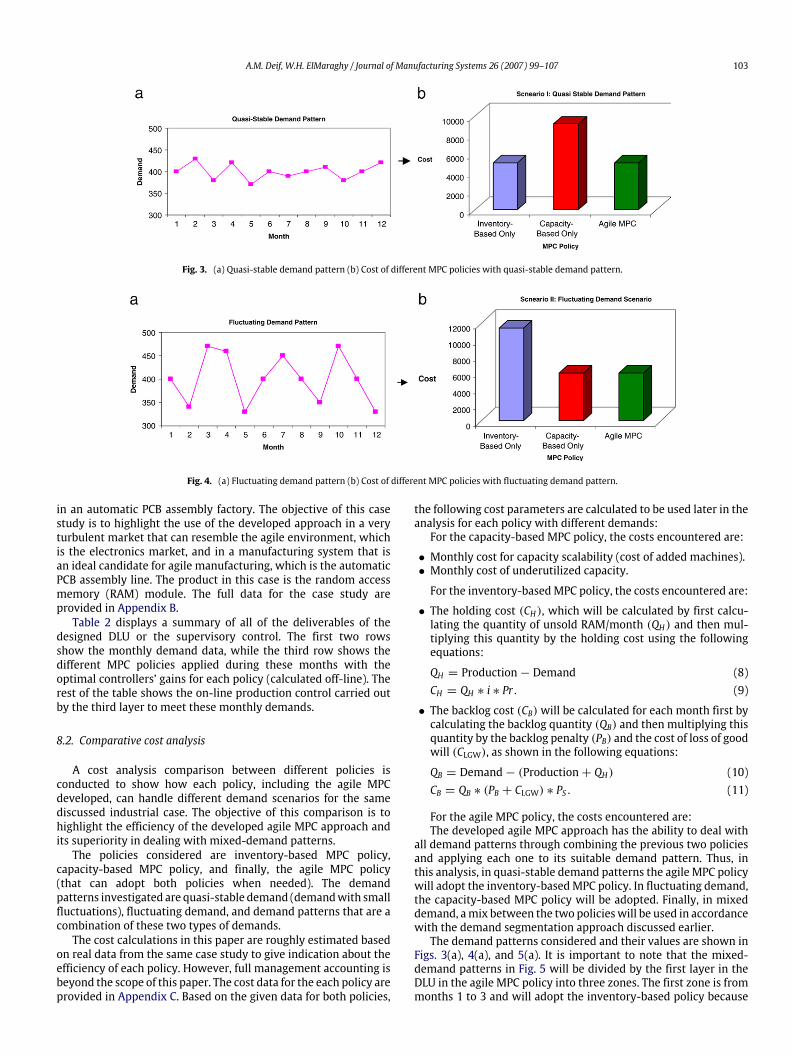
Fig. 3. (a) Quasi-stable demand pattern (b) Cost of different MPC policies with quasi-stable demand pattern.
Fig. 4. (a) Fluctuating demand pattern (b) Cost of different MPC policies with fluctuating demand pattern.
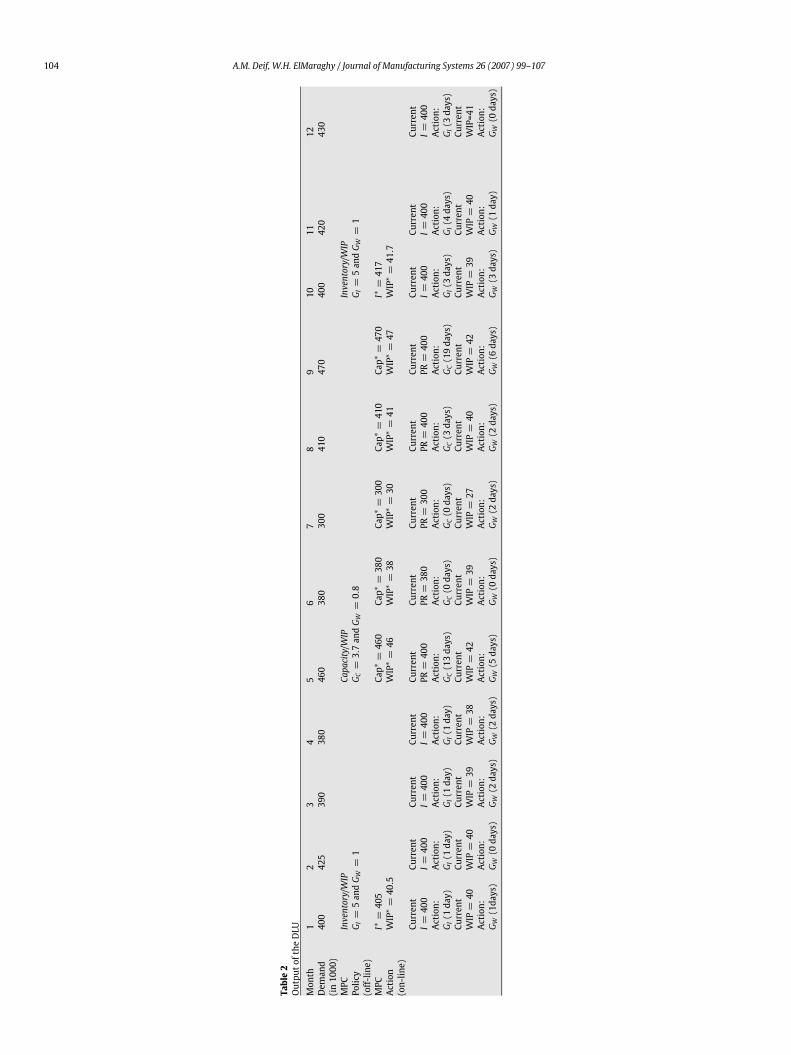
in an automatic PCB assembly factory. The objective of this casestudy is to highlight the use of the developed approach in a veryturbulent market that can resemble the agile environment, whichis the electronics market, and in a manufacturing system that isan ideal candidate for agile manufacturing, which is the automaticPCB assembly line. The product in this case is the random accessmemory (RAM) module. The full data for the case study areprovided in Appendix B.
Table 2 displays a summary of all of the deliverables of thedesigned DLU or the supervisory control. The first two rowsshow the monthly demand data, while the third row shows thedifferent MPC policies applied during these months with theoptimal controllers’ gains for each policy (calculated off-line). Therest of the table shows the on-line production control carried outby the third layer to meet these monthly demands.
8.2. Comparative cost analysis
A cost analysis comparison between different policies isconducted to show how each policy, including the agile MPCdeveloped, can handle different demand scenarios for the samediscussed industrial case. The objective of this comparison is tohighlight the efficiency of the developed agile MPC approach andits superiority in dealing with mixed-demand patterns.
The policies considered are inventory-based MPC policy,capacity-based MPC policy, and finally, the agile MPC policy(that can adopt both policies when needed). The demandpatterns investigated are quasi-stable demand (demandwith smallfluctuations), fluctuating demand, and demand patterns that are acombination of these two types of demands.
The cost calculations in this paper are roughly estimated basedon real data from the same case study to give indication about theefficiency of each policy. However, full management accounting isbeyond the scope of this paper. The cost data for the each policy areprovided in Appendix C. Based on the given data for both policies,
the following cost parameters are calculated to be used later in theanalysis for each policy with different demands:
For the capacity-based MPC policy, the costs encountered are:
• Monthly cost for capacity scalability (cost of added machines).• Monthly cost of underutilized capacity.
For the inventory-basedMPC policy, the costs encountered are:
• The holding cost (CH), which will be calculated by first calcu-lating the quantity of unsold RAM/month (QH) and then mul-tiplying this quantity by the holding cost using the followingequations:
QH = Production − Demand (8)CH = QH ∗ i ∗ Pr. (9)
• The backlog cost (CB) will be calculated for each month first bycalculating the backlog quantity (QB) and then multiplying thisquantity by the backlog penalty (PB) and the cost of loss of goodwill (CLGW), as shown in the following equations:
QB = Demand − (Production + QH) (10)CB = QB ∗ (PB + CLGW) ∗ PS . (11)
For the agile MPC policy, the costs encountered are:The developed agile MPC approach has the ability to deal with
all demand patterns through combining the previous two policiesand applying each one to its suitable demand pattern. Thus, inthis analysis, in quasi-stable demand patterns the agile MPC policywill adopt the inventory-basedMPC policy. In fluctuating demand,the capacity-based MPC policy will be adopted. Finally, in mixeddemand, amix between the two policieswill be used in accordancewith the demand segmentation approach discussed earlier.
The demand patterns considered and their values are shown inFigs. 3(a), 4(a), and 5(a). It is important to note that the mixed-demand patterns in Fig. 5 will be divided by the first layer in theDLU in the agile MPC policy into three zones. The first zone is frommonths 1 to 3 and will adopt the inventory-based policy because
104 A.M. Deif, W.H. ElMaraghy / Journal of Manufacturing Systems 26 (2007) 99–107
Table2
Outpu
tofthe
DLU
Mon
th1
23
45
67
89
1011
12Dem
and
(in10
00)
400
425
390
380
460
380
300
410
470
400
420
430
MPC
Polic
y(off-
line)
Inventory/WIP
G I=
5an
dG W
=1
Capa
city/W
IPG C
=3.7an
dG W
=0.8
Inventory/WIP
G I=
5an
dG W
=1
MPC
Actio
n(on-
line)
I∗=
405
WIP
∗=
40.5
Cap∗
=46
0W
IP∗
=46
Cap∗
=38
0W
IP∗
=38
Cap∗
=30
0W
IP∗
=30
Cap∗
=41
0W
IP∗
=41
Cap∗
=47
0W
IP∗
=47
I∗=
417
WIP
∗=
41.7
Curren
tI=
400
Curren
tI=
400
Curren
tI=
400
Curren
tI=
400
Curren
tPR
=40
0Cu
rren
tPR
=38
0Cu
rren
tPR
=30
0Cu
rren
tPR
=40
0Cu
rren
tPR
=40
0Cu
rren
tI=
400
Curren
tI=
400
Curren
tI=
400
Actio
n:G I
(1da
y)Ac
tion:
G I(1
day)
Actio
n:G I
(1da
y)Ac
tion:
G I(1
day)
Actio
n:G C
(13da
ys)
Actio
n:G C
(0da
ys)
Actio
n:G C
(0da
ys)
Actio
n:G C
(3da
ys)
Actio
n:G C
(19da
ys)
Actio
n:G I
(3da
ys)
Actio
n:G I
(4da
ys)
Actio
n:G I
(3da
ys)
Curren
tW
IP=
40Cu
rren
tW
IP=
40Cu
rren
tW
IP=
39Cu
rren
tW
IP=
38Cu
rren
tW
IP=
42Cu
rren
tW
IP=
39Cu
rren
tW
IP=
27Cu
rren
tW
IP=
40Cu
rren
tW
IP=
42Cu
rren
tW
IP=
39Cu
rren
tW
IP=
40Cu
rren
tW
IP=4
1Ac
tion:
G W(1da
ys)
Actio
n:G W
(0da
ys)
Actio
n:G W
(2da
ys)
Actio
n:G W
(2da
ys)
Actio
n:G W
(5da
ys)
Actio
n:G W
(0da
ys)
Actio
n:G W
(2da
ys)
Actio
n:G W
(2da
ys)
Actio
n:G W
(6da
ys)
Actio
n:G W
(3da
ys)
Actio
n:G W
(1da
y)Ac
tion:
G W(0
days)

A.M. Deif, W.H. ElMaraghy / Journal of Manufacturing Systems 26 (2007) 99–107 105
Fig. 5. (a) Mixed-demand pattern (b) Cost of different MPC policies with mixed-demand pattern.
it has a quasi-stable trend. The second zone will be from months4 to 9 and will adopt a capacity-based policy due to demandfluctuations. The last zone will be from months 10 to 12 and willagain adopt an inventory-based policy for the same reasons as forthe first zone. Figs. 3(b), 4(b), and 5(b) plot the overall costs over the12 months for each MPC policy with the three considered demandpatterns.
Analysis of these figures leads to the following observations:
• With quasi-stable demand, inventory-based MPC policy showsa better performance in terms of cost because the variations ofdemand from the target inventory level are limited, and thusthe holding cost as well as the backlog cost is minimal. Asfor the capacity-based policy, the cost to handle that demandpattern is quite a bit higher because the capacity is usuallyscaled to high values that need high-demand variation to avoidpaying for underutilized capacity or capacity loss, as in thiscase.
• With fluctuating demand, the opposite scenario was found,where the capacity-based MPC policy showed a better costperformance in handling this kind of demand. The reason forthat is the huge variation in demand values, which justifiesthe use of extra capacity (capacity scalability) in cases ofdemand increase. At the same time, these demand variationslead to high levels of accumulated inventory (holding cost)and sometimes a shortage in the level of available inventory(backlog cost), leading to higher cost for the inventory-basedpolicy.
• With fluctuating demand, the opposite scenario was found,where the capacity-based MPC policy showed a better costperformance in handling this kind of demand. The reason forthat is the huge variation in demand values, which justifies theuse of extra capacity (capacity scalability) in cases of demandincrease. At the same time, these demand variations lead to highlevels of accumulated inventory (holding cost) and sometimesa shortage in the level of available inventory (backlog cost),leading to higher cost for the inventory-based policy.
• The developed agile MPC approach showed the best perfor-mance of the three considered demand patterns. In a quasi-stable demand pattern, the agile MPC approach adopted aninventory-based policy by engaging the inventory controller,and this is why it was as cost efficient as the classical inventory-based policy. In fluctuating demand, the DLU disengaged the in-ventory control and switched to the capacity controller to havethe same cost-effective performance as the typical capacity-based MPC policy. However, in the mixed-demand pattern, theagile MPC approach was far superior to the other two policiesdue to its ability to handle each period in the demand patternwith the suitable policy, manipulating its switching ability be-tween different distributed controllers.
9. Conclusions
Anewapproachwasproposed for howenterprises canmaintaintheir agility through enabling manufacturing planning and control(MPC) systems to adopt different policies and align with thecurrent market strategy. A dynamic model for the agile MPCsystem was presented, where different MPC policies can beadopted through distributed controllers for each policy and asupervisory controller responsible to handle these controllersthrough a decision logic unit (DLU). A multi-layer architecturefor this DLU was developed. The first layer in the DLU isresponsible for managing the switching protocol among thedistributed controllers based on the market strategy. The optimalsettings of these controllers’ gains require a trade-off betweenthe responsiveness level and the cost of deviating from the targetproduction based on the market competitiveness plan adopted bythe higher management level. This decision is carried out througha multi-objective optimization technique in the second layer ofthe DLU. The last layer works on-line with the operational level tocontrol production, WIP, and inventory levels in accordance withthe marketing strategy using MPC policy and settings indicated bythe previous two layers.
To demonstrate the applicability of the developed approach, itwas applied to an industrial case study for automatic PCB assembly.The output of the DLU unit showed how the developed agile MPCsystem was able to control the assembly line to align with themarketing strategy and meet the required demand. Furthermore,the comparative cost analysis conducted verified the fundamentalphilosophy of the agile MPC system proposed in this paper byshowing that, in a typical dynamic market environment, theMPC system can maintain its agility by the ability to efficientlyreact to different anticipated demand patterns through differentdistributed controllers for the main manufacturing parameters.
The presented work offers a starting point for more investiga-tion about the need to close the gap between the marketing leveland the operational level in agile enterprises. Further work is re-quired to explore other dynamical approaches to achieve that in-tegration in this dynamic environment.
Appendix A. DLU algorithm
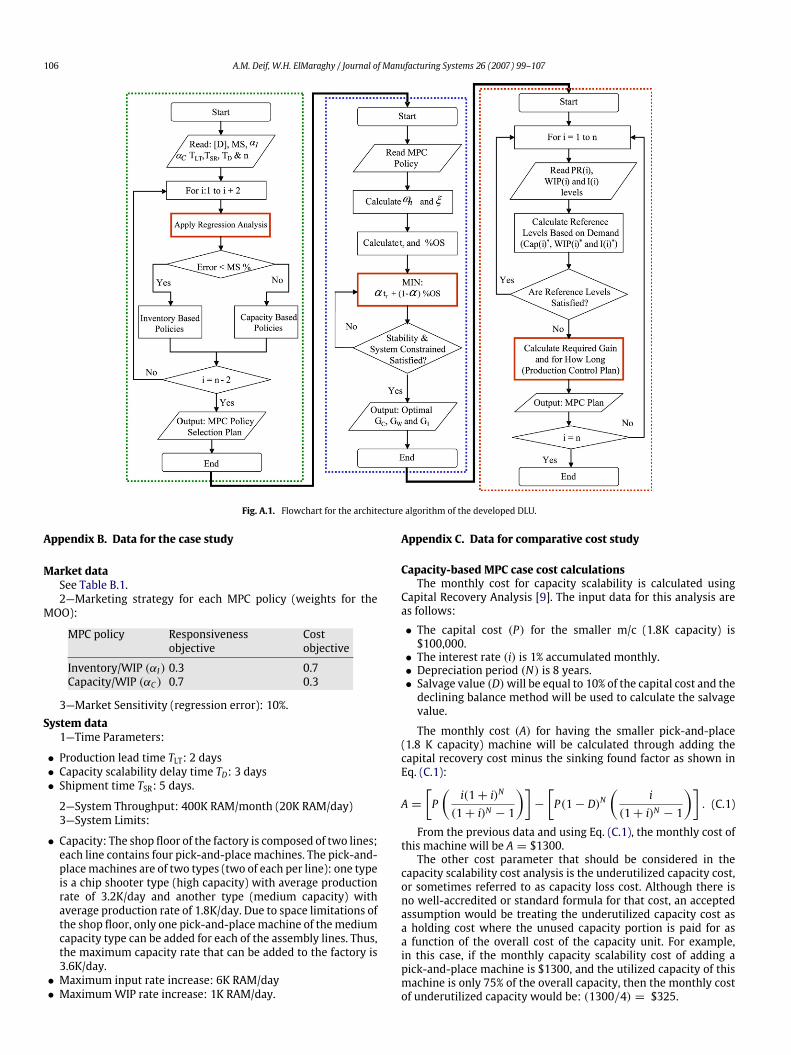
The flowchart for the architecture algorithm of the developedDLU is shown in Fig. A.1. Each of the three layers of the DLUis represented by one of the three columns, respectively. Thevariables in Fig. A.1 are given as follows:
n = number of months in the anticipated demandMS = market sensitivityα = weights assigned by managementωn = natural frequencyζ = damping ratiotr = rise time%OS = percentage overshoot.
106 A.M. Deif, W.H. ElMaraghy / Journal of Manufacturing Systems 26 (2007) 99–107
Fig. A.1. Flowchart for the architecture algorithm of the developed DLU.
Appendix B. Data for the case study
Market dataSee Table B.1.2—Marketing strategy for each MPC policy (weights for the
MOO):
MPC policy Responsivenessobjective
Costobjective
Inventory/WIP (αI) 0.3 0.7Capacity/WIP (αC ) 0.7 0.3
3—Market Sensitivity (regression error): 10%.System data
1—Time Parameters:
• Production lead time TLT: 2 days• Capacity scalability delay time TD: 3 days• Shipment time TSR: 5 days.
2—System Throughput: 400K RAM/month (20K RAM/day)3—System Limits:
• Capacity: The shop floor of the factory is composed of two lines;each line contains four pick-and-placemachines. The pick-and-placemachines are of two types (two of each per line): one typeis a chip shooter type (high capacity) with average productionrate of 3.2K/day and another type (medium capacity) withaverage production rate of 1.8K/day. Due to space limitations ofthe shop floor, only one pick-and-placemachine of themediumcapacity type can be added for each of the assembly lines. Thus,the maximum capacity rate that can be added to the factory is3.6K/day.
• Maximum input rate increase: 6K RAM/day• MaximumWIP rate increase: 1K RAM/day.
Appendix C. Data for comparative cost study
Capacity-based MPC case cost calculationsThe monthly cost for capacity scalability is calculated using
Capital Recovery Analysis [9]. The input data for this analysis areas follows:
• The capital cost (P) for the smaller m/c (1.8K capacity) is$100,000.
• The interest rate (i) is 1% accumulated monthly.• Depreciation period (N) is 8 years.• Salvage value (D)will be equal to 10% of the capital cost and the
declining balance method will be used to calculate the salvagevalue.
The monthly cost (A) for having the smaller pick-and-place(1.8 K capacity) machine will be calculated through adding thecapital recovery cost minus the sinking found factor as shown inEq. (C.1):
A =
[P
(i(1 + i)N
(1 + i)N − 1
)]−
[P(1 − D)N
(i
(1 + i)N − 1
)]. (C.1)
From the previous data and using Eq. (C.1), the monthly cost ofthis machine will be A = $1300.
The other cost parameter that should be considered in thecapacity scalability cost analysis is the underutilized capacity cost,or sometimes referred to as capacity loss cost. Although there isno well-accredited or standard formula for that cost, an acceptedassumption would be treating the underutilized capacity cost asa holding cost where the unused capacity portion is paid for asa function of the overall cost of the capacity unit. For example,in this case, if the monthly capacity scalability cost of adding apick-and-place machine is $1300, and the utilized capacity of thismachine is only 75% of the overall capacity, then the monthly costof underutilized capacity would be: (1300/4) = $325.
A.M. Deif, W.H. ElMaraghy / Journal of Manufacturing Systems 26 (2007) 99–107 107
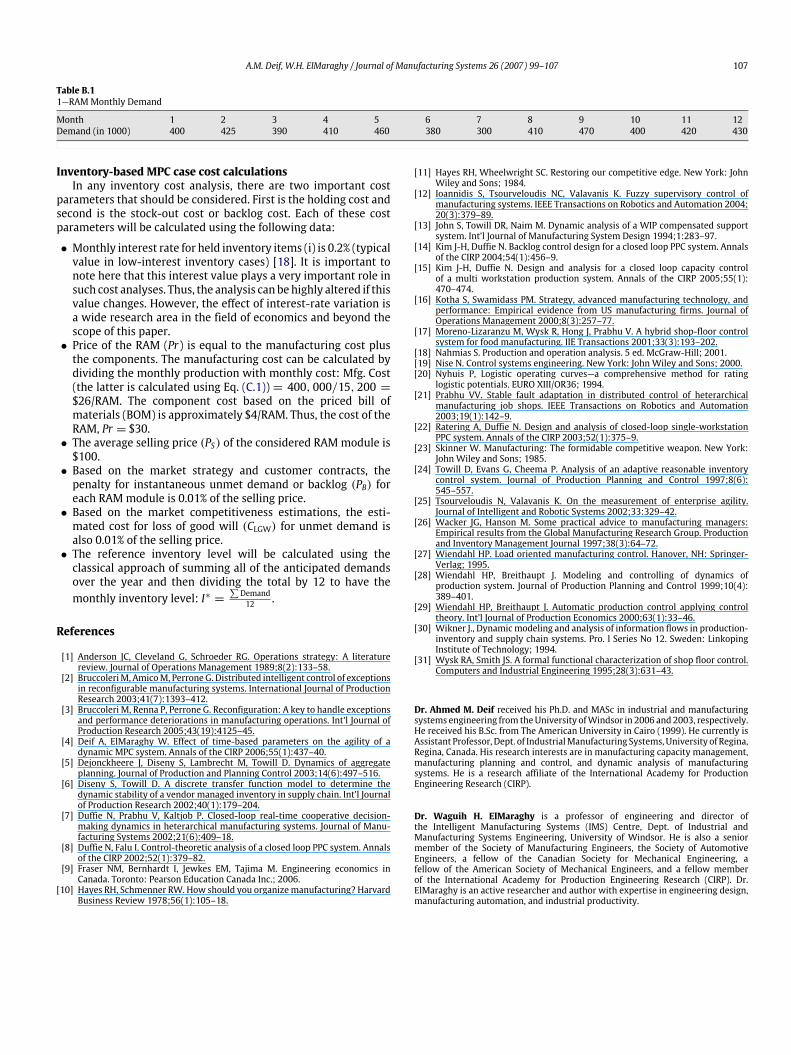
Table B.11—RAMMonthly Demand
Month 1 2 3 4 5 6 7 8 9 10 11 12Demand (in 1000) 400 425 390 410 460 380 300 410 470 400 420 430
Inventory-based MPC case cost calculationsIn any inventory cost analysis, there are two important cost
parameters that should be considered. First is the holding cost andsecond is the stock-out cost or backlog cost. Each of these costparameters will be calculated using the following data:
• Monthly interest rate for held inventory items (i) is 0.2% (typicalvalue in low-interest inventory cases) [18]. It is important tonote here that this interest value plays a very important role insuch cost analyses. Thus, the analysis can behighly altered if thisvalue changes. However, the effect of interest-rate variation isa wide research area in the field of economics and beyond thescope of this paper.
• Price of the RAM (Pr) is equal to the manufacturing cost plusthe components. The manufacturing cost can be calculated bydividing the monthly production with monthly cost: Mfg. Cost(the latter is calculated using Eq. (C.1)) = 400, 000/15, 200 =
$26/RAM. The component cost based on the priced bill ofmaterials (BOM) is approximately $4/RAM. Thus, the cost of theRAM, Pr = $30.
• The average selling price (PS) of the considered RAMmodule is$100.
• Based on the market strategy and customer contracts, thepenalty for instantaneous unmet demand or backlog (PB) foreach RAMmodule is 0.01% of the selling price.
• Based on the market competitiveness estimations, the esti-mated cost for loss of good will (CLGW) for unmet demand isalso 0.01% of the selling price.
• The reference inventory level will be calculated using theclassical approach of summing all of the anticipated demandsover the year and then dividing the total by 12 to have themonthly inventory level: I∗ =
∑Demand12 .
References
[1] Anderson JC, Cleveland G, Schroeder RG. Operations strategy: A literaturereview. Journal of Operations Management 1989;8(2):133–58.
[2] BruccoleriM, AmicoM, PerroneG. Distributed intelligent control of exceptionsin reconfigurable manufacturing systems. International Journal of ProductionResearch 2003;41(7):1393–412.
[3] Bruccoleri M, Renna P, Perrone G. Reconfiguration: A key to handle exceptionsand performance deteriorations in manufacturing operations. Int’l Journal ofProduction Research 2005;43(19):4125–45.
[4] Deif A, ElMaraghy W. Effect of time-based parameters on the agility of adynamic MPC system. Annals of the CIRP 2006;55(1):437–40.
[5] Dejonckheere J, Diseny S, Lambrecht M, Towill D. Dynamics of aggregateplanning. Journal of Production and Planning Control 2003;14(6):497–516.
[6] Diseny S, Towill D. A discrete transfer function model to determine thedynamic stability of a vendor managed inventory in supply chain. Int’l Journalof Production Research 2002;40(1):179–204.
[7] Duffie N, Prabhu V, Kaltjob P. Closed-loop real-time cooperative decision-making dynamics in heterarchical manufacturing systems. Journal of Manu-facturing Systems 2002;21(6):409–18.
[8] Duffie N, Falu I. Control-theoretic analysis of a closed loop PPC system. Annalsof the CIRP 2002;52(1):379–82.
[9] Fraser NM, Bernhardt I, Jewkes EM, Tajima M. Engineering economics inCanada. Toronto: Pearson Education Canada Inc.; 2006.
[10] Hayes RH, Schmenner RW. How should you organizemanufacturing? HarvardBusiness Review 1978;56(1):105–18.
[11] Hayes RH, Wheelwright SC. Restoring our competitive edge. New York: JohnWiley and Sons; 1984.
[12] Ioannidis S, Tsourveloudis NC, Valavanis K. Fuzzy supervisory control ofmanufacturing systems. IEEE Transactions on Robotics and Automation 2004;20(3):379–89.
[13] John S, Towill DR, Naim M. Dynamic analysis of a WIP compensated supportsystem. Int’l Journal of Manufacturing System Design 1994;1:283–97.
[14] Kim J-H, Duffie N. Backlog control design for a closed loop PPC system. Annalsof the CIRP 2004;54(1):456–9.
[15] Kim J-H, Duffie N. Design and analysis for a closed loop capacity controlof a multi workstation production system. Annals of the CIRP 2005;55(1):470–474.
[16] Kotha S, Swamidass PM. Strategy, advanced manufacturing technology, andperformance: Empirical evidence from US manufacturing firms. Journal ofOperations Management 2000;8(3):257–77.
[17] Moreno-Lizaranzu M, Wysk R, Hong J, Prabhu V. A hybrid shop-floor controlsystem for food manufacturing. IIE Transactions 2001;33(3):193–202.
[18] Nahmias S. Production and operation analysis. 5 ed. McGraw-Hill; 2001.[19] Nise N. Control systems engineering. New York: John Wiley and Sons; 2000.[20] Nyhuis P, Logistic operating curves—a comprehensive method for rating
logistic potentials. EURO XIII/OR36; 1994.[21] Prabhu VV. Stable fault adaptation in distributed control of heterarchical
manufacturing job shops. IEEE Transactions on Robotics and Automation2003;19(1):142–9.
[22] Ratering A, Duffie N. Design and analysis of closed-loop single-workstationPPC system. Annals of the CIRP 2003;52(1):375–9.
[23] Skinner W. Manufacturing: The formidable competitive weapon. New York:John Wiley and Sons; 1985.
[24] Towill D, Evans G, Cheema P. Analysis of an adaptive reasonable inventorycontrol system. Journal of Production Planning and Control 1997;8(6):545–557.
[25] Tsourveloudis N, Valavanis K. On the measurement of enterprise agility.Journal of Intelligent and Robotic Systems 2002;33:329–42.
[26] Wacker JG, Hanson M. Some practical advice to manufacturing managers:Empirical results from the Global Manufacturing Research Group. Productionand Inventory Management Journal 1997;38(3):64–72.
[27] Wiendahl HP. Load oriented manufacturing control. Hanover, NH: Springer-Verlag; 1995.
[28] Wiendahl HP, Breithaupt J. Modeling and controlling of dynamics ofproduction system. Journal of Production Planning and Control 1999;10(4):389–401.
[29] Wiendahl HP, Breithaupt J. Automatic production control applying controltheory. Int’l Journal of Production Economics 2000;63(1):33–46.
[30] Wikner J., Dynamicmodeling and analysis of information flows in production-inventory and supply chain systems. Pro. l Series No 12. Sweden: LinkopingInstitute of Technology; 1994.
[31] Wysk RA, Smith JS. A formal functional characterization of shop floor control.Computers and Industrial Engineering 1995;28(3):631–43.
Dr. Ahmed M. Deif received his Ph.D. and MASc in industrial and manufacturingsystems engineering from theUniversity ofWindsor in 2006 and 2003, respectively.He received his B.Sc. from The American University in Cairo (1999). He currently isAssistant Professor, Dept. of IndustrialManufacturing Systems, University of Regina,Regina, Canada. His research interests are in manufacturing capacity management,manufacturing planning and control, and dynamic analysis of manufacturingsystems. He is a research affiliate of the International Academy for ProductionEngineering Research (CIRP).
Dr. Waguih H. ElMaraghy is a professor of engineering and director ofthe Intelligent Manufacturing Systems (IMS) Centre, Dept. of Industrial andManufacturing Systems Engineering, University of Windsor. He is also a seniormember of the Society of Manufacturing Engineers, the Society of AutomotiveEngineers, a fellow of the Canadian Society for Mechanical Engineering, afellow of the American Society of Mechanical Engineers, and a fellow memberof the International Academy for Production Engineering Research (CIRP). Dr.ElMaraghy is an active researcher and author with expertise in engineering design,manufacturing automation, and industrial productivity.
Copyright © 2022 FDOKUMEN