Market Research Report Citywide Ultra High-Speed ...
47
Market Research Report Citywide Ultra High-Speed Broadband System Project 19 May 2011 Tellus Venture Associates ® Stephen A. Blum Tellus Venture Associates www.tellusventure.com
-
Upload
khangminh22 -
Category
Documents
-
view
1 -
download
0
Transcript of Market Research Report Citywide Ultra High-Speed ...
Market Research Report
Citywide Ultra High-Speed Broadband System Project
19 May 2011
Tellus VentureAssociates
®
Stephen A. BlumTellus Venture Associates
www.tellusventure.com
!
Table of Contents
1. ..........................................................................................................Executive Summary 12. .......................................................................................................................Introduction 43. .........................................................................................................Geographic Analysis 5
3.1. .............................................................................................................Methodology 53.2. ..........................................................................................Utility Database Analysis 53.3. .....................................................................................................................Mapping 7
4. ...........................................................................................Analysis of Existing Network 94.1. ...................................................................................................................Overview 94.2. ............................................................................................Stanford Research Park 124.3. ................................................................................................Downtown Palo Alto 134.4. ....................................................................Technology, Medical and Professional 144.5. ............................................................................................Commercial Properties 154.6. .............................................................................Telecommunications Companies 15
5. ........................................................................................Analysis of Unserved Market 175.1. .............................................................................Identification of Unserved Areas 175.2. ......................................................................Identification of Network Extensions 185.3. .................................................................................................................Validation 195.4. ..............................................................................................Cost/Benefit Analysis 215.5. ............................................................................................Evaluation by Segment 235.6. .............................................................................................Unserved School Sites 28
6. ...............................................................................................................Pricing Analysis 296.1. ...............................................................................................Alternative Providers 296.2. .........................................................................................................Current Pricing 296.3. .......................................................................................................Flat Rate Pricing 306.4. ...................................................................................Commercial Property Pricing 316.5. ...................................................................................................Recommendations 34
7. .........................................................................................................Residential Market 367.1. .................................................................................................................Overview 367.2. ......................................................................................FTTH system comparisons 377.3. ...................................................................................Case study: City of Alameda 387.4. .............................................................................................................Conclusions 39
8. ...................................................................................Findings and Recommendations 419. .........................................................................Appendix A - Tables and Spreadsheets 43
9.1. .............................................................................Prospective Network Extensions 439.2. ...................................................Fiber to the Basement Business Model Scenarios 44
10. .............................................................................................Appendix B - List of Maps 45
!
1. Executive Summary
This study evaluated the current coverage, marketing and market potential of the City of Palo Alto Utility Department’s (CPAU) dark fiber network. The key findings are:
• CPAU has a high market share and brand awareness among organizations that need the quantity and quality of bandwidth provided by direct fiber optic connections. A modest, highly targeted advertising and promotion program will help maintain this market position over time.
• CPAU's best customers are telecommunications companies. Initiatives that support mobile telecommunications providers and/or enable resellers to provide connectivity to a wider range of businesses and commercial properties will encourage greater use of CPAU's dark fiber network.
• These initiatives could include a modified flat-rate pricing policy and a commercial property initiative that recovers upfront costs over time.
• CPAU should consider extending its network to the few unserved clusters of commercial users identified by this study.
• Many public schools in the City of Palo Alto are within reach of the current network, and all can be reached via relatively modest extensions.
• It is unlikely that an “overbuild” fiber-to-the-home (FTTH) service in Palo Alto would be able to support itself or be financially justified in the near term.
Geographic analysis of Palo Alto businesses and fiber network
To evaluate the potential for new business, an electricity usage profile of existing dark fiber customers was developed and compared to CPAU's commercial electric account database. Businesses that matched the profile were mapped and classified according to distance from the network. These potential customers generally fell into two categories: 1. already within the current fiber service area or 2. located in a handful of unserved clusters. Public schools were a third category. This mapping analysis was then validated through field research.
Profile matches within the current service area were sorted into three groups: accounts located in 1. Stanford Research Park, 2. downtown Palo Alto and 3. the rest of the City. In Stanford Research Park, 83% of these potential customers have already discussed dark fiber service with CPAU staff. In downtown Palo Alto and the rest of the City, about a fifth had already been contacted and another fifth appeared to be good prospects. More than half of
! City of Palo Alto Fiber Market Research Report
19 May 2011! Tellus Venture Associates! Page 1
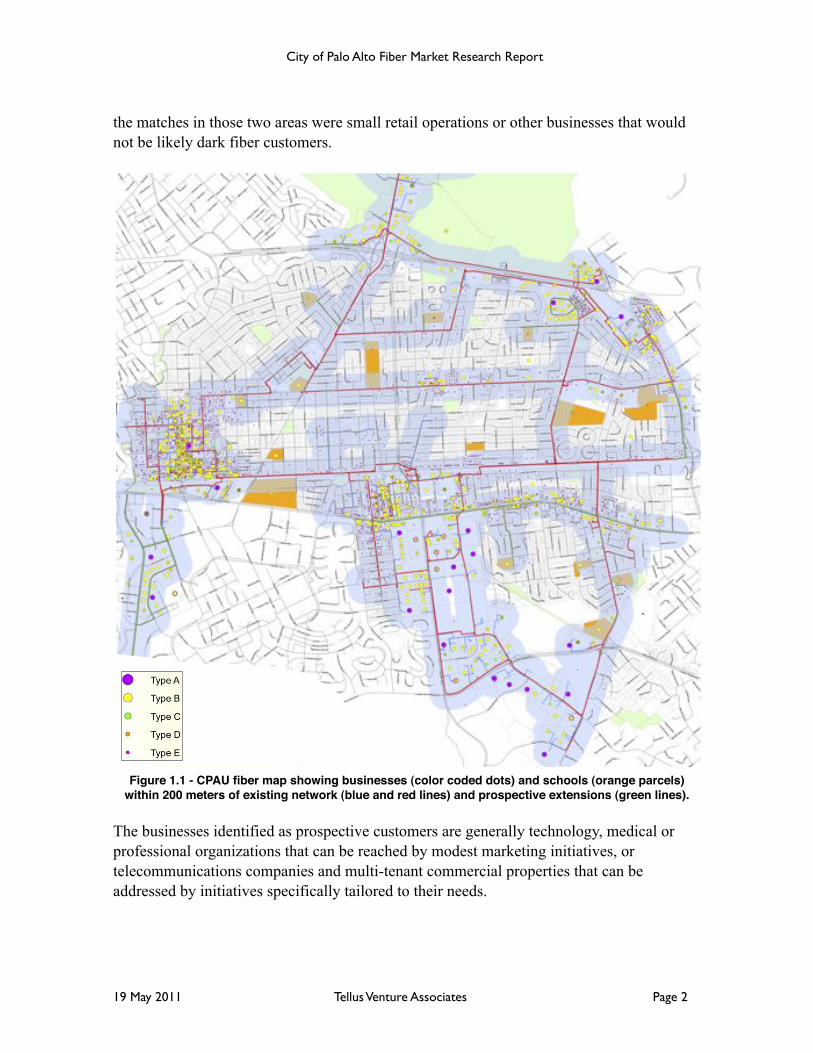
the matches in those two areas were small retail operations or other businesses that would not be likely dark fiber customers.
Figure 1.1 - CPAU fiber map showing businesses (color coded dots) and schools (orange parcels) within 200 meters of existing network (blue and red lines) and prospective extensions (green lines).
The businesses identified as prospective customers are generally technology, medical or professional organizations that can be reached by modest marketing initiatives, or telecommunications companies and multi-tenant commercial properties that can be addressed by initiatives specifically tailored to their needs.
! City of Palo Alto Fiber Market Research Report
19 May 2011! Tellus Venture Associates! Page 2
Clusters of potential fiber customers were identified in unreached areas of the City. A cost/benefit analysis showed that extending the network to the East Meadow Circle area (as CPAU staff are already doing) would be justified and extensions along Welch Road and Sand Hill Road would also be supported by current market potential.
Extensions along El Camino Real and East Bayshore Road could be supported if initiatives addressing telecommunications companies and commercial properties were successful, and could also have economic development benefits.
Pricing analysis
Potential users who were contacted cited perceived high costs as an obstacle to adoption. Currently, CPAU charges new customers upfront for construction work, and usually determines monthly rates by the distance from the customer to downtown Palo Alto. New pricing options were evaluated as ways of overcoming objections to cost.
A maximum flat total monthly cost of $1,610 would reduce current revenue by about a tenth, which could be recovered by gaining a couple dozen new customers. This price point would be a significant benefit for new and existing customers in Stanford Research Park and the southeast area of the City, and for mobile telecommunications companies.
Flat rate pricing would also simplify selling to telecommunications resellers and/or multi-tenant commercial properties. A bigger incentive in this sector, though, would be to amortize the cost of new construction via a slightly higher monthly rate, which would be competitive if even a few end users shared a single connection.
Residential service
To support the high cost of building an FTTH system, an “overbuilder” would need to take a controlling share of cable television and Internet service subscriptions from Comcast and AT&T and achieve a high rate of monthly revenue per customer. Given the ongoing uncertainty and business model disruption in the industry, increasing and uncontrollable costs, intense competition and the failure of benchmark systems in other cities, there is no viable business case for FTTH in Palo Alto.
The telecommunications and television industries are rapidly changing. Some form of FTTH service might become financially justified in the future. It should be one of the many factors considered when evaluating fiber network extensions and upgrades. However, these changes are also opening up other opportunities, such as mobile broadband, the growing digitization of the medical field and the continuing attraction of Palo Alto to new technology and professional enterprises, which are more immediate and better proven.
! City of Palo Alto Fiber Market Research Report
19 May 2011! Tellus Venture Associates! Page 3
2. Introduction
The City of Palo retained Tellus Venture Associates to conduct market research for its business plan for the Citywide Ultra High-Speed Broadband System Project. This research included:
1. Analysis of the existing City of Palo Alto Utility Department (CPAU) fiber network footprint versus existing and potential dark fiber customers.
2. Analysis of potential extensions of the network.3. Assessment of services and market position.4. Cost-benefit analysis of network extension.5. Cost-benefit analysis of commercial valued-added service options.6. Case study benchmark analysis of retail service options.
These steps were carried out in close cooperation with CPAU staff, and included review of research methodology, results and analysis.
Note regarding directions: north-south-east-west directions are based on a grid convention. For example, Middlefield Road and Alma Avenue would be considered running generally from north to south, while Oregon Expressway and Page Mill Road would be considered running generally from east to west.
! City of Palo Alto Fiber Market Research Report
19 May 2011! Tellus Venture Associates! Page 4

3. Geographic Analysis
3.1. Methodology
The City of Palo Alto provides several different kinds of utility services, including electricity, water, waste water, gas and fiber optic facilities. As a result, it has an excellent database that contains utility usage and location information for businesses and residences in the City.
The beginning assumption was that existing dark fiber customers would generally share a common electricity usage profile. Electrical usage patterns are good rough indicators of broadband service potential. In general, larger companies have larger broadband needs and use larger amounts of electricity. Specifically, the more data a company transmits and receives, the more electricity-consuming devices are necessary to generate, process and access it.
Once the profile was determined, other businesses within the City with similar profiles could be identified, and then located relative to the existing fiber network.
A preliminary list of potential dark fiber customers within reach of the existing network could then be developed and preliminary identification made of any clusters of potential dark fiber customers that are not currently reachable.
3.2. Utility Database Analysis
The analysis began with a spreadsheet drawn from the utility customer database by CPAU staff, which showed the Fiscal Year 2010 billing amounts and rate codes for each utility contract account number. The data were reorganized to show the billing information, the electric rate code and status as a fiber customer for each account number.
The data were sorted and tallied by electric rate code, and the result is shown in Table 2.1.
Of the 61 account numbers with current or past fiber service, 14 also had electric rate codes attached. Of those, one was large commercial, one was small commercial and 12 were medium commercial.
The remaining 47 were matched by address to electric accounts. Most of these fiber service accounts are attributable to resellers, which license fiber from CPAU to deliver broadband services.
! City of Palo Alto Fiber Market Research Report
19 May 2011! Tellus Venture Associates! Page 5
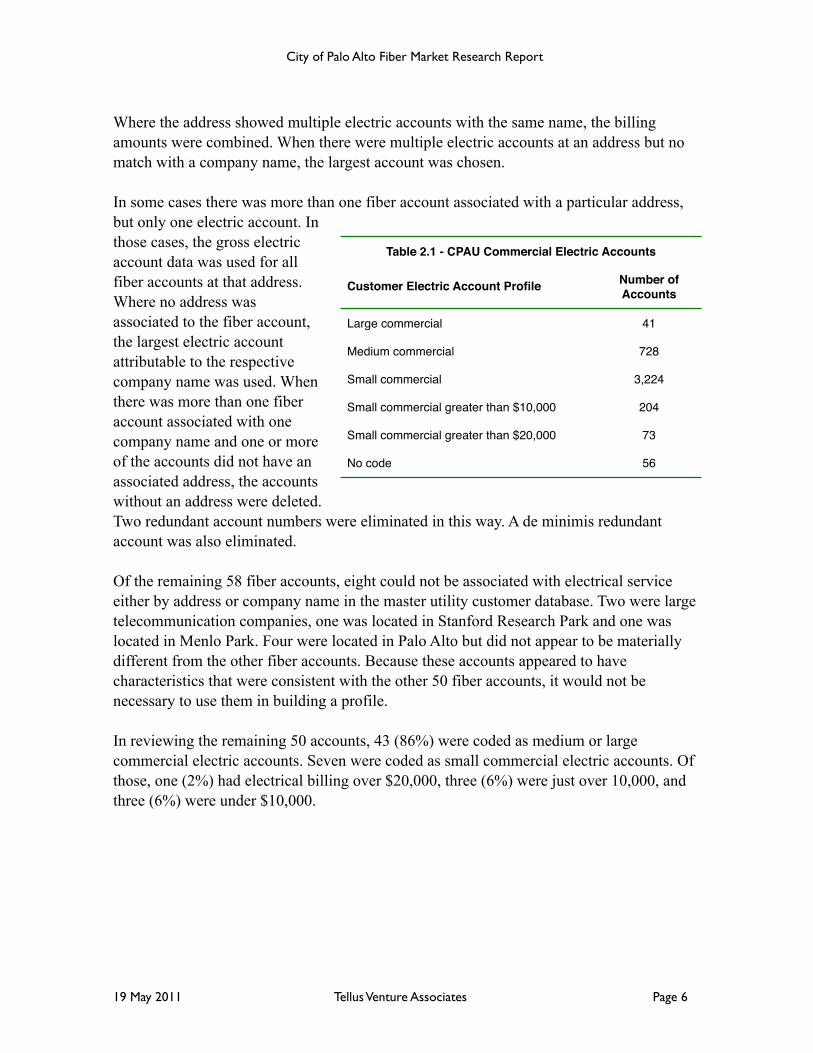
Where the address showed multiple electric accounts with the same name, the billing amounts were combined. When there were multiple electric accounts at an address but no match with a company name, the largest account was chosen.
In some cases there was more than one fiber account associated with a particular address, but only one electric account. In those cases, the gross electric account data was used for all fiber accounts at that address. Where no address was associated to the fiber account, the largest electric account attributable to the respective company name was used. When there was more than one fiber account associated with one company name and one or more of the accounts did not have an associated address, the accounts without an address were deleted. Two redundant account numbers were eliminated in this way. A de minimis redundant account was also eliminated.
Of the remaining 58 fiber accounts, eight could not be associated with electrical service either by address or company name in the master utility customer database. Two were large telecommunication companies, one was located in Stanford Research Park and one was located in Menlo Park. Four were located in Palo Alto but did not appear to be materially different from the other fiber accounts. Because these accounts appeared to have characteristics that were consistent with the other 50 fiber accounts, it would not be necessary to use them in building a profile.
In reviewing the remaining 50 accounts, 43 (86%) were coded as medium or large commercial electric accounts. Seven were coded as small commercial electric accounts. Of those, one (2%) had electrical billing over $20,000, three (6%) were just over 10,000, and three (6%) were under $10,000.
! City of Palo Alto Fiber Market Research Report
19 May 2011! Tellus Venture Associates! Page 6
Table 2.1 - CPAU Commercial Electric AccountsTable 2.1 - CPAU Commercial Electric Accounts
Customer Electric Account Profile Number of Accounts
Large commercial 41
Medium commercial 728
Small commercial 3,224
Small commercial greater than $10,000 204
Small commercial greater than $20,000 73
No code 56
For the purposes of the preliminary evaluation, the master database was sorted into six discrete types:
A. Large commercial electric accounts.B. Medium commercial electric accounts.C. Small commercial accounts with electric billing greater than or equal to $20,000.D. Small commercial accounts with electric billing greater than or equal to $10,000
and less than $20,000.E. Small commercial accounts with electric billing less than $10,000.F. Existing fiber accounts.
Electric accounts with no associated address were deleted from the database and not used in the analysis.
3.3. Mapping
Using information provided by CPAU staff, a Geographic Information System-based (GIS) parcel map of the City was created. Existing fiber network routes, including identification of aerial plant, underground plant, service drops and connection points, were added to this map.
With the exception of existing fiber accounts, the location of commercial electric accounts were added to the database and labeled A through E, based on the types identified above. Existing fiber accounts were not included because maps showing those locations already exist and the objective of this mapping analysis was to identify potential new customers.
Two analyses were run. The first was to determine the number and location of commercial electric accounts within 200 meters of the existing fiber network which matched the electricity usage profile of existing fiber accounts, which was defined as large commercial accounts, medium commercial accounts and small commercial accounts with billing greater than or equal to $20,000 (Types A, B and C). Two hundred meters was chosen as being a reasonable distance for a service drop connection; however as a check accounts within 50 and 100 meters were also mapped.
The second analysis determined the number and location of all commercial electric accounts greater than 200 meters from the existing plant. Two sets of maps were produced, one showing all commercial electric accounts and the other showing just Types A, B and C.
These accounts were evaluated using GIS spatial analysis tools and the results are shown in Table 2.2. As an additional check, a second run was made showing accounts greater than 100 meters from the existing network, accounts within 50, 100 and 200 meters of existing
! City of Palo Alto Fiber Market Research Report
19 May 2011! Tellus Venture Associates! Page 7
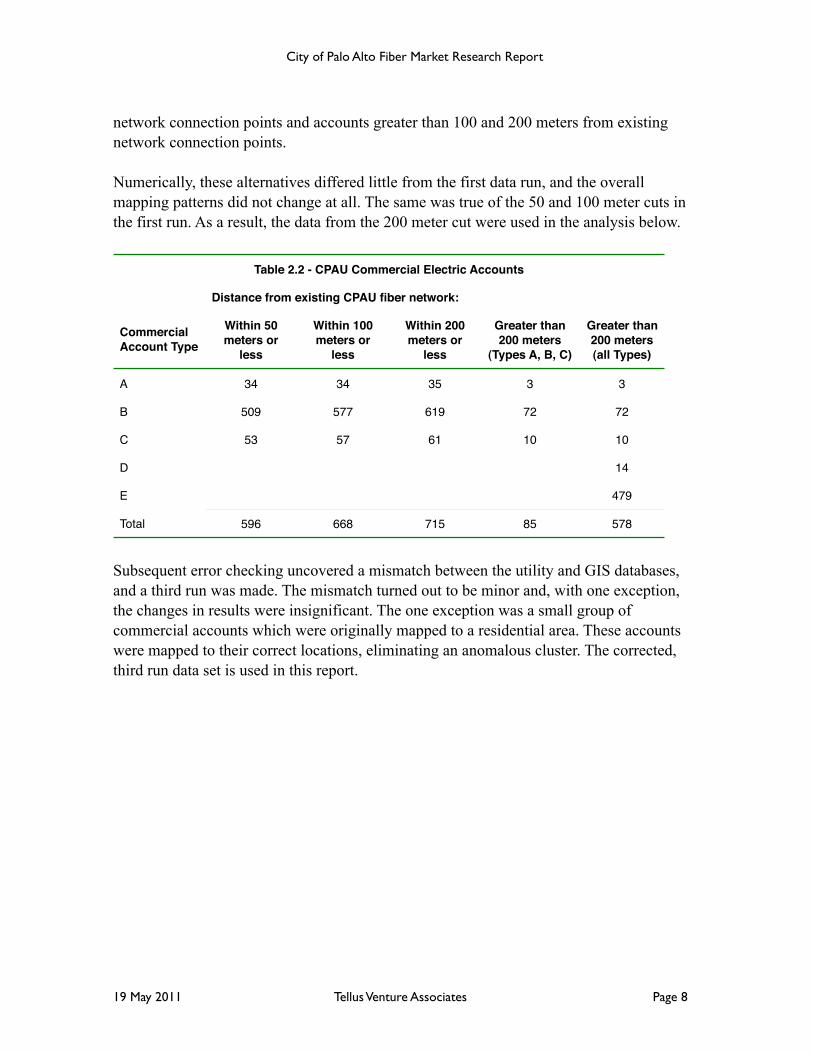
network connection points and accounts greater than 100 and 200 meters from existing network connection points.
Numerically, these alternatives differed little from the first data run, and the overall mapping patterns did not change at all. The same was true of the 50 and 100 meter cuts in the first run. As a result, the data from the 200 meter cut were used in the analysis below.
Table 2.2 - CPAU Commercial Electric AccountsTable 2.2 - CPAU Commercial Electric AccountsTable 2.2 - CPAU Commercial Electric AccountsTable 2.2 - CPAU Commercial Electric AccountsTable 2.2 - CPAU Commercial Electric AccountsTable 2.2 - CPAU Commercial Electric Accounts
Distance from existing CPAU fiber network:Distance from existing CPAU fiber network:Distance from existing CPAU fiber network:Distance from existing CPAU fiber network:Distance from existing CPAU fiber network:
Commercial Account Type
Within 50 meters or
less
Within 100 meters or
less
Within 200 meters or
less
Greater than 200 meters
(Types A, B, C)
Greater than 200 meters (all Types)
A 34 34 35 3 3
B 509 577 619 72 72
C 53 57 61 10 10
D 14
E 479
Total 596 668 715 85 578
Subsequent error checking uncovered a mismatch between the utility and GIS databases, and a third run was made. The mismatch turned out to be minor and, with one exception, the changes in results were insignificant. The one exception was a small group of commercial accounts which were originally mapped to a residential area. These accounts were mapped to their correct locations, eliminating an anomalous cluster. The corrected, third run data set is used in this report.
! City of Palo Alto Fiber Market Research Report
19 May 2011! Tellus Venture Associates! Page 8

4. Analysis of Existing Network
4.1. Overview
“There are definitely high-end online content users who need you and will find you.”Comment by a Palo Alto commercial property management executive.
Figure 4.1 - Fiber map of City of Palo Alto. Areas shaded blue are within 200 meters of existing CPAU network. Stanford Research Park and downtown Palo Alto are completely covered.
! City of Palo Alto Fiber Market Research Report
19 May 2011! Tellus Venture Associates! Page 9
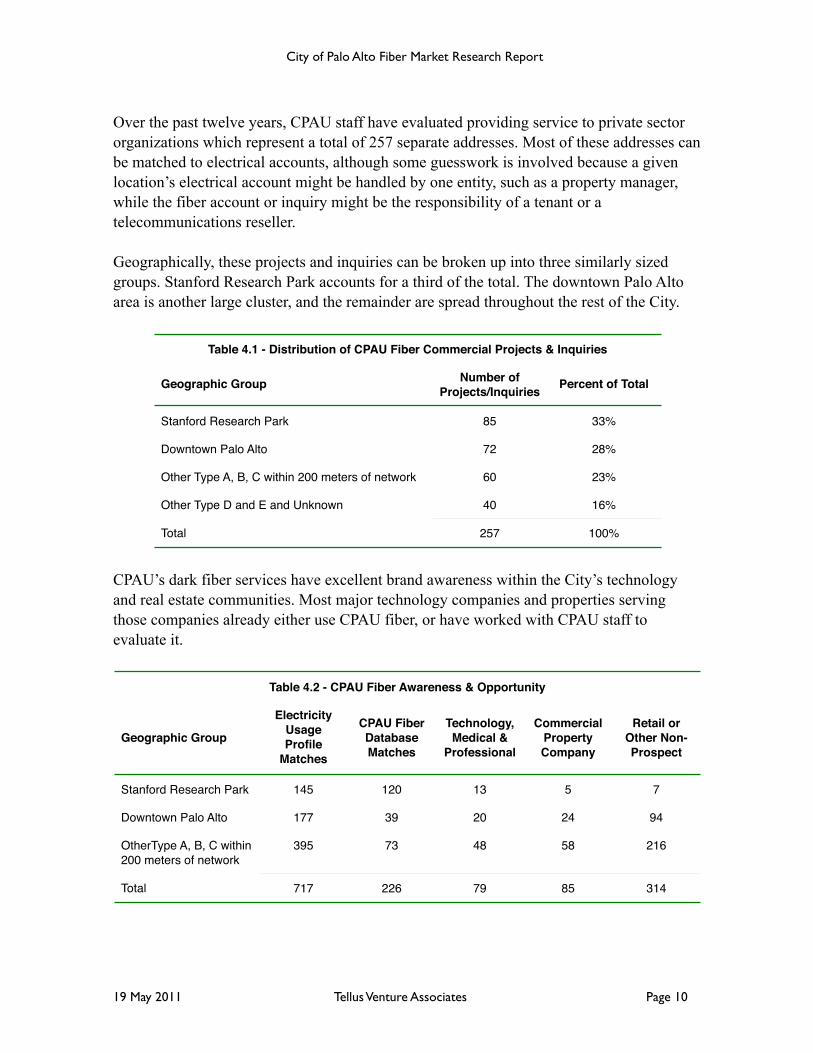
Over the past twelve years, CPAU staff have evaluated providing service to private sector organizations which represent a total of 257 separate addresses. Most of these addresses can be matched to electrical accounts, although some guesswork is involved because a given location’s electrical account might be handled by one entity, such as a property manager, while the fiber account or inquiry might be the responsibility of a tenant or a telecommunications reseller.
Geographically, these projects and inquiries can be broken up into three similarly sized groups. Stanford Research Park accounts for a third of the total. The downtown Palo Alto area is another large cluster, and the remainder are spread throughout the rest of the City.
Table 4.1 - Distribution of CPAU Fiber Commercial Projects & InquiriesTable 4.1 - Distribution of CPAU Fiber Commercial Projects & InquiriesTable 4.1 - Distribution of CPAU Fiber Commercial Projects & Inquiries
Geographic Group Number of Projects/Inquiries Percent of Total
Stanford Research Park 85 33%
Downtown Palo Alto 72 28%
Other Type A, B, C within 200 meters of network 60 23%
Other Type D and E and Unknown 40 16%
Total 257 100%
CPAU’s dark fiber services have excellent brand awareness within the City’s technology and real estate communities. Most major technology companies and properties serving those companies already either use CPAU fiber, or have worked with CPAU staff to evaluate it.
Table 4.2 - CPAU Fiber Awareness & OpportunityTable 4.2 - CPAU Fiber Awareness & OpportunityTable 4.2 - CPAU Fiber Awareness & OpportunityTable 4.2 - CPAU Fiber Awareness & OpportunityTable 4.2 - CPAU Fiber Awareness & OpportunityTable 4.2 - CPAU Fiber Awareness & Opportunity
Geographic Group
Electricity Usage Profile
Matches
CPAU Fiber Database Matches
Technology, Medical &
Professional
Commercial Property Company
Retail or Other Non-Prospect
Stanford Research Park 145 120 13 5 7
Downtown Palo Alto 177 39 20 24 94
OtherType A, B, C within 200 meters of network
395 73 48 58 216
Total 717 226 79 85 314
! City of Palo Alto Fiber Market Research Report
19 May 2011! Tellus Venture Associates! Page 10
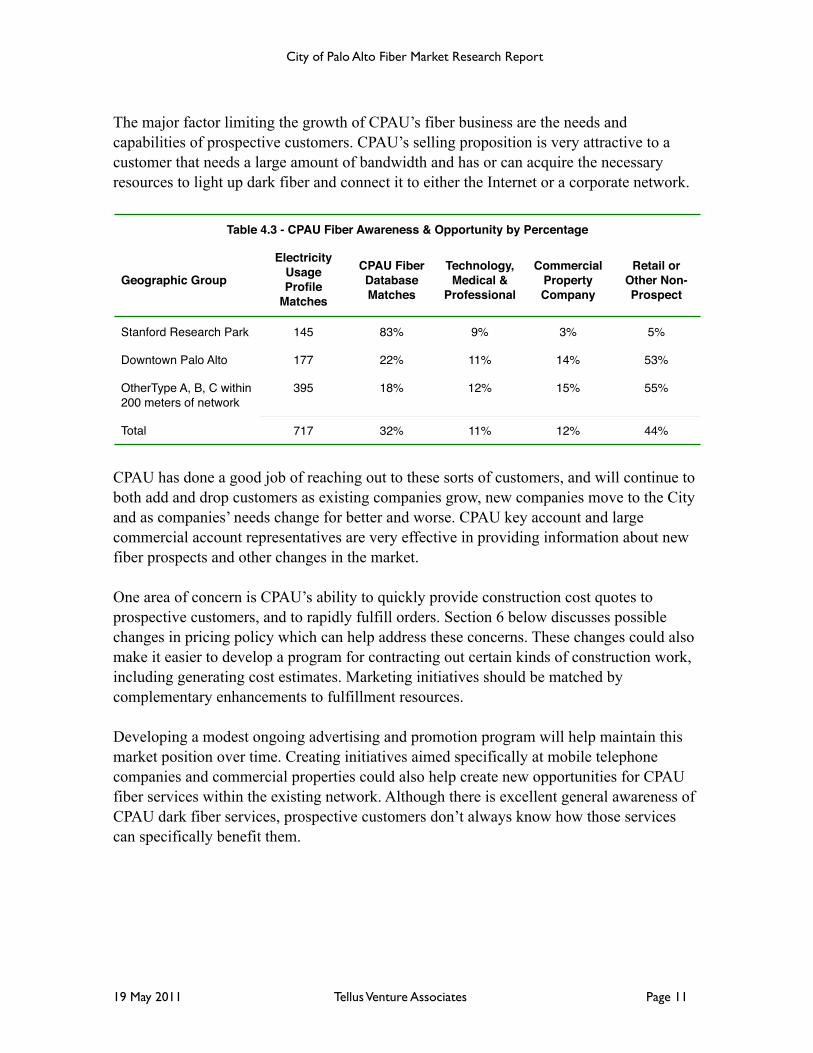
The major factor limiting the growth of CPAU’s fiber business are the needs and capabilities of prospective customers. CPAU’s selling proposition is very attractive to a customer that needs a large amount of bandwidth and has or can acquire the necessary resources to light up dark fiber and connect it to either the Internet or a corporate network.
Table 4.3 - CPAU Fiber Awareness & Opportunity by PercentageTable 4.3 - CPAU Fiber Awareness & Opportunity by PercentageTable 4.3 - CPAU Fiber Awareness & Opportunity by PercentageTable 4.3 - CPAU Fiber Awareness & Opportunity by PercentageTable 4.3 - CPAU Fiber Awareness & Opportunity by PercentageTable 4.3 - CPAU Fiber Awareness & Opportunity by Percentage
Geographic Group
Electricity Usage Profile
Matches
CPAU Fiber Database Matches
Technology, Medical &
Professional
Commercial Property Company
Retail or Other Non-Prospect
Stanford Research Park 145 83% 9% 3% 5%
Downtown Palo Alto 177 22% 11% 14% 53%
OtherType A, B, C within 200 meters of network
395 18% 12% 15% 55%
Total 717 32% 11% 12% 44%
CPAU has done a good job of reaching out to these sorts of customers, and will continue to both add and drop customers as existing companies grow, new companies move to the City and as companies’ needs change for better and worse. CPAU key account and large commercial account representatives are very effective in providing information about new fiber prospects and other changes in the market.
One area of concern is CPAU’s ability to quickly provide construction cost quotes to prospective customers, and to rapidly fulfill orders. Section 6 below discusses possible changes in pricing policy which can help address these concerns. These changes could also make it easier to develop a program for contracting out certain kinds of construction work, including generating cost estimates. Marketing initiatives should be matched by complementary enhancements to fulfillment resources.
Developing a modest ongoing advertising and promotion program will help maintain this market position over time. Creating initiatives aimed specifically at mobile telephone companies and commercial properties could also help create new opportunities for CPAU fiber services within the existing network. Although there is excellent general awareness of CPAU dark fiber services, prospective customers don’t always know how those services can specifically benefit them.
! City of Palo Alto Fiber Market Research Report
19 May 2011! Tellus Venture Associates! Page 11
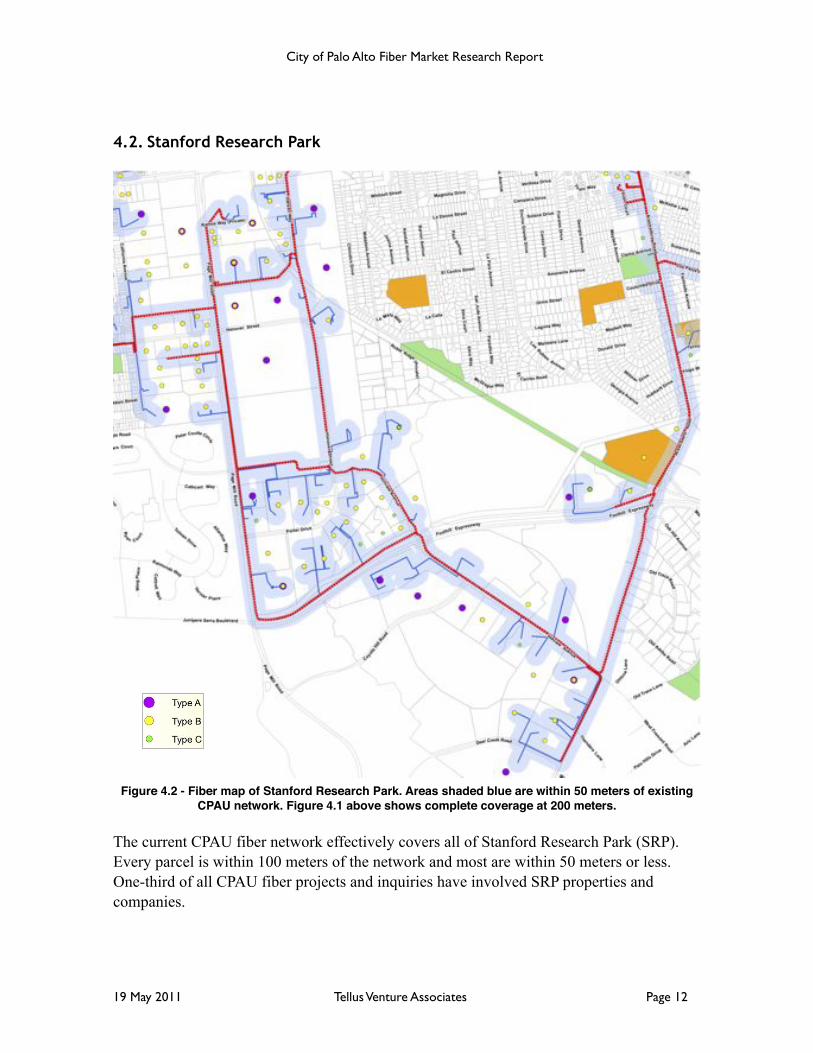
4.2. Stanford Research Park
Figure 4.2 - Fiber map of Stanford Research Park. Areas shaded blue are within 50 meters of existing CPAU network. Figure 4.1 above shows complete coverage at 200 meters.
The current CPAU fiber network effectively covers all of Stanford Research Park (SRP). Every parcel is within 100 meters of the network and most are within 50 meters or less. One-third of all CPAU fiber projects and inquiries have involved SRP properties and companies.
! City of Palo Alto Fiber Market Research Report
19 May 2011! Tellus Venture Associates! Page 12
SRP tenants seem to be well aware of the availability of dark fiber from the City. Eighty-three percent of the properties that match the electricity usage profile of existing fiber customers are either on the network already or have been investigated for connection to the City’s network or are controlled by companies that are past or present CPAU fiber customers.
Only 13 of the 144 profile matches are accounts that might be considered as immediate prospects. Of those, four are professional firms such as consultants or law firms that in all likelihood do not need large amounts of bandwidth. The remaining nine are made up of seven companies, three of which have FY2010 electrical billings of more than $100,000.
CPAU staff have been very effective in communicating with SRP tenants, and have achieved very high market share and awareness. If a program is developed to address large commercial property owners and managers, as discussed below, then SRP would be a good location to introduce it. The same would be true of any other general marketing initiative. Otherwise, current marketing and sales efforts should be maintained.
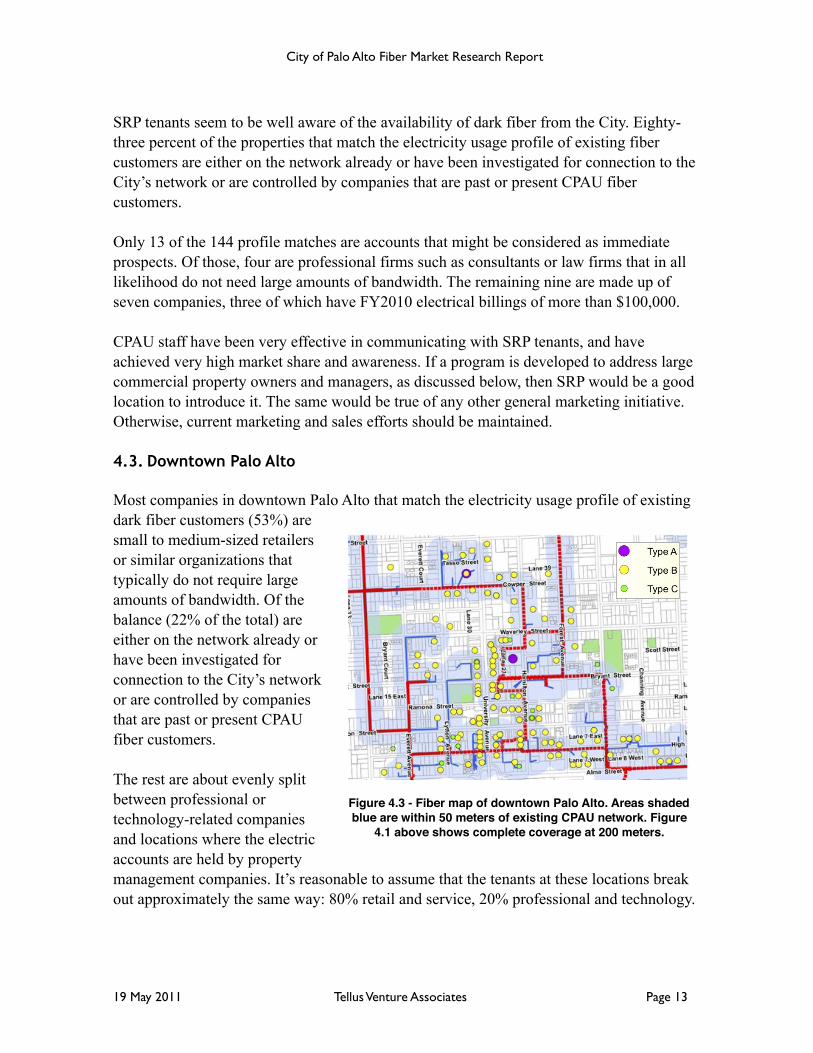
4.3. Downtown Palo Alto
Most companies in downtown Palo Alto that match the electricity usage profile of existing dark fiber customers (53%) are small to medium-sized retailers or similar organizations that typically do not require large amounts of bandwidth. Of the balance (22% of the total) are either on the network already or have been investigated for connection to the City’s network or are controlled by companies that are past or present CPAU fiber customers.
The rest are about evenly split between professional or technology-related companies and locations where the electric accounts are held by property management companies. It’s reasonable to assume that the tenants at these locations break out approximately the same way: 80% retail and service, 20% professional and technology.
! City of Palo Alto Fiber Market Research Report
19 May 2011! Tellus Venture Associates! Page 13
Figure 4.3 - Fiber map of downtown Palo Alto. Areas shaded blue are within 50 meters of existing CPAU network. Figure
4.1 above shows complete coverage at 200 meters.
Adding in an allowance for tenants of property management companies, that leads to a rough estimate of approximately 25 sales prospects in downtown Palo Alto that have business and electricity usage profiles that are similar to existing CPAU fiber customers. Two are large telecommunications companies, the rest are mostly small to mid-sized companies with FY 2010 electricity billing in the low five-figure range.
The current CPAU marketing program appears to be very effective in downtown Palo Alto. Along with Stanford Research Park, the downtown area would be a good place to try out any new marketing initiatives that might be developed. Even so, maintaining current efforts should continue to produce good results.
4.4. Technology, Medical and Professional
Technology companies, medical research and treatment organizations and professional firms comprise the bulk of current CPAU dark fiber customers. Although CPAU’s general citywide market share and awareness within these companies is slightly less than in the downtown area, it is still relatively high.
Eighteen percent of profile-matching accounts outside of Stanford Research Park and the downtown area are either on the network already or have been investigated for connection to the City’s network or are controlled by companies that are past or present CPAU fiber customers. Similar to the downtown area, 55% are retail, service or other companies that are not typically heavy consumers of bandwidth.
Of the remainder, 58 are represented by property management companies, which are discussed in the next section and 48 can be characterized as technology, medical or professional service firms.
Two of these accounts are large telecommunications providers. The remaining 46 accounts are composed of 35 different companies. Twelve had FY 2010 electricity billings of more than $50,000, one of those was over $1 million and four others were more than $100,000.
These 35 companies represent a wide cross section of industry sectors and would have widely varying bandwidth needs. It is likely, however, that some are prospective customers and should be contacted as time permits.
CPAU dark fiber services seem to have very good market penetration and awareness within technology, medical and professional firms throughout the City. Current sales and marketing efforts appear to be very effective in that regard.
! City of Palo Alto Fiber Market Research Report
19 May 2011! Tellus Venture Associates! Page 14
That said, Palo Alto is a magnet for both startup and established technology and medical companies, and the employee turnover within those companies is high. An ongoing program of targeted advertising and promotions and co-marketing efforts with select organizations would be useful in maintaining awareness and generating additional business for both CPAU and its telecommunications reseller customers.
4.5. Commercial Properties
Property management companies control approximately one-eighth of the electric accounts matching the profile of current fiber customers. In many cases, the tenants are small to medium sized firms. Typically the individual bandwidth needs of these companies are moderate, but can be significantly large when aggregated.
Some large companies or property managers, for example Stanford University or Space Systems-Loral, have considerable in-house information technology resources to complement their high demand for bandwidth. Most office and retail developments, however, do not.
One property management executive said that cost would be a determining factor for traditional tenants such as smaller professional services companies. But, he said, there appears to be a long term shift toward laboratory and medical device firms which could have more intensive bandwidth needs.
Another manager of large commercial properties in Palo Alto said he believed CPAU could achieve market penetration of 30% or more of office tenants in downtown if the monthly fee was $1,000 or less and installation costs were a few hundred dollars.
It could be possible to work directly with owners of large commercial properties or telecommunications resellers to bring CPAU fiber into office complexes. The model might involve CPAU (or an outside contractor) constructing a service drop to an access point on or near a given building. Then the property owner or, more likely, a telecommunications reseller would pull fiber inside to a managed hub. The economics of this “fiber to the basement” model are examined in Section 6 below, and could be explored further via an RFP process.
4.6. Telecommunications Companies
There are three primary types of telecommunications companies doing business in Palo Alto: mobile phone companies, facilities-based carriers and telecommunications resellers.
! City of Palo Alto Fiber Market Research Report
19 May 2011! Tellus Venture Associates! Page 15
CPAU is a direct competitor to facilities based carriers. Even so, one is a current dark fiber customer, and others might be if they had a specific problem that CPAU could solve. However, it can be assumed that these carriers are aware of CPAU’s network and little needs to be done other than maintaining a cordial professional relationship.
At the other end of the spectrum, CPAU already has an excellent customer base of telecommunications resellers. As discussed below, an ongoing marketing program aimed at maintaining CPAU’s brand awareness within closely targeted industry segments such as the mobile telecommunications sector would be useful.
Mobile telephone and broadband companies fall somewhere in between. Presently, CPAU is not directly providing fiber to any mobile companies. However, backhaul bandwidth is rapidly becoming a critical bottleneck for that industry. A Sacramento-area fiber company, Surewest, is currently generating $1 million per year by filling those gaps and expects to grow this business to $2 or $3 million per year in the near term. In Palo Alto, AT&T is already building 80 new small cell sites on utility poles.
Although companies with nationwide operations prefer nationwide vendors, there are no perfect broadband backhaul solutions. Telecommunications companies have local and regional staff who have to solve specific and unique problems on a daily basis. As Surewest has discovered, it is particularly true in the mobile telecommunications sector, where localized gaps in coverage frequently occur.
CPAU staff is already looking at ways to directly target mobile telecommunications companies, and those efforts should be encouraged. As noted below, fiber network extensions would bring CPAU’s services within reach of more cellular facilities. The more complete the solution offered to a given mobile company, the more willing that company will be to consider it.
! City of Palo Alto Fiber Market Research Report
19 May 2011! Tellus Venture Associates! Page 16
5. Analysis of Unserved Market
“Palo Alto is unique in that tenants aren't price-focused. Quality and reliability, are more important than price, within reason.”Comment by a Palo Alto commercial property investor.
5.1. Identification of Unserved Areas
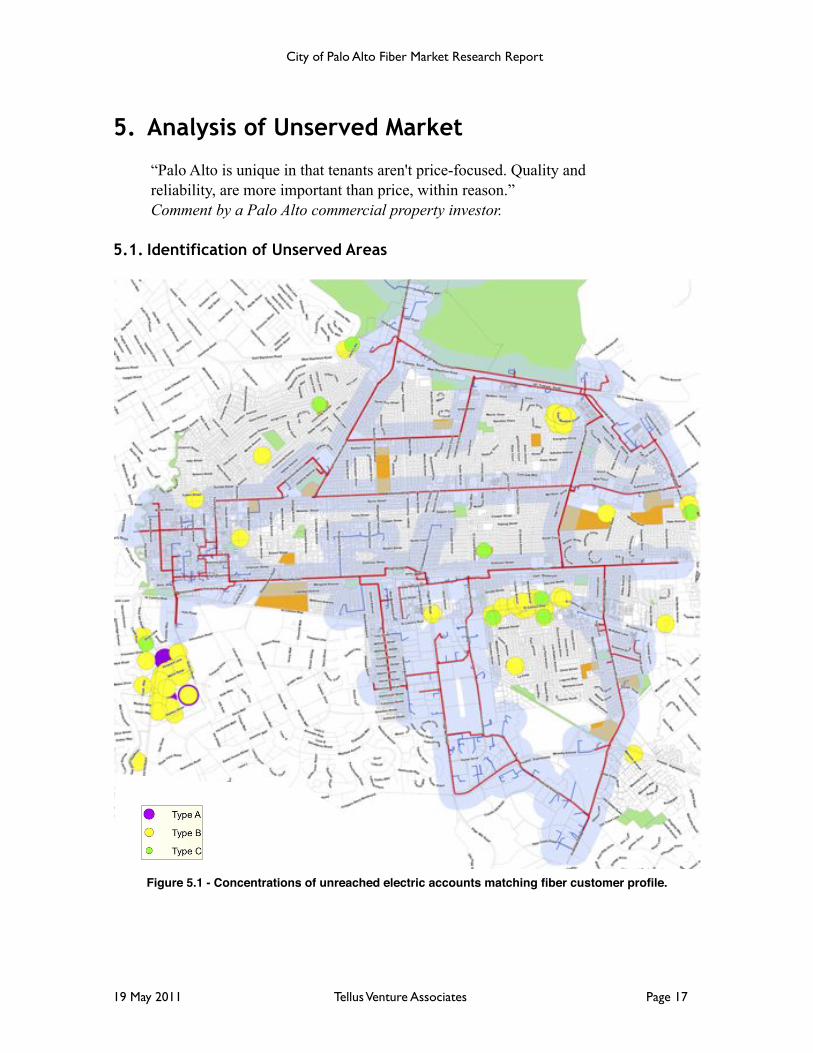
Figure 5.1 - Concentrations of unreached electric accounts matching fiber customer profile.
! City of Palo Alto Fiber Market Research Report
19 May 2011! Tellus Venture Associates! Page 17
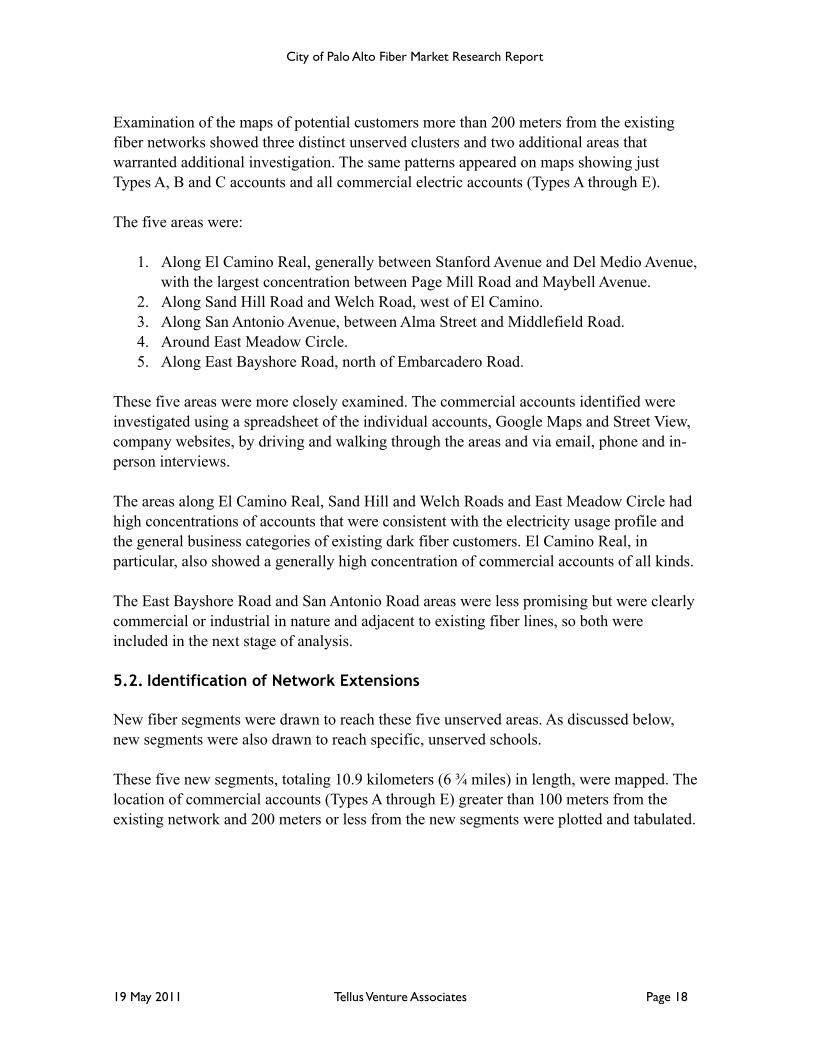
Examination of the maps of potential customers more than 200 meters from the existing fiber networks showed three distinct unserved clusters and two additional areas that warranted additional investigation. The same patterns appeared on maps showing just Types A, B and C accounts and all commercial electric accounts (Types A through E).
The five areas were:
1. Along El Camino Real, generally between Stanford Avenue and Del Medio Avenue, with the largest concentration between Page Mill Road and Maybell Avenue.
2. Along Sand Hill Road and Welch Road, west of El Camino.3. Along San Antonio Avenue, between Alma Street and Middlefield Road.4. Around East Meadow Circle.5. Along East Bayshore Road, north of Embarcadero Road.
These five areas were more closely examined. The commercial accounts identified were investigated using a spreadsheet of the individual accounts, Google Maps and Street View, company websites, by driving and walking through the areas and via email, phone and in-person interviews.
The areas along El Camino Real, Sand Hill and Welch Roads and East Meadow Circle had high concentrations of accounts that were consistent with the electricity usage profile and the general business categories of existing dark fiber customers. El Camino Real, in particular, also showed a generally high concentration of commercial accounts of all kinds.
The East Bayshore Road and San Antonio Road areas were less promising but were clearly commercial or industrial in nature and adjacent to existing fiber lines, so both were included in the next stage of analysis.
5.2. Identification of Network Extensions
New fiber segments were drawn to reach these five unserved areas. As discussed below, new segments were also drawn to reach specific, unserved schools.
These five new segments, totaling 10.9 kilometers (6 ! miles) in length, were mapped. The location of commercial accounts (Types A through E) greater than 100 meters from the existing network and 200 meters or less from the new segments were plotted and tabulated.
! City of Palo Alto Fiber Market Research Report
19 May 2011! Tellus Venture Associates! Page 18
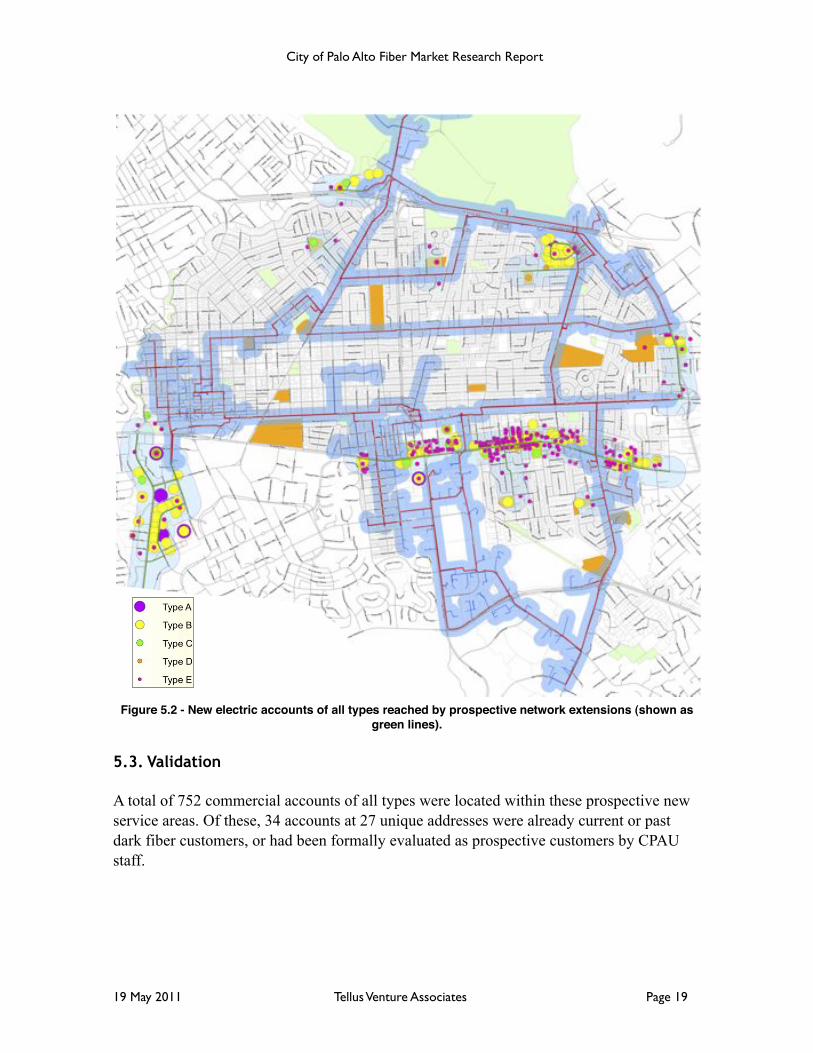
Figure 5.2 - New electric accounts of all types reached by prospective network extensions (shown as green lines).
5.3. Validation
A total of 752 commercial accounts of all types were located within these prospective new service areas. Of these, 34 accounts at 27 unique addresses were already current or past dark fiber customers, or had been formally evaluated as prospective customers by CPAU staff.
! City of Palo Alto Fiber Market Research Report
19 May 2011! Tellus Venture Associates! Page 19
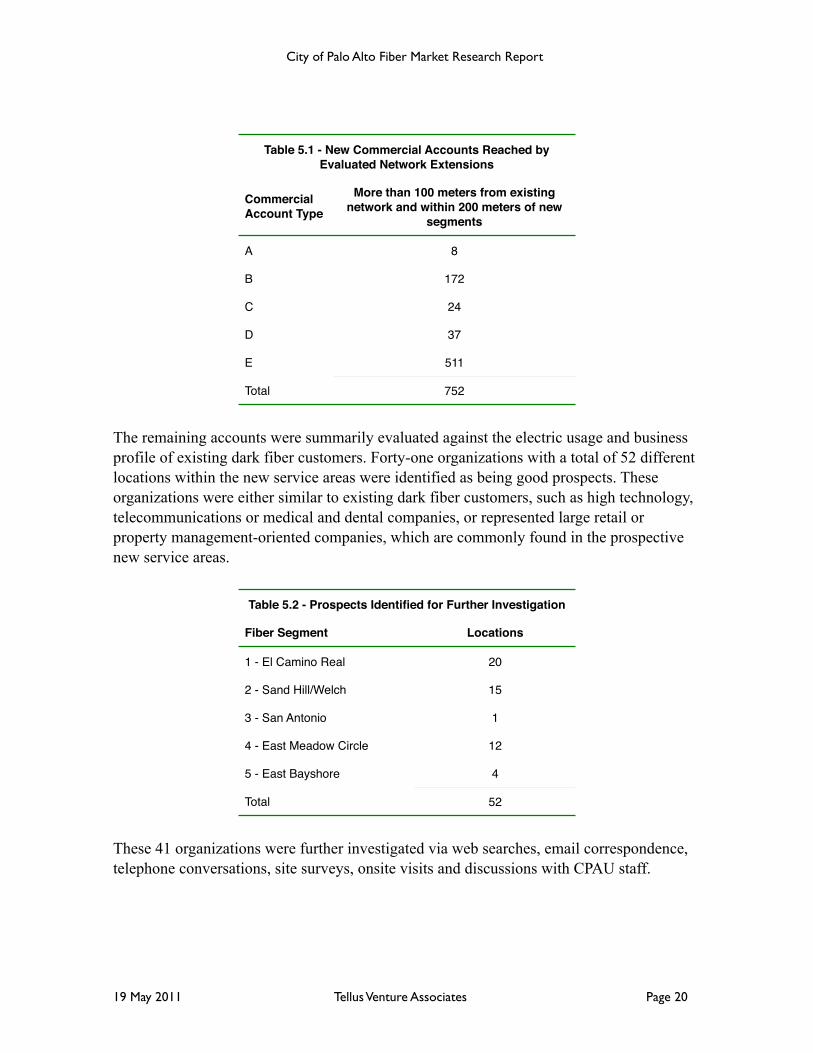
Table 5.1 - New Commercial Accounts Reached by Evaluated Network Extensions
Table 5.1 - New Commercial Accounts Reached by Evaluated Network Extensions
Commercial Account Type
More than 100 meters from existing network and within 200 meters of new
segments
A 8
B 172
C 24
D 37
E 511
Total 752
The remaining accounts were summarily evaluated against the electric usage and business profile of existing dark fiber customers. Forty-one organizations with a total of 52 different locations within the new service areas were identified as being good prospects. These organizations were either similar to existing dark fiber customers, such as high technology, telecommunications or medical and dental companies, or represented large retail or property management-oriented companies, which are commonly found in the prospective new service areas.
Table 5.2 - Prospects Identified for Further InvestigationTable 5.2 - Prospects Identified for Further Investigation
Fiber Segment Locations
1 - El Camino Real 20
2 - Sand Hill/Welch 15
3 - San Antonio 1
4 - East Meadow Circle 12
5 - East Bayshore 4
Total 52
These 41 organizations were further investigated via web searches, email correspondence, telephone conversations, site surveys, onsite visits and discussions with CPAU staff.
! City of Palo Alto Fiber Market Research Report
19 May 2011! Tellus Venture Associates! Page 20

5.4. Cost/Benefit Analysis
The cost of building the five potential network extension segments was estimated using a fiber construction cost range of $30 to $60 per foot. This range was provided by CPAU staff and is consistent with actual and estimated costs obtained from other fiber projects.
Table 5.3 - Cost Estimate of Network Extensions (000s)Table 5.3 - Cost Estimate of Network Extensions (000s)Table 5.3 - Cost Estimate of Network Extensions (000s)Table 5.3 - Cost Estimate of Network Extensions (000s)
Fiber segment Length (miles) Low cost($30/foot)
High cost($60/foot)
1 - El Camino Real 2.5 $393 $785
2 - Sand Hill/Welch 2.6 $407 $814
3 - San Antonio 0.7 $111 $222
4 - East Meadow Circle 0.7 $115 $231
5 - East Bayshore 0.3 $44 $87
Total 6.8 $1,069 $2,139
A penetration rate of 17% was used to estimate customer uptake on new segments. This rough estimate was calculated by taking the total number of profile matches in the existing network (704) and adding in the number of fiber accounts in that area (61) to get a total of 765 addressable accounts within the current network.
Table 5.4 - Estimated Revenue per Segment (000s)Table 5.4 - Estimated Revenue per Segment (000s)Table 5.4 - Estimated Revenue per Segment (000s)Table 5.4 - Estimated Revenue per Segment (000s)
Fiber segment 3 Years 5 Years 10 Years
1 - El Camino Real $156 $238 $411
2 - Sand Hill/Welch $53 $77 $129
3 - San Antonio $0 $0 $0
4 - East Meadow Circle $104 $159 $274
5 - East Bayshore $52 $79 $137
Total $365 $553 $951
This figure was then multiplied by 48%, which is the portion of the total that represent “good prospects” (current and past fiber customers, CPAU fiber database matches and
! City of Palo Alto Fiber Market Research Report
19 May 2011! Tellus Venture Associates! Page 21
technology, medical and professional organizations). The number of actual fiber accounts was divided by the result (367) to produce the estimated penetration rate.
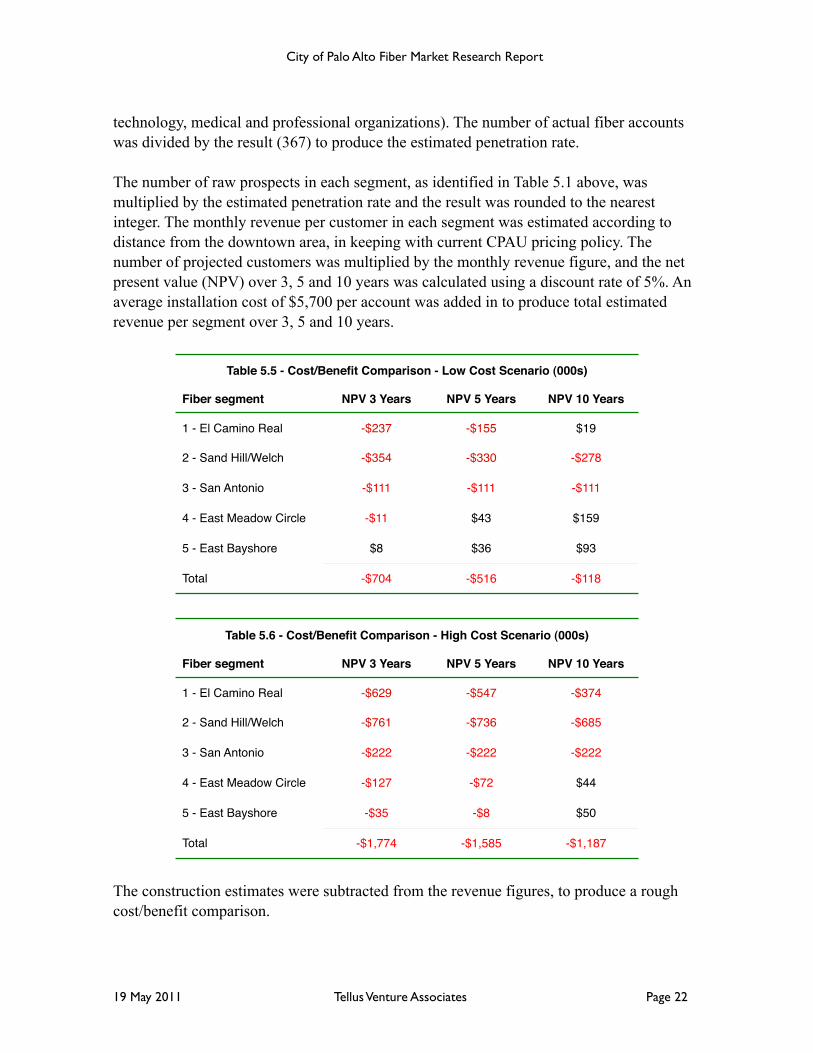
The number of raw prospects in each segment, as identified in Table 5.1 above, was multiplied by the estimated penetration rate and the result was rounded to the nearest integer. The monthly revenue per customer in each segment was estimated according to distance from the downtown area, in keeping with current CPAU pricing policy. The number of projected customers was multiplied by the monthly revenue figure, and the net present value (NPV) over 3, 5 and 10 years was calculated using a discount rate of 5%. An average installation cost of $5,700 per account was added in to produce total estimated revenue per segment over 3, 5 and 10 years.
Table 5.5 - Cost/Benefit Comparison - Low Cost Scenario (000s)Table 5.5 - Cost/Benefit Comparison - Low Cost Scenario (000s)Table 5.5 - Cost/Benefit Comparison - Low Cost Scenario (000s)Table 5.5 - Cost/Benefit Comparison - Low Cost Scenario (000s)
Fiber segment NPV 3 Years NPV 5 Years NPV 10 Years
1 - El Camino Real -$237 -$155 $19
2 - Sand Hill/Welch -$354 -$330 -$278
3 - San Antonio -$111 -$111 -$111
4 - East Meadow Circle -$11 $43 $159
5 - East Bayshore $8 $36 $93
Total -$704 -$516 -$118
Table 5.6 - Cost/Benefit Comparison - High Cost Scenario (000s)Table 5.6 - Cost/Benefit Comparison - High Cost Scenario (000s)Table 5.6 - Cost/Benefit Comparison - High Cost Scenario (000s)Table 5.6 - Cost/Benefit Comparison - High Cost Scenario (000s)
Fiber segment NPV 3 Years NPV 5 Years NPV 10 Years
1 - El Camino Real -$629 -$547 -$374
2 - Sand Hill/Welch -$761 -$736 -$685
3 - San Antonio -$222 -$222 -$222
4 - East Meadow Circle -$127 -$72 $44
5 - East Bayshore -$35 -$8 $50
Total -$1,774 -$1,585 -$1,187
The construction estimates were subtracted from the revenue figures, to produce a rough cost/benefit comparison.
! City of Palo Alto Fiber Market Research Report
19 May 2011! Tellus Venture Associates! Page 22
5.5. Evaluation by Segment
Segment 1 - El Camino Real
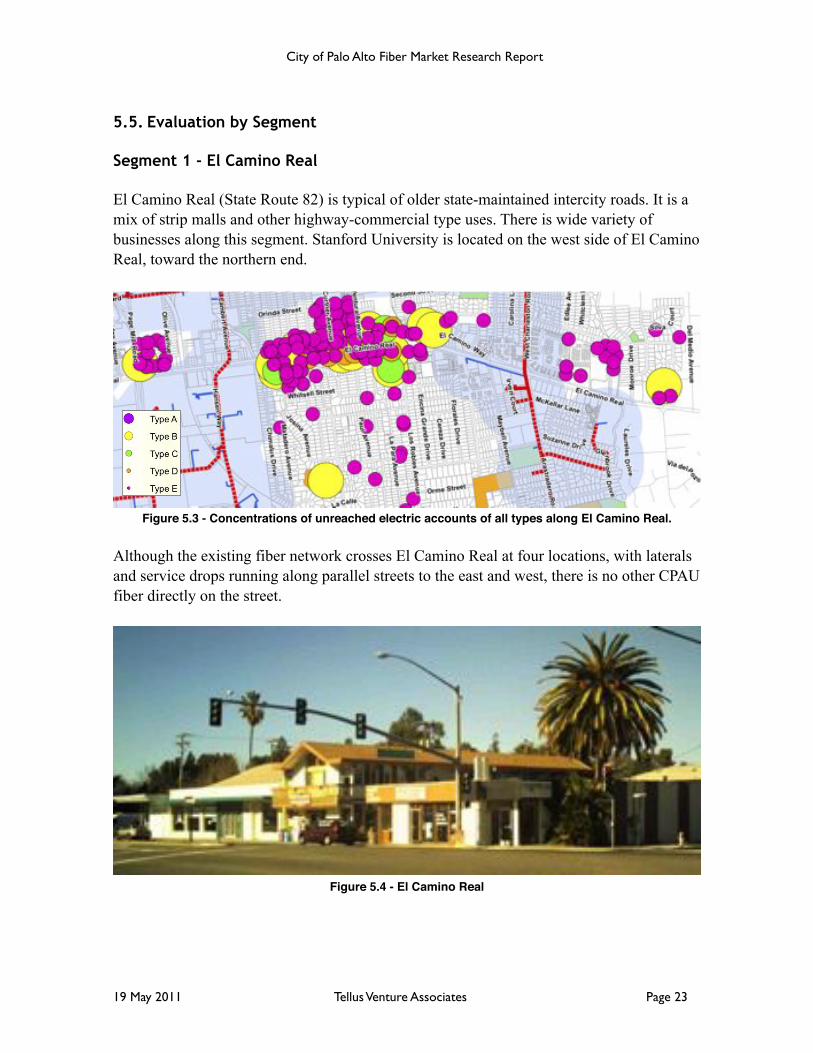
El Camino Real (State Route 82) is typical of older state-maintained intercity roads. It is a mix of strip malls and other highway-commercial type uses. There is wide variety of businesses along this segment. Stanford University is located on the west side of El Camino Real, toward the northern end.
Figure 5.3 - Concentrations of unreached electric accounts of all types along El Camino Real.
Although the existing fiber network crosses El Camino Real at four locations, with laterals and service drops running along parallel streets to the east and west, there is no other CPAU fiber directly on the street.
Figure 5.4 - El Camino Real
! City of Palo Alto Fiber Market Research Report
19 May 2011! Tellus Venture Associates! Page 23
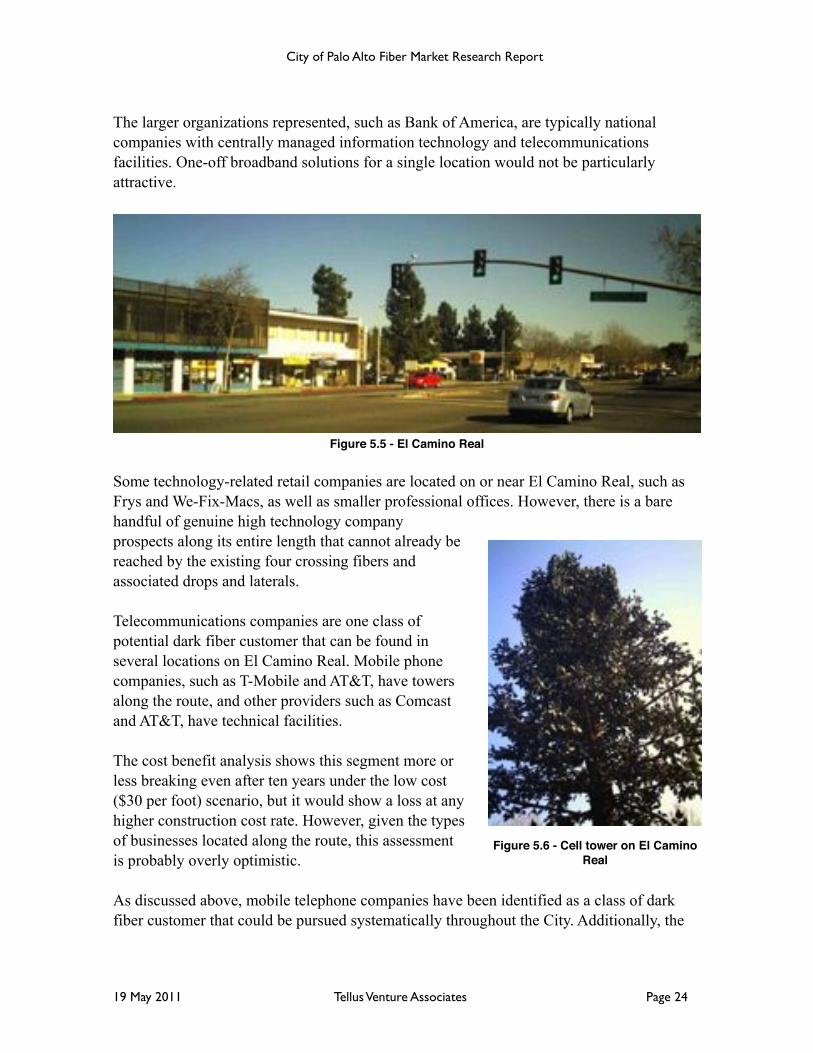
The larger organizations represented, such as Bank of America, are typically national companies with centrally managed information technology and telecommunications facilities. One-off broadband solutions for a single location would not be particularly attractive.
Figure 5.5 - El Camino Real
Some technology-related retail companies are located on or near El Camino Real, such as Frys and We-Fix-Macs, as well as smaller professional offices. However, there is a bare handful of genuine high technology company prospects along its entire length that cannot already be reached by the existing four crossing fibers and associated drops and laterals.
Telecommunications companies are one class of potential dark fiber customer that can be found in several locations on El Camino Real. Mobile phone companies, such as T-Mobile and AT&T, have towers along the route, and other providers such as Comcast and AT&T, have technical facilities.
The cost benefit analysis shows this segment more or less breaking even after ten years under the low cost ($30 per foot) scenario, but it would show a loss at any higher construction cost rate. However, given the types of businesses located along the route, this assessment is probably overly optimistic.
As discussed above, mobile telephone companies have been identified as a class of dark fiber customer that could be pursued systematically throughout the City. Additionally, the
! City of Palo Alto Fiber Market Research Report
19 May 2011! Tellus Venture Associates! Page 24
Figure 5.6 - Cell tower on El Camino Real
presence of fiber optic facilities could serve as an economic development resource for the area. Although the near-term prospects are less attractive, from an economic and business development point of view extending the CPAU fiber network along El Camino Real could be economically justified in the long run. However it does not appear to be justified based solely on current circumstances.
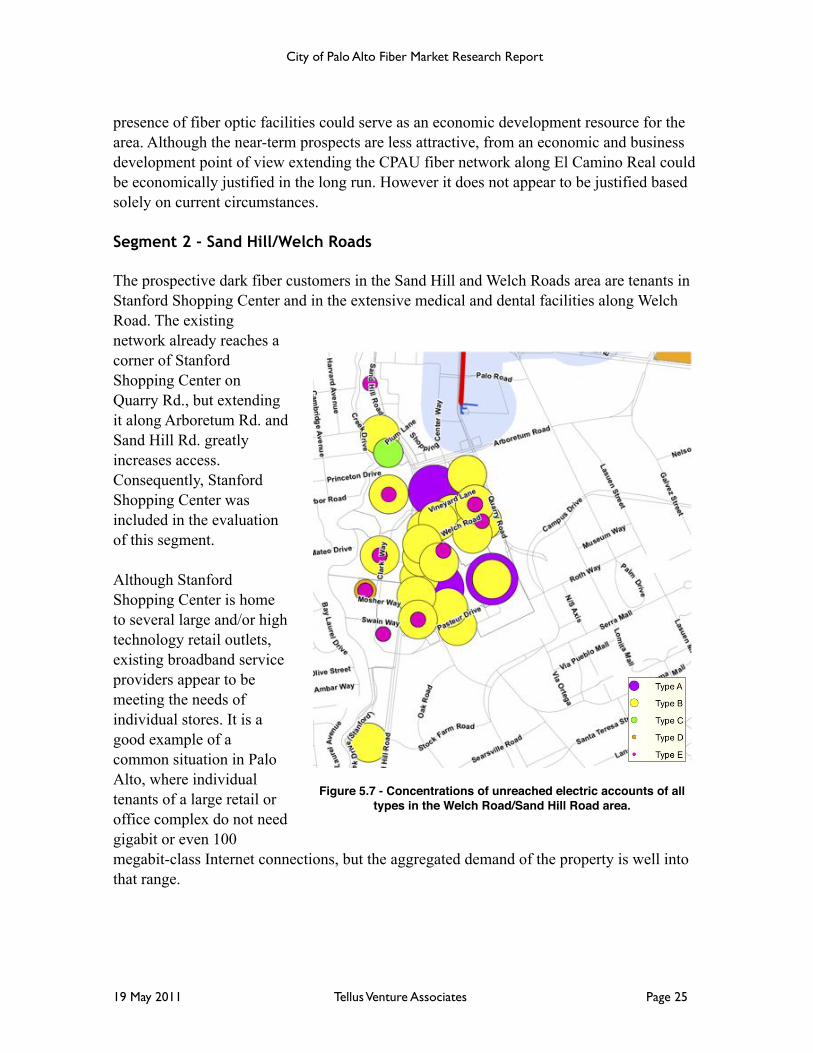
Segment 2 - Sand Hill/Welch Roads
The prospective dark fiber customers in the Sand Hill and Welch Roads area are tenants in Stanford Shopping Center and in the extensive medical and dental facilities along Welch Road. The existing network already reaches a corner of Stanford Shopping Center on Quarry Rd., but extending it along Arboretum Rd. and Sand Hill Rd. greatly increases access. Consequently, Stanford Shopping Center was included in the evaluation of this segment.
Although Stanford Shopping Center is home to several large and/or high technology retail outlets, existing broadband service providers appear to be meeting the needs of individual stores. It is a good example of a common situation in Palo Alto, where individual tenants of a large retail or office complex do not need gigabit or even 100 megabit-class Internet connections, but the aggregated demand of the property is well into that range.
! City of Palo Alto Fiber Market Research Report
19 May 2011! Tellus Venture Associates! Page 25
Figure 5.7 - Concentrations of unreached electric accounts of all types in the Welch Road/Sand Hill Road area.
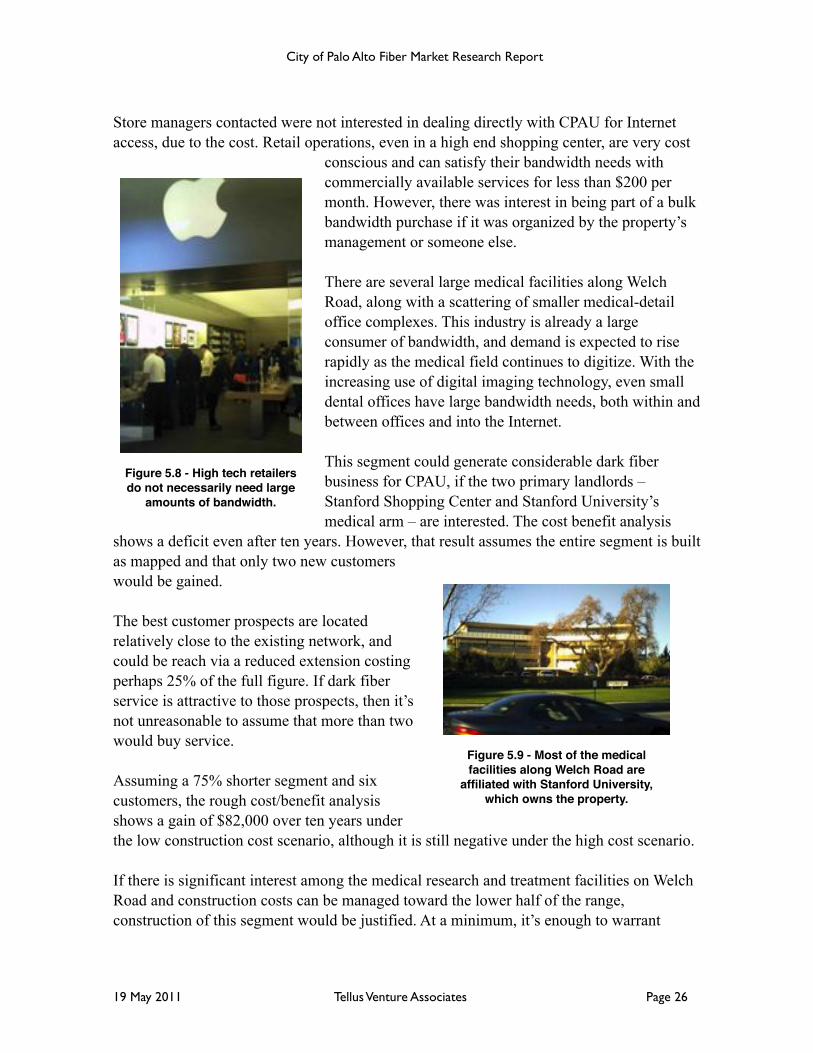
Store managers contacted were not interested in dealing directly with CPAU for Internet access, due to the cost. Retail operations, even in a high end shopping center, are very cost
conscious and can satisfy their bandwidth needs with commercially available services for less than $200 per month. However, there was interest in being part of a bulk bandwidth purchase if it was organized by the property’s management or someone else.
There are several large medical facilities along Welch Road, along with a scattering of smaller medical-detail office complexes. This industry is already a large consumer of bandwidth, and demand is expected to rise rapidly as the medical field continues to digitize. With the increasing use of digital imaging technology, even small dental offices have large bandwidth needs, both within and between offices and into the Internet.
This segment could generate considerable dark fiber business for CPAU, if the two primary landlords – Stanford Shopping Center and Stanford University’s medical arm – are interested. The cost benefit analysis
shows a deficit even after ten years. However, that result assumes the entire segment is built as mapped and that only two new customers would be gained.
The best customer prospects are located relatively close to the existing network, and could be reach via a reduced extension costing perhaps 25% of the full figure. If dark fiber service is attractive to those prospects, then it’s not unreasonable to assume that more than two would buy service.
Assuming a 75% shorter segment and six customers, the rough cost/benefit analysis shows a gain of $82,000 over ten years under the low construction cost scenario, although it is still negative under the high cost scenario.
If there is significant interest among the medical research and treatment facilities on Welch Road and construction costs can be managed toward the lower half of the range, construction of this segment would be justified. At a minimum, it’s enough to warrant
! City of Palo Alto Fiber Market Research Report
19 May 2011! Tellus Venture Associates! Page 26
Figure 5.8 - High tech retailers do not necessarily need large
amounts of bandwidth.
Figure 5.9 - Most of the medical facilities along Welch Road are
affiliated with Stanford University, which owns the property.
discussing the possibility with potential users, particularly Stanford University and Stanford Medical Center.
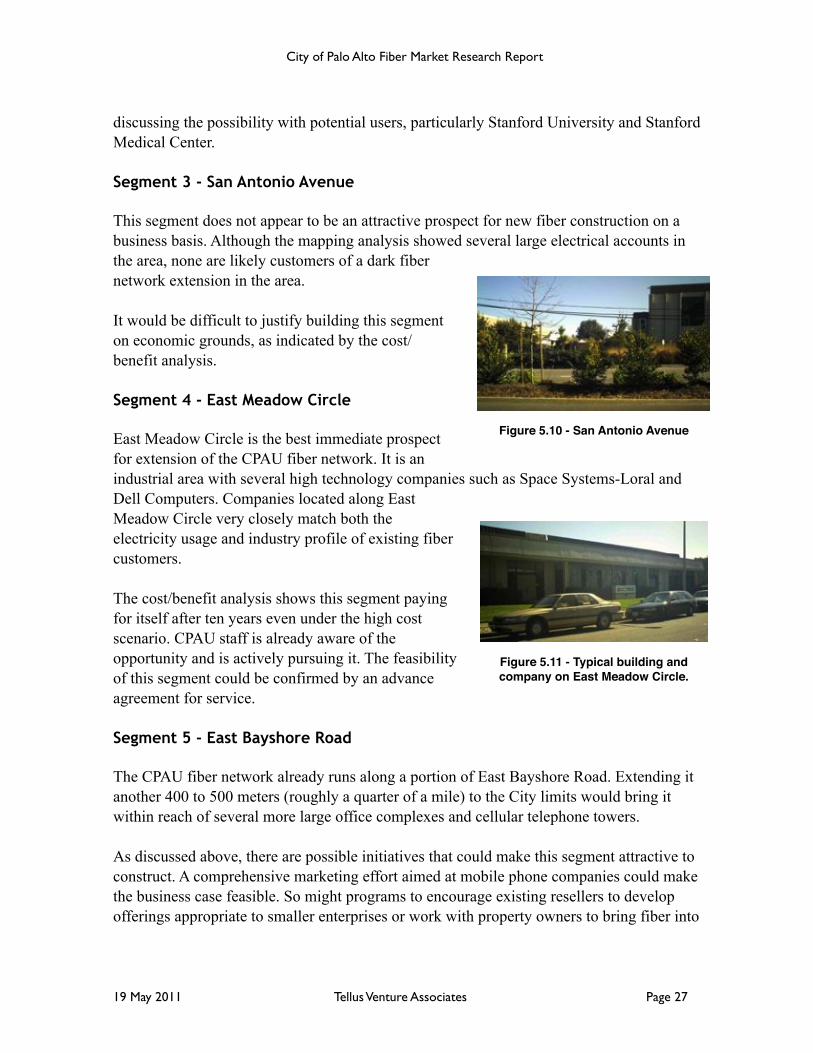
Segment 3 - San Antonio Avenue
This segment does not appear to be an attractive prospect for new fiber construction on a business basis. Although the mapping analysis showed several large electrical accounts in the area, none are likely customers of a dark fiber network extension in the area.
It would be difficult to justify building this segment on economic grounds, as indicated by the cost/benefit analysis.
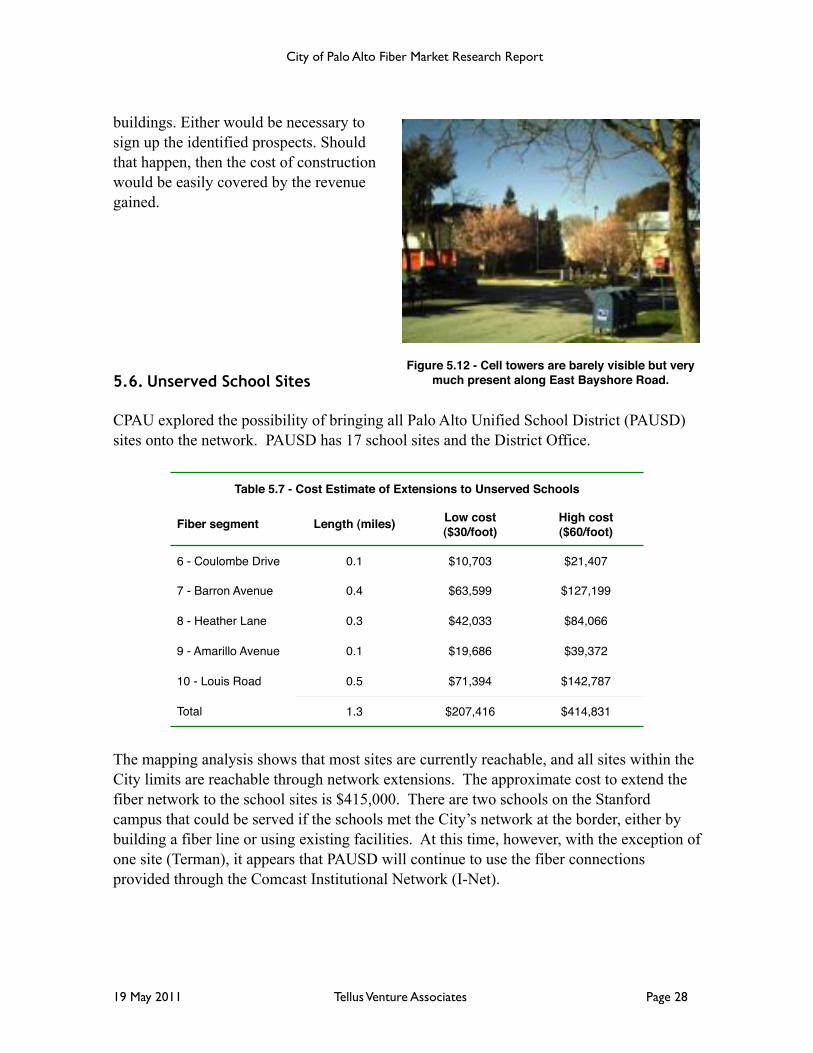
Segment 4 - East Meadow Circle
East Meadow Circle is the best immediate prospect for extension of the CPAU fiber network. It is an industrial area with several high technology companies such as Space Systems-Loral and Dell Computers. Companies located along East Meadow Circle very closely match both the electricity usage and industry profile of existing fiber customers.
The cost/benefit analysis shows this segment paying for itself after ten years even under the high cost scenario. CPAU staff is already aware of the opportunity and is actively pursuing it. The feasibility of this segment could be confirmed by an advance agreement for service.
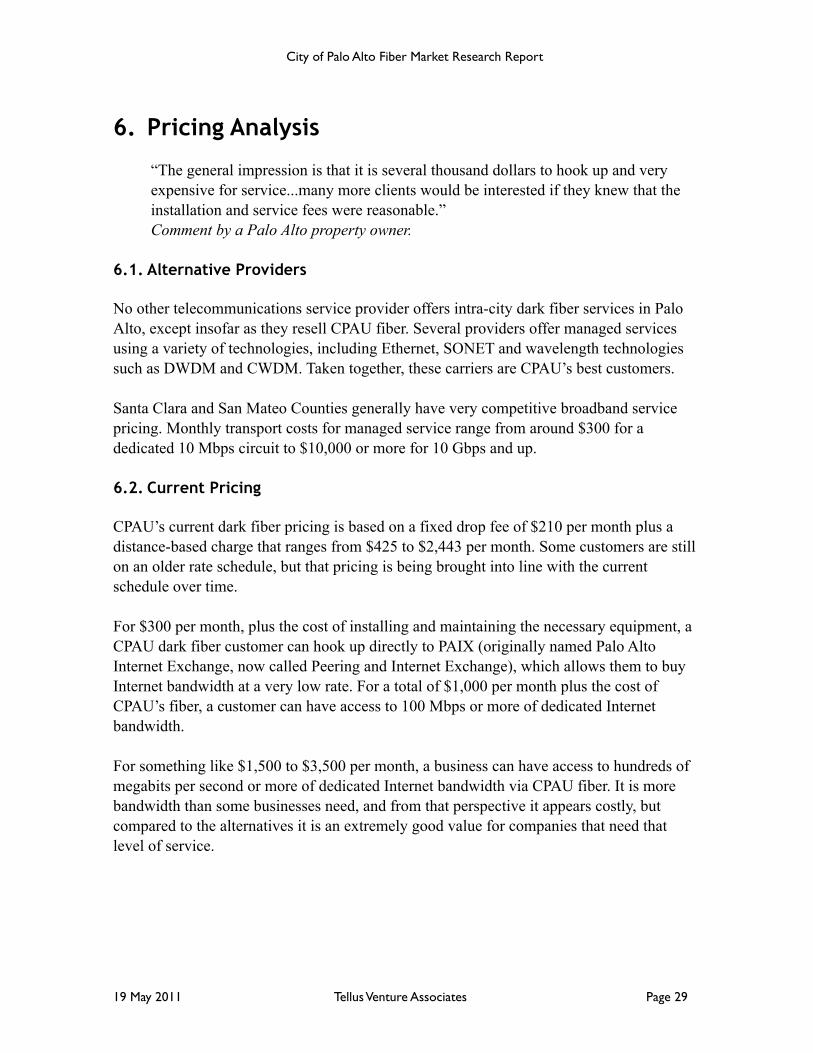
Segment 5 - East Bayshore Road
The CPAU fiber network already runs along a portion of East Bayshore Road. Extending it another 400 to 500 meters (roughly a quarter of a mile) to the City limits would bring it within reach of several more large office complexes and cellular telephone towers.
As discussed above, there are possible initiatives that could make this segment attractive to construct. A comprehensive marketing effort aimed at mobile phone companies could make the business case feasible. So might programs to encourage existing resellers to develop offerings appropriate to smaller enterprises or work with property owners to bring fiber into
! City of Palo Alto Fiber Market Research Report
19 May 2011! Tellus Venture Associates! Page 27
Figure 5.10 - San Antonio Avenue
Figure 5.11 - Typical building and company on East Meadow Circle.
buildings. Either would be necessary to sign up the identified prospects. Should that happen, then the cost of construction would be easily covered by the revenue gained.
5.6. Unserved School Sites
CPAU explored the possibility of bringing all Palo Alto Unified School District (PAUSD) sites onto the network. PAUSD has 17 school sites and the District Office.
Table 5.7 - Cost Estimate of Extensions to Unserved SchoolsTable 5.7 - Cost Estimate of Extensions to Unserved SchoolsTable 5.7 - Cost Estimate of Extensions to Unserved SchoolsTable 5.7 - Cost Estimate of Extensions to Unserved Schools
Fiber segment Length (miles) Low cost($30/foot)
High cost($60/foot)
6 - Coulombe Drive 0.1 $10,703 $21,407
7 - Barron Avenue 0.4 $63,599 $127,199
8 - Heather Lane 0.3 $42,033 $84,066
9 - Amarillo Avenue 0.1 $19,686 $39,372
10 - Louis Road 0.5 $71,394 $142,787
Total 1.3 $207,416 $414,831
The mapping analysis shows that most sites are currently reachable, and all sites within the City limits are reachable through network extensions. The approximate cost to extend the fiber network to the school sites is $415,000. There are two schools on the Stanford campus that could be served if the schools met the City’s network at the border, either by building a fiber line or using existing facilities. At this time, however, with the exception of one site (Terman), it appears that PAUSD will continue to use the fiber connections provided through the Comcast Institutional Network (I-Net).
! City of Palo Alto Fiber Market Research Report
19 May 2011! Tellus Venture Associates! Page 28
Figure 5.12 - Cell towers are barely visible but very much present along East Bayshore Road.
6. Pricing Analysis
“The general impression is that it is several thousand dollars to hook up and very expensive for service...many more clients would be interested if they knew that the installation and service fees were reasonable.”Comment by a Palo Alto property owner.
6.1. Alternative Providers
No other telecommunications service provider offers intra-city dark fiber services in Palo Alto, except insofar as they resell CPAU fiber. Several providers offer managed services using a variety of technologies, including Ethernet, SONET and wavelength technologies such as DWDM and CWDM. Taken together, these carriers are CPAU’s best customers.
Santa Clara and San Mateo Counties generally have very competitive broadband service pricing. Monthly transport costs for managed service range from around $300 for a dedicated 10 Mbps circuit to $10,000 or more for 10 Gbps and up.
6.2. Current Pricing
CPAU’s current dark fiber pricing is based on a fixed drop fee of $210 per month plus a distance-based charge that ranges from $425 to $2,443 per month. Some customers are still on an older rate schedule, but that pricing is being brought into line with the current schedule over time.
For $300 per month, plus the cost of installing and maintaining the necessary equipment, a CPAU dark fiber customer can hook up directly to PAIX (originally named Palo Alto Internet Exchange, now called Peering and Internet Exchange), which allows them to buy Internet bandwidth at a very low rate. For a total of $1,000 per month plus the cost of CPAU’s fiber, a customer can have access to 100 Mbps or more of dedicated Internet bandwidth.
For something like $1,500 to $3,500 per month, a business can have access to hundreds of megabits per second or more of dedicated Internet bandwidth via CPAU fiber. It is more bandwidth than some businesses need, and from that perspective it appears costly, but compared to the alternatives it is an extremely good value for companies that need that level of service.
! City of Palo Alto Fiber Market Research Report
19 May 2011! Tellus Venture Associates! Page 29
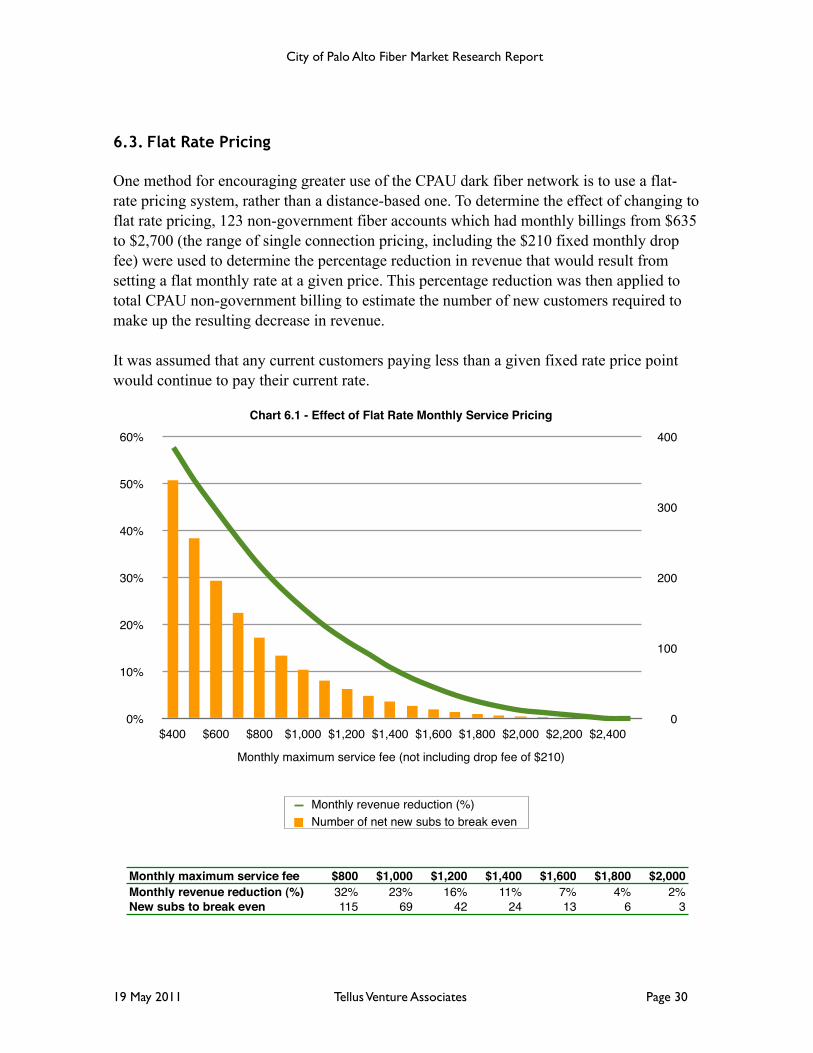
6.3. Flat Rate Pricing
One method for encouraging greater use of the CPAU dark fiber network is to use a flat-rate pricing system, rather than a distance-based one. To determine the effect of changing to flat rate pricing, 123 non-government fiber accounts which had monthly billings from $635 to $2,700 (the range of single connection pricing, including the $210 fixed monthly drop fee) were used to determine the percentage reduction in revenue that would result from setting a flat monthly rate at a given price. This percentage reduction was then applied to total CPAU non-government billing to estimate the number of new customers required to make up the resulting decrease in revenue.
It was assumed that any current customers paying less than a given fixed rate price point would continue to pay their current rate.
Monthly maximum service fee $800 $1,000 $1,200 $1,400 $1,600 $1,800 $2,000Monthly revenue reduction (%) 32% 23% 16% 11% 7% 4% 2%New subs to break even 115 69 42 24 13 6 3
0%
10%
20%
30%
40%
50%
60%
$400 $600 $800 $1,000 $1,200 $1,400 $1,600 $1,800 $2,000 $2,200 $2,4000
100
200
300
400Chart 6.1 - Effect of Flat Rate Monthly Service Pricing
Monthly maximum service fee (not including drop fee of $210)
Monthly revenue reduction (%)Number of net new subs to break even
! City of Palo Alto Fiber Market Research Report
19 May 2011! Tellus Venture Associates! Page 30
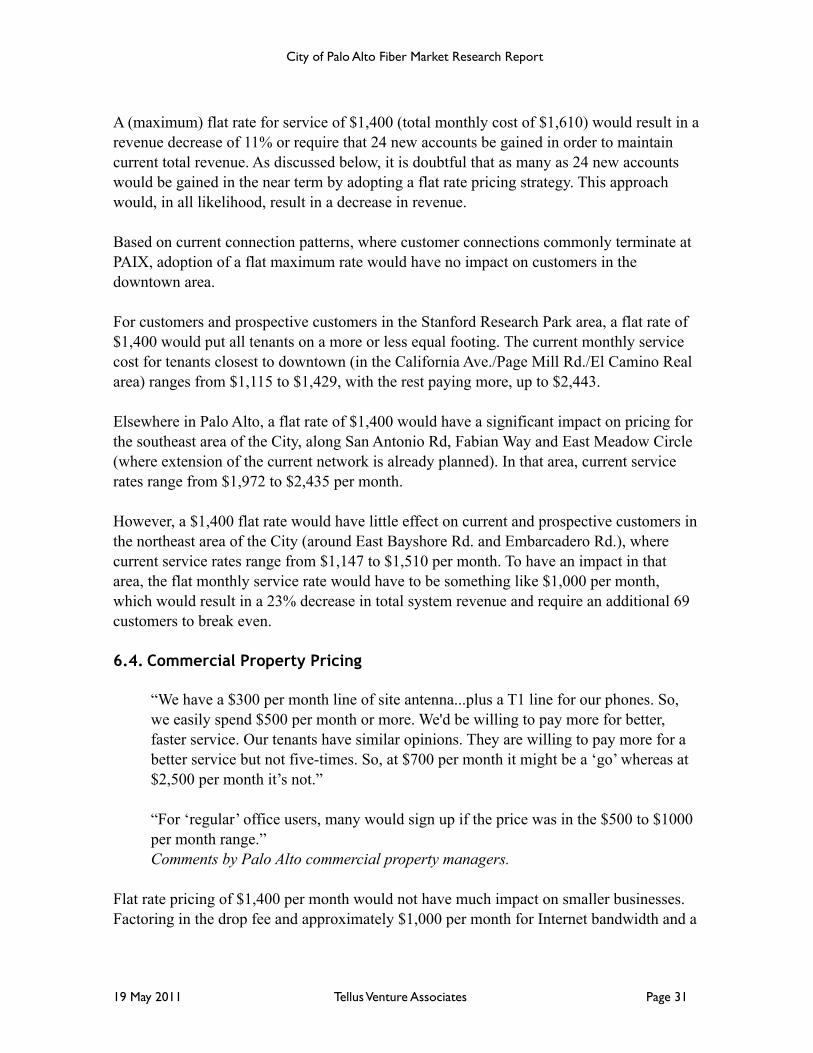
A (maximum) flat rate for service of $1,400 (total monthly cost of $1,610) would result in a revenue decrease of 11% or require that 24 new accounts be gained in order to maintain current total revenue. As discussed below, it is doubtful that as many as 24 new accounts would be gained in the near term by adopting a flat rate pricing strategy. This approach would, in all likelihood, result in a decrease in revenue.
Based on current connection patterns, where customer connections commonly terminate at PAIX, adoption of a flat maximum rate would have no impact on customers in the downtown area.
For customers and prospective customers in the Stanford Research Park area, a flat rate of $1,400 would put all tenants on a more or less equal footing. The current monthly service cost for tenants closest to downtown (in the California Ave./Page Mill Rd./El Camino Real area) ranges from $1,115 to $1,429, with the rest paying more, up to $2,443.
Elsewhere in Palo Alto, a flat rate of $1,400 would have a significant impact on pricing for the southeast area of the City, along San Antonio Rd, Fabian Way and East Meadow Circle (where extension of the current network is already planned). In that area, current service rates range from $1,972 to $2,435 per month.
However, a $1,400 flat rate would have little effect on current and prospective customers in the northeast area of the City (around East Bayshore Rd. and Embarcadero Rd.), where current service rates range from $1,147 to $1,510 per month. To have an impact in that area, the flat monthly service rate would have to be something like $1,000 per month, which would result in a 23% decrease in total system revenue and require an additional 69 customers to break even.
6.4. Commercial Property Pricing
“We have a $300 per month line of site antenna...plus a T1 line for our phones. So, we easily spend $500 per month or more. We'd be willing to pay more for better, faster service. Our tenants have similar opinions. They are willing to pay more for a better service but not five-times. So, at $700 per month it might be a ‘go’ whereas at $2,500 per month it’s not.”
“For ‘regular’ office users, many would sign up if the price was in the $500 to $1000 per month range.”Comments by Palo Alto commercial property managers.
Flat rate pricing of $1,400 per month would not have much impact on smaller businesses. Factoring in the drop fee and approximately $1,000 per month for Internet bandwidth and a
! City of Palo Alto Fiber Market Research Report
19 May 2011! Tellus Venture Associates! Page 31
connection at PAIX, the total cost would be about $2,600 per month, a maximum savings of about $1,000. Dropping the flat rate to $1,000 would put the monthly cost at about $2,200,
still more than twice what most of those businesses would consider.
On the other hand, $2,600 per month would be easily affordable if several tenants of a commercial property were to share a connection. The major obstacle for this type of multiple customer scenario are the capital costs, which break out into CPAU costs for
reaching the property, the cost of pulling fiber into a central point in a building and the cost of the associated electronics and internal cabling.
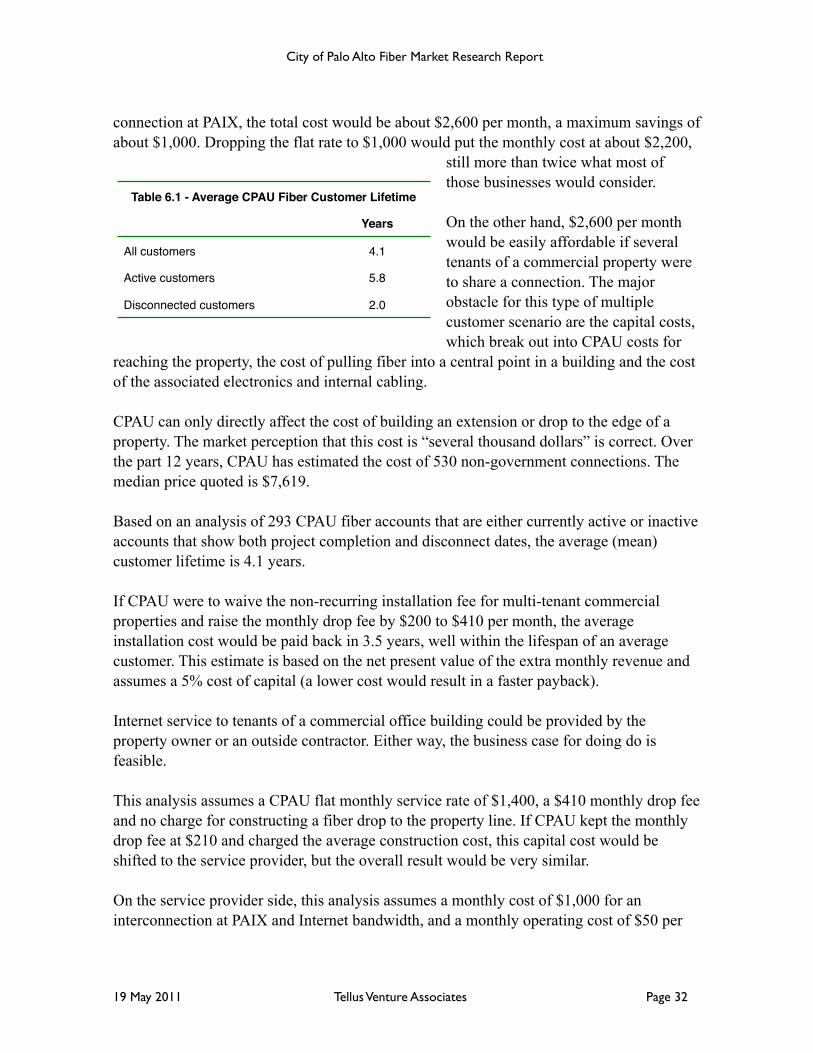
CPAU can only directly affect the cost of building an extension or drop to the edge of a property. The market perception that this cost is “several thousand dollars” is correct. Over the part 12 years, CPAU has estimated the cost of 530 non-government connections. The median price quoted is $7,619.
Based on an analysis of 293 CPAU fiber accounts that are either currently active or inactive accounts that show both project completion and disconnect dates, the average (mean) customer lifetime is 4.1 years.
If CPAU were to waive the non-recurring installation fee for multi-tenant commercial properties and raise the monthly drop fee by $200 to $410 per month, the average installation cost would be paid back in 3.5 years, well within the lifespan of an average customer. This estimate is based on the net present value of the extra monthly revenue and assumes a 5% cost of capital (a lower cost would result in a faster payback).
Internet service to tenants of a commercial office building could be provided by the property owner or an outside contractor. Either way, the business case for doing do is feasible.
This analysis assumes a CPAU flat monthly service rate of $1,400, a $410 monthly drop fee and no charge for constructing a fiber drop to the property line. If CPAU kept the monthly drop fee at $210 and charged the average construction cost, this capital cost would be shifted to the service provider, but the overall result would be very similar.
On the service provider side, this analysis assumes a monthly cost of $1,000 for an interconnection at PAIX and Internet bandwidth, and a monthly operating cost of $50 per
! City of Palo Alto Fiber Market Research Report
19 May 2011! Tellus Venture Associates! Page 32
Table 6.1 - Average CPAU Fiber Customer LifetimeTable 6.1 - Average CPAU Fiber Customer Lifetime
Years
All customers 4.1
Active customers 5.8
Disconnected customers 2.0
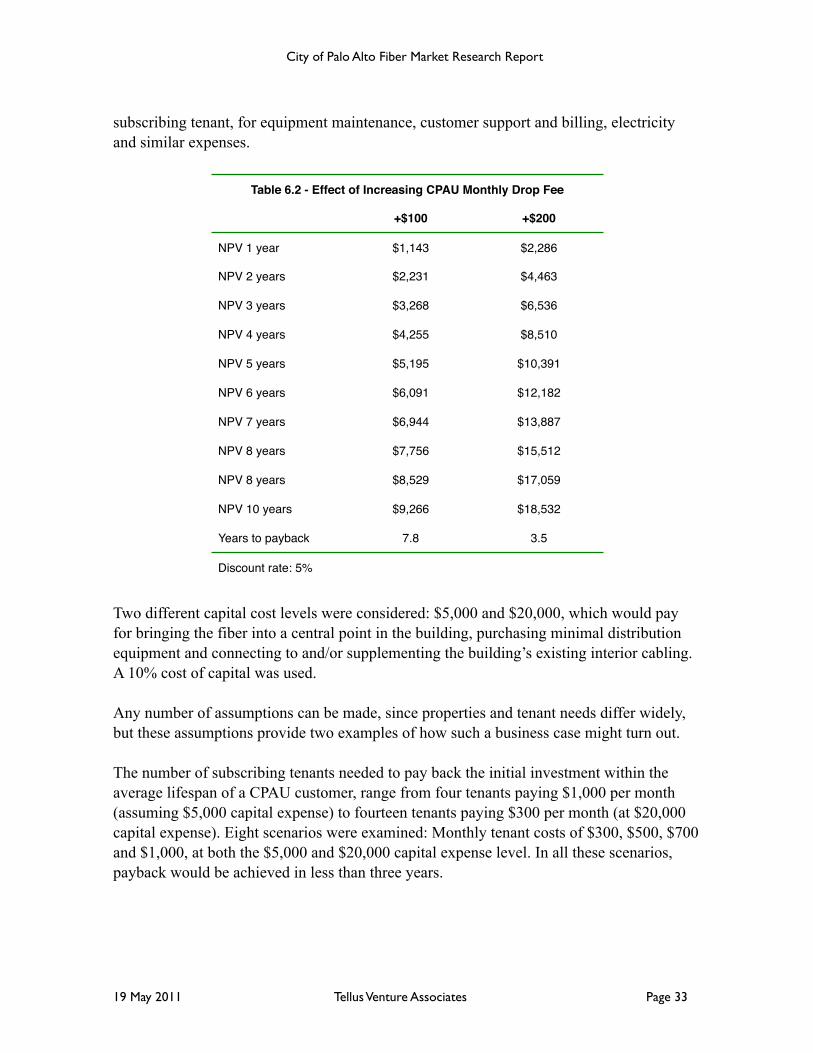
subscribing tenant, for equipment maintenance, customer support and billing, electricity and similar expenses.
Table 6.2 - Effect of Increasing CPAU Monthly Drop FeeTable 6.2 - Effect of Increasing CPAU Monthly Drop FeeTable 6.2 - Effect of Increasing CPAU Monthly Drop Fee
+$100 +$200
NPV 1 year $1,143 $2,286
NPV 2 years $2,231 $4,463
NPV 3 years $3,268 $6,536
NPV 4 years $4,255 $8,510
NPV 5 years $5,195 $10,391
NPV 6 years $6,091 $12,182
NPV 7 years $6,944 $13,887
NPV 8 years $7,756 $15,512
NPV 8 years $8,529 $17,059
NPV 10 years $9,266 $18,532
Years to payback 7.8 3.5
Discount rate: 5%Discount rate: 5%Discount rate: 5%
Two different capital cost levels were considered: $5,000 and $20,000, which would pay for bringing the fiber into a central point in the building, purchasing minimal distribution equipment and connecting to and/or supplementing the building’s existing interior cabling. A 10% cost of capital was used.
Any number of assumptions can be made, since properties and tenant needs differ widely, but these assumptions provide two examples of how such a business case might turn out.
The number of subscribing tenants needed to pay back the initial investment within the average lifespan of a CPAU customer, range from four tenants paying $1,000 per month (assuming $5,000 capital expense) to fourteen tenants paying $300 per month (at $20,000 capital expense). Eight scenarios were examined: Monthly tenant costs of $300, $500, $700 and $1,000, at both the $5,000 and $20,000 capital expense level. In all these scenarios, payback would be achieved in less than three years.
! City of Palo Alto Fiber Market Research Report
19 May 2011! Tellus Venture Associates! Page 33

This “Fiber to the Basement” business model could be pursued by CPAU without any changes to the current rate schedule or cost recovery structure. As noted above, many commercial properties are close enough to downtown to qualify for a monthly service fee of $1,400 or less, and CPAU’s construction costs can be shifted to the service provider.
Table 6.3 - “Fiber to the Basement” – Private Sector Provider ModelTable 6.3 - “Fiber to the Basement” – Private Sector Provider ModelTable 6.3 - “Fiber to the Basement” – Private Sector Provider ModelTable 6.3 - “Fiber to the Basement” – Private Sector Provider ModelTable 6.3 - “Fiber to the Basement” – Private Sector Provider ModelTable 6.3 - “Fiber to the Basement” – Private Sector Provider ModelTable 6.3 - “Fiber to the Basement” – Private Sector Provider ModelTable 6.3 - “Fiber to the Basement” – Private Sector Provider ModelTable 6.3 - “Fiber to the Basement” – Private Sector Provider Model
$5,000 Capex$5,000 Capex$5,000 Capex$5,000 Capex $20,000 Capex$20,000 Capex$20,000 Capex$20,000 Capex
Monthly Fee $300 $500 $700 $1,000 $300 $500 $700 $1,000
NPV 1 year $2,073 $3,709 $4,800 $10,800 $7,527 $8,618 $11,891 $10,800
NPV 2 years $3,957 $7,081 $9,164 $20,618 $14,370 $16,453 $22,701 $20,618
NPV 3 years $5,670 $10,146 $13,131 $29,544 $20,591 $23,575 $32,528 $29,544
NPV 4 years $7,227 $12,933 $16,737 $37,658 $26,246 $30,050 $41,462 $37,658
NPV 5 years $8,643 $15,466 $20,015 $45,035 $31,388 $35,937 $49,583 $45,035
NPV 6 years $9,930 $17,769 $22,996 $51,740 $36,062 $41,288 $56,967 $51,740
NPV 7 years $11,100 $19,863 $25,705 $57,837 $40,311 $46,153 $63,679 $57,837
NPV 8 years $12,164 $21,766 $28,168 $63,379 $44,173 $50,575 $69,781 $63,379
NPV 8 years $13,131 $23,497 $30,408 $68,417 $47,685 $54,596 $75,328 $68,417
NPV 10 years $14,010 $25,070 $32,443 $72,997 $50,877 $58,250 $80,371 $72,997
Years to payback 2.6 1.4 1.0 0.5 2.9 2.5 1.8 1.9
Subscribing tenants 12 7 5 4 14 8 6 5
Discount rate: 10%Discount rate: 10%Discount rate: 10%Discount rate: 10%Discount rate: 10%Discount rate: 10%Discount rate: 10%Discount rate: 10%Discount rate: 10%
However, by setting a flat monthly service rate and amortizing the construction costs by increasing the monthly drop fee (either on a permanent or temporary cost recovery basis), CPAU can present a simple, easily understood selling proposition to local property owners and potential third-party providers. CPAU would save time and money by simplifying the proposal and estimating process, and could create a mechanism for contracting out the required pre-engineering and construction work, once a deal has been signed.
6.5. Recommendations
Setting a maximum flat rate monthly service price would simplify CPAU’s sales process and encourage greater adoption by customers at the lesser-used edges of the network, including mobile telecommunications companies with widely scattered locations. A
! City of Palo Alto Fiber Market Research Report
19 May 2011! Tellus Venture Associates! Page 34
maximum flat rate of $1,400 would be particularly attractive to prospects in the Stanford Research Park area, where a third of current customers are located.
Even if no changes are made to the rate and cost recovery structure, it would be worthwhile to create a packaged selling proposition for multi-tenant office buildings and present it to local property owners. However, simplifying the pricing model, as described above, would make it easier to sell the service to commercial property owners who have limited expertise and interest in Internet services.
A simplified pricing model would also make CPAU’s fiber network more attractive to value-added resellers, who could devote the time and capital needed to develop the commercial property market. These third-party providers might be interested in negotiating a comprehensive agreement with CPAU, which could include initial outside plant engineering and construction services as well as customer premise expenses and ongoing operating costs. The actual level of third party provider interest could be explored via a request for proposal (RFP) process.
! City of Palo Alto Fiber Market Research Report
19 May 2011! Tellus Venture Associates! Page 35
7. Residential Market
7.1. Overview
One possible use for the CPAU fiber network is to support residential broadband service. In the past, the City has explored different options for developing residential service, including building a City-operated fiber-to-the-home system and partnering with private companies. Studies have been done, a pilot project was started and eventually shut down and RFPs have been issued. To date, no viable option for deploying an FTTH network in Palo Alto has been found.
A City-operated FTTH network has been considered, tested, studied and ultimately shelved. Although the market for broadband services – including television, telephone and Internet access – is rapidly changing and the demand for Internet bandwidth is increasing, the fundamental economics still do not support the business case for a overbuild of the existing AT&T and Comcast networks.
Even though the existing CPAU fiber network provides a good base to build upon, deploying a citywide FTTH system would be very costly. Because the only way at present to generate sufficient income to support the operating and capital costs is by selling subscription television service, substantial market share, likely greater than 50%, and high average monthly revenue per subscriber, approaching $100 or more, would be necessary.
Palo Alto is served by two consumer-oriented, full service broadband providers (Comcast and AT&T) who offer high speed residential Internet service, extensive television lineups and telephone service. Although both companies are the target of complaints, they generally meet the broadband needs of most people in their service areas, including Palo Alto. Both companies have a national presence and millions of customers. They enjoy substantial operating economies of scale, including the ability to negotiate relatively good terms with television programming providers.
City-run systems do not have that ability. Consequently, it is usually impossible to compete with entrenched incumbents on the basis of price. Although an FTTH system could theoretically offer more television programming options, this competitive strategy usually results in lower net revenue and is not compelling to most prospective subscribers, particularly when employed against full-service providers such as AT&T or Comcast.
In Palo Alto's case, there is even less opportunity to finance the construction and operation of an FTTH system with television revenue. Median household income in Palo Alto is about double the statewide average. Generally speaking, higher income households perceive less value in subscription television service.
! City of Palo Alto Fiber Market Research Report
19 May 2011! Tellus Venture Associates! Page 36
7.2. FTTH system comparisons
Results from FTTH deployments elsewhere are mixed. Bristol, a small town in rural Virginia, is considered a municipal FTTH success story. It reports positive net income with a market share of more than 60% and monthly revenue per subscriber near $100, competing successfully with Charter Communications.
Cedar Falls, Iowa is another community that has had success with municipal broadband. It went to market in 1996 using an HFC (hybrid fiber coaxial cable) system. It has achieved a market share of more than 50%, in competition with Mediacom Communications, and is currently in the process of converting to an FTTH system and expanding into neighboring areas, aided in part by a stimulus grant from the U.S. Department of Agriculture’s Rural Utilities Service.
On the other hand, iProvo, a municipally funded FTTH system in Provo, Utah, has struggled. It originally used a wholesale business model (sometimes referred to as an “open access” model), selling access to a variety of companies that, in turn, offered retail television, Internet and telephone services to residents. Financially, the venture was a failure. At one point, the city had to raise tax revenue to fund a shortfall. The system was finally sold to one of the retail providers, Broadweave, which then merged with the only other remaining retail provider on the system, Veracity. The first request of the combined company was to ask the city for additional financial relief.
Private sector companies that have built competitive broadband systems on top of incumbents (commonly called “overbuilders”) also a have a mixed record. Last year, Abry Partners bought out RCN, an overbuilder that had been in failing financial health for some time, for $1.2 billion. Most of that amount was debt accumulated by RCN and assumed by Abry. One of Abry’s first moves was to separate RCN’s middle mile services (similar to CPAU’s dark fiber service) from its consumer and small business units.
In Sacramento, a company called Winfirst built an extensive FTTH system that failed financially. The Roseville Telephone Company, later renamed Surewest, bought the system out of bankruptcy for about a dime on the dollar and has been able to survive with a market penetration of around 34%, albeit with share values that have fallen by more than half over the past five years.
Surewest expanded into Kansas, through the acquisition of another overbuilder, Everest Broadband. The company sees Kansas as its principal growth opportunity and is not considering expansion in California, due to what it considers to be a less attractive business climate. Evidently, Google agrees that Kansas has potential, choosing Kansas City, Kansas
! City of Palo Alto Fiber Market Research Report
19 May 2011! Tellus Venture Associates! Page 37
as the pilot community for its FTTH project. Surewest’s acquisition is near Google’s project area.
Strictly speaking, as an incumbent telephone company, Verizon Communications is not an overbuilder. In 2004 it started extending its fiber optic network directly to homes in its service area. At the end of 2010, Verizon reported its fiber network was available to 15.6 million homes with 3.5 million (22%) subscribing to television service and 4.1 million (26%) buying Internet access. The company has stopped most new FTTH construction and has no immediate plans to complete its build out.
7.3. Case study: City of Alameda
Like the City of Palo Alto, the City of Alameda operates its own electric utility. In 1996, when the Alameda Bureau of Electricity (later called Alameda Power & Telecom – APT) began investigating the establishment of a cable television business, the incumbent cable operator was TCI. At that time, TCI did not have a reputation in the industry for having state of the art facilities and it was perceived in the market as providing poor service.
In 1999, AT&T bought TCI and began trying to modernize and upgrade its systems. This job turned out to be a poor fit for AT&T, which was struggling to define itself in a rapidly changing industry. Following the dot-com and telecommunications crash in 2000-2001, AT&T sold its cable business to Comcast in 2002. Comcast began to take over operations in 2003 and was fully competing against APT by 2005.
During that same period (2001 to 2005), APT built out its own HFC cable television system, which it also used to provide Internet service (but not telephone service). In the process, the City of Alameda borrowed $33 million and began an aggressive marketing campaign to win subscribers.
In 2003, APT commissioned a study that formed the basis for its operations and financing going forward. The City of Palo Alto had a similar study done during the same time frame, by the same consulting company. Although these two studies were separate and differed in many respects, similar conclusions were reached.
The APT business plan assumed it would sell television service to about 39% of Alameda households (versus 38% for Palo Alto) and Internet service to 24% (versus 51% for Palo Alto). It predicted the system would be financially viable at that point. It also made assumptions about programming costs and the effectiveness of its primary competitor (initially TCI and finally Comcast) based on history and experience.
! City of Palo Alto Fiber Market Research Report
19 May 2011! Tellus Venture Associates! Page 38
Though well-founded, those assumptions proved incorrect. Market share topped out at about 30%, programming costs skyrocketed and Comcast proved to be a very aggressive competitor. APT could not meet its financial obligations, and eventually sold the cable system to Comcast in 2008 for about fifty cents on the dollar. It is currently in litigation with its debtholders, who are trying to recover the millions of dollars they lost.
7.4. Conclusions
The City of Palo Alto has been exploring FTTH service for more than ten years. The financial prospects have not proven compelling to prospective private sector partners. Its original FTTH pilot project demonstrated technical feasibility but did not address the business case.
Municipalities with successful FTTH stories bear little resemblance to Palo Alto. Bristol and Cedar Falls are relatively isolated communities in rural areas, with second tier video service providers. As a university town with Comcast as the incumbent cable operator, Provo has marginally more in common with Palo Alto, and its FTTH venture has been a financial failure for the city.
Private sector FTTH overbuilders have had some successes, but not in the Bay Area. Surewest is doing reasonably well in Sacramento, but only after buying its principal fiber network there out of bankruptcy at a steep discount. RCN pulled out of the Bay Area in 2007. Both companies are more bullish on providing middle mile service and/or serving more isolated regions.
Although there are significant differences between Palo Alto and Alameda, the failure of the APT project should be accepted as a legitimate, real world test of Palo Alto’s current FTTH business case. Both cities operate their own electric utilities, are urban communities in the San Francisco Bay Area and are served by the same two highly competitive broadband system operators.
The factors that caused the failure of APT’s system – for example, rising programming costs and intense competition – would be equally problematic for Palo Alto. Until solutions are found or, more likely, there are structural changes in the telecommunications industry, the financial prospects for FTTH in Palo Alto are dim.
Broadband system operators face an uncertain future. The standard, video-supported business model is under increasing pressure as consumers access programming directly over the Internet. In the long run, revenue from Internet services is likely to increase and dependence on video revenues is likely to decrease.
! City of Palo Alto Fiber Market Research Report
19 May 2011! Tellus Venture Associates! Page 39

This shift in the broadband business model could eventually make FTTH systems economically viable in markets such as Palo Alto. Considering the possibility of future services such as FTTH when evaluating network extensions, as Columbia Telecommunications Corporation did in its April 2011 report for the City of Palo Alto, makes sense.
For the present though, the broadband sector’s turmoil and uncertainty make FTTH system investments less attractive. The current state of the broadband market does not support a business case for a third, overbuild residential broadband system in Palo Alto.
! City of Palo Alto Fiber Market Research Report
19 May 2011! Tellus Venture Associates! Page 40
8. Findings and Recommendations
In summary, the following conclusions have been reached:
1. CPAU’s core competency is providing reliable and relatively inexpensive dark fiber connectivity through much of the City.
2. CPAU’s dark fiber services are effectively marketed to organizations that need a correspondingly high level of bandwidth. CPAU’s market share and brand awareness are high within this segment. Stanford Research Park and downtown Palo Alto are two specific areas where CPAU has been very successful.
3. The entrepreneurial nature of the high technology and biomedical industries means there is steady turnover amongst staff and companies as a whole. A modest, highly targeted and ongoing advertising and promotion program will help maintain CPAU’s market position over time. Examples include:
• Develop a fiber-specific, search engine optimized website so prospective customers can quickly learn about services.
• Periodically do keyword-based advertising on major search engines.• Occasionally buy sponsorships for local information technology networking events,
particularly in downtown Palo Alto and Stanford Research Park.• Work with economic development agencies and organizations to provide
information about CPAU fiber services to newly arrived and prospective business.
4. Telecommunications services resellers are CPAU’s best customers, and are already positioned to provide higher-value added services such as Layer 2 support and Internet connectivity. CPAU should consider initiatives that would encourage and enable resellers to make services available to a wider range of businesses, rather than competing against resellers’ core competencies.
5. Mobile telephone companies are a category of telecommunications service provider that could also be addressed. CPAU should consider developing a comprehensive approach to this market segment, including extensions of the existing network and other facilities to better serve it.
6. Flat rate service pricing and amortizing construction costs via a flat or cost-recovery based increase in the monthly drop fee would simplify CPAU’s selling proposition and make the service more attractive to customers at the edges of the network. A revised pricing policy would also make CPAU’s dark fiber services more understandable and affordable for
! City of Palo Alto Fiber Market Research Report
19 May 2011! Tellus Venture Associates! Page 41
potential customers who lack a high level of internal information technology support, for example commercial property owners.
7. A wider range of commercial properties could be served if CPAU worked with resellers and property owners to extend fiber connectivity to unserved office complexes, via a “Fiber to the Basement” business model, particularly one that created a mechanism for financing and contracting out pre-engineering and construction work when necessary. An RFP for such a program should be considered.
8. There are areas of the City that have concentrations of businesses and institutions that are not reached by the CPAU network. East Meadow Circle should be considered a high priority for network extension. The Sand Hill Road/Welch Road area is another good candidate for network extension, particularly if Stanford Medical Center and its affiliates have an interest. El Camino Real should also be considered generally on the basis of the economic development potential of fiber availability and specifically in terms of supporting mobile telephone companies and large commercial properties. An East Bayshore Road extension should be considered on the same basis.
9. The public schools in Palo Alto are within reach of the current network, and all can be reached via extensions.
10. There is no compelling case for providing fiber service directly to residences at this time. Palo Alto is served by large incumbent retail video and broadband service providers that enjoy decisive competitive advantages resulting from economies of scale. Comparable municipal broadband ventures have failed. It is unlikely that a City-run or supported residential fiber service would be able to achieve enough market penetration or subscriber revenue to support itself in the near term. Long term, the broadband business environment is very likely to change and might do so in a way that makes FTTH service financially viable. It makes sense to treat it as one of the many factors that should be considered when evaluating network extensions.
! City of Palo Alto Fiber Market Research Report
19 May 2011! Tellus Venture Associates! Page 42
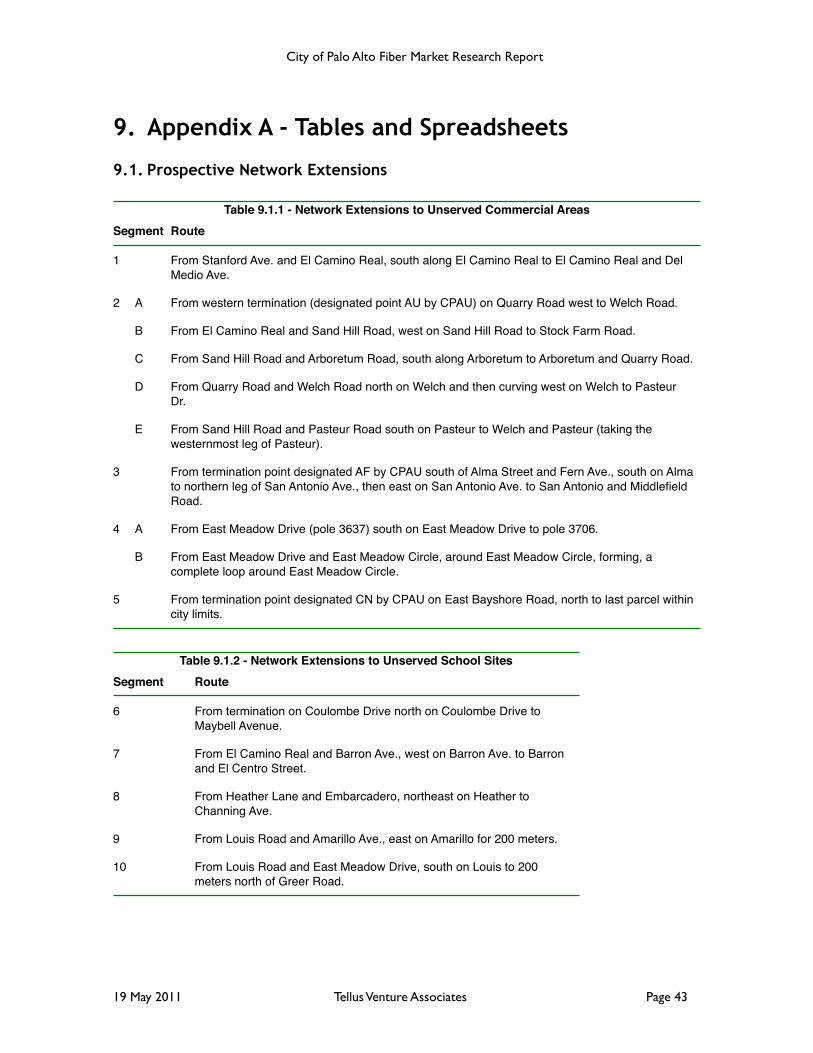
9. Appendix A - Tables and Spreadsheets
9.1. Prospective Network Extensions
Table 9.1.1 - Network Extensions to Unserved Commercial AreasTable 9.1.1 - Network Extensions to Unserved Commercial AreasTable 9.1.1 - Network Extensions to Unserved Commercial AreasSegmentSegment Route
1 From Stanford Ave. and El Camino Real, south along El Camino Real to El Camino Real and Del Medio Ave.
2 A From western termination (designated point AU by CPAU) on Quarry Road west to Welch Road.
B From El Camino Real and Sand Hill Road, west on Sand Hill Road to Stock Farm Road.
C From Sand Hill Road and Arboretum Road, south along Arboretum to Arboretum and Quarry Road.
D From Quarry Road and Welch Road north on Welch and then curving west on Welch to Pasteur Dr.
E From Sand Hill Road and Pasteur Road south on Pasteur to Welch and Pasteur (taking the westernmost leg of Pasteur).
3 From termination point designated AF by CPAU south of Alma Street and Fern Ave., south on Alma to northern leg of San Antonio Ave., then east on San Antonio Ave. to San Antonio and Middlefield Road.
4 A From East Meadow Drive (pole 3637) south on East Meadow Drive to pole 3706.
B From East Meadow Drive and East Meadow Circle, around East Meadow Circle, forming, a complete loop around East Meadow Circle.
5 From termination point designated CN by CPAU on East Bayshore Road, north to last parcel within city limits.
Table 9.1.2 - Network Extensions to Unserved School SitesTable 9.1.2 - Network Extensions to Unserved School SitesTable 9.1.2 - Network Extensions to Unserved School SitesSegmentSegment Route
6 From termination on Coulombe Drive north on Coulombe Drive to Maybell Avenue.
7 From El Camino Real and Barron Ave., west on Barron Ave. to Barron and El Centro Street.
8 From Heather Lane and Embarcadero, northeast on Heather to Channing Ave.
9 From Louis Road and Amarillo Ave., east on Amarillo for 200 meters.
10 From Louis Road and East Meadow Drive, south on Louis to 200 meters north of Greer Road.
! City of Palo Alto Fiber Market Research Report
19 May 2011! Tellus Venture Associates! Page 43
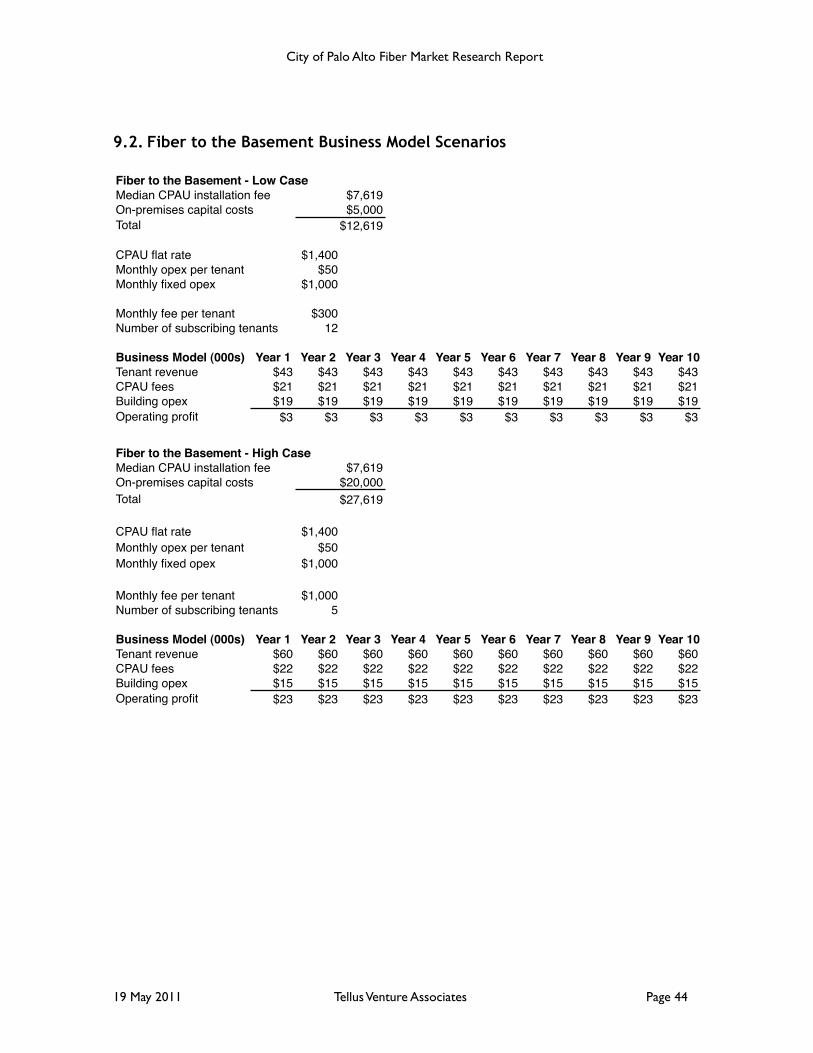
9.2. Fiber to the Basement Business Model Scenarios
Fiber to the Basement - Low CaseFiber to the Basement - Low CaseFiber to the Basement - Low CaseMedian CPAU installation feeMedian CPAU installation fee $7,619$7,619On-premises capital costsOn-premises capital costs $5,000$5,000Total $12,619$12,619
CPAU flat rate $1,400Monthly opex per tenant $50Monthly fixed opex $1,000
Monthly fee per tenant $300Number of subscribing tenantsNumber of subscribing tenants 12
Business Model (000s) Year 1 Year 2 Year 3 Year 4 Year 5 Year 6 Year 7 Year 8 Year 9 Year 10Tenant revenue $43 $43 $43 $43 $43 $43 $43 $43 $43 $43CPAU fees $21 $21 $21 $21 $21 $21 $21 $21 $21 $21Building opex $19 $19 $19 $19 $19 $19 $19 $19 $19 $19Operating profit $3 $3 $3 $3 $3 $3 $3 $3 $3 $3
Fiber to the Basement - High CaseFiber to the Basement - High CaseFiber to the Basement - High CaseMedian CPAU installation feeMedian CPAU installation fee $7,619$7,619On-premises capital costsOn-premises capital costs $20,000$20,000Total $27,619$27,619
CPAU flat rate $1,400Monthly opex per tenant $50Monthly fixed opex $1,000
Monthly fee per tenant $1,000Number of subscribing tenantsNumber of subscribing tenants 5
Business Model (000s) Year 1 Year 2 Year 3 Year 4 Year 5 Year 6 Year 7 Year 8 Year 9 Year 10Tenant revenue $60 $60 $60 $60 $60 $60 $60 $60 $60 $60CPAU fees $22 $22 $22 $22 $22 $22 $22 $22 $22 $22Building opex $15 $15 $15 $15 $15 $15 $15 $15 $15 $15Operating profit $23 $23 $23 $23 $23 $23 $23 $23 $23 $23
! City of Palo Alto Fiber Market Research Report
19 May 2011! Tellus Venture Associates! Page 44
10.Appendix B - List of Maps
1. Business Partner Parcel 100m Proposed Network2. Business Partner Parcels 200m Proposed Network3. Business Partners 50m COPA Data Connections4. Business Partners 50m5. Business Partners 100m COPA Data Connections6. Business Partners 100m7. Business Partners 200m COPA Data Connections8. Business Partners 200m9. Business Partners Greater Than 100m COPA Data Connections INDEX ALL10. Business Partners Greater Than 100m COPA Data Connections INDEX11. Business Partners Greater Than 100m INDEX ALL12. Business Partners Greater Than 100m INDEX13. Business Partners Greater Than 100m14. Business Partners Greater Than 200m COPA Data Connections INDEX ALL15. Business Partners Greater Than 200m COPA Data Connections INDEX16. Business Partners Greater Than 200m COPA Data Connections17. Business Partners Greater Than 200m INDEX ALL18. Business Partners Greater Than 200m INDEX19. Business Partners Greater Than 200m20. New Business Partners ALL INDEX21. New Business Partners ALL22. New Business Partners INDEX23. New Business Partners
! City of Palo Alto Fiber Market Research Report
19 May 2011! Tellus Venture Associates! Page 45