Assessing tree dendrometrics in young regenerating plantations using terrestrial laser scanning
10
ORIGINAL PAPER Assessing tree dendrometrics in young regenerating plantations using terrestrial laser scanning Ying Li & Carsten Hess & Henrik von Wehrden & Werner Härdtle & Goddert von Oheimb Received: 12 September 2013 /Accepted: 6 January 2014 /Published online: 29 January 2014 # INRA and Springer-Verlag France 2014 Abstract & Context Terrestrial laser scanning (TLS) provides a valuable tool for the retrieval of detailed individual-tree structural pa- rameters, but has never previously been applied to young stands under field conditions. & Aims The aim was to explore the performance of TLS in a young tree plantation located in a heterogeneous environment in subtropical China. & Methods We investigated 438 young trees for congruence between direct field and TLS measurements of total tree height, stem diameter at ground height, and length and height of the longest branch using correlation tests. We applied generalized linear models to examine whether congruence was affected by the observed structural parameter or extrinsic factors (e.g., potential occlusion, point cloud quality). & Results TLS made it possible to detect trees higher than 40 cm. The TLS-retrieved data were highly congruent with the data obtained from direct measurements. The poor descrip- tions of stems and branches of some individuals of small-sized and leaf-on tree species were due to occlusion by ground vegetation and leaf-on branches. Observed structural parame- ter and extrinsic factors did not explain the variance between the two approaches. & Conclusion TLS proved to be a promising tool for high- resolution, non-destructive analyses of tree dendrometrics in young regenerating plantations. Keywords BEF-China . Regeneration phase . Subtropical China . Point cloud . TLS 1 Introduction Competition for light is broadly recognized as a key factor determining plant growth. In trees, these interactions lead primarily to morphological responses of the crown (Grams and Anderson 2007), because crown dimensions and crown architecture strongly determine the individual’ s ability to in- tercept light and to shade neighboring trees (Brisson 2001). Although the expression of crown traits in individual trees is constrained by genetic and mechanical properties, individuals may show plastic responses within certain thresholds as a reaction to local neighborhood interactions or, more generally, to local environmental conditions. Crown responses to these conditions are the aggregate effect of the differential spatial development of single branches (Stoll and Schmid 1998; Sumida et al. 2002). Therefore, detailed information on branching patterns and the growth and mortality of single branches of individual trees as well as on local site conditions are needed to explain and model the spatiotemporal develop- ment of crowns (Pretzsch et al. 2011). To obtain this informa- tion by direct field measurement is, however, challenging and time-consuming, and thus costly (Fleck et al. 2011). In recent Handling Editor: Jean-Michel Leban Contribution of the co-authors Ying Li: designed the study, performed the research, analyzed data and wrote the manuscript Carsten Hess: performed the research, analyzed data and contributed new methods Henrik von Wehrden: analyzed data and revised the manuscript Werner Härdtle: revised the manuscript Goddert von Oheimb: designed the study, supervised the work and coordinated the research project Y. Li (*) : C. Hess : H. von Wehrden : W. Härdtle : G. von Oheimb Faculty Sustainability, Institute of Ecology, Leuphana University Lüneburg, Scharnhorststr.1, 21335 Lüneburg, Germany e-mail: [email protected] H. von Wehrden Center for Methods, Leuphana University Lüneburg, Scharnhorststr.1, 21335 Lüneburg, Germany H. von Wehrden Research Institute of Wildlife Ecology, Savoyen Strasse 1, Vienna 1160, Austria Annals of Forest Science (2014) 71:453–462 DOI 10.1007/s13595-014-0358-4
Transcript of Assessing tree dendrometrics in young regenerating plantations using terrestrial laser scanning

ORIGINAL PAPER
Assessing tree dendrometrics in young regenerating plantationsusing terrestrial laser scanning
Ying Li & Carsten Hess & Henrik von Wehrden &
Werner Härdtle & Goddert von Oheimb
Received: 12 September 2013 /Accepted: 6 January 2014 /Published online: 29 January 2014# INRA and Springer-Verlag France 2014
Abstract& Context Terrestrial laser scanning (TLS) provides a valuabletool for the retrieval of detailed individual-tree structural pa-rameters, but has never previously been applied to youngstands under field conditions.& Aims The aim was to explore the performance of TLS in ayoung tree plantation located in a heterogeneous environmentin subtropical China.& Methods We investigated 438 young trees for congruencebetween direct field and TLS measurements of total treeheight, stem diameter at ground height, and length and heightof the longest branch using correlation tests. We appliedgeneralized linear models to examine whether congruencewas affected by the observed structural parameter or extrinsicfactors (e.g., potential occlusion, point cloud quality).& Results TLS made it possible to detect trees higher than40 cm. The TLS-retrieved data were highly congruent with the
data obtained from direct measurements. The poor descrip-tions of stems and branches of some individuals of small-sizedand leaf-on tree species were due to occlusion by groundvegetation and leaf-on branches. Observed structural parame-ter and extrinsic factors did not explain the variance betweenthe two approaches.& Conclusion TLS proved to be a promising tool for high-resolution, non-destructive analyses of tree dendrometrics inyoung regenerating plantations.
Keywords BEF-China . Regeneration phase . SubtropicalChina . Point cloud . TLS
1 Introduction
Competition for light is broadly recognized as a key factordetermining plant growth. In trees, these interactions leadprimarily to morphological responses of the crown (Gramsand Anderson 2007), because crown dimensions and crownarchitecture strongly determine the individual’s ability to in-tercept light and to shade neighboring trees (Brisson 2001).Although the expression of crown traits in individual trees isconstrained by genetic and mechanical properties, individualsmay show plastic responses within certain thresholds as areaction to local neighborhood interactions or, more generally,to local environmental conditions. Crown responses to theseconditions are the aggregate effect of the differential spatialdevelopment of single branches (Stoll and Schmid 1998;Sumida et al. 2002). Therefore, detailed information onbranching patterns and the growth and mortality of singlebranches of individual trees as well as on local site conditionsare needed to explain and model the spatiotemporal develop-ment of crowns (Pretzsch et al. 2011). To obtain this informa-tion by direct field measurement is, however, challenging andtime-consuming, and thus costly (Fleck et al. 2011). In recent
Handling Editor: Jean-Michel Leban
Contribution of the co-authors Ying Li: designed the study, performedthe research, analyzed data and wrote the manuscriptCarsten Hess: performed the research, analyzed data and contributed newmethodsHenrik von Wehrden: analyzed data and revised the manuscriptWerner Härdtle: revised the manuscriptGoddert von Oheimb: designed the study, supervised the work andcoordinated the research project
Y. Li (*) :C. Hess :H. von Wehrden :W. Härdtle :G. von OheimbFaculty Sustainability, Institute of Ecology, Leuphana UniversityLüneburg, Scharnhorststr.1, 21335 Lüneburg, Germanye-mail: [email protected]
H. von WehrdenCenter for Methods, Leuphana University Lüneburg,Scharnhorststr.1, 21335 Lüneburg, Germany
H. von WehrdenResearch Institute of Wildlife Ecology, Savoyen Strasse 1,Vienna 1160, Austria
Annals of Forest Science (2014) 71:453–462DOI 10.1007/s13595-014-0358-4

years, technically intensive high-resolution inventory toolshave been used to acquire individual-tree data.
Airborne laser scanning (ALS) techniques have been success-fully applied in determining canopy structure (Vehmas et al.2011) and measuring essential parameters of individual-treecrown characteristics, such as crown base height, crown areaand crown volume (Jung et al. 2011). Compared to field mea-surements, ALS slightly underestimates tree parameters (Zimbleet al. 2003).More importantly, ALS is largely restricted to the topcanopy layer, whereas the elements in the lower canopy arerecorded in less detail due to signal occlusion by upper canopyelements (Hilker et al. 2010; Jung et al. 2011). Furthermore, ALShas some constraints in terms of the fine-scale spatial resolution(in the order of millimeters or a few centimeters) of structuralelements (van Leeuwen and Nieuwenhuis 2010).
Terrestrial laser scanning (TLS) has now been established asan alternative approach for measurement of three-dimensional(3D) structural elements of trees (Fleck et al. 2011; Jung et al.2011; Schilling et al. 2012). TLS is a light detection andranging (LiDAR) system capable of acquiring 3D structuralhigh-resolution information with a level of detail that is con-siderably higher than ALS (Lichti et al. 2002). Up to now, TLShas mainly been applied in forest science to analyze standardtree and stand dendrometrics such as stem diameter, treeheight, stem position, tree density, basal area and trunk volume(Hopkinson et al. 2004; Dassot et al. 2011). Recently, the useof TLS has been intensified to analyze 3D tree topology,canopy and individual-tree crown structure as well as the woodvolume of branches (Bucksch et al. 2010; Dassot et al. 2011,2012; Schilling et al. 2012). However, as the main interestwhen conducting forest inventories is in the wood volume ofadult trees, TLS applications have focused almost exclusivelyon adult trees or mature stands. A central task of forest scienceand forest ecology, however, is the analysis of growth dynam-ics in the regeneration phase. This phase is often characterizedby a high tree density, but also by a mixture of various treespecies, and, thus, intensive and complex tree-tree interactions.The processes operating in this early phase of stand develop-ment are essential for the future forest structure and composi-tion (Kobe 2006), and hence, it is vital to understand theunderlying mechanisms of tree-tree interactions. TLS offersthe opportunity to conduct rapid, non-destructive, accurate andextensive measurements of a large number of individual treesover time in order to analyze tree growth dynamics in general,but in particular to investigate the spatial development ofcrowns in detail (Dassot et al. 2011). To our knowledge,however, the feasibility of TLS to determine growth parame-ters of young trees under field conditions has never beenexplored before.We are aware of only one study which appliedTLS to investigate juvenile trees, albeit under controlled con-ditions; this study analyzed 6-year-old beech (Fagus sylvatica)trees planted individually in buckets and kept under a roof inan experimental botanical garden (Seidel et al. 2011a). Several
specific challenges are associated with the application of TLSfor smaller trees or younger stands: (1) the dimension of themain wood components (i.e., trunk and the first- and second-order branches) may be too small to be resolved at high qualityby the laser scanner; (2) the structural density is higher than inadult trees or mature stands, potentially resulting in a relativelyhigh level of occlusion (Dassot et al. 2011); (3) the groundlayer vegetation may occlude a substantial part of the individ-ual trees; (4) adverse impact of mild to moderate wind on scanquality is largely restricted to the smallest tree constituents(Côté et al. 2011), which make up a relatively high proportionof young trees’ structure.
The aim of our study is to explore the performance of TLS ina young experimental tree plantation in a heterogeneous envi-ronment by comparing TLS-derived tree structural data withthose obtained by direct field measurements. We conducted thestudy in the framework of the BEF-China project (BEF:Biodiversity and Ecosystem Functioning). BEF-China is a newforest BEF experiment that was established in subtropical Chinafrom 2009 to 2010 (Yang et al. 2013; Bruelheide et al. 2014). Apool of 40 native tree species was planted on 566 plots and a netarea of 38.4 ha. Species richness and composition were experi-mentally manipulated to study their effects on a range of ecosys-tem functions, including primary productivity, carbon and nutri-ent cycling, and soil processes. Conventional inventories areconducted annually to study the effect of local environmentalconditions such as size and species identity of neighboring treesor slope inclination on individual-tree growth and crown dynam-ics. Here, we compare the performance of the two approaches,direct field measurements by inventory teams and TLSmeasure-ments, to determine the four individual-tree structural parameterstotal tree height, stem diameter at ground height, length of thelongest branch and height of the longest branch.
Specifically, we tested three hypotheses in this study:
(H1) TLS-derived data are highly congruent with fieldmeasurement data.
(H2) Congruence of data varies with the observed struc-tural parameter, decreasing in the order: totalheight>stem diameter>length the longest branch>height of the longest branch.
(H3) Variance of direct field and TLS measurement data canmainly be explained by extrinsic factors (e.g. potentialocclusion, point cloud quality).
2 Material and methods
2.1 Study site
The study site is located in a hilly subtropical region nearXingangshan Township, Jiangxi Province (29.08–29.11 N,
454 Y. Li et al.

117.90–117.93 E), China. The mean annual temperature is16.7 °C and the mean annual precipitation 1,821 mm. Thepotential natural vegetation of this region is subtropical broad-leaved forest with evergreen species dominating in abundance(Bruelheide et al. 2011). Each of the 556 plots in the BEF-China experiment has a projected area of 666.7 m2 (25.8×25.8 m) and was planted with 400 tree saplings (20×20) in2009 and 2010, resulting in a total of 219,200 trees (detaileddescriptions of the experimental design are given by Yanget al. 2013; Bruelheide et al. 2014). The horizontal plantingspace is 1.29 m, resulting in a stem density of 6,000 trees ha−1.The plot tree species richness levels are 1, 2, 4, 8, 16, and 24.To maintain the designed plot compositions, herbaceous andnon-planted woody species are mechanically removed fromall plots in weeding campaigns conducted twice a year.
Due to the large number of trees planted in the experiment,the direct annual measurements are focused on trees within thecentral part of every plot. In monocultures and 2-speciesmixtures the central 6×6 planting positions (i.e., 36 trees perplot), and in the 4-, 8-, 16- and 24-species mixtures the central12×12 planting positions (i.e., 144 trees per plot) are sampled.For TLS, 14 plots were selected according to the followingcriteria: (1) monoculture or 2-species mixture; (2) high pro-portion of trees larger than 1 m high; (3) high proportion ofliving trees in the planting positions; (4) only deciduousbroad-leaved tree species or at least one out of two tree speciesdeciduous. A total of nine tree species were recorded from the14 plots: Choerospondias axillaris (Roxburgh) Burtt et Hill,Diospyros japonica Siebold et Zuccarini, LiquidambarformosanaHance, Nyssa sinensisOliver, Sapindus saponariaLinnaeus, Triadica cochinchinensis Loureiro, Triadicasebifera (L.) Small, Schima superba Gardner and Champion,Rhus chinensisMiller. All the recorded tree species are decid-uous broad-leaved, with the exception of S. superba, which isan evergreen broad-leaved species.
2.2 Data collection
2.2.1 Direct field measurement
The direct annual field measurements were conducted at theend of the growing season from the middle of September untilthe end of October. Trees were surveyed under leaf-on condi-tions for the deciduous trees in order to measure the crowndimensions. The whole inventory was conducted by tentrained teams consisting of two persons each (hereafter inven-tory teams). In this study, we use the inventory data of theselected 14 plots that were recorded by seven inventory teamsin September/October 2011. Each tree in the experiment istaggedwith a unique numeric code. For every living tree in thetotal of 504 planting positions, the total tree height and thestem diameter at 5 cm above ground (hereafter ground diam-eter (GD)) were determined. GD was measured instead of
diameter at breast height (DBH) because of the young age ofthe trees. Total height was measured as the length from thestem base to the apical meristem with a measuring pole. GDwas measured with a caliper to the nearest millimeter withoutprescribed measuring direction, and the position of the diam-eter measurement was permanently marked on the stem withwhite paint. We also measured the length and the height of thelongest branch with a measuring tape and counted the numberof living first-order branches (>1 cm in length) of every tree.The length of the longest branch was measured as the straightdistance between the branch collar and the branch apicalmeristem. A summary of tree structural parameters is present-ed in Table 1.
2.2.2 TLS data acquisition
In the selected 14 plots, TLS was conducted in March 2012under leaf-off conditions of the deciduous trees. The scanswere performed with a phase-shift FARO Laser ScannerPhoton 120 (FARO Technologies, Inc., FL, USA). The verti-cal field-of-view of each panorama scan is 310° and thehorizontal is 360°. The scanner resolution was set at ¼,corresponding to an angular resolution of 0.036° and a spatialresolution of 6.283 mm at a distance of 10 m from the device.The data acquisition rate was 244,000 points per second.Further details on technical specifications and the experimen-tal settings are presented in Table 2. One scan with the afore-mentioned configuration took about 3:24 min. The laser scan-ner was positioned on a tripod at a height of about 1.3 m. Dueto the intrinsic characteristics of the laser device and thegeometric measurement pattern, the 3D point density variedalong the distance from scanner to object, and spatial infor-mation on the surface of vegetative elements located behindanother object is not available due to occlusion (for moredetails see van der Zande et al. 2006). In order to obtain acomplete 3D picture of all focal trees in each plot, severalscans from different angles are required (Watt and Donoghue2005). Due to the schematic planting pattern of the trees, wewere able to make use of a standardized set-up of scan posi-tions comprising nine scans evenly positioned on the plot(Fig. 1). To co-register the point clouds from the nine scans(see below), artificial and highly reflective reference targets
Table 1 Summary of tree structural parameters obtained from direct fieldmeasurements on 14 plots (number of trees=438)
Range (min.–max.) Mean±SD
Total tree height (cm) 23–540 238.4±112.6
Ground diameter (cm) 0.4–9.5 3.5±1.6
Length of the longest branch (cm) 3–484 131.2±88.6
Height of the longest branch (cm) 0–340 75.2±59.8
Number of branches 0–59 13±11
TLS application in long-term tree experiments 455

(ten polystyrene spheres, each with a radius of 7 cm and threesheet metal checkerboards each with 42×46 cm edge lengths)were placed within and around the sampling area (Fig. 1).
The TLS was conducted in March in order to minimizeadverse impacts from high air humidity and wind as well as toavoid the occlusion from deciduous tree foliage and from highunderstory vegetation. During that time, air humidity is rela-tively low, and the scans were performed under windlessconditions or at very low wind velocity. The time lag betweenthe direct field measurements and TLS could introduce asystematic bias. Because the deciduous trees were in winterdormancy and the evergreen trees only show a very smallincrement between October and April (unpublished data), weassume that deviations caused by the time lag are largelyrestricted to a few trees where branch or stem breakage mighthave occurred during winter.
2.2.3 TLS data processing and extraction
The co-registration of the point clouds from nine scans withineach plot was carried out with FARO Scene (V. 5.0.1) in order
to yield a complete 3D representation for each plot (Fig. 2a).The artificial reference targets were automatically identifiedby FARO Scene to enable positioning of each individual scan.Each point of the 3D picture is characterized by an XYZcoordinate. To enhance the point cloud quality of focal trees,outliers and points with low reflection intensity were removedby a set of predefined standard filters. As a process of seg-mentation, we used the software Pointools Edit (V. 1.5) toisolate the focal trees manually from all laser pulse returns thatwere extraneous to the focal trees (i.e. surrounding vegetationand soil) (Fig. 2b). Independently of data measured directly inthe field, TLSmeasurements of total tree height, GD as well aslength and height of the longest branch were made manuallywith Pointools Edit. The built-in navigation allowed an easyand quick visual identification of the focal trees and relativelyquick measurements of the tree parameters. Total height wasdetermined by averaging two measurements of the lengthsfrom the point representing stem base to the endpoint of thehighest crown. For GD measurement (Fig. 3), the stem cross-section was taken manually at the position marked with whitepaint, or 5 cm above ground if the mark was absent or not
Table 2 Technical specificationsand experimental settings of theFARO LS Photon 120
FARO LS Photon 120 Hardware specifications Experimental settings
Laser power 20 mW (Laser class 3R) –
Wavelength 785 nm –
Range finder/method Phase-shift –
Measurement range 0.6–120 m –
Ranging error ±2 mm (at 25 m) –
Field-of-view (V×H) Up to 310°×360° 310°×360°
Angular step size (V, H) Up to 0.009° 0.036°
Spatial resolution Up to 2 mm (at 15 m) 6.283 mm (at 10 m)
Data acquisition rate Up to 976,000 points/s 244,000 points/s
Fig. 1 Plot layout andstandardized set-up of nine scanpositions to acquire terrestriallaser scanning (TLS) data. Thenorth sphere allowed fororientation to the cardinaldirections. The set-up scheme ofthe spheres within the plot had nofixed pattern, but was adjusteddepending on vegetation densityand topography. The horizontaldistance between two plantingpositions is 1.29 m, resulting in ahorizontal plot size of 41.6 m2
456 Y. Li et al.

detected due to occlusion. The maximum diameter and itsorthogonal were visually determined and manually measuredwith the tool “distance measure”. GD was calculated as theaverage of these two measurements. Additionally, to examinewhether the congruence of GD measurements varies accord-ing to the point cloud quality of the cross-sections, we intro-duced three quality classes, namely class 0, class 1, and class2. Cross-sections with incomplete contours were classified asclass 0; those with a complete contour but without white paintmark were categorized as class 1; those with both completecontour and white paint mark were grouped into class 2. Thelongest branch was first identified from different view angles.The length of the detected longest branch was measured as thelength between the branch collar and the endpoint of thebranch. The length between the stem base and the branchcollar was measured as the height of the longest branch.
An overview of the numbers of measured individual treesper tree structural parameter for direct field and point cloudmeasurement is presented in Table 3.
2.3 Data analysis
We used correlation analyses to compare TLS-retrieved datawith the field-measured data. Pearson correlations were ap-plied for normally distributed data (total tree height and GD),whereas Spearman rank correlations were used for non-normally distributed data (length and height of the longestbranch). Root-mean-square error (RMSE) was calculated toobtain the standard deviation of TLS-retrieved data from fieldmeasured data. We implemented generalized linear models(GLM) with binomial family to test whether the proportionaldeviation of the TLS data from inventory data was dependenton extrinsic factors, including potential occlusion (sum ofGDs of the focal tree’s nearest neighbors, sum of all GDs onplot level), inventory team, point cloud quality of GDs, thestructural parameters of the focal trees (total height and
Fig. 2 Three-dimensional (3D) point cloud scene of one plot and anisolated tree
Fig. 3 Manual extraction of the stem cross-section 5 cm above ground,and visual determination and manual measurement using the Pointoolstool “distance measure” of the maximum diameter and its orthogonal ofthe stem cross-section
Table 3 Number of measured tree individuals per tree structural param-eter for the direct field measurements and terrestrial laser scanning (TLS)measurements
Number of measured tree individuals
Direct fieldmeasurement
TLSmeasurement
Total tree height 438 431
Ground diameter 438 391
Length of the longest branch 431 408
Height of the longest branch 431 408
TLS application in long-term tree experiments 457

number of branches), as well as species identity. All factorswere scaled in order to make the model estimates comparable.GD data was transformed by multiplying it by 10. Data forlength and height of the longest branch were square-root-transformed. Each tree structural parameter was tested againsteach selected factor except GD point cloud quality. Only GDwas tested against the point cloud quality. For GLM with acategorical predictor, an ANOVA (using type “III” to cope forthe unbalanced level proportions) was applied to test whetherthe variance was significantly different among the levels ofone factor. Statistical analyses were conducted in R 3.0.1 (RDevelopment Core Team). Package hydroGOF was used forcalculating RMSE. The deviance percentage obtained fromthe chi-square test was calculated using packageBiodiversityR for the proportion of the explained varianceby one specific factor. Package car was used for analyzingthe type “III” ANOVA.
3 Results
According to the direct field measurements, 438 living treeswere present in the total of 504 surveyed planting positions.Of these, seven trees were branchless (Table 3). TLS datasuccessfully detected 431 trees. For all of these trees, the totalheight was measured in the point clouds, GD measurementswere conducted for 391 trees, and the length and the height ofthe longest branch was determined for 408 trees (Table 3).
The correlation coefficients between direct field and TLSmeasurements for total tree height, GD and length of thelongest branch were very high (r≥0.95***), whereas that forthe height of the longest branch was fairly high (r=0.81***;Fig. 4). In height measurements, a higher proportion of com-parisons showed larger values in the direct field measurementsthan in the TLS measurements (points below the equality linein Fig. 4a), but the absolute divergence was almost alwayssmall. Most of the outliers, however, occurred above theequality line and concerned larger tree heights (>250 cm). InGD measurements, points were equally distributed above andbelow the equality line (Fig. 4b). A somewhat larger diver-gence between the measurement results was seen mostly forsmaller values in the direct field than in TLS measurements(points above the equality line in Fig. 4b). The comparison ofthe measurements of the length of the longest branch revealeda larger number of points below the equality line, but outlierswere exclusively observed above the line (i.e., value directfield measurement<TLSmeasurement; Fig. 4c). The distribu-tion of the points for the height of the longest branch wasrelatively scattered, with several extreme outliers below theline (Fig. 4d).
As Table 4 shows, the variance of direct field and TLSmeasurements for total tree height was influenced slightly bythe sum of the GD on both the local neighborhood level
(estimate=0.01) and the plot level (estimate=0.02).Furthermore, the variance differed significantly between in-ventory teams and tree species. The variance of GD measure-ments was only significantly related to the focal tree’s height(estimate=0.03), however, with an overall low explained var-iance (r=3.13 %). None of the factors included in the GLMcontributed to the explanation of the two measurement ap-proaches regarding the two tree structural parameters lengthand height of the longest branch.
4 Discussion
In the selected 14 plots, the survival rate of planted trees was87%, which corresponds exactly to the overall survival rate ofplanted trees in the entire BEF-China experiment during thecensus interval April 2009 to June 2010 (Yang et al. 2013).The TLS data successfully detected more than 98 % of theliving trees. All seven trees that were not found in the pointclouds were small, with a total height below 40 cm and a GDbelow 0.8 cm. Although the experimental plots were regularlyweeded, and although most of the herbaceous vegetationretreats during the winter months, a tree height of 40 cm seemsto be the minimum size that is required for tree detection andheight measurements with the TLS set-up used in this study.For about 10% of the TLS-detected trees, the GD could not bedetermined from TLS data. This was mainly due to occlusionof the stems caused by ground layer vegetation as well as otherplanted trees that were positioned between the laser scannerand the focal tree. Furthermore, in the only evergreen treespecies, S. superba, leaved branches often reached down tolow heights and occluded the stem at ground height. As aresult, fragments with less than half of the cross-section con-tour appeared at ground height, and these trees were excludedfrom GD measurements. In a few cases, numerous fuzzypoints occurred in the cross-section preventing a clear delin-eation of the stem surface. However, this was restricted to thesmallest trees that were surrounded by herbaceous vegetation.Finally, in 19 trees, it was not possible to identify the longestbranch. Most of these trees were S. superba, reinforcing theadvantages of leaf-off compared to leaf-on conditions forenhancing the level of accuracy in detailed TLSmeasurements(Henning and Radtke 2006; Maas et al. 2008).
As expected (H1), TLS-derived data were highly congruentwith data from direct field measurements. Generally, conven-tional measurements of height are more prone to measuringinaccuracies than those of the stem diameter (Pretzsch 2009).In our study, however, tree height data obtained by TLSapproximated field-collected data even more closely thanGD data. We suppose that the main reason is that the totalheight of the trees measured in this study still allowed foraccurate direct height measurements with a measuring pole,whereas heights of larger trees (>6 m) have to be obtained by
458 Y. Li et al.

optical or laser tools such as a hypsometer. For time reasons,only one stem diameter measurement with a caliper was donein the field, which may cause inaccuracies in the case of non-circular stem cross-sections (see below).
On average, TLS tended to slightly underestimate total treeheight and length of the longest branch. One reason for thismight be that the direct field measurements were carried outunder leaf-on conditions, whereas TLS was done under leaf-
Fig. 4 Comparison betweendirect field measurement andterrestrial laser scanning (TLS)measurements for a total treeheight, b stem diameter at groundheight (ground diameter), c lengthof the longest branch, and dheightof the longest branch. Thecorrelation coefficient (r) and theroot-mean-square-root error(RMSE) of the twomeasurementsare 0.98 and 20.56 cm for totaltree height, 0.95 and 0.52 cm forGD, 0.95 and 34.25 cm for lengthof the longest branch, and 0.81and 38.12 cm for height of thelongest branch, respectively. Allcorrelations are truly correlatedand significantly not equal to 0(Pr<0.001)
Table 4 Results of generalized linear models (GLM) for the comparison of data on four tree structural parameters derived from direct fieldmeasurements and terrestrial laser scanning (TLS) measurements (given as estimates, i.e., the percentage of the variance explained)
Tree structural parameter
H GD Llong Hlong
Estimate (the explained variance) GDN 0.01**(1.9 %) n.s. n.s. n.s.
GDP 0.02***(4.3 %) n.s. n.s. n.s.
IT n.d.***(16.8 %) n.s. n.s. n.s.
PCQ n.d. n.s. n.d. n.d.
H n.s. 0.03*(3.13 %) n.s. n.s.
NB n.s. n.s. n.s. n.s.
Species n.d.***(7.2 %) n.s. n.s. n.s.
Tree structural parameters:H total tree height,GDstem diameter at ground height, Llong length of the longest branch,Hlongheight of the longest branch,the continuous predictors include GDN sum of the focal tree’s neighboring GDs, GDP sum of all GDs within a plot, H total tree height of the focal tree,NB the number of branches of the focal tree, the categorical predictors include IT inventory team, PCQGD point cloud quality, Species species identity,n.s. statistically not significant, n.d. not determined
***Pr<0.001; **0.001≤Pr<0.01; *0.01≤Pr<0.05
TLS application in long-term tree experiments 459
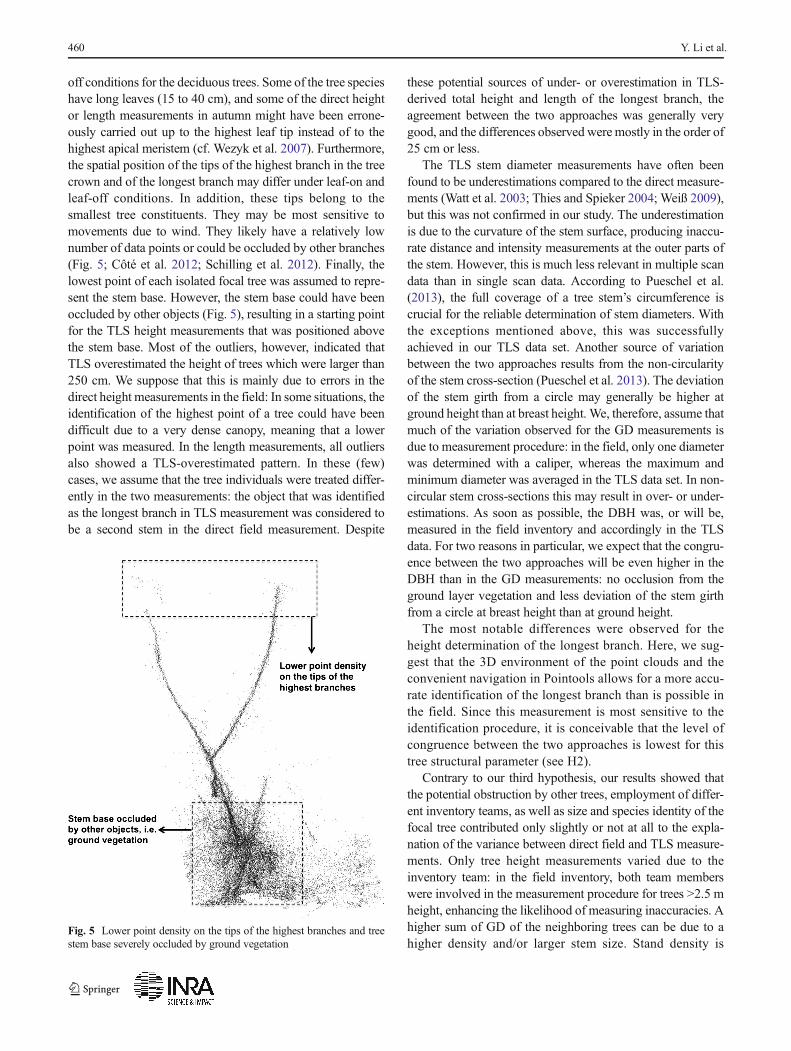
off conditions for the deciduous trees. Some of the tree specieshave long leaves (15 to 40 cm), and some of the direct heightor length measurements in autumn might have been errone-ously carried out up to the highest leaf tip instead of to thehighest apical meristem (cf. Wezyk et al. 2007). Furthermore,the spatial position of the tips of the highest branch in the treecrown and of the longest branch may differ under leaf-on andleaf-off conditions. In addition, these tips belong to thesmallest tree constituents. They may be most sensitive tomovements due to wind. They likely have a relatively lownumber of data points or could be occluded by other branches(Fig. 5; Côté et al. 2012; Schilling et al. 2012). Finally, thelowest point of each isolated focal tree was assumed to repre-sent the stem base. However, the stem base could have beenoccluded by other objects (Fig. 5), resulting in a starting pointfor the TLS height measurements that was positioned abovethe stem base. Most of the outliers, however, indicated thatTLS overestimated the height of trees which were larger than250 cm. We suppose that this is mainly due to errors in thedirect height measurements in the field: In some situations, theidentification of the highest point of a tree could have beendifficult due to a very dense canopy, meaning that a lowerpoint was measured. In the length measurements, all outliersalso showed a TLS-overestimated pattern. In these (few)cases, we assume that the tree individuals were treated differ-ently in the two measurements: the object that was identifiedas the longest branch in TLS measurement was considered tobe a second stem in the direct field measurement. Despite
these potential sources of under- or overestimation in TLS-derived total height and length of the longest branch, theagreement between the two approaches was generally verygood, and the differences observed were mostly in the order of25 cm or less.
The TLS stem diameter measurements have often beenfound to be underestimations compared to the direct measure-ments (Watt et al. 2003; Thies and Spieker 2004; Weiß 2009),but this was not confirmed in our study. The underestimationis due to the curvature of the stem surface, producing inaccu-rate distance and intensity measurements at the outer parts ofthe stem. However, this is much less relevant in multiple scandata than in single scan data. According to Pueschel et al.(2013), the full coverage of a tree stem’s circumference iscrucial for the reliable determination of stem diameters. Withthe exceptions mentioned above, this was successfullyachieved in our TLS data set. Another source of variationbetween the two approaches results from the non-circularityof the stem cross-section (Pueschel et al. 2013). The deviationof the stem girth from a circle may generally be higher atground height than at breast height. We, therefore, assume thatmuch of the variation observed for the GD measurements isdue to measurement procedure: in the field, only one diameterwas determined with a caliper, whereas the maximum andminimum diameter was averaged in the TLS data set. In non-circular stem cross-sections this may result in over- or under-estimations. As soon as possible, the DBH was, or will be,measured in the field inventory and accordingly in the TLSdata. For two reasons in particular, we expect that the congru-ence between the two approaches will be even higher in theDBH than in the GD measurements: no occlusion from theground layer vegetation and less deviation of the stem girthfrom a circle at breast height than at ground height.
The most notable differences were observed for theheight determination of the longest branch. Here, we sug-gest that the 3D environment of the point clouds and theconvenient navigation in Pointools allows for a more accu-rate identification of the longest branch than is possible inthe field. Since this measurement is most sensitive to theidentification procedure, it is conceivable that the level ofcongruence between the two approaches is lowest for thistree structural parameter (see H2).
Contrary to our third hypothesis, our results showed thatthe potential obstruction by other trees, employment of differ-ent inventory teams, as well as size and species identity of thefocal tree contributed only slightly or not at all to the expla-nation of the variance between direct field and TLS measure-ments. Only tree height measurements varied due to theinventory team: in the field inventory, both team memberswere involved in the measurement procedure for trees >2.5 mheight, enhancing the likelihood of measuring inaccuracies. Ahigher sum of GD of the neighboring trees can be due to ahigher density and/or larger stem size. Stand density is
Fig. 5 Lower point density on the tips of the highest branches and treestem base severely occluded by ground vegetation
460 Y. Li et al.

generally considered to have a key influence on the quality ofthe information from TLS (Watt and Donoghue 2005; Van derZande et al. 2006). The density of more than 5,000 trees ha−1
in our plots can be regarded as relatively high for applicationof TLS (Watt and Donoghue 2005). However, the low effectsize (tree height) and non-significant influence (other threetree structural parameters), respectively, of the GD sum ofneighboring trees implies that the scanning set-up schemeapplied in our study was adequate to minimize the occlusionof focal trees. Furthermore, species identity was a significantpredictor explaining the variance in height measurements,thoughwith a small effect size. The saplings of the tree speciesof these subtropical broad-leaved forests differ considerably ingrowth rates and tree architecture (Geißler et al. 2012; Langet al. 2012). To determine the highest point of the tree crown inthe field inventory might be easier in trees with a light andsimple structure crown, such as S. saponaria. Finally, a smallproportion of the variance in the GD measurements could beexplained by focal tree height. In our study, trees of greaterheight were predominantly C. axillaris. Tree individuals ofthis species were often multi-stemmed, leading to non-circularity of the stem cross-section at ground height, whichmay explain the higher deviation of the two measurementapproaches with increasing tree height. However, most ofthe variance between direct field and TLS measurementscould not be explained by the factors considered in the GLManalyses, but might be due to the factors mentioned above(i.e., small dimension of some important tree constituents,occlusion by ground layer vegetation, wind-induced move-ments, identification procedure).
Due to the current lack of reliable automated approaches intree segmentation and measurements, the data retrieval of thefour tree parameters from TLS is more time-consuming thanby direct field measurement in small trees (per tree about12 min from TLS and about 5 min in the field). However, assoon as the trees grow larger, the non-destructive quantifica-tion of crown parameters becomes more time-consuming oreven impossible with a high degree of accuracy. However, theTLS alternative not only saves time when conducting certainmeasurements in larger trees, but also provides several otherbenefits: it is a documentation tool with the full option forfuture analyses, including precise time series analyses; itallows the estimation of individual-tree wood volume, bothfor the whole tree and various constituents (stem andbranches; Dassot et al. 2012); it enables the analysis of the3D structural topology of trees as well as the 3D distributionof plant material (Seidel et al. 2011b); and it provides the basisfor tree crown modeling which can be used to investigate lightharvesting and tree-tree-interactions (Seidel et al. 2011c; Metzet al. 2013). In recent years, several methods forreconstructing trees or parts of trees in 3D have been devel-oped (Eysn et al. 2013). Automatic methods for tree modelinginclude voxel-based and geometric models. These approaches
are, however, sensitive to point cloud quality and varyingpoint density, and therefore manual or semi-automatic pro-cessing is still an option to enhance the quality of results(Dassot et al. 2012; Eysn et al. 2013).
We conclude that TLS enables a reliable determination oftree structural parameters in young trees under field conditions.The scanning set-up scheme used in this study produced pointclouds of high quality, enabling us to detect all trees higherthan 40 cm and to reduce occlusions (Fig. 2). Furthermore,TLS data analyses proved to be more accurate in the identifi-cation of certain structural features than the direct field inven-tory and can help to reduce the measuring inaccuracies causedby the employment of several different inventory teams in thefield. However, two factors may restrict the application of TLSto young regenerating stands: the structural complexity ofthese stands and the current lack of automated tools for dataextraction. The regular weeding of the experimental plots wasstrongly beneficial to the accuracy of TLS measurements, andstands with an even higher tree density and/or herbaceousvegetationwill require adjusted scan settings. In extreme cases,however, TLS will only be possible after canopy closure andself-thinning. In relatively small evergreen trees with densecrowns, the woody structures are largely occluded by leaves;however, tree growth with natural pruning of the lowerbranches will increase the visibility of structural elements ofthe crown when using ground-based TLS. Further research isneeded to achieve more rapid point cloud data processing bythe development of automated methods.
Acknowledgments This research was carried out as part of the BEF-China project financed by the German Research Foundation (DFG FOR891/2).We are grateful to all members of BEF-China for their support andto Lars Goldbach for his valuable assistance in the scanning campaign.We thank the two anonymous reviewers for comments that considerablyimproved the earlier version of the manuscript.
References
Brisson J (2001) Neighborhood competition and crown asymmetry inAcer saccharum. Can J For Res 31:2151–2159
Bruelheide H, Böhnke M, Both S, Fang T, Assmann T, Baruffol M,Bauhus J, Buscot F, Chen XY, Ding BY, Durka W, Erfmeier A,Fischer M, Geißler C, Guo DL, Guo LD, Härdtle W, He JS, HectorA, Kröber W, Kühn P, Lang AC, Nadrowski K, Pei KQ, Scherer-Lorenzen M, Shi XZ, Scholten T, Schuldt A, Trogisch S, vonOheimb G, Welk E, Wirth C, Wu YT, Yang XF, Zeng XQ, ZhangSR, Zhou HZ, Ma KP, Schmid B (2011) Community assemblyduring secondary forest succession in a Chinese subtropical forest.Ecol Monogr 81:25–41
Bruelheide H, Nadrowski K, Assmann T, Bauhus J, Both S, Buscot F,Chen XY, Ding BY, DurkaW, Erfmeier A, Gutknecht J, GuoD, GuoLD, Härdtle W, He JS, Klein A, Kühn P, Liang Y, Liu X, MichalskiS, Niklaus P, Pei K, Scherer-Lorenzen M, Scholten T, Schuldt A,Seidler G, von Oheimb G, Welk E, Wirth C, Wubet T, Yang XF, YuMJ, Zhang SR, Zhou HZ, Fischer M, Ma KP, Schmid B (2014)Designing forest biodiversity experiments: general considerations
TLS application in long-term tree experiments 461

illustrated by a new large experiment in subtropical China. MethodsEcol Evol. doi: 10.1111/2041-210X.12126
Bucksch A, Lindenbergh R,Menenti M (2010) SkelTre—robust skeletonextraction from imperfect point clouds. Vis Comput 26:1283–1300
Côté JF, Fournier RA, Egli R (2011) An architectural model of trees toestimate forest structural attributes using terrestrial LiDAR. EnvironModel Software 26:761–777
Côté JF, Fournier RA, Frazer GW, Niemann KO (2012) A fine-scalearchitectural model of trees to enhance LiDAR-derived measure-ments of forest canopy structure. Agric For Meteorol 166–167:72–85
Dassot M, Constant T, Fournier M (2011) The use of terrestrial LiDARtechnology in forest science: application fields, benefits and chal-lenges. Ann For Sci 68:959–974
Dassot M, Colin A, Santenoise P, Fournier M, Constant T (2012)Terrestrial laser scanning for measuring the solid wood volume,including branches, of adult standing trees in the forest environment.Comput Electron Agric 89:86–93
Eysn L, Pfeifer N, Ressl C, Hollaus M, Grafl A, Morsdorf F (2013) Apractical approach for extracting tree models in forest environmentsbased on equirectangular projections of terrestrial laser scans.Remote Sens 5:5424–5448
Fleck S, Mölder I, Jacob M, Gebauer T, Jungkunst HF, Leuschner C(2011) Comparison of conventional eight-point crown projectionswith LiDAR-based virtual crown projections in a temperate old-growth forest. Ann For Sci 68:1173–1185
Geißler G, Lang AC, von Oheimb G, Härdtle W, Baruffol M, Scholten T(2012) Impact of tree saplings on the kinetic energy of rainfall—theimportance of stand density, species identity and tree architecture insubtropical forests in China. Agric For Meteorol 156:31–40
Grams TEE, Anderson CP (2007) Competition for resources in trees:physiological versus morphological plasticity. Progr Bot 68:356–381
Henning JG, Radtke PJ (2006) Detailed stem measurements of standingtrees from ground-based scanning LiDAR. For Sci 52:67–80
Hilker T, van Leeuwen M, Coops NC, Wulder MA, Newnham GJ, JuppDLB, Culvenor DS (2010) Comparing canopy metrics derived fromterrestrial and airborne laser scanning in a Douglas-fir dominatedforest stand. Trees-Struct Funct 24:819–832
Hopkinson C, Chasmer L, Young-Pow C, Treitz P (2004) Assessingforest metrics with a ground-based scanning lidar. Can J For Res34:573–583
Jung SE, Kwak DA, Park T, Lee WK, Yoo SJ (2011) Estimating crownvariables of individual trees using airborne and terrestrial laserscanners. Remote Sens 3:2346–2363
Kobe RK (2006) Sapling growth as a function of light and landscape-level variation in soil water and foliar nitrogen in northernMichigan.Oecologia 147:119–133
Lang AC, Härdtle W, Baruffol M, Böhnke M, Bruelheide H, Schmid B,vonWehrden H, von Oheimb G (2012) Mechanisms promoting treespecies coexistence: experimental evidence with saplings of sub-tropical forest ecosystems of China. J Veg Sci 23:837–846
Lichti DD, Gordon SJ, Stewart MP (2002) Ground-based laser scanners:operation, systems and applications. Geophys J Roy Astron Soc 56:21–33
Maas HG, Bienert A, Scheller S, Keane E (2008) Automatic forestinventory parameter determination from terrestrial laser scannerdata. Int J Remote Sens 29:1579–1593
Metz J, Seidel D, Schall P, Scheffer D, Schulze ED, Ammer C (2013)Crown modeling by terrestrial laser scanning as an approach toassess the effect of aboveground intra- and interspecific competitionon tree growth. For Ecol Manage 310:275–288
Pretzsch H (2009) Forest dynamics, growth and yield: frommeasurementto model. Springer, Berlin
Pretzsch H, Seifert S, Huang P (2011) Beitrag des terrestrischenLaserscannings zur Erfassung der Struktur von Baumkronen.Schweiz Z Forstwes 162:186–194
Pueschel P, Newnham G, Rock G, Udelhoven T, Werner W, Hill J (2013)The influence of scan mode and circle fitting on tree stem detection,stem diameter and volume extraction from terrestrial laser scans.ISPRS J Photogramm Remote Sens 77:44–56
Schilling A, Schmidt A, Maas HG (2012) Tree topology representationfrom TLS point clouds using depth-first search in voxel space.Photogramm Eng Remote Sens 78:383–392
Seidel D, Beyer F, Hertel D, Fleck S, Leuschner C (2011a) 3D-laserscanning: a non-destructive method for studying above-groundbiomass and growth of juvenile trees. Agric For Meteorol 151:1305–1311
Seidel D, Fleck S, Leuschner C, Hammett T (2011b) Review of ground-based methods to measure the distribution of biomass in forestcanopies. Ann For Sci 68:225–244
Seidel D, Leuschner C, Müller A, Krause B (2011c) Crown plasticity inmixed forests—quantifying asymmetry as a measure of competitionusing terrestrial laser scanning. For Ecol Manage 261:2123–2132
Stoll P, Schmid B (1998) Plant foraging and dynamic competition be-tween branches of Pinus sylvestris in contrasting light environments.J Ecol 86:934–945
Sumida A, Terazawa I, Togashi A, Komiyama A (2002) Spatial arrange-ment of branches in relation to slope and neighborhood competition.Ann Bot 89:301–310
Thies M, Spieker H (2004) Evaluation and future prospects of terrestriallaser scanning for standardized forest inventories. Int ArchPhotogram Rem Sens Spatial Inform Sci 36:192–197
Van der Zande D, Hoet W, Jonckheere I, van Aardt J, Coppin P (2006)Influence of measurement set-up of ground-based LiDAR for deri-vation of tree structure. Agric For Meteorol 141:147–160
Van Leeuwen M, Nieuwenhuis M (2010) Retrieval of forest structuralparameters using LiDAR remote sensing. Eur J For Res 129:749–770
Vehmas M, Packalén P, MaltamoM, Eerikäinen K (2011) Using airbornelaser scanning data for detecting canopy gaps and their understorytype in mature boreal forest. Ann For Sci 68:825–835
Watt PJ, Donoghue DNM (2005) Measuring forest structure with terres-trial laser scanning. Int J Remote Sens 26:1437–1446
Watt PJ, Donoghue DNM, Dunford RW (2003) Forest parameter extrac-tion using terrestrial laser scanning. Proc. ScandLaser ScientificWorkshop on Airborne Laser Scanning of Forests, Umeå, Sweden,237–244
Weiß J (2009) Application and statistical analysis of terrestrial laserscanning and forest growth simulations to determine selected char-acteristics of Douglas-Fir stands. Folia For Pol, Ser A 51:123–137
Wezyk P, Koziol K, Glista M, Pierzchalski M (2007) Terrestrial laserscanning versus traditional forest inventory: First results from thePolish forests. In: Proc. Laser Scanning 2007 and Silvilaser 2007.ISPRS Commission III Workshop, Vol. 36, Part 3, Espoo, Finland,Sept. 12–14, 2007
Yang XF, Bauhus J, Both S, Fang T, Härdtle W, Kröber W, Ma KP,Nadrowski K, Pei KQ, Scherer-Lorenzen M, Scholten T, Seidler G,Schmid B, von Oheimb G, Bruelheide H (2013) Establishmentsuccess in a forest biodiversity and ecosystem functioning experi-ment in subtropical China (BEF-China). Eur J For Res 132:593–606
Zimble DA, Evans DL, Carlson GC, Parker RC, Grado SC, Gerard PD(2003) Characterizing vertical forest structure using small-footprintairborne LiDAR. Remote Sens Environ 87:171–182
462 Y. Li et al.