Assessing the informational value of parameter estimates in cognitive models
Assessing the value of information for water quality management:a watershed perspective from China
Bin Wu & Yi Zheng
Received: 22 February 2012 /Accepted: 25 June 2012 /Published online: 20 July 2012# Springer Science+Business Media B.V. 2012
Abstract To tackle China’s pervasive water pollution,tremendous efforts are needed to achieve more and betterinformation. However, resources for information collec-tion (e.g., water quality monitoring, field experiments,etc.) are very limited for large watersheds with significantnonpoint source pollution. Thus, it is crucial to identifythe priority of information acquisition. Based on thetheory of value of information (VOI), a stochasticoptimization approach was developed in this study toevaluate the importance of information. The approachwas applied to several key polluted water bodies in China(e.g., Lake Taihu, Lake Chaohu, and Lake Dianchi). Themajor findings include: (1) because of the severe pollu-tion and large uncertainty, the VOI for the targeted waterbodies is substantial; (2) when the uncertainty is signifi-cant, a stricter regulation would result in a higher VOI,and therefore provide more incentives for data collection;(3) due to the interaction among different informationsources, collecting multiple types of information simul-taneously could be more valuable than collecting one
after another; and (4) the importance of a specific typeof information could vary significantly across water-sheds. The proposed approach can be readily extendedto more complex models and more sophisticated water-shed cases. It could effectively support watershedmanagement in China, as well as in other countries.
Keywords Value of information . Uncertainty .
Nonpoint source . China . Eutrophication .Watershedmanagement . Probability constrained optimization
Introduction
China has become the second largest economy in theworld behind only the USA. However, its unprece-dented economic expansion has caused many environ-mental problems including pervasive water pollution(SEPA 2011). Eutrophication due to excessivenutrients is a major aquatic environmental problemin China’s large freshwater lakes, such as Lake Taihu(Hans et al. 2011); Lake Chaohu (Xu et al. 2011), andLake Dianchi (Wang et al. 2010), and has drawninternational attention (Guo 2007, Stone 2008). Al-though stricter regulations have been formulated andcarried out for municipal and industrial wastewater,nonpoint sources (e.g., runoff from agricultural areas)remain largely unregulated in China, and account for alarge share of the nutrients loading into those eutro-phic lakes (Edwin et al. 2010). It has been well recog-nized that environmental management should addressboth point and nonpoint sources at a watershed scale. In
Environ Monit Assess (2013) 185:3023–3035DOI 10.1007/s10661-012-2769-8
B. Wu :Y. ZhengDepartment of Energy and Resources Engineering,College of Engineering, Peking University,Beijing 100871, China
B. Wu :Y. ZhengCenter for Water Research, Peking University,Beijing 100871, China
Y. Zheng (*)298 Chengfu Road, Suite 301, Haidian District,Beijing 100871, Chinae-mail: [email protected]
the USA, for example, the Total Maximum Daily Load(TMDL) program (NRC 2001) incorporates the controlof nonpoint sources into the water quality management.
Asmainly drivenby rainfall–runoff process, nonpointsource pollution (NSP) has complex mechanisms andinvolves significant uncertainty (Zheng and Keller2007). In practice, information is often insufficient formaking good management decision on NSP control,and unfortunately information acquisition is costly(Farzin and Jonathan 2004). The TMDL program haslong been questioned regarding its scientific basis(NRC 2001). The major concern is lack of informationrequired to identify pollutant sources and their respectivecontributions towater quality impairment, and to allocateload reductionsamongsources. InChina, the “TotalLoadControl” (TLC) program, the counterpart of the TMDLprogram, has not included nonpoint sources yet, partiallybecause of the paucity of data on China’s NSP. In 2006,China launched the Major Science and Technology Pro-gramforWaterPollutionControlandTreatment, inwhichcontrol of NSP is one major concern. Although thisnational program, with a budget of about five billion USdollars for the next 15 years, is deemed as the strongestsupport ever for scientific and technological studies onChina’s water pollution, the financial resource for NSPinformation acquisition is still very limited. Suchresource-limited situation is very common, even in de-veloped countries like the USA (Farzin and Jonathan2004). Therefore, it is crucial to assess the importance ofdifferent types of information and identify the priority ofinformation acquisition. However, very few studies havediscussed this important issue.
Value of information (VOI) is now a well-establishedtheory in economic and management sciences. Ahituvand Neumann (1982), for the first time, summarized theVOI studies in the management field. Later, Lawrence(1999) provided techniques for assessment of VOI andcomparison of informativeness among alternative sour-ces, and presented principles for optimal design andmanagement of information systems. Up to now, theVOI theory has been widely applied in various areasincluding ecological protection (Koerkamp et al. 2006;Michael et al. 2011) and natural resources conservation(Bontems and Thomas 2000; Byron et al. 2011). But onlyin recent years has the theory been adopted for waterresources studies. For instance, in studying a groundwa-ter remediation system, Ma and Chang (2008) calculatedthe value of the information achieved by additional sam-pling. Bouma et al. (2009) assessed the value of an
extended monitoring system for the eutrophication inthe North Sea using a questionnaire method. Borisovaet al. (2005) developed an approach to calculate the VOIfor the control of watershed nonpoint source pollution. Intheir approach, net benefit of the whole society is maxi-mized by altering the land use composition and/or fertil-izer application rates. Two management scenarios werediscussed, one was price control and the other was quan-tity control. Borisova et al.’s approach involves the cal-culation of damages of pollution and/or benefits of waterquality management. In real cases, however, it is verydifficult to objectively evaluate the damages and benefits.
In this study, within the context of China’s eutrophi-cation issues, we developed a new approach to assessthe VOI for water quality management, which integratesprobability constrained optimization (Couchman et al.2006; Li et al. 2008). In our approach, the VOI isreflected by the change of pollution abatement cost,rather than by that of pollution damages and/or manage-ment benefits. The approach uses the maximum allowedload of a receiving water body as a key constraint, fortwo main reasons: first, load constraint is a commonmeasure in water quality regulations such as the TMDLin the USA and the TLC in China; second, pollutiondamages and/or management benefits should already betaken into account, at least partially, in setting loadconstraints. The proposed approach was first applied tothe nitrogen pollution problem in the Dongtiao River(Wang et al. 2004), a major tributary of Lake Taihu, andthe values of different types of information wereassessed under different scenarios. Next, the VOI wasevaluated for the nitrogen pollution in three criticalfreshwater lakes in China—Lake Taihu, Lake Chaohu,and Lake Dianchi. Important implications to watershedwater quality management were drawn.
The remainder of this paper is organized as follows.The “Assessment framework” section introduces theframework we proposed to calculate the VOI. The“Methods and data” section explains the methodsand data used in the case studies. Results and conclu-sions are presented in the “Results and discussions”and “Conclusions” sections, respectively.
Assessment framework
This study addressed a management scenario in which awater bodydoesnotmeet its ambient-basedwater qualitystandard(s) or pollutant load limit(s) and therefore,
3024 Environ Monit Assess (2013) 185:3023–3035
abatement is required for bothpoint andnonpoint sourcesofpollutionwithin itsdrainagearea.This is typicalofbothUS’sTMDLandChina’sTLC regulations.Naturally, it isdesired that the abatement cost be minimized while thecompliance is still achieved. If uncertainty is accountedfor, this minimization problem can be expressed in gen-eral as Eqs. (1) and (2):
minqp;qn
fE½Cpðqp; θÞ þ Cnðqn; θÞ�g ð1Þ
s.t.
PfQpðqp; θÞ þ Qnðqn; θÞ � Lg � a ð2ÞOther relevant constraintsWhere C denotes the abatement costs, q denotes the
amounts of abatement, Q denotes the emission loads ofdifferent sources; the subscripts p and n stand for pointsource and nonpoint source, respectively; θ is a vectorof random variables, representing all uncertain factorsfor which additional information is desired; L denotesthe load limit of the targeted water body, set by regu-lators; and α is the acceptable confidence level of com-pliance. Equation (2) is a typical probabilistic constraint.Optimization with probabilistic constraints has beendiscussed in many environmental studies (Li et al.2008; Mendes and Ribeiro 2010), and techniques tosolve the optimization problem have been developed(Bernard and Michael 2010; Van Ackooij et al. 2011).The optimal solutionfq*p; q*ngfor Eq. (1) can be denoted
as argminqp;qn
fE½Cpðqp; θÞ þ Cnðqn; θÞ�g, and the mini-
mized total cost (expected value) can be written as:
TC0 ¼ E½Cpðq*p; θÞ þ Cnðq*n; θÞ� ð3Þ
Where the subscript “0” indicates no additionalinformation.
If perfect information about the uncertain factors θis available, θ turns deterministic, and the optimiza-tion model becomes:
minqp;qn
fCpðqp; θÞ þ Cnðqn; θÞg ð4Þ
s.t.
Qpðqp; θÞ þ Qnðqn; θÞ � L ð5ÞOther relevant constraintsIts solutionfq��p ðθÞ; q��n ðθÞgcan be denoted as arg
minqp;qn
fCpðqp; θÞ þ Cnðqn; θÞg. The minimized total cost
can then be written as:
TCpf ¼ Cpðq��p ðθÞ; θÞ þ Cnðq��n ðθÞ; θÞ ð6Þ
Where the subscript “pf” indicates perfectinformation.
There could also be a situation of imperfect informa-tion, that is, information is not sufficient to determine allthe uncertain factors, but helps reduce their uncertainty.In such cases, Eqs. (1), (2), and (3) still apply, exceptthat the original random vector θ should be updated toθ′. Due to the added information,θ′ should have smallervariances than θ. The solutionfq*p0ðθÞ; q*n0ðθÞgcan be
expressed as argminqp;qn
fCpðqp; θ0Þ þ Cnðqn; θ0Þg. The
minimized total cost with imperfect information canthen be expressed as:
TCipf ¼ E½Cpðq*p0; θ0Þ þ Cnðq*n0; θ0Þ� ð7Þ
Where the subscript “ipf” indicates imperfectinformation.
One way to measure VOI is to calculate how muchcould be saved due to the added information. Forperfect information, the ex post (i.e., assuming theexact value of θ is already known) VOI can be calcu-lated as:
VOIðθÞ ¼ TC0 � TCpf ¼ E½Cpðq*p; θÞ þ Cnðq*n; θÞ�� ½Cpðq��p ðθeÞ; θeÞ þ Cnðq��n ðθeÞ; θeÞ�
ð8Þθe in Eq. (8) stands for the exact (or true) value of
θ. However, θe is most likely unknown, so one shouldcalculate the ex ante VOI instead, which is theexpected value of VOI(θ), denoted as EVOI(Lawrence 1999; Borisova et al. 2005):
EVOIðθÞ ¼ E½TC0 � TCpf � ¼ E½Cpðq*p; θÞ þ Cnðq*n; θÞ�� E½Cpðq��p ðθÞ; θÞ þ Cnðq��n ðθÞ; θÞ�
ð9ÞSimilarly, for imperfect information, the ex ante
VOI (denoted as EVOI′) is:
EVOI0ðθÞ ¼ E½TC0 � TCipf � ¼ E½Cpðq*p; θÞ þ Cnðq*n; θÞ�� E½Cpðq*p0; θ0Þ þ Cnðq*n0; θ0Þ�
ð10Þ
Environ Monit Assess (2013) 185:3023–3035 3025
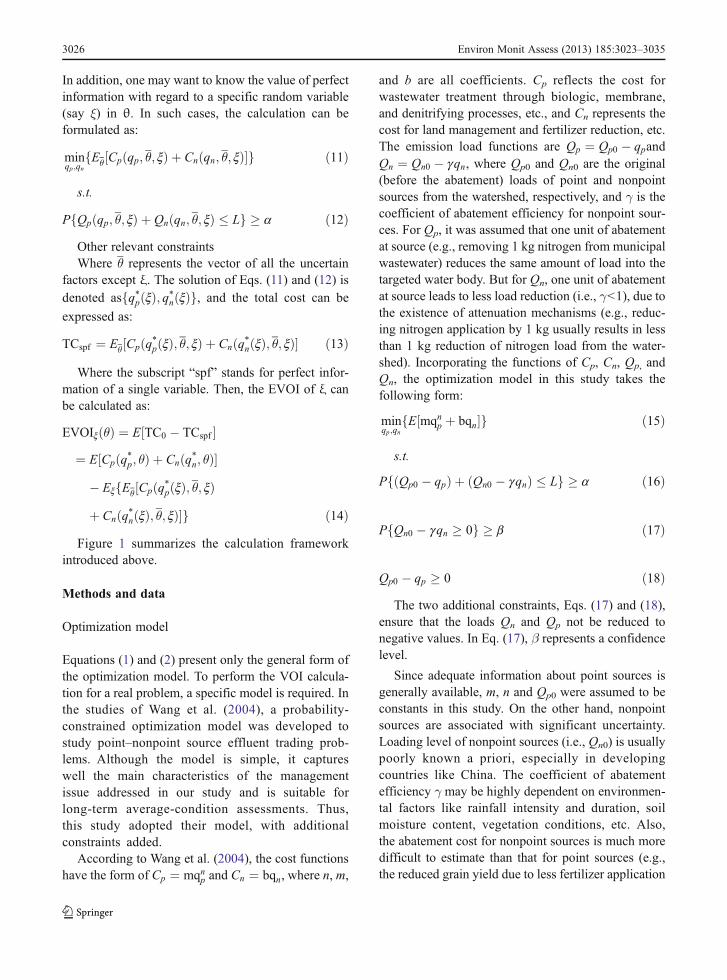
In addition, one may want to know the value of perfectinformation with regard to a specific random variable(say ξ) in θ. In such cases, the calculation can beformulated as:
minqp;qn
fEθ½Cpðqp; θ; xÞ þ Cnðqn; θ; xÞ�g ð11Þ
s.t.
PfQpðqp; θ; xÞ þ Qnðqn; θ; xÞ � Lg � a ð12ÞOther relevant constraintsWhere θ represents the vector of all the uncertain
factors except ξ. The solution of Eqs. (11) and (12) isdenoted asfq*pðxÞ; q*nðxÞg, and the total cost can be
expressed as:
TCspf ¼ Eθ½Cpðq*pðxÞ; θ; xÞ þ Cnðq*nðxÞ; θ; xÞ� ð13Þ
Where the subscript “spf” stands for perfect infor-mation of a single variable. Then, the EVOI of ξ canbe calculated as:
EVOIxðθÞ ¼ E½TC0 � TCspf �¼ E½Cpðq*p; θÞ þ Cnðq*n; θÞ�
� ExfEθ½Cpðq*pðxÞ; θ; xÞþ Cnðq*nðxÞ; θ; xÞ�g ð14Þ
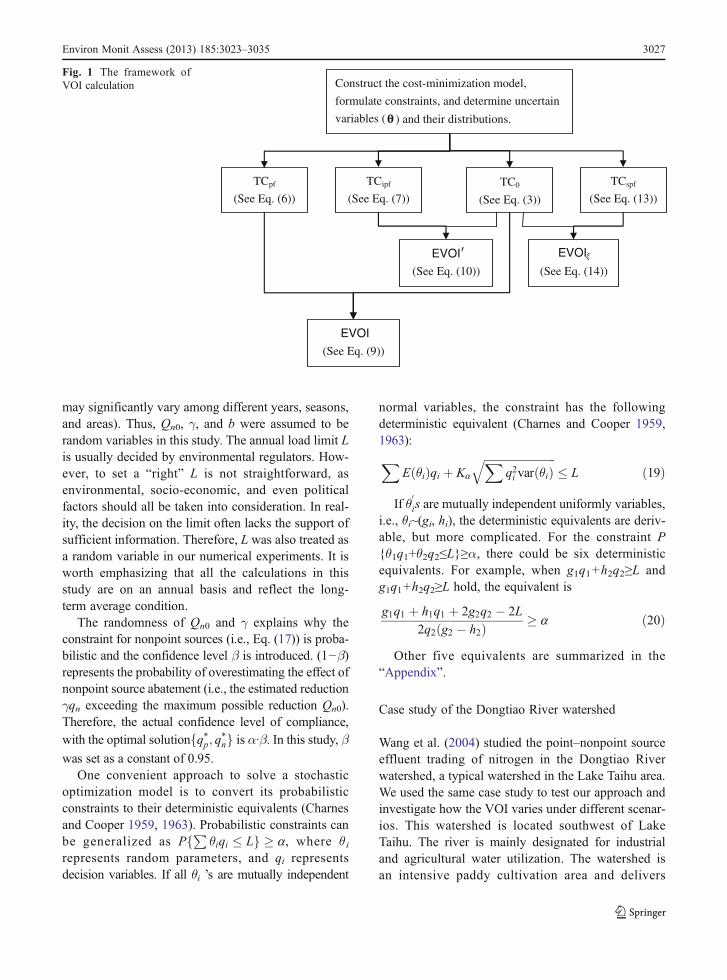
Figure 1 summarizes the calculation frameworkintroduced above.
Methods and data
Optimization model
Equations (1) and (2) present only the general form ofthe optimization model. To perform the VOI calcula-tion for a real problem, a specific model is required. Inthe studies of Wang et al. (2004), a probability-constrained optimization model was developed tostudy point–nonpoint source effluent trading prob-lems. Although the model is simple, it captureswell the main characteristics of the managementissue addressed in our study and is suitable forlong-term average-condition assessments. Thus,this study adopted their model, with additionalconstraints added.
According to Wang et al. (2004), the cost functionshave the form of Cp ¼ mqnp and Cn ¼ bqn, where n, m,
and b are all coefficients. Cp reflects the cost forwastewater treatment through biologic, membrane,and denitrifying processes, etc., and Cn represents thecost for land management and fertilizer reduction, etc.The emission load functions are Qp ¼ Qp0 � qpandQn ¼ Qn0 � gqn, where Qp0 and Qn0 are the original(before the abatement) loads of point and nonpointsources from the watershed, respectively, and γ is thecoefficient of abatement efficiency for nonpoint sour-ces. For Qp, it was assumed that one unit of abatementat source (e.g., removing 1 kg nitrogen from municipalwastewater) reduces the same amount of load into thetargeted water body. But for Qn, one unit of abatementat source leads to less load reduction (i.e., γ<1), due tothe existence of attenuation mechanisms (e.g., reduc-ing nitrogen application by 1 kg usually results in lessthan 1 kg reduction of nitrogen load from the water-shed). Incorporating the functions of Cp, Cn, Qp, andQn, the optimization model in this study takes thefollowing form:
minqp;qn
fE½mqnp þ bqn�g ð15Þ
s.t.
PfðQp0 � qpÞ þ ðQn0 � gqnÞ � Lg � a ð16Þ
PfQn0 � gqn � 0g � b ð17Þ
Qp0 � qp � 0 ð18ÞThe two additional constraints, Eqs. (17) and (18),
ensure that the loads Qn and Qp not be reduced tonegative values. In Eq. (17), β represents a confidencelevel.
Since adequate information about point sources isgenerally available, m, n and Qp0 were assumed to beconstants in this study. On the other hand, nonpointsources are associated with significant uncertainty.Loading level of nonpoint sources (i.e., Qn0) is usuallypoorly known a priori, especially in developingcountries like China. The coefficient of abatementefficiency γ may be highly dependent on environmen-tal factors like rainfall intensity and duration, soilmoisture content, vegetation conditions, etc. Also,the abatement cost for nonpoint sources is much moredifficult to estimate than that for point sources (e.g.,the reduced grain yield due to less fertilizer application
3026 Environ Monit Assess (2013) 185:3023–3035
may significantly vary among different years, seasons,and areas). Thus, Qn0, γ, and b were assumed to berandom variables in this study. The annual load limit Lis usually decided by environmental regulators. How-ever, to set a “right” L is not straightforward, asenvironmental, socio-economic, and even politicalfactors should all be taken into consideration. In real-ity, the decision on the limit often lacks the support ofsufficient information. Therefore, L was also treated asa random variable in our numerical experiments. It isworth emphasizing that all the calculations in thisstudy are on an annual basis and reflect the long-term average condition.
The randomness of Qn0 and γ explains why theconstraint for nonpoint sources (i.e., Eq. (17)) is proba-bilistic and the confidence level β is introduced. (1−β)represents the probability of overestimating the effect ofnonpoint source abatement (i.e., the estimated reductionγqn exceeding the maximum possible reduction Qn0).Therefore, the actual confidence level of compliance,with the optimal solutionfq*p; q*ng is α·β. In this study, βwas set as a constant of 0.95.
One convenient approach to solve a stochasticoptimization model is to convert its probabilisticconstraints to their deterministic equivalents (Charnesand Cooper 1959, 1963). Probabilistic constraints canbe generalized as P
Pθiqi � Lf g � a, where θ i
represents random parameters, and qi representsdecision variables. If all θi ’s are mutually independent
normal variables, the constraint has the followingdeterministic equivalent (Charnes and Cooper 1959,1963):
XEðθiÞqi þ Ka
ffiffiffiffiffiffiffiffiffiffiffiffiffiffiffiffiffiffiffiffiffiffiffiffiffiffiXq2i varðθiÞ
q� L ð19Þ
If θ0is are mutually independent uniformly variables,
i.e., θi~(gi, hi), the deterministic equivalents are deriv-able, but more complicated. For the constraint P{θ1q1+θ2q2≤L}≥α, there could be six deterministicequivalents. For example, when g1q1+h2q2≥L andg1q1+h2q2≥L hold, the equivalent is
g1q1 þ h1q1 þ 2g2q2 � 2L
2q2ðg2 � h2Þ � a ð20Þ
Other five equivalents are summarized in the“Appendix”.
Case study of the Dongtiao River watershed
Wang et al. (2004) studied the point–nonpoint sourceeffluent trading of nitrogen in the Dongtiao Riverwatershed, a typical watershed in the Lake Taihu area.We used the same case study to test our approach andinvestigate how the VOI varies under different scenar-ios. This watershed is located southwest of LakeTaihu. The river is mainly designated for industrialand agricultural water utilization. The watershed isan intensive paddy cultivation area and delivers
Construct the cost-minimization model,
formulate constraints, and determine uncertain
variables ( ) and their distributions.
EVOI
(See Eq. (10))
EVOI
(See Eq. (14))
EVOI
(See Eq. (9))
TCpf
(See Eq. (6))
TCipf
(See Eq. (7)) TC0
(See Eq. (3))
TCspf
(See Eq. (13))
Fig. 1 The framework ofVOI calculation
Environ Monit Assess (2013) 185:3023–3035 3027
significant nonpoint source load of nitrogen and phos-phorus into the Lake. Lake Taihu, situated in easternChina (31.22° N, 120.14° E), is the second largestfreshwater lake in China. Its drainage area (about36,500 km2) is one of the most densely populatedand urbanized areas in China. This area is also oneof the most developed agricultural areas in China andits chemical fertilizer consumption accounts for morethan 1 % of the whole nation. More background in-formation about the Dongtiao River watershed and theLake Taihu area can be found in Wang et al. (2004).
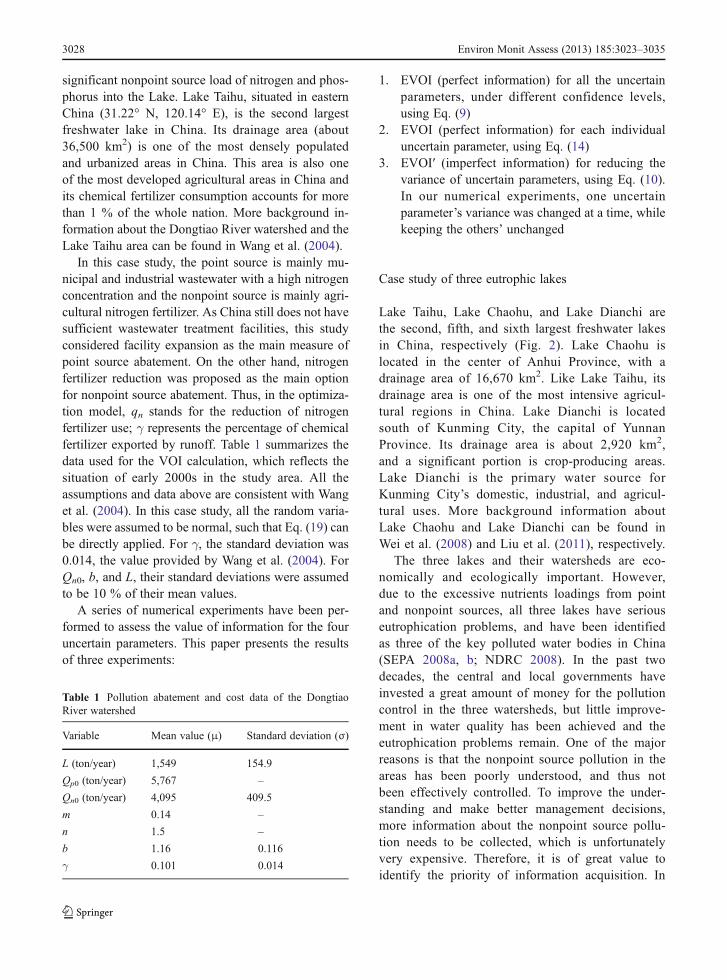
In this case study, the point source is mainly mu-nicipal and industrial wastewater with a high nitrogenconcentration and the nonpoint source is mainly agri-cultural nitrogen fertilizer. As China still does not havesufficient wastewater treatment facilities, this studyconsidered facility expansion as the main measure ofpoint source abatement. On the other hand, nitrogenfertilizer reduction was proposed as the main optionfor nonpoint source abatement. Thus, in the optimiza-tion model, qn stands for the reduction of nitrogenfertilizer use; γ represents the percentage of chemicalfertilizer exported by runoff. Table 1 summarizes thedata used for the VOI calculation, which reflects thesituation of early 2000s in the study area. All theassumptions and data above are consistent with Wanget al. (2004). In this case study, all the random varia-bles were assumed to be normal, such that Eq. (19) canbe directly applied. For γ, the standard deviation was0.014, the value provided by Wang et al. (2004). ForQn0, b, and L, their standard deviations were assumedto be 10 % of their mean values.
A series of numerical experiments have been per-formed to assess the value of information for the fouruncertain parameters. This paper presents the resultsof three experiments:
1. EVOI (perfect information) for all the uncertainparameters, under different confidence levels,using Eq. (9)
2. EVOI (perfect information) for each individualuncertain parameter, using Eq. (14)
3. EVOI′ (imperfect information) for reducing thevariance of uncertain parameters, using Eq. (10).In our numerical experiments, one uncertainparameter’s variance was changed at a time, whilekeeping the others’ unchanged
Case study of three eutrophic lakes
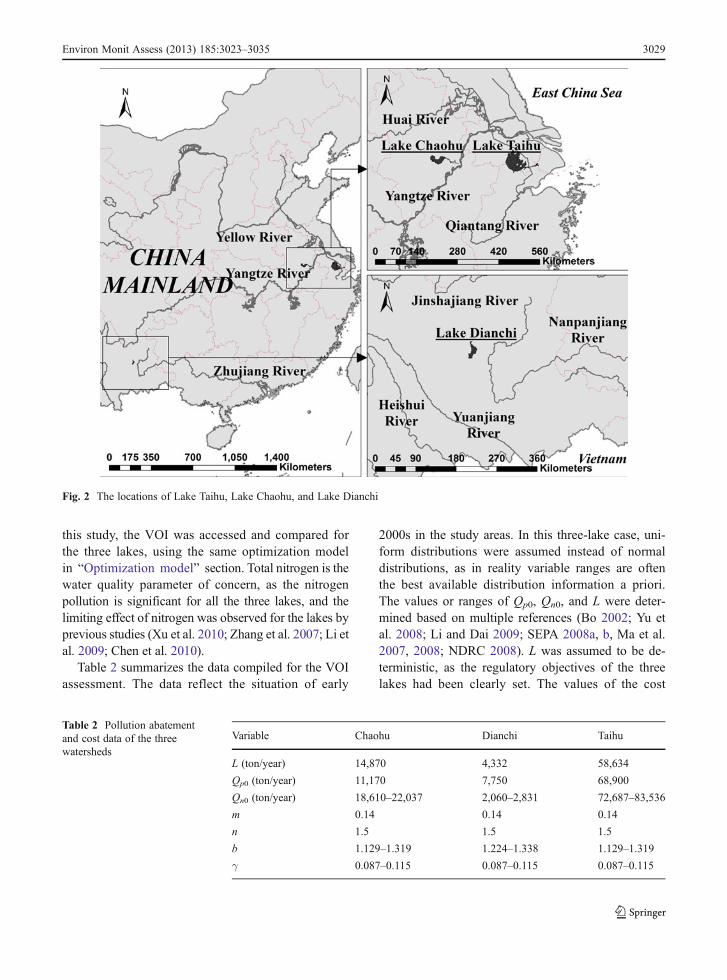
Lake Taihu, Lake Chaohu, and Lake Dianchi arethe second, fifth, and sixth largest freshwater lakesin China, respectively (Fig. 2). Lake Chaohu islocated in the center of Anhui Province, with adrainage area of 16,670 km2. Like Lake Taihu, itsdrainage area is one of the most intensive agricul-tural regions in China. Lake Dianchi is locatedsouth of Kunming City, the capital of YunnanProvince. Its drainage area is about 2,920 km2,and a significant portion is crop-producing areas.Lake Dianchi is the primary water source forKunming City’s domestic, industrial, and agricul-tural uses. More background information aboutLake Chaohu and Lake Dianchi can be found inWei et al. (2008) and Liu et al. (2011), respectively.
The three lakes and their watersheds are eco-nomically and ecologically important. However,due to the excessive nutrients loadings from pointand nonpoint sources, all three lakes have seriouseutrophication problems, and have been identifiedas three of the key polluted water bodies in China(SEPA 2008a, b; NDRC 2008). In the past twodecades, the central and local governments haveinvested a great amount of money for the pollutioncontrol in the three watersheds, but little improve-ment in water quality has been achieved and theeutrophication problems remain. One of the majorreasons is that the nonpoint source pollution in theareas has been poorly understood, and thus notbeen effectively controlled. To improve the under-standing and make better management decisions,more information about the nonpoint source pollu-tion needs to be collected, which is unfortunatelyvery expensive. Therefore, it is of great value toidentify the priority of information acquisition. In
Table 1 Pollution abatement and cost data of the DongtiaoRiver watershed
Variable Mean value (μ) Standard deviation (σ)
L (ton/year) 1,549 154.9
Qp0 (ton/year) 5,767 –
Qn0 (ton/year) 4,095 409.5
m 0.14 –
n 1.5 –
b 1.16 0.116
γ 0.101 0.014
3028 Environ Monit Assess (2013) 185:3023–3035
this study, the VOI was accessed and compared forthe three lakes, using the same optimization modelin “Optimization model” section. Total nitrogen is thewater quality parameter of concern, as the nitrogenpollution is significant for all the three lakes, and thelimiting effect of nitrogen was observed for the lakes byprevious studies (Xu et al. 2010; Zhang et al. 2007; Li etal. 2009; Chen et al. 2010).
Table 2 summarizes the data compiled for the VOIassessment. The data reflect the situation of early
2000s in the study areas. In this three-lake case, uni-form distributions were assumed instead of normaldistributions, as in reality variable ranges are oftenthe best available distribution information a priori.The values or ranges of Qp0, Qn0, and L were deter-mined based on multiple references (Bo 2002; Yu etal. 2008; Li and Dai 2009; SEPA 2008a, b, Ma et al.2007, 2008; NDRC 2008). L was assumed to be de-terministic, as the regulatory objectives of the threelakes had been clearly set. The values of the cost
Fig. 2 The locations of Lake Taihu, Lake Chaohu, and Lake Dianchi
Table 2 Pollution abatementand cost data of the threewatersheds
Variable Chaohu Dianchi Taihu
L (ton/year) 14,870 4,332 58,634
Qp0 (ton/year) 11,170 7,750 68,900
Qn0 (ton/year) 18,610–22,037 2,060–2,831 72,687–83,536
m 0.14 0.14 0.14
n 1.5 1.5 1.5
b 1.129–1.319 1.224–1.338 1.129–1.319
γ 0.087–0.115 0.087–0.115 0.087–0.115
Environ Monit Assess (2013) 185:3023–3035 3029
coefficients m and n are the same as in Table 1 andwere assumed to be constant for the three lakes. γ wasassumed to be within the range of 0.101±0.014. Thecoefficients b is calculated as the net monetary loss(i.e., crop yield loss minus fertilizer cost saving)caused by a unit reduction of nitrogen fertilizer.According to Cui et al. (2009), in the Lake Chaohuand Lake Taihu areas, one additional kilogram ofnitrogen fertilizer can increase grain yield by 8–9 kgin average and in the Lake Dianchi area by 10–11 kgin average. As of year 2002, the price of nitrogenfertilizer was 3.91 RMB/kg and the price of rice was1.90 RMB/kg (RMB is Chinese Yuan). Based on theseassumptions and data, the ranges of the coefficients bhave been determined as presented in Table 2.
Two VOI assessments were performed. In the firstassessment, the EVOI (perfect information, for all theuncertain parameters) was calculated and comparedfor the three lakes under different confidence levels.This assessment demonstrated that the VOI approachcould be used to prioritize watersheds for data collec-tion. In the second assessment, the individual EVOI(i.e., EVOIξ) for each uncertain parameter was calculat-ed. This assessment investigated how the importance ofinformation varies across different watersheds.
Results and discussions
Results for the Dongtiao River watershed
Themajor results for the Dongtiao RiverWatershed casewere illustrated in Figs. 3, 4, and 5. Figure 3 shows howthe EVOI varies with the confidence level (α). Both the
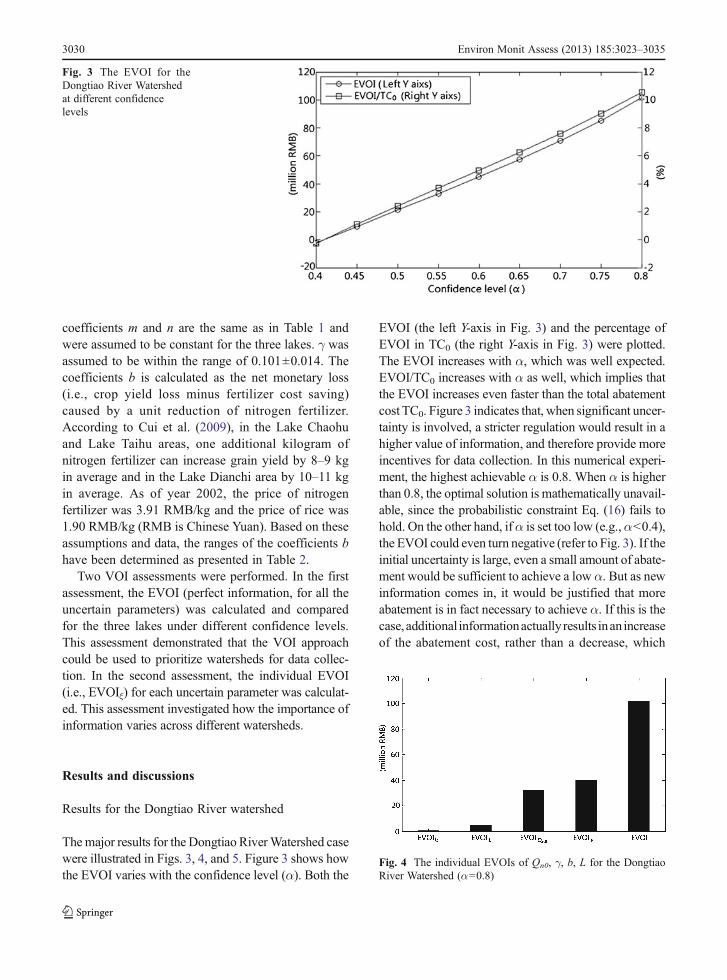
EVOI (the left Y-axis in Fig. 3) and the percentage ofEVOI in TC0 (the right Y-axis in Fig. 3) were plotted.The EVOI increases with α, which was well expected.EVOI/TC0 increases with α as well, which implies thatthe EVOI increases even faster than the total abatementcost TC0. Figure 3 indicates that, when significant uncer-tainty is involved, a stricter regulation would result in ahigher value of information, and therefore provide moreincentives for data collection. In this numerical experi-ment, the highest achievable α is 0.8. When α is higherthan 0.8, the optimal solution is mathematically unavail-able, since the probabilistic constraint Eq. (16) fails tohold. On the other hand, ifα is set too low (e.g.,α<0.4),the EVOI could even turn negative (refer to Fig. 3). If theinitial uncertainty is large, even a small amount of abate-ment would be sufficient to achieve a low α. But as newinformation comes in, it would be justified that moreabatement is in fact necessary to achieve α. If this is thecase, additional informationactually results inan increaseof the abatement cost, rather than a decrease, which
Fig. 3 The EVOI for theDongtiao River Watershedat different confidencelevels
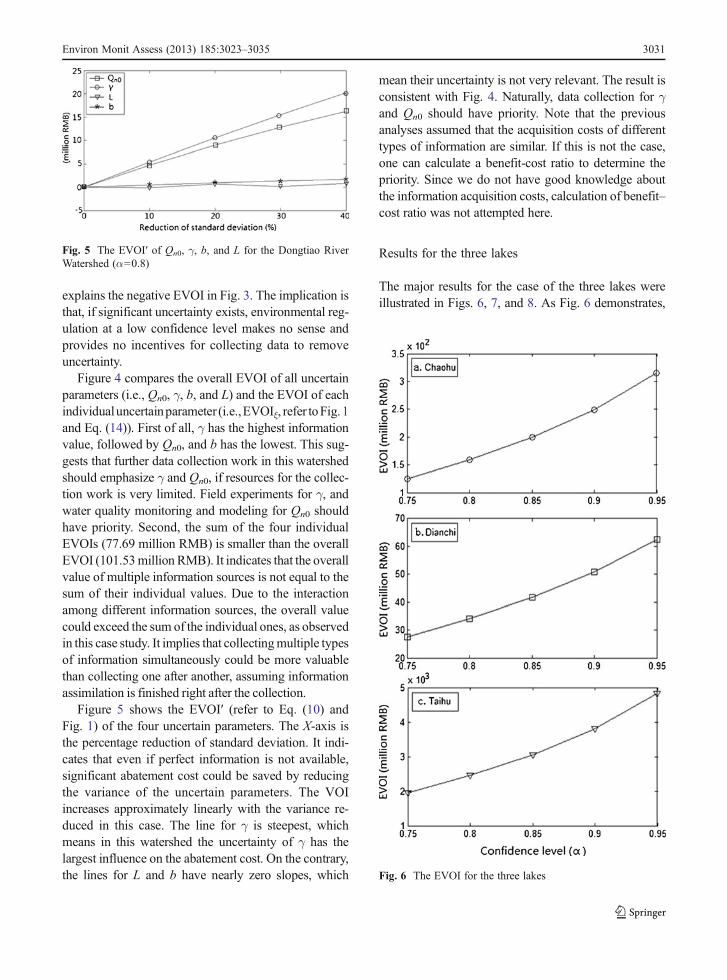
Fig. 4 The individual EVOIs of Qn0, γ, b, L for the DongtiaoRiver Watershed (α00.8)
3030 Environ Monit Assess (2013) 185:3023–3035
explains the negative EVOI in Fig. 3. The implication isthat, if significant uncertainty exists, environmental reg-ulation at a low confidence level makes no sense andprovides no incentives for collecting data to removeuncertainty.
Figure 4 compares the overall EVOI of all uncertainparameters (i.e., Qn0, γ, b, and L) and the EVOI of eachindividualuncertainparameter (i.e.,EVOIξ, refer toFig.1and Eq. (14)). First of all, γ has the highest informationvalue, followed by Qn0, and b has the lowest. This sug-gests that further data collection work in this watershedshould emphasize γ and Qn0, if resources for the collec-tion work is very limited. Field experiments for γ, andwater quality monitoring and modeling for Qn0 shouldhave priority. Second, the sum of the four individualEVOIs (77.69 million RMB) is smaller than the overallEVOI (101.53million RMB). It indicates that the overallvalue of multiple information sources is not equal to thesum of their individual values. Due to the interactionamong different information sources, the overall valuecould exceed the sum of the individual ones, as observedin this case study. It implies that collectingmultiple typesof information simultaneously could be more valuablethan collecting one after another, assuming informationassimilation is finished right after the collection.
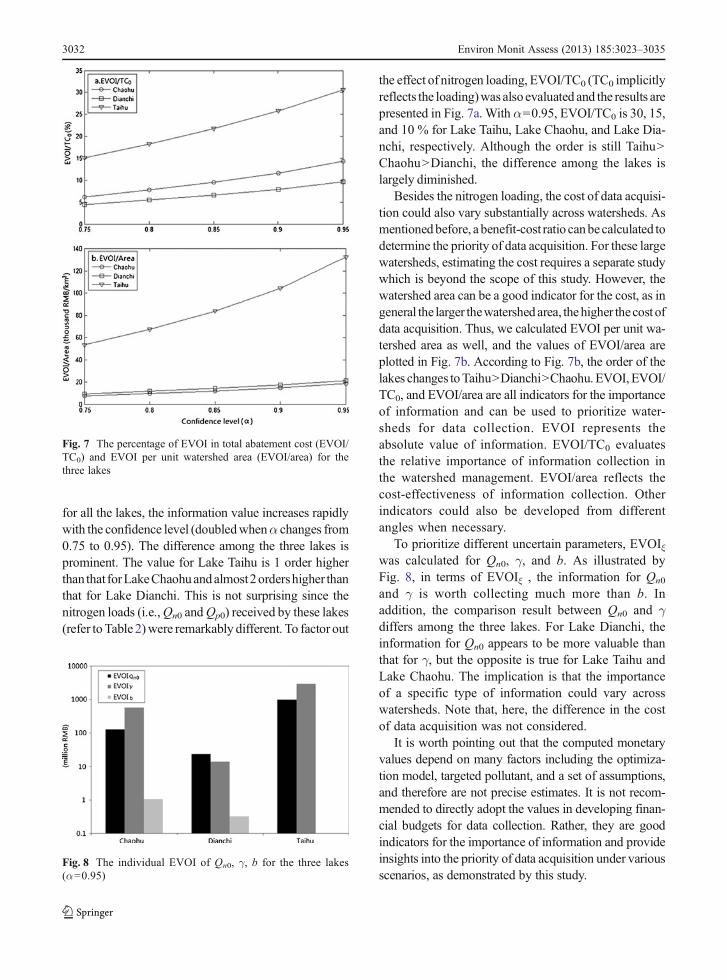
Figure 5 shows the EVOI′ (refer to Eq. (10) andFig. 1) of the four uncertain parameters. The X-axis isthe percentage reduction of standard deviation. It indi-cates that even if perfect information is not available,significant abatement cost could be saved by reducingthe variance of the uncertain parameters. The VOIincreases approximately linearly with the variance re-duced in this case. The line for γ is steepest, whichmeans in this watershed the uncertainty of γ has thelargest influence on the abatement cost. On the contrary,the lines for L and b have nearly zero slopes, which
mean their uncertainty is not very relevant. The result isconsistent with Fig. 4. Naturally, data collection for γand Qn0 should have priority. Note that the previousanalyses assumed that the acquisition costs of differenttypes of information are similar. If this is not the case,one can calculate a benefit-cost ratio to determine thepriority. Since we do not have good knowledge aboutthe information acquisition costs, calculation of benefit–cost ratio was not attempted here.
Results for the three lakes
The major results for the case of the three lakes wereillustrated in Figs. 6, 7, and 8. As Fig. 6 demonstrates,
Fig. 5 The EVOI′ of Qn0, γ, b, and L for the Dongtiao RiverWatershed (α00.8)
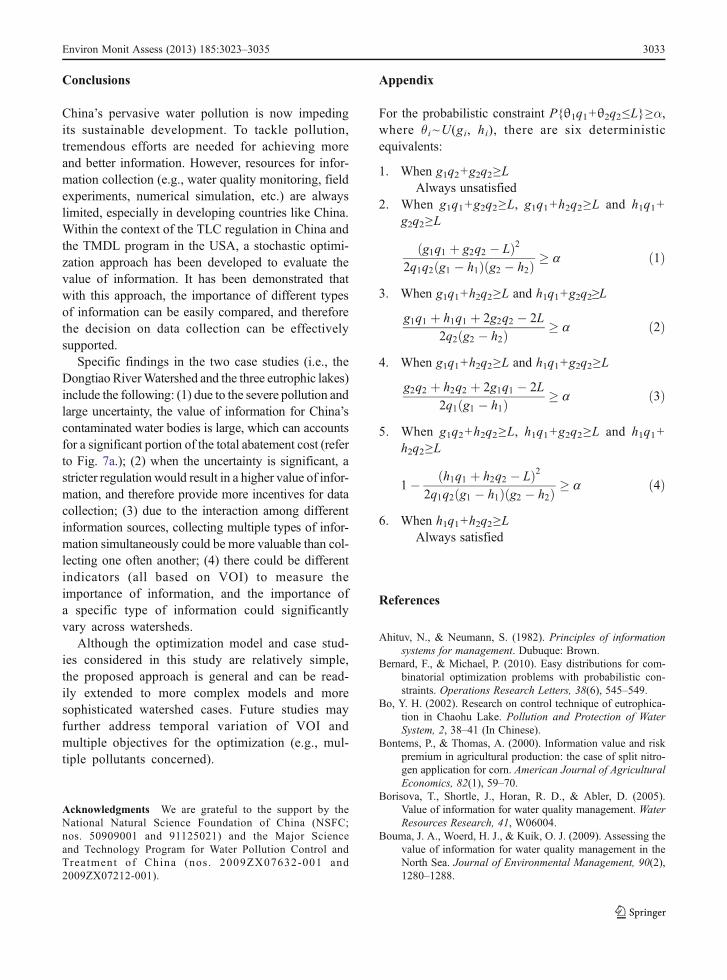
Fig. 6 The EVOI for the three lakes
Environ Monit Assess (2013) 185:3023–3035 3031
for all the lakes, the information value increases rapidlywith the confidence level (doubledwhenα changes from0.75 to 0.95). The difference among the three lakes isprominent. The value for Lake Taihu is 1 order higherthan that forLakeChaohuandalmost2ordershigher thanthat for Lake Dianchi. This is not surprising since thenitrogen loads (i.e.,Qn0 andQp0) received by these lakes(refer toTable 2)were remarkably different. To factor out
the effect of nitrogen loading, EVOI/TC0 (TC0 implicitlyreflects the loading)was also evaluated and the results arepresented in Fig. 7a. With α00.95, EVOI/TC0 is 30, 15,and 10 % for Lake Taihu, Lake Chaohu, and Lake Dia-nchi, respectively. Although the order is still Taihu>Chaohu>Dianchi, the difference among the lakes islargely diminished.
Besides the nitrogen loading, the cost of data acquisi-tion could also vary substantially across watersheds. Asmentionedbefore, a benefit-cost ratio canbecalculated todetermine the priority of data acquisition. For these largewatersheds, estimating the cost requires a separate studywhich is beyond the scope of this study. However, thewatershed area can be a good indicator for the cost, as ingeneral the larger thewatershedarea, thehigher thecost ofdata acquisition. Thus, we calculated EVOI per unit wa-tershed area as well, and the values of EVOI/area areplotted in Fig. 7b. According to Fig. 7b, the order of thelakes changes toTaihu>Dianchi>Chaohu.EVOI, EVOI/TC0, and EVOI/area are all indicators for the importanceof information and can be used to prioritize water-sheds for data collection. EVOI represents theabsolute value of information. EVOI/TC0 evaluatesthe relative importance of information collection inthe watershed management. EVOI/area reflects thecost-effectiveness of information collection. Otherindicators could also be developed from differentangles when necessary.
To prioritize different uncertain parameters, EVOIξwas calculated for Qn0, γ, and b. As illustrated byFig. 8, in terms of EVOIξ , the information for Qn0
and γ is worth collecting much more than b. Inaddition, the comparison result between Qn0 and γdiffers among the three lakes. For Lake Dianchi, theinformation for Qn0 appears to be more valuable thanthat for γ, but the opposite is true for Lake Taihu andLake Chaohu. The implication is that the importanceof a specific type of information could vary acrosswatersheds. Note that, here, the difference in the costof data acquisition was not considered.
It is worth pointing out that the computed monetaryvalues depend on many factors including the optimiza-tion model, targeted pollutant, and a set of assumptions,and therefore are not precise estimates. It is not recom-mended to directly adopt the values in developing finan-cial budgets for data collection. Rather, they are goodindicators for the importance of information and provideinsights into the priority of data acquisition under variousscenarios, as demonstrated by this study.
Fig. 7 The percentage of EVOI in total abatement cost (EVOI/TC0) and EVOI per unit watershed area (EVOI/area) for thethree lakes
Fig. 8 The individual EVOI of Qn0, γ, b for the three lakes(α00.95)
3032 Environ Monit Assess (2013) 185:3023–3035
Conclusions
China’s pervasive water pollution is now impedingits sustainable development. To tackle pollution,tremendous efforts are needed for achieving moreand better information. However, resources for infor-mation collection (e.g., water quality monitoring, fieldexperiments, numerical simulation, etc.) are alwayslimited, especially in developing countries like China.Within the context of the TLC regulation in China andthe TMDL program in the USA, a stochastic optimi-zation approach has been developed to evaluate thevalue of information. It has been demonstrated thatwith this approach, the importance of different typesof information can be easily compared, and thereforethe decision on data collection can be effectivelysupported.
Specific findings in the two case studies (i.e., theDongtiao RiverWatershed and the three eutrophic lakes)include the following: (1) due to the severe pollution andlarge uncertainty, the value of information for China’scontaminated water bodies is large, which can accountsfor a significant portion of the total abatement cost (referto Fig. 7a.); (2) when the uncertainty is significant, astricter regulation would result in a higher value of infor-mation, and therefore provide more incentives for datacollection; (3) due to the interaction among differentinformation sources, collecting multiple types of infor-mation simultaneously could be more valuable than col-lecting one often another; (4) there could be differentindicators (all based on VOI) to measure theimportance of information, and the importance ofa specific type of information could significantlyvary across watersheds.
Although the optimization model and case stud-ies considered in this study are relatively simple,the proposed approach is general and can be read-ily extended to more complex models and moresophisticated watershed cases. Future studies mayfurther address temporal variation of VOI andmultiple objectives for the optimization (e.g., mul-tiple pollutants concerned).
Acknowledgments We are grateful to the support by theNational Natural Science Foundation of China (NSFC;nos. 50909001 and 91125021) and the Major Scienceand Technology Program for Water Pollution Control andTreatment of China (nos . 2009ZX07632-001 and2009ZX07212-001).
Appendix
For the probabilistic constraint P{θ1q1+θ2q2≤L}≥α,where θi ~U(gi, hi), there are six deterministicequivalents:
1. When g1q2+g2q2≥LAlways unsatisfied
2. When g1q1+g2q2≥L, g1q1+h2q2≥L and h1q1+g2q2≥L
ðg1q1 þ g2q2 � LÞ22q1q2ðg1 � h1Þðg2 � h2Þ � a ð1Þ
3. When g1q1+h2q2≥L and h1q1+g2q2≥L
g1q1 þ h1q1 þ 2g2q2 � 2L
2q2ðg2 � h2Þ � a ð2Þ
4. When g1q1+h2q2≥L and h1q1+g2q2≥L
g2q2 þ h2q2 þ 2g1q1 � 2L
2q1ðg1 � h1Þ � a ð3Þ
5. When g1q2+h2q2≥L, h1q1+g2q2≥L and h1q1+h2q2≥L
1� ðh1q1 þ h2q2 � LÞ22q1q2ðg1 � h1Þðg2 � h2Þ � a ð4Þ
6. When h1q1+h2q2≥LAlways satisfied
References
Ahituv, N., & Neumann, S. (1982). Principles of informationsystems for management. Dubuque: Brown.
Bernard, F., & Michael, P. (2010). Easy distributions for com-binatorial optimization problems with probabilistic con-straints. Operations Research Letters, 38(6), 545–549.
Bo, Y. H. (2002). Research on control technique of eutrophica-tion in Chaohu Lake. Pollution and Protection of WaterSystem, 2, 38–41 (In Chinese).
Bontems, P., & Thomas, A. (2000). Information value and riskpremium in agricultural production: the case of split nitro-gen application for corn. American Journal of AgriculturalEconomics, 82(1), 59–70.
Borisova, T., Shortle, J., Horan, R. D., & Abler, D. (2005).Value of information for water quality management. WaterResources Research, 41, W06004.
Bouma, J. A., Woerd, H. J., & Kuik, O. J. (2009). Assessing thevalue of information for water quality management in theNorth Sea. Journal of Environmental Management, 90(2),1280–1288.
Environ Monit Assess (2013) 185:3023–3035 3033
Byron, K. W., Mitchell, J. E., & David, R. B. (2011). Adaptiveresource management and the value of information. Eco-logical Modelling, 222(18), 3429–3436.
Charnes, A., & Cooper, W. W. (1959). Chance constrainedprogramming. Management Science, 6(1), 227–243.
Charnes, A., & Cooper, W. W. (1963). Deterministic equivalentsfor optimizing and satisficing under chance constraints.Operations Research, 11(1), 18–39.
Chen, Y. C., Zhang, D. G., & Tang, L. (2010). The spatial andtemporal variation of nitrogen and its relationships with algalgrowth in Lake Dianchi China. Journal of Agro-EnvironmentScience, 29(1), 139–144 (In Chinese with English abstract).
Couchman, P., Cannon, M., & Kouvaritakis, B. (2006). Stochas-tic MPC with inequality stability constraints. Automatica,42(12), 2169–2174.
Cui, Y. T., Li, J., & Jin, L. S. (2009). Fertilizer and environmentalprotection. Beijing: Chemical Industry Press. In Chinese.
Edwin, D. O., Zhang, X. L., & Yu, T. (2010). Current status ofagricultural and rural non-point source pollution assessmentin China. Environmental Pollution, 158(5), 1159–1168.
Farzin, Y. H., & Jonathan, D. K. (2004). Nonpoint sourcepollution control under incomplete and costly information.Environmental and Resource Economics, 28(4), 489–506.
Guo, L. (2007). Doing battle with the green monster of TaihuLake. Science, 317, 1166.
Hans, W. P., Xu, H., Mark, J. M., Zhu, G. W., Qin, B. Q., Li, Y.P., et al. (2011). Controlling harmful cyanobacterial bloomsin a hyper-eutrophic lake (Lake Taihu, China), the need fora dual nutrient (N & P) management strategy. Water Re-search, 45(5), 1973–1983.
Koerkamp, B. G., Hunink, M. G. M., Stijnen, T., & Weinstein,M. C. (2006). Identifying key parameters in cost-effectiveness analysis using value of information, a com-parison of methods. Health Economics, 15(4), 383–392.
Lawrence, D. B. (1999). The economic value of information.New York: Springer.
Li, L., & Dai, W. H. (2009). Current situation and treatment ofeutrophication in Chaohu Lake. Soil and Water Conserva-tion in China, 9, 55–57 (In Chinese).
Li, Y. P., Huang, G. H., Yang, Z. F., & Nie, S. L. (2008). Anintegrated two-stage optimization model for the develop-ment of long-term waste-management strategies. The Sci-ence of the Total Environment, 392(2–3), 175–186.
Li, K. Y., Chu, S. S., Jin, X. C., Tang, X. Y., Guo, W. F.,& Chen, L. (2009). The algal growth potential ofresearch in Chaohu Lake water. Journal of Agro-Environment Science, 28(10), 2124–2131 (In Chinesewith English abstract).
Liu, J. L., Wang, R. M., Huang, B., Lin, C., Wang, Y., & Pan, X.J. (2011). Distribution and bioaccumulation of steroidaland phenolic endocrine disrupting chemicals in wild fishspecies from Dianchi Lake, China. Environmental Pollu-tion, 159(10), 2815–2822.
Ma, H. W., & Chang, C. C. (2008). Assessment of the value ofreducinguncertaintybysamplinginagroundwater remediationsystem. The Science of the Total Environment, 402(1), 9–17.
Ma, W., Li, J. X., Tian, X. R., & Liao, W. G. (2007). Investigationon countermeasures for water environment management andwater pollution prevention in Dianchi Lake. Journal of ChinaInstitute ofWater Resources and Hydropower Research, 5(1),8–14 (In Chinese with English abstract).
Ma, W., Yu, X. Z., Zhai, S. H., & Liao, W. G. (2008). Control ofgross water pollutant discharge in Tai Lake. Science &Technology Review, 26(18), 49–53 (In Chinese with En-glish abstract).
Mendes, M. P., & Ribeiro, L. (2010). Nitrate probability map-ping in the northern aquifer alluvial system of the riverTagus (Portugal) using Disjunctive Kriging. The Science ofthe Total Environment, 408(5), 1021–1034.
Michael, C. R., Sarah, J. C., & James, E. L. (2011). Whichuncertainty? Using expert elicitation and expected value ofinformation to design an adaptive program. BiologicalConservation, 144(4), 1214–1223.
NDRC (National Development and Reform Commission, China).(2008). The integrated water environment management planfor the Taihu Watershed. http://www.sdpc.gov.cn/zjgx/P020080611378720026826.pdf. Accessed 8 Feb 2012 (inChinese)
NRC (National Research Council, USA). (2001). Assessing theTMDL approach to water quality management. Washing-ton, D.C.: National Academy Press.
SEPA (State Environmental Protection Administration, China).(2008a). The water pollution prevention and treatment planfor the Chaohu Watershed (2006–2010). http: //www.ahzwgk.gov.cn/UpFiles/OA028/OA02811/200909_OA02811070220090900248110112252.pdf. Accessed 8 Feb2012 (in Chinese).
SEPA (State Environmental Protection Administration, China).(2008b). The water pollution prevention and treatment planfor the Dianchi Watershed (2006–2010). http://www.mep.gov.cn/pv_obj_cache/pv_obj_id_56B616A92B1CD869D E 8 7 C 8 2 1 1 C 0 6 F 4 7 4 9 4 5 8 0 6 0 0 / f i l e n a m e /W020080423440539131830.pdf. Accessed 8 Feb 2012 (inChinese).
SEPA (State Environmental Protection Administration, China).(2011). Report on the state of the environment in China(year 2010). http://jcs.mep.gov.cn/hjzl/zkgb/2010zkgb/.Accessed 8 Feb 2012 (in Chinese)
Stone, R. (2008). From remarkable rescue to restoration of losthabitat. Science, 322, 184.
Van Ackooij, W., Henrion, R., Möller, A., & Zorgati, R.(2011). On joint probabilistic constraints with Gaussiancoefficient matrix. Operations Research Letters, 39(2),99–102.
Wang, X. J., Zhang, W., Huang, Y. N., & Li, S. J. (2004).Modeling and simulation of point-non-point source efflu-ent trading in Taihu Lake area, perspective of non-pointsources control in China. The Science of the Total Environ-ment, 325(1–3), 39–50.
Wang, Z., Huang, K., Zhou, P. J., & Guo, H. C. (2010). A hybridneural network model for cyanobacteria bloom in DianchiLake. Procedia Environmental Sciences, 2, 67–75.
Wei, C. L., Bao, S. M., Zhu, X. Y., & Huang, X. M. (2008).Spatio-temporal variations of the bacterioplankton commu-nity composition in Chaohu Lake, China. Progress inNatural Science, 18(9), 1115–1122.
Xu, H., Hans, W. P., Qin, B. Q., Zhu, G. W., & Gao, G. (2010).Nitrogen and phosphorus inputs control phytoplanktongrowth in eutrophic Lake Taihu, China. Limnology andOceanography, 55(1), 420–432.
Xu, Z. F., Ji, J. P., & Shi, C. (2011). Water geochemistry of theChaohu Lake Basin rivers, China, chemical weathering and
3034 Environ Monit Assess (2013) 185:3023–3035

anthropogenic inputs. Applied Geochemistry, 26, S379–S383.
Yu, F., Shi, Z. T., & Peng, H. Y. (2008). The summary of thestudy on agricultural non-point source pollution. Environ-mental Science and Management, 33(8), 54–58 (In Chinesewith English abstract).
Zhang, R., Yang, L. Y., Gu, X. H., & Cui, G. B. (2007). Studyon the water environmental characters for spatial and
temporal variation in the typical districts of Lake EastTai. Journal of Hydraulic Engineering, 10, 597–605 (InChinese with English abstract).
Zheng, Y., & Keller, A. A. (2007). Uncertainty assessment inwatershed-scale water quality modeling and management,1. Framework and application of Generalized LikelihoodUncertainty Estimation (GLUE) approach. Water Resour-ces Research, 43(8), W08407.
Environ Monit Assess (2013) 185:3023–3035 3035
Copyright © 2022 FDOKUMEN