Assessing the dairy value chain and potential to enhance ...
39
Enhancing dairy-based livelihoods in India and Tanzania through feed innovation and value chain development approaches Assessing the dairy value chain and potential to enhance productivity through improved feeding in Pemba Island of Zanzibar, the United Republic of Tanzania By Brigitte L. Maass (CIAT) and Ben Lukuyu (ILRI) In collaboration with Asha Omar Fakih (Ministry of Agriculture and Natural Resources, Chake Chake, Pemba, Tanzania), Hamza Suleiman (Ministry of Agriculture and Natural Resources, Chake Chake, Pemba, Tanzania), Seif Khatib (Ministry of Agriculture and Natural Resources, Chake Chake, Pemba, Tanzania ), Fred J. Wassena(CIAT) and Samy Bacigale (CIAT) Nairobi, Kenya: International Center for Tropical Agriculture (CIAT) June 2013
-
Upload
khangminh22 -
Category
Documents
-
view
4 -
download
0
Transcript of Assessing the dairy value chain and potential to enhance ...

Enhancing dairy-based livelihoods in India and Tanzania through feed innovation and value chain development approaches
Assessing the dairy value chain and potential to enhance productivity through improved feeding in
Pemba Island of Zanzibar, the United Republic of Tanzania
By Brigitte L. Maass (CIAT) and Ben Lukuyu (ILRI)
In collaboration with Asha Omar Fakih (Ministry of Agriculture and Natural Resources, Chake Chake, Pemba, Tanzania), Hamza Suleiman (Ministry of Agriculture and Natural Resources, Chake Chake, Pemba, Tanzania),
Seif Khatib (Ministry of Agriculture and Natural Resources, Chake Chake, Pemba, Tanzania ), Fred J. Wassena(CIAT) and Samy Bacigale (CIAT)
Nairobi, Kenya: International Center for Tropical Agriculture (CIAT)June 2013
© 2013 This publication is licensed for use under the Creative Commons Attribution-
Noncommercial-Share Alike 3.0 Unported Licence. To view this licence, visit
http://creativecommons.org/licenses/by-nc-sa/3.0/. Unless otherwise noted, you are free to copy,
duplicate, or reproduce and distribute, display, or transmit any part of this publication or portions
thereof without permission, and to make translations, adaptations, or other derivative works under
the following conditions:
ATTRIBUTION. The work must be attributed, but not in any way that suggests endorsement by the publisher or the author(s).
NON-COMMERCIAL. This work may not be used for commercial purposes.
SHARE ALIKE. If this work is altered, transformed, or built upon, the resulting work must be distributed only under the same or similar license to this one.
NOTICE: For any reuse or distribution, the license terms of this work must be made clear to others. Any of the above conditions can be waived if permission is obtained from the copyright holder. Nothing in this license impairs or restricts the author’s moral rights. Fair dealing and other rights are in no way affected by the above. The parts used must not misrepresent the meaning of the publication. ILRI would appreciate being sent a copy of any materials in which text, photos etc. have been used.
.

Contents Summary ................................................................................................................................................................. 1
Introduction and background ................................................................................................................................. 2
Agriculture and livestock production in Pemba Island .................................................................................. 3
Livestock production projects in Pemba ........................................................................................................ 4
Objectives ...................................................................................................................................................... 6
Methodology .......................................................................................................................................................... 7
Results and discussion ............................................................................................................................................ 9
Producers ........................................................................................................................................................... 9
Agriculture ..................................................................................................................................................... 9
Livestock production systems ...................................................................................................................... 10
Feed types and sources throughout the year and feeding systems ............................................................ 12
Major income sources ................................................................................................................................. 15
Dairy cooperatives ....................................................................................................................................... 16
Challenges and opportunities ...................................................................................................................... 16
Consumers of milk and milk products .............................................................................................................. 18
Local population .......................................................................................................................................... 18
Tourism ........................................................................................................................................................ 18
Processors and traders/vendors ...................................................................................................................... 18
Milk processing ............................................................................................................................................ 18
Quality control ............................................................................................................................................. 19
Milk markets ................................................................................................................................................ 19
Payment mechanisms, credit and check-off system .................................................................................... 21
Main constraints .......................................................................................................................................... 21
Input and service providers .............................................................................................................................. 21
Payment mechanisms, credit and check-off system .................................................................................... 22
Challenges and opportunities ...................................................................................................................... 23
Feed suppliers .............................................................................................................................................. 23
Veterinary drug suppliers ............................................................................................................................ 24
Conclusions ........................................................................................................................................................... 26
Acknowledgements .............................................................................................................................................. 27
References ............................................................................................................................................................ 28
Appendix 1: Local measures in Pemba as indicated by FEAST participants ......................................................... 32
Appendix 2: Illustrations ....................................................................................................................................... 33
Applying FEAST in Kisiwani and Chake Chake .................................................................................................. 33
Feeds and feeding ............................................................................................................................................ 34
Processing and consumption ........................................................................................................................... 35
Local units and transport ................................................................................................................................. 36
1
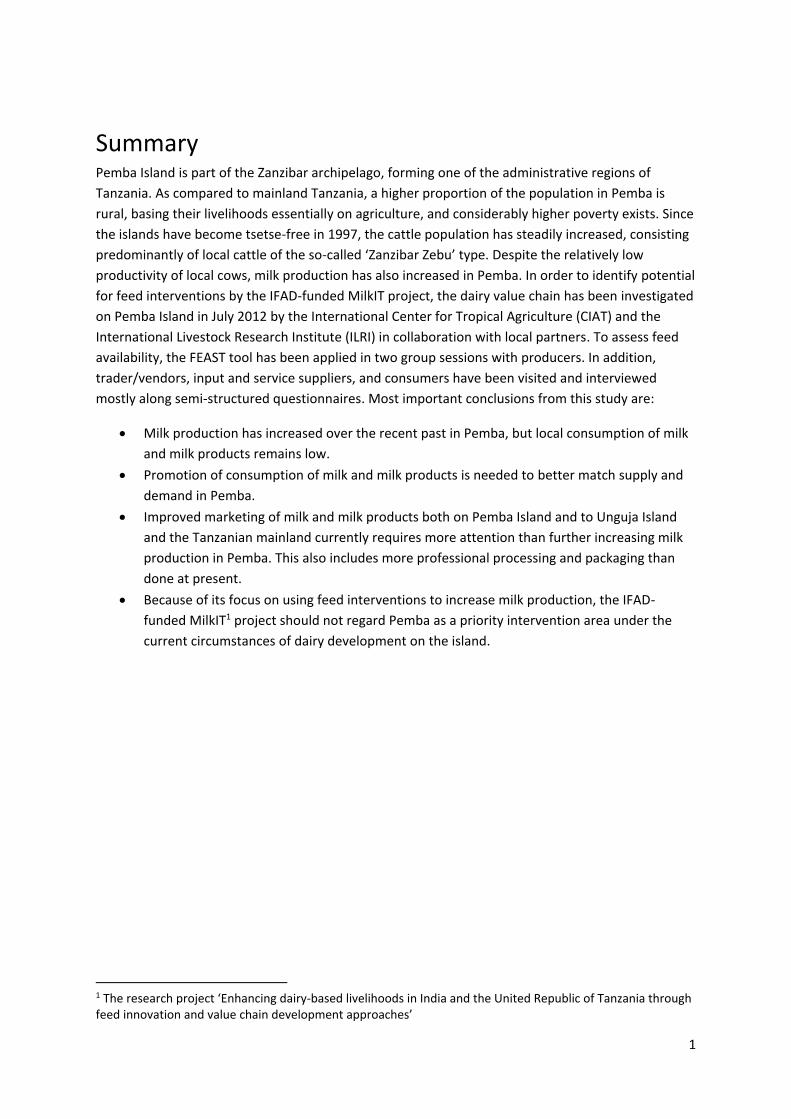
Summary Pemba Island is part of the Zanzibar archipelago, forming one of the administrative regions of
Tanzania. As compared to mainland Tanzania, a higher proportion of the population in Pemba is
rural, basing their livelihoods essentially on agriculture, and considerably higher poverty exists. Since
the islands have become tsetse-free in 1997, the cattle population has steadily increased, consisting
predominantly of local cattle of the so-called ‘Zanzibar Zebu’ type. Despite the relatively low
productivity of local cows, milk production has also increased in Pemba. In order to identify potential
for feed interventions by the IFAD-funded MilkIT project, the dairy value chain has been investigated
on Pemba Island in July 2012 by the International Center for Tropical Agriculture (CIAT) and the
International Livestock Research Institute (ILRI) in collaboration with local partners. To assess feed
availability, the FEAST tool has been applied in two group sessions with producers. In addition,
trader/vendors, input and service suppliers, and consumers have been visited and interviewed
mostly along semi-structured questionnaires. Most important conclusions from this study are:
Milk production has increased over the recent past in Pemba, but local consumption of milk
and milk products remains low.
Promotion of consumption of milk and milk products is needed to better match supply and
demand in Pemba.
Improved marketing of milk and milk products both on Pemba Island and to Unguja Island
and the Tanzanian mainland currently requires more attention than further increasing milk
production in Pemba. This also includes more professional processing and packaging than
done at present.
Because of its focus on using feed interventions to increase milk production, the IFAD-
funded MilkIT1 project should not regard Pemba as a priority intervention area under the
current circumstances of dairy development on the island.
1 The research project ‘Enhancing dairy-based livelihoods in India and the United Republic of Tanzania through feed innovation and value chain development approaches’
2
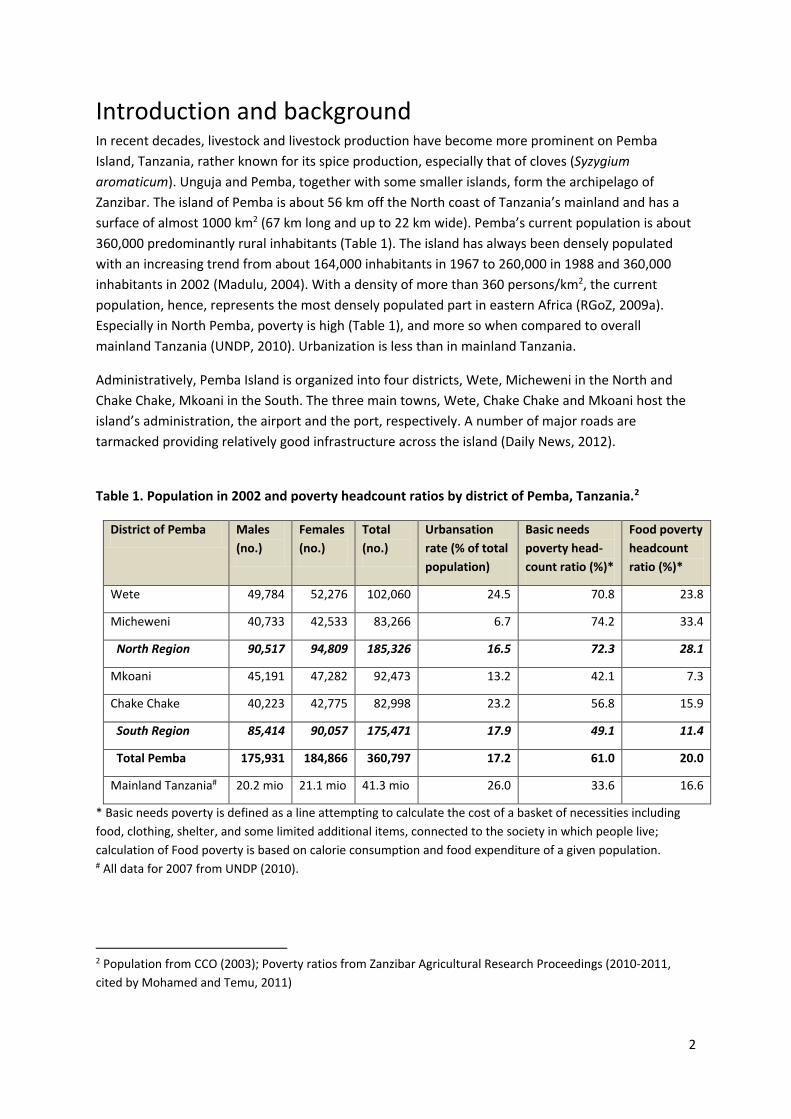
Introduction and background In recent decades, livestock and livestock production have become more prominent on Pemba
Island, Tanzania, rather known for its spice production, especially that of cloves (Syzygium
aromaticum). Unguja and Pemba, together with some smaller islands, form the archipelago of
Zanzibar. The island of Pemba is about 56 km off the North coast of Tanzania’s mainland and has a
surface of almost 1000 km2 (67 km long and up to 22 km wide). Pemba’s current population is about
360,000 predominantly rural inhabitants (Table 1). The island has always been densely populated
with an increasing trend from about 164,000 inhabitants in 1967 to 260,000 in 1988 and 360,000
inhabitants in 2002 (Madulu, 2004). With a density of more than 360 persons/km2, the current
population, hence, represents the most densely populated part in eastern Africa (RGoZ, 2009a).
Especially in North Pemba, poverty is high (Table 1), and more so when compared to overall
mainland Tanzania (UNDP, 2010). Urbanization is less than in mainland Tanzania.
Administratively, Pemba Island is organized into four districts, Wete, Micheweni in the North and
Chake Chake, Mkoani in the South. The three main towns, Wete, Chake Chake and Mkoani host the
island’s administration, the airport and the port, respectively. A number of major roads are
tarmacked providing relatively good infrastructure across the island (Daily News, 2012).
Table 1. Population in 2002 and poverty headcount ratios by district of Pemba, Tanzania.2
District of Pemba Males
(no.)
Females
(no.)
Total
(no.)
Urbansation
rate (% of total
population)
Basic needs
poverty head-
count ratio (%)*
Food poverty
headcount
ratio (%)*
Wete 49,784 52,276 102,060 24.5 70.8 23.8
Micheweni 40,733 42,533 83,266 6.7 74.2 33.4
North Region 90,517 94,809 185,326 16.5 72.3 28.1
Mkoani 45,191 47,282 92,473 13.2 42.1 7.3
Chake Chake 40,223 42,775 82,998 23.2 56.8 15.9
South Region 85,414 90,057 175,471 17.9 49.1 11.4
Total Pemba 175,931 184,866 360,797 17.2 61.0 20.0
Mainland Tanzania# 20.2 mio 21.1 mio 41.3 mio 26.0 33.6 16.6
* Basic needs poverty is defined as a line attempting to calculate the cost of a basket of necessities including
food, clothing, shelter, and some limited additional items, connected to the society in which people live;
calculation of Food poverty is based on calorie consumption and food expenditure of a given population. # All data for 2007 from UNDP (2010).
2 Population from CCO (2003); Poverty ratios from Zanzibar Agricultural Research Proceedings (2010-2011,
cited by Mohamed and Temu, 2011)
3
Agriculture and livestock production in Pemba Island
Ecologically, Pemba lies in the humid tropics with relatively high annual rainfall of about 1900 mm in
a bimodal pattern, high humidity of 60-80%, and temperatures from minimum 18-21 °C to maximum
of 28-32 °C (DFA, 1986). On average, rainfall in Pemba is higher than in Unguja (Ali, 1998). The island
is characterized by four seasons as pertained to rainfall distribution, namely two rainy seasons and
two relatively drier seasons. Three quarters of the island are cultivated land because its territory
contains only 30% coral rag area (Balsem, 2011). Generally, Pemba is hilly and has fertile soils.
Hence, agriculture is an important part of livelihoods of the people of Pemba, but rarely is it the sole
income source for rural households (Milne-Price, 2011). Land use is characterized by a patchwork of
crops, including mainly cloves, coconut, cassava and rice. Since the revolution of 1964, land belongs
to the government and can be allocated to farming families, typically 3 acres per family (2.5 acres = 1
hectare).
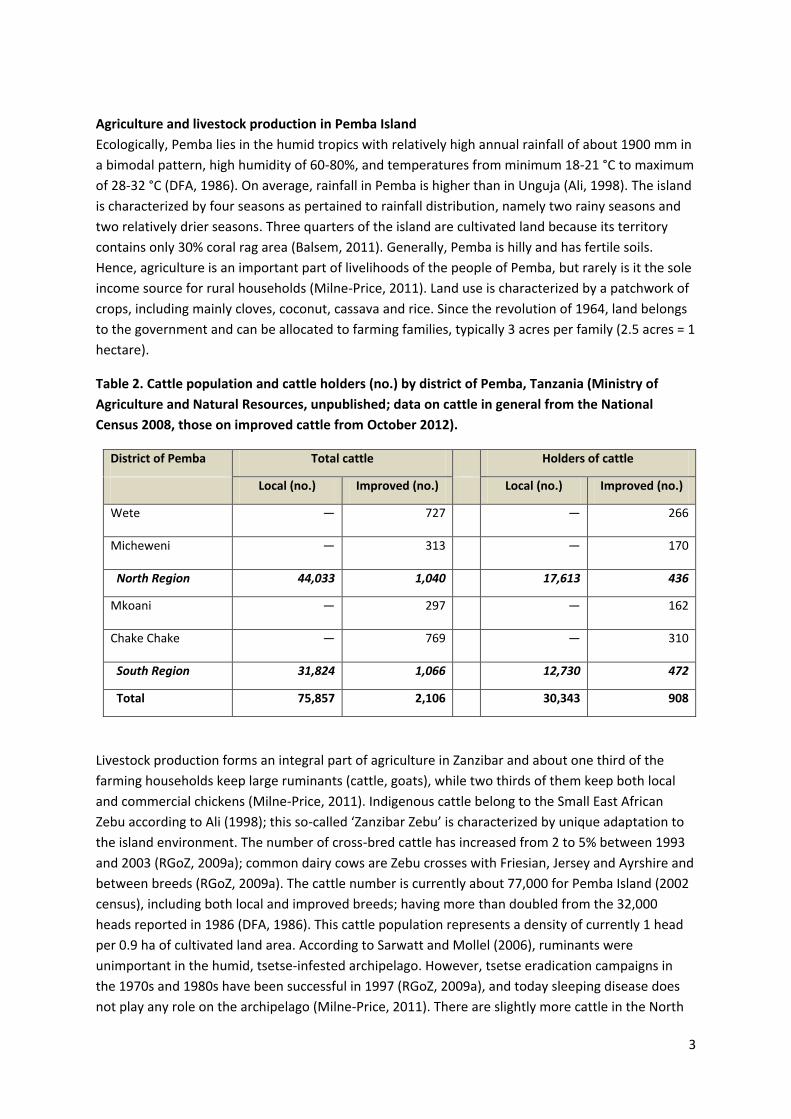
Table 2. Cattle population and cattle holders (no.) by district of Pemba, Tanzania (Ministry of
Agriculture and Natural Resources, unpublished; data on cattle in general from the National
Census 2008, those on improved cattle from October 2012).
District of Pemba Total cattle Holders of cattle
Local (no.) Improved (no.) Local (no.) Improved (no.)
Wete — 727 — 266
Micheweni — 313 — 170
North Region 44,033 1,040 17,613 436
Mkoani — 297 — 162
Chake Chake — 769 — 310
South Region 31,824 1,066 12,730 472
Total 75,857 2,106 30,343 908
Livestock production forms an integral part of agriculture in Zanzibar and about one third of the
farming households keep large ruminants (cattle, goats), while two thirds of them keep both local
and commercial chickens (Milne-Price, 2011). Indigenous cattle belong to the Small East African
Zebu according to Ali (1998); this so-called ‘Zanzibar Zebu’ is characterized by unique adaptation to
the island environment. The number of cross-bred cattle has increased from 2 to 5% between 1993
and 2003 (RGoZ, 2009a); common dairy cows are Zebu crosses with Friesian, Jersey and Ayrshire and
between breeds (RGoZ, 2009a). The cattle number is currently about 77,000 for Pemba Island (2002
census), including both local and improved breeds; having more than doubled from the 32,000
heads reported in 1986 (DFA, 1986). This cattle population represents a density of currently 1 head
per 0.9 ha of cultivated land area. According to Sarwatt and Mollel (2006), ruminants were
unimportant in the humid, tsetse-infested archipelago. However, tsetse eradication campaigns in
the 1970s and 1980s have been successful in 1997 (RGoZ, 2009a), and today sleeping disease does
not play any role on the archipelago (Milne-Price, 2011). There are slightly more cattle in the North
4
Region of Pemba than in the South (Table 2). Nevertheless, the number of improved/crossbred
cattle is very low everywhere, with a tendency of higher animal as well as cattle holder numbers in
the urban zones of Wete and Chake Chake. Overall, there are about 900 holders of improved cattle
(3% of cattle keepers).
As there is little availability of pastures on the island, most animals are tethered outside during the
day, and rarely are they provided with supplementary feed beyond kitchen or farm waste.
Consequently, traditional animal productivity is low. During the lactation period (100-150 days),
indigenous Zebu cows produce an average of 1 to 2.13 litres of milk per day (Ali, 1998; RGoZ, 2009a;
Milne-Price, 2011), yet 95% of cattle farmers sell some of this milk. Cross-bred cows have an average
of 8.8 l during a lactation of 280-300 days (RGoZ, 2009a). Improved/exotic cattle are mainly kept at
the homestead (zero-grazing) and provided with cut and carry grasses in addition to some cereal-
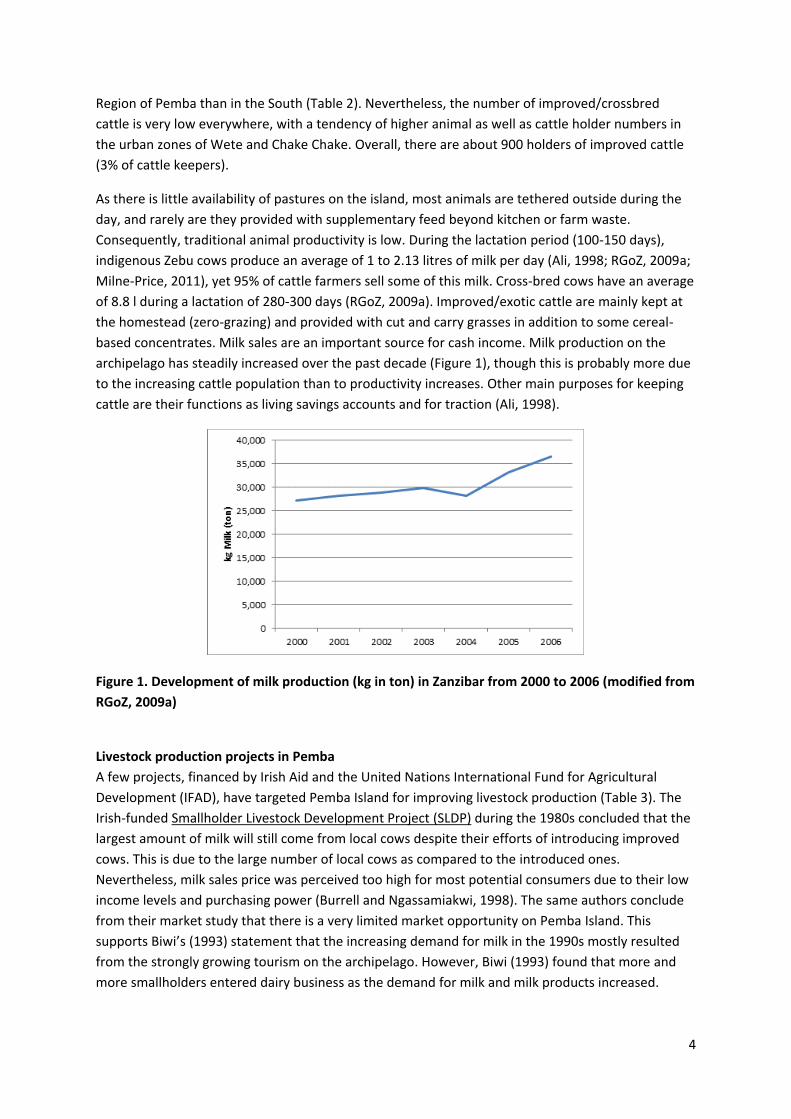
based concentrates. Milk sales are an important source for cash income. Milk production on the
archipelago has steadily increased over the past decade (Figure 1), though this is probably more due
to the increasing cattle population than to productivity increases. Other main purposes for keeping
cattle are their functions as living savings accounts and for traction (Ali, 1998).
Figure 1. Development of milk production (kg in ton) in Zanzibar from 2000 to 2006 (modified from
RGoZ, 2009a)
Livestock production projects in Pemba
A few projects, financed by Irish Aid and the United Nations International Fund for Agricultural
Development (IFAD), have targeted Pemba Island for improving livestock production (Table 3). The
Irish-funded Smallholder Livestock Development Project (SLDP) during the 1980s concluded that the
largest amount of milk will still come from local cows despite their efforts of introducing improved
cows. This is due to the large number of local cows as compared to the introduced ones.
Nevertheless, milk sales price was perceived too high for most potential consumers due to their low
income levels and purchasing power (Burrell and Ngassamiakwi, 1998). The same authors conclude
from their market study that there is a very limited market opportunity on Pemba Island. This
supports Biwi’s (1993) statement that the increasing demand for milk in the 1990s mostly resulted
from the strongly growing tourism on the archipelago. However, Biwi (1993) found that more and
more smallholders entered dairy business as the demand for milk and milk products increased.
5
The Zanzibar Sub-Programs of Agricultural Services Support Programme (ASSP) and Agricultural
Sector Development Programme-Livestock (ASDP-L) are part of the respective Tanzanian programs.
They are funded by IFAD and implemented in the nine rural districts of Zanzibar under the Ministry
of Agriculture and Natural Resources3. The two programs complement one another; their goal is to
reduce poverty, improve food security and increase incomes among communities with high level of
livelihood dependence on agriculture (Table 3). One of the successful instruments used in Pemba has
been the establishment of farmer field schools (FFS), of which 190 livestock FFSs have been
implemented in the four districts of Pemba. Within the projects, the immediate objective was to
increase production both for self-sufficiency and income generation. Since production has risen,
activities on improved processing and marketing have now become more crucial for the producers.
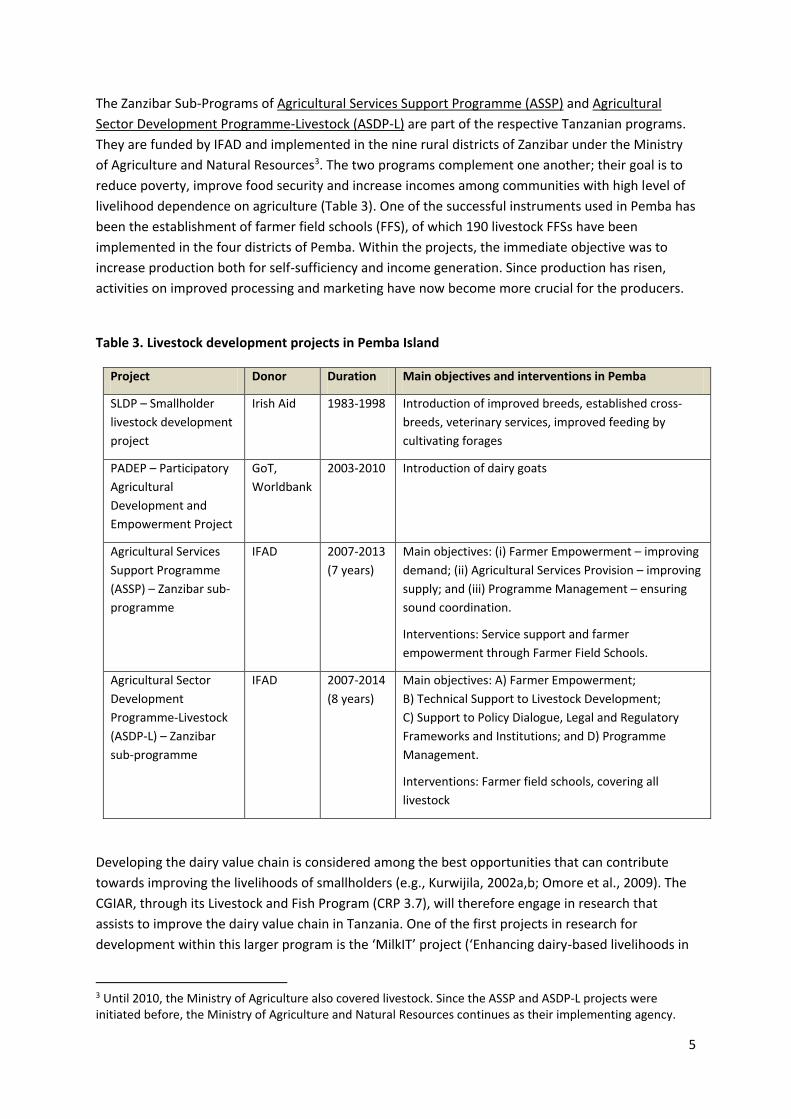
Table 3. Livestock development projects in Pemba Island
Project Donor Duration Main objectives and interventions in Pemba
SLDP – Smallholder
livestock development
project
Irish Aid 1983-1998
Introduction of improved breeds, established cross-
breeds, veterinary services, improved feeding by
cultivating forages
PADEP – Participatory
Agricultural
Development and
Empowerment Project
GoT,
Worldbank
2003-2010 Introduction of dairy goats
Agricultural Services
Support Programme
(ASSP) – Zanzibar sub-
programme
IFAD 2007-2013
(7 years)
Main objectives: (i) Farmer Empowerment – improving
demand; (ii) Agricultural Services Provision – improving
supply; and (iii) Programme Management – ensuring
sound coordination.
Interventions: Service support and farmer
empowerment through Farmer Field Schools.
Agricultural Sector
Development
Programme-Livestock
(ASDP-L) – Zanzibar
sub-programme
IFAD 2007-2014
(8 years)
Main objectives: A) Farmer Empowerment;
B) Technical Support to Livestock Development;
C) Support to Policy Dialogue, Legal and Regulatory
Frameworks and Institutions; and D) Programme
Management.
Interventions: Farmer field schools, covering all
livestock
Developing the dairy value chain is considered among the best opportunities that can contribute
towards improving the livelihoods of smallholders (e.g., Kurwijila, 2002a,b; Omore et al., 2009). The
CGIAR, through its Livestock and Fish Program (CRP 3.7), will therefore engage in research that
assists to improve the dairy value chain in Tanzania. One of the first projects in research for
development within this larger program is the ‘MilkIT’ project (‘Enhancing dairy-based livelihoods in
3 Until 2010, the Ministry of Agriculture also covered livestock. Since the ASSP and ASDP-L projects were initiated before, the Ministry of Agriculture and Natural Resources continues as their implementing agency.
6
India and the United Republic of Tanzania through feed innovation and value chain development
approaches’). This project aims at enhancing dairy-based livelihoods of smallholder farmers through
feed interventions by applying approaches of innovation and value chain research; it is financed
through an IFAD grant.
Objectives
The main objectives of the current study were to (i) characterize the dairy value chain in Pemba
Island with emphasis on milk production, and (ii) identify possible interventions for feed and feeding
improvement on the island.

7
Methodology In order to characterize the livestock production system, with emphasis on dairy cattle, and its
potential for enhancing productivity through improved feed and feeding interventions in Pemba, a
two-step approach was performed. First, the Feed Assessment Tool (FEAST, version from 15 June
2012 by Duncan et al.) was used to characterize the livestock production system and, in particular,
feed‐related aspects. The FEAST tool is a rapid and systematic method that combines a PRA
(Participative Rural Appraisal) with individual farmer interviews. The PRA provides an overview of
the farming system, in particular, the livestock production system. It also helps identify major
problems, issues and opportunities within the livestock production system. The individual farmer
interview gathers both quantitative and qualitative information according to major wealth groups
based on relative land size owned. The assessment was carried out through two structured group
discussions and completion of short questionnaires by key farmer representatives on 9th and 10th
July 2012. The composition of the groups is shown in Table 4. On the first day, farmers came from
different Shehia’s4 of the northern region and the second day from the southern region.
Participating farmers were chosen by the Program District Officers (PDO) from the Ministry of
Agriculture and Natural Resources of Zanzibar.
Table 4. Group composition of farmer representatives during two days of feed assessment
applying FEAST (Duncan et al., 2012) in Pemba, Tanzania; number of individual interviews in
parentheses.
Day Shehia Men Women Total
1 Wete District: Kisiwani 13 (5) 3 (2) 16 (7)
2 Chake Chake District: Wawi, Wara, Chanjaani,
Mkoroshoni, Vitongoji, Ziwani, Ng’ambwa
Mkoani District: Kangaani, Mjimbini, Kiwani
16 (4) 5 (2) 21 (6)
The first PRA and subsequent interviews took place in Kisiwani village, located in the North of
Pemba, in Wete District (Table 4). The travel distance by road is approximately 15 kilometers from
Chake Chake, the center town of Pemba. The second PRA as well as the two group discussions with
other value chain actors were conducted at the building of the Ministry of Agriculture and Natural
Resources in Chake Chake town. Overall 16 and 21 persons participated in Kisiwani and Chake
Chake, respectively. From each PRA group, 1-2 representatives of different wealth classes (Table 5)
were chosen for the individual interviews. Appartenly the group from Chake Chake and Mkoani
Districts was wealthier than that from Wete District, as reflected in their land ownership.
4 Administratively, a ‘Shehia’ is equivalent to the Ward on the mainland of Tanzania, while the superior administrative entity in Pemba is a ‘Jimbo’, equivalent to Division on the mainland.
8
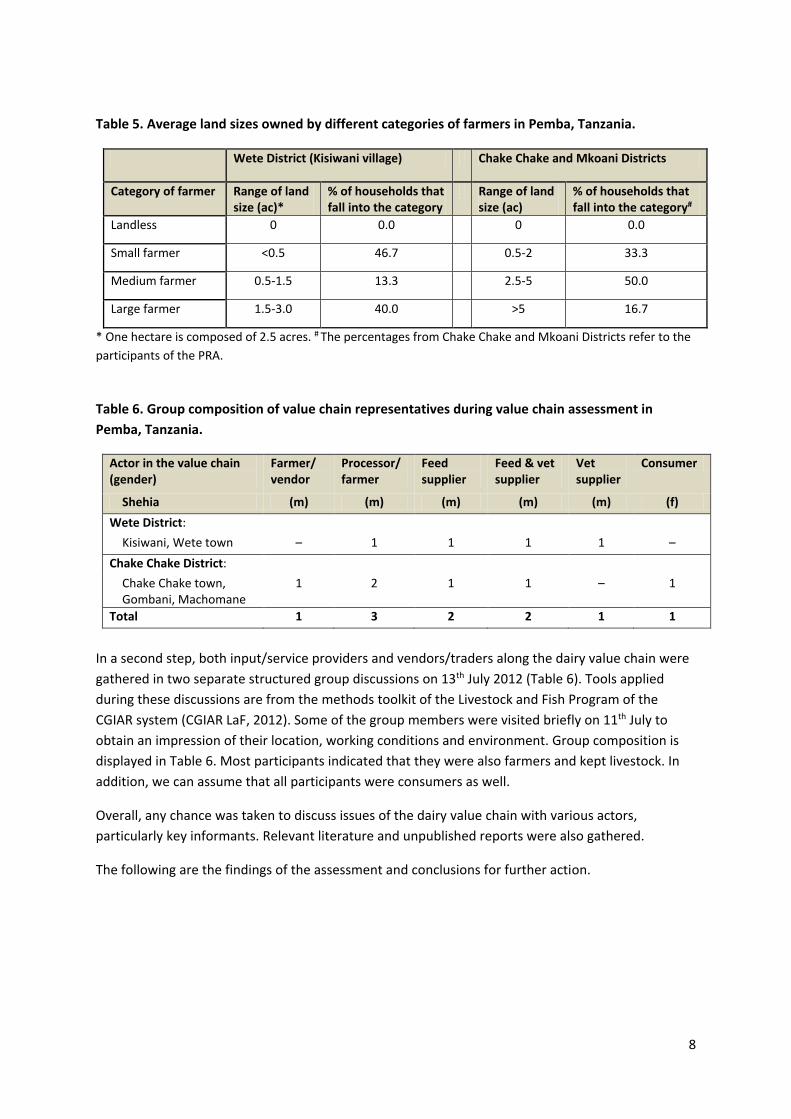
Table 5. Average land sizes owned by different categories of farmers in Pemba, Tanzania.
Wete District (Kisiwani village) Chake Chake and Mkoani Districts
Category of farmer Range of land size (ac)*
% of households that fall into the category
Range of land size (ac)
% of households that fall into the category#
Landless 0 0.0 0 0.0
Small farmer <0.5 46.7 0.5-2 33.3
Medium farmer 0.5-1.5 13.3 2.5-5 50.0
Large farmer 1.5-3.0 40.0 >5 16.7
* One hectare is composed of 2.5 acres. # The percentages from Chake Chake and Mkoani Districts refer to the
participants of the PRA.
Table 6. Group composition of value chain representatives during value chain assessment in
Pemba, Tanzania.
Actor in the value chain (gender)
Farmer/ vendor
Processor/ farmer
Feed supplier
Feed & vet supplier
Vet supplier
Consumer
Shehia (m) (m) (m) (m) (m) (f)
Wete District:
Kisiwani, Wete town – 1 1 1 1 –
Chake Chake District:
Chake Chake town, Gombani, Machomane
1 2 1 1 – 1
Total 1 3 2 2 1 1
In a second step, both input/service providers and vendors/traders along the dairy value chain were
gathered in two separate structured group discussions on 13th July 2012 (Table 6). Tools applied
during these discussions are from the methods toolkit of the Livestock and Fish Program of the
CGIAR system (CGIAR LaF, 2012). Some of the group members were visited briefly on 11th July to
obtain an impression of their location, working conditions and environment. Group composition is
displayed in Table 6. Most participants indicated that they were also farmers and kept livestock. In
addition, we can assume that all participants were consumers as well.
Overall, any chance was taken to discuss issues of the dairy value chain with various actors,
particularly key informants. Relevant literature and unpublished reports were also gathered.
The following are the findings of the assessment and conclusions for further action.
9
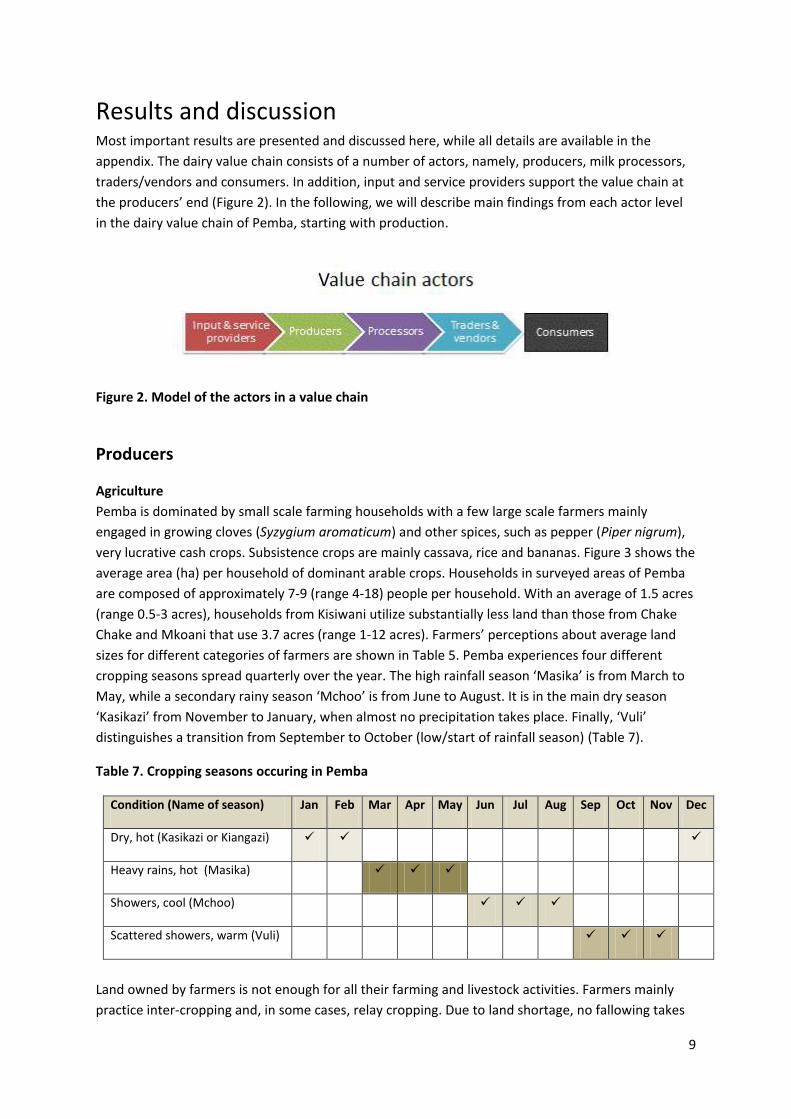
Results and discussion Most important results are presented and discussed here, while all details are available in the
appendix. The dairy value chain consists of a number of actors, namely, producers, milk processors,
traders/vendors and consumers. In addition, input and service providers support the value chain at
the producers’ end (Figure 2). In the following, we will describe main findings from each actor level
in the dairy value chain of Pemba, starting with production.
Figure 2. Model of the actors in a value chain
Producers
Agriculture
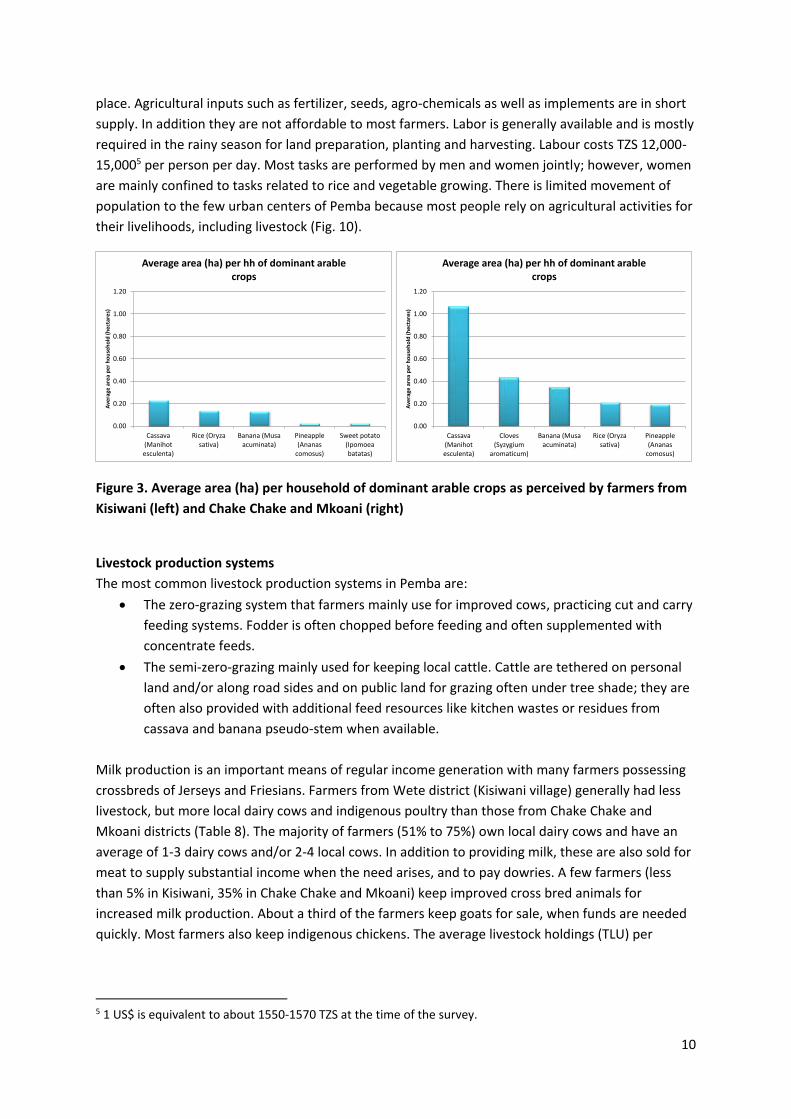
Pemba is dominated by small scale farming households with a few large scale farmers mainly
engaged in growing cloves (Syzygium aromaticum) and other spices, such as pepper (Piper nigrum),
very lucrative cash crops. Subsistence crops are mainly cassava, rice and bananas. Figure 3 shows the
average area (ha) per household of dominant arable crops. Households in surveyed areas of Pemba
are composed of approximately 7-9 (range 4-18) people per household. With an average of 1.5 acres
(range 0.5-3 acres), households from Kisiwani utilize substantially less land than those from Chake
Chake and Mkoani that use 3.7 acres (range 1-12 acres). Farmers’ perceptions about average land
sizes for different categories of farmers are shown in Table 5. Pemba experiences four different
cropping seasons spread quarterly over the year. The high rainfall season ‘Masika’ is from March to
May, while a secondary rainy season ‘Mchoo’ is from June to August. It is in the main dry season
‘Kasikazi’ from November to January, when almost no precipitation takes place. Finally, ‘Vuli’
distinguishes a transition from September to October (low/start of rainfall season) (Table 7).
Table 7. Cropping seasons occuring in Pemba
Condition (Name of season) Jan Feb Mar Apr May Jun Jul Aug Sep Oct Nov Dec
Dry, hot (Kasikazi or Kiangazi)
Heavy rains, hot (Masika)
Showers, cool (Mchoo)
Scattered showers, warm (Vuli)
Land owned by farmers is not enough for all their farming and livestock activities. Farmers mainly
practice inter-cropping and, in some cases, relay cropping. Due to land shortage, no fallowing takes
10
place. Agricultural inputs such as fertilizer, seeds, agro-chemicals as well as implements are in short
supply. In addition they are not affordable to most farmers. Labor is generally available and is mostly
required in the rainy season for land preparation, planting and harvesting. Labour costs TZS 12,000-
15,0005 per person per day. Most tasks are performed by men and women jointly; however, women
are mainly confined to tasks related to rice and vegetable growing. There is limited movement of
population to the few urban centers of Pemba because most people rely on agricultural activities for
their livelihoods, including livestock (Fig. 10).
Figure 3. Average area (ha) per household of dominant arable crops as perceived by farmers from
Kisiwani (left) and Chake Chake and Mkoani (right)
Livestock production systems
The most common livestock production systems in Pemba are:
The zero-grazing system that farmers mainly use for improved cows, practicing cut and carry
feeding systems. Fodder is often chopped before feeding and often supplemented with
concentrate feeds.
The semi-zero-grazing mainly used for keeping local cattle. Cattle are tethered on personal
land and/or along road sides and on public land for grazing often under tree shade; they are
often also provided with additional feed resources like kitchen wastes or residues from
cassava and banana pseudo-stem when available.
Milk production is an important means of regular income generation with many farmers possessing
crossbreds of Jerseys and Friesians. Farmers from Wete district (Kisiwani village) generally had less
livestock, but more local dairy cows and indigenous poultry than those from Chake Chake and
Mkoani districts (Table 8). The majority of farmers (51% to 75%) own local dairy cows and have an
average of 1-3 dairy cows and/or 2-4 local cows. In addition to providing milk, these are also sold for
meat to supply substantial income when the need arises, and to pay dowries. A few farmers (less
than 5% in Kisiwani, 35% in Chake Chake and Mkoani) keep improved cross bred animals for
increased milk production. About a third of the farmers keep goats for sale, when funds are needed
quickly. Most farmers also keep indigenous chickens. The average livestock holdings (TLU) per
5 1 US$ is equivalent to about 1550-1570 TZS at the time of the survey.
0.00
0.20
0.40
0.60
0.80
1.00
1.20
Cassava(Manihotesculenta)
Rice (Oryzasativa)
Banana (Musaacuminata)
Pineapple(Ananas
comosus)
Sweet potato(Ipomoeabatatas)
Ave
rage
are
a p
er
ho
use
ho
ld (
he
ctar
es)
Average area (ha) per hh of dominant arable crops
0.00
0.20
0.40
0.60
0.80
1.00
1.20
Cassava(Manihotesculenta)
Cloves(Syzygium
aromaticum)
Banana (Musaacuminata)
Rice (Oryzasativa)
Pineapple(Ananas
comosus)
Ave
rage
are
a p
er
ho
use
ho
ld (
he
ctar
es)
Average area (ha) per hh of dominant arable crops
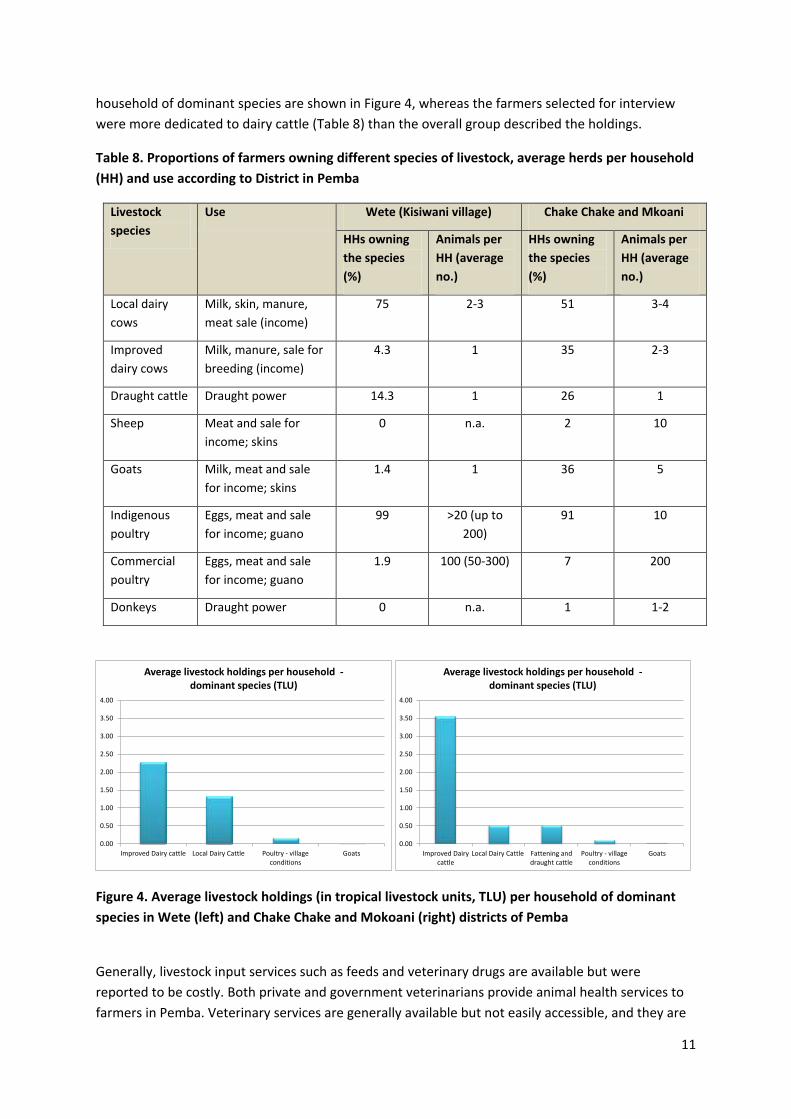
11
household of dominant species are shown in Figure 4, whereas the farmers selected for interview
were more dedicated to dairy cattle (Table 8) than the overall group described the holdings.
Table 8. Proportions of farmers owning different species of livestock, average herds per household
(HH) and use according to District in Pemba
Livestock
species
Use Wete (Kisiwani village) Chake Chake and Mkoani
HHs owning
the species
(%)
Animals per
HH (average
no.)
HHs owning
the species
(%)
Animals per
HH (average
no.)
Local dairy
cows
Milk, skin, manure,
meat sale (income)
75 2-3 51 3-4
Improved
dairy cows
Milk, manure, sale for
breeding (income)
4.3 1 35 2-3
Draught cattle Draught power 14.3 1 26 1
Sheep Meat and sale for
income; skins
0 n.a. 2 10
Goats Milk, meat and sale
for income; skins
1.4 1 36 5
Indigenous
poultry
Eggs, meat and sale
for income; guano
99 >20 (up to
200)
91 10
Commercial
poultry
Eggs, meat and sale
for income; guano
1.9 100 (50-300) 7 200
Donkeys Draught power 0 n.a. 1 1-2
Figure 4. Average livestock holdings (in tropical livestock units, TLU) per household of dominant
species in Wete (left) and Chake Chake and Mokoani (right) districts of Pemba
Generally, livestock input services such as feeds and veterinary drugs are available but were
reported to be costly. Both private and government veterinarians provide animal health services to
farmers in Pemba. Veterinary services are generally available but not easily accessible, and they are
0.00
0.50
1.00
1.50
2.00
2.50
3.00
3.50
4.00
Improved Dairy cattle Local Dairy Cattle Poultry - villageconditions
Goats
Average livestock holdings per household -dominant species (TLU)
0.00
0.50
1.00
1.50
2.00
2.50
3.00
3.50
4.00
Improved Dairycattle
Local Dairy Cattle Fattening anddraught cattle
Poultry - villageconditions
Goats
Average livestock holdings per household -dominant species (TLU)

12
costly for most farmers. For example, treating East Coast Fever (ECF) costs farmers TZS 20,000 per
treatment in addition to transport cost of TZS 3,000 and labor charges of TZS 2,000. It costs
TZS 10,000 to treat mastitis, while treating simple eye infections is about TZS 3,000. The most
common diseases are ECF, mastitis, internal worms, eye infections and lumpy skin disease.
Artificial Insemination (AI) services are lacking particularly in Mkoani district, where it is not
accessible due to lack of AI service providers. The cost of a single insemination is TZS 8,000-10,000
per single dose of semen, regardless of whether it is the first or a repeat serve. In addition, farmers
pay TZS 5,000 for the AI service. The rates of repeat are high (up to 3-4 times), especially among high
producers. Low producers tend to record lower repeat rates of 2-3 times. Improved bulls are mainly
used for breeding at a cost of TZS 5,000 per service, while local bulls are offered for free.
There is generally no credit from institutions for crop or livestock production. However, farmers
have access to a few small self-help credit and saving groups. Income is mainly obtained from crop,
livestock and small businesses. These businesses include fishing and service provision. At present,
cattle prices vary with season but range between TZS 1,200,000 and 1,500,000 per head. Goat prices
tend to remain the same throughout the year at about TZS 80,000 per head.
Feed types and sources throughout the year and feeding systems
Improved cattle are stall-fed with cut and carry grasses that are manually chopped with a ‘panga’
(local machete) or a big knife before feeding and provided three times or twice per day. Feed for the
improved animals is often supplemented with concentrates, such as pollard, maize bran, rice polish,
minerals, and coconut or sunflower cakes. Animals are mostly kept in sheds, however, some people
keep even improved cows permanently under a tree. Whereas, local cattle are mainly tethered
under shade and also provided fodder through the cut and carry system, or they graze in any open
land, such as along road sides and on public land. Both men and women participate in feeding
livestock, including also the tethering of animals farther away from the farmstead.
Figure 5. Dominant fodder crops grown in the area (ha) Kisiwani (left) and Chake Chake/Mkoani
(right)
Fodders given include Napier and Signal6 grass, cut grass, harvested legume leaves (e.g. Kudzu,
Pueraria phaseoloides), or cowpea residues (haulms), leaves of fodder shrubs like Gliricidia sepium
6 Signal grass (also called Para grass by some participants) is commonly Brachiaria decumbens, but also Brachiaria brizantha is sometimes called signal grass. Para grass is usually Brachiaria mutica, a species that
0.00
0.05
0.10
0.15
0.20
0.25
Napier grass(Pennisetumpurpureum)
Signal grass(Brachiariabrizantha)
Naturally occuringpasture - tropical
Bermuda grass(Cynodon dactylon)
Are
a o
f cr
op
gro
wn
in t
he
are
a (h
ect
are
s)
The dominant fodder crops grown in the area
0.00
0.05
0.10
0.15
0.20
0.25
Signal Grass (Brachiariabrizantha)
Napier grass (Pennisetumpurpureum)
Leucaena (Leucaenaleucocephala)
Sum
of
are
a o
f cr
op
gro
wn
(h
ect
are
s)
The dominant fodder crops grown in the area
13
and Leucaena leucocephala. In the evening all cattle are supplied in addition with garden and kitchen
wastes – like peels of cassava, banana, sweet potato, and food left from the household. Crop
residues are relatively little used for feeding despite their abundance, except maybe during the dry
season. In Kisiwani, for example, rice straw is usually burnt. Whereas farmers from Chake Chake and
Mkoani stated that rice straw as well as banana pseudo-stems and peels, pineapple waste,
breadfruit, cassava peels and leaves were also fed to cattle, especially during the dry season. Also
during the dry season, some farmers use dry grass and add molasses to make the feed more
palatable. Only two farmers treated rice straw either with urea or molasses.
Some farmers wished to establish forages plots, however, land scarcity is preventing them. Common
forages are Napier grass (Pennisetum purpureum), Signal grass (Brachiaria decumbens), and rarely
Guatemala grass (Tripsacum andersonii) for cut and carry, as well as Bermuda grass (Cynodon
dactylon) and naturally occurring grass mainly for grazing. Almost half of dairy farmers have
cultivated forages. Napier has been introduced more than 50 years ago. Widely spread are ‘Gold
coast’ and ‘Morogoro’ varieties. It is highly appreciated because of the high biomass production.
Signal grass was introduced in the 1970s. The first Leucaena was established in the early 1980s,
probably by SLDP.
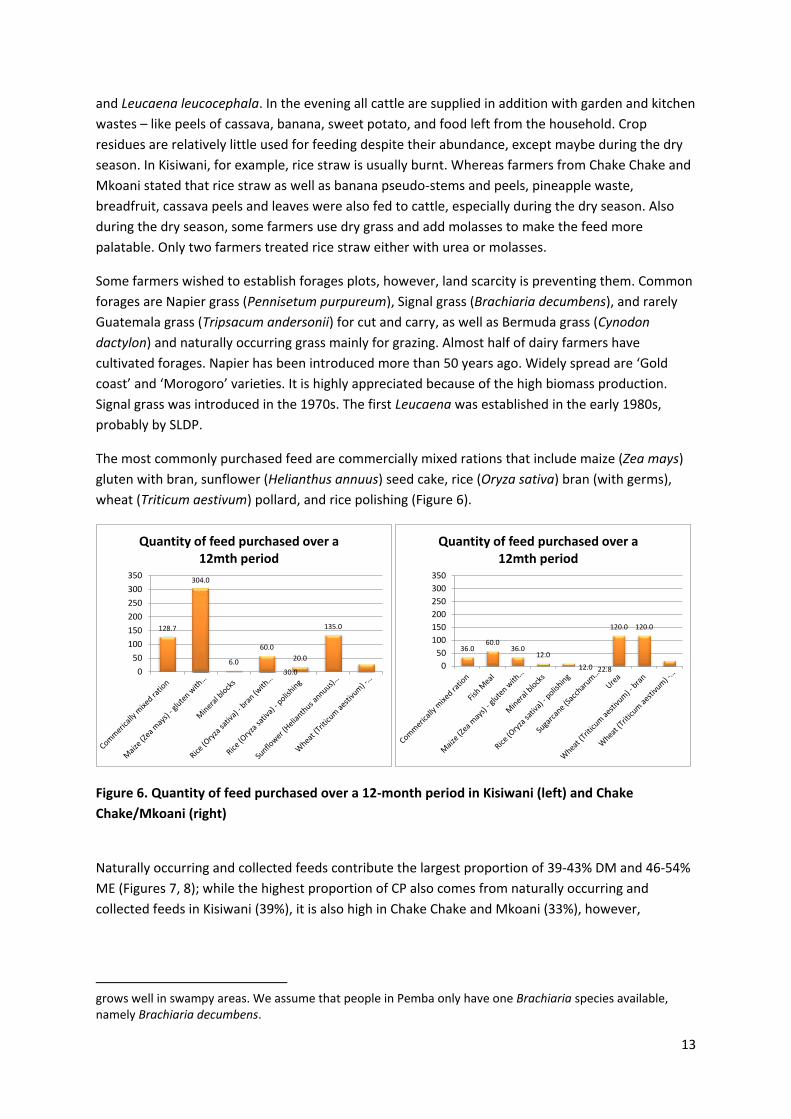
The most commonly purchased feed are commercially mixed rations that include maize (Zea mays)
gluten with bran, sunflower (Helianthus annuus) seed cake, rice (Oryza sativa) bran (with germs),
wheat (Triticum aestivum) pollard, and rice polishing (Figure 6).
Figure 6. Quantity of feed purchased over a 12-month period in Kisiwani (left) and Chake
Chake/Mkoani (right)
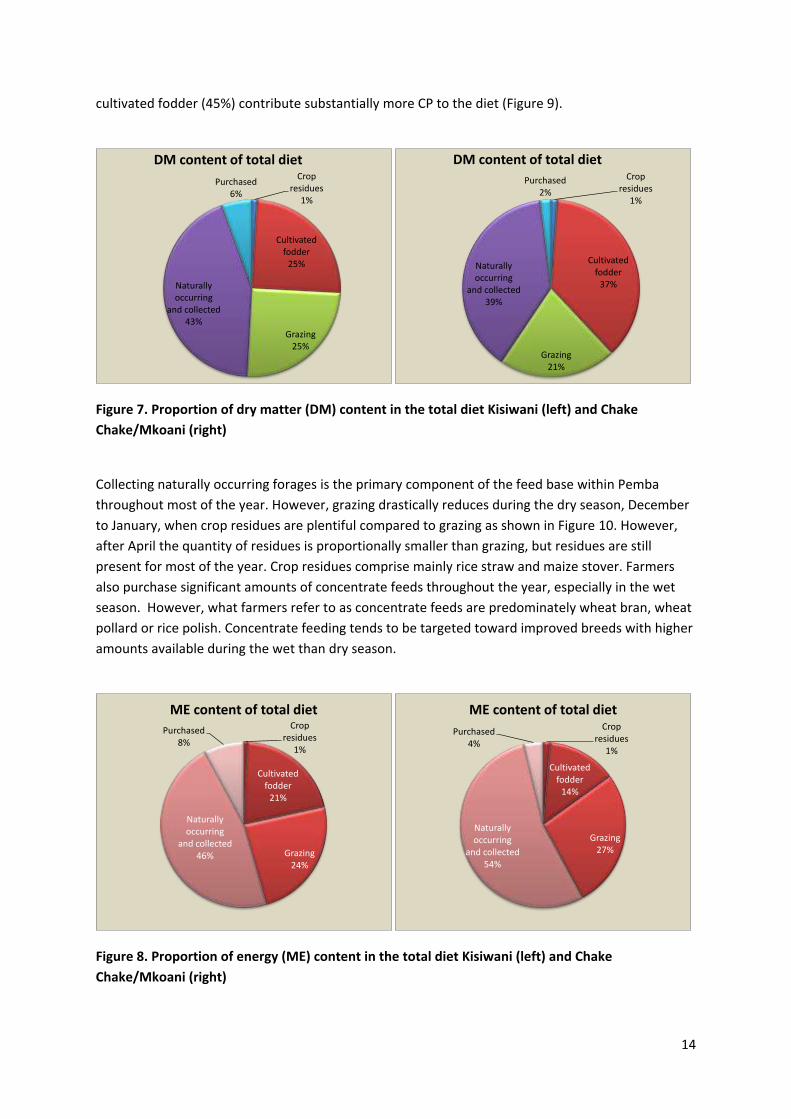
Naturally occurring and collected feeds contribute the largest proportion of 39-43% DM and 46-54%
ME (Figures 7, 8); while the highest proportion of CP also comes from naturally occurring and
collected feeds in Kisiwani (39%), it is also high in Chake Chake and Mkoani (33%), however,
grows well in swampy areas. We assume that people in Pemba only have one Brachiaria species available, namely Brachiaria decumbens.
128.7
304.0
6.0
60.0
20.0
135.0
30.00
50
100
150
200
250
300
350
Quantity of feed purchased over a 12mth period
36.060.0
36.012.0
12.0
120.0 120.0
22.80
50
100
150
200
250
300
350
Quantity of feed purchased over a 12mth period
14
cultivated fodder (45%) contribute substantially more CP to the diet (Figure 9).
Figure 7. Proportion of dry matter (DM) content in the total diet Kisiwani (left) and Chake
Chake/Mkoani (right)
Collecting naturally occurring forages is the primary component of the feed base within Pemba
throughout most of the year. However, grazing drastically reduces during the dry season, December
to January, when crop residues are plentiful compared to grazing as shown in Figure 10. However,
after April the quantity of residues is proportionally smaller than grazing, but residues are still
present for most of the year. Crop residues comprise mainly rice straw and maize stover. Farmers
also purchase significant amounts of concentrate feeds throughout the year, especially in the wet
season. However, what farmers refer to as concentrate feeds are predominately wheat bran, wheat
pollard or rice polish. Concentrate feeding tends to be targeted toward improved breeds with higher
amounts available during the wet than dry season.
Figure 8. Proportion of energy (ME) content in the total diet Kisiwani (left) and Chake
Chake/Mkoani (right)
Crop residues
1%
Cultivated fodder
25%
Grazing25%
Naturally occurring
and collected43%
Purchased6%
DM content of total dietCrop
residues1%
Cultivated fodder
37%
Grazing21%
Naturally occurring
and collected39%
Purchased2%
DM content of total diet
Crop residues
1%
Cultivated fodder
21%
Grazing24%
Naturally occurring
and collected46%
Purchased8%
ME content of total dietCrop
residues1%
Cultivated fodder
14%
Grazing27%
Naturally occurring
and collected54%
Purchased4%
ME content of total diet

15
Figure 9. Proportion of crude protein (CP) content in the total diet Kisiwani (left) and Chake
Chake/Mkoani (right)
Figure 10. Variation of feed availability throughout the year Wete (Kisiwani village, left) and Chake
Chake and Mkoani (right) districts of Pemba
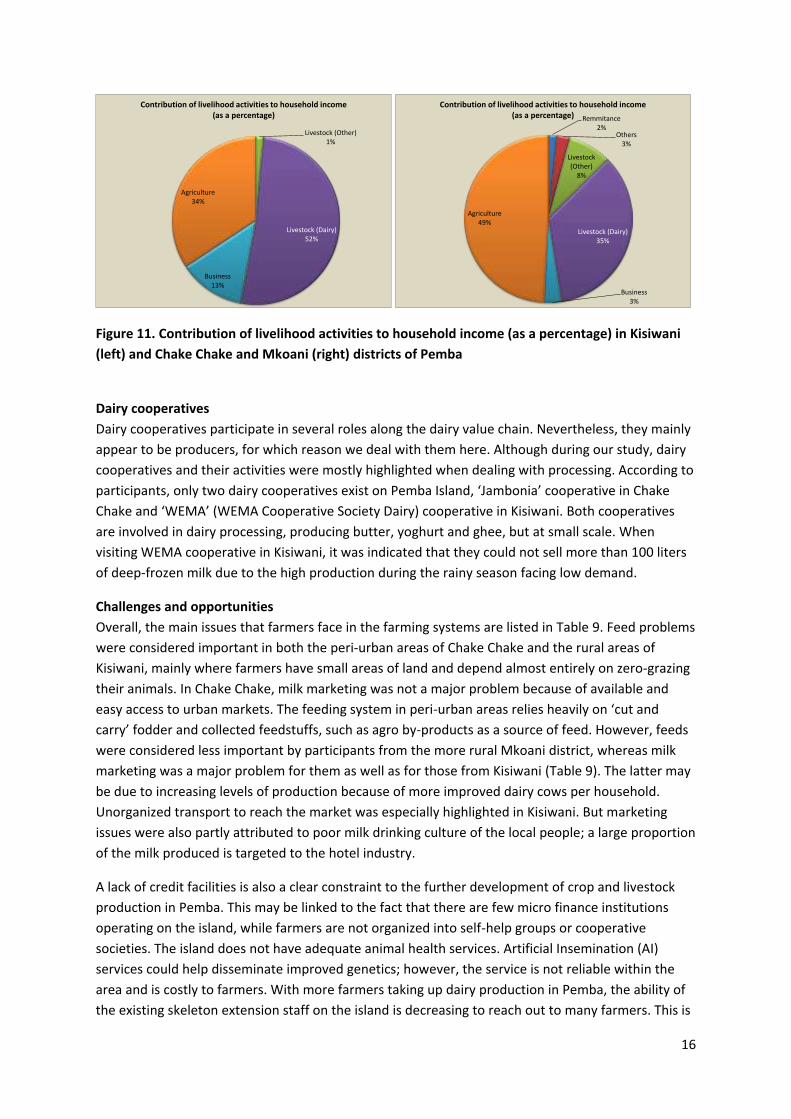
Major income sources
In both groups of respondents, the main contributors to income are livestock (43-52%) and
agriculture (34-49%); and dairy generates the predominant part of incomes from livestock
(Figure 11). In Kisiwani, more participants also get income from business (14%) than in Chake Chake
and Mkoani (3%). The result may reflect stronger the group compositions than the actual situation in
Pemba. On the other hand, Figure 11 indicates the general importance of agriculture and livestock
husbandry for the livelihoods of Pemba people. Also, the relative proportions indicate that people
with more land available, probably get good incomes from agricultural products, such as cloves.
Whereas for farmers with less land, livestock and especially dairy, can become crucial for their
livelihoods.
Crop residues
0%
Cultivated fodder
31%
Grazing17%
Naturally occurring
and collected
39%
Purchased13%
CP content of total dietCrop
residues1%
Cultivated fodder
45%
Grazing14%
Naturally occurring
and collected
33%
Purchased7%
CP content of total diet
0
1
2
3
4
5
0
50
100
Ava
ilab
lity
Available Feed Resources
Concentrates Crop residues Grazing Green forage
Legume residues Others Rainfall Pattern
0
1
2
3
4
5
0
50
100
Ava
ilab
lity
Available Feed Resources
Concentrates Crop residues Grazing Green forage
Legume residues Others Rainfall Pattern
16
Figure 11. Contribution of livelihood activities to household income (as a percentage) in Kisiwani
(left) and Chake Chake and Mkoani (right) districts of Pemba
Dairy cooperatives
Dairy cooperatives participate in several roles along the dairy value chain. Nevertheless, they mainly
appear to be producers, for which reason we deal with them here. Although during our study, dairy
cooperatives and their activities were mostly highlighted when dealing with processing. According to
participants, only two dairy cooperatives exist on Pemba Island, ‘Jambonia’ cooperative in Chake
Chake and ‘WEMA’ (WEMA Cooperative Society Dairy) cooperative in Kisiwani. Both cooperatives
are involved in dairy processing, producing butter, yoghurt and ghee, but at small scale. When
visiting WEMA cooperative in Kisiwani, it was indicated that they could not sell more than 100 liters
of deep-frozen milk due to the high production during the rainy season facing low demand.
Challenges and opportunities
Overall, the main issues that farmers face in the farming systems are listed in Table 9. Feed problems
were considered important in both the peri-urban areas of Chake Chake and the rural areas of
Kisiwani, mainly where farmers have small areas of land and depend almost entirely on zero-grazing
their animals. In Chake Chake, milk marketing was not a major problem because of available and
easy access to urban markets. The feeding system in peri-urban areas relies heavily on ‘cut and
carry’ fodder and collected feedstuffs, such as agro by-products as a source of feed. However, feeds
were considered less important by participants from the more rural Mkoani district, whereas milk
marketing was a major problem for them as well as for those from Kisiwani (Table 9). The latter may
be due to increasing levels of production because of more improved dairy cows per household.
Unorganized transport to reach the market was especially highlighted in Kisiwani. But marketing
issues were also partly attributed to poor milk drinking culture of the local people; a large proportion
of the milk produced is targeted to the hotel industry.
A lack of credit facilities is also a clear constraint to the further development of crop and livestock
production in Pemba. This may be linked to the fact that there are few micro finance institutions
operating on the island, while farmers are not organized into self-help groups or cooperative
societies. The island does not have adequate animal health services. Artificial Insemination (AI)
services could help disseminate improved genetics; however, the service is not reliable within the
area and is costly to farmers. With more farmers taking up dairy production in Pemba, the ability of
the existing skeleton extension staff on the island is decreasing to reach out to many farmers. This is
Livestock (Other)1%
Livestock (Dairy)52%
Business13%
Agriculture34%
Contribution of livelihood activities to household income (as a percentage) Remmitance
2%Others
3%
Livestock (Other)
8%
Livestock (Dairy)35%
Business3%
Agriculture49%
Contribution of livelihood activities to household income (as a percentage)
17
aggravated by lack of private sector presence and involvement in livestock production. As a result, a
lack of technical knowledge is also a clear constraint to the development of crop and livestock
production. Farmers’ perceptions of potential solutions to their problems are shown in Table 9. It
was calling for attention that farmers rather expected solutions to come from outside instead of
engaging themselves in finding them, except for the formation of cooperatives for better milk
marketing or purchasing of feeds and other inputs.
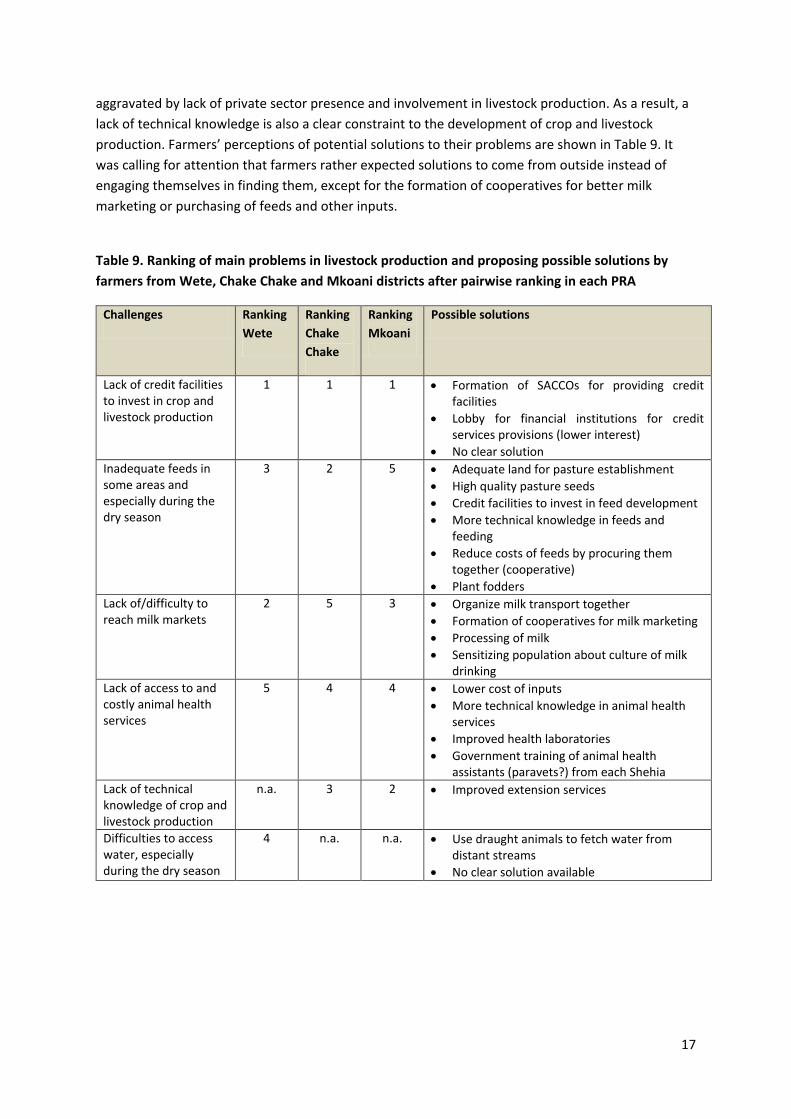
Table 9. Ranking of main problems in livestock production and proposing possible solutions by
farmers from Wete, Chake Chake and Mkoani districts after pairwise ranking in each PRA
Challenges Ranking
Wete
Ranking
Chake
Chake
Ranking
Mkoani
Possible solutions
Lack of credit facilities to invest in crop and livestock production
1 1 1 Formation of SACCOs for providing credit facilities
Lobby for financial institutions for credit services provisions (lower interest)
No clear solution
Inadequate feeds in some areas and especially during the dry season
3 2 5 Adequate land for pasture establishment
High quality pasture seeds
Credit facilities to invest in feed development
More technical knowledge in feeds and feeding
Reduce costs of feeds by procuring them together (cooperative)
Plant fodders
Lack of/difficulty to reach milk markets
2 5 3 Organize milk transport together
Formation of cooperatives for milk marketing
Processing of milk
Sensitizing population about culture of milk drinking
Lack of access to and costly animal health services
5 4 4 Lower cost of inputs
More technical knowledge in animal health services
Improved health laboratories
Government training of animal health assistants (paravets?) from each Shehia
Lack of technical knowledge of crop and livestock production
n.a. 3 2 Improved extension services
Difficulties to access water, especially during the dry season
4 n.a. n.a. Use draught animals to fetch water from distant streams
No clear solution available
18
Consumers of milk and milk products
Local population
Consumption of fresh milk is not a tradition among the population of Pemba and Zanzibar (Zanzibar
Protectorate, 1937). Nevertheless, in the urban areas of Wete and Chake Chake, for example, a few
milk kiosks sell boiled milk for immediate consumption. Some milk products, such as ghee however,
are part of the traditional island cuisine. In some villages with few dairy cattle, people who work in
town may buy milk there and take it back to the village for rural consumption. This study did not
include a specific consumer survey.
Tourism
Only a minority of international tourists (1-5% according to Gössling et al., 2006 and Sharpley and
Ussi, 2012) going to Zanzibar travel to Pemba. In one of the few existing tourist resorts visited in
Pemba, no processed milk products were offered in any of the meals except butter. According to the
hotel manager, for tea packed milk was bought in a shop in Chake Chake. A spontaneous informal
interview with some of the tourists in the same hotel highlighted that they would not dare to
consume milk products that look ‘homemade’, but rather expect professional packaging and labeling
before they would consider choosing a local product, such as yoghurt. This supports the appraisal by
RGoZ (2009b) that local milk quality is considered doubtful; and most hotels purchase UHT milk and
milk products from Tanzania mainland or countries such as Kenya and South Africa.
Processors and traders/vendors
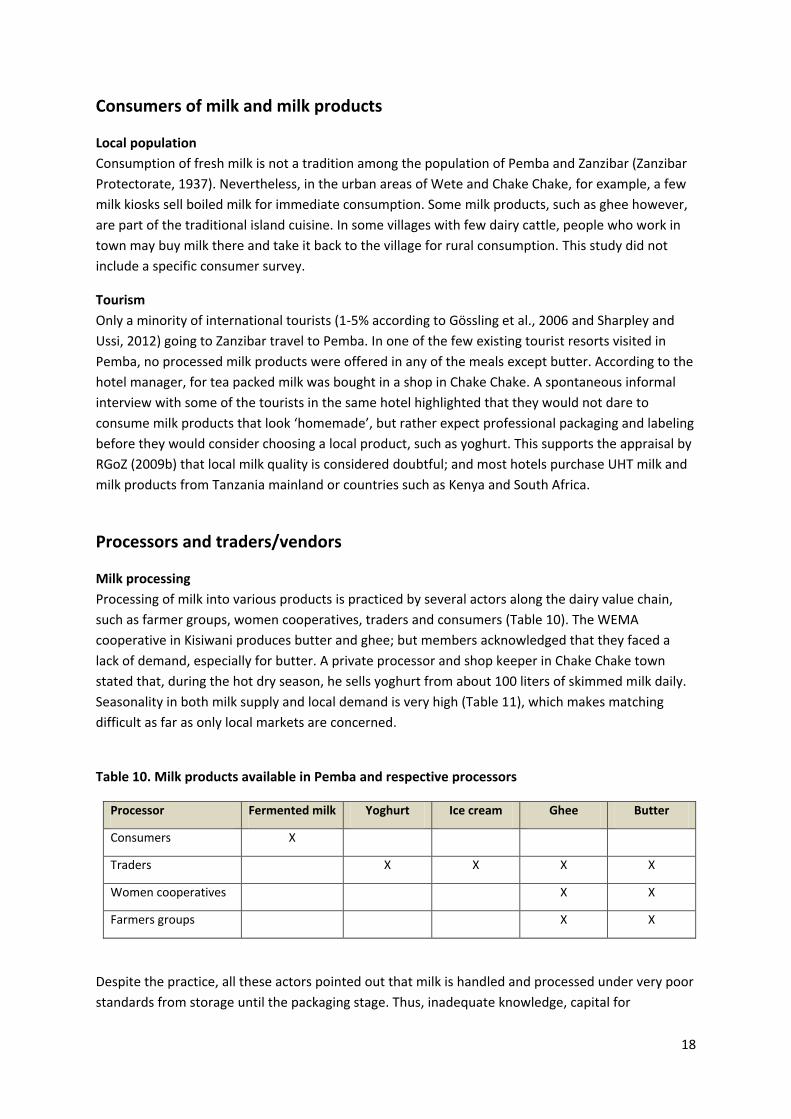
Milk processing
Processing of milk into various products is practiced by several actors along the dairy value chain,
such as farmer groups, women cooperatives, traders and consumers (Table 10). The WEMA
cooperative in Kisiwani produces butter and ghee; but members acknowledged that they faced a
lack of demand, especially for butter. A private processor and shop keeper in Chake Chake town
stated that, during the hot dry season, he sells yoghurt from about 100 liters of skimmed milk daily.
Seasonality in both milk supply and local demand is very high (Table 11), which makes matching
difficult as far as only local markets are concerned.
Table 10. Milk products available in Pemba and respective processors
Processor Fermented milk Yoghurt Ice cream Ghee Butter
Consumers X
Traders X X X X
Women cooperatives X X
Farmers groups X X
Despite the practice, all these actors pointed out that milk is handled and processed under very poor
standards from storage until the packaging stage. Thus, inadequate knowledge, capital for

19
investment, proper storage facilities, quality control standards, and standardized packaging were
mentioned to be major constraints in milk processing.
Quality control
Producers sell milk either fresh or refrigerated. Most urban farmers bring fresh milk, as most dairy
farmers have a refrigerator or they store their milk at their neighbours’. Generally the evening milk is
stored/refrigerated and delivered together with the morning milk. In Kisiwani, where many farmers
collect their milk in one point, milk is always tested by lactometer for adulteration. Processors also
test for adulteration. Most vendors also test, however, some only taste/smell (organoleptic
perception) the milk due to inadequate knowledge. Traded milk is usually boiled, so bacteria should
not play a role for consumers. Milk is always boiled at home before consumption. Rarely, people
keep raw milk to go sour and consume it in sour state served with rice or ugali. Nevertheless, there is
not much sour milk consumption, except for the villages/in rural areas.
Table 11. Seasonal variability of milk availability in Pemba
Season Milk production –
availability
Value chain channels Comments
Kasikazi Very little milk Commonly from farm to
consumer
Essentially no processing; demand is
very high in town, very hot; some
processors process as much as possible
(yoghurt, cultured milk), high % of fat in
milk
Masika Little milk Both from farm to consumer,
processor, and vendor
Mchoo Plenty of milk
(excess)
All channels! From farm to
consumer, seller/processor
and vendor
Processing little (yoghurt) as demand is
low due to cold; profit is very little
Vuli Intermediate milk All channels, from farm to
consumer, seller, vendor
(milk less available)
Vendor has to “work hard” to find
enough milk
Milk markets
Fresh milk sales are only operating within the island. The produced milk volume from local cattle still
exceeds that from improved dairy cows; however, the marketed milk is mainly from the latter. Milk
is usually consumed by the producers’ families, but also sold in their neighborhoods. Most milk is
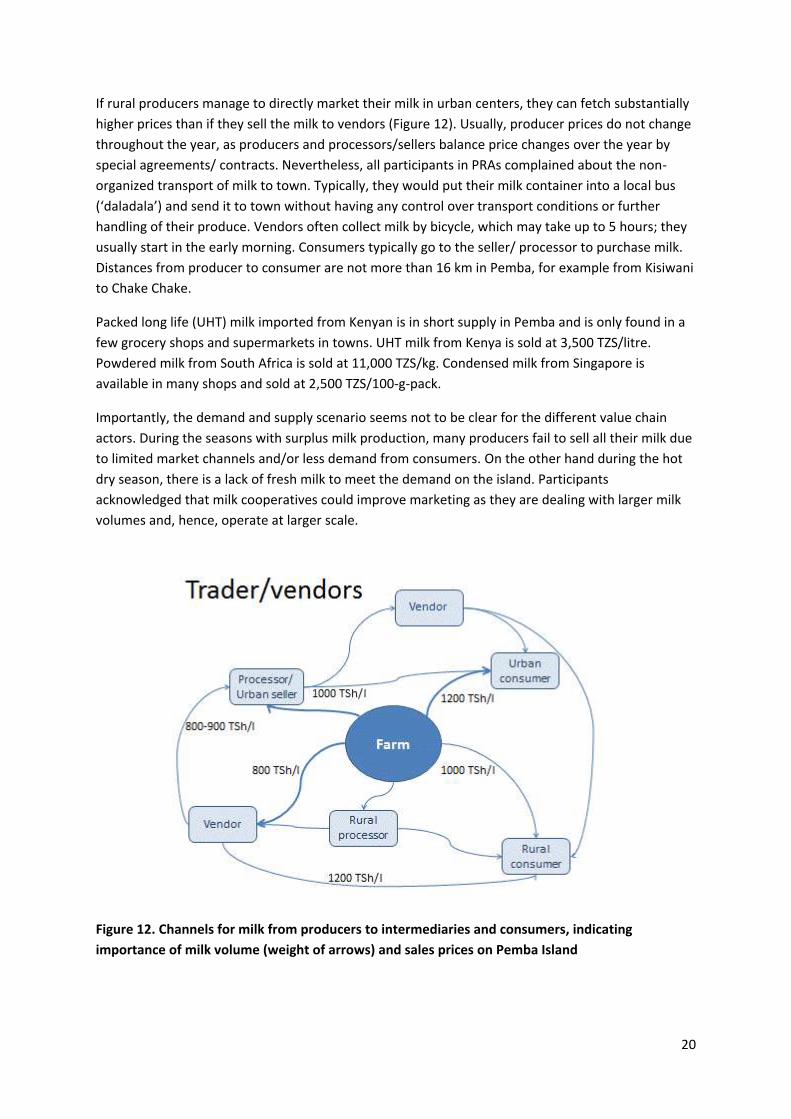
sold to vendors, urban processors/sellers or directly to urban consumers (Figure 12). Quite some
milk volume is sold directly to consumers at milk kiosks in the urban areas. Less fresh milk volume
goes directly from producers to rural consumers or rural processors. While there are only few
processors in Pemba (3 in Chake Chake, 1 in Wete and 2 in Micheweni), hundreds of sellers exist, in
every village, grocery, and operating kiosks in town. It was not possible to estimate the number of
vendors for the whole of Pemba, but participants suggested a variable number of 9-15 in Chake
Chake, according to season.
20
If rural producers manage to directly market their milk in urban centers, they can fetch substantially
higher prices than if they sell the milk to vendors (Figure 12). Usually, producer prices do not change
throughout the year, as producers and processors/sellers balance price changes over the year by
special agreements/ contracts. Nevertheless, all participants in PRAs complained about the non-
organized transport of milk to town. Typically, they would put their milk container into a local bus
(‘daladala’) and send it to town without having any control over transport conditions or further
handling of their produce. Vendors often collect milk by bicycle, which may take up to 5 hours; they
usually start in the early morning. Consumers typically go to the seller/ processor to purchase milk.
Distances from producer to consumer are not more than 16 km in Pemba, for example from Kisiwani
to Chake Chake.
Packed long life (UHT) milk imported from Kenyan is in short supply in Pemba and is only found in a
few grocery shops and supermarkets in towns. UHT milk from Kenya is sold at 3,500 TZS/litre.
Powdered milk from South Africa is sold at 11,000 TZS/kg. Condensed milk from Singapore is
available in many shops and sold at 2,500 TZS/100-g-pack.
Importantly, the demand and supply scenario seems not to be clear for the different value chain
actors. During the seasons with surplus milk production, many producers fail to sell all their milk due
to limited market channels and/or less demand from consumers. On the other hand during the hot
dry season, there is a lack of fresh milk to meet the demand on the island. Participants
acknowledged that milk cooperatives could improve marketing as they are dealing with larger milk
volumes and, hence, operate at larger scale.
Figure 12. Channels for milk from producers to intermediaries and consumers, indicating
importance of milk volume (weight of arrows) and sales prices on Pemba Island
21
Payment mechanisms, credit and check-off system
In almost all channels of the value chain (Figure 12), milk is paid in cash, usually monthly, but
sometimes also daily, weekly or on 10-day basis. Especially between producer and processor/seller,
payment mechanism depends on individual interest of the producer and may change any time
according to cash needs. Credit is not available, though, by the fact that producers are paid at the
end of the month, vendors/traders have an advancement of capital. If the milk seller has grocery on
sale, producers can buy from the seller on check-off system. There is one seller, who is providing
veterinary drugs on check-off system.
Main constraints
A substantial list of constraints was listed by the trader/vendors. To access milk purchases,
limitations in storage facilities and shortage of processing units/machines were seen of high priority.
Participants also emphasized the ignorance of producers regarding handling of milk and hygiene.
Finally, the shortage of capital for investment was stressed.
Shelf life of milk and milk products is too short considering the lack of adequate storage and
packaging facilities. Traditional consumer habits also hamper sales as most consumers are reluctant
to use skimmed milk. But the demand for milk and processed products, such as ghee and butter, is
also too low to match the available supply, especially in peak production times (Mchoo season). The
potential market from tourism is not accessible for current local products due to their inadequate
shelf life and packaging/presentation. Processors, consequently, feel the competition with imported
products from Kenya, South Africa or the Emirates, which are preferred by the hotels.
Participants identified as main constraint to broaden their business so as also to supply inputs or
services to producers in lack of capital and credit as well as lack of entrepreneurship skills. In
conclusion, they emphasized the need for improving the internal marketing system of milk and milk
products in Pemba by standardizing packaging and storage. A sensitization/promotion campaign
would be additionally needed to increase the demand of the local population in Pemba.
Input and service providers Generally, input and service provision is a secondary activity and the main income of most
participants originates from other sources, especially from farming and livestock keeping.
Participants stated that, when they are occupied with their main job, they usually employ someone
to look after the shop. It is unusual that women engage in input and service provision as a business.
Overall there is a limited number of providers available (Table 12); particularly in Mkoani district,
there exists no veterinary drug supplier. Mostly, veterinary drugs are sold together with feeds, while
a number of specialized feed suppliers exist in all districts.
As Pemba Island is fairly small and road infrastructure is good, there are no long ways between input
and service providers and their clients, the farmers (Table 13). Most ways are done either by public
transport or motorbike, however, farmers also walk to suppliers. Distances to the agents either on
Tanzanian mainland or in Kenya are substantial and transport takes several days by ship, except
when going by dhow7 that takes a day between Mombasa (Kenya) and Pemba.
7 A dhow is a traditional sailing boat with one or more masts with lateen sails used in the Indian Ocean region.

22
Table 12. Total number of feed and veterinary drug suppliers existing in Pemba
District Feed suppliers
(no.)
Veterinary drug
suppliers (no.)
Feeds and drug
suppliers (no.)
Total suppliers
(no.)
Chake Chake 3 1 1 5
Wete 2 2 4
Mkoani 1 1
Micheweni 1 1 2
Table 13. Distances between different value chain actors concerning input and service supply
Channel Distance to consumer Time to consumer
Supplier – farmer 0.5-30 km Max. 1 hour (mostly public transport)
Vet officer – farmer 0-15 km Max. 1 hour (farmer uses public transport)
Max. 30 min., Vet officer uses motorbike
Vet officer – supplier 2-30 km Max. 1 hour (motorbike)
Agent Pemba – supplier 2-30 km Max. 1 hour (motorbike)
Agent TZA – supplier 2-3 days by ship; ships first go to Unguja before
Pemba
Agent KEN – supplier 1 day by dhow, especially for drugs
Payment mechanisms, credit and check-off system
Payments in all value chain channels (see Table 13) are either on cash or (monthly) credit basis.
Generally, there is no seasonal variation in payment mechanisms. No sources of credit exist in
Pemba; however, government employees can get credits from banks.
Some farmers have agreed with vendors that the input suppliers provide them with check-off credit,
but this is not frequent. Sometimes also triangular arrangements among various actors exist.
Usually, there are no official arrangements, but agreements are oral. Participants stated that these
arrangements work well because people trust each other. Nevertheless, it became clear that first
there had to be agreement among the different actors on the different payments to be made. Only
one supplier out of 5 participants had experience with check-off credit and was satisfied with the
system. The other participants were inexperienced but demonstrated interest in the system because
there is a high level of trust in the communities. Generally, the system is initiated by the farmers.
When dealing with a cooperative, input and service providers saw more advantages than
disadvantages. Particularly, the possibility of dealing with larger volumes, more clients and the
customer binding were especially appealing to input and service providers. On the other hand, they

23
were concerned about the pressure that would be on producer prices. They also considered to run a
higher risk if a cooperative wanted a credit, as they might not be able to pay if a business failed.
Challenges and opportunities
Main challenges listed by the input and service providers were dealing with high prices and the
general lack of credit, which prevent them from taking advantage of the economy of scale. In
addition, delayed transport between Pemba and the Tanzanian mainland as well as Unguja Island
was raised. Strikingly, it was stated that there was no reliable transport between the two
neighboring main islands of the Zanzibar archipelago, which makes people in Pemba feel a bit
‘marginalized’. Overall, there was the hope that with increasing milk production and increasing
demand, business would improve. Finally, a need for lobbying towards standardization of feeds was
perceived to not fully depend on the agents.
In the following some peculiarities of the different supplier groups are given.
Feed suppliers
The feed value chain is relatively short for feed suppliers from Pemba (Figure 13). Concentrate feeds
are usually ordered from an agent on the Tanzanian mainland and are mostly delivered to suppliers
in Pemba; only larger farmers are supplied directly by the agent from the mainland. Other feed
supply comes from millers in Unguja Island and millers from Pemba itself.
Figure 13. Channels of feed supply and their relative importance (weight of arrow) on Pemba
Island (TZA, Tanzania)
The availability of feeds depends on the cropping season on Tanzania mainland, where July to
September is harvesting time. During the harvesting time, there is an excess of feeds, whereas
during the month of Ramadan – as people are fasting – milling machines are working to a minimum,

24
which creates a deficit on the market. Consequently, the demand for agricultural by-products is high
in that time and prices can increase. Supplies are also affected by transport issues. The suppliers in
Pemba do not formulate any feeds/concentrates, but resell them as they arrive. They are therefore
fully dependent on the nutritional quality supplied by the agent. Quality control does not exist,
neither in Pemba nor on the mainland. Nevertheless, suppliers react on farmers’ appreciation
concerning the feed effectiveness in their animal production. If a complaint occurs, Pemba suppliers
usually give feedback to their agents in order to improve the situation. However, this may lead to an
increase in price.
Feed suppliers establish prices themselves, depending on the cost of raw materials and transport.
They stated that profit for wholesale was 10% on average and that sometimes they lose.
Nevertheless, they also indicated that their prices may depend on availability of competitors.
Suppliers change feed prices depending on any change of transportation charges as well as when
agents change prices. Usually the changes are increases, rarely prices decrease. For example in this
year, there have been three times changes in price, going up from 31,000 TZS in January, to
35,000 TZS in March, and 38,000 TZS in May for 50 kg of layers mash. Earlier in the year, wheat
pollard was 30,000 TZS, while currently it is only 27,000 TZS per bag of 70 kg, as an example for
prices going down. Suppliers indicated that producers react to price increases in that they initially
will buy for the same cash amount until they adjust to the new price. However, this will depend on
the packaging of feeds.
Figure 14. Importance of veterinary drug supply flow (weight of arrow) on Pemba Island (KEN,
Kenya; TZA, Tanzania)
Veterinary drug suppliers
Veterinary drugs are also mostly supplied by an agent from the Tanzanian mainland to a supplier in
Pemba, who then provides the veterinary officers in Pemba (Figure 14). Nevertheless, some drugs

25
that are more difficult to obtain are also sourced from Mombasa, Kenya. These supplies are usually
transported by dhow as these are faster (Table 13) than the regular ships that usually first stop in
Unguja Island for unloading goods, before they reach Pemba. In terms of vaccines, for example for
ECF, the Tanzanian Ministry will supply them to the Ministry of Livestock in Zanzibar. In most cases,
it is the veterinary officer who deals with farmers and not the veterinary drug supplier in Pemba.
There is not much quality control ongoing, except that drug suppliers check on expiry dates. Supplier
sales prices usually allow 15-20% profit as suppliers sell in retail. But price also depends on those of
competitors.

26
Conclusions Pemba is characterized predominately by mixed crop-livestock production systems. Cloves are an
import cash crop and foreign exchange earner. At present, agriculture and livestock, especially dairy,
are the primary sources of household income. Cattle are the most important livestock species.
Improved crop and dairy production is constrained by a lack of credit facilities, milk markets and
feeds in intensive feeding systems. Other constraints are knowledge gaps by milk producers and
inadequate animal health services. To mitigate these constraints farmers (and other stakeholders)
will be required to take an integrated approach to improve livestock production through (i) milk
market improvement strategies, (ii) improving access to AI facilities to ensure farmers can rapidly
upgrade the genetic merit of their cattle holdings, and also (iii) access to credit facilities to enable
farmers invest in the crop and livestock production enterprises.
Generally, poor market channels have been among the major limiting factors towards market
development in the livestock sector in Tanzania in general and Zanzibar in particular. As this limits
the potential linkage between producers and traders (e.g., free market trade), the entrance to
competitive markets of products for both the farmers/producers and traders is also hampered.
From the dairy value chain assessment study, the following conclusions are drawn:
Milk production has increased over the recent past in Pemba, but consumption of milk and
milk products remain low.
Promotion of consumption of milk and milk products is needed to match it with the
increased production in Pemba.
Improved marketing of milk and milk products both on Pemba Island and to Unguja Island
and the Tanzanian mainland currently requires more attention than further increasing milk
production in Pemba in order to better match supply and demand. This also includes more
professional processing and packaging than done at present.
Because of its focus on using feed interventions to increase milk production, the IFAD-
funded MilkIT project should not regard Pemba as a priority intervention area under the
current circumstances of dairy development on the island.

27
Acknowledgements We acknowledge the unreserved collaboration by all survey respondents. The Pemba team is
thanked for excellent logistic support. Funding by IFAD through the MilkIT project is highly
appreciated.
28
References Ali, K.O. 1998. Indigenous cattle of Zanzibar: the need for conservation. Animal Genetic Resources Information
23:13-20.
Balsem, T. 2011. Sustainable Management of Land and Environment 2nd Phase 2010-2013 (SMOLE II) – Report
of the international land use planning advisor’s mission. Retrieved 2013 May 02 from:
http://www.smole.or.tz/doc/Land.pdf.
Biwi, K.M. 1993. Development of smallholder dairying in Zanzibar. In: Kategile, J.A. and Mubi, S. (eds.). Future
of livestock industries in East and southern Africa. Proceedings of a Workshop in Zimbabwe, 20-23 July
1992. International Livestock Centre for Africa, Addis Ababa, Ethiopia. pp. 173-176.
Burrell, G.H. and Ngassamiakwi, P.S. 1998. Milk marketing survey for Smallholder Livestock Development
Project, Pemba Island. Unpublished report prepared for Irish Aid, Dar es Salaam, Tanzania. 21 pp.
CCO (Central Census Office), 2003. 2002 Population and housing census. Tanzania census 2002, Vol. II – Age
and sex distribution. CCO, National Buerau of Statistics, President’s Office, Planning and Privatization. Dar
es Salaam, Tanzania. 352 pp.
CGIAR LaF (Livestock and Fish Research Program) 2012. Tanzania dairy value chain assessment process tool kit.
Unpublished version from June/July 2012. Retrieved 2013 Jan. 17 from: http://livestock-
fish.wikispaces.com/VCD+Tanzania.
Daily News. 2012. Pemba has made rapid development recently. Published by Daily News Tanzania, 12 Jan.
2012. Retrieved 2012 Aug. 12 from: http://touch.dailynews.co.tz/index.php/features/popular-
features/897-pemba-has-made-rapid-development-recently
DFA (Department of Foreign Affairs). 1986. Review of the Pemba Smallholder Livestock Development Project.
Pemba Island, Zanzibar, Tanzania, 8-13 May 1986. Unpublished report by Department of Foreign Affairs,
Dublin, Ireland. 23 pp.
Duncan, A., York, L., Lukuyu, B., Samaddar, A. and Stür, W. 2012. Feed Assessment Tool (FEAST): A systematic
method for assessing local feed resource availability and use with a view to designing intervention
strategies aimed at optimizing feed utilization. Questionnaire for Facilitators (Version 5.3); updated: 15
June, 2012. ILRI, Addis Ababa, Ethiopia. Retrieved from: http://www.ilri.org/feast.
Gössling, S., Bredberg, M. Randow, A., Sandström, E. and Svensson, P. 2006. Tourist perceptions of climate
change: A study of international tourists in Zanzibar. Current Issues in Tourism 9 (4-5): 419-435. DOI:
10.2167/cit265.0
Kurwijila, L. 2002a. An overview of dairy development in Tanzania. In: Rangnekar, D. and Thorpe, W. (eds.).
2002. Smallholder dairy production and marketing – Opportunities and constraints. Proceedings of a
South-South workshop held at NDDB, Anand, India, 13-16 March 2001. NDDB (National Dairy
Development Board), Anand, India, and ILRI (International Livestock Research Institute), Nairobi, Kenya.
Retrieved 2013 Jan. 15 from: http://www.ilri.org/InfoServ/Webpub/fulldocs/South_South/ch17.htm.
Kurwijila, L. 2002b. Evolution of dairy policies for smallholder production and marketing in Tanzania. In:
Rangnekar, D. and Thorpe, W. (eds.). 2002. Smallholder dairy production and marketing – Opportunities
and constraints. Proceedings of a South-South workshop held at NDDB, Anand, India, 13-16 March 2001.
NDDB (National Dairy Development Board), Anand, India, and ILRI (International Livestock Research
Institute), Nairobi, Kenya. Retrieved 2013 Jan. 15 from:
http://www.ilri.cgiar.org/InfoServ/Webpub/fulldocs/South_South/Ch27.htm.
Madulu, Ndalahwa F. 2004. Assessment of linkages between population dynamics and environmental change
in Tanzania. African Journal of Environmental Assessment and Management (AJEAM-RAGEE) 9:88-102.
29
Milne-Price, S. 2011. Veterinary issues and livestock development in Zanzibar: Farmer practices and attitudes.
SIT Study Abroad, ISP Collection, paper 1004. Retrieved 2013 May 02 from:
http://digitalcollections.sit.edu/isp_collection/1004
Mohamed, K.S. and Temu, A.E. 2011. Assessing the outreach performance of microfinance institutions in
Zanzibar. In: Haji, H.M., Akil, J.M. and Juma, S.M. (Eds.). Up-scaling agricultural research for improved
livelihood of the resource poor. Proceeding of the 2nd Annual Research Review Workshop, Zanzibar, 20-21
Oct. 2010. Ministry of Agriculture and Natural Resources, Zanzibar, Tanzania. Pp. 160-180.
Omore, A., Staal, S. J., Wanyoike, F., Osafo, E. L. K., Kurwijila, L., Barton, D., Mdoe, N., Nurah, G. and Aning. G.
2009. Market mechanisms and efficiency in urban dairy products markets in Ghana and Tanzania. ILRI
Research Report 19. ILRI (International Livestock Research Institute), Nairobi, Kenya. 56 pp. Retrieved
2013 Jan. 15 from:
http://results.waterandfood.org/bitstream/handle/10568/20/MarketMechanismsGhanaTanzania_RR_No
19.pdf?sequence=4.
RGoZ (Revolutionary Government of Zanzibar). 2009a. Zanzibar Livestock Policy – First draft 9 April 2009.
Retrieved 2013 May 02 from: http://www.kilimoznz.or.tz/images/Research/LivPolicyFDraft.pdf.
RGoZ (Revolutionary Government of Zanzibar). 2009b. Zanzibar Human Development Report – Towards Pro
Poor Growth. Retrieved 2013 May 02 from: http://zifa.ac.tz/data/ZPHDR.pdf.
Sarwatt, S. and Mollel, E. 2006. Country Pasture/Forage Resource Profiles – United Republic of Tanzania. FAO,
Rome, Italy. Retrieved 2013 May 02 from:
http://www.fao.org/ag/aGp/agpc/doc/Counprof/PDF%20files/Tanzania_English.pdf.
Sharpley, R. and Ussi, M. 2012. Tourism and governance in small island developing states (SIDS): the case of
Zanzibar. International Journal of Tourism Research. First published online 2012 July 15; doi:
10.1002/jtr.1904.
UNDP (United Nations Development Program). 2010. Tanzania – Basic country data and country overview.
Retrieved 2013 May 02 from: http://www.tz.undp.org/docs/countryinfo1.pdf.
Zanzibar Protectorate. 1937. Nutritional review of the natives of Zanzibar. 20 pp. Abstract retrieved 2013 May
02 from cabdirect:
http://www.cabdirect.org/abstracts/19371402285.html;jsessionid=5A6A8EC8DECCED43C5535BBE5AFD06
E4.
Further literature consulted
Akil, J.M. and Bryant, M.J. 2011. Small-scale dairy farming on Zanzibar Island – Tanzania: An investigation into
the factors associated with the adoption of selected farm practices. In: Haji, H.M., Akil, J.M. and Juma,
S.M. (Eds.). Up-scaling agricultural research for improved livelihood of the resource poor. Proceeding of
the 2nd Annual Research Review Workshop, Zanzibar, 20-21 Oct. 2010. Ministry of Agriculture and Natural
Resources, Zanzibar, Tanzania. Pp. 39-55.
ASDP (Agricultural Sector Development Programme). 2009. M&E Progress Report 2008/09. ASDP M&E
Working Group. The United Republic of Tanzania. Dar es Salaam, Tanzania. 104 pp. Retrieved 2013 May 02
from:
http://www.agriculture.go.tz/M&E/ASDP%20M&E%20HP/Progress%20of%20ASDP/ASDP%20M&E%20Pro
gress%20Report%202008-09_100608.pdf

30
Fagerholm, N. and Käyhkö, N. 2009. Participatory mapping and geographical patterns of the social landscape
values of rural communities in Zanzibar, Tanzania. FENNIA – International Journal of Geography 187
(1):43-60.
GoT (Government of Tanzania). 2002. Poverty and Human Development Report 2002. Retrieved 2013 May 02
from: http://www.tanzania.go.tz/pdf/phdrmain.pdf.
Index Mundi. 2012a. Tanzania – poverty headcount ratio. Retrieved 2013 May 02 from:
http://www.indexmundi.com/facts/tanzania/poverty-headcount-ratio.
Index Mundi. 2012b. Tanzania urbanization. Retrieved 2013 May 02 from:
http://www.indexmundi.com/tanzania/urbanization.html.
Jacobsen, P. 1983. East Coast Fever as a cause of calf mortality in Zanzibar. Tropical Animal Health and
Production 15 (1):43-46, DOI: 10.1007/BF02250761.
Maghimbi, S. 2010. Cooperatives in Zanzibar: Decline and renaissance. CoopAFRICA Working Paper No. 17. ILO
(International Labor Organisation) Office, Dar es Salaam, Tanzania. Retrieved 2013 May 02 from:
http://www.ilo.org/public/english/employment/ent/coop/africa/download/wpno17cooperativesinzanzib
ar.pdf.
Mkenda, A.F., Luvanda, E.G., Rutasitara, L. and Naho, A. 2004. Poverty in Tanzania: comparisons across
administrative regions. An interim report. Retrieved 2013 May 02 from:
http://www.povertymonitoring.go.tz/researchreport/poverty_comparisons_regionally_Luvanda_et_al.pdf.
Mwaseba, D.L., Johnsen, F.H., Nchimbi-Msolla, S. and Makungu, P.S.J. 2004. Does agricultural research reduce
poverty among smallholder farmers? The case of Tanzania. Noragric Working Paper No. 35, Noragric
Agricultural University of Norway, Ås, Norway. 37 pp. Retrieved 2013 May 02 from:
http://www.eldis.org/vfile/upload/1/document/0708/DOC15085.pdf.
Ogali, I.N. 2010. Experience from the field: constraints to poultry production among trained FFS farmers in
Pemba Island, Tanzania. Family Poultry Communications 9 (2):7-12. Retrieved 2013 May 02 from:
http://www.fao.org/AG/AGAINFO/themes/en/infpd/documents/newsletters/Infpd19-2.pdf#page=9.
RAWG (Research and Analysis Working Group, United Republic of Tanzania). 2009. Poverty and human
development report 2009. Dar es Salaam, Tanzania. Retrieved 2013 May 02 from:
http://www.tz.undp.org/docs/Tanzania_PHDR_2009.pdf
Reynolds, S.G. 1989. Possible reasons for non-adoption of pasture and forage crop research findings at farmer
level. Halim, R.A. (ed.). Grasslands and Forage Production in Southeast Asia. Proceedings of the First
Meeting of the Regional Working Group on Grazing and Feed Resources of South-east Asia. FAO, Rome,
Italy. Vol. 27: 181-191. Retrieved 2013 May 02 from:
http://www.fao.org/ag/agp/agpc/doc/publicat/GRASSLAN/181.pdf.
RGoZ (Revolutionary Government of Zanzibar). 2010. The Zanzibar Strategy for Growth and Reduction of
Poverty: 2010-2015 (ZSGRP) Mkuza II. Available 2013 May 02 from:
http://planipolis.iiep.unesco.org/upload/Tanzania%20UR/Zanzibar/Zanzibar-Mkuza-II-2010-2015.pdf.
The World Bank. 2005. Poverty Manual. Chapter 4, Measures of poverty. Retrieved 2013 May 02 from:
http://siteresources.worldbank.org/PGLP/Resources/povertymanual_ch4.pdf.
The World Bank. 2009a. Tanzania: Country Brief. The World Bank, Washington, DC, USA. Retrieved 2013 May
02 from:
https://openknowledge.worldbank.org/bitstream/handle/10986/2629/486010PUB0Tanz101Official0Use0
Only1.pdf?sequence=1.

31
The World Bank. 2009b. Tanzania – Mainland Trunk Roads & Zanzibar Rural Roads Baseline Survey 2009.
Retrieved 2013 May 02 from: http://microdata.worldbank.org/index.php/catalog/287.
WHO (World Health Organization). 2012. United Republic of Tanzania: Background information. Retrieved
2013 May 02 from: http://www.afro.who.int/en/tanzania/united-republic-of-tanzania.html.
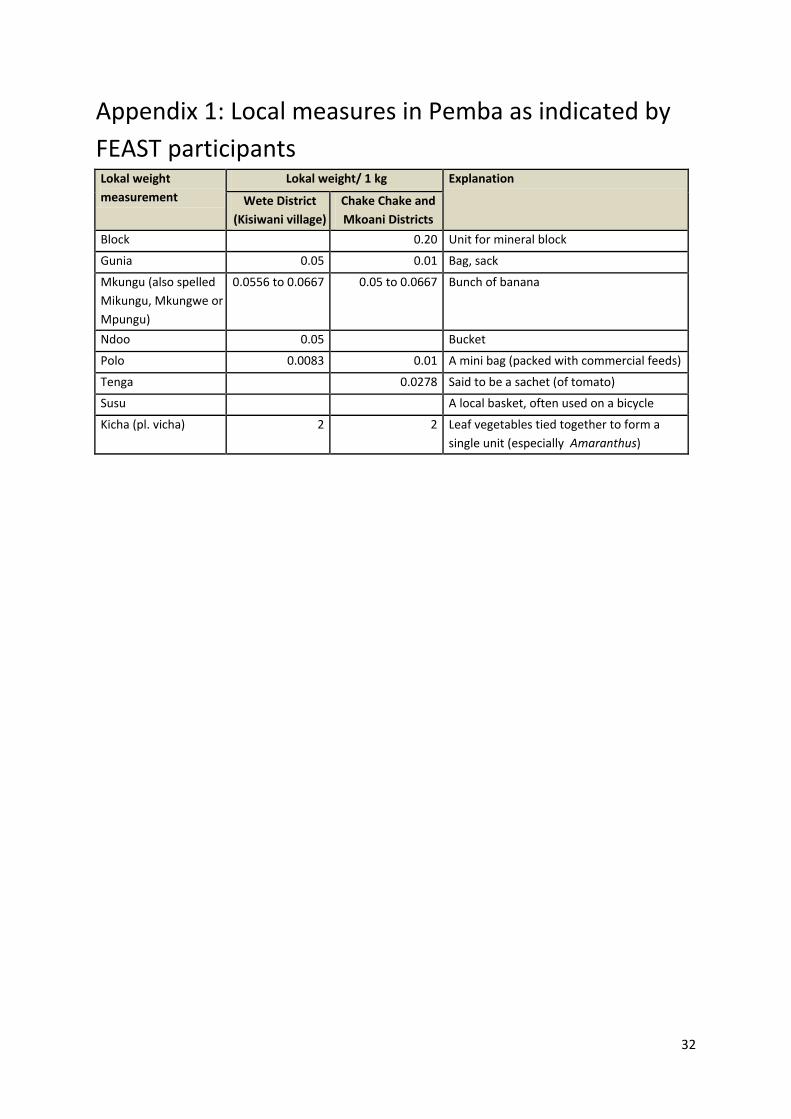
32
Appendix 1: Local measures in Pemba as indicated by
FEAST participants Lokal weight
measurement
Lokal weight/ 1 kg Explanation
Wete District
(Kisiwani village)
Chake Chake and
Mkoani Districts
Block 0.20 Unit for mineral block
Gunia 0.05 0.01 Bag, sack
Mkungu (also spelled
Mikungu, Mkungwe or
Mpungu)
0.0556 to 0.0667 0.05 to 0.0667 Bunch of banana
Ndoo 0.05 Bucket
Polo 0.0083 0.01 A mini bag (packed with commercial feeds)
Tenga 0.0278 Said to be a sachet (of tomato)
Susu A local basket, often used on a bicycle
Kicha (pl. vicha) 2 2 Leaf vegetables tied together to form a
single unit (especially Amaranthus)

33
Appendix 2: Illustrations
Applying FEAST in Kisiwani and Chake Chake
Focus group discussion with producers in Kisiwani
Individual interviews of producers from Kisiwani
Focus group discussion with producers in Chake Chake
Individual interviews of producers from Chake Chake and Mkoani
Milking a cow in Chake Chake
Manure collection in Chake Chake
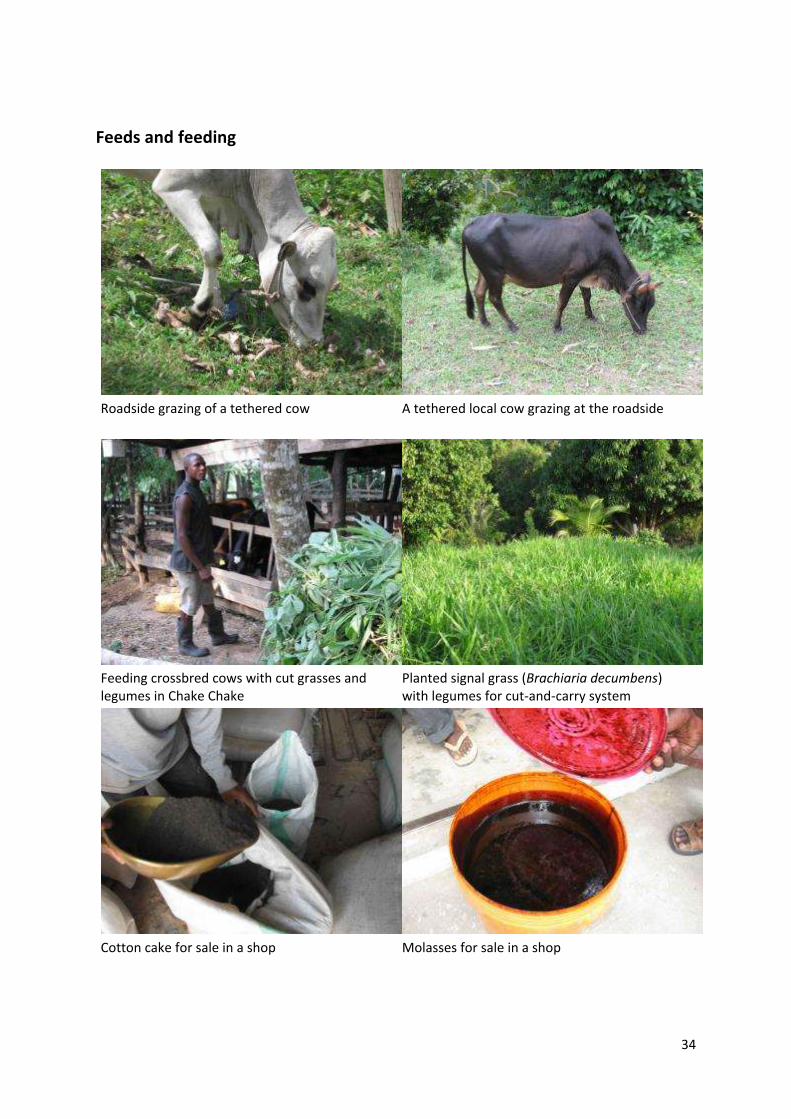
34
Feeds and feeding
Roadside grazing of a tethered cow
A tethered local cow grazing at the roadside
Feeding crossbred cows with cut grasses and legumes in Chake Chake
Planted signal grass (Brachiaria decumbens) with legumes for cut-and-carry system
Cotton cake for sale in a shop
Molasses for sale in a shop

35
Processing and consumption
Interview in a milk kiosk in Wete town Boiled and raw milk on offer in a milk kiosk in
Wete town
Milk consumers in a restaurant adjacent to a milk kiosk in Wete town
Imported long life milk from Kenya in a shop in Chake Chake town
Butter and ghee produced by a cooperative in Kisiwani
Yoghurt, ice cream and fresh milk cooled in a shop of Chake Chake town

36
Local units and transport
A local basked called ‘susu’
An input supplier in Wete town
Transporting forages on a cattle-pulled cart
Draught cattle in Chake Chake town
Local transport in a ‘Daladala’ or ‘gari ya abiria’ on between Wete and Chake Chake
Unloading goods from dhows in Pemba harbor