
Hydrological investigations of surface water–groundwater ...

Journal of Environmental Planning and Management, Vol. 38, No. 1, 1995
Assessing the Performance of the NELUP Hydrological
Models for River Basin Planning
R. ADAMS, S. M. DUNN, R. LUNN, R. MACKAY &J. R. O’CALLAGHAN
Centre for Land Use and Water Resources Research, University of Newcastle upon Tyne,
Newcastle upon Tyne NE1 7RU, UK
(Received February 1994; revised September 1994)
ABSTRACT The hydrological modelling capability within the NERC/ESRC Land UseProgramme is built around two simulation codes, SHETRAN and ARNO. Togetherthese provide a comprehensive tool for analysing the potential impacts of land use changeon the hydrology of a catchment. Both models have been validated for ® ve-year ¯ owsimulations on the prototype Tyne catchment. Results from the SHETRAN nitratesimulations are also presented with the limited available validation data. Finally, thevalue of the hydrology models is discussed in the context of river basin planning.
Introduction
Land, river and groundwater use and management practices inevitably changein time in response to changing economic and social conditions as well as totechnological development. Signi® cant alterations to the hydrological behaviourof the soils, the stream network and the underlying groundwater of a river basinmay arise as such changes take place. Changes to land drainage may lead toincreased ¯ ooding whilst changes to groundwater consumption may exacerbateperiods of low river ¯ ows. In each case, the consequences of change canencompass the degradation of the chemical and biological quality of the surfacewatercourses and, most importantly, can lead to the development of unaccept-able environments for the aquatic ¯ ora and fauna. On the land, soils maybecome waterlogged or, conversely, too dry to support the existing land cover,affecting not only the pattern of vegetation, but also the insects, invertebratesand mammals it supports. Given this background, the problem for environmen-talists and land managers is to identify future changes to land use and manage-ment practice and to predict the magnitude of the hydrological response to suchchanges.
In Moxey et al. (1995, this issue), the problem of predicting future changes inagricultural land management due to economic change is explored through theuse of regional and farm-based models within the NERC/ESRC Land UseProgramme (NELUP) decision support system (DSS). In this paper, the comple-mentary hydrological modelling capability is set out to demonstrate its utility inthe prediction of the hydrological responses of a river basin to changes inpredicted land management. These changes may arise out of planned or un-
53
0964-0568/95/010053-24 Ó 1995 University of Newcastle upon Tyne

54 R. Adams, S. M. Dunn, R. Lunn, R. Mackay & J. R. O’Callaghan
planned changes in land use. The Tyne river basin has been used to set up aprototype for the DSS and to develop and test its component models.
Two issues are central to river basin scale modelling: the ® rst concerns theavailability of data from which to extract the hydrological characteristics of theriver basin; the second concerns the design of appropriate simulation techniquesfor predicting the response of the basin. Methods are required that can simulateef® ciently the integrated response of the hydrological characteristics of the riverbasin to inputs of water and contaminants, at appropriate spatial and temporalresolutions, and which can be tested effectively using the available historicaldata. Both of these issues have been addressed during the development of thecurrent DSS hydrological modelling capability.
Two simulation codes are exploited in the hydrology component of NELUP.These are SHETRAN and ARNO. The numerical simulation code SHETRAN isdesigned to resolve the detailed spatial and temporal response of water, sedi-ment and contaminants in a river basin to land use change. However, results areproduced relatively slowly and at a considerable computational cost. Its counter-part, ARNO, is designed to give much more rapid but lower spatial resolutionresults using semi-analytical methods. The ARNO code provides a screeningtool while SHETRAN provides a more detailed analysis tool. To illustrate thedifferences between the two codes, brief summaries of the SHETRAN andARNO architectures are presented in the next section.
To demonstrate the functionality of these codes, water ¯ ow and nitratetransport models for the Tyne river basin have been developed and tested usingavailable data for the ® ve-year period 1985± 89. The results are described in thethird section. Finally, since the utility of the hydrological modelling capability inthe DSS depends on its ability to answer questions relevant to land use planningand environmental management, the future role of the hydrology componentwithin the DSS and within the broader area of river basin scale planning anddevelopment is discussed.
The Hydrology Models
SHETRAN
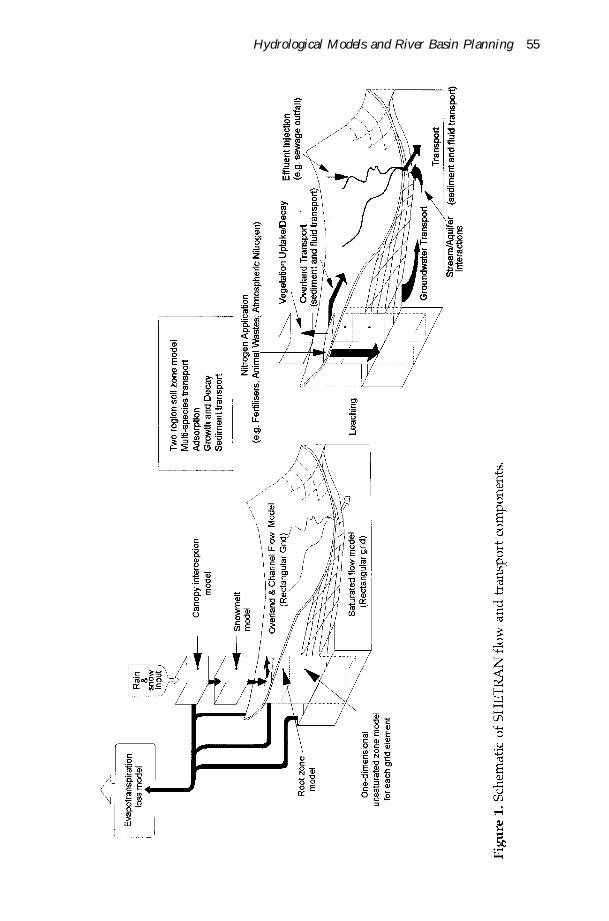
SHETRAN is a physically based, spatially distributed, catchment modellingsystem. It is a derivative of the SysteÁ me Hydrologique Europe en (SHE) ¯ owmodelling system (Abbott et al., 1986a, 1986b) but has been substantially revisedand extended over recent years to include sediment (Purnama & Bathurst, 1990),and contaminant transport (Ewen, 1990) components. It has been designed tomodel the spatial and temporal variation of water, sediment and contaminanttransport throughout a part or all of a river basin. The water ¯ ow andcontaminant transport processes modelled by SHETRAN are illustrated inFigure 1. Equations describing the balances of each of the water, sediments andcontaminants at each point within the catchment are de® ned. Constitutiverelationships are used to describe the processes affecting each quantity and theirrelationship to the physical and chemical properties of the environment. Thecombined equations are then transformed into linear systems of equations using® nite difference methods that can be readily solved for a particular spatialdistribution of catchment characteristics using a computer. The representation ofthe spatial distribution of the catchment characteristics is provided through the
Hydrological Models and River Basin Planning 55

56 R. Adams, S. M. Dunn, R. Lunn, R. Mackay & J. R. O’Callaghan
discretization of the catchment horizontally into an orthogonal network compris-ing two types of elementsÐ grid elements and stream channel links. To beconsistent with the other model components of the DSS, the Ordnance Survey1km grid has been adopted as the basic grid for SHETRAN based simulations.At each grid element, the catchment is further subdivided into a vertical columnof layers that represent the vertical paths for water and contaminants from theatmosphere down through the vegetation and the soil to the base of theunderlying aquifer. The stream channel links are used to describe the water,sediment and contaminant transport along the stream network in the catchmentand are linked to both the unsaturated and saturated zones of the adjacent gridelements. Lateral ¯ ow and transport may arise as either overland ¯ ow orsubsurface saturated zone ¯ ow.
Historically, the SHE model has been used to model small catchments of theorder of several square kilometres in size, using a grid resolution of not morethan 250m. The NELUP modelling of the Tyne basin is the ® rst test of theapplication of SHETRAN to a much larger catchment, using a coarser grid.Clearly, a 1km grid raises a number of issues with regard to the representationof both the physical properties of the area and the physical processes that occurin the model. Detailed representation of both the topography and streamnetwork is dif® cult because considerable detail at the sub-kilometre scale mustbe lost. The important effects of sub-kilometre scale processes such as landdrainage must be incorporated in the full model by the use of effective surfaceand sub-surface parameters. The validity of this model is strongly dependant onthe appropriateness of the effective parameterization. Similarly, it is recognizedthat within each square kilometre the spatial variation in soil and geologicalproperties is great. As a result, pre-processing algorithms using ® ne scale datahave been developed to identify appropriate kilometre scale soil parameters andeffective transmissivities for groundwater ¯ ow. Whilst simulations using effec-tive properties do not provide spatially precise distributions of soil moisture anddistributed ¯ ows, model test results show they can provide adequate indicationsof hydrological behaviour across the catchment above the 1km2 scale. The resultsenable the user of the DSS to distinguish between hydrologically different areasand to visualize how changes in land use can affect catchment hydrology.
SHETRAN has the advantage that the equations describing the physical andchemical process equations can be parameterized using experimental data andphysical property measurements. This is important because the changes to thephysical properties of the system due to land use change can, in principle, bepredicted and, therefore, the changes can be directly incorporated in the hydro-logical model. In this case, calibration of the parameter sets for each land usepattern is neither required nor appropriate. Despite some limitations imposed bythe scale of modelling, SHETRAN provides a powerful system capable ofproviding important hydrological response information.
ARNO
The ARNO code employs a conceptual lumped modelling approach to describewater ¯ ow at the river basin scale. Although developed originally to model thesurface water hydrology of the River Arno, the ARNO code can be easilyapplied to model most river basins. Its fast computational speed is a distinctadvantage over modelling systems such as SHETRAN. However, this computa-

Hydrological Models and River Basin Planning 57
tional speed is gained at the expense of the spatial resolution of the results thatcan be generated.
The ARNO code uses a lumped, conceptual, soil moisture accounting modelderived from earlier work carried out on the Xinanjiang river system (Zhao,1992) to represent the soil water storage characteristics of the river basin.Equations describing the routing of ¯ ows derived from output from the soilwater balance component are solved analytically. Both surface water ¯ ow,interzone ¯ ow and groundwater ¯ ow paths are explicitly described for eachsub-basin included in the model. These sub-basins are connected via channelnetworks describing the primary river system leading to the outlet of the riverbasin. The ¯ ow model is able to reproduce ¯ ows at the outlet of each sub-basinarea and along the length of the river network. However, it is only able to outputthe aggregated behaviour of the internal sub-basin responses and is unable toproduce spatial distributions of soil moisture, soil water drainage, or overland¯ ow at the same level of detail as is possible with SHETRAN. Figure 2 showsschematically the connections of the principal components of the ARNO soilwater balance model.
The original ARNO ¯ ow code has been adapted and extended to give agreater spatial resolution to the description of land cover characteristics and tointroduce parameters which have a greater physical basis. The changes to thecode now permit more effective calibration of each river basin model. Insummary, a vegetation canopy model has been added to model the processesassociated with the interception of rainfall. A spatial adaptation has also beenintroduced to delineate areas of different cover within a sub-catchment and toroute the ¯ ows from these areas to the stream network. The different cover typesused in both ARNO and SHETRAN have been simpli® ed from the classes in theLandsat remotely-sensed cover data, to a set of classes which are considered tohave markedly different hydrological responses. A snowmelt component hasbeen added to simulate the runoff events associated with low temperatureprecipitation. The current version of the ARNO code simulates the movement ofwater only.
Integration in the DSS
Both hydrology codes have been integrated into the DSS to permit the user tocarry out extensive hydrological analyses in conjunction with analyses based onthe GIS, economic and ecological component models. Both SHETRAN andARNO require spatial data describing the land surface, land cover, soils,underlying geology and stream network. The characteristics described by thesedata together control the land phase movement of water. In addition, both codesrequire data describing the temporal distribution of precipitation, air tempera-ture, sunshine hours and wind speed to characterize the climate. These data areheld in the DSS database and can be extracted for use with any hydrologicalsimulation. An intermediate software package, SHE-SHELL, performs the inte-gration of the relevant data sets for each simulation. It is resident in thebackground of the DSS and its operation is fully automatic.
The user of the DSS is able to request the recording and display of a largenumber of hydrological outputs from each simulation. These range from simplewater balances, to spatial distributions of average moisture de® cit in the soils atthe 1km level, to discharge exceedance values for speci® c locations along the

58 R. Adams, S. M. Dunn, R. Lunn, R. Mackay & J. R. O’Callaghan
Figure 2. Schematic diagram of the ARNO model.
river network. The choice of output depends on the particular use to which thedata are to be put in analysing the behaviour of the river basin. The range ofARNO outputs is smaller than that available from SHETRAN but the purpose ofusing the ARNO code is different. ARNO simulations can be run on-line on theDSS in a few minutes and can be used effectively to establish the direction andthe possible scale of a particular hydrological change that arises from theintroduction of a future land use/management pattern. These features can beobtained from basic water balance output and from in-stream responses.SHETRAN simulations can then be used to view in more detail the signi® canceof any future land use change that gives cause for concern. However, thesesimulations must be run off-line and may take many hours to complete.

Hydrological Models and River Basin Planning 59
Validation of the Hydrology Models
Hydrology of the Tyne Basin
The ® rst prototype of the DSS has been established for the Tyne river basin, UK.The Tyne basin covers an area of some 3000km2 in the North East of England,stetching from the East coast approximately 100km west into the Pennine Hills.Figure 3 shows a map of the catchment with the main rivers, the sub-catchmentboundaries and several key reference locations. The upland region of the basinis divided into northern and southern sections by the Tyne Gap, a lower lyingregion which cuts through the hills. The River South Tyne drains the southernregion from the high point of Cross Fell, close to the sources of the neighbouringRivers Wear and Tees, and ¯ ows in a general north-easterly direction. The RiverNorth Tyne drains the northern region from its boundary with Scotland, and¯ ows in a general south-easterly direction. The two rivers meet just upstreamfrom Hexham, to form the River Tyne, which then heads east towards the NorthSea. The river is tidal for some 40km inland, past the city of Newcastle and asfar upstream as Bywell. Above Bywell, the catchment is almost entirely rural,with Hexham being the only settlement of any size. It is this region of thecatchment, covering just over 2000km2, that has been the focal point of theNELUP prototype modelling. In addition, the sub-catchments of the RiverDerwent, which ¯ ows into the tidal reaches of the Tyne, have been modelled.This region covers a further 250km2.
The topography of the catchment generally consists of rolling hills. The Eastand West Allens form narrow steep-sided sub-catchments, but these areas apart,the gradients of the land are not extreme. The hills rise to over 500m in the northand 800m in the south. The valley formed by the Tyne itself is several kilometreswide, and is both low-lying and fairly ¯ at.
The soils of the region are dominated by large areas of peat in the uplands,with stagno-gleys in the majority of the remaining area. There are some brownearths and alluvial soils along the river valleys. With the exception of the areasalong the valleys, the soils are typically slow-draining and some soils in parts ofthe basin remain close to saturation for much of the year. The peaty areas alsohave an exceptionally high moisture content. However, below the soils there areonly shallow or low permeability aquifers. These features mean that the hydrol-ogy of the Tyne is dominated by surface runoff, the majority of which occurs asa result of saturation excess. There is a dense stream network and, hence, theresponse to rainfall events is very rapid.
The average annual rainfall for the region varies from around 750mm in thelow-lying east, to 1500mm in the hills to the west. A marked rain-shadow effectis observed, with relatively lower rainfall in the east, even when the differencesin elevation are accounted for. During the winter, the precipitation frequentlyfalls as snow in the hills. However, there is little seasonal variation in the depthof precipitation. Temperatures average 14°C in the summer and 4°C in thewinter.
Around 60% of the land cover of the catchment comprises some form ofgrassland, with permanent pasture in the valleys and rough grazing on the hills.The highest areas form heather moorland. Other than this, the most notablefeature of the land cover is in the North Tyne around Kielder, where an area ofover 250km2 has been put under forestry over the last 50 years. This has hadimplications for the hydrology of the region, since mature forest tends to

60 R. Adams, S. M. Dunn, R. Lunn, R. Mackay & J. R. O’Callaghan
Figure 3. The Tyne basin and sub-catchments.
increase evapotranspiration losses and, hence, reduce the runoff. However, sincethe region has high annual precipitation, the runoff ratio is still around 60± 70%.Finally, around 6% of the catchment is used for arable crops. These areas aremainly in the Tyne Valley, where the soils and climate are more suitable foragricultural production.
Water supply is also an important feature of the catchment and there are threemain surface water reservoirs. The largest, Kielder Water impounds water fromsome 240km2 of the North Tyne. The reservoir regulates ¯ ows in the NorthTyne, with the releases managed both for hydroelectric power generation andpublic water supply. A pumping station and pipeline 50km downstream atRiding Mill provide a facility for transferring water from Kielder to the RiversWear and Tees. Catcleugh Reservoir, in Redesdale, and the Derwent Reservoir,above Eddy’s Bridge, are both direct supply reservoirs, from which there is aminimal compensation ¯ ow release.
Validation of SHETRAN Flow Simulations
Five-year SHETRAN simulations have been produced for the period 1985 to1989 to provide a set of baseline data that describes the present day hydrology

Hydrological Models and River Basin Planning 61
of the Tyne catchment. The simulations have been generated without resortingto detailed calibration of the parameter set. The initial parameter set was derivedfrom a combination of: purchased experimental data, such as the soil hydraulicproperties; published experimental measurements, such as overland ¯ ow resis-tances; and estimated physical properties, such as channel geometries. Verylimited calibration was performed on one of the sub-catchments of the SouthTyne, largely to ensure that the water balance was approximately correct. Thiswas necessary due to the limited availability of hourly meteorological data. Thecalibration process resulted in some changes to the methodology for estimatingdistributed rainfall inputs, and minor adjustments to the average values of theaerodynamic resistance parameters for vegetation. These were estimated basedon an average wind speed and the vegetation height. The initial values werefound to cause unrealistically high evaporation losses from interception, so theaverage wind speed was reduced to account for this. Both sets of changes wereapplied globally and no further calibration was performed on the remainder ofthe catchment.
Whilst the results are presented in terms of ¯ ows in the river network, thesimulations actually provide a spatial picture of the different phases of the watercycle within the catchment. This incorporates the inputs from precipitation, thelosses to evapotranspiration, the additions to soil moisture, the ¯ ows intostreams from both surface and sub-surface water, and ® nally the routing ofwater down the stream network. Figure 4 shows a summary of the completewater balance predicted for the catchment above the South Tyne at HaydonBridge.
The detailed data that would be required to validate each component ofSHETRAN are not available. The best test that can be achieved is to compare thepredictions of stream¯ ow with the measured data from stream gauging stations.The stream¯ ow is the last component to be computed and it links together allof the other components, so if these data are found to give good agreement withthe measurements, then this provides con® dence in the other model predictions.Values for the ef® ciency of ® t of the predictions have been calculated using theNash and Sutcliffe method (Nash & Sutcliffe, 1970):
Ef® ciency 5 O ni 5 1
(qoi 2 qm)2 2 (qoi 2 qpi)2
(qoi 2 qm)2
where qo is the observed daily ¯ ow, qm is the mean of the observed daily ¯ ows,qp is the predicted daily ¯ ow and n is the number of daily observations.
Figure 5 shows two three-month periods of SHETRAN ¯ ow predictions forthe River Tyne at Bywell. Figure 5(a) is for the period from September toNovember 1985, and Figure 5(b) is for March to May 1989. The correspondingmeasurements from the Bywell gauging station are shown by the dotted line. Avisual inspection of these time-series graphs shows that there is excellentagreement between the SHETRAN predictions and the measured data for theseperiods. The calculated ef® ciencies are 0.87 and 0.57 respectively.
However, while Figure 5 illustrates the quality of the temporal response thatcan be produced by SHETRAN, it only illustrates the results from 10% of theavailable simulation period. In order to show the performance of SHETRANover the full ® ve-year period, ¯ ow statistics have been calculated on a monthlybasis. The bar chart in Figure 6 shows the total monthly depth of runoff atBywell, calculated from SHETRAN predictions and the measured data. This

62 R. Adams, S. M. Dunn, R. Lunn, R. Mackay & J. R. O’Callaghan
Figure 4. Annual water balance for the South Tyne at Haydon Bridge for 1985.
shows that the predicted volume of runoff matches the measured data reason-ably, with the worst discrepancy being an over-prediction of runoff by 25%. Inaddition, there is good agreement in the pattern of runoff. Overall, a discrepancyof around 10% between the measured depth of runoff and the predicted depthis found. This magnitude of error lies well within the error bounds of the rainfallinput data and the measured discharge data.
The line graph in Figure 6 shows a comparison of the monthly variance of theSHETRAN ¯ ow predictions for Bywell with the monthly variance of the mea-sured data. The variance of the ¯ ows gives a measure of the spread of dailyvalues about the mean. It can be seen that the predictions follow the samemonthly pattern as the measurements, but that the variance of the SHETRANpredictions is generally too high. The ef® ciency of the ® t, 0.47 for the full® ve-year period, re¯ ects this overprediction of variance.
The reason for the discrepancy in the variance between the measurements andpredictions is that there is a tendency for the simulations to over-predict thepeak ¯ ows from storm events. There are a number of reasons why this mayoccur. First, there may be problems with the intensity distribution of the rainfallinput to the model, since most of the recording rain gauges which were used totemporally distribute the rainfall lie on the drier east side of the catchment.Second, an analysis of the internal mass balance of SHETRAN reveals that themodel generated a 2% error in the channel routing component. This error arises

Hydrological Models and River Basin Planning 63

64 R. Adams, S. M. Dunn, R. Lunn, R. Mackay & J. R. O’Callaghan

Hydrological Models and River Basin Planning 65
only in the bottom three sub-catchments (Haydon Bridge, Reaverhill and By-well), where the ¯ ows in the main channel are greatest, and appears to becaused by insuf® cient reduction in timestep during the ¯ ow simulations. Finally,the low grid resolution that has been used to model the Tyne means thatSHETRAN does not model the recession curves of the ¯ ood peaks accurately.
Further analysis of the SHETRAN ¯ ow predictions has been carried out bycomparisons with the available measured data at the sub-catchment level. Inparticular, comparisons have been made between the difference in quality of thepredictions for the upland and lowland sub-catchments. The ef® ciencies of the® ve-year simulations are very similar, with 0.60 for the South Tyne at Feather-stone and 0.69 for the Derwent at Rowlands Gill, but a visual inspection of theerrors in the variances of the ¯ ow for the same two sub-catchments suggests thatthe predictions for the lowland Derwent at Rowlands Gill are considerablybetter than those for the upland South Tyne at Featherstone. However, the massbalance for the South Tyne at Featherstone is excellent, suggesting a linkbetween the errors in the variances and the potential errors in the temporaldistribution of rainfall. The Derwent region lies fairly close to the recording raingauges from which the temporal rainfall distribution was derived, and also hasa similar total annual rainfall. The South Tyne Featherstone region, by contrast,is much further away and has a much higher total annual rainfall. Thus the highvariances observed in the South Tyne Featherstone ¯ ow predictions may in partbe a function of errors in the temporal intensity distribution of the rainfall.However, other differences also exist between the two sub-catchments, with alower runoff ratio and less surface runoff domination from the region aboveRowlands Gill. As a result, the variance of the ¯ ows is lower for Rowlands Gilland the same type of errors in peak ¯ ow predictions becomes less important.
In summary, satisfactory validation of the SHETRAN ¯ ow predictions hasbeen achieved, without extensive calibration of the model. The errors in thecatchment water balance lie within acceptable bounds, given the potential errorsin both the input and validation data. The variance of the SHETRAN predictionsis generally high but as noted there are several potential causes that explain thisresult. Importantly, the model performs well at both the sub-catchment andcatchment level.
Validation of ARNO Flow Simulations
In the same manner used to analyse the SHETRAN ¯ ow simulations, the ARNOmodel results for the same period from 1985± 89 have also been analysed.However, the ARNO model, due to its nature, has to be calibrated against ahistorical record before it can be tested. Thus, part of the available record for1985± 89 for a few of the sub-catchments of the Tyne was used to providecalibration data. In addition, the water balance data, output from the SHETRANsimulations, were used to support this calibration. The preliminary modelcalibration was carried out against a combination of gauging station dischargerecords and SHETRAN derived mass balances for the year 1985. Additionallimited calibration using 1986 data was carried out on some catchments in caseswhere the model’s performance in 1986 was deemed unacceptable. The modelparameters which in¯ uenced the mass balances within the sub-catchments werecalibrated against the 1985 SHETRAN mass balances. The discharge recordswere employed to calibrate the overland ¯ ow parameters in the routing model

66 R. Adams, S. M. Dunn, R. Lunn, R. Mackay & J. R. O’Callaghan
which affected the timing, shape and peak magnitude of the runoff peaks, butnot the total runoff volumes. After the overland ¯ ow parameters were deter-mined, a check on the modelled ¯ ow volumes, with the volumes measured atthe gauging stations, was made. In some sub-catchments, adjustments were thenmade to the parameters affecting the water balance if a large discrepancybetween the two volumes was noted. The resulting calibrated model was thentested against the remaining years of discharge records available at severalgauging stations in the Tyne catchment.
Rather than repeat the same discussion for ARNO as carried out above forSHETRAN, a comparison of the SHETRAN and ARNO model results is pre-sented here. Figures 7 and 8 show the equivalent results from the ARNO modelto Figures 5 and 6 from SHETRAN.
Not surprisingly, the predictions of monthly runoff from the ARNO model arevery similar to the SHETRAN results. Of interest here are the discrepancies thatarise in response to changes in the meteorological conditions between years. The1985 period was relatively wet with a correspondingly dry year noted in 1989.The ARNO results for the dry year show underprediction of the ¯ ow peaksleading to the suspicion that the soil water in® ltration parameters, developed onthe basis of 1985 data alone, require further calibration. Other than this, thepredicted time-series of daily ¯ ows show similar characteristics for ARNO andSHETRAN. The ef® ciencies for ARNO, for the two periods shown in Figure 7,are 0.85 and 0.82 respectively. The runoff at Bywell (Figure 5 and 7) showsoverpredictions of 7% for ARNO and 10% for SHETRAN. This is most likely dueto errors in precipitation distribution which are handled identically for bothmodels. In both cases the overprediction tends to be in the winter, leading to thefurther possibility that the predictions from the snow component of both modelsare not reliable. The ARNO model shows better performance than SHETRAN interms of the estimation of the variances of the daily ¯ ows. This is con® rmed bythe ef® ciencies calculated for ARNO over the ® ve-year period. These are 0.82 forthe Tyne at Bywell, 0.77 for the Derwent at Rowlands Gill and 0.80 for the SouthTyne at Featherstone. This improvement over SHETRAN derives from the betterreproduction of the recession curves after each storm by the ARNO model(Figure 7).
The main point of this discussion is that ARNO provides a reliable counter-part to the SHETRAN model for predicting the behaviour of the river basinresponse to changes in climate. The upgrading of ARNO to include a similarevapotranspiration component to SHETRAN enables the model to predict differ-ences in the evapotranspiration regime caused by land use change. The use ofARNO as a rapid assessment model is therefore considered to be justi® ed in thecontext of the Tyne river basin.
Validation of SHETRAN Nitrate Simulations
The ¯ ow and the nitrate simulations for the Tyne are linked to the other DSSmodel components through the pattern of land cover and land managementheld on the NELUP database. The spatial patterns of agricultural land use andland management are derived from the Areal Interpolation model (AI) devel-oped for the agricultural modelling component (Moxey & Allanson, 1994). In theTyne basin, the main agricultural land covers are barley (winter and springcrops), wheat, oil seed rape, ley pasture, permanent pasture and rough grazing.

Hydrological Models and River Basin Planning 67

68 R. Adams, S. M. Dunn, R. Lunn, R. Mackay & J. R. O’Callaghan

Hydrological Models and River Basin Planning 69
Table 1. Estimated fertilizer applications and harvest-ing dates within the Tyne basin
Crop Month Day N kg/ha
Winter barley 3 1 50
4 1 1009 15 Harvest
Spring barley 3 14 504 1 50
9 15 Harvest
Oil seed rape 3 7 2254 1 25
9 8 Harvest
Hay 3 15 50
4 7 1409 15 Harvest
Ley pasture 3 20 50
4 15 1005 25 30
Permanent pasture 3 20 304 20 40
5 20 256 20 25
The land cover data are held in the form of percentages of agricultural landcover per 1km grid square. In addition to the spatial pattern of land cover andland management, it has been necessary to describe the temporal pattern ofnitrogen input to each land cover. This has been achieved through the extensionof the application of the erosion productivity impact calculator (EPIC) (Jones etal., 1991) used to produce agricultural productivity data for input to theeconomic linear programming model (Moxey et al., 1995, this issue). For eachland cover, fertilizer applications have been established (Table 1). The corre-sponding nitrogen data for SHETRAN are derived for each 1km square fromEPIC simulations. EPIC output has been modi® ed to provide daily plant uptakeand nitrogen input values for input to SHETRAN.
To initiate the nitrogen simulations, an initial distribution of nitrogen, in theform of nitrate, is required both areally and over depth in the soil pro® le. As ameans of avoiding the computational expense of running a SHETRAN simu-lation to establish a suitable initial condition, a supplementary code, MP (Lunn& Mackay, 1994) is used. This code provides a rapid method for setting up initialcontaminant pro® les for each 1km grid square in the soil and groundwater zone.Once this preliminary work has been completed the full simulation of the nitratemovement within the catchment is possible for any range of nitrate inputsderived from alternative agricultural activities.
A limited number of measurements are available de® ning the magnitudes ofnitrate found in surface waters at various points on the Tyne river system for theperiod 1985± 89. Although the results are insuf® cient to provide a comprehensivevalidation of the nitrate model, the available data have been used to provide apreliminary assessment of the quality of the nitrate model developed for theTyne.

70 R. Adams, S. M. Dunn, R. Lunn, R. Mackay & J. R. O’Callaghan
Figure 9. Estimated annual fertilizer application in the South Tyne.
The estimated annual fertilizer application distribution for the South Tyne isshown in Figure 9. It can be seen that the upland areas of the subcatchments aredominated by rough grazing and have no fertilizer applications. In the lowlands,the major agricultural land use is grassland. This is divided into permanentpasture and ley pasture, which cover 45% and 4% of the total South Tyne arearespectively. Permanent pasture receives an annual total of 120 kg N/ha throughthe period of March to June. Ley pasture has a higher input of 180 kg N/habetween March and May, 100 kg N/ha of which is a single application in midApril.
In addition to the grassland, small areas of oil seed rape, spring barley andwinter barley are located in the East Allen and South Tyne Haydon Bridgesub-catchments. These receive annual totals of 250, 100 and 150 kg N/harespectively. A detailed temporal description of the nitrogen inputs for eachagricultural land use is given in Table 1. In general, the major nitrogen input to

Hydrological Models and River Basin Planning 71
Table 2. Measured and predicted means and standard deviations(mgN/1)
Allen Banks Haltwhistle
Measured Predicted Measured Predicted
Mean 0.66 0.71 0.55 0.66
Standard deviation 1.31 0.86 0.94 0.74
the catchment occurs in the form of fertilizer applications between March andJune. Point source inputs from sewage outfalls and agricultural buildings are notincluded. This imposition of fertilizers on the soils of the Tyne basin introducesa near surface source of nitrogen that can be readily displaced by surface ¯ owphenomena.
SHETRAN predicted time-series, for 1985, of average daily nitrate concentra-tions at Allen Banks and Haltwhistle are shown in Figure 10. The predictedtime-series for the remaining four years of the simulation show very similarcharacteristics. The locations of Allen Banks and Haltwhistle are shown in Figure3. A series of high concentration peaks are predicted from mid March throughto the end of July following fertilization of the arable crops and grassland. Asnoted above, the simulated nitrate concentration peaks correspond to overland¯ ow events. They occur as the upper layers of the soil become saturated,allowing the fertilizer at the soil surface to dissolve in the available moisture andto be transported with the overland ¯ ow to the rivers and streams. Also shownin Figure 10 are the measured nitrate concentrations. The measurements corre-spond well, on average, with the predicted concentrations for the majority of thesimulation. The mean and standard deviations of the predicted hourly concen-trations and the NRA data are shown in Table 2. Of particular signi® cance is thefact that the mean concentration is predicted well at both locations and asensible estimate of the standard deviation has been achieved. This indicates thatthe nitrogen inputs to the system are also reasonably well estimated. An exact® t to the data could not be expected as the quantities and times of fertilizerapplications in the catchment are not known in detail for the simulated period.Estimates have been made on the basis of observed local farming practices.Many more data points are needed, however, to validate unambiguously thefrequency and duration of contaminant release events simulated following theoccurrence of signi® cant overland ¯ ows. To facilitate the use of the nitrate modelwithin the DSS for analysis, a number of general result formats are available fordisplaying SHETRAN nitrate predictions on the DSS. These include monthly orannual maps of averaged groundwater concentrations, leached water concentra-tions, total fertilizer application and total plant uptake. There is also a contami-nant mass diagram available showing the total nitrogen mass transported viaeach physical process within the catchment.
Figure 11 describes the nitrogen mass dynamics for the South Tyne for 1987.The major nitrogen input to the catchment is in the form of fertilizers whichcontribute 2613 tonnes of nitrogen over the year. In addition, 543 tonnes ofnitrogen enter the catchment via rainfall, which has an estimated nitrogenconcentration of 0.8mg N/l for the Tyne basin. Once in the soil region, approx-

72 R. Adams, S. M. Dunn, R. Lunn, R. Mackay & J. R. O’Callaghan

Hydrological Models and River Basin Planning 73
Figure 11. Nitrogen mass dynamics in the South Tyne for 1987.
imately half the applied nitrogen is taken up by the vegetation cover, and 638tonnes N is lost to the atmosphere via denitri® cation. The remaining nitrogen inthe soil region is transported to the stream network via overland ¯ ow, seepagetransport or channel/aquifer exchange. The most important of these transportmechanisms is overland ¯ ow, which accounts for 90% of the contaminanttransported to the river network.
The Role of the Hydrology Models in Planning
In the previous section is has been shown that the prototype Tyne models canre¯ ect the historical patterns of water and nitrate movement in the Tyne riverbasin. As they stand they are capable of modelling the effects of land use changein two main ways: by predicting changes to the evapotranspiration regime andits effect on runoff; and by predicting changes to the nitrate concentrations ingroundwater and streams. Clearly, other land use changes also affect hydrologyin different ways, and further development of the models will attempt toaccount for aspects such as cultivation, land drainage and small scale urbaniza-tion. As previously stated, the approach to tackling these issues is to identify theeffects through ® ne scale modelling and to develop effective representations inthe large scale catchment model.

74 R. Adams, S. M. Dunn, R. Lunn, R. Mackay & J. R. O’Callaghan
Providing the limitations of large scale modelling are accepted, the systemprovides a useful aid to land use planning in the river basin, at a regional level.Potential users of the hydrological modelling system can be classed into twogroups. The ® rst group includes the legislative and `watch dog’ organizationsthat have an interest in controlling and monitoring the development of, and theprotection of, the environment; important among these in the United Kingdomare the National Rivers Authority (NRA), the Scottish River Puri® cation Boardsand the UK Department of the Environment. The second group comprises thoseparties and organizations, such as the water utilities, the regional councils andlocal industry, that have an interest in the exploitation of the water resourceseither for recreation, water supply or ef¯ uent disposal.
Hydrological questions that may be posed by these two groups are varied. Atthe small scale, a knowledge of the local response of water quality due to achange in upstream ef¯ uent inputs may be needed. At the large scale, theprediction of the integrated effects of land use change on the reliability of boththe surface and subsurface water resources of a river basin may be important. Ineither case, the issue for hydrological planning is not simply to sustain theexisting hydrological conditions but to identify the signi® cance of any hydrolog-ical change to each component of the environment and to each user of theenvironment. It is also necessary to understand the risks associated with such achange.
The signi® cance of and risks associated with any change are dependent on thespeci® c environment and the speci® c conditions encountered. Therefore, ratherthan describing the particular use of the prototype DSS, the utility of the currenthydrological models for planning can best be illustrated by outlining a fewclasses of `hydrological’ problem relevant to the Tyne basin but with equalrelevance to other river basins that may be resolved using the present models.
Sustaining Sites of Ecological Importance
Sites of special ecological importance are commonly associated with particularhydrological environments in which rare ¯ ora and fauna are able to exist. Forexample, peat mires are associated with shallow water table conditions andwater sources of a particular quality. Similarly, game ® sh spawning beds areassociated with particular stream and river ¯ ow regimes and bed environments.Sustaining these sites involves sustaining the water balance and the water ¯ owand quality characteristics appropriate to the sites. As a ® rst step in this directionit is necessary to understand the current hydrological environment and itssensitivity to changes in the pattern of climate in the area. This can be achievedby performing detailed historical and climate sensitivity analyses using thehydrology models. Water levels, evaporation rates, and surface ¯ ow patterns canall be analysed to provide evidence of the hydrologically important controlsgoverning the site. From this step, it is then possible to identify regions upstreamfrom the site which are linked hydrologically to the site. The interactionsbetween different regions in a catchment can be effectively mapped using thehydrological models and, through additional sensitivity analyses, the magnitudeof speci® c planning events on the site can be identi® ed. The resulting maps of`hydrological signi® cance’ for the site can be used to support the managementof the river basin to the bene® t of the speci® c sites and the incumbent plants andwildlife that are to be protected.

Hydrological Models and River Basin Planning 75
This use of the hydrological models to identify the present situation, toidentify the local and regional controls on the area of interest, and to examinethe sensitivity of the area of interest to future changes of land use and climateis a common thread following through all of the following problems as well.
Integrated Catchment Planning
Recently, catchment planning has been addressed in England and Wales by theNRA (National Rivers Authority, Northumbria Region, 1993). The aim of suchplanning has been to provide a strategy for the promotion, acceptance andintegration of the many possible developments that may take place within acatchment in the future, that will provide sustained development of the waterresources of a region. Such catchment plans rely on being able to predict theintegrated response of the water system to the diverse range of new and existingactivities that may take place in the catchment. The NELUP database and thehydrology models provide an appropriate integrated tool for the examination ofpossible proposals for land development and for the ranking of the value of eachpossible proposal in terms of hydrological impact.
Sustainable Water Resources
The Tyne basin is water rich compared to some river basins in England. It isunlikely, therefore, that the local needs for water will exceed the potentialsupply for many years. Nevertheless, the potential exists in the United Kingdomfor extensive interbasin water transfers to be carried out on an economic basis.In this case it is possible that the Tyne would become a net exporter of water inthe foreseeable future. The impact of such transfers on the water balance in theTyne could signi® cantly impact on the base ¯ ows in the lower Tyne and on thecorresponding water quality in the vicinity of urban developments. If thisredistribution of water occurs at the national level in conjunction with extensivealteration to the land use in the Upper Tyne, for example to timber production,then the possibilities for signi® cant local penalties exist in the Tyne. Anyexamination of the primary issues associated with various contradictory waterresource developments relies on a detailed evaluation of the interactions be-tween such competing activities.
Ef¯ uent Licensing
At a local level, the potential for water quality to fall below acceptable levels, atvarious points in the river system, can be markedly increased by licensedef¯ uent releases from industry and urban developments. In the case of watersupply offtakes, a knowledge of the risk associated with the probability ofexceedance of permitted levels of individual pollutants in the water and theduration of these events is important. This type of data can best be estimated bythe use of integrated hydraulic/hydrology models such as SHETRAN to predictthe river ¯ ows and river water quality.
It is worth noting that in each case presented here, the principal hydrologicalconsequences of change do not relate to the average behaviour of the system but,dominantly, to its short time and space scale behaviour. The ability to model this® ne temporal detail of the response of the river basin underlies the choice of thetwo modelling codes and the development of the current modelling capability inthe DSS.

76 R. Adams, S. M. Dunn, R. Lunn, R. Mackay & J. R. O’Callaghan
Summary
In this paper the development of prototype hydrological models has beendescribed for the Tyne river basin. The testing of these models has beenillustrated for both ¯ ow and nitrate transport. The possible uses of the modelsfor river basin scale management and planning has also been considered. Thechoice of the two codes, SHETRAN and ARNO, was made on the basis of theneeds of the potential users of the NELUP DSS and on the practical consider-ations of computational ef® ciency and accuracy. The hydrology models havebeen developed to produce a wide range of water-based output that is suitableboth for interrogating the characteristics of the water resources of a region andfor the support of the counterpart ecological and economic models.
An integrated modelling system has been developed that can be used effec-tively through the DSS for practical analysis of a wide range of environmentalmanagement problems which require blends of engineering, political and socialsolutions.
Acknowledgements
The authors gratefully acknowledge the ® nancial support provided by theNatural Environment Research Council and the Economic and Social ResearchCouncil. Additionally, the authors wish to acknowledge the assistance of Pro-fessor E. Todini and his colleagues at the Centro IDEA of the University ofBologna in the development and use of the ARNO model and the technicalsupport of Dr J. Ewen and colleagues of the Water Resource Systems ResearchUnit, University of Newcastle, who developed the SHETRAN modelling system.
References
Abbott, M.B., Bathurst, J.C., Cunge, J.A., O’Connell, P.E. & Rasmussen, J. (1986a) An introduction to
the European Hydrological SystemÐ SysteÁ me Hydrologique Europe en (SHE), 1: History and philoso-phy of a physically based distributed modelling system, Journal of Hydrology, 87, pp. 45± 59.
Abbott, M.B., Bathurst, J.C., Cunge, J.A., O’Connell, P.E. & Rasmussen, J. (1986b) An introduction tothe European Hydrological SystemÐ SysteÁ me Hydrologique Europe en (SHE), 2: Structure of a
physically based distributed modelling system, Journal of Hydrology, 87, pp. 67± 77.Ewen, J. (1990) Basis for the sub-surface contaminant migration component of the catchment water ¯ ow,
contaminant transport, and contaminant migration modelling system SHETRAN-UK, NIREX ResearchReport NSS/R229 (Harwell, NIREX).
Jones, C.A., Dyke, P.T., Williams, J.R., Kiniry, J.R., Benson, V.W. & Griggs, R.H. (1991) EPIC: anoperational model for the evaluation of agricultural sustainability, Agricultural Systems, 37, pp.
341± 350.Lunn, R.J. & Mackay, R. (1994) An integrated modelling system for nitrogen transport, in: Proceedings
of the International Symposium on Transport and Reactive Processes in Aquifers (ZuÈ rich, A.A. Balkema).Moxey, A. & Allanson, P. (1994) Areal interpolation of spatially extensive variables: a comparison of
alternative techniques, International Journal of Geographical Information Systems, 8, pp. 479± 487.Moxey, A.P., White, B. & O’Callaghan, J.R. (1995) The economic component of NELUP, Journal of
Environmental Planning and Management, 38(1), pp. 21± 33.Nash, J.E. & Sutcliffe, J.V. (1970) River ¯ ow forecasting through conceptual models: Part 1Ð a
discussion of principles, Journal of Hydrology, 10, pp. 282± 290.National Rivers Authority, Northumbria Region (1993) Ouseburn Catchment Management Plan Consul-
tation Report (Newcastle upon Tyne, NRA).Purnama, A. & Bathurst, J.C. (1990) A review of three features of sediment transport in stream channels:
dynamics of cohesive sediment, in® ltration of transported sediment into the bed and stream erosion, NIREXResearch Report NSS/R237 (Harwell, NIREX).
Zhao, R.J. (1992) The Xinanjiang model applied in China, Journal of Hydrology, 135, pp. 371± 381.
Copyright © 2022 FDOKUMEN