Hydrological process and land use
97
Hydrologic processes and land use
Transcript of Hydrological process and land use

Hydrologic processes and land
use

content•Evaporation, Precipitation •Interception and Transpiration•Runoff and Stream flow•Ground water and contamination

Interception storage(on Plant)
Surface storage (on soil)
Ground water storage(Below water table)
Soil-water storage(above water table)
OutputGaseou
s
Storage in
Plants
Input
Chann el st orage
Total water yield
Rain , Snow Conden satio nOver land flow
Sub Surface flow
Seepage
seepage
Evapot
ranspi
ra
tion Stream flow(canopy
drip)
To plants
Water storage in the atmosphere
evaporation
Sun’s heat
Heated surface
Evaporation
Transpiration
Heated air
Dry air is less dense
and therefore it
rises
It expands and cools down at about 1oC/100m
Moist airMoist air
Cool air cannot hold as much water vapor as warm air as it’s Saturation Vapor Pressure is lower
Relative humidity
reaches 100% at a certain height
If temperature > 0oC , dew point is reached and vapor condenses
into water droplets
If temperature < 0oC , frost point is reached and sublimation starts turning water vapor into
ice
Cloud formation

Evaporation measurementA low budget and direct way to estimate evaporation rate, on days without any precipitation is to use a pan filled with water and to measure the height of water in the pan for 2 consecutive days at exactly the same time A lysimeter is a device used to
obtain values of potential or actual evaporation
It’s made of steel, concrete or plastic and is dug into the ground, in which a volume of soil with some vegetation is hydrologically isolated by preventing any leakage
The position of water level in the lysimeter is monitored and regulated by pumping
In weighing lysimeters change in water storage is determined by the difference of mass of the lysimeter

Warm cloud Cold cloud
Water vapor
Water vapor Water vapor
Water vapor
Water droplets
EVAPORATION CONDENSATION
Large and heavy enough to fall ?
YES
RAIN
EVAPORATION SUBLIMATION
CONDENSATION SUBLIMATION
Supercooledwater droplets
Ice crystalsLarge and heavy enough to fall ?YES
SNOW
CONDENSATION
Generation of precipitation

Precipitation•Precipitation: water falling from the atmosphere to the earth.•Rainfall•Snowfall•Hail, sleet
•Requires lifting of air mass so that it cools and condenses.

Precipitation/Rainfall •All forms of water that reach the earth from the atmosphere is called Precipitation.
•The usual forms are rainfall, snowfall, frost, hail, dew.
•Rainfall being the predominant form of precipitation causing stream flow, especially the flood flow in majority of rivers. Thus, in this context, rainfall is used synonymously with precipitation.

Precipitation
Interception
ThroughfallStemflow
EvaporationTranspiration
Evaporation
Ocean
Lake Ground water
Overlandflow
Returnflow
InfiltrationRedistribution
Evaporation
Snow pack
Percolation
Capillaryrise
Depression storage
Interflow
Wetland
Plant uptake
Overland
flow
Soil water

Contd…
•In nature water is present in three aggregation states:•solid: snow and ice; •liquid: pure water and solutions; •gaseous: vapors under different grades of pressure and saturation
The water exists in the atmosphere in these three aggregation states.

Contd…•Types of precipitation
•Rain, snow, hail, drizzle, glaze, sleet
•Rain:•precipitation in the form of water drops of size larger than 0.5 mm to 6mm
•The rainfall is classified in to• Light rain – if intensity is trace to 2.5 mm/h• Moderate – if intensity is 2.5 mm/hr to 7.5 mm/hr
• Heavy rain – above 7.5 mm/hr

Figure 2.2
Biomes and Rainfall

Causes of Precipitation

Precipitation types
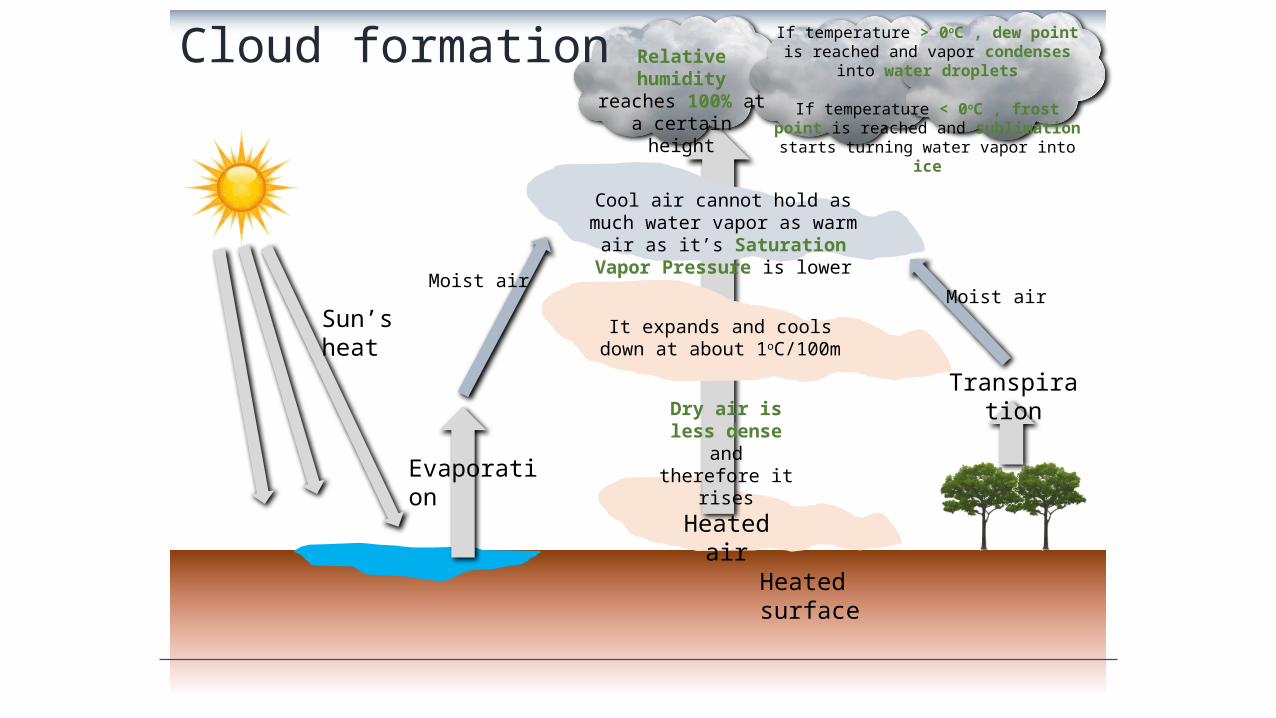
• Precipitation as a result of local heating of air at the earth’s surface is called convective precipitation
• Active in tropical areas and interiors of continents
• Precipitation is often local and intense (thunderstorms)
• When horizontal air currents are forced to rise over natural barriers such as mountains, orographic precipitation occurs
• Precipitation falls on the windward side
• Leeward side is the other side which is a precipitation shadow area
Mechanisms for air lifting1. Frontal lifting2. Orographic lifting 3. Convective lifting

Definitions•Air mass : A large body of air with similar temperature and moisture characteristics over its horizontal extent.
•Front: Boundary between contrasting air masses.
•Cold front: Leading edge of the cold air when it is advancing towards warm air.
•Warm front: leading edge of the warm air when advancing towards cold air.

Frontal Lifting•Boundary between air masses with different properties is called a front
•Cold front occurs when cold air advances towards warm air
•Warm front occurs when warm air overrides cold air
Cold front (produces cumulus cloud)
Cold front (produces stratus cloud)
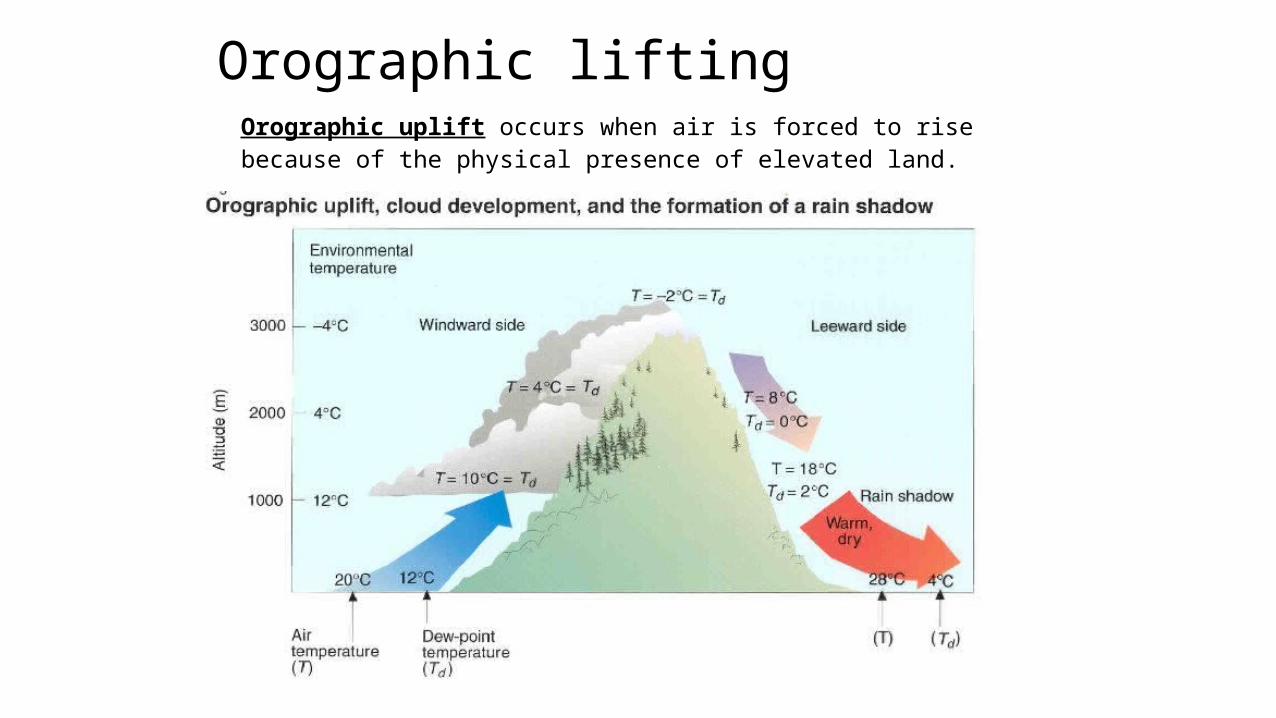
Orographic liftingOrographic uplift occurs when air is forced to rise because of the physical presence of elevated land.
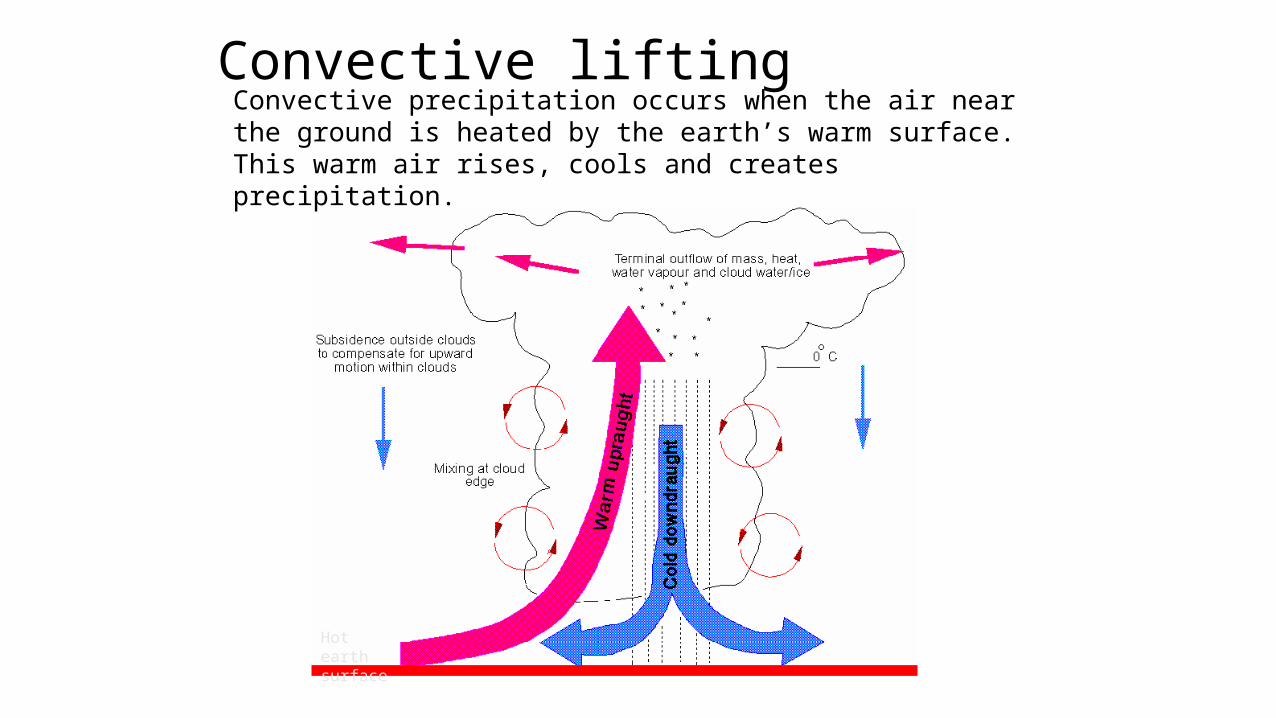
Convective lifting
Hot earth surface
Convective precipitation occurs when the air near the ground is heated by the earth’s warm surface. This warm air rises, cools and creates precipitation.
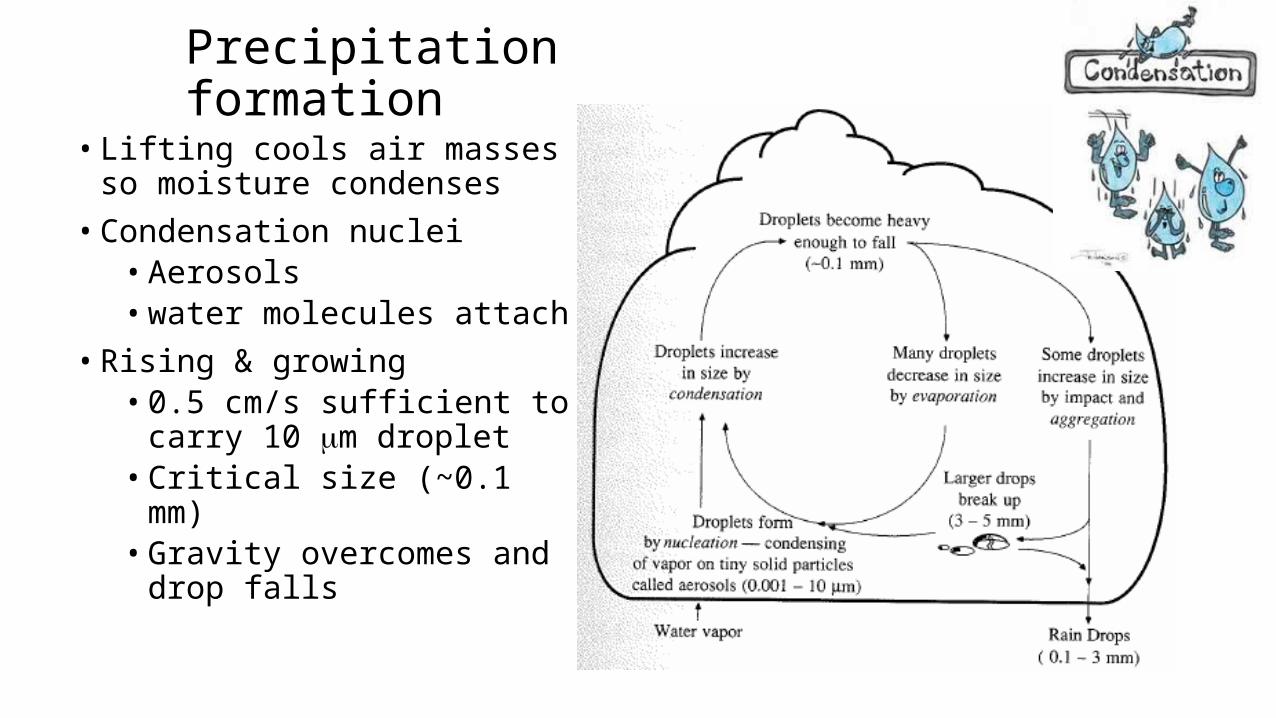
Precipitation formation
•Lifting cools air masses so moisture condenses
•Condensation nuclei•Aerosols •water molecules attach
•Rising & growing•0.5 cm/s sufficient to carry 10 mm droplet
•Critical size (~0.1 mm)
•Gravity overcomes and drop falls

Measurement of Rainfall
•Rainfall and other forms of precipitation are measured in terms of depth, the values being expressed in millimeters.
•Instrument used to collect and measure the precipitation is called raingauge.

A rain gauge (also known as an udometer, pluviometer, ombrometer ) is a type of instrument used by meteorologists and hydrologists to gather and measure the amount of liquid precipitation over a set period of time.The standard
rain gauge, developed around the start of the 20th century, consists of a funnel emptying into a graduated cylinder, 2 cm in diameter, that fits inside a larger container which is 20 cm in diameter and 50 cm tall.
A weighing-type precipitation gauge consists of a storage bin, which is weighed to record the mass.The tipping bucket rain gauge consists of a funnel that collects and channels the precipitation into a small seesaw-like container. After a pre-set amount of precipitation falls, the lever tips, dumping the collected water and sending an electrical signal.
Precipitation measurement

Precipitation Measurements
Standard Instruments:
Simple rain gauge, standard rain gauge, tipping bucket gauge, weighing gauge

Radar measurement of rainfall
•The meteorological radar is the powerful instrument for measuring the area extent, location and movement of rainstorm.
•The amount of rainfall overlarge area can be determined through the radar with a good degree of accuracy
•The radar emits a regular succession of pulse of electromagnetic radiation in a narrow beam so that when the raindrops intercept a radar beam, its intensity can easily be known.

Stratospheric Transport and Exchange
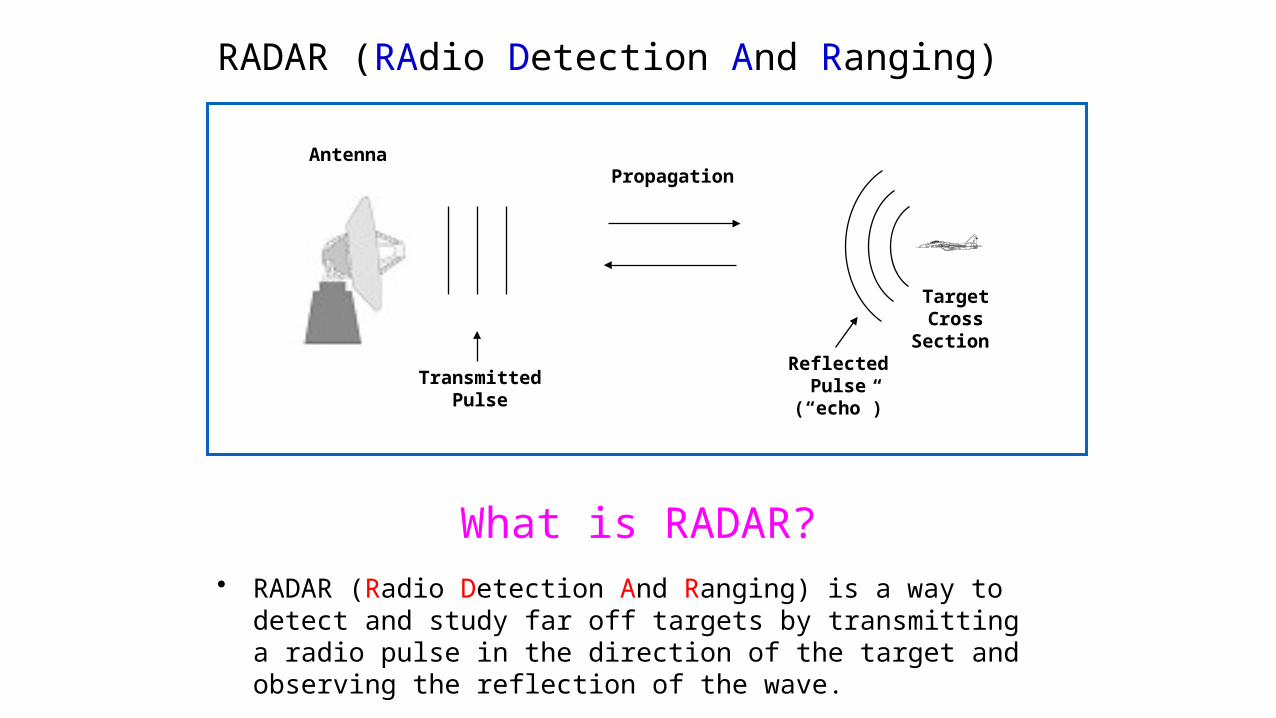
RADAR (RAdio Detection And Ranging)
Antenna
TransmittedPulse
TargetCross
Section
Propagation
ReflectedPulse
(“echo”)
• RADAR (Radio Detection And Ranging) is a way to detect and study far off targets by transmitting a radio pulse in the direction of the target and observing the reflection of the wave.
What is RADAR?

Precipitation Variation•Influenced by
•Atmospheric circulation and local factors• Higher near coastlines• Seasonal variation – annual oscillations in some places
• Variables in mountainous areas• Increases in plains areas• More uniform in Eastern US than in West
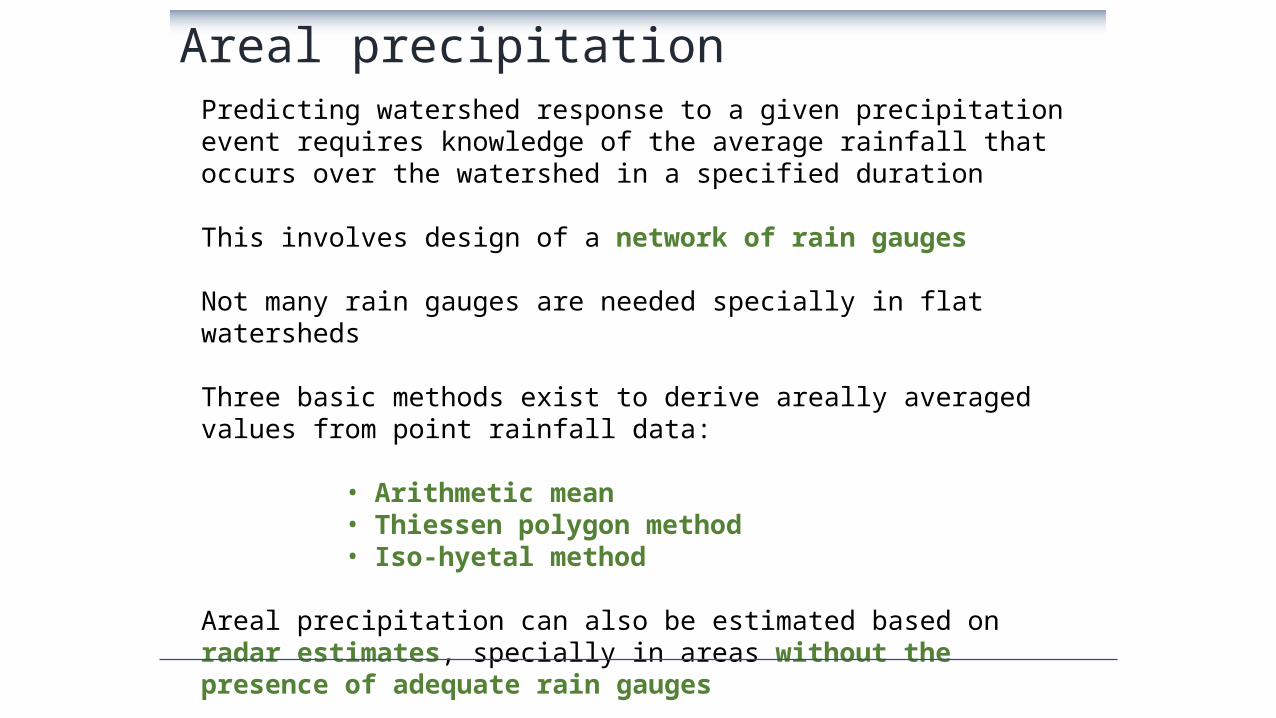
Areal precipitationPredicting watershed response to a given precipitation event requires knowledge of the average rainfall that occurs over the watershed in a specified duration
This involves design of a network of rain gauges
Not many rain gauges are needed specially in flat watersheds
Three basic methods exist to derive areally averaged values from point rainfall data:
• Arithmetic mean• Thiessen polygon method• Iso-hyetal method
Areal precipitation can also be estimated based on radar estimates, specially in areas without the presence of adequate rain gauges

Arithmetic Mean Method•Simplest method for determining areal average
P1
P2
P3
P1 = 10 mmP2 = 20 mmP3 = 30 mm
• Gages must be uniformly distributed• Gage measurements should not vary greatly about the mean
N
iiP
NP
1
1
mmP 203302010
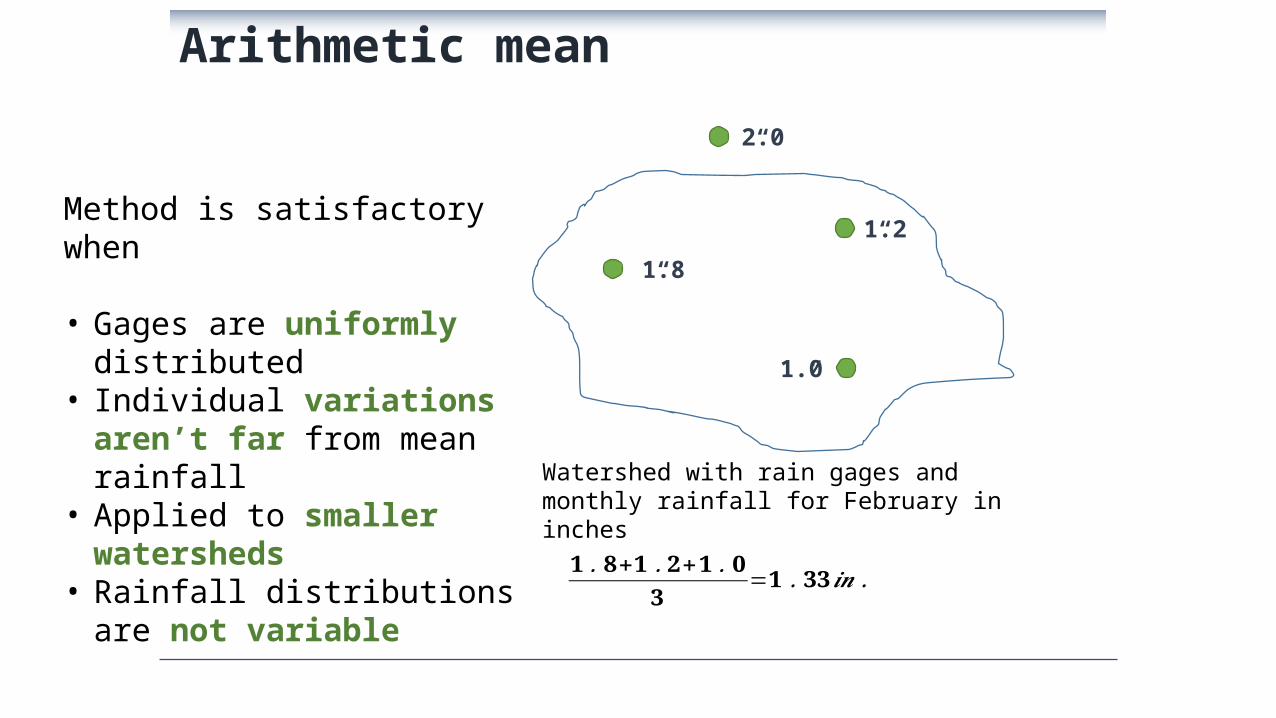
Arithmetic mean
Method is satisfactory when
• Gages are uniformly distributed
• Individual variations aren’t far from mean rainfall
• Applied to smaller watersheds
• Rainfall distributions are not variable
2.0”
1.8”
1.2”
1.0”
Watershed with rain gages and monthly rainfall for February in inches𝟏.𝟖+𝟏.𝟐+𝟏.𝟎
𝟑=𝟏.𝟑𝟑 𝒊𝒏.

Thiessen polygon method
P1
P2
P3
A1
A2
A3
• Any point in the watershed receives the same amount of rainfall as that at the nearest gage
• Rainfall recorded at a gage can be applied to any point at a distance halfway to the next station in any direction
• Steps in Thiessen polygon method1. Draw lines joining adjacent gages 2. Draw perpendicular bisectors to the lines
created in step 13. Extend the lines created in step 2 in both
directions to form representative areas for gages
4. Compute representative area for each gage5. Compute the areal average using the
following formula
N
iii PA
AP
1
1
P1 = 10 mm, A1 = 12 Km2
P2 = 20 mm, A2 = 15 Km2
P3 = 30 mm, A3 = 20 km2
mmP 7.2047302020151012

Thiessen polygon
Thiessen polygons are built up by drawing midlines, perpendicular bisectors, between rain gages on a map
Value of rainfall measured by a rain gauge is assigned to the area surrounding it
Multiplying the rainfall by its representative area, summing the products for all rain gages and dividing by total area gives weighed average of precipitation over the area
2.0”
1.0”
Watershed with rain gages and monthly rainfall for February in inches
1.8”
1.2”

Thiessen polygonValue of rainfall measured by a rain gauge is assigned to the area surrounding it
Multiplying the rainfall by its representative area, summing the products for all rain gages and dividing by total area gives weighed average of precipitation over the area
2.0”
1.0”
1.8”
1.2”
A
B
C
D

Isohyetal method
P1
P2
P3
10
20
30
•Steps•Construct isohyets (rainfall contours)
•Compute area between each pair of adjacent isohyets (Ai)
•Compute average precipitation for each pair of adjacent isohyets (pi)
•Compute areal average using the following formula
M
iii pAP
1
A1=5 , p1 = 5A2=18 , p2
= 15 A3=12 , p3 = 25
A4=12 , p3 = 35
mmP 6.214735122512151855
N
iii PA
AP
1
1
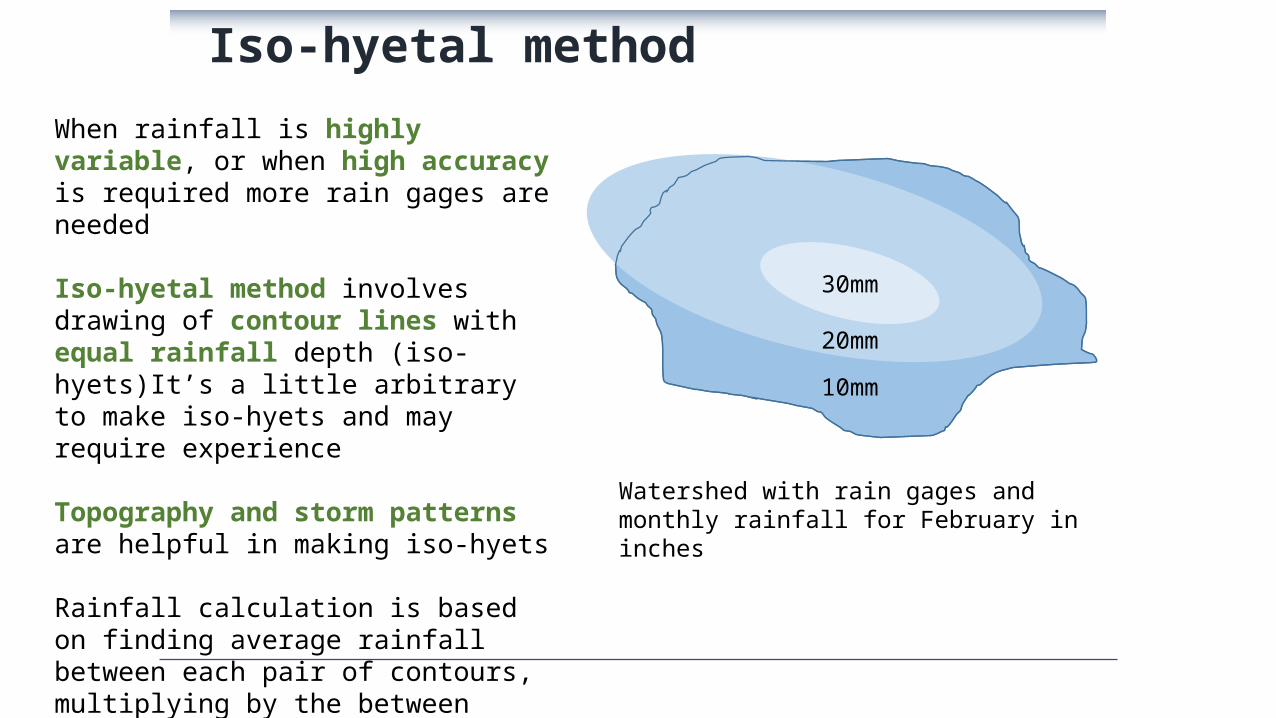
Iso-hyetal methodWhen rainfall is highly variable, or when high accuracy is required more rain gages are needed
Iso-hyetal method involves drawing of contour lines with equal rainfall depth (iso-hyets)It’s a little arbitrary to make iso-hyets and may require experience
Topography and storm patterns are helpful in making iso-hyets
Rainfall calculation is based on finding average rainfall between each pair of contours, multiplying by the between them, totaling these products and dividing by total area.
30mm
20mm10mm
Watershed with rain gages and monthly rainfall for February in inches

Rainfall interpolation in GIS•Data are generally available as points with precipitation stored in attribute table.

Rainfall maps in GIS
Nearest Neighbor “Thiessen” Polygon
InterpolationSpline Interpolation
Interception:effects of forestry on hydrology
Interception
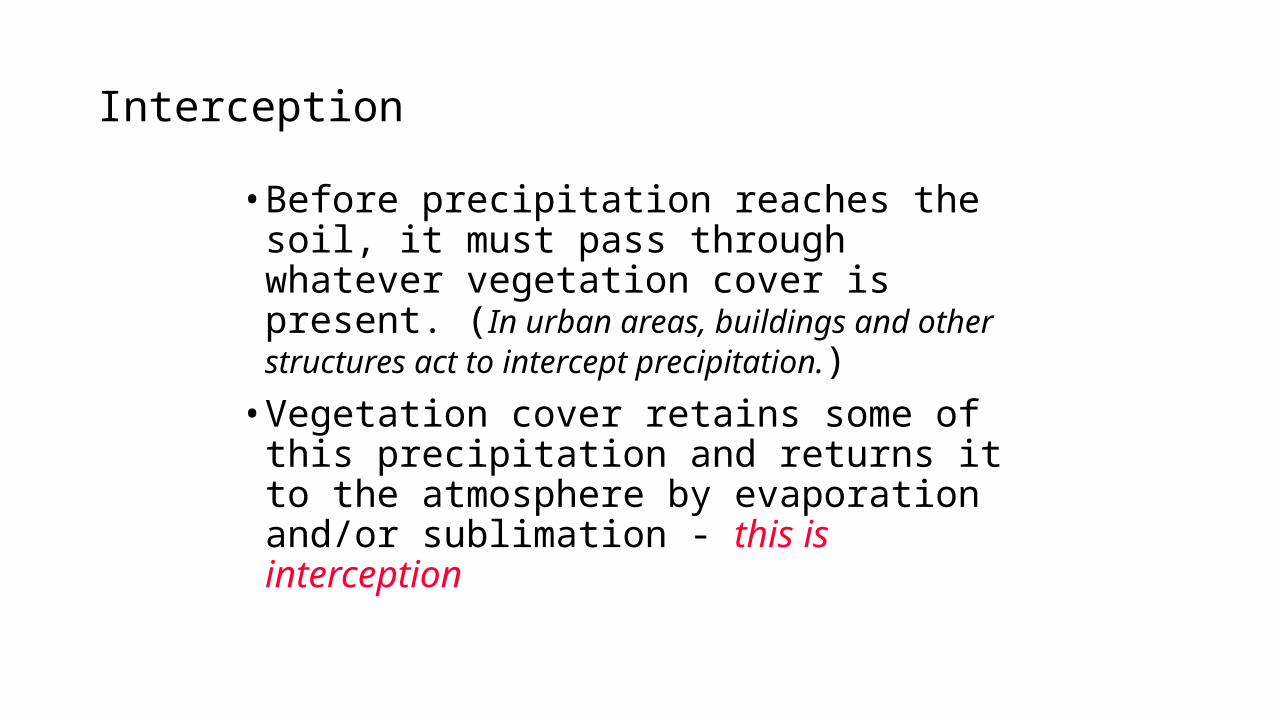
•Before precipitation reaches the soil, it must pass through whatever vegetation cover is present. (In urban areas, buildings and other structures act to intercept precipitation.)
•Vegetation cover retains some of this precipitation and returns it to the atmosphere by evaporation and/or sublimation - this is interception
Precipitation
Interception
ThroughfallStemflow
EvaporationTranspiration
Evaporation
Ocean
Lake Ground water
Overlandflow
Returnflow
InfiltrationRedistribution
Evaporation
Snow pack
Percolation
Capillaryrise
Depression storage
Interflow
Wetland
Plant uptake
Overland
flow
Soil water
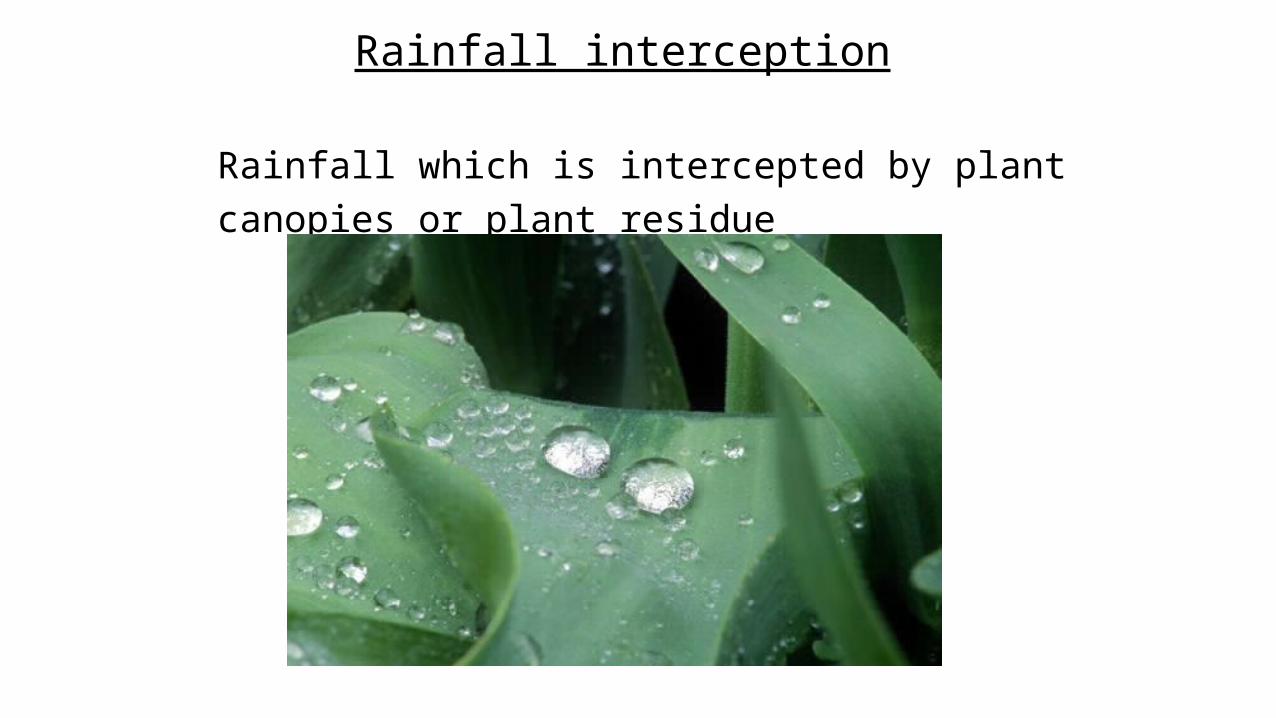
Rainfall interception
Rainfall which is intercepted by plant canopies or plant residue

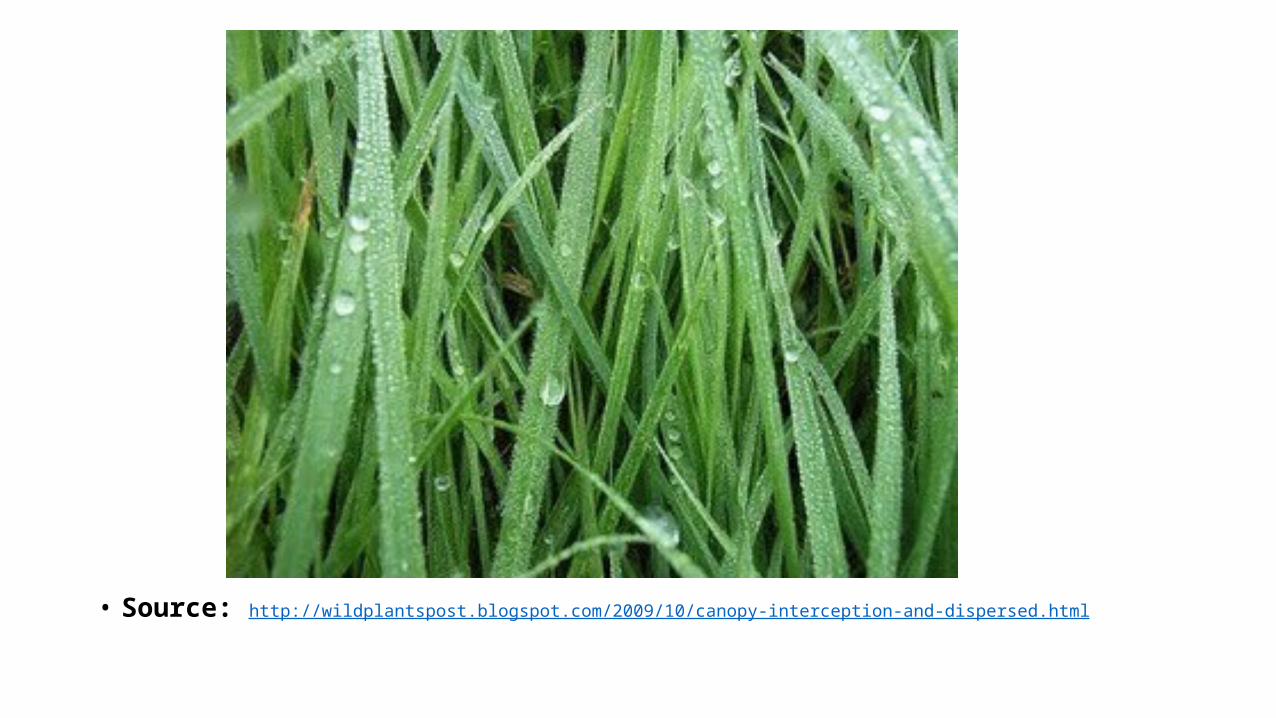
• Source: http://wildplantspost.blogspot.com/2009/10/canopy-interception-and-dispersed.html

• Source: http://www.livescience.com/10109-world-rainforests-act-rain-collecting-umbrellas.html

Pidwirny, M. (2006). "Interception, Stemflow, Canopy Drip, and Throughfall". Fundamentals of Physical Geography, 2nd Edition. Aug. 25, 2009. http://www.physicalgeography.net/fundamentals/8k.html

Rainfall interception•rain can fall directly through gaps in the canopy (throughfall), or it can hit the foliage and branches
•once the foliage has been completely wetted by the rain, droplets will begin to cascade down through the canopy
•water can drip off the canopy to the ground (throughfall) or can run down stems (stemflow)
•evaporative losses can occur from the canopy, or from vegetation at the forest floor (interception)

C
C
P
T
S
T
T
F
Components:
P = precipitationC = canopy interceptionF = forest floor interceptionT = throughfallS = stemflow
Itotal = F + C Itotal = P - (T + S)

Rain and snow interception
•Studies show that interception is proportional to canopy density or canopy height for both rain and snow
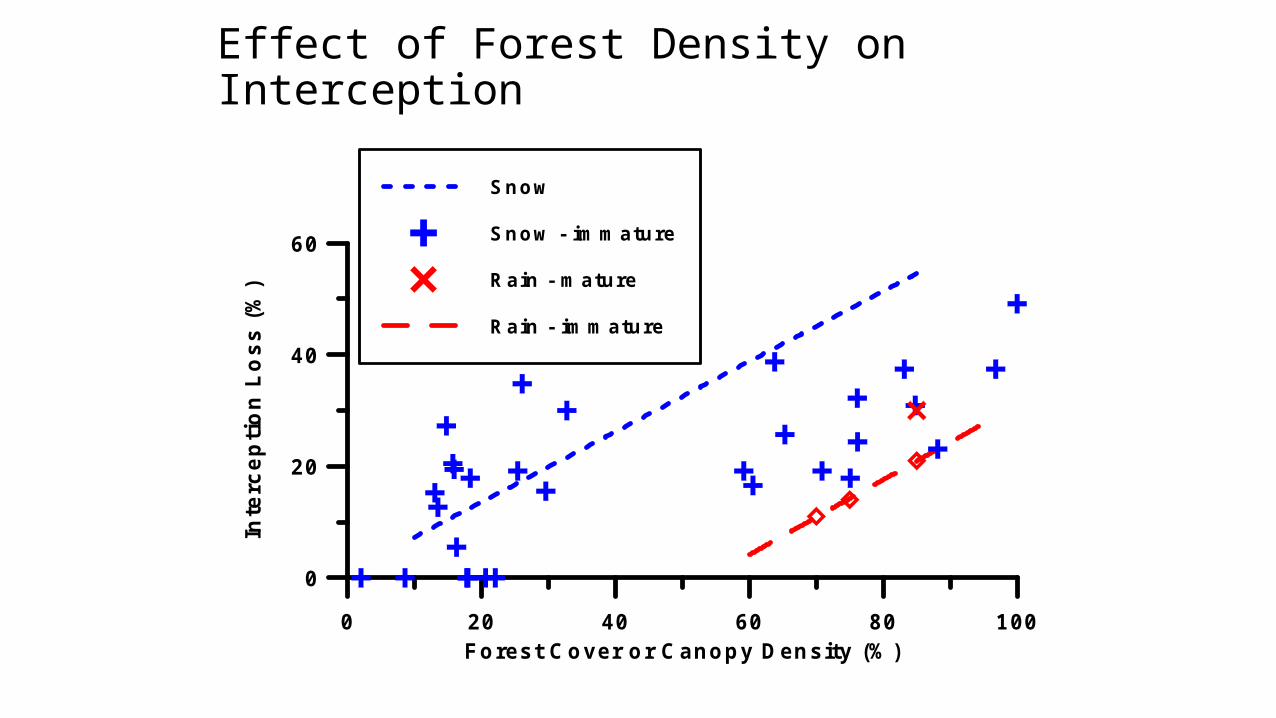
Effect of Forest Density on Interception
0 20 40 60 80 100Forest C over or C anopy D en sity (% )
0
20
40
60Intercep
tion Lo
ss (%
)
S now
S now - im m ature
R ain - m ature
R ain - im m ature
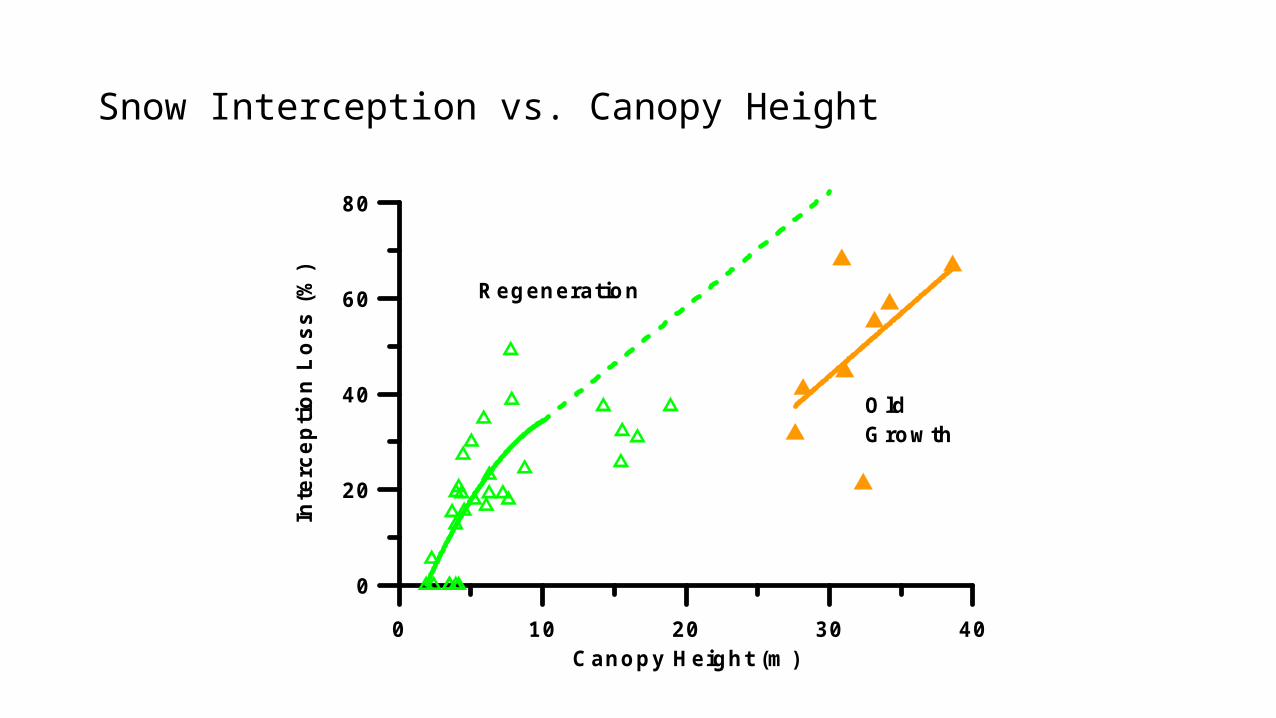
Snow Interception vs. Canopy Height
0 10 20 30 40C anopy H eight (m )
0
20
40
60
80
Intercep
tion Lo
ss (%
)R egeneration
O ldG row th

Effect of canopy structure
•Deciduous vs. coniferous: •interception is greater for coniferous than deciduous forests
(needles can hold more water than broad leaves)•conifers maintain foliage year-round
•Mature vs. immature:•rain interception greater for mature forest•snow interception is affected by stocking density as well as canopy structure in terms of tree form

So What's your decision?
•Forest harvesting always increases water available for runoff by decreasing interception•this increased availability can be in the order of 30-50% for newly harvested coastal sites
•Increases in peak flows•in rain dominated watersheds, or for spring storms, water yield and peak flow could be increased by 25-40% for a 100 mm storm

Transpiration•Transpiration is the transfer of soil moisture from the soil to the atmosphere by the action of vegetation.
•Transpiration has minimal effect on individual storms and is usually only taken into account in long-term hydrologic budgets.
•Evaporation and transpiration are commonly lumped in one variable called evapo-transpiration.

Transpiration•Transpiration is the loss of water from a plant by evaporation
•Water can only evaporate from the plant if the water potential is lower in the air surrounding the plant
•Most transpiration occurs via the leaves
•Most of this transpiration is via the stomata.
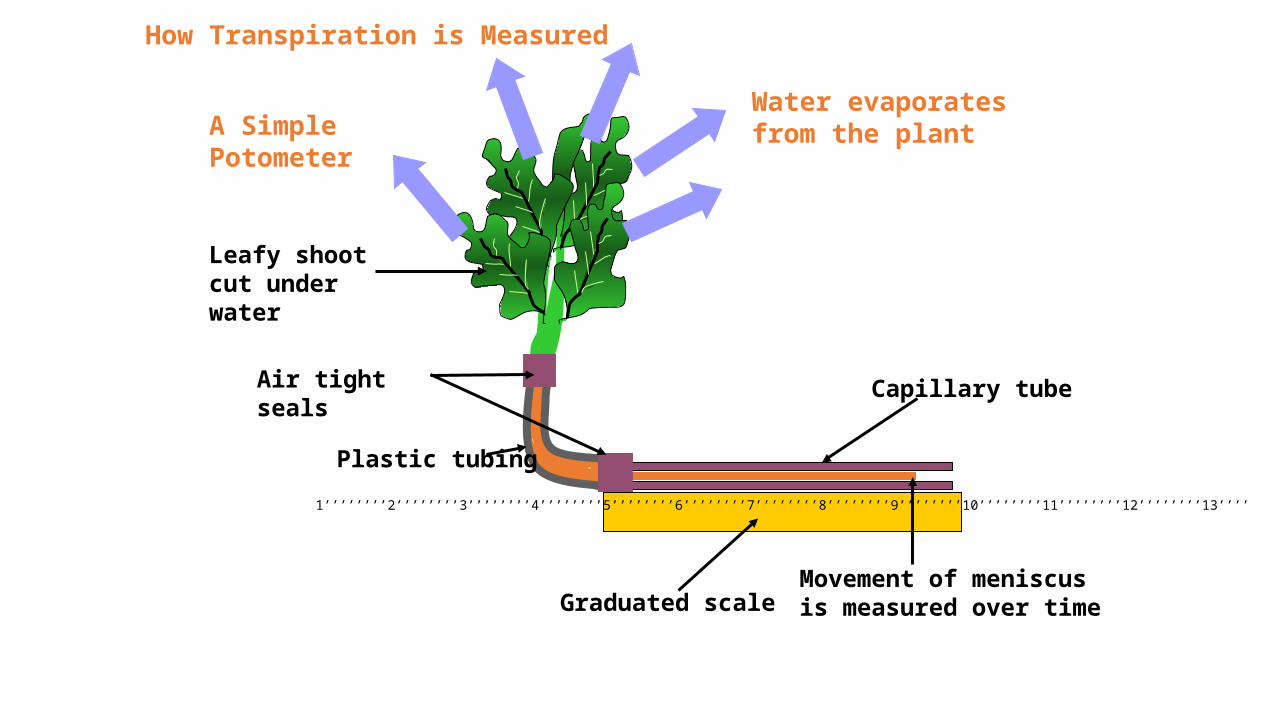
How Transpiration is Measured
A Simple Potometer
1’’’’’’’’2’’’’’’’’3’’’’’’’’4’’’’’’’’5’’’’’’’’6’’’’’’’’7’’’’’’’’8’’’’’’’’9’’’’’’’’10’’’’’’’’11’’’’’’’’12’’’’’’’’13’’’’
Air tight seals
Plastic tubing
Graduated scale
Capillary tube
Leafy shoot cut under water
Water evaporates from the plant
Movement of meniscus is measured over time

How Transpiration is Measured
1’’’’’’’’2’’’’’’’’3’’’’’’’’4’’’’’’’’5’’’’’’’’6’’’’’’’’7’’’’’’’’8’’’’’’’’9’’’’’’’’10’’’’’’’’11’’’’’’’’12’’’’’’’’13’’’’
The rate of water loss from the shoot can be measured under different environmental conditions volume of water
taken up in given timeLimitations
•measures water uptake
•plant has no roots so no resistance to water being pulled up
Water is pulled up through the plant

Environmental Factors Affecting Transpiration
1. Relative humidity:- air inside leaf is saturated (RH=100%). The lower the relative humidity outside the leaf the faster the rate of transpiration as the gradient is steeper
2. Air Movement:- increase air movement increases the rate of transpiration as it moves the saturated air from around the leaf so the gradient is steeper.
3. Temperature:- increase in temperature increases the rate of transpiration as higher temperature• Provides the latent heat of vaporisation• Increases the kinetic energy so faster diffusion• Warms the air so lowers the of the air, so
gradient is steeper

4. Atmospheric pressure:- decrease in atmospheric pressure increases the rate of transpiration.
5. Water supply:- transpiration rate is lower if there is little water available as transpiration depends on the mesophyll cell walls being wet (dry cell walls have a lower ). When cells are flaccid the stomata close.
6. Light intensity :- greater light intensity increases the rate of transpiration because it causes the stomata to open, so increasing evaporation through the stomata.
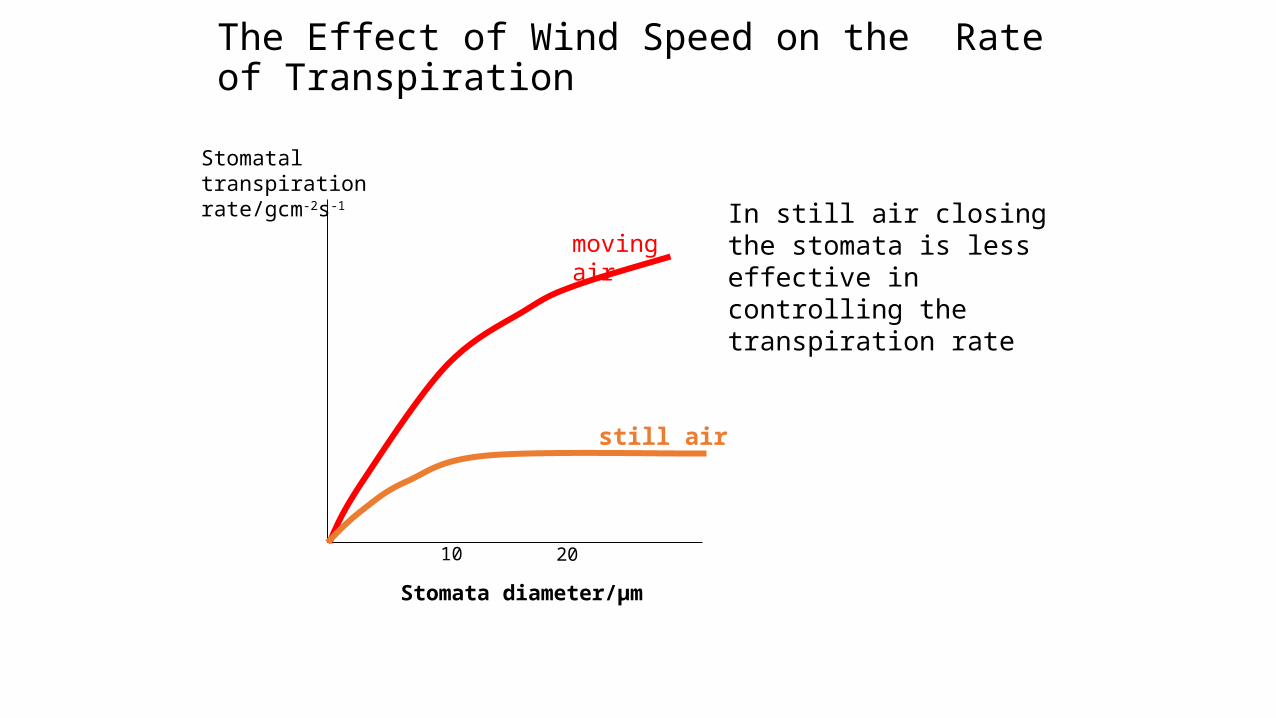
The Effect of Wind Speed on the Rate of Transpiration
Stomata diameter/µm10 20
Stomatal transpiration rate/gcm-2s-1 In still air closing
the stomata is less effective in controlling the transpiration rate
moving air
still air

Moving Air Removes the Boundary Layer of Water Vapour From the Leaf
Boundary layer
Saturated air accumulates around leaf
Still air Moving air
Lower
Water vapour is removed from the leaf surface
the pressure gradient is increased, so faster rate of water evaporation via the stomata
cross section through a leaf

Movement of Water Through the Stomata
H2O
Diffusion shells
Water moves from a higher (less negative) to a lower (more negative) water potential
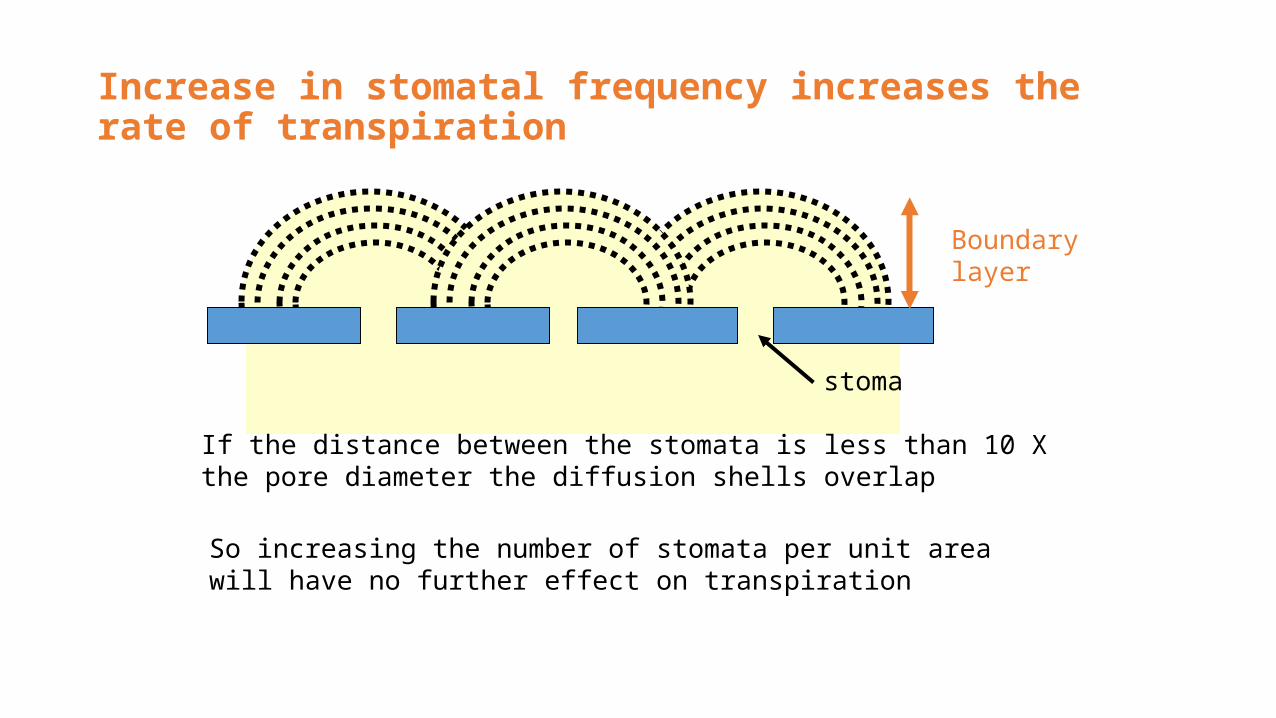
Increase in stomatal frequency increases the rate of transpiration
Boundary layer
If the distance between the stomata is less than 10 X the pore diameter the diffusion shells overlap
So increasing the number of stomata per unit area will have no further effect on transpiration
stoma

Thin outer wall
The guard cells control the opening and closing of the stomata
Guard cells flaccid
Stoma closed Stoma open
Guard cells turgid
Thick inner wall

Regulating Stomatal Opening:-the potassium ion pump hypothesis
Guard cells flaccid
Stoma closed
K+
K+
K+
K+
K+ K+
K+
K+
K+
K+ K+K+
K+ ions have the same concentration in guard cells and epidermal cellsLight activates K+ pumps which actively transport K+ from the epidermal cells into the guard cells

Regulating Stomatal Opening:-the potassium ion pump hypothesis
K+ K+K+
K+
K+ K+
K+
K+
K+
K+ K+K+
Increased concentration of K+ in guard cells
Lowers the pressure gradient in the guard cells
Water moves in by osmosis, down the pressure gradient
H2O
H2O
H2O
H2O
H2O

Stoma open
Guard cells turgid
K+
K+
K+
K+
K+
K+
K+K+
K+
K+
K+
K+
H2O
H2O
H2O H2O
H2O
H2O

Graph to show stomatal opening over 24 hours
12 2 4 6 8 10 12 2 4 6 8 10 12
stomatal opening/%
0
100
Dawn-stomata begin to open
Increased light intensity causes more stomata to open
Stomata close as the sun sets
Some plants close stomata during hottest time-saving waterAn adaptation to
hot dry environments

18.00
12.00
15.00
21.00
24.003.00
06.00
09.00
24h Cycle of Stomatal Opening and Closing

Internal factors affecting transpiration
1. Leaf area
2. Cuticle thickness
3. Number of stomata
4. Distribution of stomata
Water lost across whole leaf
waterproof layer
evaporation of water
upper surface more exposed to environment

Decisions based on rainfall data
•determine best site for planting particular species
•make decisions for the coming season based on rainfall averages
Precipitation, stream order and run off

Stream orderHeadwaters
Confluences
Image Credit: Developed by T. Endreny at SUNY ESF in the Department of Environmental Resources Engineering
Outlet
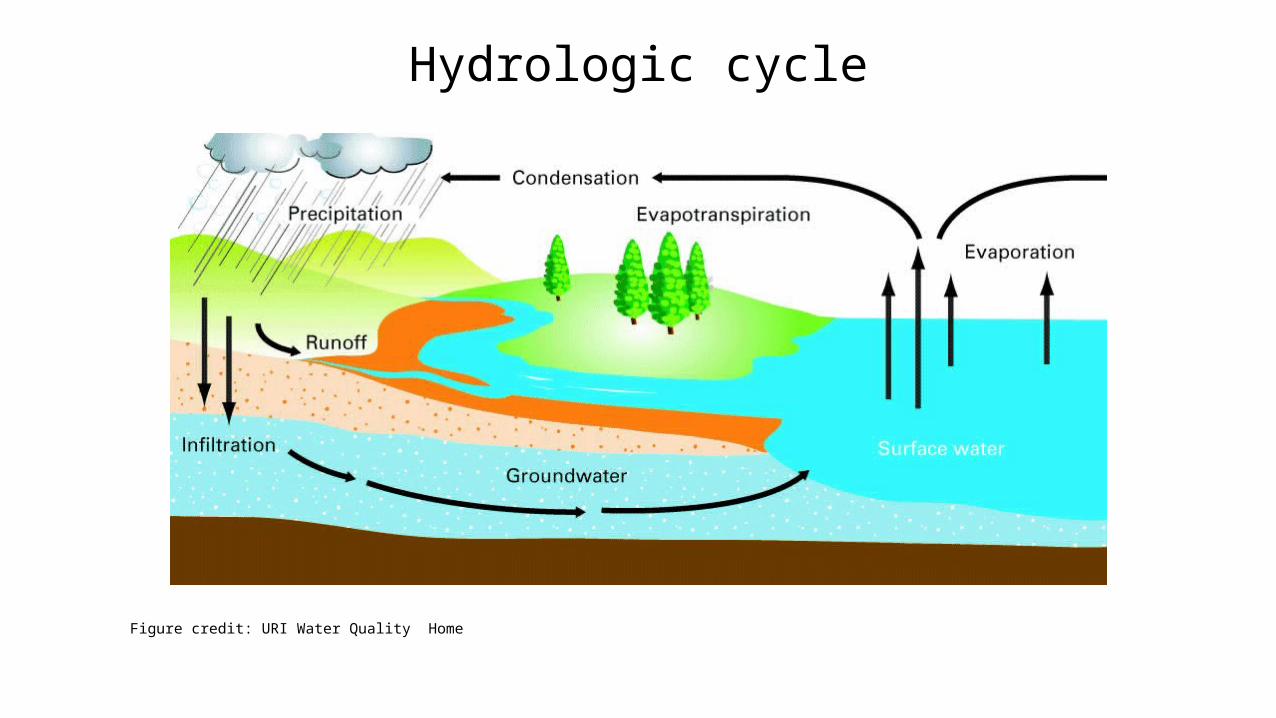
Hydrologic cycle
Figure credit: URI Water Quality Home
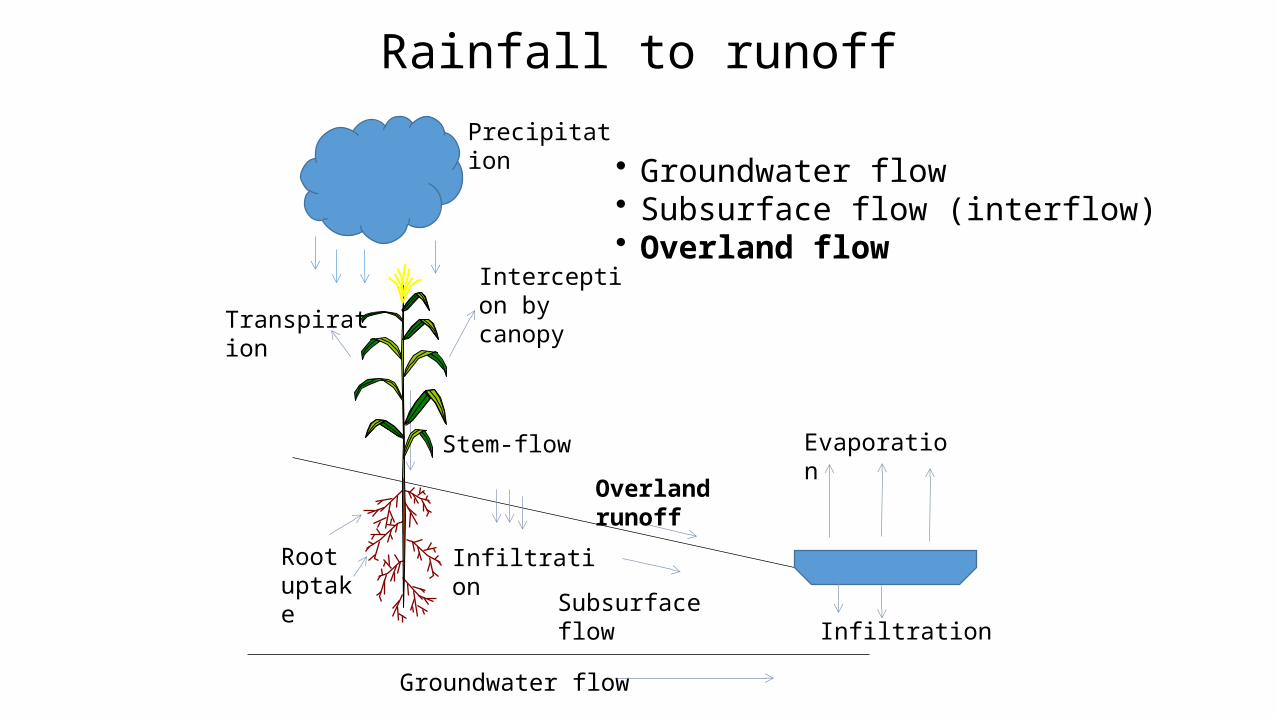
Rainfall to runoffPrecipitation
Interception by canopyTranspirat
ion
Infiltration
Root uptake
Overland runoff
Evaporation
Stem-flow
Subsurface flow Infiltration
Groundwater flow
• Groundwater flow• Subsurface flow (interflow)• Overland flow

Runoff pathways
Source: M. Ritter, The Physical Environment.
• Groundwater flow
• Subsurface flow (interflow)
• Overland flow

Source: M. Ritter, The Physical Environment.
Surface runoff is affected by . . .
Climate characteristics such as:
•Type of precipitation•Rainfall intensity•Rainfall duration•Rainfall distribution•Soil moisture

Surface runoff is affected by . . .
Physical characteristics such as: •Land use•Vegetation•Soil•Basin shape•Elevation•Slope•Topography•Drainage patterns
Source: M. Ritter, The Physical Environment.

Effects of development on runoffImage credit: Minnesota Center fro Environmental Advocacy

Effects of development on runoffImage credit: Minnesota Center fro Environmental Advocacy
Natural Landscape Low runoff High infiltration and recharge Healthy summer stream flow Natural pollutant treatment
Developed- High runoff, low recharge- Lower water tables- Low stream flow-Nuisance flooding

Measuring river runoffSteps: 1. Measure stream stage (height of water
surface).2. Measure discharge.3. Define relationship between stage and
discharge.
Image credit: Vermont EPSCoR CWDD , http://www.uvm.edu/~streams/index_old.php?Content=pages/2010_2011_Undergraduates
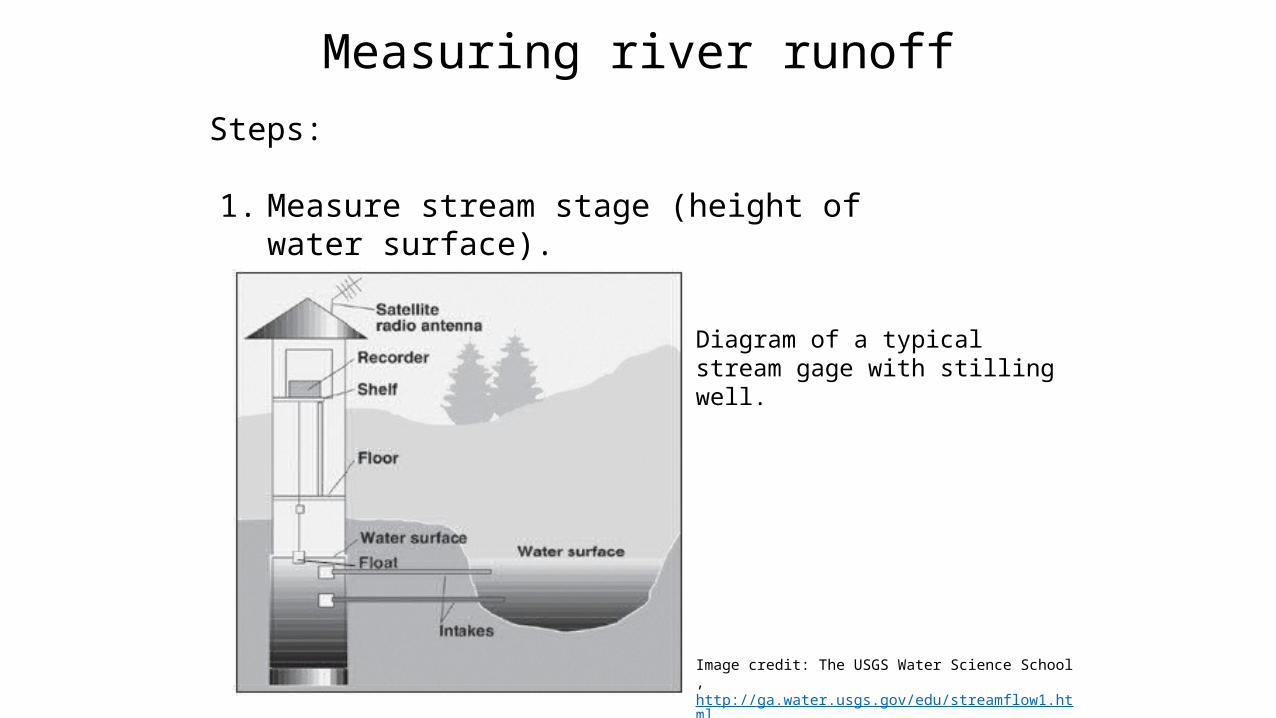
Measuring river runoffSteps: 1. Measure stream stage (height of
water surface).
Diagram of a typical stream gage with stilling well.
Image credit: The USGS Water Science School , http://ga.water.usgs.gov/edu/streamflow1.html

Measuring river runoffSteps: Measure discharge.Discharge = velocity * width * depth
Image cre dit: The USGS Wate r Scienc e School , http://ga .water.us gs.gov/ed u/stream flow2.htm l
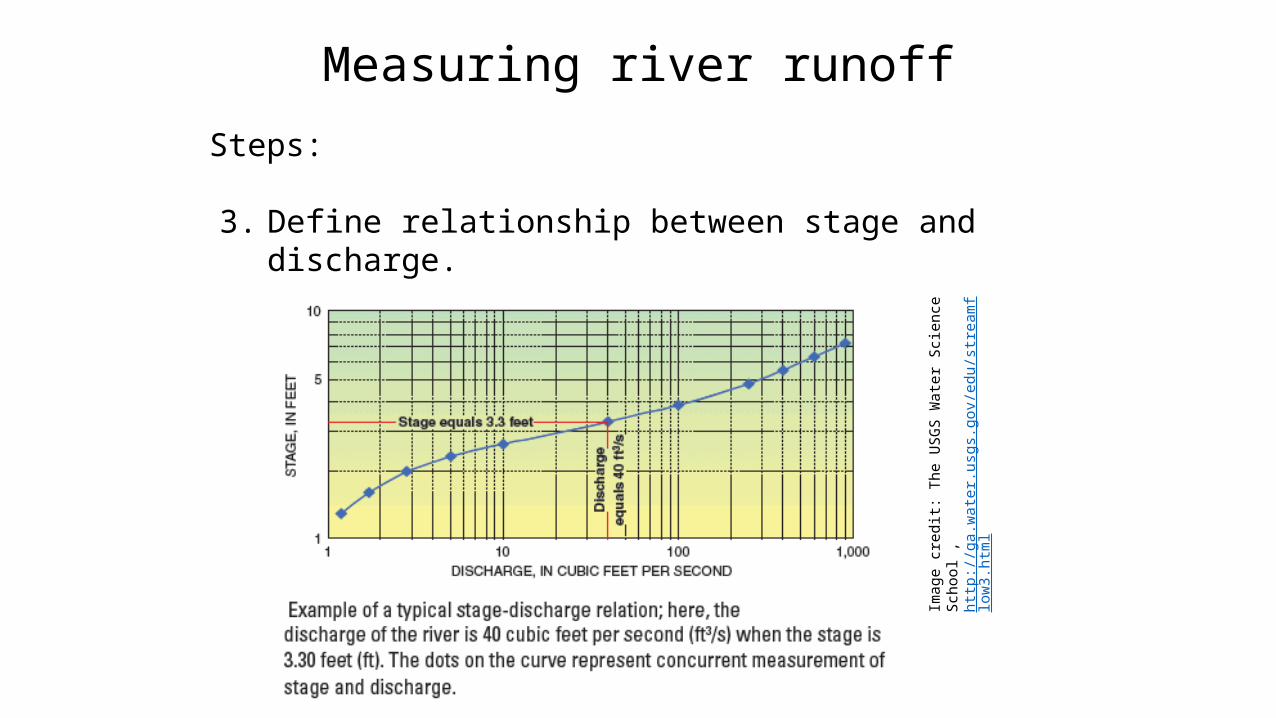
Measuring river runoffSteps: 3. Define relationship between stage and
discharge.
Imag
e cred
it: Th
e USGS
Water
Scien
ce
Scho
ol ,
http
://ga.
water.
usgs.g
ov/edu
/strea
mflow3
.html

Hydrograph• A way to look at the response of a watershed to hydrologic event
• Discharge (cms/cfs) vs. time
• Comprised of base flow and direct flow

Hydrograph pattern is the result of: Image cre dit: BBC: Intermed iate Geo graphy Ri versWatershed
characteristics
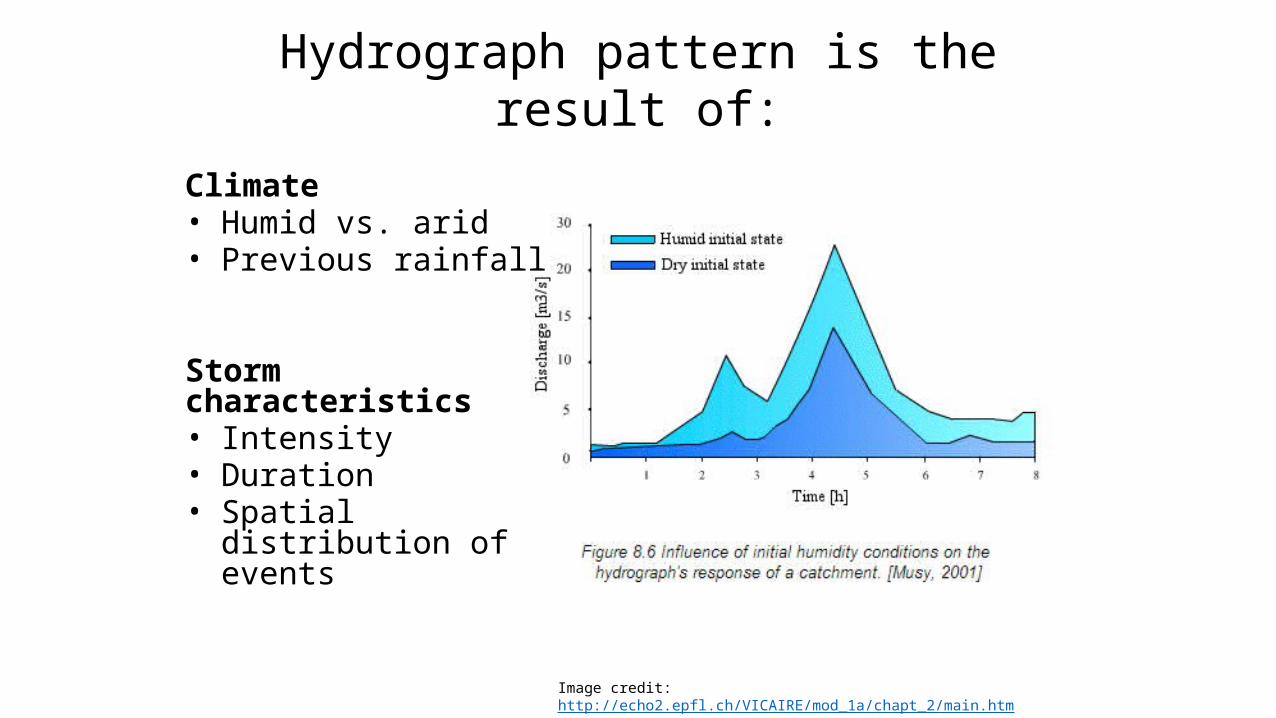
Hydrograph pattern is the result of:
Climate • Humid vs. arid• Previous rainfall
Storm characteristics• Intensity• Duration• Spatial distribution of events
Image credit: http://echo2.epfl.ch/VICAIRE/mod_1a/chapt_2/main.htm

Stream channel morphology
Image credit: Fisheries and Oceans Canada, http://www.pac.dfo-mpo.gc.ca/habitat/Glossary-glossaire-eng.htm

Stream morphology and stream health
Image credit: Vermont Water Quality Division

Influences how much water runs off
Influences how and where water runs off
Why does land use matter?

Ground Water and its contamination
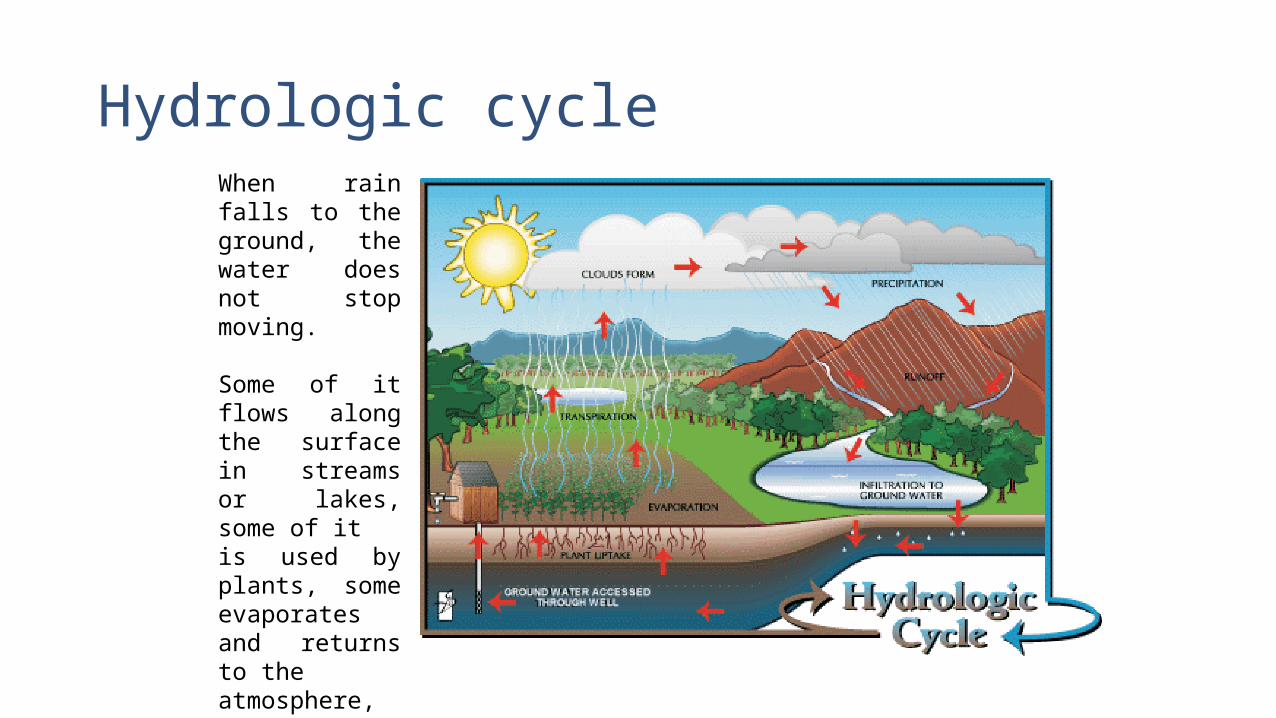
Hydrologic cycleWhen rain falls to the ground, the water does not stop moving.
Some of it flows along the surface in streams or lakes, some of itis used by plants, some evaporates and returns to theatmosphere, and some sinks into the ground

Groundwater flow
Groundwater is water that is found underground in cracks and spaces in soil, sand, and rocks. The area where water fills these spaces is called the saturated zone. The top of this zone is called the water table...just remember the top of the water is the table. The water table may be only a foot below the ground’s surface or it may be hundreds of feet down.Groundwater is stored in—and moves slowly through—layers of soil, sand, and rocks called aquifers. The speed at which groundwater flows depends on the size of the spaces in the soil or rock and how well the spaces are connected. Aquifers typically consist of gravel, sand, sandstone, or fractured rock like limestone. These materials are permeable because they have large connected spaces that allow water to flow through.
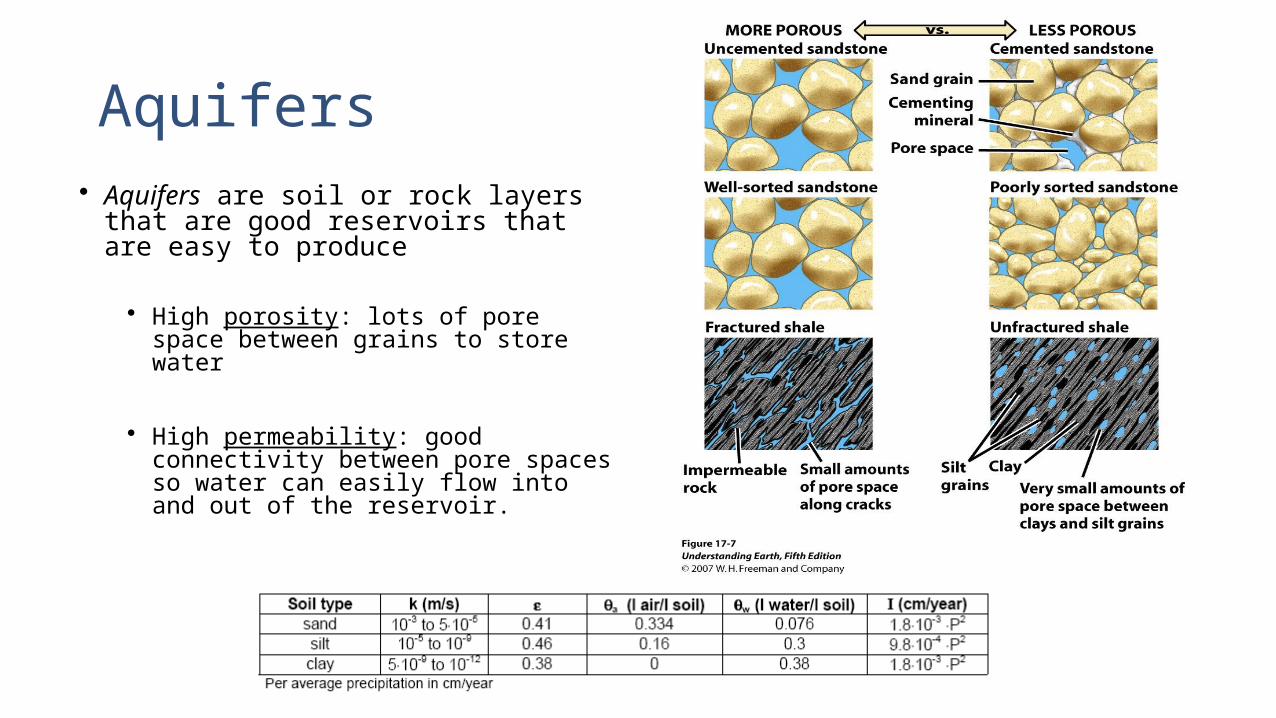
Aquifers Aquifers are soil or rock layers that are good reservoirs that are easy to produce
High porosity: lots of pore space between grains to store water
High permeability: good connectivity between pore spaces so water can easily flow into and out of the reservoir.

Above and below the water table The Water Table is the depth to the part of the soil
or rock that is saturated with water Storage capacity (also related to specific yield) is how much
water we can drain from an aquifer Saturated zone: a portion of the soil profile where
all pores are filled with water. Aquifers are located in this zone. There may be multiple saturation zones at different soil depths separated by layers of clay or rock.
Unsaturated zone: a portion of the soil profile that contains both water and air; the zone between the land surface and the water table. The soil formations do not yield usable amounts of freeflowing water. It is also called zone of aeration and vadose zone
Capillary Zone – the transition between vadose & phreatic (only a few cm thick, at most). Water can be “wicked” from phreatic to vadose zone. Deep phreatic zone can keep a shallower vadose zone productive in drought

The contamination of groundwater and soil

REFERENCES
• Introduction to Physical Hydrology, Martin R.
Hendricks
• Hydrology and Floodplain Analysis, Bedient, Huber
and Vieux
• Brooks, K. N. Ffolliot, P. F. and Magner, J. A.
(2012). Hydrology and the Management of
Watersheds, 4th Edition. ISBN: 978-0-470-96305-0
• Reddy, P. and Rami, J. (2014). A Text of
Hydrology/ third edition; ISBN:9789380856049.