Assessing the Impact of Demographic Characteristics on Spatial Error in Volunteered Geographic...
19
Assessing the impact of demographic characteristics on spatial error in volunteered geographic information features William F. Mullen • Steven P. Jackson • Arie Croitoru • Andrew Crooks • Anthony Stefanidis • Peggy Agouris Ó Springer Science+Business Media Dordrecht (outside the USA) 2014 Abstract The proliferation of volunteered geo- graphic information (VGI), such as OpenStreetMap (OSM) enabled by technological advancements, has led to large volumes of user-generated geographical content. While this data is becoming widely used, the understanding of the quality characteristics of such data is still largely unexplored. An open research question is the relationship between demographic indicators and VGI quality. While earlier studies have suggested a potential relationship between VGI quality and population density or socio-economic characteristics of an area, such relationships have not been rigorously explored, and mainly remained qualitative in nature. This paper addresses this gap by quantifying the relationship between demographic properties of a given area and the quality of VGI contributions. We study specifically the demographic characteristics of the mapped area and its relation to two dimensions of spatial data quality, namely positional accuracy and completeness of the corre- sponding VGI contributions with respect to OSM using the Denver (Colorado, US) area as a case study. We use non-spatial and spatial analysis techniques to identify potential associations among demographics data and the distribution of positional and complete- ness errors found within VGI data. Generally, the results of our study show a lack of statistically significant support for the assumption that demo- graphic properties affect the positional accuracy or completeness of VGI. While this research is focused on a specific area, our results showcase the complex nature of the relationship between VGI quality and demographics, and highlights the need for a better understanding of it. By doing so, we add to the debate of how demographics impact on the quality of VGI data and lays the foundation to further work. Keywords Volunteered geographic information Á OpenStreetMap Á Spatial analysis Á Spatial data quality Á Demographics W. F. Mullen (&) Á S. P. Jackson Á A. Croitoru Á A. Stefanidis Á P. Agouris Department of Geography and GeoInformation Science, George Mason University, 4400 University Drive, MS 6C3, Fairfax, VA 22030-4444, USA e-mail: [email protected] A. Croitoru e-mail: [email protected] A. Stefanidis e-mail: [email protected] P. Agouris e-mail: [email protected] A. Crooks Department of Computational Social Science, Krasnow Institute for Advanced Study, George Mason University, 4400 University Drive, MS 6B2, Fairfax, VA 22030-4444, USA e-mail: [email protected] 123 GeoJournal DOI 10.1007/s10708-014-9564-8
Transcript of Assessing the Impact of Demographic Characteristics on Spatial Error in Volunteered Geographic...
Assessing the impact of demographic characteristicson spatial error in volunteered geographic informationfeatures
William F. Mullen • Steven P. Jackson •
Arie Croitoru • Andrew Crooks •
Anthony Stefanidis • Peggy Agouris
� Springer Science+Business Media Dordrecht (outside the USA) 2014
Abstract The proliferation of volunteered geo-
graphic information (VGI), such as OpenStreetMap
(OSM) enabled by technological advancements, has
led to large volumes of user-generated geographical
content. While this data is becoming widely used, the
understanding of the quality characteristics of such
data is still largely unexplored. An open research
question is the relationship between demographic
indicators and VGI quality. While earlier studies have
suggested a potential relationship between VGI
quality and population density or socio-economic
characteristics of an area, such relationships have not
been rigorously explored, and mainly remained
qualitative in nature. This paper addresses this gap
by quantifying the relationship between demographic
properties of a given area and the quality of VGI
contributions. We study specifically the demographic
characteristics of the mapped area and its relation to
two dimensions of spatial data quality, namely
positional accuracy and completeness of the corre-
sponding VGI contributions with respect to OSM
using the Denver (Colorado, US) area as a case study.
We use non-spatial and spatial analysis techniques to
identify potential associations among demographics
data and the distribution of positional and complete-
ness errors found within VGI data. Generally, the
results of our study show a lack of statistically
significant support for the assumption that demo-
graphic properties affect the positional accuracy or
completeness of VGI. While this research is focused
on a specific area, our results showcase the complex
nature of the relationship between VGI quality and
demographics, and highlights the need for a better
understanding of it. By doing so, we add to the debate
of how demographics impact on the quality of VGI
data and lays the foundation to further work.
Keywords Volunteered geographic information �OpenStreetMap � Spatial analysis � Spatial data
quality � Demographics
W. F. Mullen (&) � S. P. Jackson � A. Croitoru �A. Stefanidis � P. Agouris
Department of Geography and GeoInformation Science,
George Mason University, 4400 University Drive,
MS 6C3, Fairfax, VA 22030-4444, USA
e-mail: [email protected]
A. Croitoru
e-mail: [email protected]
A. Stefanidis
e-mail: [email protected]
P. Agouris
e-mail: [email protected]
A. Crooks
Department of Computational Social Science, Krasnow
Institute for Advanced Study, George Mason University,
4400 University Drive, MS 6B2, Fairfax, VA 22030-4444,
USA
e-mail: [email protected]
123
GeoJournal
DOI 10.1007/s10708-014-9564-8
Introduction
Recent years have been characterized by a significant
shift in the way geographic information is produced,
specifically through the rise of volunteered geographic
information (VGI; Goodchild 2007), which has been
fueled through Web 2.0 technologies (Hudson-Smith
et al. 2009). While this shift has resulted in an increase
in the volume and richness of geographic data, it is also
posing some significant challenges with respect to
evaluating the quality of such data. The fact that
volunteers with minimal (if any) geographic training
are contributing such information (Mooney et al. 2010),
as well as the mechanisms that govern the contribution
process, brings to question the quality of such data (Sui
2008). An exemplar of this trend is OpenStreetMap
(OSM), an open source collaborative mapping project
that aims to generate an editable global map database
(Mooney and Corcoran 2012). Earlier studies address-
ing the quality, in particular positional accuracy, of
VGI with respect to OSM have pointed out the lack of
homogeneity (e.g. Hochmair and Zielstra 2013; Kouk-
oletsos et al. 2012). In order to understand these issues,
researchers have explored the relationship of VGI data
and its quality with various geographical and demo-
graphic indicators. Studies addressing the relation
between population density and VGI have indicated
that in densely populated urban areas more contribu-
tions can be expected, which may ultimately lead to
higher quality (Haklay 2010). At the same time, Girres
and Touya (2010) noted that population density is not
the only factor controlling the positional accuracy of
VGI, indicating that areas with higher income and
younger population are characterized by higher number
of contributions. Further efforts to identify discernible
spatial patterns in VGI quality (e.g. by comparing the
topology of volunteered road network data and com-
mercially available data) did not find statistically
significant correlation (Neis et al. 2011).
A common assertion that has emerged from such
studies is that the demographic characteristics of the
contributing volunteers may impact the distribution of
the positional and shape errors in VGI (Fairbairn and
Al-Bakri 2013). Certain demographic indicators that
have been explicitly suggested as potentially contrib-
uting to data quality patterns, include race and
economic status (e.g. Tulloch 2008; Elwood 2008;
Graham 2005; Zook and Graham 2007a, b; Crutcher
and Zook 2009). However, these earlier studies were
primarily qualitative in nature and were not accom-
panied by rigorous quantitative analyses. Motivated
by this gap, this paper aims to examine the quantitative
relationships between VGI quality—in particular
positional accuracy and completeness—and demo-
graphic properties. We do so through a case study in
Denver, Colorado (CO), where we use VGI data and
contrast it with local demographics from the United
States (US) Census Bureau. The remainder paper is
organized as follows: in section ‘‘Background and
motivation’’ we provide background information with
respect to the demographic characteristics of VGI. In
section ‘‘Data and methods’’ we present the back-
ground and rationale for our approach to assess the
impact of demographic variation on the quality of
VGI. In section ‘‘Results and discussion’’ we present
the results of our analysis, and conclude with our
summary and outlook in section ‘‘Discussion’’.
Background and motivation
When attempting to assess the quality of VGI content
we need to be cognizant of the particular nature of the
volunteering process that differentiates VGI contribu-
tions from the traditional and established processes
through which geographical data had been collected.
While VGI was enabled by technological advance-
ments, it gained popularity primarily because it
addressed the general public’s growing need to access
geographical data for a constantly increasing array of
activities. This is the reason why OSM, the prototyp-
ical example of VGI, emerged and grew in the United
Kingdom, where geographical data were not as freely
distributed by government agencies (Haklay and
Weber 2008). In contrast, the US government policy
has leaned more towards openly sharing much of its
geographical data. Up to this point, efforts to assess the
quality of OSM content have focused primarily on road
networks, as OSM was intended after all to be a ‘street
map’. Such studies have compared for example OSM
road data to a reference data set, in order to assess OSM
relative to an authoritative standard such as the U.K.
Ordnance Survey road network data sets or comparable
products (Brown and Pullar 2012; Haklay 2010;
Hochmair and Zielstra 2013; Koukoletsos et al. 2012;
Neis and Zipf 2012; Neis et al. 2011). However, as
OSM has evolved well beyond streets we are now in
need to assess the accuracy of other types of features as
GeoJournal
123
well, in order to gain a more thorough understanding of
quality issues with respect to VGI. This need is further
emphasized by the fact that large volumes of road data
(e.g. TIGER/line files), which were made freely
available by the U.S. Census, have been bulk-uploaded
into OSM since 2009 (OSM 2013b). Accordingly, road
content in OSM (especially in the US) does not
comprise solely VGI contributions, but a hybrid
aggregate of VGI and authoritative data. Therefore, a
study of non-road features (especially ones that do not
include bulk uploads of authoritative content) will
complement the current body of work and enhance our
understanding of the accuracy of OSM contributions,
and this is one of the contributions of this paper.
Furthermore, there is a lack of understanding with
respect to the spatially-driven motivations for VGI
contributions: why do people contribute for some
areas and not others? For example Zielstra and Zipf
(2010) contrasted the differences between VGI and
commercial data sources in Germany against popula-
tion density, noting that the completeness of the VGI
degraded considerably as the distance from the urban
core increased. Conversely, rural areas with low
population densities are less likely to attract VGI
contributions. However, our understanding of how this
participation varies among locations with similar
population density remains largely unexplored. For
example, Goodchild and Li (2012) found that Linus’
Law is not as effective for geographic facts as it is for
other information like Wikipedia, and that population
density alone is not sufficient to explain the trends in
the data error. A study of the quality of contributions
as it relates to the demographics of the place will
therefore advance our understanding of the relation
between population characteristics and VGI quality,
and this is the second contribution of this paper. In the
following two subsections we provide review of
accuracy and completeness in the context of OSM
(section ‘‘Positional accuracy and completeness in
OSM’’), followed by a discussion of the characteristics
of the contributors to VGI—both in terms of their
motivation and their demographics (section ‘‘The
motivation to contribute to open source initiatives’’).
Positional accuracy and completeness in OSM
In the context of this paper the term accuracy is used to
refer to positional accuracy, namely the closeness of
the coordinate values of a VGI feature (e.g. a point) to
its corresponding authoritative equivalent feature
based Euclidian distance. The term completeness
refers to the extent to which features are included or
omitted from a dataset, again in comparison to the
authoritative equivalent. In that sense, if one were to
consider schools, accuracy would refer to how close a
VGI record of a school is to its corresponding
authoritative record, whereas completeness would
refer to the percentage of schools that have been
mapped in a VGI dataset. Both terms are indicators of
the overall quality of a dataset, a term which in this
paper is used to refer to the overall fitness for use of a
dataset.
Past efforts to assess the quality of VGI contri-
butions have primarily focused on positional accu-
racy. Haklay (2010) compared OSM data and the
United Kingdom’s (UK) Ordnance Survey road
centerline data, finding that OSM data road center-
lines are displaced on average by 5.83 m for selected
areas within London. Girres and Touya (2010)
compared French road data and reported an average
displacement of 6.65 m, which is consistent with
Haklay (2010). These studies however, did not
examine any spatial variations of accuracy. In an
effort to address this issue, Al-Bakri and Fairbairn
(2010) performed a localized study in the UK,
assessing the accuracies of nodes and linear seg-
ments of polygonal VGI entries. They found that
node accuracy degraded between urban and the more
rural ‘peri-village’ areas, noting errors of 9.6 and
11.0 m respectively. For linear segments, the authors
measured an average displacement from the sur-
veyed results of 1.5 m using uniformity of buffers
established for both the reference and OSM data.
The spatial heterogeneity of VGI errors was also
pointed out by other researchers who noted that
inaccuracies were often localized to specific areas
(e.g. Girres and Touya 2010; Haklay 2010; Zielstra
and Zipf 2010). In an effort to understand these
accuracy variations, Haklay et al. (2010) showed that
there was no observable correlation between the
number of contributors and quality of VGI data once
that number reaches a certain level. Considering the
lack of discernible spatial patterns of accuracy
variations, the research community turned its atten-
tion to the motivation behind VGI contributions, as a
potential explanation for these variations.
GeoJournal
123
The motivation to contribute to open source
initiatives
Open source initiatives exceed the purview of the
geographical community, with similar efforts seen in a
very broad range of activities, ranging for example,
from Wikipedia and open source software develop-
ment projects to citizen science. Nevertheless, regard-
less of the topic, there exist certain general motivating
factors that drive participation in such efforts. For
example, Oreg and Nov (2008) identified the three
primary motivational elements for contribution,
ranked by priority of importance, as: self-develop-
ment, altruism, and reputation building. Kuznetzov
(2006) argued that for Wikipedia, perhaps the ‘poster
child’ for crowdsourcing efforts, the key motivation is
a sense of community and accomplishment. Vickery
and Wunsch-Vincent (2007) noted that the motiva-
tions driving these contributions of user-generated
content are primarily technological, social, economic,
and institutional or legal considerations. In essence, if
it’s not difficult, illegal, or inconvenient to contribute
the information and there is some motivation in the
form of intrinsic social or economic return achieved by
the contributor, then there will be information con-
tributed (Nov et al. 2011).
While the above drives public participation, the
very nature of public participation introduces biases in
volunteered content. These biases result in variations
in the patterns of contribution and the accuracy of the
contributed content itself. Such biases stem from four
key areas: Internet access, knowledge of language,
available time, and adequate technical capability to
support the editing functions required of the contrib-
utors (Holloway et al. 2007). As these areas are closely
associated with demographic properties, it is only
natural to move towards studying VGI content relative
to the corresponding demographic information of an
area, which is a direction that we pursue in this paper.
This is also consistent with earlier work by Porter and
Donthu (2006) and Longley and Singleton (2009),
who also identified the correlation between Internet
usage and several demographic indicators (e.g. age,
education, income and race).
When we consider the above under the lens of VGI
contributions in particular, an argument emerges about
the relation between VGI contributions and demo-
graphics. Elwood et al. (2013) note that differences in
social processes associated with VGI can impact the
content and quality of the contributed data. Studies of
OSM contributions have also noted that as the
population density decreases so do OSM contributions
(e.g. Zielstra and Zipf 2010; Girres and Touya 2010;
Haklay 2010; Zielstra and Zipf 2010). However,
population density itself is not the only factor affecting
content and quality (Girres and Touya 2010; Schmidt
and Klettner 2013) as it is not uncommon to have
information gaps in highly populated areas (Cipeluch
et al. 2010). Girres and Touya (2010) and Haklay
(2010) noted a significant decrease in contributions for
areas that were economically deprived or disadvan-
taged. This suggests that socioeconomic factors, such
as income and educational achievement may affect
OSM contributions, leading to complex spatial pat-
terns of participation (Elwood 2008, 2009; Ghose and
Elwood 2003; Sieber 2006; Tulloch 2008). Graham
(2005) along with Zook and Graham (2007a, b) noted
similar impacts as spatial queries and ‘software-
sorting’ techniques influenced by cultural differences
which can create or enhance a bias in digital presen-
tation or ‘perception’ of a place. Furthermore, Crut-
cher and Zook (2009), in a study of geographical data
in the context of reporting the impacts of the 2005
Hurricane Katrina in New Orleans, Louisiana, stated
that racial inequities were a key factor affecting access
and use of digital technologies. However, while there
have been a number of suggestions regarding the
impact of the demographic element on the contribu-
tion patterns and quality of VGI data, this direction
remains understudied, and in this paper we make a
contribution by addressing this issue.
Data and methods
The problem of exploring possible relationships
between population demographics and VGI quality
gives rise to significant challenges, both in terms of the
required data and in terms of the analysis methods that
are utilized. In terms of data, the study of demograph-
ics and VGI quality requires the availability of detailed
demographics data that can be spatially related to a
given study area. At the same time, it is also necessary
derive VGI quality measures for the same study area.
To derive such measures both VGI and reference data
are required so that both positional accuracy and
completeness could be calculated. At the analysis
level, several key aspects should be considered. First,
GeoJournal
123
the derivation of VGI quality measures requires a
reliable method for conflating (i.e. matching geo-
graphic features between) the VGI data and the
reference data. Second, as the possible relations
between demographics and VGI quality can be
considered as both non-spatial and spatial phenomena,
both non-spatial and spatial analysis methods should
be applied. When studied as a spatial phenomenon, the
possible relations between demographics and VGI
quality can emerge both at the local and the global
geographic scales, requiring both types of spatial
analysis. Finally, the high multidimensionality of
demographics data and its type heterogeneity (e.g.
data can include ranked-scale variables or interval-
scale variables) requires both the ability to reduce such
dimensionality and account for the various data scales.
In view of these challenges, it is necessary to employ
multiple data sources as well as an array of both non-
spatial and spatial analysis methods. An overview of
the data sources used in this study as well as the
workflow that combines the different analysis steps
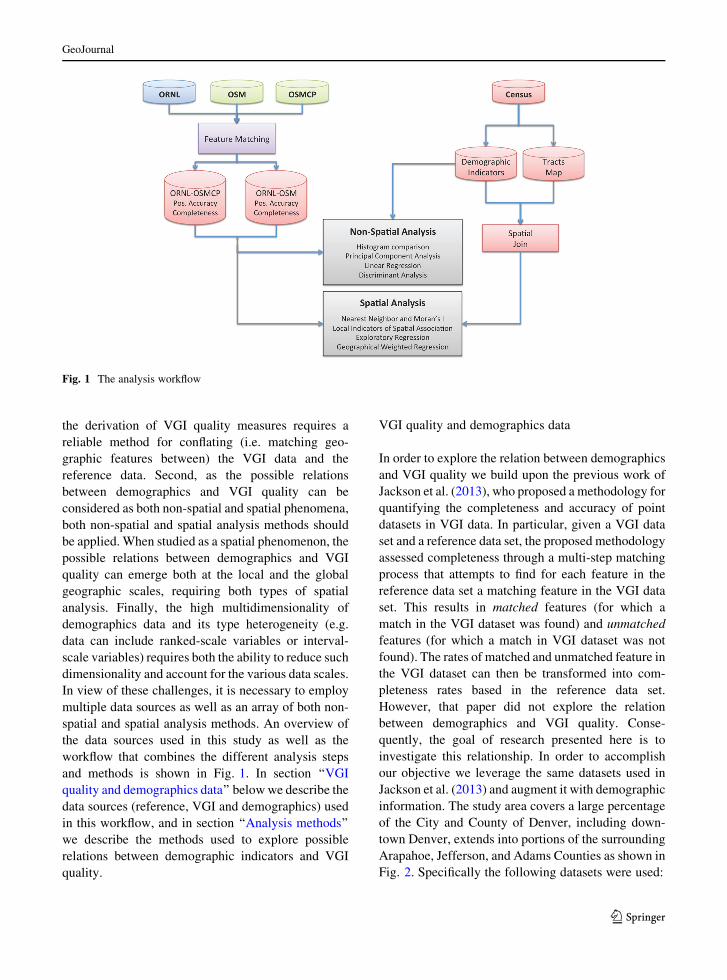
and methods is shown in Fig. 1. In section ‘‘VGI
quality and demographics data’’ below we describe the
data sources (reference, VGI and demographics) used
in this workflow, and in section ‘‘Analysis methods’’
we describe the methods used to explore possible
relations between demographic indicators and VGI
quality.
VGI quality and demographics data
In order to explore the relation between demographics
and VGI quality we build upon the previous work of
Jackson et al. (2013), who proposed a methodology for
quantifying the completeness and accuracy of point
datasets in VGI data. In particular, given a VGI data
set and a reference data set, the proposed methodology
assessed completeness through a multi-step matching
process that attempts to find for each feature in the
reference data set a matching feature in the VGI data
set. This results in matched features (for which a
match in the VGI dataset was found) and unmatched
features (for which a match in VGI dataset was not
found). The rates of matched and unmatched feature in
the VGI dataset can then be transformed into com-
pleteness rates based in the reference data set.
However, that paper did not explore the relation
between demographics and VGI quality. Conse-
quently, the goal of research presented here is to
investigate this relationship. In order to accomplish
our objective we leverage the same datasets used in
Jackson et al. (2013) and augment it with demographic
information. The study area covers a large percentage
of the City and County of Denver, including down-
town Denver, extends into portions of the surrounding
Arapahoe, Jefferson, and Adams Counties as shown in
Fig. 2. Specifically the following datasets were used:
Fig. 1 The analysis workflow
GeoJournal
123

Oak Ridge National Laboratory (ORNL) data,
which geographically located a Department of
Education list of schools using the street address
information. The ORNL data locates a point for
each school at the street address.
School locations from the Points of Interest (POI)
layer of OSM. The POI layer represents each
specific feature as a node. In OSM, it is common
practice to represent area features as points (Over
et al. 2010) and the guidelines provided within OSM
indicate that the node should be placed in the middle
of the site (OSM 2013a).
Data from the United States Geological Survey
(USGS) OSM Collaborative Project (OSMCP—
2nd Phase; Poore et al. 2012).
We consider the ORNL data as the authoritative
dataset in our analysis while the remaining two
Fig. 2 The study area
GeoJournal
123
datasets represent different types of VGI data. The
OSM POI school data represents ‘classic’ VGI while
the OSMCP dataset represents a variant of VGI data in
the sense that it introduces limited authoritative
oversight to the VGI process, in the form or peer-
developed quality control feedback to the volunteers
(e.g. university students) as well as USGS feedback
(Poore et al. 2012). This is part of a larger effort by the
USGS to augment the National Map (2014) with VGI
data pertaining to manmade structures (e.g. schools,
hospitals, post offices, police stations etc.). As one
might expect, the OSMCP effort would likely fall in
the Expert Professionals range of the scale proposed
by Coleman et al. (2009) since the final review of the
data is conducted by USGS personnel. This has also
been shown in Jackson et al. (2013), who indicated
that OSMCP data was of higher quality both in terms
of completeness and positional accuracy compared to
OSM data.
In order to assess the relationship between demo-
graphics and VGI quality the above-mentioned data-
sets were augmented with demographic data. Such
data can be drawn from census and provide us with the
respective characteristic properties (e.g. age, race,
ethnicity, economic status, or gender) of the popula-
tion under study (McKechnie 1983) at a specific point
in time. In the US, the US Census Bureau has the
responsibility to compile and publish the official
demographic data, including conducting the decennial
Census, at a variety of spatial scales (with Census
blocks being the finest). Within our study we use
Census tracts rather than Census blocks, as the latter
lacks certain demographic information (e.g. ethnicity)
due to privacy concerns. For example, the Census
blocks could potentially lead to identification of
individual households or businesses (US Census
Bureau 2012). At the Census tract level demographic
information such as: age, sex, education, employment,
ethnicity, immigration, income, marital status, popu-
lation, poverty level, and race are made available
through a spatial join operation. Consequently, census
tract data provides us with a rich source of georefer-
enced demographic data, which we can use for
assessing how demographics impact on the quality
of VGI data. As discussed above, prior research
suggests that four broad demographic categories (i.e.
population, economic status, educational achieve-
ment, and race/ethnicity) should be used to assess
the impact of demographics on VGI accuracy and
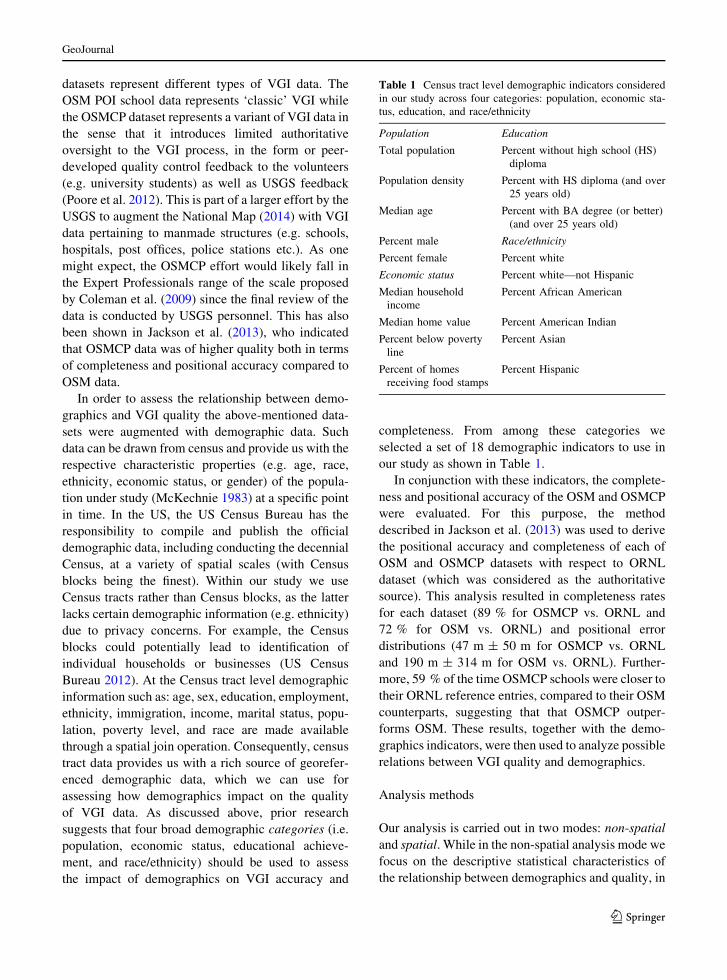
completeness. From among these categories we
selected a set of 18 demographic indicators to use in
our study as shown in Table 1.
In conjunction with these indicators, the complete-
ness and positional accuracy of the OSM and OSMCP
were evaluated. For this purpose, the method
described in Jackson et al. (2013) was used to derive
the positional accuracy and completeness of each of
OSM and OSMCP datasets with respect to ORNL
dataset (which was considered as the authoritative
source). This analysis resulted in completeness rates
for each dataset (89 % for OSMCP vs. ORNL and
72 % for OSM vs. ORNL) and positional error
distributions (47 m ± 50 m for OSMCP vs. ORNL
and 190 m ± 314 m for OSM vs. ORNL). Further-
more, 59 % of the time OSMCP schools were closer to
their ORNL reference entries, compared to their OSM
counterparts, suggesting that that OSMCP outper-
forms OSM. These results, together with the demo-
graphics indicators, were then used to analyze possible
relations between VGI quality and demographics.
Analysis methods
Our analysis is carried out in two modes: non-spatial
and spatial. While in the non-spatial analysis mode we
focus on the descriptive statistical characteristics of
the relationship between demographics and quality, in
Table 1 Census tract level demographic indicators considered
in our study across four categories: population, economic sta-
tus, education, and race/ethnicity
Population Education
Total population Percent without high school (HS)
diploma
Population density Percent with HS diploma (and over
25 years old)
Median age Percent with BA degree (or better)
(and over 25 years old)
Percent male Race/ethnicity
Percent female Percent white
Economic status Percent white—not Hispanic
Median household
income
Percent African American
Median home value Percent American Indian
Percent below poverty
line
Percent Asian
Percent of homes
receiving food stamps
Percent Hispanic
GeoJournal
123
the spatial analysis mode we focus on the geographic
properties of this relationship. Below, we provide a
concise description of each analysis mode (non-spatial
and spatial) with a particular emphasis on the spatial
analysis methods used.
Non-spatial analysis
In the non-spatial analysis mode we explore the
relations between VGI quality and demographic
indicators in four steps. First, we compare the
distribution (i.e. histogram) of quality measured with
respect to the distribution of the demographic indica-
tors in order to determine whether accuracy errors or
completeness errors are generated in tracts that fit
specific demographic profiles. As some demographic
indicators are continuous variables, a method for
binning the data is required. In this study we approx-
imate the distribution of the demographic indicators
using histograms using a binning process. A number of
statistical approaches have been developed to bin data,
which generally fall into four categories: natural
(Jenks); quantile; equal-interval; and standard devia-
tion (Longley et al. 2010). While each of these
approaches could be considered, no substantial differ-
ences in the results were observed between them in our
case study. Consequently, natural (Jenks) breaks
within each data element are used to establish five
ranges within each of the selected demographic
indicator to enable the exploration of emergent
patterns in the distribution of a VGI quality measure
across a demographic parameter (e.g. OSM complete-
ness vs. median age).
Following this initial analysis, Principal Compo-
nent Analysis (PCA; Press and Wilson 1978) and
discriminant analysis (Davis 1973) is applied in order
to identify the demographic indicators that would best
explain quality variations in the two VGI sets.
Through this analysis, PCA can potentially lead to a
reduction in the dimensionality of the demographic
indicators, while retaining as much as possible of the
variation present within the original dataset. This is
achieved by transforming the original dataset to a new
set of variables, the principal components (PCs),
which are uncorrelated but are ordered so that the first
few retain most of the variation present in all of the
original variables (Andrews et al. 1996). As PCA can
be sensitive to the scale of the variables, it may be
necessary to rescale the demographic indicators.
However, most of these indicators are already cap-
tured as percentages, therefore such scaling is not
necessary. Specific non normalized indicators, such as
total population, population density, median age, and
median household income, must be scaled to fit within
the range of 0–1 prior to the application of the PCA.
The transformation to compute these new scaled
values is straight-forward: the minimum and maxi-
mum attributes are determined, and then the minimum
is subtracted from the maximum to establish the range,
finally the minimum is subtracted from the actual
value and the result is divided by the range, yielding
scaled value for that attribute. PCA is particularly
useful as a starting point for additional detailed
analysis, such as linear regression, in that the PCA
results may identify multi-colinearities within the data
that can then be used to reduce the data dimensionality
prior to additional analysis. By eliminating such
colinearities, linear regression can be simplified.
In order to explore and quantify possible correla-
tions between demographic indicators and VGI quality
measures both linear regression and discriminant
analysis are used. Specifically, linear regression is
used to assess the correlation between VGI positional
accuracy and demographic properties (Burt et al.
2009), and discriminant analysis (Davis 1973) is used
to assess the correlation between VGI completeness
and demographic properties. In the linear regression
analysis positional accuracy is used as the dependent
variable and the demographic properties as the
explanatory variables, and R2 values are calculated
for both the OSM and OSMCP datasets. In the
discriminant analysis completeness is used as the
discriminate function, demographic properties are
used as the explanatory variables, and Wilks’ lambda
(Huberty 1984) is used to estimate the significance of
the discriminant function. Though the combination of
linear regression and discriminant analysis we are
therefore able to assess how both positional accuracy
and completeness relate to the various demographic
indicators in the study area.
Spatial analysis
In the spatial analysis mode we analyze the spatial
properties of the completeness and positional accuracy
that were derived earlier. This analysis is carried out in
two steps. In the first step we explore whether spatial
patterns emerge in the VGI quality measures, and if so,
GeoJournal
123
whether such patterns can also be found in the spatial
distribution of the studied demographic indicators. If
found, the existence of spatial patterns in both data sets
would provide supporting evidence to the possible
association between VGI quality and demographic
indicators. However, if patterns exist in one dataset
and not in the other then such association would be
unlikely. In this analysis, the term pattern refers to a
non-random spatial distribution of the studied vari-
ables that is statistically significant (based on a
relevant significance test). To accomplish this we
utilize Nearest Neighbor analysis (NN; Clark and
Evans 1954), Moran’s Index of Spatial Autocorrela-
tion (Moran’s I; Moran 1950), and Local Indicators of
Spatial Associations (LISA; Anselin 1995) to test for
statistically significant spatial patterns. In the second
step, we utilize regression to model any spatial
associations between the VGI quality measures and
demographic indicators. Specifically, we use explor-
atory regression as well as Geographically Weighted
Regression (GWR: Fotheringham et al. 2002) to
determine whether a statistically significant model
(global or local) can be derived. We briefly describe
each of these analysis methods below.
NN analysis utilizes the average distance to the
nearest neighbor data point to determine whether a
point distribution is spatially random, clustered, or
dispersed compared to a random point pattern. Based
on this, the determination whether a given dataset is
randomly distributed is made through a z-score statis-
tic: absolute score values above 2.58 indicate a 99 %
chance that the data is not randomly distributed, while
values above 1.96 indicate a 95 % chance. Using the
NN analysis, both completeness and positional accu-
racy can be analyzed for the OSM and OSMCP to
determine whether any spatial patterns can be detected
based on VGI completeness rates. While the NN
analysis addresses the question of whether global
spatial patterns exist in the quality of the two VGI
datasets studied here, it does not address the question of
whether such patterns exist at the local scale. To
address this, we utilize LISA in order to identify areas
where local clusters of higher or lower than expected
values exist (Anselin 1995). Once a dataset is shown to
exhibit spatial autocorrelation, LISA can identify
significant areas within the overall dataset that generate
such spatial autocorrelation. Accordingly, within our
analysis LISA is used to determine which, if any,
locations drive the spatial autocorrelation values that
are observed. Similarly to the NN analysis, the
positional accuracy and completeness measures from
both OSM and OSMCP will be used.
In conjunction with the NN and LISA analyses for
the VGI quality measures, similar analysis is carried
out for the demographic indicators in order to explore
whether any spatial patterns emerge. Specifically, we
are interested in determining whether demographic
indicators exhibit any significant spatial autocorrela-
tion (Burt et al. 2009) in the study area. As the
demographic indicators are associated with aerial
features (i.e. tracts) we utilize Moran’s I to evaluate
the global spatial autocorrelation between tracts.
Similarly to the NN analysis, Moran’s I analysis
determines whether a set of features and their attribute
values are spatially randomly distributed, clustered, or
dispersed. In addition to considering the attribute
values of features to calculate autocorrelation, Mor-
an’s I takes into the spatial relationships between
features in the form of a spatial weights matrix, which
can express both topological and metric spatial
relations (Wong and Lee 2005). The statistical signif-
icance of Moran’s I is evaluated using a z-score test.
After exploring the existence of spatial patterns in
VGI quality measures and demographic indicators in
the study area, our analysis turns to explore whether
VGI quality could be modeled, either at the global or
the local scale. At the global scale we utilize in this
research exploratory regression (de Smith et al. 2007;
Braun and Oswald 2011) and GWR at the local scale.
Exploratory regression was carried in order to identify
an appropriate regression model that utilizes the
distribution of the regression errors to assess the
overall regression quality. Building on Ordinary Least
Squares (OLS), exploratory regression considers non-
spatial regression quality indicators (e.g. R2 and
residuals distribution) as well as the spatial autocor-
relation within the residuals in order to evaluate the
quality of a given regression model. The premise
behind this approach is that a regression model should
exhibit both good fit to the explanatory variables,
normally distributed residuals (evaluated using the
Jarque–Bera p value), and a lack of spatial autocor-
relation between residuals (evaluated using a p-value
condition on global Moran’s I test). In addition to the
R2 and the p-values criteria, additional threshold
conditions on the quality of the regression can be
applied, for example a minimum number of model
variables and a maximum Variance Inflation Factor
GeoJournal
123
(VIF; Wheeler and Tiefelsdorf 2005). The exploratory
nature of this approach stems from its iterative
implementation, in which different combinations of
the explanatory variables are tested until the best
model is found. This analysis was implemented for
OSM and OSMCP quality measures using the
modeling thresholds in Table 2.
At the local scale, GWR is utilized to study spatially
localized regression models of the relation between
VGI quality measures and demographic indicators.
While based on principles similar to the global
exploratory regression, GWR explores local regres-
sion models by allowing the regression coefficients to
vary based on location in the study area. This is
accomplished by a location-dependent weight matrix
that expresses the spatial relations between data
elements. As a result, we are able to explore whether
there are any significant local associations between
VGI quality and demographic indicators.
Results and discussion
Following the workflow and analysis methods
described in section ‘‘Data and methods’’, in this
section we outline and discuss the results that were
obtained through each analysis method. In particular,
the results of the non-spatial analysis mode is
described in section ‘‘Non-spatial analysis results’’,
and the results if the spatial analysis mode is described
in section ‘‘Spatial analysis results’’. The different
analyses were carried out using the SPSS1 statistical
analysis package (for non-spatial analysis) and the
ArcGIS 10.1 Spatial Statistics Toolbox.2
Non-spatial analysis results
Histogram analysis
The statistical distribution of the VGI quality mea-
sures can be analyzed through the study of histograms
in an effort to determine whether positional accuracy
or completeness are generated in tracts that is char-
acterized by a specific demographic profile. Figure 3
illustrates this process using a sample histogram the
percent white (non-Hispanic) demographic indicator
versus completeness rates (i.e. percent of matched
features) for both the OSM and OSMCP data sets. This
histogram, in which natural breaks bins were used,
provides a qualitative yet fast way to gain some initial
insights with respect to any noteworthy trends in the
relation between a given quality measure and a
demographic indicator. Additionally, differences
between the OSM and OSMCP data sets with respect
to a given demographic indicator can be observed
using such a histogram: when the difference between
bars of the same bin is small, then the two datasets
exhibit a similar behavior. Conversely, large differ-
ences between bars of the same bin imply that the
demographic characteristic being examined may
cause a difference between the results in the compar-
ison. A pattern can then emerge if the overall behavior
of one histogram across the bins is different from the
behavior of the second histogram across the same bins.
As can be seen from the example in Fig. 3, while there
are some differences between the two histogram bars,
it is difficult to identify a clear pattern.
In our analysis, the process of creating the histo-
gram was repeated for each demographic indicator in
an attempt to identify any visible trends or patterns. A
summary of the results of this process is provided in
Table 3 for completeness rates in both the OSM and
OSMCP data sets. An inspection of these results
shows that, generally, none of the demographic
indicators considered exhibit a clear trend or pattern.
Principal component analysis (PCA)
As described earlier, PCA is utilized in this study as a
tool for reducing the dimensionality of the data
potentially simplify the linear regression analysis.
Accordingly, PCA was used to analyze the relation-
ship between the eighteen demographic indicators
presented in Table 1 to determine whether all of them
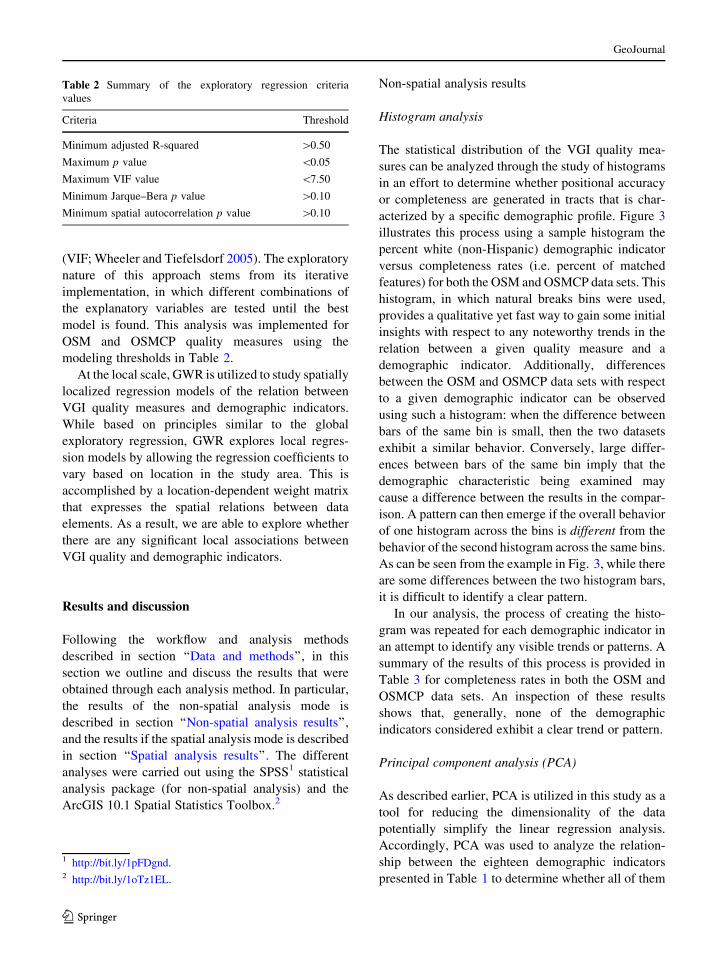
Table 2 Summary of the exploratory regression criteria
values
Criteria Threshold
Minimum adjusted R-squared [0.50
Maximum p value \0.05
Maximum VIF value \7.50
Minimum Jarque–Bera p value [0.10
Minimum spatial autocorrelation p value [0.10
1 http://bit.ly/1pFDgnd.2 http://bit.ly/1oTz1EL.
GeoJournal
123
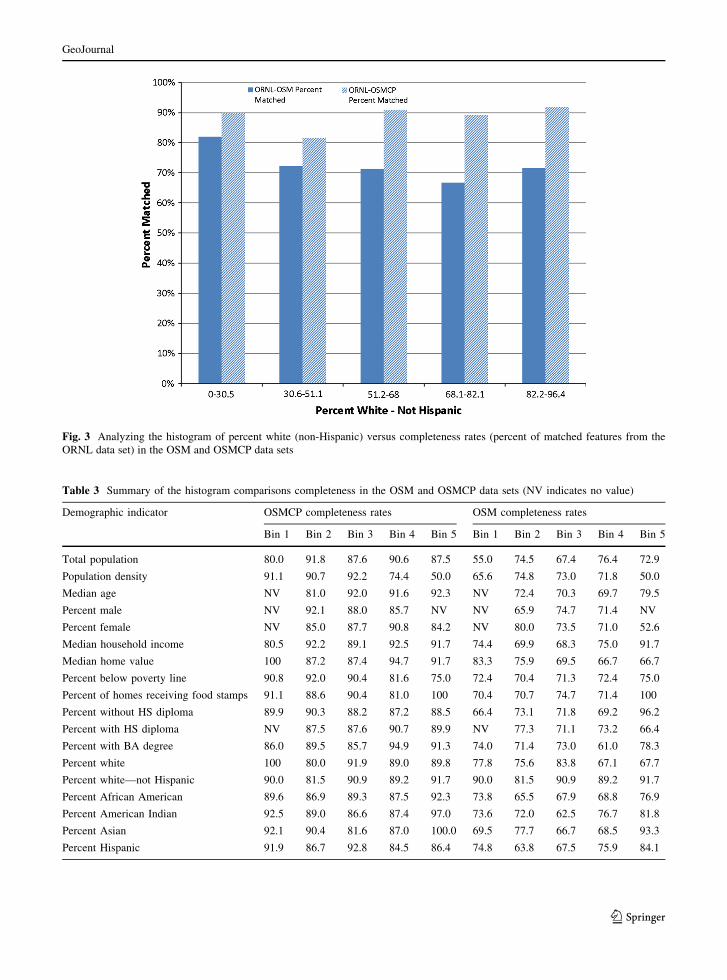
Fig. 3 Analyzing the histogram of percent white (non-Hispanic) versus completeness rates (percent of matched features from the
ORNL data set) in the OSM and OSMCP data sets
Table 3 Summary of the histogram comparisons completeness in the OSM and OSMCP data sets (NV indicates no value)
Demographic indicator OSMCP completeness rates OSM completeness rates
Bin 1 Bin 2 Bin 3 Bin 4 Bin 5 Bin 1 Bin 2 Bin 3 Bin 4 Bin 5
Total population 80.0 91.8 87.6 90.6 87.5 55.0 74.5 67.4 76.4 72.9
Population density 91.1 90.7 92.2 74.4 50.0 65.6 74.8 73.0 71.8 50.0
Median age NV 81.0 92.0 91.6 92.3 NV 72.4 70.3 69.7 79.5
Percent male NV 92.1 88.0 85.7 NV NV 65.9 74.7 71.4 NV
Percent female NV 85.0 87.7 90.8 84.2 NV 80.0 73.5 71.0 52.6
Median household income 80.5 92.2 89.1 92.5 91.7 74.4 69.9 68.3 75.0 91.7
Median home value 100 87.2 87.4 94.7 91.7 83.3 75.9 69.5 66.7 66.7
Percent below poverty line 90.8 92.0 90.4 81.6 75.0 72.4 70.4 71.3 72.4 75.0
Percent of homes receiving food stamps 91.1 88.6 90.4 81.0 100 70.4 70.7 74.7 71.4 100
Percent without HS diploma 89.9 90.3 88.2 87.2 88.5 66.4 73.1 71.8 69.2 96.2
Percent with HS diploma NV 87.5 87.6 90.7 89.9 NV 77.3 71.1 73.2 66.4
Percent with BA degree 86.0 89.5 85.7 94.9 91.3 74.0 71.4 73.0 61.0 78.3
Percent white 100 80.0 91.9 89.0 89.8 77.8 75.6 83.8 67.1 67.7
Percent white—not Hispanic 90.0 81.5 90.9 89.2 91.7 90.0 81.5 90.9 89.2 91.7
Percent African American 89.6 86.9 89.3 87.5 92.3 73.8 65.5 67.9 68.8 76.9
Percent American Indian 92.5 89.0 86.6 87.4 97.0 73.6 72.0 62.5 76.7 81.8
Percent Asian 92.1 90.4 81.6 87.0 100.0 69.5 77.7 66.7 68.5 93.3
Percent Hispanic 91.9 86.7 92.8 84.5 86.4 74.8 63.8 67.5 75.9 84.1
GeoJournal
123
provide unique information or whether they were
mostly redundant. The 401 features (schools) in our
data set, i.e. both features for which a match was found
and for which a match was not found, were assessed.
The results of the PCA identified five factors from the
eighteen input properties as able to describe approx-
imately 75 % of the variance. However, the analysis
did not find any of the 18 demographic indicators to be
redundant, and therefore none could be excluded.
Following this, the rotated component matrix was
computed using Varimax and the members of each
component were evaluated in an effort to understand the
particular relationships between the demographic prop-
erties. In this analysis the first factor included eleven of
the eighteen demographic properties from across the
four demographic categories identified in Table 1. The
other four factors identified included fewer demo-
graphic properties; however, the groupings of the
components for each of the factors were composed of
a mixture of demographic indicator categories pre-
sented in Table 1. Consequently, the PCA did not
indicate specific demographic categories (i.e. Popula-
tion, Economic Status, Education, Race/Ethnicity) that
drive the variability in VGI completeness.
Linear regression
Linear regression analyses were conducted on the
quality measures of both OSM and OSMCP in order to
assess whether they can be related to the demographic
properties associated with their location. In the
regression model positional accuracy was used as the
dependent variable and the demographic properties as
the explanatory variables on the 288 matched features
from the ORNL-OSM feature matching process and
the 357 matched features from the ORNL-OSMCP
feature matching process (section ‘‘VGI quality and
demographics data’’). Based on the results of the
regression standardized residuals were computed and
were checked for a possible linear relationship
between positional accuracy and the model residuals.
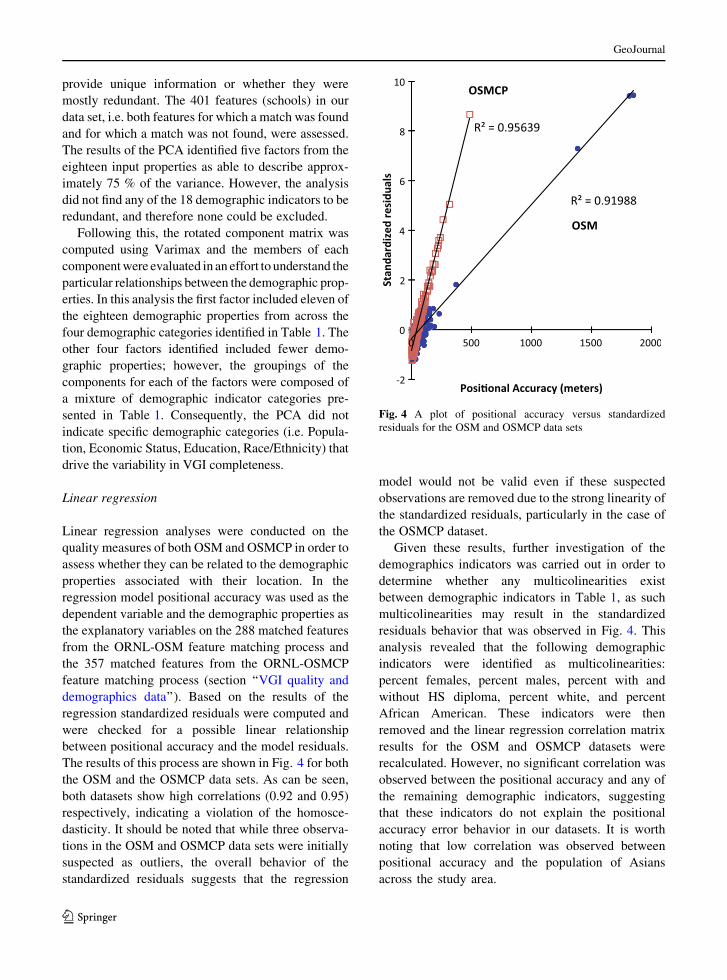
The results of this process are shown in Fig. 4 for both
the OSM and the OSMCP data sets. As can be seen,
both datasets show high correlations (0.92 and 0.95)
respectively, indicating a violation of the homosce-
dasticity. It should be noted that while three observa-
tions in the OSM and OSMCP data sets were initially
suspected as outliers, the overall behavior of the
standardized residuals suggests that the regression
model would not be valid even if these suspected
observations are removed due to the strong linearity of
the standardized residuals, particularly in the case of
the OSMCP dataset.
Given these results, further investigation of the
demographics indicators was carried out in order to
determine whether any multicolinearities exist
between demographic indicators in Table 1, as such
multicolinearities may result in the standardized
residuals behavior that was observed in Fig. 4. This
analysis revealed that the following demographic
indicators were identified as multicolinearities:
percent females, percent males, percent with and
without HS diploma, percent white, and percent
African American. These indicators were then
removed and the linear regression correlation matrix
results for the OSM and OSMCP datasets were
recalculated. However, no significant correlation was
observed between the positional accuracy and any of
the remaining demographic indicators, suggesting
that these indicators do not explain the positional
accuracy error behavior in our datasets. It is worth
noting that low correlation was observed between
positional accuracy and the population of Asians
across the study area.
Fig. 4 A plot of positional accuracy versus standardized
residuals for the OSM and OSMCP data sets
GeoJournal
123
Discriminant analysis
Discriminant analysis was used to assess the relation-
ship between completeness and demographics in the
OSM and OSMCP data sets. This was carried out by
analyzing the differences in the demographic indica-
tors for those features that were matched against the
unmatched features for the two datasets. This analysis
yields an interesting result, in that within the same
dataset, there is a statistically significant difference
between those features that were successfully matched
within the study area and those features that were
unmatched. The results were consistent for both the
OSM and the OSMCP datasets indicating that there is
a statistical difference between the demographic
properties of the matched features and those of the
unmatched features.
Spatial analysis results
Nearest neighbor (NN) analysis
Nearest neighbor analysis was performed in order to
explore whether a spatial pattern (clustering or
dispersion) in positional accuracy and completeness
could be identified for both the OSM and OSMCP data
sets. As described in section ‘‘Spatial analysis’’, the
premise behind this approach is that if such patterns
are detected, then they can be evaluated against spatial
patterns of different demographic indicators to iden-
tify any similar spatial patterns. If similar patterns are
found with respect to a specific demographic indicator,
then that indicator can serve as a potential driver of
VGI quality. Such analysis can also lead to possible
insights on how demographics may affect different
types of quality measures. For example, in the case of
completeness, if there is a statistically significant
difference in the spatial pattern of demographic
indicators associated with matched features compared
to the spatial pattern of the same demographic
indicators associated with unmatched features, then
those demographic properties could potentially drive
VGI completeness rates. Testing whether the VGI
quality measures exhibit any patterns is therefore the
first step in developing an understanding of possible
relationships between VGI quality and demographics.
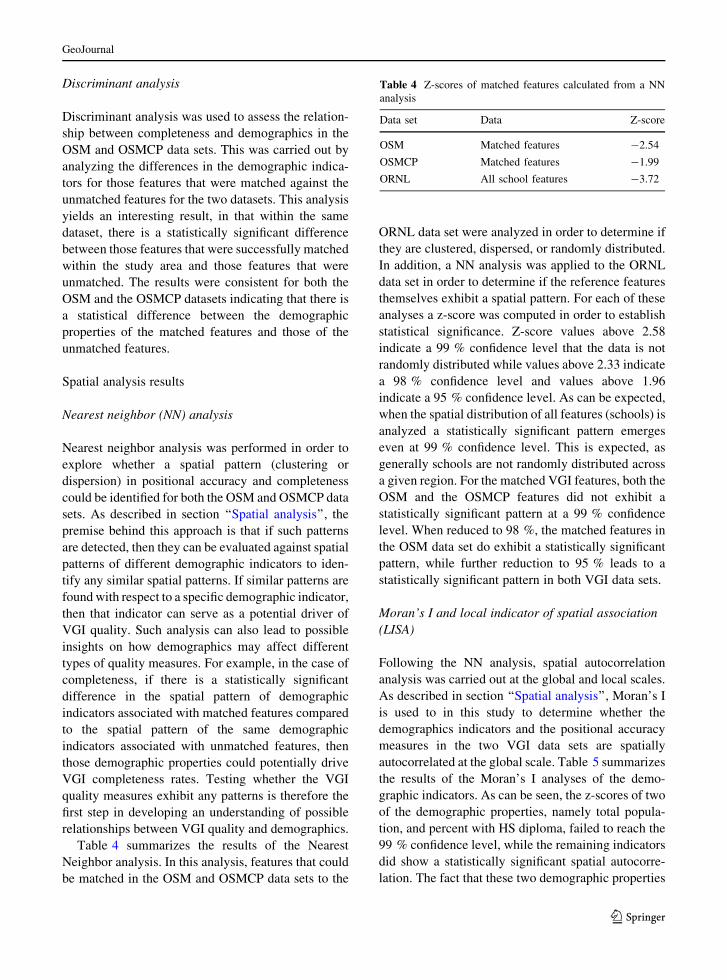
Table 4 summarizes the results of the Nearest
Neighbor analysis. In this analysis, features that could
be matched in the OSM and OSMCP data sets to the
ORNL data set were analyzed in order to determine if
they are clustered, dispersed, or randomly distributed.
In addition, a NN analysis was applied to the ORNL
data set in order to determine if the reference features
themselves exhibit a spatial pattern. For each of these
analyses a z-score was computed in order to establish
statistical significance. Z-score values above 2.58
indicate a 99 % confidence level that the data is not
randomly distributed while values above 2.33 indicate
a 98 % confidence level and values above 1.96
indicate a 95 % confidence level. As can be expected,
when the spatial distribution of all features (schools) is
analyzed a statistically significant pattern emerges
even at 99 % confidence level. This is expected, as
generally schools are not randomly distributed across
a given region. For the matched VGI features, both the
OSM and the OSMCP features did not exhibit a
statistically significant pattern at a 99 % confidence
level. When reduced to 98 %, the matched features in
the OSM data set do exhibit a statistically significant
pattern, while further reduction to 95 % leads to a
statistically significant pattern in both VGI data sets.
Moran’s I and local indicator of spatial association
(LISA)
Following the NN analysis, spatial autocorrelation
analysis was carried out at the global and local scales.
As described in section ‘‘Spatial analysis’’, Moran’s I
is used to in this study to determine whether the
demographics indicators and the positional accuracy
measures in the two VGI data sets are spatially
autocorrelated at the global scale. Table 5 summarizes
the results of the Moran’s I analyses of the demo-
graphic indicators. As can be seen, the z-scores of two
of the demographic properties, namely total popula-
tion, and percent with HS diploma, failed to reach the
99 % confidence level, while the remaining indicators
did show a statistically significant spatial autocorre-
lation. The fact that these two demographic properties
Table 4 Z-scores of matched features calculated from a NN
analysis
Data set Data Z-score
OSM Matched features -2.54
OSMCP Matched features -1.99
ORNL All school features -3.72
GeoJournal
123
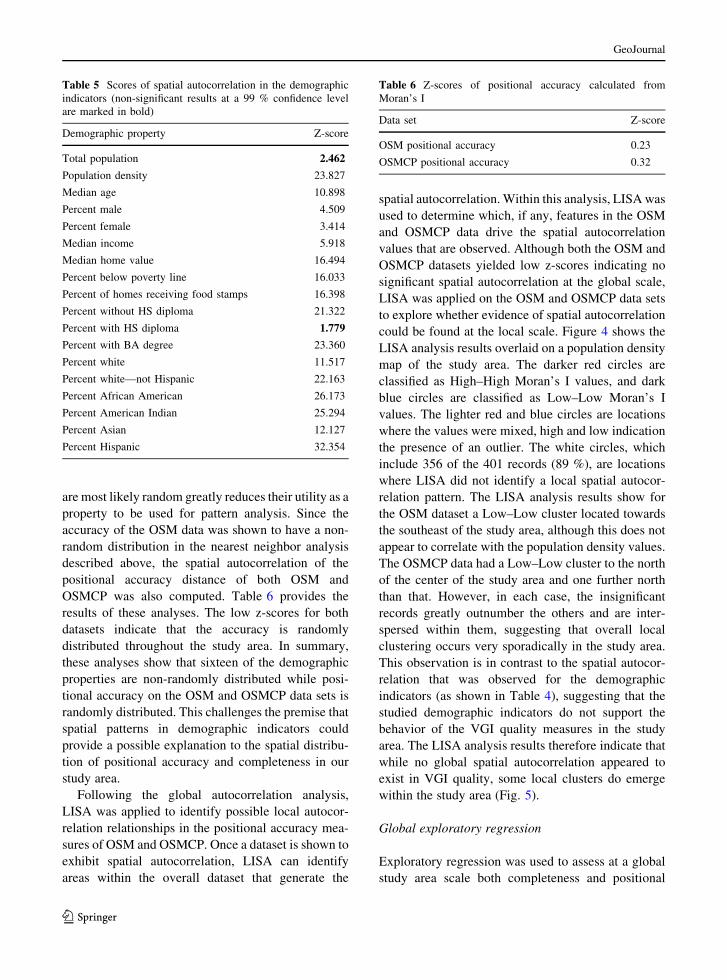
are most likely random greatly reduces their utility as a
property to be used for pattern analysis. Since the
accuracy of the OSM data was shown to have a non-
random distribution in the nearest neighbor analysis
described above, the spatial autocorrelation of the
positional accuracy distance of both OSM and
OSMCP was also computed. Table 6 provides the
results of these analyses. The low z-scores for both
datasets indicate that the accuracy is randomly
distributed throughout the study area. In summary,
these analyses show that sixteen of the demographic
properties are non-randomly distributed while posi-
tional accuracy on the OSM and OSMCP data sets is
randomly distributed. This challenges the premise that
spatial patterns in demographic indicators could
provide a possible explanation to the spatial distribu-
tion of positional accuracy and completeness in our
study area.
Following the global autocorrelation analysis,
LISA was applied to identify possible local autocor-
relation relationships in the positional accuracy mea-
sures of OSM and OSMCP. Once a dataset is shown to
exhibit spatial autocorrelation, LISA can identify
areas within the overall dataset that generate the
spatial autocorrelation. Within this analysis, LISA was
used to determine which, if any, features in the OSM
and OSMCP data drive the spatial autocorrelation
values that are observed. Although both the OSM and
OSMCP datasets yielded low z-scores indicating no
significant spatial autocorrelation at the global scale,
LISA was applied on the OSM and OSMCP data sets
to explore whether evidence of spatial autocorrelation
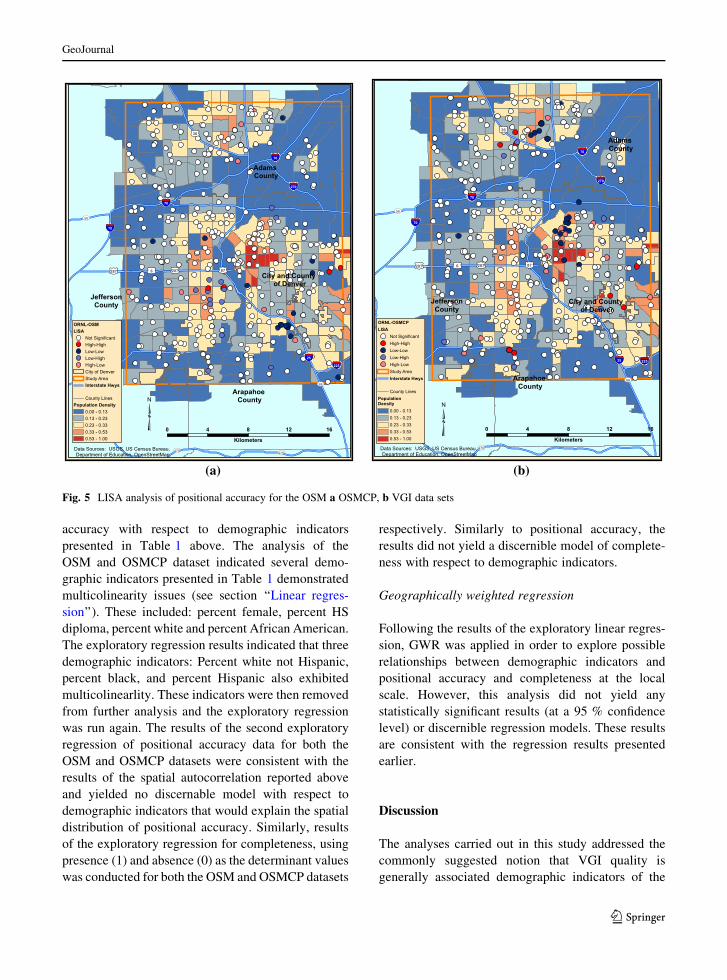
could be found at the local scale. Figure 4 shows the
LISA analysis results overlaid on a population density
map of the study area. The darker red circles are
classified as High–High Moran’s I values, and dark
blue circles are classified as Low–Low Moran’s I
values. The lighter red and blue circles are locations
where the values were mixed, high and low indication
the presence of an outlier. The white circles, which
include 356 of the 401 records (89 %), are locations
where LISA did not identify a local spatial autocor-
relation pattern. The LISA analysis results show for
the OSM dataset a Low–Low cluster located towards
the southeast of the study area, although this does not
appear to correlate with the population density values.
The OSMCP data had a Low–Low cluster to the north
of the center of the study area and one further north
than that. However, in each case, the insignificant
records greatly outnumber the others and are inter-
spersed within them, suggesting that overall local
clustering occurs very sporadically in the study area.
This observation is in contrast to the spatial autocor-
relation that was observed for the demographic
indicators (as shown in Table 4), suggesting that the
studied demographic indicators do not support the
behavior of the VGI quality measures in the study
area. The LISA analysis results therefore indicate that
while no global spatial autocorrelation appeared to
exist in VGI quality, some local clusters do emerge
within the study area (Fig. 5).
Global exploratory regression
Exploratory regression was used to assess at a global
study area scale both completeness and positional
Table 5 Scores of spatial autocorrelation in the demographic
indicators (non-significant results at a 99 % confidence level
are marked in bold)
Demographic property Z-score
Total population 2.462
Population density 23.827
Median age 10.898
Percent male 4.509
Percent female 3.414
Median income 5.918
Median home value 16.494
Percent below poverty line 16.033
Percent of homes receiving food stamps 16.398
Percent without HS diploma 21.322
Percent with HS diploma 1.779
Percent with BA degree 23.360
Percent white 11.517
Percent white—not Hispanic 22.163
Percent African American 26.173
Percent American Indian 25.294
Percent Asian 12.127
Percent Hispanic 32.354
Table 6 Z-scores of positional accuracy calculated from
Moran’s I
Data set Z-score
OSM positional accuracy 0.23
OSMCP positional accuracy 0.32
GeoJournal
123
accuracy with respect to demographic indicators
presented in Table 1 above. The analysis of the
OSM and OSMCP dataset indicated several demo-
graphic indicators presented in Table 1 demonstrated
multicolinearity issues (see section ‘‘Linear regres-
sion’’). These included: percent female, percent HS
diploma, percent white and percent African American.
The exploratory regression results indicated that three
demographic indicators: Percent white not Hispanic,
percent black, and percent Hispanic also exhibited
multicolinearlity. These indicators were then removed
from further analysis and the exploratory regression
was run again. The results of the second exploratory
regression of positional accuracy data for both the
OSM and OSMCP datasets were consistent with the
results of the spatial autocorrelation reported above
and yielded no discernable model with respect to
demographic indicators that would explain the spatial
distribution of positional accuracy. Similarly, results
of the exploratory regression for completeness, using
presence (1) and absence (0) as the determinant values
was conducted for both the OSM and OSMCP datasets
respectively. Similarly to positional accuracy, the
results did not yield a discernible model of complete-
ness with respect to demographic indicators.
Geographically weighted regression
Following the results of the exploratory linear regres-
sion, GWR was applied in order to explore possible
relationships between demographic indicators and
positional accuracy and completeness at the local
scale. However, this analysis did not yield any
statistically significant results (at a 95 % confidence
level) or discernible regression models. These results
are consistent with the regression results presented
earlier.
Discussion
The analyses carried out in this study addressed the
commonly suggested notion that VGI quality is
generally associated demographic indicators of the
(a) (b)
Fig. 5 LISA analysis of positional accuracy for the OSM a OSMCP, b VGI data sets
GeoJournal
123
area covered by the VGI (e.g. Haklay 2010; Girres and
Touya 2010; Zielstra and Zipf 2010; Cipeluch et al.
2010; Elwood 2009; Zook and Graham 2007a, b;
Crutcher and Zook 2009). Using 18 demographic
indicators from four separate categories (general
population; economic status; educational attainment;
and race/ethnicity), and focusing on point features
(schools), we examined whether such associations
could be detected, and if so whether they are
statistically significant. In order to accomplish this,
we used two VGI sources (OSM and OSMCP) and
compared them to a reference (ORNL) using the
feature matching methodology developed by Jackson
et al. (2013). This enabled us to evaluate two quality
measures of each VGI source, namely positional
accuracy and completeness, and compare and contrast
them with the various demographic indicators. Our
analysis included both non-spatial and spatial meth-
ods, which ranged from the comparison of the
distributions of the quality measure and simple
regression to exploratory and geographically weighed
regressions. The results of these analyses however,
failed to identify a clear and consistent association (or
statistically significant correlation) between either
positional accuracy or completeness with any of the
demographic properties. While some associations did
emerge (e.g. in the NN or LISA analysis), they were
found to be localized and sporadic. As a result, we
were not able to identify any patterns or combinations
of demographic indicators that are associated with
improved VGI quality.
These results suggest that, at least in some cases,
the underlying mechanisms that control VGI quality
are more involved, and that modeling VGI quality
through a direct relation with demographic indicators
may not be able to account for the intricate nature of
VGI quality. One potential explanation for the
emerging complex nature of VGI quality is that in
general, VGI contributions are typically not restricted
to contributors from the mapped area, thus enabling
virtually any user across the globe to contribute
information. Consequently, the VGI quality charac-
teristics resulting from such process are driven by a
potentially heterogeneous mixture of demographic
indicators, rendering the process of identifying spe-
cific demographic drivers of VGI quality difficult. To
some extent, this issue has been addressed in this study
through the use of the OSMCP data set for which the
contributors were indeed local to the area covered by
the dataset. However, clear associations with demo-
graphic indicators were not found in this dataset as
well.
Recent research related to our study by Li et al.
(2013), which focused on social media usage (Twitter
and Flickr) did find a relationship between Twitter
usage percentage of well-educated people with an
advanced degree and high income. In addition, high
Flickr activity was found to be correlated with a high
percentage of highly educated white and Asian people.
Similarly, Kent and Capello (2013), who studied the
use of social media during a crisis situation (a wildfire)
indicated that demographic characteristics of the area
impacted by the emergency situation could be used to
reveal the propensity of its population to contribute
information in social media during such a crisis. While
our findings appear to be in contrast to these findings,
it is important to note that their focus is on social
media rather than VGI. Arguably, social media offers
its users an environment that is substantially different
from that of VGI, which may lead to differences in the
motivation of users to contribute information as well
as differences in usage patterns. Consequently, the
question whether the findings of these recent studies
could be generalized to a VGI setting as well remains
open.
It is important to recognize that there are several
noteworthy limitations to our study. First, our study
focused on a single type of features, namely schools.
While this was beneficial for the construction of our
analysis workflow, further work is required in order to
explore whether our findings are consistent across
different feature types (e.g. stores or hospitals). In
addition, our study did not explore other types of VGI
quality measures, such as attribute accuracy or logical
consistency. Lastly, additional analysis methods—
both non-spatial and spatial—and other demographic
indicators should be further explored in an attempt to
model the relationship between demographic indica-
tors and VGI quality. For instance, while our analysis
focused on a linear model, non-linear models should
also be explored.
Summary and outlook
The enabling of citizens without formal training to
produce geographical products for mass consumption
through the use of web-based tools and technologies is
GeoJournal
123
introducing opportunities and challenges for our field.
Opportunities arise from the availability of additional
data that may extend the coverage of authoritative
datasets, or even better represent particular types of
events (e.g. capturing rapidly evolving events). The
challenges are associated with the integration of such
contributions with authoritative content. This integra-
tion is impeded by the lack of an understanding of the
accuracy of VGI datasets, and potential patterns behind
the variations of such accuracy. The study presented
within this paper has explored the relationship between
demographics and VGI quality, in order to assess the
often-repeated argument that demographics may relate
to corresponding accuracy variations.
We conducted a quantitative study to address this
issue, using data from a major metropolitan area, and
focused on point-represented areal features. The Denver
metro area that was selected as our study area offers a
unique advantage as we have available for it not only
authoritative (ORNL) and traditional crowdsourced
content (OSM) but also content derived through a
hybrid, partially supervised crowdsourcing process
(OSMCP). For this area we selected schools as a
representative feature type, for a variety of reasons.
First, schools tend to be more easily identifiable, as they
are large facilities, with well-defined components.
Secondly, in a demographically segregated city such
as Denver (James 1986; Aske et al. 2011) school
locations can be viewed as representative samples of
demographically diverse neighborhoods. The results of
our analysis do not support the arguments that a
correlation may exist between VGI error and local
demographic properties, as they show no statistically
significant such association.
VGI on a massive scale is a very complex process
and we need to gain a better understanding of the
mechanics that drive participation and content quality.
This study addressed one potential avenue, assessing
the role of demographics. While the findings of this
first quantitative study do not support earlier argu-
ments for a correlation between demographics and
accuracy, a natural future extension of this work would
be to extend the analysis to additional areas, and to
consider additional areal feature types (e.g. hospitals,
fire and police stations). Given the findings of this
research, one could argue that another logical next step
would be to study the process characteristics (rather
than its spatial and demographic indicators) and their
relation to data quality, because the process may be
more complex than can be described by work done so
far. Understanding who and why contributes VGI data
still remains an open research question. As Steinmann
et al. (2013) noted, a small percentage of contributors
are responsible for the majority of mapping. Deter-
mining which ‘small percent’ of the local population is
actually contributing poses a significant challenge to
future research relating demographics of place with
VGI contribution quality. It is through such studies
that we will be able to gain an understanding of
patterns behind the volunteering of geographical
information, and the corresponding accuracy varia-
tions. This will improve our capabilities to integrate
such datasets with authoritative collections, thus
allowing us to harvest the full potential of VGI.
References
Al-Bakri, M., & Fairbairn, D. (2010), Assessing the accuracy of
‘Crowdsourced’ data and its integration with official spa-
tial data sets. In Proceedings of the 9th international
symposium on spatial accuracy assessment in natural
resources and environmental sciences, Leicester, UK,
pp. 317–320.
Andrews, D. T., Chen, L., Wentzell, P. D., & Hamilton, D. C.
(1996). Comments on the relationship between principal
components analysis and weighted linear regression for
bivariate data sets. Chemometrics and Intelligent Labora-
tory Systems, 34(2), 231–244.
Anselin, L. (1995). Local indicators of spatial association—
LISA. Geographical Analysis, 27(2), 93–115.
Aske, D., Corman, R. R., & Marston, C. (2011). Education
policy and school segregation: A study of the Denver
metropolitan region. Journal of Legal, Ethical & Regula-
tory Issues, 14(2), 27–35.
Braun, M. T., & Oswald, F. L. (2011). Exploratory regression
analysis: A tool for selecting models and determining
predictor importance. Behavior Research Methods, 43(2),
331–339.
Brown, G., & Pullar, D. (2012). An evaluation of the use of
points versus polygons in public participation geographic
information systems using quasi-experimental design and
Monte Carlo simulation. International Journal of Geo-
graphical Information Science, 26(2), 231–246.
Burt, J., Barber, G., & Rigby, R. (2009). Elementary statistics
for geographers (3rd ed.). New York, NY: Guilford Press.
Cipeluch, B., Jacob, R., Winstanly, A., & Mooney, P. (2010).
Comparison of the accuracy of OpenStreetMap for Ireland
with Google Maps and Bing Maps. In Proceedings of the
9th international symposium on spatial accuracy assess-
ment in natural resources and environmental sciences,
Leicester, UK, pp. 337–340.
Clark, P. J., & Evans, F. C. (1954). Distance to nearest neighbor
as a measure of spatial relationships in populations. Ecol-
ogy, 35(4), 445–453.
GeoJournal
123
Coleman, D. J., Georgiadou, Y., & Labonte, J. (2009). Volun-
teered geographic information: The nature and motivation
of produsers. International Journal of Spatial Data Infra-
structures Research, 4(1), 332–358.
Crutcher, M., & Zook, M. (2009). Placemarks and waterlines:
Racialized cyberscapes in Post-Katrina Google Earth.
Geoforum, 40(4), 523–534.
Davis, J. (1973). Statistics and data analysis in geology. New
York, NY: Wiley.
de Smith, M. J., Goodchild, M. F., & Longley, P. A. (2007).
Geospatial analysis: A comprehensive guide to principles,
techniques and software tools (2nd ed.). Winchelsea, UK:
The Winchelsea Press.
Elwood, S. (2008). Volunteered geographic information: Key
questions, concepts and methods to guide emerging
research and practice. GeoJournal, 72(3–4), 133–135.
Elwood, S. (2009). Geographic information science: Emerging
research on the societal implications of the geographical
web. Progress in Human Geography, 34(3), 349–357.
Elwood, S., Goodchild, M. F., & Sui, D. (2013). Prospects for
VGI research and the emerging fourth paradigm. In D. Sui,
S. Elwood, & M. F. Goodchild (Eds.), Crowdsourcing
geographic knowledge: Volunteered geographic informa-
tion (VGI) in theory and practice (pp. 361–375). New
York, NY: Springer.
Fairbairn, D., & Al-Bakri, M. (2013). Using geometric proper-
ties to evaluate possible integration of authoritative and
volunteered geographic information. ISPRS International
Journal of Geo-Information, 2(2), 349–370.
Fotheringham, A. S., Brunsdon, C., & Charlton, M. (2002).
Geographically weighted regression & associated tech-
niques. Chichester, UK: Wiley.
Ghose, R., & Elwood, S. (2003). Public participation GIS and
local political context: Propositions and research direc-
tions. URISA Journal, 15(2), 17–22.
Girres, J.-F., & Touya, G. (2010). Quality assessment of the
French OpenStreetMap dataset. Transactions in GIS,
14(4), 435–459.
Goodchild, M. F. (2007). Citizens as sensors: The world of
volunteered geography. GeoJournal, 69(4), 211–221.
Goodchild, M. F., & Li, L. (2012). Assuring the quality of
volunteered geographic information. Spatial Statistics,
1(1), 110–120.
Graham, S. D. (2005). Software-sorted geographies. Progress in
Human Geography, 29(5), 562–580.
Haklay, M. (2010). How good is volunteered geographical
information? A comparative study of OpenStreetMap and
ordnance survey datasets. Environment and Planning B,
37(4), 682–703.
Haklay, M. M., Basiouka, S., Antoniou, V., & Ather, A.
(2010). How many volunteers does it take to map an area
well? The validity of Linus’ Law to volunteered geo-
graphic information. The Cartographic Journal, 47(4),
315–322.
Haklay, M., & Weber, P. (2008). Openstreetmap: User-gener-
ated street maps. IEEE Pervasive Computing, 7(4), 12–18.
Hochmair, H. H., & Zielstra, D. (2013). Development and
completeness of points of interest in free and proprietary
data sets: A Florida case study. Creating the GISociety—
Conference proceedings (pp. 39–48). Austria: Salzburg.
Holloway, T., Bozicevic, M., & Borner, K. (2007). Analyzing
and visualizing the semantic coverage of Wikipedia and its
authors. Complexity, 12(3), 30–40.
Huberty, C. J. (1984). Issues in the use and interpretation of
discriminant analysis. Psychological Bulletin, 95(1),
156–171.
Hudson-Smith, A., Crooks, A. T., Gibin, M., Milton, R., &
Batty, M. (2009). Neogeography and Web 2.0: Concepts,
tools and applications. Journal of Location Based Services,
3(2), 118–145.
Jackson, S. P., Mullen, W., Agouris, P., Crooks, A. T., Croitoru,
A., & Stefanidis, A. (2013). Assessing completeness and
spatial error of features in volunteered geographic infor-
mation. ISPRS International Journal of Geo-Information,
2(2), 507–530.
James, F. J. (1986). A new generalized ‘‘Exposure-Based’’
segregation index demonstration in Denver and Houston.
Sociological Methods & Research, 14(3), 301–316.
Kent, J. D., & Capello, H. T. (2013). Spatial patterns and
demographic indicators of effective social media content
during the Horsethief Canyon fire of 2012. Cartography
and Geographic Information Science, 40(2), 78–89.
Koukoletsos, T., Haklay, M., & Ellul, C. (2012). Assessing data
completeness of VGI through an automated matching
procedure for linear data. Transactions in GIS, 16(4),
477–498.
Kuznetzov, S. (2006). Motivations of contributors to Wikipedia.
ACM SIGCAS Computers and Society, 35(2), 1–7.
Li, L., Goodchild, M. F., & Xu, B. (2013). ‘Spatial. Temporal,
and socioeconomic patterns in the use of Twitter and
Flickr’, cartography and geographic information science,
40(2), 61–77.
Longley, P. A., Goodchild, M. F., Maguire, D. J., & Rhind, D.
W. (2010). Geographical information systems and science
(3rd ed.). New York, NY: Wiley.
Longley, P. A., & Singleton, A. D. (2009). Linking social
deprivation and digital exclusion in England. Urban
Studies, 46(7), 1275–1298.
McKechnie, J. (1983). Webster’s new twentieth century dictio-
nary (2nd ed.). New York, NY: Simon and Schuster.
Mooney, P., & Corcoran, P. (2012). Characteristics of heavily
edited objects in OpenStreetMap. Future Internet, 4(1),
285–305.
Mooney, P., Corcoran, P., & Winstanley, A. (2010). Towards
quality metrics for OpenStreetMap. In Proceedings of the
18th SIGSPATIAL international conference on advances in
geographic information systems, San Jose, CA, pp. 514–517.
Moran, P. A. (1950). Notes on continuous stochastic phenom-
ena. Biometrika, 37(1–2), 17–23.
Neis, P., Zielstra, D., & Zipf, A. (2011). The street network
evolution of crowdsourced maps: OpenStreetMap in Ger-
many 2007–2011. Future Internet, 4(1), 1–21.
Neis, P., & Zipf, A. (2012). Analyzing the contributor activity of
a volunteered geographic information project—The case of
OpenStreetMap. ISPRS International Journal of Geo-
Information, 1(2), 146–165.
Nov, O., Arazy, O., & Anderson, D. (2011). Technology-med-
iated citizen science participation: A motivational model.
In Proceedings of the 5th international AAAI conference on
weblogs and social media, Barcelona, Spain.
GeoJournal
123
OpenStreetMap. (2013a). Tag: Amenity = school. http://wiki.
openstreetmap.org/wiki/Tag:amenity%3Dschool. Acces-
sed on 17 May 2013.
OpenStreetMap. (2013b). USGS geographic names information
system. http://wiki.openstreetmap.org/wiki/GNIS. Acces-
sed on 17 May 2013.
Oreg, S., & Nov, O. (2008). Exploring motivations for con-
tributing to open source initiatives: The roles of contribu-
tion context and personal values. Computers in Human
Behavior, 24(5), 2055–2073.
Over, M., Schilling, A., Neubauer, S., & Zipf, A. (2010). Gen-
erating Web-based 3D city models from OpenStreetMap:
The current situation in Germany. Computers, Environ-
ment and Urban Systems, 34(6), 496–507.
Poore, B. S., Wolf, E. B., Korris, E. M., Walter, J. L., & Mat-
thews, G. D. (2012). Structures data collection for the
national map using volunteered geographic information.
U.S. Geological Survey open-file report 2012–1209, Res-
ton, VA. http://pubs.usgs.gov/of/2012/1209.
Porter, C. E., & Donthu, N. (2006). Using the technology
acceptance model to explain how attitudes determine
internet usage: The role of perceived access barriers and
demographics. Journal of Business Research, 59(9),
999–1007.
Press, S. J., & Wilson, S. (1978). Choosing between logistic
regression and discriminant analysis. Journal of the
American Statistical Association, 73(364), 699–705.
Schmidt, M., & Klettner, S. (2013). Gender and experience-
related motivators for contributing to OpenStreetMap.
Online proceedings of the international workshop on
action and interaction in volunteered geographic infor-
mation (ACTIVITY) at the 16th AGILE conference on
geographic information science, Leuven, Belgium.
Sieber, R. (2006). Public participation geographic information
systems: A literature review and framework. Annals of the
Association of American Geographers, 96(3), 491–507.
Steinmann, R., Grochenig, S., Rehrl, K., & Brunauer, R. (2013).
Contribution profiles of voluntary mappers in Open-
StreetMap. Online proceedings of the international
workshop on action and interaction in volunteered geo-
graphic information (ACTIVITY) at the 16th AGILE con-
ference on geographic information science, Leuven,
Belgium.
Sui, D. (2008). The wikification of GIS and its consequences: Or
Angelina Jolie’s new tattoo and the futureof GIS. Com-
puters, Environment and Urban Systems, 32(1), 1–5.
The National Map. (2014). http://nationalmap.gov/
TheNationalMapCorps/index.html. Accessed on 23 May
2014.
Tulloch, D. L. (2008). Is VGI participation? From vernal pools
to video games. GeoJournal, 72(3–4), 161–171.
U.S. Census Bureau. (2012). Geographic definitions. http://
www.census.gov/geo/www/geo_defn.html#CensusTract.
Accessed on 17 May 2013.
Vickery, G., & Wunsch-Vincent, S. (2007). Participative web
and user-created content: Web 2.0 wikis and social net-
working. Organization for Economic Cooperation and
Development (OECD), Paris, France.
Wheeler, D., & Tiefelsdorf, M. (2005). Multicollinearity and
correlation among local regression coefficients in geo-
graphically weighted regression. Journal of Geographical
Systems, 7(2), 161–187.
Wong, D. W. S., & Lee, J. (2005). Statistical analysis of geo-
graphic information with ArcView GIS and ArcGIS.
Hoboken, NJ: Wiley.
Zielstra, D., & Zipf, A. (2010). A comparative study of pro-
prietary geodata and volunteered geographic information
for Germany. In Proceedings of the 13th AGILE interna-
tional conference on geographic information science,
Guimaraes, Portugal, pp. 1–15.
Zook, M. A., & Graham, M. (2007a). The creative reconstruc-
tion of the internet: Google and the privatization of
cyberspace and DigiPlace. Geoforum, 38(6), 1322–1343.
Zook, M. A., & Graham, M. (2007b). Mapping DigiPlace:
Geocoded internet data and the representation of place.
Environment and Planning B, 34(3), 466–482.
GeoJournal
123