National Demographic and Health Survey - USAID
301
National Demographic and Health Survey 1998 National Statistics Office ® Department of Health ~DHS / Demographic and Health Surveys Macro International Inc.
-
Upload
khangminh22 -
Category
Documents
-
view
1 -
download
0
Transcript of National Demographic and Health Survey - USAID

National Demographic and Health Survey 1998
National Statistics Office
® Department of Health
~DHS /
Demographic and Health Surveys Macro International Inc.

REPUBLIC OF THE PHILIPPINES
National Demographic and Health Survey
1998
National Statistics Office Manila, Philippines
Department of Health Manila, Philippines
Macro International Inc. Calverton, Maryland
January 1999

This report summarizes the findings of the 1998 National Demographic and Health Survey (NDHS) undertaken by the National Statistics Office in collaboration with the Department of Health (DOH), the University of the Philippines Population Institute, and other concerned agencies in the Philippine government. Funding for the 1998 NDHS was provided by the U.S. Agency for Ituemational Development and the DOH.
The 1998 NDHS is part of the worldwide Demographic and Health Surveys (DHS) program, which is designed to collect, analyze, and disseminate demographic data on fertility, family planning, and maternal and child health. Additional information on the 1998 NDHS may be obtained from the National Statistics Office, Solicarel Building, Ramon Magsaysay Boulevard, Santa Mesa, Manila, Philippines. Additional information about the DHS program may be obtained by writing to: Macro International Inc., 11785 Beltsville Drive, Calverton, MD 20705- 3119, USA (Telephone 301-572-0200, Fax 301-572-0999).
Recommended citation:
National Statistics Office (NSO)], Department of Health (DOH) [Philippines] and Macro International Inc. (MI). 1999. National Demographic and Health Survey 1998. Manila: NSO and MI.
ISSN 0119-3252

CONTENTS
Page
Tables . . . . . . . . . . . . . . . . . . . . . . . . . . . . . . . . . . . . . . . . . . . . . . . . . . . . . . . . . . . . . . . . . . . . . . . . . . . . . . . . . . . . . . . . . . . . . . . . . . . . . . . . . . . . . . . . . . . . . . vi i
Figures . . . . . . . . . . . . . . . . . . . . . . . . . . . . . . . . . . . . . . . . . . . . . . . . . . . . . . . . . . . . . . . . . . . . . . . . . . . . . . . . . . . . . . . . . . . . . . . . . . . . . . . . . . . xii i
Preface . . . . . . . . . . . . . . . . . . . . . . . . . . . . . . . . . . . . . . . . . . . . . . . . . . . . . . . . . . . . . . . . . . . . . . . . . . . . . . . . . . . . . . . . . . . . . . . . . . . . . . . . . . x v
Summary o f f indings . . . . . . . . . . . . . . . . . . . . . . . . . . . . . . . . . . . . . . . . . . . . . . . . . . . . . . . . . . . . . . . . . . . . . . . . . . . . . . . . . . . . . . . . . x ix
Map o f Philippines . . . . . . . . . . . . . . . . . . . . . . . . . . . . . . . . . . . . . . . . . . . . . . . . . . . . . . . . . . . . . . . . . . . . . . . . . . . . . . . . . . . . . . . . . . . x x i v
CHAPTER 1 INTRODUCTION . . . . . . . . . . . . . . . . . . . . . . . . . . . . . . . . . . . . . . . . . . . . . . . . . . . . . . . . . . . . . . . . . . . . . . . . . . 1
1.1
1.2
1.3
1.4
1.5
1.6
1.7
Background . . . . . . . . . . . . . . . . . . . . . . . . . . . . . . . . . . . . . . . . . . . . . . . . . . . . . . . . . . . . . . . . . . . . . . . . . . . . . . . . . . . 1
Object ives of the survey . . . . . . . . . . . . . . . . . . . . . . . . . . . . . . . . . . . . . . . . . . . . . . . . . . . . . . . . . . . . . . . . . . . . . 2
Sample design . . . . . . . . . . . . . . . . . . . . . . . . . . . . . . . . . . . . . . . . . . . . . . . . . . . . . . . . . . . . . . . . . . . . . . . . . . . . . . . . 2
Questionnaires . . . . . . . . . . . . . . . . . . . . . . . . . . . . . . . . . . . . . . . . . . . . . . . . . . . . . . . . . . . . . . . . . . . . . . . . . . . . . . . 3
Training and f ieldwork . . . . . . . . . . . . . . . . . . . . . . . . . . . . . . . . . . . . . . . . . . . . . . . . . . . . . . . . . . . . . . . . . . . . . . 4
Data processing . . . . . . . . . . . . . . . . . . . . . . . . . . . . . . . . . . . . . . . . . . . . . . . . . . . . . . . . . . . . . . . . . . . . . . . . . . . . . . 4
Response rate . . . . . . . . . . . . . . . . . . . . . . . . . . . . . . . . . . . . . . . . . . . . . . . . . . . . . . . . . . . . . . . . . . . . . . . . . . . . . . . . . 5
CHAPTER 2 BACKGROUND CHARACTERISTICS OF HOUSEHOLDS AND RESPONDENTS . . . . . . . . . . . . . . . . . . . . . . . . . . . . . . . . . . . . . . . . . . . . . . . . . . . . . . . . . . . . . . . . . . . . 7
2.1 Age-sex composit ion . . . . . . . . . . . . . . . . . . . . . . . . . . . . . . . . . . . . . . . . . . . . . . . . . . . . . . . . . . . . . . . . . . . . . . . . 7
2.2 Population by age f rom selected sources . . . . . . . . . . . . . . . . . . . . . . . . . . . . . . . . . . . . . . . . . . . . . . . . . 9
2.3 Household composit ion . . . . . . . . . . . . . . . . . . . . . . . . . . . . . . . . . . . . . . . . . . . . . . . . . . . . . . . . . . . . . . . . . . . . . 9
2.4 Education level o f the household population . . . . . . . . . . . . . . . . . . . . . . . . . . . . . . . . . . . . . . . . . . . . 11
2.5 School enrolrnent . . . . . . . . . . . . . . . . . . . . . . . . . . . . . . . . . . . . . . . . . . . . . . . . . . . . . . . . . . . . . . . . . . . . . . . . . . . . 14
2.6 Hous ing conveniences . . . . . . . . . . . . . . . . . . . . . . . . . . . . . . . . . . . . . . . . . . . . . . . . . . . . . . . . . . . . . . . . . . . . . . 14
2.7 Presence of durable goods in the household . . . . . . . . . . . . . . . . . . . . . . . . . . . . . . . . . . . . . . . . . . . . 17
2.8 Background c h a r a c t e r i s t i c s of respondents . . . . . . . . . . . . . . . . . . . . . . . . . . . . . . . . . . . . . . . . . . . . . . 17
2.9 Education level o f respondents . . . . . . . . . . . . . . . . . . . . . . . . . . . . . . . . . . . . . . . . . . . . . . . . . . . . . . . . . . . . 18
2.10 Exposure to mass media . . . . . . . . . . . . . . . . . . . . . . . . . . . . . . . . . . . . . . . . . . . . . . . . . . . . . . . . . . . . . . . . . . . . 18
2.11 Employment . . . . . . . . . . . . . . . . . . . . . . . . . . . . . . . . . . . . . . . . . . . . . . . . . . . . . . . . . . . . . . . . . . . . . . . . . . . . . . . . . . . 23
2.12 Occupation . . . . . . . . . . . . . . . . . . . . . . . . . . . . . . . . . . . . . . . . . . . . . . . . . . . . . . . . . . . . . . . . . . . . . . . . . . . . . . . . . . . . 23
2.13 Earnings . . . . . . . . . . . . . . . . . . . . . . . . . . . . . . . . . . . . . . . . . . . . . . . . . . . . . . . . . . . . . . . . . . . . . . . . . . . . . . . . . . . . . . . 27
2.14 Child care while working . . . . . . . . . . . . . . . . . . . . . . . . . . . . . . . . . . . . . . . . . . . . . . . . . . . . . . . . . . . . . . . . . . 2 7
iii

C H A P T E R 3
3.1
3.2
3.3
3.4
3.5
3.6
3.7
3.8
C H A P T E R 4
Page
FERTILITY . . . . . . . . . . . . . . . . . . . . . . . . . . . . . . . . . . . . . . . . . . . . . . . . . . . . . . . . . . . . . . . . . . . . . . . . . . . . . . . . . 3 l
Current fertility . . . . . . . . . . . . . . . . . . . . . . . . . . . . . . . . . . . . . . . . . . . . . . . . . . . . . . . . . . . . . . . . . . . . . . . . . . . . . . . 31
Fertility by background characteristics . . . . . . . . . . . . . . . . . . . . . . . . . . . . . . . . . . . . . . . . . . . . . . . . . . . 33
Fertility trends . . . . . . . . . . . . . . . . . . . . . . . . . . . . . . . . . . . . . . . . . . . . . . . . . . . . . . . . . . . . . . . . . . . . . . . . . . . . . . . . 35
Fertility by marital duration . . . . . . . . . . . . . . . . . . . . . . . . . . . . . . . . . . . . . . . . . . . . . . . . . . . . . . . . . . . . . . . . 35
Children ever born and living . . . . . . . . . . . . . . . . . . . . . . . . . . . . . . . . . . . . . . . . . . . . . . . . . . . . . . . . . . . . . . 37
Birth intervals . . . . . . . . . . . . . . . . . . . . . . . . . . . . . . . . . . . . . . . . . . . . . . . . . . . . . . . . . . . . . . . . . . . . . . . . . . . . . . . . 39
Age at first birth . . . . . . . . . . . . . . . . . . . . . . . . . . . . . . . . . . . . . . . . . . . . . . . . . . . . . . . . . . . . . . . . . . . . . . . . . . . . . 42
Teenage fertility . . . . . . . . . . . . . . . . . . . . . . . . . . . . . . . . . . . . . . . . . . . . . . . . . . . . . . . . . . . . . . . . . . . . . . . . . . . . . 43
F A M I L Y P L A N N I N G
4.1 Knowledge o f family planning methods and their sources . . . . . . . . . . . . . . . . . . . . . . . . . . . . 47
4.2 Ever use o f family planning methods . . . . . . . . . . . . . . . . . . . . . . . . . . . . . . . . . . . . . . . . . . . . . . . . . . . . . 51
4.3 Current use o f family planning methods . . . . . . . . . . . . . . . . . . . . . . . . . . . . . . . . . . . . . . . . . . . . . . . . . 53
4.4 Number o f children at first use of family planning . . . . . . . . . . . . . . . . . . . . . . . . . . . . . . . . . . . . . 58
4.5 Problems with current method . . . . . . . . . . . . . . . . . . . . . . . . . . . . . . . . . . . . . . . . . . . . . . . . . . . . . . . . . . . . . 59
4.6 Knowledge o f fertile period . . . . . . . . . . . . . . . . . . . . . . . . . . . . . . . . . . . . . . . . . . . . . . . . . . . . . . . . . . . . . . . . 60
4.7 Timing of sterilization . . . . . . . . . . . . . . . . . . . . . . . . . . . . . . . . . . . . . . . . . . . . . . . . . . . . . . . . . . . . . . . . . . . . . . . 61
4.8 Willingness to pay for contraceptive method used . . . . . . . . . . . . . . . . . . . . . . . . . . . . . . . . . . . . . 61
4.9 Source o f supply o f m o d e m contraceptive methods currently used . . . . . . . . . . . . . . . . . 63
4.10 Contraceptive discontinuation rates . . . . . . . . . . . . . . . . . . . . . . . . . . . . . . . . . . . . . . . . . . . . . . . . . . . . . . . 65
4.11 Intentions for future family planning use among nonusers . . . . . . . . . . . . . . . . . . . . . . . . . . . . 67
4.12 Family planning messages in the mass media . . . . . . . . . . . . . . . . . . . . . . . . . . . . . . . . . . . . . . . . . . . 70
C H A P T E R 5
5.I
5.2
5.3
5.4
5.5
5.6
OTHER PROXIMATE DETERMINANTS OF FERTILITY . . . . . . . . . . . . . . . . . . . 75
Current marital status . . . . . . . . . . . . . . . . . . . . . . . . . . . . . . . . . . . . . . . . . . . . . . . . . . . . . . . . . . . . . . . . . . . . . . . 75
Age at first marriage . . . . . . . . . . . . . . . . . . . . . . . . . . . . . . . . . . . . . . . . . . . . . . . . . . . . . . . . . . . . . . . . . . . . . . . . . 76
Median age at first marriage . . . . . . . . . . . . . . . . . . . . . . . . . . . . . . . . . . . . . . . . . . . . . . . . . . . . . . . . . . . . . . 76
Age at first sexual intercourse . . . . . . . . . . . . . . . . . . . . . . . . . . . . . . . . . . . . . . . . . . . . . . . . . . . . . . . . . . . . . 79
Recent sexual activity . . . . . . . . . . . . . . . . . . . . . . . . . . . . . . . . . . . . . . . . . . . . . . . . . . . . . . . . . . . . . . . . . . . . . . . 81
Postpartum amenorrhea, abstinence, and insusceptibility . . . . . . . . . . . . . . . . . . . . . . . . . . . . . . 81
iv

5.7
5.8
CHAPTER 6
6.1
6.2
6.3
6,4
6.5
CHAPTER7
7.1
7.2
7.3
7.4
7.5
CHAPTER8
Page
Median duration of postpartum amenorrhea, abstinence,
and insusceptibility . . . . . . . . . . . . . . . . . . . . . . . . . . . . . . . . . . . . . . . . . . . . . . . . . . . . . . . . . . . . . . . . . . . . . . . . . 85
Menopause . . . . . . . . . . . . . . . . . . . . . . . . . . . . . . . . . . . . . . . . . . . . . . . . . . . . . . . . . . . . . . . . . . . . . . . . . . . . . . . . . . . . 87
FERTILITY PREFERENCES . . . . . . . . . . . . . . . . . . . . . . . . . . . . . . . . . . . . . . . . . . . . . . . . . . . . . . . . . . . 89
Desire for more children . . . . . . . . . . . . . . . . . . . . . . . . . . . . . . . . . . . . . . . . . . . . . . . . . . . . . . . . . . . . . . . . . . . . 90
Deinand for family planning . . . . . . . . . . . . . . . . . . . . . . . . . . . . . . . . . . . . . . . . . . . . . . . . . . . . . . . . . . . . . . . 94
Ideal number of children . . . . . . . . . . . . . . . . . . . . . . . . . . . . . . . . . . . . . . . . . . . . . . . . . . . . . . . . . . . . . . . . . . . . 94
Unplanned and unwanted fertility . . . . . . . . . . . . . . . . . . . . . . . . . . . . . . . . . . . . . . . . . . . . . . . . . . . . . . . . . 98
Family size desires of c0uples . . . . . . . . . . . . . . . . . . . . . . . . . . . . . . . . . . . . . . . . . . . . . . . . . . . . . . . . . . . . . 100
INFANT AND CHILD MORTALITY .. . . . . . . . . . . . . . . . . . . . . . . . . . . . . . . . . . . . . . . . . . . . . . . . . 103
Background . . . . . . . . . . . . . . . . . . . . . . . . . . . . . . . . . . . . . . . . . . . . . . . . . . . . . . . . . . . . . . . . . . . . . . . . . . . . . . . . . . . . 103
Levels and trends in infant and child mortality . . . . . . . . . . . . . . . . . . . . . . . . . . . . . . . . . . . . . . . . . 105
Infant and child mortality differentials by socioeconomic characteristics . . . . . . . . . . 107
Infant and child mortality differentials by demographic and
health characteristics . . . . . . . . . . . . . . . . . . . . . . . . . . . . . . . . . . . . . . . . . . . . . . . . . . . . . . . . . . . . . . . . . . . . . . . . . 109
High-risk fertility behavior . . . . . . . . . . . . . . . . . . . . . . . . . . . . . . . . . . . . . . . . . . . . . . . . . . . . . . . . . . . . . . . . 110
MATERNAL AND CHILD HEALTH . . . . . . . . . . . . . . . . . . . . . . . . . . . . . . . . . . . . . . . . . . . . . . . . . . 113
8.1 Prenatal care . . . . . . . . . . . . . . . . . . . . . . . . . . . . . . . . . . . . . . . . . . . . . . . . . . . . . . . . . . . . . . . . . . . . . . . . . . . . . . . . . . 113
8.2 Tetanus immunization of pregnant women . . . . . . . . . . . . . . . . . . . . . . . . . . . . . . . . . . . . . . . . . . . . . . 117
8.3 Iron and iodine supplementation during pregnancy . . . . . . . . . . . . . . . . . . . . . . . . . . . . . . . . . . . . i 19
8.4 Delivery assistance . . . . . . . . . . . . . . . . . . . . . . . . . . . . . . . . . . . . . . . . . . . . . . . . . . . . . . . . . . . . . . . . . . . . . . . . . . 119
8.5 Postnatal care . . . . . . . . . . . . . . . . . . . . . . . . . . . . . . . . . . . . . . . . . . . . . . . . . . . . . . . . . . . . . . . . . . . . . . . . . . . . . . . . . 125
8.6 Maternal mortality . . . . . . . . . . . . . . . . . . . . . . . . . . . . . . . . . . . . . . . . . . . . . . . . . . . . . . . . . . . . . . . . . . . . . . . . . . . t28
8.7 Immunization of children . . . . . . . . . . . . . . . . . . . . . . . . . . . . . . . . . . . . . . . . . . . . . . . . . . . . . . . . . . . . . . . . . . 129
8.8 Prevalence of acute respiratory infection and fever . . . . . . . . . . . . . . . . . . . . . . . . . . . . . . . . . . . . 132
8.9 Diarrheal diseases . . . . . . . . . . . . . . . . . . . . . . . . . . . . . . . . . . . . . . . . . . . . . . . . . . . . . . . . . . . . . . . . . . . . . . . . . . . 134
8.10 Treatment of diarrhea with oral rehydration therapy . . . . . . . . . . . . . . . . . . . . . . . . . . . . . . . . . . . . 134
V

Page
C H A P T E R 9 I N F A N T FEEDING AND S U P P L E M E N T A T I O N . . . . . . . . . . . . . . . . . . . . . . . . . . . . . . . . . 141
9.1
9.2
Prevalence o f breastfeeding and supplementation . . . . . . . . . . . . . . . . . . . . . . . . . . . . . . . . . . . . . 141
Duration o f breastfeeding . . . . . . . . . . . . . . . . . . . . . . . . . . . . . . . . . . . . . . . . . . . . . . . . . . . . . . . . . . . . . . . . . . 145
C H A P T E R 10 G E N E R A L H E A L T H . . . . . . . . . . . . . . . . . . . . . . . . . . . . . . . . . . . . . . . . . . . . . . . . . . . . . . . . . . . . . . . . . . . . 147
10.1 Communicable diseases . . . . . . . . . . . . . . . . . . . . . . . . . . . . . . . . . . . . . . . . . . . . . . . . . . . . . . . . . . . . . . . . . . . . 147
Dengue fever . . . . . . . . . . . . . . . . . . . . . . . . . . . . . . . . . . . . . . . . . . . . . . . . . . . . . . . . . . . . . . . . . . . . . . . . . . . . 147
Rab ie s . . . . . . . . . . . . . . . . . . . . . . . . . . . . . . . . . . . . . . . . . . . . . . . . . . . . . . . . . . . . . . . . . . . . . . . . . . . . . . . . . . . . 147
Leprosy . . . . . . . . . . . . . . . . . . . . . . . . . . . . . . . . . . . . . . . . . . . . . . . . . . . . . . . . . . . . . . . . . . . . . . . . . . . . . . . . . . . 150
Tuberculosis . . . . . . . . . . . . . . . . . . . . . . . . . . . . . . . . . . . . . . . . . . . . . . . . . . . . . . . . . . . . . . . . . . . . . . . . . . . . . 151
10.2 Non-communicable diseases . . . . . . . . . . . . . . . . . . . . . . . . . . . . . . . . . . . . . . . . . . . . . . . . . . . . . . . . . . . . . . . 154
Healthy lifestyle . . . . . . . . . . . . . . . . . . . . . . . . . . . . . . . . . . . . . . . . . . . . . . . . . . . . . . . . . . . . . . . . . . . . . . . . . . 154
Smoking . . . . . . . . . . . . . . . . . . . . . . . . . . . . . . . . . . . . . . . . . . . . . . . . . . . . . . . . . . . . . . . . . . . . . . . . . . . . . . . . . . . 154
Cancer . . . . . . . . . . . . . . . . . . . . . . . . . . . . . . . . . . . . . . . . . . . . . . . . . . . . . . . . . . . . . . . . . . . . . . . . . . . . . . . . . . . . . 155
10.3 Environmental health . . . . . . . . . . . . . . . . . . . . . . . . . . . . . . . . . . . . . . . . . . . . . . . . . . . . . . . . . . . . . . . . . . . . . . . . 156
Garbage disposal . . . . . . . . . . . . . . . . . . . . . . . . . . . . . . . . . . . . . . . . . . . . . . . . . . . . . . . . . . . . . . . . . . . . . . . . . 156
Use ofpre-cooked foods . . . . . . . . . . . . . . . . . . . . . . . . . . . . . . . . . . . . . . . . . . . . . . . . . . . . . . . . . . . . . . . 156
10.4 Health care financing . . . . . . . . . . . . . . . . . . . . . . . . . . . . . . . . . . . . . . . . . . . . . . . . . . . . . . . . . . . . . . . . . . . . . . . . 157
10.5 Traditional medicine . . . . . . . . . . . . . . . . . . . . . . . . . . . . . . . . . . . . . . . . . . . . . . . . . . . . . . . . . . . . . . . . . . . . . . . . 159
10.6 Health facility utilization . . . . . . . . . . . . . . . . . . . . . . . . . . . . . . . . . . . . . . . . . . . . . . . . . . . . . . . . . . . . . . . . . . . 160
R E F E R E N C E S . . . . . . . . . . . . . . . . . . . . . . . . . . . . . . . . . . . . . . . . . . . . . . . . . . . . . . . . . . . . . . . . . . . . . . . . . . . . . . . . . . . . . . . . . . . . . . . . . 163
A P P E N D I X A S A M P L E D E S I G N . . . . . . . . . . . . . . . . . . . . . . . . . . . . . . . . . . . . . . . . . . . . . . . . . . . . . . . . . . . . . . . . . . . . . . . . . 165
A P P E N D I X B E S T I M A T E S OF S A M P L I N G E R R O R S . . . . . . . . . . . . . . . . . . . . . . . . . . . . . . . . . . . . . . . . . . . . 171
A P P E N D I X C Q U A L I T Y OF THE DATA: N O N S A M P L I N G E R R O R S . . . . . . . . . . . . . . . . . . . . . . . . 195
A P P E N D I X D P E R S O N S I N V O L V E D IN T H E 1998 N A T I O N A L D E M O G R A P I ~ C AND H E A L T H SURVEY . . . . . . . . . . . . . . . . . . . . . . . . . . . . . . . . . . . . . . . . 203
A P P E N D I X E S U R V E Y Q U E S T I O N N A I R E S . . . . . . . . . . . . . . . . . . . . . . . . . . . . . . . . . . . . . . . . . . . . . . . . . . . . . . . . . 213
vi

Table 2.1
Table 2.2
Table 2.3
Table 2.4.1
Table 2.4.2
Table 2.5
Table 2.6
Table 2.7
Table 2.8.1
Table 2.8.2
Table 2.9
Table 2. l0
Table 2.11
Table 2.12
Table 2.13
Table 2.14
Table 2.15
Table 2.16
Table 3.1
Table 3.2
Table 3.3
Table 3.4
Table 3.5
Table 3.6
Table 3.7
Table 3.8
Table 3.9
Table 3.10
Table 4.1
Table 4.2
Table 4.3
Table 4.4
TABLES
Page
Household population by age, residence, and sex . . . . . . . . . . . . . . . . . . . . . . . . . . . . . . . . . . . . . . . 8
Median and dependency ratio . . . . . . . . . . . . . . . . . . . . . . . . . . . . . . . . . . . . . . . . . . . . . . . . . . . . . . . . . . . . . 10
Household composition . . . . . . . . . . . . . . . . . . . . . . . . . . . . . . . . . . . . . . . . . . . . . . . . . . . . . . . . . . . . . . . . . . . . 10
Educational level of the male household population . . . . . . . . . . . . . . . . . . . . . . . . . . . . . . . . . . . 12
Educational level of the female household population . . . . . . . . . . . . . . . . . . . . . . . . . . . . . . . . . 13
School enrolment . . . . . . . . . . . . . . . . . . . . . . . . . . . . . . . . . . . . . . . . . . . . . . . . . . . . . . . . . . . . . . . . . . . . . . . . . . . . 14
Housing conveniences . . . . . . . . . . . . . . . . . . . . . . . . . . . . . . . . . . . . . . . . . . . . . . . . . . . . . . . . . . . . . . . . . . . . . . 15
Household durable goods . . . . . . . . . . . . . . . . . . . . . . . . . . . . . . . . . . . . . . . . . . . . . . . . . . . . . . . . . . . . . . . . . . . 17
Background characteristics of respondents . . . . . . . . . . . . . . . . . . . . . . . . . . . . . . . . . . . . . . . . . . . . . . . 19
Background characteristics of respondents by residence and region . . . . . . . . . . . . . . . . 20
Level of education . . . . . . . . . . . . . . . . . . . . . . . . . . . . . . . . . . . . . . . . . . . . . . . . . . . . . . . . . . . . . . . . . . . . . . . . . . . 21
Exposure to mass media . . . . . . . . . . . . . . . . . . . . . . . . . . . . . . . . . . . . . . . . . . . . . . . . . . . . . . . . . . . . . . . . . . . . 22
Employment status . . . . . . . . . . . . . . . . . . . . . . . . . . . . . . . . . . . . . . . . . . . . . . . . . . . . . . . . . . . . . . . . . . . . . . . . . . 24
Type of employer . . . . . . . . . . . . . . . . . . . . . . . . . . . . . . . . . . . . . . . . . . . . . . . . . . . . . . . . . . . . . . . . . . . . . . . . . . . . 25
Occupation . . . . . . . . . . . . . . . . . . . . . . . . . . . . . . . . . . . . . . . . . . . . . . . . . . . . . . . . . . . . . . . . . . . . . . . . . . . . . . . . . . . 26 '
Person who decides on use of earnings . . . . . . . . . . . . . . . . . . . . . . . . . . . . . . . . . . . . . . . . . . . . . . . . . . 28
Child care while working . . . . . . . . . . . . . . . . . . . . . . . . . . . . . . . . . . . . . . . . . . . . . . . . . . . . . . . . . . . . . . . . . . . 29
Child care while working by region . . . . . . . . . . . . . . . . . . . . . . . . . . . . . . . . . . . . . . . . . . . . . . . . . . . . . . 30
Current feritility . . . . . . . . . . . . . . . . . . . . . . . . . . . . . . . . . . . . . . . . . . . . . . . . . . . . . . . . . . . . . . . . . . . . . . . . . . . . . . 32
Fertility by background c h a r a c t e r i s t i c s . . . . . . . . . . . . . . . . . . . . . . . . . . . . . . . . . . . . . . . . . . . . . . . . . . . 33
Fertility trends . . . . . . . . . . . . . . . . . . . . . . . . . . . . . . . . . . . . . . . . . . . . . . . . . . . . . . . . . . . . . . . . . . . . . . . . . . . . . . . . 36
Age-specific fertility rates . . . . . . . . . . . . . . . . . . . . . . . . . . . . . . . . . . . . . . . . . . . . . . . . . . . . . . . . . . . . . . . . . 37
Fertility by marital duration . . . . . . . . . . . . . . . . . . . . . . . . . . . . . . . . . . . . . . . . . . . . . . . . . . . . . . . . . . . . . . . . 37
Children ever-born and living . . . . . . . . . . . . . . . . . . . . . . . . . . . . . . . . . . . . . . . . . . . . . . . . . . . . . . . . . . . . . . 38
Birth intervals . . . . . . . . . . . . . . . . . . . . . . . . . . . . . . . . . . . . . . . . . . . . . . . . . . . . . . . . . . . . . . . . . . . . . . . . . . . . . . . 41
Age at first birth . . . . . . . . . . . . . . . . . . . . . . . . . . . . . . . . . . . . . . . . . . . . . . . . . . . . . . . . . . . . . . . . . . . . . . . . . . . . . 42
Median age at first birth . . . . . . . . . . . . . . . . . . . . . . . . . . . . . . . . . . . . . . . . . . . . . . . . . . . . . . . . . . . . . . . . . . . . 44
Teenage pregnancy and motherhood . . . . . . . . . . . . . . . . . . . . . . . . . . . . . . . . . . . . . . . . . . . . . . . . . . . . . 45
Knowledge of contraceptive methods and a source for methods . . . . . . . . . . . . . . . . . . . . . 48
Knowledge of modem contraceptive methods and source for methods . . . . . . . . . . . 50
Ever use of contraception . . . . . . . . . . . . . . . . . . . . . . . . . . . . . . . . . . . . . . . . . . . . . . . . . . . . . . . . . . . . . . . . . . 52
Current use of contraception by age . . . . . . . . . . . . . . . . . . . . . . . . . . . . . . . . . . . . . . . . . . . . . . . . . . . . . . 54
vii

Table 4.5
Table 4.6
Table 4.7
Table 4.8
Table 4.9
Table 4.10
Table 4.11
Table 4.12
Table 4.13
Table 4.14
Table 4. I5
Table 4.16
Table 4.17
Table 4.18
Table 4.19
Table 4.20
Table 4.21
Table 5.1
Table 5.2
Table 5.3
Table 5.4
Table 5.5
Table 5.6
Table 5.7
Table 5.8
Table 5.9
Table 6.1
Table 6.2
Table 6.3
Table 6.4
Table 6.5
Table 6.6
Table 6.7
Page
Trends in contraceptive use . . . . . . . . . . . . . . . . . . . . . . . . . . . . . . . . . . . . . . . . . . . . . . . . . . . . . . . . . . . . . . . . 55
Current use of contraception by background charateristics . . . . . . . . . . . . . . . . . . . . . . . . . . . . 57
Number of children at first use of contraception . . . . . . . . . . . . . . . . . . . . . . . . . . . . . . . . . . . . . . . . 58
Problems with current method of contraception . . . . . . . . . . . . . . . . . . . . . . . . . . . . . . . . . . . . . . . . . 59
Knowledge of fertile period . . . . . . . . . . . . . . . . . . . . . . . . . . . . . . . . . . . . . . . . . . . . . . . . . . . . . . . . . . . . . . . . 60
Timing of sterilization . . . . . . . . . . . . . . . . . . . . . . . . . . . . . . . . . . . . . . . . . . . . . . . . . . . . . . . . . . . . . . . . . . . . . . 61
Willingness to pay for contraceptive method used . . . . . . . . . . . . . . . . . . . . . . . . . . . . . . . . . . . . . . 62
Source of supply for modem contraceptive methods . . . . . . . . . . . . . . . . . . . . . . . . . . . . . . . . . . . 63
Time to source of supply for modern contraceptive method used . . . . . . . . . . . . . . . . . . . . 64
First year discontinuation rates for contraception . . . . . . . . . . . . . . . . . . . . . . . . . . . . . . . . . . . . . . . 65
Reason for discontinuing of contraception . . . . . . . . . . . . . . . . . . . . . . . . . . . . . . . . . . . . . . . . . . . . . . . 67
Future use of contraception . . . . . . . . . . . . . . . . . . . . . . . . . . . . . . . . . . . . . . . . . . . . . . . . . . . . . . . . . . . . . . . . 68
Reasons for not using contraception . . . . . . . . . . . . . . . . . . . . . . . . . . . . . . . . . . . . . . . . . . . . . . . . . . . . . . 68
Preferred method of contraception for future use . . . . . . . . . . . . . . . . . . . . . . . . . . . . . . . . . . . . . . . 69
Exposure to family planning messages in the mass media . . . . . . . . . . . . . . . . . . . . . . . . . . . . . 71
Acceptability of the use of mass media for disseminating
family planning message . . . . . . . . . . . . . . . . . . . . . . . . . . . . . . . . . . . . . . . . . . . . . . . . . . . . . . . . . . . . . . . . . . . 73
Exposure to family planning slogan . . . . . . . . . . . . . . . . . . . . . . . . . . . . . . . . . . . . . . . . . . . . . . . . . . . . . . 74
Current marital status . . . . . . . . . . . . . . . . . . . . . . . . . . . . . . . . . . . . . . . . . . . . . . . . . . . . . . . . . . . . . . . . . . . . . . . 75
Age at first marriage . . . . . . . . . . . . . . . . . . . . . . . . . . . . . . . . . . . . . . . . . . . . . . . . . . . . . . . . . . . . . . . . . . . . . . . . 76
Median age at first marriage . . . . . . . . . . . . . . . . . . . . . . . . . . . . . . . . . . . . . . . . . . . . . . . . . . . . . . . . . . . . . . . 77
Age at first sexual intercourse . . . . . . . . . . . . . . . . . . . . . . . . . . . . . . . . . . . . . . . . . . . . . . . . . . . . . . . . . . . . . 79
Median age at first intercourse . . . . . . . . . . . . . . . . . . . . L . . . . . . . . . . . . . . . . . . . . . . . . . . . . . . . . . . . . . . . 80
Recent sexual activity . . . . . . . . . . . . . . . . . . . . . . . . . . . . . . . . . . . . . . . . . . . . . . . . . . . . . . . . . . . . . . . . . . . . . . . . 82
Postpartum amenorrhea, abstinence, and insusceptibility . . . . . . . . . . . . . . . . . . . . . . . . . . . . . . 83
Median duration of postpartum insusceptibility by background characteristics .... 86
Menopause . . . . . . . . . . . . . . . . . . . . . . . . . . . . . . . . . . . . . . . . . . . . . . . . . . . . . . . . . . . . . . . . . . . . . . . . . . . . . . . . . . . . 87
Fertility preferences by number of living children . . . . . . . . . . . . . . . . . . . . . . . . . . . . . . . . . . . . . . 90
Fertility preferences by age . . . . . . . . . . . . . . . . . . . . . . . . . . . . . . . . . . . . . . . . . . . . . . . . . . . . . . . . . . . . . . . . 91
Desire to limit (stop) childbearing . . . . . . . . . . . . . . . . . . . . . . . . . . . . . . . . . . . . . . . . . . . . . . . . . . . . . . . . . 93
Need for family planning services . . . . . . . . . . . . . . . . . . . . . . . . . . . . . . . . . . . . . . . . . . . . . . . . . . . . . . . . . 95
Ideal number of children . . . . . . . . . . . . . . . . . . . . . . . . . . . . . . . . . . . . . . . . . . . . . . . . . . . . . . . . . . . . . . . . . . . 96
Mean ideal number of children by background characteristics . . . . . . . . . . . . . . . . . . . . . . . 97
Fertility planning status . . . . . . . . . . . . . . . . . . . . . . . . . . . . . . . . . . . . . . . . . . . . . . . . . . . . . . . . . . . . . . . . . . . . . 99
viii

Table 6.8
Table 6.9
Table 7.1
Table 7.2
Table 7.3
Table 7.4
Table 7.5
Table 8.1
Table 8.2
Table 8.3
Table 8.4
Table 8.5
Table 8.6
Table 8.7
Table 8.8
Table 8.9
Table 8.9a
Table 8.10
Table 8.11
Table 8.12
Table 8.13
Table 8.14
Table 8.15
Table 8.16
Table 8.17
Table 8.18
Table 9.1
Table 9.2
Table 9.3
Table 9.4
Table 10.1
Table 10.2
Table 10.3
Page
Wanted fertility rates . . . . . . . . . . . . . . . . . . . . . . . . . . . . . . . . . . . . . . . . . . . . . . . . . . . . . . . . . . . . . . . . . . . . . . . . 100
Couple's consensus on family size . . . . . . . . . . . . . . . . . . . . . . . . . . . . . . . . . . . . . . . . . . . . . . . . . . . . . . . . 101
Infant and child mortality . . . . . . . . . . . . . . . . . . . . . . . . . . . . . . . . . . . . . . . . . . . . . . . . . . . . . . . . . . . . . . . . . . . 105
Trend in infant mortality rate . . . . . . . . . . . . . . . . . . . . . . . . . . . . . . . . . . . . . . . . . . . . . . . . . . . . . . . . . . . . . . . 106
Infant and child mortality by socio-economic characteristics . . . . . . . . . . . . . . . . . . . . . . . . . 107
Infant and child mortality by demographic characteristics . . . . . . . . . . . . . . . . . . . . . . . . . . . . . 109
High-risk fertility behavior . . . . . . . . . . . . . . . . . . . . . . . . . . . . . . . . . . . . . . . . , . . . . . . . . . . . . . . . . . . . . . . . . I 11
Prenatal care . . . . . . . . . . . . . . . . . . . . . . . . . . . . . . . . . . . . . . . . . . . . . . . . . . . . . . . . . . . . . . . . . . . . . . . . . . . . . . . . . . 114
Information about danger signs of pregnancy . . . . . . . . . . . . . . . . . . . . . . . . . . . . . . . . . . . . . . . . . . . 116
Tetanus toxoid vaccinations . . . . . . . . . . . . . . . . . . . . . . . . . . . . . . . . . . . . . . . . . . . . . . . . . . . . . . . . . . . . . . . . 118
Iron and iodine supplementation during pregnancy . . . . . . . . . . . . . . . . . . . . . . . . . . . . . . . . . . . . 120
Place of delivery . . . . . . . . . . . . . . . . . . . . . . . . . . . . . . . . . . . . . . . . . . . . . . . . . . . . . . . . . . . . . . . . . . . . . . . . . . . 121
Assistance during delivery . . . . . . . . . . . . . . . . . . . . . . . . . . . . . . . . . . . . . . . . . . . . . . . . . . . . . . . . . . . . . . . . . 122
D e l i v e r y c h a r a c t e r i s t i c s : . . . . . . . . . . . . . . . . . . . . . . . . . . . . . . . . . . . . . . . . . . . . . . . . . . . . . . . . . . . . . . . . . . . . 123
Reasons for caesarian section . . . . . . . . . . . . . . . . . . . . . . . . . . . . . . . . . . . . . . . . . . . . . . . . . . . . . . . . . . . . . . 125
Postnatal care . . . . . . . . . . . . . . . . . . . . . . . . . . . . . . . . . . . . . . . . . . . . . . . . . . . . . . . . . . . . . . . . . . . . . . . . . . . . . . . . 126
Timing of postnatal care . . . . . . . . . . . . . . . . . . . . . . . . . . . . . . . . . . . . . . . . . . . . . . . . . . . . . . . . . . . . . . . . . . . . 127
Postnatal care services . . . . . . . . . . . . . . . . . . . . . . . . . . . . . . . . . . . . . . . . . . . . . . . . . . . . . . . . . . . . . . . . . . . . . . 128
Vaccination by source of information . . . . . . . . . . . . . . . . . . . . . . . . . . . . . . . . . . . . . . . . . . . . . . . . . . . . 129
Vaccination by background characteristics.. . . . . . . . . . . . . . . . . . . . . . . . . . . . . . . . . . . . . . . . . . . . . . 131
Reasons for non-immunization . . . . . . . . . . . . . . . . . . . . . . . . . . . . . . . . . . . . . . . . . . . . . . . . . . . . . . . . . . . . 132
Prevalence of acute respiratory tnfection . . . . . . . . . . . . . . . . . . . . . . . . . . . . . . . . . . . . . . . . . . . . . . . . 133
Diarrhea prevalence . . . . . . . . . . . . . . . . . . . . . . . . . . . . . . . . . . . . . . . . . . . . . . . . . . . . . . . . . . . . . . . . . . . . . . . . . 135
Knowledge of diarrhea care . . . . . . . . . . . . . . . . . . . . . . . . . . . . . . . . . . . . . . . . . . . . . . . . . . . . . . . . . . . . . . . 136
Diarrhea treatment . . . . . . . . . . . . . . . . . . . . . . . . . . . . . . . . . . . . . . . . . . . . . . . . . . . . . . . . . . . . . . . . . . . . . . . . . . . 137
Treatment with vitamin A and Iron . . . . . . . . . . . . . . . . . . . . . . . . . . . . . . . . . . . . . . . . . . . . . . . . . . . . . . 139
Initial breastfeeding . . . . . . . . . . . . . . . . . . . . . . . . . . . . . . . . . . . . . . . . . . . . . . . . . . . . . . . . . . . . . . . . . . . . . . . . . 142
Breasfeeding status . . . . . . . . . . . . . . . . . . . . . . . . . . . . . . . . . . . . . . . . . . . . . . . . . . . . . . . . . . . . . . . . . . . . . . . . . . 143
Type of foods received by breastfeeding children in the preceding 24 hours .... . . . 145
Median duration aiad frequency of breastfeeding . . . . . . . . . . . . . . . . . . . . . . . . . . . . . . . . . . . . . . 146
Dengue fever . . . . . . . . . . . . . . . . . . . . . . . . . . . . . . . . . . . . . . . . . . . . . . . . . . . . . . . . . . . . . . . . . . . . . . . . . . . . . . . . . 148
Responsibility of dog owners . . . . . . . . . . . . . . . . . . . . . . . . . . . . . . . . . . . . . . . . . . . . . . . . . . . . . . . . . . . . . 149
Treatment of dog bites . . . . . . . . . . . . . . . . . . . . . . . . . . . . . . . . . . . . . . . . . . . . . . . . . . . . . . . . . . . . . . . . . . . . . . 149
ix

Page
Table 10.4
Table 10.5
Table 10.6
Table 10.7
Table 10.8
Table 10.9
Table 10.10
Table 10. I 1
Table 10.I2
Table 10.13
Table 10.14
Table 10.15
Table 10.16
Table A. I
Table B. 1
Table B. 1.1
Table B. 1.2
Table B. 1.3
Table B. 1.4
Table B.1.5
Table B. 1.6
Table B. 1.7
Table B. 1.8
Table B. 1.9
Table B.I.10
Table B. 1.11
Table B.I.12
Table B.l.13
Table B. 1.14
Table B. 1.15
Table B. 1.16
Table B.1.17
Table B. 1.18
Perceived transmission of leprosy . . . . . . . . . . . . . . . . . . . . . . . . . . . . . . . . . . . . . . . . . . . . . . . . . . . . . . . . 150
Curability of leprosy . . . . . . . . . . . . . . . . . . . . . . . . . . . . . . . . . . . . . . . . . . . . . . . . . . . . . . . . . . . . . . . . . . . . . . . . 151
Causes of tuberculosis . . . . . . . . . . . . . . . . . . . . . . . . . . . . . . . . . . . . . . . . . . . . . . . . . . . . . . . . . . . . . . . . . . . . . . 152
Length of TB treatment . . . . . . . . . . . . . . . . . . . . . . . . . . . . . . . . . . . . . . . . . . . . . . . . . . . . . . . . . . . . . . . . . . . . . 153
Ways to keep healthy . . . . . . . . . . . . . . . . . . . . . . . . . . . . . . . . . . . . . . . . . . . . . . . . . . . . . . . . . . . . . . . . . . . . . . . . 154
Effects of smoking on health . . . . . . . . . . . . . . . . . . . . . . . . . . . . . . . . . . . . . . . . . . . . . . . . . . . . . . . . . . . . . . . I55
Signs and symptoms of cancer . . . . . . . . . . . . . . . . . . . . . . . . . . . . . . . . . . . . . . . . . . . . . . . . . . . . . . . . . . . . . 156
Use ofpre-cooked food . . . . . . . . . . . . . . . . . . . . . . . . . . . . . . . . . . . . . . . . . . . . . . . . . . . . . . . . . . . . . . . . . . . . . 157
Health care financing membership . . . . . . . . . . . . . . . . . . . . . . . . . . . . . . . . . . . . . . . . . . . . . . . . . . . . . . . . 158
Type of insurance plan . . . . . . . . . . . . . . . . . . . . . . . . . . . . . . . . . . . . . . . . . . . . . . . . . . . . . . . . . . . . . . . . . . . . . . . I58
Familiarity with herbal medicines . . . . . . . . . . . . . . . . . . . . . . . . . . . . . . . . . . . . . . . . . . . . . . . . . . . . . . . . . 159
Utilization of health facilities . . . . . . . . . . . . . . . . . . . . . . . . . . . . . . . . . . . . . . . . . . . . . . . . . . . . . . . . . . . . . . . 16i
Utilization of health facilities by type of service accessed. . . . . . . . . . . . . . . . . . . . . . . . . . . . . 162
Sample Implementation . . . . . . . . . . . . . . . . . . . . . . . . . . . . . . . . . . . . . . . . . . . . . . . . . . . . . . . . . . . . . . . . . . . . 167
List of variables for sampling errors, Philippines 1998 . . . . . . . . . . . . . . . . . . . . . . . . . . . . . . . . 174
Sampling errors: Entire sample, Philippines, I998 . . . . . . . . . . . . . . . . . . . . . . . . . . . . . . . . . . . . . 175
Sampling errors: Urban sample, Philippines, 1998 . . . . . . . . . . . . . . . . . . . . . . . . . . . . . . . . . . . . . I76
Sampling errors: Rural sample, Philippines, 1998 . . . . . . . . . . . . . . . . . . . . . . . . . . . . . . . . . . . . . 177
Sampling errors: National Capital Region sample, Philippines, 1998 . . . . . . . . . . . . . . . 178
Sampling errors: Cordillera Administrative Region sample, Philippines, 1998 .... 179
Sampling errors: Ilocos sample, Philippines, 1998 . . . . . . . . . . . . . . . . . . . . . . . . . . . . . . . . . . . . . 180
Sampling errors: Cagayan Valley sample, Philippines, 1998 . . . . . . . . . . . . . . . . . . . . . . . . . 181
Sampling errors: Central Luzon sample, Philippines, 1998 . . . . . . . . . . . . . . . . . . . . . . . . . . . 182
Sampling errors: Southern Tagalog sample, Philippines, 1998 . . . . . . . . . . . . . . . . . . . . . . . 183
Sampling errors: Bicol sample, Philippines, 1998 . . . . . . . . . . . . . . . . . . . . . . . . . . . . . . . . . . . . . 184
Sampling errors: Western Visayas sample, Philippines, 1998 . . . . . . . . . . . . . . . . . . . . . . . . 185
Sampling errors: Central Visayas sample, Philippines, 1998 . . . . . . . . . . . . . . . . . . . . . . . . . 186
Sampling errors: Eastern Visayas sample, Philippines, 1998 . . . . . . . . . . . . . . . . . . . . . . . . . 187
Sampling errors: Western Mindanao sample, Philippines, 1998 . . . . . . . . . . . . . . . . . . . . . 188
Sampling errors: Northern Mindanao sample, Philippines, 1998 . . . . . . . . . . . . . . . . . . . 189
Sampling errors: Southern Mindanao sample, Philippines, 1998 . . . . . . . . . . . . . . . . . . . . 190
Sampling errors: Central Mindanao sample, Philippines, 1998 . . . . . . . . . . . . . . . . . . . . . . 191
Sampling errors: Autonomous Region of Muslim Mindanao sample,
Philippines, 1998 . . . . . . . . . . . . . . . . . . . . . . . . . . . . . . . . . . . . . . . . . . . . . . . . . . . . . . . . . . . . . . . . . . . . . . . . . . . . 192
X

Table B.l.19
Table C. 1
Table C.2
Table C.3
Table CA
Tal:le C.5
"I able C.6
Page
Sampling errors: Caraga sample, Philippines, 1998 . . . . . . . . . . . . . . . . . . . . . . . . . . . . . . . . . . . . 193
Household age distribution . . . . . . . . . . . . . . . . . . . . . . . . . . . . . . . . . . . . . . . . . . . . . . . . . . . . . . . . . . . . . . . . 198
Age distribution of eligible and interviewed women . . . . . . . . . . . . . . . . . . . . . . . . . . . . . . . . . 199
Completeness of reporting . . . . . . . . . . . . . . . . . . . . . . . . . . . . . . . . . . . . . . . . . . . . . . . . . . . . . . . . . . . . . . . . 199
Births by calendar year since birth . . . . . . . . . . . . . . . . . . . . . . . . . . . . . . . . . . . . . . . . . . . . . . . . . . . . . . . 200
Reporting of age at death in days . . . . . . . . . . . . . . . . . . . . . . . . . . . . . . . . . . . . . . . . . . . . . . . . . . . . . . . . . 201
Reporting of age at death in months . . . . . . . . . . . . . . . . . . . . . . . . . . . . . . . . . . . . . . . . . . . . . . . . . . . . . 202
xi


FIGURES
Figure 2.1
Figure 2.2
Figure 2.3
Figure 2.4
Figure 2.5
Figure 3.1
Figure 3.2
Figure 3.3
Figure 3.4
Figure 3.5
Figure 3.6
Figure 3.7
Figure 3.8
Figure 4.1
Figure 4.2
Figure 4.3
Figure 4.4
Figure 5.1
Figure 5.2
Figure 5.3
Page
Single-year age distribution of the household population, by sex . . . . . . . . . . . . . . . . 8
Distribution of the household population by age and sex . . . . . . . . . . . . . . . . . . . . . . 9
Median years of schooling by sex and region . . . . . . . . . . . . . . . . . . . . . . . . . . . . . . . 11
Housing conveniences by residence . . . . . . . . . . . . . . . . . . . . . . . . . . . . . . . . . . . . . . 16
Distribution of respondents by religion and ethnieity . . . . . . . . . . . . . . . . . . . . . . . . . 20
Total fertility rates in selected countries in Southeast Asia . . . . . . . . . . . . . . . . . . . . 32
Age-specific fertility rates by residence . . . . . . . . . . . . . . . . . . . . . . . . . . . . . . . . . . . 34
Total fertility rate among women age 15-49 by residence and education . . . . . . . . . 34
Total fertility rate, Philippines 1970-1996 . . . . . . . . . . . . . . . . . . . . . . . . . . . . . . . . . 36
Mean number of children ever born among women age 15-49 by age group . . . . . . . . . . . . . . . . . . . . . . . . . . . . . . . . . . . . . . . . . . . . . . . . . . . . . . . . . . . 39
Median number of months since previous birth by age of mother and birth order . . . . . . . . . . . . . . . . . . . . . . . . . . . . . . . . . . . . . . . . . . . . . . . . . . . . . . . 40
Percentage of women age 15-19 (teenagers) who have begun childbearing by residence and education . . . . . . . . . . . . . . . . . . . . . . . . . . . . . . . . . . . . . . . . . . . . . 46
Percentage of women age 15-19 (teenagers) who have begun childbearing by region . . . . . . . . . . . . . . . . . . . . . . . . . . . . . . . . . . . . . . . . . . . . . . . . . . . . . . . . . . . 46
Knowledge of contraception among currently married women age 15-49 . . . . . . . . . 49
Use of contraception among currently married women 15-19 . . . . . . . . . . . . . . . . . . 53
Trends in contraceptive use, Philippines 1968-1998 . . . . . . . . . . . . . . . . . . . . . . . . . 56
Contraceptive discontinuation rates for first year of life . . . . . . . . . . . . . . . . . . . . . . 66
Median age at first marriage by residence and education . . . . . . . . . . . . . . . . . . . . . . 78
median ge at first marriage by region . . . . . . . . . . . . . . . . . . . . . . . . . . . . . . . . . . . . . 78
Percentage of births for which mothers are postpartum amenorrheic, abstaining and insusceptible . . . . . . . . . . . . . . . . . . . . . . . . . . . . . . . . . . . . . . . . . . . . 84
xiii

Figure 6.1
Figure 6.2
Figure 6.3
Figure 6.4
Figure 6.5
Figure 7.1
Figure 7.2
Figure 7.3
Figure 8. I
Figure 8.2
Figure 8.3
Figure 8.4
Fignre 8.5
Figure 8.6
Figure 9.1
Figure 10.1
Figure 10.2
Page
Fertility preferences among currently married women age 15-49 . . . . . . . . . . . . . . . 91
Percentage of currently married women who want no more children by residence and region . . . . . . . . . . . . . . . . . . . . . . . . . . . . . . . . . . . . . . . . . . . . . . . . 92
Mean ideal number of children for all women by region . . . . . . . . . . . . . . . . . . . . . . 98
Currently married women by perceived consensus with husband regarding the number of children desired . . . . . . . . . . . . . . . . . . . . . . . . . . . . . . . . . 102
Currently ma~ied women whose desired number of children is the same as that perceived as desired by their husband . . . . . . . . . . . . . . . . . . . . . . . . . 102
Deaths among children under two years for three 5-year periods preceding the survey . . . . . . . . . . . . . . . . . . . . . . . . . . . . . . . . . . . . . . . . . . . . . . . . . 104
Trends in infant mortality in the Philippines, various sources, 1970-1995 . . . . . . . 106
Infant mortality by background characteristics . . . . . . . . . . . . . . . . . . . . . . . . . . . . . 108
Number of prenatal care visits and stage of pregnancy at first visit . . . . . . . . . . . . . 115
Knowledge of dangerous signs and symptoms during pregnancy among women who received prenatal care . . . . . . . . . . . . . . . . . . . . . . . . . . . . . . . . . . . . . . 117
Percentage of live births with complications during pregnancy . . . . . . . . . . . . . . . . 123
Distribution of live births by source of postnatal care . . . . . . . . . . . . . . . . . . . . . . . 127
Vaccination coverage among children 12-23 months . . . . . . . . . . . . . . . . . . . . . . . . 130
Feeding practices among children under five with diarrhea . . . . . . . . . . . . . . . . . . . 138
Distribution of children by breastfeeding (BF) status according to age . . . . . . . . . . 144
Sources of Anti-TB medicines . . . . . . . . . . . . . . . . . . . . . . . . . . . . . . . . . . . . . . . . . 153
Percentage of households that utilized health facilities in the 6 months preceding the survey . . . . . . . . . . . . . . . . . . . . . . . . . . . . . . . . . . . . . . . . . . . . . . . . . 162
xiv

P R E F A C E
The National Statistics Office (NSO) is pleased to present this final report on the 1998 National Demographic and Health Survey (NDHS). The survey is the seventh in a series of surveys conducted every five years since 1968 to measure trends in demographic and family planning indicators. It was implemented by the NSO in collaboration with the Department of Health. Fieldwork for the NDHS took place from early March to early May and covered a sample of over 12,000 households and 14,000 women of childbearing age.
The successful completion of the 1998 NDHS was made possible by the joint efforts of a number of organizations and individuals whose pa~ieipation I would like to acknowledge with gratitude. First is the U.S. Agency for International Development (USAID)/Philippines which initiated planning for the survey and provided substantial financial assistance for the implementation of the sampling and data collection. The Department of Health (DOH), University of the Philippines Population Institute, Commission on Population and Food and Nutrition Research Institute collaborated on all stages of the survey, assisting in the design, field staff training, and fieldwork. DOH also provided financial assistance and participated in the analysis and production of this report. We would also like to thank the Demographic and Health Surveys program of Macro International Inc. in Maryland U.S.A. for providing technical assistance in all phases of the project. As part of its ongoing assistance to NSO in the design and implementation of a new master sample, the U.S. Bureau of the Census provided invaluable assistance in the design and selection of the NDHS sub-sample. The survey would not have gotten offthe ground without the exemplary, untiring efforts of the staff at the Household Statistics Department and at the NSO regional and provincial offices. They spent many long days, nights and weekends of overtime work to make this survey a success. Finally we are ever mindful of the generosity of our respondents in contributing their time and information to enable us to gather crucial data for our country's future planning.
Manila, Philippines January 1999
TqMA ~ P. ~,FRICA Adm'l~istr~or
National StatiStics Office
XV


P R E F A C E
The Department of Health is proud to have been involved in the implementation of the 1998 National Demographic and Health Survey. The survey has provided much needed information that will be used in evaluating DOH programs and in planning future directions. In fact, there are few survey findings that do not have direct relevance to DOH programs. Data from the households interviewed concerning source of drinking water, type of toilet facility, and use of iodized salt are basic indicators of the home health environment. Data collected from individual women such as levels of contraceptive use, fertility and child mortality rates, and the extent of coverage of various reproductive health services will be used to assess progress in the relevant DOH programs. Regional-level indicators will point to the areas where more concentrated efforts are needed. Finally, the special health module that was added to the survey at the request of the DOH provides results of particular interest to DOH concerning health facility utilization, knowledge of the causes of various diseases, knowledge and use of traditional medicines, and health insurance coverage.
I would like to thank the National Statistics Office for taking the lead in implementing the 1998 NDHS. I heartily support such collaborative efforts between government agencies because they result in a better product at lower cost. Perhaps more importantly, collaboration encourages a wider sense of ownership of the data and ensures its broader use. I hope that the future will hold more examples of such fruitful joint efforts.
Manila, Philippines January 1999
A L B E R ~ J R . , M.D. Secretary
Department of Health
xvii


SUMMARY OF FINDINGS
The 1998 Philippines National Demographic and Health Survey (NDHS). is a nationally- representative survey of 13,983 women age 15-49. The NDHS was designed to provide information on levels and trends of fertility, family planning knowledge and use, infant and child mortality, and maternal and child health. It was implemented by the National Statistics Office in collaboration with the Department of Health (DOH). Macro International Inc. of Calverton, Maryland provided technical assistance to the project, while financial assistance was provided by the U.S. Agency for International Development (USAID) and the DOH. Fieldwork for the NDHS took place from early March to early May 1998.
Survey data generally confirm patterns observed in the 1993 National Demographic Survey (NDS), showing increasing contraceptive use and declining fertility.
F E R T I L I T Y
Fertility Decline. The NDHS data indicate that fertility continues to decline gradually but steadily. At current levels, women will give birth an average of 3.7 children per woman during their reproductive years, a decline from the level of 4.1 recorded in the 1993 NDS. A total fertility rate of 3.7, however, is still considerably higher than the rates prevailing in neighboring Southeast Asian countries.
Fertility Differentials. Survey data show that the large differential between urban and rural fertility levels is widening even further. While the total fertility rate in urban areas declined by about 15 percent over the last five years (from 3.5 to 3.0), the rate among rural women barely declined at all (from 4.8 to 4.7). Consequently, rural women give birth to almost two children more than urban women.
Significant differences in fertility levels by region still exist. For example, fertility is more than twice as high in Eastern Visayas and Bicol Regions (with total fertility rates well over 5 births per woman) than in Metro Manila (with a rate of 2.5 births per woman).
Fertility levels are closely related to women's education. Women with no formal education give birth to an average of 5.0 children in their lifetime, compared to 2.9 for women with at least some college education. Women with either elementary or high school education have intermediate fertility rates.
Family Size Norms. One reason that fertility has not fallen more rapidly is that women in the Philippines still want moderately large families. Only one-third of women say they would ideally like to have one or two children, while another third state a desire for three children. The remaining third say they would choose four or more children. Overall, the mean ideal family size among all women is 3.2 children, identical to the mean found in 1993.
Unplanned Fertility. Another reason for the relatively high fertility level is that unplanned pregnancies are still common in the Philippines. Overall, 45 percent of births in the five years prior to the survey were reported to be unplanned; 27 percent were mistimed (wanted later) and 18 percent were unwanted. I f unwanted births could be eliminated altogether, the total fertility rate in the Philippines would be 2.7 births per woman instead of the actual level of 3.7.
xix

Age at First Birth. Fertility rates would be even higher if Filipino women did not have a pattem of late childbearing. The median age at first birth is 23 years in the Philippines, considerably higher than in most other countries. Another factor that holds down the overall level of fertility is the fact that about 9 or 10 percent of women never give birth, higher than the level of 3-4 percent found in most developing countries.
F A M I L Y P L A N N I N G
Increasing Use of Contraception. A major cause of declining fertility in the Philippines has been the gradual but fairly steady increase in contraceptive use over the last three decades. The contraceptive prevalence rate has tripled since 1968, from 15 to 47 percent of married women. Although contraceptive use has increased since the 1993 NDS (from 40 to 47 percent of married women), comparison with the series of nationally representative Family Planning Surveys indicates that there has been a levelling-off in family planning use in recent years.
Method Mix. Use of traditional methods of family planning has always accounted for a relatively high proportion of overall use in the Philippines, and data from the 1998 NDHS show the proportion holding steady at about 40 percent. The dominant changes in the "method mix" since 1993 have been an increase in use of injectables and traditional methods such as calendar rhythm and withdrawal and a decline in the proportions using female sterilization. Despite the decline in the latter, female sterilization still is the most widely used method, followed by the pill.
Differentials in Family Planning Use. Differentials in current use of family planning in the 16 administrative regions of the country are large, ranging from 16 percent of married women in ARMM to 55 percent of those in Southern Mindanao and Central Luzon. Contraceptive use varies considerably by education of women. Only 15 percent of married women with no formal education are using a method, compared to half of those with some secondary school. The urban-rural gap in contraceptive use is moderate (51 vs. 42 percent, respectively).
Knowledge of Contraception. Knowledge of contraceptive methods and supply sources has been almost universal in the Philippines for some time and the NDHS results indicate that 99 percent of currently married women age 15-49 have heard of at least one method of family planning. More than 9 in 10 married women know the pill, IUD, condom, and female sterilization, while about 8 in 10 have heard of injectables, male sterilization, rhythm, and withdrawal. Knowledge of injectables has increased far more than any other method, from 54 percent of married women in 1993 to 89 percent in 1998.
Unmet Need for Family Planning. Unmet need for family planning services has declined since I993. Data from the 1993 NDS show that 26 percent of currently married women were in need of services, compared with 20 percent in the 1998 NDHS. A little under half of the unmet need is comprised of women who want to space their next birth, while just over half is for women who do not want any more children (limiters). If all women who say they want to space or limit their children were to use methods, the contraceptive prevalence rate could be increased from 47 percent to 70 percent of married women. Currently, about three-quarters of this "total demand" for family planning is being met.
XX

Discontinuation Rates. One challenge for the family planning program is to reduce the high levels of contraceptive discontinuation. NDHS data indicate that about 40 percent of contraceptive users in the Philippines stop using within 12 months of starting, almost one-third of whom stop because of an unwanted pregnancy (i.e., contraceptive failure). Discontinuation rates vary by method. Not surprisingly, the rates for the condom (60 percent), withdrawal (46 percent), and the pill (44 percent) are considerably higher than for the 1UD (14 percent). However, discontinuation rates for injectables are relatively high, considering that one dose is usually effective for three months. Fifty-two percent of injection users discontinue within one year of starting, a rate that is higher than for the pill.
MATERNAL AND CHILD HEALTH
Childhood Mortality. Survey results show that although the infant mortality rate remains unchanged, overall mortality of children under five has declined somewhat in recent years. Under-five mortality declined from 54 deaths per 1,000 births in 1988-92 to 48 for the period 1993-97. The infant mortality rate remained stable at about 35 per 1,000 births.
Childhood Vaccination Coverage. The 1998 NDHS results show that 73 percent of children 12- 23 months are fully vaccinated by the date of the interview, almost identical to the level of 72 percent recorded in the 1993 NDS. When the data are restricted to vaccines received before the child's first birthday, however, only 65 percent of children age 12-23 months can be considered to be fully vaccinated.
Childhood Health. The NDHS provides some data on childhood illness and treatment. Approximately one in four children under age five had a fever and 13 percent had respiratory illness in the two weeks before the survey. Of these, 58 percent were taken to a health facility for treatment. Seven percent of children under five were reported to have had diarrhea in the two weeks preceeding the survey. The fact that four-fifths of children with diarrhea received some type of oral rehydration therapy (fluid made from an ORS packet, recommended homemade fluid, or increased fluids) is encouraging.
Breastfeeding Practices. Almost all Filipino babies (88 percent) are breastfed for some time, with a median duration of breastfeeding of 13 months. Although breastfeeding has beneficial effects on both the child and the mother, NDHS data indicate that supplementation of breastfeeding with other liquids and foods occurs too early in the Philippines. For example, among newborns less than two months of age, 19 percent were already receiving supplemental foods or liquids other than water.
Maternal Health Care. NDHS data point to several areas regarding maternal health care in which improvements could be made. Although most Filipino mothers (86 percent) receive prenatal care from a doctor, nurse, or midwife, tetanus toxoid coverage is far from universal and has been declining somewhat. The proportion of recent births for which the mother reported receiving two or more tetanus toxoid vaccinations during pregnancy declined from 42 in 1993 to 38 percent. Moreover, two-thirds of births in the Philippines are delivered at home; consequently only 56 percent receive asistance at delivery from a doctor, nurse, or midwife and 41 percent are assisted by traditional birth attendants. Proper medical attention during pregnancy and hygienic conditions during delivery can reduce the risk of complications and infections that can cause death or serious illness for either the mother or the newborn. Somewhat more encouraging is the fact that for 75 percent of recent births, mothers reported having received iron tablets during pregnancy and in 57 percent of cases, they received iodine tablets during pregnancy. Maternal mortality has remained low at approximately 200 maternal deaths per 100,000 live births.
xxi

HOUSEHOLD HEALTH ISSUES
Health Care ~inaneing. NDHS data indicate that in 40 percent of households, at least one member of the household belongs to a health care financing scheme or an insurance plan. Over 90 percent of such households belong to Medicare.
Knowledge of Herbal Medieines. The Depar~nent of Health has endorsed 10 herbal medicines as being scientifically proven effective for treatment of specific illnesses and conditions. NDHS data show that although awareness of some of these herbs is widespread, knowledge about the specific uses of the herbs is quite limited. For example, although 81 percent of household respondents recognized ampalaya, only one in 20 know that it is useful in treating diabetes and only 6 percent of the 75 percent of respondents who are familiar with sambong correctly said that it is used as a diuretic. However, knowledge of bayabas is high; 97 percent of household respondents had heard of it and 81 percent know that it is used to clean wounds.
Knowledge of Healthy Lifestyle. NDHS data indicate quite high general awareness regarding health issues. For example, most household respondents say that they watch their nutrition or exercise to stay healthy. Similarly, a majority of household respondents are aware that smoking causes lung diseases such as cancer. Over 90 percent of respondents have heard of dengue fever and two-thirds of them say that dengue can be prevented by destroying the breeding sites of mosquitos. However, misconceptions about leprosy and tuberculosis abound, with 21 percent of respondents knowing that leprosy is transmitted by skin and 11 percent by airborne droplets, and only one in six respondents knowing that tuberculosis is caused by a germ or bacteria.
xxii

P H I L I P P I N E S ,¢ .#
CORDILLERA ADMINISTRATIVE I i REGION (OAR)\
CHINA SEA
REGION I ILOCOS
OAGAYAN VALLEY
PACIFIC OCEAN
REGIONIII CENTRAL LUZON REGION V
REGION(NCR)
SOUTHERN TAGALOG
t f • ",o
REGION VI WESTERN VISAYAS
I
OENTRAL VISAYAS
I t
EASTERN VlSAYAS
REGION
O
REGIONIX- WESTERN MINOANAO
REGION Xll- OENTRAL, MINDANAO 6". /
~ . ~ o ; ~ AUTONOMOUS REGION • OF MUSLIM MINDANAO
CELEBES SEA
REGION XI SOUTHERN MINDANAO
NORTHERN MINOANAO


CHAPTER 1
INTRODUCTION
1.1 Background
Demographic surveys are the primary source of data used in monitoring the progress and evaluating the impact of the population program of the country. The Philippine Population Program was officially launched in 1970. Since then, it has undergone many changes in its policy and program directions. In the beginning, the program was centered on fertility reduction and contraceptive distribution, using a clinic-based approach. In the 1970s, the family planning program shifted to a family welfare approach, adopting a combined clinic and community-based delivery approach. In the 1980s, the population policy was re-stated, calling for the broadening of population concerns beyond fertility reduction to cover family formation, the status of women, maternal and child health, morbidity and mortality, population distribution and urbanization, internal and international migration and population structure (POPCOM, 1997: p.1). The Philippine Population Management Program (PPMP) was developed in 1993 to supplant the Philippine Population Program (PNGOC, 1998: p 25.).
The PPMP adopts the population, resources and environment (PRE) framework which defines the connection between population and sustainable development. Its overall goal is the improvement of quality of life by creating a favorable environment for achieving rational growth and distribution of population, defined in relation to resources and environment. In the years 1998 to 2003, the program aims at promoting the reproductive health approach in the implementation of population policies and programs. Specifically, the Philippine Family Planning Program (PFPP) will promote family planning within a comprehensive package of reproductive health services (POPCOM, 1997: p.17). The action agenda includes:
1) reducing unmet need for family planning services, 2) reducing incidence of high-risk pregnancies, 3) making available high-quality family planning serviees, 4) reducing abortion, and 5) increasing the participation and sharing of responsibility of men in the practice of
family planning (POPCOM, 1997: p.19).
The Department of Health (DOH) is the lead agency for the reproductive health and family planning component of the PPMP. The Commission on Population (POPCOM) is the coordinating body of the PPMP (POPCOM, 1997: p. 5-6).
The 1998 National Demographic and Health Survey (NDHS) is the seventh in a series of demographic surveys taken at five-year intervals since 1968. It is a nationwide sample survey designed to collect information on fertility, family planning, and health in the Philippines. The 1998 NDHS was undertaken as part of the worldwide Demographic and Health Survey (DHS) program. "It was conducted by the National Statistics Office (NSO), in collaboration with the Department of Health (DOH).

Macro International, Inc., which is based in Calverton, Maryland (USA), provided technical assistance to the project. The University of the Philippine Population Institute (UPPI), The Population Commission (POPCOM), the Food and Nutrition Research Institute (FNR1) and the DOH also provided technical inputs during the preparatory phase of the survey. Financial assistance was provided by the U.S. Agency for International Development (USAID) and the DOH.
This report presents the findings from the 1998 NDHS regarding the principal topics covered in the survey, namely, fertility, family planning, infant and child mortality, infant feeding practices, maternal and child health, as well as general health. The NDHS data can be useful inputs for the implementation of some major program tasks of the government under the Philippine Population Management Program (PPMP). These data can be utilized for research activities aimed at improving program strategies. Together with data from previous demographic surveys, the survey ean serve as an instrument to monitor the progress and evaluate the impact of the PPMP.
1.2 Objectives of the Survey
The primary objective of the NDHS is to PrOvide up-to-date information on fertility levels; determinants of fertility; fertility preferences; infant and childhood mortality levels; awareness, approval, and use of family planning methods; breastfeeding practices; and maternal and child health. This information is intended to assist policy makers and program managers in evaluating and designing programs and strategies for improving health and family planning services in the country.
1.3 Sample Design
The 1998 NDHS aims at providing estimates for each of the sixteen regions of the country with an acceptable precision for socio-demographic characteristics like fertility, family planning use, and health and mortality indicators. The NDHS sample design consisted of selecting some 12,500 households in 755 enumeration areas (EAs) which was expected to produce completed interviews with approximately 15,000 women age 15-49. The sample was first allocated to each of the regions. Within each region, a self-weighting sampling scheme was adopted; however, due to the non-proportional allocation of the sample to the regions, the NDHS sample is not self-weighting at the national level and weighting factors have been applied to the data.
The 1998 NDHS sample is a sub-sample of the new master sample of the Integrated Survey of Households (ISH) of the NSO. The expanded sample of ISH consists of 3,416 enumeration areas selected from the 1995 census frame with a sophisticated design that allows for regional estimates with periodic rotation of panels. The ISH expanded sample was drawn by first, selecting barangays systematically with probability proportional to size. In barangays that consist of more than one EA, a subsequent step consisted of selecting the sample Elk systematically with probability proportional to size. Because the primary sampling units in the ISH were selected with probability proportional to size, the EAs for the NDHS were sub-selected from the ISH with equal probability to make the NDHS selection equivalent to selection with probability proportional to size. A total of 755 primary sampling units were utilized for the NDHS. Fieldwork in three sample EA was not possible, so a total of 752 EAs Were covered.

The list of households based on the household listing operation conducted in all the NDHS sample points in November 1997 served as the frame for the selection of the NDHS sample households. A different scheme for selecting sample households was applied to urban and rural areas. A systematic sampling of households was carried out in urban areas in order to spread the NDHS sample throughout the sampled EA, while compact clustering was employed in rural areas in order to facilitate field operations. This was accomplished by taking a specified number of consecutive households starting with a household selected at random. Detailed discussion of the 1998 NDHS sampling design is presented in Appendix A. Sampling errors can be found in Appendix B.
1.4 Questionnaires
There were three types of questionnaires used for the 1998 NDHS: the Household Questionnaire 0xrDHS Form 1), the Individual Questionnaire (NDHS Form 2), and the Health Module (NDHS Form 3). The contents of the first two questionnaires were based on the DHS Model A Questionnaire, which is designed for use in countries with relatively high levels of contraceptive use. These model questionnaires were adapted for use in the Philippines during a series of meetings with representatives from the DOH, UPPI, POPCOM, FNRI, USAID/Philippines, and Macro International Inc. Draft questionnaires were then circulated to other interested groups. These questionnaires were developed in English (see Appendix E) and were translated into six of the most common dialects, namely, Tagalog, Cebuano, Ilocano, Bicol, Hiligaynon, and Waray.
The Household (HH) Questionnaire was used to list all the usual members of the sample household, and visitors who slept in the sample household the night prior to the date of interview and some of their characteristics such as name, age, sex, education, relationship to household head, and usual residence. Information on age and sex from the HH Questionnaire was used to identify eligible women for interview using the Individual Questionnaire. Questions about the dwelling such as the source of drinking water, type of toilet facilities, ownership of various consumer goods and use of iodized were also included in the Household Questionnaire.
The Individual Questionnaire was used to collect information on the following top!cs:
• Background characteristics (age, education, religion, etc.)
• Reproductive history and fertility preferences
• Knowledge and use of contraception
• Availability of family planning supplies and services
• Breastfeeding and child health
• Maternal mortality
The Health Questionnaire was developed in close collaboration with the DOH in partial substitution for the cancelled National Health Survey, It included questions on health practice s of the household, awareness about selected communicable ~ind non-communicable diseases, utilization of and satisfaction with various types of health facilities, knowledge concerning traditional medicines, and health care financing.

1.5 Training and Fieldwork
The NDHS questionnaires were pretested in October 1997. Female interviewers were trained at the NSO central office in Manila, after which they conducted interviews in various locations in the field under the observation of staff from NSO central office. Altogether, approximately 160 Household, Woman's and Health Questionnaires were completed. Based on observations in the field and suggestions made by the pretest field teams, revisions were made in the wording and translations of the questionnaires.
Training for the main survey took place in two phases. In the first phase, approximately 35 trainers from NSO, DOH, UPPI, and POPCOM gathered for two weeks in late January at a training center near the NSO central office in Manila. They received thorough training in how to fill and edit the questionnaires, how to supervise fieldwork, and how to train field staff in their respective training sites. These trainers then dispersed to the six training sites (Agoo, Malolos, Lucena City, Cebu City, Iloilo City, and Davao City) where they trained some 261 interviewers, 44 supervisors, and 43 field editors for three weeks (February 9-27, 1998). Initially, training consisted of lectures on how to complete the questionnaires, with mock interviews between participants to gain practice in asking questions. Towards the end of the training course, the participants spent several days in practice interviewing in households near the training sites.
Fieldwork for the NDHS was carried out by 44 interviewing teams. Each team, except that which covered Palawan, Lanao del Sur and Maguindanao, consisted of 1 supervisor, 1 field editor, and 3-7 female interviewers, for a total of 348 field staff. Fieldwork commenced on 3 March 1998 and was completed in the first week of May 1998. Periodic field monitoring of the NDHS operations was done by the NSO regional and provincial officials, NDHS regional supervisors and selected NSO central office staff.
1.6 Data Processing
Review and editing of NDHS questionnaires was done by the field editors while they were in the enumeration areas to facilitate the verification of the forms. The editors were expected to review questionnaires of at least 8 households per day. The supervisors of teams with more than four interviewers assisted the editors in reviewing the questionnaires.
Folioing of forms was done by the team supervisors before submission to the Provincial Office. The Provincial Statistics Officers were responsible for the transmittal of these forms to the Central Office.
On March 16, 1998, eighteen hired NDHS data processors started the data processing at the Central Office. Office editing, data entry, key verification (100%), and machine processing were done simultaneously. There were two stages involved in the machine processing. In the first stage, keyed-in data were checked for completeness and were matched with the verification data. In the second stage, inconsistencies in the data were noted and checked. All the data processing activities were completed on June 30, 1998.
4

1.7 Response Rate
Table 1 shows the response rates for the survey and reasons for non-response. A total of 13,708 households were selected for the sample, of which 12,567 were occupied. Of these households occupied, 99 percent or 12,407 were successfully interviewed. The shortfall is primarily due to dwellings that were vacant or in which the inhabitants had le~ for an extended period at the time they were visited by the interviewing teams (see Appendix Table A.1 for details.)
In the households interviewed, 14,390 women were identified as eligible for the individual interview (i.e. age 15-49) and interviews were completed for 13,983 or 97 percent of them. The principal reason for non-response among eligible women was the failure to find them at home despite repeated visits to the household. The refusal rate was low.
Table 1 Sample results
Number of households, number of interviews and response rates, Philippines 1998
Result Number Percent
Households selected 13,708 100.0 Households occupied 12,567 91.6 Households absent for extended 202 1.5
period Dwelling vaeanffdestroyed 853 6.2
Householdsoceupied 12,567 100.0 Households interviewed 12,407 98.7 Households not interviewed 160 1.3
Eligible women 14,390 100.0 Women interviewed 13,983 97.2 Women not interviewed 407 2.8
Source: NSO, DOH and MI, 1998 NDHS


CHAPTER 2
BACKGROUND CHARACTERISTICS OF HOUSEHOLDS AND RESPONDENTS
Presented in this chapter are the background characteristics of the sample households and the respondents to the survey. Information on the characteristics of the households and respondents is deemed important in the interpretation of the survey results. The behavior of women concerning demographic phenomena is known to be influenced by their characteristics and their environment. Also, analysis of the reported characteristics of the sample households and the respondents can indicate the quality of the information collected and whether or not it is representtive of the population.
The chapter is divided into three parts. The first part deals with the characteristics of the household population in terms of age-sex composition, household size and distribution, and educational background. The second part describes the housing environment in which the respondents live. The characteristics of the individual women respondents to the survey are discussed in the third part of this chapter.
2.1 Age.Sex Composition
The household questionnaire used in the 1998 National Demographic and Health Survey (NDHS) collected data on the demographic and social characteristics of the members and visitors in each sample household. A household, as defined in the survey, refers to a person or group of persons who usually sleep in the same housing unit and have a common arrangement for the preparation and consumption of food. A visitor, on the other hand, is someone who is not a usual resident of the household but slept in the household the night prior to the interview. In this report, except in Table 2.2 census figures, data are based on the population according to the place where they spent the night before the interview (de facto).
Age reporting in the Philippines is relatively accurate. The present generation of residents, including those living in the rural areas, seems to be conscious of calendar dates, especially those relating to important events in their personal lives such as birthdays. The distribution of the sampled population by single year of age and by sex is presented in Figure 2.1 and in Appendix Table C.1. Examination of the data and the graph reveals only a slight preference for digits ending in 0 and 5 when reporting ages. Another indication of the quality of age reporting is the number of women age 15 and age 49 relative to those age 14 and 50. In some surveys, including the 1993 NDS, there was displacement of women from age 15 to age 14 and from age 49 to 50, probably done intentionally by the interviewers to reduce their assigned workload. The data in Table C.1 indicate that this was not a problem in the 1998 NDHS.
The proportion of the population below 15 years is larger in rural than in urban areas, indicating a younger age structure of the rural population (Table 2.1). In urban areas, the proportion is, however, larger for males than for females but it differs little between the sexes in rural areas, On the whole, it can be said that the composition of the Philippine population by age and sex depicts a population pyramid (Figure 2.2) with a wide base and narrow top, a pattern that is typical of high fertility societies.
7

900
800
700
600
500
400
300
200
t00
Figure 2.1 Single-year Age Distribution of the Household Population,
by Sex, Philippines
Number of Persons
I I I I I I I l l I I I I
5 10 15 20 25 30 35 40 45 50 55 60 65 70
Age I - -Male +Female ]
1998 NDH$
Table 2.1 Household votmlation by a~e. residence and sex
Percent distribution of the de facto household population by five-year age groups, according to urban-rural residence and sex, Philippines 1998
Age Urban Rural Total group Male Female Total Male Fema!e Total Male Female Total.
0-4 13.1 10.8 11.9 14.9 13.9 14.4 14.0 12.3 13.2 5-9 12.1 11.1 11.6 15.0 15.0 15.0 13.6 13.0 13.3 10-14 11.2 10.4 10.8 13.2 13.1 13.2 12.2 11.7 12.0 15-19 11.2 11.6 11.4 10.1 8.9 9.5 10.7 10.3 10.5 20-24 9.7 9.3 9.5 6.8 6.7 6.7 8.2 8.0 8.1 25-29 8.6 8.8 8.7 6.6 6.7 6.7 7.6 7.8 7.7 30-34 7.4 7.8 7.6 6.5 6.5 6.5 6.9 7.2 7.0 35-39 6.4 6.6 6.5 5.8 6.1 5.9 6.1 6.4 6.2 40-.44 5.1 5.6 5.4 4.6 4.7 4.6 4.8 5,2 5.0 45..49 4.3 4.2 4.3 4.0 3.9 4.0 4.2 4.1 4.1 50-54 3.2 3.7 3.5 3.2 3.6 3.4 3.2 3.7 3.4 55-59 2.5 3.0 2.8 2.7 3.1 2.9 2.6 3.1 2.8 60-64 2.0 2.2 2.1 2.3 2.7 2.5 2.2 2.4 2.3 65-69 1.2 1.7 1.5 1.5 1.8 1.7 1.4 1.7 1,6 70-74 0.9 1.2 1.0 1.3 1.4 1.3 1.1 1.3 1.2 75-79 0.5 0,9 0,7 0,7 1,0 0,9 0.6 1.0 0.8 80+ 0.4 0.9 0.7 0.7 0.8 0.8 0.6 0.9 0.7 Missing/ 0.1 0.0 0.1 0.0 0.0 0.0 0.0 0.0 0.0 Don't know
Total 10O.0 100.0 100.0 100.0 100.0 100.0 100.0 100,0 100.0 Number ~ 14,707 15,585 30,300 15,273 14,784 30,057 29,980 30,369 60,357
lIncludes 8 cases with missing information on sex.
8

Age 80+
75-79 70-74 65-69 60-64 55-59 50-54 45-49 40-44 35-39 30-34 25-29 20-24 15-19 10-14
5-9 0-4
Figure 2.2 Distribution of the Household Population
by Age and Sex, Philippines 1998
El im
Male ~ I
~ n ~ n
:S i {i i i!I:iliI ~ }i i i!" ;!i!~ilI I i ~ ! ~ Yi ii!i iI Ii! ~:4i"ii '!~::!4
' I I i, I
6 4 2
Percent
Female
I I I
2 4 6 8
1998 NDHS
2.2 Population by Age from Selected Sources
In Table 2.2, the percent distribution of the population by broad age groups, according to the 1970, 1980, 1990 and 1995 Census of Population and the 1993 NDS and 1998 NDHS are presented. There appears to be a progressive decline since 1970 in the proportion Of the population under 15 and, concomitantly, an increase in the median age. The growing proportion in the 15-64 group results in a declining dependency ratio, defined as the ratio of persons in the "dependent" ages (under 15 and 65 and over) to those in the "economically active" ages (15-64). This slight aging of the population has taken place in the recent past as a result of a continuous, albeit slow decline in fertility levels. The 1993 NDS and 1998 NDHS data show fairly similar distributions by age, which supports the representativeness of the survey population.
2.3 Household Composition
Information on the size and composition of the sample households by urban-rural residence is presented in Table 2.3. Women head about 15 percent of the households. As expected, a higher proportion of female-headed households is noted in urban areas (17 percent) than in rural areas (12 percent). On average, a household is composed of 5.1 persons, A negligible difference in average household size is observed between urban and rural areas.
9

Table 2.2 Median a~e and de~ndanev ratio
Percent distribution of the household population by broad age groups for various census years and the NDHS. Philippines 1998
1970 1980 1990 1993 1995 1998 Ago group Census C e n s u s Census NDS Census NDHS
Less than 15 45.7 42.0 39.5 39.3 38.4 38.5 15.,64 51.4 54.6 57.1 56.8 58.1 57.3 65+ 2.9 3.4 3.4 3.9 3.5 4.2
Total I00.0 100.0 100.0 10O.0 100.0 100.0 Median age 16 18 19 20.1 20 20.6 Dependency ratio 94.6 83.2 75.1 76.1 72.2 74.5
Table 2.3 Household comvosition
Percent distribution of households by sex of head of household and household size. according to urban-rural residence. Philippines 1998
Residence
Characteristic Urban Rural Total
Household headship Male 83.1 87.9 85.5 Female 16.9 12.1 14.5
Total 100.0 100.0 100.0
Number~usual membe~ 1 3.8 4.3 4.1 2 8.0 9.1 8.6 3 12.6 13.8 13.2 4 18.1 16.6 17.3 5 19.6 17.7 18.6 6 14.3 14.3 14.3 7 9.4 10.3 9.9 8 6.0 6.1 6.0 9+ 8.3 7.7 8.0
Total 1~.0 100.0 100.0
Mean size of household 5.1 5.0 5.1
10

Figure 2.3 Median Years of Schooling by Sex and Region,
Philippines 1998
Median Number Years 10
8
6
4
2
0
Region
1998 NDHS
2.4 Education Level of the Household Population
Tables 2.4.1 and 2.4.2 present information on the highest level of education attended by the population according to sex, age, residence, and region. Education is highly valued by Filipino families. The constitution of the country reflects this and states that education, at least up to high school level, is a basic right of all Filipino children. The results of the survey indicate that the vast majority of the population does have some formal education. Among the population age 6 and over, only 4 percent have no formal education, and no more than 3 percent among those between the ages of 10 and 50 never attended school. Of both men and women, around half reached only as far as primary school, more than one in four attended high school, and one in five attended higher education. ~
No major gender differences are observed as far as education is concerned. However, a significant difference is noted in the educational level between urban and rural areas. The educational system appears to favor residents of urban areas.
The distribution of the population by highest level of education attended differs greatly among the regions of the country (Figure 2.3). Metropolitan Manila has a much better educated population compared with the rest of the country; the median duration of schooling in this region is 9 years, compared with 5 or 6 years for the other regions. Residents of Autonomous Region in Muslim Mindanao have the lowest median duration of schooling.
1Comparisons with the 1993 NDS data are complicated slightly by the fact that the 1993 survey questions make it difficult to distinguish those who never attended school from those who attended but did not complete any grade. In practice, this affects only children who were currently in first grade. In 1993, such children were considered to have no education, while in 1998, they were categorized in elementary school. This accounts for the seemingly large decline between the two surveys in the proportion of 6-9 year olds with no education.
11

Table 2.4.1 Educational level of the male household oooulation
Percent distribution of the de facto male household population age six and over by highest level of education attended, according to selected background characteristics, Philippines 1998
Level of education
Median College Don't Number number of
Background Elemen- High or know/ of years of characteristic None tar/ school hig~her missin s Total males schooling
Age l 6-9 16.3 83.0 0.0 0.0 0.6 100.0 3,247 0.1 10-14 1.6 84.2 13.9 0.1 0.2 100.0 3,670 3.8 15-19 1.1 27.2 60.2 11.4 0.1 10O.0 3,197 7.7 20-24 1,3 23,4 38,7 36,5 0,1 100.0 2,464 9,5 25-29 1.3 28.8 36.2 33.5 0.2 100.0 2,275 9.3 30-34 1.3 30.1 36.2 32.3 0.1 100.0 2,076 9.3 35-39 1.7 33.7 34.3 30.3 0.1 100.0 1,833 9.1 40-44 2.0 37.7 33.4 26.8 0.1 I00.0 1.444 8.6 45-49 3.0 43.2 30.1 23.8 0.0 100.0 1,255 7.2 50-54 3.3 52.2 21.5 22.8 0.2 100.0 957 5.8 55-59 4.5 57.0 19.2 18.7 0.5 100.0 778 5.5 60-64 5.2 57.1 22.7 15.0 0.1 I00.0 655 5.5 65+ 11.6 59.8 14.5 13.7 0.4 100.0 1,096 4.5
Residence Urban 2.3 37.4 32.9 27.2 0.2 100.0 12,444 8.0 Rural 6.0 60.2 24.2 9.3 0.3 100.0 12,512 5.1
Region Metro Manila 1.4 27.6 35.0 35.7 0.4 I00.0 3,760 9.4 Cordillera Admin. 6.6 51.9 24.6 16.5 0.4 100.0 436 5.3 Ilocos 4.3 44.6 34.2 16.6 0.3 100.0 1,385 6.3 Cagayan Valley 4.8 54.2 25.9 14.9 0.2 100.0 966 5.5 C. Luzon 2.7 45.1 35.6 16.5 0.1 100.0 2,553 6.5 S. Tagalog 2.8 47.2 30.0 19.7 0.3 100.0 3,468 6.0 Bieol 3.0 61.2 25.2 10.4 0.2 100.0 1,481 5.4 W. Visayas 3.4 55.8 24.3 16.4 0.1 100.0 2,013 5.3 C. Visayas 4.0 57.3 24.0 14.6 0.2 100.0 1,899 5.3 E. Visayas 6.0 65.4 19.3 9.0 0.3 100.0 1,242 4.1 W. Mindanao 9.0 54.1 21.3 15.5 0.1 100.0 995 5.0 N. Mindanao 3.7 56.1 26.6 13.4 0.1 100.0 882 5.3 S. Mindanao 4.4 50.9 30.3 14.4 0.0 100.0 1,662 5.6 C. Mindanao 4.2 55.4 24.9 15.1 0.4 100.0 854 5.4 ARMM 25.3 46.4 16.6 10.6 1.0 100.0 707 2.8 Caraga 2.3 58.7 27.6 11.2 0.3 100.0 653 5.2
Total 4.2 48.8 28.5 18.2 0.2 100.0 24r956 5.8
~Excludes 9 men with missing age.
12

Table 2.4.2 Educational level of the female household aooulatigll
Percent distribution of the de facto female household population age six and over by highest level of education attended, according to selected background characteristics, Philippines 1998
Level of education
Median College Don't Number number of
Background Elemen- High or know/ of years of characteristic None tary school hig~her missin~ Total f emales schooling
Age 1 6-9 12.8 86.2 0.2 0.0 0.7 100.0 3,128 0.3 10-14 1.1 81.3 17.4 0.0 0.2 100.0 3,563 4.3 15-19 0.9 16.7 65.9 16.4 0.1 100.0 3,113 8.4 20-24 1.3 17.3 40.5 40.7 0.1 100.0 2,440 9.7 25-29 2.0 21.8 40.0 36.1 0.0 100.0 2,375 9.5 30-34 1.6 27.3 36.5 34.4 0.2 1120.0 2,177 9.3 35-39 2.1 33.7 32.2 31.8 0.2 100.0 1,933 9.1 40-44 2.8 37.8 30.5 28.8 0.0 100.0 1,568 7.9 45-49 3.1 45.8 24.7 26.4 0.0 100.0 1,240 6.5 50-54 5.5 55.1 17.5 21.7 0.2 100.0 1,120 5.7 55-59 5.4 60.0 18.9 15.5 0.1 100.0 931 5.5 60-64 8.0 61.6 19.8 10.2 0.4 100.0 739 5.2 65+ 15.9 63.4 10.0 10.1 0.5 100.0 1,460 3.7
Residence Urban 2.3 37.1 32.6 27.8 0.2 100.0 13,541 8.0 Rural 6.5 57.1 25.1 11.1 0.3 100.0 12,255 5.3
Region Metro Manila 0.9 29.2 36.8 32.5 0.5 100.0 4,386 9.2 Cordillera Admin. 9.1 48.2 25.7 16.7 0.2 100.0 412 5.5 linens 3.8 46.4 30.7 18.9 0.1 100.0 1,356 6.1 Cagayan Valley 4,5 54,1 23,9 17,4 0,1 100,0 926 5,6 C. Luzon 2.3 47.1 31.4 19.1 0.1 100.0 2,582 6.2 S. Tagalog 2.7 47.5 29.0 20.6 0.1 100.0 3,609 6.0 Bicol 3.5 58.6 24.8 12.8 0.2 100.0 1,477 5.5 W. Visayas 3.7 50.2 26.5 19.4 0.1 100.0 2,060 5.8 C. Visayas 3.9 52.4 28.0 15.6 0.2 100.0 2,050 5.6 E. Visayas 6.7 61.7 20.6 10.7 0.3 100.0 1,211 5.0 W. Mindanao 9.7 49.6 24.9 15.3 0.4 100.0 979 5.3 N. Mindanao 3.5 51.9 28.6 15.9 0.1 100.0 907 5.7 S. Mindanao 4.8 46.0 30.3 18.9 0.1 100.0 1,651 6.0 C. Miedanan 6.4 45.4 29.6 18.4 0.3 100.0 825 5.9 ARMM 30.4 41.4 16.2 10.8 1.2 100.0 715 2.5 Caraga 2.8 56.5 26.1 14.3 0.3 100.0 649 5.5
Total 4.3 46.6 29.0 19.8 0.2 100.0 25r796 6.0
1Excludes 8 women with age missing.
13

2.5 School Enrollment
Table 2.5 shows the percent distribution of the household population 6-24 years of age enrolled in school by age, sex and urban-rural residence. More than eight out of ten person's age 6 to 10 and age 11 to 15 are attending school. Between the ages of 16 and 20, the proportion of those actually enrolled diminishes significantly. Economic reasons possibly pull youth from the school system into the job market.
The probability of being in school is fairly equal for the male and female populations in urban areas except at ages 21 to 24, when men are more likely to be enrolled than women. In rural areas, however, the female population seems to get the advantage as far as schooling is concerned. This is possibly due to the fact that male children are needed more to help on the farm.
Table 2.5 School enrollment
Percentage of the de facto household population age 6-24 years enrolled in school by age group, sex, and urban-rural residence, Philippines 1998
Male Female Total
Age group Urban Rural Total Urban Rural Total Urban Rural Total
6-10 86.8 76.4 81.0 90.2 80.4 84.7 88.5 78,3 82.8 11-15 89.5 78.7 83.6 90.7 88.7 89.7 90.1 83,6 86.6
6-15 88.1 77.5 82.2 90.5 84.2 87.0 89.3 80.8 84.6
16-20 57.2 41.4 49.9 55.1 49.7 52.9 56.1 45.1 51.4 21-24 18.1 10.1 14.8 12.0 9.8 11.1 15.1 10.0 13.0
2.6 Housing Conveniences
Table 2.6 and Figure 2.4 show the distribution of households with selected housing conveniences by urban-rural residence. The information on the source of water, type of sanitation facility, type of floor material and number of persons per sleeping room are indicators of the health and socioeconomic condition of households which, in turn, are associated with demographic behavior.
Seven out of ten households have electricity. However, a significant difference was noted between urban and rural areas; 91 percent of urban households have electricity compared with only half (51 percent) of rural households (Figure 2.4).
Almost half of the households have piped water (48 percent) and most of these have water piped into the residence (piped into dwelling or yard/plot). Again, a significant difference is noted between urban and rural areas. In urban areas, two out of three households have piped water, compared with only one out three households in rural areas. Wells and springs are among the main sources of water in rural areas; far fewer households in urban areas get their water from these sources. The vast majority of urban and rural households live within 15 minutes of a source of water.
14

Table 2.6 Housinz conveniences
Percent distribution of households by housing eonvefftance, according to urban.rural rcs'tdene¢, Philippines 1998
Housing Residence characteristic Urban Rural Total
Electricity Yes 91.1 51.9 71.3 No 8.8 47.9 28.5 Missing 0.1 0.2 0.1
Total 100.0 100.0 I00.0
Source of drinking water Piped into dwelling 46.6 14.0 30.2 Piped into yard/plot 7.8 5.4 6.6 Piped into public yard l 1.4 11.7 11.6 Protected well 24.8 40.0 32.5 Unprotected well 1.9 11.2 6.6 Developed/undeveloped spring 1.9 15.0 8.5 River/stream/Fond/lake~rainwater 0.5 1.5 1.1 Tanker truck/peddler 3.3 0.9 2.1 Bottled water 1.6 0.0 0.8 Other 0.1 0.1 0.1
Total 100.0 1130.0 100,0
Time to get to water source Within 15 minutes 92.7 79.8 86.2 Median time (minutes) 0.0 2.9 0.0
Sanitation facility Own flush toilet 71.1 48.1 59.5 Shared flush toilet 16.3 12.1 14.2 Closed pit latrine 4,9 9.6 7.3 Open pit latrine 2.4 9.7 6.1 No facilities/field 3.6 17.0 10,3 Drop/overhang 1.4 2.9 2.1 Other 0.0 0.1 0.1 Missing 0.4 0.5 0.4
Total 100.0 100.0 100.0
Flooring Earth/sand 4.3 12.8 8,6 Wood planks 13.2 16.4 14.8 Palnv'bamboo 8.7 29.8 19.3 Parquet/polished wood 1.1 1.2 1.1 Vinyl/asphalt strips 1.7 0.3 1.0 Ceramic tiles 4.8 0.9 2.8 Cement 61.0 37.5 49.1 Marble 4.9 0.9 2.9 Missing 0.3 0.2 0.2
Total 100.0 100.0 100.0
Persons per sleeping room 1-2 57.9 48.0 52.9 3-4 29.1 32.7 30.9 5-6 9.6 12.9 11.3 7+ 3.0 6.0 4.5 Missing/Don't know 0.4 0.3 0.4
Total 100.0 100.0 100.0
Mean persons per room 2.8 3.2 3.0
Iodized salt Iodized 15.4 6.4 10.9 Not iodized 77.5 86.7 82.2 Missing 7.1 6.9 7.0
Total 100.0 100.0 100.0
Number of households 6,151 6,256 12,407
15

The majority of households (81 percent) have either a flush toilet or a closed pit latrine. The proportion is much higher in urban (92 percent) than in rural areas (70 percent). A large proportion (17 percent) of rural households have no toilet facility.
As to the type of flooring material, half of the households have cement floors and one in five have palm or bamboo floors. Urban households are more likely to use cement than rural households (61 and 38 percent, respectively). About 15 percent of households in both urban and rural areas have wood plank floors.
A question was asked about the number of rooms the household used for sleeping. The purpose was to get a measure of household crowding. On average, there were 3 persons per sleeping room. No significant difference was noted between urban and rural households in this respect.
Lack of a sufficient amount of iodine in the diet can lead to serious nutritional deficiencies such as goiter, nutritional stunting, mental retardation, and cretinism. To prevent these health problems, iodine is routinely added to salt in many countries. In order to evaluate the extent of use of iodized salt in the Philippines, NDHS interviewers tested samples of salt used in the households surveyed. The test involved placing a drop of a special solution on to a small amount of salt supplied by the household respondent. The test indicates the presence of iodine in the salt, but not its quality, which is subject to degradation. Test kits were supplied by UNICEF/Philippines.
Results show that only about 10 percent of households in the Philippines utilize iodized salt. Use of iodized salt is higher among urban than rural households.
Percent
Figure 2.4 Housing Conveniences by Residence,
Philippines 1998
100
80
60
40
20
0 E(ectdcity Water piped into
dwelling/yard for drinking Own/shared flush toUet
I IUrban mRural ~Total I
Cement flooring
1998 NDHS
16

2.7 Presence of Durable Goods in the Household
The percentage of households owning specific consumer durable goods by urban-rural residence is presented in Table 2.7. Among the durable consumer goods, radio and television are available in 80 percent and 56 percent of households, respectively. Two out of five households own a refrigerator while one out of four report owning a bicycle.
Table 2.7 Household durable ~oods
Percentage of households possessing residence, Philippines 1998
specific durable consumer goods, by urban-rural
Residence Durable ~oods Urban Rural Total
Radio 86.0 73.8 79.8 Television 77.2 35.8 56.3 Telephone 28.7 3.1 15.8 Refr/geraCor 56.8 19.5 38.0 Bicycle 27.0 21.2 24.1 Motorcycle 13.1 8.8 10.9 Private car 17.6 3.7 10.6 Boat 2.2 3.7 2.9 Tractor 0.9 1.8 1.4 None of the above 7.3 20.2 13.8
Number of households 6,151 6,256 12,407
The proportion of households with such appliances varies greatly between urban and rural areas. Almost nine out of ten urban households report having a radio, compared to three out of four rural households. About 77 percent of urban households report having a television, compared to only 36 percent of rural households. A majority of urban households have a refrigerator, compared to only one out of five rural households. Urban households are more likely than rural households to own some means of transportation (a bicycle, motorcycle, or private car).
There has been an increase since 1993 in the ownership of durable goods. For example, the proportion of households with a television increased from 43 percent in 1993 to 56 percent in 1998. Over the same period, the proportion of households owning a refrigerator increased from 28 to 38 percent NSO and MI, 1994: 19).
2.8 Background Characteristics of Respondents
In the household questionnaire, a total of 14,390 women were identified as eligible for interview with the NDHS individual questionnaire. Of these women, 13,983 or 97 percent were successfully interviewed. In each age group, the proportion of women interviewed was about the same.
Table 2.8.1 shows the distribution of women in the NDHS sample by selected background characteristics. More than half (53 percent) of the women interviewed in the survey are under age 30. Married women comprise 53 percent of the total women interviewed, while never-married women
17

constitute just over one-third. An additional 6 percent of women are living with a manJ Almost all of the women who were interviewed have had some formal education. Almost three out of ten women interviewed are in college or are college graduates, and a large proportion (42 percent) have attended high school. Roman Catholicism is the predominant religion (82 percent). With respect to ethnicity, Tagalog and Cebuano groups combined comprise more than half of the respondents.
Table 2.8.2 shows that there are more respondents from urban areas than from rural areas. One out of five respondents (20 percent) is from the Metropolitan Manila area, I0 percent were found in the northern provinces (comprising Ilocos, Cagayan Valley, and Cordillera Administrative Region), while the rest of Luzon has about 30 percent of the respondents. Visayas and Mindanao (including ARMM and Caraga) have 19 and 22 percent of the respondents, respectively.
2.9 Education Level of Respondents
Table 2.9 presents the percent distribution of the respondents by the highest level of education attended, according to age, urban-rural residence, and region. The data show that younger women have higher educational attainment than older women do. About 80 percent of women age 15 to 24 years have attended at least secondary level of education, compared with less than 60 percent of women age 40 and older.
As expected, women in urban areas are better educated than women in rural areas. Over 80 percent of urban women have attended at least secondary school compared to only 60 percent of mral women. Women in Metropolitan Manila, Ilocos, Central Luzon, Southem Mindanao, Western Visayas, Central Mindanao and Southern Tagalog are better educated than in other regions. More than 70 percent of the women in these regions have secondary or higher education. On the other hand, ARMM and Eastern Visayas have the lowest proportion of women with secondary or higher education at 44 and 53 percent, respectively.
2.10 E x p o s u r e to M a s s M e d i a
Presented in Table 2.10 is the percentage of respondents who were exposed to different types of mass media by age, education level, urban-rural residence and region. The table shows that eight out of ten women listen to the radio every day. A similar number watch television at least once a week, while almost two in three women read newspapers at least once a week. Younger women are more likely to have been exposed to mass media than older women.
A positive relationship is noted between exposure to mass media and educational attainment. Women with higher education are more likely to have been exposed to mass media. Between urban and rural areas, the proportion differs for those who read newspapers and watch television but not for those who listen to the radio.
lIn this report, women who are living together with a man are considered as currently married.
18
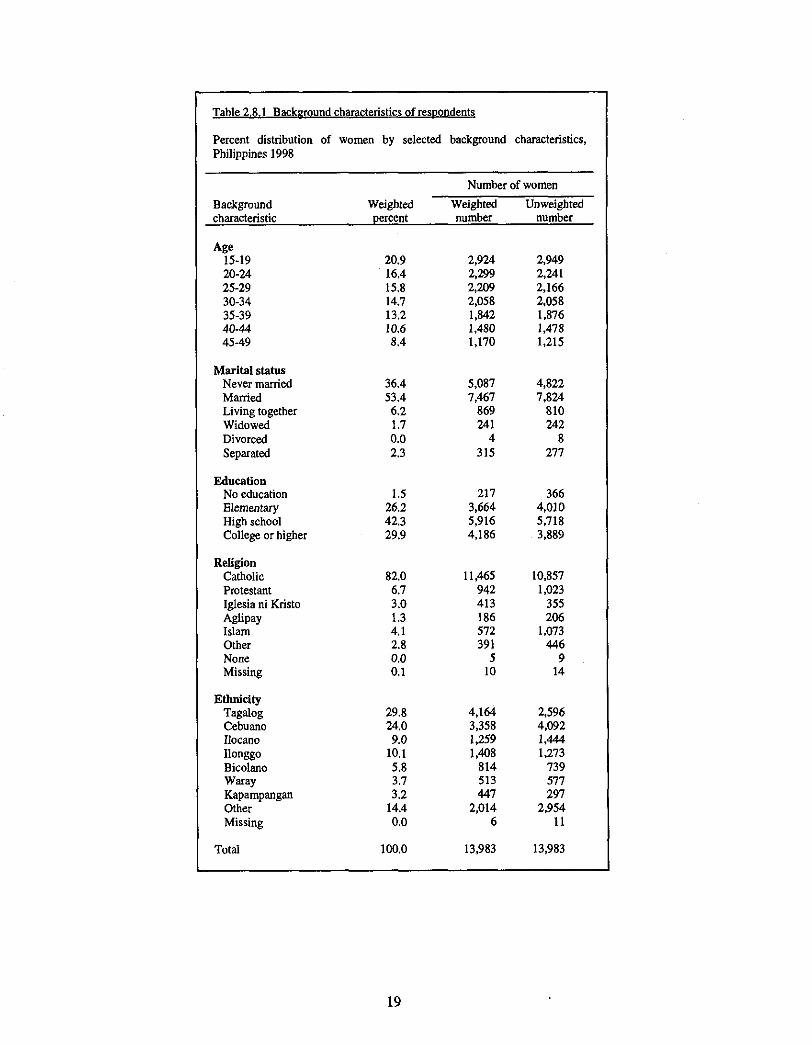
Table 2.8.1 Baekm'ound characteristics of resnondents
Percent distribution of women by selected background characteristics, Philippines 1998
Number of women
Background Weighted Weighted Unweighted characteristic percent number number
Age 15-19 20.9 2,924 2,949 20-24 16,4 2,299 2,241 25-29 15.8 2,209 2,166 30-34 14.7 2,058 2,058 35-39 13,2 1,842 1,876 40-44 10,6 1,480 1,478 45-49 8,4 1,170 1,215
Marital status Never married 36.4 5,087 4,822 Married 53.4 7,467 7,824 Living together 6.2 869 810 Widowed 1,7 241 242 Divorced 0,0 4 8 Separated 2.3 315 277
Education No education 1,5 217 366 Elementary 26,2 3,664 4,010 High school 42.3 5,916 5,718 College or higher 29.9 4,186 3,889
Religion Catholic 82.0 11,465 10,857 Protestant 6.7 942 1,023 lglesia ni Kristo 3.0 413 355 Aglipay 1,3 186 206 Islam 4,1 572 1,073 Other 2.8 391 446 None 0,0 5 9 Missing 0,1 10 14
Ethnicity Tagalog 29.8 4,164 2,596 Cebuano 24.0 3,358 4,092 Ilocaao 9.0 1,259 1,444 llonggo 10.1 1,408 1,273 Bicolano 5,8 814 739 Waray 3.7 513 577 Kapampangan 3.2 447 297 Other 14.4 2,014 2,954 Missing 0.0 6 11
Total 100.0 13,983 13,983
19

Table 2.8.2 Background characteristics of respondents: residence and region
Percent distribution of women by residence and region, Philippines 1998
Number of women
Background Weighted Weighted Unweighted characteristic percent number number
Residence Urban 56.6 7,911 6,730 Rural 43.4 6,072 7,253
Region Metro Manila 20.2 2,818 1.490 Cordillera Admin. 1.5 207 589 llocos 4.9 689 709 Cagayan Valley 3.4 474 717 C. Luzon 10,1 1,414 953 S. Tagalog 13.7 1,917 1,181 Bicol 5.0 703 745 W. Visayas 7.5 1,045 882 C. Visayas 7.8 1,093 993 E. Visayas 4.0 553 770 W. Mindanao 3.8 530 973 N. Mindanao 3.4 482 781 S. Mindanao 6.6 925 985 C. Mindanao 3.0 425 682 ARMM 2.8 385 810 Caraga 2.3 323 723
Total 100.0 13,983 13,983
Figure 2.5 Distribution of Respondents by Religion and Ethnicity
Protestant Agilpay Islam Igles~an~ Other 7% 1% 4% Kristo
Catholic 82%
RELIGION
3u%
Ilocano Other 9 % 4Ao,
beouano 2 4 %
ETHNICITY
~ampangan 3%
Ilonggo 10%
Waray 4%
1998 NDHS
20
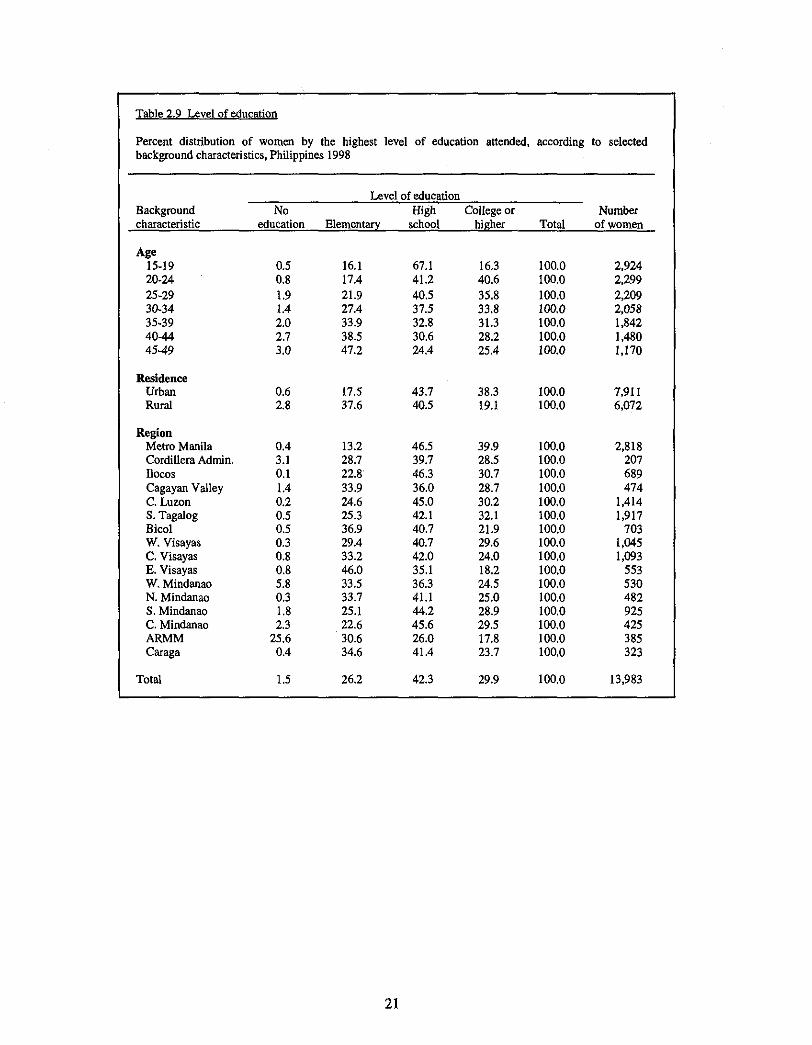
Table 2.9 Level of education
Percent distribution of women by the highest level of education attended, according to selected background characteristics, Philippines 1998
Level ofeducation Background No High College or Number characteristic education Elementary school higher Total of women
Age 15-19 0,5 16.1 67,1 16,3 100.0 2,924 20.24 0.8 17.4 41.2 40.6 I00,0 2,299 25-29 1.9 21.9 40.5 35.8 100.0 2,209 30-34 1.4 27.4 37.5 33.8 100,0 2,058 35-39 2.0 33.9 32.8 31.3 100,0 1,842 40.44 2.7 38.5 30.6 28.2 100.0 1,480 45,-49 3.0 47.2 24.4 25.4 100,0 1,170
Residence Urban 0.6 17.5 43.7 38.3 100,0 7,911 Rural 2.8 37.6 40.5 19.1 100,0 6,072
Region Metro Manila 0.4 13.2 46.5 39.9 100,0 2,818 Cordillera Admin. 3.1 28.7 39.7 28.5 100,0 207 Ilocos 0.1 22.8 46.3 30.7 100.0 689 Cagayan Valley 1.4 33.9 36.0 28.7 100,0 474 C. Luzon 0.2 24.6 45.0 30.2 I00,0 1,414 S. Tagalog 0.5 25.3 42.1 32.1 100.0 1,917 Bicol 0.5 36.9 40.7 21.9 100.0 703 W. Visayas 0.3 29.4 40.7 29.6 100,0 1,045 C. Visayas 0.8 33.2 42.0 24.0 100,0 1,093 E. Visayas 0.8 46.0 35.1 18.2 100.0 553 W. Mindanao 5.8 33.5 36.3 24.5 100,0 530 N. Mindanao 0.3 33.7 41.1 25.0 I00,0 482 S. Mindanao 1.8 25.1 44.2 28.9 100,0 925 C. Mindanao 2.3 22.6 45.6 29.5 100,0 425 ARMM 25.6 30.6 26.0 17.8 100,0 385 Caraga 0.4 34.6 41.4 23.7 100,0 323
Total 1.5 26.2 42.3 29.9 100.0 13,983
21

Table 2.10 Exuosure to mass media
Percent distribution of women who usually read a newspaper once a week, watch television once a week, or listen to a radio dally, by background characteristics, Philippines 1998
Read Watch Listen to Background No m a s s newspaper television radio All three Number characteristic media weekly weekly dally media of women
Age 15-19 2,9 70.8 85.8 83.1 57.0 2,924 20-24 3,5 69.0 82.4 81.8 54,1 2,299 25-29 4.5 63.2 78.7 80.0 47.5 2,209 30-34 6.0 58.2 78.8 76.8 43.4 2,058 35-39 6.9 57.5 75.5 77.5 43.4 1,842 40-44 6.3 58.5 76.5 76.9 45.0 1,480 45-49 6.6 53.9 74.2 76.9 40.1 1,170
Residence Urban 1,9 72.9 91.6 80.3 58.9 7,911 Rural 8.9 50.1 64.3 78.5 35.0 6,072
Region Metro Manila 0.7 82.1 95.8 78.9 66.0 2,818 Cordillera Adrnin. 15.4 49.9 50.1 74.0 32.8 207 nocos 2.8 70.7 86.5 91.8 65.0 689 Cagayan Valley 7.4 59.1 64.3 79.4 39.3 474 C. Luzon 1,2 66.9 92.9 80.5 53.3 1,414 S. Tagalog 3.0 67.2 84.6 80.2 52.4 1,917 Bicol 8.1 45.0 60.1 79.5 29.0 703 W. Visayas 2.3 69.3 82.3 86.1 54.9 1,045 C. Visayas 5.6 49.4 71.7 78.1 34.5 1,093 E, Visayas 7,3 49.5 65.8 79,1 36.0 553 W. Mindanao 13.8 52.2 58.1 79.7 38.2 530 N. Mindanao 10.8 43.9 67.6 73.6 31.8 482 S. Mindanao 4.2 50.8 83.0 74.9 37.4 925 C. Mindanao 4.0 63.8 77.7 84.0 49.7 425 ARMM 31.5 34.4 28.4 60.6 18.0 385 Caraga 5.9 53.8 75.8 78.7 40.4 323
EdueaUon No education 42.6 2.6 20.1 53.6 1.8 217 Elementary 10.4 39.1 61.7 73.3 25.1 3,664 High school 2.9 64.9 84.3 81.2 50.5 5,916 College or higher 1.0 84.4 92.2 84.0 68.8 4,186
Total 4.9 63.0 79.8 79.6 48.5 13,983
22

2.11 Employment
In the 1998 NDHS, respondents were asked if they worked, aside from doing their housework, regardless of whether they were paid or not. Table 2.11 shows that a majority of women (55 percent) were engaged in an economic activity in the last 12 months. Older women, women in urban areas and women with some college education or college degree are more likely to have been employed. For example, the proportion of women 30 years old and older who worked in the last year is about 65 percent, while for women in their 20s the proportion is 56 percent or lower. The smaller proportion of young women who work, especially those below 20 years, may be related to the practice of letting college-age children study full-time.
By residence, six out of ten women in urban areas were engaged in an economic activity in the last 12 months compared with only one-half of rural women. Across regions, more than 60 percent of women in Western Visayas, Southern Mindanao and Metro Manila were engaged in an economic activity in the 12 months preceding the survey. Only one out of 3 women worked in ARMM.
Table 2.12 shows that three out of five employed women are self-employed. It is interesting to note that self-employed women tend to be younger, live in the urban areas, and have higher educational attainment. In all regions except Ilocos, Eastern Visayas, Northern Mindanao, Central Mindanao, CAR and ARMM, self-employed women comprise a majority of the employed women. Almost one out of three employed women work for others. Ninety-five percent of working women earn cash for their work (data not shown).
2.12 Occupation
Table 2.13 presents the percent distribution of currently employed women by occupation, according to selected background characteristics. The majority of the women work in sales and services (53 percent). One out of five women who work are in professional and technical occupations. Only about 11 percent of women work in agriculture.
Sales and service occupations are the most popular among all groups, except those with no education who are more likely to be working in agriculture and those with college, who tend to be employed in professional occupations.
The regional differentials show that in most regions, about half of employed women work in sales and services occupations. In Cagayan Valley, CAR and ARMM, at least one-third of working women are engaged in agricultural occupations. Central Luzon, Southern Tagalog and Central Visayas have more than 20 percent of its employed women in skilled manual occupations.
23

Table 2.11 Emdiovment status
Percent distribution of women by employment status in the last 12 months, according to background characteristics, Philippines 1998
Not currently employed Currently employed
Did not work in Worked Number
Background last 12 in last 12 Season- Occasion- of characteristic months months All year all}' ally Missing Total women
Age 15-19 69,2 7.5 12.1 9.1 2.0 0.2 100.0 2,924 20-24 44.3 12.1 30.6 11.0 1.9 0.1 100.0 2.299 25-29 43,5 10.4 35.9 7.1 3.0 0.1 100.0 2,209 30-34 37,5 8.0 41.3 9.8 3.3 0.1 100.0 2,058 35-39 35,7 7.4 ,:14.0 8.9 3.8 0.3 100.0 1,842 40-44 34.6 5.6 47.4 8.3 3.9 0.2 100.0 1.480 45-49 34,4 5.1 48.5 8.6 3.5 0.0 100,0 1,170
Residence Urban 40,4 7.3 40.7 9.0 2.4 0.1 100.0 7.911 Rural 51,8 9.7 25.7 9.1 3.5 0.2 100.0 6,072
Region Metro Manila 36,4 6.9 43.0 11.4 2.1 0.1 100.0 2,818 Cordillera Admin. 44.5 7.3 31.9 9.7 6.6 0.0 100.0 207 llocos 50,5 9.4 29.1 8.0 2.4 0.6 100.0 689 Cagayan Valley 53,7 5.7 24.4 11.4 4.6 0.1 100.0 474 C. Luzon 50.6 7.0 34.7 5.1 2.3 0.3 100.0 1.414 S. Tagalog 45,6 7.0 37.2 7.2 3.0 0.1 100.0 1,917 Bieol 58,7 10.9 19.6 6.7 4.2 0.0 100.0 703 W. Visayas 38,8 15.1 31.4 10.4 4.3 0.0 100.0 1.045 C. Visayas 42.8 7.2 38.9 9.0 1.8 0.3 100.0 1,093 E. Visayas 44,7 12.5 30.0 8.1 4.8 0.0 100.0 553 W. Mindanao 63,4 5.9 22.7 6.3 1.6 0.1 100.0 530 N. Mindanao 44~3 8.6 33.7 10,8 2.6 0.1 100.0 482 S. Mindanao 36,3 11.4 35.7 13.4 3.1 0.1 100.0 925 C. Mindanao 50,6 6.9 28.5 10.0 3.8 0.1 100.0 425 ARMM 66.8 3.7 22.4 5.7 1.1 0.4 100.0 385 Caraga 45,2 10.I 32.4 9.1 3.2 0.0 100.0 323
Education No education 58.9 5.7 22.2 9.9 3.4 0.0 100.0 217 Elementary 43.0 8.3 32.1 12.1 4.5 0.1 100.0 3,664 High school 51.7 9.1 27.2 9.0 2.9 0,2 100.0 5,916 College or higher 37.9 7.6 46.3 6.4 1.4 0.2 100.0 4,186
Total 45,4 8.4 34.2 9.0 2.9 0.1 1130.0 13,983
24

Table 2.12 Tvne of emolover
Percent distribution of currently employed women by employer, according to background characteristics, Philippines 1998
Employer
Number Background Self- Works for Works for of characteristic employed others relative Missing Total women
Age 15-19 79.0 8.1 12.6 0.3 100.0 679 20-24 77.3 14.6 7.2 0.9 100.0 999 25-29 62.0 29.7 7.9 0.3 100.0 1,016 30-34 52.2 39.0 8.4 0.4 100.0 1,118 35-39 52.9 39.3 7.5 0.2 100.0 1,045 40-44 48.5 43.5 7.8 0.2 100.0 882 45-49 42.4 49.1 8.5 0.0 100.0 708
Residence Urban 66.2 26.2 7.2 0.3 100.0 4,127 Rural 46.2 43.1 10.3 0.4 100.0 2,322
Region Metro Manila 74.1 18.5 7.0 0.4 100.0 1,595 Cordillera Adrniu. 42.9 47.9 9.2 0.0 100.0 100 Ilucus 47.3 41.3 11.0 0.4 100.0 273 Cagayan Valley 55.5 25.5 18.9 0.0 100.0 192 C. Luzon 56.6 34.9 7.4 1.0 100.0 595 S. Tagalog 62.1 29.4 8.3 0.4 100.0 907 Eicol 51.1 40.6 7.9 0.4 100.0 214 W. Visayas 56.5 35.4 8.2 0.0 I00.0 482 C. Visayas 61,0 34.3 4.4 0.2 100.0 545 E. Visayas 41.8 50.3 7,5 0~3 100.0 237 W. Mindanao 54.4 38.9 6.7 0.0 100.0 162 N. Mindanao 45.2 45.2 9.3 0.3 100.0 227 S. Mindanao 53.5 37.9 8.3 0.2 100.0 483 C. Mindanao 46.0 35.0 19.1 0.0 100.0 180 ARMM 22.3 59.1 18.2 0.4 100.0 113 Caraga 50.1 43.3 5.3 1.2 100.0 144
Education No education 26.9 54.6 18.5 0.0 100.0 77 Elementary 49.7 40.5 9.5 0.3 100.0 1,786 High school 57.0 34.6 8.0 0.5 100.0 2,314 College or higher 69A 22.9 7,6 0,3 100.0 2,271
Total 59.0 32.3 8.4 0.3 I00.0 6,448
25

Table 2.13 Occuoation
Percent distribution of currently employed women by occupation and type of agricultural land worked or type of non-agricultural employment, according to background characteristics, Philippines 1998
Agricultural Non-agricultural
Background Own Family Rented Other's Prof., Sales, Skilled Don't Number characteristic land land land land Tech. services manual know Total of women
Age 15-19 0.5 1.8 0.2 4.5 5.5 75.4 10.9 1.1 100.0 679 20-24 1.0 1.3 0.3 2.8 26.7 51.7 15.7 0.6 100.0 999 25-29 1.9 1.8 0.4 4.0 30.3 49.l 11.8 0.6 100.0 1,016 30-34 2.7 2.1 0.6 6.6 23.8 50.1 13.3 0.9 100.0 1, I 18 35-39 2.0 2.2 0.5 8.5 23.8 48.2 13.9 0.8 100.0 1,045 40M4 2.7 2.7 0.7 7.3 20.8 53.3 11.2 1.2 100.0 882 45-49 3.9 2.7 1.4 10.9 17.8 50.4 11.9 1.0 I00.0 708
Residence Urban 0.3 0.5 0.I 1.9 26.4 57.7 12.3 0.7 100.0 4,127 Rural 5.2 4.8 1.5 14.0 15.1 44.7 13.7 1.0 100.0 2,322
Region Metro Manila 0.0 0.0 0.0 0.2 27.8 61.8 10.0 0.2 100.0 1,595 Cordillera Admin. 10.9 7.0 1.4 14.1 13.7 38.7 13.0 1.1 100.0 100 nocos 2.1 3.9 1.8 13.2 19.2 48.0 11.4 0.4 100.0 273 Cagayan Valley 12.8 6.2 0.7 16.2 20.7 41.4 1.4 0.7 100.0 192 C. Luzon 0.7 0.2 0.0 6.5 20.0 48.6 23.9 0.0 100.0 595 S. Tagalog 1.4 1.1 0.0 4.3 23.8 47.6 21.1 0.7 100.0 907 Bicol 1.8 1.8 0.0 5.7 17.6 54.6 16.7 1.8 100.0 214 W. Visayas 1.7 2.5 0.7 11.8 18.7 53.8 6.9 3.9 100.0 482 C. Visayas 1.6 1.6 0.0 3.8 20.6 49.1 22.8 0.4 100.0 545 E. Visayas 4.2 4.5 4.5 9.1 17.0 53.6 7.0 0.0 I00.0 237 W. Mindanao 4.7 5.0 0.0 3.4 26.2 55.0 5.4 0.3 100.0 162 N. Mindanao 6.8 4.6 1.4 10.1 17.4 54.8 4.6 0.3 100.0 227 S. Mindanao 1.4 2.5 0.4 10.5 21.6 54.7 7.0 1.9 100.0 483 C. Mindanao 2.8 4.8 3.8 6.9 21.8 51.9 6.9 1.0 100.0 180 ARMM 6.8 11.8 0.8 19.0 19.4 32.9 6.3 3.0 100.0 113 Caraga 1.9 1.9 1.5 12.I 19.2 58.8 4.3 0.3 100.0 144
Education No education 10.0 18.2 1.8 28.2 0.0 27.4 13.1 1.2 100.0 77 Elementary 4.6 4.2 1.6 14.9 1.6 57.9 14.0 1.3 I00.0 1,786 High school 1.5 1.4 0.3 4.4 6.2 66.6 18.8 0.7 100.0 2,314 College or higher 0.4 0.5 0.0 0.6 55.8 36.2 5.9 0.7 100.0 2,27 l
Total 2.1 2.0 0.6 6.3 22.3 53.0 12.8 0.8 100.0 6,448
26

2.13 Earnings
Data on who decides how to spend the money earned by employed women is shown in Table 2.14. Two out of three respondents reported that they alone decide how to spend the money they earn. About 14 percent said that their partner decides, while 18 percent jointly decide with their partner.
In all age groups, a large majority of respondents say they alone decide on how to spend their cash earnings. However, among those 35 years old and older, about one out of every four women receiving cash said that the decision to spend their earnings is made jointly with their partner. Two out of three urban residents said that they decide how to spend their money.
Although in most regions, a majority of the respondents said that they decide for themselves how to spend their money, in some regions--notably Cagayan Valley, Caraga, Northern Mindanao, and Western Visayas--one-third or more of working women say they decide with their husband how to spend their earnings.
2.14 Child Care While Working
The welfare of children under six years whose mothers are employed is the focus of Tables 2.15.1 and 2.15.2. Overall, one out of three women who works has one or more children under six years old. This proportion varies by background characteristic. Rural women, less educated women, and women working for someone else or in agriculture are more likely to have a child under six. As a reflection of regional differentials in fertility, women in Bicol, Western Visayas, Eastern Visayas, Northern Mindanao, Central Mindanao and CAR are more likely to have one or more children under six years of age.
Among working women, three out of ten take care of their children under six years while they work. Relatives are also common caretakers for children of working women (28 percent). In 12 percent of cases, husbands/partners take care of children while their wife works and in 11 percent of cases, female siblings care for the children. The role of female siblings in child care is more pronounced in the rural than in the urban areas. Children whose mothers have attended some college or acquired a college degree are more likely to leave their children with servants/hired help (24 percent) or other relatives (37 percent). Children whose mothers have no education or are engaged in agricultural occupations are most likely to be cared for by their sisters.
Across regions, mothers and relatives, including female siblings, are the most important caregivers while the mother is working. Hired help or servants are common in Metro Manila. Children in Eastern Visayas and CAR are likely to be cared for by their female siblings while their mother is at work (21 percent and 20 percent, respectively).
27

Table 2.14 Person who deoides on use of earnings
Percent distribution of women receiving cash earnings by person who decides on use of earnings, according to background characteristics, Philippines 1998
Person who decides how earnings are used
Jointly with Jointly Number Background Respondent Husband/ husband/ Someone with of characteristic only partner partner else someone Missing Total women
Age 15-19 80.6 1.2 1.8 11.4 4.0 1.0 100.0 636 20-24 79.6 6.0 8.6 2.5 2.5 0.9 100.0 964 25-29 65.6 14.6 17.1 1.1 1.3 0.4 100.0 982 30-34 57.1 16.9 23.7 0.7 0.4 1.2 100.0 1,064 35-39 54.8 18.6 24.9 0.5 0.6 0.7 100.0 1,008 40-44 56.1 19.3 23.0 0.6 0.3 0.6 100.0 839 45-49 57.7 15.5 25.2 0.4 0.6 0.5 100.0 664
Residence Urban 68.6 12.0 15.2 2.2 1.4 0.7 100.0 4,049 Rural 55.1 16.8 24.3 1.8 1.1 0.8 100.0 2,108
Region Metro Manila 74.1 10.9 11.5 0.8 1.7 1.0 100.0 1,579 Cordillera Admin. 49.1 15.0 27.4 4.0 1.3 3.1 100.0 79 Ilocos 61.6 20.0 16.1 0.0 0.4 2.0 100.0 248 Cagayan Valley 43.4 11.8 39.5 0.4 0.9 3.9 100.0 151 C. Luzon 66.9 15.6 13.3 2.3 1.3 0.5 100.0 579 S. Tagalog 61.5 16.7 19.3 1.8 0.5 0.2 100.0 893 Bicol 61.4 18.1 16.3 2.3 1.9 0.0 100.0 203 W. Visayas 46.9 12.1 31.5 6.4 2.6 0.5 100.0 462 C. Visayas 73.2 14.1 8.7 2.3 1.7 0.0 I00.0 531 E. Visayas 54.8 13.4 25.8 4.0 1.0 1.0 100.0 215 W. Mindanao 59.9 22.6 12.2 1.7 1.4 2.1 100.0 156 N. Mindanao 56.3 8.1 33.4 0.6 0.9 0.6 100.0 205 S. Mindanao 63.8 9.6 22.6 3.4 0.4 0.2 100.0 470 C. Mindanao 62.4 19.2 15.5 2.0 0.0 0.8 100.0 153 ARMM 50.0 15.3 28.7 0.5 3.0 2.5 100.0 96 Caraga 53,9 9.4 35.2 0.6 0.6 0.3 100.0 138
Education No education 55.5 15.4 22.8 0.9 2.1 3.3 100.0 62 Elementary 62.1 13.0 20.7 2.1 1.3 0.9 100.0 1,646 High school 67.2 12.4 15.2 3.0 1.6 0.6 100.0 2,218 College or higher 62.4 15.3 19.4 1.0 1.0 0.8 100.0 2,232
Total 64.0 13.7 18.3 2.0 1.3 0.8 100.0 6,157
28

Table 2.15.1 Child care while working
Percent distribution of employed women by whether they have a child under five years of age and percent distribution of employed mothers who have a child under five by person who cares for child while mother is at work, according to background characteristics, Philippines 1998
to
Employed women Child's caretaker, among employed mothers who have children <5
Residence Urban 72.3 27.7 27.5 10.3 32.9 1.0 15.0 0.3 7.6 2.0 3.4 100.0 4,127 Rural 56.0 44.0 34.3 12.7 22.8 1.4 3.2 0.1 15.1 4.7 5.7 100.0 2,322
E d u ~ o n No education 58.6 41.4 31.3 5.1 8.9 1.1 0.0 0.0 43.0 7.7 3.0 100.0 77 Elementary 63.5 36.5 32.2 11.6 21.1 0.8 0.1 0.2 22.3 5.9 5.8 100.0 1,786 High school 69.3 30.7 38.9 13.7 26.5 2.0 2.7 0.0 8.4 2.9 4.9 100.0 2,314 College or higher 66.1 33.9 21.8 9.5 36.5 0.7 23.9 0.5 2.9 1.2 3.0 I00.0 2,271
Type of employer Work for family 67.7 32.3 27.4 3.4 29.9 0.9 9.6 0.0 16.6 6.7 5.5 100.0 539 Work for someone else 53.5 46.5 50.5 10.3 14.1 1.1 5.3 0.2 10.8 3.7 4.0 100.0 2,083 Self-employed 73.2 26.8 12.3 14.0 41.2 1.2 13.3 0.3 10.5 2.3 4.6 100.0 3,804
Occupation Agricultursl 51.1 48.9 22.5 5.8 26.1 1.0 0.7 0.0 27.2 9.2 6.6 100.0 707 Non-agricultural 68.3 31.7 32.0 12.6 28.7 1.2 11.2 0.3 8.1 2.1 3.7 I00.0 5,697
Employment status All year, full time 68.7 31.3 30.7 10.8 30.3 1.1 13.8 0.3 7.5 2.4 3.0 100.0 4,291 All year, part-time 59.1 40.9 24.8 17.4 21.0 1.9 4.1 0.4 21.4 5.4 3.6 100.0 488 Seasonal 66.0 34.0 32.3 10.6 29.2 1.4 1.9 0.0 15.0 4.1 5.1 I00.0 1,263 Occasional 53.1 46.9 33.3 12.2 17.8 0.0 1.0 0.0 17.0 5.6 12.1 100.0 404
Total 66.4 33.6 30.7 11.5 28.1 1.2 9.4 0.2 11.1 3.3 4.2 100.0 6,448
One or more Other Other Number
Background No child children Husband/ Other Neighbor/ Hired School/inst'l female male Other, of characl/~ristic <5 <5 Respondent partner relative friend help care/other child child Missing Total women

o
Table 2.15.2 Child care while working: region
Percent distribution of employed women by whether they have a child under five years of age and percent distribution of employed mothers who have a child under five by person who cares for child while mother is at work, according to region, Philippines I998
Employed women Child's caretaker among employed mothers who have children <5
Metro Manila 77.9 22.1 22.0 9.7 36.6 1.1 18.8 0.0 7.5 1.6 2.7 100.0 1595 Cordinera Admin. 53.9 46.1 19.1 13.7 26.7 2.3 3.1 0.0 19.8 7.6 7.6 100.0 1130 Ilocos 64.1 35.9 31.7 11.9 31.7 1.0 6.9 0.0 10.9 3.0 3.0 100.0 273 Cagayan Valley 63.1 36.9 28.0 6.5 30.8 3.7 5.6 0.0 t5.0 6.5 3.7 100.0 192 C. Luzon 67.3 32.7 36.6 9.9 32.8 0.8 4.6 0.0 7.6 3.1 4.6 100.0 595 S. Tagalog 64.4 35.6 29.6 9.5 31.2 1.5 11.1 0.0 7.5 4.0 5.5 i00.0 907 Bicol 55.1 44.9 50.0 8.8 13.7 1.0 3.9 1.0 13.7 2.9 4.9 100.0 214 W. Visayas 59.0 41.0 29.3 19.2 27.5 1.8 6.6 0.0 9.6 1.8 4.2 100.0 482 C. Visayas 69.3 30.7 33.6 16.4 24.3 0.7 11.2 0.0 8.6 1.3 3.9 100.0 545 E. Visayas 53.6 46.4 32.7 13.1 16.3 0.7 2.0 2.0 20.9 7.2 5.2 100.0 237 W. Mindanao 63.4 36.6 29.4 8.3 33.9 0.0 8.3 1.8 13.8 0.9 3.7 I00.0 162 N. Mindanao 56.7 43.3 37.1 7,5 16.4 1.3 10.I 0.0 17.0 5.0 5.7 100.0 227 S. Mindanao 65.4 34.6 27.5 14,0 24.2 0.0 8.4 0.0 14.6 4.5 6.8 100.0 483 C. Mindanao 54.7 45.3 27.5 11.5 27.5 2.3 8.4 2.3 16.0 2.3 3.8 100.0 180 ARMM 59.1 40.9 47.4 7.2 21.6 0.0 3.1 0.0 14.4 3.1 3.1 100.0 113 Caraga 60.7 39.3 31.5 7,9 27.6 1.6 11.0 0.0 t l .0 3.9 5.5 I00.0 144
Total 66A 33.6 30.7 11,5 28.1 1.2 9.4 0.2 11.1 3.3 4.5 100.0 6,448
One or more Other Other Number
No child children Husband/ Other Neighbor/ Hired School/inst'l female male Other, of Region <5 <5 Respondent partner relative Friend help care/other child child missing Total women

CHAPTER 3
FERTILITY
In line with the objective of measuring fertility levels, trends, and differentials, special care was given to administer a set of carefully worded questions to obtain accurate and reliable data on fertility. Data on fertility came from a full pregnancy history asked of all women aged 15-49 at the time of the survey. The sequence of questions was intended to derive information on all pregnancies that resulted in either a live birth or a miscarriage or still birth. For live births, women were asked questions about children still living at home, those living elsewhere, and those who had died. Since pregnancies were listed in order of occurrence, it was possible to probe cases in which the interval between pregnancies seemed too short or too long. For pregnancies not ending in a live birth, women were asked the month and year of the pregnancy termination as well as the duration of the pregnancy. For pregnancies that were lost before full term, women were asked whether a doctor or anyone else did something to end the pregnancy. This approach maximizes recall of all pregnancies and provides a richer data set for fertility analysis than a history of live births only.
The analysis in this chapter revolves around females who were born in a given time period (birth cohort) and on those who married during a given time period (marriage cohort). The fertility measures presented here are derived directly from the pregnancy history. The total fertility rate (TFR) is calculated by summing the age-specific fertility rates, and can be interpreted as the average number of births a hypothetical woman would have at the end of her reproductive life if she were subject to the currently prevailing age-specific rates from age 15 to 49. The TFR remains the most significant demographic indicator in the analysis of the impact of national population programs, particularly family planning programs, on individual or group reproductive behavior. A three-year TFR was computedtu provide the most recent estimates of current levels of fertility. The three-year rate also helps reduce sampling errors and avoid problems of displacement of births reported from 5 to 6 years prior to the survey?
3.1 C u r r e n t Fe r t i l i ty
Fertility levels in the Philippines between 1995 and early 1998, as measured by the TFR, have declined from the levels in 1990-1993. Data in Table 3.1 indicate that for the country as a whole, the TFR is estimated at 3.7 ehildren per woman. This represents a decline from 4.1 children per woman in 1990-1993. The age-specific fertility rates show a pattern that peaks at ages 25-29 and tapers off at the older ages. Table 3.1 also shows a general fertility rate (GFR) of 126 live births per 1,000 women age 15- 44 years and a crude birth rate (CBR) of 28 births per 1,000 population. By all indicators, the current fertility level in the Philippines remains relatively high when compared with its Southeast Asian neighbors (Figure 3.1). Another notable feature of current fertility !s the lower fertility of urban women in the country. The TFR for urban area is 3~0 births per woman, 1.7 less than the rural TFR. Lower urban fertility is observed across all age groups (Figure 3.2).
IThe distribution of all children by calendar year of birth shows that there is only very slight heaping of births for 1992 with small associated deficits in the years prior to and following those years (see Table C.4). The pattern of transference of births has been observed in other DHS surveys and is believed to be due to transference of births by interviewe£~ out of the period for which the health and calendar data were collected.
31

Table 3.1 Current fertility
Age-specific and cumulative fertility rates and the cmde birth rate for the three years preceding the survey, by urban-rural residence, Philippines 1998
Residence
Age group Urban Rural Total
15-19 30 69 46 20-24 137 233 177 25-29 182 247 210 30-34 133 183 155 35-39 84 142 111 40-44 32 50 40 45-49 4 10 7
TFR 15-49 3.01 4.67 3.73 TFR 15-44 2.99 4.63 3.70 GFR 101 159 I26 CBR 25.8 30.1 28.0
Note: Rates are for the period 1-36 months preceding the survey. Rates for age group 45-49 may be slightly biased due to truncation.
TFR: Total fertility rate expressed per woman GFR: General fertility rate (births divided by number of
women 15-44), expressed per 1,000 women
Figure 3.1 Total Fertility Rates in Selected Countries in
Southeast Asia Births per Woman
4,0
3.5
3.0
2.5
2,0
1.5
1.0
0,5
0.0
1.7
m 2.0
2.3
2.8
3.2
Singapore Thailand Vietnam Indonesia Malaysia Philippines
Sources: Indonesia: 1997 Indonesia DHS; Philippines: 1998 NDHS Other:, Population Reference Bureau, 1998 Wodd Population Data Sheet
32

3.2 Fertility by Background Characteristics
Variations in fertility are evident from the data on current and cumulative fertility shown in Table 3.2. The mean number of children ever born (CEB) to the oldest women (40-49 years of age) is an indicator of completed fertility for it reflects the fertility performance of older women who are nearing the end of their reproductive years. If fertility has remained stable over time, the two fertility measures, TFR and CEB, would be equal or similar. Although a comparison of completed fertility among women aged 40-49 years with the total fertility rate provides an indication of fertility change, this approach may be somewhat biased due to omission of births by older women. Nevertheless, consistency in the two measures with respect to urban-rural differentials and educational attainment is observed.
As noted earlier, urban women have fewer children than their rural counterparts. On average, urban women have at least one and a half children less than rural women have. This may be interpreted as arising from differences in levels of development between urban and rural areas (Figure 3.3).
Such differences are also substantiated by regional variations in fertility. Metropolitan Manila, the most developed region, exhibits the lowest TFR (2.5 children per woman) and the lowest mean number of children ever born (3 children per woman). In contrast, Eastern Visayas, one of the least developed regions in the country, shows the highest TFR (5.9) and a mean CEB of 6.2 children per woman. The difference in fertility between the two regions is more than 3 children.
The widely accepted negative effect of education on fertility is clearly borne out by the data. The depressing effect of education on fertility is best indicated by the difference in fertility rates between
Table 3.2 Fertiliw by background characteristics
Total fertility rates for the three years preceding the survey and mean number of children ever born to women age 40-49, by selected background characteristias, Philippines 1998
Mean number of children
Total ever born Background fertility to women characteristic rate ~ age 40-49
Residence Urban 3.0i 3.70 Rural 4.67 5.28
Region Metro Manila 2.49 2.95 Cordillera Admin. 4.79 5.71 llocos 3.43 4.99 Cagayan Valley 3.56 4.30 C. Luzon 3.52 4.15 S. Tagalog 3.69 4.09 Bicol 5.45 5.39 W. Visayas 4.02 4.48 C. Visayas 3.70 4.35 E. Visayas 5.91 6.19 W. Mindanao 3.90 4.97 N. Mindanao 4.75 5.50 S. Mindanao 3.67 4.63 C. Mindanao 4.22 5.17 ARMM 4.61 5.10 CARAGA 4.65 5.65
Education No education 5.01 5,42 Elementary 5.00 5.46 High school 3.64 4.24 College or higher 2.90 2.86
Total 3.73 4.42
Rate for women age 15-49 years
women with no education (5.0 children per woman) and those with higher education (2.9 children per woman). Thus, a Filipino woman without education can be expected to have almost twice as many children as a highly educated woman. The data suggest that a good mechanism for fertility reduction is to improve education of women. This would free women to spend more time on economic and other pursuits rather than childbearing which in turn would aid the family as a whole.
33

Figure 3.2 Age-Specific Fertility Rates by Residence
300
250
200
150
100
50
0
Births per 1,000 Women
I I I I I
15-19 20-24 25-29 30-34 35-39 40-44
Age
[÷Uban "B'Rural "8Total]
45-49
1998 NDHS
Figure 3.3 Total Fertility Rate among Women Age 15-49
by Residence and Education Total Fertility Rate
6.0
5.0
4.0
3.0
2.0
1.0
0.0 Urban
4,7
Rural RESIDENCE
5.0 5.0
No Elemen- H igh College education tary school or higher
EDUCATION
34
1998NDHS

3.3 Fertility Trends
To validate the data obtained from the 1998 NDHS, age-specific fertility rates can be compared with corresponding rates from periodic national demographic surveys from 1973 to 1993. Discrepancies will reflect a combination of real change, of differences in geographic eoverage, of change in data collection procedures, and of estimation techniques in one or in all surveys. Nonetheless, they serve the purpose of reflecting recent change in fertility trends in the Philippines.
Table 3.3 and Figure 3.4 shows fertility rates for the 25-year period preceding the survey. The rates reflect a five-year average centered on mid-period years for the 1973, 1978 and 1983 surveys and a three-year rate for the 1986, 1993 and 1998 surveys. In general, the TFR declines from 6.0 children per woman in 1970 to 3.7 in 1996, or a decrease of 2.3 births per woman during the 25-year period. The pace of decline in fertility over time varies. During roughly the period 1970-1975, the TFR declined by 2.4 percent annually. This was followed by a smaller decline of 0.6 percent during the succeeding five-year period. The largest decline was during the first half of the 1980s and was estimated at 3.2 percent annually. The latter half of the 1980s once again revealed a slide back in the progress of fertility reduction with just 1.1 per6ent annual decline during the period 1984-1991. Between 1991 and 1996, the TFR decreased annually by 1.8 percent.
Through most of the 25 years, the mean age marriage for women has remained high and relatively stable, at about 22 or 23 years. The observed decline in fertility can be attributed to changes in family planning practices.
Retrospective data from a single survey can also be used to establish fertility trends over time. Using the 1998 NDHS age-specific fertility rates (ASFR) for the last 20 years are presented in Table 3.4 by five-year periods. The ASFRs are progressively truncated with increasing number of years from the time of the survey. Due to truncation, changes over the past 20 years are observed only for women up to age 29.
In terms of internal consistency, the data substantiate a fertility decline, as the ASFRs are higher in the distant past than in the more recent past. The minimal decline of fertility among women age 20-29 shown for periods 5-9 and 10-14 years before the survey is similar to the trend observed in previous surveys and, therefore, does not necessarily suggest recall problems or omission of births by older women.
Overall, fertility decline during the past 20 years has been moderate. For women aged 15-29, the TFR declined from 2.7 (15-19 years before the survey) to 2.2 (0-4 years before the survey). A closer look at more recent fertility change by comparing ASFRs between 0-4 years and 5-9 years prior to the survey reveals that the relative reduction is largest for women under 20 years and those above age 35.
3.4 Fertility by Marital Duration
Table 3.5 presents fertility rates for ever-married women by duration since first marriage for five- year periods preceding the survey. These rates are similar to the ones presented in Table 3.4 and are subject to similar problems of truncation. Declines are observed in all marital durations. For all five-year periods, marital fertility is higher in the more distant past than in the recent past.
35

Table 3.3 Fertility trends
Age-specific and total fertility rates from various surveys, Philippines 1973-1998
1973 1978 1983 1986 1993 1998 NDS RPFS NDS CPS NDS NDHS
Age (1970) ( 1 9 7 5 ) ( 1 9 8 0 ) ! 1 9 8 4 ) (I991) (1996)
15-19 56 50 55 48 50 46 20-24 228 212 220 192 190 I77 25-29 302 251 258 229 217 210 30-34 268 240 221 198 181 155 35-39 212 179 165 140 120 111 40-44 100 89 78 62 51 40 45-49 28 27 20 15 8 7
TFR 5.97 5.24 5.08 4.42 4.09 3.73
Note: Rates for 1970 to 1980 are five-year averages and 1984 to I996, three-year averages centered on the year in parentheses.
Sources: 1970to 1984-Concepcion, 1991,Table4.10 1 9 9 1 - NSO and Macro International Ine, 1994, Table 3.3
Figure 3.4 Total Fertility Rate
Philippines 1970-1996 Births per Woman
1973 NDS 1978 RPFS 1983 NDS 1986 CPS 1999 NDS 1998 NDHS
Sources: Concepcion, 1991; NSO and MI, 1994
36

Table 3.4 Age-specific fertility rates
Age-specific fertility rates for five-year periods preceding the survey, by mother's age at the time of the birth, Philippines 1998
Mother's ageat time ofbi~h
Number of years preceding the survey
0-4 5-9 10-14 15-19
15-19 50 57 64 63 20-24 177 199 207 223 25-29 210 224 226 251 30-34 161 181 189 [221] 35-39 106 124 [138] 40-44 43 [69] 45-49 [8]
Note: Age-specific fertility rates are per 1,000 women. Estimates enclosed in brackets are truncated.
3.5 Children Ever Born and Living
A basic measure of fertility is the number of children ever born (CEB) or current parity. This measure is based on a cross-sectional view at the time of survey and does not refer directly to the timing of fertility of individual respondents but is a measure of completed fertility. The number of CEB by age of women for all women and currently married women and the corresponding mean CEB as well as mean number of living children is presented in Table 3.6. Among all women, two out of five do not have any children. By contrast, only 6 percent of married women do not have any children.
Table 3.5 Fertility by marital duration
Fertility rates for ever-married women by duration (years) since first marriage, for five-year periods preceding the survey, Philippines 1998
Marriage Number of years preceding the survey
duration at birth 0-4 5-9 10-14 15-19
0-4 370 393 404 397 5-9 221 249 247 289 10-14 143 164 205 252 15-19 93 132 158 [219] 20-24 62 117 [153] 25-29 27 [39]
Note: Fertility rates are per 1,000 women. Estimates enclosed in brackets are truncated.
37
Table 3.6 shows marked differences between married women and all women in the proportion without any children at younger ages. This is due to the fact that many women remain unmarried in their late teens and early twenties. Assuming that voluntary childlessness within marriage is rare, this figure may also be used to estimate primary sterility.
On the other hand, 3 percent of married women age 45-49 are childless. The corresponding proportion without children among all women 45-49 is higher, at 9 percent. The differences at older ages reflect the combined impact of marital dissolution, infertility and celibacy. It should be noted that while 1 out of 11 Filipino women 45-49 remains childless, about 8 percent have 10 or more births.
Table 3.6 also shows that while the proportion of women with no children decreases with age, the proportion of Women at higher parities increases with age, reflecting the process of family formation over time. Also, the mean CEB for all women and currently married women increases with increasing age indicating that the data are free from gross recall bias (Figure 3.5). The mean CEB for the whole sample of women is 2.2 children, while for married women, it is 3.4 children. It is interesting to note that for women completing their childbearing (age 45-49), the mean CEB is 4.7 children among all women and 5.1 children among married women.
Table 3.6 Children ever born and living
Percent distribution of all women and of currently married women by number of children ever born (CEB) and mean number of children ever barn and living, according to five-year age groups, Philippines 1998
Mean Mean Number of children ever born (CEB) Number number number
Age of of of living group 0 1 2 3 4 5 -6 7 8 9 10 Total women CEB children
ALL WOMEN
15-19 94.5 3.9 1.4 0.I 0.0 0.0 0.0 0.0 0.0 0.0 0.0 100.0 2,924 0.07 0.07 20-24 61.5 19.4 11.9 5.0 1.7 0.5 0.I 0.0 0.0 0.0 0.0 100.0 2,299 0.68 0.65 25-29 29.8 19.2 19.5 16.6 9.1 3.8 1.3 0.4 0.1 0.0 0.0 100.0 2,209 1.75 1.67 30-34 15.5 I1.0 18.1 20.8 14.4 9.3 6.1 2.8 1.3 0.4 0.2 100.0 2,058 2.86 2.69 35-39 9.4 8.0 I4.7 18.2 16.1 12.4 8.1 5.1 3.8 1.7 2.3 100.0 1,842 3.75 3.47 40-44 9.7 7.4 10.1 17.7 15.5 12.9 8.6 6.1 4.2 3.1 4.8 I00.0 1,480 4.16 3.81 45-49 8.7 5.9 10.5 12.7 13.8 9.8 10.4 10.5 5.4 4.8 7.6 100.0 1,170 4.74 4.28
Total 39.9 11.0 11.9 11.9 8.7 5.9 4.0 2.7 1.6 1.0 1.5 100.0 13,983 2.16 2.00
CURRENTLY MARRIED WOMEN
15-19 40.5 41.2 16.5 1.7 0.0 0.0 0.0 0.0 0.0 0.0 0.0 100.0 224 0.79 0.74 20-24 14.3 41.7 27.1 II .6 3.9 1.1 0.2 0.0 0.0 0.0 0.0 100.0 967 1.53 1.49 25-29 7.5 24.0 25.8 22.7 12.5 4.9 1.9 0.6 0.1 0.0 0.0 100.0 1,585 2.35 2.24 30-34 5.0 11.1 20.5 24.I 16.2 10.5 7.2 3.1 1.6 0.4 0.2 100.0 1,730 3.25 3.06 35-39 2.3 7.9 15.3 19.9 17.4 13.6 8.8 5.7 4.4 2.0 2.7 I00.0 1,602 4.11 3.81 40-44 2.6 6.6 11.1 18.8 I6.9 14.1 9.4 6.5 4.9 3.7 5.5 100.0 1,243 4.58 4.I8 45-49 2.6 4.9 II .0 13.8 14.3 10.8 12.2 11.3 5.8 5.0 8.4 100.0 965 5.14 4.65
Total 6.4 16.0 18.7 18.9 13.7 9.2 6.4 4.1 2.6 1.6 2.3 100.0 8,336 3.39 3.15
Besides describing average family size, information on the number of living children at the time of interview (reported by the respondent) or the current family size (derived from the pregnancy history) can give some indication of infant and child mortality. The data show that on the average, all women have a mean of 2 children still living and currently married women have a mean of 3.2 living children. It
38

is notable that the mean number of CEB and of children still living are not substantially different. On the average, both groups of women had a loss of 7 percent of all live births.
Figure 3.5 Mean Number of Children Ever Born
among Women Age 15-49 by Age Group
Number of Children Ever Born
5.0
4.5
4.0
3.5
3.0
2.5
2.0
1.5
1.0
0.5
0.0
2.2 / 15-19 20-24 25-29 30-34 35-39 40-44 45-49 Total
Age Group
1998 NDHS
3.6 Birth Intervals
The timing of births has significant influence on both fertility and mortality. There is evidence that women with closely spaced births have higher fertility than women with longer birth intervals. Similarly, studies in diverse settings consistently show that shorter birth intervals increase the incidence of infant and child deaths.
Table 3.7 shows the percent distribution of births in the five years preceding the survey by the length of the interval since the previous birth, classified by selected demographic and background characteristics of women. In general, the median length of the birth interval is slightly over 2 years, or 28 months. About 1 out of 5 births occurs four or more years after a previous birth. More than one-third of births occur within two years of a previous birth. This finding is cause for concern as it has implications for maternal and child health and survival. It has been shown that short birth intervals, particularly those
• less than two years in length, elevate the risk of death for mother and child (see Chapter 7).
Data on median birth interval by demographic and background characteristics reveal interesting differentials. Younger women who are just beginning their reproductive years exhibit shorter median birth intervals. These are estimated at 19 and 25 months for women under 20 and those 20-29, respectively. By contrast, women who are 40 or older report a median birth interval of 39 months, an interval more than twice as long as that of women aged 15-19 (Figure 3.6).
39

Median birth interval exhibits a generally curvilinear relationship with birth order, increasing from 27 months for second to third births, to a peak of 30 months for fourth through the sixth births, then declining to 29 months for seventh or higher births.
The data in Table 3,7 show that the birth interval does not vary by sex of the previous child. The survival status of the previous birth influences the timing of the next birth. For women whose previous birth is still living, the next birth occurs after 29 months. For those whose previous birth did not survive, the corresponding birth interval is shorter by 3.8 months. This finding raises interesting questions on the mechanism where by infant and child mortality influences birth intervals and fertility, particularly the question of whether mothers seek to replace deceased children as soon as possible.
Urban-rural residence and mother's education seem to exert some effect on the length of birth intervals. For women who live in urban areas, the median birth interval is 29.3 months, 1.5 months longer than for women who live in rural areas. As expected, better educated women space births more widely than uneducated women. Women with college education or higher have a median birth interval 4 months longer than women without schooling.
Figure 3.6 Median Number of Months Since Previous Birth
by Age of Mother and Birth Order
Median Number of Months
45
40
35
30
25
20
15
10
5
0
30
15-19 20-29 80-39 40+ 2-3 4-6 Age ol Mother Birth Order
7+
1998 NDHS
40

Table 3.7 Birth intervals
Percent distribution of births in the five years preceding the survey by number of months since previous birth, according to demographic and socioeconomic characteristics, Philippines 1998
Number of months since previous birth
Characteristic 7-17 18-23 24-35 36-47 48+
Median number of Number
months since of Total previous birth births
Age of mother 15-19 47.9 20.3 31.1 0.7 0.0 100.0 18.7 49 20-29 2],7 25.1 33,2 10.6 9.4 100,0 24.7 2,182 30-39 14.2 15.5 29.5 14.5 26.2 100.0 31.0 2,815 40+ 8.7 11.0 24.0 17.9 38.4 100.0 39.1 605
Birth order 2-3 20.0 20.2 28.0 11.7 20.2 100.0 26.7 2,855 4-6 13.3 17.2 31.7 14.7 23.1 100.0 30.2 1,993 7+ 14.4 17.7 35.3 15.1 17.5 100.0 28.6 803
Sex of prior birth Male 16.5 17.8 30.8 13.8 21.0 100.0 28.7 2,917 Female 17.2 19.8 29.8 12.6 20.6 I00.0 27.8 2,734
Survival of prior birth Living 15.8 19,0 30.8 13.4 21.0 100,0 28.5 5,327 Dead 33.8 15.5 23.6 9.6 17.4 100.0 24.7 324
Residence Urban 18.2 16.7 27.1 13.5 24.5 100,0 29.3 2,439 Rural 15.8 20.4 32.8 13.0 18.0 100.0 27.8 3,212
Region Metro Manila 17.9 13.4 28.3 13.4 27.0 100.0 30.3 707 Cordillera Admin, 16.7 21,6 33,0 13.8 14.9 100.0 28,0 122 Ilocos 14.1 20.0 36.1 11.8 18.0 100.0 28.6 248 Cagayan Valley 13.8 16.4 29.7 16.0 24.2 100.0 31.4 178 C. Luzon 17.5 19.6 21.6 11.4 29.8 100.0 29.2 507 S. Tagalog 17,7 19.3 28.9 13.4 20.8 100.0 28.9 826 Bieol 17,0 20.1 35.9 13,6 13.4 100.0 27.1 423 W, Visayas 17.4 19.3 30.4 13.8 19.1 100.0 27.6 429 C. Visayas 13.6 18.2 38.5 11.5 18.2 100.0 28.1 429 E. Visayas 17.6 20.2 31.0 14.0 17.2 100.0 27.7 370 W, Mindanao 15,5 18.1 29.9 16.2 20.2 100.0 28.7 231 N. Mindanao 15.8 21.5 31,5 14.1 17.2 I00.0 26.7 259 S. Mindanao 17.0 21.4 24.4 13.2 24.1 100.0 28.3 343 C. Mindanao 18.4 17.5 31.3 13.6 19.3 100.0 28.1 207 ARMM 18.1 21.4 32.2 13.1 15.3 I00.0 26.5 218 Caraga 17.5 19.3 33.9 10.5 18.7 100.0 26.9 153
Education No education 18.9 21.8 27.7 14.7 16.9 100.0 26,2 ]51 Elementary 14.3 19.9 35.0 13.6 17.2 100.0 28.2 2,191 High school 17.6 19.5 29.9 11.9 21.2 100.0 27.9 2,092 College or higher 19.9 15.3 23.1 14.6 27.1 100.0 30.2 1,216
Total 16.8 18.8 30.3 13.2 20.8 100.0 28.3 5,651
Note: First-order births are excluded. The interval for multiple births is the number of months since the preceding pregnancy that ended in a live birth.
41
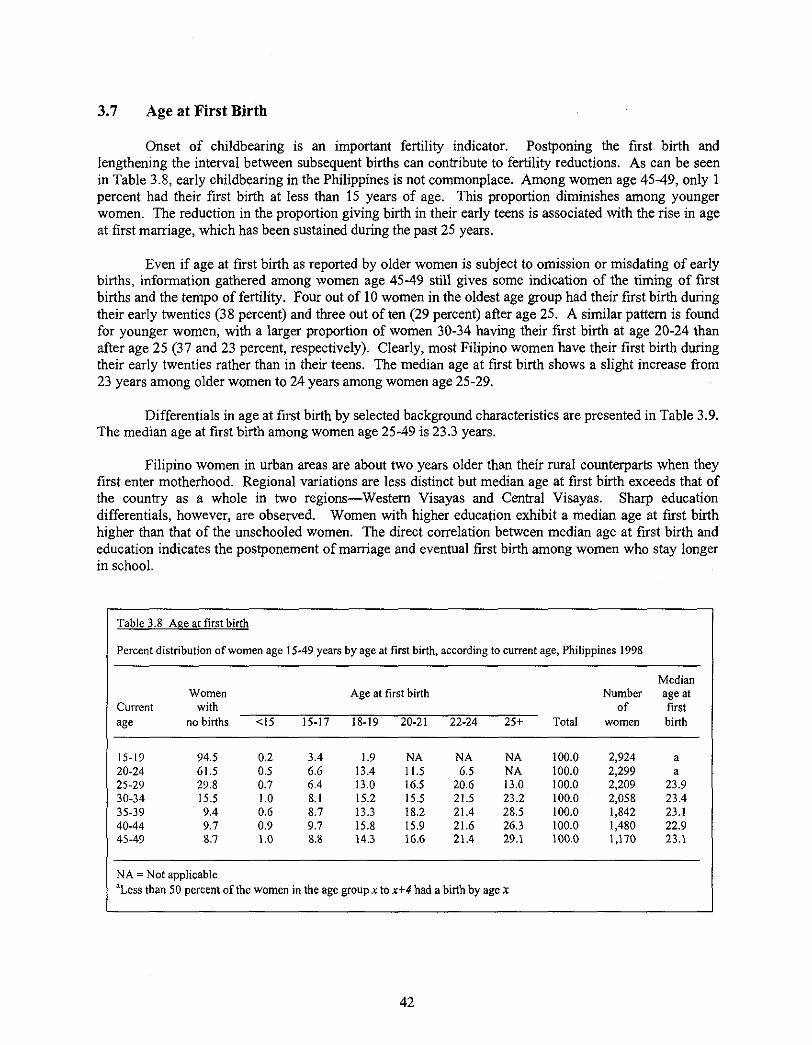
3.7 Age a t F i r s t B i r t h
Onset of childbearing is an important fertility indicator. Postponing the first birth and lengthening the interval between subsequent births can contribute to fertility reductions. As can be seen in Table 3.8, early childbearing in the Philippines is not commonplace. Among women age 45-49, only 1 percent had their first birth at less than 15 years of age. This proportion diminishes among younger women. The reduction in the proportion giving birth in their early teens is associated with the rise in age at first marriage, which has been sustained during the past 25 years.
Even if age at first birth as reported by older women is subject to omission or misdating of early births, information gathered among women age 45-49 still gives some indication of the timing of first births and the tempo of fertility. Four out of 10 women in the oldest age group had their first birth during their early twenties (38 percent) and three out often (29 percent) after age 25. A similar pattern is found for younger women, with a larger proportion of women 30-34 having their first birth at age 20-24 than after age 25 (37 and 23 percent, respectively). Clearly, most Filipino women have their first birth during their early twenties rather than in their teens. The median age at first birth shows a slight increase from 23 years among older women to 24 years among women age 25-29.
Differentials in age at first birth by selected background characteristics are presented in Table 3.9. The median age at first birth among women age 25-49 is 23.3 years.
Filipino women in urban areas are about two years older than their rural counterparts when they first enter motherhood. Regional variations are less distinct but median age at first birth exceeds that of the country as a whole in two regions--Western Visayas and Central Visayas. Sharp education differentials, however, are observed. Women with higher education exhibit a median age at first birth higher than that of the unschooled women. The direct correlation between median age at first birth and education indicates the postponement of marriage and eventual first birth among women who stay longer in school.
Table 3.8 Age at first birth
Percent distribution of women age 15-49 years by age at first birth, according to current age, Philippines 1998
Median Women Age at first birth Number age at
Current with of first age no births <15 15-17 18-19 20-21 22-24 25+ Total women birth
15-19 94.5 0.2 3.4 1.9 NA NA NA 100.0 2,924 a 20-24 61.5 0.5 6.6 13.4 11.5 6.5 NA I00.0 2,299 a 25-29 29.8 0.7 6.4 13.0 16.5 20.6 13.0 100.0 27209 23.9 30-34 I5.5 1.0 8.1 15.2 15.5 21.5 23.2 100.0 2,058 23.4 35-39 9.4 0.6 8.7 13.3 18.2 21.4 28.5 100.0 1,842 23.1 40-44 9.7 0.9 9.7 15.8 15.9 21.6 26.3 100.0 1,480 22.9 45-49 8.7 1.0 8.8 14.3 16.6 21.4 29.1 I00.0 1,170 23.1
NA = Not applicable ~Less than 50 percent of the women in the age group x to x+4 had a birth by age x
42

3.8 Teenage Fertility
As noted earlier, early childbearing, particularly births occurring before age 20, affects only a small segment of the population. However, this does not mean that the level of teenage childbearing and motherhood does not pose social and health threats to society. Table 3.10 presents data on fertility among women age 15-19 (teenagers) at the time of the survey. Of the women in this age group, 7percent have begun childbearing (6 percent are already mothers and 2 percent are pregnant with their first child).
Differences between subgroups of these women are evident. As expected, the proportion of women who have begun childbearing increases linearly with age, from less than one percent among those age 15 years to 21 percent among those age 19 years. Rural teenagers are almost twice as likely (11 percent) to experience teenage pregnancy as their urban counterparts (5 percent) (see Figure 3.7).
Consistent with urban-rural and regional differentials, the less urbanized regions of ARMM, Western Mindanao, Eastern Visayas, and Cagayan Valley all share higher proportions of teenage fertility relative to other regions of the country (Figure 3.8). This is particularly true for ARMM, a predominantly Muslim region, where cultural factors impinging on women's roles and status may partially explain the high proportion of teenagers who begun childbearing early (13 percent). In comparison, Metropolitan Manila, the premier region of the country, has the lowest proportion of teenagers who have begun childbearing (4 percent).
It may be inferred from the data that teenagers in urban areas where educational facilities are concentrated, particularly in Metropolitan Manila, have other alternatives in life than early childbearing. Another interpretation is that teenagers in urban areas and more urbanized regions and those in school have greater access to information and may therefore, be more knowledgeable on matters of safe sex.
The preventive effect of education on early childbearing is borne out by the data. There is a gradual decrease in the proportion who having begun childbearing from 17 percent among teens who had never been to school to 5 percent among those with higher education.
43

Table 3.9 Median age at first birth
Median age at first birth among women age 25-49 years, by current age and selected background characteristics, Philippines 1998
Background Current age Ages
characteristic 25-29 30-34 35-39 40-44 45-49 25-49
Residence Urban 25.3 24.3 23.9 23.7 24.1 24.3 Rural 22,3 22,3 22,3 22.0 22.2 22,2
Region Metro Manila a 25.7 24,7 24.3 25.1 a Cordillera Admin. 21.7 22.5 21.9 20.7 22.3 21.8 Ilocos 24.3 23.3 22.6 24.5 21.6 23.2 Cagayan Valley 21.6 21.2 21.7 22,2 22.0 21.7 C. Luzon 23.5 23.3 23.7 22.9 23.3 23.3 S. Tagalog 23.4 22.9 23.6 23.1 23.0 23.2 Bieol 22.7 22.7 23.1 22.2 22.3 22.6 W. Visayas 24.8 23.8 22.8 24.0 24.8 24.0 C. Visayas 24.0 22.9 23.5 22.7 24.0 23.5 E. Visayas 22,9 21.3 21.3 20.8 21.9 21,6 W. Mindanao 22.8 22.2 22.4 21.3 22.8 22.3 N. Mindanao 23.5 22.9 22.4 21.0 21.9 22.6 S. Mindanao 23.3 22.9 22.9 22.1 22.6 22,7 C. Mindanao 22.0 23.1 23.8 21.6 21.7 22.7 ARMM 21.7 20.8 21.3 22.3 23.6 21.8 Caraga 23.4 23.2 21.6 20,9 22.1 22.3
F~lueation No education 19,9 20.0 20,4 20,4 21.8 20.5 Elementary 20.9 20.8 21.2 21.0 21.4 21.1 High school 23.0 22.7 22.6 22.4 22.9 22.7 College or higher a 26.0 26.6 26,3 27.1 a
Total 23.9 23.4 23.1 22.9 23. I 23.3
Note: Themedians for the 15-19 cohort and for the20-24 cohort could not be determined because half the women have not yet had a birth aMedians were not calculated for these cohorts because less than 50 percent of women in the age group x to x+4 have had a birth by agex.
44

Table 3.10 Teenage pregnancy and motherhood
Percentage of teenagers age 15-19 years who are mothers or pregnant with their first child, by selected background characteristics, Philippines 1998
Percentage Percentage who are: who have
Pregnant begun Number Background with first child- of characteristic Mothers child bearing teenagers
Age 15 0.3 0.2 0.5 624 16 0.8 0.8 1.6 613 17 3.6 1.4 5.0 589 18 7.8 2.6 10.5 602 19 17.0 4.2 21.3 497
Residence Urban 3.4 1.3 4.7 1,701 Rural 8.3 2.4 10.8 1,223
Region Metro Manila 2.8 0.9 3.7 605 Cordillera Admin. 2.3 2.3 4.6 46 Ilocos 3.3 1.3 4.6 147 Cagayan Valley 5.0 5.6 i0.6 106 C. Luzon 5.1 1.0 6.2 289 g. Tagalog 7.2 2.7 9.9 360 Bieol 8.4 1.4 9.8 135 W. Visayas 4.6 1.0 5.6 233 C. Visayas 4.3 1.0 5.3 228 E. Visayas 8.5 3.5 12.0 102 W. Mindanao 8.3 4.4 12.6 112 N. Mindanao 7.0 1.2 8.2 106 S. Mindanao 6.4 2.3 8.7 206 C. Mindanan 5.7 1.3 7.0 98 ARMM 11.4 1.7 13.1 83 Caraga 7.8 1.3 9.2 68
Education No education i 7.3 0.0 17.3 15 Elementary 11.5 4.4 15.9 471 High school 4.5 1.2 5.7 1,962 College or higher 3.0 1.5 4.5 476
Total 5.5 1.8 7.2 2,924
45

20
15
10
5
0
Figure 3.7 Percentage of Women Age 15-19 (Teenagers) Who Have
Begun Childbearing by Residence and Education
Percent
10.8
17.3
Urban Rural No Elemen- High College education tary school or higher RESIDENCE
EDUCATION
1998 NDHS
Figure 3.8 Percentage of Women Age 15-19 (Teenagers)
Who Have Begun Childbearing by Region
Metro Manila Cordillera Admin.
Ilicos Cagayan Valley
C. Luzon S. Tagalog I
Bicol W. Vlsayas C. Vlsayas E. Visayas
W. Mindanao N. Mindanao S. Mindanao C. Mindanao
ARMM Caraga
0 2
10.6
6.2 I :9.9
:9.6 I :s.6
r i .12.0
12.6
4 6 8 10 12 14
Percent
46
1998 NDHS
CHAPTER 4
FAMILY PLANNING
4.1 Knowledge of Family Planning Methods and Their Sources
Lack of knowledge of family planning methods and their sources is a major obstacle to the use of contraception. As in other DHS surveys, information about knowledge of family planning methods and of the places where they can be obtained was generated by asking the respondent to name the ways or methods that a couple can use to delay or avoid a pregnancy. If the respondent did not spontaneously mention a particular method, the interviewer described that method and asked the respondent if she recognized it. Thirteen methods (pill, IUD, injection, condom, ligation or female sterilization, vasectomy or male sterilization, calendar/rhythm method/periodic abstinence, mucus/Billings/ovulation, basal body temperature, symptothermal, lactational amenorrhea method or LAM, breastfeeding, and withdrawal) were described in the questionnaire. Other methods not provided in the questionnaire but mentioned spontaneously by the respondent were also recorded. For all methods mentioned or recognized, the respondent was asked if she had ever used the method and if she knew where a person could obtain the method or, in the case of natural family planning, advice on how to use natural family planning, t
Among currently married women as well as all women, virtually all respondents know of one or more family planning methods (99 percent and 98 percent, respectively) or a modem method (98 percent and 97 percent, respectively) (Figure 4.1 and Table 4.1). This high level of general contraceptive awareness has been observed in previous surveys, including the 1983, 1988, and 1993 National Demographic Surveys and the 1986 Contraceptive Prevalence Survey (Concepcion, 1991). Knowledge of traditional methods is only slightly less common than knowledge of modem methods.
The more widely known modem methods are the pill, condom, female sterilization, IUD, and injection. The least known modem methods include lactationai amenorrhea method (LAM) and symptothermal method. Slightly less than 90 percent of married women are aware of the calendar/rhythm method and withdrawal.
Not all who claim to know a family planning method know where they can obtain it; however, the gap between knowledge of contraceptive methods and knowledge of their sources among married women is very small. Ninety-five percent know a source for the pill, 91 percent for condom, 87 percent for female sterilization, 86 percent for the IUD, 83 percent for injections, and 72 percent for male sterilization. It is not surprising that a smaller percentage of currently married women know a place where one can obtain advice on how to use the mucus/Billings/ovulation (22 percent), basal body temperature (20 percent), LAM (13 percent), and symptothermal methods (9 percent), which are not well known contraceptive methods.
lln this report, the term natural family planning refers to mucus/Billings/ovulation, basal body temperature and symptothermal methods. In the 1993 NDS, questions did not differentiate between the various methods of periodic abstinence and the term includes both rhythm and periodic abstinence.
47

Table 4.1 Knowledge of contraceptive methods and a source for methods
Percentage of all women and currently married women who know specific contraceptive methods and who know a source (for information or services), by specific methods, Philippines 1998
Know method Know a source
Currently Currently Contraceptive All married All married method women women women women
Any method 97,6 98.6 93.8 96.4
Modern method 97.0 98.0 93.7 96.4 Pill 95.9 97.3 90.8 94.6 IUD 86,7 91.8 78.4 85.5 Injection 82,8 89.1 75.8 83.3 Condom 93,4 95.4 86.7 90.7 Female sterilization 87.8 92.2 81.4 87.2 Male sterilization 69.4 78.4 63.2 71.8 Mucus, Billings, ovulation 20;8 23.8 18.6 21.6 Basal body temperature 20.7 22.6 18.2 20.0 Symptothermal 9.5 10.4 8.5 9.3 Lactational amenorrhea 13.4 15.0 11.9 13.4
Traditional method 88.2 94.1 71.0 80.1 Calendar, rhythm 78.6 87.1 71.0 80.1 Breastfeeding 54.9 62.2 NA NA Withdrawal 75.9 87.3 NA NA Other traditional methods 6.5 8.0 NA NA
Total 13,983 8,336 13,983 8,336
NA -- Not applicable
48

Figure 4.1 Knowledge of Contraception among
Currently Married Women Age 15-49
Pill
IUD
Injection
Condom
Female sterilization
Male sterilization
Mucus, Billings, ovulation
Basal body temperature
Symptothermal
Lactational amenorrhoa
Calendar, rhythm
Breastfeeding
Withdrawal
97
BBlo m l . =
10 20 30 40 50 60 70 80 90 100
Percent
1998NDHS
Except for women in the age group 15-19, the level of knowledge of any method, modem methods, and sources for modem methods does not vary greatly by age. The age group 15-19 shows the lowest proportion having knowledge of methods and their sources (Table 4.2). There is also little difference in levels of knowledge by urban-rural residence, where the urban level is higher by only about two percentage points than the rural level.
49

Table 4.2 Knowledue of modem contracentive methods and source for methods
Percentage of currently married women who know at least one modem contraceptive method and who know a source (for information or services), by selected background characteristics, Philippines 1998
Know a Know Know source for Number
Background any a modem modem of characteristic method method I method women
Age 15-19 96.5 96.0 90.6 244 20-24 98.7 98.2 96.2 967 25-29 98.7 98.0 96.7 1,585 30-34 99.0 98.3 96.7 1,730 35-39 98.8 98.0 96.9 1,602 40-44 98.5 98.1 96.7 1,243 45-49 97.9 97.3 95.6 965
Residence Urban 99.3 99.0 97.9 4,222 Rural 97.8 96.8 94.8 4,114
Region Metro Manila 99.7 99.6 98.1 1,298 Cordillera Admin. 99.2 99.0 95.1 136 I1ocos 100.0 100.0 99.3 414 Cagayan Valley 99.0 98.4 96.5 322 C. Luzon 99.3 99.3 98.3 883 S. Tagalog 99.7 99.6 97.1 1,219 Bicol 99.6 99.4 97.8 481 W. Visayas 100.0 100.0 98.5 627 C. Visayas 99.6 99.6 98.8 620 E. Visayas 99.5 99.1 96.7 395 W. Mindanan 91.0 90.3 89.5 343 N. Mindanan 100.0 100.0 99.2 295 S. Mindanao 99.3 99.2 98.4 572 C. Miudanao 98.4 98.4 96.3 273 ARMM 77.9 61.9 57.5 252 Caraga 100.0 99.8 99.1 208
Education No education 64.9 51.1 44.0 169 Elementary 98.6 97.7 95.0 2,756 High school 99.5 99.3 98.3 3,050 College or higher 99.8 99.8 99.2 2,361
Total. 98.6 98.0 96.4 8,336
llncludes pill, IUD, injection, condom, female stefilizaton, male sterilization, mucus/Billings/ovulation, basal body temperature, symptothermal method and lactational amanorrhea method (LAM).
50

When it comes to regional variations, only ARMM deviates from the practically universal knowledge of any method and any modem method. It is in the level of knowledge of a place to obtain a modem method that larger regional differentials exist. Women in Ilocos Region, Central Visayas, Northern Mindanao and Caraga have the highest levels of knowledge of a source for a modem method (at least 99 percent). ARMM shows the lowest level (58 percent).
Excluding women with no education, them are no substantial differentials in the proportion knowing at least one contraceptive method and a source for a modem method by level of education. Women with no education are much less likely to know about methods or their sources.
4.2 Ever Use of Family Planning Methods
For each method mentioned spontaneously or recognized after probing, the respondent was asked if she had ever used it. While the information is available for all women and married women, the analysis primarily focuses on married women who are at the greatest risk of pregnancy (Table 4.3). Seven in 10 married women have used a family planning method at some time; 53 percent have used a modem method and 44 percent have used a traditional method. The most popular modem method is the pill (36 percent) followed by the condom (14 percent), female sterilization (10 percent), and the IUD (9 percent). The remaining modem methods have small proportions of ever users. Among the traditional methods, withdrawal is the most popular (33 percent), followed by the calendar/rhythm method (24 percent).
In general, the level of ever use increases with age up to age 35-39, and then declines. However, the pattern varies for specific modem methods; ever use of the pill peaks at age 30-34, IUD use at age 35- 39, and female sterilization use at age 40-44.
51

t.~tt to
Table 4.3 Ever use of contraception
Among all women and currently married women, the percentage who have ever used a contraceptive method, by specific method and age. Philippines 1998
Modem methods Traditional methods
Mucus, Basal Lac- Any Any Female Male Bill'mgs, body tational tradi- Calen- Other Number
Any modem In jet- Con- stedli- sterili- ovula- temper- Sympto- amenor- fional dar, With- meth- of Age method method Pill IUD tion dora zafion zation tion ature thermal rhea m e t h o d rhythm drawal ods women
ALL WOMEN
15-19 2.6 1.8 1,3 0,3 0.4 0.3 0.0 0,0 0.0 0,0 0.0 0,0 1.4 0,4 1.2 0,0 2,924 20-24 25.3 17.8 13.4 2.5 3.2 3.4 0.l 0.0 0.2 0.1 0.0 0.1 14.3 5.7 11.4 0.9 2,299 25-29 52.1 37.9 28.1 6.2 6.8 8.1 2.5 0.0 0.6 0.3 0.0 0.5 32.4 14.7 25.3 1.5 2,209 30-34 66.2 52.0 36.5 8.5 6.5 13.8 7.5 0.0 1.1 0.5 0.0 0.3 42.6 23.4 32.6 2.8 2,058 35-39 69.9 54.1 35.9 9.3 5.8 13.9 13.6 0.1 1.5 0.3 0.1 0.5 44.2 28.1 30.2 3.4 1,842 40-44 63.8 49.3 30.6 7.5 4.5 16.8 17.3 0.3 1.3 0.9 0.5 0.7 40.6 26.2 28.8 3.2 1,480 45-49 56.8 42.4 25.3 7.2 2.0 15.7 15.3 0.7 0.9 0.8 0.0 0.3 36.5 22.7 26.0 3.8 1,170
Total 43A 32.8 22.4 5.3 4.0 8.8 6.4 0.1 0.7 0.3 0.1 0.3 27.2 15.2 20.1 1.9 13,983
CURRENTLY MARRIED WOMEN
15-19 28.6 19.5 14.5 2.9 4.0 2.1 0.0 0.0 0.3 0.0 0.0 0.3 16.3 4.4 14.1 0.6 244 20-24 57.7 40.6 30.9 5.9 7.1 7.2 0.2 0.0 0.3 0.3 0.1 0.2 32.5 12.9 25.9 1.6 967 25-29 70.2 50.9 37.6 8.6 9.3 11.1 3.3 0.0 0.7 0.5 0.1 0.7 44.4 20.1 34.9 2.1 1,585 30-34 75.7 59.7 41.5 9.7 7.5 15.9 8.8 0.0 1.3 0.6 0.0 0.4 49.2 27.1 37.5 3.2 1,730 35-39 76.6 59.6 39.8 10.3 6.4 15.3 14.7 0.1 1.7 0.3 0.1 0.6 48.8 30.7 33.2 3.8 1,602 40-44 71.2 54.4 33.9 8.2 5.2 18.7 19.9 0.4 1.6 1.0 0.6 0.8 46.3 29.8 33.1 3.8 1,243 45-49 64.0 48.3 28.4 g.5 2.3 18.4 17.5 0.8 1.1 1.(3 0.0 0.4 41.2 25.9 29.6 4.2 965
Total 69.4 52.5 35.8 8.6 6.5 14.2 10.3 0.2 I.I 0.6 0.I 0.5 44.0 24.4 32.6 3.0 8,336
52

4.3 Current Use of Family Planning Methods
The level of current use of contraception is the most widely used and valuable measure of the success of the Philippine Family Planning Program (PFPP). As with ever use, the information on current use is available for all women and currently married women but the analysis focuses on the latter (Table 4.4). Thus, contraceptive prevalence is defined as the proportion of married women age 15-49 years who were using some method of family planning at the survey date.
An inverted U-shaped pattern of prevalence by age is observed, which is typical of most countries. Among currently married women, a peak in use occurs at age 35-39 for any method or any traditional method and at age 30-34 years for any modern method (Table 4.4). However, as with the data on ever use, the peak occurs in different age groups for specific modem methods. As expected, permanent methods such as female sterilization are popular among older women who are more likely to have completed their families and want to stop childbearing altogether. In contrast, the use of pill is popular among the younger women who are still in their early stages of family building, peaking at age 20-29 years. Current use of calendar/rhythm/periodic abstinence is highest among married women age 35-39 years, while withdrawal is highest among those age 25-29 years.
The contraceptive prevalence rate is 47 percent; 28 percent are using modern methods and 18 percent traditional methods. Female sterilization and the pill are the most preferred methods (10 percent each). Withdrawal and calendar/rhythm rank next (9 percent each), IUD fifth (4 percent), followed by injection and condom (2 percent each). The remaining methods have fewer users, each being used by one percent or less of married women (see Figure 4.2).
P 10
Other methods
1%
Figure 4.2 Use of Contraception among
Currently Married Women 15-49 Withdrawal IUD
Condom 9% 4% Female
ection 2%
Calendar/ rhythm
9%
Not using 53%
1998 NDHS
53
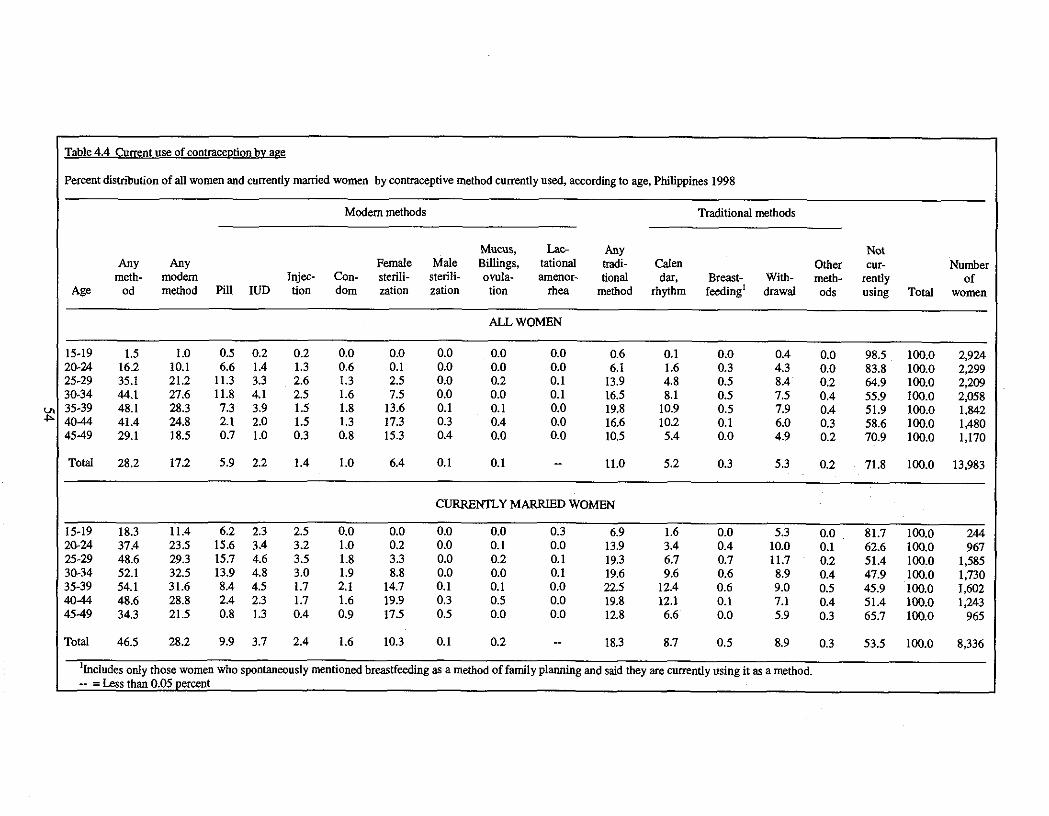
Table 4.4 Current use of contraception by age
Percent distribution of all women and currently married women by contraceptive method currently used, according to age, Philippines 1998
Modem methods Traditional methods
Mucus, Lac- Any Not Any Any Female Male Billings, tational tradi- Calen Other cur- Number
meth- modem Injec- Con- stcrili- sterili- ovula- amenor- tional dar, Breast- With- meth- rently of Age od method Pill IUD tion dora zation zation tion rhea m e t h o d rhythm feeding I drawal ods using Total women
ALL WOMEN
15-19 1.5 1.0 0.5 0.2 0.2 0,0 0,0 0.0 0.0 0.0 0.6 0.1 0,0 0.4 0.0 98.5 100.0 2,924 20-24 16.2 10.1 6.6 1.4 1.3 0,6 0.1 0.0 0.0 0.0 6.1 1.6 0.3 4.3 0.0 83.8 1(30 .0 2,299 25-29 35.1 21.2 11.3 3.3 2.6 1.3 2,5 0.0 0.2 0.1 13.9 4.8 0.5 8.4 0.2 64.9 100.0 2,209 30-34 44,l 27.6 11.8 4.1 2,5 1.6 7.5 0.0 0.0 0,1 16.5 8.1 0.5 7.5 0.4 55.9 100.0 2,058 35-39 48.1 28.3 7.3 3.9 1.5 1.8 13.6 0,1 0.1 0.0 19.8 10.9 0.5 7.9 0.4 51.9 100.0 1,842 40-44 41.4 24,8 2.1 2.0 1.5 1.3 17.3 0.3 0.4 0.0 16,6 10.2 0.1 6.0 0.3 58.6 100.0 1,480 45-49 29.1 18.5 0.7 1.0 0.3 0,8 15.3 0.4 0.0 0.0 10.5 5.4 0.0 4.9 0.2 70.9 100.0 1,170
Total 28.2 17.2 5,9 2.2 1.4 1.0 6.4 0.1 0.1 -- 11.0 5,2 0.3 5.3 0.2 71.8 1130.0 13,983
CURRENTLY MARRIED WOMEN
15-19 18.3 11.4 6.2 2.3 2,5 0,0 0.0 0.0 0.0 0.3 6.9 1.6 0.0 5,3 0.0 81,7 100.0 244 20-24 37.4 23.5 15.6 3.4 3.2 L0 0,2 0,0 0,1 0.0 13.9 3.4 0.4 10.0 0,1 62.6 100,0 967 25-29 48.6 29.3 15.7 4.6 3.5 1.8 3.3 0.0 0.2 0.1 19.3 6.7 0.7 11.7 0.2 51.4 100.0 1,585 30-34 52.1 32.5 13.9 4.8 3.0 1,9 8.8 0.0 0.0 0.I 19,6 9.6 0.6 8.9 0.4 47.9 100.0 1,730 35-39 54.1 31.6 8A 4.5 1.7 2,1 14.7 0.1 0.1 0.0 22,5 12.4 0.6 9.0 0.5 45.9 100.0 1,602 40-44 48.6 28.8 2.4 2.3 1.7 1.6 19.9 0.3 0.5 0.0 19,8 12,1 0.I 7.1 0.4 51.4 I00.0 1,243 45-49 34.3 21.5 0.8 1.3 0.4 0,9 17.5 0,5 0.0 0.0 12,8 6.6 0.0 5.9 0.3 65.7 100.0 965
Total 46.5 28.2 9.9 3.7 2.4 1,6 10,3 0.1 0.2 -- 18,3 8,7 0.5 8.9 0.3 53.5 100.0 8,336
lIncludes only those women who spontaneously mentioned breasffeeding as a method of family planning and said they are currently using it as a method. -- = Less than 0.05 percent
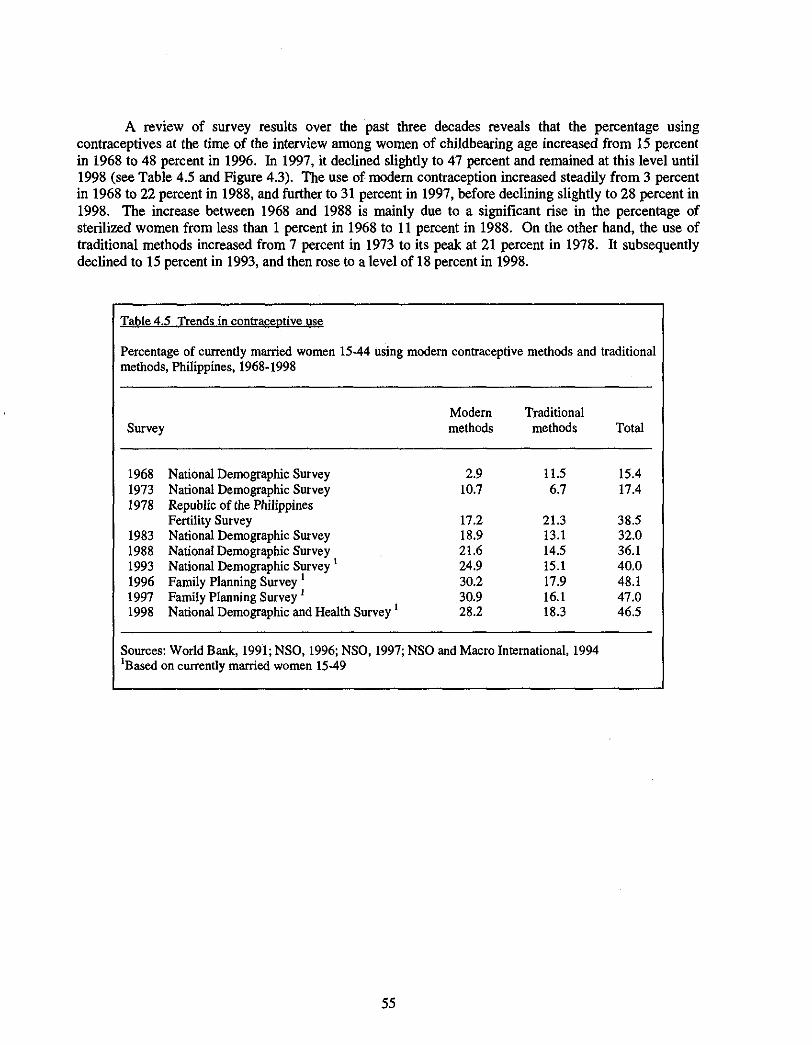
A review of survey results ove r the past three decades reveals that the percentage using contraceptives at the time of the interview among women of childbearing age increased from 15 percent in 1968 to 48 percent in 1996. In 1997, it declined slightly to 47 percent and remained at this level until 1998 (see Table 4.5 and Figure 4.3). The use of modem contraception increased steadily from 3 percent in 1968 to 22 percent in 1988, and further to 31 percent in 1997, before declining slightly to 28 percent in 1998. The increase between 1968 and 1988 is mainly due to a significant rise in the percentage of sterilized women from less than 1 percent in 1968 to 11 percent in 1988. On the other hand, the use of traditional methods increased from 7 percent in 1973 to its peak at 21 percent in 1978. It subsequently declined to 15 percent in 1993, and then rose to a level of 18 percent in 1998.
Table 4.5 Trends in contracentive use
Percentage of currently married women 15-44 using modern contraceptive methods and traditional methods, Philippines, 1968-1998
Modem Traditional Survey methods methods Total
1968 National Demographic Survey 2.9 11.5 15.4 1973 National Demographic Survey 10.7 6.7 17.4 1978 Republic of the Philippines
Fertility Survey 17.2 21.3 38.5 1983 National Demographic Survey 18.9 13.1 32.0 1988 National Demographic Survey 21.6 14.5 36.1 1993 National Demographic Survey i 24.9 15.1 40.0 1996 Family Planning Survey I 30.2 17.9 48.1 1997 Family Planning Survey J 30.9 16.1 47.0 1998 National Demographic and Health Survey t 28.2 18.3 46.5
Sources: World Bank, 1991; NSO, 1996; NSO, 1997; NSO and Macro International, 1994 1Based on currently married women 15-49
55

Figure 4.3 Trends in Contraceptive Use
Philippines 1968-1998
60
50
40
30
20
10
0
Percent
1968 NDS 1973NDS 1978 RPFS 1983NDS 1988 NDS 1993NDS 1998 NDHS
It~Modern methods DTraditional methods]
The level of current contraceptive use is higher in urban areas (51 percent) than in rural areas (42 percent). Among urban women, female sterilization (13 percent) is the most popular method, followed by the pill (11 percent), whereas among rural women, the most commonly used methods are the pill (9 percent), withdrawal (8 percent), and calendar/rhythm/periodic abstinence (8 percent) (Table 4.6).
Differentials in current contraceptive use among the 16 administrative regions of the country are large. The use of any contraceptive method is highest in Central Luzon (55 percent), Southern Mindanao (55 percent) and Northern Mindanao (54 percent), while Autonomous Region of Muslim Mindanao (ARMM) manifests the lowest use (16 percent). However, when current use of any modem method is examined, Cagayan Valley ranks first (39 percent), followed by Southern Mindanao (36 percent) and Central Luzon (35 percent). ARMM registers the lowest level of current use of modem methods (9 percent). The ranking changes with the current use of any tradit'tonal method with Central Visayas showing the highest level (23 percent) and ARMM the lowest (7 percent). The top ranking regions when pill use is considered are Cagayan Valley and Western Mindanao (16 percent each), and for female sterilization they are Central Luzon (19 percent) and Cordillera Administrative Region (15 percent).
56
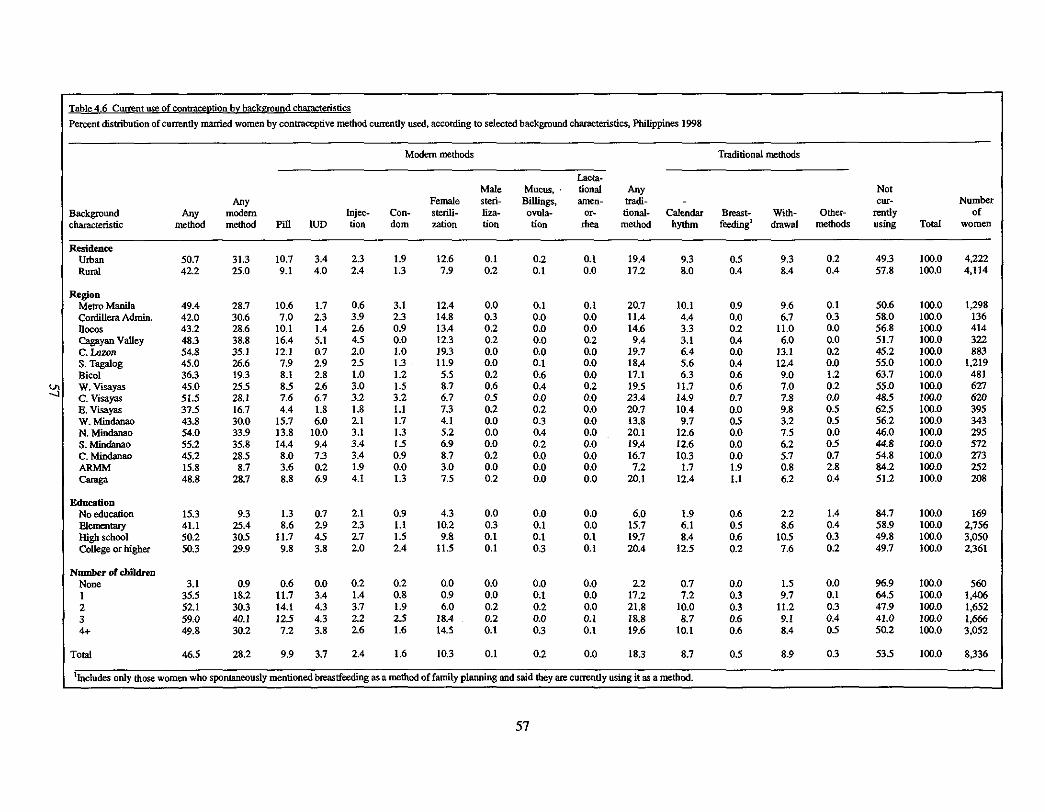
Table 4.6 Cmxent use of egntraeeption by baek~ound characteristics
Percent distribution of currently marciod women by contraceptive method currently used, according to selected background characteristics, Philippines 1998
Modem methods Traditional methods
Lacta- Male Mucus, • tional Any Not
Any Female steri- Billings, amen- ttadi- - cur- Number Background Any modem Injee- Con- sterili- liza- ovula- or- tlonal- Calendar Breast- With- Other- rently of characteristic method method Pill IUD lion dora zafion tion llon rhea method hythm feeding ~ dmwal methods using Total women
Residence Urban 50.7 31.3 10.7 3.4 2.3 1.9 12.6 0.1 0.2 0.1 19.4 Rural 42.2 25.0 9.1 4.0 2.4 1.3 7.9 0.2 0.1 0.0 17.2
9.3 0.5 9.3 0.2 49.3 100.0 4,222 8.0 0.4 8.4 0.4 57.8 100.0 4.114
Region Metro Manila 49.4 28.7 10.6 1.7 0.6 3.1 12.4 0.0 0.1 0.1 20.7 10.1 Cordillera Admin. 42.0 30.6 7.0 2.3 3.9 2.3 14.8 0.3 0.0 0.0 11.4 4.4 lloeos 43.2 28.6 10.1 1.4 2.6 0.9 13.4 0.2 0.0 0.0 14.6 3.3 Cagayan Valley 48.3 38.8 16.4 5.1 4.5 0.0 12.3 0.2 0.0 0.2 9.4 3.1 C. L~zoa 54,8 35.1 12.1 0.7 2.0 1.0 19.3 0.0 0.0 0.0 19.7 6.4 S. Tagalog 45.0 26.6 7.9 2.9 2.5 1.3 11.9 0.0 0.1 0.0 18.4 5.6 Bieol 36.3 19.3 8.1 2.8 1.0 1.2 5.5 0.2 0.6 0.0 17.1 6.3 W. Visayas 45.0 25.5 8.5 2.6 3.0 1.5 8.7 0.6 0.4 0.2 19.5 11.7 C. Visayas 51.5 28,1 7.6 6.7 3.2 3.2 6.7 0.5 0.0 0.0 23.4 14.9 E. ~FLsayas 37.5 16.7 4.4 1.8 1.8 1.1 7.3 0.2 0.2 0.0 20.7 10.4 W. Mindanao 43.8 30.0 15.7 6.0 2.1 1.7 4.1 0.0 0.3 0.0 13.8 9.7 N. Mindanao 54.0 33.9 13.8 10.0 3.1 1.3 5.2 0.0 0.4 0.0 20.1 12.6 S. Mindanao 55.2 35.8 14.4 9.4 3.4 1.5 6.9 0.0 0.2 0.0 19.4 12.6 C. Mindanao 45.2 28.5 8.0 7.3 3.4 0.9 8.7 0.2 0.0 0.0 16.7 10.3 ARMM 15.8 8.7 3.6 0.2 1.9 0.0 3.0 0.0 0.0 0.0 7.2 1.7 Camga 48.8 28.7 8.8 6.9 4.1 1.3 7.5 0.2 0.0 0.0 20.1 12.4
Education No odueation 15.3 9.3 1.3 0.7 2.1 0.9 4.3 0.0 0.0 0.0 6.0 1.9 Elementary 41.1 25.4 8.6 2.9 2.3 1.1 10,2 0.3 0.1 0.0 15.7 6.1 High school 50.2 30.5 11.7 4.5 2.7 1.5 9.8 0.1 0.1 0.1 19.7 8.4 Callege or higher 50.3 29.9 9.8 3.8 2.0 2.4 11.5 0.1 0,3 0.1 20.4 12.5
Number of children None 3.1 0.9 0.6 0.0 0.2 0.2 0.0 0.0 0.0 0.0 2.2 0.7 1 35.5 18.2 11.7 3.4 1.4 0.8 0.9 0.0 0.1 0.0 17.2 7.2 2 52.1 30.3 14.1 4.3 3.7 1.9 6.0 0.2 0,2 0.0 21,8 10.0 8 59.0 40.1 12.5 4.3 2.2 2.5 18.4 0.2 0.0 0.1 18.8 8.7 4+ 49.8 30.2 7.2 3.8 2.6 1.6 14.5 0.1 0.3 0.1 19.6 10.1
Total 46.5 28.2 9.9 3.7 2.4 1.6 10.3 0.1 0.2 0.0 18.3 8.7
0.9 9.6 0.1 50.6 100.0 1,298 0.0 6.7 0.3 58.0 100.0 136 0.2 11.0 0.0 56.8 100.0 414 0.4 6.0 0.0 51.7 100.0 322 0.0 13.1 0.2 45.2 100.0 883 0A 12.4 0.0 55.0 100.0 1.219 0.6 9.0 1.2 63.7 100.0 481 0,6 7.0 0.2 55.0 100.0 627 0.7 7.8 0.0 48.5 100.0 620 0.0 9.8 0.5 62,5 100.0 395 0.5 3.2 0.5 56.2 100.0 343 0.0 7.5 0.0 46.0 100.0 295 0.0 6.2 0.5 44.8 100.0 572 0.0 5.7 0.7 54.8 100.0 273 1.9 0.8 2.8 84.2 100.0 252 1.1 6.2 0.4 51.2 100.0 208
0.6 2.2 1.4 84.7 100.0 169 0.5 8.6 0.4 58.9 100.0 2,756 0.6 10.5 0.3 49.8 100.0 3,050 0.2 7.6 0.2 49.7 100.0 2,361
0.0 1.5 0.0 96.9 100.0 560 0.3 9.7 0.1 64,5 100.0 1.406 0.3 11.2 0.3 47.9 100.0 1,652 0.6 9.1 0.4 41.0 100.0 1,666 0.6 8.4 0.5 50.2 100.0 3,052
0.5 8.9 0.3 53.5 I00.0 8,336
~Inchides only those women who spontaneously mentioned breasffeeding as a method of family planning and said they are currently using it as a method.
57

Current contraceptive use differs by level of education. Only 15 percent of married women with no formal education are currently using a method, compared with 41 percent of women with at most some elementary education, and 50 percent of those with at least some secondary education or higher. Among women with no education or only some elementary schooling, female sterilization is the most widely used method, followed by withdrawal. Among women with some secondary schooling, the pill is the most widely used method, followed by withdrawal. It is interesting to note that among women who have at least some college education or higher, calendar/rhythm is the most commonly used method, followed by female sterilization.
The level of contraceptive use is also strongly related to the number of children a woman has. Only 3 percent of married women with no children are currently using a family planning method. After the first child, contraceptive use increases sharply with the number of living children, peaking at 59 percent among women with 3 children, after which it declines.
4.4 Number of Children at First Use of Family Planning
In many cultures, family planning is used only when couples have already had as many children as they want. However, as the concept of family planning gains acceptance, the motivation to use family planning may either be to space births or to limit family size. Table 4.7 shows the percent distribution of ever-married women by the number of living children at the time of first use, by the respondent's age at the time of the interview. The results indicate that Filipino women are adopting family planning fairly early in the family building process although only 4 percent of ever-users began using immediately after marriage or before the first birth. Overall, about one in three women began using family planning after the first child and about one in six started using after two children.
Table 4.7 Number of children at first use of contracention
Percent distribution of ever-married women by number of living children at the time of first use of contraception, according to current age, Philippines 1998
Number of living children at time of first use of contraceptive Number
Current Never used Miss- of age contraception 0 1 2 3 4+ ing Total women
15-19 68.7 6.5 21.0 3.3 0,3 0.0 0.2 100.0 248 20-24 40.1 7.0 39.5 9.8 2,5 1,0 0.0 100,0 1,004 25-29 28.2 4.7 38.5 17.1 7,2 4,2 0.1 I00,0 1,657 30-34 23.4 3.2 35.2 15.9 11.8 10,4 0.1 100.0 1,820 35-39 22.3 2.8 31.5 17.4 13.5 12.5 0.1 100,0 1,703 40-44 29.4 2.6 25.4 15.4 12,1 15,0 0.1 100,0 1,371 45-49 35.5 1.7 21.1 15.1 10,9 15,5 0.1 100.0 1,093
Total 29.7 3.6 32.0 15.2 9.8 9,6 0.1 100,0 8,896
58

The timing of first contraceptive use in terms of the number of living children varies among the different age cohorts of women. A higher percentage of younger women compared with older women started using contraception after having one child. For instance, two out of five women aged 20-24 years first used contraception after having one child, compared with one out of five women aged 45-49 years. The two age cohorts are worth noting as the 45-49 cohort has a slightly higher percentage of ever-users of contraception compared to the 20-24 cohort (64 percent versus 60 percent).
4.5 Problems with Current Method
Identifying problems with the use of specific methods has practical implications for future educational and publicity campaigns. Therefore, the 1998 NDHS included a question for all current users as to whether they had experienced any problems with the method they were using and if so, what the main problem was. The results are shown in Table 4.8. Ninety percent or more of current users of the condom, female sterilization, withdrawal, and the KID reported having no problems with the method they were currently using. A slightly lower percentage of current users of the pill (86 pereen0 reported the same. Of those who have had problems with their methods, side effects were generally cited as the most common problem. Health concerns were reported by a little more than one percent of the current users of the pill, IUD, female sterilization and withdrawal. It should be mentioned that this question, which asks about problems with current method, may not have elicited a full reporting of problems. Women who had serious problems are likely to have discontinued the method.
Table 4.8 Problems with current method of contraception
Percent distribution of contraceptive users by the main problem with current method, according to specific methods, Philippines 1998
Female sterili- With-
Main problem Pill IUD Condom zation drawal
No problem 85.9 89.4 95.3 89.9 89.8 Husband disapproves 0.0 0.2 0.0 0.0 0.0 Side effects 12.1 7.9 2.1 8.1 8.1 Health concerns 1.2 0.8 1.4 1.4 1.5 Access/availability 0.0 0.2 0.0 0.0 0.0 Cost 0.1 0.0 0.0 0.0 0.0 Inconvenient to use 0.7 0.7 1.2 0.0 0.2 Other 0.0 0.2 0.0 0.5 0.1 Missing 0.0 0.6 0.0 0.1 0.3
Total 100.0 100.0 100.0 100.0 100.0 Number of women 831 310 138 898 742
59

4.6 Knowledge of Fertile Period
An elementary knowledge of reproductive physiology is useful for successful practice of coitus- associated methods such as withdrawal, condom and vaginal methods. Such knowledge is particularly critical in the practice of calendar/rhythm method and natural family planning methods such as mucus/Billings/ovulation, basal body temperature, and symptothermal method. In the 1998 NDHS, women were asked during which days of a woman's menstrual cycle a woman has the greatest chance of becoming pregnant. A fifth of all women interviewed said they did not know when they are fertile during their ovulatory cycle (Table 4.9). In contrast, only a small proportion of those who have used calendar/rhythm (7 percent) did not know when a woman is most likely to get pregnant. However, only 14 percent of all women and 26 percent of ever-users of calendar/rhythm gave the "correct" response, that is, a woman's fertile period occurs in the middle of her cycle. About 33 percent of all women and 35 percent of ever-users of calendar/rhythm method said that a woman is most likely to conceive right after her period has ended. Smaller proportions reported that the least safe period is just before a woman's period begins. One-fifth of all women and 16 percent of users of calendar/rhythm reported that there is no particular time when women are at greater risk of conceiving. The findings indicate a need to further educate potential and actual users of natural family planning on the ovulatory process.
Table 4.9 Knowledge of fertile period
Percent distribution of all women and of women who have ever used calendar/rhythm by knowledge of the fertile period during the ovulatory cycle, Philippines 1998
Ever-users of Perceived calendar/ All fertile period rhythm women
During menstrual period 0.4 0.9 Right after period has ended 34.5 33.2
! In the middle of the cycle 25.7 13.8 Just before period begins 3.8 5.6 Other 13.1 6.8 No particular time 15.7 19.6 Don't know 6.5 20.1 Missing 0.1 0.1
Total 100.0 100.0 Number of women 728 13,983
60

4.7 Timing of Sterilization
In the Philippines where female sterilization is one of the most widely used methods of contraception, information about the trend in age at adoption of sterilization is very useful. To minimize problems of censoring, the median age at the time of the operation is calculated for women sterilized at less than 40 years of age. Data shown in Table 4.10 indicate that 73 percent of sterilized women had their operation at age 25-34, and 12 percent were sterilized before age 25. There is evidence that, over time, women are having the operation at older ages; the median age at sterilization is 29 for women sterilized 8-9 years ago, and 32 for women who had the operation less than 2 years ago. Overall, the median age is 30 years.
Table 4.10 Timin~ of sterilization
Percent distribution of sterilized women by age at the time of sterilization, according to the number of years since the operation, Philippines 1998
Age at time of sterilization Number Years since of Median operation <25 25.29 30-34 35-39 40-44 45-49 Total women ago
<2 4.1 30.8 33.6 24.0 7.0 0.5 100.0 103 31.9 2-3 4.6 41.1 29.4 16.8 6.2 1.9 100.0 85 30.1 4-5 6.7 23.8 49.8 11.8 7.9 0.0 100.0 88 3t.5 6-7 7.3 33.9 32.3 24.0 2.5 0.0 100.0 121 31.2 8-9 11.8 44.2 29.8 14.3 0.0 0.0 I00.0 84 28.9 10+ 18.1 45.6 31.6 4.7 0.0 0.0 100.0 417 b
Total 12.1 39.6 33.3 12.3 2.5 0.2 100.0 898 29.6
a Median age was calculated only for women less than 40 years of age to avoid problems of censoring. b
Not calculated due to censonng
4.8 Willingness to Pay for Contraceptive Method Used
Slightly more than one-third (35 percent) of current users of pills obtain these free of charge (Table 4.11). Three out of ten purchase a packet of pills at less than 10 pesos, 15 percent, at 10 to 24 pesos and another 14 percent at 25 to 99 pesos. When asked how much they are willing to pay for the pills, more than half (55 percent) of pill users expressed willingness to pay between 10 and 50 pesos per packet. Around one-fifth would still purchase it at more than 50 pesos but not to exceed 99 pesos.
Of the users of injection, one-third obtain it for free, while around three-fifths pay less than 100 pesos per injection. Less than 5 percent pay 100 pesos or more. However, almost three out of ten are willing to pay 100 pesos or more per injection, one-quarter from 50 to 99 pesos, and 48 percent would rather pay less than 50 pesos.
Almost three out of ten IUD users do not pay for the method, while more than half (53 percent) pay less than 100 pesos. Surprisingly, four out of ten IUD users expressed willingness to pay for the method at 100 pesos or more. Almost half of condom users are willing to pay less than 20 pesos for a packet of condoms. This is to be expected since 28 percent obtain the method for free, while another 39 percent pay less than 10 pesos per packet.
61

Table 4.11 Willingness to pay for contraceptive method used
Percent distribution of current users of pill, injection, IUD; and condom, by cost of method and by amount willing to pay for method, Philippines 1998
Pill users Injection users IUD users Condom users
Amount Amount Current willing Current willing
Cost cost to pay Cost cost to pay Cost
Amount Current willing
cost to pay Cost
Amount Current willing
cost to pay
Free 35.4 Free 33.2 Free 27.1 < 10 pesos 30.2 7.4 < 10 pesos 13.4 3.2 < 10 pesos 6.1 10 - 24 pesos 14.7 29.5 10 - 19 pesos 17.5 13.0 1 0 - 19 pesos 8.3 2 5 - 49 pesos 3.8 25.1 2 0 - 29 pesos 10.2 17.4 2 0 - 29 pesos 12.1 50 - 74 pesos 5.0 11.5 30 - 49 pesos 7.5 14.1 30 - 49 pesos 6.5 75 - 99 pesos 5.4 9.8 50 - 99 pesos 13.8 23.2 5 0 - 99 pesos 19.9 1 0 0 - 149 pesos 4.2 8.3 100 - 249 pesos 2.5 14.3 100 - 249 pesos 12.4 1 5 0 - 199 pesos 0.0 1.7 250 - 499 pesos 1.3 11.1 250 - 499 pesos 4.3 200 - 299 pesos 0.4 1.2 500 - 749 pesos 0.2 2.5 500 - 749 pesos 1.1 300 pesos 0.1 2.3 750 - 999 pesos 0.5 0.7 750 - 999 pesos 1.1 >300 pesos 0.4 3.0 1,000 pesos 0.0 0.5 1,000 pesos 0.0 Don't know/ 0.5 0.2 Don't know/ 0.0 0.0 Don't know/ 1.2 missing missing missing
Total 100.0 100.0 Total 100.0 100.0 Total 100.0 Mean 19.6 51.5 Mean 28.0 85.1 Mean 65.8
No. ofusers 831 831 No. ofusers 198 198 No. ofusers 310
Free 0.6 < 10 pesos 7.6 1 0 - 19 pesos
10.7 2 0 - 29 pesos 9.4 3 0 - 49 pesos
29.1 50 - 99 pesos 18.7 1 0 0 - 249 pesos l 3.3 2 5 0 - 499 pesos 4.9 1.3 3.9 0.6 Don't know/
missing
28.3 38.6 15.5 18.1 32.3 2.7 20.4 2.2 12.8 1.5 6.9 0.8 8.4 1.4 3.7
6.4 0.0
100.0 Total 100.0 146.1 Mean 13.0
Note: Cost refers to the cost per packet of pills, per injection, and per packet of condoms; IUD cost includes cost of insertion.
310 No. of users 138
I00.0 32.3
138

4.9 Source of Supply of M o d e r n Con t racep t ive Methods C u r r e n t l y Used
Information on sources of modem contraceptives currently used is useful for family planning program managers and implementors. The public sector (Table 4.12) emerges as the main source for a large majority of current users (72 percent) of modem contraceptives. In fact, about nine in I0 users of injection, four in five users of IUD, and three in four users of the pill obtained their methods from government sources. While government hospitals are the main source of female sterilization, barangay health stations and urbardmral health centers are the main sources for the pill, IUD, and injection. Pharmacies are an important source of pills and condoms.
Table 4.12 Source of supply for modern contraceetive methods
Percent distribution of current users of modern contraceptive methods by most recent source of supply, according to specific methods, Philippines 1998
Female Source of supply Pill IUD Injection Condom sterilization Total
Public sector 76.4 82.4 92.0 41.4 65.6 72.0 Government hospital 1.8 10.4 3.5 0.0 54.1 22.7 Rural/urban health station 31.3 41.4 33.7 17.4 7.1 22.7 Barangay health station 38.6 28.3 53.0 21.9 3.3 23.9 Barangay supply office 4.3 0.6 1.3 1.0 0.3 1.9 Other public 0.4 1.7 0.4 1.0 0.9 0.8
Medical private 22.7 15.8 7.5 54.1 32.7 26.3 Private hospital/clinic 3.2 13.4 5.7 3.0 30.8 15.4 Private doctor 2.6 1.8 1.3 0.0 1.6 1.9 Private nurse/midwife 0.4 0.4 0.5 0.0 0.1 0.3 Pharmacy 15.5 0.2 0.0 47.2 0.0 8.1 Store 0.6 0.0 0.0 2.4 0.0 0.4 NGO 0.1 0.0 0.0 0.0 0.0 0.1 Industry based clinic 0.3 0.0 0.0 1.4 0.0 0.2
Other private 0.9 1.2 0.5 4.5 1.1 1.4 Puericulture center 0.1 1.2 0.0 0.0 0.4 0.3 Church 0.0 0.0 0.0 0.0 0.6 0.3 Friends/relatives 0.8 0.0 0.5 3.8 0.1 0.7 Other 0.0 0.0 0.0 0.7 0.1 0.1
Don't know 0.0 0.0 0.0 0.0 0.3 0.1 Missing 0.0 0.6 0.0 0.0 0.2 0.2
Total 100.0 100.0 100.0 100.0 I00.0 100.0 Number of women 831 310 198 138 898 2,403
Note: Total includes 12 users of male sterilization, 13 users of mucus/Billings/ovulation method and 4 LAM users.
63

Aside from the type of source, information on the length of time needed to reach the source from home was obtained for women who are currently using a modem contraceptive method. Table 4.13 shows the relevant information by urban-rural residence for current users of modem contraceptives. Among current users of modem contraceptives, the median time to reach a source is 30 minutes. The same length of time holds true for rural users, while urban users need about 20 minutes, on average.
Table 4.13 Time to source of suonlv for modem contracentive methods
Percent distribution of women who are currently using a modem contraceptive method by time (minutes) to reach a source of supply, according to urban-rural residence, Philippines 1998
T i m e (minutes) tO source
Women who are currently using a modem method
Urban Rural Total
0-14 37.4 26.4 32.7 15-29 17.3 15.2 16.4 30-59 22.9 25.1 23.8 60+ 21.5 32.8 26.4 Don't know time 0.4 0.3 0.4 Don't know source 0.2 0.0 0.1 Not stated 0.2 0.2 0.2
Total 100.0 100.0 100.0 Median time to source 20.2 30.4 30.0
Number of women 1,363 1,040 2,403
64
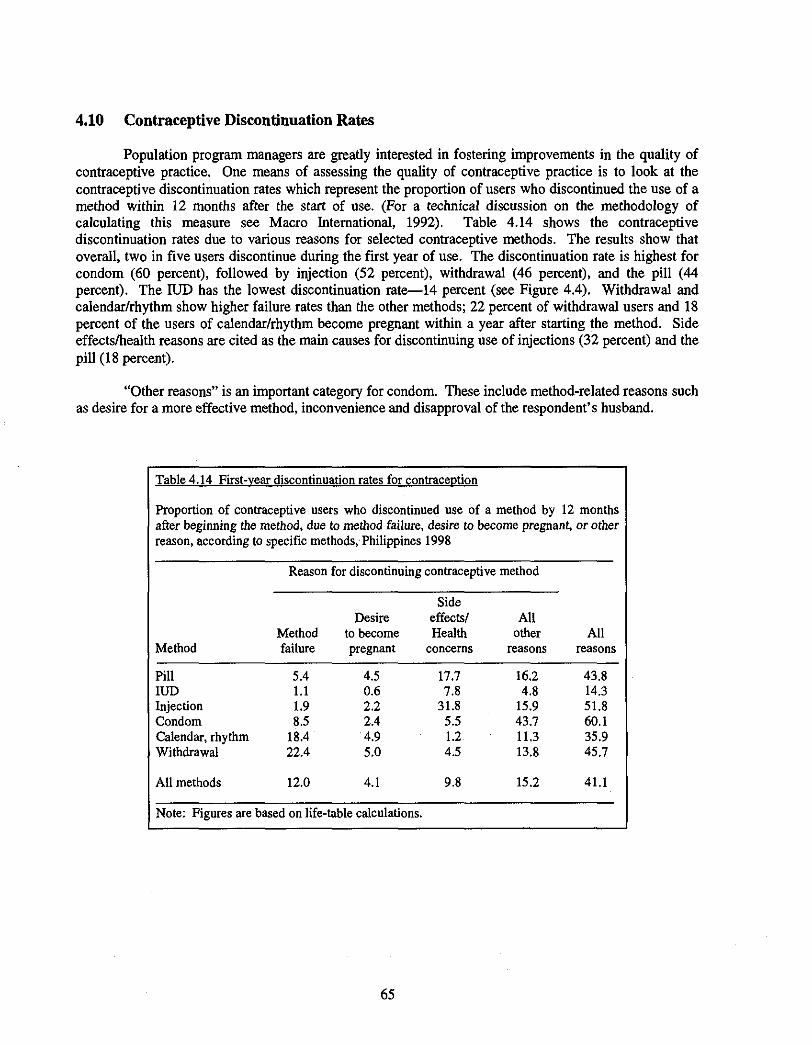
4.10 Contraceptive Discontinuation Rates
Population program managers are greatly interested in fostering improvements in the quality of contraceptive practice. One means of assessing the quality of contraceptive practice is to look at the contraceptive discontinuation rates which represent the proportion of users who discontinued the use of a method within 12 months after the start of use. (For a technical discussion on the methodology of calculating this measure see Macro International, 1992). Table 4.14 shows the contraceptive discontinuation rates due to various reasons for selected contraceptive methods. The results show that overall, two in five users discontinue during the first year of use. The discontinuation rate is highest for condom (60 percent), followed by injection (52 percent), withdrawal (46 percent), and the pill (44 percent). The IUD has the lowest discontinuation rate---14 percent (see Figure 4.4). Withdrawal and calendar/rhythm show higher failure rates than the other methods; 22 percent of withdrawal users and 18 percent of the users of calendar/rhythm become pregnant within a year after starting the method. Side effects/health reasons are cited as the main causes for discontinuing use of injections (32 percent) and the pill (18 percent).
"Other reasons" is an important category for condom. These include method-related reasons such as desire for a more effective method, inconvenience and disapproval of the respondent's husband.
Table 4.14 First-year discontinuation rates for contracet~tion
Proportion of contraceptive users who discontinued use of a method by 12 months after beginning the method, due to method failure, desire to become pregnant, or other reason, according to specific methods, Philippines 1998
Reason for discontinuing contraceptive method
Side Desire effects/ All
Method to become Health other All Method failure pregnant concerns reasons reasons
Pill 5.4 4.5 17.7 16.2 43.8 IUD 1.1 0.6 7.8 4.8 14.3 Injection 1.9 2.2 31.8 15.9 51.8 Condom 8.5 2.4 5.5 43.7 60.1 Calendar, rhythm 18.4 4.9 1.2 11.3 35.9
i Withdrawal 22.4 5,0 4,5 13.8 45,7
All methods 12.0 4.1 9.8 15.2 41.1
Note: Figures are based on life-table calculations.
65

Figure 4.4 Contraceptive Discontinuation Rates
for First Year of Use
Percent
70
60
5O
40
3O
2O
10
0 Pill IUD Injection Condom Calendar/ With-
rhythm drawa{
1998 NDHS
Table 4.15 presents reasons for discontinuation among ever users who have discontinued use of a mt:!hod during the five years preceding the survey. Considering all methods, accidental pregnancy stands ,ut as the most important reason of stopping use of contraception. Side effects ranks second (16 percent) md desire for pregnancy is third (15 percent). Manipulable program variables, such as access/availability m d cosl of methods, are minor reasons for discontinuing use of any method. Looking at specific methods, the most common reason for discontinuing use of the pill, IUD and injection is side effects, ~ hile method failure is reported by users of withdrawal and calendar/rhythm. Method failure accounts t,,, :d, onl half of the discontinuations of traditional methods. More users of condom discontinue use due + ' i~1~ onvellience than for any other reason.
66

Table 4.15 Reasons for discontinuing of contraception
Percent distribution of discontinuations of contraceptive methods in the five years preceding the survey by main reason for discontinuation, according to specific methods, Philippines 1998
Modern method discontinued
Traditional method discontinued
Reason for Calendar discontinuation Pill IUD Injection Condom rhythm Withdrawal Other Total
Became pregnant 13.0 6.4 2.4 16.7 50.7 52.5 28.1 31.4 To become pregnant 17.0 20.3 5.9 8.1 19.4 12.4 17.3 15.1 Husband disapproved 0.8 0.9 3.0 9.8 1.9 3.3 2.2 2.5 Side effects 28.1 36.0 44.6 6.6 1.0 5.3 3.2 15.5 Health concerns 8.6 13.7 14.8 3.0 1.6 2.6 4.5 5.6 Access/availability 1.6 0.2 2.7 1.1 0.2 0.0 1.7 0.8 More effective method 2.0 4.8 3.4 6.3 7.9 8.1 9.7 5.6 Inconvenient to use 2.6 5.8 1.9 27.3 2.5 2.3 3.7 4.3 Infrequent sex 11.3 1.4 4.1 8.1 3.4 3.1 0.9 6.0 Cost 0.3 0.0 1.4 0.4 0.0 0.0 2.6 0.3 Fatalistic 0.0 0.0 0.2 0.0 0.0 0.0 0.0 0.0 Menopause 0.2 0.3 0.0 0.7 1.0 0.4 2.2 0.5 Marital dissolution 0.5 0.9 0.1 1.0 0.4 0.3 0.0 0.4 Other 8.2 5.6 6.7 5.2 3.5 2.3 14.1 5.4 Don't know 0.7 0.5 0.9 0.3 0.7 0.2 2.1 0.6 Missing 5.3 3.1 7.8 5.6 5.7 7.1 7.6 6.0
Total 100.0 100.0 100.0 100.0 100.0 100.0 100.0 100.0 Number of women 1,295 179 275 287 876 1,130 110 4,152
4.11 Intentions for Future Family Planning Use among Nonusers
Intention to use contraception in the future provides a forecast of potential demand for services, and acts as a convenient summary indicator of disposition towards contraception among current nonusers. Intention not to use contraception in the future is useful in identifying "hard core" targets for program managers and implementors. Among currently married nonusers, 54 percent do not intend to use a family planning method in the future (Table 4.16). One in three nonusers indicated their intent to use a contraceptive method in the next 12 months, while 8 percent said they will use it later. Among currently married nonusers with no living children, a much lower percentage (13 percent) intend to use a method in the next 12 months but 24 percent of them said they will use it later.
67

Table 4.16 Future use of eontraeention
Percent distribution of currently married women who are not using a contraceptive method by intention to use in the future, according to number of living children, Philippines 1998
Number of living children I
Fhtut¢ intention 0 I 2 3 4+ Total
Intends to use in next 12 months 12.5 31.3 39.0 37.0 33.1 32.8 Intends to use later 23.5 13.3 7.3 6.6 2.6 8.0 Unsure as to timing 0.9 0.9 0.6 0.7 1.0 0.8 Unsure as to intention 6.4 5.0 4.2 3.3 2.8 3.9 Does not intend touse 56.8 48,9 48.4 52.0 59.7 53.9 Missing 0.0 0.6 0.6 0.3 0.9 0,6
Total 100.0 100.0 100.0 100.0 100.0 100.0 Number of women 361 877 829 695 1,588 4,351
IIneindes current pregnancy
One-fifth of married nonusers who say they do not intend to use family planning cited desire for pregnancy as the main reason for not using a method. A slightly lower percentage (18 percent) say that they fear side effects (Table 4.17). Other often cited reasons are "menopausal/ had hysterectomy" (14 percent) and health con- cerns (14 percent). Small proportions (6 percent or less) of nonusers cited "husband opposed" (6 per- cent), "opposed to family planning" (5 percent), religion (5 percent) and "older age, difficulty in becoming pregnant, infrequent sex and husband away" (5 percent) as reasons for not using contra- ception. Desire for more children, side effects and health concerns are reported more often by women under 30 than older women as the reason for not using contraception.
Presented in Table 4.18 is the distribution of married nonusers who intend to use in the future by their preferred method. Two out of five nonusers who intend to use family planning in the future prefer to use the pill, 13 percent want to use calendar/rhythm/periodic abstinence, 12 percent want to use injection, 9 percent prefer to use IUD and another 9 percent, female sterilization. A larger percentage of women who intend to use contraception within the next 12 months prefer to use the IUD, injection, and female sterilization than those who want to use contraception after 12 months.
Table 4.17 Reasons for not usine contracentlon
Percent dis~butlon of currently married women who are not using a contraceptive method and who do not intend to use in the future by main reason for not using, according to age, Philip- pines 1998
Age Reason for not using Contraception <30 30+ Total
Wants more children Respondent opposed Husband opposed Others opposed Religion Knows.no method Knows no source Costs too much Side effects Lack of access Inconvenient Interfere with body Health concerns Old/difficuli to get pregnant/ infrequent sex/husband away
Menopausal/had hysterectomy
Subfecund, infecuod Other Don't know/missing
Total Number of women
26.7 18.8 ~ . 4 4.0 5.0 ~8 8,8 4.6 5.5 0.4 0.2 0.2 6.1 4.4 4.8 2,4 1.0 1.3 0,I 0.2 0.2 0.1 0.4 0.4
25.3 15.6 17.5 0.7 0.1 0.2 1.1 L0 1.0 0.8 1.0 1.0 15.3 13.4 13.8
3,0 5.3 4.8 0,5 17.9 14.4
0.6 4.0 3.4 2.2 6.6 5.8 1.8 0.4 0.7
100.0 100.0 100,0 468 1,877 2,345
68

Table 4.18 Preferred method of contraceotion for thture use
Percent distribution of currently married women who are not using a contraceptive method but who intend to use in the future by preferred method, according to whether they intend to use in the next 12 months or later, Philippines 1998
Intend to use
In next After Preferred method 12 12 of contraception months months Total
Pill 39.0 44.2 40.0 IUD 10.6 5.0 9.3 Injection 12.2 8.3 11.7 Condom 2.2 6.5 3.0 Female sterilization 9.4 5.7 8.7 Male sterilization 0.1 0.0 0.1 Calendar/rhythm/periodic abstinence 11.9 16.0 12.8 Mucus/Billings/ovulation 0.1 0.1 0.1 Basal body temperature 0.1 0.5 0.2 Symptothermal 0.1 0.2 0.1 Lactational amenorrhea 0.3 0.0 0.2 Breastfeeding 0.4 0.7 0.6 Withdrawal 7.2 7.5 7.1 Other 2.4 1.2 2.1 Unsure 4.1 3.8 4.0
Total 100.0 100.0 100.0 Number of women 1,426 349 1,811
Note: Total includes 36 women unsure as to timing of intended use.
69

4.12 Family Planning Messages in the Mass Media
In the Philippine Family Planning Program, the Department of Health and Commission on Population are working hand in hand with other government and private agencies in implementing the Information, Education, Communication and Motivation (IECM) component. For example, given the high level of awareness about family planning, the focuses of the Department of Health's efforts in IECM are (Department of Health, 1990):
.
2.
.
4.
correcting misinformation about the Program emanating from various sources; reiteration and specifying the health benefits of family planning and the link of family planning services with other health services; providing the informational basis for expanded choice; and supporting any selection among legally and medically accepted choices with necessary information (as part of the service to assist that choice).
One of the channels of IECM relates to the mass media, which includes radio, television, news- paper/magazine, posters and leaflets/brochures. During the few months prior to the survey, 67 percent of all women had heard about family planning on the radio, while 71 percent had seen it on television (Table 4.19). Less than half had read about family planning in a newspaper/magazine (44 percent), a poster (44 percent), or leaflet/brochure (34 percent). Women, irrespective of age and residence mainly hear about family planning from a radio or a television. A higher percentage of younger women than older women and of urban women compared with rural women had seen a family planning message on television. Moreover, urban women are more likely to see a message in a newspaper/magazine, poster and leaf- let/brochure compared with women in rural areas.
The role of mass media as a channel for communicating family planning to the public is least important in the Autonomous Region of Muslim Mindanao (ARMM). Metropolitan Manila leads all regions in the level of family planning communication through television, newspaper/magazine and leaflet/brochure while Southern Mindanao leads in communications through posters. With radio as the source of family planning messages, Caraga tops the list (79 percent), and Ilocos, Northern Mindanao, Central Mindanao, and Western Mindanao rank second, third, fourth and fifth, respectively.
Generally, more highly educated women are more likely to hear or see family planning messages from the different media of communication. Five in six women with some college education had heard a family planning message on television in the few months before the survey, compared with only one in six women with no formal education.
70

Table 4.19 Exposure to family plannin~ messa~,es in the mass media
Percentage of women who received a message about family planning through the mass media a few months prior to the survey, by selected background characteristics, Philippines 1998
Exposure to family planning message in the media
Number Background Newspaper/ Leaflet/ of characteristic Radio Television magazine Poster brochure women
Age 15-19 65.1 72.7 39.8 39.8 28.1 2,924 20-24 67.6 73.9 48.9 46.0 36.6 2,299 25-29 68.1 71.0 44.5 45.9 35.7 2,209 30-34 68.6 71.9 44.2 45.7 34.7 2,058 35-39 70.9 69.3 46.3 45.6 36.5 1,842 40-44 66.2 67.5 44.6 46.8 39.5 1,480 45-49 65.6 64.0 43.8 42.5 33.7 1,170
Residence Urban 67.9 81.7 52.3 49.5 39.5 7,911 Rural 66.7 56.5 34.0 37.7 27.8 6,072
Region Metro Manila 67.7 89.2 56.8 51.1 44.6 2,818 Cordillera Admin. 57.0 42.3 43.8 44.7 36.8 207 Ilocos 75.7 77.3 47.1 39.6 27.5 689 Cagayan valley 70.2 58.0 42.0 43.1 35.7 474 C.Luzon 65.0 77.6 47.1 40.5 27.4 1,414 S .Tagalog 70.5 77.4 46.6 40.1 30.0 1,917 Bicol 63.9 54.1 34.5 42.4 32.9 703 W.Visayas 66.3 64.1 43.5 51.1 39.3 1,045 C.Visayas 70.3 64.4 38.8 46.8 37.7 1,093 E.Visayas 66.2 52.3 33.0 36.6 25.6 553 W.Mindanao 71.4 51.9 33.3 31.4 21.9 530 N.Mindanao 73.2 65.8 40.8 49.9 37.6 482 S.Mindanao 63.2 70.9 41.1 54.2 37.6 925 C.Mindanao 71.7 69.2 40.5 43.3 32.7 425 ARMM 32.1 23.7 14.7 15.8 13.8 385 Caraga 79.0 71.6 44.4 47.3 39.0 323
Education No education 30.9 16.1 2.7 4.4 4.0 217 Elementary 64.5 53.5 26.4 27.8 19.7 3,664 High school 68.8 74.4 43.0 44.3 31.7 5,916 College or higher 69.9 83.7 64.2 61.2 52.7 4,186
Total 67.4 70.8 44.4 44.4 34.4 13,983
71

To determine the level of acceptance for dissemination of family planning information among Filipino women, the NDHS asked women whether they consider it acceptable to provide family planning information over the radio or television. The result shows that most respondents consider it acceptable to air family planning messages over the radio (88 percent) or television (87 percent). There is little variation by women's age. Urban women are somewhat more likely to accept family planning messages on television than rural women. Family planning messages transmitted through the radio are highly acceptable to women in Caraga, Cagayan Valley, Southern Tagalog, Western Visayas, Northern Mindanao, and Ilocos. On the other hand, family planning messages aired on television are highly acceptable in Caraga, Metropolitan Manila, and Southern Tagalog. Women in ARMM region are the least likely to accept having these messages on either medium (43 percent each). Again, more educated women are more likely to accept family planning messages on radio or television (Table 4.20).
Table 4.21 shows the percentage of women who have seen or heard the slogan of the Philippine Family Planning Program "kung sila'y mahal niyo, magplano" and the distribution of these women according to what they think is the meaning of the slogan. Sixty-six percent of women have heard or seen the slogan. The level of awareness of women about the slogan varies slightly by age. More than 85 percent of women in each age group said that the slogan is about practicing family planning, while 5 percent indicated that it is about using contraception. Seven in ten urban women have heard or seen the slogan compared with about six in ten women in rural areas. For both urban and rural women, the slogan is widely conceived as encouraging peopl e to practice family planning.
More than 70 percent of women in Western Visayas, Caraga, Ilocos Region, Bicol Region, and Metropolitan Manila, have heard or seen the slogan. ARMM shows the lowest level of awareness of the slogan. Again, the majority of women in all regions indicated that the slogan means to practice family planning. Central Visayas shows the highest percentage (13 percent) of women indicating that it means using contraception. Three out of ten women in Eastern Visayas provided other interpretations. The level of awareness of the slogan is lowest among women with no education, and it increases with the level of education. Four in five women with college education or higher have heard or seen the slogan. One-third of women who did not go to school reported meanings pertaining neither to family planning or contraception.
72

Table 4.20 Acceptability of the use of mass media for disseminatin~ family nlannin~ message
Percent distribution of women by acceptability of having messages about family planning on radio or television, according to selected background characteristics, Philippines 1998
Acceptability of radio message Acceptability of TV message
Not Don't Not Don't Number Background accept- Accept- know/ accept- Accept- know/ of characteristic able able missing Total able able missing Total women
Age 15-19 10.0 84.9 5.1 100.0 11.1 84.1 4.8 100.0 2,924 20-24 7.2 90.6 2,3 100.0 8.3 89.0 2,7 100.0 2,299 25.29 7.8 89.6 2.6 100.0 9.1 88.5 2.4 100.0 2,209 30-34 8.1 90.4 1.5 100.0 9.3 88.8 1.9 100.0 2,058 35-39 8.0 89.8 2.2 100.0 10.8 86.6 2.6 100.0 1,842 40.44 10.2 87.7 2.1 100.0 12.5 84.6 2.8 100.0 1,480 45-49 12.3 84.2 3.5 100.0 14.0 82.1 3.9 100.0 1,170
Residence Urban 7.3 89.9 2.7 100.0 7.3 90.5 2.1 100.0 7,911 Rural 10.8 86.1 3.1 100.0 14.4 81.3 4.3 100.0 6,072
Region Metro Manila 6.2 89.4 4.4 100.0 5.3 91.8 2.9 100.0 2,818 Cordillera Admin. 14.4 83.7 1.9 100.0 18.7 78.1 3.2 100.0 207 Ilocos 5.1 91.1 3.8 I00.0 6.1 89.0 4.9 100.0 689 Cagayan Valley 5.3 93.4 1.3 100.0 11.3 86.1 2.6 I00.0 474 C.Luzon 10.5 87.2 2.3 100.0 10.0 87.8 2.2 100.0 1,414 S.Tagalog 6.7 91.9 1.4 100.0 8.2 90.0 1.8 100.0 1,917 Bicol 7.9 89.7 2.4 100.0 9.8 87.2 3.0 100.0 703 W.Visayas 6.5 91.8 1.7 100.0 10.7 87.0 2.4 100.0 1,045 C.Visayas 10.0 88.7 1.3 100.0 13.1 84,5 2.4 100.0 1,093 E.Visayas 12.1 86.5 1.4 100.0 15.6 80.4 4.0 100.0 553 W.Mindanao 14.8 81.0 4.2 100.0 22.8 71.6 5.5 100.0 530 N.Mindanao 7.6 91.7 0.8 100.0 10.8 88.2 1.0 100.0 482 S.Mindanao 8.7 89.8 1.4 100.0 9.3 88.9 1.7 100.0 925 C.Mindanao 9.8 88.6 1.6 100.0 10.1 88.3 1.6 I00.0 425 ARMM 38.0 42.7 19.3 100.0 37.2 43.0 19.9 100.0 385 Caraga 4.8 94.1 1.1 100.0 5.5 93.2 1.2 100.0 323
Education No education 35.9 42.3 21.8 100.0 41.7 35.8 22.5 100.0 217 Elementary 11.5 84.8 3.6 100.0 15.9 79.1 5.1 100.0 3,664 High school 7.8 89.5 2.7 100.0 8.7 88.7 2.5 100.0 5,916 College or higher 6.6 91.9 1.5 100.0 6.4 92.5 1.1 100.0 4,186
Total 8.9 88.3 2.9 100.0 10.4 86.5 3.1 100.0 13,983
73

Table 4.21 Exoosure to family diannin~ slogan
Percentage of women who have seen or heard the family planning slogan 'kung sila'y mahal niyo, magplano' and percentage who say that it refers to using contraception, according to background characteristics, Philippines, 1998
Of those who have seen or heard family planning Have seen slogan, percentage who say it refers to: or heard
Background family planning Practice of Use of Number of characteristic slogan family planning contraception Other women
Age 15-19 60.5 86.2 5.7 8.1 2,924 20-24 68.3 86.0 5.9 8.1 2,299 25-29 68.9 86.7 4.6 8.7 2,209 30-34 67.8 87.2 4.9 7.9 2,058 35-39 66.8 87.4 3,8 8.8 1,842 40-44 64.3 85.8 4.5 9.6 1,480 45-49 62.7 85.9 4.3 9.8 1,170
Residence Urban 70,1 87,8 5.3 6.9 7,911 Rural 59.8 84.5 4.3 11.2 6,072
Region Metro Manila 70.3 90.0 6.5 3.5 2,818 Cordillera Admin. 61.6 87.3 3.3 9.4 207 Ilocos 71.8 95.5 2.2 2.4 689 Cagayan Valley 59.3 95.3 2.1 2.6 474 C.Luzon 61.8 89.5 2.2 8.3 1,414 S.Tagalog 67.6 93.1 2.9 4.0 1,917 Bieol 70.7 95.3 1.7 3.0 703 W.Visayas 74.7 83.9 2.0 14.1 1,045 C.Visayas 66.9 73.9 13.4 12.7 1,093 E.Visayas 56.5 64.6 5.7 29.7 553 W.Mindanao 43.4 89.8 5.0 5.2 530 N.Mindanao 55.2 85.4 6.5 8.1 482 S.Mindanao 69.9 70.2 5.5 24.2 925 C.Mindanao 69.4 83.3 4.9 11.8 425 ARMM 31.7 86.8 8.2 5.1 385 Caraga 74.4 84.9 7.2 7.8 323
Education No education 14.7 68.8 0.0 31.2 217 Elementary 49.1 84.5 5.5 I 0.0 3,664 High school 66.5 86.1 5.0 8.9 5,916 College or higher 81.4 88.2 4.6 7.2 4,186
Total 65.6 86.5 4.9 8.6 13,983
74

CHAPTER 5
OTHER PROXIMATE DETERMINANTS OF FERTILITY
Addressed in this chapter are the principal factors, other than contraception, which affect woman's risk of becoming pregnant: nuptiality and sexual intercourse; postpartum amenorrhea and abstinence from sexual relations, and menopause. Marriage is a primary indicator of the exposure of women to the risk of pregnancy and, therefore, is important for the understanding of fertility. Populations in which age at marriage is low tend to be populations with early childbearing and high fertility, Trends in the age at which women marry as well as in the proportions remaining single can help explain trends in fertility.
Included also in this chapter is information on more direct measures of the beginning of exposure to pregnancy and the level of exposure: age at first sexual intercourse and the frequency of intercourse. Measures of several other proximate determinants of fertility which, like marriage and sexual intercourse, influence exposure to risk are also presented. These are the duration of postpartum amenorrhea and postpartum abstinence, and menopause.
5.1 Current Marital Status
Table 5.1 shows the marital status of women at the time of the survey by age. Overall, 36 percent of women have never married, 53 percent are married, 6 percent are living together with a partner, and 4 percent are not living with a husband or a partner.
Table 5.1 Current marital status
Percent distribution &women by current marital status, according to age, Philippines 1998
Marital status Number
Never Living Not living of Age married Married together Widowed Divorced together Total women
15-19 91.5 4.8 3.6 0.0 0.0 0.1 100.0 2,924 20-24 56.3 34.5 7.6 0.1 0.0 1.5 100.0 2,299 25-29 25.0 64.3 7.5 0.4 0.1 2.7 100.0 2,209 30-34 I 1.5 76.9 7.2 1.8 0.0 2.6 100.0 2,058 35-39 7.5 79.7 7.3 2.2 0.0 3.3 100.0 1,842 40-44 7.4 77.5 6.4 4.8 0.0 3.9 100.0 1,480 45-49 6.6 78.3 4.1 6.9 0.2 3.8 100.0 1,170
Total 36.4 53.4 6.2 1.7 0.0 2.3 I00.0 13,983
The proportion never married decreases rapidly from 92 percent among teenagers to 56 percent among women in their early twenties to 25 percent among women in their late twenties. A relatively high proportion of women (about 7 percent) remains single through their 40s. The proportion in both formal and informal unions starts well below 10 percent among teenagers, increasing rapidly to 42
75

percent among women 20-24 years of age, and 72 percent among women 25-29 years. This proportion reaches its peak at 87 percent among women 35-39 years and declines slightly thereafter, more as a result of marital dissolution (primarily through widowhood) than by nonmarriage.
5.2 Age at First Marriage
Table 5.2 presents the percentage of women who first married at selected ages and the median age at first marriage, according to current age. The table clearly shows an increase in age at marriage across cohorts. Among women age 30 or older, about 34 percent were married by age 20, while 30 percent of women aged 25-29 and only 28 percent of women aged 20-24 did so. The median age at first marriage increased by almost a year, from 21.8 years among women 45-49 years to 22.7 years among women 25-29 years. This reflects a long-standing pattern of late age at marriage among Filipino women, evidenced by the fact that around one in three women 25-49 was still single at age 25.
Table 5.2 Age at first marriage
Percentage of women who were first married by exact age 15, 18, 20, 22 and 25, and median age at first marriage, according to current age, Philippines 1998
Percentage of women who were first married by exact age:
Curret~t age 15 18 20 22
Percen- tage Median
who had Number age at never of first
25 married women marriage
15-19 1.3 NA NA NA NA 91.5 2,924 a
20-24 2.0 14.6 27.5 NA NA 56.3 2,299 a
25-29 2.4 14.4 30.2 44.7 64.6 25.0 2,209 22.7
30-34 3.2 18.0 34.2 48.7 68.3 11.5 2,058 22.2
35-39 2.7 16.3 34.2 51.6 69.8 7.5 1,842 21.8 40-44 3.3 20.2 36.8 53.3 71.7 7.4 1,480 21.6
45-49 4.0 18.7 34.9 52.0 70.0 6.6 1,170 21.8
20-49 2.8 16.6 32.4 47.3 63.3 21.8 11,058 b
25-49 3.0 17.2 33.7 49.5 68.5 12.7 8,759 22.1 NA = Not applicable a Omitted because less than 50 percent of the women in the age group x to x+4 were first married by age x b Not calculated due to censoring
5.3 Median Age at First Marriage
Urban women tend to marry about two years later than rural women do. The median age at first marriage for urban women is 23 years while that for rural women is 21. years (Table 5.3 and Figure 5.1). As shown in Figure 5.2, sizeable differences in age at marriage exist by region. The median age at first marriage is highest in Metropolitan Manila (24 years). There is no distinct pattern in age at first marriage by island groups; however, the less developed regions (Cagayan Valley, Eastern Visayas, Cordillera Administrative Region and Autonomous Region in Muslim Mindanao) show lower medians (ranging from 19.9 to 20.7 years) than other areas. There is a positive relationship between age at first marriage
76

and level of education. The median for women with no education is 19 years, while those with high school education show a median of 22 years.
Table 5.3 Median age at first marriage
Median age at first marriage among women age 25-49 years, by current age and selected background characteristics, Philippines 1998
Current age Women
Background age characteristic 25-29 30-34 35-39 40-44 45-49 25-49
Residence Urban 24.1 23.0 22.6 22,3 22,8 23,0
Rural 21.2 21.1 21,0 20,7 20.8 21.0
Region Metro Manila a 24.5 23.0 23,2 23.4 24.0
Cordillera Admin. 20.9 21.5 20.5 19,3 (20.8) 20.7
Iloeos 22.8 22.0 20.9 22,9 20.9 21.9
Cagayan Valley 20.3 19.6 20.3 21,2 20.2 20.3
C.Luzon 22.4 22.1 22.5 21,1 22.1 22.1
S.Tagalog 22.3 22.0 22.4 21,7 21.7 22.1
Bicol 21.6 21.7 21.9 21,2 21,3 21,5
W.Visayas 23.4 22.7 21,5 22.6 23.3 22.7
C,Visayas 23.2 22.2 22,8 21,7 23.0 22.6
E.Visayas 22.0 19.7 19,3 19,3 20.3 i9.9
W.Mindanao 21,3 21.2 21.3 19,7 21.0 21.0
N.Mindanao 21.9 21,9 2I .6 19,5 20.9 21.2
S.Mindanao 22.4 22.0 21.8 21.1 20.9 21.g
C.Mindanao 21.2 21.6 22.1 20,6 19.7 21.4
ARMM 20.1 19.4 19.3 20.6 20.8 20.0
Caraga 21.7 21.9 20.5 19.8 20.8 21.0
Education No education (19.2) (18.5) 19.1 18,0 18.9 18.7
Elementary 19.7 19.6 19.8 19,8 20.0 19.8
High school 21.8 21.4 21.3 21,4 21,8 21.5
College or higher a 24.9 25.3 24.7 25.8 a
Total 22.7 22.2 21.8 21,6 21.8 22.1 Note: Medians are not shown for women 20-24 because less than 50 percent have married by age 20 in almost all subgroups shown in the table. a Omitted because less than 50 percent of the women in the age group were first married by age 25. 0 Figures in parentheses are based on 25.49 cases.
77

25
20
15
10
5
0
Median Age
Figure 5.1 Median Age at First Marriage by Residence and Education
23 22
Total Urban Rural RESIDENCE
NO Elemen- education tary
EDUCATJON
High school
1998NDHS
Figure 5.2 Median Age at First Marriage by Region
Metro Manila Cordillera Admin.
Ilicos Cagayan Valley
C. Luzon
S. Tagalog Bicol
W. Visayas C. Visayas E. Visayas
W. Mindanao N. Mindanao S. Mindanao C. Mindanao
ARMM Caraga
24 21
22 20
22
F 22 22
Hllllmlllrlrl~l I 23
. . . . . 23 2O
21 21
.... 22 21
20 21
0 5 10 15 20 25
Median Age
1998 NDHS
78

5.4 Age at First Sexual Intercourse
Like age at first marriage, age at first sexual intercourse is an indicator of the beginning of a woman's exposure to the risk of pregnancy. Table 5.4 presents information on age at first sex for all women. Overall, half of women aged 25-49 became sexually active by 22 years. Only 3 percent of women aged 25-49 years had had sexual intercourse by age 15 and 35 percent by age 20. By age 25, two out of three women have had sexual intercourse. The table shows that the age at which women became sexually active has increased somewhat over time.
Table 5.4 Age at first sexual intercourse
Percentage of women who had first sexual intercourse by exact age 15, 18, 20, 22, and 25, and median age at first intercourse, according to current age, Philippines 1998
Percentage of women who had first intercourse by exact age:
Current age 15 18 20 22
Percentage who Median
never had Number age at inter- of first inter-
25 course women course
15-19 1.3 NA NA NA NA 90.9 2,924 a
20-24 1.8 14.8 28.7 NA NA 54.5 2,299 a
25-29 2.1 14.3 30.7 45.1 63.4 24.0 2,209 22.8
30-34 3.1 18.1 34.8 48.0 66.7 10.9 2,058 22.3
35-39 2.5 17.7 35.8 52.3 68.2 7.4 1,842 21.7
40-44 3.0 21.1 37.0 52.9 70.1 7.2 1,480 21.6
45-49 3.6 19.3 37.0 51.9 69.4 6.3 1,I70 21.7
20-49 2.6 17.1 33.4 47.6 62.4 21.0 11,059 a
25-49 2.7 17.7 34.7 49.5 67.1 12.2 8,760 22.1
NA = Not applicable aOmitted because less than 50 percent of the women in the age group x to x+4 were first married by age x
Comparing the information in Table 5.4 with the information on age at first marriage in Table 5.3, it is clear that the majority of Filipino women have first sexual intercourse when they marry. There is no difference between the median age at first intercourse and first marriage among women aged 25-49 (22.1 years). Differentials in the median age at first intercourse parallel those observed for the median age at first marriage (see Table 5.5).
79

Table 5.5 Median age at first intercourse
Median age at first sexual intercourse among women age 25-49 years, by current age and selected background characteristics, Philippines 1998
Background Current age Women age
characteristic 25-29 30-34 35-39 40-44 45-49 25-49
Residence Urban 24.2 23.1 22.5 22.4 22.7 23. I
Rural 21.2 21.2 21.0 20.6 20.6 20.9
Region Metro Manila a 24.5 22.8 23.4 23.4 24.1
Cordillera Admin. 21.2 21.1 20.8 18.9 (20.7) 20.7 Ilocos 23.4 22.1 21.2 23.1 20.6 21.9
Cagayan Valley 20.6 20.0 20.8 21.0 21.0 20.6
C.Luzon 22.4 22.4 22.6 21.4 21.8 22.1
S.Tagalog 22.3 22.1 22.4 21.7 21.7 22.1 Bicol 22.3 21.8 21.8 21.2 20.3 21.7
W.Visayas 23.4 22.9 21.3 22.9 23.0 22.8
C.Visayas 22.7 21.7 22.0 21.2 22.8 22.1
E.Visayas 21.6 19.8 19.4 18.7 20.4 19.9
W.Mindanao 21.6 21.7 21.0 20.1 20.3 21.0
N.Mindanao 21.6 22.1 21.0 19.5 20.5 21.1
S.Mindanao 22.2 21.8 21.2 21.1 20.6 21.5 C.Mindanao 21.5 21.5 22.5 20.7 20.0 21.5
ARMM 20.2 20.6 20.1 21.5 21.1 20.6
Caraga 21.3 21.9 20.3 20.2 20.6 20.8
Education No education 19.3 20.4 19.5 18.4 19.4 19.3
Elementary 19.7 19.7 19.7 19.8 19.8 19.7
High school 21.9 21.3 21.3 21.2 21.8 21.5
College or higher a 24.9 25.3 24.8 26.1 a
Total 22.8 22.3 21.7 21.6 21.7 22.1
Note: Median are not shown for women 20-24 because less than 50 percent had had intercourse by age 20 in almost all subgroups shown in the table, a Omitted because less than 50 percent of the women in age group x to x+4 had had intercourse by age x. ( ) Figures in parentheses are based on 25-49 unweighted cases.
80

5.5 Recent Sexual Activity
In the absence of contraception, the probability of pregnancy is related to participation in sexual intercourse. Thus, information on intercourse is important for refinement of measures of exposure to pregnancy. An indicator of the percentage of women who are abstaining from sex in any given month, due to such factors as a recent birth, spousal separation, illness, etc. the percentage who were not sexual active in the four weeks preceding the survey. There were several questions in the 1998 NDHS on the topic of recent sexual activity. All women were asked how long ago they had last had sexual intercourse, how many times they bad sex in the last four weeks, and how many times they usually have sex in a month.
Table 5.6 is based on the question regarding on time since last intercourse and allows an assessment of the overall level of sexual activity according to age, marital duration, and other background characteristics. In general, 47 percent of women were sexually active in the month preceding the survey, 4 percent were postpartum abstaining, and 13 percent were not sexually active for reasons other than a recent birth (e.g., spousal separation, illness) although they had had sex before, while 36 percent had never had sex. The proportion postpartum abstaining declines as age and duration of marriage increase. At the same time, the proportion not sexually active for other reasons increases with increasing age and marriage duration.
The percentage of women who were sexually active in the month preceding the survey declines gradually with increasing level of education. More rural than urban women were sexually active in the four weeks preceding the survey. Women living in Metropolitan Manila showed the lowest proportion sexually active in the month before the survey (35 percent). The comparatively large proportion abstaining among Metropolitan Manila women is mainly due to factors other than a recent birth and the large proportion who have never had sex.
The proportion sexually active among contraceptive users is far higher than for nonusers. For example, 95 percent of pill users were sexualIy active during the month preceding the survey, compared with only 30 percent of nonusers. Among sterilization users, who tend to be older than other women, 17 percent were abstaining for reasons other than a recent birth.
5.6 Postpartum Amenorrhea, Abstinence, and Insusceptibility
Among women who are not using contraception, exposure to the risk of pregnancy in the period following a birth is influenced by two factors: breastfeeding and sexual abstinence. Postpartum protection from conception can be prolonged by breastfeeding, which can lengthen the time until the next ovulation, and by delaying the resumption of sexual relations.
81

Table 5.6 Recent sexual activity
Percent distribution of women by sexual activity in the four weeks preceding the survey and the duration of abstinence by whether or not postpartum, according to selected background eharacterlstles, Philippines 1998
Not sexually active in last 4 weeks
Sexually Abstaildng Abstaining Never Nunther Background aedve in last (postpartum) (not postpartum) had of dlaracteristic 4 weeks 0-1 years 2+ years 0-1 years 2+ years Missing sex Total women
Age
]5-10 6.9 1.0 0.0 1.1 0.0 0.1 90.9 100.0 2,924
20-24 33.2 4.9 0.5 5,9 0.2 0.8 54.5 100.0 2,299
25-29 58.1 5.1 1.4 9.9 0.8 0.7 24.0 I00.0 2,209
30-34 69.1 4.0 0.9 10.4 2.4 2.2 10.9 I00,0 2,058
35-39 71.0 2.7 0.4 12.9 4.3 1.4 7.4 100.0 1,842
40-44 65.7 0.9 0.5 15.7 8,1 1.9 7.2 100.0 1,480
45-49 57.4 0.2 0.1 21.6 12.6 1.8 6.3 100.0 1,170
Duradon of union (yr)
0-4 74.2 9.I 0.9 13.9 0.5 1.4 0.0 100.0 1,838
5-9 79.0 5.2 I .I 11.4 1.8 1.3 0.1 100.0 1,850
10-14 76.9 3.7 0.9 13,1 3.6 1.8 0.0 I00.0 1,655
15-19 75.4 2.0 0.7 13.4 6.2 2.3 0.0 109.0 1,502
20-24 71.2 1.2 0.1 18.1 8.0 1.3 0.0 100.0 1,149
25-29 64.2 0.6 0.3 21.3 11.1 2.5 0.0 100.0 702
30+ 51.8 0.0 0.O 28.8 17.7 1.7 0.0 100.0 200
Never in tmion 0.4 0.5 0.2 0.4 0.4 0.2 97.9 100.0 5,087
Residence Urban 41.8 2.4 0.6 9.3 3.6 1.2 41.1 100.0 7,911
Rural 54.5 3.5 0.5 9.7 2.2 I.O 28.5 100.0 6,072
Region Metro Manila 34.5 1.8 0.6 9.6 4.4 1.5 47.6 100.0 2,818
Cordillera Admin. 51.6 3.7 0.2 9.7 3.2 1.0 30.6 100.0 207
Iloeos 46.0 3.0 0,7 10.3 3.5 1.1 35.4 100.0 689
Cagayan Valley 56.9 2.6 0.6 9.1 1.7 1.3 27.9 100.0 474
C.Luzou 49.0 3.1 0.2 9.3 3.4 0.8 34.1 100.0 1,414
S.Taga[og 48.6 3.5 0.3 11.9 3.6 0.4 31.8 100.0 1,917
Bieol 51.7 4.2 0.3 11.4 2.6 1.6 28.3 100.0 703
W.Visayas 46.3 2.9 1.6 9.9 2.2 1.5 35.7 100.0 1,045
C.Visayas 48.0 3.3 0.4 8.2 1.9 0.7 37.5 I00.0 1,093
E.Visayas 57.5 3.1 0.6 10.6 2.9 2.1 23.1 100.0 553
W.Mindanao 55.7 2.7 0.7 6.3 1.2 1.4 32.0 100.0 530
N.Miudanao 52.1 3.2 0.4 7.0 2.4 0.9 33.9 100.0 482
S.Miudanao 52.5 2.9 0.5 7.3 2.4 0.7 33,6 100,0 925
C.Miudanao 52.6 2.5 0.6 9.2 1.8 0.6 32.7 100.0 425
ARMM 58.3 2.0 0.5 4.0 2.3 1.6 31.4 100.0 385
Caraga 50.2 3.3 0.8 11.6 1.2 2.4 30.4 100.0 323
Education NO education 64.9 3.1 1.4 7.7 4.3 2.4 16.1 100.0 217
Eletnentary 60.2 2.9 0.6 12.0 4.0 1.5 18.7 I00.0 3,664
High school 41.0 2.9 0.7 8.0 2.5 1.0 44.0 109.0 5,916
College or higher 44.1 2.8 0.4 9.4 2.7 0.9 39.6 100.0 4,186
C u r r e n t contraceptive No method 30.5 3.5 0.8 9.9 3.8 1.4 50.1 100.0 9,936
Pill 95.4 0.8 0.1 3.4 0.0 0.3 0.0 I00.0 831
IUD 92.9 0.9 0.2 5.7 0.3 0.0 0.0 100.0 310
Sterilization 76.3 1.4 0.0 17.2 4.3 0.8 0.0 100.0 909
Periodle abstinence 92.4 0.2 0.2 6.6 0.2 0.4 0.0 100.0 728
Other 89.9 2.5 0.0 7.0 0.0 0.6 0.0 100.0 1,269
Total 47.4 2.9 0.6 9.5 3.0 1.1 35.6 100.0 13,983
82

Table 5.7 Postpartum amenorrhea~ abstinence and insusceptibility
Percentage of births for which mothers are postpartum amenorrheie, abstaining, and insusceptible, by number of months since birth, and median and mean durations, Philippines 1998
Number Months Amenor- Abstain- Insus- of since birth rheie ing ceptible births
<2 97.2 91.1 100.0 184
2-3 65.6 34.1 73.5 281 4-5 49.4 21.3 57.8 279
6-7 41.9 13.2 47.3 290
8-9 30.2 8.6 37.4 233
10-11 22.2 5.5 25.5 249
12-13 16.2 6.6 22.1 226
14-15 10.2 10.0 17.5 284
16-17 6.0 4.5 9.8 280
18-19 5.3 4.3 9.3 261 20-21 3.7 3.4 7.1 222
22-23 3.4 2.5 5.5 239
24-25 1.7 5.1 6.0 248
26-27 0.9 1.7 2.3 248 28-29 0.7 2.1 2.8 289
30-31 1.3 3.3 4.4 237
32-33 1.3 3.7 4.2 255
34-35 1.7 3.1 4.3 226
Total 19.4 11.5 23.8 4,530
Median 4.9 2.3 6.2 NA
Mean 7.4 4.8 9.0 NA Prevalence/
incidence
mean 6.9 4.1 8.5 NA Note: Means and medians are based on the current status proportion in each two-month age interval (smoothed). NA = Not applicable
83

Table 5.7 shows the percentage of births for which mothers are postpartum amenorrheic, abstaining and postpartum insusceptible by the number of months since the birth. Women who are insusceptible are defined as those who are either amenorrheie or abstaining following a birth and, thus, are not exposed to the risk of pregnancy. The estimates shown in Table 5.7 are based on current status data, that is, they refer to the proportion of births occurring x months before the survey for which mothers are still amenorrheic or abstaining at the time of the survey. All live births occurring during the three years prior to the survey are included. To reduce fluctuations in the estimates, the births are grouped in two-month intervals. The prevalence/incidence (P/I) mean is borrowed from epidemiology, and is provided to enable international comparison.
Among births 2 to 3 months prior to interview, 66 percent of the mothers are still amenorrheic. The proportion amenorrheic 6 to 7 months after the birth is 42 percent and 12 to 13 months after the birth it has declined to 16 percent. The duration of postpartum abstinence is shorter than the duration of amenorrhea (see Figure 5.3). One out of three mothers is abstaining from sexual relations 2 to 3 months following birth, but only 7 percent are still abstaining after a year. Overall, 47 percent of all mothers are susceptible to the risk of pregnancy 6 months after a birth (not taking into account contraceptive use).
Figure 5.3 Percentage of Births for Which Mothers are
Postpartum Amenorrheic, Abstaining and Insusceptible
100
80
60
40
20
0
Percent
_ _ Q ,m , m
28 30 32 34 0 2 4 6 8 10 12 14 16 18 20 22 24 26
Months Since Birth I-*-Amenorrheic "='Abstaining "~'lnsusceptible I
1998 NDHS
84

5.7 Median Duration of Postpartum Amenorrhea, Abstinence, and Insusceptibility
Presented in Table 5.8 is the median duration of postpartum amenorrhea, abstinence, and insusceptibility by selected background characteristics. As in Table 5.7, this table is based on current status data on all live births occurring in the three years prior to the survey. On average, women in the Philippines are amenorrheic for 4.9 months following a birth, abstain for 2.3 months, and are insusceptible to the risk of pregnancy for 6.2 months. The duration of postpartum amenorrhea is practically identical among women under 30 years of age and those 30 years or older. Urban women are amenorrheic for less than half the time as rural women, perhaps due to shorter duration of breastfeeding.
As expected, the median duration of amenorrhea is shortest in Metropolitan Manila (3 months), average for the more developed regions (4-5 months) and longest for the less developed regions of the country (6-9 months). Education is inversely reIated to the duration of postpartum amenorrhea. Women with no education are amenorrheic for twice as long (7.6 months) as women with high school or higher education (3. I months).
Subgroup differences in the duration of abstinence tend to be less pronounced due to the brevity of this practice among Philippine couples.
The combined effect of amenorrhea and abstinence is reflected in the median duration of insusceptibility shown in Table 5.8. Rural women are insusceptible to the risk of pregnancy for twice as long (8.2 months) as urban women (4.1 months). This difference is due largely to the longer duration of postpartum amenorrhea among rural women. Education is inversely related to the duration of insusceptibility. Regional differences in the duration of insusceptibility generally replicate the differences in the duration of amenorrhea.
85

Table 5.8 Median duration of postpartum insusceptibility by background characteristics
Median number of months of postpartum amenorrhea, postpartum abstinence, and postpartum insusceptibility, by selected background characteristics, Philippines 1998
Background Postpartum Postpartum Postpartum Number of characteristic amanorrhea abstinanee insusceptibility births
Age <30 4.6 2.3 6.4 2,502 30+ 5.2 2.2 5.8 2,027
Residence Urban 3.3 2.3 4.1 2,089 Rural 7.3 2.3 8.2 2,441
Region Metro Manila 2.7 2.1 3.4 615 Cordillera Admin. 7.1 2.7 8.0 g6 Ilocos 7.2 2.8 7.9 204 Cagayan Valley 8.0 3.2 9.0 139 C.Luzon 3.1 2.9 4.5 445
S.Tagalog 4.3 2.4 6.3 643 Bicol 8.8 2.2 10.7 329 W.Visayas 4.4 2.1 6.2 338 C.Visayas 6.7 2.0 7.8 359 E.Visayas 6.2 2.1 7.2 276 W.Mindanao 4.4 2.1 7.4 177 N.Mindanao 6.1 2.3 7.2 199 S.Mindanao 5.9 2.2 6.9 297 C.Mindanan 4.1 2.1 4.4 153 ARMM 6.7 2.0 7.4 150 Caraga 6.2 2.0 7.9 122
Education No education 7.6 2.1 8.0 95 Elementary 7.6 2.1 8.0 1,479 High school 4.8 2.3 6.1 1,753 College or higher 3.1 2.3 4.0 1,203
Total 4.9 2.3 6.2 4,530
Note: Medians are based on current status.
86

5.8 Menopause
The onset of infecundity with increasing age reduces the proportion of women who are exposed to the risk of pregnancy. Table 5.9 shows the percentage of women who are not currently pregnant and not postpartum amenorrheic but whose last menstrual period occurred six or more months prior to the survey. The data show that the percentage rises rapidly with age, particularly after 46. By age 48, 38 percent of women are menopausal.
Another facet of loss of exposure that is not shown in this table is terminal separation, divorce, and widowhood in which a woman does not remarry before the end of her childbearing years.
Table 5.9 Menopause
Menopause a among women 30-49 years by age, Philippines 1998
Number Pereent of
Age menopausal women
30-34 1.2 2,058 35-39 1.4 1,842 40-41 43.6 600 42-43 5.8 612 44-45 9.4 513 46-47 20.7 454 48-49 37.6 472
Total 6.5 6,550
tPereentage of all women whose last menstrual period occurred six or more months preceding the survey. Pregnant and postpartum amenorrheie women were considered to be non- menopausal.
The 1998 NDHS does not provide sufficient information on marriage history to define a reasonably precise indicator of terminal separation, divorce, and widowhood but some indications may be gathered from Table 5.1. A third factor affecting the end of fertility is the lack of exposure due to long-term abstinence among currently married women. Many of these women will probably not resume sexual relations. This information is given in Table 5.6.
87


CHAPTER6
FERTILITY PREFERENCES
The Philippine Family Planning Program (PFPP) aims to ensure the availability of reliable information and services necessary for families to manage the risk and outcomes of reproduction according to their health needs and fertility aspirations. It is anchored on a basic constitutional provision that recognizes the right of couples to determine for themselves the size of family they would like to raise.
Addressed in this chapter are questions that allow an assessment of the need for contraception, whether for birth spacing or for birth limitation, and the extent of unwanted fertility. The NDHS respondents were first asked if they wanted more children, and if so, how long they would prefer to wait before the next child. They were also asked the hypothetical question, if they could start anew, how many children they would want. Since the general objective of the Philippine Family Planning Program is to reduce the level of unmet need for family planning, particularly among high risk families, it is important for policymakers and program planners to understand the extent of unmet need in the country, whether for spacing or limitation. Two other issues are examined: the extent to which unwanted and mistimed pregnancies occur and the effect of such pregnancies on fertility rates.
Interpretation of data on fertility preferences has always been the subject of controversy, Survey questions on this topic have been criticized on the grounds that (a) answers are misleading because they may reflect unformed, ephemeral views, which are held with weak intensity and little conviction and (b) they do not take into account the effects of social pressure, or the attitudes of other family members, particularly the husband, who may exert a major influence on reproductive decisions.
The first objection has greater force in societies where the use of contraceptives is limited and the idea of conscious reproductive choice may still be unfamiliar or unknown. Thus, preference data from these settings should be interpreted with caution. This objection probably has little relevance in the Philippines where there is almost universal family planning knowledge and a moderate level of famiIy planning use. The second objection is correct in principle. It is only recently that the program has realized the importance of the husband with regard to fertility decisions.
The inclusion of women who are currently pregnant complicates the measurement of views on future childbearing. For these women, the question on the desire for more children is rephrased to refer to desire for another child, after the one that they are expecting. To take into account the way in which the preference variable is defined for pregnant women, the results are :lassified by number of living children, including the current pregnancy as equivalent to a living child. In addition, the question on preferred waiting time before the next birth is rephrased for pregnant women to make clear that the information wanted is the preferred waiting time after the birth of the child the respondent is expecting.
Women who have been sterilized for contraceptive purposes also require special analytic treatment. The general strategy presented in this chapter is to classify them as wanting no more children.
89

6.1 Desire for More Children
Table 6.1 shows the percent distribution o f married women by desire for children according to number of living children. It allows the examination o f the potential need for contraceptive services, for spacing as well as for limiting births. The table indicates that 51 percent o f all married women do not want any more children, almost one fifth want to delay their next birth for two or more years, and 10 percent have been sterilized. These figures suggest that 8 out o f 10 married women are potentially in need of family planning services. Only 12 percent want another child within two years, while 5 percent are either undecided about their fertility preferences or want another child but are unsure when. (Figure 6.1).
The table also shows that among married women, the desire to limit childbearing increases, and the desire to delay the next birth decreases with the number of living children. The proportion o f women who want to limit their childbearing increases dramatically after having one child. For example, among women with one living child, 16 percent want no more children and 49 percent want to delay the next child for at least two years; among women with 3 children, 56 percent want no more children, while 13 percent want to have their next ctflld later.
Table 6. l Fertility preferences by number of living children
Percent distribution of currently married women by desire for more children, according to number of living children, Philippines 1998
Number of living children t
Desire for children 0 i 2 3 4 5 6+ Total
Have another soon 2 77.4 23.9 11.4 5.3 3.5 3.4 2.0 12.0
Have another late? 11.2 49.3 26.9 12.7 6.8 4.5 2.8 18.7
Have another, undecided when 1.9 1.5 1.1 1.1 0.8 0.9 0.5 1.1
Undecided 0.3 6.5 5.7 4.8 2.7 3.0 2.9 4.3
Wants no more 1.4 15.9 47.2 56.3 66.1 72.0 80.3 51.4
Sterilized 0.0 0.9 6.0 18.3 18.7 15.1 8.8 10.4
Declared infecund 7.7 1.8 1.6 1.3 1.3 0.9 2.4 1.8
Missing 0.0 0.2 0.2 0.1 0.2 0.2 0.2 0.2
Total I00.0 100.0 100.0 100.0 100.0 100.0 100.0 100.0
Number of women 378 1,401 1,708 1,695 1,218 762 1,174 8,336
t hlcludes current pregnancy. 2 Wants next birth within 2 years. 3 Wants to delay next birth for 2 or more years.
Table 6.2 shows the distribution of married women by desire for children, according to age. The table shows that 53 percent of women age 15-19 want to delay having their next child by two or more years. This proportion diminishes with age, and the proportion wanting to limit increases. At age 35-39, only 7 percent of women want to have another child after 2 years, while 3 in 5 do not want any more children. Note that at least 3 out of 10 married women 20-24 years old stated that they do not want any more children.
90

Figure 6.1 Fertility Preferences among Currently
Married Women Age 15-49
Want no r children 5
Undecided 4%
Want a child, undecided when 1%
cund 2%
Want a chil . . . . . . . . . . . . . . . on 12%
(2+ yr) (<2 yr)
Steril ized 1 0 %
1998 NDHS
I ;tb[c (~ ~ }e v p eferences by age
I~_.,, cnl disll ibution of currently married w o m e n by desire for more children, according to age, Phi l ippines 1998
Age of w o m a n
l ) , - i l c lut chi ldlen 15-19 20 24 25-29 30-34 35-39 40-44 45-49 Total
IL t / c Ltll//lhcr soon' 20.2 13.0 12.2 14.5 I 1.2 10.7 7.6 120
I I,t L ~ n t h e I l a t e r : 5 2 9 4 7 4 3 2 9 1 7 2 6.6 3.0 ().9 187
I It~ c :motlmr. Lmdecided when 15 0.4 1.8 1.2 I 1 I 0 0.4 1 1
I '1 ,&cidcd 7 2 71 5 4 4 8 4.2 2.5 0.7 4.3
\ :rll,, iio mole 178 31.4 44.2 5 2 7 61 0 58 8 64 2 5 1 4
":* ih cd 0 0 0.2 3.3 8 8 14.9 20.3 18.1 1 0 4
[i, ~ I,/i cd in f,:cund 0 2 0.5 0.2 0.7 1.0 3.4 7 7 1.8
',h <n~ 0.2 0.0 0.0 0 1 0.1 0.4 0,5 0 2
[,,t iI 1000 1 0 0 0 1 0 0 0 1 0 0 0 I00.0 100.0 1 0 0 0 100.0
' x ,m#c t ~H ~,,omcn 244 967 1,585 1,730 1,6(12 1,243 965 8,336
\ \ clnb n c \ t birth wi thin 2 years. \ \ m t l~ dcla? next birth fbr 2 or more years.
91

Table 6.3 shows the percentage of married women who do not want more children according to parity and selected background characteristics. This table provides information about group variation in the potential demand for family planning. It is interesting to note that there is little difference in the desire to limit childbearing between urban and rural women (60 percent in urban areas and 64 percent in rural areas) (see Figure 6.2).
Considering the differentials by region of residence, the newly created Caraga Region has the largest proportion of women who want no more children (70 percent) while the Autonomous Region in Muslim Mindanao shows the lowest percentage of (23 percent). The latter may be related to religious practices. The desire to limit childbearing among married women varies with education. In general, except for the comparatively small number of women with no education, there is an inverse relationship between education level and the proportion of women wanting no more children. This is likely due to the concentration of more highIy educated women at lower parities. At parity two and above, the expected positive relationship between education and the desire to limit childbearing is generally observed.
80
70
60
50
40
30
20
10
0
Figure 6.2 Percentage of Currently Married Women Who Want
No More Children by Residence and Region
Percent
64
Total Urban Rural RESIDENCE
No education
Elemen- High College tary school or higher
EDUCATION
1998 NDHS
92

Table 6.3 Desire to limit (stop) childbearing
Percentage of married women who want no more children, by number of living children and selected background characteristics, Philippines 1998
Number of living children t
Background characteristic 0 1 2 3 4 5 6+ Total
Residence Urban 0.2 17.4 54.2 76.6 88.8 90.1 88.4 60.0
Rural 2.9 16.0 51.9 72.3 81.0 84.8 89.4 63.7
Region Metro Manila (0.0) 14.4 50.0 74.4 88.3 (88.2) (85.7) 54.5
Cordillera Admin. * (7.3) 43.9 55.6 75.4 89.5 88.2 61.4
Ilocos * 13.3 49.4 65.8 82.5 86,0 83.9 57.5
Cagayan Valley * 10.9 57.I 74.1 82.1 (88.9) 94.4 60.6
C.Luzon (0.0) 19.3 50.0 79.9 90.1 (89.8) (98.0) 63.4
S.Tagalog * 11.9 60.9 79.8 92.5 95.8 93.3 67.4
Bicol * 24.3 48.3 70.2 77.8 80.4 90.8 64.6
W.Visayas * 16.1 65.0 78.9 88.2 (93.6) 92.3 66.9
C.Visayas * 19.6 50,4 84.7 89.3 89.8 89.0 65.2
E.Visayas * 29.4 50.6 71.4 84.3 86.2 94.0 70.4
W.Mindanao (0.0) 21.4 44.9 67.0 83.1 89.8 86.2 58.9
N.Mindanao * 20.3 51,7 73.7 86.3 (84.8) 93,0 67.8
SMindanao (5.0) 24.6 51.6 79.2 90.7 96.6 93.5 63.5
C.Mindanao * 16.1 66.0 75.3 79.3 (78.6) 76.8 62.6
ARMM (0.0) 8.3 10.1 17.4 25.3 23.8 47.2 22.6
Caraga * 7.7 63.3 84.7 86.1 88,7 94.6 70.2
Education No education * * (10.8) 35.6 34.4 * 72.2 42.7
Elementary 1.9 24.2 54.9 77.2 81.8 86.3 90.5 72.1
High school 0,8 14.9 51.3 74.2 89.5 88.1 90.3 60.4
College or higher 1.6 15.2 55.3 75.4 87.9 88.9 82.8 53.1
Total 1.4 16.8 53.2 74.6 84.8 87.1 89.1 61.9
Note: Women who have been sterilized are considered to want no more children. Includes current pregnancy.
* Less than 25 unweighted cases. 0 Figures in parentheses are based on 25-49 unweighted cases.
93

6.2 Demand for Family Planning
Unmet need is defined as the percentage of currently married women who are not using any method of family planning and do not want any more children or want to space their next birth. Specifically, women with an unmet need for spacing include pregnant women whose pregnancy was mistimed, and women who are neither pregnant nor amenorrheic and who are not using any method of family planning and want to wait two or more years for their next birth. Uumet need for limiting purposes refers to pregnant women whose pregnancy was unwanted, amenorrheic women whose last child was unwanted, and women who are not using any method of family planning but who want no more children. These indicators are used to evaluate the extent to which the family planning programs are meeting the demand for services.
Table 6.4 shows the information on unmet need, met need (current use), and the level of potential demand for family planning among married women. Demand for family planning is defined as the sum of contraceptive prevalence (met need) and unmet need. 1 Overall, the total demand for family planning is 70 percent; around two-thirds of that demand is for limiting births. The demand for family planning for limiting purposes peaks among women age 35-39. Total demand varies little by urban-rural residence. By region, it is highest in Central Luzon, Northern Mindanao, Southern Mindanao, Central Mindanao and Caraga. Variation across educational groups is small except for a much lower level of demand among the small number of women with no education.
Since only three quarters of the demand for family planning is satisfied, there is need for the Family Planning Program to intensify efforts to address unmet need and the backlog in the demand for family planning services. Unsatisfied demand or unmet need is 20 percent: 9 percent for spacing births and 11 percent for limiting childbearing. Total unmet need decreases with age. It is higher among rural women, among women who have no education or elementary education, and among women in Bicol, Eastern Visayas, CAR and ARMM than other women.
6.3 Ideal Number of Children
This section focuses on the respondent's ideal number of children. In ascertaining the total ideal number of children, the respondent is required to consider abstractly and independent o f her actual family size, the number of children she would choose i f she could start again. As shown in Table 6.5, the mean ideal number of children is 3.2 among all women and 3.5 among married women. Almost two-thirds of the women in the Philippines expressed a preference to have 3 or less children. It is interesting to note that 11 percent of women want to have 5 or more children, while 29 percent want only two. Only two percent of women gave a non-numeric response such as "it is up to God" or "don ' t know".
I Also included but not shown in the table, is the small proportion of currently pregnant or amenorrheic women whose pregnancy or last birth was the result of a contraceptive failure.
94

Table 6.4 Need for family pJanning services
Percentage o1' currently married women with unmet need for family planning, met need for family planning, and the total demand for family planning services, by selected background characteristics, Philippines 1998
Met need for Unmet need for family planning Total demand for Percentage family planning t (currently using) 2 family planning 3 of Number
Background For For For For For For demand of characteristic spacing limiting Total spacing limiting Total spacing limiting Total satisfied women
Age
15-19 27.4 4.6 32.1 12.4 5.9 18.3 44.2 10.5 54.7 41.4 244
20-24 21.2 8.2 29.4 25.9 11.4 37.4 52.4 19.9 72.3 59.3 967
25-29 13.5 10.3 23.9 23.1 25.5 48.6 41.4 36.7 78.1 69.4 1,585
30-34 7.2 11.9 19.1 15.0 37.1 52.1 25.0 50.1 75.2 74.6 1,730
35-39 4.6 15.2 19.8 6.3 47.8 54.1 12.0 64.2 76.2 74.0 1,602
40-44 2.3 13.5 15.8 2.5 46.1 48.6 5.1 60.1 65.2 75.7 1,243
45-49 0.0 6.3 6.3 0.7 33.5 34.3 0.8 39.9 40.6 84.5 965
Residence
Urban 7.3 9.0 16.3 14.5 36.2 50.7 24.3 45.6 69.9 76.6 4,222
Rural 9.8 13.4 23.3 10.6 31.6 42.2 22.9 46.2 69.1 66.4 4,114
Region Metro Manila 6.6 8.5 15.0 17.3 32.1 49.4 26.8 40.8 67.6 77.8 1,298
Cordillera Admin. 14.5 12.4 26.9 7.8 34.2 42.0 24.6 47.4 72.0 62.6 136
Ilocos 11.7 11.7 23.5 12.9 30.3 43.2 26.3 42.3 68.5 65.8 414
Cagayan Valley 8.8 9.9 18.7 14.4 33.9 48.3 24.2 44.8 69.0 72.9 322
C.Luzon 7.2 7.4 14.6 12.8 42.0 54.8 23.4 49.7 73.1 80.0 883
S.Tagalog 9.1 11.9 20.9 9.5 35.6 45.0 21.3 47.7 69.0 69.7 1,219
Bicol 7.9 17.3 25.1 11.2 25.1 36.3 22.6 43.2 65.8 61.8 48l
W.Visayas 8.1 14.6 22.7 11.7 33.3 45.0 21.2 49.7 70.9 68.0 627
C.Visayas 5.2 9.9 15.1 12.8 38.7 51.5 20.6 50.1 70.7 78.6 620
E.Visayas 8.4 19.6 28.0 8.9 28.5 37.5 20.2 49.6 69.8 59.9 395
W.Mindanao 11.4 12.2 23.7 9.8 34.0 43.8 22.5 47.1 69.7 66.1 343
N.Mindanao 6.7 11.7 18.4 14.9 39.1 54.0 24.9 51.3 76.2 75.8 295
S.Mindanao 7.1 8.7 15.8 16.3 38.9 55.2 25.1 48.8 73.9 78.7 572 C.Miudanao 11.0 12.1 23.1 10.0 35.2 45.2 23.7 48.6 72.4 68.1 273
ARMM 21.9 7.5 29.4 8.3 7.5 15.8 31.7 15.1 46.8 37.1 252
Caraga 9.6 II.6 21.2 10.7 38.1 48.8 21.8 50.3 72.2 70.6 208
Education
No education 14.0 14.5 28.4 5.9 9.4 15.3 20.8 24.3 45.1 37.0 169
Elementary 8.1 15.8 23.9 6.7 34.5 41.1 16.9 51.2 68.1 64.9 2,756
High school 9.1 9.6 18.7 14.3 35.8 50.2 26.3 46.3 72.5 74.2 3,050
College or higher 8.1 7.5 15.6 17.6 32.8 50.3 28.2 40.8 69.0 77.3 2,361
Total 8.6 11.2 19.8 12.6 34.0 46.5 23.6 45.9 69.5 71.6 8,336
IUnmet need for spacing includes pregnant women whose pregnancy was mistimed, amenorrheie women whose last birth was mistimed, and women who are neither preg~ant nor amenotrheie and wgo are not using any method of family planning and say they want to wait 2 or more yeats for their next birth. Also included in unmet need for spacing are women who are unsure whether they want another child or who want another child but am unsure when to have the birih. Unmet need for limiting refers to pregnant wonlen whose pregnancy was mlwanted, amenorrheie women whose last child was unwanted and women who are neither pregnant nor amenorrfieie and who are not using any method of family planning and who want no more ehtid~n.
2 Using for spacing is defined as women who are using some method of family planning and say they want to have anoti~er child or are undecided whether to have another. Using for Ihniting is defined as women who are using and who want no more children. Note that the specific methods used are not taken into account here.
3 Pregnant and anleuorrheie women whose pregnancy was the result of a eontraeeptlve failure are not included in the eategnry of unmet need, but are included in total demand for contraception.
95

Table 6.5 Ideal number of children
Percent distribution of all women by ideal number of'children and mean ideal number of children for all women and for currently married women, according to number of living children, Philippines 1998
Ideal number Number ofliving children t of children 0 1 2 3 4 5 6+ Total
0 0.8 0.0 0.0 0.1 0.0 0.0 0.1 0.3 1 3.9 8.5 2.4 1.4 0.9 0.9 0.5 3.i 2 40.4 38.8 36.6 12.3 15.0 11.3 9.2 29.3 3 32.4 32.4 30.9 45.5 I5.8 30.8 27.5 31.8 4 16.2 14.6 24.1 28.5 50.6 20.1 26.5 22.9 5 2.7 2.4 3.4 5.4 7.5 22.6 9.9 5.3 6+ 1.8 2.2 2.2 5.5 8.6 11.5 22.1 5.4 Non-numeric response 1.9 1.0 0.5 1.3 1.6 2.8 4.3 1.8
Total 100.0 100.0 100.0 100.0 100.0 100.0 100.0 100.0 Number of women 5,407 1,621 1,824 1,783 1,297 808 1,243 13,983
Mean ideal number for: women 2.8 2.7 3.0 3.5 3.8 4.0 4.4 3.2 Number of women 5,305 1,605 1,815 1,761 1,276 785 1,I90 13,736 CMW 2.9 2.8 3.0 3.5 3.9 4.0 4.4 3.5 Number of woman 375 1,387 1,700 1,675 1,198 741 1,124 8,199
Note: The means exclude women who gave non-numeric responses. , Includes current pregnancy.
There is a correlation between actual and ideal number of children. Women who want larger families tend to achieve larger families. It is also possible that women with larger families have larger ideal sizes because of attitudes that they acquired 20 or 30 years ago. Women may adjust upwards their ideal size of family as the actual number of children increases. For example, the mean ideal number of children of women with one living child is 2.7, while women who have 6 or more children expressed an ideal number of 4.4. Preference for a three-child family is expressed by 46 percent of women with three living children, and 51 percent of women with four children said four was their ideal number.
Despite the likelihood that some rationalization occurs, it is common to find that respondents state ideal sizes lower than their actual number of living children. This can be taken as an indicator of surplus or unwanted fertility. In fact, among women with five or more children, more than 60 percent say that if they were to start again they would choose to have fewer children.
Presented in Table 6.6 is the mean ideal number of children for all women by age and mother 's background characteristics. The table shows that younger and better educated women are more likely to have lower fertility goals than other women. There is only a small difference in the ideal number of children among women in the rural and urban areas. Women in ARMM and CAR have mean ideal family sizes o f four or more children compared with less than three children for women in Metropolitan Manila and Southern Mindanao. The mean ideal number of children for other regions ranges from 3 to 3.5 children.
96

Table 6.6 Mean ideal number of children by background characteristics
Mean ideal number of children for at1 women, by age and selected background characteristics. Philippines 1998
Background characteristic
Age of woman
15-19 20-24 25-29 30-34 35-39 40-44 45-49 Total
Residence Urban 2.7 2,9 2.9 3.2 3.2 3.5 3.5 3.1
Rural 2,9 3,1 3.3 3,5 3.8 3.9 4.0 3,4
Region Metro Manila 2.7 2.9 2.9 3.0 3.1 3.3 3;0 2.9
CordJlJera Admin, 2.9 3.5 4.1 3.9 4.7 4.9 (5.2) 4.0
Iloeos 2.7 3.0 3.0 3.5 3,4 3,8 4.0 3.2
Cagayan Valley 2.9 3.0 3.2 3.6 3.8 3.7 4.1 3.4
C.Luzon 2.9 3.0 3.1 3.4 3.6 3.6 3.9 3.3
S,Tagalog 2.9 2,9 3.0 3.2 3.3 3.6 3.5 3.1
Bieol 2.5 2.7 3.0 3.4 3.5 3.7 3.9 3.2
W.Visayas 2.7 2.7 3.0 3,1 3.3 3.4 3.6 3.1
C,Visayas 2.6 2.7 2.8 3.1 3.1 4.0 3.6 3.0
E.Visayas 2.7 3.1 3.1 3.6 3.7 4.3 4.1 3.5
W.Mindanao 2.8 3.2 3.2 3.6 3.9 3.9 4.3 3.4
N.Mindanao 2.5 2.7 3.0 3.4 3.5 3.7 3.8 3.1
S,Mindanao 2.5 2.7 2.8 3.2 3,2 3,3 3.4 2.9
C.Mindanao 3,2 3.0 3.0 3.7 3.6 3.4 3.8 3.4 ARMM 4.6 5.8 6.1 6.4 6.2 6.1 6.6 5.8
Caraga 2.6 2.7 3.0 3.3 3.6 3.9 3.8 3,2
Education No education * (4.7) 5.2 5.9 5.1 5.0 5.2 5.1
Elementary 2,8 3.1 3.3 3.7 3,8 3.8 4.0 3.5
High school 2.8 2.9 3.0 3.2 3,4 3,6 3.5 3.0 College or higher 2,9 2.9 2.9 3.1 3.1 3.4 3.4 3.1
Total 2.8 2.9 3.1 3.3 3.5 3.7 3.8 3.2
* Less than 25 unweighted cases 0 Figures in parentheses are based on 25-49 unweighted eases.
97

Figure 6.3 Mean Ideal Number of Children for All Women by Region
Number of Children
7.0
6.0
5.0
4.0
3.0
2.0
1.0
0.0 ~P ~ ~ .,~ ~o ~o ~̂o ~̂o .,# .,e
Region 1998 NDHS
6.4 Unplanned and Unwanted Fertility
For each child born in the preceding five years and any current pregnancy, women were asked questions to determine whether the particular pregnancy was planned, unplanned but wanted at a later time, or not wanted at all. Answers to these questions form a powerful indicator of the degree to which couples successfully control childbearing. In addition, the data can be used to gauge the effect on period fertility of the prevention of unwanted births.
Table 6.7 shows the distribution of births in the five years preceding the survey by fertility planning status, according to birth order and mother's age at birth. Fifty-four percent of all births were wanted at the time of conception, 27 percent were wanted but at a later time, and 18 percent were unwanted. As expected, the proportion of births which were wanted at the time of conception is highest among first births (75 percent) and among mothers under age 20 at the time of birth (63 percent). Mistimed pregnancies are highest for the second and third child. The proportion of unwanted births increases as mothers get older and have had more children. It is highest among fourth births and above (35 percent) and among mothers age 40-44 years (52 percent).
98

Table 6.7 Fertility planning status
Percent distribution of births in the five years preceding the survey by fertility planning status, according to birth order and mother's age, Philippines 1998
Planning status of birth
Wanted Number Birth order Wanted Wanted no of and mother's age then later more Missing Total births
Birth order 1 75.4 20.5 3.7 0.5 100.0 2,100 2 56.4 36.0 7. I 0.5 100.0 1,762 3 52.5 30.6 16.7 0.2 100.0 1,413 4+ 39.3 24.5 35.1 1.0 100.0 3,100
Age at birth <20 62.5 29.2 7.4 0.8 100.0 704 20-24 58.6 33.2 7.6 0.6 100.0 2,173 25-29 54.3 29.6 15.5 0.6 100.0 2,424 30-34 53.0 22.4 24.0 0.6 100.0 1,773 35-39 45.0 19.3 34.9 0.8 100.0 971 40-44 39.7 7.7 51.9 0.6 100.0 311 45-49 (54.0) (4.6) (41.4) (0.0) 100.0 22
Total 54.2 26.9 18.2 0.7 100.0 8,377 Note: Birth order includes current pregnancy. ( ) Figures in parentheses are based on 25-49 unweighted cases.
The wanted fertility rate is defined as the level of fertility that theoretically would result i f all unwanted births could be prevented. The total wanted fertility rate provides another indicator of fertility aspirations and may be interpreted as the number of wanted births that a woman would bear by age 50.
Table 6.8 shows the total wanted fertility rates and total ferfdity rates for the three years preceding the survey by place of residence and level of education. The comparison makes clear that women will bear one child more than they desire i f they continue to reproduce at current levels over time. This difference is an indication of the number of births a person needs to avoid over her reproductive life in order to attain her fertility aspirations. Regardless of the place of residence, region of residence, and level of education, the wanted number of births is lower than the actual number of births. Interestingly, women in rural areas have 1.5 children more than their desired number. Among urban women, the difference is less than one child. This indicates that urban women are more successful in achieving their fertility goals.
99

Table 6.8 Wanted fertility rates
Total wanted fertility rates and total fertility rates for the three years preceding the survey, by selected background characteristics, Philippines 1998
Total wanted Total
Background fertility fertility characteristic rate rate
Residence Urban 2.3 3.0
Rural 3.3 4.7
Region
Metro Manila 2.0 2.5
Cordillera Admin. 3.6 4.8
Ilocos 2.5 3.4
Cagayan Valley 2.9 3.6
C.Luzon 2.8 3.5
S.Tagalog 2.6 3.7
Bicol 3.6 5.5
W.Visayas 2.9 4.0
C.Visayas 2.5 3.7
E.Visayas 3.8 5,9
W.Mindanao 2.9 3.9
N.Mindanao 3.1 4.8
S.Mindunao 2.5 3.7
C.Mindanao 3.0 4,2
ARMM 4.2 4,6
Caraga 3.1 4.6
Education No education 3.9 5.0
Elementary 3.3 5.0
High school 2.7 3.6
College or higher 2.5 2.9
Total 2.7 3.7
Note: Rates are based on births to women 15-49 in the period 1-36 months preceding the survey. The total fertility rates are the same as those presented in Table 3.2.
Considering the gap between wanted and actual fertility by region, Eastern Visayas and Bicol have the largest differentials about two children. The gap between wanted and actual fertility is lowest for ARMM (0.4 births) and Metropolitan Manila (0.5 births). College-educated women seem to be most successful in achieving their fertility goals. They have a difference of less than one child between desired and actual fertility. On the other hand, women with elementary education have the largest gap (1.7 children).
6.5 Family Size Desires of Couples
Discussion of family planning between partners is thought to be instrumental in the decision to take joint action to plan family size. Information about women's perceptions concerning their partner's desired number of children is shown in Table 6.9. Seven out of ten currently married women say that they want the same number of children as their partner.
One in five currently married women believes that her partner wants more children than she does. Women with no education (32 percent) and those living in ARMM (42 percent) are more likely than other women to say that their partner wants more children than they do.
About 7 percent of currently married women report that they want more children than their partner. The proportion is largest among women in Southern Tagalog (11 percent).
I00

Table 6.9 Couple's consensus on family size
Percent distribution of currently married women by perceived consensus with husband regarding the number of children desired, according to selected background characteristics, Philippines 1998
Couple's consensus on desire for childrenl
Husband and Husband Husband Number Background wife want same wants more wants fewer Don't know/ of characteristic number than wife than wife missing Total women
Age of woman 15-19 67.5 18.7 7.8 6.0 100.0 244 20-24 73,0 16.9 8.2 2.0 100.0 967 25-29 72.3 18.8 7.1 1.8 100.0 1,585 30-34 72.4 18.2 7.4 2.0 100.0 1,730 35-39 67.9 21.6 7.4 3.1 16'0.0 1,602 40-44 65.3 22.5 7.3 4.9 100.0 1,243
45-49 70.9 20.1 4.8 4.1 100.0 965
Difference in age between woman and husband/partner
0-1 year 72.5 18.3 7.0 2.1 100.0 2,256 2-3 years 70.1 19.9 7.1 2.9 100.0 2,309 4-5 years 69.4 20.6 6.5 3.5 100.0 1,515 6+ years and over 69.0 20.3 7.7 2.9 100.0 2,209
Residence
Urban 71.3 18.2 7.6 3.0 100.0 4,222 Rural 69.1 21.3 6.7 2.9 100.0 4,114
Region
Melro Manila 69.7 17.8 8.2 4.4 100.0 1,298 Cordillera Admin. 68.1 20.2 6.5 5.2 100.0 136 lloeos 75.4 16.9 5.2 2.6 100.0 414 Cagayan Valley 71.0 22.2 5.1 1.6 100.0 322 C.Luzon 74.6 16.5 6.7 2.2 100.0 883 S.Tagalog 70.3 17.3 11.2 1.2 100.0 1,219 Bicol 73.5 18.7 5.1 2.8 100.0 481 W.Visayas 74.1 15.9 6.2 3.8 100.0 627 C.Visayas 73.9 18.5 3.9 3.7 100.0 620 E.Visayas 63.3 26.7 7.3 2.7 100.0 395 W.Mindanao 67.9 22,4 6.5 3.2 100.0 343 NMindanao 67.4 23.6 6,5 2.5 100.0 295 SMindanao 72.6 17.7 8.4 1.3 100.0 572 C.Mindanao 63.5 24.7 6.4 5.5 100.0 273
ARMM 48.1 41.7 3.4 6.8 100.0 252 Caraga 63.8 27.0 7.3 1.9 100,0 208
Education
No education 56.0 31.5 2.7 9.8 100.0 169 ELementary 66.3 22.5 7.6 3.6 100.0 2,756 High school 71.8 18.2 7.3 2.8 100.0 3,050 College o1" higher 73.7 17.6 6.8 1.9 100.0 2,361
Total 70.2 19.7 7.1 3.0 100.0 8,336
tBased on wife's perceptions of her husband's desires.
101

Figure 6.4 Currently Married Women by Perceived Consensus with
Husband Regarding the Number of Children Desired
Husband ~nd wif• want s~
Husband wants more than wife
2O%
Don't know/ Husband wants missing fewer than wife
3% 7% 1998NDHS
Figure 6.5 Currently Married Women Whose Desired Number of Children is the Same as That Perceived as Desired by Their Husband
Percent
100
90
80
70
60
50
40
30
20
10
0
o+~ o~ <o, + +~ +.+ +o++.+,%,+.+,%+~ ~. o+.
Region 1998 NDHS
102

CHAPTER 7
INFANT AND CHILD MORTALITY
7.1 Background
Reported in this chapter is information on levels, trends, and differentials in neonatal, postneonatal, infant and child mortality. This information is relevant to the demographic assessment of both population and health policies and programs. Estimates of infant and child mortality may be used as inputs into population projections, particularly if the level of adult mortality is known from another source or can be inferred with reasonable confidence. Information on mortality of children also serves the needs of agencies providing health services by identifying sectors of the population which are at high mortality risk.
In this report, infant and child mortality are measured using the following rates:
• Neonatal mortality (NN): the probability of dying within the first month of life;
Postneonatal mortality (PNN): the probability of dying after the first month of life but before age one year;
• Infant mortality (iq0): the probability of dying between birth and age one year;
• Child mortality (4ql): the probability of dying between exact age one and age five;
• Under-five mortality (sq0): the probability of dying between birth and exact age five.
The mortality rates presented in this chapter are computed from information derived from the questions asked in the pregnancy history section of the 1998 National Demographic and Health Survey (NDHS) individual woman's questionnaire. Data collection proceeded as follows: first, each woman was asked about the number of sons and daughters living with her in the same household as well as those who are living elsewhere, and the number who had died. At this point, the respondent was also asked about the number of pregnancies which did not result in a live birth. Next, the respondent was asked to give information on each of the pregnancies she had experienced. For each pregnancy, she was asked whether the pregnancy ended in a live birth or not. The name, sex, date of birth, age at last birthday, whether the birth was an outcome of a single or multiple birth, and survival status were recorded for all live births. If the child had died, the woman was asked the age at death. If the ctftld was sfill living, information about his/her age at last birthday and whether the child lived with his/her mother was obtained. For pregnancies that did not result in a live birth, the respondent was asked if she or someone else did something to end the pregnancy, and what the duration of the pregnancy was at the time of loss.
The information on living and dead children is used to directly estimate mortality rates. It should be noted here that the reliability of these mortality estimates depends upon full recall about children who have died, the absence of significant differentials in birth dates between living and dead children, and accurate reporting of age at death. It should be said, however, that birth history data provide information that make detailed analyses of mortality possible.
103

A closer look at the pattern of reporting of age at death (Table C.6 in Appendix C and Figure 7.1) reveals some evidence of heaping of deaths. For the five years preceding the survey, a significantly high percentage of deaths was reported among infants 12 months of age. However, this heaping on age at death of 12 months is far lower for deaths occurring in the five years preceding the survey than it is for earlier deaths. Thus, reporting of age at death appears to be reasonable, though a more thorough investigation would result in more definitive conclusions.
200
Figure 7.1 Deaths among Children Under Two Years for Three 5-Year Periods Preceding the Survey
Number of Deaths
150
100
50
<1 1 2 3 4 5 6 7 8 9 10 11 12 13 14 15 16 17 18 19 20 21 22 23
Age at Death (months)
I Years prior to Survey I "e'O-4 "~'5-9 "1"10-14
1998NDHS
In order to analyze trends in mortality, direct estimates based on the 1983, 1988 and 1993 NDS, the 1986 Contraceptive Prevalence Survey (CPS), and the Republic of the Philippines Fertility Survey (RPFS) are also presented in this chapter as well as estimates from the Vital Registration System (VRS).
Data from the maternity histories collected in previous surveys cited earlier provided direct estimates of infant mortality at various periods preceding each survey. The estimates from the vital registration system were calculated using the ratio of registered infant deaths to births expressed in terms of 1,000 live births. Comparing the point estimates of infant mortality from various sources during the same periods provides some insights as to the levels and trends of infant mortality.
104

7.2 Levels and Trends in Infant and Child Mortality
Table 7,1 presents various mortality estimates for children under five based on the 1998 NDHS. The infant mortality rate during the five-year period prior to the survey was 35 deaths per 1,000 live births, while the neonatal mortality rate was 18 deaths per 1,000 live births. The probability of dying between birth and the fifth birthday was 48 per 1,000 live births. The data indicate that the under-five mortality rate declined from 72 in the period 10 to 14 years prior to the survey to 48 in the most recent five-year period. While the various measures of mortality showed a declining trend, a variable pattern was observed in mortality during the post-neonatal period.
Table 7.1 Infant and child mortality
Infant and child mortality rates by five-year periods preceding the survey, Philippines 1998
Years Neonatal Postneonatal Infant Child Under-five preceding mortality mortality mortality mortality Mortality survey (NN) (PNN) (tq0) Gq0 (sq0)
0-4 17.8 17.3 35.1 13.8 48.4 5-9 20.7 16.1 36.8 26.2 62.1 10-14 26,5 19.1 45,6 27.9 72.3
Table 7,2 and Figure 7.2 show direct measures of infant mortality from various sources. During the 25-year period, infant mortality continued to decline though at varying paces. Prior to 1980, the IMR based on the Vital Registration System (VRS) was generally higher than those directly measured from the four national demographic surveys, with the exception of the 1975 IMR estimate from the 1978 RPFS, which was higher than the VRS estimate. The 1983 and 1988 NDS rounds yielded more or less comparable IMR estimates for 1975 and 1980, The pattern observed with vital registration as a source is reversed for the period since 1980 in which the rates are much lower than those estimated from the national surveys. Point estimates for 1980 appear to be similar from all sources. There is, however, wide divergence in the preceding and succeeding periods.
The estimates from the I998 NDHS are slightly higher than those from the 1993 NDS for the same time period, but the trends of the IMR estimates from these two surveys are similar. The IMR appears to have dramatically declined between 1980 and 1990.
105

Table 7.2 Trend in infant mortality rate
Infant mortality rates from various sources, Philippines 1970-1995
Vital Approximate 1998 1993 1988 1983 1978 Registration
Midpoint NDHS NDS NDS NDS RPFS System
1995 35.1 1990 36.8 33.6 24.3 1985 45.6 43.5 52.0 38.0 1980 51.3 51.0 47.0 45.1 1975 53.0 50.0 59.0 56.9 1970 50.0 56.0 62.0
~ource: Final Report of the Task Force on Infant Mortality Rate, blSCB, December 1992 1993 NDS and 1998 NDHS
Figure 7.2 Trends in Infant Mortality in the Philippines
Various Sources, 1970-1995
70-
tZ) Q
Z
¢o
t2
60-
40.
30.
2O
1970 1975 1980 1985 1990 1995
• 1978 RPFS ! 1983 NDS ,I, 1988 NDS X 1993 NDS • 1998 NDHS O V'Cal Registration . . . . . . Average
106

7.3 Infant and Child Mortality Differentials by Socioeconomic Characteristics
Socioeconomic factors are important determinants o f the levels o f infant and child mortality. In the 1998 NDHS, several socioeconomic factors have been measured such as place o f residence and education o f parents. Health beliefs and practices as well as accessibility or availability o f health care services have also been collected. This section deals with the relationship between the childhood mortali ty measures and some o f these variables.
Table 7.3 shows mortality measures by selected background characteristics o f the mother for the 10-year period preceding the survey. In general, mortality in urban areas is lower than in rural areas.
Table 7.3 Infant and child mortality by socioeconomic characteristics
Infant and child mortality rates for the 10-year period preceding the survey, by selected socioeconomic characteristics, Philippines 1998
Neonatal Postneonatal Infant Child Under-five Socioeconomic mortality mortality mortality mortality mortality characteristic (NN) (PNN) (iq0) (4q J) (sq0)
Residence Urban 17.6 13.3 30.9 15.4 45.8 Rural 20.6 19.6 40.2 23.3 62.5
Region Metro Manila 15.1 8.6 23.7 15.3 38.6 Cordillera Admin. 18.7 24.0 42.7 10.1 52.4 llocos 27.7 13.9 41.5 10.2 51.3 Cagayan Valley 15,4 21.7 37.1 16.1 52.6 C. Luzon 20.1 8.5 28.7 11.1 39.4 S. Tagalog 21.1 14.2 35.3 18.5 53.2 Bicol 14.7 16.7 31.4 21.8 52.5 W. Visayas 11.2 14.8 26.0 16.1 41.6 C. Visayas 11,5 12.1 23.6 15.1 38.4 E. Visayas 31.3 29.5 60.8 26.4 85.6 W. Mindanao 19.5 25.1 44.6 31.7 74.9 N. Mindanao 21.1 19.9 41.0 24.8 64.8 S. Mindanao 19.1 21.8 40.9 21.1 61.2 C. Mindanao 27.0 21.4 48.4 29.0 75.9 ARMM 23.6 31.5 55.1 45.0 97.6 Caraga 28.6 24.6 53.2 31.0 82.5
Education No education 35.4 43.1 78.5 62.0 135.7 Elementary 20.4 24.7 45.1 29.2 73.0 High school 19,5 11.9 31.4 14.8 45.7 College or higher 15.3 8.1 23.4 5.0 28,3
Medical maternity care No antenatal/delivery care Either antenatal or delivery Both antenatal & delivery
29,2 47,6 76,8 36,6 110,6 16.3 20.2 36.5 12,7 48.7 15.4 7.2 22.5 7.6 30.0
Total 19.3 16.7 36.0 19.7 54.9
107

Among regions, infant mortality is lowest in Metro Manila and Central Visayas and highest in Eastern Visayas. Child mortality is lowest in Cordillera Administrative Region and Ilocos Region and highest in ARMM.
Table 7.3 also indicates that mortality rates for children of mothers with no education or elementary education are much higher than those with a high school or, especially, college education (see Figure 7.3). This supports the findings from the 1993 NDS and of previous studies which showed that children born to better educated mothers have a higher probability of surviving their early years. In reviewing Philippines studies in this area, using various statistical techniques and mortality indicators, Costelo (n.d.) concluded that there is an inverse relationship between maternal education and infant mortality.
Figure 7.3 Infant Mortality by Background Characteristics
Deaths per 1,000 Births
S0
70
60
50
40
30
20
10
0 Urban Rural No Elemen- High College
REStDENCE education tary school or higher EDUCATION
Note: Figures are for the 10-year peedd preceding the survey, 1998 NDH$
Meanwhile, mortality among infants/ehildren whose mothers had no antenatal care or medical assistance at the time of delivery is much higher than among those whose mothers had either or both antenatal care and medical assistance during delivery. This observation reinforces the findings of local studies which show that accessibility and availability of health services/facilities can be linked empirically to reduced rates of infant mortality. For instance, it was found that access to a midwife, hospital, prima/y health care center, or pharmacy is inversely associated with neonatal mortality, and that access to a health worker and hospital has a similar impact on postneonataI mortality. Access to modern medical practitioners can be linked to lower infant mortality.
108

7.4 Infant and Child Mortality Differentials by Demographic and Health Characteristics
Table 7.4 shows mortality by selected demographic characteristics which have been shown to influence the survival chances of children. In general, mortality is higher for males than for females. One of the variables known to have an effect on ~nfant mortality is the mother's age at the time of delivery. The level of infant mortality, particularly during the neonatal period, and under-five mortality is higher among children whose mothers were less than age 20 at the time of delivery, decreases among mothers age 20-29, and increases among mothers age 40-49. Child mortality does not show a definite pattern of variation with mother's age.
~l'able 7.4 Infant and child mortalit'¢ by demographic characteristics
Infant and child mortality rates for the 10.year period preceding the survey, by selected demographic characteristics, Philippines 1998
Neonatal Postneonatal Infant Child Under-five Demographic mortality mortality mortality mortality mortality characteristic (NN) (PNN) (N0) (4ql) (sq0)
Sex of child Male 20.6 18.7 39.4 20.8 59.4 Female 17.8 14.5 32.3 18.5 50.2
Age of mother at birth <20 26.4 15.0 41.4 19,1 59.7 20-29 16.3 17.0 33.3 18,1 50.8 30-39 21.0 16.7 37.6 23,3 60.0 40-49 35.3 16.7 52.0 16.0 67.2
Birth order 1 20.8 11.0 31.8 10.5 42.0 2-3 16,6 15.3 31.9 14.3 45.7 4-6 18,5 20.2 38.8 28.4 66,0 7+ 26.9 26.2 53.1 39.7 90.7
Previous birth interval <2 yrs 20.9 25.1 46.1 28.5 73.2 2-3 yrs 14.1 14.1 28.2 21.8 49.4 4 yrs+ 22.7 14.8 37.5 11.2 48.3
Size at birth 1 Small or very small 30.6 18.0 48.6 13.9 61.9 Average or larger I3.8 14.8 28.6 12.6 40.8
kRates for the 10-year period preceding the survey
109
The levels of infant and child mortality among children of birth order 1 to 3 are similar but rise thereafter with increasing birth order. Mortality according to the length of the previous birth interval indicates the usual pattern of high mortality among children born less than two years after the previous birth. Mortality rates decline considerably for children born 2-3 years after a prior birth. However, neonatal mortality is markedly higher while the mortality rates after the neonatal period but before the age of 5 years are lower for children born 4 or more years after a previous birth compared to those born 2-3 years after a previous birth.
Children who were judged by their mothers to be "average or larger" at birth generally have lower mortality levels than children judged to be "small or very small" at birth. Within the first month of life, the level of mortality for small or very small infants is about twice that for those whose birth size is average or larger.
7.5 High-Risk Fertility Behavior
The distribution of women and children according to categories of increased risk of infant and child mortality as a result of fertility behavior of the mother is shown in Table 7.5. Children at elevated risk include those born to mothers who are too young or too old when they give birth, children of high parity, and children born after a short interval. The table also presents the relative risk of dying for children born in the last five years by comparing the proportion dead in each high-risk category with the proportion dead among children who are not in any high-risk category. This information is useful for designing and monitoring programs both to avoid high-risk behavior and to cope with elevated risks.
Of the children born in the five years preceding the survey, 57 percent are in one or more elevated risk categories. High birth order and short birth interval were the most common high-risk factors. More than one-fifth of all births are subject to multiple risk characteristics. Under the single risk category, 2 percent were born to mothers younger than 18 years, 3 percent were born to mothers older than 34 years, 15 percent were born after an interval of less than 24 months, and 16 percent were of birth order greater than 3. Under the multiple high-risk category, 10 percent were born to mothers over 34 years of age and were of birth order greater than 3, and 9 percent were born after an interval of less than 24 months and were of birth order greater than 3.
The risk ratios shown in the second column of Table 7.5 illustrate the relationship between the risk factors and mortality levels. The risk ratios for children in the single high-risk categories are generally lower than risk ratios for children in multiple high-risk categories. Those who fall into only one elevated risk category have a risk ratio of 1.44, while children who are in the multiple high-risk categories have a risk ratio of 2.14. The highest risk ratios for those in single high-risk categories are observed for children with mothers who are older than 34 years of age (2.14). As for children who are in the multiple high-risk categories, the highest ratio is observed for those with mothers who are older than 34 years, with birth interval less than 24 months, and with birth order greater than 3 (2.60). High-risk ratios are also observed for children with birth order greater than 3 and with birth interval less than 24 months (2.09).
110

Table 7.5 High-risk fertility behavior
Percent distribution of children born in the five years preceding the survey who are at elevated risk of dying and the percent distribution of currently married women at risk of conceiving a child with an elevated risk of dying, by category of increased risk, Philippines 1998
Births in the 5 years Percentage preceding the survey of
currently Risk Percentage Risk married Category of births ratio women a
Not in any high-risk category Unavoidable risk: first births
20.7 1.00 26.3 b 22.4 1.01 5.0
Single high-risk category Mother's age < 18 2.3 1.83 0.2 Mother's age > 34 2.6 2.14 9.2 Birth interval < 24 14.5 1.40 8.9 Birth order > 3 15.8 1.31 11.9
Subtotal 35.1 1.44 30.1
Multiple high-risk category Age <18 & birth interval <24 c Age >34 & birth interval <24 Age >34 & birth order >3 Age >34 & birth interval<24 &
birth order >3 Birth interval <24 & birth order >3
0.3 (6.13) 0.1 0.4 (2.2~ 0.7 9.7 1.91 26.6
2.8 2.60 3.7 8.7 2.09 7.4
Subtotal 21.9 2.14 38.6
In any high-risk category 56.9 1.71 68.7
Total 100.0 100.0 Number 7,567 8,336
Note: Risk ratio is the ratio of the proportion dead of births in a specific high-risk category to the proportion dead of births not in any high-risk category, NA = Not applicable "Women were assigned to risk categories according to the status they would have at the birth of a child, i f the child were conceived at the time of the survey: age less than 17 years and 3 months, age older than 34 and 2 months, latest birth less than 15 months ago, and latest birth of order 3 or higher. blncludes sterilized women ¢Includes the combined categories age <18 and birth order >3. 0 Based on 25-49 unweighted cases
l l l
The distribution of currently married women according to category of potential risk if they were to conceive at the time of the survey is also presented. The results indicate that 30 percent of married women have the potential for giving birth to a child in a single high-risk category, and 39 percent have the potential for having a child in a multiple high-risk category.
In summary, the aforementioned findings indicate that more than half of the births in the last five years are at an elevated mortality risk. Moreover, two-thirds of married women had the potential for giving birth to a child at an elevated risk at the time of the survey. This implies that a significant reduction in infant and child mortality could be achieved through changes in childbearing patterns.
112

CHAPTER8
MATERNAL AND CHILD HEALTH
Presented in this chapter are three areas of importance to maternal and child health: maternal care and delivery assistance, vaccinations, and common childhood diseases and treatment. Combined with information on neonatal and infant mortality, this information is useful in identifying subgroups of women who are in need of maternity care in planning for improvement of services.
8.1 Prenatal Care
In the 1998 National Demographic and Health Survey (NDHS), respondents were asked whether they had seen anyone for prenatal care during the pregnancy preceding each live birth in the last five years. The interviewer was instructed to record all responses if more than one source of prenatal care was mentioned for the same pregnancy. However, for the purposes of this tabulation, only the provider with the highest qualifications is considered when there is more than one response. Table 8.1 shows that the overall level of prenatal care among Filipino women is high. Nine out of 10 children born in the five years preceding the survey were to mothers who received prenatal care, the same as the 1993 NDS findings. However, prenatal care by professional health workers (doctors, nurses and midwives) increased by 3 percentage points (from 83 percent of births in 1993 to 86 percent in 1998). Mothers received no prenatal care for one out of 13 births.
Births to mothers age 20-34, lower order births, births to urban mothers, better-educated mothers, and mothers living in Central Luzon and Metro Manila were more likely to receive medical attention during pregnancy than were other births in the five years prior to the survey. While more than half of children in the urban areas are born to mothers who receive prenatal care from a physician, in the rural areas nurses and midwives are more likely to be the prenatal care provider. Disparities in prenatal service provider are also present by region. In Metro Manila and Central Luzon, the most common prenatal care provider is a physician. In all other regions, mothers were as likely or more likely to consult a nurse or midwife, except in ARMM, where birth attendants are the most important source for prenatal care. There is a very strong association between mother's level of education and type of prenatal care received. Mothers who had high school education are eight times more likely to consult a physician for prenatal care than mothers who had no education. For mothers with some college education, the chance of using a doctor for prenatal care is even higher: 16 times higher than the level for mothers who had no formal schooling.
The maternal care program in the Philippines recommends that every pregnant woman have at least 3 prenatal care visits during her pregnancy, 1 visit in each of the three trimesters. Information about the visits made by pregnant women is presented in Table 8.2 and Figure 8.1. The findings indicate that for the majority of the births in the five years prior to the survey, mothers complied with the recommended minimum number of visits. For 77 percent of births, mothers made 3 or more prenatal visits. The median number of visits was 4.4.
113

Table 8.1 Prenatal care
Percent distribution of live births in the last five years by source of prenatal care during pregnancy, according to maternal and background characteristics, Philippines 1998
Prenatal care provider I
Traditional Number Background Nurse/ birth No of characteristic Doctor Midwife attendant one Missing Total births
Age at birth <20 20-34 35+
Birth order 1 2-3 4-5 6+
Residence Urban Rural
Region Metro Manila Cordillera Admin. lloeos Cagayan Valley C. Luzon S. Luzon Bicol W. Visayas C. Visayas E. Visayas W. Mindanao N. Mindanao S. Mindanao C. Mindanao ARMM Caraga
Mother's education No education Elementary High school College or higher
28.9 53.4 7.8 9.8 0.2 100.0 644 40.3 46.7 5.5 7.1 0.3 100.0 5,756 34.9 46.0 9.2 9.8 0.0 100.0 1,167
51.5 40.5 3.4 4.5 0. t 100.0 1,907 43.4 45.1 5.2 6.1 0.2 100.0 2,863 30.2 53.4 7.4 8.6 0.4 100.0 1,548 17.8 54.4 11.8 15.8 0.3 100.0 1,248
56.6 35.8 2.8 4.6 0.1 100.0 3,465 23.2 56.7 9.2 10.5 0.3 100.0 4,101
75.3 19.7 1.4 3.6 0.0 100.0 1,048 40.3 44.3 0.7 14.2 0.5 100.0 149 43.2 42.9 2.8 10.7 0.3 100.0 344 31.1 41.5 6.6 20.5 0.3 100.0 242 53.9 38.8 2.1 5.0 0.2 100.0 711 43.7 42.5 5.1 8.7 0.0 100.0 1,078 20.0 60.8 10.2 8.7 0.4 100.0 530 38.1 54.7 2.6 4.5 0.2 100.0 585 24.2 69.2 2.3 4.1 0.2 100.0 586 19.8 57.6 7.7 14.5 0.5 100.0 446 21.9 51.8 19.2 6.1 1.1 100.0 304 21.3 61.8 5.0 11.9 0.0 100.0 331 31.7 57.6 2.5 8.3 0.0 100.0 489 20.8 61.7 9.2 7.8 0.5 100.0 264 11.6 30.7 48.2 8.7 0.9 I00.0 263 26.3 63.0 4.5 5.4 0.7 100.0 197
Total 38.5 47.2 6.3 7.8 0.2
Note: Figures are for births in the period 1-59 months preceding the survey. 1If the respondent mentioned more than one pmvider, only the most qualified provider is considered.
4.5 22.7 39.4 32.8 0.6 I00.0 169 15.7 59.8 10.6 13.7 0.3 100.0 2,586 37.6 53.7 3.6 4.9 0.3 100.0 2,913 74.1 22.2 1.6 1.9 0.1 100.0 1,898
100.0 7,566
Table 8.2 and Figure 8.1 also present the distribution of births occurring in the past five years according to the timing of the first prenatal visit. For almost half of births, the first prenatal visit was made in the first 3 months of gestation. It should be noted that mothers of one in three births had their first prenatal care in the 4-7th month, while a small percentage was first examined during the last three months of pregnancy.
114

Figure 8.1 Number of Prenatal Care Visits and
Stage of Pregnancy at First Visit
0-3 months 48%
2 visits 1 visit Don't
9% 5% know
7-9 months 3 or more visits No prenatal 7%
77% care 8%
NUMBER OF PRENATAL CARE VISITS STAGE OF PREGNANCY
AT FIRST VISIT
1998 NDHS
For early detection of risks, mothers are advised to have a prenatal checkup as early as the first trimester of pregnancy. The results of the 1998 N D H S shows that the median age of pregnancy when women come for their first prenatal checkup is 3.9 months.
High quality prenatal care includes identifying a high-risk condition among pregnant women and educating them about potential symptoms that are indicative of serious conditions so that early intervention can be instituted. For live births that occurred in the f ive years before the survey for which mothers received a prenatal checkup, only 33 percent were informed about the dangers related to pregnancy. Younger mothers, those residing in rural areas, those coming f rom A R M M and those with no education or with low education are less likely to be told about the dangerous symptoms of pregnancy and are therefore more at risk (Table 8.2). Mothers who were more likely to be informed about such dangerous symptoms as vaginal bleeding, headache, dizziness and edema were mothers who were residing in urban areas and who have college education.
115

Among those women who were informed of the danger signs, about one-fourth said they were told to watch for vaginal bleeding, while another one-fourth said they were told about dizziness, headaches and blurred vision. Twenty-three percent were told that excessive paleness or anemia was a danger sign, while 22 percent were told to watch for swollen face or hands (Figure 8.2).
Table 8.2 Information about danger signs of oregnancv
Percent distribution of live births in the five years preceding the survey for which prenatal care was received by whether the mother was informed about specific symptoms during pregnancy that might be dangerous, according to background characteristics, Philippines 1998
Informed about dangerous symptoms
Births with Background Don't know/ prenatal characteristic Yes No missing Total care
Age group 15-19 30.2 69.6 0.3 100.0 178 20-24 34.8 63.4 1.7 100.0 1,221 25-29 32.1 66.8 1.1 100.0 2,084 30-34 34.1 64.9 1.0 100.0 1,745 35+ 33.4 65.0 1.6 100.0 1,731
Residence Urban 37.4 61.2 1.4 100.0 3,301 Rural 29.6 69.1 1,2 100.0 3,657
Region Metro Manila 43.4 53.4 3.2 100.0 1,010 Cordillera Admin. 39.5 58.8 1.7 100.0 127 llocos 37.1 61.9 1.0 100.0 306 Cagayan Valley 41.7 56.6 1.7 100.0 192 C. Luzon 20.5 79.3 0.2 100.0 674 S. Tagalog 27.4 72.4 0.2 100.0 984 Bieol 29.0 68.8 2.2 100.0 482 W. Visayas 38.9 60.9 0.2 100.0 558 C. Visayas 31.2 68.4 0.4 100.0 560 E. Visayas 24.0 75.4 0.6 100.0 380 W. Mindanao 38.0 61.2 0.8 100.0 282 N. Mindanao 36.4 62.7 0.8 I00.0 291 S. Mindanao 38.7 60.5 0.8 100.0 449 C. Mindanao 28.9 66.0 5.2 100.0 242 ARMM 21.0 74.9 4.2 100.0 238 Caraga 54.1 45.9 0.0 100.0 185
Mother's education No education 15.7 78.6 5.7 100.0 112 Elementary 25.0 73.8 1.2 100.0 2,226 High school 31.8 66.9 1.2 100.0 2,762 College 46.6 52.2 1.3 100.0 1,859
Total 33.3 65.4 1.3 100.0 6,959
116

30
20
10
Figure 8.2 Knowledge of Dangerous Signs and Symptoms
during Pregnancy among Women Who Received Prenatal Care
Percent
Vaginal Headache/ Swollen Anemia Can't Other breeding dizziness face/hands remember
1998 NDHS
8.2 Tetanus Immunization of Pregnant Women
In many countries, neonatal tetanus is a major cause of neonatal mortality. The maternal care program recommends that women receive at least two tetanus injections during the first pregnancy. Booster injections are given 6 months later, and in order to confer lifetime immunity, two more doses are given. Information on the number of tetanus toxoid injections received by pregnant women was collected in the 1998 NDHS and is presented in Table 8.3.
Mothers of 30 percent of live births in the five years prior to the survey did not receive a tetanus injection during that pregnancy, a decline of 5 percentage points from the 1993 NDS. Tetanus toxoid coverage is lower among births to mothers 35 years and above, those of birth order 6 and over, those from ARMM, and those whose mothers have no education.
The proportion of newborns whose mothers received two or morn doses of tetanus toxoid has decreased from 42 percent in 1993 to 38 percent in 1998 while those who were given one dose of the vaccine increased from 22 percent in 1993 to 31 percent in 1998.
117

Table 8.3 Tetanus toxoid vaccinations
Percent distribution of live births in the five years preceding the survey by number of tetanus toxoid injections given to the mother during pregnancy, according to maternal and background characteristics, Philippines 1998
Number of tetanus toxoid injections
Background Two doses Don't know/ Number of characteristic
None One dose or more missing Total births
Age at birth < 20 31.0 27.2 40.5 1.2 100.0 644 20-34 28.8 31.4 38.5 1 ~3 100.0 5,756 35+ 36.9 29.1 32.8 1.1 100.0 1,167
Birth order 1 29.5 26.2 43.2 1.1 100.0 1,907 2-3 26.7 33.5 38.6 1.2 100.0 2,863 4-5 29.1 33.7 35.4 1.7 100.0 1,548 6+ 40.9 27.3 30.7 1.2 100.0 1,248
Residence Urban 30.2 31.6 37.0 1.2 100.0 3,465 Rural 30.3 29.9 38.5 1.3 100.0 4,101
Region Metro Manila 35.2 33.8 30.3 0.7 100.0 1,048 Cordillera Admin. 32.5 32.5 33.7 1.2 100.0 149 llocos 30.8 29.7 38.7 0.8 100.0 344 Cagayan Valley 31.7 28.1 39.6 0.5 100.0 242 C. Luzon 30.1 33.8 34.7 1.5 100.0 711 S. Luzon 32.7 28.2 38.7 0.5 100.0 1,078 Bicol 29.9 29.9 38.1 2.0 100.0 530 W. Visayas 20.9 29.1 49.0 1.0 100.0 585 C. Visayas 22.2 35.3 41.2 1.3 100.0 586 E. Visayas 31.2 34.7 33.4 0.6 100.0 446 W. Mindanao 31.2 21.5 44.4 2.9 100.0 304 N. Mindanao 28.9 39.0 32.1 0.0 100.0 33 l S. Mindanao 24.4 28.8 43.8 3.I 100.0 489 C. Mindanao 23.4 24.1 49.9 2.6 100.0 264 ARMM 57.6 18.4 20.4 3.6 100.0 263 Caraga 26.1 33.1 40.1 0.7 100.0 197
Mother's education No education 70.6 12.0 12.5 4.9 I00.0 169 Elementary 33.9 29.5 35.5 1.1 100.0 2,586 High school 23.4 33.3 42.3 1.0 100.0 2,913 College or higher 32.2 29.9 36.2 1.7 100.0 1,898
Total 30.3 30.7 37.8 1.3 100.0 7,566
118
8.3 Iron and Iodine Supplementation During Pregnancy
Anemia associated with pregnancy is treated by giving iron tablets to pregnant women during antenatal checkups. As shown in Table 8.4 for 75 percent of births during the five years prior to the survey mothers received iron supplements during the pregnancy. Mothers with college education, those who were residing in urban areas, and those who were pregnant for the first time were more likely to receive iron supplements during pregnancy. Regional coverage ranges from 83 percent (Western Visayas) to 38 percent (ARMM).
Iodine is provided to pregnant women to prevent mental retardation in children due to iodine deficiency. Only 57 percent of pregnant women received iodine supplements during the five years prior to the survey. Pregnant women age 20-34, those at lower parity, those who were residing in urban areas, and those with college education were more likely to be given iodine. Southern Mindanao showed the highest coverage of iodine for pregnant women (70 percent) while ARMM had the lowest (31 percent) coverage.
8.4 Delivery Assistance
Among births in the past five years, 34 percent were born in a health facility, while the remaining 66 percent were delivered either in the respondent's home, someone else's home, or in another place. Table 8.5 indicates that there does not appear to be a strong relationship between mother's age and the place of delivery. Women who have lower birth order babies, live in urban areas, have post secondary or college education, and those who made 4 or more prenatal visits are more likely than other women to have delivered in a health facility. It is interesting to note that the vast majority of births of order six or higher (86 percent) were delivered at home. Delivery at a health facility was most common in Metro Manila (72 percent), and least common in ARMM (6 percent).
Presented in Table 8.6 is information on assistance at delivery. As with prenatal care, the interviewer was instructed to record all responses if more than one person assisted during delivery. However, for purposes of this analysis, only the most highly qualified attendant is considered if there is more than one response. Virtually all of the births in the past five years were delivered with some assistance, more than half by professional health workers. Medical assistance at delivery was more common among women with lower order births, those who live in urban areas, those who have high school or higher educational, and those who had 4 or more prenatal visits. In Metro Manila, 92 percent of births were attended by a professional health worker, while in ARMM the proportion attended by professional health workers is only 16 percent.
It is interesting to note that while a high proportion (86 percent) of pregnant women go to professional health workers for prenatal checkups, only 56 percent were assisted by these professional health workers during delivery (Table 8.6). This differential is especially acute among women in ARMM where most births (82 percent) are assisted by traditional birth attendants. Pregnant women with low and no education, those residing in rural areas, and those who have had many deliveries are more likely to give birth with assistance from a traditional birth attendant.
119

Table 8.4 Iron and iodine suet)lemantation durin~ t)regnancy
Percent distribution of live births in the five years preceding the survey by whether the mother received iron tablets and iodine capsules during pregnancy, according to maternal background characteristics, Philippines 1998
Iron tablets Iodine capsules
Background Don't know/ Don't know/ Number characteristic Yes No missing Yes No missing Total of births
Age at birth <20 69.0 30.3 0.6 48.4 50.5 1.1 100.0 644 20-34 75.9 23.3 0.8 58.5 40.3 1.2 100.0 5,756 35+ 71.1 28.4 0.5 51.9 46.9 1.2 100.0 1,167
Birth order 1 80.2 19.2 0.6 58.7 40.4 0.8 100.0 1,907 2-3 78.2 21.0 0.8 60.9 37.6 1.5 100.0 2,863 4-5 69.8 29.2 1.0 54.5 44.1 1.4 100.0 1,548 6+ 63.6 35.8 0.6 46.2 52.9 0.9 100.0 1,248
Residence Urban 82.1 17.2 0.7 62.4 36.1 1.5 100.0 3,465 Rural 68.3 31.0 0.8 51.7 47.3 0.9 100.0 4,10I
Region Metro Manila 81.9 17.0 1.1 61.4 36.5 2.2 100.0 1,048 Cordillera Admin. 68.4 30.2 1.4 53.5 45.0 1.4 100.0 149 Ilocos 72.0 26.8 1.1 61.0 37.6 1.4 I00.0 344 Cagayan Valley 63.4 35.5 1.1 50.0 48.1 1.9 100.0 242 C.Luzon 74.3 25.3 0.4 57.6 41.5 0.8 100.0 711 S. Tagalog 78.5 21.5 0.0 59.6 40.1 0.3 100.0 1,078 Bicol 66.5 33.2 0.4 53.7 46.0 0.4 100.0 530 WNisayas 83.2 16.6 0.2 64.4 35.2 0.4 100.0 585 C.Visayas 78.6 20.9 0.6 52.4 46.4 1.1 100.0 586 E,Visayas 71.I 28,3 0,6 44,2 55,l 0.6 100.0 446 W.Mindanao 64.3 33.3 2.0 51.3 46.4 2.3 100.0 304 N.Mindanao 72.8 27.2 0.0 51.3 48.7 0.0 100.0 331 S.Mindanao 82.3 17.7 0.0 69.5 29.2 1.3 100.0 489 C.Mindanao 71.6 26.5 1.9 55.1 42.6 2.4 100.0 264 ARMM 38.4 57.4 4.2 30.9 65.0 4.2 100.0 263 Caraga 81.6 17.9 0.5 61.9 37.2 0.9 100.0 197
Mother's education No education 21.7 74.6 3.7 16.0 80.4 3.7 100.0 169 Elementary 62.6 36.8 0.6 45.1 54.0 0.9 100.0 2,586 High school 79.4 19.9 0.6 61.6 37.2 1.2 100.0 2,913 College or higher 88.1 11.1 0.8 68.4 30.2 1.4 100.0 1,898
Total 74.6 24.7 0.7 56.6 42.2 1.2 100.0 7,566
120

Table 8.5 Place of delivery
Percent distribution of live births in the last five years by place of delivery, according to background characteristics, Philippines 1998
Place of delivery
Number Background Health At Don't know/ of characteristic facility h o m e missing Total births
Age at birth <20 29.0 70.5 0.6 100.0 644 20-34 35.6 64.1 0.3 l(30.0 5,756 35+ 30.3 69.6 0.1 100.0 1,167
Birth order l 49.8 49.9 0.3 100.0 1,907 2-3 37.0 62.8 0.2 100.0 2,863 4-5 26.5 73.0 0.6 100.0 1,548 6+ 13.8 85.9 0.2 100.0 1,248
Residence Urban 52.1 47.7 0.2 100.0 3,465 Rural 19.2 80.4 0.4 100.0 4,101
Region Metro Manila 72.4 27.6 0.0 100.0 1,048 Cordillera Admin. 33.0 66.5 0.5 100.0 149 llocos 26.8 72.9 0.3 100.0 344 Cagayan Valley 19.7 80.1 0.3 100.0 242 C. Luzon 49.1 50.7 0.2 100.0 711 S. Luzon 34.0 66.0 0.0 100.0 1,078 Bicol 19.6 80.0 0.4 100.0 530 W. Visayas 32.0 67.8 0.2 100.0 585 C. Visayas 26.7 72.4 0.9 100.0 586 E. Visayas 17.0 82.6 0.3 100.0 446 W. Mindanao 18.5 80.8 0.7 100.0 304 N. Mindanao 20.0 79.7 0.4 100.0 331 S. Mindanao 33.6 66.2 0.2 100.0 489 C. Mindanao 21.7 77.8 0.5 100.0 264 ARMM 6.3 92.6 0.9 100.0 263 Caraga 22.0 77.8 0.2 100.0 197
Mother's education No education 4.7 94.7 0.6 100.0 169 Elementary 12.6 87.2 0.2 100.0 2,586 High school 33.3 66.3 0.4 100.0 2,913 College or higher 67.7 32.1 0.2 100.0 1,898
Prenatal visits during pregnancy None 9.9 89.9 0.2 100.0 589 1-3 visits 17.1 82.9 0.0 100.0 2,277 4+ visits 45.9 54.0 0.1 100.0 4,640
Total 34.2 65.5 0.3 100.0 7,566
121

Table 8.6 Assistance durin~ delivery
Percent distribution of live births in the last five years by type of assistance during delivery, according to background characteristics, Philippines 1998
Assistance during delivery
Traditional Don't Number Background Nurse/ birth Relative/ know/ of characteristic Doctor midwife attendant other No one missing Total births
Age at birth <20 26.0 25.1 46.4 2.2 0.0 0.2 100.0 644 20-34 31.9 26.8 39.1 1.8 0.2 0.3 100.0 5,756 35+ 28.5 19.4 49.2 2.4 0.3 0.0 100.0 1,167
Birth order 1 45.7 25.2 28.2 0.8 0.0 0.1 100.0 1,907 2-3 33.0 28.7 36.3 1.8 0.1 0.2 100.0 2,863 4-5 24.1 24.8 48.6 1.8 0.3 0.4 100.0 1,548 6+ 11.9 19.5 63.8 4.1 0.4 0.2 100.0 1,248
Residence Urban 47.6 30.9 20.7 0.5 0.I 0.2 100.0 3,465 Rural I6.8 20.9 58.7 3.0 0.2 0.3 100.0 4,101
Region Metro Manila 64.1 27.4 7.8 0.7 0.0 0.0 100.0 1,048 Cordillera Admin. 28.5 19.6 16~3 33.5 1.7 0.5 100.0 149 Ilocos 25.4 41.0 33.3 0.0 0.0 0.3 100.0 344 Cagayan Valley 18.6 23.5 49.2 8.5 0.0 0.3 100.0 242 C. Luzon 45.7 38.6 15.4 0.0 0.0 0.2 100.0 711 S. Luzon 33.1 26.7 39.9 0.3 0.0 0.0 100.0 1,078 Bieol 14.3 29.9 55.1 0.4 0.0 0.4 100.0 530 W. Visayas 28.7 19.4 50.8 0.8 0.0 0.2 100.0 585 C. Visayas 23.7 32.0 44.0 0.2 0.0 0.2 100.0 586 E. Visayas 16.1 11.6 70.3 1.1 0.6 0.3 100.0 446 W. Mindanao 15.9 23.7 55.2 4.3 0.2 0.7 I00.0 304 N. Mindanao 20.0 14.6 61.0 4.3 0.2 0.0 100.0 331 S. Mindanao 27.6 19.4 48.8 3.3 0.8 0.2 100.0 489 C. Mindanao 20.3 22.7 55.1 0.9 0.5 0.5 100.0 264 ARMM 3.4 12.1 81.9 0.7 0.5 1.3 100.0 263 Caraga 21.8 18.4 58.5 1.1 0.0 0.2 100.0 197
Mother's education No education 4.5 4.9 75.5 11.4 3.1 0.6 100.0 169 Elementary 10.6 19.7 66.0 3.2 0.2 0.3 100.0 2,586 High school 29.2 34.2 35.2 1.1 0.0 0.2 100.0 2,913 College or higher 63.5 21.9 14.0 0.5 0.0 0.1 100.0 1,898
Prenatal visits during pregnancy
None 8.6 15.0 67.8 7.8 0.8 0.0 100.0 589 1-3 visits 14.6 24.2 57.9 3.0 0.2 0.1 100.0 2,277 4+ visits 41.9 27.7 29.8 0.6 0.0 0.0 100.0 4,640
Total 30.9 25.5 41.3 1.9 0.2 0.2 100.0 7,566
Note: Figures are for births in the period 1-59 months prior to the survey. If the respondent mentioned more than one attendant, only the most qualified attendant is considered.
122

The 1998 NDHS data shows that of the 7,566 births in the five years preceding the survey, 21 percent were to mothers who had complications during delivery (Figure 8.3). Prolonged labor was the most common complication (17 percent) followed by excessive bleeding (7 percent), vaginal infection (2 percent), and convulsions (1 percent). Prevalence of prolonged labor appears to have increased slightly from the 15 percent found in the 1993 Philippine National Safe Motherhood Survey (PNSMS) (NSO and MI, 1994:53). The occurrence of excessive bleeding and convulsions decreased slightly over the same time period.
100
90
80
70
60
50
40
30
20
10
0
Percent
17
Figure 8.3 Percentage of Live Births with Complications During Delivery
2 1
Prolonged Excessive Vaginal Convulsions labor bleeding infection
COMPLICATION
79
Other
1998 NDHS
Table 8.7 shows that about 6 percent of births in the Philippines are born by caesarean section. This constitutes 1 in 6 of all deliveries in a health facility. As expected, caesarean sections are more common among urban than rural births (9 vs. 3 percent, respectively). They are also more common in Central Luzon (13 percent) and Metro Manila (9 percent) and least common in ARMM (less than 1 percent). Table 8.8 indicates that the most common reason for caesarean section is a big baby followed by prolonged labor and breech delivery.
123

Table 8.7 Delivery characteristics
Percent distribution of live births in the last five years by whether the delivery was by caesarean section, birth weight, and the mother's estimate of baby's size at birth, Philippines 1998
Birth weight Size of child at birth
Delivery Less 2.5 kg Don't Smaller Average Don't Number Background by than or know/ Very than or know/ of characteristic caesarean 2.5 kg more missing small average larger missing births
section
Age at birth < 20 2.3 9.5 41.7 48.8 6.6 14.6 78.2 0.6 644 20-34 5.9 9.7 51.9 38.4 5.4 12.7 81,4 0.5 5,756 35+ 6.5 9.2 43.7 47.1 7.1 12.0 80.4 0.5 1,167
Birth order 1 8.7 11.9 59.8 28.3 5.7 13.5 80.5 0.3 1,907 2-3 6.7 9.5 54.3 36.3 5.1 12.6 81.8 0.5 2,863 4-5 2.9 8.3 44.3 47.4 6.0 12.9 80.4 0.7 1,548 6+ 1.9 8.0 30.8 61.2 7.1 11.8 80.5 0.7 1,248
Residence Urban 8.9 11.5 66.2 22.2 5.1 12.2 82.5 0.2 3,465 Rural 2.9 8.0 35.8 56.2 6.4 13.3 79.5 0.7 4,101
Region Metro Manila 8.7 12.3 73.5 14.3 4.9 12.1 83.0 0.0 1,048 Cordillera Admin. 4.7 9.2 33. 0 57.8 11.1 19.1 69.3 0.5 149 llocos 5.6 7.1 41.2 51.7 5.1 16.1 78.0 0.8 344 Cagayan Valley 4.1 4.6 38.0 57.4 4.4 10.7 84.7 0.3 242 C. Luzon 12.7 9.2 62.8 28.0 4.8 9.2 85.4 0.6 711 S. Tagalog 6.9 9.2 56.0 34.8 2.4 10.5 86.7 0.3 1,078 Bicol 2.5 10.9 34.0 55.1 8.0 11.9 79.0 1.1 530 W. Visayas 4.9 12.1 40.9 47.0 4.7 13.0 82.2 0.2 585 C. Visayas 2.3 12.6 50.8 36.7 8.8 19.4 71.6 0.2 586 E. Visayas 2.1 8.5 33.9 57.6 9.5 13.0 77.2 0.3 446 W. Mindanao 2.7 7.3 35.1 57.5 7.5 15.2 75.6 1.6 304 N. Mindanao 2.4 6.0 48.I 45.9 7.6 11.9 79.5 0.9 331 S. Mindanao 7.3 10.6 56.0 33.4 7.7 ' 15.2 76.8 0.4 489 C. Mindanao 4.7 5.9 42.1 52.0 6.1 10.9 82.3 0.7 264 ARMM 0.7 4.5 15.0 80.5 2.9 8.8 87.0 1.3 263 Caraga 2.5 11.6 51.9 36.5 3.9 13.6 82.3 0.2 197
Mother's education No education 0.6 2.1 7.9 90.0 5.2 18.3 75.6 0.9 169 Elementary 1.7 8.1 28.9 63.0 7.1 14.2 78.2 0.6 2,586 High school 4.3 11.0 54.2 34.8 5.9 13.6 80.0 0.5 2,913 College or higher 13.5 10.1 75.1 14.8 3.9 9.0 86.7 0.3 1,898
Total 5.7 9.6 49.8 40.6 5.8 12.7 81.0 0.5 7,566
124

Information on the baby's birth weight was also obtained in the 1998 NDHS. Table 8.7 shows that among children born in the five years prior to the survey, 41 percent had weights unknown to mothers. Ten percent of all births, or 16 percent of those who were weighed, were reported to weigh less than what is considered normal birth weight (2,500 grams). Mothers were also asked for their own objective assessment of whether the baby's birth size was very large, larger than average, average, smaller than average, or very small. According to mothers' reports, 19 percent of births in the past five years were smaller than average or very small at birth.
Table 8.8 Reasons for caesarean section
Percent distribution of caesarean births in the five years before the survey by reason for the operation, Philippines 1998
Reason for caesarean section Percent
Preeclampsia 6.3 Eclampsia 2.7 Baby too big 34.3 Breach 12.3 Fetal distress 7.1 Prolong labor 12.1 Excessive discharge 3.7 Excessive bleeding 2.2 Other 14.5 Missing 4.9
Total 100.0 Number 411
8.5 Postnatal Care
The delivery of postnatal care services is aimed at preventing the occurrence of maternal and infant morbidity and mortality in the country. The mother's background characteristic and the providers of good quality postnatal care contribute greatly in the success of this goal. The 1998 NDHS results (Table 8.9 and Figure 8.4) show that 3 in 5 postpartum mothers (59 percent) receive examinations after delivery. Mothers who have delivered for the first time, those who reside in urban areas and those who have some college education are more likely to consult a doctor for a checkup after delivery. Traditional birth attendants are the major care givers postnatal in the rural areas and among the uneducated mothers. Those mothers who never consult a health worker for a prenatal checkup are least likely to consult health workers for postnatal care services. While in Metro Manila 51 percent of postpartum mothers consult doctors, 59 percent of mothers in ARMM rely on the traditional birth attendants for post delivery care.
125

Table 8.9 Postnatal care
Percent distribution of live births in the last five years by source of postnatal care during delivery, according to maternal and background characteristics, Philippines 1998
Postnatal cam provider
Traditional Number Background birth Relative/ No one/ of characteristic Doctor Nurse Midwife attendant friend Other missing Total births
Age at birth <20 17.3 1.1 13.9 21.3 0.0 0.0 46.4 100.0 644 20-34 24.4 1.2 17.2 16.4 0.0 0.1 40.6 100.0 5,756 35+ 22.2 0.8 15.4 18.8 0.0 0.2 42.5 I00.0 1,167
Birth order 1 33.7 1.6 14.8 13.1 0.0 0.0 36.8 100.0 1,907 2-3 26.0 1.0 18.5 15.7 0.0 0.1 38.8 100.0 2,863 4-5 17.5 1.4 17.3 19.7 0.0 0.1 44.0 100.0 1,548 6+ 9.5 0.7 I4.6 23.8 0.1 0.3 51.1 100.0 1,248
Residence Urban 36.8 1.8 16.9 10.4 0.0 0.1 34.1 100.0 3,465 Rural 12.2 0.7 16.5 22.9 0.0 0.2 47.6 100.0 4,101
Region Metro Manila 50.9 3.4 11.6 6.9 0.0 0.0 27.3 100.0 1,048 Cordillera Admin. 17.0 2.4 10.4 0.0 0.0 0.0 70.3 i00.0 149 llocos 20.1 0.8 13.3 10.5 0.5 0.0 55.4 100.0 344 Cagayan Valley 15.3 0.5 22.4 12.6 0.0 0.0 48.6 100.0 242 C. Luzon 33.0 1.0 25.1 9.8 0.0 0.0 31.1 100.0 711 S. Luzon 28.0 1.2 28.2 11.4 0.0 0.0 31.2 100.0 1,078 Bicol 11.1 0.7 18.4 25.7 0.0 0.4 43,9 100.0 530 W. Visayas 20.4 0.2 9.3 17.4 0.0 0.0 52.6 I00.0 585 C. Visayas 14.8 0.8 22.4 18.8 0.0 0.0 43.2 100.0 586 E. Visayas 7.4 0.2 6.6 21.1 0.0 0.0 64.8 100.0 446 W. Mindanao I3.1 2.3 21.5 33.7 0.0 0.5 28.9 100.0 304 N. Mindanao 10.6 0.6 7.1 20.1 0.0 0.6 61.0 100.0 331 S. Mindanao 25.7 0.0 11.9 25.3 0.0 0.6 36.5 100.0 489 C. Mindanao 12.8 0.2 11.3 12.3 0.0 0.2 63.1 100.0 264 ARMM 4.7 1.1 7.6 59.0 0.0 0.0 27.6 100.0 263 Caraga 14.5 0.7 I7.2 24.0 0.0 0.0 43.5 100.0 197
Mother's education No education 0.9 0.4 3.4 43.5 0.0 0.6 51.2 100.0 169 Elementary 7.1 0.8 15.2 26.7 0.1 0.2 50.0 100.0 2,586 High school 19.9 1.0 22.3 14.1 0.0 0.1 42.6 100.0 2,913 College or higher 53.2 1.9 11.2 6.8 0.0 0.0 26.9 100.0 1,898
Prenatal visits during pregnancy
None 3.7 0.0 5.4 12.3 0.0 0.3 78.2 100.0 589 1-3 visits 8.7 0.9 14.3 23.8 0.0 0.2 52.1 100.0 2,277 4+ visits 33.3 1.5 19.4 14.4 0.0 0.0 31.4 100.0 4,640
Total 23,5 1,2 16,7 17,2 0,0 0,1 4t,4 100,0 7,566
Note: Figures are for births in the period 1-59 months prior to the survey. If the mspondant mentioned more than one attendant, only the most qualified attendant is considered.
126

Figure 8.4 Distribution of Live Births by Source of Postnatal Care
No one
~al birth idant r%
Midwife 17%
DOCtOr 24%
1%
1998NDH$
The majority of mothers received postnatal care during the first 2 weeks after delivery, while only 13 percent visited more than 28 days after delivery (Table 8.9a). Details of health services received during the postnatal care are enumerated in Table 8.10. It is interesting to note that services rendered during the postnatal visit are mainly focused on baby care and to a lesser extent on abdominal examination of the mother.
Table 8.9a Timing of postnatal care
Among live births in the five years preceding the survey for which postnatal care was received, percent distribution by timing of the postnatal care, Philippines, 1998
Timing of visit Percent
0-6 days 42.7 7-13 days 29.0 14-20 days 11.1 21-27 days 3.6 28-34 days 9.8 35-41 days 0.5 42-48 days 0.6 49 days or more 2.0 Don't know/mlssing 0.7
Total 100.0 Number of births 4,435
127

Table 8.10 Postnatal care services
Among live births in the five years preceding the survey for which postnatal care was received, percentage receiving specific services during postnatal checkup, Philippines, 1998
Services received
Don't know/ Type of service Yes No missing Total
Abdominal exam 73.5 26.0 0.5 100.0 Breast exam 41.0 58.3 0.6 100.0 Internal exam 37.5 61.8 0.7 100.0 Family planning advice 44.5 54.6 0.9 100.0 Breastfeeding advice 69.3 30.0 0.7 100.0 Baby care advice 72.9 26.5 0.6 100.0 Checkup of baby 79.2 20.3 0.5 100.0
8.6 Maternal Mortality
Although the level of maternal mortality is generally considered to be one of the most important indicators of a nations health, reliable data are extremely difficult to obtain. Even in countries with relatively complete vital registration systems, maternal deaths are often underreported or misclassified as non-maternal (WHO and UNICEF, 1997:3). Household surveys offer an alternative data collection mechanism; however, surveys may also suffer from underreporting and misclassification. In addition, they require large sample sizes in order to provide reliable estimates even at the national level. This is because, even where levels of maternal mortality are high, the actual number of maternal deaths is likely to be relatively small (WHO and UNICEF, 1997:4). For these reasons, estimates of maternal mortality rates and ratios must be interpreted cautiously.
Data were collected in the NDHS that allow direct estimation of maternal mortality rates and ratios. The procedure used is the direct method modification of the so-called "A Sisterhood-approach" in which respondents are asked about the survivorship of all live births of their natural mother (siblings). A description of the methodology used is presented in Appendix C along with a discussion of various measures of data quality and results.
The results confirm the finding from the 1993 NDS that the maternal mortality ratio in the Philippines is approximately 200 per 100,000 live births. Because the ratio from the 1998 survey--172 per 100,000 births for the period approximately 1991-1997--is lower than the level of 209 estimated from the 1993 NDS for the period 1987-1993, it is tempting to conclude that there has been a decline in the maternal mortality in the Philippines in recent years. Such a conclusion is not possible, however, due to the large sampling errors associated with these estimates (Stanton etal., 1997:44). Analysis of sampling errors suggest that the 95 percent confidence limits around these estimates are on the order of 30 percent, meaning that the true estimate of the maternal mortality ratio for 1991-97 lies somewhere between 120 and 224, which clearly encompasses the former estimate of 209. The fact that just a few additional maternal deaths reported or omitted can radically change the maternal mortality ratio limits the usefulness of the methodology in measuring change in maternal mortality ratios over short periods of time.
128

Another indicator of maternal mortality is the proportion of deaths due to maternal causes. In the 1998 NDHS, maternal deaths represent approximately 14 percent of all deaths to women aged 15-49. Another useful indicator is the lifetime risk of dying of maternal causes. Based on the 1998 data, it appears that Filipino women face a 1 in 100 chance of dying of maternal causes in their lifetime.
8.7 Immunizat ion of Children
To assist in the evaluation of the Expanded Program on Immunization (EPI), the 1998 NDHS collected information on immunization coverage for all children born in the five years prior to the survey. For each child, the mother was asked if she had a health card for the child, and, if so, the interviewer asked to see it. When a mother was able to show the health card to the interviewer, the dates of vaccinations were copied from the card to the questionnaire. If the child had never received a health card, or the mother was unable to show the card to the interviewer, the mother was asked whether the child had received vaccinations against specific diseases, namely, tuberculosis (BCG), measles, diphtheria, pertussis, tetanus (DPT), and polio.
Shown in Table 8.11 is the overall vaccination coverage for children age 12-23 months according to the source of the data used for determining the coverage. Data were obtained from health cards for only 41 percent of children vaccinated; for the remaining children the immunization coverage information is based on their mother's report. Overall, 73 percent of children are considered completely immunized, meaning that they received all of the basic vaccines. This is slightly higher than the 72 percent found in the 1993 NDS. The coverage rate is highest for BCG and the first doses of DPT and polio (around 91 percent). The dropout rate I measured by the difference in coverage between the first and third doses is 10 percent for DPT and 11 percent for polio. These are slightly lower than the 1993 NDS dropout rates of 12 and 14 percent, respectively.
Table 8.11 Vaccination by source of information
Percentage of children 12-23 months of age who have received specific vaccines at any time before the • interview and before 12 months of age, according to whether the information is from the vaccination card or from the mother, Philippines 1998
Percentage of children who received: Number
Background DPT Polio of characteristic BCG 1 2 3+ 1 2 3+ Measles All I None children
Vaccinated at any rime before the survey Vaccination card 40.6 41.0 39.7 37.8 41.3 40.1 38.2 34.9 33.8 0.0 610 Mother's report 50.1 49.3 47.3 43.0 50.4 48.0 43.5 44.0 39.0 7.7 864 Either source 90.8 90.3 87.0 80.9 91.7 88.1 81.7 78.9 72.8 7.7 1,474
Vaccinated by 12 months of age 90.6 90.1 86.7 78.7 91.5 87.8 80.6 70.9 65.3 7.9 1,474 Note: For children whose information was based on the mothetJs report, the proportion of vaccinations given during the first year of life was assumed to be the same as for children with a written record of vaccination. tChildren who are fully vaccinated (i.e., those who have lxceived BCG, measles and three doses of DPT and polio).
1 Dropout rate (dosel-dose 3)/dose 1"100
129

An important aim of the EPI program is that basic vaccines--namely BCG, measles, and 3 doses each of DPT and polio vaccines be given before the child reaches the first birthday. A child is considered fully immunized if given these basic vaccines during this period. Immunization coverage for the first 12 months is also reported in Table 8.11. Based on information obtained from the health cards and from mothers' reports, 65 percent are considered fully immunized. This is 3 percentage points higher than in 1993 (62 percent) (NSO and MI, 1994: 100).
Differentials in immunization coverage among children 12-23 months by background characteristics are presented in Table 8.12 and Figure 8.5. The rates are based on both health cards and mother's report. Coverage varies only slightly by the sex of the child; however, thc rates have a strong negative association with birth order, and a very strong positive association with mother's education. Urban children are somewhat more likely than rural children to be fully immunized. ARMM has consistently shown low coverage for all vaccines as well as for the presence of vaccination cards.
Figure 8.5 Vaccination Coverage among Children 12-23 Months
100
80
60
40
20
0
Percent
1 2-3 4-5 6+
B I R T H O R D E R
Urban Rural
R E S I D E N C E
] 82 I
No edu- Elemen- High College cation tary school or
higher
M O T H E R ' S E D U C A T I O N
1998 NDHS
130

Table 8.12 Vaccinations by background characteristics
Percentage of children 12-23 months who had received specific vaccines by the time of the survey (according to the vaccination card or the mother's report) and the percentage with a vaccination card by background characteristics, Philippines 1998
Percentage of children who received: Percent- Number
Background DPT Polio age with of characteristic BCG 1 2 3+ 1 2 3+ Measles All None a card children
Child's sex Male 89,4 89 ,2 85 ,7 79,9 90,4 86 ,4 80,5 78,8 71,9 9,1 41,8 762 Female 92.1 91 .4 88.3 81.9 93.0 89 .8 83.0 79.0 73.8 6.2 40.9 712
Birth order 1 95.5 95.2 93 .0 86.2 96.3 93.1 87.5 82.9 76.4 3.2 46.4 399 2-3 90.8 90 .9 87 .7 82.3 91.8 88.1 82.3 79.8 74.2 7.8 39.7 553 4-5 89.4 89 .8 86 .0 79.3 91.4 87.3 80.5 78.2 72.2 8.6 35.8 296 6+ 84.0 80.7 75 .7 69.9 83.6 79 .9 71.9 70.6 63.9 14.2 43.9 227
Residence Urban 95.0 94 .8 92 .0 85.5 95.8 92 .2 85.5 82.2 76.1 3.8 42.1 700 Rural 86.9 86 .2 82 .4 76.7 88.0 84.3 78.4 75.9 69.8 11.2 40.8 775
Region Metro Manila 95.0 95.0 93.3 84.9 96.6 94.1 84.0 81.5 73.1 3.4 37.0 225 CordilleraAdmin. 90 .4 90.4 83.1 80.7 90.4 86 .7 81.9 80.7 75.9 7.2 36.1 29 Ilocos 85.9 85 .9 78 .9 69.0 85.9 78 .9 71.8 70.4 60.6 14.1 28.2 69 C. Valley 87.0 87.0 85.5 82.6 88.4 88.4 82.6 84.1 82.6 11.6 29.0 46 C. Luzon 97.9 96 .8 95 .7 81.9 98.9 94 .7 86.2 84.0 75.5 1.1 35.1 139 S. Tagalog 89.8 87 .6 85 .4 81.0 89.8 86.1 82.5 73.0 70.8 9.5 35.8 222 Bicol 87.4 88 .4 80.0 74.7 90.5 80.0 74.7 74.7 68.4 9.5 48.4 90 W. Visayas 96.7 95 .6 90 .0 86.7 97.8 93 .3 87.8 93.3 86.7 2.2 62.2 107 C. Visayas 93.7 95 .5 93.7 90.i 94.6 93.7 87.4 86.5 77.5 4.5 59.5 122 E. Visayas 82.5 83.3 77 .5 71.7 85.8 81 .7 75.0 71.7 62.5 12.5 46.7 86 W. Mindanao 81.4 80 .4 76 .5 71.6 81.4 77 .5 73.5 74.5 69.6 18.6 33.3 56 N. Mindanao 94.2 95 .2 92 .3 87.5 96.2 95 .2 87.5 76.9 74.0 3.8 36.5 64 S. Mindanao 96.6 96 .6 95 .4 92.0 96.6 95 .4 92.0 83.9 82.8 3.4 57.5 82 C. Mindanao 87.8 86.5 79 .7 77.0 86.5 83 .8 78.4 77.0 71.6 12.2 32.4 46 ARMM 65.1 59 .6 56 .9 50.5 59.6 56 .9 50.5 50.5 46.8 33.9 22.0 52 Caraga 93.3 93 .3 91 .0 85.4 98.9 92.1 87.6 87.6 78.7 1.1 43.8 40
Mother's education No education 49.0 46 .8 41.4 36.4 44.6 43 .0 38.0 32.1 32.1 47.3 27.6 22 Elementary 84.7 82 .6 78.2 70.0 86.2 80 .7 72.9 70.7 62.5 12.9 42.3 470 High school 93.4 93 .8 91 .3 85.0 94.6 92 .0 85.6 81.6 76.4 5.2 43.8 581 College or higher 96.2 96 .5 93.4 90.0 96.5 93 .5 88.8 87.2 81.9 3.0 37.7 402
Total 90.8 90 .3 87 .0 80~9 91.7 88.1 81.7 78.9 72.8 7.7 41.4 1,474
Among the children who did not receive all the basic immunizations in the first year of life, the reasons for non-immunization are given in Table 8.13 The major obstacles to completing the basic immunization regime appears to be the inconvenience of gett ing to a health facility or f inding the time to take the child to the clinic.
131

Table 8.13 Reasons for non-immunization
Percentage of children 12-23 months who did not receive all basic immunization in the first year of life by reasons for non-immunization, Philippines 1998
Reason Percent
Unaware of need for immunization 4.3 Unaware of need to return for second or third dose 2.2 Fear of side effects, wrong ideas about contraindieations 9.2 Postponed until another time 6.9 No faith in immunization 5.5 Rumors 1.3 Place of immunization too far 15.5 Time for immunization inconvenient 2.6 Vaccinator absent 2.0 Mother too busy 13.2 Family problem, including illness of mother 1.3 Child ill - not brought 9.9 Child ill - brought but not given immunization 1.8 Long waiting time 1.0 Other 10.5 No reason given 29.7
Number of children 289
8.8 Prevalence of Acute Respiratory Infection and Fever
Acute respiratory infection is still the leading cause of death among children under 5. The 1998 NDHS results show that 13 percent of children under 5 had cough with rapid breathing in the two weeks prior to the survey (Table 8.14). Children 12 to 23 months, children of birth order 6 or higher, and children in rural areas are slightly more likely to have been reported to have respiratory problems. High levels of cough with rapid breathing are found in CAR.
Among children who were ill with cough and rapid breathing, 58 percent were taken to a health facility. The percentage of children who were taken to a health facility is higher for younger children, those of lower birth order, those in urban areas, and those whose mothers have more education.
Various infectious diseases are accompanied by fever. In the Philippines, the most common diseases with fever are measles, respiratory infections, typhoid, and dengue. Information about the prevalence of fever among children under five was collected in the survey although the cause was not investigated. Table 8.14 provides information on the presence of fever and cough accompanied by rapid breathing. Overall, one in four children under five had fever in the two weeks prior to the survey. Variations in the percentage of children with fever are generally small across subgroups; the highest levels, one-third or more, are found among children aged 6-23 months. Prevalence of fever ranges from 17 percent of children under five in ARMM to 32 percent of those in CAR.
132

Table 8.t4 Prevalence of acute resoiratorv infection
Percentage of children under five years of age who were ill with a cough with rapid breathing (AR1) and the percentage who were ili with fever during the two weeks before the survey, by socioeconomic and demographic characteristics, Philippines 1998
Children with Children with Children Number Background cough and rapid ARI taken to a with of characteristic breathing (ARI) health facility fever children
Child's age Under 6 months 10.8 62.3 20.8 736 6-11 months 14.2 75.2 39.7 759 12-23 months 18.1 60.0 33.9 1,474 24-35 months 14.9 51.7 24.6 1,446 36-47 months 11.8 52.7 20.5 1,415 48-59 months 8.8 53.1 19.8 1,455
Child's sex Male 13.5 60.9 26.1 3,821 Female 13.0 54.4 25.7 3,463
Birth order 1 11.7 66.5 24.2 1,851 2-3 12.9 61.1 25.5 2,768 4-5 12.9 54.2 26.4 1,485 6+ 17.1 46.4 28.9 1,181
Residence Urban 11.7 64.5 24.9 3,359 Rural 14.6 53.3 26.7 3,926
Region Metro Manila 12.4 70.1 23.2 1,020 Cordillera Admin. 25.6 64.4 32.4 143 Iloeos 13.2 64.4 21.9 332 Cagayan Valley 21.9 55.8 27.4 232 C. Luzon 14.1 53.8 28.1 686 S. Tagalog 11.5 59.5 28.8 1,044 Bicol 15.1 53.1 30.5 505 W. Visayas 13.9 46.3 26.8 571 C. Visayas 7.5 66.7 22.8 573 E. Visayas 20.2 51.7 28.6 418 W. Mindanao 11.7 59.7 20.9 290 N. Mindanao 10.3 67.9 20.5 319 S. Mindanao 15.8 57.0 31.9 469 C. Mindanao 8.6 54.3 23.9 253 ARMM 5.0 38.5 16.8 246 Caraga 17.9 47.3 22.3 184
Mother's edncation No education 12.6 56.9 18.6 152 Elementary 15.6 46.7 28.6 2,448 High school 13.1 66.7 26.2 2,820 College or higher 10.5 63.1 22.5 1,866
Total 13.3 57.9 25.9 7,286
133

8.9 Diarrheal Diseases
Mothers with children under five years of age were asked if their children had diarrhea at any time in the two weeks prior to the interview and if they had diarrhea in the past 24 hours. Mothers were also asked about any action taken to treat their children. The 1998 NDHS data indicate that 1 in 14 children under five was reported as having diarrhea during the 2-week period before the survey, and less than 1 percent had bloody diarrhea in that period (Table 8.15). A slight decline in the prevalence of diarrhea is noted since 1993, from 10 to 7 percent.
The prevalence of diarrhea generally varies only slightly by background characteristics. The most significant variation is by age and region. Prevalence is somewhat higher for children 6-23 months than for younger or older children. Considering regional variations, Table 8.15 shows that the prevalence of diarrhea is higher in Eastern Visayas and CAR than in other regions.
8.10 Treatment of Diarrhea with Oral Rehydration Therapy
The level of knowledge of ORS (prepackaged oral rehydrafton salts) to treat diarrhea is shown in Table 8.16. In the1998 NDHS, a mother is classified as knowing about ORS if she reported using ORS packets to treat one of her children for diarrhea in the two-week period prior to the survey, or if she has ever seen or heard of ORS packets.
A large majority of mothers (93 percent) know about ORS packets. There are significant variations in the levels of ORS knowledge by age, region, and education; teenage mothers, mothers with no education, and those in ARMM are the least likely to know about ORS packets. Knowledge is over 30 percentage points higher among educated mothers than mothers with no education.
It is encouraging to note that almost three-quarters of Filipino mothers know that children with diarrhea should be given more to drink than usual. Fourteen percent say such children should be given the same amount to drink, while 13 percent say they should be given less to drink, a practice that could result in increased dehydration of the child. Half of mothers of young children believe that children with diarrhea should receive less to eat than usual, while 28 percent believe children should be given the same amount and 24 percent believe children should be given more to eat.
134

Table 8.15 Diarrhea prevalence
Percentage of children under five years of age who had diarrhea and bloody diarrhea in the two weeks preceding the survey, and the percentage with diarrhea in the 24 hours before the survey, by selected background characteristics, Philippines 1998
Diarrhea in the preceding 2 weeks
Background Diarrhea in Number of characteristic All diarrhea I preceding 24 hours children
Child's age Under 6 months 6.2 0.1 736 6-11 months 13.9 1.6 759 12-23 months 13.4 0.4 1,474 24-35 months 5.9 0.8 1,446 36-47 months 3.7 0.4 1,415 48-59 months 3.6 0.3 1,455
Child's sex Male 7.7 0.7 3,823 Female 7.1 0.3 3,463
Birth order 1 7,2 0.4 1,851 2-3 7.3 0.6 2,768 4-5 7.1 0.4 1,486 6+ 8.5 0.7 1,181
Region Metro Manila 5.6 0.6 1,020 Cordillera Admin. 12.0 0.7 143 llocos 6.7 0.3 332 Cagayan Valley 9.1 0.6 232 C. Luzon 5.8 0.4 686 S. Tagalog 7.0 0.5 1,044 Bicol 7.7 0.2 505 W. Visayas 9.1 0.2 571 C. Visayas 5.8 0.2 573 E. Visayas 13.0 1.2 418 W. Mindanao 7.1 0.8 290 N. Mindanao 5.2 0.8 319 S. Mindanao 9.0 1.2 469 C. Mindanao 8.6 0.5 253 ARMM 6.2 0.2 246 Caraga 7.3 0.7 184
Mother's edueafioa No education 6.5 0.0 152 Elementary 8.4 0.6 2,448 High school 7.3 0.6 2,820 Collegeor higher 6.4 0.4 1,866
Total 7.4 0.5 7,286
qncludes diarrhea in the preceding 24 hours
135

Table 8.16 Knowledge of diarrhea care
Percentage of mothers with births in the last five years who know about ORS packets and appropriate feeding graetices during diarrhea, according to demographic and background characteristics, Philippines 1998
Appropriate feeding practices during diarrhea Percentage
who Fluids Solid foods know about Reduced Same Increased Don't Reduced Same Increased Don't Number
Background ORS fluid amount fluid know/ food amount food know/ of characteristic packets intake of fluid intake missing intake of food intake missing women
Age group 15-19 81.6 19.3 18.3 59,2 3.3 41.3 31.6 24.3 2.9 160 20-24 91.4 16.3 12.9 70,4 0.4 44.5 28.1 26.5 0.9 855 25-29 93.1 11.0 14.1 73,7 1.2 46.9 27.5 24.5 1.1 1,378 30-34 94.6 10.6 16.0 73.0 0.4 47.5 29.4 22.9 0.2 1,211 35+ 92.0 13.0 12.5 74.2 0.3 50.9 26.9 21.6 0.5 1,363
Residence Urban 93.4 9.4 13.1 76.9 0.6 49.7 27.9 21.8 0.6 2,380 Rural 91.7 15.6 15.0 68.7 0.8 45.6 28.2 25.3 0.9 2,588
Region Metro Manila 92.0 4.7 14.0 80.6 0.8 55.8 23.3 20.2 0.8 732 Cordillera Admin. 97.3 I0.5 12.8 75.9 0.8 31.1 28.8 38.9 1.2 90 nocos 90.4 26.8 21.5 51.3 0.4 53.9 25.0 21.1 0.0 221 C. Valley 92.5 20.5 16.4 6L2 1.9 41.8 30.6 26.1 1.5 177 C. Luzon 94.2 10.3 7.6 81.8 0.3 54.8 20.3 23.9 0.9 490 S. Tagalog 90.5 3.5 6.2 89.8 0.5 46.1 25.9 27.8 0.2 701 Bicol 95.6 16.0 16.0 66.8 1.2 49.6 25.4 25.6 1.5 324 W. Visayas 97.3 6.9 11.7 80.8 0.6 43.1 35.5 20.8 0.6 393 C. Visayas 95.1 15.4 14.0 70.3 0.3 52.6 32.8 14.0 0.6 379 E. Visayas 96.5 16.8 14.4 68.8 0.0 39.3 31.2 29.3 0.3 265 W. Mindanao 87.0 26.1 17.3 55.1 1.6 50.3 25.0 23.4 1.3 205 N. Mindanao 96.6 18.2 18.8 62.0 0.9 39.2 28.6 31.8 0.3 200 S. Mindanao 90.4 16.4 18.7 64.6 0.3 43.6 36.3 19.3 0.8 332 C. Mindanao 93.8 15.6 23.6 60.1 0.7 31.5 35.9 31.9 0.7 172 ARMM 71.6 23.7 22.8 50.9 2.7 42.5 29.9 24.6 3.0 159 Caraga 93.7 17.4 20.9 61.7 0.0 46.3 30.3 23.3 0.0 128
Mother's education No education 57.9 27.1 18.8 50.9 3.2 46.2 25.4 24.7 3.7 101 Elementary 91.5 15.9 16.1 67.5 0.7 47.5 29.1 22.7 0.7 1,598 High school 94.2 11.7 13.4 74.3 0.6 48.4 26.5 24.7 0.5 1,920 College or higher 93.9 9.0 12.2 78.1 0.7 46.6 29.2 23.3 0.9 1,349
Total 92.5 12.6 14.1 72.6 0.7 47.5 28.0 23.7 0.8 4,968
ORS = Oral rehydration salts
136

Table 8.17 examines in detail the treatment approaches that were adopted for children who were reported to have experienced a diarrhea episode during the two-week period before the survey. Medical treatment was sought for 44 percent of these children. Children who had diarrhea were either treated with ORS packets (43 percent) or recommended home fluids (RHF) such as sugar-salt-water solution, or rice water (am soup) (49 percent). Overall, 65 percent received either ORS or RHF. While 3 in every 5 children who had diarrhea were given increased fluids, it is interesting to note that 18 percent were given neither increased fluids nor ORS. Eighty-four percent of children received home remedies.
The use of oral rehydration therapy appears to have increased. In 1993, only 27 percent of children with diarrhea were treated with solutions made from ORS packets compared to 43 percent in 1998. Similarly, in 1993, only 36 percent of ill children were treated with homemade solutions compared to 49 percent in 1998.
Table g. 17 Diarrhea treatment
Percentage of children under five who had diarrhea in the past two weeks who were taken for treatment to a health facility or provider and the forms of treatment given, Philippines 1998
Diarrhea treatment Percent
Percentage of children with diarrhea taken to a health facility 43.9
ORS packets 43.4 Recommended home fluids (RHF) 49.3 Either ORS or RHF 64.1 Increased fluids 58.3 No ORS, RHF, increased fluids 18.4 Injection 0.6 Home remedy 83.4 None 1.9 Missing 4.0
Number of children with diarrhea 539
Figure 8.6 looks at the extent to which feeding practices were changed for children with diarrhea in the two weeks prior to the survey. With regard to consumption of fluids during children's diarrhea, mothers reported that they gave the same amount of fluids to 23 percent of children, and increased fluids for 58 percent. However, nearly one-fifth of children were given less fluids. With regard to consumption of food, half of the mothers with children ill with diarrhea reported giving the children less food than usual, while 21 percent said they increased feeding and 29 percent reported giving the same amount of food as usual.
137

Figure 8.6 Feeding Practices among Children under Five with Diarrhea
Percent
58
49
Same Increased Decreased Same Increased Decreased FLUID INTAKE SOLID FOOD INTAKE
1998NDHS
Mothers with children under five years were asked about their children's intake of supplementary vitamin A and iron during the six months preceding the survey. Results in Table 8.18 reveal that 71 percent of children were given vitamin A capsules. A little over half of these children were provided with iron preparations. Infants who are of birth order 6 and above, rural children and those with uneducated mothers were less likely to be given the above micronutrients. The regional distribution indicates that ARMM has consistently low coverage for the micronutrients for children.
138

Table 8.18 Treatment with vitamin A and iron
Percentage of children under five years who received a vitamin A capsule or iron drops/syrop during the six months preceding the survey, by selected background characteristics, Philippines 1998
Children under five
Background Received vitamin Received iron Number characteristic A capsule drops/syrup of children
Child's age 6-11 months 80.9 67.7 1,495 12-23 months 76.9 60.5 1,474 24-35 months 81.1 63.3 1,446 36-47 months 78.0 61.7 1,415 48-59 months 77.4 62.8 1,455
Child's sex Male 70.3 55.8 3,823 Female 70.9 57.0 3,463
Birth order 1 70.6 59.6 1,851 2-3 72.6 59.0 2,768 4-5 71.2 55.2 1,486 6+ 65.1 46.4 1,181
Residence Urban 72.9 63.4 3,360 Rural 68.7 50.3 3,926
Region Metro Manila 72.5 67.0 1,020 Cordillera Admin. 74.0 47.9 143 llocos 68.4 64.3 332 Cagayan Valley 68.4 45.6 232 C. Luzon 70.3 63.2 686 S, Tagalog 70.0 59.7 1,044 Bicol 75.3 59.6 505 W. Visayas 75.5 55.8 571 C. Visayas 73.3 53.6 573 E. Visayas 68.6 35.2 418 W. Mindanao 68.2 58.5 290 N. Mindanao 74.1 42.9 319 S, Mindanao 76.4 62.9 469 C. Mindanan 71.4 57.4 253 ARMM 31.8 23.5 246 Caraga 70.0 53.3 184
Mother's education No education 29.6 17.6 152 Elementary 67.5 45.8 2,448 High school 74.7 61.9 2,820 College or higher 71.7 64.8 1,866
Total 70.6 56.3 7,286
139


CHAPTER 9
INFANT FEEDING AND SUPPLEMENTATION
The importance of proper infant feeding cannot be overemphasized as it affects children's nutritional health and well being. Hence, the Philippines in urgent response to the 1981 International Code of Marketing of Breastmilk Substitute by the World Health Organization (WHO) advocated a strong campaign to encourage breastfeeding among nursing mothers instead of using breast milk substitutes. Breastfeeding with all its healthful and economic advantages is the best form of feeding during the first six months of infancy. Supplementary foods introduced initially at four to six months of infancy greatly contribute to the nutritional needs of the growing child. Thus, proper and adequate infant feeding, starting at birth, is very important for physical and mental development of a child.
9.1 Prevalence of Breastfeeding and Supplementation
Breastfeeding is not universal in the Philippines; 12 percent of children born in the five years before the survey were not breastfed at all (see Table 9.1). The extent of breastfeeding does not vary by sex of child, but urban children are less likely to be breastfed than rural children (83 percent compared to 92 percent). Observing regional variations, children in Metro Manila are the least likely and children in CAR the most likely to be breastfed. Mother's education has a negative association with their children's chances of being breastfed. While 94 percent of children of mothers who have no education were breastfed, only 81 percent of children whose mothers have been to college ever received breast milk. Children of mothers who received assistance from medical personnel at delivery and children who were born in a health facility are less likely to be breastfed than those who were delivered by a traditional midwife or were born at home.
The first breast milk, or colostmm, is beneficial to infants because it contains a high concentration of antibodies that protect children against certain infectious diseases. However, in some places, cultural norms dictate against giving infants colostrum. Results from the 1998 NDHS show that 41 percent of children born during the five years before the survey were given breast milk during the first hour after birth, and 79 percent were given breast milk during the first 24 hours.
Differentials in the early initiation of breast milk appear to exhibit a pattern similar to that of prevalence; rural infants and infants of mothers with no education are slightly more likely to be given breast milk soon after birth. The percentage of children receiving colostmm on Luzon Island, except in the Cordillera Adminstrative Region and Cagayan Valley, tends to be lower than in other parts of the country. It is interesting to note that children in Metro Manila are the least likely to be given breast milk, but children in Bicol are the least likely to be breastfed immediately after birth.
141

Table 9.1 Initial breastfeedin~
Percentage of children born in the five years preceding the survey who were ever breastfed, and the percentage of last-born children who started breastfeeding within one hour of birth and within one day of birth, by selected background characteristics, PhiIippines 1998
Percentage who started Percentage breastfeeding: Number
Background ever Within 1 hour Within 1 day of characteristic breastfed of birth of birth children
Sex Male 87.1 40.0 77.7 3,974 Female 89.0 41.1 79.6 3,592
Residence Urban 83.1 38.8 75.4 3,465 Rural 92.2 41.8 81.0 4,101
Region Metro Manila 79.6 33.6 71.0 1,048 Cordillera Admin. 95.3 73.8 91.I 149 Ilocos 85.9 37.2 72.0 344 Cagayan Valley 90~4 51.7 69.2 242 C. Luzon 84.3 33.9 73.8 711 S. Tagalog 87.2 26.8 77.4 1,078 Bicol 92.7 18.1 75.6 530 W. Visayas 92.7 48.3 88.4 585 C. Visayas 93.4 58.1 84.3 586 E. Visayas 90.7 54.4 83.3 446 W. Mindanao 90.7 54.2 79.1 304 N. Mindanan 90.9 50.5 88.1 331 S. Mindanao 88.1 43.8 75.2 489 C. Mindanao 87.2 43.1 84.0 264 ARMM 88.1 41.6 78.5 263 Caraga 89.1 35.6 83.7 197
Mother's education No education 93.7 49.9 84.8 169 Elementary 93.0 40.7 81.3 2,586 High school 87.5 39.5 79.7 2,913 College or higher 81.4 41.0 71.8 1,898
Assistance at delivery Medically trained personnel 84.3 39.5 75.7 4,268 Traditional midwife 92.5 41.3 82.3 3,124 Other/None 97.1 54.1 85.4 157
Place of delivery Health facility 83~1 40.7 73.8 2,590 At home 90.6 40.6 81.2 4,953
Total 88.0 40.5 78.6 7,566
142

For children born in the f ive years prior to the survey who were currently breastfed, mothers were asked i f they had g iven various types of liquids or solid foods to the child "yes terday" or "last night ," Children who are exclusively breastfed are defined as receiving breast mi lk only, while,full breastfeeding is defined as receiving breast mi lk and plain water only. The results shown in Table 9.2 indicate that, children in the Philippines are introduced to supplemental foods very early; among newborns under 2 months, one in seven is not breastfed, and 19 percent are receiving supplementary foods in addition to breast milk. More than half of newborns are exclusively breastfed. At age 6-7 months, the major i ty of infants receive supplementary foods; the percentage of children who are not breastfed increases to one in three children, while the percentage of children who are exlusively breastfed dropped to 2.3 percent. At age 6 months and older, virtually all infants have received foods other than breast mi lk (Figure 9,1).
Table 9.2 Breestfeeding status
Percent distribution of living children under age three by breast feeding status, according to child's age in months, Philippines 1998
Percentage of children who are:
Bmastfed and given:
Not Exclusively Plain Number of breast- breast- water Supple- living
ABe in months fed fed only merits Total children
< 2 15.2 57.7 7.9 19,2 100.0 186 2-3 20.2 40.1 8.8 30.9 100.0 271 4-5 32.1 20.0 9.7 38.2 100.0 278 6-7 34.7 2,3 2.0 60.9 100.0 287 8-9 40.3 0.4 0.9 58.4 100.0 228 10-11 37.2 0.1 0.1 62.6 100.0 244 12-13 47.9 0.7 0.3 51.1 100.0 221 14-15 56.2 0.3 0.0 43,4 100.0 279 16-17 63.3 0.0 0.4 36.4 I00.0 274 18-19 68.2 0.0 0.0 31.8 100.0 258 20-21 73.8 0.0 0.0 26.2 100.0 219 22-23 79.8 0.4 0.0 19.7 100.0 223 24-25 81.2 0.0 0.0 18.8 100.0 241 26-27 91.2 o.o 0,0 8.8 100.0 242 28-29 94.2 0.0 0.0 5.8 100.0 278 30-31 90.8 0.0 0.0 9.2 I00.0 230 32-33 92.0 0.0 0.0 8.0 100.0 243 34-35 92.7 0.4 0.0 6.8 100.0 212
0-2 18.2 47.2 8.5 26.1 100.0 458 4-6 32.6 14.5 7.3 45,6 100.0 414 7-9 38.5 0,8 1.2 59.5 100.0 379
143

Figure 9.1 Distribution of Children by Breastfeeding (BF)
Status According to Age
1 O0
90
80
70
Percent
60
50
40
30
2O
10
0 0 2 4 6 8 10 12
"~BF + supplement
NBF + water only
~ Exclusive BF
mNot BF
14 16 18 20 22 24 26 28 30 32 34
Age in Months
Table 9.3 shows the type of supplements given to children under age three. Among breastfeeding children age 2-3 months, 26 percent are given infant formula, 7 percent receive milk other than breast milk, and 17 percent are given other liquids. (Other liquids consists of water, tea, rice water or fruit juice.) By the time infunts are 4-5 months, the pattern of feeding has changed dramatically; 12 percent have been introduced to meat, fish and eggs,32 percent are receiving grains, flour or cereal and 9 percent are given tubers and plantains.
Bottles with nipples are usually used in conjunction with infant formula, but they are also used with other types of supplementary food. The use of a bottle is not generally recommended at early stages of infancy due to the risk of exposing the child to the harmful effects of insufficient and unhygienic preparation of the liquid, particularly in poor environmental and socioeconomic conditions. In particular, since it is difficult to thoroughly clean feeding bottles, their use is thought to place children at increased risk of developing diarrhea or other diseases. Among breastfeeding newborns, 23 percent have already used a bottle with a nipple. The percentage of children who were given a bottle with a nipple increases until age 8-9 months, after which the percentage gradually declines.
144

Table 9.3 'IN, De of foods received bv breastfeeding children in the precedin2 24 hours
Percentage of breastfeeding children under 36 months of age by type of food received in the 24 hours before the interview and the percentage using a bottle with a nipple, by number of months since child's births, Philippines 1998
Supplementation
Percentage using
Months Breast Infant Grain, bottle Number since milk formula Other Other Meat, flour, with a of birth only milk milk liquid fish eggs Tubers Other nipple children
< 2 68.0 22.7 0.3 3.7 0.0 1.0 0.0 0.0 22.9 158 2-3 50.2 26.3 7.4 16.8 3.4 6.6 3.0 2.5 35.5 217 4-5 29.5 27.8 9.4 28.4 12.3 32.6 9.0 7.4 34.2 189 6-7 3.6 36.1 21.2 46.1 52.1 77.6 30.8 32.0 45.9 187 8-9 0.7 34.3 27.3 55.1 69.3 84.6 37.6 46.4 47.5 136 10-11 0.2 17.8 28.3 62.9 81.6 96.2 48.9 44.7 27.0 153 12-13 1.3 17.2 36.6 68.6 82.7 94.2 52.5 57.9 36.6 115 14-15 0.8 20.3 39.7 65.0 89.7 95.3 50.9 64.9 31.8 122 16-17 0.0 21.9 40.4 71.4 92.1 91.7 59.7 59.5 34.0 101 18-23 0.5 8.9 42.8 74.1 89.5 96.4 ~0.2 63.9 29.3 184 24-29 0.0 13.8 40.7 83.1 96.1 92.2 61.5 72.1 29.8 83 30-35 1.7 5.2 58.6 81.5 93.1 94.6 64.2 73.8 29.3 56
0-3 57.7 24.8 4.4 11.3 2.0 4.3 1.8 1.5 30.2 375 4-6 21.5 30.1 12.6 34.9 22.1 44.8 14.6 12.7 38.2 279 7-9 1.3 35.4 25.4 51.2 65.8 83.7 36.5 43.5 46.6 233
Total 16.7 22.6 25.2 49.2 55.4 65.1 34.7 37.4 34.2 1,701
9.2 Duration of Breastfeeding
The median duration and the frequency of breastfeeding according to selected background characteristics are presented in Table 9.4. The estimates of mean and median durations are based on current status data, that is, the proportions of children under 3 years of age who were be ing breastfed at the t ime of the survey, as opposed to the retrospective data on the length of breastfeeding of older children who are no longer breastfed. The prevalence/incidence mean is provided for the total population in order to allow for international comparison.
The median duration of breastfeeding is 13 months. Children who live in rural areas are breastfed about 10 months longer than children in urban areas. Children whose mothers have no education are breastfed 3 t imes as long as children whose mothers have college or higher education (15 months compared to 5 months). Mothers assisted by traditional midwives at delivery also breastfeed longer than those assisted by medically trained personnel at delivery. There is little difference in breastfeeding duration by sex of children; although girls receive breast mi lk slightly longer than boys.
The median duration of exclusive breastfeeding is very short in the Philippines, only a month and a half. The differentials in duration of exclusive breastfeeding and full breastfeeding are s imilar to those for breastfeeding in general.
145

The duration of postpartum amenorrhea is affected by both the duration and the frequency of breasffeeding. Children's health and nutritional status are also affected by the frequency of breastfeeding. Frequent breastfeeding is fairly common in the Philippines; 7 in 10 children under 6 months were breastfed six times or more in the 24 hours preceding the interview. Differentials in the frequency of breasffeeding are similar to those for breastfeeding prevalence, initiation, and supplementation.
Table 9,4 Median duration and frceuenev of breastfeedin~
Median duration of any, exclusive, and full breastfeeding among children under 3 years and the percentage of children under 6 months of age who were breasffed 6 or more times in the 24 hours preceding the interview, according to background characteristics, Philippines 1998
Among children <3 years, median duration of breastfeeding in months Percentage Number of
Any Exclusive Full Number of <6 too. breasffed living Background breast- breast- breast- children 6+ times in last children characteristic ffeeding feeding feedin$1 <3 years 24 hours < 6 months Sex of child
Male 11.6 Female 13.5
Residence Urban 5.6 Rural 15.5
Region Metro Manila 3.4 Cordillera Admin. 16.7 llocos 18.2 Cagayan Valley 13.9 C. Luzon 10.1 S. Tagalog 12.9 Bieol 15.6 W. Visayas 14.0 C. Visayas 14.0 E. "qisayas 15.3 W. Mindanan 16.6 N. Mindanao 12.2 S. Mindanao 8.3 C. Mindanao 7.8 ARMM 15.1 Caraga 12.9
Education No education 15.4 Elementary 17.2 High school 12.6 College or higher 4.6
Delivery assistance Medically trained personnel 6.5 Traditional midwife 16.7
Total 12.8 Mean 13.7 Prevalence/Incidence 13.2
0.7 1.7 2,405 68.9 394 1.8 2.4 2,161 73.3 341
0.7 0.8 2,108 58.6 331 2.1 2.8 2,459 81.0 405
0.5 0.6 624 51.9 102 3.1 3.4 86 (87.5) 14 2.8 2.8 204 (75.8) 32 3.5 3.6 140 (92.9) 19 1.3 1.3 450 56.0 74 0.6 0.8 648 64.0 122 2.8 3A 330 88.9 51 1.0 2.1 341 (72.1 ) 51 1.7 2.4 361 87.5 62 2.3 3.2 279 80.8 37 2.4 2.8 178 (89.1) 25 1.9 3.2 199 78.6 35 1.8 2.4 299 (61.7) 44 0.7 2.6 153 (63.9) 22 3.4 3.4 151 85.5 26 2.2 4.5 123 (81.8) 20
2.3 2.9 97 (81.9) 17 2.2 2.9 1,492 84.4 233 1.5 2.2 1,767 73.0 282 0.6 0.8 1,210 51.7 203
0.8 1.4 2,627 61.1 416 2.1 3.0 1,844 83.2 310
1.4 2.1 4,566 70.9 736 2.9 3.4 88.6 NA NA 2.2 2.8 NA NA NA
Note: Children for whom assistance at delivery is missing, "other," or "none" are excluded. Figures in parentheses are based on 25 to 49 unweighted cases. NA=Not applicable 1Either exclusive breastfeeding or received plain water only in addition to breast milk.
146

CHAPTER 10
GENERAL HEALTH
This chapter contains subject matter related to some health programs of the Department of Health. These include some data that help in evaluating the information and education campaigns conducted for topics related to lifestyle, smoking, cancer, communicable diseases (dengue fever, leprosy, tuberculosis, rabies), traditional medicine, environmental health, and health care financing.
The unit of analysis in this section refers to the person who answered questions relating to the household. No attempt was made to select adults at random. Thus, the data cannot be interpreted as relating to all adults but rather to one respondent per household.
10.1 Communicable Diseases
Dengue Fever
The Dengue Control Program is one of the newer health programs of the Department of Health and involved launching a massive information and education campaign to prevent the spread of dengue in the country. To help assess the effectiveness of this campaign, respondents were asked whether they were aware of dengue fever and whether they knew how to keep from getting this disease. The results of the NDHS show that 9 out of 10 household respondents have heard about dengue fever. While the general awareness is high, the level of awareness in different regions varies from as high as 99 percent in Metro Manila to as low as 76 percent in Western Mindanao. Table 10.1 provides the data.
Removing breeding places of mosquitoes was mentioned by 2 in 3 household respondents as a means of preventing dengue fever. Almost 40 percent of household respondents know that mosquito nets can prevent the spread of dengue fever. As shown in Table 10.1, many misconceptions about dengue prevention still exist among the general public. These include avoiding people with dengue fever, taking medicines, washing hands before eating, and eliminating flies. Again, respondents from Metro Manila are more knowledgeable on dengue prevention while those from CAR are the least knowledgeable.
Rabies
Prevention of rabies in the country emphasizes not only the giving of vaccines to people bitten by animals (mainly dogs) but also the major role of dog owners in preventing this dreaded disease, Household respondents were asked what they think dog owner's responsibilities are. Respondents in half of the households are aware that dog owners have a responsibility to immunize their dogs and restrain their dogs. One out of 7 respondents feels that it is a dog owner's responsibility to provide treatment to victims bitten by their dog and one out of 7 believes that they have no responsibility at all. Metro Manila residents are more knowledgeable about responsible dog ownership compared with the rest of the regions (Table 10.2).
147

Table 10.1 Dengue fever
Percentage of household respondents who have heard of dengue fever and percentage who report various means of protecting against it, by region, Philippines 1998
Means of protecting against dengue fever
Avoid Pnreontage people Remove Use Wash who have with breeding Take mos- hands Elimi- Number of hoardof dengue planesof medi. quite before nate Don't household
Region dengue fever mosquitos nines nets eatin~ flies Other None know respondents
Metro Manila 98.9 5.9 81.8 2.8 22.7 5.2 49.5 19.6 0.4 0.6 1,859 Cordillnra Admin. 76.6 1.0 35.9 1.8 30.2 1.1 8.6 29.9 1.3 4.8 212 Ilocos 91.2 6.1 62.4 2.6 44.1 2.4 16.6 18.6 0.2 2.1 667 Cagayan Valley 92.8 2.9 47.0 5.5 62.0 1.3 12.0 37.0 0.4 0.7 475 C. Luzon 95.9 5.7 73.0 1.5 34.9 3.7 35.2 11.5 0.4 2,0 1,292 S. Tagalog 9L5 2.3 79,l 0,7 37,7 3,7 14.4 11,6 0,2 L4 1,818 Bicol 81.4 2.1 54.6 2.6 27.1 3.2 26.4 19.2 0.5 1.8 740 W. Visayes 88.4 2.5 65.8 2.0 28.8 2.4 19.8 29.1 0.4 2.0 1,027 C.Visayas 92.5 4.8 58.5 5.3 41.3 1.1 18.4 37.1 0.6 0.4 959 E. Vieayas 84.3 1.6 46.8 0.6 46.5 0.4 15.3 35.9 0.4 1.2 620 W. Mindanao 76.2 6.8 56.5 6,0 44.7 3.8 17.3 20.1 0.2 1.4 466 N. Mindanao 89.0 3.4 49.5 2.9 44.6 2.1 23.2 26.9 0.3 2.4 427 S. Mindanao 94.2 2.8 59,2 2.3 37.1 2.1 36.8 40,9 0.6 2.6 797 C. Mindanao 92.9 4.8 66.5 2.9 46.2 1.9 24.1 16.5 1.1 1.9 406 ARMM 79.4 14,2 62.2 8.3 52.9 5.0 30.9 6.3 0.5 1.7 322 Caragu 93.8 6.7 65.8 5.8 65.8 1.2 27.6 21.9 0.1 0.7 314
Total 91 .O 4.3 65.9 2.8 37.5 3.0 26.2 22.6 0.4 1.7 12,401
For households with a member bitten by a dog within the 3 months before the survey, the respondents were asked what was done to treat the dog bite. Thirty-seven percent reported that the bite was washed with soap and water (Table 10.3). Only 26 percent said that consultations were made with physicians or the victim went to the health center, while 9 percent said that they observed the dog. It is interesting to note that local practices such as applying garlic on the bite site and seeking assistance from traditional healers are still very common.
148

Table 10.2 Resoonsibilitv ofdoa owners
Percentage of household respondents who report specific responsibilities of dog owners, by region, Philippines 1998
Responsibility of dog owners
Provide Restrain treatment Number
lmmu- dog for the of nize within the dog bite household
Region dog yard victim O t h e r None respondents
Metro Manila 68.6 48,9 4.6 7.6 6.8 1,859 Cordillera Admin. 29.9 35.7 6.1 14.7 29.7 212 Ilocos 28.2 38,8 29.4 4.7 16.4 667 Cagayan Valley 29.9 40.7 21.3 6.7 22.9 475 C. Luzon 56.8 34.2 7.8 4.0 17.8 1,292 S. Tagalog 53.6 63.4 3.6 2.4 8.4 1,818 Bicel 36.3 61.0 9.9 2.8 17.4 740 W. Visayas 47.3 41,8 15.0 6.6 15.0 1,027 C. Visayas 47.6 50,4 24.5 6.4 10.6 959 E. Visayas 33.2 45.7 34.7 4.0 15.8 620 W. Mindanao 51.6 57,2 24.8 4.9 11.2 466 N. Mindanao 48.5 31,6 16.3 1.5 19.8 427 S. Mindanao 38.6 48,2 11.2 5.4 23.9 797 C. Mindanao 54.4 39,1 16.2 2.3 23.5 406 ARMM 34.9 65,7 13.9 1.2 17.6 322 Caraga 50.8 65,0 23.6 2.4 8.9 314
Total 48.7 4817 13.7 4.8 14.4 12,401
Table 10.3 Treatment 0fdo2 bites
Among liousebelds with any member bitten by a dog in the last 3 months, percentage reporting various treatments, Philippines 1998
Treatment of dog bite Percentage
Washed with soap and water 37.3 Applied garlic on site 37.0 Consulted health center/physician 25.6 Sought an herbulario 28.8 Immediately killed the dog 0.8 Observed the dog 8.9 Other 26.2 Nothing 2.0
Number of households 471
149

Leprosy
By the year 2000, the Leprosy Control Program of the Department of Health aims to eliminate leprosy as a public health problem by bringing down the prevalence rate to less than 1 case per 1,000 population. Information campaigns designed to increase public knowledge about leprosy are a major activity of the Department of Health.
Respondents were asked how leprosy is acquired, whether it is curable, and whether patients with leprosy can be treated at home. Table 10.4 details the responses regarding the mode of transmission. Skin- to-skin transmission and droplet or airborne transmission were correctly known to only 21 percent and 11 percent of respondents, respectively. While misconceptions regarding the transmission of leprosy still abound, 27 percent do not know a mode of transmission and 24 percent do not know the disease at all.
Only 60 percent of household respondents know that leprosy is curable (Table 10.5) The proportion who know that leprosy is curable ranges from a low of 49 percent in Central Luzon to a high of 75 percent in Western Mindanao. Only 11 percent know that treatment can be done at home. It is worth noting that 40 percent believe that leprosy is not curable.
Table 10.4 Perceived Iransmission of lepros',/
Percentage of household respondents who cite various modes of transmission of leprosy, by region, Philippines 1998
Region
Mode of transmission of leprosy Number
Skin- Exposure Eating Don't know Don't of to- Droplets/ Here- to hot certain mode of know household
skin airborne ditary and cold foods Other transmission leprosy respondents
Metro Manila 15.6 8.3 Cordillera Admin. 31.2 5.7 Ilocos 35.6 9.1 Cagayan Valley 29.7 11.7 C. Luzon 7.3 2.1 S. Tagalog 11.1 6.2 Bicol 8.6 5.8 W. Visayas 19.4 10.4 C. Visayas 24.1 11.9 E. Visayas 28.1 14.6 W. Mindanao 41.5 21.3 N. Mindanao 28.2 9.5 S. Mindano 26.4 15.6 C. Mindanao 25.3 23.3 ARMM 48.0 32.3 Caraga 35.3 19.0
Total 20.9 10.5
19.8 24.2 2.9 i0.0 31.3 15.3 1,859 2.7 0.5 3.6 14.7 25.0 27.9 212 9.3 2.1 3.0 8.7 20.1 27.4 667 4.9 1.6 3.3 22.8 24.2 19.3 475
15.6 7.3 3.0 6.0 43.0 22.8 1,292 14.0 9.8 3.6 5.8 26.6 33.3 1,818 11.0 3.7 1.2 4.5 31.8 40.3 740 5.8 1.3 5.7 27.8 31.1 16.7 1,027
10.6 1.3 4.6 26.0 19.5 26.6 959 7.1 0.6 2.0 27.3 20.8 19.4 620
22.5 3.7 10.6 14.0 9.7 24.2 466 7.0 0.9 5.2 9.9 23.7 28.1 427 9.5 1.8 10.2 23.4 27.3 15.3 797 7.6 1.5 6.6 16.5 19.5 29.5 406
17.0 5.2 6.3 14.1 10.2 30.0 322 12.9 1.3 7.9 12.3 21.0 22.4 314
12.4 7.0 4.4 14.1 26.9 24.2 12,401
150

Table 10.5 Curability oflenmsv
Among household respondents who know of leprosy, percent distribution by whether or not they think it is curable and whether or not it can be treated at home, aex:ording to region, Philippines 1998
Think leprosy is curable
Think Can be Cannot be leprosy Number
treated at treated at is not of household Region home home curable To ta l respondents
Metro Manila 10.6 54.0 35.1 100.0 1,569 Cordillera Admin. 18.7 37.5 43.8 100.0 152 Iloeos 10.7 59.0 30,3 I00.0 483 Cagayan Valley 9.4 44.4 46,2 100.0 381 C. Luzon 5.8 43.0 51.2 100.0 998 S. Tagalog 13.4 41.2 45,4 100.0 1,210 Bianl 13.8 45.3 40,9 100.0 440 W. Visayas 8.9 47.6 43.6 100.0 854 C. Visayas 11.7 54.5 33.8 100.0 702 E. Visayas 17.4 44.3 38.3 100.0 500 W. Mindanao 14.4 61.2 24.5 100.0 351 N. Mindanao 11.7 38.4 49.9 100.0 307 S. Mindano 11.0 48.6 40,2 100.0 673 C. Mindanao 10.7 57.2 31.8 100.0 286 ARMM 4.6 66.2 29,2 100.0 225 Caraga 7.8 51.0 41,0 100.0 244
Total 11.0 49.0 40,0 100.0 9,375
Tuberculosis
Household respondents were asked about their perceptions of the canse(s) of tuberculosis (TB). Only 16 percent correctly identified microbes or bacteria as the cause of tuberculosis. A great majority of the respondents still have incorrect perceptions regarding the cause of tuberculosis as shown in Table 10.6. There is not much difference in the level of knowledge among regions, ARMM and Caraga respondents have the highest percentage with correct perceptions (28 and 27 percent, respectively), while those from Western Visayas have the lowest (11 percent).
For households with any member taking anti-TB medicines at the time of the survey, the respondents were asked for the source of the anti-TB drugs taken. Figure 10.1 shows that the health centers and drugstores each provide anti-TB medicines to over 40 percent of TB patients and government hospitals provide to 11 percent of TB cases. Table 10.7 shows that respondents have different perceptions regarding the length of treatment for TB. It is worth noting that a sizeable proportion still believe that TB can be treated in as short a duration as 1-3 months, while 16 percent don't know the length of treatment. According to DOH policy, TB should be treated for at least 6 months.
151

Table 10.6 Causes of tuberculosis
Percentage of household respondents who report various causes of tuberculosis, by region, Philippines 1998
Re,on
Perceived causes of TB
Number Microbes/ Don't Don't of
germs,' Lifo Alcohol know know household bacteria Inherited style Smoking drinking Fatigue Other cause TB respondents
Metro Manila 16.5 18.9 3.6 57.9 38.8 35.0 29.3 3.7 1.7 1,859 Cordillera Admin. 12.1 6.0 0.5 47.8 20.0 10.2 38.3 12.3 3.2 212
Ilocos 16.7 13.7 0.9 63.0 31.4 32.0 13.5 6.2 2.7 667
Cagayan Valley 14.1 10.9 1.9 54.1 36.5 23.2 25.7 8.1 4.6 475 C. Luzon 16.5 11.1 1.4 50.1 31.8 27.2 22.6 11.1 2.1 1,292
S. Tagalog 16.0 13.0 18.2 53.2 29.3 24.0 12.3 6.7 3.7 1,818
Bicol 14.9 8.7 10.2 45.8 23.5 20.1 33.8 7.3 3.6 740 W. Visayas 10.6 10.4 7.7 39.6 38.7 30.6 45.5 5.5 1.0 1,027
C. Visayas 16.8 11.2 I5.3 43.8 33.6 27.4 28.8 8.6 3.1 959 E. Visayas 12.0 5.0 0.5 56.8 41.0 19.6 34.3 4.3 1.6 620 W. Mindanao 21.6 20.1 5.8 66.2 47.8 34.0 16.0 3.1 3.2 466
N. Mindanao 16.9 8.2 2.4 58.3 43.1 25.6 14.5 8.7 2.9 427 S. Mindanao 14.9 6.5 5.7 64.4 52.7 40.2 26.3 5.2 1.3 797 C. Mindanao 16.2 10.5 5.1 67.2 54.3 30.9 23.0 2.6 2.3 406
ARMM 28.4 28.6 21.3 64.5 26.8 23.5 6.6 6.4 2.4 322 Caraga 27.4 11.0 8.0 67.6 60.4 46.7 17.9 3.0 1.8 314
Total 16.2 12.5 7.5 54.4 36.8 28.8 24.8 6.4 2.5 12,401
152

Table 10.7 Lemzth of TB treatment
Percent distribution of household respondents by perceived length of TB treatment, according to region, Philipp'mes 1998
Perceived length of TB treatment
Number One Don't Don't of
One Two Three Four Six Eight year or know know household Re~ion month months months months months months more length TB Total respondents
Metro Manila 3.6 2.3 6.8 1.3 51.7 1.5 17.4 13.7 1.7 100.0 1,859 Cordillera Admin. 4.4 2.4 4.4 1.1 24.6 1.3 31.2 27,5 3.2 100.0 212
llocos 1.4 2.0 5.8 2.9 45,5 0.9 24,4 14.5 2.7 100.0 667
Cagayan Valley 3.2 3.2 5.1 1.0 40,1 3.3 25.4 14.1 4.6 100.0 475 C. Luzon 2.2 1.4 4.6 1.1 51.4 1.7 20.9 14.6 2.1 100,0 1.292 S. Tagalog 5.5 2.0 8.4 2.0 49.1 2.3 17.1 9.9 3.7 100,0 1,818
Bicol 6.9 2.6 9.9 2.5 40.3 1.7 19.2 13.3 3,6 100.0 740
W. Visayas 6.9 5.1 9.8 1.9 26,8 1.5 31.0 16.0 1.0 100.0 1,027
C. Visayas 5.4 4.1 10.0 2.0 253 1.5 22,8 25.8 3.1 100.0 959 E. Visayas 4.0 3.7 2.6 1.2 34,4 1.1 32,2 19.3 1.6 100.0 620 W. Mindanao 3.6 3.3 8.5 7.6 31.3 4.8 24.7 13.0 3.2 100.0 466
N. Mindanao 3.7 2.3 4.0 1.4 29.5 1.8 32,7 21.8 2.9 I00.0 427
S. Mindanao 6.6 2.9 7.1 1.9 28.9 1.7 28,1 21.4 1.3 100.0 797 C. Mindanao 2.9 2.5 4.6 1.4 41.7 2,6 21.9 19.9 2.3 100.0 406
ARMM 2.0 0.6 1,5 2.4 37.0 4.9 31.3 17.7 2.4 100.0 322 Caraga 4.6 3.1 6,4 1.8 31.4 1.9 36.1 12.9 1.8 100.0 314
Total 4.4 2.7 6.9 1.9 40,2 2.0 23.5 16,0 2.5 100.0 12,401
Figure 10.1 Sources of Anti-TB Medicines
Percent
50
45
40
35
30
25
20
15
10
5
0 Health Drugstore center
NGO Private Govem- Other Don't clinic and ment know hospital hospital
Note: Based on households with a member taking antI-TB medication. 1998 NDHS
153

10.2 Non-Communicable Diseases
Healthy Lifestyle
Household respondents were asked what they do to keep themselves healthy. Results in Table 10.8 show that the majority (74 percent) of respondents said that maintaining proper nutrition contributes to their health; one in three (29 percent) reported exercising for good health; and small proportions reported low-fat diets (5 percent) and 10w-salt diets (2 percent) as contributing to their health. Three to 5 percent of respondents mentioned avoiding smoking, moderate drinking, and monitoring blood pressure as ways they stay healthy. Respondents ' behavior varies little by region, however, those in Caraga, Central Lnzon, and Southern Tagalog are more convinced of the health benefits o f proper nutrition while those in C AR are less convinced.
Table 10.8 Wavs to stav healthy
Percentage of household respondents citing various ways to stay healthy, by region, Philippines 1998
Ways to stay healthy
Number Low. Low- Monitor of
Exer- fat salt Avoid Moderate blood Proper household Region cise diet diet smoking drinking pressure nutrition Other None respondents
Metro Manila 30.0 10.6 4.1 5.2 3.4 4.9 77.5 27.1 5.7 1,859 Cordillera Admin. 26.8 2.4 1.0 1.6 3.9 0.8 44.3 65.1 4.4 212 Ilocos 46.6 5.2 0.8 8.8 3.5 4.6 68.2 33.9 2.6 667 Cagayan Valley 30.3 4.1 0.9 3.5 1.9 1.7 63.2 48.1 6.2 475 C. Luzon 16.3 3.9 2.2 3.9 3.4 2.2 85.7 19.2 6.0 1,292 g. Tagalog 28.1 4.8 1.5 3.5 3.0 3.1 84.9 26.4 3.2 1,8184 Bicol 38.2 2.4 0.4 1.1 0.9 3.7 55.6 26.3 13.1 740 W. Visayas 14.7 2.3 1.4 4.4 3.5 2.5 62.2 62.9 2.9 1,027 C. Visayas 28.9 5.3 3.1 3.4 2.8 2.8 73.9 42.9 2.7 959 E. Visayas 30.1 2.4 1.7 1.0 6.0 0.8 73.9 41.1 2.6 620 W. Mindanao 39.2 8.6 1.4 6.8 4.7 4.8 74.9 36.0 2.3 466 N. Mindanao 25.0 2.7 0.2 0.5 2.6 0.9 82.6 30.4 1.1 427 S. Mindanao 24.6 4.1 1.5 1.7 3.2 1.9 76.9 52.1 1.3 797 C. Mindanao 36.5 7.6 0.8 4.5 3.1 2.5 77.1 37.7 3.4 406 ARMM 46.6 6.6 2.1 27.1 2.9 2.6 46.0 28.9 12.2 322 Caraga 38.4 7.9 3.0 8.1 4.1 4.9 87.9 35.1 0.7 314
Total 29.0 5.3 1.9 4.5 3.2 3.0 74.3 35.5 4.4 12,401
Smo~ng
Household respondents were asked the number of smokers in the household. The results show that 40 percent of households nationwide have no smokers (data not shown). It further shows that for every 6 individuals there is one smoker.
Respondents were asked about their perceptions on the effects of smoking. The results are found in Table 10.9. Only 34 percent of respondents believe that smoking causes lung cancer. While there were misconceptions regarding its effects, i.e., that it causes TB, one in 15 believes that smoking does not cause any ill effect to a person 's health.
154
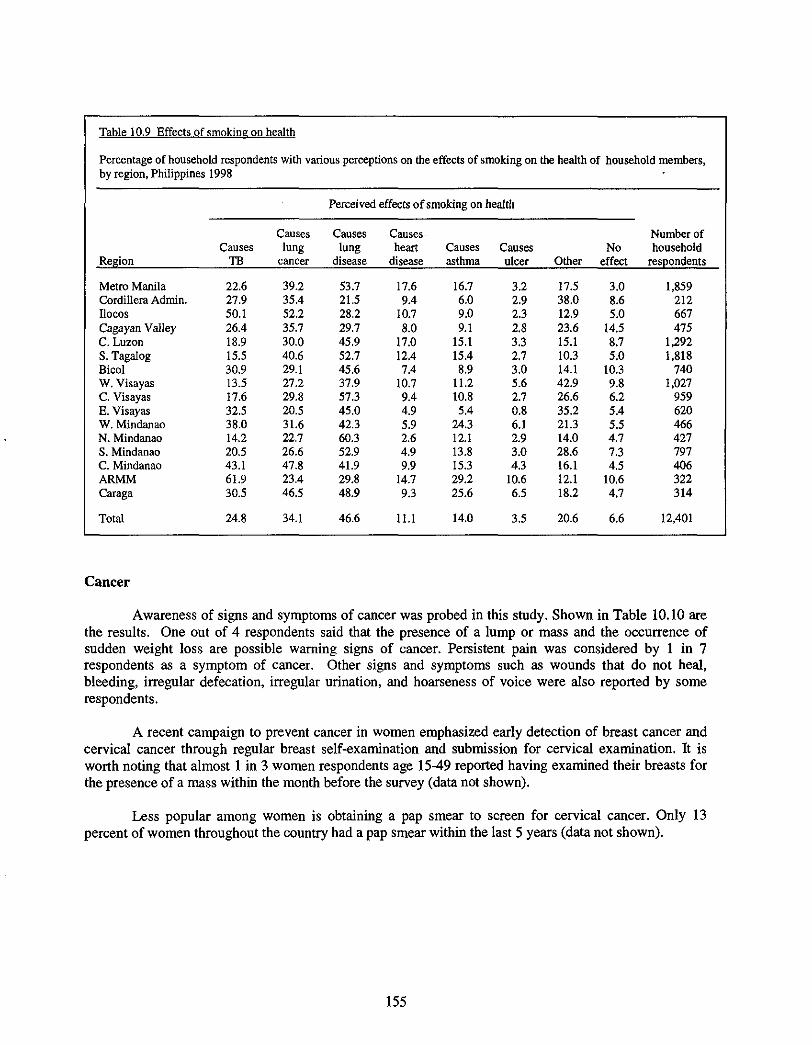
Table 10.9 Effects of smoking on health
Percentage of household respondents with various perceptions on the effects of smoking on the health of household members, by region, Philippines 1998
Perceived effects of smoking on health
Causes C a u s e s Causes Number of Causes lung lung heart Causes Causes No household
.Region TB cancer disease disease asthma ulcer Other effect respondents
Metro Manila 22.6 39.2 53.7 I7.6 I6.7 3.2 17.5 3.0 1,859 Cordillera Admin. 27.9 35.4 21.5 9.4 6.0 2.9 38.0 8.6 212 Ilocos 50.1 52.2 28.2 10.7 9.0 2.3 12.9 5.0 667 Cagayan Valley 26.4 35.7 29.7 8.0 9.1 2.8 23.6 14.5 475 C. Luzon 18.9 30.0 45.9 17.0 15.1 3.3 15.1 8.7 1,292 S. Tagalog 15.5 40.6 52.7 12.4 15.4 2.7 10.3 5.0 1,818 Bicol 30.9 29.1 45.6 7.4 8.9 3.0 14.1 10.3 740 W. Visayas 13.5 27.2 37.9 10.7 11.2 5.6 42.9 9.8 1,027 C. Visayas 17.6 29.8 57.3 9.4 10.8 2.7 26.6 6.2 959 E. Visayas 32.5 20.5 45.0 4.9 5.4 0.8 35.2 5.4 620 W. Mindanao 38.0 31.6 42.3 5.9 24.3 6.1 21.3 5.5 466 N. Mindanao 14.2 22.7 60.3 2.6 12.1 2.9 14.0 4.7 427 S. Mindanao 20.5 26.6 52.9 4.9 13.8 3.0 28.6 7.3 797 C. Mindanao 43.1 47.8 41.9 9.9 I5.3 4.3 16.1 4.5 406 ARMM 61.9 23.4 29.8 14.7 29.2 10.6 12.1 10.6 322 Caraga 30.5 46.5 48.9 9.3 25.6 6.5 18.2 4.7 314
Total 24.8 34.1 46.6 11.1 14.0 3.5 20.6 6.6 12,401
Cancer
Awareness of signs and symptoms of cancer was probed in this study. Shown in Table 10.10 are the results. One out of 4 respondents said that the presence of a lump or mass and the occurrence of sudden weight loss are possible warning signs of cancer. Persistent pain was considered by 1 in 7 respondents as a symptom of cancer. Other signs and symptoms such as wounds that do not heal, bleeding, irregular defecation, irregular urination, and hoarseness of voice were also reported by some respondents.
A recent campaign to prevent cancer in women emphasized early detection of breast cancer and cervical cancer through regular breast self-examination and submission for cervical examination. It is worth noting that almost 1 in 3 women respondents age 15-49 reported having examined their breasts for the presence of a mass within the month before the survey (data not shown).
Less popular among women is obtaining a pap smear to screen for cervical cancer. Only 13 percent of women throughout the country had a pap smear within the last 5 years (data not shown).
155

Table 10.10 Signs and svmntoms of cancer
Percentage of household respondents who know about specific signs and symptoms of cancer, by region, Philippines 1998
Signs and symptoms of cancer
Sore/ Irregn- Irregu- Hoarse- wound Sudden lar far ness Persis-
Lump/ that does weight Bleed- defe- urina- of tent Region mass not heal loss ing cation tion voice pain Other None
Number of household
respondents
Metro Manila 35.1 8.1 36.5 8.3 5.5 2.6 5.9 16.6 18.0 2.0 1,859 Cordillera Admin. 19.7 3.4 11.6 2.7 0.8 1.0 1.6 4.8 31.0 7.8 212 Iloeos 31.4 3.8 25.7 4.4 2.9 2.1 3.7 11.9 12.3 1.1 667 Cagayan Valley 29.3 4.6 20.0 3.8 1.9 0.9 2.9 12.8 21.2 3.0 475 C. Luzon 26.0 7.0 27.6 6.3 2.5 1.5 1.9 9.8 14.2 1.1 1,292 S. Tagalog 35.0 8.3 34.5 5.9 1.8 0.9 3.3 14.6 16.3 1.0 1,818 Bicol 18.4 6.2 17.3 2.6 1.2 0.7 1.7 14.0 13.2 1.7 740 W. Visayas 20.3 3.1 20.9 4.9 1.2 1.3 2.0 19.0 29.1 0.7 1,027 C. Visayas 13.1 2.0 22.6 1.5 3.1 1.9 1.9 I0.0 24.2 3.4 959 E. Visayas 15.4 5.4 12.5 2.2 1.3 0.2 1.8 12.5 31.4 3.6 620 W. Mindanao 15.7 4.7 31.2 6.3 2.1 1.8 5.3 25.8 17.0 4.4 466 N. Mindanao 8.2 2.7 17.9 4.1 1.4 1.4 1.5 11.5 9.0 3.8 427 S. Mindanao 12.3 6.9 22.2 2.4 1.2 0.7 2.4 11.2 38.4 5.4 797 C. Mindanao 23.0 4.6 21.3 3.1 0.9 1.1 0.6 13.0 23.2 1.4 406 ARMM 32.1 22.2 17.0 7.5 2.6 1.7 2.4 20.8 5.7 2.4 322 Caraga 22.2 6.2 32.4 2.8 1.9 1.2 5.8 20.0 21.0 3.1 314
Total 24.6 6.2 26.1 4.9 2.4 1.4 3.0 14.2 20.1 2.3 12,401
10.3 Environmental Health
Garbage Disposal
Respondents were asked how they dispose of their household garbage. Forty-eight percent o f households burn their garbage. In 30 percent o f households, garbage is collected by trucks or carts. Six percent o f households either dump garbage into individual open dumping sites or throw waste into low land areas: 5 percent bury their garbage and only 4 percent conduct compost ing (data not shown).
O f the households that utilize garbage trucks, daily garbage collection is done in only 37 percent. In the remain ing two-thirds of these households, garbage collection is done once or twice weekly or once b iweekly (49 percent and 10 percent, respectively).
Use of Pre-cooked Foods
As shown in Table 10.11, 23 percent o f households buy pre-cooked foods. Seventeen percent o f households go to carinderias (small eat ing places) while 11 percent go to restaurants, and 10 percent use ambulant vendors. This implies that the Department of Health policy should ensure the examinat ion of food handlers not only in restaurants and carinderias but for ambulant vendors as well. The practice of buying pre-cooked foods is mainly done in Western Visayas and Metro Manila and less in Ilocos and Southern Mindanao.
156

Table 10.11 Use of Dre-cooked foods
Percentage of households that regularly buy cooked food from ambulant vendors, carinderias, or restaurants, by region, Philippines 1998
Region
Percentage buying food from:
Any Number Ambulant of the of
vendor Carindeda Restaurant three types households
Metro Manila 8,4 24.7 21.0 33.4 1,859 Cordillera Admin. 2.1 3.4 3.2 6.3 212 Ilocos 2.0 2.9 1.4 3.7 667 Cagayan Valley 5.9 6.5 5.2 10.3 475 C. Luzon 5.4 9.8 3.9 13.0 1,292 S. Tagalog 10.8 16.8 13.0 27.0 1,818 Bicol 11.9 11.4 4.1 20.1 740 W. Visayas 27.3 38.7 33.0 53.4 1,027 C. Visayas 6.0 19.1 6.9 22.4 959 E. Visayas 14.9 16.6 7.2 25.6 620 W. Mindanan I2.7 15.7 10.8 22.0 466 N. Mindanao I0.7 20.3 10.5 26.0 427 S. Mindanao 2.3 5.2 0.2 6.8 797 C. Mindanao 8.8 10.4 6.2 15.6 406 ARMM 8.6 4.4 2.3 12.2 322 Caraga 14.1 22.1 18.2 28.9 314
Total 9.8 16.5 11.2 23.4 12,401
Note: Carinderia refers to an eating place that is smaller than a restaurant.
10.4 Health Care Financing
Household respondents were asked i f any household members were affiliated with any health care f inancing schemes or health insurance plans. T w o in f ive households have health insurance plan. Two-thirds (68 percent) o f the households in Metro Manila have health insurance. A R M M has the smallest proportion of households with a member in a health insurance scheme (13 percent). Details are in Table 10.12.
A m o n g those with a health insurance plan, around 9 in 10 are members of Medicare (Table 10.13). One in 10 has membership in a private health insurance plan, amd a negl igible number have membership in a health maintenance organization (HMO) or a communi ty cooperative.
157

Table 10.12. Health care financing membershin
Percent distribution of households by whether or not any member has health care financing membership, by region, Philippines 1998
Health care financing membership
Region Yes No Total
Number of
households
Metro Manila 68.1 31.9 100.0 1,859 Cordillera Admin. 30.9 69.1 100.0 212 Ilocos 31.4 68.6 100.0 667 Cagayan Valley 24.5 75.5 100.0 475 C. Luzon 38.7 61.3 100.0 1,292 S. Tagalog 44.7 55.3 100.0 1,818 Bicol 22.3 77.7 100.0 740 W. Visayas 42.7 57.3 100.0 1,027 C. Visayas 38.2 61.8 100.0 959 E. Visayas 21.7 78.3 100.0 620 W. Mindanao 26.9 73.1 100.0 466 N. Mindanan 32.1 67.9 100.0 427 S. Mindanao 42.5 57.5 100.0 797 C. Mindanao 27.5 72.5 100.0 406 ARMM 13.1 86.9 100.0 322 Caraga 30.8 69.2 100.0 314
Total 39.7 60.3 100.0 12,401
Table 10.13 T,/pe ofinsuranceplan
Among households with health insurance plans, percentage reporting specific types of plans, by region, Philippines 1998
Health insurance plan Number
Community of Re~ion Medicare HMO Private cooperative Other households
Metro Manila 90.4 1.5 17.8 0.3 0.6 1,266 Cordillera Admin. 84.8 0.0 20.9 0.5 5.8 65 Ilocos 98.5 0.0 5.3 0.5 0.0 209 Cagayan Valley 90.5 0.6 19.5 0.6 0.0 116 C~ Luzon 92.1 0.3 5.2 5.5 1.5 500 S. Tagalog 94.8 1.2 11.9 0.8 0.0 813 Bieol 96.4 0.6 2.4 0.0 0.6 165 W. Visayas 96.6 0.0 5.6 1. I 1.7 438 C, Visayas 89.8 0~0 10.5 1.8 2.2 367 E. Visayas 97.2 1.1 4.4 0.0 0.0 134 W. Mindanao 76.3 0.9 30.6 0.0 4.1 126 N. Mindanan 91.0 0.0 3.3 1.0 3.3 137 S. Mindanao 99.1 1.1 1.7 0.3 0.3 339 C. Mindanao 98.3 0.0 3.4 0.0 0.6 112 ARMM 96.5 0.0 4.7 1.2 0.0 42 Caraga 97.1 1.9 1.4 0.5 1.9 97
Total 93.1 0.8 10.6 1.l 1.0 4,926
158

10.5 Traditional Medicine
Ten medicinal plants are endorsed by the Department of Health through the Traditional Medicine Program and are scientifically proven effective to cure certain illnesses and relieve some specific symptoms of illnesses. They consist of ampalaya, ulasimang bato, lagundi, niyogniyogan, sambong, tsaang gubat, yerba buena, bayabas, bawang, and acapulco.
Household respondents were asked whether they were familiar with these different medicinal herbs and their perceptions as to their intended use. Results in Tablel0.14 indicate that bayabas and bawang are the most widely known medicinal herbs. Virtually all respondents are aware that bayabas has a medicinal use. Around 9 in 10 are familiar with bawang and 8 in 10 know about ampalaya's medicinal value. Three-fourths know that sambong is used medicinally. Least known among the 10 herbal medicines is niyogniyogan.
Table 10.14. Familiarity with traditional medicines
Percentage of household respondents who are familiar with various traditional herbal medicines and of those, the percentage who report specific uses for the medicines, Philippines 1998
Traditional medicine
Perceived use of traditional Ulasi- medicines in Ampa- mang Niyog- S a m - Tsaang Yerba Aca- treating illness laya bato La~ndi niyo$an b o n ~ ~ u b a t buena Bayabas Bawang pulco
Percentage who know of medi- cinal value 80.7 33.6 50.1 17.8 75.2 27.6 58.2 96.8 87.3 44.6
Used traditional medicine to treat:
Head/body pains 1.0 1.3 4.6 2.1 8.9 1.2 12.9 0.9 1.4 0.4 Fever 3.l 3.8 19.1 3.4 13.2 5.8 16.4 1.5 1.5 0.5 Abdominal pain 10.7 7.4 10.8 9.3 21.1 56.8 22.3 47.7 8.1 1.1 Cough/asthma 43.1 8.8 32.6 5.6 36.7 7.7 30.7 2.8 2.6 0.6 Ascaris 2.8 0.6 0.5 23.8 0.5 1.0 0.7 1.0 0.5 2.3 Diabetes 5.4 3.5 0.5 1.0 0.6 0.6 0.1 0.3 0.1 0.1 Gouty arthritis 0.6 16.1 4.9 1.7 9.0 0.8 3.1 0.3 1.3 0.1 Hypercholeste- rolemia 2.5 5.2 0.5 1.0 0.6 0.8 0.4 0.3 24.5 0.2
Skin iinfection/ clean wound 8.4 8.6 5.1 5.2 5.0 3.8 4.8 80.5 12.2 55.0
Diuretic/for urinary stone 0.9 27.2 2.2 6.7 6.2 6.3 0.8 1.1 0.3 0.5
Other 39.5 22.3 25.2 18.6 37.1 14.8 24.7 11.5 64.9 37.2
Note: Numbers in bold indicate accepted uses of the particular herb.
While familiarity with some traditional medicines is high, the perception on the correct use of specific herbal medicines is generally low except for bayabas. In Table 10.14, the correct use of the different herbal medicines is highlighted in bold. Around 81 percent of those who said they were familiar with bayabas correctly identified it as used to clean wounds. On the other hand, only 5 percent of those who said that they were familiar with ampalaya correctly identified it as used to treat diabetes mellitus and only 6 percent of those who claimed familiarity with sambong knew that it is used as a diuretic and facilitates the excretion of urinary stones.
159

Respondents were asked what traditional medicines were used during the 3 months prior to the interview. Bayabas was the most often used (34 percent) followed by sambong (23 percent), bawang (23 percent) and ampalaya (19 percent). Least used is niyogniyogan (2 percent), ulasimang bato (6 percent), tsaang gubat (6 percent), acapulco (9 percent), and lagundi and yerba buena (9 and 13 percent, respectively) (data not shown).
Questions regarding awareness of the Department of Health's endorsement of the 10 traditional medicines was included in the questionnaire. The result reveals that more household respondents were aware of the DOH endorsement of bayabas than any other herbal medicine.
10.6 Health Facility Utilization
Health facilities that are most widely used by the general population are either government or private health units. The government health facilities are either those retained by the Department of Health such as the regional hospitals or those health facilities that were devolved to the local governments such as the provincial, district, and municipal hospitals as well as the outpatient care centers, such as the rural health units (9 percent), barangay health stations (17 percent) and private clinics (13 percent).
In the 6 months prior to the survey, around 50 percent of households utilized a health facility for health care services (Table 10.15). Among hospitals, private hospitals are most utilized, followed by the provincial hospitals (9 and 4 percent, respectively). The regional hospitals are used by only 2 percent of households.
Households in Metro Manila are more likely to go to private clinics and private hospitals for health care services compared with households in other regions. Households in Ilocos and Cordillera Administrative Region are more likely to patronize the provincial hospitals than the rest of the regions. In Eastern Visayas, households visit district hospitals more often than households in than other regions.
Table 10.16 shows that among the household members who went to regional hospitals, the services mostly utilized were: treatment of illnesses, routine checkups, laboratory services, and antenatal, delivery, and postpartum care. Those who went to provincial and district hospitals visited these facilities for treatment of illnesses and injuries as well as for routine checkups and laboratory services. The barangay health stations and rural health units are generally utilized by households for most health care services but are least likely to be used for laboratory services and health and nutrition education.
160

Table 10.15 Utilization of health facilities
Percentage of househoIds that utilized specific health facilities in the six months preceding the survey, by region, Philippines 1998
Health facility
Region
Rural Barangay Any Regional Provincial District Municipal health hea l th Private Private health hospital hospital hospital hospital unit station hospital clinic Other facility
Metro Manila 0~6 1.5 1.2 1.3 13.7 5.9 17.0 19.6 6.1 55.5 Cordillera Admin. 1.9 10.3 4.8 2.3 13.2 8.9 9.4 7.9 1.0 51.7 llocos 2,3 10.0 6.8 0.8 8.8 20.1 7.0 12.2 0.0 51.4 Cagayan Valley 2.3 4.9 3.3 1.7 7.8 12.6 7.1 9.1 0.7 45.1 C. Luzon 0,4 4.4 3.5 0.4 2.5 12.4 8.0 13.1 2.0 41.3 S. Tagalog 0,7 2.4 1.0 2.8 8.4 20.6 9.3 13.0 0.7 51.9 Bicol 2,6 4.2 1.5 2.2 8.3 24.3 4.2 7.8 1.3 49.1 W. Visayas 2.4 5.4 9.1 4.1 10.1 21.6 7.2 14.5 2.5 57.0 C. Visayas 1.8 4.8 2.1 0.4 7.4 22.4 9.4 14.5 0.7 50.5 E. Visayas 2,2 5.4 11.5 3.0 14.6 15.6 3.4 9.7 3.2 53.7 W. Mindanao 2,6 2.7 0.7 2.2 8.4 18.2 7.9 5.0 1.1 42.8 N. Mindanao 0.6 5.8 1.4 4.7 6.7 24.0 9.0 6.4 1.5 52.5 S. Mindanao 3,3 2.9 2.1 1.5 4.5 21.8 10.2 12.4 0.2 44.6 C. Mindanao 1,4 3.1 1.2 4.8 6.3 13.4 10.8 12.4 0.5 41.9 ARMM 3,1 4.7 2.0 1.2 8.1 13.9 3.8 7.3 0.8 37.8 Caraga 0.9 6.1 4.6 2.2 11.3 21.6 6.8 7.0 0.7 50.1
Total 1.5 4.2 3.3 2.0 8.7 16.9 9.2 12.6 1.9 49.7
161

Table 10.16 Utilization of health facilities bv Woe of service accessed
Percentage of households that utilized specific health facilities, by type of service accessed, Philippines 1998
Health facility
Type of service Regional Provincial District Municipal hospital hospital hospital hospital
Rural Barangay Any health heal th Private Private health unit station hospital clinic Other facility
Treatment when ill or injured 59.0 56.1 64.7 64.7 43.1 33.0 57.4 55.0 53.6 48.5
Routine checkup 33.6 38.5 30.3 44.2 44.6 38.0 56.1 56.7 53.5 45.8 Laboratory service 26.3 24.2 17.4 15.0 4.9 0.0 32.4 16,3 24.5 13.6 Immunization 4.2 3.2 2.8 5.8 22.1 30.9 5.3 5.2 5.7 14.6 Family planning 4.8 2.6 1.9 5.2 14.2 16.1 2.6 3.1 4.2 8.3 Health and nutrition education 2.8 2.9 1,2 2.4 7.1 4.6 3.8 2.8 6.4 4.1 Prenatal delivery,
postnatal 11.7 15.1 8.4 6.4 10.2 12.6 10.4 6.0 6.2 10.0 Other 10.2 7.4 9.8 8.1 8.7 5.4 4.3 6.2 17.7 6.9
RHU = Rural health unit BHS = Barangay health station
Figure 10.2 Percentage of Households that Utilized Health Facilities
in the 6 Months Preceding the Survey Percent
18
16
14
12
10
8 6
4
2
0 Regional Provincial 'District Municipal hospital hospital hospital hospital
BHS = Barangay health station RHU = Rural health unit
BHS RHU Private Private Other hospital clinic
1998 NDHS
162

REFERENCES
Central Bureau of Statistics (CBS) [Indonesia], National Family Planning Coordinating Board, Ministry of Health, and Macro International (MI), 1998. Indonesia Demographic and Health Survey 199Z Columbia, Maryland: CBS and MI.
Commission on Population (POPCOM). 1997. The Directional Plan of the Philippine Population Management Program. Manila: POPCOM.
Concepcion, M.B. 1991. Fertility and Contraception in the Philippines." Glimpses from the 1986 Contraceptive Prevalence Survey. Manila: Population Institute, University of the Philippines.
Department of Health [Philippines]. 1990 The Contribution of the Department of Health to the Philippine Family Planning Program. Manila.
E1-Zanaty, F.H., H.A.A. Sayed, H.H.M. Zaky, and A.A. Way. 1993. Egypt Demographic and Health Survey 1992. Calverton, Maryland: National Population Council and Macro International.
Macro Intemational Inc. 1992. Guidelines for the DHS II First Country Report: Working Draft. Columbia, Maryland.
Madigan, F.C. 1985. Infant Mortality by Socioeconomic Variables, Philippines, 1983. Report No .4 Series 1 for the 1983 National Demographic Survey. Cagayan de Oro City, Philippines: Research Institute for Mindanao Culture, Xavier University.
National Statistics Office (NSO) [Philippines]. 1996. 1996 Family Planning Survey, Final Report. Manila.
National Statistics Office (NSO) [Philippines]. 1997. 1997 Family Planning Survey, Final Report. Manila.
National Statistics Office (NSO) [Philippines] and Macro Intemational Inc. (MI). 1994. National Demographic Survey 1993. Manila.
National Statistics Office [Philippines]. 1992. 1990 Census of Population and Housing. Report No .3: Socioeconomic and Demographic Characteristics. Manila.
Philippine NGO Council on Population, Health and Welfare (PNGOC). 1997. 'The Philippine Population Program: Historical Perspective,' Link, 7(2 "d Quarter): 23-25. Quezon City.
Population Reference Bureau, 1998. 1998 World Population Data Sheet. Washington D.C..
World Bank. 1991. New Directions in the Philippines Family Planning Program. Report No. 9579-PH. Washington, DC.
[World Fertility Survey] National Census and Statistics Office (NCSO); University of the Philippines Population Institute, Commission on Population; and National Economic and Development Authority. 1979. Republic of the Philippines Fertility Survey 1978: First Report. Manila: NCSO and World Fertility Survey.
163


APPENDIX A
SAMPLE DESIGN


APPENDIX A
SAMPLE DESIGN
Based on the objective of providing reliable results at the regional level, a subsample size of 755 EAs were selected from the ISH master sample. To maximize the efficiency of the sample design, the sample was allocated to the regions using a method called "power allocation procedure". This method takes into account the size of the domain and the precision of important characteristics based on the I993 National Demographic Survey (NDS).
In order to ensure that the sample in each region is self-weighting, the actual number of households, nhijk ' in each EA was determined based on the overall sampling rate per region using the expression below:
wh~e:
nhijk NhU k ' *f
P l h q k
f -- sampling fraction
Required Estimated Sample Size for the Region
Weighted HH Estimate for the Region from NDHS Listing
N h ~ k ' = number of households from the NDHS listing for the k-th sample segment in t he j - t h sample EA in the i-th sample barangay in stratum h
P l h i j k = Probability of selection for the NDHS sample segment j - th sample EA in the i-th sample barangay in stratum h
in the
Hence, the probability of selection in all sampling stages considering the updating of the frame based from the 1995 POPCEN and the segmenting of large EAs in NCR can now be expressed as follows:
= b x Nhi x NhU x Nhok x nh~i* • Nh Nhi N ' '
h hlj Nhok
167

where: bh number of sample EAs (or segments) selected in stratum h
(urban and rural areas of large c i ty /munic ipa l i ty domain, city, other urban or rural, within province) for the NDHS
Nh = total number of households from the 1995 POPCEN frame (cumulated measure size) for stratum h
= number of households from the 1995 POPCEN frame in the i-th sample barangay in stratum h
arhq = number of households from the 1995 POPCEN frame for t he j - t h sample EA in the i-th sample barangay in stratum h
Nh/j' number of households from the frame of segments (cumulated measure of s ize 'o f the segments) for t h e j - t h sample EA in the i-th sample barangay in stratum h
Nhqk number of households from the frame of segments for the k-th sample segment in the j- th sample EA in the i-th sample barangay in stratum h
Nh/jk ' number of households from the l i s t ing for the k-th sample segment in t he j - th sample EA in the i-th sample barangay in stratum h
nhqk number of households selected for the NDHS in the k-th sample segment in t he j - th sample EA in the i-th sample barangay in the i-th sample PSU in stratum h
Of the total NDHS sample areas, only 753 EAs were listed. Hence, the probabilities of selection (Plhi jk) for the affected strata were adjusted before the selection of the sample households. Consequently, the number of households selected in the remaining EAs for these strata increased. The adjustment factor can be defined as follows:
b h '
bh
where b h ' is the total number of EAs actually listed.
The total number of sample households selected is about 13,708 households. For urban areas, the sample households were selected systematically. Cluster sampling on the other hand was applied in selecting sample households for rural areas to facilitate field operation. Two clusters of households for each rural barangay/EA/segment were selected.
168

A,I Sample Implementation
Percent Distribution of Households and eligible Women in the DHS sample by results of the interview, and household response rates, eligible women reponse rates, and overall reponse rates, according to region and urban-rural area, Phililppines 1998
Re~ion Result Metro Cordillera Cagayan C- S- W- C- E-
Manila Admin. Ilocos Valley Luzon Tal~alo8 Bieol Visayas Visas, as Visayas
Selected household Completed (C) 82.9 84.4 Household present but no competent respondent at home (HP) 1.6 2.9 Refused (R) 2.0 0,4 Dwelling not found (DNF) 0.0 1.0 Household absent 1.8 3.8 Dwelling vacant (DV) 10.5 6.9 Dwelling destroyed (DD) 0,9 0.4 Other 0.3 0.3
90.0 95.0 93,1 90.3 92.8 91,9 93.9 91.6
0.3 0.1 0.2 0.7 0.2 0,3 0.8 0.2 0.0 0.0 0.3 0.0 0.0 0.I 0.1 0.0 0.0 0.0 0.0 0.1 0.0 0,4 0,0 0.1 1,2 0.1 1.2 0.8 1.2 1,5 0.2 2.0 8.2 4.3 4.7 7.9 5.5 5.4 5.0 5.1 0.0 0.3 0.2 0.3 0.1 0.3 0.0 1.0 0.3 0.I 0.2 0.0 0.I 0,0 0.0 0.0
Total Percent 100.0 I00,0 100.0 100.0 100.0 100.0 100.0 100,0 I00,0 100.0 Number 1169 735 730 726 911 1189 816 913 905 913
Household response
rate (HRR) I 95.8 95.2 99.7 99.9 99.4 99.2 99.7 99,1 99.1 99.6
Eligible women Completed (EWC) 95.6 91.9 98.5 98.1 96.8 98.3 97.5 97,4 96.6 97.3 Not at home (EWNH) 2,4 4.2 0.1 1.0 1.4 0.7 1.0 1,2 1.9 1.3 Postponed (EWP) 0,0 0.3 0.0 0.0 0.0 0.0 0.1 0.0 0.0 0.0 Refused (fiWR) 0.8 1.7 0.1 0.1 0.2 0.1 0.1 0,2 0,5 0.0 Partly completed (EWPC) 0.3 0,0 0.0 0.0 0.2 0.0 0.0 0.0 0.0 0.0 Incapaultated (EWI) 0.3 1.6 1.3 0.8 0,9 0.4 1.0 1.1 0.9 1.3 Other (EWO) 0.6 0.3 0.0 0.0 0.5 0.5 0.1 0.1 0.1 0. I
Total percent 100.0 100,0 100.0 100,0 100.0 100,0 100.0 100.0 100,0 100,0 Number 1559 641 720 731 985 1202 764 906 1028 791
Elligible women reponse
rate (EWRR) 2
Overall response rate (ORR) 3
95.6 91.9 98.5 98.1 96.8 98.3 97.5 97.4 96,6 97.3
91.6 87.5 98.2 97.9 96,2 97.4 97.3 96.4 95.7 97.0 Note: The household response rate is calculated for completed househoJds as a proportion of completed, no competent respondent, postponed, refused, and dwelling not found. The eligible woman response rate is calculated for completed interviews as a proportion of compteted, not at home, postponed, refused, partially completed, incapacitated and "other." The overall response rate is the product of the household and woman response.
Using the number of households farting into specific response ca egones, the household response rate (HRR) is calcula ed as:
C C + HP + R +DNF
2Using the number of eligible women falling into specific response categories, the eligible woman response rate (EWRR) is calculated as:
EWC EWC+EWN H+EWP+EWR+EWPC+EWI+EWO
3The overall response rate (ORR) is calculated as: ORR = HRR + EWRR
169

A, l --continued
Percent Distribution of Households and eligible Women in the DHS sample by results of the interview, and household response rates, eligible women reponse rates, and overall reponse rates, according to region and urban.rural area, Phililppines I998
Re~ion Residence Result W- N- S- C-
Mindanao Mindanao Mindanao Mindanao ARMM Cara~a Urban Rural Total
Selected household Completed (C) 92.I 89.5 89.3 91.5 89.8 92.5 89.2 91.5 90.5 Household present but no competent respondent at home (HP) 012 0.1 0.1 1.1 2.1 0.0 0.9 0.5 0.7 Refused (R) 0.0 0.0 0.0 0.3 0.0 0.0 0.5 0.0 0.2 Dwelling not found (DNF) 0.0 0.0 1,2 0.6 0.7 0.0 0,4 0.1 0.2 Household absent 1.7 2.9 1.5 1.7 1.6 1.4 1.6 1.4 1.5 Dwelling vacant (DV) 5.5 7.4 6.4 4. l 5.3 5.8 6.7 6.0 6.3 Dwelling destroyed (DD) 0.5 0A 1.4 0.6 0.4 0.4 0.$ 0.4 0.8 Other 0.0 0.0 0.0 0.1 0.0 0.0 0.1 0.1 0A
Total Percent 100.0 I00.0 100.0 100.0 100.0 100.0 100.0 100.0 100.0 Number 884 732 919 707 729 730 5822 7886 13708
Household response
rate (HRR) I 99.8 99.8 98.6 97.9 97.0 100.0 98.0 99.3 98.7
Eligible women Completed (EWC) 99.2 99.5 97.3 94,9 97.6 98.2 96.8 97.5 97.2 Not at home (EWNH) 0.0 0.1 2,0 3.9 1,8 1.0 1.9 I. 1 1.5 Postponed (EWP) 0.0 0.0 0,0 0.0 0.0 0.0 0,0 0.0 0.0 Refused (EWR) 0.0 0.0 0.2 0.3 0.2 0.0 0.4 0.2 0.3 Partly completed (EWPC) 0.1 0.0 0.0 0.0 0.0 0.0 O. 1 0,0 0.0 Incapacitated (EWI) 0.3 0.3 0.5 0,6 0.4 0.7 0.5 0.9 0.7 Other (EWe) 0.4 0.1 0.0 0.4 0.0 0.1 0.3 0.2 0.3
Total percent 100,0 100.0 100.0 100.0 100.0 100.0 100.0 100.0 100.0 Number 981 785 1012 719 830 736 6954 7436 14390
Elligible women reponse rate (EWRR)
Overall response rate (eRR) 3
99.2 99.5 97.3 94.9 97.6 98.2 96.8 97.5 97.2
98.9 99.3 95.9 92.8 94.7 98.2 94.8 96.8 95.9 Note: The household response rate is calculated for completed households as a proportion of completed, no competent respondent, postponed, refused, and dwelling not found. The eligible woman n-~sponse rate is calculated for completed interviews as a proportion of completed, not at home, postponed, refused, partially completed, incapacitated and "other." The overall response rate is the product of the household and woman response.
fUsing the number of households falling into specific response categories, the household response rate (HRR) is calculated as:
C C + H P + R + D N F
2Using the number of eligible women falling into specific response categories, the eligible woman response rate (EWRR) is calculated as:
EWC EWC+EWNH+EWP+EWR+EWPC+EWI+EWO
3The overall response rate (ORR) is calculated as: ORR-- HRR + EWRR
I?0

APPENDIX B
ESTIMATES OF SAMPLING ERRORS


APPENDIX B
ESTIMATES OF SAMPLING ERRORS
The estimates from a sample survey are affected by two types of errors: (1) nonsumpling errors, and (2) sampling errors. Nonsampling errors are the results of mistakes made in implementing data collection and data processing, such as failure to locate and interview the correct household, misunderstanding of the questions on the part of either the interviewer or the respondent, and data enlry errors. Although numerous efforts were made during the implementation of the NDHS to minimize this type of error, nonsampling errors are impossible to avoid and difficult to evaluate statistically.
Sampling errors, on the other hand, can be evaluated statistically. The sample of respondants selected in the NDHS is only one of many samples that could have been selected from the same population, using the same design and expected size. Each of these samples would yield results that differ somewhat from the results of the actual sample selected. Sampling errors are a measure of the variability between all possible samples. Although the degree of variability is not known exactly, it can be estimated from the survey results.
A sampling error is usually measured in terms of the standard error for a particular statistic (mean, percentage, etc.), which is the square root of the variance. The standard error can be used to calculate confidence intervals within which the lrue value for the population can reasonably be assumed to fall. For example, for any given statistic calculated from a sample survey, the value of that statistic will fall within a range of plus or minus two times the standard error of that statistic in 95 percent of all possible samples of identical size and design.
I f the sample of respondents had been selected as a simple random sample, it would have been possible to use straightforward formulas for calculating sampling errors. However, the NDHS sample is the result of a two-stage stratified design, and, eousequently, it was necessary to use more complex formulae. The computer software used to calculate sampling errors for the NDHS is the ISSA Sampling Error Module. This module used the Taylor linearization method of variance estimation for survey estimates that are means or proportions. The Jackknife repeated replication method is used for variance estimation of more complex statistics such as fertility and mortality rates.
The Taylor linearization method treats any percentage or average as a ratio estimate, r = y/x, where y represents the total sample value for variable y, and x represents the total number of cases in the group or subgroup under consideration. The variance o f r is computed using the formula given below with the standard error being the square root of the variance:
7 roT1 Lz ,- t=I m h
in which
ghi = Y h i - r . X h i , a n d z h = Y h - r . x h
where h rnh Yhl xhj f
represents the stratum which varies from 1 to H, is the total number of enumeration areas (EAs) selected in the h th stratum, is the sum of the values of variable y in the t e EA in the h t~ stratum, is the sum of the number of eases in the t ~ EA in the h th stratum, and is the overall sampling fraction, which is so small that it is ignored.
The Jackknife repeated replication method derives estimates of complex rates from each of several replications of the parent sample, and calculates standard errors for these estimates using simple formulae. Each replication considers
173

all but one clusters in the calculation of the estimates. Pseudo-independent replications are thus created. In the NDHS, there were 752 non-empty clusters. Hence, 751 replications were created. The variance of a rate r is calculated as follows:
S E 2(R) = v a r ( r ) - k
1 E ( r i _ r )2 k(k-1) i=1
in which
r i = k r - (k-1)r(i)
where r
r0) k
is the estimate computed fi'om the full sample of 752 clusters, is the estimate computed from the reduced sample of 751 clusters (t ~ cluster excluded), and is the total number of clusters.
In addition to the standard error, ISSA computes the design effect (DEFT) for each estimate, which is defined as the ratio between the standard error using the given sample design and the standard error that would result i ra simple random sample had been used. A DEFT value of 1.0 indicates that the sample design is as efficient as a simple random sample, while a value greater than 1.0 indicates the increase in the sampling error due to the use of a more complex and less statistically efficient design. ISSA also computes the relative error and confidence limits for the estimates.
Sampling errors for the NDHS are calculated for selected variables considered to be of primary interest. The results are presented in this appendix for the country as a whole, for urban and rural areas, and for each of the 16 regions. For eanh variable, the type of statistic (mean, proportion, or rate) and the base population are given in Table B. 1. Tables B.I.1 to B.1.19 present the value of the statistic (R), its standard error (SE), the number of unweighted (N) and weighted (WN) cases, the design effect (DEFT), the relative standard error (SE/R), and the 95 percent confidence limits (Pd:2SE), for each variable. The DEFT is considered undefined when the standard error considering simple random sample is zero (when the estimate is close to 0 or 1). In the case of the total fertility rate, the number ofunweighted cases is not relevant since there is no known unweighted value for woman-years of exposure to childbearing.
The confidence interval (e.g., as calculated for children ever born to women age 15-49) can be interpreted as follows: the overall average from the national sample is 2.156 and its standard error is .029. Therefore, to obtain the 95 percent confidence limits, one adds and subtracts twice the standard error to the sample estimate, i.e., 2.156:t:2 x.029. There is a high probability (95 percent) that the true average number of children ever born to all women aged 15 to 49 is between 2.098 and 2.214.
Sampling errors are analyzed for the national sample and for two separate groups of estimates: (1) means and proportions, and (2) complex demographic rates. The relative standard errors (SE/R) for the means and proportions range between 0 percent and 33 percent with an average of 3.6 percent; the highest relative standard errors are for estimates of very low values (e.g., currently using male sterilization among currently married women). If estimates of very low values (less than 10 percent) were removed, than the average drops to 1.8 percent. So in general, the relative standard error for most estimates for the country as a whole is small, except for estimates of very small proportions. The relative standard error for the total fertility rate is small, 2.3 percent. However, for the mortality rates, the average relative standard error is higher, 8.4 percent.
There are differentials in the relative standard error for the estimates of sub-populations. For example, for the variable with secondary education or higher, the relative standard errors as a percent of the estimated mean for the whole country, for the rural areas, and for Cagayan Valley Region are 0.9 percent, 1.8 percent, and 5.4 percent, respectively.
For the total sample, the value of the design effect (DEFT) averaged over all variables is 1.27, which means that due to multi-stage clustering of the sample variance is increased by a factor of 1.56 over that in an equivalent simple random sample.
174

Table B.I.I Sampling errors: Entire sample,'Philippines 1998
Variables
Number of eases
Standard Un- Weight- Design Relative Confidence limits Value error weighted ed effect error
(R) (SE) (N) (WN) (DEFT) (SE/R) R-2SE R+2SE
Urban 0.566 0.007 13983 13983 1.679 0.012 0.552 0.580
No education 0.017 0.002 13983 13983 1,483 0.094 0.014 0.021 With edueatlon 0.722 0.006 13983 13983 1.631 0.009 0.710 0.735
Never Married 0,364 0,006 13983 13983 1.550 0.017 0.351 0.376 Currently in union 0.596 0,007 13983 13983 1,586 0.011 0.583 0.609 Married before age of 20 0,324 0.007 11034 1 I059 1.527 0.021 0.311 0.338 Had filet sexual intercourse before 18 0.171 0,005 11034 11059 1,341 0,028 0.162 0.181
Children ever born 2.156 0.029 13983 13983 1,369 0,013 2.098 2.214 Children ever born to women over 40 4.419 0,067 2693 2651 1,186 0.015 4.286 4.553 Children Surviving 2.001 0.026 13983 13983 1.364 0.013 1.949 2.054
Know any method 0.985 0,002 8634 8336 Know any modern method 0.979 0.002 8634 8336 Ever used any contraceptive method 0.694 0,006 8634 8336 Currently using any method 0.465 0.007 8634 8336 Currently using a modern method 0,282 0.006 8634 8336 Currently using pill 0.099 0,004 8634 8336 Currently using IUD 0,037 0,003 8634 8336 Currently using injection 0,024 0.002 8634 8336 Currently using condom 0.016 0.002 8634 8336 Currently using female sterilization 0.103 0.004 8634 8336 Curcently using male sterilization 0.001 0,000 8634 8336 Currently using perlodie abstinence 0.087 0.003 8634 8336 Currently using withdrawal 0.089 0,003 8634 8336 Public source user 0.720 0.012 2439 2403
Want no more children 0.619 0.006 8634 8336 Want to delay next birth at least 2 years 0.187 0.005 8634 8336 Ideal number of children 3.202 0.015 13693 13736
Mother received tetanus injections Received medical care at birth
0.685 0,008 8083 7566 0,564 0,010 8083 7566
Had diarrhea in last 2 weeks 0.074 0.004 7751 7286 Received ORS treatment 0.434 0,023 604 539 Received medical treatment 0,439 0,023 604 539
Having health card 0,414 0.015 1554 1474 Received BCG vaccination 0.908 0,008 1554 1474 Received DPT vaccination (3 doses) 0.809 0.012 1554 1474 Received polio vaccination (3 doses) 0,817 0,012 1554 1474 Received measles vaccination 0.789 0.013 1554 1474 Fully immunized 0.728 0.014 1554 1474
Total fertility rate 3.730 0.084 HA 39113
1.184 0.002 0,982 0,988 1,181 0.002 0.976 0.983 1.266 0.009 0.681 0.706 1,256 0.014 0.452 0.479 1.216 0.021 0.270 0.294 1.251 0.041 0.091 0.107 1.267 0.070 0.032 0.042 1.354 0.094 0.019 0.028 1.224 0.103 0.013 0.019 1.288 0.041 0.095 0.111 1.126 0.325 0.000 0.002 1,095 0.038 0.080 0.093 1.104 0.038 0.082 0.095 1.334 0.017 0.695 0.744
1.187 0.010 0.606 0,631 1,112 0,025 0.178 0.196 1,170 0.005 3.173 3.231
1,231 0.012 0.669 0.700 1.417 0.018 0.543 0.585
1.107 0.048 0.067 0.081 1.022 0.053 0.388 0.479 1.047 0.052 0.393 0.485
1,191 0.037 0.383 0.445 1.I02 0,009 0.891 0,924 1.194 0.015 0.784 0.833 1.196 0.015 0.793 0.842 1.200 0.016 0.763 0.814 1.222 0.020 0.700 0.757
1.434 0.023 3.561 3.898
Neonatal mortality rate 17,800 1.736 8279 7742 1,086 0.098 I4.328 21.273 Infant mortality rate 35,134 2.302 8297 7756 1,049 0.066 30.530 39.739 Child mortality rate 13.778 1,511 8341 779I 1.094 0.110 10.756 16.801 Under 5 child mortality rate 48.428 2.844 8359 7805 1.090 0.059 42.741 54.115 Postneonatal mortality rate 17.334 1,492 8297 7756 0.986 0.086 14.349 20.319
N.A. = Not Applicable
175

Table B.1.2 Sampling errors: Urban sample, Philippines 1998
Value Variables (R)
Number of eases
Standard Un- Weight- Design Relative Confidence limits error weighted ed effect error (SE) 0"4) (WN) (DEFT) (SErR) R,2SE R+2SE
Urban 1.000 0,000 6730 7911
No education 0,006 0.001 6730 7911 With education 0,820 0.007 6730 7911
Never Married 0,419 0,010 6730 7911 Currently in union 0,534 0.010 6730 7911 Married before age of 20 0.258 0,010 5238 6210 Had first sexual intercourse before 18 0,133 0.007 5238 6210
Children ever born 1.741 0.038 6730 7911 Children ever born to women over 40 3.696 0,084 1255 1438 Children Surviving 1.637 0.035 6730 7911
Know any method 0.993 0.001 3680 4222 Know any modem method 0.990 0.002 3680 4222 Ever used any contraceptive method 0.741 0.008 3680 4222 Currently using any method 0.507 0.009 3680 4222 Currently using a modem method 0.313 0.008 3680 4222 Currently using pill 0.107 0.006 3680 4222 Currently using IUD 0.034 0.004 3680 4222 Currently using injection 0,023 0.003 3680 4222 Currently using condom 0,019 0.003 3680 4222 Currently using female sterilization 0,126 0.007 3680 4222 Currently using male sterilization 0.001 0.000 3680 4222 Currently using periodic abstinence 0.093 0.005 3680 4222 Currently using withdrawal 0.093 0.005 3680 4222 Public source user 0,622 0,017 1193 1363
Want no more children Want to delay next birth at least 2 years Ideal number of children
Motherreceivedtetanusinjections Received medical care atbirth
NA 0.000 1.000 1.000
1.080 0.167 0.004 0,008 1.477 0.008 0.806 0.833
1.594 0,023 0.400 0.438 1.643 0.019 0.514 0.554 1.626 0.038 0.239 0,278 1.437 0,051 0.119 0.146
1.447 0,022 1.664 1.817 1,166 0,023 3.528 3.865 1,438 0,021 1.567 1,708
0,980 0.001 0.990 0.996 1.074 0.002 0.987 0.994 1,118 0.011 0.725 0357 1.138 0.018 0,488 0,526 1,030 0,025 0.297 0,329 1,221 0.058 0,095 0.120 1,247 0.110 0.027 0.042 1,320 0.142 0,016 0.030 1.189 0.141 0.014 0.024 1.236 0.054 0,113 0.140 0.956 0.523 0.000 0.002 1.050 0.054 0.083 0.104 0.994 0,051 0.083 0.102 1.246 0,028 0,587 0,657
0.600 0,010 3680 4222 1.198 0.016 0.581 0,620 0.186 0,007 3680 4222 1,129 0.039 0.172 0,201 3.052 0.018 6628 7801 1.094 0.006 3.016 3.087
0.685 0.012 3079 3465 1.152 0.017 0.662 0.709 0.786 0.012 3079 3465 1.233 0.015 0.762 0.809
Had diarrhea in last 2 weeks 0.065 0.005 2979 3360 1.068 0.079 0.054 0.075 Received ORS treatment 0.447 0.039 201 218 1.044 0.087 0.369 0.525 Received medical treatment 0,478 0,037 201 218 1.017 0,078 0.404 0.553
Having health card 0.421 0.022 614 700 Received BCG vaccination 0.950 0.010 614 700 Received DPT vaccination (3 doses) 0.855 0.020 614 700 Received polio vaccination (3 doses) 0.865 0.019 614 700 Received measles vaccination 0.822 0.018 614 700 Fully immunized 0.761 0.022 614 700
1.078 0,052 0.377 0.464 1.071 0,010 0.931 0.969 1,353 0.023 0.815 0.895 1.277 0.022 0,817 0.892 1,179 0.022 0.785 0.859 1,277 0.030 0.716 0,806
Total fertillty rate 3.012 0.096 NA 22194 1.250 0.032 2,819 3.204
Neonatal mortality rate 17.613 2.074 6171 6907 1,080 0.118 13.465 21.761 Infant mortallty rate 30.890 2.607 6174 6910 1.064 0.084 25.677 36.103 Child mortality rate 15.369 1.852 6196 6933 1.031 0.121 11.665 19.073 Undar 5 child mortality rate 45.784 3.304 6199 6936 1.086 0.072 39.177 52.391 Postneonatal mortality rate 13,277 1.562 6174 6910 1,007 0.118 10.153 16.402
N.A. = Not Applicable
176

Table B. 1.3 Sampling errors: Rural sample, Philippines 1998
Variables
Number &eases
Standard Un- Weight- Design Relative Confidence limits Value error weighted ed effect error
(R) (SE) (2q) (WN) (DEFT) (SE/R) R-2SE R+2SE
Urban
No education With education
Never Married Currently in union Married before age of 20 Had first sexual intercourse before 18
Children ever born Children ever born to women over 40 Children Surviving
Kt3o~v a~y m~tb~ Know any modem method Ever used any contraceptive method Currently using any method Currently using a modem method Currently using pill Cun'ently using IUD Currently using injection Currently using condom Currently using female sterilization Currently using male sterilization Currently using periodic abstinence Currently using withdrawal Public source user
Want no more children Want to delay next birth at least 2 years Ideal number of children
Mother received tetanus injections Received medical care at birth
Had diarrhea in last 2 weeks Received ORS treatment Received medical treatment
Having health card Received BCG vaccination Received DPT vaccination (3 doses) Received polio vaccination (3 doses) Received measles vaccination Fully immunized
Total fertility rate
0.000 0,000 7253 6072
0.032 0,004 7253 6072 0.596 0,011 7253 6072
0.292 0.007 7253 6072 0.678 0.007 7253 6072 0.409 0,008 5796 4848 0.221 0.007 5796 4848
2,696 0,040 7253 6072 5.277 0.098 1438 1212 2.476 0,036 7253 6072
fi,977 0.~33 4954 4114 0,968 0.003 4954 4114 0.645 0.009 4954 4114 0,422 0.010 4954 4114 0.250 0,009 4954 4114 0.091 0.005 4954 4114 0.040 0,004 4954 4114 0.024 0.003 4954 4114 0.013 0.002 4954 4114 0.079 0.005 4954 4114 0,002 0.001 4954 4114 0.080 0.004 4954 4114 0.084 0.005 4954 4114 0.847 0.015 1246 1040
0.637 0.008 4954 4114 0.188 0,006 4954 4114 3.399 0.023 7065 5935
0,684 0.011 5004 4101 0.377 0.014 5004 4101
0.082 0.005 4772 3926 0.425 0,028 403 321 0.412 0,029 403 321
0.408 0,021 940 775 0.869 0.013 940 775 0.767 0.015 940 775 0.784 0.016 940 775 0.759 0.017 940 775 0,698 0.018 940 775
NA NA 0.000 0.000
1.708 0.111 0,025 0.039 1.833 0.018 0.575 0.617
1,233 0.023 0.278 0.305 1,219 0.010 0.664 0.691 1.292 0.020 0.392 0.425 1.207 0.030 0.208 0.234
1.211 0.015 2.616 2.775 1,209 0.019 5,081 5.473 1,201 0.014 2.405 2,547
1,316 0,003 0,972 0.983 1,272 0,003 0,962 0.975 1,384 0,015 0.626 0.664 1.860 0.023 0.403 0.442 1.395 0.034 0,233 0,267 1,221 0,055 0,081 0.101 1.268 0.089 0.033 0,047 1,365 0.124 0.018 0.030 1,189 0.146 0.009 0.017 1,272 0,062 0.069 0.089 1,255 0,411 0,000 0.003 1,122 0,054 0.071 0.088 1,214 0,057 0.075 0.094 1.447 0.017 0,817 0,876
1.120 0.012 0.622 0.652 1,054 0.031 0.176 0.200 1,239 0.007 3.352 3.446
1.330 0,016 0,662 0.705 1,595 0,037 0.349 0.405
1.168 0,060 0.072 0.092 1.032 0.065 0.369 0.480 1.108 0.071 0.354 0.471
1.323 0.053 0.365 0.451 1,159 0.015 0.843 0.895 1.101 0.020 0.736 0.797 1.153 0.020 0.752 0.815 1.241 0.023 0.724 0,794 1.189 0.026 0.662 0,734
4.674 0.113 NA 16919 1.366 0.024 4.447 4.900
Neonatal mortality rate 20.622 1.526 10173 8292 0.997 0.074 17.571 23,674 Infant mortality rate 40.183 2.169 10186 8301 1.049 0,054 35.845 44.520 Child moriality rate 23.251 1,961 10233 8341 1.139 0.084 19,329 27.172 Under 5 child mortality rate 62,499 3.190 10246 8351 1.188 0.051 56,119 68.880 Posmeonata[ mortality rate 19,560 1.467 10186 8301 1,044 0.075 16.626 22.494
N.A. = Not Applicable
177

Table B. 1.4 Sampling errors: Metropolitan Manila sample, Philippines 1998
Variables
Number of cases
Standard Un- Weight- Design Relative Confidence limits Value error weighted ed effect error
(R) (SE) (N) (WN) (DEFT) (SE/R) R-2SE R+2SE
Urban
No education With education
1.000 0.000 1490 2818
0.004 0.002 1490 2818 0.864 0.013 1490 2818
NA 0.000 1.000 1.000
1.14I 0.465 0.000 0.008 1.412 0.015 0.839 0.889
Never Married 0.484 0.022 1490 2818 1.710 0.046 0.440 0.528 Currently in union 0.460 0.023 1490 2818 1,767 0.050 0.415 0.506 Married belbre age of 20 0.217 0.020 1170 2213 1,676 0.093 0.177 0.258 Had first sexual intercourse before 18 0.113 0.013 1170 2213 1.378 0. I 13 0.087 0.138
Children ever born 1.374 0.082 1490 2818 Children ever born to women over 40 2.955 0.166 242 458 Children Surviving 1.311 0.076 1490 2818
Know any method 0.997 0.002 686 1298 Know any modem method 0.996 0.003 686 1298 Ever used any contraceptive method 0.714 0.017 686 1298 Currently using any method 0.494 0.021 686 1298 Currently using a modem method 0.287 0.016 686 1298 Currently using pill 0.106 0.014 686 1298 Currently using IUD 0.017 0.005 686 1298 Currently using injection 0.006 0.003 686 1298 Cunently using condom 0.031 0.007 686 1298 Currently using female sterilization 0.124 0.012 686 1298 Currently using male sterilization 0.000 O.OOO 686 1298 Currently using periodic abstinence 0.101 0.010 686 I298 Currently using withdrawal 0.096 0.009 686 1298 Public source user 0.463 0.036 205 388
Want no more children 0.545 0.020 Want to delay next birth at least 2 years 0.184 0.014 Ideal number of children 2.918 0.027
686 1298 686 1298
1467 2775
0,641 0.025 554 1048 0.915 0.015 554 1048
Mother received tetanus injections Received medical care at birth
Had diarrhea in last 2 weeks 0.056 0.011 539 1020 Received ORS treatment 0.500 0.078 30 57 Received medleal treatment 0.600 0.092 30 57
Having health card 0.370 0.044 119 225 Received BCG vaccination 0.950 0.023 119 225 Received DPT vaccination (3 doses) 0.849 0.048 I 19 225 Received polio vaccination (3 doses) 0.840 0.045 119 225 Received measles vaccination @815 0.039 119 225 Fully immunized 0.731 0.052 119 225
1,694 0.060 1.210 1.538 1.093 0.056 2.623 3.286 1.671 0.058 1.160 1,463
0.988 0.002 0.993 1.000 1.014 0.003 0.991 1.000 0.962 0.023 0.681 0.747 1.123 0.043 0.451 0.537 0.912 0.055 0.256 0.319 1.175 0.130 0.079 0.134 1.087 0.311 0.007 0.028 1.036 0.517 0.000 0.012 1.037 0.223 0.017 0.044 0.925 0.094 0.101 0.147
NA NA 0.000 0.000 0.876 0,100 0.080 0.121 0.830 0.097 0.078 0.115 1.027 0.077 0.392 0.535
1.044 0.036 0.505 0.585 0.955 0.077 0.155 0.212 0.928 0.009 2.863 2.972
1.058 0.039 0.590 0.691 1.082 0.017 0.885 0.945
1.109 0.196 0.034 0.077 0.856 0.156 0.344 0.656 1.032 0.154 0.415 0.785
0.983 0.118 0.283 0.457 1.137 0.024 0.904 0.995 1.379 0.056 0.754 0.944 1.276 0.053 0.751 0.930 1.101 0.048 0.737 0,893 1.267 0.072 0.626 0.836
Total fertility rate 2.486 0.188 NA 7971 1.201 0.076 2.109 2.863
Neonatal mortality rate 15.066 4,212 1073 2030 1.083 0.280 6.642 23.490 In rant moltality rate 23.653 5.627 1073 2030 1.198 0.238 12.400 34.907 Child momlality rate 15.307 4.025 1077 2037 1.018 0.263 7.258 23.356 Under 5 child mortality rate 38.598 7.402 1077 2037 1.208 0.192 23.794 53.402 Post neonatal mortality rate 8.587 3.136 1073 2030 IA13 0.365 2.316 14.859
N.A. = Not Applicable
178

Table B.I.5 Sampling errors: Cordillera Administrative Region sample, Philippines 1998
Variables
Numberofeases
Standard Un- Weight- Design Relative Confidence limits Value " error weighted ed effect error
(R) (SE) (N) (WN) (DEFT) (SE/R) R-2SE R+2SE
Urban 0.343 0.026 589
No education 0.036 0.009 589 With education 0.683 0.024 589
Never Married 0.307 0.015 589 Currently in union 0.655 0.017 589 Married before age of 20 0.417 0.025 458 Had first sexual intercourse before 18 0.251 0.023 458
Children ever born 2.849 0.126 589 Chddt~n ever born to women over 40 5.712 0.314 104 Children Surviving 2.593 0.115 589
Know any method 0.992 0.006 386 Know any modem method 0.990 0.006 386 Ever used any contraceptive method 0.632 0.045 386 Currently using any method 0.420 0.045 386 Currently using a modem method 0.306 0.033 386 Currently using pill 0.070 0.015 386 Currently using IUD 0.023 0.006 386 Currently using injection 0.039 0.012 386 Currently using condom 0.023 0.007 386 Currently using female sterilization 0.148 0.030 386 Currently using male sterilization 0.003 0.003 386 Currently using periodic abstinence 0.044 0.013 386 Currently using withdrawal 0.067 0.013 386 Publlcsoureeuser 0,818 0.037 121
Want no more children 0,614 0.026 Want to delay next birth at least 2 years 0.210 0.021 Ideal number of children 3.959 0.122
Mother received tetanus injections Received medical care at birth
207 1,345 0.077 0.290 0,396
207 1.160 0.249 0.018 0,053 207 1.227 0.035 0.635 0.730
207 0.765 0.047 0.278 0.336 207 0.878 0,026 0.621 0.690 161 1.070 0.059 0.368 0.466 161 1.130 0.091 0.205 0.297
207 1.044 0.044 2.596 3.102 37 0.989 0.055 5.083 6.340
207 1.076 0.044 2.363 2.822
136 1.304 0.006 0.981 1.000 136 1.227 0.006 0.977 1.000 136 1.832 0.071 0,542 0.722 136 1.803 0.108 0.329 0.510 136 1.418 0.109 0.239 0.372 136 1.169 0.217 0.040 0.100 136 0.785 0.259 0.011 0.035 136 1.189 0.301 0.015 0.062 136 0.914 0.302 0.009 0.037 136 1.658 0.203 0.088 0.208 136 1.007 1.007 0.000 0.008 136 1.265 0.300 0.018 0.070 136 1.022 0.194 0.041 0.093 42 1.044 0.045 0,745 ~892
386 136 1.050 0.042 0.562 0,666 386 136 1.001 0.099 0.168 0.251 581 204 1.309 0.031 3.714 4.203
0.663 0,031 424 0.481 0.030 424
Had diarrhea in last 2 weeks 0.120 0.023 407 Received ORS treatment 0.449 0.050 49 Received medical treatment 0.265 0.060 49
Having health card 0.361 0.067 83 Received BCG vaccination 0.904 0.027 83 Received DPT vaccination (3 doses) 0.807 0,058 83 Received pot[o vaccination (3 doses) 0.819 0.053 83 Received measles vaccination 0.807 0.049 83 Fully immunized 0.759 0.061 83
Total l~rtility rate 4.795 0.345 NA
149 1.155 0.046 0.601 0.724 149 0.995 0.062 0.422 0.541
143 1.350 0,187 0.075 0.165 17 0.709 0.112 0.348 0.550 17 0.957 0.228 0.144 0.386
29 1.275 0.186 0.227 0.496 29 0.843 0.030 0.849 0.958 29 1.346 0.072 0.691 0.924 29 1.263 0.065 0.712 0.926 29 1.139 0.061 0.709 0.906 29 1.306 0.081 0.636 0.882
575 1.140 0,072 4.106 5.484
302 1.026 0.330 6.346 31.037 302 1.077 0.195 26.066 59.299 303 1.021 0.342 3.207 17.090 303 1.215 0.197 31.759 73.036 302 1.228 0.271 10.996 36.986
Neonatal mortality rate 18.692 6.173 859 Infant mortality rate 42.682 8.308 859 Child mortality rate 10.148 3.471 863 Under 5 child mortality rate 52.398 10.319 863 Postneonatal mortality rate 23.901 6.498 859
N.A, = Not Applicable
179

Tables B.1.6 Sampling errors: Ilocos Region sample, Philippines 1998
Variables
Number &eases
Standard Un- Weight- Design Relative Confidence limits Value error weighted ed effect error
(R) (SE) (N) (WN) (DEFT) (SE/R) R-2SE R+2SE
Urban 0.358 0.021 709 689 1.139 0.057 0.317 0.399
No education 0.003 0.002 709 689 1.003 0.709 0.000 0.007 With education 0.770 0.025 709 689 1.599 0.033 0.720 0.821
Never Married 0.362 0.022 Currently in union 0.601 0.024 Married before age of 20 0.32I 0.017 Had first sexual intercourse before 18 0.129 0.014
Children ever born 2.216 0.127 Children ever born to women over 40 4.993 0.278 Children Surviving 2,056 0.116
Know any method 1.000 0.000 Know any modem method 1.000 0.000 Ever used any contraceptive method 0.615 0.026 Currently using any method 0.432 0.024 Currently using a modem method 0.286 0,026 Currently using pill 0.101 0,012 Currently using IUD 0,014 0.007 Currently using injection 0.026 0.008 Cun'ently using condom 0,009 0,005 Currently using female sterilization 0.134 0.020 Currently using male sterilization 0.002 0.002 Currently using periodic abstinence 0.033 0.007 Currently using withdrawal 0.110 0.011 Public source user 0.824 0.043
Want no more children 0.575 0.021 Want to delay next birth at least 2 years 0.195 0.022 Ideal number of children 3,230 0.070
Mother received tetanus injections Received medical care at birth
709 689 1.224 0.061 0.318 0.407 709 689 1.293 0.040 0.553 0.648 558 542 0.851 0.052 0.287 0.354 558 542 0.991 0.109 0.101 0.157
709 689 1.305 0.057 1.961 2.470 143 139 1.134 0.056 4.438 5.548 709 689 1.311 0,057 1.824 2.289
426 414 NA 0.000 1.000 1.000 426 414 NA 0.000 1.000 1.000 426 414 1,I00 0.042 0,563 0.667 426 414 0.985 0.055 0.385 0.479 426 414 1.179 0.090 0.235 0.338 426 414 0.812 0.118 0.077 0.125 426 414 1.175 0.477 0.001 0.028 426 414 1.079 0.321 0.009 0.042 426 414 0.999 0.498 0.000 0.019 426 414 1.195 0,147 0.094 0.173 426 414 1.001 1.001 0.000 0.007 426 414 0,818 0.215 0.019 0.047 426 414 0.737 0.102 0.088 0.133 125 121 1.245 0.052 0.739 0.909
426 414 0.886 0.037 0,533 0.618 426 414 1.125 0.111 0.152 0.238 700 680 1.509 0.022 3.090 3.370
0.684 0,039 354 344 1.273 0.057 0,605 0.762 0,664 0,045 354 344 1.392 0.068 0,574 0.754
Had diarrhea in last 2 weeks 0.067 0.024 Received ORS treatment 0.391 0.107 Received medical treatment 0.478 0.128
Having health card 0.282 0.037 Received BCG vaccination 0.859 0.037 Received DPT vaccination (3 doses) 0.690 0.037 Received perle vaccination (3 doses) 0.718 0.043 Received measles vaccination 0.704 0.063 Fully immunized 0.606 0.050
Total fertility rate 3,432 0.285
Neonatal mortality rate 27,682 6.072 Infant mortality rate 41.538 7.690 Child mm'tality rate 10.176 4.973 Under 5 child mortality rate 51.291 9.698 Posmeonatal mortality rate 13.856 4.597
342 332 1.570 0.362 0.019 0.I16 23 22 0.871 0,274 0.177 0.606 23 22 1.053 0,268 0.222 0.735
71 69 0.698 0.132 0.207 0.356 71 69 0.886 0.043 0.786 0.933 71 69 0.686 0.054 0.616 0.764 71 69 0.814 0.060 0.633 0.804 71 69 1.176 0.089 0.579 0.830 71 69 0,879 0.083 0.505 0.706
NA 1921 1.169 0.083 2.862 4.002
728 707 0.937 0.219 15.538 39,825 728 707 0.959 0.185 26,159 56.918 732 711 1.050 0.489 0.229 20.122 732 711 0.985 0.189 31.895 70.687 728 707 1.071 0.332 4.662 23.051
N.A. = Not Applicable
180

Table B.I.7 Sampling errors: Cagayan Valley sample, Philippines 1998
Variables
Number of eases
Standard Un- Weight- Design Relative Confidence limits Value error weighted etI ~ffe¢'~ error
(R) (SE) (N) (WN) (DEFT) (SE/R) R-2SE R+2SE
Urban 0.244 0.027 717 474
No education 0.020 0.010 717 474 With education 0.6~47 0.035 717 474
Never Married 0.279 0.016 717 474 Currently in union 0.679 0.020 717 474 Married before age of 20 0.454 0.031 557 368 Had first sexual intercourse before 18 0.223 0.026 557 368
Children ever born 2.275 0,099 717 474 Children ever born to women over 40 4.303 0.228 142 94 Children Surviving 2.126 0.088 717 474
Know any method 0.990 0.004 487 322 Know any modem method 0.984 0.007 487 322 Ever used any contraceptive method 0.674 0.030 487 322 Currently using any method 0.483 0.028 487 322 Currently using a modem method 0.388 0.031 487 322 Currently using pill 0.164 0.017 487 322 Currently using IUD 0.051 0.012 487 322 Currently using injection 0.045 0.015 487 322 Currently using condom 0.000 0.000 487 322 Currently using female sterilization 0.123 0.015 487 322 Currently using male sterilization 0.002 0.002 487 322 Currently using periodic abstinence 0.031 0.008 487 322 Currently using withdrawal 0.060 0.011 487 322 Public source user 0.849 0.028 192 127
Want no more children Want to delay next birth at least 2 years Idea~ number of children
Mother received tetanus injections Received medical care at birth
0.606 0.024 487 322 0.230 0.019 487 322 3.374 0.063 713 471
0.678 0.035 366 242 0.421 0.059 366 242
Had dian'hea in last 2 weeks 0.091 0.019 351 232 Received ORS treatment 0.375 0.119 32 21 Received medical treatment 0.313 0.094 32 21
Having health card 0.290 0.053 69 46 Received BCG vaccination 0.870 0.064 69 46 Received DPT vaccination (3 doses) 0.826 0.065 69 46 Reeelved polio vaccination (3 doses) 0,826 0.065 69 46 Received measles vaeelnation 0.841 0.067 69 46 Fully immunized 0.826 0.065 69 46
1.686 0.111 0,190 0.298
1.881 0.498 0.000 0.039 1.958 0.054 0.577 0.717
0.929 0.056 0.248 0.310 1.120 0.029 0.640 0.718 1.458 0.068 0.393 0.516 1.458 0,116 0.171 0.274
1.138 0.043 2.078 2.472 1.075 0.053 3.847 4.758 1.110 0.041 1.950 2.301
0.983 0.005 0.981 0.999 1.214 0.007 0.970 0.998 1.394 0.044 0.614 0.733 1.219 0.057 0.427 0.538 1.418 0.081 0.325 0.451 1.017 0.104 0.130 0.198 1.173 0.229 0.028 0.075 1.550 0.323 0.016 0.074
NA NA 0.000 0.000 1,020 0.123 0.093 0.154 0.997 0.997 0.000 0.006 1.071 0.273 0.014 0.048 0.978 0.176 0.039 0.081 1.073 0.033 0.793 0.905
1.104 0.040 0,557 0.655 1.017 0.084 0.191 0.269 1.273 0.019 3.24g 3.501
1.205 0.052 0.607 0.748 1.854 0.140 0.303 0.538
1.216 0.209 0.053 0.129 1.327 0.318 0.136 0.614 1.070 0.299 0.125 0.500
0.973 0.184 0.183 0.397 1.568 0.073 0.742 0.997 1.423 0.079 0.696 0.956 1,423 0.079 0.696 0.956 1.521 0.080 0.706 0.975 1.423 0.079 0.696 0.956
Total l'eL'tility rate 3.557 0.276 NA 1307 1.225 0.077 3.005 4.108
Neonatal mortality rate 15.434 5.510 781 516 1.167 0.357 4.414 26.454 Infant mortality rate 37.106 6.965 783 518 1,028 0.188 23.176 51.037 Child mortality rate 16.115 4.960 785 519 1.I18 0.308 6.195 26.035 Under 5 child moriality rate 52.623 8.816 787 520 1.142 0.168 3 4 . 9 9 2 70.255 Postneonatal mortality rate 21.672 4.568 783 518 0.885 0.211 12.536 30.808
N.A. = Not Applicable
181

Table B.1.8 Sampling errors: Central Luzon sample, Philippines 1998
Variables
Numberofcases
Standard Un- Weight- Design Relative Confidence limits.- Value enor weighted ed effect error
(R) (SE) (N) (WN) (DEFT) (SE/R) R-2SE R+ZSE
Urban 0.572 0.018 953 1414 1.096 0.031 0.537 0.607
No education 0.002 0.001 953 1414 0.984 0.696 0.000 0.005 With education 0.752 0.024 953 1414 1.743 0.032 0.704 0.801
Never Married 0.343 0.018 953 1414 1.I50 0.052 0.308 0.379 Currently in union 0.624 0.017 953 I414 1.087 0,027 0,590 0.658 Married before age of 20 0.315 0.015 758 1125 0.904 0.048 0.285 0.346 Had first sexual intercourse before 18 0.146 0.013 758 1125 0.984 0.086 0,121 0.172
Children ever born 2.010 0.065 953 1414 0,921 0.033 1.880 2.141 Children ever bom to women over 40 4.148 0.181 182 270 0.999 0.044 3.786 4.511 Children Surviving 1.903 0.058 953 1414 0.872 0.030 1.787 2.020
Know any method 0.993 0.002 595 883 0.707 0.002 0.989 0,998 Know any modem method 0.993 0,002 595 883 0.707 0.002 0,989 0,998 Ever used any contraceptive method 0.756 0.021 595 883 I. 198 0.028 0.714 0.799 Currently using any method 0,548 0,026 595 883 1.286 0.048 0,495 0.600 Currently using a modern method 0.351 0.023 595 883 I.I93 0.066 0.305 0.398 Currenlly using pill 0.121 0.018 595 883 1.335 0.148 0.085 0.157 Currenlly using IUD 0,007 .0,003 595 883 1.034 0.515 0.000 0.014 Currently using injection 0,020 0.007 595 883 1.127 0.322 0,007 0,033 Currently using condom 0,010 0.004 595 883 0.978 0.398 0.002 0.018 Currently using female sterilization 0.193 0.019 595 883 1.190 0.100 0.155 0.232 Currently using male sterilization 0.000 0.000 595 883 NA NA 0,000 0.000 Currently using periodic abstinence 0.064 0.009 595 883 0.939 0,148 0.045 0.083 Currently using withdrawal 0,131 0.014 595 883 1.001 0.106 0.103 0.159 Public source user 0.762 0.039 214 318 1,342 0,051 0.683 0.840
Want no more children Want to delay next birth at least 2 years Ideal number of children
Mother received tetanus injections Received medical care at birth
0.634 0.017 595 883 0.852 0,027 0,600 0,667 0.198 0.014 595 883 0.861 0.071 0,170 0.226 3.272 0.042 948 1407 1.053 0.013 3.189 3.355
0.685 0.025 479 711 1.081 0.037 0.634 0.736 0.843 0.026 479 711 1,216 0.031 0.791 0.896
Had diarrhea in last 2 weeks 0.058 0.009 462 686 0.848 0.162 0.039 0.077 Recelved ORS treatment 0.407 0.122 27 40 1,262 0,300 0.163 0.652 Received medical treatment 0.370 0.081 27 40 0.907 0.219 0.208 0.533
Having health card Received BCG vaccination Received DPT vaccination (3 doses) Received polio vaccination (3 doses) Received measles vaccination Fully immunized
0.351 0.052 94 139 1.049 0.148 0.247 0.455 0,979 0.014 .94 139 0.973 0,015 0,950 1,000 0.819 0.048 94 139 1.212 0.059 0.723 0.916 0.862 0.040 94 139 1,125 0.047 0.781 0.942 0.840 0.045 94 139 1.177 0.053 0.751 0.930 0.755 0.051 94 139 1.156 0.068 0.652 0.858
Total t~ttility rate 3.516 0,176 NA 3975 0.981 0.050 3.163 3.868
Neonatal mortality rate 20.148 5.464 953 1414 1.106 0.271 9.220 31.077 Infant mortality rate 28.678 6.393 953 1414 1,132 0.223 15.892 41.465 Child mortality rate 11.053 3.576 958 1422 1.030 0.324 3.901 18.206 Under 5 child mortality rate 39,415 7,932 958 1422 1.214 0.201 23.551 55.278 Post neonatal mort ality rate 8.530 2.843 953 1414 0,956 0.333 2.844 14.215
N.A. = Not Applicable
182

Table B.I.9 Sampling errors: Southern Tagalog sample, Philippines 1998
Variables
Number of cases
Standard Un- Weight- Design Relative Confidence limits Value error weighted ed effect error
(R) (SE) (N) (WN) (DEFT) (SE/R) R-2SE R+2SE
Urban 0.591 0.018 1181 1917 1.249 0.030 0.555 0.627
No education 0.005 0.002 1181 1917 1.034 0.421 0.001 0.009 With education 0.742 0.017 118I I917 1.332 0.023 0.708 0.776
Never Married 0.321 0.017 Currently in union 0.636 0.017 Man'ied before age of 20 0.314 0.024 Had first sexual intercourse before 18 0.178 0.018
Children ever born 2.231 0.085 Children ever born to women over 40 4.085 0.210 Children Surviving 2.085 0.077
Know any method 0.997 0.002 Know any modern method 0.996 0.001 Ever used any contraceptive method 0.719 0.019 Currently using any method 0.450 0.016 Currently using a modern method 0.266 0.017 Currently using pill 0.079 0.010 Cmvently using IUD 0.029 0.008 Currently using injection 0.025 0.009 Currently using condom 0.013 0.004 Currently using female sterilization 0.119 0.014 Currently using male sterilization 0.000 0.000 Cun'ently using periodic abstinence 0.056 0.008 Currently using withdrawal 0.124 0.012 Public source user 0.644 0.041
Want no more children 0.674 0.020 Want to delay next birth at least 2 years 0.164 0.016 Ideal number of children 3.140 0.037
Mother t~ceived tetanus injections Received medical care at birth
0.669 0.028 0.598 0.032
Had diarrhea in last 2 weeks 0.070 0.011 Received ORS treatment 0.422 0.074 Received medical treatment 0.378 0.084
Having health card 0.358 0.054 Reeeived BCG vaccination 0.898 0.025 Received DPT vaccination (3 doses) 0.810 0.033 Received polio vaccination (3 doses) 0.825 0.035 Received measles vaccination 0.730 0.042 Fully immunized 0.708 0.042
Total l~rtility rate 3.689 0.259
Neonatal mot~tality rate 21.142 3.211 Infant mortality rate 35.349 3.941 Child mo~'tality rate 18.536 4.214 Under 5 child mortality rate 53.229 5.529 Postneonatal mortality rate 14.206 2.545
1181 1917 1.225 0.052 0.288 0.354 1181 1917 1.225 0.027 0.602 0.670 959 1557 1.584 0.076 0.266 0.361 959 1557 1.484 0.103 0.142 0.215
1181 1917 1.232 0.038 2.061 2.401 234 380 1.219 0.051 3.665 4.506
1181 1917 1.220 0.037 1.930 2.239
751 1219 1.007 0.002 0.994 1.000 751 1219 0.595 0.001 0.993 0.999 751' 1219 1.144 0.026 0.681 0.757 751 1219 0.883 0.036 0.418 0.482 751 1219 1.054 0.064 0.232 0.300 751 1219 1.000 0.125 0.059 0.098 751 1219 1.292 0.272 0.013 0.045 751 1219 1.520 0.345 0.008 0.043 751 1219 1.006 0.316 0.005 0.022 751 1219 1.221 0.122 0.090 0.147 751 1219 NA NA 0.000 0.000 751 1219 1.009 0.151 0.039 0.073 751 1219 0.983 0.095 0.100 0.147 202 328 1.202 0.063 0.562 0.725
751 1219 1.196 0.030 0.633 0.715 751 1219 1.148 0.095 0.133 0.195
1168 1896 1.162 0.012 3.067 3.214
664 1078 1.277 0.042 0.613 0.724 664 1078 1.310 0.054 0.533 0.663
643 1044 1.110 0.163 0.047 0.093 45 73 0.964 0.176 0.274 0.571 45 73 1.106 0.222 0.210 0.546
137 222 1.324 0.152 0.249 0.467 137 222 0.951 0.027 0.849 0.947 137 222 0.990 0.041 0.744 0.877 137 222 1.080 0.043 0.755 0.895 137 222 1.098 0.057 0.646 0.814 137 222 1.073 0.059 0.624 0.792
NA 5399 1.403 0.070 3.170 4.208
1359 2206 0.816 0.152 14.721 27.564 1359 2206 0.815 0.111 2 7 . 4 6 8 43.230 1368 2221 0.957 0.227 10.108 26.964 1368 2221 0.847 0.104 42.172 64.287 1359 2206 0.802 0.179 9.117 19.296
N.A. = Not Applicable
183

Table B.I.10 Sampling errors: Bicol Region sample, Philippines 1998
Variables
Number of cases
Standard Un- Weight- Design Relative Confidence limits Value error weighted ed effect error
(R) (SE) ~ ) (WN) (DEFT) ( S E ~ R ) R-2SE R+2SE
Urban
No education With education
Never Married Currently in union Married before age of 20 Had first sexual intercourse before 18
0.301 0.020 745 703
0.005 0.002 745 703 0.626 0.029 745 703
0,289 0.017 745 703 0.683 0.016 745 703 0.347 0,026 602 568 0.181 0.024 602 568
1.187 0.066 0.261 0.341
0.699 0.349 0.002 0.009 1.658 0.047 0,567 0.684
1,035 0,060 0.254 0.323 0.930 0.023 0.651 0.715 1,357 0.076 0,294 0.400 1.543 0.134 0.133 0.230
Children ever born 2.797 0,100 745 703 0,959 0,036 2,597 2.998 Children ever born to women over 40 5,387 0.283 155 146 1,127 0,052 4.822 5.952 Children Surviving 2,596 0,089 745 703 0,927 0,034 2.419 2.773
Know any method Know any modem method Ever used any contraceptive method Cun'ently using any method Currently using a modem method Currently using pill Currently using IUD Currently using injection Currently using condom Currently using female sterilization Currently using male sterilization Currently using periodic abstinence Currently using withdrawal Public source user
Want no more children Want to delay next birth at least 2 years Ideal number of children
Mother received tetanus injections Received medical care at birth
0.996 0,003 509 481 0.994 0.003 509 48I 0.631 0,021 509 481 0,363 0.020 509 481 0.193 0.016 509 481 0.081 0.014 509 481 0.028 0.012 509 481 0.010 0.004 509 481 0.012 0.005 509 481 0.055 0.013 509 481 0.002 0.002 509 481 0.063 0.013 509 481 0.090 0.012 509 481 0.770 0.047 100 94
0.646 0.021 509 481 0.177 0.014 509 481 3.171 0.048 726 686
0.681 0.021 561 530 0.442 0.046 561 530
0.077 0.014 535 505 0.439 0.069 41 39 0.463 0.063 41 39
0.484 0.052 95 90 0.874 0.040 95 90 0.747 0.032 95 90 0.747 0.029 95 90 0.747 0,049 95 90 0.684 0.045 95 90
5.450 0.281 NA 1987
Had diarrhea in last 2 weeks Received ORS treatment Received medical treatment
Having health card Received BCG vaccination Received DPT vaccination (3 doses) Received polio vaccination (3 doses) Received measles vaccination Fully immunized
Total t~rtilityrate
0,987 0,003 0,991 1.000 0.987 0.003 0.987 1.000 0.958 0,033 0.590 0.672 0,922 0,054 0.324 0.403 0.913 0.083 0.161 0.224 1.138 0,171 0.053 0.108 1,632 0.431 0.004 0.051 1.005 0.448 0.001 0,019 1,010 0.410 0,002 0.021 1,252 0.230 0,030 0,080 0,983 0.983 0.000 0.006 1,233 0.211 0.036 0.089 0.915 0,129 0.067 0.114 1,107 0.061 0,676 0.864
1,012 0.033 0.603 0.689 0,846 0,081 0,148 0,205 1,004 0.015 3.076 3.266
0,901 0.031 0.639 0.723 1.734 0,104 0.350 0.534
1389 0.188 0,048 0,105 0,862 0.156 0.302 0.576 0.790 0.136 0.337 0.590
1.017 0.108 0.380 0.589 1,160 0,045 0,795 0.953 0.713 0.043 0.684 0.811 0.653 0.039 0.689 0.806 1,098 0.066 0.649 0.845 0.935 0,065 0.595 0.773
1.174 0.051 4.889 6,011
Neonatal mortality rate 14,686 4.233 1096 1035 0,999 0,288 6,220 23.152 Infant mortality rate 31,401 5.261 1099 1038 0.944 0,168 20.879 41.922 Child mortality rata 21.818 5.624 1097 1036 1.148 0,258 10.566 33.060 Under 5 child mortality rate 52,529 9.257 1100 I039 1.216 0.176 34.014 71.043 Postneonatal mortality rate 16.715 4.424 1099 1038 1.103 0.265 7.867 25.563
N.A. = Not Applicable
184

Table B. 1. l 1 Sampling errors: Western Visayas sample, Philippines 1998
Variables
Number of cases
Standard Un- Weight- Design Relative Confidence limits Value en'or weighted ed effect en'or
(R) (SE) (N) (WN) (DEFT) (SE/R) R-2SE R+2SE
Urban 0.476 0.020 882 1045 1.165 0.041 0.437 0.515
No education 0.007 0.003 882 1045 0,996 0.405 0.001 0.012 With education 0.703 0.021 882 1045 1.360 0.030 0.661 0,745
Never Married 0.361 0.013 882 1045 0.830 0.037 0.334 0.387 Currently in union 0.600 0.015 882 1045 0.894 0.025 0.570 0.629 Married before age of 20 0,267 0.018 685 812 1.049 0.066 0.232 0.303 Had first sexual intercourse before 18 0.117 0.010 685 812 0.801 0.084 0.097 0.136
Children ever born 2.215 0,096 882 1045 1.106 0.043 2.024 2.407 Children ever bona to women over 40 4.478 0,238 178 211 1.050 0.053 4.002 4.953 Children Surviving 2,070 0.085 882 1045 1.062 0,041 1,900 2,241
Know any method Know any modern method Eve]" used any contraceptive method Currently using any method Currently using a modern method Currently using pill Currently using IUD Currently using injection Currently using condom Currently using female sterilization Currently using male sterilization Cun'entLy using periodic abstinence Currently using withdrawal Public source user
Want no more children Want to delay next birth at least 2 years Ideal number of children
~vlother received tetanus injections Received medical care at birth
1,000 0,000 529 627 NA 0.000 1.000 1.000 1,000 0.000 529 627 NA 0.000 1.000 1,000 0.724 0.023 529 627 1.204 0,032 0,677 0,771 0.450 0.024 529 627 1.124 0.054 0.401 0.499 0.255 0.020 529 627 1.037 0.077 0.216 0.295 0.085 0.012 529 627 1.001 0.143 0.061 0.109 0,026 0.006 529 627 0.895 0.236 0,014 0,039 0,030 0.009 529 627 1.142 0.281 0.013 0.047 0.015 0.007 529 627 1.325 0.465 0.001 0.029 0.087 0.014 529 627 1.130 0,159 0.059 0.115 0.006 0.004 529 627 1.287 0.742 0.000 0.014 0.117 0,017 529 627 1,233 0.147 0.083 0.152 0.070 0.011 529 627 0.998 0.158 0.048 0.092 0.788 0.030 137 162 0.853 0.038 0.729 0.848
0,669 0,027 529 627 ],304 0,040 0,616 0,723 0.157 0.018 529 627 1.165 0.117 0.120 0.194 3.055 0.052 858 1017 1,306 0,017 2,950 3,159
0,781 0.029 494 585 1.340 0.037 0.723 0.840 0.482 0.032 494 585 1.139 0.067 0.417 0.546
Had diarrhea in last 2 weeks 0.091 0.012 482 571 0,865 0.126 0,068 0,114 Received ORS treatment 0,318 0.069 44 52 0.922 0.215 0.181 0.455 Received medical treatment 0,364 0.069 44 52 0.906 0.190 0.225 0.502
Having health card Received BCG vaccination Received DPT vaccination (3 doses) Received polio vaccination (3 doses) Received measles vaccination Fully immunized
0.622 0.065 90 107 1.259 0.104 0.493 0.752 0.967 0.018 90 107 0.966 0,019 0,930 1,000 0,867 0,037 90 107 1,025 0.042 0.793 0.940 0.878 0.032 90 107 0.932 ~037 0.813 0.942 0.933 0.027 90 107 1.038 0,029 0.879 0.988 0.867 0,037 90 107 1,025 0.042 0.793 0.940
Total t~r(ibty rate 4.028 0.236 NA 2867 1.036 0.059 3.551 4.494
Neonatal mortality rate 11.185 3.282 992 1175 0.907 0.293 4.621 17.748 lnt~nt mortality rate 25.980 5.275 994 1178 1.052 0.203 15.430 36.530 Child mortallty rate 16.069 5.027 998 1182 1.243 0.313 6.015 26.123 Under 5 child mortality rate 41.631 7.663 1000 1185 1.197 0.184 26.306 56.956 Post neonatal mortality rate 14.795 4,081 994 1178 1.091 0.276 6.633 22.958
N.A, = Not Applicable
185

Table B.I.12 Sampling errors: Central Visayas sample, Philippines 1998
Variables
Number of cases
Standard Un- Weight- Design Relative Confidence limits Value error weighted ed effect error
(R) (SE) (N) (WN) (DEFT) (SE/R) R-2SE R+2SE
Urban 0.523 0.018 993 1093 1.109 0.034 0.487 0.558
No education 0.012 0.004 993 1093 1.182 0.339 0.004 0.020 With education 0.660 0.017 993 1093 1.117 0.025 0.626 0.693
Never Mat'ried 0.396 0.014 993 1093 0.914 0.036 0,367 0.424 Currently in union 0.567 0,017 993 1093 1,057 0.029 0.534 0.600 Married before age of 20 0,289 0.021 786 865 1.279 0,072 0.247 0.330 Had first sexual intercourse before 18 0,149 0.013 786 865 1.047 0.089 0.122 0.175
Children ever born 2.060 0.075 993 1093 0.964 0.036 1.910 2.210 Childlen ever born to women over 40 4.353 0.229 190 209 1.075 0.053 3.894 4.812 Children Surviving 1,941 0.067 993 1093 0.928 0.034 1.807 2.074
Know any method Know any modern method Ever used any contraceptive method Cun'ently using any method Currently using a modem method Currently using pill Currently using IUD Currently using injection Cun'ently using condom Currently using female sterilization Currently using male sterilization Currently using periodic abstinence Cunently using withdrawal Public source user
Want no more children Want to delay next birth at least 2 years Ideal number of children
Mother received tetanus injeetiolls Received medical care at birth
Had diarrhea in last 2 weeks Received ORS treatment Received medical treatment
Having health card Received BCG vaccination Received DPT vaccination (3 doses) Received polio vaccination (3 doses) Received measles vaccination Fully immunized
0.996 0.003 563 620 0.996 0.003 563 620 0.787 0.02I 563 620 0.515 0.029 563 620 0.281 0.030 563 620 0.076 0.012 563 620 0.067 0,016 563 620 0.032 0.009 563 620 0,032 0,008 563 620 0.067 0.010 563 620 0.005 0.003 563 620 0.149 0.014 563 620 0.078 0.011 563 620 0.765 0.038 162 178
0.652 0.021 563 620 0.169 0.016 563 620 3.019 0.050 972 1070
0.765 0.024 532 586 0.556 0.044 532 586
0.058 0,011 521 573 0.433 0.084 30 33 0,533 0.108 30 33
0.595 0.055 111 122 0.937 0.022 I l l 122 0.901 0.033 111 122 0.874 0.042 111 122 0.865 0.031 111 122 0.775 0.042 111 122
Total t~rtiIity rate 3.703 0,261 NA 3029
1.007 0.003 0.991 1.000 1.007 0.003 0.991 1.000 1.207 0.026 0.745 0.829 1.376 0.056 0.457 0.573 1.590 0.107 0.220 0.341 1.075 0,158 0.052 0.100 1.515 0.237 0.035 0.100 1.188 0.276 0.014 0.050 1,078 0,250 0,016 0,048 0.935 0.147 0.048 0.087 0.996 0.574 0.000 0.011 0.936 0.094 0.121 0.177 0.978 0.142 0.056 0.100 1.139 0.050 0.689 0.841
1.028 0.032 0.611 0.693 1.004 0.094 0.137 0.200 1.138 0.0]7 2.918 3.119
1.160 0.032 0.716 0.814 1.623 0.079 0.468 0.644
0.920 0.187 0.036 0.079 0.904 0.194 0.265 0.601 1,148 0.202 0.318 0.749
1.155 0.092 0.486 0.704 0.954 0.024 0.893 0.981 1.159 0.037 0.835 0.967 1.340 0.048 0.789 0.958 0.953 0.036 0.803 0.927 1.062 0.055 0.690 0.859
1.234 0.070 3.181 4.224
Neonatal mol~ality rate 11.511 4.467 1050 1156 1.278 0.388 2.576 20.446 Infant mortality rate 23.616 5,77I 105I I157 1.208 0.244 12.074 35.157 Child mortality rate 15.099 3.517 1054 1160 0.887 0.233 8.065 22.133 Under 5 child mortallty rate 38.358 6.779 1055 1161 1.151 0.177 24.800 51.915 Postneonatal mortality rate 12.105 3.335 1051 1157 0,986 0.275 5.435 18,774
N.A. = Not Applicable
186

Table B. I.I 3 Sampling errors: Eastern Visayas sample, Philippines 1998
Numberofeases
Standard Un- Weight- Design Relative Confidence limits Value error weighted e,d effect error
Variables (R) (SE) (N) (WN) (DEFT) (SE/R) P,-2SE R+2SE
Urban 0.335 0.020 770 553
No education 0,018 0.006 770 553 With education 0.532 0.024 770 553
Never Married 0.242 0.015 770 553 Currently in union 0.714 0.016 770 553 Married before age of 20 0.508 0.022 628 451 Had fil'st sexual intercourse before 18 0.298 0.018 628 451
Children ever born 3.334 0.I 14 770 553 Children ever born to women over 40 6.188 0.249 181 130 Children Surviving 2.966 0.103 770 553
Know any method Know any modem method Ever used any contraceptive method Currently using any method Currently using a modem method Currently using pill Currently using IUD Currently using injection Currently using condom Curcently using female sterilization Currently using male sterilization Currently using periodic abstinence Currently using withdrawal Public source user
1.189 0.060 0.295 0.376
1.246 0.330 0.006 0.030 1.306 0.044 0,485 0.579
0.967 0.062 0,212 0.271 0.975 0.022 0.683 0.746 1.100 0.043 0.464 0.552 0.99I 0.061 0.262 0.334
1.005 0.034 3.I07 3.561 1.125 0.040 5.691 6.685 1.041 0.035 2.761 3,172
0.995 0.003 550 395 1.000 0.003 0.991 0.004 550 395 0.998 0.004 0.638 0,023 550 395 1.112 0.036 0.375 0,021 550 395 1.030 0.057 0.167 0,014 550 395 0.855 0.081 0.044 0.009 550 395 1.010 0.202 0.018 0.006 550 395 1.006 0.316 0.018 0.007 550 395 1.297 0.407 0.011 0.005 550 395 1.022 0.415 0.073 0.012 550 395 L039 0.158 0.002 0.002 550 395 1.006 1.006 0.104 0.014 550 395 1.068 0.134 0.098 0.012 550 395 0.943 0.122 0.844 0.037 96 69 0.995 0.044
Want no more children 0.704 0.019 550 395 0.965 0.027 Want to detay next birth at least 2 years 0.142 0.014 550 395 0.945 0.099 Ideal number of children 3.459 0.072 749 538 1.107 0.021
Mother received tetanus injections 0.682 0,030 622 446 1.239 0.044 Received medical care at birth 0.277 0.028 622 446 1.238 0.100
Had diarrhea in last 2 weeks 0.130 0,013 583 418 0.848 0.097 Received ORS treatment 0.539 0.062 76 55 0.978 0.114 Received medical treatment 0.434 0,062 76 55 1.058 0.142
Having health card 0.467 0,050 120 86 1.095 0.107 Received BCG vaccination 0.825 0.046 120 86 1.336 0.056 Received DPT vaccination (3 doses) 0.717 0,045 120 86 1.082 0.062 Received polio vaccination (3 doses) 0.750 0.043 120 86 1.095 0.058 Received measles vaccination 0.717 0.048 120 86 1.155 0.066 Fully immunized 0.625 0,046 120 86 1.029 0.073
Total fertility rate 5.911 0.354 NA 1561 1.278 0.060
Neonatal mortality rate 31.275 5.196 1256 902 0.953 0.166 Infant mortality rate 60.813 7.451 1258 903 1.043 0.I23 Child mortality rate 26.406 6.056 1262 906 1.112 0.229 Under 5 child mortality rate 85.613 9.652 1264 907 1.045 0.113 Postneonatal mortality rate 29.538 5.265 1258 903 1.124 0.178
0.988 1,000 0.983 0,999 0.593 0,684 0.332 0.417 0.140 0,195 0.026 0,06I 0.007 0,030 0.003 0,033 0.002 0,020 0.050 0,096 0.000 0,005 0.076 0,131 0.074 0,122 0.770 0,918
0.666 0.74) 0.114 0,170 3.316 3.603
0.622 0,742 0.221 0.332
0.105 0,156 0.416 0,663 0.311 0,558
0.367 0,566 0.732 0,918 0.628 0,806 0.663 0,837 0.622 0,812 0.534 0,716
5.204 6.618
20,883 41.667 45.912 75.715 14.293 38.518 66.310 104.916 19,009 40.067
N.A. = Not Applicable
187

Table B.I.14 Sampling errors: Western Mindanao sample, Philippines 1998
Standard Value error
Variables (R) (SE)
Number of cases
Un- Weight- Design Relative Confidence limits weighted ed effect error
(N) (WN) (DEFT) (SE/R) R-2SE R+2SE
Urban 0.350 0.029
No education 0.060 0.016 With education 0.607 0.033
Never Married 0.322 0.019 Currently in union 0.647 0.019 Married before age of 20 0,403 0.022 Had first sexual intercourse before 18 0.207 0,016
Children ever born 2.434 0.088 Children ever born to women over 40 4.969 0.256 Children Surviving 2,225 0.082
973 530 1.880 0.082 0.293 0.408
973 530 2.124 0,271 0.027 0.092 973 530 2.134 0.055 0.541 0.674
973 530 1.248 0.058 0.284 0.359 973 550 1.264 0.030 0.609 0,686 767 418 1.256 0.055 0.358 0.447 767 418 1.100 0.078 0.175 0.240
973 530 1.011 0.036 2.257 2.610 191 104 1.146 0.051 4.457 5.480 973 530 1.044 0.037 2.061 2,390
14mow any method 0.908 0.026 630 343 2.242 0.028 0.856 0.960 Know any modem method 0.903 0.027 630 343 2.279 0,030 0.849 0.957 Ever used any contraceptive method 0.610 0.037 630 343 1.884 0.060 0,536 0.683 Currently using any method 0.438 0.031 630 343 1.583 0.072 0.375 0,501 Currently using a modern method 0.300 0.023 630 343 1.279 0,078 0,253 0.347 Currendy using pill 0,157 0.020 630 343 1,361 0,126 0.118 0.197 Currently using IUD 0.060 0.014 630 343 1.430 0.225 0.033 0,087 Currently using injection 0.021 0.005 630 343 0.864 0.237 0,011 0.030 Currently using condom 0.017 0.005 630 343 1.014 0.303 0.007 0.028 Currently using female sterilization 0.041 0,009 630 343 1,186 0.228 0,022 0.060 CwTently using male sterilization 0.000 0.000 630 343 NA NA 0.000 0.000 Currently using periodic abstinence 0.097 0.013 630 343 1.084 0.132 0.071 0.122 Currently using withdrawal 0.032 0.008 630 343 1.165 0.257 0.015 0.048 Public source user 0.895 0.021 190 103 0,944 0,024 0,853 0,937
Want no mole children 0.589 0.020 Want to delay next birth at least 2 years 0.211 0.019 Ideal number of children 3.448 0.071
630 343 1.028 0.034 0.549 0.629 630 343 1.174 0.090 0.175 0.249 943 513 1.237 0.020 3.306 3.589
Mother received tetanus injections Received medical care at birth
0.659 0.035 558 304. 1.372 0,054 0,589 0.730 0,396 0,043 558 304 1.657 0.108 0.311 0.481
Had diarrhea in last 2 weeks 0.071 0.012 532 290 1,049 0,174 0,047 0.096 Received ORS treatment 0.447 0.061 38 21 0.778 0.137 0.324 0.570 Received medical treatment 0.632 0.093 38 21 1.184 0.147 0.445 0.818
Having health card 0.333 0,048 102 56 1.031 0.144 0.237 0.430 Received BCG vaccination 0.814 0.047 102 56 1,216 0,058 0,720 0,908 Received DPT vaccination (3 doses) 0,716 0,049 102 56 1.105 0.069 0.617 0.814 Received polio vaccination (3 doses) 0.735 0.050 102 56 1.140 0.068 0.636 0.835 Received measles vaccination 0.745 0.053 102 56 1.232 0.071 0.639 0.852 Fully immunized 0.696 0.053 102 56 1,166 0,076 0,590 0.802
Total tbrtility rate 3,900 0,272 NA 1480 1,302 0.070 3.355 4,445
Neonatal mortality rate 19.489 4.030 1164 634 0.902 0.207 11.429 27.549 In rant mortality rate 44.570 6.143 1166 635 0.982 0.138 32.284 56.856 Child mortality rate 31.713 6.384 1169 636 1.121 0.201 18.946 44.481 Under 5 child mortality rate 74.870 8.788 1171 638 1.071 0.117 57.294 92.446 Postneonatal mortality rate 25.081 4.390 1166 635 0.981 0.175 16.300 33.862
N.A. = Not Applicable
188

Table B.I.15 Sampling errors: Northern Mindanao sample, Philippines 1998
Variables
Numberofeases
Standard Un- Weight- Design Relative Confidence limits Value error weighted ed effect error
(R) (SE) (N) (WN) (DEFT) (SF3R) R-2SE R+2SE
Urban
No education With education
0.512 0.027 781 482
0.004 0,003 781 482 0.661 0,028 781 482
Never Matried 0.357 0.020 781 482 Currently in union 0,612 0,021 781 482 Married betbre age of 20 0,421 0,018 610 377 Had first sexual intercourse before 18 0.254 0,020 610 377
Children ever born 2,627 0,100 781 482 Children ever born to women over 40 5.503 0.269 153 94 Children Surviving 2,398 0,093 781 482
Know any method 1,000 0,000 478 295 Know any modem method 1,000 0,000 478 295 Ever used any contraceptive method 0.751 0.032 478 295 Currently using any method 0.540 0.029 478 295 Currently using a modem method 0,339 0,026 478 295 Currently using pill 0.138 0.018 478 295 Currently using IUD 0.100 0.016 478 295 Currently using injection 0,031 0,010 478 295 Currently using condom 0.013 0,004 478 295 Currently using female sterilization 0,052 0,011 478 295 Currently using male sterilization 0,000 0,000 478 295 Currently using periodic abstinence 0,126 0.014 478 295 Currently using withdrawal 0.075 0,013 478 295 Public source user 0.785 0.034 I63 101
Want no more children 0.678 0.021 Want to delay next birth at least 2 years 0.205 0.017 Ideal number of children 3.102 0.076
Mother received tetanus injections Received medical care at birth
478 295 478 295 774 478
0.711 0.028 536 331 0.345 0.041 536 331
Had diarrhea in last 2 weeks 0,052 0,014 517 319 Received ORS treatment 0.519 0,095 27 17 Received medical treatment 0.556 0.114 27 17
Having health card 0.365 0,056 104 64 Received BCG vaccination 0.942 0.026 104 64 Received DPT vaccination (3 doses) 0,875 0,036 104 64 Received polio vaccination (3 doses) 0,875 0,032 104 64 Received measles vaccination 0.769 0.034 104 64 Fully immunized 0.740 0.039 104 64
Total l?rtility rate 4,753 0,342 NA 1337
1,534 0.054 0.457 0.567
1,263 0.728 0.000 0.009 1.644 0,042 0.605 0,716
1,167 0.056 0.317 0.397 1.191 0,034 0,570 0,654 0,902 0,043 0,385 0.457 1.111 0.077 0,215 0.293
0,959 0.038 2.428 2.826 1.089 0,049 4,964 6.042 1.002 0,039 2,213 2,584
NA 0.000 1.000 1.000 NA 0.000 1.000 1.000
1,632 0.043 0,686 0.816 1,281 0,054 0,481 0,598 1,188 0.076 0.287 0.390 1.I30 0,129 0,102 0,174 1,149 0,157 0,069 0,132 1.28I 0.326 0.011 0.052 0.806 0,328 0,004 0,021 1.088 0.212 0,030 0,074
NA NA 0,000 0,000 0.895 0.108 0,098 0,153 1.068 0.171 0,050 0.101 1,040 0.043 0.718 0.852
0.984 0,031 0.636 0.720 0.945 0.085 0.I70 0.240 1,450 0.024 2.951 3.253
1.172 0.039 0.665 0,767 1,536 0.118 0.264 0.427
1.300 0.259 0.025 0.079 0.930 0.184 0,328 0.709 1.202 0.206 0,327 0,784
1.190 0,154 0,253 0.478 1,147 0.028 0.890 0.995 1.099 0,041 0,804 0,946 0.983 0,036 0,811 0,939 0,814 0.044 0.702 0.837 0,914 0.053 0.662 0.819
1,307 0,072 4.069 5,438
Neonatal morlality rate 21.095 4.256 1005 621 0.880 0.202 12.584 29.606 Infant mortality rate 40.970 6.771 1005 621 1.028 0.165 27.429 54.512 Child mortality rate 24.811 7.112 1008 622 1.215 0,287 10.586 39.035 Under 5 child mortality rate 64.765 9.334 1008 622 1.078 0.144 46.097 83.433 Post neonatal mortality rate 19.875 4.324 1005 621 1.024 0.218 11.227 28.523
N.A. = Not Appllcable
189

Table B, I. 16 Sampling errors: Southern Mindanao sample, Philippines 1998
Variables
Number of cases
Standard Un- Weight- Design Relative Confidence limits Value error weighted ed effect error
(R) (SE) (N) (WN) (DEFT) (SE/R) R-2SE R+2SE
Urban 0.487 0.028 985 925 1,788 0.058 0.430 0.544
No education 0.020 0.007 985 925 1,604 0.355 0.006 0.035 With education 0.73I 0.027 985 925 1.917 0.037 0,677 0,785
Never Married 0.353 0.020 985 925 1.325 0.057 0.313 0.394 Currently in union 0.618 0.020 985 925 1.284 0.032 0.579 0.658 Married before age of 20 0.364 0.026 766 719 1.489 0.071 0.312 0.416 Had first sexual intereourse before 18 0.222 0.017 766 719 1.148 0.078 0.187 0.256
Children ever bum 2.189 0.109 985 925 1.312 0.050 1.971 2.407 Children ever born to women over 40 4.631 0.304 179 168 1.336 0.066 4,024 5,239 Children Surviving 2.017 0.096 985 925 1.282 0.048 1.824 2.210
Know any method Know any modem method Ever used any contraceptive method Currently using any method Currently using a modem method Currently using pill Currently using IUD Currently using injection Currently using condom Currently using female sterilization Currently using male sterilization Currently using periodic abstinence Currently using withdrawal Public source user
Want no more children Want to delay next birth at least 2 years Ideal number of children
Mother received tetanus injections Received medical care at birth
0.993 0.003 609 572 1.028 0.003 0.987 1.000 0.992 0.003 609 572 0.803 0.003 0.986 0.998 0.787 0.020 609 572 1,198 0.025 0.747 0.826 0.552 0.020 609 572 0.994 0.036 0.512 0.592 0.358 0.016 609 572 0.845 0.046 0.325 0.391 0,144 0.014 609 572 1.012 0.100 0.116 0.173 0.094 0.012 609 572 1.054 0.133 0.069 0.118 0.034 0.011 609 572 1,463 0.314 0.013 0.056 0.015 0.004 609 572 0.899 0.298 0.006 0.024 0.069 0.013 609 572 1.225 0.183 0.044 0.094 0.000 0.000 609 572 NA NA 0.000 0.000 0.126 0.015 609 572 1.096 0.117 0.097 0.156 0.062 0.009 609 572 0.941 0.148 0.044 0.081 0.766 0.040 222 209 1,392 0.052 0.686 0.845
0,635 0.021 609 572 1.078 0.033 0.593 0.678 0.220 0.016 609 572 0.978 0.074 0.187 0.253 2.918 0.046 979 920 1.216 0.016 2.825 3.011
0.726 0.026 521 489 1.058 0.035 0.674 0.777 0.470 0,043 521 489 1.505 0.090 0.385 0.555
Had diarrhea in last 2 weeks 0.090 0.013 499 469 0.990 0,144 0.064 0.116 Received ORS treatment 0.422 0.088 45 42 1.138 0.208 0,247 0.598 Received medical treatment 0.400 0.072 45 42 0.990 0.180 0.256 0.544
Having health card Received BCG vaccination Received DPT vaccination (3 doses) Received polio vaccination (3 doses) Received measles vaccination Fully immunized
0.575 0.046 87 82 0.872 0.080 0.482 0.667 0.966 0.019 87 82 0.996 0.020 0,927 1.000 0.920 0.030 87 82 1,033 0.033 0.859 0.980 0.920 0.030 87 82 1.033 0.033 0.859 0.980 0.839 0.046 87 82 1.162 0.055 0.748 0.931 0.828 0.047 87 82 1.167 0.057 0.733 0.922
Totat lbrtdity rate 3.666 0.242 NA 2557 1.190 0.066 3.182 4.150
Neonatal mortality rate 19.139 5.052 1050 986 1.058 0.264 9.035 29.243 Infant mortalhy rate 40.938 6.864 1051 987 0.976 0,160 27.811 54.065 Child mortality rate 21.115 5.803 1054 990 1.150 0.261 10.10g 32,122 Under 5 child mortality rate 61.188 9.878 1055 991 1.194 0.161 41,433 80.943 Postneonatal mortality rate 21.799 5.062 1051 987 1.020 0.232 11.676 31.922
N,A. = Not Applicabl~
190

Table B.I.17 Sampling errors: Central Mindanao sample, Philippines 1998
Variables
Number of eases
Standard Un- Weight- Design Relative Confidence limits Value error weighted ed effect error
(R) (SE) (N) (WN) (DEFT) (SE/P.) R-2SE R+2SE
Urban
No education Wlth education
0.333 0.022 682 425
0.026 0.011 682 425 0,751 0.025 682 425
Never Man'ied 0.330 0.017 682 425 Curt'entry in union 0,642 0.0L7 682 425 Man'ied before age of 20 0.389 0.020 525 327 Had first sexual intercourse before 18 0,194 0.016 525 327
Children ever born 2.405 0.116 682 425 Children ever born to women over 40 5.168 0.205 I 13 70 Children Surviving 2.I92 0.109 682 425
Know any method 0.984 0,007 438 273 Know any modem method 0.984 0.007 438 273 Ever used any contraceptive method 0.655 0.030 438 273 Currently using any method 0.452 0.038 438 273 Currently using a modem method 0.285 0.023 438 273 Currently using pill 0.080 0.015 438 273 Cun'ently using IUD 0.073 0.014 438 273 Currently using injection 0.034 0.008 438 273 Currently using condom 0.009 0.005 438 273 CmTently using female sterilization 0.087 0.016 438 273 Curremly using male sterilization 0.002 0.002 43g 273 Currently using periodic abstinence 0.103 0.017 438 273 Cunently using withdrawal 0.057 0.018 438 273 Public source user 0.746 0.037 126 79
Want no more children 0.626 0.026 Want to delay next birth at least 2 years 0.171 0.019 Ideal number of children 3,352 0.100
Motherreceivedtetanusinjections Received medicalcareatbirth
1.209 0.066 0.289 0.376
1.718 0.400 0.005 0.048 1.509 0.033 0.701 0.801
0.924 0.050 0.297 0.363 0.939 0,027 0,608 0,677 0.955 0.052 0.348 0,429 0.902 0.080 0.163 0.225
1.134 0.048 2.173 2.636 0.703 0.040 4.758 5.579 1.188 0.050 1.973 2.411
1.151 0.007 0.970 0.998 1.151 0.007 0.970 0.998 1.298 0.045 0.596 0.714 1.583 0.083 0.377 0,527 1,067 0.081 0.239 0.331 1,193 0.194 0,049 0.111 1.093 0.I86 0.046 0.100 0.868 0.221 0.019 0.049 1.042 0.519 0.000 0.019 1.185 0.184 0.055 0.119 1.017 1.017 0.000 0.0CO 1.164 0.165 0.069 0.137 1.577 0.307 0.022 0.092 0.953 0.050 0.672 0.820
438 273 1,I02 0.041 0.575 0.677 438 273 1.029 0.108 0.134 0.208 665 415 1.201 0.030 3.151 3.553
0.740 0,032 423 264 0.430 0.042 423 264
Had diarrhea in last 2 weeks 0.086 0.013 406 253 Received ORS tt~atment 0.314 0.086 35 22 Received medical treatment 0.343 0.081 35 22
Having health card 0.324 0.050 74 46 Received BCG vaccination 0,878 0.037 74 46 Received DPT vaecinatlon (3 doses) 0.770 0.058 74 46 Received polio vaccination (3 doses) 0.784 0.056 74 46 Received measles vaccination 0.770 0.052 74 46 Fully immunized 0.716 0.061 74 46
Total fertility rate 4.219 0.267 NA 1184
1.239 0.044 0.675 0.805 1.395 0.097 0.347 0.514
0.961 0,153 0.060 0.113 1,083 0.274 0.142 0.487 1.037 0.236 0,181 0.505
0.913 0.153 0.225 0.424 0.965 0.042 0.805 0,952 1.177 0.075 0.655 0.885 1.163 0.071 0.672 0.895 1.054 0.067 0,667 0.873 1,163 0.085 0.594 0.838
1.111 0.063 3.685 4.752
Neonatal mortality rate 26.995 6,644 86l 537 1,062 0.246 t3,708 40.282 Infant mortality rate 48.367 10.072 861 537 1.112 0.208 28.223 68.510 Child mortality rate 28.969 7.824 866 540 1.079 0.270 13.321 44.616 Under 5 child mortality rate 75,934 13.776 866 540 1.223 0.181 48.382 103.487 Posmeonatal mortality rate 21,372 6.455 861 537 1.259 0.302 8.462 34.282
N.A. = Not Applicable
191

Table B.l.I 8 Sampling errors: ARMM sample, Philippines 1998
Variables
Numberofcases
Standard Un- Weight- Design Relative Confidence limits Value error weighted ed effect error
(R) (SE) (N) (WN) (DEFT) (SE/R) R-2SE R+2SE
Urban
No education With education
Never Married Currently in union Married before age of 20 Had first sexual intercourse before 18
Children ever born Children ever born to women over 40 Children Surviving
Know any method Know any modem method Ever used any contraceptive method Currently using any method Currently using a modem method Currently using pill Currently using IUD Currently using injection Currently using condom
, Currently using female sterilization Currently using male sterilization Currently using periodic abstinence Currently using withdrawal Public source user
Want no more children Want to delay next birth at least 2 years Ideal number of children
Mother received tetanus injections Received medical care at birth
Had diarrhea in last 2 weeks Received ORS treatment Received medical treatment
Having health card Received BCG vaccination Received DPT vaccination (3 doses) Received polio vaccination (3 doses) Received measles vaccination Fully immunized
0.222 0.019 810 385
0.259 0.048 810 385 0.438 0.054 810 385
0.314 0.015 810 385 0,654 0,015 810 385 0.479 0,027 635 301 0.298 0.023 635 301
2.742 0.114 810 385 5.I01 0.313 138 66 2.428 0.095 810 385
0.762 0.032 530 252 0.617 0,043 530 252 0.183 0.034 530 252 0.158 0.029 530 252 0.087 0.025 530 252 0.036 0.012 530 252 0.002 0.002 530 252 0.019 0,009 530 252 0.000 0.000 530 252 0.030 0.010 530 252 0.000 0.000 530 252 0.017 0.006 530 252 0.008 0.004 530 252 0,783 0.041 46 22
1.329 0,087 0.183 0.261
3.116 0.185 0.163 0,355 3.099 0.123 0.330 0,546
0.926 0.048 0.283 0.344 0.878 0.022 0.625 0,684 1.384 0.057 0.424 0.534 1,240 0.076 0.253 0.343
1,132 0.042 2.514 2.970 1.284 0.061 4,476 5.727 1.093 0.039 2.238 2.619
1.704 0.041 0.699 0.825 2.018 0,069 0.532 0.702 2.025 0. I86 0. I15 0.25I 1.844 0.185 0.100 0.217 2.069 0.292 0.036 0.137 1.503 0.339 0,012 0.060 0.995 0.995 0,000 0.006 1.470 0.461 0.001 0.036
NA NA 0.000 0.000 1.320 0,325 0.011 0,050
NA NA 0.000 0.000 1.127 0.373 0.004 0.030 0.991 0.494 0.000 0.015 0.659 0.052 0.702 0.864
0.226 0,021 630 252 1.169 0.094 0.184 0.269 0.289 0.021 530 252 1.059 0.072 0.247 0.330 5.830 0.188 728 346 1.770 0.032 5.454 6.206
0.388 0.040 554 263 0.155 0,030 554 263
0.062 0.015 519 246 0.500 0.096 32 15 0.344 0.080 32 15
0.220 0.072 109 52 0.651 0.051 109 52 0.505 0.055 109 52 0.505 0.055 109 52 0.505 0.054 109 52 0.468 0.056 109 52
1.526 0.104 0,307 0.469 1.584 0.196 0.094 0.216
1.289 0.238 0.032 0,091 1.125 0.193 0,307 0,693 0.957 0.233 0.183 0.504
1.711 0.328 0.076 0.365 1.098 0,078 0.550 0.753 1.128 0.109 0.395 0.615 1.128 0.109 0.395 0,615 1.097 0.106 0.398 0.612 1.141 0.119 0.357 0.579
Total fertility rate 4.606 0.428 NA 107I 1.529 0,093 3.749 5.463
Neonatal mortality rate 23.579 6.273 1199 569 1.304 0.266 11.032 36.126 Infant mortality rate 55.108 10.220 1200 570 1.353 0.185 34.668 75.548 ChildmoJ~a)ityrat¢ 44,964 8,647 1209 574 1.]40 0,192 27,669 62,258 Under 5 child mortality rate 97.593 15.931 1210 574 1.502 0.163 65.731 129.455 Posmeonatal mortality rate 31.529 6.511 1200 570 1.183 0.206 18.507 44.550
N.A. = Not Applicable
192

Table B.I.19 Sampling errors: CARAGA sample, Philippines 1998
Va(iables
Number of eases
Standard Un- Weight- Design Relative Confidence limits Value error weighted ed effect error
(R) (SE) (N) (WN) (DEFT) (SE/R) R-2SE R+2SE
Urban 0.438 0.018 723 323 1.001 0.042 0.401 0.475
No education 0,008 0.003 723 323 0.822 0.334 0.003 0,014 With educatlon 0.650 0.035 723 323 1.956 0.053 0.581 0.720
Never Married 0.313 0.014 723 323 0.825 0.046 0.284 0.341 Currently in union 0.646 0.014 723 323 0.789 0.022 0.618 0.674 Married before age of 20 0.395 0.026 570 254 1.291 0.067 0.842 0.448 Had first sexual intercourse before 18 0.216 0.022 570 254 1,264 0.101 0.172 0.259
Children ever born 2.849 0.103 723 323 0.907 0.036 2.644 3.054 Children ever born to women over 40 5.649 0.222 168 75 0.940 0.039 5.205 6.092 Children Surviving 2.548 0.093 723 323 0.946 0.037 2.361 2.735
Know any method Know any modem method Ever used any contraceptive method Currently using any method Currently using a modem method Currently using pill CuIrent y using 1UD Currently using injection Currently using condom Currently using female sterilization Currently using male sterilization Currently using periodic abstinence Currently using withdrawal Public source user
Want no more children Want to delay next birth at least 2 years Ideal number of children
Mother received tetanus injections Received medical care at birth
1.000 0.000 467 208 NA 0.000 1.000 1.000 0.998 0.002 467 208 0.997 0.002 0.994 1.000 0.730 0.026 467 208 1.278 0.036 0.678 0.783 0.488 0,028 467 208 1.226 0.058 0.431 0.545 0.287 0,022 467 208 1,064 0.078 0.242 0.332 0.088 0.013 467 208 0.988 0.148 0.062 0.114 0.069 0.017 467 208 1,436 0.245 0,035 0.102 0.041 0,012 467 208 1.274 0,287 0.017 0.064 0.013 0.004 467 208 0.816 0.331 0.004 0.021 0.075 0.011 467 208 0.929 0.151 0.052 0.098 0,002 0.002 467 208 1.001 1.001 0.000 0.006 0.124 0.016 467 208 1.045 0.129 0.092 0.156 0.062 0.013 467 208 1.183 0.213 0.036 0.089 0.833 0.027 138 62 0.851 0.033 0.779 0.888
0.702 0.017 467 208 0.813 0.025 0.668 0.737 0.193 0.019 467 208 1,049 0.099 0.154 0.231 3.180 0.046 722 322 0.875 0.014 3.088 3.272
0.732 0.035 441 197 1.335 0.047 0.663 0.802 0.401 0.039 441 197 1.317 0.097 0.324 0.479
Had diarrhea in last 2 weeks 0.073 0.010 413 184 0.756 0.143 0.052 0.093 Received ORS treatment 0.467 0.130 30 I3 1.318 0.279 0.206 0.727 Received medical treatment 0.600 0.115 30 13 1.177 0.191 0.370 0.830
Having health card Received BCG vaccination Received DPT vaccination (3 doses) Received polio vaccination (3 doses) Received measles vaccination Fully immunized
0.438 0,068 89 40 1.287 0.155 0.303 0.574 0.933 0,028 89 40 1.041 0.030 0.877 0.988 0.854 0.041 89 40 1.082 0.047 0.773 0.935 0.876 0.044 89 40 1,268 0.051 0.788 0.965 0.876 0.033 89 40 0.938 0.037 0.811 0.942 0.787 0.045 89 40 1.031 0.057 0.697 0.876
Total fertility rate 4.648 0.323 NA 893 1.063 0.069 4.003 5.294
Neonatal mortality rate 28.556 7.018 918 410 1.037 0,246 14.521 42.591 Infant mortality rate 53.179 9.014 920 411 1.059 0.169 3 5 . 1 5 1 71.206 Child mortality rate 31.012 6.904 929 415 1.115 0.223 17.205 44.820 Under 5 child mortality rate 82.542 11,242 931 416 1.119 0.136 60.057 105.027 Posmeonatal mortality rate 24.623 5.610 920 411 0.997 0.228 13.403 35.843
N.A. = Not Applicable
193

APPENDIX C
QUALITY OF THE DATA: NONSAMPLING ERRORS


APPENDIX C
QUALITY OF THE DATA: NONSAMPLING ERRORS
While Appendix B provides sampling errors for selected variables presented in the report, this appendix is presented to provide data users an initial overview of the data quality. For this purpose, misreporting of ages, respondent's recall problems and other problems encountered during data collection are investigated in Appendix C.
Presented in Table C.1 is the distribution by single years of age of the household population. Overall, slight heaping on ages ending with 0 and 5 is detected throughout all ages for both sexes. Errors are particularly notable in the age reporting at ages 15 and 49 years--the lower and upper limits of eligibility for individual in the NDHS interview. The age ratios at 15 for women is 1.00, while for men it is 0.95 indicating a better age reporting by the females at this age. At age 49, the ratios are 0.93 and 0.97 for women and men, respectively, demonstrating the tendency for both males and females to either understate or overstate their age.
In Table C.2, household weights are applied to the age distribution of women reported in the individual interview, to investigate if there is a bias in the age reporting in the individual woman's interview. The table shows the expected pattern of declining percentage as age increases, and that there is virtually no difference between the age distribution of women recorded in the household schedule and those interviewed with the individual questionnaire, indicating the absence of a bias. This table also shows that response rates vary slightly across the age of the respondents.
Information on the completeness of reporting in connection with a set of important variables is provided in Table C.3. With the exception of information on child's size at birth, the percentage of eases with missing information is extraordinarily low, and information on dating, of events seem to be complete.
According to Table C.4, there is a slight heaping in the reported total number of births in 1990 and the number of children still living. Information on month and year of birth is available for virtually all children. Birth dates of dead children are less complete than for surviving children; nevertheless, this information is known for 95.8 percent of children. The overall sex ratio at birth for all births is 106, while from year to year there are fluctuations without any indication of bias except for 1995 when overall sex ratio at birth was unusually high at 127. Sex ratio for dead children is much higher than for surviving children, indicating higher mortality among male children. The calendar ratios show that there was a transference of births from 1991 to the earlier and later years. The ratio of births in 1991 to the average of the two adjoining years is 0.96, while the ratios for 1990 and 1991 are 1.02 and 1.06, respectively.
The percentage of early neonatal deaths (deaths within the first 7 days after birth) among all neonatal deaths (deaths within the first month of birth) increases as infant mortaIity decreases (Table C.5). However, a decreasing proportion of neonatal among infant deaths is shown in Table C.6. It should also be noted that heaping at age I2 months is more apparent in the more distant past (5 years or more prior to the survey) than in the most recent period, demonstrating that reporting of age at death is improving.
197

Table C.I Household age distribution
Single-year age distribution of the de jure household population by sex (weighted), Philippines 1998
Males Females Males Females Age Number Percent Number Percent Age Number Percent Number Percent
<1 894 3.0 762 2.5 36 323 1.1 374 1.2 I 799 2.7 765 2.5 37 368 1.2 375 1.2 2 833 2.8 731 2.4 38 355 1.2 402 1.3 3 840 2.8 728 2.4 39 367 1.2 353 1.2 4 835 2.8 762 2.5 40 322 1.i 316 1,0 5 822 2.7 826 2.7 41 234 0.8 326 1.1 6 870 2.9 771 2.5 42 314 1.0 358 1.2 7 824 2.7 823 2.7 43 315 1.1 291 1.0 8 763 2.5 801 2.6 44 259 0.9 277 0.9 9 791 2.6 733 2.4 45 302 1.0 280 0.9
10 786 2.6 755 2.5 46 233 0.8 232 0.8 I1 718 2.4 682 2.2 47 232 0.8 234 0.8 12 748 2.5 677 2.2 48 251 0.8 254 0.8 13 701 2.3 721 2.4 49 237 0.8 240 0.8 14 718 2.4 727 2.4 50 239 0.8 263 0.9 15 653 2.2 685 2.3 51 160 0.5 221 0.7 16 656 2.2 646 2.1 52 204 0.7 237 0.8 17 614 2.0 624 2.1 53 187 0.6 193 0.6 18 670 2.2 631 2.1 54 168 0.6 207 0.7 19 604 2.0 527 1.7 55 165 0.5 251 0.8 20 554 1.8 532 1.8 56 169 0.6 175 0.6 21 503 1.7 509 1.7 57 150 0.5 168 0.6 22 509 1.7 494 1.6 58 164 0.5 177 0.6 23 442 1.5 472 1.6 59 132 0.4 159 0.5 24 455 1.5 433 1.4 60 I98 0.7 212 0.7 25 492 1.6 530 1.7 6I 114 0.4 125 0.4 26 426 1.4 441 1.5 62 133 0.4 15I 0.5 27 431 1.4 499 1.6 63 107 0.4 143 0.5 28 472 1.6 486 1.6 64 102 0.3 108 0.4 29 455 1.5 420 1.4 65 124 0.4 152 0.5 30 439 1.5 455 1.5 66 69 0.2 92 0.3 31 418 1.4 407 1.3 67 81 0.3 99 0.3 32 392 1.3 438 1.4 68 79 0.3 104 0.3 33 424 1.4 457 1.5 69 65 0.2 74 0.2 34 403 1.3 420 1.4 70+ 677 2.3 940 3.1 35 419 1.4 429 1.4 Don' t know/
missing 9 0.0 8 0.0
Total 29980 I00.0 30369 100.0
Note: The de jure population includes all usual residents.
198

Table C.2 Age distribution of eligible and interviewed women
Percent distribution in five-year age gmups of the de jure household population of women age 10-54 and of interviewed women age 15-49,and percentage of eligible women who were interviewed (weighted), Philippines 1998
Household population Interviewed Percentage of women age 15-49 women age 15-49 interviewed
Age Number Percent Number Percent (weighted)
10-14 3563 NA NA NA NA 15-I9 3113 21.0 3028 21.0 97.3 20-24 2440 16.4 2358 16.4 96.6 25-29 2375 16.0 2291 15.9 96.5 30-34 2177 14.7 2123 14.7 97.5 35-39 1933 13.0 1896 13.2 98.1 40-44 1568 10.6 1519 10.5 96.9 45-49 1240 8.4 1201 8.3 96.8 50-54 1120 NA NA NA
15-49 14847 NA 14416 NA 97.1
Note: The de jure population includes all residents. NA = Not applicable
Table C.3 Completeness of reporting
Percentage of observations missing information for selected demographic and health questions (weighted), Philippines 1998
Percentage Number missing of
Subject Reference group information cases
Birth date Births in last 15 years Month only 0.7 21268 Month and year 0.0 21268
Age at death Deaths to births in last 15 years 0.2 1264
Age/date at first union t Ever-married women 0.2 8896
Respondent's education All women 0.0 13983
Child's size at birth Births in last 59 months 5.9 4773
Diarrhea in last 2 weeks Living children age 0-59 months 1.2 7286
tBoth year and age missing
199

Table C.4 Births by calendar year since birth
Distribution of births by calendar years since birth for living (L), dead (D), and all (T) children, according to reporting completeness, sex ratio at birth, and ratio of births by calendar year, Philippines 1998
Percentage with Sex ratio Number of births complete birth date ~ at birth 2 Calendar ratio 3 Male Female
Year L D T L D T L D T L D T L D T L D T
98 356 7 363 100.0 100.0 100.0 103.7 60.6 102.7 - - 181 3 184 175 4 179 97 1544 42 1586 I00.0 100.0 100,0 112.7 166,9 113.8 168.6 134.6 167.5 818 26 844 726 16 742 96 1476 56 1532 100.0 100.0 100.0 104.7 74,0 103.4 99.5 107.8 99.7 755 24 779 721 32 753 95 1424 61 1485 99.9 100.0 99.9 125.0 174.0 126.7 98.5 101.3 98.6 791 39 830 633 22 655 94 1415 65 1480 99.9 100.0 99.9 106.3 132.5 107.3 98.5 94.6 98.4 729 37 766 686 28 714 93 1448 76 1525 99.8 100.0 99,8 103.0 91.7 102.4 99.5 89.6 98.9 735 37 771 714 40 753 92 1497 105 1602 99.1 97.7 99.0 101.0 152.4 103.7 104.5 134.8 106.1 752 64 816 745 42 787 91 1416 80 1496 99.2 96.5 99.1 113.1 118.5 113.4 97.0 84.2 96.2 751 43 795 664 37 701 90 1422 85 1507 99.1 91.8 98.7 98.5 150,6 100.9 101.8 100.5 101.7 706 51 757 716 34 750 89 1377 89 1466 99.3 91.4 98.8 96.9 129,6 98.6 678 50 728 700 39 738 94-98 6214 231 6445 99,9 100.0 99.9 111.3 125,6 I l l .8 3274 129 3402 2940 102 3043 89-93 7161 435 7596 99.3 95.4 99.1 102.3 128.3 103.7 3622 245 3867 3539 191 3730 84-88 5859 529. 6389 99.3 95.5 99.0 106.1 120,6 107.2 3016 289 3305 2844 240 3083 79-83 4589 462 5050 99.2 96.2 98.9 102.3 143,3 105.4 2320 272 2592 2269 190 2458 <79 4161 500 4661 99.0 94.1 98.5 96.9 138.5 100.7 2048 290 2338 2113 210 2323
All 27984 2157 30141 99.4 95.8 99.1 104.2 131.4 105.9 14280 1225 15504 13704 932 14637
NA = Not applicable tBoth year and month of birth given 2(BJBf)* 100, where Bm and Bf are the numbers of male and female births, respectively 3[2B~/(B~.t +B~+l)]* 100, where B~ is the number of births in the calendar yearx
200

Table C.5 Reporting of age at death in days
Distribution of reported deaths under 1 month of age by age at death in days and the percentage of neonatal deaths reported to occur at ages 0-6 days, for five-year periods of birth preceding the survey, Philippines 1998
Age at death Number of years preceding the survey Total
(in days) 0-4 5-9 10-14 15-19 0-19
<1 35 49 51 27 163 1 22 30 36 24 112 2 12 8 8 7 35 3 18 13 14 7 53 4 7 3 3 4 18 5 6 14 7 6 32 6 5 0 2 3 11 7 7 14 25 22 67 8 0 2 0 2 5 9 1 3 4 1 10
I0 2 4 3 0 9 12 2 0 I 2 5 13 0 1 1 0 2 14 4 3 5 2 14 15 1 2 4 2 8 16 0 0 0 3 3 17 0 0 1 I 2 18 0 0 1 0 1 19 0 4 0 1 4 20 2 0 0 0 2 21 0 2 1 1 5 22 1 0 0 0 2 23 1 0 0 6 6 25 0 0 1 0 1 27 1 0 2 0 2 29 0 0 1 0 1 30 0 I 0 2 2
Total O-30 129 153 172 123 576 Percent early neonatal ~ 82.0 77.0 70.6 63.9 73.4
1(0-6 days/O-30 days) * 100
201

Table C.6 Reporting of age at death in months
Distribution of reported deaths under 2 years of age by age at death in months and the percentage of infant deaths reported to occur at ages under one month, for five-year periods of birth preceding the survey, Philippines 1998
Age at death Number of years preceding the survey Total
(in months) 0-4 5-9 10-14 15-19 0-19
<I a 129 153 172 123 576 1 21 20 24 21 86 2 17 11 12 5 44 3 10 17 7 11 46 4 15 8 3 4 30 5 2 9 12 10 33 6 4 8 5 3 20 7 10 14 13 14 50 8 6 13 6 17 43 9 17 12 11 9 49
10 2 9 6 7 24 11 7 5 13 9 34 12 15 49 53 38 156 13 1 1 2 5 9 14 I 2 3 6 12 15 3 1 1 1 5 16 2 1 3 1 7 17 1 1 I 0 4 18 3 3 4 8 17 19 0 2 0 0 3 20 0 0 1 0 2 21 0 0 1 0 1 22 0 0 2 0 3 23 1 1 I 3 6 1 year 0 3 2 1 5
Total 0-11 240 279 284 232 1035 Percent neonatal b 53.7 54.8 60.4 52.9 55.6
alncludes deaths under 1 month reported in days b(Under 1 month/under 1 year) * 100
202

APPENDIX D
PERSONS INVOLVED IN THE 1998 NATIONAL DEMOGRAPHIC
AND HEALTH SURVEY


A P P E N D I X D
P E R S O N N E L I N V O L V E D
PILE-TEST
Macro International, Inc. Dr. Pav Govindasamy
Population Commission Helen Madrid Rosalinda Diaz
Department of Health Dr. Josephine Hipolito Dr. Emalita Manalac Dr. Orlando Pagulayan Dr. Erlinda Guerrero
Univ. of the Philippines Population Institute Zenaida Quiray
National Statistics Office Benedicta Yabut Mercedita Tia Lyn Jerusalem Eddie Aquino Welvin Billones
National Statistics Office Ma. Virginia Olvefia Teresita Vargas Hilda Fernandez Nerissa Guillermo Ma. Neneth Labrador Merle Clamor Annabelle Langbayan Cynthia Lumberio Socorro Abejo Custodio Saboren Lucita Flavier Jeremias Luis Lucia Iraida Soneja Wilma Sulit Wilma Perante Aniceta Nipal Cecil Gonzales Juliet Dalanon Ismael Ramos
T R A I N I N G
FIRST LEVEL
U.S. Assistance for International Development Reynalda Perez
Department of Health Dr. Erlinda Guerrero Dr. Emalita Mafialac Dr. Gloria Punzalan Onofria De Guzman Helen Ocampo
Univ. of the Philippines Population Institute Dr. Zelda Zablan Dr. Josie Cabigon Eliseo De Guzman
Macro International, Inc. Dr. Annie Cross
National Statistics Office Dr. Elizabeth Go Paula Monina Collado Dr. Socorro Abejo Benedicta Yabut Mercedita Tia Lucita Flavier Jeremias Luis Lucia Iraida Soneja Ma. Virginia Olvefia
205

Department of Health Dr. Gloria Punzalan Onofria De Guzman
POPULATION COMMISSION Fe Lotho
National Statistics Office Socorro Abejo Mercedita Tia Benedicta Yabut Ma. Virginia Olve~a Lucia Iraida Soneja Lucita Flavier Jeremias Luis Edna Rapanot
SECOND LEVEL
National Statistics Office Amalia Saripada Zenaida Tapire Marifi Pedrera Ma. Esperanza Rosaupan Dr. Francis Chan Annabelle Langbayan Socrates Ramores Connie Angeles Cynthia Lumberio Airene Pucyutan Jessamyne Anne Calledo Wilma Perante Juliet Dalanon Belinda Penuela Leah Magracia
Team No. 1 Adelfa Yepes (Team Supervisor) Veronica Magramo (Field Editor) Corazon Martinez Nena de Leon Edita Ines Vivencia Verdadero Emerlita de Leon Julita Osea Ma. Linda Mabansag
M A I N S U R V E Y
INTERVIEW TEAMS
Team No. 3 Yolanda Mantaring (Team Supervisor) Leonor Daudo (Field Editor) Asuncion Apolonio Ma. Alelie Santos Vilma Borreo Cerlina Felipe
Team No. 2 Cristina Mabanes(Team Supervisor) Elenita Tiangco (Field Editor) Lilian Alberto Irma Maranan Merlyn Panganiban Sharee Mae Sampilo Susan Sampang
Team No. 4 Evelyn Bermudes (Team Supervisor) Zenaida Felipe (Field Editor) Vilma Obias Amelia Vega Sonia Baesarsa Rebecca Susosco
206

Team No. 5 MagdaIena Buyuccan (Team Supervisor) Evangeline Canuto (Field Editor) Leilani Joyce Molintas Doleny Bao-angan Rhodalyn Taguba Visitation Balbuena Mary Jane Benabese Alma Hangdaan
Team No. 6 Romeo Agustin (Team Supervisor) Gloria Mercedes Felizco(Field Editor) Estela Lunag Nora Bullan Divina Langgawan Remedios Agluya Michelle Aeod Evelyn Boteng
Team No. 10 Thelma Sanchez (Team Supervisor) Marites Balintec (Field Editor) Jessileth Cabuha Editha Dantes Eileen Diego Estelita Eehala Josephine Galindo Recelyn Madduma
Team No. 11 Marites Alim (Team Supervisor) Janeth Bundalian (Field Editor) Maritess Manlapud Marissa Ramos Remedios Bemardo Josefina Belen Garcia
Team No. 7 Artemio Alibayan (Team Supervisor) Cherry Renon (Field Editor) Jocelyn Balino Perpetua Vergara Adelfa Vicente Venus Tranquilo Marizel Garcia
Team No. 12 Amorcita Murao(Team Supervisor) Agnes Borcena (Field Editor) Maribeth Victorino Benneth Mariano Teodorica Puzon Norma Dariza Marian Felipe
Team No. 8 Crispin Barrozo (Team Supervisor) Gloria Naraja (Field Editor) Teresita Zarate Magdalena Sales Sylvia de Guzman Milagros de Guzman Natalia Banta Lilia Iniego
Team No. 9 Cholly Bayon (Team Supervisor) Merlyn Malana (Field Editor) Jesusa Arena Ma. Cristina Regala Lovely Mabborang Ella Mallillin Gladys Perdido Mamer Tacang Imelda Tamayao
Team No. 13 Corazon Bonifacio (Team Supervisor) Maria Baun (Field Editor) Crispina Sarte Angelina Murao Daisy Valeda Liza Suarez Jocelyn Tuguero
Team No. 14 Rudy Vergara (Team Supervisor) Irene La Torre (Field Editor) Charity Carandang Anastacia Evora Myma Malabanan Fely Mifiano Edith Magpantay Rea Aban
207

Team No. 1S Emil Salazar (Team Supervisor) Ma. Pia Bocalan (Field Editor) Aria Marie Cruz Cynthia Ibusca Leslie Matilla Nova Piamonte Fritzie Tan Ruth Pera
Team No. 20 Nancy Nillo (Team Supervisor) Theresa Ramores (Field Editor) Fe Reglos Lilia Caudilla Alma Alvia Lanie Sto. Tomas Irene Petra Ravalo Grace Casallos
Team No. 16 Carlito Tortes (Team Supervisor) Hermie Colimbino (Field Editor) Junalyn Albonia Sofia Cordero Wilma Dimaala Josephine Principe Eleonor Sobelino Merlita The
Team No. 21 Antonet Catubuan (Team Supervisor) Mary Fe Distura (Field Editor) Judy Martinez Ofelia Bolido Leyte Arroyo Warlyn Defante
Team No. 17 Evelyn Apellido (Team Supervisor) Shirley Vuelba
Team No. 22 Salvacion Lemos (Team Supervisor) Jennifer Magbanua (Field Editor) Geraldine Campos Dativa Cuello Jehan Sebastian Daisy Seguiza
Team No. 18 Marivel Alarcon (Team Supervisor) Joji Villafuerte (Field Editor) Eva Zaragosa Sarsuela Salvaeion Gina Navarro Marites Marilla
Team No. 23 Judy Jordan (Team Supervisor Joy Liguaton (Field Editor) Eunice Mae Rivera Helen Claur Liza Robillo Lucita Trajeras Jenalyn Sinogbuhan Jasmin Buala
Team No. 19 Emelinda Gualvez (Team Supervisor) Grace Levantino (Field Editor) Juliet Dudan Anaeris Lachica Sergia San Juan Ligaya Ty
Team No. 24 Edwina Carriaga (Team Supervisor) Carmelieta Nieves (Field Editor) Fe Bascon Marcia Daan Reineria Gulong Wenifreda Hayag Clarissa Nadela Alicia Wong
208

Team No, 25 Colita Montoya (Team Supervisor) Nimfa Aray (Field Editor) Divinagraeia Basio Jocelyn Durante Eugenia Mitra Vilma Ubanan
Team No. 30 Felipa Siborboro (Team Supervisor) Linda Otong (Field Editor) Medarda Tolentino Warlita Polliseo Milan Asmawil Ma. Teresa Babaran
Team No. 26 Hera Juares (Team Supervisor) Felida Generosos (Field Editor) Maripe Socorro Arbon Jelly Cabajon Girlie Diputado Donabell Idayan
Team No. 27 Custodio Saboren, Jr. (Team Supervisor) Agnes Agner (Field Editor) Brigette Chua Ma. Elene Juabot Sheryl Abadingo Jane Labrador
Team No. 28 Necitas Flores (Team Supervisor) Matilde Anzale (Field Editor) Leonora Daga Rosalia Emphasis Liezl Cabrigas Odelia Fumar Rosalea Cabuello
Team No. 31 Nerissa Lim (Team Supervisor) Vivian Camelotes (Field Editor) Thelma delos Santos Elma Ybanez Celsa Cabusas Gilda Sanel Rosemarie Salva
Team No. 32 Herminia Melegrito (Team Supervisor) Rosebella Delfinado (Field Editor) Pearlhana Centi Susan Beliganio Marjorie Gonzales Rosalinda Saleedo Teresita Balanay
Team No. 33 Susan Pamtilo (Team Supervisor) Aurora Blaneaflor (Field Editor) Delia Baeus Pinky Bagnio Araeeli Patriana Isabel Piape Loudivina Reales Nancy Taboelaon
Team No. 29 Leonida Daco-ag (Team Supervisor) Sergette Ellema (Field Editor) Esmeralda Alcayde Maillen Aler Helen Navallo Teen dela Cruz Emma Villarante Marissa Gabuya
Team No. 34 Lolita Espinosa (Team Supervisor) Buenafe Siseon (Field Editor) Eunice Autor Bernadette Baeonguis Rosanna Labrador Arlene Ministerio Mariche Muring Beberly Palasan
209

Team No. 35 Rowena Linaban (Team Supervisor) Jenelyn Modequino (Field Editor) Rose Abubo Carmen Gurrea Leilanie Liwagon Rosie Lumantas
Team No. 40 Regina Gamolo (Team Supervisor) Noemi Moncada (Field Editor) Marina Anciano Marichu Baculio Sanalia Ibrahim
Team No. 36 Eva Agang (Team Supervisor) Emma Santander (Field Editor) Alberticia Jamis Lilia Monforte Donna Santander Maureen Serifia
Team No. 37 Juliet Macabiog (Team Supervisor) Mary Jane Cardinal (Field Editor) Heidy Espinosa Jennen Frias Charita Mahinay Marilyn Octobre Gilda Songcog Rosalie Suarez
Team No. 41 Jurilyn Palmes (Team Supervisor) Corazon Capulong (Field Editor) Ella Gutierrez Josephine Jurado Marilyn Lanestosa Melanie Silvano Ma. Adeliza Suson
Team No. 42 Vilma Halud (Team Supervisor) Ambolda Mohammad (Field Editor) Fatima Usas Jumbra Mastot Mirlinda Biblani
Team No. 38 Heidy Palencia (Team Supervisor) Loida Buton (Field Editor) Cecilia Catedral Flordeliza Enriquez Flerida Ihalas Marilou Joseph Melchorita Ortega
Team No. 43 Mohammadali Alonto (Team Supervisor) Mohammadali Alonto (Field Editor) Atica Amer Sadjarata Banuas
Team No. 39 Genoveva Manio (Team Supervisor) Letecia Baluran (Field Editor) Cecile Abaro Jeannete Cabug Meriam Catog Bebelita Duarte Marsha Lebrilla
Team No. 44 Abdulradzak Ayob (Team Supervisor) Josephine Senina (Field Editor) Baiali Menang Jasmin Tumindig Jubaida Tamon Rasna Latiph Rowaida Ali
210

FIELD SUPERVISORS FROM CENTRAL OFFICE
National Statistics Office Eloisa Rodriguez Marilyn Vergara Edna Rapanot Gemelyn Macabiog Erlinda Silang Wilma Sulit Ma. Esperanza Rosaupan Rita Tumbaga
National Statistics Office Benedieta Yabut Girlie salvaeion Zenaida Tapire Socorro Abejo Amelia Saripada Irma Tanjuakio Lucita Flavier Ma. Teresa Rapanan
V E R I F I C A T I O N O F V A C A N T H O U S I N G U N I T S
National Statistics Office Amelia Saripada Girlie Salvation Zenaida Tapire Ma. Isabel Delfin Elpidio Maramot Leticia Tulio
National Statistics Office Elsie Galanta Erlinda Silang Ma. Solita Cabedo Wilma Sulit Gemalyn Maeabiog Edna Rapanot
P R O C E S S I N G
DATA PROCESSING STAFF
Macro International, Inc. Albert Themme
National Statistics Office Elpidio Maramot (over-all-supervisor) Amelia Saripada Zenaida Tapire Wilma Sulit Maria Inarda Lina Galit Erma Aquino Cherrie Balderama George Sansano Allan Melendrez Joselito Sarmiento Jehiel Pacamarra
National Statistics Office Antonio Tolenfmo Rufina Bruto Rhecon Ghamad Milagros Isagunde Eufemia Macabebe Marlyn Recupero Rudinah Bulambao Heidi Grace Diaz Norlinda Yulgar Mariter Magdadaro Delia Parentila Marlene Ramos Chit Sanehez Mark Victorino Lizle Zamora
211


APPENDIX E
SURVEY QUESTIONNAIRES


Republic of the Philippines NATIONAL STATISTICS OFFICE
1998 NATIONAL DEMOGRAPHIC AND HEALTH SURVEY HOUSEHOLD QUESTIONNAIRE
Set of sets
Confidentiality: This survey is authorized by Commonwealth Act No. 591. All information Is strictly confidential.
IDENTIFICATION
NDHS FORM 1 NSCB Approval No. N80-9721-01 Expires June 30, 1998
PROVINCE
CITY/MUNICIPALITY
BARANGAY
URBAN/RURAL (URBAN=l, RURAL=2)
,, NDS SAMPLE NUMBER ..................................................................................................
HOUSEHOLD CONTROL NUMBER
., NDHS HOUSEHOLD SEQUENTIAL NUMBER. .......................................................................
NAME OF HOUSEHOLD HEAD
ADDRESS
INTERVIEWER VfSITS
DATE
INTERVIEWER'S NAME
RESULT*
NEXT VISIT: DATE
TIME L; : : L / E ;
*RESULT CODES : 01 COMPLETED, ORIGINAL HOUSEHOLD 02 COMPLETED, PRESENT OCCUPANT OF DWELLING 03 NO HOUSEHOLD MEMBER AT HOME OR NO COMPETENT RESPONDENT AT HOME
AT TIME OF VISIT 04 ENTIRE HOUSEHOLD ABSENT FOR EXTENDED PERIOD OF TIME 05 POSTPONED 06 REFUSED 07 DWELLING VACANT OR ADDRESS NOT A DWELLING 08 DWELLING DESTROYED 09 DWELLING NOT FOUND 10 OTHER
(SPECIFY)
FINAL VISIT
DAY
MONTH
YEAR 1 9 9 8
INT. CODE
RESULT*
TOTAL NO. [ - - ~ OF VISITS
TOTAL HH MEMBERS
TOTAL ELIGIBLE WOMEN
LINE NO. OF RESP. IN HOUSEHOLD SCHEDULE
LANGUAGE OF QUESTIONNAIRE: ENGLISH [-} SUPERVISOR
NAME
DATE
NAME
DATE
FIELD EDITOR OFFICE EDITOR KEYED BY
215

HOUSEHOLD SCHEDULE
LINE USUAL RESIDENTS AND VISITORS :~ELATIONSHIP TO HEA r` NO. OF THE HOUSEHOLD*
Ol
O2
O3
O4
O5
O6
O7
O8
O9
lO
11
12
13
14
RESIDENCE SEX AGE
Please give me the names of the persons who Nhat is the relationship of )oes (NAME) usually live in your household and guests of NAME) to the head of the rsually live here? the household who slept here last night, iousehold? starting with the head of the household
(3) L YES NO
:)id (NAME) sleep Is (NAME) How old is (NAME) 1ere last night? male or as of his/her last
female? birthday?
YES NO M F IN YEARS
1 2 2 I I
1 2 1 2 1 2 ~ [ ~
~ ] 1 2 1 2 1 2 ~ [ ~
~ ] 1 2 1 2 1 2
1 2 1 2 1 2
2 M-T- 1 2 1 2 1
1 2 1 2 1 2
~ ] 1 2 1 2 1 2
1 2 1 2 1 2 ~ [ ~
1 2 1 2 1 2
1 2 1 2 1 2
1 2 1 2 1 2
CT- 1 2 1 2 1 2
--F-CT 1 2 1 2 1 2
TICK HERE IF CONTINUATION SET IS USED
Just to make sure that I have a complete listing:
1 ) Are there any other persons such as small children or infants that we have not listed?
2) In addition, are there any other people who may not be members of your family, such as domestic servants, lodgers or friends who usually llve here?
3) Are there any guests or temporary visitors staying here, or anyone else who stept here last night that have not been tisfed?
*CODES FOR Q.3 RELATIONSHIP TO HEAD OF HOUSEHOLD:
01 = HEAD 02 = WIFE OR HUSBAND
[ ]
YES [ ~ - _ ~ ENTER EACH IN TABLE NO I ~ - I
YES ~ ENTER EACH IN TABLE NO ~ l
YES ~ ENTER EACH IN TABLE NO ~ 7
03 = SON OR DAUGHTER 08 = BROTHER OR SISTER 04 ; SON-IN-LAW OR DAUGHTER-IN-LAW 09 = OTHER RELATIVE 05 = GRANDCHILD 10 = ADOPTED/FOSTER/STEP CHILD 06 = PARENT 11 = NOT RELATED 07 = PARENT-IN-LAW 98 = DONOr KNOW
216

HOUSEHOLD SCHEDULE
EDUCATION RESIDENCE ELIGIBI- LITY
MOTHER'S USUAL RESIDENCE IF AGE IS 5 YEAR8 OR OLDER
IF AGE IS 6 YEARS OR OLDER AT PERSON'S BIRTH RESIDENCE IN JANUARY 1993
CIRCLE Has (NAME) At the time (NAME) was born, where was In what province did (NAME) reside in LINE ever been to IF ATTENDED SCHOOL his/her mother's province of usual Janua9 1993?*** school? What is the highest IF AGE IS residence? *** NUMBER
grade/year (NAME) LESS THAN OF ALL completed?** ~ v = a ~ WOMEN
Is (NAME) AGE 15- 49
still in school?
YES NO GRADE/YEAR YES NO
t 2 I ~ ] 1 2 I - T q F F 1 02
1 2 ~ r ~ 1 2 F F 1 I - I - 1 03
, 2 ~ 1 1 2 I - r - ] F F 1 o.
1 2 F ~ I , 2 ~ F I ~ 05
, 2 ~ - ] , 2 F V } I - ~ 06
, 2 ~ , 2 ~ F F i o~
1 2 ~ , 2 M-T-] I ~ o5
1 2 I - F - I 1 2 I - F - I ~ o9
1 2 i q - I , 2 I - r - I ~ 1,
F-Fq CTq ~ q 1 2 1 2 12
I T ] FF1 1 2 1 2 13
, 2 I -T -1 , 2 F r l I ~ ,4
**CODES FOR Q.9 GRADE/YEAR
0O = NO GRADE COMPLETED 11 = ELEMENTARY GRADE 1 12 = ELEMENTARY GRADE 2 13 = ELEMENTARY GRADE 3 14 = ELEMENTARY GRADE 4 15 = ELEMENTARY GRADE 5 16 = ELEMENTARY GRADE 6 17 = ELEMENTARY GRADE 7
21 = HIGH SCHOOL YEAR 1 22 = HIGH SCHOOL YEAR 2 23 = HIGH SCHOOL YEAR 3 24 = HIGH SCHOOL YEAR 4 25 = HIGH SCHOOL GRADUATE
31 = POSTSECONDARY YEAR 1 32 = POSTSECONDARY YEAR 2 OR MORE
41 = COLLEGE YEAR 1 42 = COLLEGE YEAR 2 43 = COLLEGE YEAR 3 44 = COLLEGE YEAR 4
45 = COLLEGE YEAR 5 46 = COLLEGE YEAR 6 OR HIGHER 47 = COLLEGE GRADUATE
51 = POST-BACCALAUREATE 98 = DON'T KNOW
***CODES FOR QS, 11 AND 12 RESIDENCE
96 = SAME PROVINCE 97 = FOREJGN COUNTRY 98 = DON'T KNOW
SPECIFY IF ANOTHER PROVINCE
217

NO.
14
QUESTIONS AND FILTERS
What is the main source of ddnking water for members of your household?
CODING CATEGORIES SKIP
COMMUNITY WATER SYSTEM PIPED INTO
DWELLING . . . . . . . . . . . . . . 11 ~ YARD/PLOTIIII...II.I . . . . . . . . . . i i i ~ i ~ 1 2 ' I~ 16 PUBLIC TAP . . . . . . . . . . . . . . . . . . . . . . . . . . . . . 13
POINT SOURCE PROTECTED WELL . . . . . . . . . . . . . . . . . . . . 21 UNPROTECTED (OPEN
DUG WELL) . . . . . . . . . . . . . . . . . . . . . . . . . . . . . 22 DEVELOPED SPRING . . . . . . . . . . . . . . . . . . 31 UNDEVELOPED SPRING . . . . . . . . . . . . . . 32 RIVER/STREAM . . . . . . . . . . . . . . . . . . . . . . . . . 33 POND/LAKE . . . . . . . . . . . . . . . . . . . . . . . . . . . . . 34 DAM . . . . . . . . . . . . . . . . . . . . . . . . . . . . . . . . . . . . . . 35 RAINWATER . . . . . . . . . . . . . . . . . . . . . . . . . . . . . 41 .
TANKER TRUCK/PEDDLER . . . . . . . . . . . . . . . . . . . 51 . Bo'rrLEDWATER . . . . . . . . . . . . . . . . . . . . . . . . . . . . . 61" • 16 OTHER, SPECIFY 96 '
15 H~w long does it take you to go there, get water, and come back? MINUTES . . . . . . . . . . . . . . . . . . . I I I [
ON PREMISES . . . . . . . . . . . . . . . . . . . . . . . . . . . . . . . 996
16
17
18
22
How do you treat your drinking water?
PROBE: Anything else?
CIRCLE ALL RESPONSES.
19
20
What kind of toilet facility does your household use?
Does your household have: Electricity? A radlo/radio cassette? A television? A telephone/cellular phone? A refrigerator/freezer?
How many rooms are used for sleeping by your household?
BOIUNG . . . . . . . . . . . . . . . . . . . . . . . . . . . . . . . . . . . . . . . . A C H L O R I N A T I O N . . . . . . . . . . . . . . . . . . . . . . . . . . . . . . . . S FILTERING EQUIPMENT . . . . . . . . . . . . . . . . . . . . . . O OTHER, SPECIFY X NONE Y
21
FLUSH TOILET OWN TOILET . . . . . . . . . . . . . . . . . . . . . . . . . . . . . . . 11 SHARED FLUSH TOILET . . . . . . . . . . . . . . . . . . . 12
PiT TOILET/LATRIN E CLOSED PIT . . . . . . . . . . . . . . . . . . . . . . . . . . . . . . . . 21 OPEN PIT . . . . . . . . . . . . . . . . . . . . . . . . . . . . . . . . . . . 22
DROP/OVERHANG . . . . . . . . . . . . . . . . . . . . . . . . . . . . 31 NO FACILITY/FIELD . . . . . . . . . . . . . . . . . . . . . . . . . . . 41 OTHER, SPECIFY 96
YES NO ELECTRICITY . . . . . . . . . . . . . . . . . . . . . . . . 1 2 RADIO/RADIO CASSETrE . . . . . . . . . . . 1 2 TELEVISION . . . . . . . . . . . . . . . . . . . . . . . . . . 1 2 TELEPHONE/CELL PHONE . . . . . . . . . 1 2 REFR{GERATOPJFREEZER . . . . . . . . . 1 2
ROOMS ......................................
MAIN MATERIAL OF THE FLOOR.
RECORD OBSERVATION.
Does any member of your household own: A bicycle? A motorcycle? A car/jeep/van? A motorized banca/boat? A tractor?
What type of salt is usually used for cooking in your household?
NATURAL FLOOR EARTH/SAND . . . . . . . . . . . . . . . . . . . . . . . . . . . . . . 11
RUDIMENTARY FLOOR WOOD PLANKS . . . . . . . . . . . . . . . . . . . . . . . . . . . . 21 PALM/BAMBOO . . . . . . . . . . . . . . . . . . . . . . . . . . . . . 22
FINISHED FLOOR PARQUET OR POLISHED WOOD . . . . . . . . . 31 VINYL OR ASPHALT STRIPS . . . . . . . . . . . . . . 32 CERAMIC TILES . . . . . . . . . . . . . . . . . . . . . . . . . . . . 33 CEMENT . . . . . . . . . . . . . . . . . . . . . . . . . . . . . . . . . . . . 34 MARBLE . . . . . . . . . . . . . . . . . . . . . . . . . . . . . . . . . . . . 35
OTHER, SPECIFY 96
YES NO BICYCLE . . . . . . . . . . . . . . . . . . . . . . . . . . . . . . 1 2 MOTORCYCLE . . . . . . . . . . . . . . . . . . . . . . . . 1 2 CAPJJEEPNAN . . . . . . . . . . . . . . . . . . . . . . . 1 2 BOAT . . . . . . . . . . . . . . . . . . . . . . . . . . . . . . . . . . ! 2 TRACTOR • 1 2
PACKED
IODIZED . . . . . . . . . . . . . . . . . . . . . . . . . . . . . . . . . . . 11
NOT IODIZED . . . . . . . . . . . . . . . . . . . . . . . . . . . . . 12
NOT PACKED
ROCK/COARSE . . . . . . . . . . . . . . . . . . . . . . . . . . . 21
REFINED . . . . . . . . . . . . . . . . . . . . . . . . . . . . . . . . . . 22 OTHER, SPECIFY 96
23 May I see a sample of the salt used to cook the viand eaten by members of your IODINE READING (PPM) household last night? I I I
TEST THE SALT AND WRITE THE RESULT NOT TESTED/NOT SEEN . . . . . . . . . . . . . . . . . . . . . 98
218

NDHS Form 2 NSCB Appmval No. NSO-9721-02 Expires June 30, 1998
Republic of the Philippines NATIONAL STATISTICS OFFICE
1998 NATIONAL DEMOGRAPHIC AND HEALTH SURVEY INDIVIDUAL QUESTIONNAIRE
Set of sets
Confidentiality: This survey is authorized by Commonwealth Act. No. 591. All information Is strictly confidential.
IDENTIFICATION
PROVINCE
CITY/MUNICIPALITY
BARANGAY
URBAN/RURAL(URBAN=I, RURAL=2~ . . . . . . . . . . . . . . . . . . . . . . . . . . . . . . . . . . . . . . . . . . . . . . . . . . . . . . . . . . . . . . . . . . . . . . . . . . . . . .
NDSSAMPLENUMBER .................................................................................................
HOUSEHOLDCONTROLNUMBER ...................................................................................
NDHS HOUSEHOLD SEQUENTIAL NUMBER ......................................................................
ADDRESS
NAME AND LINE NUMBER OF ELIGIBLE WOMAN
INTERVIEWER VISITS
1 2
DATE
INTERVIEWER'S NAME
RESULT*
FINAL VISIT
DAY
MONTH
YEAR F 9 9 i
INT. CODE
RESULT*
8
NEXT VISIT: DATE
TIME
TOTAL NO. OF VISITS
*RESULT CODES: 1 COMPLETED 4 REFUSED 7 OTHER 2 NOT AT HOME 5 PARTLY COMPLETED (SPECIFY) 3 POSTPONED 6 RESPONDENTINCAPACITATEO
LANGUAGE OF QUESTIONNAIRE** 17 I
LOCAL LANGUAGE OF RESPONDENT**
**LANGUAGE CODES 1 TAGALOG 3 ILOCANO 2 CEBUANO 4 BICOL
NAME
DATE
SUPERVISOR
LANGUAGE OF INTERVIEW** I ]
TRANSLATOR USED YES. . . 1 NO. . . 2
5 HILIGAYNON 7 ENGLISH 6 WARAY 8 OTHER
FIELD EDITOR OFFICE EDITOR KEYED BY
NAME
DATE r - T - 1
219

AGE - BIRTH DATE CONSISTENCY C H A R T
Current
Age
0 1 2 3 4
5 6 7 8 9
10 11 12 13 14
15 16 17 18 19
20 21 22 23 24
25 26 27 28 29
Year of Birth
Has not had Has already birthday in had birthday
1998 in 1998 Don' t Know
1997 -- 1996 1997 1995 1996 1994 1995 1993 1994
1992 1993 1991 1992 1990 1991 1989 1990 1988 1989
1987 1988 1986 1987 1985 1986 1984 1985 1983 1984
1982 1983 1981 1982 1980 1981 1979 1980 1978 1979
1977 1978 1976 1977 1975 1976 1974 1975 1973 1974
1972 1973 1971 1972 1970 1971 1969 1970 1968 1969
Year o f Birth Current
Age Has not had Has already
birthday in had birthday
1998 in 1998
Don ' t Know
30 31 32 33 34
35 36 37 38 39
40 41 42 43 44
45 46 47 48 49
50 51 52 53 54
55 56 57 58 59
1967 1968 1966 1967 1965 1966 1964 1965 1963 1964
1962 1963 1961 1962 1960 1961 1959 1960 1958 1959
1957 1958 1956 1957 1955 1956 1954 1955 1953 1954
1952 1953 1951 1952 1950 1951 1949 1950 1948 1949
1947 1948 1946 1947 1945 1946 1944 1945 1943 1944
1942 1943 1941 1942 1940 1941 1939 1940 1938 1939
2 220

NO.
I 1101
102
103
104
SECTION 1. RESPONDENT'S BACKGROUND
QUESTIONS AND FILTERS
RECORD THE TIME STARTED.
How long have you been living continuously in (NAME OF CURRENT PLACE OF RESIDENCE)?
Just before you moved here, did you live in a large city, smaU city, town/poblacion or barrio/rural area?
In what month and year were you born?
CODING CATEGORIES SKIP
qOUR . . . . . . . . . . . . . . . . . . . . . . . . . . . . . . ! ~
IlNUTES
qUMBER OF YEARS . . . . . . . . . . .
~LWAYS . . . . . . . . . . . . . . . . . . . . . . . . . . . . . . . . . . . . . 98 ~ 104
/ISITOR . . . . . . . . . . . . . . . . . . . . . . . . . . . . . . . . . . . . . . 96
LARGE CITY . . . . . . . . . . . . . . . . . . . . . . . . . . . . . . . . . . 1 SMALL CITY . . . . . . . . . . . . . . . . . . . . . . . . . . . . . . . . . . . 2 TOWN/POBLACION . . . . . . . . . . . . . . . . . . . . . . . . . . 3 BARRIO/RURAL AREA 4
IONTH
DON'T KNOW MONTH 98
I YEAR ............... I I I I I DON'T KNOW YEAR . . . . . . . . . . . . . . . . . . . . 9998
105 HOW old were you at your last birthday? AGE IN COMPLETED YEARS i i i
COMPARE AND CORRECT 104 AND/OR 105 IF INCONSISTENT.
106 Have you ever attended school? YES . . . . . . . . . . . . . . . . . . . . . . . . . . . . . . . . . . . . . . . . . . . 1
NO . . . . . . . . . . . . . . . . . . . . . . . . . . . . . . . . . . . . . . . . . . . . . 2 IJ 112
107 What is the highest grade/year you completed? NO GRADE COMPLETED . . . . . . . . . . . . . . 00
ELEMENTARY GRADE 1 . . . . . . . . . . . . . . . 11 ELEMENTARY GRADE 2 . . . . . . . . . . . . . . . 12 ELEMENTARY GRADE 3 . . . . . . . . . . . . . . . 13 ELEMENTARY GRADE 4 . . . . . . . . . . . . . . . 14 ELEMENTARY GRADE 5 . . . . . . . . . . . . . . . 15 ELEMENTARY GRADE 6 . . . . . . . . . . . . . . . 16 ELEMENTARY GRADE 7 17
HIGH SCHOOL YEAR 1 . . . . . . . . . . . . . . . . 21 HIGH SCHOOL YEAR 2 . . . . . . . . . . . . . . . . 22 HIGH SCHOOL YEAR 3 . . . . . . . . . . . . . . . . 23 HIGH SCHOOL YEAR 4 . . . . . . . . . . . . . . . . 24 HIGH SCHOOL GRADUATE 25
POSTSECONDARYYEAR 1 . . . . . . . . . . 31 POSTSECONDARY YEAR 2
OR MORE 32
COLLEGE YEAR 1 . . . . . . . . . . . . . . . . . . . . . . 41 COLLEGE YEAR 2 . . . . . . . . . . . . . . . . . . . . . . 42 COLLEGE YEAR 3 43 COLLEGE YEAR 4 ~ ~ 4 4 COLLEGE YEAR 5 .. . . . . . . . . . . . . . . . . . . . . 45 COLLEGE YEAR 6
OR HIGHER 46 COLLEGEGRADUATE . . . . . . . . . . . . . . . . . 47
POST-BACCALAUREATE 51
DON'T KNOW 98
221 3

NO.
108
109
110
I l l l
112
CHECK 105:
QUESTIONS AND FILTERS
AGE 24 ~ OR BELOW
AGE 25 OR ABOVE
Are you currently attending school?
What was the main reason you stopped attending school?
CODING CATEGORIES
I= 111
CHECK 107: ELEMENTARY - ' ~ HIGH SCHOOL
GRADE 7 ~ YEAR 1 OR OR LOWER HIGHER
YES 1
NO .2
GOT PREGNANT 01 GOT MARRIED .02 TOOK CARE YOUNGER
CHILDREN .03 FAMILY NEEDED HELP ON FARM
OR IN BUSINESS .04 COULD NOT PAY SCHOOL .05 NEEDED TO EARN MONEY .06 GRADUATED/HAD ENOUGH
SCHOOLING. .07 DID NOT PASS ENTRANCE EXAMS....08 DID NOT LIKE SCHOOL 09 SCHOOL NOT ACCESSIBLE/
TOO FAR 10
OTHER 96 (SPECIFY)
DON'T KNOW ............ 98
• ~I~ 1 II
I Can you read and understand a letter or newspaper easily, with difficulty, or not at all?
EASILY WITH DIFFICULTY NOT AT ALL
I~ 113
113 DO you usually read a newspaper or magazine at least once a week? YES NO
114 Do you usually listen to a radio everyday? YES NO
115 Do you usually watch television at least once a week? YES
NO 116 What is your religion?
117
ROMAN CATHOLIC PROTESTANT IGLESIA NI KRISTO AGLIPAY ISLAM OTHER
(SPECIFY)
..1 .2
..3 - ' ' ~ 114 .1 .2 1 .2 1 .2 1 2 3 .4
,.5 6
How do you classify yourself? Are you a Tagalog, Cebuano, IIocano, Ilonggo, Bicolano, Waray, Kapampangan, or something else?
NONE ........................................... 7
TAGALOG .1 CEBUANO .2 ILOCANO .3 ILONGGO .4 BICOLANO .5 WARAY .6 KAPAMPANGAN .7 OTHER 8
(SPECIFY)
4 222

S E C T I O N 2 . R E P R O D U C T I O N
NO.
201
202
203
204
205
206
207
208
209
QUESTIONS AND FILTERS
Now I would like to ask about all the births you have had during your life. Have you ever given birth?
Do you have any sons or daughters to whom you have given birth who are now living with you?
I How many sons live with you?
And how many daughters live with you?
I IF NONE, RECORD "O0".
Do you have any sons or daughters to whom you have given birth who are alive but do not live with you?
How many sons ere alive but do not vew h you?
And how many daughters are alive but do not live with you?
IF NONE, RECORD "00".
Have you ever given birth to a boy or gid who was born alive but later died?
IF NO, PROBE: Any baby who cried or showed signs of life but survived only a few hours or days?
How many boys have died?
And how many girls have died?
IF NONE. RECORD "00".
Some pregnancies end in non-live births before furl term or as a stillbirth. Have you had any pregnancy that did not result in a live birth?
In all, how many such pregnancies have there been?
CODING CATEGORIES
YES
NO
YES NO
SONS AT HOME
DAUGHTERS AT HOME
YES NO
SONS ELSEWHERE i
! DAUGHTERS ELSEWHERE..
YES
NO
SKIP
1
2 - - ' ~ 2 0 6
1 2 - - 4 ~ 2 0 4
1 2 - - ' - ~ 2 0 6
1
2 ~ ' 1 ~ 208
1 2 - - ~ 210
BOYS DEAD
GIRLS DEAD
YES NO
PREGNANCY LOSS I-F-1 210 SUM ANSWERS TO 203,205, 207 AND 209, AND ENTER TOTAL.
IF NONE, RECORD "00".
TOTAL PREGNANCIES I1-1 211 CHECK 210:
Just to make sure that I have this dght: you have had _ _ children who are still living (CHECK 203 AND 205) _ _ children who have died (CHECK 207) _ _ pregnancies that did not result in a live birth (CHECK 209). Is that correct?
PROBE AND CORRECT YES I NO I I ,201210AS
,, NECESSARY
212 CHECK21g: ] I - - O N E OR MORE NO PREGNANCIES PREGNANCIES ~ 2 3 6 I
223 5

,213 oneN°Wyout wouldhad.like to ask you about all of your pregnancies, whether born alive, born dead, or lost before full term, starting with the first
RECORD ALL THE PREGNANCIES. RECORD TWINS AND TRIPLETS ON SEPARATE LINES.
->14 215 ~216 217 218 r'hinkhack Wasthata lWas the baby bom alive, bom Didthat What namewas o the time single or dead, or lost before full term? Ibaby cry, Igiven to that child? )f your multiple Imove, or I first/next) pregnancy? breathe
220 In what month and yearw (NAME) born?
PROBE: What is his/her birthday?
SINGLE.... 1
MULTIPLE. 2
BORN ALIVE ...................... (SKIP TO 218}~
BORN DEAD ...................... 2
LOST BEFORE FULL TERM (NAME)
(NAME)
(NAME)
(NAME)
(NAME)
(NAME)
(NAME)
MONTH ............
YEAR
SINGLE.....1
MULTIPLE..2
BORN AL VE ...................... 1 (SKIP TO 218)~ I
BORN DEAD ...................... 2
LOST BEFORE FULL TERM (SKIP TO 2 2 5 ) ~
S NGLE.....1
iMULTIPLE. 2
BORN ALIVE 1
BORN DEAD ...................... 2
LOST BEFORE FULL TERM...3 (SKIP TO 225) 9 I
;INGLE.....1 | BORN AL VE ...................... 1
I (SKIP TO 215)~ n ~ULTIPLE..2 BORN DEAD ...................... 2
LOST BEFORE FULL TERM...3 (SKIP TO 225,~ ~ I
SINGLE 1 | BORN ALIVE 1
MULTIPLE..2 BORN DEAD ...................... 2
LOST BEFORE FULL TERM...3 (SKIP TO 22~,.
~INGLE.....1 | BORN AL VE ...................... 1
I (SKIP TO 218) 4 i /lULTIPLE..2 BORN DEAD ...................... 2
LOST BEFORE FULL TERM_..3 (SKIP TO 225)q I
SINGLE...._1
MULTIPLE..2
BORN ALIVE 1
BORN DEAD ...................... 2
LOST BEFORE FULLTERM_._3 (SKIP TO 225)~ I
MONTH ............
YEAR. r ~
M O N T H . ~
YEAR_
MONTH ............
YEAR.
MONTH ............
YEAR.
MONTH ............
~ONTH ............
YEAR. i ' ~
6 224

IF BORN ALIVE AND STILL LIVING:
How old was (NAME) at his/her last birthday?
RECORD AGEIN COMPLETED YEARS.
01
AGE iN YEARS
02
AGE IN YEARS
03
AGE IN YEARS
~q 04
AGE IN YEARS
F-~ 08
AGE IN YEARS
F-~ 06
AGE IN YEARS
F-~ 07
AGEIN YEARS
IF BORN ALIVE BUT NOW DEAD:
IF BORN DEAD OR LOST BEFORE FULL TERM:
How old was (NAME) when he/she died?
IF "1 YR.", PROBE: How many months old was (NAME)? RECORD DAYS IF LESS THAN 1 MONTH; MONTHS IF LESS THAN TWO YEARS; OTHERWISE, ENTER YEARS.
225 ',226 In what month and year did How many this pregnancy end?
227 1228 1!229 Did you or a !FROM YEAR Nere there
months did doctor or OF THIS any other the pregnancy someone PREGNANCY pregnancie last? else do SUBTRACT s between
anything to YEAR OF the RECORD IN end this PREVIOUS previous COMPLETED #regnancy? PREGNANCY. pregnancy? MONTHS. IS THE mentioned
DIFFERENCE and this 4 OR MORE ereanancy'
o.Ys ........... ,~CII~oN,. I ~ - ~ MONTHS 2 i l l YEAR
YEARS 81 I I (SKIP T6"~iEkT
PREGNANCY)
DAYS ........... 1 ~ 1
MONTHS ....... 2
YEARS ......... 3 SKIP TO 228)
MONTH
YEAR i
MONTHS YES ....... 1
NO ........ 2
MONTHS 'fEB ....... 1 IYES ........ 1
NO ........ 2 NO ......... 2
I (NEXT~
DAYS ........... ~ ~ I M O N T H ~ MONTHS 2L__L_J YEARIIIII YEARS 31 I I
SKI P 3:(~"~28-) ] ~ I
MONTHS YES ....... 1 I YES ........ 1
NO ........ 2 NO 2 I (N;;T~
....... 1
DAYS ........... 1 [~q IMONT. ~ MONTHS 21__L__ I YEARI_J__L_L__ I YEARS 31 I I
SKIP "[:(3228-) I I I
MONTHS YESNo ....... 21 I YES ........ 1 YESNo ....... 21
NO 2
(;;;XT;I
DAYS ........... ~ [:Zq IMONT. ~ MONTHS ....... 2 I - - J - - I YEAR YEARS 31 I I
8KIP T(3228-) I I I
r---"'F'--IMONTHS YES ....... 1 I YES ........ 1 YES ....... 1
, , , NO ........ 2 NO I ......... 2 NO ......... 2 I I I
(NEXT J
oA~s ........... 1 ~:l:q IMO.T. ~ MONTHS 2 I - - I - - J YEAR L -L_ I__ !__ I YEARS 31 I I
MONTHS YES ....... 1 I YES ........ 1
NO ........ 2 NO ......... 2
I (NEXTJ
....... 1
DAYS ........... I ,MONTH ,' ' MONTHS
MONTHB ....... 2LL--J YEARL2---L-U J I [--~ YEARS 31 I I (SKIP "1:(~';)28") ~ i I
1 | YES ........ 1
2 I NO ......... 2 (NEXTJ
NO ......... 2
225 7

214 215 Was that a single or multiple #regnancy?
Was the baby born alive, born dead, or lost before full term?
218 What name was
220 In what month and year v (NAME) born?
PROBE: What is his/her birthday?
10
11
12
13
14
SINGLE . I | BORN ALIVE ...................... 1
I (SKIP TO 218) 4 I V1ULTIPLE 2 BORN DEAD ...................... 2
LOST BEFORE FULL TERM... 3 (SKIP TO 225) • I
SINGLE ..I I BORN ALIVE ...................... 1
I (SKIP TO 218)~ i ~,IULTIPLE..2 BORN DEAD ...................... 2
LOST BEFORE FULL TERM (SKIP TO 225) 4 ' ~
SINGLE....1 1 BORN ALIVE ...................... 1
I (SKIP TO 218) = a MULTIPLE. 2 BORN DEAD ...................... 2
LOST BEFORE FULL TERM
I SINGLE. . 1 1 BORN ALIVE ...................... 1
I (SKIP TO 218)~ I MULTIPLE. 2 BORN DEAD ...................... 2
LOST BEFORE FULL TERM
SINGLE 11 ~ o ~ .,w(sKiP ...................... TO 218;4
MULTIPLE. 2 BORN DEAD ...................... 2
LOST BEFORE FULL TERM
SINGLE..._.ll BORN ALIVE(sKIP ...................... TO 218;4
MULTIPLE..2 BORN DEAD ...................... 2
LOST BEFORE FULL TERM
MULTIPLE .2
BORN ALfVE ...................... (SKIP TO 218)~
BORN DEAD ...................... 2
LOST BEFORE FULL TERM
(NAME)
(NAME)
(NAME)
(NAME)
(NAME)
(NAME)
(NAME)
M O N T H . ~
YEAR.
M O N T H ~
YEAR
MONTH
YEAR.
MONTH
YEAR.
~AONTH
YEAR.
~IONTH
YEAR _
~AONTH
YEAR.
8 226

I | IF BORN ALIVE BUT NOW IF BORN ALIVE AND | DEAD:
STILL LIVING: I 222 223 |224 How old Is (NAME)| How old was (NAME) when was (NAME) living with |he/she died? at his/her you? last IF "1 YR.", PROSE: How birthday? many months old was
(NAME)? RECORD DAYS IF LESS THAN 1 MONTH; MONTHS IF LESS THAN TWO YEAR~ OTHERWISE, ENTER YEARS.
RECORD AGEIN COMPLETED fEARS.
O8
YES 1 7
AGE IN '40 2"1 YEARS -
- ~ [GO TO"# 228)
O9
YES 1 q
AGE IN '40 2 -1 YEARS ""
:GO TO"# .~28)
10
YES 1 "1
AGE IN ~10.....2 -I YEARS
:GO TO"# .~28)
11
(ES 1 1
AGE IN ~lO 2 -1 YEARS .....
' ~ GO TO "# -)28)
12
(ES 1 "1
AGE IN qO ... 2 1 YEARS
' ~ GO TO '~ .~28)
13
(ES 1
AGE IN '/O 2-1 YEARS "
GO TO,I] ~28)
14
rES 1 "1
AGE IN , I O 2 -I YEARS
S ~ ] GO TO"# ~28)
DAYS .. . . . . . . . . . . 1
MONTHS ........ 2
YEARS .......... 3 (SKIP TO 228)
DAYS .. . . . . . . . . . . 1
MONTHS ........ 2
YEARS .......... 3 (SKIP TO 228)
DAYS .. . . . . . . . . . . 1
MONTHS ........ 2
YEARS .......... 3 (SKIP TO 226)
DAYS . . . . . . . . . . . 1
MONTHS ........ 2
YEARS .......... 3 (SKIP TO228)
DAYS ... . . . . . . . . . 1
MONTHS ........ 2
YEARS .. . . . . . . . 3 SKiP TO 226)
DAYS . . . . . . . . . . . 1
MONTHS .... . . 2
YEARS .......... 3 SKIP TO 228)
DAYS .. . . . . . . . . . . 1
MONTHS ........ 2
YEARS .......... 3 (SKIP TO 228)
IF BORN DEAD OR LOST BEFORE FULL TERM: I
I 225 226 227 1228 In what month and year did How many Did you or aIFROM YEAR this pregnancy end? months did the doctor or IOF THIS
MONTH . . . . . . . .
YEAR I I I I
MONTH .. . . . . . . .
Y E A R I I I I I
MONTH .. . . . . . . .
YEARI I I I I
MONTH---'T---
YEARI I I I I
MONTH I ~ ]
YEAR ........ I l l
MONTH I - ~
I AONTH F ' ~
YEAR I I I
pregnancy last?
RECORDIN COMPLETED MONTHS.
MONTHS
MONTHS
MONTHS
MONTHS
MONTHS
MONTHS
MONTHS
someone else do anything to end this pregnancy?
YES .... . . 1
NO .. . . . . . . 2
YES ... . . . 1
NO .. . . . . . . 2
YES ... . . . 1
NO .. . . . . . . 2
~ES ... . . . 1
klO ... . . . . . 2
YES .. . . . . 1
~10 2
YES .. . . . . 1
~/O .. . . . . . . 2
fES .. . . . . 1
~10 .. . . . . . . 2
PREGNANCY SUBTRACT YEAR OF PREVIOUS PREGNANCY. iS THE DIFFERENCE 4 OR MORE YEARS?
YES .. . . . . . . 1
NO . 2
PREGNANCY
YES .. . . . . . . 1
NO 2
PREGNANCY
YES .. . . . . . . 1
NO 2
PREGNANCY
YES .. . . . . . . 1
NO .. . . . . . . . 2
(NEXT4 I PREGNANCY
YES .. . . . . . . 1
NO .. . . . . . . . 2
(NEXTJ PREGNANCY
YES .... . . . . t
NO .. . . . . . . . 2
(NEXT~ PREGNANCY
YES .. . . . . . . 1
NO .. . . . . . . . 2
(NEXTJ PREGNANCY
229 Were there any other pregnancies between the previous pregnancy mentioned and this )regnancy?
YES ........ 1
NO ... . . . . . . 2
YES ........ 1
NO ... . . . . . . 2
YES ........ 1
NO ... . . . . . . 2
YES ........ 1
~10 ... . . . . . . 2
YES ........ t
klO ......... 2
YES ........ 1
'40 . . . . . . . . 2
(ES ........ 1
qO ... . . . . . . 2
227 9

FROM YEAR OF INTERVIEW (1998), SUBTRACT YEAR OF LAST PREGNANCY IS THE DIFFERENCE 4 YEARS OR MORE?
YES.. . . .1
231 Have you had any pregnancies since (YEAR OF LAST PREGNANCY)?
IF "YES", PROBE AND CORRECT 203 TO 229.
COMPARE 210 WITH NUMBER OF PREGNANCIES IN HISTORY ABOVE AND MARK
ARE SAME DIFFERENT I= PROBE AND RECONCILE
CHECK:
YES.. . . .1 NO ........ 2
FOR EACH PREGNANCY: YEAR IS RECORDED IN 220 OR 225 . . . . . . . . . . . . . . . . . . . . .
FOR EACH LIVING CHILD: CURRENT AGE IS RECORDED IN 222 . . . . . . . . . . . . . . . . . . .
236
237
238
239
FOR EACH DEAD CHILD: AGE AT DEATH IS RECORDED IN 224 . . . . . . . . . . . . . . . . . . . .
FOR EACH PREGNANCY LOSS: DURATION IS RECORDED IN 226 . . . . .
FOR AGE AT DEATH 12 MONTHS OR 1 YR.: PROBE TO DETERMINE EXACT
NUMBER OF MONTHS IN 224 . . . . . . . . . . . . . . . . . . . . . . . . . . . . . . . . . . . . . . . . . . . . . .
CHECK 220 AND ENTER THE NUMBER OF BIRTHS SINCE JANUARY 1993. IF NONE, RECORD "0". rl CHECK 233: [ ~ [ ~
BIRTHS = 0? YES NO
(SKIP TO 235) "~"
CHECK 220: FOR EACH BIRTH SINCE JANUARY 1993 ENTER "B" IN THE MONTH OF BIRTH IN COLUMN 1 OF THE CALENDAR AND "P" IN EACH OF THE 8 PRECEDING MONTHS. WRITE NAME TO THE LEFT OF THE "B" CODE,
CHECK 225 AND 226: FOR EACH NON-LIVE BIRTH SINCE 1993, ENTER "T" IN THE MONTH OF PREGNANCY TERMINATION IN COLUMN
OF THE CALENDAR AND "P" IN EACH PRECEDING MONTH OF PREGNANCY.
Are you pregnant? YES . . . . . . . . . . . . . . . . . . . . . . . . . . . . . . . . . . . . . . . . . . . . . . . . . . 1 NO . . . . . . . . . . . . . . . . . . . . . . . . . . . . . . . . . . . . . . . . . . . . . . . . . . . 2 - - UNSURE . . . . . . . . . . . . . . . . . . . . . . . . . . . . . . . . . . . . . . . . . . . . 8
How many months pregnant are you?
RECORD NUMBER OF COMPLETED MONTHS. ENTER "Ps" IN COLUMN 1 OF CALENDAR, BEGINNING WITH THE MONTH OF INTERVIEW AND FOR EACH COMPLETED MONTH OF PREGNANCY.
At the time you became pregnant, did you want to become pregnant then, did you want to wait until late_._.Er, or did you not want to become pregnant at all?
When did your last menstrual period start?
MONTHS . . . . . . . . . . . . . . . . . . . . . . . . . . . . .
THEN . . . . . . . . . . . . . . . . . . . . . . . . . . . . . . . . . . . . . . . . . . . . . . . . 1 LATER . . . . . . . . . . . . . . . . . . . . . . . . . . . . . . . . . . . . . . . . . . . . . . 2 NOT AT ALL . . . . . . . . . . . . . . . . . . . . . . . . . . . . . . . . . . . . . . . 3
DAYS AGO . . . . . . . . . . . . . . . . . . . . . . . . . 1
WEEKS AGO . . . . . . . . . . . . . . . . . . . . . . 2
MONTHS AGO . . . . . . . . . . . . . . . . . . . . 3
YEARS AGO . . . . . . . . . . . . . . . . . . . . . . . 4
IN MENOPAUSE . . . . . . . . . . . . . . . . . . . . . . . . . . . . . . . 994 BEFORE LAST BIRTH . . . . . . . . . . . . . . . . . . . . . . . . 995 NEVER MENSTRUATED . . . . . . . . . . . . . . . . . . . . . 996
] ) 239
(DATE, IF GIVEN)
240 Are there certain days during the woman's menstrual cycle when YES . . . . . . . . . . . . . . . . . . . . . . . . . . . . . . . . . . . . . . . . . . . . . . . . . . 1 she has a greater chance of becoming pregnant than other days? NO . . . . . . . . . . . . . . . . . . . . . . . . . . . . . . . . . . . . . . . . . . . . . . . . . . . 2 - 1 .
DON'T KNOW . . . . . . . . . . . . . . . . . . . . . . . . . . . . . . . . . . . . . 8 - 301 241 During which days of the monthly cycle does a woman have the
reatest chance of becoming pregnant? DURING HER PERIOD . . . . . . . . . . . . . . . . . . . . . . . . . . 1 RIGHT AFTER HER PERIOD HAS
ENDED . . . . . . . . . . . . . . . . . . . . . . . . . . . . . . . . . . . . . . . . . . 2 IN THE MIDDLE OF THE CYCLE . . . . . . . . . . . . . . 3 JUST BEFORE HER PERIOD BEGINS ....... 4 OTHER 6
(SPECIFY) DON'T KNOW . . . . . . . . . . . . . . . . . . . . . . . . . . . . . . . . . . . . . 8
10 228

S E C T I O N 3. C O N T R A C E P T I O N
NOW I would like to talk about family planning - the various ways or methods that a couple can use to delay or avoid a pregnancy.
31RCLE CODE "1" IN 301 FOR EACH METHOD MENTIONED SPONTANEOUSLY. tHEN PROCEED DOWN COLUMN 302, READING THE NAME AND DESCRIPTION OF EACH METHOD NOT MENTIONED SPONTANEOUSLY. CIRCLE CODE "2" IF METHOD iS RECOGNFZED, AND CODE "3" IF NOT RECOGNIZED. tHEN, FOR EACH METHOD WITH CODE "1" OR "2" CIRCLED IN 301 OR 302, ASK 303 AND 304.
301 Nhich ways or methods have you heard about?
01
02
302 Have you 303 Have you ever heard of ever used (METHOD)? (METHOD)?
SPONTANEOUS PROBED YES YES NO
=ILL Women can take a pill every ~'ES
Jay. 1 2 3--1
MO
IUD Women can have a loop or coil placed inside them by a doctor or a nurse.
1 2
304 Do you know where a person could go to get(METHOD)?
1 YES, SAME BARANGAY 1
YES, ANOTHER BARANGAY 2
2 NO 3
IYES 1 YES, SAME BARANGAY 1
3-- I YES, ANOTHER BARANGAY 2
NO 2 NO 3
03 INJECTIONS Women can have an injection by a doctor or nurse which stops them from becoming pregnant for several months.
1 2
YES 1 YES, SAME BARANGAY 1
3-- I YES, ANOTHER BARANGAY. 2
NO 2 NO 3
04 CONDOM Men can put a rubber sheath on their penis during sexual intercourse.
1 2
YES 1 YES, SAME BARANGAY 1
3 . - I YES, ANOTHER BARANGAY 2
NO 2 NO 3
05 LIGATION/FEMALE STERILIZATION Women can have an operation to avoid having any more children.
1 2 3 3 Have you ever YES, SAME BARANGAY 1 had an operation to avoid having any more YES, ANOTHER BARANGAY 2 children?
YES 1 NO 3
NO 2
06 VASECTOMY/MALE STERILIZATION Men can have an operation to avoid having any more children.
1 2
Have you ever YES, SAME BARANGAY 1 had a partner who had an operation to YES, ANOTHER BARANGAY 2 avoid having any more children? NO 3
YES 1
NO 2
~7 CALENDAR, RHYTHM, PERIODIC ABSTINENCE Every month that women are sexually active they can avoid having sexual intercourse on the days of the month they are most likely to get pregnant.
1 2
YES
3"-~ NO
1 Do you know where a person can obtain advice on how to use this method?
2 .YES, SAME BARANGAY . . . . . . . . . . . . . . 1 _
YES, ANOTHER BARANGAY 2
NO 3
08 MUCUS, BILLINGS, OVULATION Women can monitor cervical mucus to determine the days of the month they are most likely to get pregnant.
1 2
YES
3 '7 ' NO
1
2
Do you know where a person can obtain advice on how to use this method?
.YES, SAME BARANGAy . . . . . . . . . . . . . 1 .
YES, ANOTHER BARANGAY 2
.NO . . . . . . . . . . . . . . . . . . . . . . . . . . . . . . . . . . . . . . . . . 3 _
11 229

CIRCLE CODE 1 IN 301 FOR EACH METHOD MENTIONED SPONTANEOUSLY. THEN PROCEED DOWN COLUMN 302, READING THE NAME AND DESCRIPTION OF EACH METHOD NOT MENTIONED SPONTANEOUSLY. CIRCLE CODE 2 IF METHOD IS RECOGNIZED, AND CODE 3 IF NOT RECOGNIZED. THEN. FOR EACH METHOD WITH CODE 1 OR 2 CIRCLED IN 301 OR 302, ASK 303 AND 304.
NO I
306
Which ways or methods have you heard about?
BASAL BODY TEMPERATURE Women can monitor the body temperature to determine the days of the month they are most likely to get pregnant. SYMPTOTHERMAL Women can monitor both cervical mucus and basal body temperature to deter- mine the days of the month they are most likely to get pregnant.
LACTATIONAL AMENORRHEA METHOD (LAM) Method used by women with less than 6 month old baby, whose period has not returned and are breasffeeding the baby day and night without supplementation to avoid pregnancy. BREASTFEEDING Women bmasffeedthe childto avofd pregnancy.
302 Have you 303 Have you 304 Do you know where a person ever heard of ever used can obtain advice on how to (METHOD)? (METHOD)? use this method?
SPONTANEOUS PROBED YES YES NO
1 2
1 2
1 2
1 2
WITHDRAWAL Men can be careful and pull out before climax 1 2
Have you heard of any other ways or methods that women or men can use to avoid pregnancy?
1 2
(SPECIFY)
(SPECIFY)
QUESTIONS AND FILTERS
~'ES 1 YES, SAME BARANGAY 1 3 7 YES, ANOTHER BARANGAY 2
YO 2 NO 3
YES 1 YES, SAME BARANGAY 1
3 ' 7 YES, ANOTHER BARANGAY 2 I ' NO 2 NO 3
YES 1 YES, SAME BARANGAY 1 3
NO 2 YES, ANOTHER BARANGAY 2
NO 3
YES 1
3 3 . o l i ......... 2
YES 1 3 ........... ~
CODING CATEGORIES I SKIP
NOT A SINGLE ,,YES,, I I AT LEAST ONE YESIl (NEVER USED) ~, (EVER USED)
Have you ever used anything or tried in any way to delay or avoid getting pregnant?
YES . . . . . . . . . . . . . . . . . . . . . . . . . . . . . . . . . . . . . . . . . . . . . m
NO .............................................. 2 308
308
ENTER "0" IN COLUMN 1 OF CALENDAR IN EACH BLANK MONTH.
What have you used or done?
CORRECT 303 TO 305 (AND 302 IF NECESSARY).
12 230

NO.
309
310
311
QUESTIONS AND FILTERS
Now I would like to ask you about the first time that you did something or used a method to avoid getting pregnant.
What was the first method you ever used?
IF WOMAN MENTIONS LAM, PROBE IF AT THE TIME SHE WAS USING LAM SHE HAD A BABY LESS THAN 6 MONTHS OLD, HER PERIOD DID NOT RETURN THEN, AND SHE WAS BREASTFEEDING THE BABY DAY AND NIGHT WITHOUT SUPPLEMENTATION TO AVOID PREGNANCY. IF THE RESPONDENT DOES NOT QUALIFY FOR LAM, ENCIRCLE CODE "12"- BREASTFEEDING.
How many living children did you have at that time, if any?
IF NONE, RECORD "00".
In what month and year did you fimt start using a method of family planning?
CODING CATEGORIES
PILL . . . . . . . . . . . . . . . . . . . . . . . . . . . . . . . . . . . . . . . . . . . 01 IUD . . . . . . . . . . . . . . . . . . . . . . . . . . . . . . . . . . . . . . . . . . . . 02 INJECTIONS . . . . . . . . . . . . . . . . . . . . . . . . . . . . . . . . 03 CONDOM . . . . . . . . . . . . . . . . . . . . . . . . . . . . . . . . . . . . 04 FEMALE STERILIZATION 05 MALE STER[LIZATION..._IIIIIIIIIIIIIIII06 CALENDAR, RHYTHM, PERIODIC
ABSTINENCE . . . . . . . . . . . . . . . . . . . . . . . 97 MUCUS, BILLINGS, OVULATION .. . . . . . 08 BASAL BODY TEMPERATURE . . . . . . . . . 09 SYMPTOTHERMAL 19 LACTATIONAL AMI=~IORRHEA . . . . . . . . .
METHOD (LAM) . . . . . . . . . . . . . . . . . . . . 11 BREASTFEEDING . . . . . . . . . . . . . . . . . . . . . . . . . 12 WITHDRAWAL . . . . . . . . . . . . . . . . . . . . . . . . . . . . . . 13 OTHER 96
(SPECIFY)
NUMBER OF CHILDREN I-T-1 MONTH . . . . . . . . . . . . . . . . . . . . . . . . . . .
DON'T KNOW . . . . . . . . . . . . . . . . . . . . . . . . . . . . . . . 98
Y E A R . . . . . . . . . . . . . . . . . . I I I I I DON'T KNOW 9998
SKiP
"~313
3t2
313
314
315
316
316A
HOW old were you when you first started using a method of family planning? AGE I-T-] CHECK 303:
I "O 'N I-- ] STERILIZED STERILIZED
CHECK 236:
NOT PREGNANToR UNSURE I PREGNANT I ~
Are you currently doing something or using any method to delay or avoid getting pregnant?
Which method are you currently using?
• CIRCLE ONLY ONE CODE. • IF FEMALE STERILIZATION IS USED IN COMBINATION WITH
ANY OTHER METHOD, CIRCLE "05" FOR FEMALE STERILIZATION.
• IF USING ANY METHOD WHICH REQUIRES SUPPLY/SERVICE ("01" TO "06") AND ANY METHOD WHICH DOES NOT REQUIRE SUPPL)(/SERV]CE ("07" TO "13" AND "96"), CIRCLE THE CODE FOR THE METHOD WHICH REQUIRE SUPPLY/ SERVICE ("01" TO "06").
• IF WOMEN IS STERILIZED/USING IUD AND HUSBAND/ PARTNER HAD STERILIZATION, CIRCLE THE CODE FOR THE CURRENT METHOD USED BY THE WOMAN.
• IF THE ABOVE CONDITIONS ARE NOT SATISFIED, CIRCLE THE CODE FOR THE METHOD USED OFTEN.
CIRCLE "05" FOR FEMALE STERILIZATION.
YES . . . . . . . . . . . . . . . . . . . . . . . . . . . . . . . . . . . . . . . . . . . . . 1
NO 2 - -
PILL . . . . . . . . . . . . . . . . . . . . . . . . . . . . . . . . . . . . . . . . . . . 01 UD 02 " 7
INJECT[(SNS . . . . . . . . . . . . . . . . . . . . . . . . . . . . . . . . 03 --i-- CONDOM....III:IIIIIIIIIIIII IIIIIIIIO4 FEMALE STERILIZATION 05 - - I MALE " - " CALENDAR, RHYTHM, PERIODIC
ABSTINENCE 07 -'] MUCUS, BILLINGSI'(')~}0"~:I:i(:~I~ ....... 08 _.~ BASAL BODY TEMPERATURE .. . . . . . 09 / S Y M P T O T H E R M A L . . . . . . . . . . . . . . . iiiii 10 - - " LACTATIONAL AMENORRHEA
METHOD (LAM) . . . . . . . . . . . . . . . . . . . . 11 BREASTFEEDING 12 _J WITHDRAWAL . . . . . . . . . . . . . . . . . . . . . . . . . :13 /
OTHER 96 (SPECIFY)
316A
331
• 3 3 1
• 323
~ 3 2 5
~" 330
231 13

NO.
317
QUESTIONS AND FILTERS
At the time you first started using the pill, did you consult a doctor, nurse or midwife?
318 At the time you last got the pill, did you consult a doctor, nurse or midwife?
319
320
321
322
323
May I see the package of pills you are now using?
RECORD NAME OF BRAND IF PACKAGE IS SEEN.
What is the brand name of the pills you are using now? RECORD NAME OF BRAND.
324
How much (in cash) does one packet (cycle) of pills cost you?
How much would you be willing to pay for the packet of pills?
P 10?
P 25?
P 50?
P 75?
P 100?
P 150? P 200?
P 300? More than P 300?
IF YES, CONTINUE WITH THE
NEXT AMOUNT.
IF "NO", SKIP TO 330.
On your last visit, how much (in cash) did you actuany pay for (METHOD in 316)?
PROBE FOR COST PER IUD DEVICE PLUS INSERTION, PER INJECTION, PER PACKET OF CONDOM, AS APPROPRIATE.
How much would you be willing to pay for (METHOD in 316), (including all costs):
F "YES", CONTINUE WITH THE
'qEXT AMOUNT.
F "NO", SKIP TO 330.
P 10?
P 20? P 30?
P 50? P 100?
P 250?
P 500? P 750?
P 1000?
More than P 1000? - -
CODING CATEGORIES
YES . . . . . . . . . . . . . . . . . . . . . . . . . . . . . . . . . . . . . . . . . . . . . 1
NO . . . . . . . . . . . . . . . . . . . . . . . . . . . . . . . . . . . . . . . . . . . . . . 2
YES . . . . . . . . . . . . . . . . . . . . . . . . . . . . . . . . . . . . . . . . . . . . . 1
N O . . . . . . . . . . . . . . . . . . . . . . . . . . . . . . . . . . . . . . . . . . . . . . 2
PACKAGE SEEN . . . . . . . . . . . . . . . . . . . . . . . . . . . . . 1 " ~
BRAND NAME
PACKAGE NOT SEEN . . . . . . . . . . . . . . . . . . . . . . 2
BRAND NAME [ ~
DON'T KNOW . . . . . . . . . . . . . . . . . . . . . . . . . . . . . . . . 98 l
PESO ~ I . . . . . . . . . . . . . . . . . . . . . . . ! i
FREE . . . . . . . . . . . . . . . . . . . . . . . . . . . . . . . . . . . . . . . . 996
DON'T KNOW . . . . . . . . . . . . . . . . . . . . . . . . . . . . . 998
YES NO
P 10 . . . . . . . . . . . . . . . . . . . . . . . . . . . . . 1 2 - -
P 25 . . . . . . . . . . . . . . . . . . . . . . . . . . . . . . 1 2 - -
P 50 . . . . . . . . . . . . . . . . . . . . . . . . . . . . . . 1 2
P 75 . . . . . . . . . . . . . . . . . . . . . . . . . . . . . . 1 2 - -
P 100 . . . . . . . . . . . . . . . . . . . . . . . . . . . . . . 1 2 - -
P 150 . . . . . . . . . . . . . . . . . . . . . . . . . . . . . . 1 2 - - P 200 . . . . . . . . . . . . . . . . . . . . . . . . . . . . . . 1 2 - -
P 300 . . . . . . . . . . . . . . . . . . . . . . . . . . . . . . 1 2 ~
More than P 300 . . . . . . . . . . . . . . . . 1...- I 2 r -
325 Do you regret that you (your husband/partner) had the operation not to have any (more) children?
326 Why do you regret the operation?
PESO . . . . . . . . . . . . . . . . . . . . . . . .
F R E E . . . . . . . . . . . . . . . . . . . . . . . . . . . . . . . . . . . . . . . . 9 9 6
D O N ' T K N O W . . . . . . . . . . . . . . . . . . . . . . . . . . . . . 9 9 6
YES NO P 10? . . . . . . . . . . . . . . . . . . . . . . . . . . . . . 1 2 - -
P 20? . . . . . . . . . . . . . . . . . . . . . . . . . . . . . 1 2 - -
P 30? . . . . . . . . . . . . . . . . . . . . . . . . . . . . . 1 2 - - P 50? . . . . . . . . . . . . . . . . . . . . . . . . . . . . . 1 2 - -
P 100? . . . . . . . . . . . . . . . . . . . . . . . . . . . . 1 2 - -
P 250? . . . . . . . . . . . . . . . . . . . . . . . . . . . . 1 2 - -
P 500? . . . . . . . . . . . . . . . . . . . . . . . . . . . . 1 2 - -
P 750? . . . . . . . . . . . . . . . . . . . . . . . . . . . . 1 2 ~ " P 1000? . . . . . . . . . . . . . . . . . . . . . . . . . . . 1 2 - -
More than P 10007 . . . . . . . . . . . . . . 1 "-= 2 r " -
YES . . . . . . . . . . . . . . . . . . . . . . . . . . . . . . . . . . . . . . . . . . . . 1
N O . . . . . . . . . . . . . . . . . . . . . . . . . . . . . . . . . . . . . . . . . . . . . . 2
RESPONDENT WANTS
ANOTHER CHILD . . . . . . . . . . . . . . . . . . 1
HUSBAND/PARTNER WANTS
ANOTHER CHILD . . . . . . . . . . . . . . . . . . . 2
SIDE EFFECTS . . . . . . . . . . . . . . . . . . . . . . . . . . . . . . 3
CHILD DIED . . . . . . . . . . . . . . . . . . . . . . . . . . . . . . . . . . . 4
OTHER 6
(SPECIFY)
SKIP
321
~- 3 3 0
• 3 3 0
~" 327
14 232

NO. 1
327
328
I 330
I
331
QUESTIONS AND FILTERS
In what month and year was the sterilization performed?
CODING CATEGORIES
MONTH . . . . . . . . . . . . . . . . . . . . . . . . . . .
YEAR .................. l l t l l
SKIP 1
How much (in cash) did the sterilization operation cost you? PESO .. . . . . . . . .
FREE . . . . . . . . . . . . . . . . . . . . . . . . . . . . . . . . . . . . . . 99996
DON'T KNOV¢ . . . . . . . . . . . . . . . . . . . . . . . . . . 99998
CHECK 327: STERILIZED BEFORE ~ ] STERILIZED IN/ ~ ] JANUARY 1993 AFTER JAN. 1993
ENTER CODE FOR STERILIZATION IN MONTH ENTER CODE FOR STERILIZATION IN OF INTERVIEW IN COLUMN 1 OF THE MONTH OF INTERVIEW IN COLUMN 1 OF CALENDAR AND EACH MONTH BACK TO THE CALENDAR AND IN EACH MONTH JANUARY 1993. BACK TO THE DATE OF THE OPERATION
THEN SKIP TO ID 332 THEN SKIP TO ' Ii 331
ENTER METHOD CODE FROM 316 IN CURRENT MONTH IN COLUMN 1 OF CALENDAR. THEN DETERMINE WHEN SHE STARTED USING METHOD THIS TIME. ENTER METHOD CODE IN EACH MONTH OF USE. ILLUSTRATIVE QUESTIONS:
• When did you start using this method continuously? • How long have you been using this method continuously?
I would like to ask you some questions about the times you or your partner may have used a method to avoid getting pregnant during the last few years.
USE CALENDAR TO PROBE FOR EARLIER PERIODS OF USE AND NON-USE, STARTING WITH MOST RECENT USE, BACK TO JANUARY 1993.
USE NAMES OF CHILDREN, DATES OF BIRTH, AND PERIODS OF PREGNANCY AS REFERENCE POINTS.
IN COLUMN 1, ENTER CODE IN EACH MONTH OF METHOD USE OR "0" FOR NON-USE. ILLUSTRATIVE QUESTIONS:
COLUMN 1: • When was the last time you used a method? Which method was that? • When did you start using that method? How long after the birth of (NAME)? • How long did you use the method then?
IN COLUMN 2, ENTER CODES FOR REASON FOR DISCONTINUATION IN THE LAST MONTH THE METHOD WAS USED. NUMBER OF CODES IN COLUMN 2 MUST BE THE SAME AS THE NUMBER OF INTERRUPTIONS OF METHOD USE IN COLUMN 1.
ASK WHY SHE STOPPED USING THE METHOD. IF A PREGNANCY FOLLOWED, ASK WHETHER SHE BECAME PREGNANT UNINTENTIONALLY WHILE USING THE METHOD OR DELIBERATELY STOPPED TO GET PREGNANT.
ILLUSTRATIVE QUESTIONS:
COLUMN 2: • Why did you stop using the (METHOD)? • Did you become pregnant while using (METHOD), or did you stop to get pregnant, or did you stop for
some other reason?
IF DELIBERATELY STOPPED TO BECOME PREGNANT, ASK:
• How many months did it take you to get pregnant after you stopped using (METHOD)? AND ENTER "0" IN EACH SUCH MONTH IN COLUMN 1.
233 15

NO.
332
333
334
335
336
337
QUESTIONS AND FILTERS
CHECK 316:
CIRCLE METHOD CODE:
Where did you obtain~learn about (METHOD) the East time?
IF SOURCE IS HOSPITAL, HEALTH CENTER, OR CLINIC, WRITE THE NAME OF THE PLACE. PROBE TO IDENTIFY THE TYPE OF SOURCE AND CIRCLE THE APPROPRIATE CODE.
(NAME OF PLACE)
How long did it take to travel from your home to (NAME OF SOURCE)?
IF LESS THAN 2 HOURS, RECORD IN MINUTES• ELSE. RECORD IN HOURS,
Is it easy or difficult to get to (NAME OF SOURCE)?
CODING CATEGORIES
N O E N T R Y
PILL IUD INJECTIONS CONDOM
: FEMALE STERILIZATION MALE STERILIZATION CALENDAR, RHYTHM, PERIODIC ABSTINENCE MUCUS, BILLtNGS, OVULATION BASAL BODY TEMPERATURE• SYMPTOTHERMAL LACTATIONAL AMENORRHEA
METHOD (LAM) ........... BREASTFEEDING WITHDRAWAL OTHER METHOD
PUBLIC SECTOR GOVERNMENT HOSPITAL 11 RURAL/URBAN HEALTH
CENTER I2 BARANGAY HEALTH STATION.....13 BARANGAY SUPPLY/SERVICE
POINT OFFICER/BHW 14 OTHER PUBLIC 16
(SPECIFY) PRIVATE MEDICAL SECTOR
PRIVATE HOSPITAL/CLINIC 21 PRIVATE DOCTOR 22 PRIVATE NURSE/MIDWIFE 23 PHARMACY 24 STORE 25 NGO 27 INDUSTRY-BASED CLINIC.. 28 OTHER PRIVATE
MEDICAL 26 (SPECIFY)
OTHER SOURCE PUERICULTURE CENTER. 31 CHURCH 32 FRIEND/RELATIVE 33 OTHER 36
(SPECIFY) DON'T KNOW 98
SKIP
0 0 - - "~ 344
01 02
03 04 05 06
07 - - • 346
98
09 10
11
13 96
MINUTES 1
HOURS 2 O .DON'T KNOW ............................ 9998 .
EASY 1 DIFFICULT 2
• DON'T KNOW ................................. 8 .
• 346
2 8 - - • 338 A B C D
Were you satisfied with the service at (NAME OF SOURCE)? , YES ............................................. 1 , I= 338 NO DON'T KNOW
What is the reason you were not satisfied with the service at (NAME OF SOURCE)?
COST TOO MUCH NOT EASILY ACCESSIBLE TIME OPEN NOT CONVENIENT DAYS OPEN NOT CONVENIENT STAFF NOT PLEASANT/FRIENDLY.....E METHOD NOTAVAILABLE F SERVICE TAKES TOO MUCH TIME....G OTHER X
(SPECIFY)
PROBE: Any other reason?
CIRCLE ALL RESPONSES•
16 234

NO.
338
QUESTIONS AND FILTERS
Who referred you to (NAME OF SOURCE)?
CODING CATEGORIES
PUBLIC SECTOR BARANGAY SERVICE POINT
OFFICER 11 BARANGAY HEALTH WORKER 12 BARANGAY NUTRITION SCHOLAR.13 OTHER PUBLIC 16
(SPECIFY) PRIVATE MEDICAL SECTOR
COMMUNITY HEALTH WORKER....21 VOLUNTARY HEALTH WORKER....22 NGO CLINIC OUTREACH WORKER23 OTHER PRIVATE
MEDICAL 26 (SPECIFY)
OTHER SOURCE FRIEND/RELATIVE 31 OTHER 36
(SPECIFY) NO ONE 41 DON'T KNOW 98
SKIP
339 Are you having any problem with using (NAME OF METHOD)? YES 1
NO 2 - - .11- 341
340 What is your main problem with using (NAME OF METHOD)?
341
342
HUSBAND DISAPPROVES 1
SIDE EFFECTS 2
HEALTH CONCERNS 3
DIFFICULT TO OBTAIN 4
COSTS TOO MUCH 5
INCONVENIENT TO USE 7
OTHER 6
(SPECIFY)
CHECK 316:
FEMALE/MALE STERILIZATION I I ~"342A
OTHERMETHODS I I ~342
YES 1 - - • 343
NO 2 - - • 348
Do you know another place where you could have obta[ned/leamed about (METHOD) the last time?
At the time of the sterilization operation, did you know another place where you could have received the operation?
YES 1
NO 2 - -
342A
• 348
235 17

NO.
343
QUESTIONS AND FILTERS
People select the place where they get family planning services for various reasons.
What was the main reason you went to (NAME OF PLACE IN 333) instead of some other place you know about?
RECORD RESPONSE AND CIRCLE CODE.
CODING CATEGORIES I
ACCESS-RELATED REASONS
CLOSER TO HOME .... . . . . . . . . . . . . . . . . 11 -
CLOSER TO MARKETANORK ....... 12 -
AVAILABILITY OF TRANSPORT....13 -
SERVICE-RELATED REASONS
STAFF MORE COMPETENT/
FRIENDLY ... . . . . . . . . . . . . . . . . . . . . . . 21 -
CLEANER FACILITY ... . . . . . . . . . . . . . . . . 22 -
OFFERS MORE PRIVACY ............ 23 - - -.b.
SHORTER WAITING TIME ............ 24 -
LONGER HOURS OF SERVICE 25 -
USE OTHER SERVICES AT THE FACILITY ..... . . . . . . . . . . . . . . . . . . . . . . . . 26 -
LOWER COST/CHEAPER ................ 31 --
WANTED ANONYMITY .................... 41 --
OTHER 96 --
(SPECIFY)
DON'T KNOW
SKIP
-1~348
98 - -
344
345
346
CHECK 236: NOT PREGNANT OR UNSURE I I PREGNANT I
What is the main reason you are not using a method of contraception to avoid pregnancy?
RECORD RESPONSE AND CIRCLE CODE.
Do you know of a place where you can obtain a method of family planning?
NOT MARRIED 11
FERTILITY-RELATED REASONS NOT HAVING SEX ........................ 21 INFREQUENT SEX/
HUSBAND AWAY .................... 22 MENOPAUSAL/HYSTERECTOMY... 23 SUBFECUND/INFECUND ............... 24 POSTPARTUM/BREASTFEEDING._. 25 WANTS (MORE) CHILDREN ........... 26 MIGHT BE PREGNANT 27
OPPOSITION TO USE RESPONDENT OPPOSED ............. 31 HUSBAND OPPOSED ................... 32 OTHERS OPPOSED ..... . . . . . . . . . . . . . . . . 33 RELIGIOUS PROHIBITION ............. 34 FATALISTIC 35
LACK OF KNOWLEDGE KNOWS NO METHOD KNOWS NO SOURCE
METHOD-RELATED REASONS HEALTH CONCERNS ............ FEAR OFSIDE EFFECTS ...... LACK OF ACCESS~OO FAR. COST TOO MUCH ................ INCONVENIENTTOUSE ....... iNTERFERES WITH BODY'S
NATURALPROCESSES
OTHER (SPECIFY)
346
.41
.42 - - ~ 348
.51 52 53 .54 .55
.56
96
DON'T KNOW .... . . . . . . . . . . . . . . . . . . . . . . . . . . . 98
YES ... . . . . . . . . . . . . . . . . . . . . . . . . . . . . . . . . . . . . . . . . . . 1
NO ... . . . . . . . . . . . . . . . . . . . . . . . . . . . . . . . . . . . . . . . . . . . 2 - - .-1~348
I8 236

NO.
347 Where is that?
QUESTIONS AND FILTERS
PROBE: Anywhere else?
RECORD ALL MENTIONED.
CODING CATEGORIES
PUBLIC SECTOR GOVERNMENT HOSPITAL A RURAL/URBAN HEALTH
CENTER B BARANGAY HEALTH STATION C BARANGAY SUPPLY/SERVICE
POINT OFFICER/BHW D OTHER PUBLIC E
(SPECIFY)
PRIVATE MEDICAL SECTOR PRIVATE HOSPITAL/CLINIC F PRIVATE DOCTOR G PRIVATE NURSE/MIDWIFE H PHARMACY I STORE J NGO K INDUSTRY-BASED CLINIC L OTHER PRIVATE
MEDICAL M (SPECIFY)
OTHER SOURCE PUERICULTURE CENTER N CHURCH O FRIEND/RELATIVE P OTHER X
(SPECIFY) DON'T KNOW
SKIP
Z
348 Were you visited by a family planning program worker in the last 12 YES 1 months? NO 2
349 Have you visited a health facility for any reason in the last 12 months? YES I
NO 2 - -i~ 351
350 Did any staff member at the health facility speak to you about family YES 1 planning methods? NO 2
351' Have you had a pap smear within the past 5 years? YES 1
NO 2
DON'T KNOW PAP SMEAR 8
352 Have you examined your breast for any sign of a mass within the last YES 1 month? NO 2
REMARKS:
237 19

SECTION 4A. PREGNANCY AND BREASTFEEDING
401
402
403
404
405
406
407
408
409
410
411
CHECK 233: SKIP
BIRTHS SINCE BIRTHS SINCE • 479 JAN. 1993 JAN. 1993
ENTER THE NAME, LINE NUMBER, AND SURVIVAL STATUS OF EACH BIRTH SINCE JANUARY 1993 IN THE TABLE. ASK THE QUESTIONS ABOUT ALL OF THESE BIRTHS. BEGIN WITH THE LAST BIRTH. (IF THERE ARE MORE THAN 2 BIRTHS, USE ADDITIONAL QUESTIONNAIRE).
Now I would like to ask you some questions about the health of all your children born in the last five years. (We will talk about one child at a time.)
LINE NUMBER FROM 214
LAST BIRTH NEXT-TO-LAST BIRTH
LINE NUMBER ~ - - ] LINE NUMBER F - -
FROM 218 NAME NAME
__] At the time you became pregnant with (NAME), did you want to become pregnant then, did you want to wait until rater, or did you want no (no more) children at air?
How much longer would you like to have waited?
When you were pregnant with (NAME), did you see anyone for prenatal care for this pregnancy?
IF YES: Whom did you see? Anyone else?
PROBE FOR THE TYPE OF PERSON AND RECORD ALL PERSONS SEEN.
Whom did you see first for prenatal care?
How many months pregnant were you when you first received prenatal care?
How many times did you receive prenatal care during this pregnancy?
During any of your prenatal visits, were you informed about symptoms or conditions which may occur during pregnancy that may be dangerous to you or to your baby?
THEN t (SKIP TO 4 0 7 ~ n
LATER 2
NO/NO MORE 3 (SKIP TO 407', ~ n
THEN 1 (SKIP TO 407~ I
LATER 2
NO/NO MORE 3 (SKIP TO 407) • I
MONTHS. 1
YEARS 2 i
.DON'T KNOW ..... . . . . . . . . . . . . . . . . . . . . . . . 998 ,DON'T KNOW ... . . . . . . . . . . . . . . . . . . . . . . . . . 998 .
HEALTH PROFESSIONAL DOCTOR A NURSE B MIDWIFE C
HILOT D OTHER X
(SPECIFY) NO ONE Y
(SKIP TO 413) 4 I
HEALTH PROFESSIONAL DOCTOR 1 NURSE 2 MIDWIFE 3
HILOT 4 OTHER 6
MONTHS 1
YEARS 2
HEALTH PROFESSIONAL DOCTOR A NURSE B MIDWIFE C
HILOT D OTHER X
(SPECIFY) NO ONE Y
(SKIP TO 413) 4 I
HEALTH PROFESSIONAL DOCTOR 1 NURSE 2 MIDWIFE 3
HILOT 4 OTHER 6
I - i - I (SPECIFY) (SPECIFY)
MONTHS MONTHS
• DON'T KNOW ...... . . . . . . . . . . . . . . . . . . . . . . . . 98 • DON'T KNOW ... . . . . . . . . . . . . . . . . . . . . . . . . . . . 98 .
NO. OFTIMES I NO. OFTIMES I
. D O N ' T K N O W . . . . . . . . . . . . . . . . . . . . . . . . . . . . . .98 . D O N ' T K N O W . . . . . . . . . . . . . . . . . . . . . . . . . . . . . . 98 .
YES 1 YES 1
NO 2- NO 2 - DON'T KNOW 8- DON'T KNOW 8 -
(SKIP TO 413) 4 (SKIP TO 413) 4
2 0 2 3 8

LAST BIRTH NEXT-TO-LAST BIRTH
412
4 1 3
414
415A
415B
416
¢17
What symptoms or conditions can you remember?
PROBE: Anything else?
When you were pregnant with (NAME) were you given any of the following:
Iron tablets/capsules? Iodine capsule?
Tetanus toxoid, an injection in the arm to prevent the baby from getting tetanus, that is, convulsions after birth?
During this pregnancy, how many times did you receive a tetanus toxoid injection?
NAME
VAGINAL BLEEDING A HEADACHE, DIZZINESS. BLURRED
VISION B SWOLLEN FACE AND/OR
HANDS C PALE OR ANEMIC D
CAN'T REMEMBER E OTHER X
(SPECIFY)
YES NO DK
iRON TAB/CAP 1 2 8 IODINE CAP 1 2 8
TETANUS TOXOID 1 2 8 I I
(SKIP TO 415A)
NO. OF TIMES t [
NAME
VAGINAL BLEEDING A HEADACHE, DiZZiNESS, BLURRED
VISION B SWOLLEN FACE AND/OR
HANDS C PALE OR ANEMIC D
CAN'T REMEMBER E OTHER X
(SPECIFY)
IRON TAB/CAP IODINE CAP
TETANUS TOXOID
NO. OF TIMES
YES NO DK
1 2 8 1 2 8
1 2 8 I I
(SKIP TO 415A)
I I . DON'T KNOW .............................. 8 , DON'T KNOW .............................. .8
Did you receive any tetanus toxoid YES 1 YES 1 injections during your previous NO 2 NO 2 pregnancies or during the National (SKIP TO 416) q l (SKIP TO 416~ l Immunization Day or Oplan Alis Disease? DON'T KNOW 8 ! DON'T KNOW 8
How many times? , NUMBER OF TIMES ............... I I .NUMBEROFT'MES . . . . . . . . . . . . . . . I I Where did you give birth to (NAME)? HOME
OWN HOME OTHER HOME
PUBLIC SECTOR GOVT. HOSPITAL GOVT. HEALTH CENTER GOVT. HEALTH POST OTHER PUBLIC
(SPECIFY) PRIVATE MEDICAL SECTOR
PVT. HOSPITAL/CLINIC OTHER PRIVATE MEDICAL
(SPECIFY) OTHER
(SPECIFY)
HEALTH PROFESSIONAL DOCTOR NURSE MIDWIFE
HILOT RELATIVE/FRIEND
OTHER (SPECIFY)
HOME 11 OWN HOME 12 OTHER HOME
PUBLIC SECTOR 21 GOVT. HOSPITAL 22 GOVT. HEALTH CENTER 23 GOVT, HEALTH POST
OTHER PUBLIC 26
(SPECIFY) PRIVATE MEDICAL SECTOR
31 PVT. HOSPITAL/CLINIC OTHER PRIVATE MEDICAL
36 (SPECIFY)
96 OTHER (SPECIFY)
HEALTH PROFESSIONAL A DOCTOR B NURSE C MIDWIFE D HILOT E RELATIVE/FRIEND
X OTHER (SPECIFY)
11 12
21 22 23
26
31
36
96
A B C D E
X
• NOONE ...................................... Y .NOONE ....................................... Y I
Who assisted with the delivery of (NAME)?
Anyone else?
PROBE FOR THE TYPE OF PERSON AND RECORD ALL PERSONS ASSISTING.
239 21

YES NO
418
419
419A
420
421
LAST BIRTH
NAME
NEXT-TO-LAST BIRTH
NAME
Around the time of the birth of (NAME), did you have any of the following )roblems?
Long Labor, that is, your regular contractions last more than 12 hours?
Excessive bleeding that you feared it was life threatening?
A high fever with bad smelling vaginal diiseharge?
Convulsions not caused by a fever?
; When (NAME) was born, was he/she:
very large,
larger than average, average,
smaller than average, or
very small?
Was (NAME) delivered by caesarian section?
i What was the main reason for having a ! delivery by caesarian section?
Was (NAME) weighed at birth?
How much did (NAME) weigh?
RECORD WEIGHT FROM HEALTH CARD, IF AVAILABLE.
LABOR MORETHAN12 HOURS
EXCESSIVE BLEEDING
FEVER WlTH BADSMELLING VAGINALDISCHARGE
CONVULSIONS
VERY LARGE
LARGER THAN AVERAGE AVERAGE
SMALLER THAN AVERAGE
VERY SMALL
YES NO
LABOR MORE THAN 12 2 HOURS
2 EXCESSIVE BLEEDING
FEVER WITH BAD SMELLING 1 2 VAGINAL DISCHARGE
1 2 CONVULSIONS
1 VERY LARGE
2 LARGER THAN AVERAGE 3 AVERAGE
4 SMALLER THAN AVERAGE
5 VERY SMALL
1 2
1 2
1 2
1 2
1
2 3 4 5
1
2 I
O8
O9
98
1 2 I
, DON'T KNOW ............................... 8 , DON'T KNOW. ............................... 8
YES 1
NO 2
(SKIP TO 420) 4 I
HIGH BLOOD PRESSURE AND SWELLING OF FACE AND HAND W/O CONVULSION (PRE- ECLAMPSIA) 01
CONVULSION, HIGH BLOOD PRESSURE AND SWELLING OF FACE AND HAND (ECLAMPSlA) 02
BABY TOO BIG TO PASS MOTHER'S PELVIC BONE 03
BREECH BIRTH, BABY'S HEAD NOT COMING OUT FIRST ................. 04
BABY MIGHT DIE INSIDE MOTHER'S WOMB (FETAL DISTRESS) ......... 05
UNUSUALLY PROLONGED LABOR (LABOR BEYOND 12 HOURS) ...... .06
EXCESSIVE WATERY VAGINAL DISCHARGE BEFORE THE ONSET OF LABOR 07
EXCESSIVE BLEEDING .... 08
OTHER 09
98
YES
NO
(SKIP TO 420) 4
HIGH BLOOD PRESSURE AND SWELLING OF FACE AND HAND W/O CONVULSION (PRE- ECLAMPSlA) 01
CONVULSION, HIGH BLOOD PRESSURE AND SWELLING OF FACE AND HAND (ECLAMPSIA) 02
BABY TOO BIG TO PASS MOTHER'S PELVIC BONE 03
BREECH BIRTH, BABY'S HEAD NOT COMING OUT FIRST 04
BABY MIGHT DIE INSIDE MOTHER'S WOMB (FETAL DISTRESS) 05
UNUSUALLY PROLONGED LABOR (LABOR BEYOND 12 HOURS) 06
EXCESSIVE WATERY VAGINAL DISCHARGE BEFORE THE ONSET OF LABOR 07
EXCESSIVE BLEEDING
OTHER (SPECIFY)
DON'T KNOW
YES NO
417A
(SKIP TO 422) 4
POUNDS OUNCES
(SPECIFY)
DON'T KNOW
YES 1 NO 2
(SKIP TO 422) il I
POUNDS OUNCES
FROM I - - [q CARD 1
RECALL 2 ~ " - ] ~ FROM • RECALL .2 [ ~ [ ~ [ ~ - ~
, DON'T KNOW ....................... 99998 . DON'T KNOW. ......................... 99998
FROM ~ [ - ~ r ~ CARD 1
FROM
22 240

LAST BIRTH NEXT-TO-LAST BIRTH
422
423
424
425
Did you see anyone for a postnatai check- up after the birth of (NAME)?
IF YES: Whom did you see? Anyone else?
How many days after the birth of (NAME) did you get postnatal care?
Did you receive the following services during your postnatal check.up?
Abdominal examination? Breast examination? internal examine(tan? Family planning advice? Breestfeeding advise? Baby care advice? Check-up of baby? Any other service?
Has your period returned since the birth of (NAME)?
426 Did your period return between the birth of (NAME) and your next pregnancy?
427 I For how many months after the birth of (NAME) did you no_jt have your period?
NAME
HEALTH PROFESSIONAL DOCTOR .................................. A NURSE .... . . . . . . . . . . . . . . . . . . . . . . . . . . . . . . . . B MIDWIFE .................................. C
HILOT .... . . . . . . . . . . . . . . . . . . . . . . . . . . . . . . . . . . . . . D RELATIVE~FRIEND . . . . . . . . . . . . . . . . . . . . . . . . E
OTHER X (SPECIFY)
NO ONE .......................... -~ ........... | (SKIP TO 425)
r , ~
DAYS .... . . . . . . . . . . . . . . . . . . . . 1 I I I
WEEKS ...................... 2
DON'T KNOW. .......................... 996
YES NO DK
ABDOMINAL EXAM ............ 1 2 8 BREAST EXAM .................. 1 2 8 INTERNAL EXAM ............... 1 2 8 FAM LY PLANN NG ADVICE.1 2 8 BREASTFEEDING ADV CE 1 2 8 BABY CARE ADVICE .......... 1 2 8 CHECK-UP OF BABY .......... 1 2 8 OTHER 1 2 8
(SPECIFY)
NAME
HEALTH PROFESSIONAL DOCTOR ... . . . . . . . . . . . . . . . . . . . . . . . . . . . . . . A NURSE ... . . . . . . . . . . . . . . . . . . . . . . . . . . . . . . . . . B MIDWIFE .. . . . . . . . . . . . . . . . . . . . . . . . . . . . . . . . C
HILOT .. . . . . . . . . . . . . . . . . . . . . . . . . . . . . . . . . . . . . . . . D RELATIVEIFRIEN[~ . . . . . . . . . . . . . . . . . . . . . . . . E
OTHER X (SPECIFY)
NO ONE . . . . . . . . . . . . . . . . . . . . . . . . . ..... (SKIP TO426) 4 "
DAYS .... . . . . . . . . . . . . . . . . . . . . . . . 1 I I I
WEEKS ... . . . . . . . . . . . . . . . . . . . . . 2
DON'T KNOW .... . . . . . . . . . . . . . . . . . . . . . . . . 998
YES NO DK
ABDOMINAL EXAM ... . . . . . . . . . 1 2 8 BREAST EXAM .................. 1 2 8 INTERNAL EXAM .... . . . . . . . . . . . I 2 B FAMILY PLANNING ADVICE 1 2 8 BREASTFEEDING ADVICE.. 1 2 8 BABY CARE ADVICE .......... 1 2 8 CHECK-UP OF BABY ........... 1 2 8 OTHER 1 2 8
(SPECIFY)
MONTHS ........................ ~ MONTHS ... . . . . . . . . . . . . . . . . . . . .
DON'T KNOW. .... . . . . . . . . . . . . . . . . . . . . . . . . . 98 , DON'T KNOW ... . . . . . . . . . . . . . . . . . . . . . . . . . . 98
428 CHECK 236:
RESPONDENT PREGNANT? NOT 1 PREG- 1 PREG- I NANT J NANT OR
UNSURE
(SKIP TO 430)
429
430
Have you resumed sexual relations since the birth of (NAME)?
For how many months after the birth of (NAME) did you not have sexual relations?
431 Did you ever breastfeed (NAME)?
Y E S . . . . . . . . . . . . . . . . . . . . . . . . . . . . . . . . . . . . . . . . . . . 1
N O . . . . . . . . . . . . . . . . . . . . . . . . . . . . . . . . . . . . . . . . . . . . . 2
(SKIP TO 431) 4
MONTHS ......................
DON'T KNOW ............................. 98
YES 1 . . . . . . . . . . . . . . . . . . . . . . . K
N O . . . . . . . . . . . . . . . . . . . . . . . . . . . . . . . . . . . . . . . . . . . . . . 2
MONTHS .... . . . . . . . . . . . . . . . . . . . .
!DON'T KNOW ... . . . . . . . . . . . . . . . . . . . . . . . . . . . 98
YES . . . . . . . . . . . . . . . . . . . . . . . . . . . . . . . . . . . . . . . . . .
(SKIP TO 433) 4 NO ............................................. 2
241 23

LAST BIRTH NEXT-TO-LAST BIRTH
432
433
434
I
Why did you not breasffeed (NAME)?
How long after birth did you first put (NAME) to the breast?
IF LESS THAN 1 HOUR, RECORD "00" HOURS
IFLESSTHAN24HOURS, RECORD HOURS•
OTHERWISE, RECORD DAYS
NAME NAME
CHECK 404:
CHILD ALIVE?
435 Are you still breasffeeding (NAME)?
MOTHER ILIJWEAK. 1 - - CHILD ILL/WEAK CHILD DIED NIPPLE/BREAST PROBLEM 4 NOT ENOUGH MiLK 5 - - MOTHER WORKING, 7 - - CHILD REFUSED 8 -
OTHER 6 - (SPECIFY) (SKIP TO 443) 4
436
437
IMMEDIATELY 000
HOURS 1
DAYS 2
MOTHER ILL/WEAK 1 - CHILD ILL/WEAK 2 - CHILD DIED 3 - NIPPLE/BREAST PROBLEM 4 - NOT ENOUGH MILK 5 - MOTHER WORKING 7 - CHILD REFUSED 8 -
OTHER 6 - (SPECIFY) (SKIP TO 443)
IMMEDIATELY 000
HOURS 1
DAYS 2
ALIVE I DEADI " (SKIPTO436) 4
YES 1 I
NO . . . . . . . . . . . . . . . . . . . . . . . . . . . ; I • - - - - . - - " ~
MONTHS MONTHS / STILL BREASTFEEDiNG 70
/
(SKIP TO 441) 4 - I
, DON'T KNOW . . . . . . . . . . . . . . . . . . . . . . . . . . . 98 , DON'T KNOW..: . . . . . . . . . . . . . . . . . . . . . . . . . . . 98
438
For how many months (:lid you breastfeed (NAME)?
Why did you stop breasffeeding (NAME)? MOTHER ILL/WEAK.. 01 -
CHILD ILL/WEAK 02 - -
CHILD DIED 03 - -
NIPPLE/BREAST PROBLEM 04 - -
NOT ENOUGH MILK.. 05 - -
MOTHER WORKING.. 06 - -
CHILD REFUSED 07 - -
WEANING AGE/AGE TO STOP... 08 - -
BECAME PREGNANT 09 - -
STARTED USING
CONTRACEPTION 10 - -
OTHER 96 - - (SPECIFY)
MOTHER ILL/WEAK 01 - -
CHILD ILLNVEAK 02 - -
CHILD DIED 03 - -
NIPPLE/BREAST PROBLEM 04 - -
NOT ENOUGH MILK 05 - -
MOTHER WORKING 06 - -
CHILD REFUSED 07 - -
WEANING AGE/AGE TO STOP 08 - -
BECAME PREGNANT 09 - -
STARTED USING
CONTRACEPTION 10 - -
OTHER 96 - - (SPECIFY)
How many times did you breasffeed (NAME) last night between sunset and sunrise?
IF ANSWER IS NOT NUMERIC PROBE FOR APPROXIMATE NUMBER.
( S K I P T O 4 4 0 ) 4 ( S K I P T O 4 4 2 ) 4
. . I - - C ] " FEEDINGS
24 2 4 2

439 How many times did you breastfeed (NAME) yesterday during the daylight hours?
IF ANSWER IS NOT NUMERIC PROSE FOR APPROXIMATE NUMBER.
LAST BIRTH
NAME
NUMBER OF DAYLIGHT .................. FEEDINGS
NAME
NEXT-TO-LAST BIRTH
441
442
444
445
446
L
CHECK 435:
OR "YES" IN ENTRY 435 NO 1 I "NO" IN 435
(SKIP TO 442)
Was (NAME) ever given water or anything YES ...................................................... 1 else to drink or eat other than breaetmilk? NO ........................................................ 2
( SKIP TO 448) 4 I
How many months old was (NAME)when I MONTHS .................... you first started giving him/her any food or J I t J liquid other than breastmilk? I
CHECK 404: ALIVE I I DEAD
CHILD ALIVE? (SKIP TO 448)
Did (NAME) drink anything from a bottle with a nipple yesterday or last night?
At any time yesterday or last night, was (NAME) given any of the following:
Plain water?
Sugar water?. Juice/Herbal tea?
Infant formula?
Other milk?
Any other liquid? Any food made from cereals (wheat,
maize, rice,such as porridge, bread, or noodles)?
Any food made from root crops (cassava, kamote or local tuber?
Eggs, fish, poultry, or meat?
Any other solid or semi-solid foods?
CHECK 445:
FOOD OR LIQUID GIVEN YESTERDAY?
YES ........................................... 1 NO ............................................ 2 DON'T KNOW .............................. 8
YES NO DK
PLAIN WATER .................. 1 2 8 SUGAR WATER ................. 1 2 8
JUICE/HERBAL TEA ........... 1 2 8
INFANT FORMULA ............. 1 2 8
OTHER MILK .................... 1 2 8
OTHER LIQUIDS ................ 1 2 8
FOOD MADE FROM
CEREALS .................... 1 2 8
FOOD MADE FROM
ROOT CROPS ............... 1 2 8
EGGSIFISHIPOULTRYI MEAT .......................... 1 2 8
OTHER SOLID/SEMI-
SOLID FOODS .............. 1 2 8
"YES"TO ~ "NO"f'DK" F" ~ ONE/MORE I . ~ J TO A L L ~ . ~ J
(SKIP TO 4 4 8 )
Y E S . . . . . . . . . . . . . . . . . . . . . . . . . . . . . . . . . . . . . . . . . . . . . . . . . . . . . . 1
N O . . . . . . . . . . . . . . . . . . . . . . . . . . . . . . . . . . . . . . . . . . . . . . . . . . . . . . . . 2
( SKIP TO 448) 4 I
MONTHS ........................ ~ - ~
ALIVE ~ J DEAD
(SKIP TO 445) (SKIP TO 448)
YES NO DK
PLAIN WATER .................. 1 2 8 SUGAR WATER ..... . . . . . . . . . . . 1 2 8
JUICE/HERBAL TEA .......... 1 2 8
INFANT FORMULA ............ 1 2 8
OTHER MILK .................... 1 2 8
OTHER LIQUIDS ............... 1 2 8
FOOD MADE FROM
CEREALS .................... 1 2 8
FOOD MADE FROM
ROOT CROPS .............. 1 2 8
EGGSIFISHIPOULTRYI MEAT .... . . . . . . . . . . . . . . . . . . . . . 1 2 8
OTHER SOLID/SEMI-
SOLID FOODS .............. t 2 8
"YES" TO ~ "NO"/"DK" ONE/MORE TO ALL
(SKfP TO 448)
243 25

447
448
(Aside from breasffeedlng,) how many times did (NAME) eat and/or drink yesterday, including both meals and snacks?
IF 7 OR MORE TIMES, RECORD "7".
LAST BIRTH NEXT-TO-LAST BIRTH
NAME NAME
NUMBER OF T~MES [ ] NUMBER O~ TIMES ['--] . DON'T KNOW ............................ .8 . DON'T KNOW. ............................ 8 .
GO BACK TO 405 IN NEXT COLUMN; IF NO MORE BIRTHS, GO TO 449; OR OR, IF NO MORE BIRTHS, GO TO 449. IF WITH SECOND-TO-LAST BIRTH
SINCE JANUARY 1993, USE ANOTHER QUESTIONNAIRE.
REMARKS:
26 244

E 45O
451
452
453
454 (1) COPY VACCINATION DATE FOR EACH VACCINE FROM THE CARD.
455
SECTION 4B. IMMUNIZATION AND HEALTH
ENTER THE NAME, LINE NUMBER, AND SURVIVAL STATUS OF EACH BIRTH SINCE JANUARY 1993 IN THE TABLE. ASK THE QUESTIONS ABOUT ALL OF THESE BIRTHS. BEGIN WITH THE LAST BIRTH. IF THERE ARE MORE THAN 2 BIRTHS USE ADDITIONAL QUESTIONNAIRE).
LAST BIRTH NEXT-TO-LAST BIRTH
LINE NUMBER FROM 214 LINE NUMBER ............... ~ I ~ LINE NUMBER ................... I I ~
NAME NAME
FROM 2t8 ALIVE 1 I D E A D [ ~ ALIVE ~ 1 C oR,DEAD ~ I F NO MORE (GO TO 451 IN NEXT • AND 221 (GO TO 451 IN NEXT ~1, I ((OLUMN;
COLUMN; OR, IF NO MORE BIRTHS, GO TO ~ BIRTHS, GO TO 478.) 478.)
Do you have a card where (NAME'S) YES, SEEN . . . . . . ..1 YES, SEEN 1 vaccinations are written down? iS-KIP'T(~ 4~i - " ~ ....... -(SKIP TO'454i
YES, NOT SEEN ... . . . :~ YES, NOT SEEN . . . . . . . . . . . . . . . . . . . . . . . . . . . . 2 IF YES: May I see it please? (SKIP'TO 4 5 6 i - - ' " ~ - " " -I (SKIP TO 4 6 6 ) ~ ' 1
NO CARD ....................................... 3 NO CARD ......................................... 3
Did you ever have a vaccination card for YES ............................................... 1 YES ................................................ 1 (NAME)? (SKIP TO 456) ~ (SKIP TO 4 5 6 ) 4 1 ~ - - ~ I
NO ................................................ 2 NO .................................................. 2
WRITE "44" IN "MONTH" COLUMN IF CARD SHOWS THAT A VACCINATION WAS GIVEN, BUT NO DATE IS RECORDED
(2)
BCG
DPT 1
DPT 2
DPT 3
Polio 1
Polio 2
Polio 3
Measles
Has (NAME) received any vaccinations that was not recorded on this card?
RECORD "YES" ONLY IF RESPONDENT MENTIONS BCG, POLIO 1-3, DPT 1-3, AND/OR MEASLES VACCINE(S)
MON]H DAY YEAR MON]H DAY YEAR
BCG .....
D1 .......
D2 .......
D3 .......
P1 .......
P2 .......
P3 .......
MEASLES
Y E S . . . . . . . . . . . . . . . . . . . . . . . . . . . . . . . . . . . . . . . . . . . .
(PROBE FOR VACCINATIONS AND WRITE 66' IN THE CORRESPONDING MONTH COLUMN IN 454)
NO ............................................. 2
DON'T KNOW ............................... 8
(SKIP TO 457L) ~ '~
BCG ........
DI
D2
D3
P1
P2
P3
MEASLES
Y E S . . . . . . . . . . . . . . . . . . . . . . . . . . . . . . . . . . . . . . . . . '~
(PROBE FOR VACCINATIONS AND WRITE "66" IN THE CORRESPONDING MONTH COLUMN IN 454)
NO ............................................. 2
DON'T KNOW ............................... 8
(SKIP TO 457L) ~
245 27

456A
LAST BIRTH NEXT-TO-LAST BIRTH
NAME NAME
CHECK 222:
AGE OF CHILD = "OO"? YES __1 NO / Y E S - - I NO J
457
457A
457B
457C
457D
457E
457F
(SKIP TO 457J) II
457G
457H
457J
457K
Did (NAME) ever receive any vaccinations YES 1 YES 1 to prevent him/her from getting diseases? NO 2 NO 2
I (SKIP TO 457P) • I (SKIP TO 457P)~ I
• DON'T KNOW .............................. 8 . DON'T KNOW .................................. 8 .
Please tell me if (NAME) received any of the following vaccinations:
A BCG vaccination against tuberculosis, that is, an injection in the left shoulder that caused a scar?
Did (NAME) receive this BCG vaccine before his/her first birthday?
YES NO
(SKIP TO 457C) 4 DON'T KNOW
1 YES 2 NO I SKIP TO 4 ( 457C) 8 1 DON'T KNOW
YES 1 NO 2
YES . . . . . . . . . . . . . . . . . . . . . . . . . . . . . . . . . . . . . . . . . . . . . . . . . . . . . . . . . . 1
NO ............................................................ 2
DO NOT ASK THIS QUESTION IF "YES" IN 456.
Polio vaccine, that is, drops in the mouth ?
How many times?
i Did (NAME) receive this third (last) polio : vaccine before his/her first birthday?
DO NOT ASK THIS QUESTION IF "YES" IN 456.
DPT vaccination, that is, an injection in the thigh that is usually given at the same time as polio drops?
How many times?
Did (NAME) receive this third (last) DPT vaccine before his/her first birthday?
DO NOT ASK THIS QUESTION IF "YES" IN 456.
An injection to prevent measles?
Did (NAME) receive this measles vaccine before his/her first birthday?
OO NOT ASK THIS QUESTION IF "YES" IN 456.
YES' 1 NO
(SKIP TO 457F) • ........ "1 DON'T KNOW 8
NUMBER OF TIMES I I
YES 1 NO 2
YES 1 NO 2
(SKIP TO 457J) 4 I DON'T KNOW 8
NUMBER OF TIMES. I I
YES 1 NO 2
YES 1 NO 2
(SKIP TO 457L) 4 [ DON'T KNOW 8
YES 1 NO 2
YES 1 NO 2i
(SKIP TO 457F) ~ t DON'T KNOW 8
NUMBER OF TIMES I I
YES 1 NO 2
YES NO
DON'T KNOW
NUMBER OF TIMES
YES NO
YES NO
DON'T KNOW
YES NO
1 2
I 8
(SKIP TO 457L) 4
II 1 2
1 2
I 8
456
1 2
28 246

457N
457R
AGE OF CHILD = "00"?
CHECK 452:
SEEN CARD?
GO BACK TO 454, IF ALL ROWS FILLED UP ASK:
Did (NAME) receive BCG, 3 doses of Polio and DPT and Measles Vaccines before his/her first birthday?
OTHERWISE, DO NOTASKTHIS QUESTION, ENTER "X" FOR "NO" AND SKIP TO 457R.
CHECK 457B: 457D: = "3" AND 457E = "YES" 457G: = "3" AND 457H = "YES" 457K:
RECEIVED VACCINATION BEFORE FIRST BIRTHDAY?
CHECK 456: ,, AGE OF CHILD = "00 ?
What are the reasons why (NAME) did not complete {have any) vaccination before reaching his/her first birthday?
RECORD ALL RESPONSES MENTIONED.
LAST BIRTH
NAME
YEs NO I -
(SKIP TO 4 5 7 T ~
SEEN I ~ 1 NOT SEEN/ ~ ] (CODE"1" I I NO CARD ~N 482) / (CODE 2" /
/ OR "3" / ,N452)
• (SKIP TO 4570)
YES ~ NO [ ~
(SKIP TO 457T) (SKIP TO 457R)
YES NO/NO ENTRY BCG .. . . . . . . . . . . . . . . 1 2 - - Polio . . . . . . . . . . . . . . . 1 2 - - DPT . . . . . . . . . . . . . . . . t 2 - - Measles . . . . . . . . . . . ~ 2 - -
÷ (SKIP TO 457T) (SKIP TO 457R
YES I I NO t
(SKIP TO 458)
UNAWARE OF NEEDS FOR IMMUNIZATION . . . . . . . . . . . . . . . . . . . . . . . A
UNAWARE OF NEED TO RETURN FOR SECOND OR THIRD DOSE . . . . . . . . . . . . . . . . . . . . . . . . . . . . . . . . . . . . B
FEAR OF SIDE REACTIONS, WRONG IDEAS ABOUT CONTRAINDICATIONS . . . . . . . . . . . . . . C
POSTPONED UNTIL ANOTHER TIME . . . . . . . . . . . . . . . . . . . . . . D
NO FAITH IN IMMUNIZATION .... . . . . . . E
RUMORS . . . . . . . . . . . . . . . . . . . . . . . . . . . . . . . . . . . F
PLACE OF IMMUNIZATION TOO FAR G
TIME FOR IMMUNIZATION INCONVENIENT . . . . . . . . . . . . . . . . . . . . . . . H
VACCINATOR ABSENT . . . . . . . . . . . . . . . . . . I
MOTHER TOO BUSY . . . . . . . . . . . . . . . . . . . . . J
FAMILY PROBLEM, INCLUDING ILLNESS OF MOTHER .. . . . . . . . . . . . . . K
NEXT-TO-LAST BIRTH
NAME
YES ~ NO q
{SKIP TO 4 5 7 T ~
SEEN NOT SEEN/ (CODE "1" I NO CARD IN 452) (CODE 2" /
I OR -3" / I IN 452) 4' • (SKIP TO 4570) Y,,? i
(SKIP TO 457T) (SKIP TO 457R)
YES NO/NO ENTRY BCG . . . . . . . . . . . . . . . . 1 2 - - Polio . . . . . . . . . . . . . . . . 1 2 - - DPT . . . . . . . . . . . . . . . . 1 2 - -
Measles .. . . . . . . . . . . i 2 - -
(SKIP TO 457T) (SKIP TO 457R NOEl (SKIP TO 458)
UNAWARE OF NEEDS FOR IMMUNIZATION . . . . . . . . . . . . . . . . . . . . . . . . . . . A
UNAWARE OF NEED TO RETURN FOR SECOND OR THIRD DOSE . . . . . . . . . . . . . . . . . . . . . . . . . . . . . . . . . . . . . . . . B
FEAR OF SIDE REACTIONS, WRONG IDEAS ABOUT CONTRAINDICATIONS . . . . . . . . . . . . . . . . . . C
POSTPONED UNTIL ANOTHER TIME . . . . . . . . . . . . . . . . . . . . . . . . . . . D
NO FAITH IN iMMUNIZATION . . . . . . . . . . . . . . E
RUMORS . . . . . . . . . . . . . . . . . . . . . . . . . . . . . . . . . . . . . . . . F
PLACE OF IMMUNIZATION TOO FAR . . . . . . . . . . . . . . . . . . . . . . . . . . . . . . . . . . . . G
TIME FOR IMMUNIZATION INCONVENIENT . . . . . . . . . . . . . . . . . . . . . . . . . . . H
VACCINATOR ABSENT . . . . . . . . . . . . . . . . . . . . . . I
MOTHER TOO BUSY . . . . . . . . . . . . . . . . . . . . . . . . . J
FAMILY PROBLEM, INCLUDING ILLNESS OF MOTHER . . . . . . . . . . . . . . . . . . . K
CHILD ILL-NOT BROUGHT .. . . . . . . . . . . . . L CHILD ILL-NOT BROUGHT . . . . . . . . . . . . . . . . . L
CHILD ILL-BROUGHT BUT NOT CHILD ILL-BROUGHT BUT NOT GIVEN IMMUNIZATION M GIVEN IMMUNIZATION .. . . . . . . . . . . . . . . . . M
LONG WAITING TIME . . . . . . . . . . . . . . . . . . . N LONG WAITING TIME . . . . . . . . . . . . . . . . . . . . . . . . N
OTHER X )THER X (SPECIFY) (SPECIFY)
247 29

NAME
NEXT-TO-LAST BIRTH
457S CHECK 456A:
457T
EVER RECEIVED VACCINATION?
Did (NAME) receive an injection to prevent Hepatitis B?
YES
(SKIP TO 458) 9
YES/NO --1 NO ENTRY
' t (SKIP TO 458
1 YES
2 NO
1 8 DON'T KNOW
II
NOI (SKIP TO 458
1
2
I 8
NO
(SKIP TO 458) 4
: DON'T KNOW
NAME
YES/NO "-7 ENTRY
LAST BIRTH
I I 457U How many times? NUMBER OF TIMES NUMBER OF TIMES
458 At any time during the last six months, did (NAME) receive any of the following: YES NO DK YES NO DK
Vitamin A capsule? VITAMIN A 1 2 8 VITAMIN A 1 2 8 Iodine capsule? IODINE 1 2 8 IODINE 1 2 8 Iron drops/syrup? IRON 1 2 8 IRON 1 2 8
459 Has (NAME) been ill with a fever at any YES 1 YES 1 time in the last 2 weeks? NO 2 NO 2
DON'T KNOW 8 DON'T KNOW . . . . . . . . . . . . . . . . . . . . . . . . . . . . . . . . . . . . . . . . . . . . . . . . . . . . . . . . . . . . . . . . . . 8 ,
460 Has (NAME) been ill with a cough at any YES 1 YES 1 time in the last 2 weeks? NO 2 NO 2
(SKIP TO 465) q I (SKIP TO 465) q I • DON'T KNOW . . . . . . . . . . . . . . . . . . . . . . . . . . . . . . 8 . DON'T KNOW . . . . . . . . . . . . . . . . . . . . . . . . . . . . . . . . . . 8 .
461 When (NAME) was ill with a cough, did YES 1 YES 1 he/she breathe faster than usual with NO 2 NO 2 shod, fast breaths? . DON'T KNOW . . . . . . . . . . . . . . . . . . . . . . . . . . . . . . 8 . DON'T KNOW . . . . . . . . . . . . . . . . . . . . . . . . . . . . . . . . . . 8 .
462 Did you seek advice or treatment for the YES 1 YES 1 cough? NO 2 NO 2
(SKIPTO 465) q I (SKIPTO 465) ~1 I
463 ! PUBLIC SECTOR GOVT. HOSPITAL/CLINIC/CHHC A
PUBLIC SECTOR GOVT. HOSPITAL/CLINIC/CH HC.. A
RURAL HEALTH UNIT/
URBAN HEALTH CENTER B
BARANGAY HEALTH STATION.... C
RURAL HEALTH UNIT/
URBAN HEALTH CENTER B
BARANGAY HEALTH STATION C
COMM. HEALTH WORKER D
OTHER PUBLIC E
(SPECIFY)
PRIVATE SECTOR
PVT. HOSPITAL/CLINIC F
PHARMACY G
PRIVATE DOCTOR/MIDWIFE/
NURSE H
STORE I
INDUSTRY-BASED CLINIC J
BOY SCOUTS/GIRL SCOUTS K
JAYCEES L
OTHER PRIVATE M
(SPECIFY)
Where did you seek advice or treatment?
Anywhere else?
RECORD ALL MENTIONED.
COMM. HEALTH WORKER D
OTHER PUBLIC E
(SPECIFY)
PRIVATE SECTOR
PVT. HOSPITAI.JCLINIC F
PHARMACY G
PRIVATE DOCTOR/MIDWIFE/
NURSE H
STORE I
INDUSTRY-BASED CLINIC J
BOY SCOUTS/GIRL SCOUTS K
JAYCEES L
OTHER PRIVATE M
(SPECIFY)
30 248

LAST BIRTH NEXT-TO-LAST BIRTH
464
NAME
What was given to treat the cough?
; - '~o5 Has (NAME) had diarrhea in the last 2
weeks?
466 Was there any blood in the stools?
467
468
469
470
471
INJECTION A ANTIBIOTIC (PILL OR SYRUP). B COUGH SYRUP C OTHER PILL OR SYRUP D UNKNOWN PILL OR SYRUP. E HOME REMEDY/HERBAL
MEDICINE F
OTHER X
NAME
INJECTION A t~NTIBIOTiC (PILL OR SYRUP). B COUGH SYRUP C OTHER PILL OR SYRUP D UNKNOWN PILL OR SYRUP E HOME REMEDY/HERBAL
MEDICINE F
OTHER X (SPECIFY) (SPECIFY)
CHECK 435;
LAST CHILD STILL BREASTFEED?
During (NAME'S)diarrhea, did you maintain the same number of breastfeeds~ did you increase the number of breasffeeda, did you reduce the number of breasffeeds, or did you stop breasffeedinq completely althogether?
On that worst day of the diarrhea, how many bowel movements did (NAME) have?
(Aside from breasffeeding), was (NAME) given the same amount to drink as before thedlarrhea, ormore, orleas, ornot given anything to drink at all?
Was (NAME) given the same amount of food to eat as before the diarrhea, or more, or less, or not given anything to eat at all?
• NOTHING GIVEN . . . . . . . . . . . . . . . . . . . . . . . . . Y . NOTHING GIVEN . . . . . . . . . . . . . . . . . . . . . . . . . . . . . . Y .
YES 1 YES 1 NO 2 NO 2
(SKIP TO 477) • I (SKIP TO 477) "- , . DON'T KNOW .. . . . . . . . . . . . . . . . . . . . . . . . . . . . . .8 . DON'T KNOW . . . . . . . . . . . . . . . . . . . . . . . . . . . . . . . . . 8 .
YES 1 YES 1 NO 2 NO 2
• DON'T KNO W . . . . . . . . . . . . . . . . . . . . . . . . . . . . . .8 , DON'T KNOW. . . . . . . . . . . . . . . . . . . . . . . . . . . . . . . . . . 8 .
YES : I NOII,,
(SKIP TO 469 ' r
INCREASED .2 REDUCED 3 STOPPED 4
NUMBER OF BOWEL NUMBER OF BOWEL MOVEMENTS [ - ~ MOVEMENTS
DON'T KNOW ..98 DON'T KNOW 98
SAME 1 SAME 1 MORE 2 MORE 2 LESS 3 LESS 3 NOTHING 4 NOTHING 4
• DON'T KNOW .. . . . . . . . . . . . . . . . . . . . . . . . . . . . . 8 , DON'T KNOW . . . . . . . . . . . . . . . . . . . . . . . . . . . . . . . . . 8 .
SAME 1 SAME 1 MORE 2 MORE 2 LESS 3 LESS 3 NOTHING 4 NOTHING 4
! DON'T KNOW. . . . . . . . . . . . . . . . . . . . . . . . . . . . . . 8 . DON'T KNOW . . . . . . . . . . . . . . . . . . . . . . . . . . . . . . . . . 8 .
249 31

472
LAST BIRTH NEXT-TO-LAST BIRTH
When (NAME) had diarrhea, was he/she given any of the following to drink:
Fluid from ORS preparation (ORESOL/Hydrite)? Rice water/'am' Home-made sugar-salt-water solution?
Tea/herbal drin ks/softdrinks/soffdrin ks with starch?
Milk/infant formula? Rice/cern coffee? Coconut water/broth/soups?
NAME
ORS PREPARATION
RICE WATER/'AM' 1 2 8 HOME-MADE SUGAR-SALT-
WATER SOLUTION 1 2 8 TEA/HERBAL DRINKS/
SO FTDRINKS/SOFTDRIN KS WITH STARCH 1 2 8
MILK/INFANT FORMULA.____1 2 8 RICE/CORN COFFEE 1 2 8 COCONUT WATER/BROTH/
SOUPS 1 2 8 WATER 1 2 8 OTHER LIQUID 1 2 8
NAME
YES NO DK
1 2 8 ORS PREPARATION
YES NO DK
1 2 8
1 2 8
1 2 8
RICE WATE R/'AM' HOME-MADE SUGAR-SALT-
WATER SOLUTION TENHERBAL DRINKS/
SOFTDRINKS/SOFTDRI N KS WITH STARCH
MILK/INFANT FORMULA. RICE/CORN COFFEE COCONUT WATER/BROTH/
SOUPS WATER OTHER LIQUID
1 2 8 1 2 8 1 2 8
..1 2 8 Water? 1 2 8 Any other liquid? 1 2 8
473 Was anything (else) given to treat the YES 1 !YES 1 diarrhea? NO 2 NO 2
(SKIP TO 475) ql I (SKIP TO 475) • I i
. . . . . . . . . . . . . . . . . . . . . . . . . . . . . . . DON'T KNOW 8 , DON'T KNOW . . . . . . . . . . . . . . . . . . . . . . . . . . . . . . . . . . . 8
474
475
What was given to treat the diarrhea?
Anything else?
RECORD ALL MENTIONED.
RECOMMENDED HOME FLUID A PILL OR SYRUP B INJECTION C (I.V.) INTRAVENOUS. D HOME REMEDIES/
HERBAL MEDICINES, E
OTHER X (SPECIFY)
YES 1 NO 2
(SKIP TO 477) • I
PUBLIC SECTOR GOVT HOSP TAL/CLINIC/CHHC A RURAL HEALTH UNIT/
URBAN HEALTH CENTER B SARANGAY HEALTH STATION ____C COMM. HEALTH WORKER D OTHER PUBLIC
E (SPECIFY)
PRIVATE SECTOR PVT. HOSPITAL/CLINIC F PHARMACY G PRIVATE DOCTOR/MIDWIFE/
NURSE H STORE I INDUSTRY-BASED CLINIC J BOY SCOUTS/GIRL SCOUTS K JAYCEES L OTHER PRIVATE M
(SPECIFY)
RECOMMENDED HOME FLUID A PILL OR SYRUP B INJECTION C (I.V.) INTRAVENOUS D HOME REMEDIES/
HERBAL MEDICINES E
OTHER X (SPECIFY)
YES 1 NO 2
(SKIP TO 477) 9 I
PUBLIC SECTOR GOVT. HOS PITAL/CLINIC/CH HC ...A RURAL HEALTH UNIT/
URBAN HEALTH CENTER B BARANGAY HEALTH STATION C COMM. HEALTH WORKER D OTHER PUBLIC
E (SPECIFY)
PRIVATE SECTOR PVT. HOSPITAL/CLINIC F PHARMACY G PRIVATE DOCTOR/MIDWIFE/
NURSE H STORE I INDUSTRY-BASED CLINIC J BOY SCOUTS/GIRL SCOUTS K JAYCEES L OTHER PRIVATE M
(SPECIFY)
Did you seek advice or treatment for the diarrhea?
Where did you seek advice or treatment?
Anywhere else?
RECORD ALL MENTIONED.
476
477 GO BACK TO 451 IN NEXT COLUMN : GO BACK TO 451 IN NEXT COLUMN : OR, OR, IF NO MORE BIRTHS, GO TO 478 IF NO MORE BIRTHS, GO TO 478
32 250

NO.
478
QUESTIONS AND FILTERS
CHECK 472, ALL COLUMNS: NO CHILD RECEIVED ORS PREPARATION
483
I CODING CATEGORIES
(ORESOL/HYDR,TE)
Have you ever heard of a special product called ORESOL or HYDRITE you can get for the treatment of diarrhea?
ANY CHILD RECEIVED ORS PREPARATION I I (ORESOL/HYDRITE)
SKIP
481
479 YES . . . . . . . . . . . . . . . . . . . . . . . . . . . . . . . . . . . . . . . . . . . . . 1 • 481 N O . . . . . . . . . . . . . . . . . . . . . . . . . . . . . . . . . . . . . . . . . . . . . . 2
480 Have you ever seen packets like these before? YES 1 SHOW ORESOL PACKET OR HYDRITE TABLET. . NO . . . . . . . . . . . . . . . . . . . . . . . . . . . . . . . . . . . . . . . . . . . . . . 2 . != 485
481 Have you ever prepared a solution with one of these packets/tablets or YES, ORESOL 1 any other ORS for yourself or someone else to treat diarrhea? YES, HYDRITE OR OTHER ORS 2 " ~"1. 484
SHOW ORESOL PACKET OR HYDRITE TABLET. NO 3 -
482 The last time you prepared the ORESOL solution, did you use the whole WHOLE PACKET AT ONE TIME 1 ~acket at one time or only part of the packet? PART OF THE PACKET 2 • 484
484
How much water did you use to prepare ORESOL the last time you made it?
Where can you get a packet/tablet of ORS like ORESOL, HYDRITE?
PROBE: Anywhere else?
RECORD ALLMENTIONED.
I When a child has diarrhea, should he/she be given the same amount to drink as before the diarrhea, or more, or less, or not given anything to
' drink at all?
When a child has diarrhea, should he/she be given the same amount to eat as before the diarrhea, or more, or less, or not given any thing to eat at all?
½ LITER 1 1 LITER 2 1 ½ LITERS 3 2 LITERS 4 FOLLOWED INSTRUCTIONS ON
PACKAGE. 5 OTHER 6
(SPECIFY) DON'T KNOW . . . . . . . . . . . . . . . . . . . . . . . . . . . . . . . . 8
PUBLIC SECTOR GOVT. HOSPITAUCLINIC/CHHC A
RURAL HEALTH UNIT/
URBAN HEALTH CENTER B
BARANGAY HEALTH STATION C
COMM. HEALTH WORKER D
OTHER PUBLIC E
(SPECIFY)
PRIVATE SECTOR
PVT. HOSPITAL/CLINIC F
PHARMACY G
PRIVATE DOCTOPJMIDWIFE/
NURSE H
STORE I INDUSTRY-BASED CLINIC J
BOY SCOUTS/GIRL SCOUTS K
JAYCEES L
OTHER PRIVATE M
(SPECIFY)
SAME 1 MORE 2 LESS 3 NOTHING 4 DON'T KNOW . . . . . . . . . . . . . . . . . . . . . . . . . . . . . . . . 8
SAME 1 MORE 2 LESS 3 NOTHING 4 DON'T KNOW . . . . . . . . . . . . . . . . . . . . . . . . . . . . . . . . 8
485
486
I
251 33

NO.
487
488
QUESTIONS AND FILTERS
When a child is sick with diarrhea, what signs of the illness would tell you that he or she should be taken to a health facility or health worker?
RECORD ALL MENTIONED.
When a child is sick with a cough, what signs of the illness would tail you that he or she should be taken to a health facility or health worker?
RECORD ALL MENTIONED.
CODING CATEGORIES
REPEATED WATERY STOOLS.__ ANY WATERY STOOLS REPEATED VOMITING ANY VOMITING D BLOOD IN STOOLS E FEVER F MARKED THIRST G NOT EATING/NOT DRINKING WELL... H GETTING SiCKEPJVERY SICK I NOT GETTING BETTER 3
OTHER X (SPECIFY)
• DON'T KNOW . . . . . . . . . . . . . . . . . . . . . . . . . . . . . . . . . Z ,
FAST BREATHING A DIFFICULT BREATHING B NOISY BREATHING C FEVER D UNABLE TO DRINK E NOT EATING/NOT DRINKING WELL .F GETTING SICKEPJVERY SICK G PERSISTENT COUGH H NOT GETTING BETTER I OTHER X
(SPECIFY) . DON'T KNOW . . . . . . . . . . . . . . . . . . . . . . . . . . . . . . . . . Z .
SKIP
A B C
REMARKS:
34 252

NO, QUESTIONS AND FILTERS
501 PRESENCE OF OTHERS AT THIS POINT.
S E C T I O N 5 . M A R R I A G E
502 Are you currently married or living with a man?
503 Do you currently have a regular sexual partner, an occeslonal sexual ~artner, or no sexual partner at all?
504 Have you ever been married or lived with a man?
505
506
ENTER "0" IN COLUMN 3 OF CALENDAR IN THE MONTH OF INTERVIEW
AND IN EACH MONTH BACK TO JANUARY 1993
What is your marital status now: are you widowed, divorced, or separated?
507 Is your husband/partner staying with you now or is he staying elsewhere?
508 During the last four weeks, how many days were you and your husband/partner apart?
509 Have you been married or lived with a man only once, or more than once?
510
511
512
513
5t4
In what month and year did you start living with your (first) husband/partner?
How old were you when you started living with him?
CHECK 509:
MARRIED OR LIVED WITH A [ ~ MAN MORE THAN ONCE
CODING CATEGORIES SKIP
YES NO CHILDREN UNDER 10 1 2 HUSBAND/PARTNER 1 2 OTHER MALES 1 2
• OTHER FEMALES . . . . . . . . . . . . . . . . . . . 1 2 .
YES, CURRENTLY MARRIED 1 - - " 1 YES, LIVING WITH A MAN 2 " J'l~ 507
NO, NOT IN UNION 3
REGULAR SEXUAL PARTNER 1
OCCASIONAL SEXUAL PARTNER 2
NO SEXUAL PARTNER 3
YES, FORMERLY MARRIED 1 - - "-I~ 506 YES, LIVED WITH A MAN.. 2 - - -'1~ 509
. . . . . . . . . . . . . . . . . . . . . . . . . . . . 3 , N O . . . . . . . . . . . . . . . . . . . .
P' 5 1 6
WIDOWED 1-- " 1 DIVORCED 2- - ~ 509 SEPARATED 3---
STAYING WITH HER 1
STAYING ELSEWHERE 2
! DAYS
ONCE 1
MORE THAN ONCE 2
MONTH
DK MONTH 98
YEAR I I I I I---'512 . DK YEAR ................................ 9995 .
AGE ~
MARRIED OR UVED I I" "-1~" 515 WITH A MAN ONLY ONCE
MONTH
DK MONTH 98
YEAR I I I I---'515 . DK YEAR ................................ 9998 .
AGE ~
In what month and yeardid you startliving with yourcerren~last husband/partner?
How old were you when you started living with him?
253 35

515 DETERMINE MONTHS MARRIED OR IN UNION SINCE JANUARY 1993. ENTER"X" IN COLUMN 3 OF CALENDAR FOR EACH MONTH MARRIED OR IN UNION, AND ENTER"^"'0 FOR EACH MONTH NOT MARRIED/NOT IN UNION, SINCE JANUARY t993.
516
FOR WOMEN WITH MORE THAN ONE UNION: PROBE FOR STARTING AND TERMINATION DATES OF ANY PREVIOUS UNIONS.
FOR WOMEN NOT CURRENTLY IN UNION: PROBE FOR DATE WHEN LAST UNION STARTED AND FOR TERMINATION DATE AND, IF APPROPRIATE, FOR THE STARTING AND TERMINATION DATES OF ANY PREVIOUS UNIONS.
Now I need to ask some details about your sexual activity (if ever) in order to gain a better understanding of some family planning issues. TIMES . . . . . . . . . . . . . . . . . . . . . . . . . . . . . .
NEVER HAD SEXUAL INTERCOURSE . . . . . . . . . . . . . . . . . . . . . . . . . . . 90 HOW many times (if ever) did you have sexual intercourse in the last four ID 601
weeks?
517 How many times in a month do you usually have sexual intercourse? TIMES . . . . . . . . . . . . . . . . . . . . . . . . . . . . . .
518 When was the last time you had sexual intercourse? DAYS AGO . . . . . . . . . . . . . . . . . . . . . . 1
WEEKS AGO .. . . . . . . . . . . . . . . . . . . 2
MONTHSAGO . . . . . . . . . . . . . . . . . 3
YEARS AGO . . . . . . . . . . . . . . . . . . . . 4
BEFORE LAST BIRTH . . . . . . . . . . . . . . . . . . . 996
F""'[-'--I 5t 9 How old were you when you first had sexual intercourse? AGE . . . . . . . . . . . . . . . . . . . . . . . . . . . . . . . . . I I I
FIRST TIME WHEN MARRIED ... . . . 96
520 How old were you when you had your first menstrual period? AGE . . . . . . . . . . . . . . . . . . . . . . . . . . . . . . . . . I I I
36 254

SECTION 6. FERTIL ITY P R E F E R E N C E S
NO. QUESTIONS AND FILTERS CODING CATEGORIES SKIP
'601 CHECK 316: NEITHER I HEORSHE ~ - I _
STERILIZED STERILIZED P 614
602
603
CHECK 236:
NOT PREGNANT OR I UNSURE P R E G N A N T - - - - ]
Now I have some questions about the future.
Would you like to have (a/another) child, or would you prefer not to have any (more) children?
NOW I have some questions about the future.
After the child you are expecting now, would you like to have another child, or would you prefer not to have any more children?
CHECK 236:
NOT PREGNANT OR I UNSURE PREGNANT [ ~ ]
~ ,
How long would you like to wait from After the child you are expecting now before the birth of (a/another) child?
604 C .ECK236: NOT PREGNANT OR
UNSURE
605
now, how long would you like to wait before the birth of another child?
HAVE (NANOTHER) CHILD 1
NO MORE/NONE 2- -
SAYS SHE CAN'T GET PREGNANT__._.3--
UNDECIDED/DON'T KNOW 8--
M O N T H S . 1
YEARS 2
r ' - - ' - - -
I
SOON/NOW 993-- SAYS SHE CAN'T GET PREGNANT 9 9 4 - AFTER MARRIAGE 995 OTHER 996
(SPECIFY) • DON'T KNOW .... . . . . . . . . . . . . . . . . . . . . . . . . . . 998 .
PREGNANT
604
606
604
1606
I-l- If you became pregnant in the next few weeks, would you be happy, unhappy, or would it not matter very much?
607
HAPPY 1 UNHAPPY 2
. WOULD NOT MATTER ...................... 3 .
606 CHECK 315: USING A METHOD? / NOT CURRENTLY CURRENTLY
USING US NG OR 315 NOT ASKED OR 315 ASKED
607 Do you think you will use a method to delay or avoid pregnancy within the next 12 months?
YES 1 - NO 2
• DON'T KNOW .... . . . . . . . . . . . . . . . . . . . . . . . . . . . . . 8 .
" ~ 614
- t~ 609
608 Do you think you will use a method to delay or avoid pregnancy at any time YES 1 in the future? NO 2 - - 7
• DON'T KNOW .... . . . . . . . . . . . . . . . . . . . . . . . . . . . . . 8 --. J l~ 612
255 37

NO,
609
610
611
QUESTIONS AND FILTERS
Which method would you prefer to use?
WouJd you be willing to pay for (METHOD)?
How much would you be willing to pay for (METHOD) (Including all costs)?
P 10? P 20? P 25? P 30? P 50? P 76? P 100? P 150? P 200? P 300? P 500? P 750? P 1000? P 1600? P 2000? P 3000? More then P3000?
IF "YES", CONTINUE WITH THE NEXT AMOUNT.
I= IF "NO", SKIP TO 614.
CODING CATEGORIES SKIP
PILL 01 IUD 02 INJECTIONS 03 CONDOM 04 FEMALE STERILfZATION. 05 MALE STERILIZATION .66 CALEN DAPJRHYTHM/PERIODIC
ABSTINENCE 0 7 - M UCUS/BILL[NGS/OVULATION .. . . . . . . .08- BASAL BODY TEMPERATURE 0 9 - SYMPTOTHERMAL 1 0 - LACTATIONAL AMENORRHEA
METHOD (LAM). 1 1 - "1~614 BREASTFEEDING 1 2 - WITHDRAWAL . . . . . . . . . . . . 1 3 - OTHER 9 6 -
(SPECIFY) • UNSURE . . . . . . . . . . . . . . . . . . . . . . . . . . . . . . . . . . . . . .98-.
YES 1 NO : .2.-- " ~
, DON'T KNOW . . . . . . . . . . . . . . . . . . . . . . . . . . . . . . . . 8-- . " 614
YES NO P10 1 2 P20 1 2 P25 1 2 P30 ..... 1 2 P50 ......... 1 2 P75 1 2 P100 1 2 P150 1 2 P200 1 2 P300 1 2 PSO0 1 2 P750 1 2 P1000 1 2 P1500 1 2 P2000 1 2 P3O00 1 2 More than P300O 1 " I 2
I
614
r
38 256

NO.
612
613
614
6 1 5
QUESTIONS AND FILTERS
What is the main reason that you think you will never use a method?
Would you ever use a method if you were married?
CHECK 221: HASUVINGCHtLDRENIINOUV'NGCHILOREN ~
If you could go back to the time you you did not have any children and could choose exactly the number of children to have in your whole life, how many would that be?
If you could choose exactly the the number of children to have in your whole life, how many would that be?
PROBE FOR A NUMERIC RESPONSE.
How many of these children would you like to be boys, how many would you like to be girls and for how many would it not matter?
CODING CATEGORIES
NOT CURRENTLY MARRIED ..11
FERTILITY-RELATED REASONS INFREQUENT SEX .21 - MENOPAUSAL/HYSTERECTOMY.22 -
SUBFECUND/INFECUND ..23 - WANTS MORE CHILDREN 2 4 -
OPPOSITION TO USE RESPONDENT OPPOSED HUSBAND OPPOSED OTHERS OPPOSED RELIGIOUS PROHIBITION
LACK OF KNOWLEDGE KNOWS NO METHOD KNOWS NO SOURCE
METHOD-RELATED REASONS HEALTH CONCERNS FEAR OF SIDE EFFECTS LACK OF ACCESS/TOO FAR COST TOO MUCH INCONVENIENT TO USE INTERFERES WITH BODY'S
NORMAL PROCESSES
OTHER (SPECIFY)
• DON'T KNOW_ . . . . . . . . . . . . . . . . . . . . . . . . . . . . . . 98 - .
YES 1 NO 2 DON'T KNOW 8
NUMBER
OTHER 96--
(SPECIFY)
BOY8
NUMBER
OTHER 96 (SPECIFY)
GIRLS
NUMBER F ~
OTHER 96 (SPECIFY)
EITHER
NUMBER
OTHER 96 (SPECIFY)
SKIP
..31 - 3 2 - 3 3 -
• .34 -
I b 6 1 4
4 t - ..42 -
5 1 - .52 -
• . 5 3 -
. 5 4 -
• 5 5 -
. 5 6 -
9 6 -
616
257 39

NO.
616
617
618
QUESTIONS AND FILTERS
Would you say that you approve or disapprove of couples using a method to avoid getting pregnant?
Is it acceptable or not acceptable to you for information on family planning to be provided:
On the radio? On the television?
In the last few months have you heard about family planning:
On the radio?
On the television?
In a newspaper or magazine?
From a poster?
From leaflets or brochures?
CODING CATEGORIES
APPROVE . . . . . . . . . . . . . . . . . . . . . . . . . . . . .
DISAPPROVE . . . . . . . . . . . . . . . . . . . . . . . .
NO OPINION
NOT ACCEPT- ACCEPT-
ABLE ABLE DK RADIO . . . . . . . . . . . . . . . . . . . . . . 1 2 8 TELEVISION . . . . . . . . . . . . . . 1 2 8
YES NO
RADIO . . . . . . . . . . . . . . . . . . . . . . . . . . . . . . . . . . 1 2
TELEVISION . . . . . . . . . . . . . . . . . . . . . . . . . . 1 2
NEWSPAPER OR MAGAZINE....1 2
POSTER . . . . . . . . . . . . . . . . . . . . . . . . . . . . . . . 1 2
LEAFLETS OR BROCHURES 1
619 Have you seen or heard the slogan "Kung sila'y mahal n'yo, magplano"? YES
NO., 620 What does this slogan mean? PRA PRACTICE FAMILY PLANNING
USE CONTRACEPTION ... . . . . . . .
OTHER
(SPECIFY)
621 In the last few months have you discussed the practice of family planning YES. with your friends, neighbors, or relatives? NO.
622 With whom? HUS
623
Anyone else?
RECORD ALL MENTIONED•
SKIP
1
2
3
2
1
2 ) 621
1
2
6
1
2 I= 623
C
D
E
F
G
H
701
1
2
8
1
2
3
1
2
3
8
CHECK 502: YES, CURRENTLY ~--] YES, I [
MARRIED LIVING WITH A MAN ~ r , v
624
HUSBAND/PARTNER._.
MOTHER . . . . . . . . . . . . . . . . . .
FATHER . . . . . . . . . . . . . . . . . . .
SISTER(S) . . . . . . . . . . . . . . . . .
BROTHER(S) . . . . . . . . . . . . .
DAUGHTER . . . . . . . . . . . . . . .
MOTHER-IN-LAW .... . . . .
FRIENDS/NEIGHBORS
OTHER
(SPECIFY)
NO, NOT IN UN'ONI ]
Spouses/partners do not always agree on everything. Now I want to ask you about your husband's/partner's views on family planning.
DO you think that your husband/partner approves or disapproves of couples using a method to avoid pregnancy?
APPROVES .....
DISAPPROVES
DON'T KNOW
625 How often have you talked to your husband/partner about family planning NEVER . . . . . . . . . . . . . . in the past year? ONCE OR TWICE.
MORE OFTEN .....
626 Do you think your husband/partner wants the same number of children that SAME N U M B E R ou want, or does he want more or fewer than you want? ~A~D= , "~ . r~D=~ MORE CHILDREN..
FEWER CHILDREN
DON'T KNOW
A
B
.C
G
X
40 258

NO.
701
702
703
704
705
SECTION 7, HUSBAND'S SACKGROUND, WOMAN'S WORK AND RESIDENCE
QUESTIONS AND FILTERS CHECK 502 AND 504:
C U R R E N T L Y . _ . _ ] FORMERLY I ~ MARRIED/ MARRIED/ - -
LIVING WITH LIVED WITH A MAN A MAN
How old was your husband/partner on his last birthday?
I CODING CATEGORIES
NEVER MARRIED AND NEVERIN UNION I I
L I
Did your (last) husband/partner ever attend school?
What was the highest grade/year he completed?
What (is/was) your (last) husband/partner's occupation?
That is, what kind of work (does/did) ha mainly do?
AGE
YES 1
. NO ............................................. 2 -
NO GRADE COMPLETED 00
ELEMENTARY GRADE 1 11 ELEMENTARY GRADE 2 12 ELEMENTARY GRADE 3 13 ELEMENTARY GRADE 4 14 ELEMENTARY GRADE 5 15 ELEMENTARY GRADE 6 16 ELEMENTARY GRADE 7 17
HIGH SCHOOL YEAR 1 21 HIGH SCHOOL YEAR 2 22 HIGH SCHOOL YEAR 3 23 H/GH SCHOOL YEAR 4 24 HIGH SCHOOL GRADUATE 25
POSTSECONDARY YEAR 1 31 POSTSECONDARY YEAR 2 OR MORE .32
1706 CHECK705: - - - ] I WORKS (WORKED) DOES (DID) NOT WORK
IN AGRICULTURE IN AGRICULTURE
I
COLLEGE YEAR 1 41 COLLEGE YEAR 2 42 COLLEGE YEAR 3 43 COLLEGE YEAR 4 44 COLLEGE YEAR 5 45 COLLEGE YEAR 6 OR HIGHER 46 COLLEGE GRADUATE 47
POST-BACCALAUREATE 51 . DON'T KNOW ............................... 98
707 (Does/did) your husband/partner work mainly on his own land
or on family land,
or (does/did) he rent land,
or (does/did) he work on someone else'e land?
HIS LAND 1
FAMILY LAND 2
RENTED LAND 3
SOMEONE ELSE'S LAND 4
NOT APPLICABLE 5
SKIP
• 703
--1~708
~ 0 5
• 708
708 Now I would like to ask you some questions about your work. YES 1 - - --~" 711
Aside from your own housework, a r e you currently working? NO 2
709 As you know, some women take up jobs for which they are paid in cash or kind. Others sell things, have a small business or work on the family farm or in the family business.
YES 1 - " ~ 711 Are you currently doing any of these things or any other work? NO 2
259 41

NO. QUESTIONS AND FILTERS
710 Have you done any work in the last 12 months?
711
712
I 713
714
715
716
717
What is your occupation, that is, what kind of work do (did) you mainly do?
CODING CATEGORIES
YES . . . . . . . . . . . . . . . . . . . . . . . . . . . . . . . . . . . . . . . . . . . . . 1
NO . . . . . . . . . . . . . . . . . . . . . . . . . . . . . . . . . . . . . . . . . . . . . . 2 ' -
i-r-q CHECK 711:
WORKS (WORKED) r ~ DOES (DID) NOT WORK F"-" ] IN AGRICULTURE l I [N AGRICULTURE I I
Do you work mainly on your own land
or on family land,
or do you rent land
or work on someone else's land?
Are you employed (as paid or unpaid worker) by a member of your family,
or are you self-employed,
or are you employed by someone else?
Do you usually work throughout the year,
or do you work seasonally,
or only once in a while?
During the last 12 months, how many months did you work?
During the last 12 months, how many days a week did you usually work n the months that you worked) ?
OWN LAND . . . . . . . . . . . . . . . . . . . . . . . . . . . . . . . . . . . 1
FAMILY LAND . . . . . . . . . . . . . . . . . . . . . . . . . . . . . . . . 2
RENTED LAND . . . . . . . . . . . . . . . . . . . . . . . . . . . . . . . 3
SOMEONE ELSE'S LAND .. . . . . . . . . . . . . . . . . 4
NOT APPLICABLE . . . . . . . . . . . . . . . . . . . . . . . . . . . 5
BY FAMILY MEMBER . . . . . . . . . . . . . . . . . . . . . . . 1
SELF-EMPLOYED . . . . . . . . . . . . . . . . . . . . . . . . . . . 2
BY SOMEONE ELSE . . . . . . . . . . . . . . . . . . . . . . . . 3
THROUGHOUT THE YEAR 1 ' -
SEASONALLY/PART OF THE YEAR....2
ONCE INAWHILE . . . . . . . . . . . . . . . . . . . . . . . . . . . 3 . -
NUMBEROFMONTHS .... . . . . .
NUMBER OF DAYS . . . . . . . . . . . . . . . . . . . ] ' ~ -
SKIP
]D 726
I- 714 I
ID 717
718
719
718 During the last 12 months, approximately how many days did you work? NUMBER OF DAYS
719 Do you earn cash for your work? YES . . . . . . . . . . . . . . . . . . . . . . . . . . . . . . . . . . . . . . . . . . . . . 1
PROBE: Do you make money for working? NO . . . . . . . . . . . . . . . . . . . . . . . . . . . . . . . . . . . . . . . . . . . . . . 2 ~ 722
720
721
How much do you usually earn for this work?
PROBE: Is this by the hour, by the day, by the week, by the month or by the year?
CHECK 602: No, D
CURRENTLY MARRIED NOT IN UNION YES,
LIVING WITH A MAN
Who mainly decides how the money you earn will be used: you, someone else, or you and someone else jointly?
PER HOUR...1
PER D A Y . . 2
PER WEEK.__3
PER MONTH.4
PER YEAR. .5
OTHER
(SPECIFY)
999996
RESPONDENT DECIDES . . . . . . . . . . . . . . . . . . 1
HUSBAND/PARTNER DECIDES ... . . . . . . . 2
JOINTLY WITH HUSBAND/PARTNER..3
SOMEONE ELSE DECIDES . . . . . . . . . . . . . . . 4
JOINTLY WITH SOMEONE ELSE .. . . . . . . 5
HOME . . . . . . . . . . . . . . . . . . . . . . . . . . . . . . . . . . . . . . . . . . 1
Who mainly decides how the money you earn will be used: you, your husband/partner, you and your husband/partner jointly, or someone else?
722 Do you usually work at home or away from home?
42 260

AWAY ........................................... 2
NO. QUESTIONS AND FILTERS 723 CHECK 222 AND 223: CHILD AGE 5 OR LESS LIVING AT HOME?
724 CHECK 708 AND 709:
725
726
727
728
CODING CATEGORIES SKIP
YEsrl NO5 ',2, ' t
CURRENTLY WORKING?
YESil NOG ,,2o ' r
RESPONDENT. 01
HUSBAND/PARTNER 02
OLDER FEMALE CHILD 03
OLDER MALE CHILD 04
OTHER RELATIVES . . . . . . . . 05
NEIGHBORS 0 6
FRIENDS. 07
SERVANTS/HIRED HELP 08
CHILD IS IN SCHOOL... 09
INSTITUTIONAL CHILD CARE 10
9 6
Who usually takes care of (NAME OF YOUNGEST CHILD AT HOME) while you are working?
OTHER
(SPECIFY)
Have you lived in only one barangay or in more than one barangay since ONE BARANGAY 1 January 1993? MORE THAN ONE
• BARANGAY ................................. 2 - - . ~ 728
IN COLUMN 4 OF CALENDAR, ENTER THE APPROPRIATE CODE FOR CURRENT BARANGAY, ("1" CITY, "2" TOWN/POBLACION, "3" BARRIO/RURAL AREA). BEGIN IN THE MONTH OF INTERVIEW AND CONTINUE WITH ALL PRECEDING MONTHS BACK TO JANUARY 1993.
THEN S K I P T O _ _
In what month and year did you move to (NAME OF CURRENT BARANGAY)?
IN COLUMN 4 OF CALENDAR, ENTER "X" IN THE MONTH AND YEAR OF THE MOVE. IN SUBSEQUENT MONTHS ENTER THE APPROPRIATE CODE FOR THE TYPE OF BARANGAY ("1" CITY, "2" TOWN/POBLACION, "3" BARRIO/RURAL AREA). CONTINUE PROBING FOR PREVIOUS BARANGAY, AND RECORD MOVES AND TYPE OF BARANGAY ACCORDINGLY•
ILLUSTRATWE QUESTIONS: • Where did you live before..,..? • In what month and year did you arrive there? • Is that place a city, a town/poblacion, or barrio/rural area?
801
261 43

SECTION 8. MATERNAL MORTALITY
NO.
801
802
803
QUESTIONS AND FILTERS
NOW I would like to ask you some questions about your brothers and sisters, that is, all of the children born to your natural mother, including those who are living with you, those living elsewhere and those who have died. How many children did your mother give birth to, including you?
CHECK 801: TWO OR MORE "1
BIRTHS / ONLY ONE BIRTH I ' m
(RESPONDENT) |
How many of these births did your mother hove before you were born?
CODING CATEGORIES
NUMBER OF BIRTHS TO
I I I NATURAL MOTHER
NUMBER OF PRECEDING BIRTHS
SKIP
I= 816
REMARKS:
44 262

804 What was the name given to your brother or sister from eldest to youngest?
[01] [02] [03] [04] [05] [06]
805 Is (NAME) male or female?
MALE 1 MALE 1 MALE 1 MALE 1 MALE 1 MALE 1
FEMALE 2 FEMALE 2 FEMALE 2 FEMALE 2 FEMALE 2 FEMALE 2
806 Is (NAME) still alive?
YES 1 YES 1 YES 1 YES 1 YES 1 YES 1
NO 2 NO . 2 NO .2 NO 2 NO 2 ; NO 2
GOTO80"6 ~-- I GOTO808~ ~-J GOTO808 ~ 1 GOTO808~I ~1 G O T O 8 0 8 ' J GOTO808~I "J
DK 8 DK 8 DK .8 DK .8 DK .8 DK ....... 8
GO TO I02] 4{'-I- GO TO [031 ~ GO TO [04] ~ GO TO [05] ~ GO TO [06] ~ - J GO TO [071
807
808
[--I--1 F--I--1 I--1--1 I--1--1 I--I--1 his/her last GO TO [02] GO TO [03] GO TO [04] GO TO [05] GO TO [06] GO TO [07] b-day?
In what year did (NAME) die?
DK 9998 DK 9998 DK .9998 DK 9998 DK 9998 DK 9998
809 aH°Wd ir ~(nNYAY~I ~r) s [ ~ [ ~ ~ [ ~ ] [ ~ die?
810
811
How old was (NAME) when he/she died?
Was (NAME) pregnant when she died?
1-71 1-1-1 I-I-1 l-T] IF MALE OR IF MALE OR IF MALE OR IF MALE OR IF MALE OR IF MALE OR DIED BEFORE DIED BEFORE DIED BEFORE DIED BEFORE DIED BEFORE DIED BEFORE 12 YEARS OF 12 YEARS OF 12 YEARS OF 12 YEARS OF 12 YEARS OF 12 YEARS OF AGE GO TO AGE GO TO [03] AGE GO TO [04] AGE GO TO [05] AGE GO TO i AGE GO TO [07] [021 [06] YES YES 1 YES 1 YES 1 YES YES 1
GOTO814 ~ GOTO814 ,~ I GOTO8144_I GOTO814 .il--J GOTO814 ~ GOTO814
NO 2 NO 2 NO 2 NO 2 NO 2 NO ........ 2
812 Did (NAME) die YES YES 1 YES 1 YES 1 YES YES 1 duringehildbirth? G O T O 8 1 5 4 _ I GOTO8151f. I G O T O S / 5 4 J GO TO 815 ,~.-J GOTO8t5,4F-J GO TO 815 ~.--I
NO 2 NO 2 NO 2 NO 2 NO 2 NO 2
Did (NAME) die within two YES YES 1 YES 1 YES 1 YES YES 1 months after the end of a
NO 2 NO 2 NO 2 NO 2 NO. 2 NO 2 pregnancy or childbirth? GO TO 815 41.J G O T O 8 1 5 , ~ GO TO 815 ~I-J GO TO 815 ,11-J GO TO 815 .~I-J GO TO 815.qI.~J
Was her death
due to YES 1 YES 1 YES 1 YES 1 YES 1 YES 1 complications of pregnancy or NO 2 NO ............... 2 NO 2 NO 2 NO 2 NO 2 childbirth? DK 8 DK .__8 DK ............... 8 DK 8 DK 8 DK 8
813
814
1815 How many
F-I--1 F-T--] [--71 I--I--] birth to during GO TO [02] GO TO [03] GO TO [04] GO TO [05] GO TO [08] GO TO [07] her lifetime?
IF NO MORE BROTHERS OR SISTERS. GO TO 816
263 45

804 What was the name given to your brother or sister from eldest to youngest?
[071 [08] [091 [1 O] [11] [12]
805
806
807
808
is (NAME) male or femare?
MALE 1 MALE 1 MALE
FEMALE 2 FEMALE 2 FEMALE.
Is (NAME) still alive?
1 MALE 1 MALE 1 MALE 1
2 FEMALE.. 2 FEMALE ........ 2 FEMALE 2
How old is (NAME) on hi/her last birthday?
In what year did (NAME) die?
YES 1 YES 1 YES 1
NO 2 NO 2 NO 2
GO TO 808 ~1-1 GO TO 8 0 8 ~ I GO TO 8 0 8 ~ I
DK 8 DK 8 DK 8 GO TO [06]: I GO TO [09]~ J GO TO [10]~ -'1
GO TO [08] GO TO [091 GO TO [101
GO TO 810 ~ GO TO 810 + '
DK . . . . . . . . . . . . 999~ DK 9998 DK 9998
YES 1 YES 1 YES 'i
NO 2 NO 2 NO 2
GO TO 8084 - I GO TO 808~1 ' - I GO TO 800 4 I
DK 8 DK 8 DK 8 ! GO TO [ i ' i ] ~ I GO TO [12~4 - j GO TO [ 1 3 ] ~ j
GO TO [111 GO TO [12] GO TO [131
DK 9998 DK 9998 DK 9998
809
810
How many years ago did (NAME) I I I die?
How old was (NAME) when I I I he/she died? iF MALE OR
DIED BEFORE 12 YEARS OF AGE GO TO 108)
i-FI FI-] I-I-I I-T) I-T) F]-I 13-1
IF MALE OR IF MALE OR IF MALE OR IF MALE OR IF MALE OR DIED BEFORE DIED BEFORE 12 DIED BEFORE DIED BEFORE DIED BEFORE 12 YEARS OF YEARS OF AGE 12 YEARS OF 12 YEARS OF 12 YEARS OF
AGE GO TO [09 ] GOTO[10] AGE GO TO [11] AGE GO TO [121 AGE GO TO [13]
811 Was (NAME) YES YES 1 YES 1 YES 1 YES YES 1 pregnantwhen GOTO814 ~ GOTO814 4 I GO TO 814 ~I.-I GO TO 814 41--J GO TO 814 .4.--I GO TO 814 ~--J she died?
NO z NO 2 NO 2 NO 2 NO NO 2
812 Did (NAME) die YES YES 1 YES 1 YES 1 YES YES 1 duringehiIdbirth? GO TO 818 ,4_.J GO TO 815 ~I_J GOTO8t5~I._I GO TO 815 ~I_J GO TO 815 ~I_..J GO TO 815 ~I.J
NO NO 2 NO 2 NO 2 NO NO 2
Did (NAME) die within two YES YES 1 YES 1 YES 1 YES YES 1 months after the end of a
NO ,= NO 2 NO 2 NO 2 NO ,~ NO 2 pregnancy or childbirth? GOTO815 ~ GOTO815 ~--J GOTO8t5 4 I GOTO815 ~ GOTO815 4--[ GOTO815 4 J
813
814
815
Was her death due to YES .............. YES 1 YES 1 YES 1 YES [YES 1 complications of pregnancy or NO NO 2 NO 2 NO 2 NO 2 NO 2 childbirth? DK DK 8 DK 8 DK 8 DK 8 DK 8
HOW many
~Nh ildMeE~ dJ idve ~ l ~ I ~ ~ m - ~
birth to during GO TO [08] GO TO [09] GO TO [10] GO TO [11] GO TO [t2] GO TO [13] her lifetime?
816 RECORD THE TIME ENDED. HOUR
MINUTES
46 264

ONLY ONE CODE SHOULD APPEAR IN ANY BOX. FOR COLUMNS 1, 3, AND 4, ALL MONTHS SHOULD BE FILLED IN.
INFORMATION TO BE CODED FOR EACH COLUMN
COL.1: Births, Pregnancies, Contraceptive Use
B BIRTHS P PREGNANCIES T TERMINATIONS
0 NO METHOD 1 PILL 2 IUD 3 INJECTIONS 4 CONDOM 5 FEMALE STERILIZATION 6 MALE STERILIZATION 7 CALENDAR~RHYTHM/PERIODIC ABSTINENCE 8 MUCUS/BILLINGS/OVULATION 9 BASAL BODY TEMPERATURE A SYMPTOTHERMAL E LACTATIONAL AMENORRHEA METHOD C BREASTFEEDING D WITHDRAWAL X OTHER
(SPECIFY)
COL.2: Discontinuation of Contraceptive Use
0 INFREQUENT SEX/HUSBAND AWAY/OLD 1 BECAME PREGNANTWHILE USING 2 WANTEDTO BECOME PREGNANT 3 HUSBAND DISAPPROVED 4 WANTED MORE EFFECTIVE METHOD 5 HEALTH CONCERNS 6 SIDE EFFECTS 7 INACCESSIBLE/U NAVAILABLE 8 COSTTOO MUCH 9 INCONVENIENTTO USE F FATALISTIC A DIFFICULTTO GET PREGNANT/
HYSTERECTOMY/MENOPAUSE D MARITAL DISSOLUTION/SEPARATION X OTHER
(SPECIFY) Z DON'T KNOW
COL3: Marriage/Union
X IN UNION (MARRIED OR LIVING TOGETHER) 0 NOT IN UNION
COLA: Moves and Types of Barangsy
X CHANGE OF BARANGAY 1 CITY 2 TOWN/POBLACION 3 BARRIO/RURAL AREA
t 9 9 8
1 9 9 7
1 9 9 6
1 9 9 5
1 9 9 4
1 9 9 3
12 DEC 1f NOV 10 OCT 09 SEP 08 AUG 07 JUL 06 JUN 05 MAY 04 APR 03 MAR 02 FEB 01 JAN 12 DEC 11 NOV 10 OCT 09 SEP 08 AUG 07 JUL 06 JUN 05 MAY 04 APR 03 MAR 02 FEB 01 JAN 12 DEC 11 NOV 10 OCT 09 SEP 08 AUG 07 JUL 06 JUN 05 MAY 04 APR 03 MAR 02 FEB 01 JAN 12 DEC 1'i NOV 10 OCT 09 SEP 08 AUG 07 JUL 06 JUN 05 MAY 04 APR 03 MAR 02 FEB 01 JAN 12 DEC 11 NOV 10 OCT 09 SEP 08 AUG 07 JUL 06 JUN 05 MAY 04 APR 03 MAR 02 FEB 01 JAN 12 DEC 11 NOV 10 OCT 09 SEP 08 AUG 07 JUL 06 JUN 05 MAY 04 APR 03 MAR 02 FEB 01 JAN
01 02 03 04 O5 06 07 O8 09 10 ' t l 12 13 14 15 16 17 18 19 20 2t 22 23 24 25 26 27 28 29 30 31 32 33 34 35 36 37 38 39 4O 41 42 43 44 45 46 47 48 49 5O 5t 52 53 54 55 56 57 58 59 6O 61 62 63 64 65 66 67 68 69 70 71 72
01 DEC 02 NOV 03 OCT 04 SEP 05 AUG 06 JUL 07 JUN 08 MAY 09 APR 10 MAR 11 FEB 12 JAN 13 DEC 14 NOV 15 OCT 16 SEP 17 AUG 18 JUL 19 JUN 20 MAY 21 APR 22 MAR 23 FEB 24 JAN 25 DEC 26 NOV 27 OCT 28 SEP 29 AUG 30 JUL 31 JUN 32 MAY 33 APR 34 MAR 35 FEB 36 JAN 37 DEC 38 NOV 39 OCT 40 SEP 41 AUG 42 JUL 43 JUN 44 MAY 45 APR 46 MAR 47 FEB 48 JAN 49 DEC 50 NOV 51 OCT 52 SEP 53 AUG 54 JUL 55 JUN 56 MAY 57 APR 58 MAR 59 FEB 60 JAN 61 DEC 62 NOV 63 OCT 64 SEP 65 AUG 66 JUL 67 JUN 68 MAY 69 APR 70 MAR 71 FEB 72 JAN
1 g
9 8
1 9 9 7
1 9 9 6
1 9 9 5
1 9 9 4
1 9 9 3
265

INTERVIEWER'S OBSERVATIONS To be filled in after completing interview
Comments about Respondent:
Comments on Specific Questions:
Any other Comments:
SUPERVISOR'S OBSERVATIONS
Name of Supervisor: Date:
EDITOR'S OBSERVATIONS
Name of Editor: Date:
48 266

NDHS Form 3 NSCB Approval No. NSO-9721-03 Expires June 30, 1998
Republic of the Philippines NATIONAL STATISTICS OFFICE
1998 NATIONAL DEMOGRAPHIC AND HEALTH SURVEY HEALTH MODULE
Confidentiality: This survey is authorized by Commonwealth Act No. 591. All information is stdctly confidential
IDENTIFICATION
PROVINCE
CITY/MUNICIPALITY
BARANGAY I
URBAN/RURAL(URBAN=l, RURAL=2) ..........................................................................
NDS SAMPLE NUMBER .......................................................................................... j.
HOUSEHOLD CONTROL NUMBER ..............................................................................
NDHS HOUSEHOLD SEQUENTIAL NUMBER ..................................................................
ADDRESS
I NAME AND LINE NUMBER OF RESPONDENT
INTERVIEWER VISITS
DATE
INTERVIEWER'S NAME
i RESULT*
NEXT VISIT: DATE
TIME
1 2 3 FINAL VISIT
~7:~ ~7 ~ ~ ~:~ ~ ~ ~C~ ~
RESULT CODES: * 01 COMPLETED, ORIGINAL HOUSEHOLD 02 COMPLETED, PRESENT OCCUPANT OF DWELLING 93 NO HOUSEHOLD MEMBER AT HOME OR NO COMPETENT RESPONDENT AT
AT TIME OF VISIT 04 ENTIRE HOUSEHOLD ABSENT FOR EXTENDED PERIOD OF TIME 05 POSTPONED 06 REFUSED 97 DWELLING VACANT OR ADDRESS NOT A DWELLING 08 DWELLING DESTROYED 09 DWELLING NOT FOUND 10 OTHER
HOME
(SPECIFY)
DAY
MONTH
YEAR 1 9 9 8
INT. CODE
RESULT*
TOTAL NO.
OF VISITS [ ]
TIME OF INTERVIEW
TIME STARTED
TIME ENDED
HOUR ........ ~
MINUTES .... ~
r ~ LANGUAGE OF QUESTIONNAIRE**
LOCAL LANGUAGE OF RESPONDENT** [ ]
**LANGUAGE CODES 1 TAGALOG 3 ILOCANO 2 CEBUANO 4 SICOL
LANGUAGE OF INTERVIEW**
TRANSLATOR USED
5 HILIGAYNON 7 ENGLISH 6 WARAY
SUPERVISOR FIELD EDITOR
NAME ~ NAME
DATE DATE
[] YES ........... 1 NO ........... 2
8 OTHER (SPECIFY)
OFFICE EDITOR KEYED BY
267

NO.
1
2
3
4
SECTION A. ENVIRONMENTAL HEALTH
QUESTIONS AND FILTERS
How does yourhousehold usually dispose of garbage?
How frequently is the garbage usually collected/disposed?
CODING CATEGORIES
GARBAGE TRUCK/CART COLLECTION
INDIVIDUAL OPEN DUMPING
INDIVIDUAL BURNING
COMPOSTING
INDIVIDUAL BURYING
FEEDING TO DOMESTIC ANIMALS
DUMPING INTO LOW LAND AREA
OTHERS, SPECIFY
EVERYDAY
ONCE IN TWO DAYS
'ONCE OR TWlCE A WEEK
OTHERS, SPECIFY
SKIP
I
2
3
4
5
I
2
3
4
IS THERE A GARBAGE OR TRASH AROUND THE HOUSE OR YARD THAT ATTRACTS FLIES?
Does your household regularly buy cooked food
from...
Ambulant vendors?
Carinderia?
Restaurants?
ENCIRCLE "1 ," IF YES AND "2," IF NO.
YES 1
• NO ............................................................ 2 .
YES NO
Ambulant vendors 1 2
Carinderia 1 2
Restaurants 1 2
2 268

2
T
SECTION B. HEALTH FACILITY UTILIZATION
During the last 6 months, did you visit a health facility?
YES ........ 1 NO ........... 2 "~ SKIP TO SECTION C _.t
What type of health facility did you visit? READ EACH FACILITY TO THE RESPONDENT. ENCIRCLE "1" IF THE RESPONDENT UTILIZED THE FACILITY. OTHERWISE, ENCIRCLE "2".
FOR COLS. 1,4,7 ASK: When you visited (FACILITY)
Regional Hospital
1 2 "~ SKIP TO NEXT FACILITY
SATIS- SERVICE I FLED/ AVAILED what type of service did you utilize?
FOR COLS. 2,5,8 ASK: Were you satisfied or dissatisfied with the service?
FOR COLS. 3,6,9 ASK: Why were you satisfied or dissatisfied with the service?
TYPE OF SERVICE AVAILED (1)
READ EACH SERVICE TO THE RESPONDENT
A. Treatment when ill or 1 2 injured
B. Routine Check-ups 1 2
C. Laboratory Services 1 2
D. Immunization 1 2
E. Family Planning 1 2
F. Health and Nutrition 1 2 Education
G. Prenatal, Delivery and 1 2 Postnatal ~,
1 2 H. Others
(SPECIFY)
Provincial Hospital
2 "~" SKIP TO NEXT
FACILITY
REASONS*
(3)
REASONS* I AVAILEDSERVICE
District Hospital
2 -I~ SKiP TO NEXT
FACILITY
1 2
1 2
1 2
1 2 ECC]
I -C1 2
T T - C I 2
r- i- i - i 2
i- i-71
*CODES FOR REASONS FOR SATISFACTION/DISSATISFACTION (DO NOT READ TO RESPONDENT)
REASONS*
(9)
£:EE]
AVAILABILITY OF MEDICINE . . . . . . . . . . . . . . . . . . . . . . . . . . . . . . . . . . . . . . . . . . . . . . . . . . . . . . . A POTENCY/EFFECTIVITY OF MEDICINES GIVEN . . . . . . . . . . . . . . . . . . . . . . . . . . . . . B ADEQUACY OF HEALTH EQUIPMENT AND OTHER FACILITIES ... . . . . . . . C AVAILABILITY AND ACCESSABILITY OF HEALTH PERSONNEL .. . . . . . . . . D HEALTH PERSONNEL APPROACHABILITY . . . . . . . . . . . . . . . . . . . . . . . . . . . . . . . . . . . . E TECHNICAL COMPETENCY OF HEALTH PERSONNEL . . . . . . . . . . . . . . . . . . . . . F COURTEOUSNESS OF HEALTH CARE FACILITY STAFF . . . . . . . . . . . . . . . . . . . G CHARGES FOR SERVICES OR MEDICINES . . . . . . . . . . . . . . . . . . . . . . . . . . . . . . . . . . . . H IMPORTANCE GIVEN TO PATIENTS' RIGHT IN HEALTH CARE .. . . . . . . . . . I AVAILABILITY/QUALITY OF LINENS/BEDDINGS . . . . . . . . . . . . . . . . . . . . . . . . . . . . . . J AVAILABILITY/QUALITY OF FOOD . . . . . . . . . . . . . . . . . . . . . . . . . . . . . . . . . . . . . . . . . . . . . . . K AVAILABILITY OF SERVICE . . . . . . . . . . . . . . . . . . . . . . . . . . . . . . . . . . . . . . . . . . . . . . . . . . . . . . . . L OTHERS, SPECIFY X
269

SECTION B. HEALTH FACILITY UTILIZATION
Municipal Hospital
2 ~" SKIP TO NEXT
FACILITY
Rural Health Unit
1 2 "~" SKIP TO NEXT FACILITY
Barangay Health Station
1 2 "lb SKIP TO NEXT FACILITY
FOR COLS. 10,13,16 ASK: SERVICE REASONS* When you visited (FACILITY) AVAILED what type of service did you utilize?
FOR COLS. 11,14,17 ASK: Were you satisfied or dissatisfied with the service?
FORCOLS. 12,15,18 ASK: Why were you satisfied or dissatisfied with the service?
TYPE OF SERVICE AVAILED (10) (12) I
READ EACH SERVICE TO THE ! RESPONDENT
A. Treatment when ill or 1 2 injured ~
B. Routine Check-ups 1 2
C. Laboratory Services 1 2 I ~
D. Immunization 1 2
E. Family Planning 1 2
F. Health and Nutrition 1 2 Education ~"
G. PrenataF, Delivery and 1 2 Postnatal ~'
H. Others 1 2
(SPECIFY)
REASONS* SERVICE REASONS* AVAILED
(18) i (16) i (t8)
1 21 r - i - i -q
r -F3
cr-T3
1 t -Cl- ]
r-r l *CODES FOR REASONS FOR SATISFACTION/DISSATISFACTION (DO NOT READ TO RESPONDENT)
AVAILABILITY OF MEDICINE . . . . . . . . . . . . . . . . . . . . . . . . . . . . . . . . . . . . . . . . . . . . . . . . . . . . . . . . . . . A POTENCY/EFFECTIVITY OF MEDICINES GIVEN . . . . . . . . . . . . . . . . . . . . . . . . . . . . . . . . . . . B ADEQUACY OF HEALTH EQUIPMENT AND OTHER FACIUTIES . . . . . . . . . . . . . . . C AVAILABILITY AND ACCESSABILITY OF HEALTH PERSONNEL .. . . . . . . . . . . . . . D HEALTH PERSONNEL APPROACHABILITY . . . . . . . . . . . . . . . . . . . . . . . . . . . . . . . . . . . . . . . . . . E TECHNICAL COMPETENCY OF HEALTH PERSONNEL . . . . . . . . . . . . . . . . . . . . . . . . . . . F COURTEOUSNESS OF HEALTH CARE FACILITY STAFF . . . . . . . . . . . . . . . . . . . . . . . . . G CHARGES FOR SERVICES OR MEDICINES . . . . . . . . . . . . . . . . . . . . . . . . . . . . . . . . . . . . . . . . . H IMPORTANCE GIVEN TO PATIENTS' RIGHT IN HEALTH CARE .. . . . . . . . . . . . . . . . I AVAILABILITY/QUALITY OF LINENS/BEDDINGS . . . . . . . . . . . . . . . . . . . . . . . . . . . . . . . . . . . . J AVAILABILITY/QUALITY OF FOOD . . . . . . . . . . . . . . . . . . . . . . . . . . . . . . . . . . . . . . . . . . . . . . . . . . . . K AVAILABILITY OF SERVICE . . . . . . . . . . . . . . . . . . . . . . . . . . . . . . . . . . . . . . . . . . . . . . . . . . . . . . . . . . . . . L OTHERS, SPECIFY X
4 270

4
SECTION B. HEALTH FACILITY UTILIZATION
FOR COL. 19,22,25, ASK: When you visited (FACILITY} what type of service did you utilize?
FOR COL. 20,23,26, ASK: Were you satisfied or dissatisfied with the service?
FOR COL. 21,24,27, ASK: Why were you satisfied or dissatisfied with the service?
Private Hospital Private Clinic
1 2 -I~ SKIP TO 1 2 "~ SKIP TO NEXT NEXT FACILITY FACILITY
SERVICE SATIS- l REASONS* ~ R~6ONS ° SATIS- ~ FIED/DIS- F IED ID IS SATIS- SATIS- FIED
Others, Specify
1 2 "1=" GO TO SECTION C
SATIS- SATIS- SATIS- FIED FlED FLED ...1 ,..1 ...1
TYPE OF SERVICE AVAILED
READ EACH SERVICE TO THE RESPONDENT
Treatment when ill or injured
B. Routine Check-ups
C. Laboratory Services
D. Immunization
E. Family Planning
F. Health and Nutrition Education
G, Prenatal, Delivery and Postnatal
H. Others
{SPECIFY)
o,s.[ ro, . o,s. SATIS- SATIS- SATIS- FIED FlED FlED , , , 2 . . . . . .
<20) r {21) ~ (2,) ~ (=6) r {27)
I , [- l -q-]
i ~ Fq-Fq
F-FT-q F-T-Fq
r-crq
*CODES FOR REASONS FOR SATISFACTION/DISSATISFACTION (DO NOT READ TO RESPONDENT
,-r-~
ZEZ~
____:ZEZ3
AVAILABILITY OF MEDICINE . . . . . . . . . . . . . . . . . . . . . . . . . . . . . . . . . . . . . . . . . . . . . . . . . . . . . . . . . . . . . A POTENCY/EFFECTIVITY OF MEDICINES GIVEN . . . . . . . . . . . . . . . . . . . . . . . . . . . . . . . . . . . . . B ADEQUACY OF HEALTH EQUIPMENT AND OTHER FACILITIES . . . . . . . . . . . . . . . . . C AVAILABILITY AND ACCESSAB]LITY OF HEALTH PERSONNEL . . . . . . . . . . . . . . . . D HEALTH PERSONNEL APPROACHABILITY . . . . . . . . . . . . . . . . . . . . . . . . . . . . . . . . . . . . . . . . . . . E
TECHNICAL COMPETENCY OF HEALTH PERSONNEL . . . . . . . . . . . . . . . . . . . . . . . . . . . . . F COURTEOUSNESS OF HEALTH CARE FACILITY STAFF . . . . . . . . . . . . . . . . . . . . . . . . . . G CHARGES FOR SERVICES OR MEDICINES . . . . . . . . . . . . . . . . . . . . . . . . . . . . . . . . . . . . . . . . . . . H IMPORTANCE GIVEN TO PATIENTS' RIGHT IN HEALTH CARE . . . . . . . . . . . . . . . . . . } AVAILABILITY/QUALITY OF LINENS/BEDDINGS . . . . . . . . . . . . . . . . . . . . . . . . . . . . . . . . . . . . . J A V A I L A B I L I T Y / Q U A L I T Y OF FOOD . . . . . . . . . . . . . . . . . . . . . . . . . . . . . . . . . . . . . . . . . . . . . . . . . . . . . . K AVAILABILITY OF SERVICE . . . . . . . . . . . . . . . . . . . . . . . . . . . . . . . . . . . . . . . . . . . . . . . . . . . . . . . . . . . . . . L OTHERS, SPECIFY X
271 5
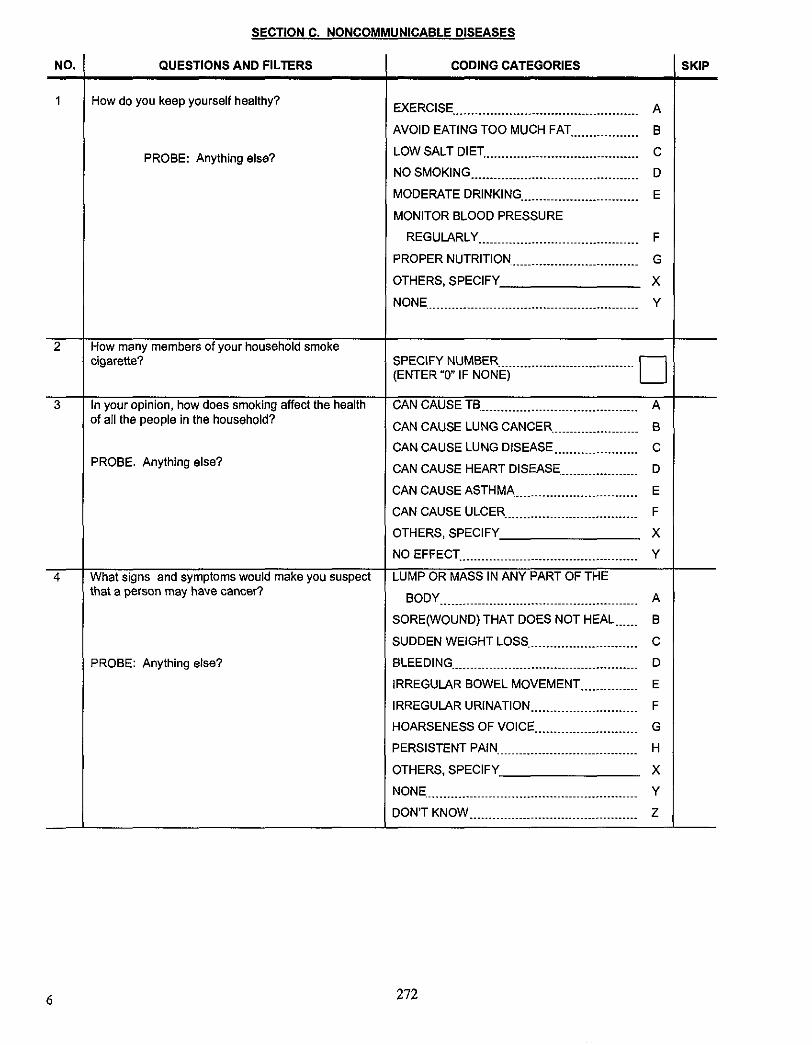
NO.
1
SECTION C. NONCOMMUNICABLE DISEASES
QUESTIONS AND FILTERS
How do you keep yourself healthy?
PROBE: Anything else?
CODING CATEGORIES
EXERCISE
AVOID EATING TOO MUCH FAT
LOW SALT DIET
NO SMOKING
MODERATE DRINKING
MONITOR BLOOD PRESSURE
REGULARLY
PROPER NUTRITION
OTHERS, SPECIFY
NONE
A
B
C
D
E
F
G
X
Y
2 How many members of your household smoke cigarette? SPECIFY NUMBER (ENTER"O",F NONE) 1 I
3 In your opinion, how does smoking affect the health CAN CAUSE TB A of all the people in the household?
PROBE. Anything else?
CAN CAUSE LUNG CANCER
CAN CAUSE LUNG DISEASE
CAN CAUSE HEART DISEASE
CAN CAUSE ASTHMA
CAN CAUSE ULCER
OTHERS, SPECIFY
What signs and symptoms would make you suspect that a person may have cancer?
B
C
D
E
F
X
PROBE: Anything else?
, NO EFFECT . . . . . . . . . . . . . . . . . . . . . . . . . . . . . . . . . . . . . . . . . . . . . . . Y ,
LUMP OR MASS IN ANY PART OF THE
BODY A
SORE(WOUND) THAT DOES NOT HEAL B
SUDDEN WEIGHT LOSS C
BLEEDING D
IRREGULAR BOWEL MOVEMENT E
IRREGULAR URINATION F
HOARSENESS OF VOICE G
PERSISTENT PAIN H
OTHERS, SPECIFY X
NONE Y
• DON'T KNOW ............................................ Z .
SKIP
6 272

NO.
1
SECTION D, COMMUNICABLE DISEASE
QUESTIONS AND FILTERS
Whet do you think is the cause of TB?
PROBE: Anything else?
How long do you think TB should be treated?
CODING CATEGORIES
MICROBES/G ERMS/BACTERIA A
INHERITED B
LIFESTYLE C
SMOKING D
ALCOHOL DRINKING E
FATIGUE F
OTHERS, SPECIFY X
DON'T KNOW CAUSE TB Y
. . . . . . . . . . . . . . . . . . . Z • DOES NOT KNOW TB . . . . . . . . . . . . . . .
ONE MONTH 1
TWO MONTHS 2
THREE MONTHS 3
FOUR MONTHS 4
SIX MONTHS 5
EIGHT MONTHS 6
ONE YEAR OR MORE 7
SKIP
-i. 5
• DON'T KNOW ............................................ 8
3 Is there a member of your household who is currently YES 1 taking anti-TB medicines? NO 2 • 5
DON'T KNOW 8
4 if Yes, where does that person get the anti-TB medicines?
PROBE: Anything else?
HEALTH CENTER A
BUY MEDICINES FROM DRUGSTORE B
N.G.O C
PRIVATE CLINIC/HOSPITAL D
GOVERNMENT HOSPITAL E
OTHERS, SPECIFY X
, DON'T KNOW ............................................ Z ,
SKIN TO SKIN A
DROPLETS/AIRBORNE B
HEREDITARY C
EXPOSURE TO HOT THEN
COLD "PASMA" D
EATING CERTAIN TYPES OF FOOD E
OTHERS, SPECIFY X
DON'T KNOW MODE OF TRANSMISSION .... Y
How do you think is leprosy spread?
PROBE: Anything else?
• DON'T KNOW LEPROSY ............................. Z ,'~8
6 Do you think leprosy is curable? YES 1
• NO ............................................................ 2 , "~8
7 In your opinion can leprosy patients be treated at YES 1 home? . NO ............................................................ 2
7 273

NO.
8
9
10
QUESTIONS AND FILTERS
Have you heard of "dengue" fever?
8
What can you do to protect yourself from getting dengue fever?
PROBE: Anything else?
Apart from feeding or cleaning the dog, what do you think is the responsibility of a dog owner?
PROBE: Anything else?
11 During the last 3 months, was any member of your family bitten by a dog?
12 What was done to treat the bite?
PROBE: Anything else?
I CODING CATEGORIES SKIP
YES .......................................................... 1
NO ........................................................... 2 P 10
STAY AWAY FROM PEOPLE WITH ............
DENGUE ............................................. A
REMOVE BREEDING PLACES (STAGNANT
WATER) OF MOSQUITOES WITHIN
SURROUNDINGS .................................. B
TAKE MEDICINES SO AS NOT TO GET
SICK .................................................... C
USE MOSQUITO NETS . . . . . . . . . . . . . . . . . . . . . . . . . . . . . . D
WASH HANDS BEFORE EATING ................ E
ELIMINATE ALL FLIES IN
YOUR SURROUNDINGS ........................ F
OTHERS, SPECIFY X
NONE ....................................................... Y
DON'T KNOWN ........................................... Z
IMMUNIZE DOG ........................................ A
RESTRAIN/CONFINE DOG WITHIN THE
YARD/HOUSE ....................................... B
IN CASE OF DOG BITE, PROVIDE
NECESSARY TREATMENT FOR
THE VICTIM .......................................... C
OTHERS, SPECIFY X
NONE ...................................................... Y
YES .......................................................... I
NO 2 .- SECT, . . . . . . . . . . . . . . . . . . . . . . . . . . . . . . . . . . . . . . . . . . . . . . . . . . . . . . . . . . . E
WASHED BITE WOUND WITH SOAP
AND WATER ......................................... A
APPLIED GARLIC ON SITE OF BITE ............ B
CONSULTED HEALTH CENTER/
PHYSICIAN ........................................... C
SOUGHT AN HERBULARIO ........................ D
IMMEDIATELY KILLED THE DOG ................ E
OBSERVED THE DOG ............................... F
OTHERS, SPECIFY X
NOTHING ................................................. Y
274

SECTION E. TRADITIONAL MEDICINES
There are some locally produced herbs that have medicinal values, I would like to find out if you know some of these.
Are you familiar with (NAME Ampa- Ulasi- La- Niyog- Sam- Tsa- Yerba Baya- Ba- gundi* niyo- bong* ang Bue- bas* wang*
gan* gubat* na* OF HERB) which is used as laya* a medicine?
READ EACH HERBAL MEDICINE TO THE RESPONDENT. ENCIRCLE "1" IF THE RESPONDENT IS FAMILIAR, OTHERWISE ENCIRCLE "~'.
Aca- mang pulco* bato (pansit pan- sitan)*
(1) (2) (3) (4) (5) (6) (7) (8) (g) (~0)
YES..1 YES..1 YES..1 YES..1 YES..1 YES..1 YES..1 YES..1 YES..1 YES..1
oo. oo . ,o oo ooq, L o: TO (2) TO (3) TO (4) TO (5) TO (6) TO (7) TO (8) TO (9) TO (10) SECT.
F.
For what illness or disease do you think (NAME OF HERB) is used? CIRCLE CODES OF ALL ILLNESSES MENTIONED.
A. HEADACHE A A A A A A A A A A
B. FEVER B B B B B B B B B B
C. ABDOMINAL C C C C C C C C C C PAIN/DIARRHEA
D. COUGH/ASTHMA D D D D D D D D D D
E. ASCARIS E E E E E E E E E E
F. DIABETES F F F F F F F F F F
G. GOUTY ARTHRITIS/ G G G G G G G G G G RAYUMA
H. HYPER CHO- H H H H H H H H H H
LESTEROLEMIA
i. SKIN INFECTION/ I I I I I I I I CLEANING WOUNDS
J. DIURETIC/FOR J J J J J J J J J J
URINARY STONES
K. OTHERS, SPECIFY K K K K , K K K K K K
3 Have you used (NAME OF HERB) during the YES..1 YES..1 YES..1 YES..1 YES..I YES..1 YES..1 YES..1 YES..I YES..1
past 3 months? NO...2 NO...2 NO._2 NO...2 NO...2 NO...2 NO...2 NO...2 NO.. .2 NO...2
4 Do you know if (NAME OF HERB) is endorsed bythe YES..1 YES..1 YES..1 YES..1 YES..1 YES..1 YES..1 YES..1 YES..1
DOH? NO...2 : NO...2 NO.,.2 NO...2 NO...2 NO...2 NO...2 NO...2 NO...2
GO GO GO GO GO GO GO GO GO TO (2) TO (3) TO (4) TO (5) , TO (6) TO (7) TO (8) TO (9) TO (10)
*REFER TO INTERVIEWER'S MANUAL FOR OTHER NAMES OF THESE HERBS.
275
YES..1
NO...2 GO TO SECT.
F.

SECTION F. HEALTH CARE FINANCING
1. Are you or any member of your household a member of MEDICARE, Employer-based Heatth Maintenance Organization (HMO), Private Health Insurance, Community/Cooperative Health Financing Scheme or any Health Insurance Plan?
. YES ......... 1 NO ........... 2, ENDINTERVIEW
FROM NDHS Form 1 Col. (2) and Col. (1)
2. What kind of Health Insurance Plan?
PROBE: Anything else?
3. CHECK Q.2
4. Have you (Has any member of your household) or any of your (his/her) dependents utilized MEDICARE benefits within the last 12 months?
5. Were you (Do you think he/she was) satisfied or dissatisfied with the service?
6. Why were you (do you think he/she was ) not satisfied with the service?
PROBE: Anything else?
RESPONDENT HOUSEHOLD MEMBER NAME: NAME; LINENO.: LINENO.:
MEDICARE A HMO B PRIVATE C COMMUNITY/COOP. D OTHERS, SPECIFY E
"A" is encircled E I - -
"A" is not encircled / p
(SKIP TO 7) q
YES 1
NO 2 - - - I
(SKIP TO 7)
MEDICARE HMO PRIVATE C COMMUNITY/COOP. D OTHERS, SPECIFY E DON'T KNOW Z
(SKIP TO 7) ~ I
"A" is encircled r - - } -
"A" is not encircled [ ] /
(SKIP TO 7) 4
YES 1
NO 2
(SKIP TO 7) ~ ~
SATISFIED 1 (SKIPTO 7) 4 I
DISSATISFIED 2 DON'T KNOW. 8
(SKIPTO 7) 9 I
PROCESSING OF CLAIMS TOO LONG A
TOO MANY REQUIREMENTS B
LIMITED HOSPITALIZATION/ FINANCIALBENEFITS.C
BENEFITS CAN'T BE AVAILED OF UNLESS HOSPITALIZED .D
PREMIUM NOT REFUNDABLE E
LACK OFINFORMATION ABOUT MEDICARE F
OTHERS X ~PECIFY)
HOUSEHOLD MEMBER: NAME: LINE NO.:-
SATISFIED I (SKIP TO 7) q I
DISSATISFIED 2
PROCESSING OF CLAIMS TOO LONG A
TOO MANY REQUIREMENTS B
LIMITED HOSPITALIZATION/ FINANCIAL BENEFITS .C
BENEFITS CAN'T BE AVAILED OF UNLESS HOSPITALIZED D
PREMIUM NOT REFUNDABLE E
LACK OF INFORMATION ABOUT MEDICARE F
OTHERS X (SPECIFY)
A MEDICARE A B HMO B
PRIVATE C COMMUNITY/COOP. D OTHERS, SPECIFY E DON'T KNOW Z
(SKIP TO 7) q I
"A" is encircled F - ] -
"A" is not encircled [ ] / (SKIP TO 7) q
YES 1
NO 2
(SKIP TO 7) ~l'"'n
SATISFIED 1 (SKIP TO 7) 4 I
DISSATISFIED 2 DON'T KNOW 8
(SKIP TO 7) q I
PROCESSING OF CLAIMS TOO LONG A
TOO MANY REQUIREMENTS B
LIMITED HOSPITALIZATION/ FINANCIAL BENEFITS .C
BENEFITS CAN'T BE AVAILED OF UNLESS HOSPITALIZED D
PREMIUM NOT REFUNDABLE E
LACK OF INFORMATION ABOUT MEDICARE .F
OTHERS X (SPECIFY)
.DON'T KNOW .................. Z .DON'T KNOW .................. Z .
7. GO TO NEXT HH MEMBER GO TO NEXT HH MEMBER GO TO NEXT HH MEMBER OR IF NO MORE MEMBER OR IF NO MORE MEMBER OR IF NO MORE MEMBER
END INTERVIEW END INTERVIEW END INTERVIEW
10
276