The Somali Health and Demographic Survey 2020 - ReliefWeb
462
THE FEDERAL REPUBLIC OF SOMALIA The Somali Health and Demographic Survey 2020 Xog la helaa talo la helaa Information for better decisions 2020
-
Upload
khangminh22 -
Category
Documents
-
view
2 -
download
0
Transcript of The Somali Health and Demographic Survey 2020 - ReliefWeb

THE FEDERAL REPUBLIC OF SOMALIA
The Somali Health and Demographic
Survey 2020
Xog la helaa talo la helaa Information for better decisions 2020

The information contained in this publication may be reproduced, stored in a retrieval system or transmitted, in any form or by any means, electronic, mechanical, photocopying, recording or otherwise, without prior permission but with acknowledgement of this publication as a source.
Suggested citation:Directorate of National Statistics, Federal Government of Somalia. The Somali Health and Demographic Survey 2020.
Additional information about the survey can be obtained from:The Directorate of National Statistics, Ministry of Planning, Investment and Economic Development, Federal Government of Somalia.
Email:[email protected]
Website:www.dns.org.so
Telephone no.:+252 616 272 788 or +252 615 549 101
Social media:https://www.facebook.com/mopied/Twitter: @MoPIED_Somalia
This report was produced by the Federal Government of Somalia, with support from the United Nations Population Fund, Somalia and key donors.

The Somali Health and Demographic
Survey 2020
With technical support from:
With financial contribution from:

The Somali Health and Demographic SurveyIV

V
It is a great pleasure for the Directorate of National Statistics of the Ministry of Planning, Investment and Economic Development, in cooperation with the Policy and Planning Directorate of the Ministry of Health and Human Services of the Federal Government and its Federal Member States, to present the findings of the Somali Health and Demographic Survey (SHDS), conducted from 2018-2019.
This survey marks the first time that such data has been produced in the history of Somalia. It provides long-awaited information required by policy- and decision-makers, and all other relevant stakeholders to make evidence-based programme and policy decisions that deliver effective services to Somalis. The survey findings will enable the Federal Government of Somalia and Federal Member States to monitor their respective sectors in Somalia’s National Development Plans, including those relating to improving the lives of women and children, and overall health in Somalia.
The SHDS will help us to continue to change the national dialogue in our country. It presents more than just numbers—offering valuable nuggets of information to the Ministry of Health and our partners to strive at all levels to promote universal access to reproductive health care and rights. This will be achieved by promoting international maternal health standards and providing guidance and support to health systems that will help us to define our country’s strategic plans and programmes. The survey findings will also offer a glimpse into social behaviour in our communities and encourage our people to adopt positive behavioural changes to improve their own lives.
Findings from the SHDS show us our assets—Somalia has resources in young people—just above half of our population comprises people below 15 years of age. While we are pleased to report that maternal mortality has dropped over the years, from 732 in 2015 to 692, we remain focused to use data gathered to save the life of every mother possible. For instance, we now know that most underweight births were reported in younger mothers, under 20 years of age, and that only 32 percent of births were delivered with support from trained health care providers. The SHDS results further highlight areas that need intervention—to improve the lives of children, we know that
Preface
The survey findings will enable the Federal Government of Somalia and Federal Member States to monitor their respective sectors in Somalia’s National Development Plans

The Somali Health and Demographic SurveyVI
only 3.5 percent of births have been registered, and only 11 percent of children aged 11-23 months have been fully vaccinated against common vaccine-preventable childhood diseases. Additionally, while about 70 percent of households have access to an improved source of drinking water, only just above half of households interviewed use an improved sanitation facility.
These crucial findings are a result of the great efforts of UNFPA Somalia’s Population and Development Unit, that collaborated at every stage with technical teams from the respective Somali statistical offices—along with all the personnel who have worked on this survey. These professionals worked together diligently to complete every phase of work according to the planned timetable in a challenging environment. Some of these heroes also include more than 300 Somalis who knocked on doors of pre-sampled households in urban, rural and nomadic settings to collect rich, diverse information from more than 15,000 households across the country for this main survey report. These teams were responsible for collecting information on maternal mortality from 100,000 households during the initial stages when households were being listed.
Thanks to our strong collaboration with UNFPA, Somalia now has a legacy of information, and skilled statistical staff who are able to lay a strong foundation of statistics for our future generations. We also remain grateful to the donors of this undertaking—the UK Department for International Development (DFID), the Government of Sweden, the Government of Finland, the Government of Italy, the Italian Agency for Development Cooperation (AICS), the Swiss Agency for Development and Cooperation for their generous contributions, which have created a product that will help turn the dreams of the Somalis to reality.
We look forward to seeing the findings from this report shaping vital plans in Somalia, including the response of the international community to support the Somali National Development Plan 9 to attain the Sustainable Development Goals, and response plans for diseases and emergencies, such as the ongoing COVID-19 pandemic, locust invasion, and recurrent drought and floods. It is our hope that this report will be used and analyzed even further to drive more positive changes in Somalia.
Hon Amb Gamal Mohamed Hassan
Minister of Planning, Investment and Economic Development,
The Federal Government of Somalia
Hon Dr. Fawziya Abikar Nur
Minister of Health and Human Services,
The Federal Government of Somalia

VII
The Somalia Health and Demographic Survey (SHDS) was realized with the commitment and dedication of several organizations and individuals.
The statistical teams within the Directorate of National Statistics of the Federal Government of Somalia and Federal Member States were instrumental in ensuring all stages of the survey were carried out with attention to detail. In their quest for Somalis to have data for better planning and policymaking, the following experts steered all technical processes for the SHDS: Abdirahman Omar Dahir (Director General, Statistics, Ministry of Planning, Investment and Economic Development, Federal Government of Somalia), Nur Ahmed Weheliye (SHDS Coordinator), Dr Abdikadir Afrah Weheliye (Deputy SHDS Coordinator), Hussein Abdi (Director General, Ministry of Planning, Economic Development and International Cooperation, Puntland), Said Abdilaahi Abdi (Technical Lead, Federal Government of Somalia), Abdi Mohamoud Ali (Technical Lead, Puntland), Abdinasir Ali Dahir (Demographer), Mohamed Abdinur Mohamed (Statistician), and Abdulrazak Abdullahi Karie (Demographer).
The United Kingdom Department for International Development (DfID), The Government of Sweden, The Government of Finland, The Government of Italy, The Italian Agency for Development Cooperation (AICS) and The Swiss Agency for Development and Cooperation provided key financial support that went into creating a legacy for the country—data and skilled personnel. In particular, we would like to acknowledge the guidance of Joanne McFadden of The United Kingdom Department for International Development (DfID).
We would like to express our sincere gratitude to the United Nations Population Fund for working together with our teams every step of the way, and for developing their capacity and skills in several areas. This survey would not have been realized without the support and leadership of Anders Thomsen (Representative, UNFPA Somalia) and Walter Mendonça Filho (Deputy Representative, UNFPA Somalia). We would like to single out Mariam Alwi (Population and
Acknowledgements

The Somali Health and Demographic SurveyVIII
Development Specialist and Head of Population and Development Unit, UNFPA Somalia) for her dedication to Somalis, and devotion and patience in steering this mission. The contributions of the UNFPA Somalia team of experts, without whom the survey would not have come to fruition are also recognised. These are Richard Ng’etich (Statistician), Felix Mulama (Demographer) and Umikaltuma Ibrahim (GIS Analyst).
We remain indebted to Nikolai Botev (Former Representative, UNFPA Somalia) for his unparalleled commitment and guidance at every stage of the survey during his tenure and his support in technical editing and review afterwards.
The peer group of experts in different fields that provided valuable input and time to the report include Dr Daniel Shiloh and his team (Louisa Blackwell, Merad Salah and Daniel Ayoubkhani) from Methodology Advisory Services, Office for National Statistics, United Kingdom, Peter Lundquist and Anna Nyman from Statistics Sweden, Dr Tareq Alkebsi, Yemen Central Statistics Office, Dr. Abdallah Abdelaziz Zoubi (immediate former PD Advisor, ASRO) and Helge Brunborg, Vebjorn Aalandslid and Per Schoning from Statistics Norway.
Abdi Dirshe, Former Permanent Secretary for the Ministry of Planning, Investment and Economic Development, and Abdikadir Mohamed Adan, Current Permanent Secretary, Ministry of Planning, Investment and Economic Development provided much-needed guidance.
We remain grateful to Philip Hughes (GIS Administrator, United Nations Support Office in Somalia) who provided much-needed satellite imagery to aid in the development of the survey frame.
We would also like to thank the UNFPA Rwanda Country Office for their support during technical workshops held for the survey and recognise the advice and guidance of Yusuf Murangwa (Director General, National Institute of Statistics of Rwanda) and his team.
Finally, this report is the culmination of a wide range of efforts from Somali respondents, enumerators, supervisors, quality assurance teams and other field personnel, who sometimes had to brave conflict, poor weather and limited infrastructure in their quest to collect the data that made this report possible. Mahadsanid to each one of them.

IX

The Somali Health and Demographic SurveyX
Acronyms
AIDS Acquired Immunodeficiency Syndrome
ANC antenatal care
ARI acute respiratory infections
ART antiretroviral therapy
BCG Bacillus Calmette-Guérin [tuberculosis vaccine]
BMI body mass index
CAPI Computer-Assisted Personal Interviewing
CSPro Census and Survey Processing System
DfID Department for International Development
DHS The Demographic and Health Surveys
DPT diphtheria, pertussis and tetanus vaccine
EAs enumeration areas
EPHS Essential Package of Health Services
FGM/C Female Genital Mutilation/Cutting
FGS Federal Government of Somalia
FMS Federal Member States
GAR gross attendance ratios
GBV Gender-Based Violence
GDP Gross Domestic Product
GFR general fertility rate
GIS geographic information system
GPI gender parity index
HC health centres
HIV Human Immunodeficiency Virus
IYCF Infant and Young Child Feeding
LAMPS Learning and Monitoring Programme for Somalia
MCH maternal and child health
MMR Maternal Mortality Ratio
MMRate Maternal Mortality Rate
MOH Ministry of Health
MTCT mother-to-child transmission
NARs net attendance ratios
NDP National Development Plan
NLWs nomadic link workers
ORS oral rehydration salts

XI
ORT oral rehydration therapy
PAPFAM Pan Arab Project for Family Health
PESS Population Estimation Survey of Somalia
PNC postnatal care
PPS probability proportional to size
PSU primary sampling units
RHF recommended home fluids
SD standard deviation units
SDGs Sustainable Development Goals
SHDS The Somali Health and Demographic Survey
SGBV Sexual and Gender-Based Violence
SHS second-hand smoke
SPSS Statistical Package for Social Sciences
SSUs secondary sampling units
STIs sexually transmitted infections
TFG Transitional Federal Government
TFR total fertility rate
TNS temporary nomadic settlements
ToT training of trainers
TPM Third-Party Monitoring
TTI tetanus toxoid injections
UNICEF United Nations Children’s Fund
USU ultimate sampling units
WHO World Health Organization

The Somali Health and Demographic SurveyXII
1
2
ContentsPreface V
Acknowledgements VII
Acronyms X
List of Tables XVIII
List of Figures XXI
Executive Summary XXVI
INTRODUCTION 2
Country Context 2
Geography 2
Demography 2
History and Politics 3
Economy 3
Health Status 4
Survey Objectives and Organization 4
Sample Design 5
Questionnaires 8
Maternal Mortality Questionnaire 8
Household and Individual Questionnaires 8
Training 9
Listing and MMR Training 9
Main Survey Training 10
Fieldwork 10
Listing and MMR Data Collection 10
Main Survey Data Collection 10
Data Processing 12
Response Rates 12
Quality Assurance 12
HOUSEHOLD AND HOUSING CHARACTERISTICS 20
Household and Housing Characteristics 21
Age and Sex Composition 21
Household Composition 22
Education 23
Educational Attainment 23
School Attendance Ratios 24
Housing Characteristics 25
Water Supply 25
Sanitation Facilities 26

XIII
3
4
Housing Characteristics 28
Household Possessions 29
Household Wealth 32
Birth Registration 33
List of Tables 33
CHARACTERISTICS OF THE RESPONDENTS 50
Background Characteristics of Respondents 50
Educational Attainment 51
Literacy 51
Exposure to Mass Media 52
Internet Use 53
Employment Status 56
Type of Employment 57
Health Insurance Coverage 57
Use of Tobacco 57
List of Tables 58
MARRIAGE, FERTILITY AND BIRTH SPACING 72
Marriage 72
Marital status 72
Age at First Marriage 73
Early Marriage 74
Fertility 74
Current Fertility 74
Inter-Birth Intervals 77
Menopause 77
Age at First Birth 78
Teenage Pregnancy and Motherhood 78
Fertility Preferences 79
Fertility Preferences by Number of Living Children 79
Desire to Limit Childbearing 79
Ideal Number of Children 79
Fertility Planning 80
Birth Spacing 80
Knowledge of Contraceptive Methods 81
Contraceptive Use 82
Knowledge of Fertile Period 82
Need and Demand for Birth Spacing 83

The Somali Health and Demographic SurveyXIV
5
7
6
Exposure to Birth Spacing Messages 86
List of Tables 86
MATERNAL AND NEWBORN HEALTH 108
Antenatal Care 108
Antenatal Care Coverage 109
Number and Timing of Antenatal Visits 109
Components of Antenatal Care 110
Tetanus Toxoid 111
Assistance during Delivery 111
Place of Delivery 114
Postnatal Care and Practices 115
Problems in Accessing Health Care 116
List of Tables 117
CHILD HEALTH 132
Birth Weight 132
Vaccination of Children 133
Symptoms of Acute Respiratory Infection 134
Fever 135
Diarrhoeal Diseases 138
Treatment of Childhood Illnesses 138
Disposal of Children’s Stools 139
List of Tables 140
CHILD NUTRITION, FEEDING PRACTICES AND NUTRITIONAL STATUS OF WOMEN 152
Nutrition of Children and Women 152
Nutritional Status of Children 153
Initiation of Breastfeeding 154
Breastfeeding status by age 155
Infant and Young Child Feeding (IYCF) Indicators on Breastfeeding Status 156
Types of Complementary Foods 156
Infant and Young Child Feeding (IYCF) Practices 157
Micronutrient Intake among Children 160
Nutritional Status of Women 160
Micronutrient Intake among Women 161
List of Tables 161

XV
8
HIV/AIDS-RELATED KNOWLEDGE, BELIEFS AND ATTITUDES 176
Misconceptions about HIV/AIDS 177
Knowledge about Mother-to-Child Transmission 177
Attitudes towards People Living with HIV/AIDS 178
Self-reporting of Sexually Transmitted Infections 179
List of Tables 182
9
GENDER-BASED VIOLENCE 192
Measurements of Violence 192
Ethical Considerations in SHDS 193
Opinions about Domestic Violence 193
Women’s Experience of Physical Violence 195
Perpetrators of Physical Violence 195
Violence during Pregnancy 198
Spousal Violence 198
Injuries to Women due to Spousal Violence 198
Help-seeking Behaviours 199
List of Tables 200
10
FEMALE CIRCUMCISION 212
Opinions on Female Circumcision 212
Prevalence of Female Circumcision 213
Age at Female Circumcision 214
Female Circumcision on Daughters 214
Attitudes towards Female Circumcision 215
List of Tables 218

The Somali Health and Demographic SurveyXVI
11
12
13
WOMEN’S EMPOWERMENT 228
Women’s Employment 228
Control over Women’s Earnings 229
Control over Husbands’ Earnings 229
Ownership of Assets 230
Ownership and Use of Bank Accounts and Mobile Phones 231
Women’s Participation in Decision Making 234
Attitudes towards Wife Beating 234
Summary Indices of Women’s Empowerment 235
List of Tables 235
CHRONIC DISEASES, DISABILITY, OUT-OF-POCKET HEALTH EXPENDITURE AND SOCIAL HABITS 248
Prevalence of Chronic Diseases 248
Diagnosis and Treatment of Chronic Diseases 249
Prevalence of Disability 251
Origin and Age at Onset of Disability 252
Care and Support for Persons with Disabilities 256
Household Out-of-Pocket Health Expenditure and Health-Seeking Behaviour 256
Tobacco Use and Khat Chewing 258
List of Tables 260
ADULT AND MATERNAL MORTALITY 276
Adult Mortality 276
Maternal Mortality 277
Female and Maternal Deaths 278
Maternal Mortality Estimation 279

XVII
REFERENCES 284
GLOSSARY 286
APPENDIX A 292
Sampling Design 293
Objectives of the Somali Health and Demographic Survey 293
Sampling Frame 293
Constructing Sampling Frame for Urban and Rural areas 293
Constructing Sampling Frame for Nomads 293
Sample Design 294
Sample Allocation 294
Sample Selection in Urban and Rural Areas 294
Sample Selection in Nomadic Areas 295
First-stage Sample Allocation and Selection 295
Second-stage Sample Allocation and Selection 295
Third-stage Sample Allocation and Selection (2nd Stage in Nomadic Areas) 295
Design Weights and Sampling Weights 295
Post-Stratification 297
Normalization 297
References 297
APPENDIX B 298
Estimates of Sampling Errors 299
References 300
APPENDIX C 304
Data Quality Tables 305
APPENDIX D 308
List of Contributors 309
Main Survey 312
Household Listing & MMR 314
APPENDIX E 316
Household Questionnaire 317
Ever-married Woman’s Questionnaire 341
Never-married Woman’s Questionnaire 411
Maternal Mortality Questionnaire 422

The Somali Health and Demographic SurveyXVIII
List of Tables
Table 1.1 Results of the household and individual interviews 13
Table 2.1 Household population by age, sex, and residence 34
Table 2.2 Household composition 35
Table 2.3a Educational attainment of the male household population 36
Table 2.3b Educational attainment of the female household population 37
Table 2.4 School attendance ratio 38
Table 2.5a Household drinking water 39
Table 2.5b Treatment of household drinking water 40
Table 2.6 Household sanitation facilities 41
Table 2.7 Housing characteristics 42
Table 2.8 Household possessions 43
Table 2.9 Wealth quintiles 44
Table 2.10 Birth registration of children aged under five 44
Table 3.1 Background characteristics of respondents 58
Table 3.2 Educational attainment 59
Table 3.3 Literacy 60
Table 3.4 Exposure to mass media 61
Table 3.5 Internet use 62
Table 3.6 Employment status 63
Table 3.7 Type of employment 64
Table 3.8 Health insurance coverage 65
Table 3.9 Use of tobacco 66
Table 4.1 Current marital status 87
Table 4.2 Age at first marriage - Women 87
Table 4.3 Age at first marriage - Men 88
Table 4.4 Current Fertility 88
Table 4.5 Selected fertility indicators by background characteristics 89
Table 4.6 Children ever born and living 90
Table 4.7 Birth intervals 91
Table 4.8 Menopause 92
Table 4.9 Age at first birth 92
Table 4.10 Median age at first birth 93
Table 4.11 Teenage pregnancy and motherhood 94
Table 4.12 Fertility preferences by number of living children 95
Table 4.13 Desire to limit childbearing—Women 95
Table 4.14 Ideal number of children 96
Table 4.15 Fertility planning status 97
Table 4.16 Knowledge of contraceptive methods 98
Table 4.17 Knowledge of contraceptive methods by background characteristics 99
Table 4.18 Current use of contraception by age 100
XIX
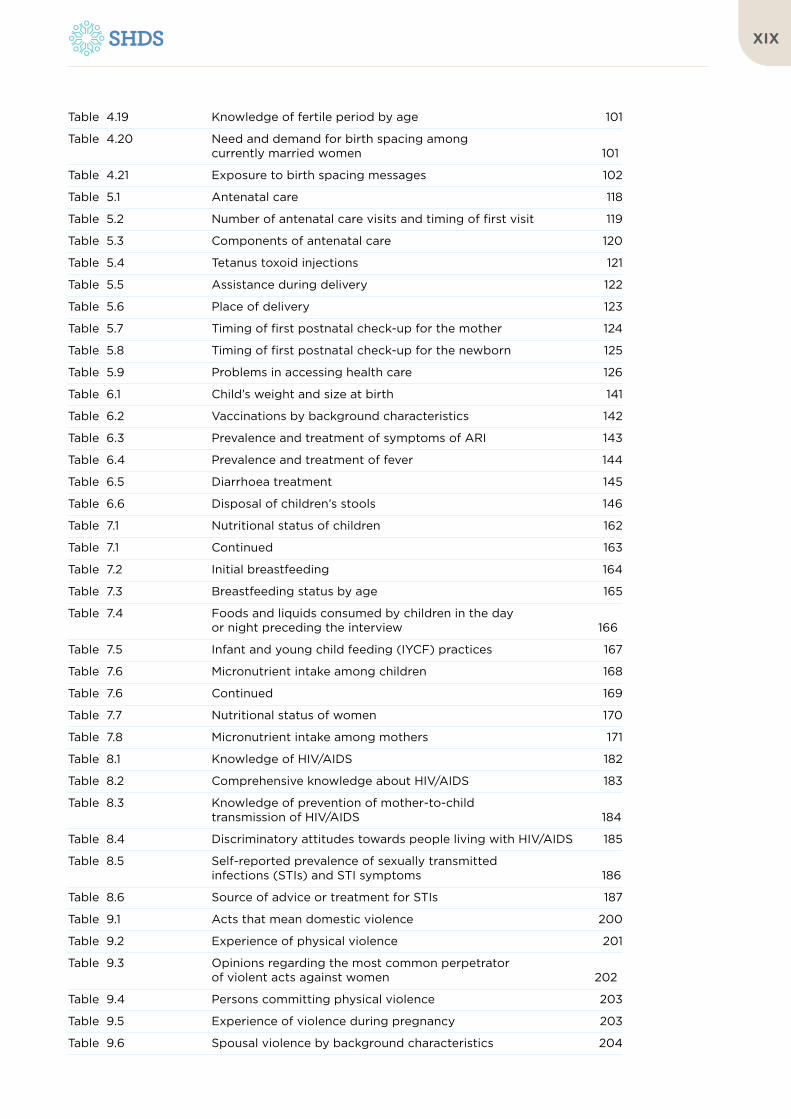
Table 4.19 Knowledge of fertile period by age 101
Table 4.20 Need and demand for birth spacing among currently married women 101
Table 4.21 Exposure to birth spacing messages 102
Table 5.1 Antenatal care 118
Table 5.2 Number of antenatal care visits and timing of first visit 119
Table 5.3 Components of antenatal care 120
Table 5.4 Tetanus toxoid injections 121
Table 5.5 Assistance during delivery 122
Table 5.6 Place of delivery 123
Table 5.7 Timing of first postnatal check-up for the mother 124
Table 5.8 Timing of first postnatal check-up for the newborn 125
Table 5.9 Problems in accessing health care 126
Table 6.1 Child’s weight and size at birth 141
Table 6.2 Vaccinations by background characteristics 142
Table 6.3 Prevalence and treatment of symptoms of ARI 143
Table 6.4 Prevalence and treatment of fever 144
Table 6.5 Diarrhoea treatment 145
Table 6.6 Disposal of children’s stools 146
Table 7.1 Nutritional status of children 162
Table 7.1 Continued 163
Table 7.2 Initial breastfeeding 164
Table 7.3 Breastfeeding status by age 165
Table 7.4 Foods and liquids consumed by children in the day or night preceding the interview 166
Table 7.5 Infant and young child feeding (IYCF) practices 167
Table 7.6 Micronutrient intake among children 168
Table 7.6 Continued 169
Table 7.7 Nutritional status of women 170
Table 7.8 Micronutrient intake among mothers 171
Table 8.1 Knowledge of HIV/AIDS 182
Table 8.2 Comprehensive knowledge about HIV/AIDS 183
Table 8.3 Knowledge of prevention of mother-to-child transmission of HIV/AIDS 184
Table 8.4 Discriminatory attitudes towards people living with HIV/AIDS 185
Table 8.5 Self-reported prevalence of sexually transmitted infections (STIs) and STI symptoms 186
Table 8.6 Source of advice or treatment for STIs 187
Table 9.1 Acts that mean domestic violence 200
Table 9.2 Experience of physical violence 201
Table 9.3 Opinions regarding the most common perpetrator of violent acts against women 202
Table 9.4 Persons committing physical violence 203
Table 9.5 Experience of violence during pregnancy 203
Table 9.6 Spousal violence by background characteristics 204

The Somali Health and Demographic SurveyXX
Table 9.7 Injuries to women due to spousal violence 205
Table 9.8 Help-seeking to stop violence 206
Table 10.1 Opinions on whether female circumcision is required by religion 219
Table 10.2 Prevalence of female circumcision 220
Table 10.3 Age at female circumcision 221
Table 10.4 Female circumcision on girl’s aged 0-14 by mother’s background characteristics 222
Table 10.5 Opinions on continuation of female circumcision 223
Table 11.1 Employment and cash earnings of currently married women 236
Table 11.2 Control over women’s cash earnings and relative magnitude of women’s cash earnings 237
Table 11.3 Control over husbands’ cash earnings 238
Table 11.4 Ownership of assets 239
Table 11.5 Ownership and use of bank accounts and mobile phones 240
Table 11.6 Participation in decision making 240
Table 11.7 Attitude toward wife beating: Women 241
Table 11.8 Indicators of women’s empowerment 242
Table 12.1 Prevalence of chronic diseases 261
Table 12.2 Prevalence of chronic diseases diagnosed by a physician 262
Table 12.3 Prevalence of specific chronic diseases 263
Table 12.4 Prevalence of disability and common types of disability 264
Table 12.5 Origin of disabilities 265
Table 12.6 Age at onset of disability 266
Table 12.7 Care and support received for persons with disabilities 267
Table 12.8 Sources for advice or treatment 268
Table 12.9 Financial sources used to pay for health services 269
Table 12.10 Amount in health expenses 269
Table 12.11 Smoking or using tobacco 270
Table 12.12 Use of Khat 271
Table 13.1 Adult mortality rate 277
Table 13.2 Adult mortality probabilities 277
Table 13.3 Female deaths by cause, number of female deaths overall, by time of death and by cause during the 24 months prior to the survey, by age group corresponding to female’s reproductive age, SHDS 2020 278
Table 13.4 Female population, number of female deaths during the 12 months prior to the survey, maternal deaths by age group corresponding to female’s reproductive age, adjusted, SHDS 2020 281
XXI
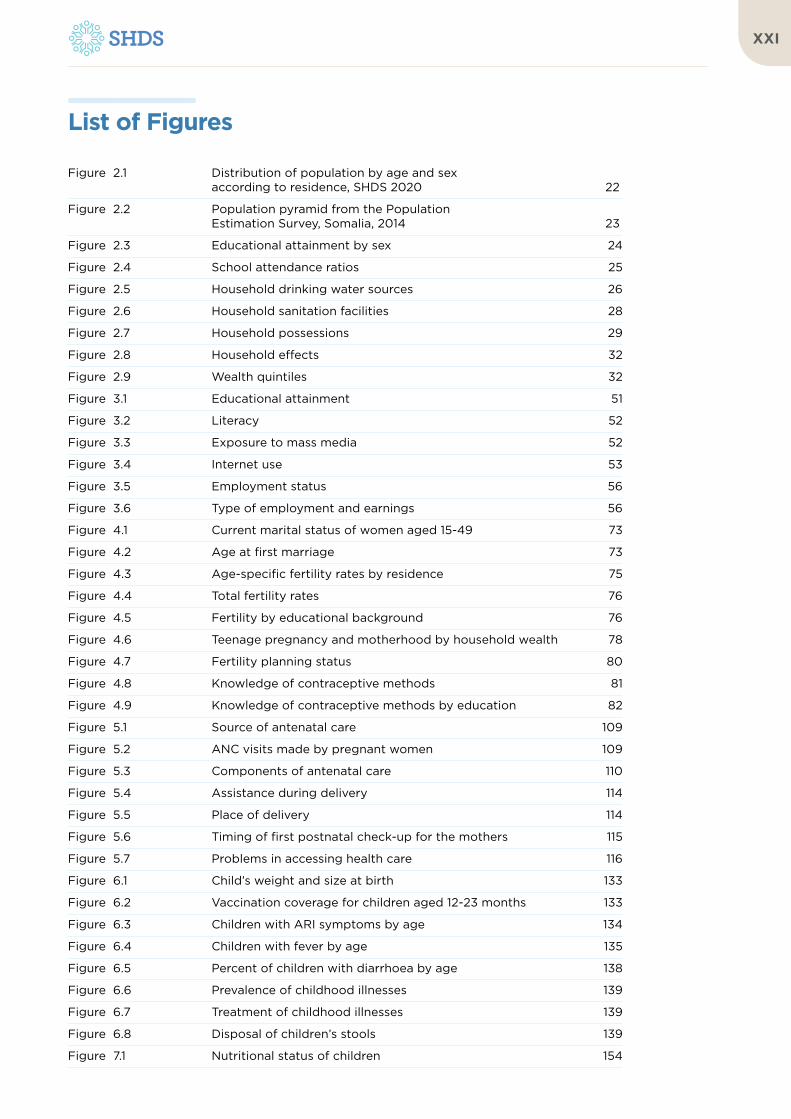
List of Figures
Figure 2.1 Distribution of population by age and sex according to residence, SHDS 2020 22
Figure 2.2 Population pyramid from the Population Estimation Survey, Somalia, 2014 23
Figure 2.3 Educational attainment by sex 24
Figure 2.4 School attendance ratios 25
Figure 2.5 Household drinking water sources 26
Figure 2.6 Household sanitation facilities 28
Figure 2.7 Household possessions 29
Figure 2.8 Household effects 32
Figure 2.9 Wealth quintiles 32
Figure 3.1 Educational attainment 51
Figure 3.2 Literacy 52
Figure 3.3 Exposure to mass media 52
Figure 3.4 Internet use 53
Figure 3.5 Employment status 56
Figure 3.6 Type of employment and earnings 56
Figure 4.1 Current marital status of women aged 15-49 73
Figure 4.2 Age at first marriage 73
Figure 4.3 Age-specific fertility rates by residence 75
Figure 4.4 Total fertility rates 76
Figure 4.5 Fertility by educational background 76
Figure 4.6 Teenage pregnancy and motherhood by household wealth 78
Figure 4.7 Fertility planning status 80
Figure 4.8 Knowledge of contraceptive methods 81
Figure 4.9 Knowledge of contraceptive methods by education 82
Figure 5.1 Source of antenatal care 109
Figure 5.2 ANC visits made by pregnant women 109
Figure 5.3 Components of antenatal care 110
Figure 5.4 Assistance during delivery 114
Figure 5.5 Place of delivery 114
Figure 5.6 Timing of first postnatal check-up for the mothers 115
Figure 5.7 Problems in accessing health care 116
Figure 6.1 Child’s weight and size at birth 133
Figure 6.2 Vaccination coverage for children aged 12-23 months 133
Figure 6.3 Children with ARI symptoms by age 134
Figure 6.4 Children with fever by age 135
Figure 6.5 Percent of children with diarrhoea by age 138
Figure 6.6 Prevalence of childhood illnesses 139
Figure 6.7 Treatment of childhood illnesses 139
Figure 6.8 Disposal of children’s stools 139
Figure 7.1 Nutritional status of children 154

The Somali Health and Demographic SurveyXXII
Figure 7.2 Initial Breastfeeding 154
Figure 7.3 Breastfeeding status by age 155
Figure 7.4 IYCF indicators on breastfeeding status 156
Figure 8.1 Knowledge of prevention of mother-to-child transmission of HIV/AIDS 177
Figure 8.2 Discriminatory attitudes towards people living with HIV/AIDS by education 178
Figure 8.3 Discriminatory attitudes towards people living with HIV/AIDS by age 178
Figure 8.4 Source of advice or treatment for STIs 179
Figure 9.1 Acts that mean domestic violence 194
Figure 9.2 Physical Violence 195
Figure 9.3 Injuries to women due to spousal violence 199
Figure 10.1 Opinions on female circumcision by education 213
Figure 10.2 Opinions on female circumcision by wealth status 213
Figure 10.3 Type of female circumcision by place of residence 214
Figure 10.4 Types of female circumcision by level of education 214
Figure 10.5 Type of female circumcision by wealth status 214
Figure 10.6 Age at female circumcision by place of residence 215
Figure 10.7 Opinion on continuation of female circumcision by levels of education 215
Figure 11.1 Control over women’s earnings 229
Figure 11.2 Ownership of bank account and mobile phones 231
Figure 11.3 Attitude towards wife beating 234
Figure 12.1 Prevalence of chronic diseases 249
Figure 12.2 Chronic diseases diagnosed and treated 250
Figure 12.3 Common chronic diseases 251
Figure 12.4 Disability prevalence by age 252
Figure 12.5 Common types of disabilities 252
Figure 12.6 Age at onset of disability 253
Figure 12.7 Support received by household members for people with disabilities 256
Figure 12.8 Source of advice or treatment 257
Figure 12.9 Source of payment of health services 257
Figure 12.10 Smoking/tobacco use by wealth quintile 259
Figure 12.11 Cigarette smoking, tobacco use and chewing of khat 259

XXIII
Goal Indicator Male Female Total
2Zero hunger
2.2.1 Prevalence of stunting among children under 5 years of age
27.7 28 27.8
2.2.2 Prevalence of malnutrition among children under 5 years of age
22.7 22.8 22.7
a) Prevalence of wasting among children under 5 years of age
11.4 12.4 11.6
3Good health and well-being
3.1.1 Maternal mortality ratio (maternal deaths per 100,000 live births)
n/a 692 n/a
3.1.2 Proportion of births attended by skilled health personnel
n/a n/a 31.9
3.7.1 Proportion of women of reproductive age (aged 15-49 years) who have their need for birth spacing satisfied with modern methods
n/a 2.1 n/a
3.7.2 Adolescent birth rates per 1,000 women
a) Women aged 15-19 years n/a 140 n/a
3.a.1 Age-standardized prevalence of current tobacco use among persons aged 15 years and older
11.3 1.1 5.9
3.b.1 Proportion of the target population covered by all vaccines included in their national programme
9.9 11.6 10.7
4Inclusive and equitable quality education and lifelong learning opportunities for all
4.3.1 Participation rate of youth and adults in formal and non-formal education and training in the last 12 months
a) Net Attendance Ratio (primary) 19.7 17.2 18.5
b) Net Attendance Ratio (secondary) 10.6 7.9 9.2
4.6.1 Percentage of population in a given age group achieving at least a fixed level of proficiency in functional (a) literacy and (b) numeracy skills
a) Adult literacy n/a 32.2 n/a
SUSTAINABLE DEVELOPMENT GOAL INDICATORS

The Somali Health and Demographic SurveyXXIV
Goal Indicator Male Female Total
5Gender equality
5.2.1 Proportion of ever-married women and girls aged 15 years and older subjected to physical, sexual or psychological violence by a current or former husband in the previous 12 months
a) Physical violence n/a 11.9 n/a
c) Psychological violence n/a 4.2 n/a
5.3.1 Proportion of women aged 20-24 years who were married before age 15 and before age 18
a) Before age 15 n/a 16.8 n/a
b) Before age 18 n/a 35.5 n/a
5.3.2 Proportion of girls and women aged 15-49 years who have undergone female genital mutilation/cutting, by age
n/a 99.2 n/a
5.b.1 Proportion of individuals who own a mobile telephone
n/a 75.3 n/a
6Ensure availability and sustainable management of water and sanitation for all
6.1.1 Percentage of population using safely managed drinking water services
n/a n/a 69.4
7Affordable and clean energy
7.1.1 Proportion of population with access to electricity
n/a n/a 49.2
7.1.2 Proportion of population with primary reliance on clean fuels and technology
n/a n/a 5.2
SUSTAINABLE DEVELOPMENT GOAL INDICATORS

XXV
Goal Indicator Male Female Total
8Decent work and economic growth
8.10.2 Proportion of adults (15 years and older) with an account at a bank or other financial institution or with a mobile-money-service provider
a) Proportion of adults (15 years and older) with an account at a bank or other financial institution
n/a 3.5 n/a
b) Proportion of adults (15 years and older) with with a mobile-money account
n/a 63.9 n/a
16 Peaceful and inclusive societies for sustainable development, access to justice for all and effective, accountable and inclusive institutions
16.1.3 Proportion of population subjected to physical, psychological or sexual violence in the previous 12 months
a) Percentage of women aged 15-49 who have experienced physical violence in the last 12 months
n/a 7.6 n/a
16.9.1 Proportion of children under 5 years of age whose births have been registered with a civil authority
3.5 3.4 3.5
17Partnerships for the goals
17.8.1 Proportion of individuals who used Internet in the last 12 months
n/a 15.1 n/a
SUSTAINABLE DEVELOPMENT GOAL INDICATORS

The Somali Health and Demographic SurveyXXVI
Demographic Information and Household Characteristics
As one of Somalia’s biggest assets, and possibly untapped potentials, Somalia has a young population—around 55 percent of household members are under 15 years of age, and 42 percent of Somalia’s population falls within the working age group.
The SHDS report reveals that the size of an average household in Somalia is 6.2 people. In addition to nuclear family members, 28 percent of households are home to a foster child and/or orphaned children.
Keeping their ties with family and friends strong, around three-quarters of households own mobile phones. Within the nomadic communities, 59 percent of households own a simple mobile phone with access to fm radio. This presents an opportunity for stakeholders to reach out to Somalis using innovative ways.
Education and School Attendance
Education is inextricably tied to ways in which Somalis can improve their lives. The SHDS findings show that, in general, educated Somalis are empowered to make informed decisions to improve their lives.
Executive Summary
Unlocking a brighter, healthier future for Somalis
There has never been a more opportune time to ensure Somalis have
better access to health, education, sanitation and nutrition. With the
voices of Somalis from more than 100,000 households—documented
across two phases of The Somali Health and Demographic Survey
(SHDS)—presented in this report, policymakers and stakeholders now
have access to rich and diverse information that will be key to unlocking
a bright future for Somalis, particularly for women of childbearing ages
and children. A first of its kind, the report sheds light on the lives and
needs of nomadic communities—usually difficult to reach—and people
living in urban and rural households. The information presented will help
close gaps of inequality that have existed for years among people of
different ages, lifestyles, places of residence and health status. Some of
the key findings are presented below:

XXVII
Educational attainment varies across age groups though. Of all the age groups analyzed, younger Somalis have better access to education than older people. Those who fall within the age bracket 15-19 years have the lowest number of people with no education, at 57 percent. Additionally, the survey reveals that places of residence have a bearing on access to education. Urban dwellers have better opportunities to progress to higher education than people in nomadic settlements (46 percent of women from urban areas have no education, as compared to 84 percent of nomadic women, for instance).
Overall, access to education is low. A third of female household members and 28 percent of male household members have had some form of primary education. Moreover, 19 percent of all children attending primary school are of the right age for that level, and at secondary level, only 9 percent of children attending are of the right age for that level.
Somali women are yet to enjoy the benefits of formal education, which is known as an equalizer for people of different socioeconomic backgrounds. Just under half, at 48 percent, of girls and women aged 6 and above, have never been to school, in comparison to 45 percent of boys and men. Less than a third of women, at 32 percent, are literate.
Women’s Empowerment
By empowering women, a nation can make great strides in development and peace building. The SHDS reveals that some signs of women’s empowerment can be witnessed in Somalia. For instance, three-quarters of women aged 15-49 own a mobile phone and 64 percent use their mobile phones for financial transactions. Furthermore, Somali women are contributing to financial decisions—nine out of ten women are deciding how their cash earnings will be spent either individually or jointly with their husbands, and close to seven out of ten (67 percent) of women make individual or joint decisions on how their husbands’ cash will be spent.
Employment
As in many other countries, employment in Somalia is known to be governed by the needs in the market and largely by terms set by employers. The SHDS found that only 9 percent of ever-married women interviewed were employed at the time the survey was conducted, while 18 percent were not paid for their work. Of the women who were employed, 49 percent were self-employed. Highlighting the need for more livelihood opportunities across the country, the survey reveals that just over half of women were employed all year round.
Marriage, Fertility and Birth Spacing
Information on marriage guides the understanding of fertility patterns, particularly as marriage among Somali women is universal and childbearing takes place within the context of marriage.
Early marriage is common, particularly for women—36 percent of women aged 20-24 interviewed were married by the time they turned 18 and, overall, almost all Somali women are married by the age of 35. In comparison, 6 percent of men aged 20-24 had entered their first marriage by the time they turned 18. According to the survey, the median age at first marriage is 20 for Somali women aged 25-49 and 23 for men aged 25-64.
Women who marry early are generally known to have a higher chance of getting pregnant and having more children during their reproductive years. According to the SHDS, Somalia’s total fertility rate is 6.9 children. Additionally, 91 percent of women interviewed consider 6 or more children to be the ideal family size. Given that the fertility rate has remained relatively high over the years, all these factors mean that Somalia is likely to witness a spike in population growth over the coming years.
As can be noted in the survey findings, for women with no education, the total fertility rate is about twice as high, at 7.2, as that of women
The Somali Health and Demographic SurveyXXVIII
with higher education, at 3.7. Information on birth spacing would help Somali women make better choices about how many children to have, to ensure better health of women and children.
Water and Sanitation
Access to safe drinking water, particularly if readily available within households, together with better sanitation would prevent the spread of diseases, such as diarrhoea and dysentery, across the country. Yet, less than half of household members, at 42 percent, have access to piped water coming into their dwelling, yard or plot.
The recent pandemic of COVID-19 further highlights the importance of access to water for safe handwashing in the prevention of diseases. However, in general, a large number of Somalis still need access to safe water. Around seven out of ten households, at 65 percent, use an improved source that provides safe drinking water and 12 percent of the households travel for at least 30 minutes or longer to get water.
Across the country, only around six out of ten households, at 57 percent, have an improved sanitation facility that they do not share with other households.
Maternal Health and Newborn Health
Despite the gains made in maternal health, one of the largest challenges Somalia faces is high maternal mortality rates. The survey finds that this can be attributed to low uptake of antenatal care, postnatal care and a low number of delivery at health facilities or with skilled health care providers. All these factors are strongly connected. Women who access health care throughout their pregnancy are more likely to seek support for the health of their newborns.
Less than one-third, at 32 percent, of births are delivered with the assistance of a skilled health professional, which includes a doctor/clinical officer or nurse/midwife/auxiliary midwife. In
general, young and educated Somali mothers, as well as those living in urban areas are more likely to be assisted by skilled birth health care providers than older mothers, women with little or no education, and women living in rural or nomadic households.
The SHDS noted that an overwhelming 79 percent of births were delivered at home, and only around one in five births (21 percent) in the five years preceding the survey was delivered in a health facility. Deliveries are more common in public health facilities (at 17 percent) than in facilities supported by the private sector (at 4 percent). Even in urban settings, 28 percent of deliveries take place in public health facilities, as compared to 6 percent in private facilities.
In terms of care that women seek before and after childbirth, more interventions are needed to assist women and their caregivers to make better decisions. Only 31 percent of women aged 15-49 who had a live birth received ANC from skilled personnel during their last birth. An overwhelming 89 percent of the mothers did not receive any postnatal check-up in the first two days after childbirth.
To have any significant impact on improving women’s lives, it would be essential to help them overcome the barriers they face in accessing health. At least seven out of ten (73 percent) women state they face at least one problem in accessing health care when they need it. The majority of women perceive the lack of money (65 percent) as a barrier, followed by the distance to a health facility (62 percent).
The SHDS found that nomadic married women, women who aren’t employed for cash, women with no education, and those from poorer households face acute problems in accessing health care.
Child Health and Nutrition
Information on child health is crucial for policymakers and parents to ensure children’s longevity and productivity. The survey unveiled that Somali mothers were able to present

XXIX
health cards for only 4 percent of children aged 12-23 months and that just 10 percent of babies delivered live had their weight reported, nine percent of which were infants with low birth weight (less than 2.5 kg).
Overall, only 11 percent of children aged 12-23 months are fully vaccinated (i.e. with BCG, pentavalent, polio and measles vaccines). Vaccination rates are higher for children with educated mothers and children living in urban areas. In general, children presenting with
diarrhoea are more likely to be treated than children with acute respiratory infections (ARI).
Unsafe disposal of children’s stool makes children susceptible to several diseases that are spread through the faecal-oral route. In Somalia, at 46 percent, close to half of under-fives who live with their mothers had their last stools disposed of safely. Children in urban areas (74 percent) and rural areas (60 percent) were more likely than those in nomadic areas
The report sheds light on the lives and needs of nomadic communities—usually difficult to reach—and people living in urban and rural households

The Somali Health and Demographic SurveyXXX
(7 percent) to have their waste disposed of safely.
Another area in which children need support to reach their full potential is ensuring they receive proper and adequate nutrition. This journey starts early for children, at birth. In Somalia, six out of ten children were breastfed within the first hour of their birth and only around three out of ten children under 6 months were exclusively breastfed. In addition, infants as young as zero months, whether breastfeeding or not, have already been introduced to other foods and liquids.
Twenty-eight percent of Somali children under the age of five years are stunted (height-for-age) or too short for their age, 17 percent are severely stunted, and 12 percent are wasted (refers to weight-for-height). In total, 6 percent of children are severely wasted.
There is a need to highlight the benefits of breastfeeding, including early initiation of breastfeeding, and the importance of feeding children nutritious foods at the right time. Only 28 percent of breastfed children aged 6-23 months were fed the minimum frequency of meals. Additionally, only one-third of children aged 6-23 months had consumed foods rich in vitamin A during the night or day preceding the survey, while 21 percent had consumed foods rich in iron.
Gender-Based Violence
Gender-Based Violence (GBV) is one of the most prevalent human rights violations faced by people, particularly women, all around the globe. In Somalia, the survey results show that over 60 percent of women considered physical abuse, denial of education, forced marriage, rape and sexual harassment forms of domestic violence. The survey also noted that women with higher education generally have a better understanding of acts that constitute domestic violence than women with no education, primary or secondary education.
Fourteen percent of women aged 15-49 had experienced physical violence since the
age of 12, while 8 percent reported they had experienced physical violence in the 12 months preceding the survey. According to the survey results, it can be noted that younger women are more likely to experience physical violence, with 16 percent of women in the 15-19 age group reporting they had experienced violence since the age of 12 and 10 percent in the same age group reporting experience of violence in the year preceding the survey.
With regard to women’s opinions on who the most common perpetrators of violent acts against women are, the survey found that over half (59 percent) of women believe that husbands commit the most violent acts against women in the community. Twelve percent of ever-married women reported they had been abused physically by a spouse, while 4 percent reported emotional abuse by a spouse.
Female Circumcision
Female circumcision, also known as Female Genital Mutilation/Cutting (FGM/C), has been practised in Somalia for several decades. The SHDS shows that circumcision in women aged 15–49 is high, at 99 percent. Pharaonic circumcision is the most common type, performed on 64 percent of women. The findings also show that 12 percent of women have undergone the intermediate type of circumcision, while 22 percent have undergone the Sunni type. The majority of women (71 percent) aged 15-49 were circumcised between the ages of 5-9 years.
Mothers with daughters were also asked if their daughters underwent female circumcision, the age at which it was performed, and the type of FGM/C performed among other questions. The results indicate that about 3 percent of girls underwent circumcision between the ages of 0-4, 30 percent of daughters underwent circumcision between the ages of 5-9 and 76 percent of daughters had undergone the practice within the ages of 10-14 years.
Among women surveyed, 72 percent believe that female circumcision is a religious requirement.

XXXI
Chronic Diseases and Out-of-pocket Expenditure
For a society where the spotlight has focused mainly on communicable diseases, the SHDS noted that 6 percent of Somalis are now suffering from chronic diseases. The most common chronic diseases are blood pressure (33 percent), diabetes (20 percent), and kidney diseases and arthritis (at 8 percent each).
The survey further discovered that around 5 percent of the population are suffering from disabilities, and that 42 percent of disabled people in Somalia had not received any care nor support for their disability in the year preceding the survey.
Without any current holistic financial support, around half of Somali households (48 percent) reported they are paying for their health expenses from their income. Future interventions working on improving health service delivery will need to take this into consideration for planning and effective programmes.
HIV/AIDS
Even though HIV/AIDS is not considered a major epidemic in Somalia, the SHDS set out to collect information about the knowledge Somalis have about HIV/AIDS and their attitudes towards people living with HIV. The survey revealed that 66 percent of women aged 15-49 in Somalia had heard of HIV/AIDS. Unfortunately, 48 percent of women aged 15-49 have discriminatory attitudes towards people living with HIV; sixty-two percent of women aged 15-49 even reported they would not buy fresh vegetables from a shopkeeper who is living with HIV. The findings on this topic would guide programmes working to prevent the spread of HIV/AIDS.
Adult and Maternal Mortality
Indicators on adult and maternal mortality can be used to assess the health status of a population. Using the direct estimates of female and male mortality rates for the two
years preceding the survey, the SHDS found that there were more female deaths than male deaths. Among women of the ages of reproductive health, the death rate is highest among women aged 30-34, at 10.9 deaths per 1,000 population. This is also the age group where childbearing is at its peak. The survey reveals that the main causes of maternal mortality are postpartum hemorrhage, pre-eclampsia/eclampsia, obstructed labour and sepsis.
Overall, a quarter of women (25 percent) and men (24 percent) who have reached the age of 15 are likely to die before they reach the age of 50.
Over the years, some gains have been made—Somalia’s maternal mortality rate has dropped from 732 in 2015 to 692 maternal deaths per 100,000 live births. However, more efforts need to be made to save every Somali mother’s life. At present, one in 1,000 women aged 15-49 dies due to pregnancy or birth-related complications, and 5 percent of women would be expected to die from pregnancy-related causes during their reproductive lifetime.
The SHDS Agenda
The SHDS presents pivotal, and potentially game-changing information for Somalis. While informing planning and decision making, the statistics generated will feed into national plans and strategies and spur actions that will improve the lives of Somalis. These findings will further assist Somalis themselves to gain an understanding about their own situation, and take bold steps to ensure they can improve their own lives.

Archillorem quissecusam ent velluptiam dolorporion providem id mo consequ atatiis eaque net qui qui que sunto is iducium quas assimincias velecto tat
01Introduction
©U
NFP
A S
OM
ALI
A/T
ob
in J
on
es

The Somali Health and Demographic Survey2
Country Context
Geography
Somalia is located in the Horn of Africa, with an estimated surface area of 637,657 km2 and a terrain consisting mainly of plateaus, plains and highlands. It has the longest coastline in Africa, stretching over 3,333 km along the Gulf of Aden to the north and the Indian Ocean to the east and south. It borders Djibouti along the north-west, Ethiopia to the west and Kenya to the south-west. Somalia has a tropical hot climate, with little seasonal variations and daily temperatures that vary from 30°C to 40°C. The country experiences low annual rainfall and four seasons: Gu’ and Deyr are the rainy seasons and Haga and Jilal are the dry seasons. Over the years, however, changing, unpredictable climate patterns have resulted in recurrent floods and drought experienced across the country.
DemographyThe first population and housing census for Somalia, conducted in 1975, published limited results. Following this, the findings from a second population census carried out in 1986 were not published officially, as they were considered to suffer from significant biases, especially over-counting. Since then, it has not been possible to conduct another census
1 I N T R O D U C T I O N

3
as the ongoing conflict in the country did not permit it.
In 2014, UNFPA, along with the statistical offices within the Ministries of Planning, embarked on the Population Estimation Survey of Somalia (PESS). The survey estimated the Somali population at 12.3 million, with 51 percent of the population living in urban areas, 23 percent living in rural areas and 26 percent in nomadic areas. Forty-nine percent of the total population were female, of which 50 percent were women of reproductive age (15-49 years). Children under five years of age accounted for 14 percent of the population, while persons aged 65 years and above made up 2 percent of the total population. Seventeen percent of the population comprised persons between five and nine years, whereas 53 percent of the population were within the 15-64 age bracket. The PESS 2014 is the most recent nationwide population estimation exercise undertaken in Somalia.
History and Politics Somalia obtained its independence on 1 July 1960 from Italy and, soon after, merged with the British Protectorate Somaliland, which became independent from the United Kingdom on 26 June 1960 to form the Republic of Somalia.
In August 2012, Somalia adopted a provisional
constitution that envisages the creation of federal member states that, will together, constitute the Federal Republic of Somalia.
The Government of Somalia has made significant progress towards the establishment of a stable, effective and democratic structure of government since the Federal Government of Somalia (FGS) was established on 20 August 2012. With the basic administrative structure of federal governance in place, federal institutions were established. State formation has progressed since then, with the emergence of new Federal Member States (FMS), namely, Jubbaland, Galmudug, South West, Hirshabelle, Banadir Administration, in addition to the existing Puntland and Somaliland. Continued efforts are underway to consolidate what has been achieved so far in laying the groundwork for stability and reconstruction in Somalia.
EconomySince the end of the tenure of the Transitional Federal Government (TFG) in 2012, Somalia’s economy has made remarkable progress after more than two decades of political unrest. However, Somalia still remains one of the poorest and least developed countries in Africa, with the Gross Domestic Product (GDP) of 4.7 million US dollars in 2018 (FGS 2020) and per capita estimated at approximately $315 in 2018 (World Bank 2018).
12.3mEstimated Somali population, according to PESS 2014
51%Living in urban areas
23%Living in rural areas
26%Living in nomadic areas

The Somali Health and Demographic Survey4
Somalia’s economy runs largely on agriculture and livestock. This accounts for 65% of both the Gross Domestic Product and the employment of the workforce. Livestock accounts for about 40% of GDP and more than 50% of export earnings. Other main products include fish, charcoal and bananas, sugar, sorghum and corn. According to the Central Bank of Somalia, in 2017, aggregate imports of goods and services averaged about US$ 2,892 million per year, which stands above the level prior to the start of the civil war in 1991. Exports of about US$ 451 million annually have also surpassed pre-war aggregate export levels (before 1991) (FGS 2020).
Health StatusThe morbidity and mortality trends have remained similar for years, with the general population affected by the same diseases, including diarrhoea, acute respiratory infections (ARI), malaria, malnutrition, and other vaccine-preventable diseases. The adult HIV prevalence rate in 2014 was estimated at 0.55 percent (UNAIDS 2014), however other health indicators remain poor. This could be attributed to the poor state of the health system that continues to suffer from a lack of resources and adequate data to inform planning. This is particularly noticeable in reproductive health, an area largely dependent on the adequacy and availability of health services, which are features of a well-functioning health system.
The Ministry of Health (MOH) works to support Somali people in attaining better health, which will enable them to participate in economic and social development and to contribute to the alleviation of poverty (Ministry of Health, 2014). To attain this goal, the government’s policies for the health sector is centred on the following priorities:
| Service delivery: Scaling up of essential and basic health and nutrition services (EPHS)
| Human resources for health: Overcoming the crisis of human resources for health
| Leadership and governance: Improving governance and leadership of the health
system | Medicines, medical supplies and
technologies: Enhancing access to essential medicines and technologies
| Health information system: Providing a functioning health information system
| Health financing: Health financing for progress towards Universal Health Coverage
| Health infrastructure: Improving health sector physical infrastructure
| Emergency preparedness and response: Enhancing health emergency preparedness and response
| Social determinants of health: Promoting action on social determinants of health and health in all policies
Survey Objectives and OrganizationThe main objective of the Somali Health and Demographic Survey (SHDS) was to provide evidence on the health and demographic characteristics of the Somali population that will guide the development of programmes and formulation of effective policies. This information would also help monitor and evaluate national, sub-national and sector development plans, including the Sustainable Development Goals (SDGs), both by the government and development partners.
The specific objectives of the SHDS were to:
| Estimate maternal and adult mortality | Examine basic indicators of maternal and
child health | Measure fertility and birth spacing | Describe patterns of knowledge
and awareness of the Human Immunodeficiency Virus (HIV) and other sexually transmitted infections
| Estimate infant and child mortality | Understand the extent and patterns
of gender-based violence and female circumcision

5
Sample DesignThe sample for the SHDS was designed to provide estimates of key indicators for the country as a whole, for each of the eighteen pre-war geographical regions, which are the country’s first-level administrative divisions, as well as separately for urban, rural and nomadic areas.
With the exception of Banadir region, which is considered fully urban, each region was stratified into urban, rural and nomadic areas, yielding a total of 55 sampling strata. All three strata of Lower Shabelle and Middle Juba regions, as well as the rural and nomadic strata of Bay region, were completely excluded from the survey due to security reasons. A final total of 47 sampling strata formed the sampling frame.
Through the use of up-to-date, high-resolution satellite imagery, as well as on-the-ground knowledge of staff from the respective ministries of planning, all dwelling structures were digitized in urban and rural areas. Enumeration Areas (EAs) were formed on-screen through a spatial count of dwelling structures in a Geographic Information System (GIS) software. Thereafter, a sample ground verification of the digitized structures was carried out for large urban and rural areas and necessary adjustments made to the frame. Each EA created had a minimum of 50 and a maximum of 149 dwelling structures. A total of 10,525 EAs were digitized: 7,488 in urban areas and 3,037 in rural areas. However, because of security and accessibility constraints, not all digitized areas were included in the final sampling frame—9,136 EAs (7,308 in urban and 1,828 in rural) formed the final frame. The nomadic frame comprised an updated list of temporary nomadic settlements (TNS) obtained from the nomadic link workers who are tied to these settlements. A total of 2,521 TNS formed the SHDS nomadic sampling frame.
The SHDS followed a three-stage stratified cluster sample design in urban and rural strata with a probability proportional to size, for the
sampling of Primary Sampling Units (PSU) and Secondary Sampling Units (SSU) (respectively at the first and second stage), and systematic sampling of households at the third stage. For the nomadic stratum, a two-stage stratified cluster sample design was applied with a probability proportional to size for sampling of PSUs at the first stage and systematic sampling of households at the second stage. To ensure that the survey precision is comparable across regions, PSUs were allocated equally to all regions with slight adjustments in two regions.
Within each stratum, a sample of 35 EAs was selected independently, with probability
BOX 1: Nomadic households
Nomadic households reside temporarily in areas known as Temporary Nomadic Settlements (TNS) for as long as they can access pasture and water in these locations. The duration of their stay in such places is mainly dependent on the amount of rain that falls within that season and how long the season will last. During the long rains, the nomads would be stationed in one location, between 60 to 90 days, and for the short rains they spend about 45 days, based on anecdotal information. In the dry seasons, nomads move long distances, including across regions, and into neighbouring countries in search of water and pasture.
Nomadic settlements usually affiliate themselves with local settlements along their paths of movement.
References to ‘nomadic areas’ in the SHDS report are made to locations where survey teams visited households within temporary nomadic settlements.

The main objective of the Somali Health and Demographic Survey was to provide evidence on the health and demographic characteristics of the Somali population that will guide the development of programmes and formulation of effective policies

©U
NFP
A S
OM
ALI
A/T
ob
in J
on
es

The Somali Health and Demographic Survey8
proportional to the number of digitized dwelling structures. In this first stage, a total of 1,433 EAs were allocated (to urban - 770 EAs, rural - 488 EAs, and nomadic – 175 EAs) representing about 16 percent of the total frame of EAs. In the urban and rural selected EAs, all households were listed and information on births and deaths was recorded through the maternal mortality questionnaire. The data collected in this first phase was cleaned and a summary of households listed per EA formed the sampling frames for the second phase. In the second stage, 10 EAs were sampled out of the possible 35 that were listed, using probability proportional to the number of households. All households in each of these 10 EAs were serialized based on their location in the EA and 30 of these households sampled for the survey. The serialization was done to ensure distribution of the households interviewed for the survey in the EA sampled. A total of 220 EAs and 150 EAs were allocated to urban and rural strata respectively, while in the third stage, an average of 30 households were selected from the listed households in every EA to yield a total of 16,360 households from 538 EAs covered (220 EAs in urban, 147 EAs in rural and 171 EAs in nomadic) out of the sampled 545 EAs.
In nomadic areas, a sample of 10 EAs (in this case TNS) were selected from each nomadic stratum, with probability proportional to the number of estimated households. A complete listing of households was carried out in the selected TNS followed by the selection of 30 households for the main survey interview. In those TNS with less than 30 households, all households were interviewed for the main survey. All eligible ever-married women aged 12 to 49 and never-married women aged 15 to 49 were interviewed in the selected households, while the household questionnaire was administered to all households selected. The maternal mortality questionnaire was administered to all households in each sampled TNS.
QuestionnairesFour types of questionnaires were used in the SHDS 2020: the Maternal Mortality Questionnaire, the Household Questionnaire and two individual questionnaires—Ever-married Woman’s Questionnaire and Never-married Woman’s Questionnaire.
Maternal Mortality QuestionnaireA stand-alone Maternal Mortality Questionnaire was used in all households during the listing phase to identify maternal deaths in the two years preceding the survey. This allowed the estimation of the Maternal Mortality Ratio (MMR) using a direct method. The methodology was adopted from the Yemen National Health and Demographic Survey carried out in 2013 and was used to obtain a more current estimate of the maternal mortality in Somalia.
Household and Individual Questionnaires
The Household Questionnaire, Ever-married Woman’s Questionnaire, and Never-married Woman’s Questionnaire were based on Yemen Health and Demographic Survey 2013 instruments, and was adapted to reflect the relevant population and health issues in the Somali context.
The questionnaires were further updated with relevant sections of the Demographic and Health Surveys (DHS) Program’s standard Demographic and Health Survey Questionnaires (DHS7).
Input was solicited from various stakeholders representing government agencies, particularly the ministries of health and planning, as well as international development partners. After the preparation of the questionnaires in English, they were translated into Somali. The questionnaires were further tested and refined in the field to ensure that culturally and religiously sensitive questions were appropriately worded.

9
The Household Questionnaire was used to list all of the members of and visitors to the selected households. Basic demographic information was collected on the characteristics of each person listed, including his or her age, sex, marital status, education, and relationship to the head of the household. For children under the age of 18, parents’ survival status was determined. The data obtained from the Household Questionnaire was used to identify ever- and never-married women eligible to be interviewed with the relevant individual questionnaire and those persons eligible for anthropometric measurements. The Household Questionnaire also collected information on the characteristics of the household’s dwelling unit, such as their source of drinking water; type of sanitation facility; materials used for the floor, walls, and roof of the dwelling unit; and ownership of various durable goods. In addition, the questionnaire included questions about disability, as well as out-of-pocket expenditure on health.
The Ever-married Woman’s Questionnaire was used to collect information from all women aged 12 to 49 years who were currently married, divorced, abandoned, or widowed. In all households, eligible women were asked questions on the following topics:
| Background characteristics, such as age, education, literacy and media exposure
| Birth history and child mortality | Knowledge and use of family planning
methods | Antenatal care, delivery, and postnatal
care | Breastfeeding and infant feeding practices | Vaccinations and children’s illnesses | Marriage and sexual activity | Fertility preferences | Women’s work and partners’ background
characteristics | Knowledge of HIV/AIDS and methods of
HIV transmission | Adult and pregnancy-related mortality
The Never-married Woman’s Questionnaire was used to collect information from all women aged 15 to 49 years who had never been
married. In all households, eligible women were asked questions on the following topics:
| Background characteristics, such as age, education, literacy and media exposure
| Violence against women
In this survey, Computer-Assisted Personal Interviewing (CAPI) was used, with interviewers using smart phones to record responses during interviews. The phones were equipped with Bluetooth technology to enable remote electronic transfer of completed questionnaires from interviewers to supervisors. Supervisors transferred completed files to the CSWeb server 1 instances whenever internet connectivity was available. Any revision to the questionnaire was received by the supervisors and interviewers by simply synchronizing their phones with the CSWeb server, which was created specifically for the SHDS. The CAPI data collection system employed in the SHDS 2020 was developed by UNFPA using the mobile version of the Census and Survey Processing System (CSPro)2. The CSPro software was developed jointly by the U.S. Census Bureau, the DHS Program and Serpro S.A.
Training
Training for the SHDS was two-phased: for the Listing/Maternal Mortality Ratio data collectors and for the Main Survey data collectors (those administering the household, ever-married woman and never-married woman questionnaires).
Listing and MMR TrainingTraining of Trainers (ToT) sessions were conducted in two locations: Mogadishu and Hargeisa, facilitated by technical staff from
1 CSWeb is a web application that facilitates the secure transfer of questionnaires or files between a user’s tools (with CSEntry) and a web server.
2 CSPro is a public domain software package that allows users to enter, edit, tabulate and disseminate census and survey data.

The Somali Health and Demographic Survey10
UNFPA. Forty-nine trainers were trained in household listing concepts (identification of structures, dwelling units, and EA boundaries), interview techniques, interviewers’ and supervisors’ roles, age probing techniques, fieldwork procedures, sampling techniques, importance of data on births and deaths, recognizing and handling age inconsistencies, identification of maternal deaths and CSPro mobile data collection application. Thereafter, these trainers transferred this knowledge and skills to 247 data collectors from across the country in Hargeisa, Las Anod, Badhan, Garowe, Bossaso, Galkacyo, Mogadishu, Baidoa, Kismayo, Adado, Jowhar, Beletweyne, Waajid, Baardhere and Hudur towns. A pretest was carried out using both paper questionnaires and CAPI to assess the understanding of the trainees. Modifications were made to the questionnaire and survey methods, based on lessons drawn from the pretest. Participants were assessed through both theoretical evaluations in class as well as observations made on their survey implementation during the pretest.
Main Survey Training The UNFPA technical team trained 19 master trainers in October 2017 in Kigali, Rwanda. These master trainers were all Somali health and demographic professionals who participated in the development and review of data collection tools. Consequently, along with the master trainers, UNFPA trained 51 trainers of trainers. Finally, 347 supervisors and interviewers—299 women (constituting 85 percent of the data collectors who had been drawn from the medical profession (nurses, midwives and doctors)) and 48 men were trained by the ToTs in Boroma, Hargeisa, Burao, Garowe and Mogadishu. At the end of each training, a pretest was conducted using manual questionnaires and CAPI to ensure that all the trainees had acquired a minimum level of knowledge and skills required for the SHDS. The selection of supervisors was based on performance in both in-class assessments and field pretests.
FieldworkData collection in urban and rural areas was carried out in two distinct phases: listing/MMR and main survey. Data collection in the nomadic areas was carried out almost simultaneously due to the mobility of nomadic households.
Listing and MMR Data CollectionThe listing of households and MMR data collection began in February 2018 and was completed in January 2019 for urban and rural areas. As a result of insecurity, flooding and the time taken to engage all of Somalia’s Federal Member States, this phase did not take place concurrently throughout the country. Fieldwork was carried out by 64 teams, each consisting of one supervisor, four enumerators and a driver. An Android platform developed in CSPro was used for data collection. Each team was assigned mobile phones (one for each enumerator and one for the supervisor), EA Maps (in A0 and A3 sizes), EA Google Earth files, control sheets, notebooks, pens and document folders. In addition, 34 data quality controllers (trainers, GIS staff, survey/state directors, and regional coordinators) were coordinating and supervising fieldwork. In security-compromised areas, survey teams were supported by security guards and facilitators in the field.
Main Survey Data CollectionThe trained interviewers and supervisors were deployed to collect data from 30 selected households in each of the 10 sampled enumeration areas in each region-stratum. Selected households were obtained from a complete list of households in the EA. Data collectors were supported by the listing team who were well-versed in reading maps and could identify the EA boundaries as well as the selected households. Each interviewer collected data from approximately two households per day.
The nomadic households were listed a day prior to the day of enumeration in each TNS
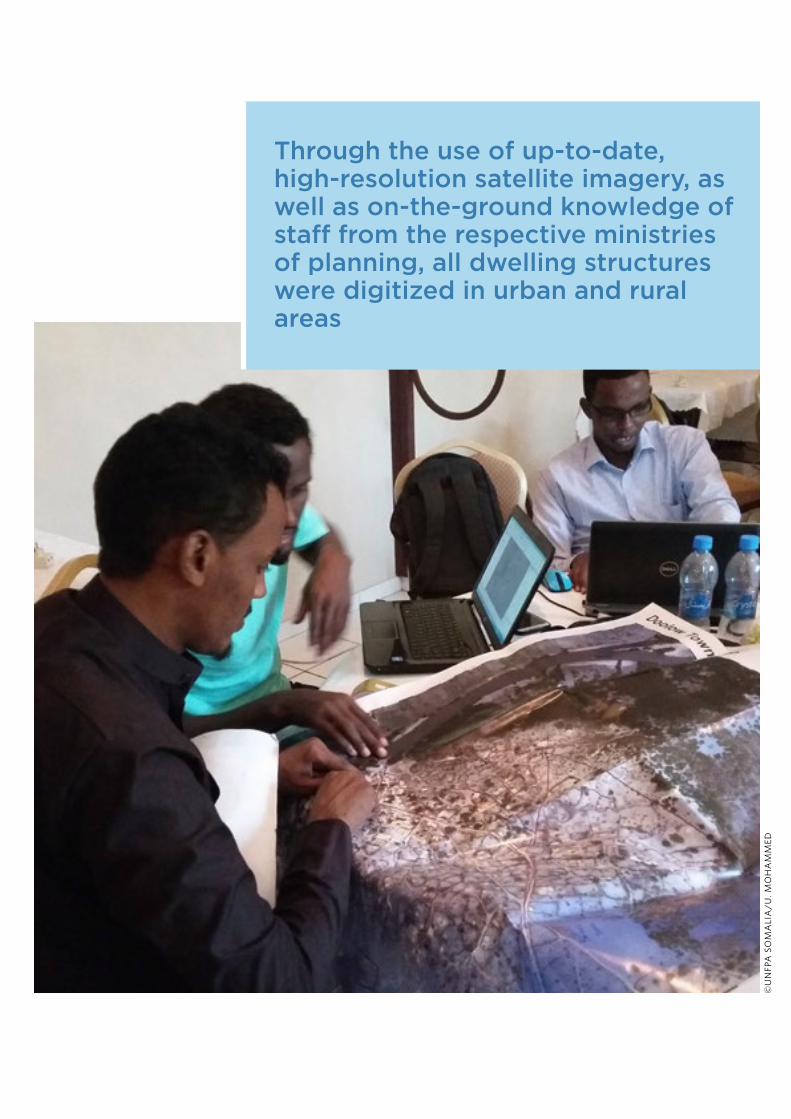
Through the use of up-to-date, high-resolution satellite imagery, as well as on-the-ground knowledge of staff from the respective ministries of planning, all dwelling structures were digitized in urban and rural areas
©U
NFP
A S
OM
ALI
A/U
. MO
HA
MM
ED

The Somali Health and Demographic Survey12
to obtain a current and complete list of households. During listing, coordinates of all nomadic household structures and the names of the head of each household were recorded. A sample of 30 households was then selected by the listing team and given to the supervisors of the enumerating team on their first day of enumeration. Subsequent to this, supervisors allocated households to be interviewed to enumerators. The MMR questionnaire was administered by both listing and enumerating teams in nomadic areas. The enumerating team collected this data from the 30 sampled households, while the listing team collected data on maternal deaths from the remaining unsampled households in the TNS.
Data Processing
Data processing for the SHDS was carried out by a core team of 17 people drawn from in-country statistical offices and UNFPA, with several members playing multiple roles. All team members had previously participated in the training and fieldwork for the SHDS.
Data from the SHDS was sent to a password-protected cloud CSWeb server. The electronic files were downloaded as csdb files exported to SPSS3 and Stata4 for data processing. Three people served as CSPro data administrators. They were responsible for downloading the data from server instances and merging them, following which, a larger team worked on producing the six DHS standard type files, which were then handed over to other data processing teams. A team of three GIS specialists carried out spatial editing of all household records from the server, assigning them to the correctly sampled EA codes. Concurrently, the data tabulation and re-coding teams produced the tabulation plan and re-coding manual following DHS standards but contextualized to the SHDS. Two team members were tasked with computing the
3 SPSS is a software package used for statistical analysis. SPSS originally stood for Statistical Package for the Social Science.
4 A statistical software for data science.
sampling and survey weights.
Response Rates
Table 1.1 presents response rates for the SHDS 2020. A total of 16,360 households were selected for the sample, of which 15,870 were occupied. Of the occupied households, 15,761 were successfully interviewed, yielding a response rate of 99 percent. The response rate was similar throughout all the three places of residence. The SHDS 2020 interviewed 16,715 women—11,884 ever-married women and 4,831 never-married women.
Quality Assurance
A variety of tools and mechanisms were used as part of the quality assurance arrangements throughout the implementation of the SHDS 2020. These included a consultative approach to critical decision making, extensive training and competitive recruitment of survey personnel, independent third-party monitoring, the Global Positioning System (GPS) tracking of field operations, peer review arrangements and validation meetings.
Consultative approach to critical decision making– all key decisions concerning the survey, including its methodology, instruments, field work, tabulation plan, reports and data access, were discussed, designed and formulated following extensive consultations with Somali government partners, national and international experts and development partners where applicable. The idea was to draw on the widest possible expertise, as well as to ensure validation and in-country ownership.
Extensive training and competitive recruitment of survey personnel– given the national execution of the survey, UNFPA put in place an extensive training programme for

13
Number of households, number of interviews, and response rates, according to residence (unweighted), SHDS 2020
ResultResidence
Urban Rural Nomadic Total
Household interviews
Households selected 6,684 4,677 4,999 16,360
Households occupied 6,443 4,469 4,958 15,870
Households interviewed 6,390 4,444 4,927 15,761
Household response rate1 99.2 99.4 99.4 99.3
Interviews with ever-married women aged 15-49
Number of eligible ever-married women 5,758 3,560 3,570 12,888
Number of eligible ever-married women interviewed 5,256 3,193 3,435 11,884
Eligible ever-married women response rate2 91.3 89.7 96.2 92.2
Interviews with never-married women aged 15-49
Number of eligible never-married women 3,037 1,235 1,042 5,314
Number of eligible never-married women interviewed 2,691 1,117 1,023 4,831
Eligible never-married women response rate3 88.6 90.4 98.2 90.9
Interviews with all women aged 15-49
Number of eligible women 8,795 4,795 4,612 18,202
Number of eligible women interviewed 7,947 4,310 4,458 16,715
Eligible women response rate4 90.4 89.9 96.7 91.81 Households interviewed/households occupied 2 Ever-married women interviewed/eligible ever-married women3 Never-married women interviewed/eligible never-married women4 All women interviewed/eligible ever-married and never-married women
Table 1.1 Results of the household and individual interviews
survey personnel that worked on a “cascade” principle, with training of trainers at various levels. In each training, a test was administered at the end, and trainees who scored 80 percent and above were retained for participation in the survey.
Learning and Monitoring Programme for Somalia (LAMPS)– an Independent Third-Party Monitoring (TPM), engaged by the Department for International Development (DfID), provided periodical monitoring of SHDS activities throughout the survey’s implementation phase. The activities selected for verification, as well as field teams and beneficiaries to interview, were all randomly selected by the LAMPS teams throughout the entire phase of the survey. The findings from LAMPS provided the SHDS technical team with specific areas in which to improve the quality of SHDS training and collection of data
from selected households. LAMPS consistently rated SHDS activities as delivered according to how they were designed and planned.
GPS tracking of field operations– During field data collection, the SHDS employed the use of handheld devices with embedded GPS, which allowed geo-referencing and the collection of geo-located data. It also enabled the tracking of fieldwork and ensured that the sample design is adhered to. Further, the geo-referenced data aided in data editing.
Consistency checks of the data– Geo-referenced listed data was cross-checked with digitized dwelling structures to ensure listing was undertaken in the correct EAs. Similarly, during the main survey, information collected during listing—which included coordinates, names of household members and other landmarks—helped to ensure teams visited the

The Somali Health and Demographic Survey14
correct households. Further, listing information on the target population, women of child bearing age and children under five years of age, aided in monitoring data collection by the main survey team.
Peer review arrangements– UNFPA approached prominent experts in the various fields related to the SHDS survey, including from the League of Arab States Pan Arab Project for Family Health (PAPFAM) expert group, National Statistical Offices (Statistics Norway, Statistics Sweden and Office for National Statistics), UN Habitat, and academia, to serve as peer reviewers of key aspects of SHDS and its outcomes. These included the sample
design, methodology for covering the nomadic population, the use of GIS and satellite imagery in the preparations for the survey, the use of Brass-type techniques for the analysis of the survey data, and the SHDS reports themselves.
Validation forums– The Somali partners and international experts have reviewed the SHDS data, reports and other outcomes of the survey with the aim to validate the processes and findings.

15
Archillorem quissecusam ent velluptiam dolorporion providem id mo consequ atatiis eaque net qui qui que sunto is iducium quas assimincias velecto tat
02Household and Housing Characteristics

©U
NFP
A S
OM
ALI
A
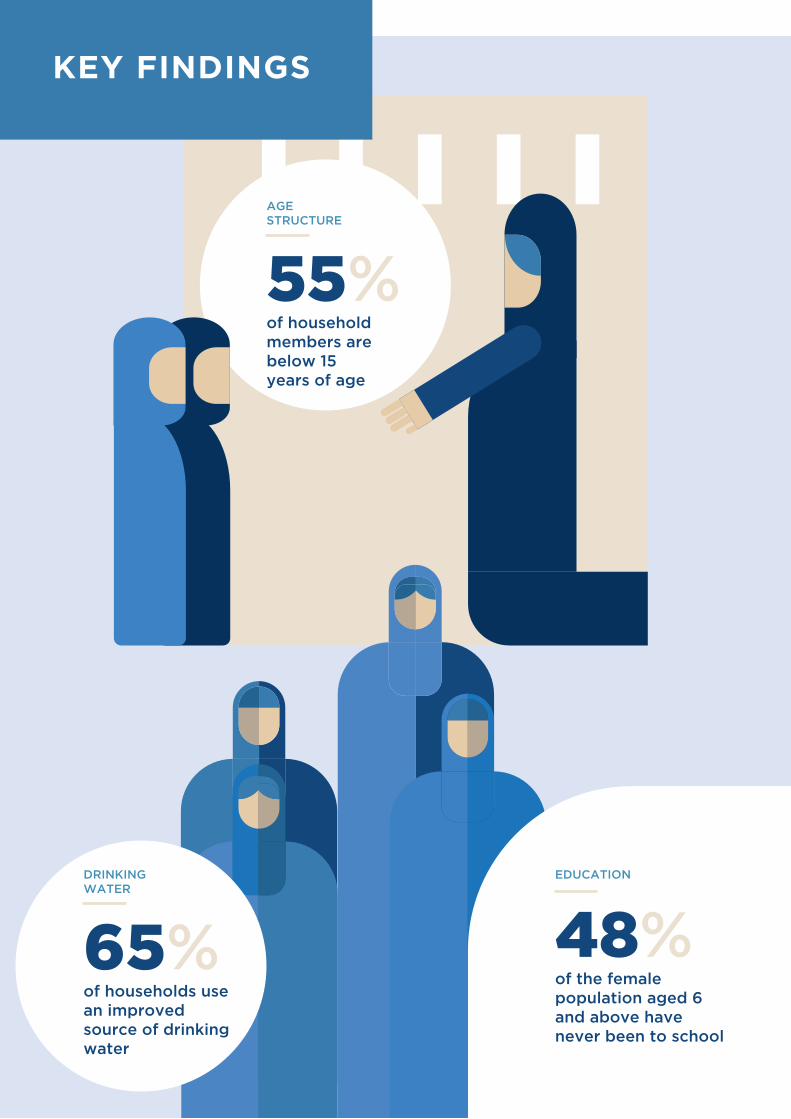
KEY FINDINGS
AGE STRUCTURE
55%of household members are below 15 years of age
BIRTH REGISTRATION
3%of children aged 2-4 years have their birth registered
EDUCATION
48%of the female population aged 6 and above have never been to school
SANITATION
57%of households have an improved sanitation facility
DRINKINGWATER
65%of households use an improved source of drinking water
MOBILE PHONE OWNERSHIP
74%of households own a mobile phone

The Somali Health and Demographic Survey20
This chapter presents the
socioeconomic characteristics
of the household members that
were covered by the Somali
Health and Demographic Survey
2020. Information collected
included respondents’ age,
sex, type of residence (urban,
rural and nomadic household
members) and educational status,
as well as household facilities,
characteristics and possessions.
The profile of the households
presented in this chapter will
inform the understanding
of SHDS 2020 results in the
following chapters, while serving
as a foundation for social and
economic development planning.
The SHDS 2020 collected information from all usual residents of a selected household (de jure population) and persons who had stayed in the surveyed household the night before the interview (de facto population). Although the difference between these two populations is small, to avoid double counting, all tables
BOX 2.1 Key definitions
HouseholdA person or group of related or unrelated persons who live together in the same dwelling unit(s) or in connected premises, who acknowledge one adult, male or female, as the head of the household, who share the same housekeeping arrangements, and who are considered a single unit.
De facto populationAll persons who stayed in the selected households the night before the interview (whether usual residents or visitors).
De jure populationAll persons who are usual residents of the selected households, whether or not they stayed in the household the night before the interview.
Age in completed years (Age at last birthday)This is the most common definition of age, where it is expressed as the number of completed years lived by a person. Other definitions include exact age, which is used mostly for modelling purposes, and age reached during the year.
2 H O U S E H O L D A N D H O U S I N G C H A R A C T E R I S T I C S

21
in this report refer to the de facto population, unless otherwise specified.
Household and Housing Characteristics
Age and Sex Composition
Age and sex are important demographic variables that are the primary basis of demographic classification in vital statistics, census and surveys. They are the basis for studying patterns of mortality, fertility, fertility preference, age at first marriage and other information about the inhabitants of a country.
The SHDS 2020 collected information on the age in completed years for each household member. When the age was not known, interviewers asked for dates of birth in the Gregorian calendar/Somali historical calendar. Age was then calculated using conversion charts, specifically designed for this purpose.
Table 2.1 presents the distribution of households members, by age, residence (urban, rural and nomadic) and sex.
The age structure of the household members is typical of a society with a young population. Having one of the highest fertility rates in the world, Somalia has a broad-based age pyramid, with 55 percent of household members below 15 years old. The sex and age distribution of the household members is presented in the population pyramid in Figure 2.1.
The population pyramids in Figure 2.1 are in line with a developing country’s population where there is a high fertility and mortality rate, which demographically represents a young population. There are more boys than girls among children under 15 years of age, and more women than men at the older ages. This is a pattern observed universally, which is driven by the sex ratio at birth (under normal
circumstances, around 105 boys are born for every 100 girls) and by the sex differences in mortality as women generally have lower death rates compared to men.
Regardless of the type of residence, the age pyramids in Figure 2.1 sharply taper to become narrower above age 55. This indicates high mortality rates among the older age groups. Around two-thirds of Somalis are aged less than 20 years and around three-quarters (78 percent) are aged below 30 years. Youth between 15-29 years of age constitute 23 percent of the household members, while older people (65 years and above) comprise only 3 percent of the household members. Forty-two percent of the household members are within the working age population (15-64 years), highlighting the need to create jobs and ensure that training or education offered addresses the needs of the labour market.
The pyramids in Figure 2.1 have patterns that are similar to Figure 2.2, which presents the population pyramid from the Population Estimation Survey (PESS), Somalia, 2014 (UNFPA 2014). Overall, the number of household members aged between 50-54 years has increased, compared to the same category in the PESS. A notable feature of the 2014 PESS age pyramid is the relatively low proportion of the age group 0-4, which is the result of the under-counting of young children—a common feature of surveys in countries with weaker statistical systems. The fact that the under-counting is not so pronounced in the 2020 SHDS data attests to the quality of the survey and the progress that the Somali statistical system is making.
Somalia has a broad-based age pyramid, with 55 percent of the household members below 15 years old

The Somali Health and Demographic Survey22
22.0 18.0 14.0 10.0 6.0 2.0 2.0 6.0 10.0 14.0 18.0 22.0
<5
5-9
10-14
15-1920-24
25-29
30-34
35-39
40-44
45-49
50-54
55-59
60-64
65-6970-74
75-79
80+
Urban population distribution by age and sex
Female Male
22.0 18.0 14.0 10.0 6.0 2.0 2.0 6.0 10.0 14.0 18.0 22.0
<55-9
10-1415-19
20-24
25-2930-34
35-3940-44
45-4950-5455-59
60-6465-69
70-7475-79
80+
Nomadic population distribution by age and sex
Female Male
22.0 18.0 14.0 10.0 6.0 2.0 2.0 6.0 10.0 14.0 18.0 22.0
<55-9
10-14
15-1920-24
25-2930-34
35-3940-44
45-4950-5455-59
60-6465-69
70-7475-79
80+
Rural population distribution by age and sex
Female Male
22.0 18.0 14.0 10.0 6.0 2.0 2.0 6.0 10.0 14.0 18.0 22.0
<5
5-910-14
15-1920-24
25-2930-34
35-3940-4445-49
50-5455-59
60-6465-69
70-7475-79
80+
Total population distribution by age and sex
Female Male
The SHDS 2020 shows about 38 percent of the female household members are within childbearing age (15-49 years). This can have implications on the country’s future birth rates. The large number of potential mothers creates a population momentum and is a strong indication of a potential spike in population growth that Somalia is likely to experience in the coming years. The medium variant of the latest revision of the UN population prospects (United Nations 2019) projects that the population of Somalia could more than double in the next 30 years to close to 35 million in 2050. These projections need to be taken into account by the relevant policymakers and stakeholders need to be encouraged to consider preparing for the provision of adequate social services.
Household CompositionTable 2.2 shows the distribution of households covered by the survey by the sex of the head of household and the number of household members, according to urban, rural and
nomadic residence. About one-third (32 percent) of households are headed by women (33 percent of urban and 33 percent of rural households, and 28 percent of nomadic households).
The average household size in Somalia is 6.2 persons, slightly higher than the 5.9 persons per household recorded in the PESS 2014 (UNFPA 2014). Urban households, which have 6.6 persons per household, are slightly larger than rural households, with 5.7 persons per household. Nomadic households have the lowest average household size, with 5.3 persons. According to the 2014 PESS, the nomadic and urban households had the highest average household sizes, at 6.5 and 6.4 persons respectively, rural areas had a household size of 5.8 persons. An improved methodology for enumerating nomadic households was adopted in the SHDS 2020. This could explain the deviation from the 2014 PESS that showed the mean household size was largest among the nomads.
Figure 2.1 Distribution of population by age and sex according to residence, SHDS 2020

23
Table 2.2 indicates that 28 percent of households have a foster child and/or orphaned children, 15 percent have foster children, 14 percent have single orphans and 4 percent have double orphans. There is a slight difference in the number of households with foster children among the three types of residence. In the urban households, 17 percent have foster children, while this proportion was 14 percent in the rural and 13 percent in the nomadic households.
EducationThe level of education is an important characteristic, as it affects behaviour, including health-related behaviours and choices made in relation to reproduction, contraceptive use, child health, and hygiene. Access to education is considered a human right that inherently influences the development of a country. It is one of the key national responses that would guarantee orphans and children from different backgrounds equal access to better lives as they grow up.
Educational Attainment Information on educational attainment of the male and female household members aged six
and above is presented in Table 2.3a and Table 2.3b. The survey results show that educational attainment varies across age groups. The age group with the lowest number of people with no education is 20-24 years among the male household members (33 percent) and 15-19 among the female household members (36 percent). Among the male household members, those older than 55 years have more people that have completed secondary education compared to men in younger age groups. In contrast, the female household members show slight variations across the different age groups, with those in age cohorts 20-24 and 60-64 being more likely to have completed secondary education.
The chances of progression to higher education are slightly better for urban dwellers compared to people living in rural and nomadic areas,
Female Male
Population pyramid (PESS 2014)
10 8 6 4 2 0 2 4 6 8
0-4 5-9 10-14
15-19 20-24 25-29 30-34
35-39
40-44
45-49
50-54
55-59
60-64
65-69
70-74
75-79
80-84
85+
10
Figure 2.2 Population pyramid from the Population Estimation Survey, Somalia, 2014
The chances of progression to higher education are slightly better for urban dwellers compared to people living in rural and nomadic areas, as educational facilities are concentrated in the urban centres

The Somali Health and Demographic Survey24
as educational facilities are concentrated in the urban centres. The nomadic household members are the most disadvantaged in terms of accessing education. Seventy-eight percent of nomadic male household members have no education, 1 percent have completed primary and secondary and less than 1 percent have post-secondary education level. Similar indicators for women are worse than those for men. Eighty-four percent of the nomadic female household members have no education.
Figure 2.3 compares educational attainment by sex. Educational attainment is higher for men than it is for women. Overall, 48 percent of the female population aged six and above have never been to school, in comparison to 45 percent of men and boys. Thirty-three percent of female household members and 28 percent of the male household members have had some primary education. Twenty-one percent of men have attended secondary or higher schooling, compared to 14 percent of women.
School Attendance RatiosTable 2.4 presents data on net attendance ratios (NARs) and gross attendance ratios (GARs) by school level, sex, and place of residence. The NAR for primary schooling is measured as the proportion of children aged 6-13 attending primary school, and for
secondary schooling as the population aged 14-17 attending secondary school. The GAR for primary schooling is measured as the total number of primary school students relative to the official primary-school-age population; similarly, GAR for secondary schooling refers to the number of secondary school students relative to the official secondary-school-age population. The GAR is nearly always higher than the NAR for the same level because the GAR includes participation by those who may be older or younger than the official age range for that level. A NAR of 100 would indicate that all those in the official age range for the specific level are attending school at that level. The GAR can exceed 100 if there is significant overage or underage participation at a given level of schooling.
Nineteen percent of the total children attending primary school are of the right age for that level. At secondary level, only nine percent of the total children attending are of the right age for that level.
As shown in Figure 2.4 below, there is little difference between the NAR of boys and girls at the primary level (20 percent and 17 percent, respectively). The NAR is higher for males than females at the secondary level (11 percent and 8 percent, respectively).
45.2
27.5
3.95.5
7.8 7.5
2.6
47.8
32.6
4.8 5.4 5.1 3.90.5
No education Some primary Completedprimary
Some secondary Completedsecondary
Higher education Don't know
Male Female
Figure 2.3 Educational attainment by sex
Percent distribution of the de facto male and female populations aged six and over by educational attainment

25
19.717.2
10.6
7.9
28.6
25.2
28.1
19.6
Male Female Male Female
Primary Secondary
Net Attendance Ratio (NAR) and Gross Attendance Ratio (GAR) for the defacto household population by sex and level of schooling
NAR GAR
The NAR is slightly lower in rural areas than in urban areas, and is very low among the nomadic household members at primary level. The GAR is higher for males compared to females, at 29 and 25 percent respectively, at the primary-school level, and 28 and 20 percent, respectively, at the secondary-school level, indicating higher school attendance among males than females. As the table shows, both the NAR and GAR at primary and secondary school levels increase with increasing wealth.
Housing Characteristics
Water Supply
Access to clean drinking water is one of the SDGs and a target outlined in Somalia’s National Development Plan (NDP) 9. The different types of water sources and sanitation facilities available to a population are important determinants of health, particularly among children. Good hygienic and sanitation practices can reduce exposure to and repercussions of preventable diseases. Conversely, poor quality of water and water scarcity also shape livelihood choices, such as education, for people living in developing countries.
The source of drinking water for a household is an indicator of how safe it is to consume. Sources that are likely to provide uncontaminated water that is suitable for drinking are known as improved water sources (Table 2.5a). These include piped water, protected dug wells, tube wells or boreholes,
Figure 2.4 School attendance ratios
Net Attendance Ratio (NAR) and Gross Attendance Ratio (GAR) for the de facto household population by sex and level of schooling
At secondary level, only nine percent of the total children attending are of the right age for that level

The Somali Health and Demographic Survey26
rainwater, and bottled water. The lack of ready access to a water source may limit the quantity of suitable drinking water that is available to a household. Even where water is obtained from an improved source, if it is fetched from a source that is not immediately accessible to a household, it may be contaminated during transportation or storage. By treating water effectively at home, families can improve the quality of household drinking water.
The prevalence of preventable, water-borne diseases such as diarrhoea and dysentery in Somalia can be reduced by introducing and using improved water sources that are readily available to the households. According to the survey, 65 percent of households get their drinking water from improved water sources. Slightly over three-quarters (76 percent) of urban households have access to improved water sources, while just over half (55 percent) of rural households and 35 percent of nomadic households have access to improved water sources (Table 2.5a and Figure 2.5).
Forty-two percent of household members have access to piped water coming into their dwelling, yard or plot.
Twelve percent of the households travel for at least 30 minutes or longer to get water. Nomadic household members travel the longest distances to get water. Forty-five
percent of nomadic households, 13 percent of rural and 5 percent of urban households travel longer than 30 minutes, to access improved water sources.
As shown in Table 2.5b, only 16 percent of households treat water before drinking it, 22 percent of the urban households and 9 percent in rural settings. No nomadic households use appropriate treatment methods for drinking water.
The most common method of water treatment is bleaching/chlorination, used by 13 percent of households—20 percent in urban households and 6 percent in rural settings. None of the nomadic households interviewed use bleaching/chlorination.
Sanitation FacilitiesWith adequate sanitation and means of disposal of human excreta, which are both fundamental needs and human rights—as well as with personal hygiene—people are assured of the ability to maintain their dignity and protection from a large number of diseases.
The inadequate disposal of human excreta and personal hygiene is associated with a range of diseases including diarrhoeal diseases. Improved sanitation can reduce diarrheal disease by more than a third (Cairncross
76.255.3
34.5
65.2
23.844.7
65.5
34.8
Urban Rural Nomadic Total
Percent distribution of household drinking water sources by residence
Improved source Unimproved source
Figure 2.5 Household drinking water sources
Percent distribution of household drinking water sources by residence

27
12%of the households travel for at least 30 minutes or longer to get water
©A
U U
N I
ST P
HO
TO
/To
bin
Jo
nes

The Somali Health and Demographic Survey28
S., Hunt C., Boisson S., et al. 2010), and can significantly lessen the adverse health impacts of other disorders responsible for death and disease among millions of children in developing countries. An improved sanitation facility is defined as one that hygienically separates human excreta from human contact. Improved sanitation facilities for excreta disposal include flush or pour flush to a piped sewer system, septic tank, or pit latrine, ventilated improved pit latrine, pit latrine with slab, and use of a composting toilet. The SHDS considers improved toilets as those that flush or pour flush into a piped sewer system or septic tank.
A household is classified as having a basic toilet facility if the toilet is used by only members of one household (i.e. it is not shared) and if the facility used by the household separates the waste from human contact as proposed by the the United Nations Children’s Fund (UNICEF) and (WHO) (UNICEF, WHO 2012).
Table 2.6 shows that 57 percent of households use sanitation facilities with basic sanitation services that would be considered as improved toilet facilities.
Access to sanitation facilities within households varies greatly in urban and rural residences, as shown in Table 2.6. A majority of households in urban areas (72 percent) have
access to improved toilet facilities. In rural and nomadic households, 49 percent and 1 percent respectively have access to sanitation.
As indicated in Figure 2.6, the prevalence and use of open defecation is higher in nomadic settings than in rural and urban settings.
Housing Characteristics Table 2.7 presents the distribution of households by the dwelling characteristics and amenities. Nationwide, 44 percent of households use electricity, with variations in geographical locations and type of residence. In urban areas, 66 percent of households use electricity for lighting, compared to 17 percent of rural households, and less than 1 percent of nomadic households.
The kind of flooring used in a house can be indicative of the lifestyle its inhabitants have. Across Somalia, more than half (59 percent) of dwellings have floors made of earth or sand.
Figure 2.6 Household sanitation facilities
Percent distribution of households by type of toilet/latrine facilities in use and place of residence
72.3
49.2
1.0
56.8
23.8
26.9
4.9
22.3
3.9
23.9
94.1
20.9
Urban Rural Nomadic Total
Percent of households by type of toilet/latrine facilities and place of residence
Improved facility Unimproved facility Open Defecation
57 percent of households use sanitation facilities that would be considered as improved toilet facilities

29
0.3Tractor
0.4Boat /canoe
0.7Motorcycle/scooter
1.2Bicycle
1.2Animal plough
1.3Rickshaw
2.3Donkey cart
4.3Car/truck
5.3Non-mobile telephone
6.9Computer
7.3Refrigerator
10.1Air conditioner/fan
11.9Internet
17.2Ownership of agriculture land
19.1Radio
20.5Television
38.6Ownership of livestock
Mobile phone 74.4
In urban and rural residences, cement is the second most common type of flooring, used in 33 percent of urban dwellings and 24 percent of rural dwellings.
Firewood is the most common source of fuel used for cooking in nomadic and rural areas, with 93 percent of nomadic households and 65 percent of rural households using firewood. In urban areas, 62 percent of households use charcoal, whereas in rural settings, 25 percent use this type of fuel for cooking.
Household PossessionsInformation on the ownership of durable goods and other possessions is presented in Table 2.8. The availability of durable consumer goods
is an indicator of a household’s socioeconomic status and access to various benefits. For example, access to the radio can increase exposure to innovative ideas, whereas transport vehicles can provide access to services outside of the local area.
As shown in Figure 2.7, 21 percent of households in Somalia own a television, and 74 percent own a mobile telephone.
Keeping up with technological advances and connecting with friends and family is a top priority in the majority of households: Eighty-one percent of people living in urban households, 67 percent in rural dwellings and 59 percent of nomadic households own simple mobile telephones with access to fm radio. In addition, around 23 percent of urban households, 16 percent of rural households and 8 percent of nomadic households own radios (Figure 2.8).
Figure 2.7 Household possessions
Percent of household possessions


Sixty-seven percent in rural dwellings and fifty-nine percent of nomadic households own simple mobile telephones with access to fm radio
©A
U U
N I
ST P
HO
TO
/Ily
as A
hmed

The Somali Health and Demographic Survey32
Figure 2.9 Wealth quintiles
Percent distribution of de jure population by wealth quintile and place of residence
3.6
17.322.9
27.0 29.331.6 31.8
20.6
10.65.4
90.3
4.9 2.3 1.9 0.5
Lowest Second Middle Fourth Highest
Percent of de jure population by wealth quintile and place of residence
Urban Rural Nomadic
Figure 2.8 Household effects
Percent of households effects ownership by place of residence
Six percent of urban households own a car or truck. As in many developing countries, several Somalis families value livestock and regard them as assets: Almost all nomadic households (95 percent) own livestock. Fifty-five percent of rural households and 19 percent of urban households own livestock.
Household Wealth
In addition to presenting standard background characteristics, many of the results in this report
are shown by wealth quintiles, an indicator of the economic status of households. The SHDS 2020 did not collect data on consumption or income, but the information collected on dwelling and household characteristics, consumer goods, and assets is used as a measure of socioeconomic status. The resulting wealth index is an indicator of the relative level of wealth that is used as a proxy for expenditure and income measures. Each household asset for which information is collected is assigned a ‘weight’ or ‘factor score’ generated through principal components analysis. The resulting asset scores are standardized in relation to a standard normal distribution with a mean of
23.1
32.1
81.0
7.111.0
18.615.5
4.6
67.0
2.0 1.2 2.3
8.4
0.5
59.3
3.40.2 1.2
Radio Television Mobile phone Non-mobiletelephone
Computer Internet
Percent of households effects ownership by place of residence
Urban Rural Nomadic

zero and a standard deviation of one.
Table 2.9 shows the distribution of the household members into five wealth quintiles (five equally divided levels) based on the wealth index by residence. These distributions indicate the degree to which wealth is evenly (or unevenly) distributed across Somalia. As expected, according to the SHDS findings, urban areas are wealthier than rural and nomadic areas. For example, within urban households, 29 percent of households belong to the highest wealth quintile, followed by 5 percent in rural areas. Less than 1 percent in nomadic areas belong to the wealthiest households, indicating that the most affluent or wealthier households live in urban settings.
Birth Registration
The registration of births is the inscription of the facts of a birth into an official log. A birth certificate is issued as proof of the registration of birth. Information on the registration of births was collected in the household interviews by
asking whether children under the age of 5 had a birth certificate. If the interviewer was informed that the child did not have a birth certificate, then he/she probed further to ascertain whether the child’s birth had been registered with the civil authority.
Almost all children did not have a birth certificate. Four percent of children under two years were registered, of which less than 1 percent had a birth certificate. These figures may be significantly low due to the lack of civil registration and the lack of a vital statistics system. The levels of registration were generally low and no significant variations were recorded across the country, as shown in Table 2.10.
List of Tables
Table 2.1 Household population by age, sex, and residence 34
Table 2.2 Household composition 35
Table 2.3a Educational attainment of the male household population 36
Table 2.3b Educational attainment of the female household population 37
Table 2.4 School attendance ratio 38
Table 2.5a Household drinking water 39
Table 2.5b Treatment of household drinking water 40
Table 2.6 Household sanitation facilities 41
Table 2.7 Housing characteristics 42
Table 2.8 Household possessions 43
Table 2.9 Wealth quintiles 44
Table 2.10 Birth registration of children under age five 44

The Somali Health and Demographic Survey34
Percent distribution of the de facto household population by various age groups and percentage of the de facto household population aged 10-19, according to sex and residence, SHDS 2020
Background characteristics
Urban Rural Nomadic Total
Male Female Total Male Female Total Male Female Total Male Female Total
Age
<5 20.8 19.6 20.2 22.1 19.8 20.9 20.2 19.6 19.9 21.1 19.6 20.3
5-9 20.5 18.3 19.3 19.7 18.5 19.1 19.4 18.8 19.1 20.2 18.4 19.3
10-14 15.6 15.4 15.5 14.7 14.4 14.6 14.8 14.5 14.7 15.3 15.1 15.2
15-19 10.6 12.0 11.3 9.9 10.7 10.3 9.4 10.2 9.8 10.3 11.5 10.9
20-24 5.5 7.1 6.3 5.3 7.2 6.3 5.5 7.4 6.5 5.5 7.1 6.3
25-29 4.7 6.3 5.5 5.1 6.8 6.0 5.3 7.0 6.2 4.9 6.5 5.7
30-34 4.2 4.6 4.4 4.2 4.4 4.3 4.5 5.2 4.9 4.2 4.6 4.4
35-39 3.7 3.9 3.8 3.4 4.5 4.0 4.0 4.6 4.3 3.6 4.1 3.9
40-44 3.2 2.6 2.9 3.2 2.8 3.0 3.5 3.3 3.4 3.2 2.7 3.0
45-49 1.9 1.6 1.7 2.2 1.9 2.1 1.9 1.6 1.7 2.0 1.7 1.8
50-54 2.7 2.6 2.7 3.2 2.9 3.1 3.9 3.4 3.6 3.0 2.8 2.9
55-59 1.6 1.1 1.3 1.8 1.3 1.6 1.9 1.4 1.7 1.7 1.2 1.4
60-64 1.8 1.5 1.6 1.8 1.6 1.7 2.4 1.2 1.8 1.8 1.5 1.7
65-69 0.8 0.7 0.8 0.8 0.6 0.7 0.8 0.5 0.7 0.8 0.7 0.7
70-74 1.1 1.1 1.1 1.1 1.2 1.1 1.2 0.6 0.9 1.1 1.1 1.1
75-79 0.4 0.4 0.4 0.4 0.3 0.4 0.4 0.2 0.3 0.4 0.4 0.4
80+ 1.1 1.2 1.2 1.2 1.0 1.1 0.7 0.6 0.6 1.1 1.1 1.1
Total 100.0 100.0 100.0 100.0 100.0 100.0 100.0 100.0 100.0 100.0 100.0 100.0
Dependency age groups
0-14 56.9 53.3 55.0 56.5 52.8 54.5 54.4 52.9 53.6 56.5 53.1 54.8
15-64 39.7 43.2 41.5 40.1 44.1 42.2 42.5 45.2 43.9 40.1 43.7 41.9
65+ 3.4 3.5 3.4 3.4 3.1 3.3 3.1 1.9 2.5 3.4 3.2 3.3
Total 100.0 100.0 100.0 100.0 100.0 100.0 100.0 100.0 100.0 100.0 100.0 100.0
Child and adult populations
0-17 63.7 60.7 62.1 63.0 59.4 61.1 60.7 59.4 60.0 63.2 60.2 61.7
18+ 36.3 39.3 37.8 37.0 40.6 38.9 39.3 40.6 40.0 36.8 39.8 38.3
Total 100.0 100.0 100.0 100.0 100.0 100.0 100.0 100.0 100.0 100.0 100.0 100.0
Adolescents
10-19
26.1 27.4 26.8 24.6 25.1 24.9 24.3 24.7 24.5 25.5 26.6 26.1
Number of persons
30,298 32,088 62,386 11,976 12,745 24,721 5,249 5,284 10,533 47,523 50,117 97,640
Table 2.1 Household population by age, sex, and residence

35
Table 2.2 Household composition
Percent distribution of households by sex of head of household and by household size; mean size of household, and percentage of households with orphans and foster children under 18 years of age, according to residence, SHDS 2020
Background characteristics Type of Residence
Urban Rural Nomadic Total
Household headship
Male 67.2 67.3 72.0 67.9
Female 32.8 32.7 28.0 32.1
Total 100.0 100.0 100.0 100.0
Number of usual members
1 2.3 3.4 3.2 2.7
2 4.9 7.7 8.7 6.2
3 7.8 11.2 12.1 9.3
4 10.4 13.1 15.6 11.8
5 13.0 14.0 16.2 13.7
6 14.1 13.9 15.1 14.2
7 13.2 12.0 11.9 12.7
8 10.2 9.6 8.1 9.8
9+ 24.0 15.0 9.2 19.7
Total 100.0 100.0 100.0 100.0
Mean size of households 6.6 5.7 5.3 6.2
Percentage of households with orphans and foster children under 18
Foster children1 16.5 13.7 12.9 15.3
Double orphans 4.2 2.5 3.7 3.7
Single orphans2 16.0 10.0 10.7 13.7
Foster and/or orphan children 31.6 23.1 24.2 28.3
Number of households 9,470 4,363 2,007 15,841
Note: Table is based on de jure household population, i.e. usual residents1 Foster children are those under age 18 years of age living in households with neither their mother nor their father present2 Includes children with one dead parent and an unknown survival status of the other parent

The Somali Health and Demographic Survey36
Percent distribution of the de facto male household population aged six and over by highest level of schooling attended or completed and median years completed, according to background characteristics, SHDS 2020
Background characteristics
Educational attainment of the household population
TotalNumber of
males
Median years
completed No
education Some
primary Completed
primary1
Some secondary
Completed secondary2
Higher education Don’t know
Age
6-9 69.1 30.9 0.0 0.0 0.0 0.0 0.0 100.0 3,795 4.0
10-14 45.9 44.2 3.8 6.2 0.0 0.0 0.0 100.0 4,161 5.0
15-19 35.9 27.2 5.0 12.0 11.1 7.8 1.0 100.0 2,991 8.0
20-24 33.1 19.8 4.4 8.4 15.4 16.2 2.8 100.0 1,428 11.0
25-29 35.4 18.7 5.0 5.0 13.3 17.7 4.9 100.0 1,177 12.0
30-34 37.6 15.6 3.9 4.3 13.4 17.9 7.2 100.0 1,035 12.0
35-39 38.2 17.1 7.1 5.3 11.4 14.3 6.6 100.0 862 11.0
40-44 37.1 13.8 7.0 6.4 17.2 12.4 6.1 100.0 713 12.0
45-49 34.7 19.5 6.3 3.4 12.8 11.6 11.6 100.0 437 10.0
50-54 41.6 16.2 7.9 5.3 11.7 12.3 5.0 100.0 695 10.0
55-59 38.6 10.6 4.6 2.2 19.4 15.7 9.0 100.0 373 12.0
60-64 40.4 13.8 4.9 1.9 16.5 14.3 8.3 100.0 425 12.0
65+ 35.6 19.5 4.4 5.2 17.0 13.1 5.1 100.0 674 12.0
Type of residence
Urban 41.9 26.9 4.1 6.5 8.9 9.5 2.3 100.0 13,713 8.0
Rural 50.2 31.7 3.7 3.4 5.5 2.4 3.2 100.0 4,346 5.0
Nomadic 77.9 13.8 1.3 0.6 0.9 0.3 5.2 100.0 706 3.0
Total 45.2 27.5 3.9 5.5 7.8 7.5 2.6 100.0 18,766 8.0
1 Completed 8th grade at the primary level2 Completed 12th grade at the secondary level
Table 2.3a Educational attainment of the male household population

37
Table 2.3b Educational attainment of the female household population
Percent distribution of the de facto female household population aged six and over by highest level of schooling attended or completed and median years completed, according to background characteristics, SHDS 2020
Background characteristics
Educational attainment of the household population
Number of females
Median years
completed No
education Some
primary Completed
primary1
Some secondary
Completed secondary2
Higher education Don’t know Total
Age
6-9 69.0 31.0 0.0 0.0 0.0 0.0 0.0 100.0 3,167 4.0
10-14 46.5 45.1 3.8 4.5 0.0 0.0 0.0 100.0 3,817 5.0
15-19 36.1 29.6 6.4 11.5 9.2 6.5 0.7 100.0 2,776 8.0
20-24 37.5 27.2 7.0 6.8 11.1 10.3 0.2 100.0 1,502 8.0
25-29 41.1 28.4 6.7 5.7 8.4 8.3 1.4 100.0 1,132 8.0
30-34 45.0 23.2 8.0 6.8 8.3 7.0 1.7 100.0 766 8.0
35-39 46.9 27.7 7.4 2.8 7.2 7.0 1.0 100.0 684 7.0
40-44 47.2 25.1 8.1 4.1 8.9 5.5 1.1 100.0 433 8.0
45-49 40.9 28.7 9.7 7.6 9.1 3.9 0.2 100.0 239 8.0
50-54 47.1 25.6 7.3 4.0 8.5 6.5 0.9 100.0 371 8.0
55-59 43.2 27.9 4.2 14.0 6.4 3.7 0.6 100.0 184 7.8
60-64 37.3 31.6 3.7 8.5 13.1 4.7 1.1 100.0 213 7.0
65+ 51.7 26.4 7.4 3.3 8.0 2.4 0.7 100.0 399 6.0
Type of residence
Urban 45.9 30.8 5.3 6.4 6.1 4.9 0.4 100.0 11,764 7.0
Rural 49.4 41.2 3.5 2.4 2.1 0.9 0.5 100.0 3,466 4.0
Nomadic 84.0 13.8 0.5 0.1 0.0 0.1 1.5 100.0 454 2.0
Total 47.8 32.6 4.8 5.4 5.1 3.9 0.5 100.0 15,684 6.0
1 Completed 8th grade at the primary level2 Completed 12th grade at the secondary level

The Somali Health and Demographic Survey38
Net attendance ratios (NAR) and gross attendance ratios (GAR) for the de facto household population by sex and level of schooling and Gender Parity Index (GPI), according to background characteristics, SHDS 2020
Background characteristics
Net Attendance Ratio1 Gross Attendance Ratio2
Male Female Total
Gender Parity Index3 Male Female Total
Gender Parity Index3
PRIMARY
Type of residence
Urban 22.7 19.4 21.1 0.85 32.4 28.1 30.3 0.87
Rural 19.5 18.6 19.1 0.95 30.0 27.6 28.8 0.92
Nomadic 2.1 1.1 1.6 0.49 3.0 1.7 2.3 0.56
Wealth quintile
Lowest 8.6 7.0 7.8 0.81 13.4 10.5 12.0 0.79
Second 13.3 12.3 12.8 0.93 20.8 18.1 19.5 0.87
Middle 18.6 16.1 17.4 0.87 28.2 24.5 26.4 0.87
Fourth 25.6 20.9 23.3 0.82 36.6 31.1 33.9 0.85
Highest 32.6 29.5 31.0 0.91 44.5 41.3 42.9 0.93
Total 19.7 17.2 18.5 0.88 28.6 25.2 26.9 0.88
SECONDARY
Type of residence
Urban 14.2 11.1 12.5 0.78 37.9 27.2 32.2 0.72
Rural 5.9 2.3 4.0 0.40 14.1 7.1 10.3 0.50
Nomadic 0.1 0.0 0.0 0.00 0.8 0.1 0.5 0.10
Wealth quintile
Lowest 0.7 0.3 0.5 0.44 2.2 1.2 1.7 0.52
Second 3.1 2.0 2.5 0.67 8.0 4.8 6.4 0.61
Middle 8.0 4.8 6.3 0.60 22.6 12.9 17.4 0.57
Fourth 13.5 11.3 12.3 0.84 38.3 29.2 33.5 0.76
Highest 26.2 17.8 21.5 0.68 64.7 42.5 52.3 0.66
Total 10.6 7.9 9.2 0.74 28.1 19.6 23.6 0.701 The NAR for primary school is the percentage of the primary-school-age (6-13 years) population that is attending primary school.
The NAR for secondary school is the percentage of the secondary-school-age (14-18 years) population that is attending secondary school. By definition, the NAR cannot exceed 100 percent.2 The GAR for primary school is the total number of primary school students, expressed as a percentage of the official primary-school-age population.
The GAR for secondary school is the total number of secondary school students, expressed as a percentage of the official secondary-school-age population.
If there are significant numbers of overage and under-age students at a given level of schooling, the GAR can exceed 100 percent.3 The Gender Parity Index for primary school is the ratio of the primary school NAR (or GAR) for females to the NAR (or GAR) for males. The Gender Parity Index for secondary school is the ratio of the secondary school NAR (or GAR) for females to the NAR (or GAR) for males.
Table 2.4 School attendance ratio

39
Table 2.5a Household drinking water
Percent distribution of households and de jure population by source of drinking water and by time to obtain drinking water and type of drinking water service, according to residence, SHDS 2020
Background characteristics Households
Total
Population
TotalUrban Rural Nomadic Urban Rural Nomadic
Source of drinking water
Improved source 76.2 55.3 34.5 65.2 80.0 57.4 35.3 69.4
Piped water into dwelling/yard/plot
58.4 24.5 0.2 41.7 63.1 26.4 0.2 46.9
Piped to neighbor 4.2 2.2 0.1 3.1 3.6 2.2 0.1 2.9
Public tap/standpipe 4.8 5.4 0.7 4.5 4.7 5.5 0.8 4.5
Tube well/borehole 2.5 3.2 1.5 2.5 2.4 3.1 1.6 2.5
Protected dug well 5.4 14.1 8.1 8.1 5.1 14.4 8.1 7.8
Protected spring 0.5 2.0 7.2 1.8 0.5 1.9 7.2 1.6
Rainwater 0.2 3.5 16.5 3.2 0.2 3.5 17.2 2.9
Bottled water 0.3 0.4 0.2 0.3 0.3 0.4 0.2 0.3
Un-improved source 23.8 44.7 65.5 34.8 20.0 42.6 64.7 30.6
Unprotected dug well 2.6 12.0 29.9 8.6 2.5 12.1 31.4 8.1
Unprotected spring 0.4 1.9 9.2 1.9 0.3 2.0 9.6 1.8
Tanker truck/cart with drum 16.7 12.1 8.7 14.5 15.9 12.5 9.0 14.3
Water Kiosk 0.2 0.9 0.7 0.5 0.1 0.9 0.7 0.4
Surface water 0.3 13.5 11.8 5.4 0.3 13.8 10.7 4.9
Other source 0.4 0.5 3.3 0.8 0.4 0.6 3.0 0.7
Missing 3.2 3.8 1.8 3.2 0.5 0.7 0.3 0.5
Total 100.0 100.0 100.0 100.0 100.0 100.0 100.0 100.0
Time to obtain drinking water (round trip)
Water on premises1 80.9 52.6 10.8 64.3 81.8 52.0 9.1 66.3
30 minutes or less 13.7 33.5 42.9 22.8 12.9 33.9 43.3 21.5
More than 30 minutes 4.5 13.0 44.6 11.9 4.4 13.2 45.8 11.2
DK/Missing 1.0 0.9 1.7 1.0 1.0 0.8 1.8 1.0
Total 100.0 100.0 100.0 100.0 100.0 100.0 100.0 100.0
Drinking water service
Percentage with basic drinking water service2
74.5 51.0 18.4 61.0 78.2 53.1 18.6 65.4
Percentage with limited drinking water service3
1.5 4.0 15.2 3.9 1.6 4.0 15.7 3.7
Number of households 9,779 4,536 2,045 16,360 63,462 25,318 10,839 99,619
1 Includes water piped to a neighbor and those reporting a round trip collection time of zero minutes 2 Defined as drinking water from an improved source, provided either water is on the premises or round-trip collection time is 30 minutes or less Includes safely managed 3 Drinking water from an improved source, provided round-trip collection time is more than 30 minutes”

The Somali Health and Demographic Survey40
Percent distribution of households by various methods used to treat drinking water, and percentage using an appropriate treatment method, according to residence, SHDS 2020
Water treatment method Urban Rural Nomadic Total
Water treatment prior to drinking
Boiled 4.2 3.3 0.0 3.4
Bleach/chlorine added 19.5 5.6 0.0 13.2
Strained through cloth 0.1 0.0 0.0 0.1
Ceramic, sand or other filter 0.3 0.1 0.0 0.2
Solar disinfection 0.1 0.0 0.0 0.0
Let it stand and settle 0.1 0.0 0.0 0.0
Other treatment 0.3 0.6 0.0 0.3
No treatment 76.8 90.1 98.1 83.2
Don’t know 22.9 9.7 1.9 16.6
Percentage using an appropriate treatment method1
22.4 8.5 0.0 15.8
Total 9,469 4,363 2,007 15,839
Respondents may report multiple treatment methods so the sum of treatment may exceed 100 percent.
1 Appropriate water treatment methods include boiling, bleaching, straining, filtering and solar disinfecting.
Table 2.5b Treatment of household drinking water

41
Table 2.6 Household sanitation facilities
Percent distribution of households and de jure population by type of toilet/latrine facilities, percent distribution of households and de jure population with a toilet/latrine facility by location of the facility, percentage of households and de jure population with basic sanitation services, and percentage with limited sanitation services, according to residence, SHDS 2020
Households Population
Type and location of toilet/latrine facility
Urban Rural Nomads Total Urban Rural Nomads Total
Improved facility 72.3 49.2 1.0 56.8 73.8 50.4 0.9 59.8
Flush/pour to piped sewer system 8.1 3.6 0.0 5.8 8.1 3.8 0.0 6.1
Flush/pour to septic tank 5.6 3.2 0.1 4.2 5.7 3.2 0.0 4.4
Flush/pour to a pit latrine 20.5 16.9 0.2 16.9 20.8 17.7 0.2 17.8
Ventilated improved pit (VIP) latrine 6.1 8.1 0.1 5.9 5.9 7.8 0.1 5.7
Pit latrine with a slab 32.1 17.5 0.6 24.1 33.3 17.9 0.6 25.8
Non-improved facility 23.8 26.9 4.9 22.3 23.2 27.2 4.7 22.1
Flush to some where else 0.7 1.1 0.3 0.7 0.7 1.1 0.3 0.8
Flush/pour flush, don’t know where 0.6 0.7 0.1 0.5 0.5 1.0 0.1 0.6
Pit latrine without slab/Open latrine 18.8 21.7 1.8 17.4 18.5 21.7 1.8 17.5
Bucket toilet 2.6 1.1 1.0 2.0 2.6 1.2 0.8 2.0
Hanging toilet/hanging latrine 0.6 0.3 0.2 0.5 0.6 0.2 0.2 0.4
Others 0.5 2.0 1.7 1.1 0.4 2.0 1.6 0.9
Open Defecation 3.9 23.9 94.1 20.9 3.1 22.4 94.3 18.0
Total 100.0 100.0 100.0 100.0 100.0 100.0 100.0 100.0
Number of households/population 9,379 4,317 2,004 15,700 62,447 24,877 10,782 98,107
Location of the facility
In own dwelling 64.0 39.0 15.4 56.9 66.0 39.4 13.4 59.2
In own yard/plot 24.9 39.3 17.8 28.7 24.0 40.0 19.2 27.8
Elsewhere 11.1 21.7 66.8 14.4 10.0 20.6 67.5 13.0
Total 100.0 100.0 100.0 100.0 100.0 100.0 100.0 100.0
Number of households/population with a toilet/latrine facility
8,989 3,276 126 12,390 60,458 19,261 658 80,377
Percentage with basic sanitation service1
45.5 32.1 0.6 36.1 50.1 34.0 0.5 40.6
Percentage with limited sanitation service2
26.7 17.1 0.4 20.7 23.7 16.5 0.4 19.3
1 Defined as use of improved facilities that are not shared with other households. Includes safely managed sanitation service, which is not shown separately. 2 Defined as use of improved facilities shared by 2 or more households

The Somali Health and Demographic Survey42
Table 2.7 Housing characteristics
Percent distribution of households and de jure population by housing characteristics, percentage using solid fuel for cooking; and percent distribution by frequency of smoking in the home, according to residence, SHDS 2020
Housing characteristics
Households
Total
Population
TotalUrban Rural Nomadic Urban Rural Nomadic
Electricity
Yes 66.2 17.2 0.1 44.3 69.9 18.5 0.1 49.2
No 33.8 82.8 99.9 55.7 30.1 81.5 99.9 50.8
Total 100.0 100.0 100.0 100.0 100.0 100.0 100.0 100.0
Flooring material
Earth/Sand 49.1 65.5 90.6 58.9 47.4 65.2 90.4 56.6
Dung 1.6 1.2 0.8 1.4 1.6 1.1 0.8 1.4
Grass 1.1 3.6 5.4 2.3 0.9 3.5 5.4 2.1
Wooden Planks 1.9 2.1 0.2 1.8 1.9 2.4 0.2 1.9
Palm/Bamboo 1.7 1.2 2.0 1.6 1.6 1.4 2.2 1.6
Parquet/Polished wood
0.5 0.6 0.0 0.5 0.5 0.6 0.0 0.5
Vinyl/Asphalt Strips 0.2 0.3 0.0 0.2 0.1 0.3 0.0 0.1
Ceramic Tiles 9.2 1.4 0.0 5.9 9.9 1.3 0.0 6.7
Cement 32.9 23.7 0.2 26.2 34.2 23.9 0.3 27.9
Carpet 0.9 0.4 0.4 0.7 0.8 0.3 0.4 0.6
Others 0.9 0.1 0.3 0.6 0.9 0.1 0.3 0.6
Total 100.0 100.0 100.0 100.0 100.0 100.0 100.0 100.0
Rooms used for sleeping
One 30.8 53.8 92.8 45.0 23.7 46.3 91.0 36.7
Two 33.8 34.4 7.0 30.6 33.3 38.2 8.7 31.8
Three or more 35.4 11.8 0.3 24.4 43.1 15.5 0.3 31.4
Total 100.0 100.0 100.0 100.0 100.0 100.0 100.0 100.0
Place for cooking
In the house 61.8 37.5 12.5 48.9 62.8 37.7 12.4 50.9
In a separate building
24.2 35.2 11.5 25.6 24.7 36.5 11.2 26.2
Outdoors 13.3 26.5 74.1 24.6 12.2 25.5 74.7 22.4
Others 0.7 0.8 1.8 0.9 0.3 0.3 1.7 0.5
Total 100.0 100.0 100.0 100.0 100.0 100.0 100.0 100.0
Cooking fuel
Electricity 3.4 0.2 0.0 2.1 3.8 0.2 0.0 2.5
LPG/natural gas/ biogas
3.8 1.0 0.1 2.6 3.8 1.0 0.1 2.7
Kerosene 2.5 1.2 0.4 1.9 2.5 1.2 0.4 2.0
Firewood 25.0 64.8 93.0 44.5 23.1 65.0 93.8 41.5
Charcoal 62.3 24.5 2.4 44.3 64.3 24.1 2.2 47.3
Straw/shrubs/grass 0.4 3.1 1.3 1.2 0.3 3.1 1.1 1.1
Agricultural crop 1.9 4.4 2.4 2.7 1.8 4.9 2.1 2.6
Animal dung 0.0 0.0 0.0 0.0 0.0 0.0 0.0 0.0
No food cooked in the household
0.5 0.5 0.4 0.5 0.2 0.1 0.3 0.2
Other 0.2 0.2 0.0 0.2 0.2 0.2 0.0 0.2
Total 100.0 100.0 100.0 100.0 100.0 100.0 100.0 100.0
Percentage using solid fuel for cooking1
89.6 96.8 99.1 92.8 89.5 97.2 99.3 92.5
Percentage using clean fuel for cooking2
7.2 1.3 0.1 4.7 7.6 1.3 0.1 5.2
Population 9,469 4,363 2,007 15,839 63,144 25,140 10,801 99,085
LPG = Liquid petroleum gas 1 Includes coal/lignite, charcoal, wood, straw/shrubs/grass, agricultural crops, and animal dung 2 Includes electricity and LPG/natural gas/biogas

43
Table 2.8 Household possessions
Percentage of households possessing various household effects, means of transportation, agricultural land and livestock/farm animals, according to residence, SHDS 2020
PossessionType of residence
Urban Rural Nomadic Total
Household effects
Radio 23.1 15.5 8.4 19.1
Television 32.1 4.6 0.5 20.5
Refrigerator 11.4 1.5 0.1 7.3
Mobile phone 81.0 67.0 59.3 74.4
Non-mobile telephone 7.1 2.0 3.4 5.3
Computer 11.0 1.2 0.2 6.9
Internet 18.6 2.3 1.2 11.9
Air conditioner/fan 15.9 1.7 1.3 10.1
Means of transport
Bicycle 1.2 1.0 1.1 1.2
Motorcycle/scooter 0.8 0.8 0.4 0.7
Donkey cart 1.3 3.9 3.7 2.3
Car/truck 5.7 2.4 1.5 4.3
Boat/canoe 0.3 0.3 0.8 0.4
Tractor 0.3 0.3 0.2 0.3
Rickshaw 2.1 0.3 0.2 1.3
Animal plough 0.8 0.6 4.8 1.2
Ownership of agriculture land
10.9 34.5 9.4 17.2
Ownership of livestock1 19.1 55.1 94.8 38.6
Livestock lost1 11.8 31.0 70.7 24.6
Number of households 9,469 4,363 2,007 15,8391 Camels, cattle, sheep, goats, horses, donkeys, poultry

The Somali Health and Demographic Survey44
Percent distribution of de jure population by wealth quintiles and the Gini coefficient, according to residence and region, SHDS 2020
Wealth quintile
Number of persons Gini coefficient
Residence/regionLowest Second Middle Fourth Highest Total
Type of residence
Urban 3.6 17.3 22.9 27.0 29.3 100.0 62,508 0.2
Rural 31.6 31.8 20.6 10.6 5.4 100.0 24,928 0.3
Nomadic 90.3 4.9 2.3 1.9 0.5 100.0 10,601 0.4
Total 20.1 19.6 20.1 20.1 20.1 100.0 98,038 0.2
Percentage of de jure children under five years of age whose births are registered with the civil authorities, according to background characteristics, SHDS 2020
Background characteristics
Children whose births are registered
Number of childrenPercentage who had a
birth certificatePercentage who did not have a birth certificate Percentage registered
Age
<2 0.2 3.7 3.8 6,935
2-4 0.4 2.9 3.3 12,929
Sex
Male 0.3 3.2 3.5 10,021
Female 0.3 3.1 3.4 9,843
Type of residence
Urban 0.4 3.6 4.1 12,583
Rural 0.1 2.9 3.0 5,189
Nomadic 0.0 1.0 1.0 2,092
Total 0.3 3.2 3.5 19,864
Table 2.9 Wealth quintiles
Table 2.10 Birth registration of children aged under five

45

Archillorem quissecusam ent velluptiam dolorporion providem id mo consequ atatiis eaque net qui qui que sunto is iducium quas assimincias velecto tat
03Characteristics of the Respondents

©A
U U
N I
ST P
HO
TO
/To
bin
Jo
nes

EDUCATIONALATTAINMENT
25%of women have at least primary level education
KEY FINDINGS
ACCESS TO MEDIA
10%of women watch television at least once a week
LITERACY
32%of women are literate
INTERNET USE
17%of women had used the internet at least once
HEALTH INSURANCE
99.8%of ever-married women do not have health insurance
EMPLOYMENT
9%of ever-married women are currently employed
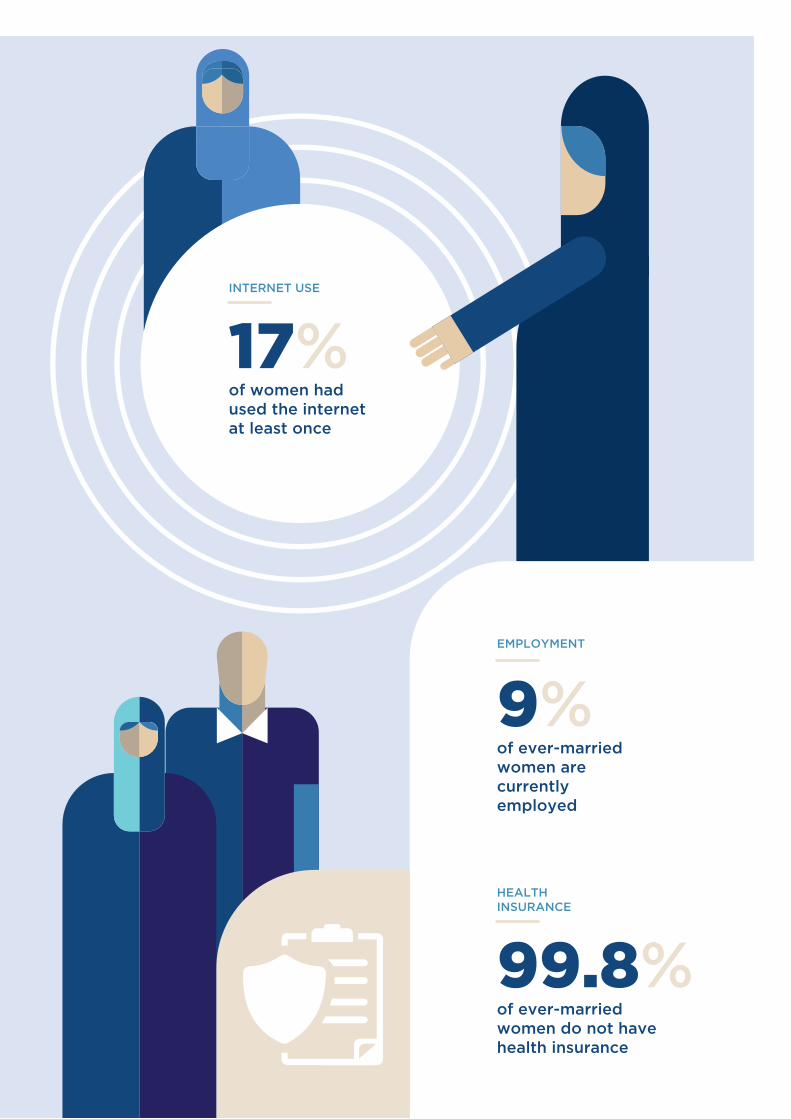

The Somali Health and Demographic Survey50
This chapter presents information
on the individual demographic
and socioeconomic characteristics
of the survey respondents who
were interviewed for the SHDS
2020. For information presented
in this chapter, enumerators
administered questions to
never-married and ever-married
women. Questions on educational
attainment, literacy, exposure
to mass media and internet
use were administered to both
never-married and ever-married
women, whereas questions on
employment status, occupation,
health insurance coverage and use
of tobacco were only administered
to ever-married women.
This information is useful in understanding the factors that affect the lives of women in the reproductive age group, and provides a context for the interpretation of demographic and health indicators.
Background Characteristics of Respondents
Information on the background characteristics of women aged 15-49 interviewed in the SHDS 2020 is presented in Table 3.1 by age, marital status, type of residence, education and wealth quintile. Twenty-eight percent of the women were aged 15-19 (74 percent among never-married women and 8 percent among ever-married women).
Sixty-two percent of the women were currently married, while 29 percent had never been married, 6 percent were divorced or separated and 3 percent were widowed.
More women live in urban areas than rural and nomadic areas. Thirty-nine percent of all women resided in urban areas, 30 percent and 32 percent resided in rural and nomadic areas respectively. Similarly, there were more ever-married and never-married women in urban areas than in rural and nomadic areas.
Educational attainment in Somalia is low—only 24 percent of the Somali population aged 25 and above have completed at least primary school (UNFPA 2014). Similarly, according to the SHDS 2020, educational attainment was low—75 percent of all women had never
3 C H A R A C T E R I S T I C S O F T H E R E S P O N D E N T S

51
attended school. Eighty-four percent of ever-married women had no education compared to 55 percent of never-married women.
Twenty-nine percent of never-married women and 18 percent of ever-married women were from the wealthiest households.
Educational AttainmentTable 3.2 presents the distribution of women aged 15-49 by educational attainment and median years of schooling completed according to background characteristics.
The findings show that educational attainment among women is very low. Overall, 75 percent of women aged 15-49 have not attended any formal schooling. Twelve percent of women have some levels of primary education, but only 3 percent completed primary schooling. Moreover, 5 percent of women attended secondary school, but only 3 percent completed secondary education. Three percent of women have completed higher levels of education (Figure 3.1).
Educational attainment decreases as the age of women increases. The percentage of women who have some level of primary education is highest among women aged 15-19 (19 percent) and lowest among women aged 40-44 and 45-49 (4 percent each).
The differences in educational attainment among women aged 15-49 in urban, rural and nomadic areas is pronounced. Ninety-seven percent of women living in nomadic areas have never attended formal schooling compared to 72 percent among those from rural areas and 59 percent of women from urban areas.
Educational attainment increases with increasing levels of wealth. The proportion of women with no education is highest in the poorest households (96 percent) and lowest in the wealthiest households (47 percent). The
proportion of women who have attained higher education also increases with increasing wealth levels.
Literacy
Adult literacy is defined as the percentage of the population aged 15 years and over who are both able to read and write, with an understanding, a short simple statement on their everyday lives (UNESCO Institute for Statistics, 2013).
The SHDS 2020 assessed literacy levels among women aged 15-49 who had never been to school or who had primary or secondary levels of education by asking them to read all or part of a sentence in English or Somali. Anyone who could read a sentence in any other language was also considered a literate person. Those with a higher level of education were assumed to be literate without administering a reading test. Table 3.3. presents the literacy of women by background characteristics. The table shows that just about a third (32 percent) of Somali women aged 15-49 are literate.
As shown in Figure 3.2, literacy levels generally decrease with age; literacy is highest among
74.8
12.1
3.2
4.82.5
2.6
Percent distribution of women aged 15-49 by highest level of schooling attended or completed
No education
Some primary
Completed primary
Some secondary
Completed secondary
Higher education
Percent distribution of women aged 15-49 by highest level of schooling attended or completed
Figure 3.1 Educational attainment

The Somali Health and Demographic Survey52
women aged 15-19 (48 percent) and lowest among those aged 40-44 (13 percent).
Literacy among women aged 15-49 varies by place of residence. Among women residing in urban areas, 50 percent are literate compared to 37 percent among those living in rural areas and 5 percent among the women living in nomadic areas.
Further analysis by wealth levels shows that literacy levels increase with wealth status. Women from wealthier households are more
literate (62 percent) compared to women from poorer households (6 percent).
Exposure to Mass MediaThe SHDS 2020 collected information on the exposure of respondents to both broadcast and print media. Respondents were asked how often they read a newspaper, watch television, or listen to the radio. This information indicates the extent to which women are regularly exposed to mass media, which can be used in the development of educational programmes, to convey messages to the public about government policies, disseminate health information, report opinions on health issues and other societal matters. It can also serve as a tool to observe public sentiments on important issues.
Table 3.4 shows that 93 percent of women did not access any of the three forms of media—newspaper, radio and television—at least once a week. Watching television was the most common use of media—10 percent of women watch television at least once a week; 7 percent
48.4
38.1
27.1
23.019.9
13.016.0
15-19 20-24 25-29 30-34 35-39 40-44 45-49
Percent of women aged 15-49 by literacy and agePercent of women aged 15-49 by literacy and age
Figure 3.2 Literacy
0.3 0.4 1.
8
0.1
98.2
0.6 0.5 2.
6
0.1
97.4
1.7 3.2
7.3
0.5
92.7
4.9 8
.9 9.5
2.1
90.5
9.6
34.7
14.5
4.7
85.
5
Reads a newspaper Watches television Listens to radio Accesses all threemedia
Accesses none of thethree media
Lowest Second Middle Fourth Highest
Percent of women aged 15-49 who are exposed to specific media on a weekly basis by wealth status Figure 3.3 Exposure to mass media

53
listen to the radio at least once a week; and 4 percent read newspapers at least once a week.
Urban women have more access to newspapers, television and radio compared to their rural and nomadic counterparts—7 percent read a newspaper at least once a week, 22 percent watch television at least once a week and 14 percent listen to the radio at least once a week.
Exposure to media increases with both education and wealth. While only about 1 percent of women with no education read a newspaper at least once a week, 32 percent of women with higher education do so. Similarly, while 5 percent of women with no education watch television at least once a week, 48 percent of women with higher education watch television at least once a week.
Figure 3.3 presents the percentage of women aged 15-49 exposed to mass media by wealth quintile. Less than 1 percent of women in the lowest wealth quintile watch television at least once a week, compared to 35 percent in the highest quintile. Likewise, 2 percent of women in the lowest quintile listen to the radio at least once a week, compared to 15 percent in the highest quintile.
Internet Use
The internet is an important tool for accessing information. Globally, women are 23 percent less likely than men to use mobile internet. In Sub-Saharan Africa, women are 41 percent less likely than men to use mobile internet (GSMA 2019). Furthermore, studies have shown that women use the internet more often for health-related information searches than men. When their access is hindered, chances are women are slower to have access to important information for their families.
The SHDS collected information about women’s use of the internet: women aged 15-49 were asked whether they had ever used the internet and, if they had, whether they used it in the 12 months preceding the survey. Interviewers also enquired how often women had used the internet in the month preceding the survey.
Table 3.5 shows that 17 percent of women had used the internet at least once and 15 percent had used the internet in the past 12 months preceding the survey.
The use of the internet generally decreases with increase in age; 25 percent of women aged 15-19 had used the internet, compared to 4 percent of women aged 40-44. About one-third (32 percent) of women living in urban areas had used the internet at least once, compared to 12 percent and 1 percent of women living in rural and nomadic areas, respectively.
Internet usage also increases with educational attainment and wealth status. Ninety-one percent of women with higher education had ever used the internet, compared to 6 percent of women with no education (Figure 3.4). Moreover, 44 percent of women in the highest wealth quintile had ever used the internet, compared to 1 percent of women in the lowest wealth quintile.
Percent of women aged 15-49 who have ever used the internet by education level
Figure 3.4 Internet use
5.6
31.2
70.4
90.8
No Education Primary Secondary Higher
Percent of women aged 15-49 who have ever used the internet by education level
Exposure to media increases with both education and wealth


Women in urban settings are more likely to be educated than women in nomadic and rural households
©A
U U
N I
ST P
HO
TO
/To
bin
Jo
nes

The Somali Health and Demographic Survey56
Employment StatusIn the SHDS 2020, ever-married women aged 15-49 were asked about their employment status in the seven days preceding the survey, as well as whether they had done any work in the 12 months prior to the survey. Respondents were categorized as currently employed if they had worked in the seven days preceding the survey. Table 3.6 shows the employment status of ever-married women by background characteristics.
The employment status of the respondents was low. Nine percent of ever-married women were currently employed at the time the survey was conducted, while 1 percent were not currently employed but had worked in the 12
months preceding the survey. Ninety percent of ever-married women had not done any work in the 12 months prior to the survey.
The proportion of ever-married women who were currently employed increases with age; it is lowest among ever-married women aged 15-19 (3 percent) and highest among those aged 45-49 (18 percent) (Figure 3.5).
Employment increases with an increase in the number of living children— 6 percent each for both women with no living children and those with one to two children, 9 percent for those with three to four children and 11 percent for women with 5 or more children.
The results show that employment varies by
3.0
5.1
7.38.5
11.6
14.4
18.0
15-19 20-24 25-29 30-34 35-39 40-44 45-49
Percent of ever married women aged 15-49 currently employed by age
Percent of ever-married women aged 15-49 currently employed by age
45.7
11.0
0.5
42.8
83.6
5.4 2.78.3
72.5
7.02.0
18.4
Cash only Cash and in-kind In-kind only Not paid
Percent of ever married women aged 15-49 employed in the 12 months preceding the survey by type of earnings
Agricultural work Non-Agricultural work Total
Percent of ever-married women aged 15-49 employed in the 12 months preceding the survey by type of earnings
Figure 3.5 Employment status
Figure 3.6 Type of employment and earnings

57
place of residence and wealth status of the household. Among women from nomadic areas, 3 percent were currently employed, compared to 12 percent and 11 percent of women from urban and rural areas respectively. More women from wealthier households were employed than in poorer ones; 13 percent of women in the highest wealth quintile were currently employed compared to 3 percent of women in the lowest wealth quintile.
Type of EmploymentTable 3.7 shows the distribution of ever-married women aged 15-49 who were employed in the 12 months preceding the survey by type of earnings and employer, as well as continuity of employment, by whether their work is agricultural or non-agricultural.
Overall, 73 percent of ever-married women were paid in cash only while 18 percent were not paid for their work. Forty-six percent of the respondents working in agriculture were paid in cash only for their work, while 43 percent were not paid at all. Women in non-agricultural work were mainly paid in cash only (84 percent), whereas 5 percent were paid in cash and in kind, 3 percent were paid in kind only and 8 percent were not paid (Figure 3.6).
Forty-nine percent of the currently employed women aged 15-49 were self-employed. Sixty-four percent of women in agricultural work were employed by a family member, while 2 percent were employed by a non-family member. More than half of women engaged in non-agricultural work were self-employed (55 percent).
Just over half of women were employed all year round (56 percent). Both women engaged in agricultural and non-agricultural work were mostly employed all year round (61 percent and 53 percent respectively).
Health Insurance Coverage
WHO considers health insurance a promising means for achieving universal health care coverage (WHO 2010a).
In the SHDS 2020, ever-married women aged 15-49 were asked whether they were covered by health insurance and the type of health insurance they were using. Table 3.8 presents the distribution of health insurance coverage. The survey shows that almost all women (99.8 percent) did not have health insurance.
Use of Tobacco
Tobacco use and second-hand smoke (SHS) exposure during pregnancy have adverse health effects on women and infants. Women who smoke are more likely than non-smokers to experience infertility and delays in conceiving. Maternal smoking during pregnancy increases risks of prematurity, stillbirth, and neonatal death and may cause a reduction in breast milk (WHO 2010).
Ever-married women aged 15-49 were asked about their smoking habits during the survey. Table 3.9 shows the distribution of cigarette smokers and the percentage of women who use various types of tobacco by background characteristics.
Overall, 2 percent of ever-married women smoke cigarettes or use any type of tobacco. There is a slight variation among women of various age groups. Two percent of women in all age groups except 20-24 and 45-49 use any type of tobacco. Furthermore, 2 percent of women in urban and rural areas use any type of tobacco compared to 1 percent of women in nomadic areas.

The Somali Health and Demographic Survey58
Percentage of all women aged 15-49 by selected background characteristics, SHDS 2020
Background characteristics
Ever-married Women Never-married women All women
Weighted percent
Weighted number
Unweighted number
Weighted percent
Weighted number
Unweighted number
Weighted percent
Weighted number
Unweighted number
Age
15-19 8.4 981 1,030 73.7 3,708 3,540 28.1 4,690 4,570
20-24 18.2 2,129 2,164 16.2 813 828 17.6 2,942 2,992
25-29 23.4 2,731 2,766 4.3 217 230 17.6 2,948 2,996
30-34 18.1 2,118 2,155 2.2 110 95 13.3 2,228 2,250
35-39 16.5 1,924 1,952 1.8 90 53 12.1 2,015 2,005
40-44 9.9 1,162 1,164 1.0 50 49 7.3 1,212 1,213
45-49 5.5 641 653 0.8 41 36 4.1 681 689
Marital status
Never-married n/a n/a n/a 100.0 5,029 4,831 28.9 5,029 4,831
Married 87.6 10,238 10,331 n/a n/a n/a 62.3 10,238 10,331
Divorced/separated 8.3 969 1,033 n/a n/a n/a 5.9 969 1,033
Widowed 4.1 478 520 n/a n/a n/a 2.9 478 520
Type of residence
Urban 35.4 4,136 5,256 46.9 2,356 2,691 38.8 6,492 7,947
Rural 30.2 3,523 3,193 27.9 1,404 1,117 29.5 4,928 4,310
Nomadic 34.5 4,027 3,435 25.2 1,269 1,023 31.7 5,296 4,458
Education
No education 83.8 9,798 9,885 55.4 2,784 2,604 75.3 12,582 12,489
Primary 11.6 1,355 1,389 23.0 1,155 1,093 15.0 2,510 2,482
Secondary 3.2 374 438 16.5 828 824 7.2 1,202 1,262
Higher 1.4 159 172 5.2 262 310 2.5 421 482
Wealth quintile
Lowest 23.5 2,748 2,452 16.1 809 690 21.3 3,557 3,142
Second 20.0 2,341 2,512 13.2 663 648 18.0 3,004 3,160
Middle 18.5 2,159 2,284 18.3 923 813 18.4 3,082 3,097
Fourth 20.1 2,350 2,348 23.0 1,154 1,102 21.0 3,504 3,450
Highest 17.9 2,088 2,288 29.4 1,480 1,578 21.3 3,568 3,866
Total 15-49 100.0 11,686 11,884 100.0 5,029 4,831 100.0 16,715 16,715
Note: Education categories refer to the highest level of education attended, whether or not that level was completed
n/a = Not applicable
Table 3.1 Background characteristics of respondents
List of Tables
Table 3.1 Background characteristics of respondents 58
Table 3.2 Educational attainment 59
Table 3.3 Literacy 60
Table 3.4 Exposure to mass media 61
Table 3.5 Internet use 62
Table 3.6 Employment status 63
Table 3.7 Type of employment 64
Table 3.8 Health insurance coverage 65
Table 3.9 Use of tobacco 66

59
Percent distribution of all women aged 15-49 by highest level of schooling attended or completed,and median years completed, according to background characteristics, SHDS 2020
Background characteristics
Educational attainment of the household members Median years
completedNumber
of women No
education Some
primaryCompleted
primary1
Some secondary
Completed secondary2
Higher education Total
Age
15-24 61.7 16.9 4.7 9.3 3.6 3.7 100.0 0.0 7,556
15-19 57.4 18.9 6.0 12.2 3.3 2.2 100.0 0.0 4,649
20-24 68.8 13.6 2.7 4.5 4.2 6.1 100.0 0.0 2,906
25-29 80.8 9.9 2.7 1.6 1.9 3.1 100.0 0.0 2,918
30-34 84.5 9.7 1.5 1.1 1.6 1.6 100.0 0.0 2,195
35-39 89.6 7.3 1.3 0.3 0.9 0.6 100.0 0.0 1,948
40-44 93.1 3.9 1.1 0.5 1.3 0.2 100.0 0.0 1,176
45-49 89.8 4.3 2.5 0.6 1.4 1.4 100.0 0.0 646
Type of residence
Urban 59.1 16.1 5.1 9.1 5.2 5.4 100.0 0.0 6,478
Rural 72.0 17.1 4.0 4.1 1.3 1.6 100.0 0.0 4,822
Nomadic 97.3 2.5 0.1 0.0 0.1 0.0 100.0 0.0 5,138
Wealth quintile
Lowest 96.4 3.3 0.2 0.1 0.0 0.1 100.0 0.0 3,471
Second 90.3 7.2 1.2 0.6 0.5 0.2 100.0 0.0 2,917
Middle 75.8 15.5 3.0 3.9 1.2 0.6 100.0 0.0 3,047
Fourth 67.6 16.5 4.3 6.3 3.0 2.3 100.0 0.0 3,452
Highest 47.2 17.7 6.8 12.1 7.2 9.0 100.0 3.0 3,551
Total 74.8 12.1 3.2 4.8 2.5 2.6 100.0 0.0 16,438 1 Completed 8th grade at the primary level2 Completed 12th grade at the secondary level
Table 3.2 Educational attainment

The Somali Health and Demographic Survey60
Percent distribution of all women aged 15-49 by level of schooling attended and level of literacy, and percentage literate, according to background characteristics, SHDS 2020
Background characteristics
No schooling, primary or secondary school
Higher education
Can read a whole
sentence
Can read part of a sentence
Cannot read at
all
No card with required language
Blind/ visually
impaired TotalPercentage
literate1
Number of
women
Age
15-24 3.7 23.4 17.4 54.8 0.5 0.3 100.0 44.4 7,556
15-19 2.1 28.2 18.0 51.2 0.3 0.1 100.0 48.4 4,649
20-24 6.1 15.6 16.4 60.5 0.8 0.6 100.0 38.1 2,906
25-29 3.1 9.3 14.6 71.2 1.5 0.3 100.0 27.1 2,918
30-34 1.6 7.7 13.8 75.2 1.6 0.2 100.0 23.0 2,195
35-39 0.6 5.0 14.3 78.1 1.6 0.4 100.0 19.9 1,948
40-44 0.2 4.2 8.6 85.3 1.6 0.1 100.0 13.0 1,176
45-49 1.4 5.3 9.2 80.7 3.1 0.3 100.0 16.0 646
Type of residence
Urban 5.4 24.0 21.0 48.4 0.9 0.4 100.0 50.4 6,478
Rural 1.6 15.8 19.2 62.5 0.7 0.2 100.0 36.6 4,822
Nomadic 0.0 1.4 3.9 92.7 1.8 0.2 100.0 5.2 5,138
Wealth quintile
Lowest 0.0 2.2 4.0 92.1 1.3 0.4 100.0 6.2 3,471
Second 0.2 5.0 7.2 86.1 1.5 0.0 100.0 12.4 2,917
Middle 0.6 13.1 19.0 66.1 1.2 0.0 100.0 32.7 3,047
Fourth 2.3 19.3 22.2 54.7 1.1 0.4 100.0 43.8 3,452
Highest 9.0 31.1 22.1 36.6 0.7 0.4 100.0 62.3 3,551
Total 2.6 14.5 15.1 66.4 1.1 0.3 100.0 32.2 16,438 1 Refers to women who attended higher education and women who can read a whole sentence or part of the sentence.
Table 3.3 Literacy
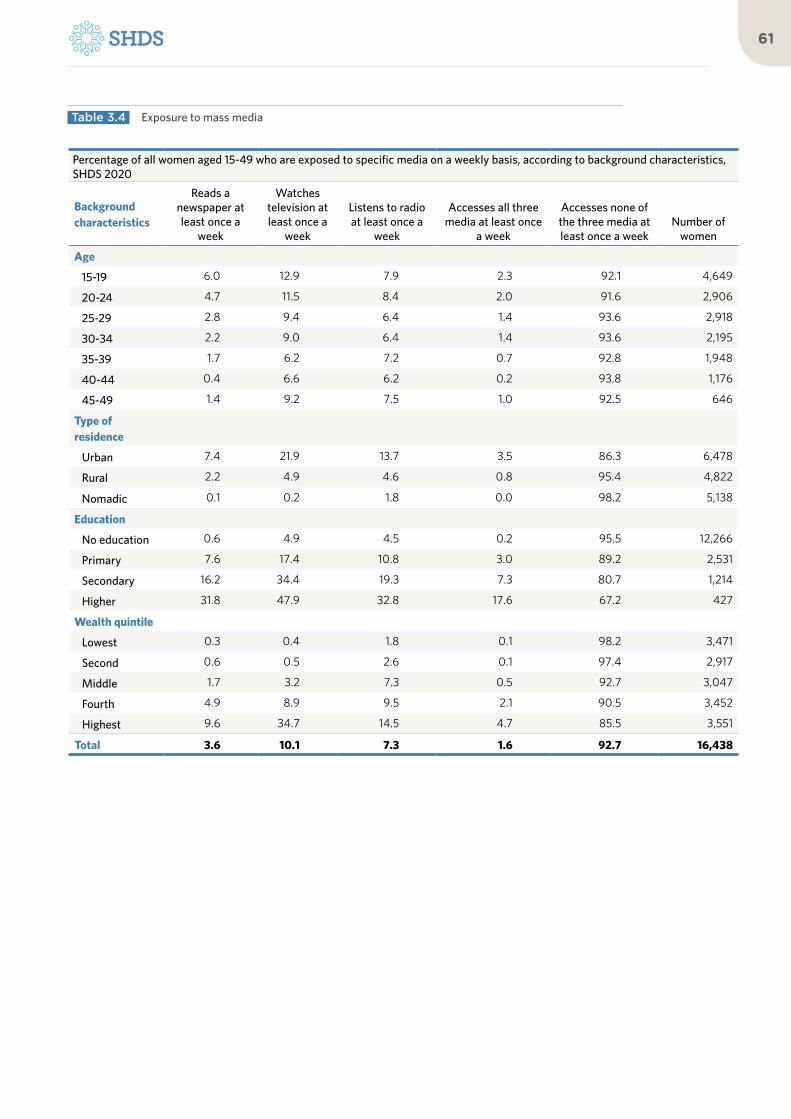
61
Percentage of all women aged 15-49 who are exposed to specific media on a weekly basis, according to background characteristics, SHDS 2020
Background characteristics
Reads a newspaper at least once a
week
Watches television at least once a
week
Listens to radio at least once a
week
Accesses all three media at least once
a week
Accesses none of the three media at least once a week
Number of women
Age
15-19 6.0 12.9 7.9 2.3 92.1 4,649
20-24 4.7 11.5 8.4 2.0 91.6 2,906
25-29 2.8 9.4 6.4 1.4 93.6 2,918
30-34 2.2 9.0 6.4 1.4 93.6 2,195
35-39 1.7 6.2 7.2 0.7 92.8 1,948
40-44 0.4 6.6 6.2 0.2 93.8 1,176
45-49 1.4 9.2 7.5 1.0 92.5 646
Type of residence
Urban 7.4 21.9 13.7 3.5 86.3 6,478
Rural 2.2 4.9 4.6 0.8 95.4 4,822
Nomadic 0.1 0.2 1.8 0.0 98.2 5,138
Education
No education 0.6 4.9 4.5 0.2 95.5 12,266
Primary 7.6 17.4 10.8 3.0 89.2 2,531
Secondary 16.2 34.4 19.3 7.3 80.7 1,214
Higher 31.8 47.9 32.8 17.6 67.2 427
Wealth quintile
Lowest 0.3 0.4 1.8 0.1 98.2 3,471
Second 0.6 0.5 2.6 0.1 97.4 2,917
Middle 1.7 3.2 7.3 0.5 92.7 3,047
Fourth 4.9 8.9 9.5 2.1 90.5 3,452
Highest 9.6 34.7 14.5 4.7 85.5 3,551
Total 3.6 10.1 7.3 1.6 92.7 16,438
Table 3.4 Exposure to mass media

The Somali Health and Demographic Survey62
Percentage of women aged 15-49 who have ever used the internet, and percentage who have used the internet in the past 12 months; and among women who have used the internet in the past 12 months, percent distribution by frequency of internet use in the past month, according to background characteristics, SHDS 2020
Background characteristics
Percent distribution by reported use of the internet within the 12 months preceding the
survey
Ever used the internet
Used the internet in the past 12
monthsNumber
of womenAlmost
every day
At least once a week
Less than once a week Not at all Total
Number of
women
Age
15-19 25.4 23.5 4,649 65.5 23.3 5.8 5.4 100.0 1,091
20-24 24.3 22.7 2,906 69.8 18.9 5.3 5.9 100.0 658
25-29 14.9 13.2 2,918 71.5 19.7 4.7 4.2 100.0 385
30-34 9.1 8.7 2,195 68.8 21.2 2.9 7.1 100.0 191
35-39 6.3 5.1 1,948 63.6 12.6 12.3 11.4 100.0 100
40-44 3.6 2.9 1,176 (60.0) (20.0) (7.5) (12.5) 100.0 40
45-49 4.5 2.8 646 * * * * 100.0 23
Type of residence
Urban 32.2 29.9 6,478 70.0 19.8 5.1 5.1 100.0 1,939
Rural 12.1 10.5 4,822 62.8 23.1 7.1 7.0 100.0 505
Nomadic 0.8 0.7 5,138 (24.0) (32.0) (12.0) (32.0) 100.0 25
Education
No education 5.6 4.8 12,266 56.9 23.5 8.9 10.7 100.0 585
Primary 31.2 27.5 2,531 62.0 24.8 7.7 5.6 100.0 696
Secondary 70.4 67.4 1,214 72.6 19.3 3.8 4.3 100.0 818
Higher 90.8 88.5 427 85.0 11.7 0.7 2.6 100.0 378
Wealth quintile
Lowest 0.7 0.5 3,471 * * * * 100.0 17
Second 2.3 1.7 2,917 32.0 50.3 3.6 14.2 100.0 50
Middle 10.1 9.0 3,047 48.9 28.9 8.7 13.5 100.0 273
Fourth 21.6 19.1 3,452 65.6 22.2 6.8 5.3 100.0 660
Highest 44.2 41.6 3,551 74.1 17.5 4.3 4.1 100.0 1,477
Total 16.5 15.1 16,438 67.8 20.7 5.6 5.9 100.0 2,478
Note: Figures in parentheses are based on 25-49 unweighted cases. An asterisk indicates that a figure is based on fewer than 25 unweighted cases and has been suppressed.
Table 3.5 Internet use

63
Percent distribution of ever-married women aged 15-49 by employment status, according to background characteristics, SHDS 2020
Background characteristics
Employed in the 12 months preceding the survey
Not employed in the 12 months preceding
the survey TotalNumber of ever-married womenCurrently employed1
Not currently employed
Age
15-19 3.0 0.6 96.4 100.0 973
20-24 5.1 1.0 93.9 100.0 2,119
25-29 7.3 0.6 92.1 100.0 2,728
30-34 8.5 1.3 90.3 100.0 2,119
35-39 11.6 1.0 87.3 100.0 1,922
40-44 14.4 1.9 83.6 100.0 1,158
45-49 18.0 1.8 80.2 100.0 641
Number of living children
0 6.4 1.5 92.1 100.0 1,316
1-2 6.4 0.8 92.8 100.0 2,833
3-4 8.6 1.0 90.4 100.0 3,219
5+ 11.2 1.1 87.7 100.0 4,292
Type of residence
Urban 12.2 1.4 86.3 100.0 4,161
Rural 10.7 1.2 88.1 100.0 3,509
Nomadic 3.4 0.6 96.0 100.0 3,989
Education
No education 7.9 1.1 91.0 100.0 9,757
Primary 11.1 0.8 88.0 100.0 1,367
Secondary 12.5 0.7 86.8 100.0 375
Higher 32.3 1.7 65.9 100.0 161
Wealth quintile
Lowest 3.1 0.6 96.3 100.0 2,733
Second 6.6 1.1 92.4 100.0 2,310
Middle 11.3 1.8 86.9 100.0 2,159
Fourth 11.3 0.7 88.0 100.0 2,356
Highest 13.0 1.3 85.7 100.0 2,101
Total 8.8 1.1 90.2 100.0 11,660
1 ‘Currently employed’ is defined as having done work in the seven days preceding the survey. Includes persons who did not work in the seven days preceding the survey but who are regularly employed and were absent from work for leave illness, vacation or any other such reason.
Table 3.6 Employment status

The Somali Health and Demographic Survey64
Percent distribution of ever-married women aged 15-49 employed in the 12 months preceding the survey by type of earnings, type of employer, and continuity of employment, according to type of employment (agricultural or non-agricultural), SHDS 2020
Background characteristics Agricultural work Non-agricultural work Total
Type of earning
Cash only 45.7 83.6 72.5
Cash and in-kind 11.0 5.4 7.0
In-kind only 0.5 2.7 2.0
Not paid 42.8 8.3 18.4
Total 100.0 100.0 100.0
Type of employer
Employed by family member 63.7 27.9 38.4
Employed by non-family member 1.6 17.5 12.8
Self-employed 34.7 54.6 48.8
Total 100.0 100.0 100.0
Continuity of employment
All year 61.3 53.3 55.6
Seasonal 18.8 24.8 23.1
Occasional 19.9 21.9 21.3
Total 100.0 100.0 100.0
Number of women employed during the past 12 months 44 106 150
Table 3.7 Type of employment

65
Percentage of ever-married women aged 15-49 with specific types of health insurance coverage, and percentage with any health insurance, according to background characteristics, SHDS 2020
Background characteristics Social
security
Other employer-
based insurance
Mutual health organization/ community-
based insurance
Privately purchased
commercial insurance Other None
Number of women
Age
15-19 0.0 0.0 0.1 0.0 0.0 99.9 973
20-24 0.0 0.0 0.0 0.0 0.0 99.9 2,119
25-29 0.0 0.1 0.2 0.1 0.0 99.6 2,728
30-34 0.0 0.1 0.1 0.0 0.0 99.8 2,119
35-39 0.0 0.1 0.1 0.1 0.1 99.8 1,922
40-44 0.0 0.0 0.0 0.1 0.2 99.7 1,158
45-49 0.0 0.1 0.0 0.0 0.1 99.8 641
Type of residence
Urban 0.0 0.2 0.2 0.0 0.0 99.6 4,161
Rural 0.0 0.1 0.1 0.0 0.0 99.8 3,509
Nomadic 0.0 0.0 0.0 0.0 0.1 99.9 3,989
Education
No education 0.0 0.0 0.0 0.0 0.0 99.9 9,757
Primary 0.0 0.2 0.3 0.0 0.1 99.5 1,367
Secondary 0.0 0.0 0.8 0.3 0.0 98.9 375
Higher 0.0 1.5 0.0 0.0 0.0 98.5 161
Wealth quintile
Lowest 0.0 0.0 0.0 0.0 0.1 99.9 2,733
Second 0.0 0.0 0.1 0.0 0.0 99.8 2,310
Middle 0.0 0.0 0.1 0.0 0.0 99.9 2,159
Fourth 0.0 0.0 0.1 0.0 0.0 99.8 2,356
Highest 0.0 0.3 0.2 0.2 0.1 99.4 2,101
Total 0.0 0.1 0.1 0.0 0.0 99.8 11,660
Table 3.8 Health insurance coverage

The Somali Health and Demographic Survey66
Percentage of ever-married women aged 15-49 who use various tobacco products, according to background characteristics, SHDS 2020
Background characteristics
Percentage who smoke
CigarettesOther types of
tobaccoAny type of tobacco Number of women
Age
15-19 1.5 0.0 1.5 973
20-24 1.2 0.1 1.2 2,119
25-29 1.5 0.2 1.6 2,728
30-34 1.6 0.2 1.7 2,119
35-39 1.7 0.4 1.7 1,922
40-44 1.8 0.2 1.8 1,158
45-49 0.5 0.0 0.5 641
Type of residence
Urban 1.8 0.3 1.9 4,161
Rural 1.9 0.3 2.0 3,509
Nomadic 0.8 0.0 0.8 3,989
Education
No education 1.5 0.2 1.5 9,757
Primary 1.1 0.1 1.1 1,367
Secondary 2.3 0.1 2.3 375
Higher 2.0 0.0 2.0 161
Wealth quintile
Lowest 0.4 0.0 0.4 2,733
Second 1.4 0.5 1.4 2,310
Middle 2.4 0.4 2.4 2,159
Fourth 2.3 0.1 2.5 2,356
Highest 1.0 0.1 1.0 2,101
Total 1.5 0.2 1.5 11,660
Table 3.9 Use of tobacco

67

04Marriage, Fertility and Birth Spacing

©U
NFP
A S
OM
ALI
A/T
ob
in J
on
es

KEY FINDINGS
AGE ATFIRST BIRTH
median age at first birth in Somalia for women aged 25-49
AGE AT FIRSTMARRIAGE
The median age at first marriage is 20 for women and 23 for men
16%EARLY MARRIAGE
ever-married women aged 20-49 are married by age 15, and 34 percent are married by 18 years
62%CONTRACEPTIVEKNOWLEDGE
of ever-married women aged 15-49 have knowledge of modern contraception
21BIRTH SPACING
median months between two births among Somali women
20Years
23Years
6.9TOTAL FERTILITYRATE (TFR)
children perwoman
14%
21
TEENAGE PREGNANCYAND MOTHERHOOD
of women aged 15-19 have either given birth or are pregnant with their first child 68%
FERTILITY PLANNING
of births were reported by the mother to have been wanted at the time of conception

The Somali Health and Demographic Survey72
Estimates suggest that Somalia
has one of the highest fertility
levels in the world, second
only to Niger according to the
latest revision of the UN World
Population Prospects (United
Nations 2019). The data on
marriage and fertility collected as
part of the SHDS 2020 validates
estimates and helps gain better
insight into what is behind
Somalia’s fertility levels and
trends.
Some of these factors, including proximate determinants such as age at marriage, timing of fertility, birth spacing, age at first birth and inter-birth intervals among others, are presented in this chapter. It further examines the key factors that determine the exposure to the risk of pregnancy. Information presented pertains to women of reproductive age.
Marriage Information on marriage helps to determine the extent to which a woman is exposed to the risk of pregnancy, and informs fertility levels and trends. In general, populations in which women marry at a young age tend to initiate childbearing early, and thus have higher fertility rates in general. In Somalia, marriage and fertility are closely linked, because childbearing takes place within the context of marriage.
Marital statusThe SHDS 2020 classified marital status as never-married, currently married, divorced or widowed. Table 4.1 and Figure 4.1 show the distribution of women aged 15-49 by their current marital status and according to age. Marriage among Somali women is virtually universal, with only 6 percent of the women aged 45-49 having never entered into a marital union. The percentage of women who have never been married declines sharply with increasing age, from 79 percent among those aged 15-19 to 28 percent for women aged 20-24. Almost all Somali women are married by the age of 35. The percentage of currently married women increases with age and peaks at the
4 M A R R I A G E , F E R T I L I T Y A N D B I R T H S PA C I N G

73
35-39 age group. Additionally, widowhood significantly increases and peaks among women of age 45-49 years. Divorce among women of 15-19 years stands at 2 percent and is 6 percent among all women of reproductive ages (15-49 years).
Age at First Marriage Age at first marriage is an important indicator of exposure to the risk of conception and childbirth, especially in a society in which almost all births occur within marriage. Women who marry early will, on average, have a longer exposure to the risk of pregnancy and more
births in their reproductive years. Information on age at first marriage was obtained by asking all ever-married women the month and year in which they got married to their first husbands, while similar information for men was obtained from the household roster.
Table 4.2 shows the percentage of ever-married women aged 15-49 by specific exact ages and median age at first marriage. Sixteen percent of women in the age group 20-49 entered their first marriage by the age of 15. Thirty-four percent of women aged 20-49 were married for the first time by the age of 18, while close to half (44 percent) married for the first time by
Percent distribution of women aged 15-49 by current marital status
Percent of women age 15-49 who were first married by specific exact ages
Figure 4.1 Current marital status of women aged 15-49
Figure 4.2 Age at first marriage
79.3
28.3
7.24.7 3.3 4.7 6.4
18.0
62.8
84.2 83.985.8
80.9
70.5
2.2
7.4 6.6 7.8 6.4 7.3 9.0
0.6 1.4 1.9 3.5 4.57.0
14.1
15-19 20-24 25-29 30-34 35-39 40-44 45-49
Never Married Currently Married Divorced Widowed
16.2
33.8
44.3
NA NA
15.9
33.2
45.1
58.2
75.2
15 18 20 22 25
20-49 25-49

The Somali Health and Demographic Survey74
the age of 20. The median age at first marriage for women aged 25-49 is 20 years.
Table 4.3 shows the percentage of men aged 15-64 who were first married, by specific exact ages and the median age at first marriage. About 1 percent of men in the age bracket 20-49 entered into their first marriage by the age of 15 and 7 percent by the age of 18. Fourteen percent of the men aged 15-64 had never-married. The median age at first marriage for men aged 25-64 is 23 years.
Early MarriageEarly marriage is still widely practised in many parts of the world, including Somalia, even though it violates the rights of young people (particularly girls) and has widespread and long-term consequences. Somali parents encourage the marriage of their daughters while they are still young, in the hope that marriage will benefit the girls both financially and socially, while also relieving financial burdens on the family. This traditional practice prevents young girls from realizing their full potential in life, limiting their physical, psychological and economic development. Early marriage often results in early childbearing, which has a detrimental effect on the health of both the mother and child. It also often leads to a longer reproductive period and higher levels of fertility. In many countries, the postponement of marriage greatly reduces childbearing rates.
As seen in Table 4.2, 16 percent of women aged 20-49 and 25-49 had already married by the time they turned 15. Thirty-four percent and 33 percent of women aged 20-49 and 25-49, respectively, were first married by the age of 18 (Figure 4.2).
FertilityThis section examines a number of issues related to fertility and childbearing, including fertility levels, age at which women initiate childbearing, fertility preference, and other determinants of fertility. The knowledge of current and cumulative fertility is central to understanding population dynamics and the factors that influence the size and age structure of a population. It is also essential in monitoring the progress and evaluating the impact of population and health programmes in Somalia. Using the information collected during the SHDS, it is possible to estimate the current level of fertility, identify trends, and highlight variations in fertility according to certain characteristics. During the survey, interviewers asked all ever-married women aged 15-49 in the sampled households about the total number of children they had ever given birth to, alive or dead, the sex of the children, those that are living within the household, and children living elsewhere. Following this, interviewers compiled a complete history of births for each respondent, from the earliest to the most recent birth, recording for each of them the type of birth (single or multiple), survival status, gender and date of birth.
Current Fertility The most commonly used measures of current fertility are the total fertility rate (TFR) and one of its components—age-specific fertility rates (ASFRs). The TFR is a summary measure of fertility and is interpreted as the number of children a woman would have by the end of her child-bearing years if she were to experience the currently observed ASFRs. The TFR estimates compiled during the SHDS 2020 refer to the three years preceding the survey. The ASFR was calculated as the number of live births by women in a given age group divided by the number of woman-years in that age group during the specified period.
As presented in Figure 4.3, across most of the age groups, generally, women residing in nomadic households have higher ASFRs compared to those in rural and urban settings.
Early marriage often results in early childbearing, which has a detrimental effect on the health of both the mother and child

75
However, in the age groups 25-29, 30-34 and 35-39 years, women residing in rural households have higher ASFRs than their urban and nomadic counterparts.
Other important measures of current fertility are the general fertility rate (GFR) and crude birth rate (CBR). The GFR is the annual number of live births in a population per 1,000 women aged 15-49, while the CBR is the ratio of the number of live births occurring in a given year per 1,000 population.
Table 4.4 presents the ASFRs and aggregate fertility measures (TFR, GFR, and CBR) by place of residence.
The total fertility rate for Somalia is 6.9 children per woman. According to the SHDS findings, differences can be noted in the TFRs of women by their type of residence. The TFR is highest among women residing in nomadic areas, at 7.3, and lowest among those residing in urban areas, at 6.4 (Figure 4.4). Childbearing peaks in the age groups 20-24 and 25-29 and drops sharply after 39 years.
Overall, the GFR in Somalia is 228 per 1,000 women. The GFR is 235 births per 1,000 women for women living in rural areas, 211
births per 1,000 women for those in urban areas and 244 births per 1,000 women for women in nomadic households. The CBR exhibits the same pattern as the TFR and the GFR. There is a small difference between the TFR reported in the Multiple Indicator Cluster Survey 2006 (UNICEF 2006), reported as 6.7 children per woman, and the SHDS 2020, which states it is 6.9 children per woman. While comparing both figures, it is important to keep in mind that the MICS 2006 coverage of the nomadic population was excluded. The TFR estimate for 2015-2020 presented in the World Population Prospects for Somalia is 6.1 (United Nations 2019)1 . Data from the SHDS suggests that the fertility levels in Somalia have remained relatively stable over the past couple of decades, and that the decline expected by international experts did not materialize.
1 According to these estimates the TFR for 2015-20 was highest in Niger -- 6.95, followed by Somalia, the Democratic Republic of the with 5.95, and Mali with 5.92 (United Nations 2019)
The total fertility rate for Somalia is 6.9 children per woman
Percent of women age 15-49 who were first married by specific exact ages
Figure 4.3 Age-specific fertility rates by residence
0
50
100
150
200
250
300
350
400
15-19 20-24 25-29 30-34 35-39 40-44 45-49
Birt
hs p
er 1,
00
0 w
omen
Urban Rural Nomadic

The Somali Health and Demographic Survey76
Table 4.5 presents the TFR and the mean number of children ever born (CEB) by background characteristics of the women. It is important to keep in mind that the two indicators capture two different perspectives on fertility. The TFR is a “period” indicator, which shows the number of children that would be born per woman if she was subject to the current schedule of age-specific fertility rates. The CEB is a cohort indicator, which measures the mean number of children born alive to women in a given age group. The number of children ever born to a particular woman is a measure of her lifetime fertility experience up to the moment the SHDS interview was carried out. Table 4.5 presents the CEB for women aged 40 to 49 years, as they are nearing the end of their reproductive lives and thus could
be interpreted as a measure of the average completed fertility. It is important to keep in mind that the reporting of children ever born is subject to recall and other biases, and this is particularly pronounced among older women. The table also presents data for women who reported they were pregnant at the time of the survey.
Comparing the TFR (a measure of period/current fertility) with the mean number of CEB among women aged 40 to 49/completed fertility (a measure of cohort/past fertility) provides important insights in fertility patterns and trends. If fertility remained stable over time and women accurately reported the number of children they have ever born alive, the TFR and mean CEB for women aged 40-49 would be equal. The SHDS indicates there is a very slight difference between the TFR (6.9) and mean CEB for women aged 40-49 years (7.2). This could mean fertility is declining slightly, or a lower recall bias.
As Table 4.5 indicates, the TFR is consistently lower than the mean number of children ever born for women aged 40-49. This is likely to be attributed to the aforementioned problems with recall and other biases in reporting CEB. The magnitude of the differences suggests though that the current fertility levels in Somalia might be lower than in the past. A forthcoming specialized thematic report will look into this in more detail. Notably, this pattern holds across places of residence and women’s education levels. In terms of differences in TFR by place of residence, Table 4.5 indicates that fertility is lowest among women living in urban areas and highest among those living in nomadic areas. Only the TFR for women living in urban areas is lower, at 6.4, than the national average of 6.9 children per woman. The largest fertility differentials are associated with educational background (Figure 4.5). For women with no education, the TFR is about twice as high (7.2) as that for women with higher education (3.7). Notably, the difference in TFR between women with no education and those with primary education is relatively small (Table 4.5 and Figure 4.5).
6.4
7.1
7.3
6.9
Urban
Rural
Nomadic
Total
7.26.4
4.7
3.7
No education Primary Secondary Higher
Total fertility rates by residence
Total fertility rates by level of education
Figure 4.4 Total fertility rates
Figure 4.5 Fertility by educational background

77
Another measure of fertility is the proportion of women who were pregnant at the time the survey was conducted. This represents, in a sense, the most current level of fertility, since it anticipates fertility during the months following the survey. However, this measure of current fertility should also be treated with caution as pregnancies are generally under-reported. Some women in the early stages of pregnancy may be unaware or uncertain that they are pregnant, and others may deliberately avoid mentioning their status due to local customs and tradition.
Overall, 17 percent of ever-married women were pregnant at the time the survey was conducted. There is a slight variation in the proportions of ‘currently pregnant women’ (pregnant at the time the survey was conducted) with respect to their places of residence, at 18 percent, 17 percent and 16 percent for urban, nomadic and rural settings, respectively.
Information on the number of CEB for Somalia is presented in Table 4.6 for ever-married women and currently married women. On average, ever-married women aged 45-49 have given birth to 8.8 children, of whom 8 survived until the time the survey was conducted. Of the 9.5 children born on average to currently married women aged 45-49, 8.6 survived until the time the survey was conducted. The difference in fertility between the two groups could be attributed to the fact that it is almost universal that children are born within marriage across the country. The dissolution of marriage, particularly at early ages of childbearing, reduces the exposure to the risk of pregnancy and childbearing.
The mean number of CEB increases with age, reflecting the natural family building process.
For example, among ever-married women, the average number of live births for the age group 25-29 is 4.8, while women of 35-39 years reported an average of 8.4 children. Among currently married women, the mean CEB to women of 25-29 years is 5.2, 8.8 for women in the 35-39 age group and 9.5 among women aged 45-49.
Inter-Birth IntervalsThe inter-birth interval, defined as the period of time between two consecutive births, has important implications both for the health of the mother and child and for the fertility levels in a population. After a live birth, the recommended interval before attempting the next pregnancy is at least 24 months, in order to reduce the risk of adverse maternal, perinatal and infant outcomes (WHO 2005). Children born too close together have long been associated with an increased risk of adverse health outcomes, including infant, child and maternal mortality (B. K. Dabal, 2007).
Table 4.7 presents the distribution of non-first births that occurred in the five years preceding the survey by the number of months since the previous birth, according to background characteristics. It shows that the median spacing between births is 21 months. Twenty-three percent of births reported a spacing of 60 months and above. Births with a spacing of less than 18 months accounted for 27 percent of the total number. There is no difference in the mean birth interval whether or not the preceding birth is male or female.
MenopauseWomen are considered to have reached menopause if they are neither pregnant nor postpartum amenorrhoeic and have not had a menstrual period in the six months before the survey; if they report being menopausal; or having had a hysterectomy; or if they have never menstruated. Table 4.8 shows that, overall, 18 percent of women aged 30-49 are menopausal. As could be expected, the proportion of menopausal women increases with age.
On average, ever-married women aged 45-49 have given birth to 8.8 children, of whom 8 survived

The Somali Health and Demographic Survey78
Age at First BirthThe age at which childbearing commences is an important determinant of the overall level of fertility, as well as the health and well-being of the mother and child. The data on age at first birth is sometimes affected by reporting errors, such as misreporting the woman’s age, underreporting of first births, and misreporting the first child’s date of birth. Such errors are usually more pronounced among older women. Table 4.9 shows the percentage of women by age at first birth according to their current age. The survey shows that the median age at first birth for Somali women aged 25-49 is 21 years.
Table 4.10 summarizes the median age at first birth for women aged 20-49 and 25-49 across residential, educational, and wealth status subgroups. The results show that the median age at first birth does not vary much by these background characteristics, with the exception of women with higher education, who—as could be expected—had their first children later, at 22 years, compared to women with primary education, who had their first children at 19 years.
Teenage Pregnancy and Motherhood
Teenage pregnancy and motherhood is defined as the percentage of women aged 15-19 who are pregnant with their first child at the time of the survey, or have had a live birth or have begun childbearing, according to the DHS program (Croft T et al. 2018).
Childbearing under the age of 20 has major health implications for both the mother and the child. Likewise, pregnancy under the age of 20 has adverse social consequences, especially for female education, as women who become mothers under the age of 20 are likely not to complete their education.
The percentage of teenage women (aged 15-19) who are mothers or pregnant with their first child is shown in Table 4.11 – the data indicates that 14 percent of the Somali girls aged 15-19 fall in this category, 12 percent having already given birth to a child and 2 percent being pregnant with their first child. The proportion of teenagers who have begun childbearing rises rapidly with age. Two percent of women aged 15 have started childbearing, but by the age of 19, 39 percent of women have had a baby, or are pregnant with their first child. There are significant differences in background
Percentage of women age 15-19 who have begun childbearing
Figure 4.6 Teenage pregnancy and motherhood by household wealth
20.3
17.4
14.311.7
9.1
Lowest Second Middle Fourth Highest

79
characteristics – while 19 percent of girls aged 15-19 in nomadic areas are already mothers or pregnant with their first child, this proportion in urban areas is 11 percent. Nineteen percent of girls aged 15-19 without education have had a baby or are pregnant, compared to 2 percent of girls with higher education who fall within this bracket. Twenty percent of the girls aged 15-19 in the poorest households have started childbearing, compared to 9 percent of girls of the same age in the wealthiest households (Figure 4.6).
Fertility Preferences
Information on fertility preferences can help assess the desire for children, ideal number of children, the extent of wanted, mistimed and unintended pregnancies. Data on fertility preferences may suggest the way in which fertility trends and patterns are likely to evolve in the future. This section presents SHDS data on whether and when married women desire more children and the desire to limit children, by background characteristics. It also presents the reported ideal number of children, the mean ideal number of children, and whether the last birth was intended at the time of conception.
Fertility Preferences by Number of Living Children
Table 4.12 presents the percent distribution of currently married women by their desire for more children, according to the number of living children they had, as stated at the time the survey was conducted. Sixty-nine percent of currently married women want to have a child soon, 14 percent are undecided on whether to have another child, and 12 percent
do not want any more children. Seventy-seven percent of currently married women with no living children want to have a child soon, while 59 percent of women with six or more children want to have another child soon. Only 3 percent of currently married women reported they want to have another child later.
Desire to Limit Childbearing Table 4.13 shows the percentage of currently married women who want no more children by the number of living children they already have, according to background characteristics. Overall, 12 percent of currently married women are willing to stop childbearing. The desire to limit childbearing increases as the number of living children increases, from zero percent among married women with no living children to 20 percent among women with six or more living children.
Analysis by women’s residence shows that, generally, nomadic women are less likely to want no more children in comparison to urban and rural women (11 percent, 12 percent and 14 percent, respectively). There is no clear relationship between wealth and wanting no more children. However, women in fourth and middle wealth quintiles are more likely to want no more children (14 percent and 13 percent, respectively) than women in the lowest (10 percent) and the highest quintiles (12 percent).
Ideal Number of ChildrenIn order to obtain a greater insight into fertility preferences among Somali women, the SHDS interviewers asked all ever-married women, regardless of the number of living children they have, a hypothetical question about the number of children they would choose to have if they could start their reproductive lives again. Respondents with no children were asked: “If you could choose exactly the number of children to have in your whole life, how many would that be?” Respondents who had children were asked: “If you could go back to the time when you did not have any children and could choose exactly the number of children to have in your whole life, how many would that be?”
Women who become mothers under the age of 20 are likely not to complete their education
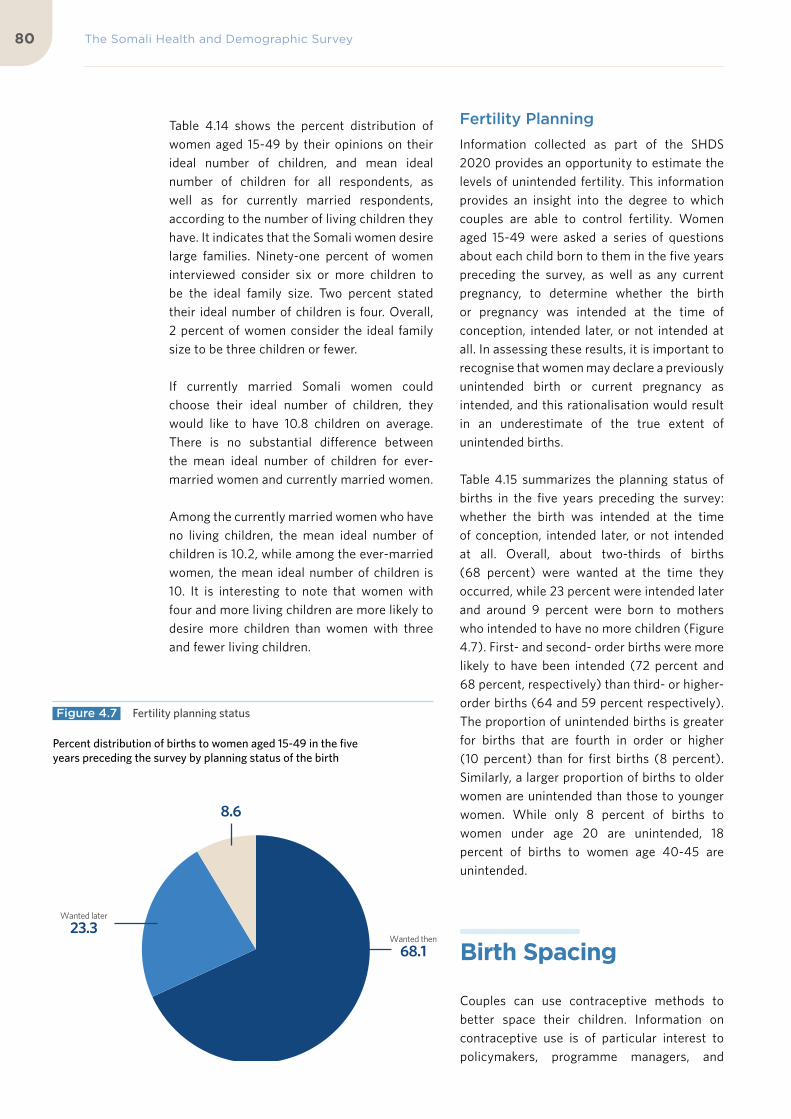
The Somali Health and Demographic Survey80
Table 4.14 shows the percent distribution of women aged 15-49 by their opinions on their ideal number of children, and mean ideal number of children for all respondents, as well as for currently married respondents, according to the number of living children they have. It indicates that the Somali women desire large families. Ninety-one percent of women interviewed consider six or more children to be the ideal family size. Two percent stated their ideal number of children is four. Overall, 2 percent of women consider the ideal family size to be three children or fewer.
If currently married Somali women could choose their ideal number of children, they would like to have 10.8 children on average. There is no substantial difference between the mean ideal number of children for ever-married women and currently married women.
Among the currently married women who have no living children, the mean ideal number of children is 10.2, while among the ever-married women, the mean ideal number of children is 10. It is interesting to note that women with four and more living children are more likely to desire more children than women with three and fewer living children.
Fertility Planning Information collected as part of the SHDS 2020 provides an opportunity to estimate the levels of unintended fertility. This information provides an insight into the degree to which couples are able to control fertility. Women aged 15-49 were asked a series of questions about each child born to them in the five years preceding the survey, as well as any current pregnancy, to determine whether the birth or pregnancy was intended at the time of conception, intended later, or not intended at all. In assessing these results, it is important to recognise that women may declare a previously unintended birth or current pregnancy as intended, and this rationalisation would result in an underestimate of the true extent of unintended births.
Table 4.15 summarizes the planning status of births in the five years preceding the survey: whether the birth was intended at the time of conception, intended later, or not intended at all. Overall, about two-thirds of births (68 percent) were wanted at the time they occurred, while 23 percent were intended later and around 9 percent were born to mothers who intended to have no more children (Figure 4.7). First- and second- order births were more likely to have been intended (72 percent and 68 percent, respectively) than third- or higher- order births (64 and 59 percent respectively). The proportion of unintended births is greater for births that are fourth in order or higher (10 percent) than for first births (8 percent). Similarly, a larger proportion of births to older women are unintended than those to younger women. While only 8 percent of births to women under age 20 are unintended, 18 percent of births to women age 40-45 are unintended.
Birth Spacing
Couples can use contraceptive methods to better space their children. Information on contraceptive use is of particular interest to policymakers, programme managers, and
Wanted then
68.1
Wanted later
23.3
Wanted no more
8.6
Percent distribution of births to women aged 15-49 in the five years preceding the survey by planning status of the birth
Figure 4.7 Fertility planning status

81
researchers in population and birth spacing. This section describes women’s knowledge and use of contraceptive methods and the need and demand for birth spacing.
Knowledge of Contraceptive Methods
The knowledge of contraceptive methods is a precondition for their proper use. Information regarding knowledge of birth spacing methods was gathered by asking the respondent first about ways or methods by which the couple could delay or avoid pregnancy. If the respondent failed to mention any of the
methods included in the questionnaire, the interviewer described the method and asked the respondent whether she had heard about it. No questions were asked to obtain information about the depth of knowledge.
Contraceptive methods used for the survey were classified into two broad categories: modern methods and traditional methods. Modern methods include the pill, the intrauterine device (IUD), injectables, implants, the male and the female condom, the diaphragm, the lactational amenorrhea method (LAM), and emergency contraception. Traditional methods include rhythm (periodic abstinence) and withdrawal.
Percentage of all ever-married women, currently married women 15-49 who have heard of any contraceptive method, by specific method
Figure 4.8 Knowledge of contraceptive methods
62.6
62.0
15.8
31.3
25.4
35.0
17.3
10.3
11.5
12.1
53.5
1.0
17.4
11.0
14.1
1.2
63.0
62.3
15.2
31.1
25.0
34.7
16.9
10.1
11.2
11.9
53.7
0.9
17.3
10.8
13.9
1.2
Any method
Any modern method
IUDs
Injectables
Implants
Pills
Male condoms
Female condoms
Emergency contraception
Standard days method
Lactational Amenorrhea (LAM)
Other modern methods
Any traditional method
Rhythm
Withdrawal
Traditional methods
Currently married women All ever-married women

The Somali Health and Demographic Survey82
Table 4.16 presents data on the knowledge of contraceptive methods. It indicates that around 63 percent of ever-married women have heard of at least one method of contraception. Modern contraceptive methods are more widely known than traditional methods—62 percent each of both ever-married women and currently married women know of any modern method, while 17 percent each of ever-married women and currently married women know of a traditional method (Figure 4.8).
The LAM, pill, injectables, implants and condoms are the contraceptive methods most commonly known among Somali women. Fifty-four percent of women have heard of lactational amenorrhea, 35 percent have heard of the pill, 31 percent have heard of injectables, 25 percent have heard of implants, and 17 percent have heard of the male condom.
Table 4.17 presents data on the knowledge of contraceptive methods by background characteristics. It shows that knowledge of contraception is highest among older women, with about half of the girls aged 15-19 having heard of contraceptive methods. Women in urban areas are more likely to know of contraceptive methods, as close to three-quarters of them stated they had heard of at
least one modern method, compared to 65 percent among women in rural areas, and 52 percent of women who reside in nomadic areas. As could be expected, women with higher education are best informed about contraception—90 percent of them have heard of at least one method (Figure 4.9).
Contraceptive Use One of the most frequently used indicators for assessing the success of birth spacing programmes is examining the current level of contraceptive use. This is also widely used as a measure in the analysis of determinants of fertility.
Table 4.18 shows the distribution of currently married women who were using modern contraception by age. As indicated in the table, 7 percent of the currently married women are using any contraceptive method and 1 percent are using modern methods. Among the 15-19-year olds, 11 percent are using contraceptives compared to 2 percent of those aged 40-44.
Knowledge of Fertile Period To examine a woman’s knowledge of the reproductive process, respondents were asked
Percentage of currently married women aged 15-49 who have heard of at least one contraceptive method
Figure 4.9 Knowledge of contraceptive methods by education
59.4
79.784.9
89.7
No education Primary Secondary Higher

83
whether there were certain days between the menstrual periods when a woman was more likely to become pregnant if she had sexual intercourse. Those women who responded that the fertile period is “halfway between two menstrual periods” were considered to have correct knowledge of their fertile period. Table 4.19 shows the percentage of ever-married women aged 15-49 with correct knowledge of the fertile period during the ovulation cycle, according to age. Overall, only 10 percent of ever-married women correctly reported the most fertile time as being halfway between two menstrual periods.
Among young ever-married women (15-19 years of age), 8 percent had correct knowledge of the fertile period. Around 10 percent of women in the age group 20-24 were able to correctly identify a woman’s monthly cycle, while 11 percent of women aged 45-49 reported the correct women’s fertile period. These results indicate a continued need for education about women’s physiology of reproduction and effective use of contraceptive methods.
Need and Demand for Birth Spacing
One of the major concerns of birth spacing programmes is to assess the size of the potential demand for contraception and to identify women who are in need of contraceptive services. Table 4.20 presents estimates of unmet need, met need, and the total demand for birth spacing. The table also shows the percentage of the total demand that is satisfied.
Women who are currently married and who either do not want any more children or want
to wait two or more years before having another child, but are not using contraception, are considered to have an ‘unmet need’ for birth spacing. Women with a ‘met need’ for birth spacing are those who are currently using contraception. The total demand for birth spacing is the sum of unmet needs and met needs.
Table 4.20 shows that 37 percent of currently married women have an unmet need for birth spacing services (29 percent for spacing births and 8 percent for stopping childbearing). One percent of married women are currently using a contraceptive method or have a met need for either birth spacing or limiting childbearing. Thirty-eight percent of currently married women have a demand for birth spacing (30 percent for birth spacing and 8 percent for limiting childbearing). At present, only 3 percent of the potential demand for birth spacing is being met. This means that if all married women who said they want to space the births of their children, or limit their number of children were to use birth spacing methods, the contraceptive prevalence rate would increase from 1 percent to 38 percent.
Analysis by age shows that the unmet need for birth spacing is highest among women aged 30-34 (39 percent), and lowest among women aged 15-19 (31 percent). Unmet need is slightly higher in rural and nomadic areas than urban areas, with urban areas at 36 percent and both rural and nomadic areas at 37 percent each.
Unmet needs are higher among women with no education than women with primary education, at 37 percent, followed by women with higher education, at 30 percent. Women with secondary education have the lowest unmet needs at 29 percent. Unmet need is lowest among women from wealthier households, at 34 percent, and highest among women in the middle wealth quintile, at 39 percent. There are no big differences in the total demand for birth spacing among currently married women from households of different wealth.
Comparison with the 2006 MICS indicates that unmet need among currently married women
Among the 15-19-year olds, 11 percent are using contraceptives compared to 2 percent of those aged 40-44

Ninety-one percent of women interviewed consider six or more children to be the ideal family size

©A
U U
N I
ST P
HO
TO
/To
bin
Jo
nes

The Somali Health and Demographic Survey86
increased from 26 percent to 37 percent over the past 14 years.
Exposure to Birth Spacing Messages
The role of the media in promoting birth spacing is essential in bringing information to different target groups. Data on the level of exposure to media, such as the radio, television, and papers/magazines are important for programme managers and planners to effectively target population subgroups for information, education, and communication campaigns. To assess the effectiveness of such media on the dissemination of birth spacing information, interviewing teams asked ever-married women whether they had heard messages about birth spacing on the radio or seen related messages on television or in newspapers/magazines during the few months preceding the survey.
Table 4.21 shows that women’s exposure to all three media is very low. About 13 percent of women have heard a message related to birth spacing on the radio. Close to 10 percent of women reported having seen a message on birth spacing on television, and 4 percent saw a message on birth spacing in a newspaper. Eighty-two percent of women had not been exposed to birth spacing messages in any of these media. As expected, women in nomadic areas are less likely to have been exposed to birth spacing messages in the media compared to women in urban and rural areas.
Table 4.1 Current marital status 87
Table 4.2 Age at first marriage - Women 87
Table 4.3 Age at first marriage - Men 88
Table 4.4 Current Fertility 88
Table 4.5 Selected fertility indicators by background characteristics 89
Table 4.6 Children ever born and living 90
Table 4.7 Birth intervals 91
Table 4.8 Menopause 92
Table 4.9 Age at first birth 92
Table 4.10 Median age at first birth 93
Table 4.11 Teenage pregnancy and motherhood 94
Table 4.12 Fertility preferences by number of living children 95
Table 4.13 Desire to limit childbearing—Women 95
Table 4.14 Ideal number of children 96
Table 4.15 Fertility planning status 97
Table 4.16 Knowledge of contraceptive methods 98
Table 4.17 Knowledge of contraceptive methods by background characteristics 99
Table 4.18 Current use of contraception by age 100
List of Tables

87
Percent distribution of women aged 15-49 by current marital status and age, SHDS 2020
AgeNever-married
Currently Married Divorced Widowed Total
Number of women
15-19 79.3 18.0 2.2 0.6 100.0 4,705
20-24 28.3 62.8 7.4 1.4 100.0 2,956
25-29 7.2 84.2 6.6 1.9 100.0 2,942
30-34 4.7 83.9 7.8 3.5 100.0 2,224
35-39 3.3 85.8 6.4 4.5 100.0 1,989
40-44 4.7 80.9 7.3 7.0 100.0 1,216
45-49 6.4 70.5 9.0 14.1 100.0 684
Total 30.2 61.1 5.8 2.8 100.0 16,715
Percentage of women aged 15-49 who were first married by specific exact ages, and median age at first marriage, according to current age, SHDS 2020
Current age
Percentage first married by exact age:
15 18 20 22 25
Percentage of never-married
Number of respondents
Median age at first marriage
15-19 7.8 n/a n/a n/a n/a 78.9 4,644 a
20-24 16.8 35.5 41.8 n/a n/a 26.9 2,910 a
25-29 14.6 32.4 42.2 55.9 71.8 6.4 2,919 20.0
30-34 24.9 36.7 48.0 60.6 79.2 3.4 2,193 19.0
35-39 12.8 33.8 45.6 59.6 78.4 1.3 1,949 20.0
40-44 9.9 29.5 46.9 57.3 71.3 1.5 1,179 20.0
45-49 11.7 29.7 43.9 58.4 74.0 0.8 645 20.0
20-49 16.2 33.8 44.3 n/a n/a 9.3 11,796 a
25-49 15.9 33.2 45.1 58.2 75.2 3.5 8,885 20.0
Note: The age at first marriage is defined as the age at which the respondent got married to her first spouse
n/a = Not applicable due to censoring
a = Omitted because less than 50 percent of the women got married for the first time before reaching the beginning of the age group
Table 4.1 Current marital status
Table 4.2 Age at first marriage - Women
Table 4.19 Knowledge of fertile period by age 101
Table 4.20 Need and demand for birth spacing among currently married women 101
Table 4.21 Exposure to birth spacing messages 102

The Somali Health and Demographic Survey88
Table 4.3 Age at first marriage - Men
Table 4.4 Current Fertility
Percentage of men aged 15-64 who were first married by specific exact ages, and median age at first marriage, according to current age, SHDS 2020
Current agePercentage first married by exact age: Percentage
of never-married
Number of respondents
Median age at first marriage15 18 20 22 25
15-19 0.2 n/a n/a n/a n/a 86.5 3,332 a
20-24 0.3 5.6 10.5 n/a n/a 59.5 2,041 a
25-29 0.2 5.3 13.6 30.3 43.0 28.5 2,081 a
30-34 0.8 7.6 16.9 36.9 49.1 16.8 1,933 22.0
35-39 0.5 7.3 18.1 37.3 50.2 12.4 1,716 23.0
40-44 0.6 8.7 17.2 39.6 53.5 9.0 1,523 23.0
45-49 0.2 9.1 18.0 39.0 49.9 7.5 933 23.0
50-54 0.9 7.7 17.1 35.5 47.5 10.2 1,404 24.0
55-59 0.8 8.3 17.3 40.5 55.7 8.0 774 23.0
60-64 0.4 9.6 18.2 39.4 53.7 6.5 899 23.0
20-49 0.5 7.0 15.3 n/a n/a 24.9 10,227 a
25-49 0.5 7.3 16.5 36.0 48.7 16.3 8,186 a
20-64 0.5 7.3 15.8 n/a n/a 21.2 13,305 a
25-64 0.5 7.6 16.7 36.5 49.4 14.2 11,263 23.0
Note: The age at first marriage is defined as the age at which the respondent got married to his first spouse
n/a = Not applicable due to censoring
a = Omitted because less than 50 percent of the men got married for the first time before reaching the beginning of the age group
Age-specific and total fertility rates, the general fertility rate, and the crude birth rate for the three years preceding the survey, by residence, SHDS 2020
Age groupResidence
TotalUrban Rural Nomadic
15-19 94 112 157 118
20-24 304 342 350 329
25-29 312 343 320 324
30-34 290 299 284 291
35-39 174 189 178 180
40-44 79 104 128 102
45-49 20 36 41 33
TFR (15-49) 6.4 7.1 7.3 6.9
GFR 211 235 244 228
CBR 38.5 43.9 46.3 42.2
Notes: Age-specific fertility rates are per 1,000 women.
Rates for age group 45-49 may be slightly biased due to truncation.
Rates are for the period 1-36 months prior to interview.
TFR: Total fertility rate expressed per women
GFR: General fertility rate expressed per 1,000 women aged 15-49
CBR: Crude birth rate expressed per 1,000 population

89
Total fertility rate for the three years preceding the survey, percentage of women aged 15-49 currently pregnant, and mean number of children ever born to women aged 40-49 years, by background characteristics, SHDS 2020
Background characteristicTotal Fertility Rate
Mean number of children ever born to women aged 40-49
Percentage women aged 15-49 currently pregnant
Type of residence
Urban 6.4 6.8 18
Rural 7.1 7.2 16.4
Nomadic 7.3 8.3 16.9
Education
No education 7.2 8.3 16.1
Primary 6.4 8.6 20.5
Secondary 4.7 6.3 30.9
Higher 3.7 6.4 23.5
Wealth quintile
Lowest 7.3 7 17.4
Second 7.7 7.6 16.2
Middle 7 7.3 17.9
Fourth 7 7 16.7
Highest 5.6 7.1 17.6
Total 6.9 7.2 17.1
Note: Total fertility rates are for the period 1-36 months preceding the interview
Table 4.5 Selected fertility indicators by background characteristics

The Somali Health and Demographic Survey90
Percent distribution of all women and currently married women aged 15-49 by the number of children ever born, mean number of children ever born and mean number of living children, according to age group, SHDS 2020
Age
Number of children ever born
TotalNumber
of women
Mean number
of children
ever born
Mean number of living children0 1 2 3 4 5 6 7 8 9 10+
Ever- married women
15-19 88.5 7.2 3.3 1.0 0.0 0.0 0.0 0.0 0.0 0.0 0.0 100.0 4,649 0.2 0.2
20-24 41.6 14.6 19.8 16.6 7.4 0.0 0.0 0.0 0.0 0.0 0.0 100.0 2,906 1.9 2.1
25-29 13.3 7.4 14.5 18.5 18.4 13.6 7.6 4.5 1.3 0.6 0.3 100.0 2,918 4.8 4.6
30-34 9.5 4.2 8.3 12.2 13.6 14.9 13.7 10.4 7.3 3.0 3.0 100.0 2,195 6.7 6.3
35-39 5.3 1.9 5.9 8.0 10.5 12.9 12.8 15.3 9.8 8.4 9.2 100.0 1,948 8.4 7.9
40-44 7.3 1.4 4.7 7.9 9.8 14.5 13.9 10.5 8.6 8.4 13.0 100.0 1,176 8.5 7.9
45-49 6.0 1.0 6.2 10.0 7.3 13.2 13.7 8.7 10.2 9.6 14.3 100.0 646 8.8 8.0
Total 37.4 6.8 9.4 10.0 8.6 7.5 6.2 5.1 3.4 2.5 3.0 100.0 16,438 4.1 3.9
Currently married women
15-19 44.4 34.3 16.5 4.8 0.0 0.0 0.0 0.0 0.0 0.0 0.0 100.0 844 1.2 1.2
20-24 19.7 19.3 26.5 23.8 10.7 0.0 0.0 0.0 0.0 0.0 0.0 100.0 1,857 2.7 2.9
25-29 6.5 7.3 14.9 20.2 19.9 15.2 8.5 5.1 1.5 0.7 0.3 100.0 2,477 5.2 5.0
30-34 5.3 3.2 7.9 12.9 13.7 15.7 15.6 11.1 7.9 3.4 3.4 100.0 1,866 7.1 6.8
35-39 3.6 1.5 5.5 7.8 10.2 12.5 13.5 15.5 10.5 9.3 10.2 100.0 1,705 8.8 8.2
40-44 5.4 1.2 4.5 7.6 9.8 14.2 14.5 10.5 9.2 9.2 13.9 100.0 984 8.9 8.2
45-49 3.1 0.1 5.9 9.5 5.6 14.8 14.5 8.3 11.4 10.5 16.3 100.0 483 9.5 8.6
Total 11.0 9.1 12.9 14.4 12.2 10.7 9.2 7.3 5.0 3.7 4.5 100.0 10,215 5.9 5.6
Table 4.6 Children ever born and living

91
Percent distribution of non-first births in the five years preceding the survey by number of months since preceding birth, and median number of months since preceding birth, according to background characteristics, SHDS 2020
Background characteristics
Birth order (number of months since preceding birth)
Number of non-first births
Median number of
months since preceding birth7-17 18-23 24-35 36-47 48-59 60+ Total
Age
15-19 13.0 2.6 5.9 1.0 0.1 77.4 100.0 246 13.8
20-29 28.3 13.2 20.9 5.9 2.0 29.6 100.0 4,346 19.2
30-39 27.3 17.5 29.6 10.7 5.0 9.9 100.0 2,890 23.0
40-49 19.2 11.9 29.4 11.8 7.2 20.5 100.0 526 24.0
Sex of preceding birth
Male 27.0 14.8 24.0 7.8 3.8 22.7 100.0 4,280 21.0
Female 26.8 13.8 24.3 8.0 2.8 24.2 100.0 3,729 21.0
Survival of preceding birth
Living 27.4 14.5 24.1 7.5 3.2 23.3 100.0 7,400 20.8
Dead 20.4 12.3 25.2 13.0 4.8 24.2 100.0 608 24.0
Birth order
2-3 27.1 14.5 24.5 7.8 3.2 22.9 100.0 7,335 20.8
4-6 26.0 13.2 20.6 8.9 5.5 25.8 100.0 608 22.4
7+ 12.0 6.7 18.1 7.2 1.9 54.0 100.0 66 21.6
Type of residence
Urban 30.4 13.2 22.9 7.6 3.2 22.7 100.0 2,987 23.0
Rural 26.2 16.1 24.7 8.4 2.8 21.7 100.0 2,436 23.0
Nomadic 23.4 14.0 25.1 7.8 4.0 25.7 100.0 2,586 19.2
Education
No education 26.1 14.4 25.0 8.2 3.6 22.6 100.0 6,664 21.0
Primary 31.7 14.0 20.6 6.5 2.2 25.0 100.0 1,058 20.0
Secondary 30.0 14.8 13.1 7.8 2.7 31.5 100.0 199 21.6
Higher 22.5 10.6 23.4 0.0 1.3 42.3 100.0 87 24.9
Wealth quintile
Lowest 22.2 14.4 25.8 7.4 3.8 26.4 100.0 1,756 20.0
Second 23.8 13.7 27.1 9.8 3.5 22.1 100.0 1,630 20.0
Middle 30.5 14.9 23.4 6.4 3.1 21.7 100.0 1,615 21.0
Fourth 30.9 13.3 22.9 8.1 3.5 21.4 100.0 1,733 22.0
Highest 27.2 15.7 20.7 7.8 2.8 25.8 100.0 1,275 22.0
Total 26.9 14.3 24.1 7.9 3.3 23.4 100.0 8,009 21.0
Note: First-order births are excluded. The interval for multiple births is the number of months since the preceding pregnancy that ended in a live birth.
Table 4.7 Birth intervals

The Somali Health and Demographic Survey92
Percentage of women aged 30-49 who are menopausal, by age, SHDS 2020
Age Percentage menopausal1 Number of women
30-34 15.7 2,195
35-39 15.1 1,948
40-41 17.8 906
42-43 16.1 222
44-45 30.5 410
46-47 29.8 164
48-49 43.8 121
Total 17.8 5,9651 Percentage of women who are not pregnant and not postpartum amenorrhoeic, whose last menstrual period occurred six or more months preceding the survey.
Percentage of women aged 15-49 who gave birth by specific exact ages, percentage who have never given birth, and median age at first birth, according to current age, SHDS 2020
Current age
Percentage who gave birth by exact age: Percentage who never given
birthNumber of
womenMedian age at
first birth15 18 20 22 25
15-19 1.2 na na na Na 82.0 4,649 a
20-24 2.6 27.2 48.8 na Na 30.6 2,906 a
25-29 3.7 24.1 45.3 65.0 81.9 8.7 2,918 20.0
30-34 4.8 24.9 43.5 60.8 77.5 5.4 2,195 20.0
35-39 2.3 15.9 36.4 57.1 75.9 1.7 1,948 21.0
40-44 3.2 12.8 27.2 47.0 66.4 2.9 1,176 21.0
45-49 2.1 12.1 21.0 33.2 51.7 2.2 646 21.0
20-49 3.3 21.9 41.2 na na 11.4 11,789 a
25-49 3.5 20.1 38.8 57.5 75.3 5.1 8,883 21.0
n/a = Not applicable due to censoring
a = Omitted because less than 50 percent of women had a birth before reaching the beginning of the age group.
Table 4.8 Menopause
Table 4.9 Age at first birth

93
Median age at first birth among women aged 20-49 and 25-49 years, by background characteristics, SHDS 2020
Background characteristics Women aged 20-49 Women aged 25-49
Type of residence
Urban 19.0 20.0
Rural 20.0 20.0
Nomadic 20.0 20.0
Education
No education 20.0 20.0
Primary 19.0 20.0
Secondary 20.0 21.0
Higher 22.0 21.0
Wealth quintile
Lowest 20.0 20.0
Second 19.0 20.0
Middle 19.0 20.0
Fourth 20.0 20.0
Highest 20.0 20.0
Total 20.0 20.0
a = Omitted because less than 50 percent of the women had a birth before reaching the beginning of the age group
Table 4.10 Median age at first birth

The Somali Health and Demographic Survey94
Percentage of women aged 15-19 who have had a live birth or who are pregnant with their first child, and percentage who have begun childbearing, SHDS 2020
Background characteristics
Percentage of women age 15-19 who:
Number of womenHave had a live birth
Are pregnant with first child
Percentage who have begun childbearing
Age group
15-19 11.6 2.4 14.0 4,649
15 1.2 0.7 1.9 1,192
16 2.3 0.6 2.9 933
17 7.6 2.9 10.5 801
18 19.9 4.3 24.2 1,052
19 35.0 4.4 39.4 671
Type of residence
Urban 8.9 1.9 10.9 1,973
Rural 11.3 2.3 13.6 1,314
Nomadic 15.8 3.3 19.1 1,363
Education
No education 15.7 3.3 18.9 2,660
Primary 8.0 1.5 9.5 1,166
Secondary 3.9 1.0 4.9 724
Higher 2.4 0.0 2.4 100
Wealth quintile
Lowest 16.7 3.6 20.3 858
Second 14.9 2.5 17.4 727
Middle 11.9 2.3 14.3 928
Fourth 9.4 2.3 11.7 1,006
Highest 7.4 1.7 9.1 1,130
Total 11.6 2.4 14.0 4,649
Table 4.11 Teenage pregnancy and motherhood

95
Percent distribution of currently married women aged 15-49 by desire for children, according to number of living children, SHDS 2020
Desire for children
Number of living children1
Total 15-490 1 2 3 4 5 6+
Have another soon2
76.6 79.4 74.2 71.2 69.8 67.8 58.8 68.7
Have another later3
0.6 3.5 3.2 2.6 2.9 2.8 3.2 2.8
Undecided 15.2 10.1 12.1 13.3 15.3 13.8 15.2 13.9
Want no more
0.0 5.2 7.8 11.3 10.8 13.7 20.0 12.0
Declared infecund
7.7 1.7 2.7 1.5 1.3 1.9 2.7 2.6
Total 100.0 100.0 100.0 100.0 100.0 100.0 100.0 100.0
Number of respondents
865 1,025 1,292 1,557 1,354 1,224 2,916 10,234
1 The number of living children includes current pregnancy for women2 Wants next birth within 2 years3 Wants to delay next birth for 2 or more years
Percentage of currently married women aged 15-49 who want no more children, by number of living children, according to background characteristics, SHDS 2020
Background characteristics
Number of living children1
Total0 1 2 3 4 5 6+
Type of residence
Urban 0.0 6.0 6.1 10.9 10.1 13.7 18.9 11.7
Rural 0.0 5.5 8.2 12.3 11.1 13.4 23.4 13.7
Nomadic 0.0 4.4 9.0 10.9 11.1 13.9 17.8 10.9
Education
No education 0.0 5.4 8.8 12.2 11.8 14.6 20.5 12.9
Primary 0.0 5.1 2.4 5.0 6.4 7.3 15.9 7.3
Secondary 0.0 5.2 2.5 7.6 1.8 9.4 23.6 7.1
Higher 0.0 1.8 18.1 12.0 0.0 0.0 0.0 5.9
Wealth quintile
Lowest 0.0 3.5 8.2 9.1 10.7 10.6 17.8 10.1
Second 0.0 5.0 6.0 12.8 9.4 13.6 20.3 12.0
Middle 0.0 1.7 8.4 12.1 11.9 17.4 20.6 13.4
Fourth 0.0 12.4 7.4 11.0 11.4 14.5 21.7 13.6
Highest 0.0 4.4 9.1 12.9 10.5 13.0 19.7 11.5
Total 0.0 5.2 7.8 11.3 10.8 13.7 20.0 12.0
Note: 1 The number of living children includes the current pregnancy
Table 4.12 Fertility preferences by number of living children
Table 4.13 Desire to limit childbearing—Women

The Somali Health and Demographic Survey96
Table 4.14 Ideal number of children
Percent distribution of women aged 15-49 by ideal number of children, and mean ideal number of children for all respondents and for currently married respondents, according to the number of living children, SHDS 2020
Number of living children1
Total0 1 2 3 4 5 6+
Ideal number of children
1 0.9 1.1 0.0 0.2 0.1 0.2 0.1 0.3
2 1.1 0.9 1.1 0.8 0.4 0.9 0.4 0.7
3 0.9 0.8 0.9 2.0 0.8 0.6 0.9 1.0
4 1.9 2.2 2.6 2.0 2.4 0.5 1.0 1.7
5 7.8 7.4 8.9 6.0 2.9 3.9 1.6 4.9
6+ 87.3 87.6 86.6 89.0 93.5 93.9 96.0 91.4
Total 100.0 100.0 100.0 100.0 100.0 100.0 100.0 100.0
Number of women
808 1,015 1,256 1,426 1,261 1,097 2,452 9,314
Mean ideal number of children for:2
All ever-married women
10.0 9.6 10.0 10.0 10.9 10.8 12.1 10.7
Number of women
808 1,015 1,256 1,426 1,261 1,097 2,452 9,314
Mean ideal number of children for currently married women
Currently married women
10.2 9.7 10.0 10.1 10.9 10.8 12.1 10.8
Number of currently married women
653 840 1,074 1,275 1,095 1,001 2,241 8,179
1 The number of living children includes current pregnancy for women.2 Means are calculated excluding respondents who gave non-numeric responses.

97
Percent distribution of births to women aged 15-49 in the five years preceding the survey (including current pregnancies), by planning status of the birth, according to birth order and mother’s age at birth, SHDS 2020
Birth order and mother’s age at birth
Planning status of birth
Total Number of birthsWanted then Wanted later Wanted no more
Birth Order
1 71.5 20.5 8.1 100.0 7,727
2 67.5 23.4 9.0 100.0 5,952
3 64.2 27.2 8.7 100.0 3,109
4+ 59.1 31.0 9.9 100.0 1,091
Mother’s age at birth
<20 65.9 26.5 7.6 100.0 2,729
20-24 70.2 23.2 6.6 100.0 5,340
25-29 68.4 23.5 8.1 100.0 4,709
30-34 67.9 22.3 9.9 100.0 3,074
35-39 65.8 20.9 13.3 100.0 1,651
40-44 66.3 15.7 18.0 100.0 341
45-49 (53.6) (25.0) (21.4) 100.0 28
Total 15-49 68.1 23.3 8.6 100.0 17,878
Note: Figures in parentheses are based on 25-49 unweighted cases.
Table 4.15 Fertility planning status

The Somali Health and Demographic Survey98
Percentage of ever-married women, currently married women aged 15-49 who have heard of any contraceptive method, by specific method, SHDS 2020
Method All ever-married women Currently married women
Any method 62.6 63.0
Any modern method 62.0 62.3
IUDs 15.8 15.2
Injectables 31.3 31.1
Implants 25.4 25.0
Pills 35.0 34.7
Male condoms 17.3 16.9
Female condoms 10.3 10.1
Emergency contraception 11.5 11.2
Standard days method 12.1 11.9
Lactational Amenorrhea (LAM) 53.5 53.7
Other modern methods 1.0 0.9
Any traditional method 17.4 17.3
Rhythm 11.0 10.8
Withdrawal 14.1 13.9
Traditional methods 1.2 1.2
Mean number of methods known by women 15-49
2.4 2.4
Number of respondents 11,660 10,215
Table 4.16 Knowledge of contraceptive methods

99
Percentage of currently married women aged 15-49 who have heard of at least one contraceptive method and who have heard of at least one modern method, by background characteristics, SHDS 2020
Background characteristics Heard of any method Heard of any modern method Number of women
Age
15-19 49.9 49.5 844
20-24 62.4 61.8 1,857
25-29 64.1 63.3 2,477
30-34 64.3 63.8 1,866
35-39 65.2 64.6 1,705
40-44 63.3 62.6 984
45-49 68.3 67.9 483
Type of residence
Urban 73.0 72.5 3,490
Rural 65.1 64.6 3,004
Nomadic 51.9 50.9 3,721
Education
No education 59.4 58.8 8,593
Primary 79.7 79.2 1,176
Secondary 84.9 84.2 306
Higher 89.7 89.7 140
Wealth quintile
Lowest 55.4 54.5 2,579
Second 53.2 52.4 2,049
Middle 63.4 62.9 1,819
Fourth 69.3 68.9 1,969
Highest 77.6 77.0 1,798
Total 15-49 63.0 62.3 10,215
Table 4.17 Knowledge of contraceptive methods by background characteristics

The Somali Health and Demographic Survey100
Perc
ent d
istr
ibut
ion
of c
urre
ntly
mar
ried
wom
en a
ged
15-4
9 by
con
trac
epti
ve m
etho
d cu
rren
tly
used
, acc
ordi
ng to
age
, SH
DS
2020
Age
Any
met
hod
Any
mod
ern
met
hod
Mod
ern
met
hod
Any
tr
adit
iona
l m
etho
d
Trad
itio
nal m
etho
d
Not
cur
rent
ly
usin
gTo
tal
Num
ber
of w
omen
cu
rren
tly
mar
ried
IUD
Inje
ctab
les
Impl
ants
Pills
cond
om
Lact
atio
nal
Am
enor
rhea
(L
AM
)Rh
ythm
Wit
hdra
wal
15-1
910
.70
.50
.10
.20
.10
.00
.00
.010
.210
.20
.08
9.3
100
.066
5
20-2
49.
31.
20
.00
.10
.40
.60
.00
.28
.18
.10
.090
.710
0.0
1,4
32
25-2
99.
70
.90
.00
.20
.30
.40
.00
.18
.78
.70
.090
.310
0.0
1,91
7
30-3
47.
11.
40
.20
.00
.30
.60
.10
.15.
65.
60
.092
.910
0.0
1,53
2
35-3
94
.40
.50
.00
.00
.00
.30
.00
.23.
93.
90
.095
.610
0.0
1,51
1
40
-44
1.9
0.8
0.0
0.0
0.3
0.1
0.0
0.4
1.1
1.1
0.0
98.1
100
.092
6
45-
490
.00
.00
.00
.00
.00
.00
.00
.00
.00
.00
.010
0.0
100
.04
76
Tota
l6.
90
.90
.05
0.1
0.2
0.4
0.0
30
.16.
06.
00
.093
.110
0.0
8,4
59
Not
e: If
mor
e th
an o
ne m
etho
d is
use
d, o
nly
the
mos
t eff
ecti
ve m
etho
d is
con
side
red
in th
is ta
bula
tion
n/a
= N
ot a
pplic
able
LAM
= L
acta
tion
al a
men
orrh
oea
met
hod
Tab
le 4
.18
Cur
rent
use
of c
ontr
acep
tion
by
age

101
Percentage of ever-married women aged 15-49 with correct knowledge of the fertile period during the ovulatory cycle, according to age, SHDS 2020
AgePercentage with correct
knowledge of the fertile period Number of ever-married women
15-19 8.0 973
20-24 10.3 2,119
25-29 11.0 2,728
30-34 10.3 2,119
35-39 10.1 1,922
40-44 10.6 1,158
45-49 11.3 641
Total 10.3 11,660
Note: Correct knowledge of the fertile period is defined as halfway between two menstrual periods.
Table 4.19 Knowledge of fertile period by age
Table 4.20 Need and demand for birth spacing among currently married women
Percentage of currently married women aged 15-49 with unmet need for birth spacing, percentage with met need for birth spacing, the total demand for birth spacing, and the percentage of the demand for contraception that is satisfied, by background characteristics, SHDS 2020
Background characteristics
Unmet need for birth spacing
Total
Met need for birth spacing (currently
using)
Total
Total demand for birth spacing1
Total
Percentage of demand satisfied2
Percentage of demand satisfied
by modern method3
Number of
womenFor
spacingFor
limitingFor
spacingFor
limitingFor
spacingFor
limiting
Age
15-19 28.1 3.0 31.1 0.5 0.1 0.6 28.6 3.2 31.7 1.9 1.2 844
20-24 31.9 4.0 35.9 1.4 0.1 1.4 33.3 4.1 37.4 3.9 2.6 1,857
25-29 32.7 4.9 37.6 0.9 0.2 1.1 33.6 5.2 38.8 3.0 2.2 2,477
30-34 31.6 7.3 38.9 1.3 0.2 1.5 32.9 7.5 40.4 3.7 2.9 1,866
35-39 26.3 10.2 36.4 0.5 0.3 0.7 26.7 10.4 37.2 2.0 1.3 1,705
40-44 22.5 16.0 38.4 0.9 0.4 1.3 23.3 16.4 39.7 3.2 1.9 984
45-49 14.6 17.1 31.7 0.1 0.1 14.7 17.1 31.8 0.2 0.0 483
Type of Residence
Urban 28.5 7.3 35.8 2.0 0.4 2.4 30.5 7.7 38.2 6.2 4.7 3,490
Rural 28.5 8.8 37.3 0.8 0.1 0.9 29.3 8.9 38.2 2.4 1.1 3,004
Nomadic 30.1 6.8 36.8 0.0 0.1 0.1 30.1 6.9 37.0 0.3 0.3 3,721
Education
No Education 28.7 8.2 36.9 0.5 0.2 0.7 29.2 8.4 37.6 1.8 1.1 8,595
Primary 33.5 3.8 37.3 2.0 0.3 2.3 35.5 4.2 39.6 5.9 5.0 1,176
Secondary 24.4 4.5 28.9 5.6 5.6 30.0 4.5 34.6 16.3 14.3 306
Higher 24.8 5.3 30.1 7.0 7.0 31.9 5.3 37.1 18.9 11.4 138
Wealth quintile
Lowest 28.8 6.4 35.2 0.1 0.1 0.1 28.9 6.4 35.3 0.4 0.2 2,579
Second 29.8 7.1 37.0 0.2 0.1 0.3 30.0 7.2 37.2 0.7 0.5 2,049
Middle 30.6 8.5 39.1 0.6 0.3 0.9 31.2 8.8 40.0 2.2 1.9 1,819
Fourth 29.3 8.6 37.9 1.1 0.3 1.4 30.4 8.9 39.3 3.5 2.5 1,969
Highest 26.8 7.6 34.4 3.1 0.4 3.4 29.8 8.0 37.8 9.1 6.0 1,798
Total 29.1 7.5 36.6 0.9 0.2 1.1 30.0 7.8 37.7 3.0 2.1 10,215
Note: Numbers in this table correspond to the revised definition of unmet need described in Bradley et al., 2012.
1 Total demand is the sum of unmet need and met need.
2 Percentage of demand satisfied is met need divided by total demand.
3 Modern methods include pill, IUD, injectables, implants, male condom, female condom, and lactational amenorrhea method (LAM).

The Somali Health and Demographic Survey102
Table 4.21 Exposure to birth spacing messages
Percentage of ever-married women aged 15-49 who heard or saw a birth spacing message on radio, on television, in a newspaper or magazine, or on a mobile phone in the past few months, according to background characteristics, SHDS 2020
Background characteristics
Radio Television Newspaper None of these three media sources
Number of women
Type of residence
Urban 21.6 19.4 7.7 69.4 4,161
Rural 14.1 7.8 3.8 82.8 3,509
Nomadic 4.2 0.5 0.4 95.5 3,989
Education
No education 10.7 6.1 2.4 86.2 9,757
Primary 24.4 21.1 8.5 67.4 1,367
Secondary 31.4 36.3 17.5 55.1 375
Higher 41.9 52.2 32.6 38.0 161
Wealth quintile
Lowest 4.3 0.8 0.5 95.2 2,733
Second 6.8 1.7 0.9 92.7 2,310
Middle 14.8 5.7 4.0 82.8 2,159
Fourth 17.9 12.1 5.3 77.2 2,356
Highest 26.1 30.1 10.4 59.7 2,101
Total 15-49 13.4 9.5 4.0 82.4 11,660

103

Archillorem quissecusam ent velluptiam dolorporion providem id mo consequ atatiis eaque net qui qui que sunto is iducium quas assimincias velecto tat
05Maternal and Newborn Health

©U
NFP
A S
OM
ALI
A/T
ob
in J
on
es

KEY FINDINGS
ANTENATAL CARE COVERAGE
31%of women aged 15-49 who had a live birth in the 5 years before the survey received antenatal care from skilled health personnel during the pregnancy of their last birth
DELIVERY SERVICES
32%of births were delivered with the assistance of a skilled health care provider
COMPONENTS OFANTENATAL CARE
89%of women who received antenatal care had their blood pressure measured
24%of women had at least four ANC visits
21%of births were delivered at a health facility
68%of women had a blood sample taken
64%of women had a urine sample taken
HINDRANCES WOMENAGED 15-49 FACE INACCESSING HEALTH CAREDURING PREGNANCY ANDCHILD DELIVERY
65%lack of money
62%distance to a health facility
42%obtaining permission to access services
POSTNATAL CHECKS
11%of mothers and
10%of births had a postnatal check within the first 2 days after delivery
The Somali Health and Demographic Survey108
This chapter presents crucial
findings on maternal health,
including information on the
provision of antenatal care (ANC),
delivery, and postnatal care
(PNC). These services support
key strategic and health policy
objectives in Somalia, particularly
the reduction of maternal
morbidity and mortality.
The survey results provide an opportunity to identify critical issues affecting the health status of women and children in Somalia. This information will assist policymakers, planners and other collaborators in the health sector to formulate appropriate strategies and interventions to improve maternal, newborn and child health services across Somalia.
Antenatal Care
The health care that a mother receives during pregnancy and at the time of delivery, known as antenatal care, is important for the survival and well-being of both the mother and newborn
child. The ANC from a nurse or trained personnel is vital for monitoring a pregnancy and reducing the risks related to morbidity and mortality for the mother and child during pregnancy and delivery.
A well-designed and well-implemented ANC programme facilitates the timely detection and treatment of problems during pregnancy. In developing countries in particular, the prevention and treatment of malaria in pregnant women, management of anaemia during pregnancy, and treatment of sexually transmitted infections (STIs) can significantly improve foetal outcomes and improve maternal health. During the antenatal period, interventions such as the administering of tetanus immunization can be life-saving for both the mother and child.
During the SHDS 2020, women who had given birth in the five years preceding the survey were asked about the type of ANC provider they had used; the number of ANC visits they had made; the stage of pregnancy they were in at the time of their first visit; and services and information provided during ANC. For women with two or more live births during the five-year period, data on ANC refers to the most recent birth only.
5 M AT E R N A L A N D N E W B O R N H E A LT H

109
Doctor/Clinical Officer
12.4
Nurse/AuxilliaryMidwife/Midwife
18.7
TBA/other/relative
1.2
No ANC
67.7
1 Visit
18.9
2-3 Visits
55.8
4+ Visits
24.4
Don't know/missing
1.0
Antenatal Care Coverage
Table 5.1 and Figure 5.1 show the percent distribution of women who had a birth five years preceding the survey, by ANC provider during pregnancy. Sixty-eight percent of women did not make ANC visits during their most recent pregnancy in the five years prior to the survey. Among those who made ANC visits, 31 percent received ANC from trained personnel (doctors/clinical officers or nurses/midwives/auxiliary midwives) at least once. Twelve percent of women received ANC from a doctor/clinical officer, while 19 percent received care from a midwife, nurse or auxiliary midwife.
About half of the women living in urban areas (49 percent) had received ANC from skilled personnel, whereas in rural areas and within nomadic settlements, 35 percent and 9 percent of women, respectively, received ANC from a skilled provider.
Education levels and the wealth status of women were strongly associated with their use of ANC from a skilled health care provider. Seventy-seven percent of women with higher education received antenatal care from a skilled provider, compared to 26 percent of women with no education.
Generally, younger mothers of 20-34 years received more ANC from skilled medical personnel than older women aged 35-49 years (at 33 percent and 25 percent respectively).
Number and Timing of Antenatal VisitsANC is more beneficial in preventing adverse outcomes of pregnancy when it is sought early and is continued throughout pregnancy. Health professionals recommend that the first antenatal visit should occur within the first three months of the pregnancy and that visits should continue on a monthly basis through
week 28 of pregnancy, and then every two weeks up to week 36 (or until birth). If the first antenatal visit is made during the third month of pregnancy and then visits occur as regularly as recommended, a total of at least 12 to 13 antenatal visits should have taken place. Table 5.2 and Figure 5.2 show that among women who had a live birth in the five years preceding
Percent distribution of mothers who had children in the five years before the survey, by source of antenatal care received during pregnancy
Percent distribution of women aged 15-49 who had a live birth in the five years preceding the survey, and attended antenatal care (ANC) by number of ANC visits for the most recent live birth
Figure 5.1 Source of antenatal care
Figure 5.2 ANC visits made by pregnant women

The Somali Health and Demographic Survey110
the survey, 24 percent had made four or more antenatal care visits, with the majority (56 percent) making between two and three visits in their most recent pregnancy in the five years preceding the survey. Unlike the women residing in the urban and rural areas, a quarter of whom made four or more ANC visits, among the women residing in the nomadic areas, only 8 percent made four or more ANC visits. Forty-seven percent of nomadic women made only one ANC visit during their most recent pregnancy in the five years preceding the survey.
Thirty-three percent of women make their first antenatal care visit before the fourth month of pregnancy. Nomadic women have a larger percentage of women who delay ANC to the last trimester—19 percent reported they made their first ANC visit in or after the eighth month, as compared to 9 percent and 8 percent among women in urban and rural households respectively. Generally, the median length of pregnancy at the first antenatal care visit is 5 months.
Components of Antenatal Care
The content of ANC is an essential component of the quality of maternal health services being delivered. In addition to receiving basic care, every pregnant woman should be monitored for complications. Ensuring that pregnant women receive information and undergo screening for complications should be a routine part of all antenatal care visits. To assess ANC services, respondents were asked whether they had been advised of complications or received certain screening tests during at least one of the ANC visits. Table 5.3 presents information on the content of antenatal services, including the percentages of women who took iron supplements, took drugs for intestinal parasites, were informed of the signs of pregnancy complications, and received selected routine services during antenatal care visits for their most recent birth in the five years preceding the survey.
Overall, 12 percent of women took iron tablets during the pregnancy of their last birth. Variations by background characteristics
18.5
3.4
19.1
14.215.4
12.8
1.4
13.4
9.5 9.8
3.8
0.6
3.62.3 2.3
Took iron tablets orsyrup
Took intestinalparasite drugs
Blood preasuremeasured
Urine sample taken Blood sample taken
Among women with a live birth in the pastfive years, the percentage who during the
pregnancy for their last birth
Among women who received ANC for their most recent birth in thepast 5 years, the percentage with the selected services
Urban Rural Nomadic
Percent distribution of mothers who had children in the five years before the survey, by source of antenatal care received during pregnancy
Figure 5.3 Components of antenatal care

111
indicate that urban women are more likely than rural or nomadic women to take iron supplements (19 percent, 13 percent and 4 percent respectively). The proportion of women who took iron supplements increases steadily with both education and wealth quintile. Those with higher education stand at 32 percent, and 10 percent of women with no education took iron supplements. Overall, only 2 percent of women took drugs to treat intestinal worms during their last pregnancy. Nine percent of women with higher than secondary education took drugs for intestinal parasites during their pregnancy, compared with 2 percent of women with no education.
Among other antenatal care services, 89 percent of women who received antenatal care had their blood pressure measured, 64 percent had a urine sample taken, and 68 percent had a blood sample taken.
As presented in Figure 5.3, the likelihood of women receiving each of the ANC components services varies according to their place of residence. Overall, women in urban households have a better opportunity of receiving ANC components or services than those in other population domains such as rural and nomadic households.
Tetanus Toxoid
Tetanus toxoid injections are given during pregnancy to prevent neonatal tetanus, a leading cause of early infant death in many developing countries, often attributed to poor hygiene during delivery. For full protection of her newborn baby, a pregnant woman should receive at least two injections of the vaccine during pregnancy. If a woman has been vaccinated during a previous pregnancy, she may only require one or no doses for the next pregnancy. Five doses are considered to provide protection for a lifetime. Table 5.4 presents the percentage of women aged 15-49 with a live birth in the five years preceding the survey who received two or more tetanus
toxoid injections during their most recent pregnancy and the percentage whose last birth was protected against neonatal tetanus.
Results show that very few pregnant women get vaccinated against tetanus in Somalia, despite the need for vaccination. Only 17 percent of women received two or more tetanus toxoid injections during the pregnancy of their last live birth.
Twenty-seven percent of births were protected against neonatal tetanus. Births to women in urban areas are more likely to be protected against neonatal tetanus than births to women in nomadic areas (43 percent and 7 percent, respectively). The proportion of births protected against tetanus increases with a mother’s education level: 60 percent of mothers with higher education have births protected against neonatal tetanus, as compared to 23 percent of women with no education. The use of tetanus vaccinations increases as levels of wealth increase.
Assistance during Delivery To reduce maternal and neonatal morbidity and mortality, there is a need for every child to be delivered with the assistance of trained skilled birth attendants. Table 5.5 shows the percent distribution of births in the five years preceding the survey by the type of medical assistants available at the time of delivery, the percentage of births attended by a skilled health provider, and the percentage of births delivered by caesarean section (C-section), according to background characteristics.
Thirty-two percent of births in Somalia are delivered with the assistance of a skilled health professional, which includes a doctor/clinical officer or a nurse/midwife/auxiliary midwife.
According to survey findings, the percentage of women who delivered babies by C-section is 2 percent.

Thirty-two percent of births in Somalia are delivered with the assistance of a skilled health care provider

©U
NFP
A S
OM
ALI
A/T
ob
in J
on
es
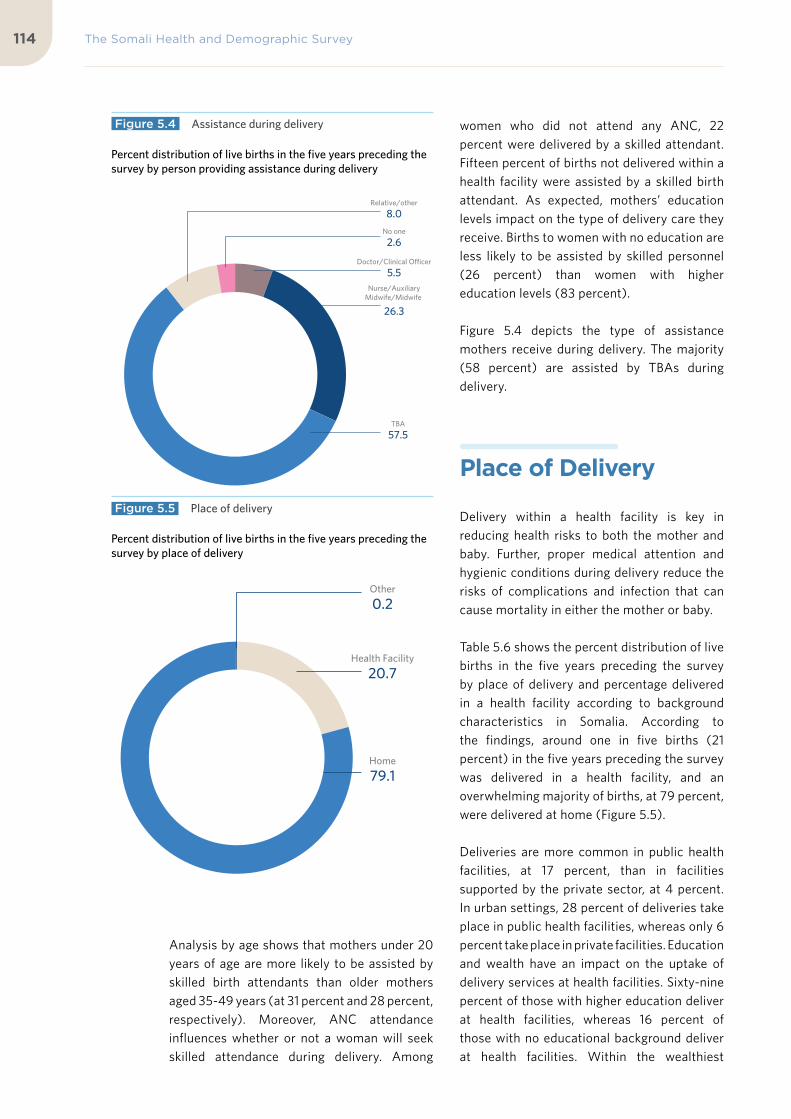
The Somali Health and Demographic Survey114
Analysis by age shows that mothers under 20 years of age are more likely to be assisted by skilled birth attendants than older mothers aged 35-49 years (at 31 percent and 28 percent, respectively). Moreover, ANC attendance influences whether or not a woman will seek skilled attendance during delivery. Among
women who did not attend any ANC, 22 percent were delivered by a skilled attendant. Fifteen percent of births not delivered within a health facility were assisted by a skilled birth attendant. As expected, mothers’ education levels impact on the type of delivery care they receive. Births to women with no education are less likely to be assisted by skilled personnel (26 percent) than women with higher education levels (83 percent).
Figure 5.4 depicts the type of assistance mothers receive during delivery. The majority (58 percent) are assisted by TBAs during delivery.
Place of Delivery
Delivery within a health facility is key in reducing health risks to both the mother and baby. Further, proper medical attention and hygienic conditions during delivery reduce the risks of complications and infection that can cause mortality in either the mother or baby.
Table 5.6 shows the percent distribution of live births in the five years preceding the survey by place of delivery and percentage delivered in a health facility according to background characteristics in Somalia. According to the findings, around one in five births (21 percent) in the five years preceding the survey was delivered in a health facility, and an overwhelming majority of births, at 79 percent, were delivered at home (Figure 5.5).
Deliveries are more common in public health facilities, at 17 percent, than in facilities supported by the private sector, at 4 percent. In urban settings, 28 percent of deliveries take place in public health facilities, whereas only 6 percent take place in private facilities. Education and wealth have an impact on the uptake of delivery services at health facilities. Sixty-nine percent of those with higher education deliver at health facilities, whereas 16 percent of those with no educational background deliver at health facilities. Within the wealthiest
Doctor/Clinical Officer
5.5Nurse/Auxiliary
Midwife/Midwife
26.3
TBA
57.5
Relative/other
8.0
No one
2.6
Health Facility
20.7
Home
79.1
Other
0.2
Percent distribution of live births in the five years preceding the survey by person providing assistance during delivery
Percent distribution of live births in the five years preceding the survey by place of delivery
Figure 5.4 Assistance during delivery
Figure 5.5 Place of delivery

115
households, 48 percent of women deliver at facilities, versus only 5 percent of women from the poorest households.
Postnatal Care and Practices A large number of maternal and neonatal deaths occur during the first 48 hours after delivery in general. To address this, safe motherhood programmes have increased their emphasis on the importance of postnatal care, encouraging that all women receive a health check-up within two days of delivery. To assess the extent of use of postnatal care in Somalia, respondents who had given birth in the five years preceding the survey were asked whether they had received a health check after the delivery of their last birth. Table 5.7 and Figure 5.6 show the timing of the first postnatal check-up for women giving birth in the two years preceding the survey. The table shows that only 9 percent of mothers had a postnatal check during the first four hours after delivery. Eighty-nine percent of the mothers did not
receive any postnatal check-up.
Of those who received care, 11 percent received it within the crucial first two days of delivery. Urban women were more likely to receive postnatal care (19 percent) within the first two days than those in nomadic settings (3 percent). Additionally, women with higher levels of education were more likely to receive postnatal care within two days of delivery (49 percent) than women with either no schooling or education (7 percent).
Table 5.8 shows the timing of the first postnatal check-up for newborns born in the two years preceding the survey. About 90 percent of newborns received no postnatal care. More women in urban areas received postnatal care in the first two days after delivery (17 percent) compared to women in nomadic settlements (2 percent).
Choices made according to education levels show that women who have higher education are more likely to receive postnatal care within two days of delivery (49 percent) than women with no schooling (7 percent).
16.7
1.2 0.6 0.0 0.4 0.5
80.5
8.81.1 0.9 0.1 0.0 0.4
88.6
2.0 0.0 0.6 0.0 0.0 0.1
97.2
Less than 4 hours 4-23 hours 1-2 days 3-6 days 7-41 days Don't know No postnatalcheckup
Urban Rural Nomadic
Percent distribution of last births in the two years preceding the survey by time of first postnatal check-up after birth, by place of residence
Figure 5.6 Timing of first postnatal check-up for the mothers

The Somali Health and Demographic Survey116
Across the country, there are no marked variations in uptake of postnatal care within the first two days of birth, by mother’s age and birth order.
Problems in Accessing Health Care The SHDS 2020 included a series of questions designed to collect information on the problems women face in obtaining health care for themselves. This information is particularly important in understanding and addressing the hindrances women may face in seeking care during pregnancy and, particularly, during child delivery. To collect this information,
women aged 15-49 were asked whether each of the following factors would be a major problem or not for them in obtaining health services: getting permission to go facilities, getting money for treatment, the distance to the health facility, and not wanting to go alone to seek health care. Table 5.9 shows the percentages of respondents who consider the individual factors to be a big problem, and the percentages reporting at least one of the specified factors to be a big challenge, according to background characteristics.
Seventy-three percent of women reported they face at least one problem accessing health care. The majority perceived lack of money (65 percent) as a hindrance, 62 percent cited the distance to a health facility as a challenge, while 47 percent mentioned not wanting to
69.7
72.9
72.5
72.2
73.5
72.5
73.1
68.3
65.8
72.2
80.2
74.4
67.3
61.6
33.0
84.8
78.2
72.6
67.8
56.6
15-19
20-34
35-49
1-2
3-4
5+
Married
Divorced/ widowed
Urban
Rural
Nomadic
No Education
Primary
Secondary
Higher
Lowest
Second
Middle
Fourth
Highest
Age
Num
ber
ofliv
ing
child
ren
Mar
ital
stat
usT
ype
ofre
side
nce
Educ
atio
nW
ealt
h qu
inti
le
Percent of women aged 15-49 who reported that they have problems accessing health care for themselves while sick by background characteristics
Figure 5.7 Problems in accessing health care

117
go alone to seek health care as a deterrent. Forty-two percent of all women cited obtaining permission, usually required from the husband, as a major problem.
Figure 5.7 shows that nomadic women, married women, older women, women with large families, women not working for cash, women with no education and those in the lower wealth quintiles face acute problems in accessing health care.
List of Tables
Table 5.1 Antenatal care 118
Table 5.2 Number of antenatal care visits and timing of first visit 119
Table 5.3 Components of antenatal care 120
Table 5.4 Tetanus toxoid injections 121
Table 5.5 Assistance during delivery 122
Table 5.6 Place of delivery 123
Table 5.7 Timing of first postnatal check-up for the mother 124
Table 5.8 Timing of first postnatal checkup for the newborn 125
Table 5.9 Problems in accessing health care 126

The Somali Health and Demographic Survey118
Percent distribution of ever-married women aged 15-49 who had a live birth in the 5 years preceding the survey by antenatal care (ANC) provider, SHDS 2020
Background characteristics
Person providing assistance during ANC
Total
Skilled assistance
during ANC2
Number of women
Doctor/Clinical Officer
Nurse/Auxiliary Midwife/Midwife
TBA1/Other/Relative No ANC
Mother’s age at birth
<20 12.5 17.1 1.3 69.1 100.0 29.6 1,897
20-34 12.8 19.9 1.3 66.1 100.0 32.6 5,945
35-49 9.7 15.3 0.7 74.3 100.0 25.0 1,014
Birth order
1 12.0 18.1 1.1 68.8 100.0 30.0 8,412
2-3 19.9 32.6 2.9 44.5 100.0 52.6 391
4-5 (21.3) (14.6) (5.6) (58.4) 100.0 (36.0) 89
6+ (0.0) (40.0) (8.0) (52.0) 100.0 (40.0) 25
Type of residence
Urban 19.8 29.2 1.7 49.2 100.0 49.1 3,155
Rural 13.0 21.9 1.2 63.9 100.0 34.9 2,637
Nomadic 4.1 5.3 0.8 89.9 100.0 9.3 3,064
Education
No education 9.8 16.0 1.1 73.1 100.0 25.8 7,397
Primary 21.4 33.3 2.1 43.2 100.0 54.7 1,068
Secondary 34.8 29.0 1.3 35.0 100.0 63.7 280
Higher 40.9 35.8 0.3 23.0 100.0 76.7 111
Wealth quintile
Lowest 3.7 8.4 0.5 87.3 100.0 12.1 2,058
Second 5.8 11.3 1.2 81.7 100.0 17.1 1,823
Middle 12.2 21.1 1.5 65.2 100.0 33.3 1,682
Fourth 18.1 26.0 1.5 54.4 100.0 44.1 1,807
Highest 25.5 30.7 1.6 42.2 100.0 56.2 1,486
Total 12.4 18.7 1.2 67.7 100.0 31.1 8,856
Note: If more than one source of ANC was mentioned, only the provider with the highest qualifications is considered in this tabulation.1 TBA: Traditional Birth Attendants 2 Skilled provider includes doctor/clinical officer or nurse/midwife/auxiliary midwife
Note: Figures in parentheses are based on 25-49 unweighted cases.
Table 5.1 Antenatal care

119
Percent distribution of women aged 15-49 who had a live birth in the five years preceding the survey by number of antenatal care (ANC) visits for the most recent live birth, and by the timing of the first visit, and among women with ANC, median months pregnant at first visit, according to residence, SHDS 2020
Number and timing of ANC visits
Type of residence
TotalUrban Rural Nomadic
Number of ANC visits
1 13.8 18.1 46.5 18.9
2-3 58.2 55.6 43.6 55.8
4+ 26.9 25.5 7.9 24.4
Don’t know/missing 1.2 0.9 2.0 1.0
Total 100.0 100.0 100.0 100.0
Number of months pregnant at time of first ANC visit
<4 33.7 33.0 27.0 32.7
4-5 35.0 32.2 24.0 33.0
6-7 21.7 25.6 28.0 23.7
8+ 9.1 8.3 19.0 9.9
Don’t know/missing 0.6 0.9 2.0 0.6
Total 100.0 100.0 100.0 100.0
Number of women 2,834 2,531 3,060 8,424
Median months pregnant at first visit (for those with ANC)
5.0 5.0 5.0 5.0
Number of women with ANC
1,440 885 306 2,632
Table 5.2 Number of antenatal care visits and timing of first visit

The Somali Health and Demographic Survey120
Among women aged 15-49 with a live birth in the five years preceding the survey, the percentage who took iron tablets or syrup and drugs for intestinal parasites during the pregnancy of the most recent birth, and among women receiving antenatal care (ANC) for the most recent live birth in the five years preceding the survey, the percentage receiving specific antenatal services, according to background characteristics, SHDS 2020
Background characteristics
Among women with a live birth in the past five years, the
percentage who during the pregnancy for their last birth:
Number of women with a
live birth in the past five years
Among women who received ANC for their most recent birth in the past 5
years, the percentage with the selected services: Number of
women with ANC for their most
recent birth
Took iron tablets or
syrupTook intestinal parasite drugs
Blood pressure
measured
Urine sample taken
Blood sample taken
Mother’s age at birth
<20 17.5 2.4 2,634 89.8 63.7 67.9 573
20-34 12.8 2.0 11,555 89.1 64.7 68.6 1,978
35-49 4.8 0.8 1,744 86.5 60.0 61.1 254
Birth order
1 26.3 4.1 8,181 89.4 63.7 67.7 2,555
2-3 2.1 0.3 7,378 85.1 69.3 69.4 227
4-5 * * * * * * 37
6+ * * * * * * 12
Type of residence
Urban 18.5 3.4 5,635 90.8 67.7 73.2 1,545
Rural 12.8 1.4 4,817 88.7 62.8 64.6 951
Nomadic 3.8 0.6 5,480 80.9 50.4 50.7 308
Education
No education 10.1 1.6 13,267 87.0 59.0 63.8 1,952
Primary 18.9 2.2 2,034 93.3 73.5 73.7 596
Secondary 27.4 4.1 454 96.5 77.4 81.0 174
Higher 32.3 8.9 178 90.5 90.1 92.4 83
Wealth quintile
Lowest 4.4 0.4 3,626 80.8 48.3 47.1 268
Second 7.0 1.3 3,322 87.4 51.9 50.6 332
Middle 13.6 2.3 3,155 87.4 63.5 68.7 574
Fourth 16.4 2.9 3,344 91.3 64.3 69.8 802
Highest 20.4 2.6 2,486 91.3 74.3 78.8 829
Total 15-49 11.9 1.8 15,928 89.0 64.1 67.8 2,805
Note: An asterisk indicates that a figure is based on fewer than 25 unweighted cases and has been suppressed.
Table 5.3 Components of antenatal care

121
Among mothers aged 15-49 with a live birth in the five years preceding the survey, the percentage receiving two or more tetanus toxoid injections (TTI) during the pregnancy for the last live birth and the percentage whose last live birth was protected against neonatal tetanus, according to background characteristics, SHDS 2020
Background characteristics Percentage receiving two or more injections during last
pregnancy
Percentage whose last live birth was protected against
neonatal tetanus1
Number of mothers
Mother’s age at birth
<20 17.6 27.2 1,899
20-34 17.9 28.3 5,955
35-49 12.4 21.1 1,015
Birth order
1 17.4 27.8 2,454
2-3 17.1 26.9 5,497
4-5 17.2 27.3 877
6+ (15.2) (32.6) 46
Type of residence
Urban 28.5 43.2 3,162
Rural 19.4 31.5 2,642
Nomadic 3.6 7.1 3,065
Education
No education 14.2 22.8 7,408
Primary 31.1 48.3 1,069
Secondary 35.1 50.5 280
Higher 39.5 60.2 111
Wealth quintile
Lowest 5.1 9.5 2,058
Second 9.2 16.3 1,824
Middle 23.1 34.7 1,686
Fourth 25.0 38.0 1,813
Highest 27.5 43.6 1,487
Total 17.2 27.2 8,8691 Includes mothers with two injections during the pregnancy of her last birth, or two or more injections (the last within 3 years of the last live birth), or three or more injections (the last within 5 years of the last birth), or four or more injections (the last within 10 years of the last live birth), or five or more injections at any time prior to the last birth
Note: Figures in parentheses are based on 25-49 unweighted cases.
Table 5.4 Tetanus toxoid injections

The Somali Health and Demographic Survey122
Percent distribution of live births in the five years preceding the survey by person providing assistance during delivery, percentage of births assisted by a skilled provider, and the percentage delivered by caesarian-section, according to background characteristics, SHDS 2020
Background characteristics
Person providing assistance during delivery
Total
Percentage delivered by skilled provider1
Percentage delivered by
C-sectionNumber of
births
Doctor/Clinical Officer
Nurse/Auxiliary Midwife/Midwife
Traditional birth
attendant Relative/other No one
Mother’s age at birth
<20 5.6 24.9 58.3 8.1 3.2 100.0 30.5 1.6 2,775
20-34 5.6 27.3 57.1 7.8 2.3 100.0 32.9 1.8 13,430
35-49 4.9 22.7 59.1 9.3 3.9 100.0 27.6 1.0 2,273
Birth order
1 6.2 25.8 57.2 8.4 2.4 100.0 32.0 2.2 8,039
2-3 5.2 26.6 57.3 8.0 2.8 100.0 31.9 1.3 9,297
4-5 3.6 27.8 61.1 4.9 2.6 100.0 31.4 0.9 1,072
6+ 4.2 24.8 70.4 0.0 0.5 100.0 29.0 1.5 70
Antenatal care visits2
None 4.3 18.0 64.8 9.8 3.1 100.0 22.3 1.4 5,995
1-3 10.3 47.8 36.3 4.5 1.1 100.0 58.1 4.2 2,114
4+ 13.7 61.4 23.1 1.6 0.2 100.0 75.1 5.0 729
Don’t know/missing
(17.9) (28.6) (39.3) (14.3) 0.0 100.0 (46.4) (3.6) 28
Place of delivery
Health facility 20.6 76.0 2.9 0.1 0.3 100.0 96.6 8.0 3,830
Elsewhere 1.6 13.4 71.8 10.0 3.2 100.0 15.0 0.0 14,648
Type of residence
Urban 9.7 41.3 45.9 2.3 0.8 100.0 51.0 2.9 6,523
Rural 6.0 30.9 55.7 5.0 2.4 100.0 36.9 1.7 5,501
Nomadic 0.9 7.4 70.7 16.3 4.7 100.0 8.3 0.4 6,454
Education
No education 4.4 22.0 61.4 9.1 3.1 100.0 26.4 1.1 15,490
Primary 9.7 46.3 41.2 2.6 0.3 100.0 55.9 3.3 2,288
Secondary 15.6 56.2 28.1 0.1 0.1 100.0 71.7 7.2 498
Higher 19.7 63.3 16.3 0.7 0.0 100.0 83.0 8.9 202
Wealth quintile
Lowest 1.0 8.7 67.6 19.7 3.0 100.0 9.7 0.4 4,286
Second 1.3 10.9 73.5 9.6 4.6 100.0 12.3 0.4 3,886
Middle 6.0 28.1 59.7 3.6 2.7 100.0 34.0 1.2 3,613
Fourth 8.0 42.4 46.6 2.2 0.8 100.0 50.4 2.6 3,820
Highest 14.2 49.9 32.6 1.5 1.8 100.0 64.1 4.6 2,873
Total 5.5 26.3 57.5 8.0 2.6 100.0 31.9 1.7 18,478
Note: If the respondent mentioned more than one person attending during delivery, only the most qualified person is considered in this tabulation. Figures in parentheses are based on 25-49 unweighted cases
1 Skilled provider includes doctor/clinical officer or nurse/midwife/auxiliary midwife
2 Includes only the most recent birth in the five years preceding the survey
Table 5.5 Assistance during delivery

123
Percent distribution of live births in the five years preceding the survey by place of delivery and percentage delivered in a health facility, according to background characteristics, SHDS 2020
Background characteristics
Health facility
Public sector Private sector Home Other Total
Percentage delivered in a health facility
Number of births
Mother’s age at birth
<20 18.4 3.4 78.0 0.2 100.0 21.8 2,775
20-34 17.4 3.8 78.7 0.2 100.0 21.2 13,430
35-49 13.6 3.2 82.8 0.3 100.0 16.8 2,273
Birth order
1 17.1 3.7 79.0 0.2 100.0 20.8 8,039
2-3 17.0 3.7 79.1 0.2 100.0 20.7 9,297
4-5 16.6 3.6 79.5 0.2 100.0 20.2 1,072
6+ 20.4 3.3 76.3 0.0 100.0 23.7 70
Antenatal care visits1
None 9.7 2.2 87.8 0.2 100.0 11.9 5,995
1-3 36.1 7.9 55.9 0.1 100.0 44.0 2,114
4+ 49.9 15.9 34.1 0.0 100.0 65.8 729
Don’t know/missing
(28.6) (3.6) (64.3) (3.6) 100.0 (32.1) 28
Type of residence
Urban 27.7 6.0 66.2 0.1 100.0 33.7 6,523
Rural 20.4 4.2 75.0 0.4 100.0 24.7 5,501
Nomadic 3.4 0.9 95.6 0.1 100.0 4.3 6,454
Education
No education 13.4 2.7 83.7 0.2 100.0 16.1 15,490
Primary 34.0 6.7 58.9 0.3 100.0 40.7 2,288
Secondary 39.8 14.1 46.1 0.0 100.0 53.9 498
Higher 50.1 18.5 31.4 0.0 100.0 68.6 202
Wealth quintile
Lowest 4.0 0.9 94.9 0.1 100.0 5.0 4,286
Second 7.2 0.7 92.0 0.1 100.0 7.9 3,886
Middle 17.1 4.2 78.5 0.2 100.0 21.2 3,613
Fourth 26.3 4.4 69.1 0.2 100.0 30.7 3,820
Highest 37.6 10.1 51.9 0.4 100.0 47.7 2,873
Total 17.1 3.7 79.1 0.2 100.0 20.7 18,4781 Includes only the most recent birth in the five years preceding the survey.
Note: Figures in parentheses are based on 25-49 unweighted cases.
Table 5.6 Place of delivery

The Somali Health and Demographic Survey124
Among women aged 15-49 giving birth in the two years preceding the survey, the percent distribution of the mother’s first postnatal check-up for the last live birth by time after delivery, and the percentage of woman with a live birth in the two years preceding the survey who received a postnatal checkup in the first two days after giving birth, according to background characteristics, SHDS 2020
Background characteristics
Time after delivery of mother’s first postnatal check-up
Total
Percentage of women with a postnatal
check-up in the first two days
after birthNumber
of womenLess than 4 hours
4-23 hours
1-2 days
3-6 days 7-41 days
Don’t know
No postnatal check-up1
Mother’s age at birth
<20 8.7 0.9 0.7 0.1 0.0 0.3 89.2 100.0 10.4 1,442
20-34 9.1 0.7 0.6 0.0 0.2 0.3 89.0 100.0 10.5 3,539
35-49 9.6 0.8 1.2 0.0 0.0 0.4 88.0 100.0 11.6 343
Birth order
1 11.9 0.6 0.9 0.0 0.7 0.4 85.5 100.0 13.4 1,152
2-3 8.2 0.8 0.7 0.0 0.0 0.3 89.9 100.0 9.7 3,456
4+ 8.4 1.0 0.5 0.2 0.0 0.2 89.7 100.0 9.9 716
Place of delivery
Health facility 36.7 3.1 2.8 0.2 0.6 1.4 55.2 100.0 42.7 1,312
Elsewhere 0.0 0.0 0.0 0.0 0.0 0.0 100.0 100.0 0.0 4,012
Type of residence
Urban 16.7 1.2 0.6 0.0 0.4 0.5 80.5 100.0 18.6 1,802
Rural 8.8 1.1 0.9 0.1 0.0 0.4 88.6 100.0 10.8 1,615
Nomadic 2.0 0.0 0.6 0.0 0.0 0.1 97.2 100.0 2.7 1,907
Education
No education 6.2 0.5 0.6 0.0 0.1 0.3 92.3 100.0 7.3 4,372
Primary 18.2 2.3 1.1 0.3 0.0 0.4 77.8 100.0 21.7 719
Secondary 29.0 1.2 0.9 0.0 3.3 0.0 65.6 100.0 31.1 168
Higher Education
48.3 0.0 0.8 0.5 0.0 0.8 49.7 100.0 49.0 66
Wealth quintile
Lowest 2.7 0.1 0.6 0.0 0.0 0.1 96.4 100.0 3.4 1,279
Second 3.7 0.0 0.6 0.0 0.0 0.1 95.6 100.0 4.4 1,099
Middle 7.1 0.6 0.7 0.3 0.0 0.1 91.2 100.0 8.4 974
Fourth 12.1 1.5 0.5 0.0 0.0 0.5 85.4 100.0 14.1 1,098
Highest 23.4 1.8 1.1 0.0 0.9 1.1 71.7 100.0 26.4 875
Total 9.0 0.8 0.7 0.1 0.1 0.3 88.9 100.0 10.5 5,324
1 Includes women who received a check-up after 41 days
Table 5.7 Timing of first postnatal check-up for the mother
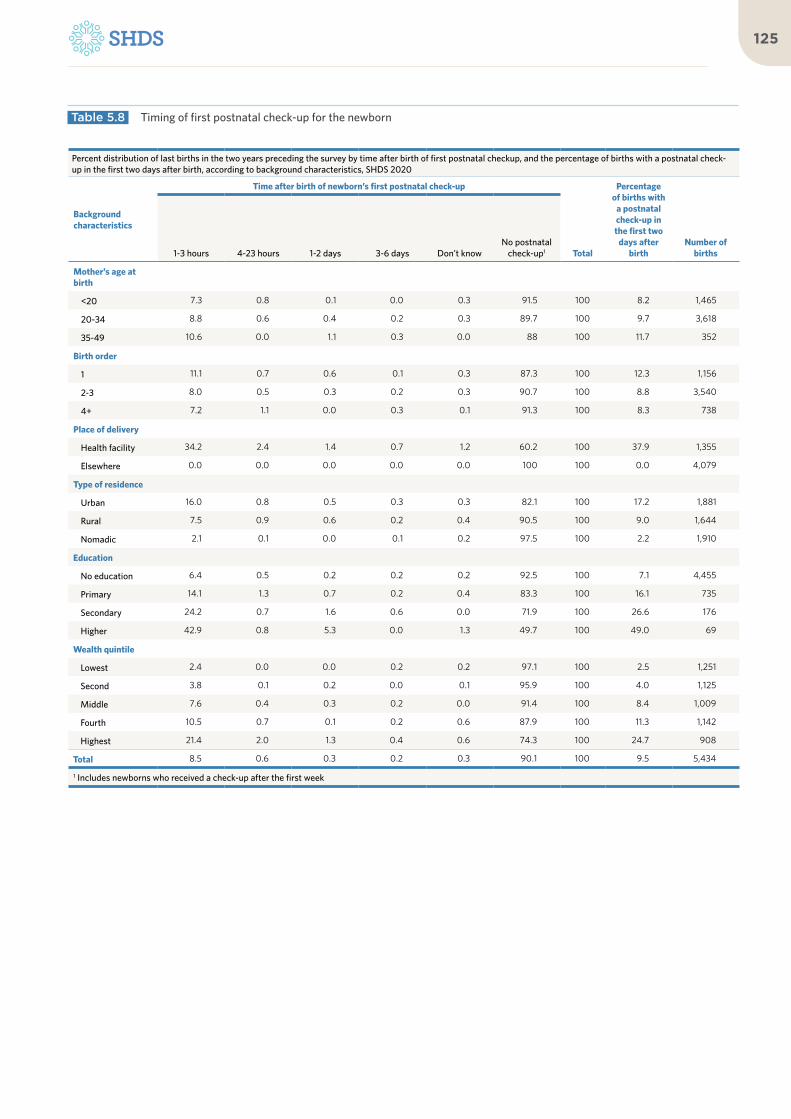
125
Percent distribution of last births in the two years preceding the survey by time after birth of first postnatal checkup, and the percentage of births with a postnatal check-up in the first two days after birth, according to background characteristics, SHDS 2020
Background characteristics
Time after birth of newborn’s first postnatal check-up
Total
Percentage of births with
a postnatal check-up in the first two
days after birth
Number of births1-3 hours 4-23 hours 1-2 days 3-6 days Don’t know
No postnatal check-up1
Mother’s age at birth
<20 7.3 0.8 0.1 0.0 0.3 91.5 100 8.2 1,465
20-34 8.8 0.6 0.4 0.2 0.3 89.7 100 9.7 3,618
35-49 10.6 0.0 1.1 0.3 0.0 88 100 11.7 352
Birth order
1 11.1 0.7 0.6 0.1 0.3 87.3 100 12.3 1,156
2-3 8.0 0.5 0.3 0.2 0.3 90.7 100 8.8 3,540
4+ 7.2 1.1 0.0 0.3 0.1 91.3 100 8.3 738
Place of delivery
Health facility 34.2 2.4 1.4 0.7 1.2 60.2 100 37.9 1,355
Elsewhere 0.0 0.0 0.0 0.0 0.0 100 100 0.0 4,079
Type of residence
Urban 16.0 0.8 0.5 0.3 0.3 82.1 100 17.2 1,881
Rural 7.5 0.9 0.6 0.2 0.4 90.5 100 9.0 1,644
Nomadic 2.1 0.1 0.0 0.1 0.2 97.5 100 2.2 1,910
Education
No education 6.4 0.5 0.2 0.2 0.2 92.5 100 7.1 4,455
Primary 14.1 1.3 0.7 0.2 0.4 83.3 100 16.1 735
Secondary 24.2 0.7 1.6 0.6 0.0 71.9 100 26.6 176
Higher 42.9 0.8 5.3 0.0 1.3 49.7 100 49.0 69
Wealth quintile
Lowest 2.4 0.0 0.0 0.2 0.2 97.1 100 2.5 1,251
Second 3.8 0.1 0.2 0.0 0.1 95.9 100 4.0 1,125
Middle 7.6 0.4 0.3 0.2 0.0 91.4 100 8.4 1,009
Fourth 10.5 0.7 0.1 0.2 0.6 87.9 100 11.3 1,142
Highest 21.4 2.0 1.3 0.4 0.6 74.3 100 24.7 908
Total 8.5 0.6 0.3 0.2 0.3 90.1 100 9.5 5,434
1 Includes newborns who received a check-up after the first week
Table 5.8 Timing of first postnatal check-up for the newborn

The Somali Health and Demographic Survey126
Percentage of women aged 15-49 who reported that they have serious problems in accessing health care for themselves when they are sick, by type of problem, according to background characteristics, SHDS 2020
Background characteristics
Problems in accessing health care
Number of ever-married women
Getting permission to go
for treatmentGetting money for treatment
Distance to health facility
Not wanting to go alone
At least one problem
accessing health care
Age
15-19 40.6 60.9 59.2 45.3 69.7 997
20-34 41.8 64.8 61.7 47.3 72.9 7,104
35-49 42.4 65.9 61.7 46.1 72.5 3,779
Number of living children
0 * * * * * 9
1-2 34.2 68.5 61.7 46.5 72.2 210
3-4 38.8 64.4 56.4 45.4 73.5 570
5+ 42.2 64.8 61.8 46.8 72.5 11,086
Marital status
Married 42.4 65.4 62.5 47.0 73.1 10,372
Divorced/ widowed
38.6 61.2 54.7 44.6 68.3 1,508
Employed past 12 months
Not employed 42.7 65.6 62.5 47.7 73.3 10,624
Employed for cash
37.0 59.0 53.2 39.6 66.8 985
Employed not for cash
29.9 54.5 53.4 34.4 64.0 270
Type of residence
Urban 38.8 58.4 50.8 39.7 65.8 4,349
Rural 43.0 65.2 61.2 45.1 72.2 3,547
Nomadic 44.3 71.6 73.5 55.9 80.2 3,984
Education
No education 43.4 66.9 64.2 48.8 74.4 9,908
Primary 36.6 58.1 52.1 38.3 67.3 1,408
Secondary 32.9 53.0 43.5 36.0 61.6 396
Higher 18.0 25.6 26.6 18.6 33.0 167
Wealth quintile
Lowest 47.8 77.1 78.6 57.0 84.8 2,654
Second 45.7 71.0 70.4 54.6 78.2 2,351
Middle 46.1 65.8 60.8 47.5 72.6 2,235
Fourth 37.8 59.2 52.7 40.8 67.8 2,454
Highest 31.0 48.6 41.7 31.7 56.6 2,186
Total 41.9 64.8 61.5 46.7 72.5 11,880
Note: An asterisk indicates that a figure is based on fewer than 25 unweighted cases and has been suppressed.
Table 5.9 Problems in accessing health care

127

Archillorem quissecusam ent velluptiam dolorporion providem id mo consequ atatiis eaque net qui qui que sunto is iducium quas assimincias velecto tat
06Child Health
©U
NFP
A S
OM
ALI
A/T
ob
in J
on
es

KEY FINDINGS
BIRTHWEIGHT
9%of births in the five years preceding the survey had a low birth weight (less than 2.5 kg)
SYMPTOMS OF ACUTE RESPIRATORY INFECTION (ARI):
4%of children under the age of five had symptoms of ARI in the two weeks before the survey
VACCINATIONSFOR CHILDREN AGED12-23 MONTHS
11%had received all basic vaccinations
DIARRHOEA
5%of children under age five had had diarrhoea in the 2 weeks before the survey
CHILDREN’S STOOLDISPOSAL
46%of children under age five had their stool disposed of safely
FEVER
7%of children under age five had a fever in the 2 weeks before the survey
37%had received BCG
12%had received the third dose of pentavalent vaccine
26%had received thethird dose of polio
23%had received the measles vaccine

The Somali Health and Demographic Survey132
This chapter presents findings
from the SHDS that relate to
children’s health. These include
the characteristics of newborns
(birth weight), vaccination
status of children, symptoms
of acute respiratory infection
(ARI), fever and diarrhoea, and
treatment of childhood illnesses.
Information collected on child
health from the SHDS 2020 is
expected to assist policymakers
and programme managers in
formulating appropriate strategies
and interventions to improve the
health of children in Somalia and
sanitation in their environment.
Birth Weight
Birth weight is a major determinant of infant and child health, as low birth weight is associated with fetal and neonatal morbidity, inhibited physical and cognitive development, and chronic diseases later in life. Birth weight
is, thus, used as a summary indicator of the challenges that a public health system faces, including long-term maternal malnutrition, ill health, and poor health care during pregnancy. Children whose birth weight is less than 2.5 kilograms, or children reported to be “very small” or “smaller than average,” are considered to have a higher risk of early childhood death than average children (WHO 2014).
The SHDS 2020 recorded births occurring during the five years preceding the survey. Birth weight was recorded in the Ever-Married Woman’s Questionnaire, based either on a written record or the mother’s report. As the birth weight may not have been known for many babies, the mother’s estimate of the baby’s size at birth was also obtained. Even though such an estimate is subjective, it can be a useful estimate for the weight of the child.
Table 6.1 presents information on child weight at birth by background characteristics. It shows that the birth weight was reported for only 10 percent of the live births occurring in the five years preceding the survey. Nine percent of these were infants with low birth weight (less than 2.5 kg). According to the findings presented, it can be noted that first-order births are more likely to be of low weight compared to births of other orders (Table 6.1). More underweight births were reported among younger mothers, at 9 percent for mothers
6 C H I L D H E A LT H

133
younger than 20 years old, as compared to 6 percent of underweight births reported by mothers of ages 35-49 (Figure 6.1).
Vaccination of ChildrenAccording to WHO, a child is considered fully vaccinated if he or she has received a
BCG vaccination against tuberculosis; three doses of the diphtheria, pertussis and tetanus (DPT) vaccine; at least three doses of the polio vaccine; and one dose of the measles vaccine. The SHDS 2020 collected information on the coverage of these vaccinations among the children born in the five years preceding the survey.
Following internationally recommended procedures, information on vaccination coverage was obtained in two ways in the survey—from child health cards and from mothers’ verbal reports. All mothers were asked to show the interviewer the child health cards on which immunization dates were recorded for all children born in the five years preceding the survey. If a card was available, the interviewer recorded the dates of each vaccination received by the child. If a card showed that the child was not fully vaccinated, the mother was then asked whether the child had received other vaccinations that were not recorded on the card, and these too were noted. If a child never received a health card or if the mother was unable to show the card to the interviewer, the vaccination information for the child was based on the mother’s report. Questions were asked for each type of vaccine.
9.48.9
5.8
<20 20-34 35-49
10.7All basic vaccinations
12.0DPT 3
22.7Measles
26.2Polio 3
36.7BCG
60.3No vaccinations
Percent of births with a reported birth weight of less than 2.5 kg by mother’s age
Percent of children aged 12-23 months who received specific vaccines at any time before the survey
Figure 6.1 Child’s weight and size at birth
Figure 6.2 Vaccination coverage for children aged 12-23 months

The Somali Health and Demographic Survey134
Mothers were asked to recall whether the child had received BCG, polio, pentavalent and measles vaccinations. If the mother indicated that the child had received the polio or pentavalent vaccines, she was asked about the number of doses that the child received. The results presented here are based on both information from the health card and the mother’s report for those without a card.
Table 6.2 presents data on the vaccination coverage for children aged 12-23 months, the age by which they should have received all vaccinations. Mothers were able to present health cards for 4 percent of these children. Overall, only 11 percent of children aged 12-23 months are fully vaccinated, meaning that they received the basic vaccinations (one BCG vaccine, three doses of pentavalent and polio vaccines, and one dose of measles vaccine) at any time before the survey was conducted (Figure 6.2). Thirty-seven percent of children had received BCG at any time before the survey, 21 percent received the first dose of pentavalent vaccine, and 30 percent received the first dose of polio. Twelve percent of children completed the required three doses of the pentavalent vaccine and 26 percent of the children received the three doses of polio vaccine. Twenty-three percent of children had been vaccinated against measles.
As can be expected, the percentage of children vaccinated increases among more educated mothers—24 percent of the children of mothers with secondary education have received all basic vaccinations, while among children of mothers with no schooling, only 8 percent have received all basic vaccinations. There is also variation by place of residence, as around 19 percent of children in urban areas have received all basic vaccinations, while less than 1 percent of children in nomadic areas have received all basic vaccinations.
Symptoms of Acute Respiratory InfectionARI is a serious infection that prevents normal breathing. It usually begins as a viral infection in the nose, trachea (windpipe) or lungs. If the infection is not treated, it can spread to the entire respiratory system. Early diagnosis and treatment with antibiotics can prevent a large proportion of deaths caused by ARI. According to WHO, ARI is one of the leading causes of childhood morbidity and mortality throughout the world. In the SHDS 2020, the prevalence of ARI was estimated by asking mothers whether their children under the age of 5 had
3.0
4.7
4.4
3.9
3.0
2.7
0-5 6-11 12-23 24-35 36-47 48-59
Percent of children with ARI symptoms in the two weeks preceding the survey
Figure 6.3 Children with ARI symptoms by age
Age in Months
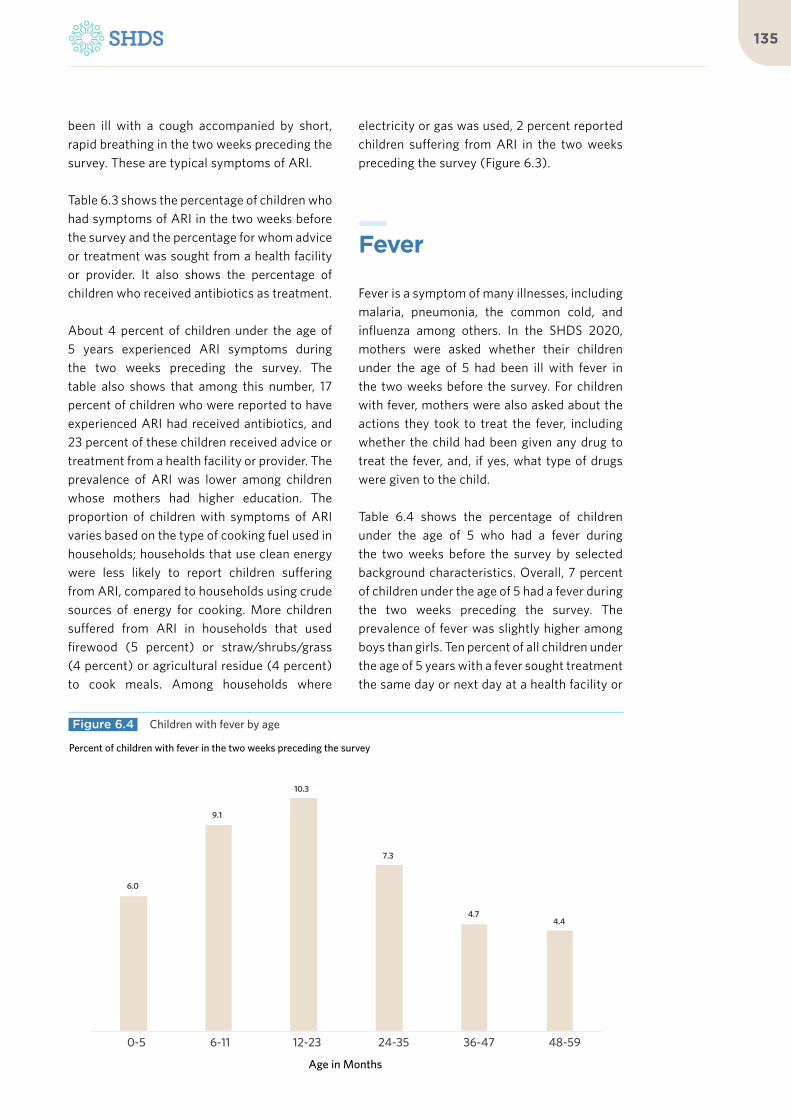
135
been ill with a cough accompanied by short, rapid breathing in the two weeks preceding the survey. These are typical symptoms of ARI.
Table 6.3 shows the percentage of children who had symptoms of ARI in the two weeks before the survey and the percentage for whom advice or treatment was sought from a health facility or provider. It also shows the percentage of children who received antibiotics as treatment.
About 4 percent of children under the age of 5 years experienced ARI symptoms during the two weeks preceding the survey. The table also shows that among this number, 17 percent of children who were reported to have experienced ARI had received antibiotics, and 23 percent of these children received advice or treatment from a health facility or provider. The prevalence of ARI was lower among children whose mothers had higher education. The proportion of children with symptoms of ARI varies based on the type of cooking fuel used in households; households that use clean energy were less likely to report children suffering from ARI, compared to households using crude sources of energy for cooking. More children suffered from ARI in households that used firewood (5 percent) or straw/shrubs/grass (4 percent) or agricultural residue (4 percent) to cook meals. Among households where
electricity or gas was used, 2 percent reported children suffering from ARI in the two weeks preceding the survey (Figure 6.3).
Fever
Fever is a symptom of many illnesses, including malaria, pneumonia, the common cold, and influenza among others. In the SHDS 2020, mothers were asked whether their children under the age of 5 had been ill with fever in the two weeks before the survey. For children with fever, mothers were also asked about the actions they took to treat the fever, including whether the child had been given any drug to treat the fever, and, if yes, what type of drugs were given to the child.
Table 6.4 shows the percentage of children under the age of 5 who had a fever during the two weeks before the survey by selected background characteristics. Overall, 7 percent of children under the age of 5 had a fever during the two weeks preceding the survey. The prevalence of fever was slightly higher among boys than girls. Ten percent of all children under the age of 5 years with a fever sought treatment the same day or next day at a health facility or
6.0
9.1
10.3
7.3
4.74.4
0-5 6-11 12-23 24-35 36-47 48-59
Percent of children with fever in the two weeks preceding the survey
Figure 6.4 Children with fever by age
Age in Months

More children suffered from ARI in households that used firewood or straw/shrubs/grass or agricultural residue to cook meals
©U
N P
ho
to/T
ob
in J
on
es

The Somali Health and Demographic Survey138
provider to seek treatment or advice the same day or the next day. The percentage with fever and who sought treatment was higher among children in urban and rural areas, at 12 percent, compared to nomadic children, at 1 percent. Twenty-four percent of children under the age of 5 years with fever took antibiotics. The prevalence of fever varied with the age of the child, as children less than 35 months of age were more likely to have fever (Figure 6.4).
Diarrhoeal Diseases
Dehydration caused by severe diarrhoea is a major cause of morbidity and mortality among young children, although the condition can be easily treated with oral rehydration therapy (ORT). Cases of diarrhoea are related to the use of contaminated water and unhygienic practices in food preparation and disposal of excreta. The SHDS 2020 collected information on the prevalence of diarrhoea among children by asking mothers whether their children under the age of 5 years had diarrhoea during the two weeks before the survey. If a child was identified as having had diarrhoea, information was collected on the treatment and feeding
practices during the episode.
Table 6.5 presents data on the percentage of children under age 5 who had diarrhoea during the two weeks preceding the survey, by selected background characteristics. Overall, 5 percent of children under the age of 5 years had diarrhoea, and children with diarrhoea for whom advice or treatment was sought from a health facility or provider was 3 percent. Children in the urban areas are more likely to have diarrhoea than those in the rural areas. The prevalence of diarrhoea varied with the educational level of the mother, but was uniform among boys and girls. Under the age of two years, the prevalence of diarrhoea increases with age but shows a declining trend after 23 months (Figure 6.5).
Treatment of Childhood Illnesses Figure 6.6 shows that the percentages of children presenting ARI symptoms, fever, and diarrhoea among children under the age of 5 years in the 2 weeks before the survey. Most children reported to have had fever, followed by
4.1
8.1
8.8
5.2
3.33.5
0-5 6-11 12-23 24-35 36-47 48- 59
Percent of children who had diarrhoea in the two weeks preceding the survey
Figure 6.5 Percent of children with diarrhoea by age
Age in Months

139
diarrhoea and ARI. Figure 6.7 shows the advice from a health facility or treatment sought 2 weeks before the survey for children with ARI, fever and diarrhoea. Children presenting with diarrhoea are more likely to be treated while children presenting with ARI are the least likely to be treated.
Disposal of Children’s StoolsThe proper disposal of children’s faeces is important in preventing the spread of disease. If human faeces are left uncontained, disease may spread by others who come into direct contact with it, or by animals that come into contact with the faeces.
Table 6.6 presents information on the disposal of the stools of children under the age of 5 by background characteristics. The information was derived by asking ever-married women what was done to dispose of the stools the last time their youngest child under age 5 passed stools. Forty-six percent of the children who live with their mothers had their last stool disposed of safely. As expected, the stools of older children (48-59 months) are much
3.5
6.7
5.3
ARI Fever Diarrhoea
22.5
36.5
47.5
ARI Fever Diarrhoea
Percent of children under the age of five with childhood illnesses in the two weeks preceding the survey
Percent of children under age five treated for childhood illnesses in the two weeks preceding the survey
Figure 6.6 Prevalence of childhood illnesses
Figure 6.7 Treatment of childhood illnesses
19.5
16.5
10.1
13.7
13.0
26.7
0.4
Child used toilet latrine
Put/rinsed into toilet or latrine
Buried
Put/rinsed into drain or ditch
Thrown into garbage
Left in the open
Other
Percent distribution of youngest children under age five, living with the mother, by the manner of disposal of the child’s last faecal matter
Figure 6.8 Disposal of children’s stools

The Somali Health and Demographic Survey140
more likely to be disposed of safely than those of younger children, mainly because older children are more likely to use a toilet or latrine where it is available. Children in urban areas (74 percent) and rural areas (60 percent) were more likely than those in nomadic areas (7 percent) to have had their stool disposed of safely. Moreover, the education levels and wealth status of a mother play a role in the
safe disposal of stool. Among mothers with primary education, 73 percent of children had their stool disposed of safely, which is almost double those reporting safe stool disposal among children of mothers with no education, at 41 percent.
List of Tables
Table 6.1 Child’s weight and size at birth 141
Table 6.2 Vaccinations by background characteristics 142
Table 6.3 Prevalence and treatment of symptoms of ARI 143
Table 6.4 Prevalence and treatment of fever 144
Table 6.5 Diarrhoea treatment 145
Table 6.6 Disposal of children’s stools 146

141
Percentage of live births in the five years preceding the survey that have a reported birth weight; among live births in the five years preceding the survey with a reported birth weight, percent distribution by birth weight; and percent distribution of all live births in the five years preceding the survey according to background characteristics, SHDS 2020
Background characteristics
Percent distribution of all live births by size of child at birth
Total
Percentage of all births that have
a reported birth weight1
Number of births
Births with a reported birth weight1
Very smallSmaller than
averageAverage or
largerLess than
2.5 kgNumber of
births
Mother’s age at birth
<20 8.4 8.6 83.1 100.0 9.6 2,238 9.4 214
20-34 7.0 5.4 87.6 100.0 10.2 10,974 8.9 1,124
35-49 8.6 5.0 86.4 100.0 9.6 1,817 5.8 174
Birth order
1 8.4 6.3 85.3 100.0 11.9 7,086 9.0 841
2-3 6.6 5.3 88.1 100.0 8.7 7,265 7.7 630
4-5 5.6 6.2 88.2 100.0 6.0 646 (9.3) 43
6+ (13.0) (14.8) (72.2) 100.0 (7.4) 54 * 4
Type of residence
Urban 7.1 6.7 86.2 100.0 18.5 5,498 8.2 1,020
Rural 6.5 4.8 88.8 100.0 9.9 4,504 9.2 444
Nomadic 8.6 5.9 85.5 100.0 0.9 5,027 (17.9) 39
Education
No education 7.9 5.8 86.3 100.0 6.9 12,446 9.1 859
Primary 5.4 6.6 88.1 100.0 20.4 1,970 7.3 402
Secondary 3.9 5.9 90.3 100.0 37.7 431 12.5 163
Higher 4.3 3.3 92.3 100.0 48.0 183 2.8 88
Total 7.4 5.8 86.8 100.0 10.1 15,030 8.6 1,5111Based on either a written record or the mother’s recall
Note: Figures in parentheses are based on 25-49 unweighted cases. An asterisk indicates that a figure is based on fewer than 25 unweighted cases and has been suppressed.
Table 6.1 Child’s weight and size at birth

The Somali Health and Demographic Survey142
Percentage of children aged 12-23 months who received specific vaccines at any time before the survey (according to a vaccination card or the mother’s report), and percentage with a vaccination card, by background characteristics, SHDS 2020
Background characteristics
BCG
DPT Polio 1
MeaslesAll basic
vaccinations2
No vaccinations
Percentage with a
vaccination card seen
Number of children1 2 3 0 1 2 3
Sex
Female 36.9 19.9 14.3 11.0 13.4 27.7 26.6 25.4 22.0 9.9 61.3 4.3 1,196
Male 36.4 22.2 17.0 13.2 15.6 31.6 30.3 27.2 23.5 11.6 59.1 4.0 1,044
Birth order
1 34.5 19.9 14.3 11.1 13.8 27.0 25.9 24.0 20.9 9.5 61.9 3.5 768
2-3 39.8 22.4 15.6 10.9 16.0 32.5 30.8 28.3 25.1 10.3 57.1 3.8 714
4-5 37.4 20.4 16.2 12.3 15.4 30.1 28.7 26.3 22.7 11.0 61.2 3.7 427
6+ 34.1 21.1 17.6 16.2 11.4 28.5 28.1 27.0 21.8 14.0 62.2 7.0 332
Type of residence
Urban 58.5 34.6 25.8 20.6 26.1 48.7 46.6 43.7 37.3 19.0 38.9 7.8 719
Rural 44.0 27.0 20.3 16.9 17.2 33.8 33.6 32.1 29.8 14.6 52.9 4.2 666
Nomadic 12.7 4.9 3.3 1.0 2.5 10.2 8.9 7.1 5.0 0.6 84.0 1.1 855
Mother’s education
No education 30.4 16.9 12.3 9.2 11.0 24.2 23.4 21.6 18.2 8.1 66.3 3.5 1,848
Primary 63.6 39.4 30.9 24.6 29.3 54.0 50.5 47.1 42.6 22.2 34.3 7.9 308
Secondary 76.3 43.0 29.7 28.2 27.8 53.5 53.5 47.8 42.3 24.2 23.2 7.3 64
Higher * * * * * * * * * * * * 15
Wealth quintile
Lowest 16.9 8.6 5.1 2.0 5.1 14.9 14.7 12.1 9.5 1.9 79.0 1.3 553
Second 22.5 13.4 10.4 8.5 7.4 19.7 17.2 16.5 14.2 7.6 75.3 1.6 513
Middle 42.1 26.4 19.6 15.7 20.0 34.3 32.5 30.8 27.3 14.7 55.1 4.7 432
Fourth 55.8 31.9 23.2 18.0 23.2 43.9 42.9 39.8 33.2 15.4 40.4 7.3 456
Highest 61.7 33.1 26.7 22.6 22.9 45.6 45.4 42.6 39.9 19.8 36.7 8.5 286
Total 36.7 21.0 15.5 12.0 14.4 29.6 28.3 26.2 22.7 10.7 60.3 4.1 2,240
1 Polio 0 is the polio vaccination given at birth
2 BCG, measles, and three doses each of DPT and polio vaccine (excluding polio vaccine given at birth)
Note: An asterisk indicates that a figure is based on fewer than 25 unweighted cases and has been suppressed.
Table 6.2 Vaccinations by background characteristics

143
Among children under the age of five, the percentage who had symptoms of acute respiratory infection (ARI) in the two weeks preceding the survey and among children with symptoms of ARI, the percentage for whom advice or treatment was sought from a health facility or provider and the percentage who received antibiotics as treatment, according to background characteristics, SHDS 2020
Background characteristics
Among children under the age of five:
Among children under the age of five with symptoms of ARI:
Number of childrenPercentage with
symptoms of ARI1 Number of children
Percentage for whom advice or treatment was sought from a
health facility or providerPercentage who received
antibiotics
Age in months
0-5 3.0 1,543 (11.8) (11.8) 51
6-11 4.7 1,310 30.2 17.9 62
12-23 4.4 2,719 27.5 23.6 120
24-35 3.9 3,215 25.5 18.9 124
36-47 3.0 3,212 17.3 10.5 95
48-59 2.7 3,101 16.5 14.4 84
Sex
Male 3.6 7,872 22.1 17.5 286
Female 3.4 7,227 22.9 16.2 246
Cooking fuel
Electricity or gas 2.1 722 * * 10
Kerosene 1.8 284 * * 6
Firewood 4.7 6,385 20.3 15.5 299
Charcoal 2.6 6,757 26.2 21.8 179
Straw/Shrubs/Grass
3.9 163 * * 3
Agricultural crops 4.4 304 * * 9
Other fuel (0.0) 21 * * 0
No food cooked in household
1.6 61 * * 1
Missing 3.2 394 * * 13
Mother’s education
No education 3.4 12,595 19.8 16.0 428
Primary 4.3 1,908 33.3 19.9 82
Secondary 4.3 428 * * 25
Higher 1.5 168 * * 4
Wealth quintile
Lowest 1.4 3,606 (9.1) (10.9) 55
Second 4.3 3,139 13.3 4.0 134
Middle 4.6 2,921 16.0 15.6 133
Fourth 4.1 3,094 38.8 30.8 127
Highest 3.7 2,339 28.2 18.4 87
Total 3.5 15,099 22.5 16.9 531
1Symptoms of ARI (cough accompanied by short, rapid breathing which was chest-related and/or by difficult breathing which was chest-related) is considered a proxy for pneumonia
Note: Figures in parentheses are based on 25-49 unweighted cases. An asterisk indicates that a figure is based on fewer than 25 unweighted cases and has been suppressed.
Table 6.3 Prevalence and treatment of symptoms of ARI

The Somali Health and Demographic Survey144
Among children under the age of five, the percentage who had a fever in the two weeks preceding the survey and among children with fever, the percentage for whom advice or treatment was sought from a health facility or provider, percentage who took antibiotics as treatment, by background characteristics, SHDS 2020
Background characteristics
Among children under the age of five: Among children under the age of five with
fever:
Number of children with fever
Percentage with fever Number of children
Percentage for whom treatment
was sought
Percentage who took antibiotic
drugs
Age in months
0-5 6.0 1,543 23.5 13.1 92
6-11 9.1 1,310 38.4 23.6 119
12-23 10.3 2,719 39.6 26.0 280
24-35 7.3 3,215 38.3 27.0 236
36-47 4.7 3,212 30.8 19.1 151
48-59 4.4 3,101 40.5 30.3 137
Sex
Male 7.1 7,872 35.4 25.8 556
Female 6.3 7,227 37.8 22.5 459
Type of residence
Urban 8.6 5,204 48.8 30.4 450
Rural 6.8 4,574 41.1 30.6 310
Nomadic 4.8 5,321 9.1 6.0 255
Mother’s education
No education 6.3 12,595 30.1 19.9 795
Primary 9.5 1,908 57.4 37.7 181
Secondary 7.8 428 (66.4) (38.9) 36
Higher 3.0 168 * * 7
Wealth quintile
Lowest 5.1 3,606 6.8 7.3 182
Second 4.9 3,139 20.8 7.9 155
Middle 8.3 2,921 41.5 25.7 241
Fourth 7.9 3,094 48.9 38.5 246
Highest 8.2 2,339 55.4 34.0 191
Total 6.7 15,099 36.5 24.3 1,015
Note: Figures in parentheses are based on 25-49 unweighted cases. An asterisk indicates that a figure is based on fewer than 25 unweighted cases and has been suppressed.
Table 6.4 Prevalence and treatment of fever

145
Among children under the age of five who had diarrhoea in the two weeks preceding the survey, the percentage for whom advice or treatment was sought from a health facility or provider by background characteristics, SHDS 2020
Background characteristics
Percentage with diarrhoea Number of children
Percentage of children with diarrhoea for
whom advice or treatment was sought
from a health facility or provider
Number of children with diarrhoea
Age in months
0-5 4.1 1,543 35.1 63
6-11 8.1 1,310 49.6 106
12-23 8.8 2,719 52.9 240
24-35 5.2 3,215 47.4 168
36-47 3.3 3,212 37.3 105
48-59 3.5 3,101 50.9 110
Sex
Male 5.3 7,872 50.3 421
Female 5.2 7,227 44.4 373
Type of residence
Urban 7.7 5,204 59.9 398
Rural 4.4 4,574 52.2 202
Nomadic 3.6 5,321 17.2 193
Mother’s education
No education 4.9 12,595 42.2 615
Primary 7.2 1,908 64.0 138
Secondary 7.6 428 (70.6) 34
Higher 4.6 168 * 9
Wealth quintile
Lowest 3.6 3,606 19.9 129
Second 4.0 3,139 31.6 126
Middle 7.5 2,921 53.0 218
Fourth 6.0 3,094 62.7 185
Highest 5.8 2,339 59.0 136
Total 5.3 15,099 47.5 793
Note: ORT includes fluid prepared from oral rehydration salt (ORS) packets, pre-packaged ORS fluid, and recommended home fluids (RHF).
Note: Figures in parentheses are based on 25-49 unweighted cases. An asterisk indicates that a figure is based on fewer than 25 unweighted cases and has been suppressed.
Table 6.5 Diarrhoea treatment
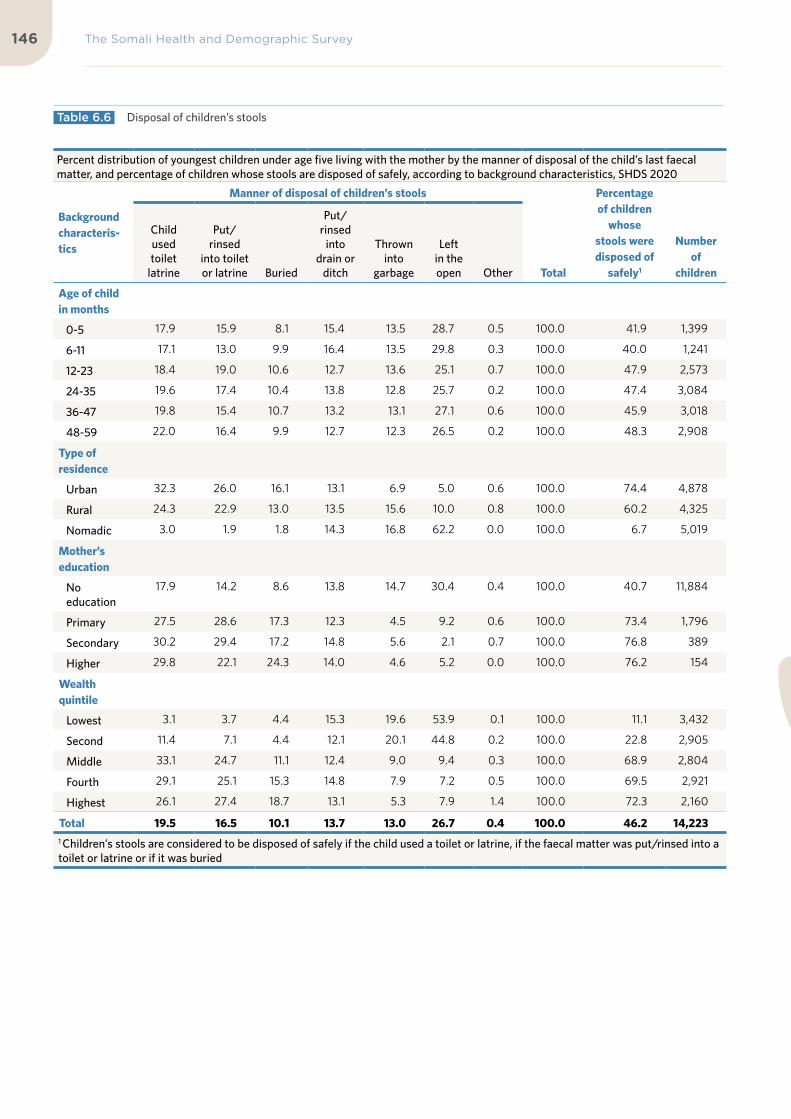
The Somali Health and Demographic Survey146
Percent distribution of youngest children under age five living with the mother by the manner of disposal of the child’s last faecal matter, and percentage of children whose stools are disposed of safely, according to background characteristics, SHDS 2020
Background characteris-tics
Manner of disposal of children’s stools
Total
Percentage of children
whose stools were disposed of
safely1
Number of
children
Child used toilet
latrine
Put/rinsed
into toilet or latrine Buried
Put/rinsed
into drain or
ditch
Thrown into
garbage
Left in the open Other
Age of child in months
0-5 17.9 15.9 8.1 15.4 13.5 28.7 0.5 100.0 41.9 1,399
6-11 17.1 13.0 9.9 16.4 13.5 29.8 0.3 100.0 40.0 1,241
12-23 18.4 19.0 10.6 12.7 13.6 25.1 0.7 100.0 47.9 2,573
24-35 19.6 17.4 10.4 13.8 12.8 25.7 0.2 100.0 47.4 3,084
36-47 19.8 15.4 10.7 13.2 13.1 27.1 0.6 100.0 45.9 3,018
48-59 22.0 16.4 9.9 12.7 12.3 26.5 0.2 100.0 48.3 2,908
Type of residence
Urban 32.3 26.0 16.1 13.1 6.9 5.0 0.6 100.0 74.4 4,878
Rural 24.3 22.9 13.0 13.5 15.6 10.0 0.8 100.0 60.2 4,325
Nomadic 3.0 1.9 1.8 14.3 16.8 62.2 0.0 100.0 6.7 5,019
Mother’s education
No education
17.9 14.2 8.6 13.8 14.7 30.4 0.4 100.0 40.7 11,884
Primary 27.5 28.6 17.3 12.3 4.5 9.2 0.6 100.0 73.4 1,796
Secondary 30.2 29.4 17.2 14.8 5.6 2.1 0.7 100.0 76.8 389
Higher 29.8 22.1 24.3 14.0 4.6 5.2 0.0 100.0 76.2 154
Wealth quintile
Lowest 3.1 3.7 4.4 15.3 19.6 53.9 0.1 100.0 11.1 3,432
Second 11.4 7.1 4.4 12.1 20.1 44.8 0.2 100.0 22.8 2,905
Middle 33.1 24.7 11.1 12.4 9.0 9.4 0.3 100.0 68.9 2,804
Fourth 29.1 25.1 15.3 14.8 7.9 7.2 0.5 100.0 69.5 2,921
Highest 26.1 27.4 18.7 13.1 5.3 7.9 1.4 100.0 72.3 2,160
Total 19.5 16.5 10.1 13.7 13.0 26.7 0.4 100.0 46.2 14,2231 Children’s stools are considered to be disposed of safely if the child used a toilet or latrine, if the faecal matter was put/rinsed into a toilet or latrine or if it was buried
Table 6.6 Disposal of children’s stools

147

Archillorem quissecusam ent velluptiam dolorporion providem id mo consequ atatiis eaque net qui qui que sunto is iducium quas assimincias velecto tat
07Child Nutrition, Feeding Practices and Nutritional Status of Women

©U
NFP
A S
OM
ALI
A/T
ob
in J
on
es

KEY FINDINGS
NUTRITIONAL STATUS OF CHILDREN
28%of children under-five are stunted (short for their age)
EARLY INITIATION OF BREASTFEEDING
60%of children were breastfed within the first hour of their birth
IRON SUPPLEMENTATION
6%of children aged 6–23 months received iron supplements in the 7 days preceding survey
DEWORMING
8%of children 6–59 months were dewormed in the past 6 months
EXCLUSIVE BREASTFEEDING
34%of children under 6 months are exclusively breastfed
TIMELY INITIATION OF COMPLEMENTARY FEEDING
41%of children were introduced to complementary foods at 6-8 months
12%are wasted (thin for their height)
23%are underweight (thin for their age)
BREASTFEEDING
90%of children are breastfed at some point
VITAMIN A
33%of children of 6-23 months consumed foods rich in vitamin A in the day preceding the survey

The Somali Health and Demographic Survey152
Nutrition provides energy,
promotes growth, and nourishes
the body. The nutritional status
of a person is determined by
multifaceted interactions among
food availability, affordability,
accessibility and consumption
and infections. It influences
an individual’s growth and
development, productivity,
reproductive success and
susceptibility to diseases.
Good nutritional status is critical for the growth and development of children, particularly those who are under two years of age. Additionally, women’s nutrition has a direct effect on their health and the health of their children. Nutritional deficiencies among women can lead to anaemia, infections and pregnancy complications which could result in premature birth or death. Nutritional deficiencies among children, especially those under five years of age, often lead to childhood illnesses such as diarrhoea, respiratory diseases and nutritional problems such as wasting and stunting.
Nutrition of Children and Women
The nutritional status of women and children can be measured using different methods, such as anthropometric, biochemical, clinical and dietary methods. These techniques of assessment differ in how and when they are conducted. In the SHDS 2020, the anthropometric and dietary methods were used for assessing the nutritional status of women aged 15 to 49 years and children aged zero to five years. The dietary method inquired about feeding practices of infants and children, while the anthropometric assessment measured the height and weight of women aged 15-49 and the children under the age of five in sampled households. The equipment used for height and weight measurements was the seca scale (for weight), height board (height for children aged under five) and seca (height for adults).
The SHDS 2020 followed the standard method of measuring the height and weight of women and children. Women’s weight was measured by placing the weighing scale on a flat place to ensure it was balanced and having the woman stand on it facing forward, with a vertical posture. Children under two years of age were measured lying down (supine position), whereas children above two years
7 C H I L D N U T R I T I O N , F E E D I N G P R A C T I C E S A N D N U T R I T I O N A L S TAT U S O F W O M E N

153
of age were measured while standing upright. The enumerating teams were trained before being deployed to the field. Their training involved class sessions and field pilot-tests on how to measure the weight and length/height of children and women respectively. The enumerators were medical professionals—midwives, nurses, public health and doctors. In the SHDS 2020, standardized nutritional indicators were generated using the WHO anthropometric tool for nutritional survey data analyses. The measurements below were used to generate nutritional indicators:
1. Weight-for-age (underweight)2. Height-for-age (stunting)3. Weight-for-height (wasting)
The standard assessment guideline that was used to calculate the indicators was the ‘Z-score’ or standard deviation scores (-2 or + 2). The weight-for-age index (underweight indicator) describes children who are underweight if they are minus (2 SD) from the mean reference population. This is a crucial indicator for assessing nutritional conditions of children.
The height-for-age (stunting) indicator calculates the children who suffer growth retardation as a result of poor diets or recurrent infections. Stunting is a result of chronic nutritional deprivations and often results in delayed mental and motoric development, poor school performance, and reduced intellectual capacity and productivity later in life. This in turn affects the economic development at national level.
The weight-for-height (wasting) indicator measures the children who suffer from acute malnutrition, usually as consequences of insufficient food intake or a high incidence of infectious diseases, especially diarrhoea. Wasting in turn impairs the functioning of the immune system and increases children’s morbidity and mortality.
Weight-for-age (underweight) is a composite index of height-for-age and weight-for-height.
It takes into account both acute and chronic malnutrition.
Nutritional Status of ChildrenThe nutritional status of children is affected by different factors, such as a mother’s nutritional status, socioeconomic status, educational background or children’s poor health conditions. The nutritional status of Somali children is relatively poor due to many reasons, such as low economic conditions, and severe drought that has affected the country in recent years. Under-nourished children are usually associated with high mortality and morbidity rates. Additionally, nutritional deficit also hinders children’s long-term physical and mental development.
The SHDS 2020 measured the height and weight of children below 5 years and inquired about their dietary intake. The weight and height measured for children that were recorded were used as anthropometric measurements using the Z-score. As per WHO standards, indicators such as height-for-age, weight-for-height and weight-for-age can be used to calculate the nutritional status of children under five years of age.
Table 7.1 shows the nutritional status of children under five years of age according to three anthropometric indices—height-for-age, weight-for-height and weight-for-age. Twenty-eight percent of children under the age of five are stunted or too short for their age, and 17 percent are severely stunted, while 12 percent are wasted; the table also shows that 6 percent of the children are severely wasted. Twenty-three percent of children under the age of five are underweight, with 12 percent severely underweight.
As presented in Figure 7.1, the prevalence of malnutrition among children aged under 5 shows a fluctuating trend. Malnutrition starts to

The Somali Health and Demographic Survey154
manifest at three to four months of age, the time many infants start complementary feeding, and continues to rise. As a consequence, wasting, which reflects acute malnutrition, increases and peaks in the fourth month. Stunting takes a bit of time to show (because it reflects chronic nutrition or repeated infections), so as infants start to eat food other than breastmilk at three to four months, stunting starts to rise
and peaks at 6 months, with a prevalence of 38 percent. On the other hand, wasting is highest among infants aged zero to five months, at 18 percent, and lowest, at 9 percent, among children of 48–59 months.
Initiation of BreastfeedingThe World Health Organisation (WHO) recommends early initiation of breastfeeding within the first hour of birth. The first breast milk contains a substance called ‘colostrum’, which contains a high concentration of antibodies and nutrients. It protects babies from the onset of diseases. Breastfeeding is also beneficial for mothers as it is known to reduce the risks of breast and ovarian cancers and postpartum depression. Early suckling improves the production of milk, and creates a bond between a mother and child. As a result, WHO recommends children be exclusively breastfed in the first six months of their life and that mothers should continue breastfeeding up to two years, while providing complementary foods.
Table 7.2 shows that 60 percent of children
0.0
5.0
10.0
15.0
20.0
25.0
30.0
35.0
40.0
45.0
0 1 2 3 4 5 6 7 8 9 10 11 12 13 14 15 16 17 18 19 20 21 22 23 24 25 26 27 28 29 30 31 32 33 34 35 36 37 38 39 40 41 42 43 44 45 46 47 48 49 50 51 52 53 54 55 56 57 58 59
Age in months
Stunted Wasted Underweight
62.0 62.3
46.1
Urban Rural Nomadic
Percent of children under five years classified as malnourished according to three anthropometric indices of nutritional status
Percent of children who started breastfeeding within the first hour of birth by place of residence
Figure 7.1 Nutritional status of children
Figure 7.2 Initial Breastfeeding

155
were breastfed within the first hour of their birth. Overall, 90 percent of children had been breastfed regardless of whether or not initiation of breastfeeding was within the first hour of birth or continued until two years.
As presented in Figure 7.2, analysis by the place of residence shows that children from nomadic areas are less likely to be breastfed within the first hour of birth, at 46 percent, as compared to 62 percent each of children in the urban and rural areas.
It can be noted that children born in health facilities or delivered with the assistance of health professionals were more likely to have been breastfed in the first hour of birth compared to children born at home, with the delivery assisted by a traditional birth attendant or by no one at all. The survey data shows that 67 percent of children born in health facilities were breastfed within the first hour of birth, while 58 percent of children who were born at home started breastfeeding within the first hour of birth (Table 7.2).
Breastfeeding status by ageIn the SHDS 2020, ever-married women who had children were asked if they had ever breastfed their babies, how long after the birth they put the baby to the breast (for the last child), if anything was given other than breast milk in the first three days of life (for the last child), if they were still breastfeeding the last child, if they had given their children micronutrient powder, and if they were ready to use therapeutic (PlumpyNut), or ready to use supplemental food (PlumpyDoz). The enumerators used the local names of these foods in order for the respondents to clearly understand the questions.
Table 7.3 and Figure 7.3 show the percentage distribution of children less than two years of age by breastfeeding status, including those currently breastfeeding and the percentage of all children under two years of age using feeding bottles with nipples according to their age in months. Thirty-four percent of children under six months are exclusively breastfed and the percentage of exclusive breastfeeding declines with age, from 43 percent for children aged 0-1 months to 28 percent among children of 4-5 months. Contrary to the recommendation
0.0
10.0
20.0
30.0
40.0
50.0
60.0
70.0
80.0
0-1 2-3 4-5 6-8 9-11 12-17 18-23
Age in months
Not breastfeeding Exclusively breastfeeding Breastfeeding and consuming plain water only
Percent of children under age two by breastfeeding status
Figure 7.3 Breastfeeding status by age

The Somali Health and Demographic Survey156
that children under the age of six months be exclusively breastfed, many infants under six months are also fed other liquids in addition to breast milk, such as water, at 15 percent, other milk, at 13 percent, and non-milk liquids, at five percent. Moreover, 15 percent of infants began complementary foods before six months of age. Nineteen percent of children aged under six months were not breastfeeding at the time the survey was conducted. Forty percent of children under two years of age were ‘currently’ being breastfed at the time the survey was carried out, while 44 percent of children under two years of age were using a feeding bottle with a nipple.
Infant and Young Child Feeding (IYCF) Indicators on Breastfeeding StatusFigure 7.4 shows that 34 percent of children aged under six months were exclusively breastfed, while 54 percent of children under age six months were predominantly breastfed. Forty-nine percent of children were still breastfeeding at the age of one, and 40 percent were breastfeeding at age two. Overall, 41 percent of children were introduced to complementary foods at six to eight months and 30 percent of children under age two were breastfed appropriately for their age. Further, 47 percent of children aged 0-23 months were bottle-fed.
Types of Complementary FoodsComplementary foods are recommended to be given to children when breastfeeding is no longer sufficient to addressing children’s needs. The period for complementary feeding usually starts from four to six months. At this age, children are vulnerable to malnutrition. Complementary feeding should be timely, meaning that all infants should begin receiving foods in addition to breast milk from six months onwards. However, foods to be given to children should be appropriate for their age and nutritional needs. Mothers or caregivers should take appropriate measures when preparing food, ensuring its safety to minimize the risk of food contamination.
Table 7.4 shows the foods consumed by children under two years of age who were living with the mother during the day or night preceding the interview according to their breastfeeding status. The data shows that 10 percent of breastfed children aged under two years and 10 percent of non-breastfed children aged under 2 years were fed infant milk formula. Thirty-one percent of the breastfed children were getting other liquids in addition to the breast milk, compared to 41 percent who were not breastfed. However, infants as young
33.7
28.3
48.5
41.2
39.9
30.3
53.5
46.9
IYCF 2: Exclusive breastfeeding under 6 months
Exclusive breastfeeding at 4-5 months of age
IYCF 3: Continue breastfeeding at 1 year
IYCF 4: Introduction of solid, semisolid or soft foods (6-8 months)
IYCF 10: Continued breastfeeding at 2 years
IYCF 11: Age appropriate breastfeeding (0-23 months)
IYCF 12: Predominant breastfeeding (0-5 months)
IYCF 14: Bottle feeding (0-23 months)
Figure 7.4 IYCF indicators on breastfeeding status

157
as zero months, whether breastfeeding or not, have already been introduced to other foods and liquids. This contradicts the exclusive breastfeeding guidance provided by WHO for children less than six months old.
Overall, 41 percent of breastfed children aged under two years received solid or semi-solid complementary foods in addition to breast milk. Twenty-three percent of children aged 0-23 months received foods made from grains, whereas 17 percent of children of this age had fruits and vegetables rich in vitamin A. Thirteen percent and 11 percent of children aged 0-23 months were given milk products (cheese, yoghurt and other) and animal sources of food (meat, fish and poultry) respectively. Fifty-seven percent of children aged 0-23 months who were not breastfeeding received solid or semi-solid foods from any sources.
With respect to the dietary intake of children by their breastfeeding status, a higher proportion of solid and semi-solid foods are being consumed by non-breastfed children. Thirty-four percent of non-breastfeeding children receive other types of milk. Supplementary foods given to children are fruits and vegetables rich in vitamin A, and meat, fish, poultry and eggs.
Infant and Young Child Feeding (IYCF) PracticesThe period during pregnancy and children’s first two years of life are considered as a critical window for their growth and prevention of childhood illnesses. Optimal Infant and Young Child Feeding (IYCF) Practices are essential for child growth and development. The IYCF Global Strategy was first issued in 2002 jointly by WHO and UNICEF to reverse disturbing trends of infant and child feeding practices. The main objective of the strategy is to improve and promote healthy feeding practices and, as a result, to decrease the child morbidity and mortality.
Table 7.5 shows children aged 6-23 months living with their mothers, and who are being fed according to the three IYCF practices based on the breastfeeding status, the number of food groups they receive and times they were being fed during the day or night preceding the survey. The UNICEF-recommended IYCF practices to be followed are based on breastfeeding status and the age of children. Children from six to eight months on breastfeeding are recommended to be fed four different groups of food per day, with a minimum meal frequency of two times, whereas children aged 9-23 months need to be fed four or more different groups of food per day, with a minimum meal frequency of three times. Non-breastfeeding children are recommended to be given four different groups of foods, with a minimum meal frequency of four times.
Table 7.5 indicates that 13 percent of breastfed children aged 6-23 months old were fed four or more different groups of food the day or night preceding the survey and 28 percent were fed the minimum meal frequency the night or day before the survey. Only 5 percent among the breastfed children aged 6-23 months old were fed four or more different groups of foods at a minimum number of times that is required.
With regard to non-breastfeeding children, 30 percent were fed milk or milk products, whereas 17 percent were fed four or more different groups of food the night or day preceding the survey. With regard to the minimum meal frequency among non-breastfeeding children, 31 percent of them were fed the minimum meal frequency. With regard to IYCF practices, only 8 percent of the non-breastfeeding children were fed as recommended by the IYCF guidelines.
Overall, only 5 percent of all children aged 6-23 months were fed in line with three IYCF practices the night or day prior to the survey, while 12 percent of children of the same age were fed four or more different groups of foods. With regard to the meal frequency, 23 percent of children aged 6-23 months had meals in line with the recommended minimum meal frequency.

The proportion of children consuming foods rich in vitamin A and iron and the proportion receiving iron supplements and deworming medication increase with higher levels of mothers’ education and increasing household wealth

©U
NFP
A S
OM
ALI
A/T
ob
in J
on
es

The Somali Health and Demographic Survey160
There are notable differences according to residence in the proportion of children aged 6-23 months fed according to the recommended three IYCF practices—from 11 percent in urban areas to less than 1 percent in nomadic areas. Additionally, there is a steady increase in the proportion of children fed according to the recommended three IYCF practices as mother’s education increases, from 4 percent among children whose mothers have no education to 16 percent among children whose mothers have secondary school education. As expected, children from wealthier households are more likely to be fed according to the recommended three IYCF practices than children from poorer households.
Micronutrient Intake among Children
Micronutrients, which consist of vitamins and minerals, are essential for children’s development and prevention against illnesses. Vitamin A and iron are key micronutrients needed for supplementation. The deficiency of these micronutrients can result in a weak immune system, blindness, stunting or anaemia. For children, the period 6-59 months in particular is a critical window for their health and well-being.
In the SHDS, ever-married women were asked if children aged 6-23 months consumed foods rich in vitamin A and iron the day or night preceding the survey and records were made to reflect those who had received any of these supplements.
Table 7.6 shows that 33 percent of children of 6-23 months had consumed foods rich in vitamin A during the night or day preceding the survey, while 21 percent had consumed foods rich in iron. The findings further reveal that 6 percent of children of ages 6-59 months were given iron supplements in the seven days preceding the survey. Similarly, only 8 percent of children aged 6-59 months were given deworming drugs in the six months before the survey was conducted.
Analysis by the place of residence shows that a large proportion of children in urban areas (48 percent) received vitamin A supplements, followed by those who live in rural areas (39 percent); nomadic children received the least vitamin A supplements (14 percent). Similar patterns were also observed for the percentage of children who were given deworming medication in the six months preceding the survey, with 14 percent of urban children, 8 percent of children from rural areas and 1 percent of nomadic children receiving deworming medication (Table 7.6).
In general, the proportion of children consuming foods rich in vitamin A and iron and the proportion receiving iron supplements and deworming medication increase with higher levels of mothers’ education and increasing household wealth (Table 7.6).
Nutritional Status of Women
Women’s nutrition is vital for their health and pregnancy outcomes. In the SHDS 2020, women’s nutritional status was calculated by measuring their body mass index (BMI). The BMI is a screening tool that can indicate whether a person is underweight, has normal weight or is overweight. The BMI is calculated by dividing the weight (kg) of the person by height (m) square. The ranges of BMI are <18.5 (underweight), 18.5-24.9 (normal), 25.0-29.9 (overweight) and >=30 (obese). If the person’s BMI is outside of normal range, their health risks might increase significantly. Having too much weight can lead to various health conditions, such as diabetes type 2, cardiovascular problems and high blood pressure. If the weight of a person is below the normal range, the risk of adverse pregnancy outcomes and overall poor health status increases.
Table 7.7 shows that the height of 3 percent of women was below 145 cm. Generally, women with short stature have a higher risk of having obstructed labour, due to cephalo-pelvic

161
disproportion. Fifty-two percent of women have a normal body mass index (between 18.5 and 24.9), while 15 percent of women aged 15-49 are thin, with a BMI of less than 18.5. Twenty-two percent of women are overweight, with a body mass index of more than 25.0– 29.9; 11 percent of women are obese.
Analysis by women’s places of residence shows that nomadic areas have the highest percentage of thin women, at 26 percent, followed by women in rural areas, at 16 percent, compared to 14 percent of women in urban areas. Similarly, the percentage of overweight women is highest in urban areas, at 23 percent. The proportion of overweight women increases with age, as women aged 40-49 (34 percent) are more likely to be overweight than women aged 15-19 (10 percent).
Micronutrient Intake among WomenMicronutrients deficiency is a global public health problem. Largely, deficiency is observed in minerals and vitamins affecting the health of mothers and, indirectly, the nutritional status and development of children. Iron supplementation for women during pregnancy is vital for mothers’ and babies’ health. Iron supplementation has an impact on the health of the mother during pregnancy, delivery or the post-partum stage as its severe deficiency may lead to anaemia, spontaneous abortion or low birth weight. Additionally, the strategy
of deworming is a public health intervention for pregnant women recommended by WHO. Preventive deworming using a single dose of Albendazole or Mebendazole is recommended for pregnant women in areas where prevalence of hookworms or T. trichiura infection and anaemia is a public health problem. This is to curb the effects of helminths diseases on the health of pregnant women.
Table 7.8 shows that only 2 percent of women reported that they had taken iron supplementation for the recommended 90 days or more during their last pregnancy. Similarly, only 4 percent of women took deworming medication. There is a slight variation in these proportions by place of residence. The percentage of women who took iron supplements for at least 90 days is higher among women in urban areas (5 percent), as compared to rural settings (2 percent) and nomadic areas (1 percent). Seven percent of women in urban areas had taken deworming tablets, compared to 4 percent of women in rural areas and 1 percent of nomadic women. The proportion of women who had taken iron supplementation for 90 days or longer during their last pregnancy increases the higher their education levels are—13 percent of women with secondary education reported to have taken iron tablets, as compared with 1 percent among those who do not have any form of education.
List of Tables
Table 7.1 Nutritional status of children 162
Table 7.1 Continued 163
Table 7.2 Initial breastfeeding 164
Table 7.3 Breastfeeding status by age 165
Table 7.4 Foods and liquids consumed by children in the day or night preceding the interview 166
Table 7.5 Infant and young child feeding (IYCF) practices 167
Table 7.6 Micronutrient intake among children 168
Table 7.6 Continued 169
Table 7.7 Nutritional status of women 170
Table 7.8 Micronutrient intake among mothers 171

The Somali Health and Demographic Survey162
Perc
enta
ge o
f chi
ldre
n un
der
five
year
s cl
assi
fied
as m
alno
uris
hed
acco
rdin
g to
thre
e an
thro
pom
etri
c in
dice
s of
nut
riti
onal
sta
tus:
hei
ght-
for-
age,
wei
ght-
for-
heig
ht, a
nd w
eigh
t-fo
r-ag
e, b
y ba
ckgr
ound
cha
ract
eris
tics
, SH
DS
2020
Bac
kgro
und
char
acte
rist
ics
Hei
ght-
for-
age1
Wei
ght-
for-
Hei
ght
Wei
ght-
for-
age
Perc
enta
ge
belo
w -3
SD
Perc
enta
ge
belo
w -2
SD
2
Mea
n Z-
scor
e (S
D)
Num
ber
of
child
ren
Perc
enta
ge
belo
w -3
SD
Perc
enta
ge
belo
w -2
SD
2
Perc
enta
ge
belo
w +
2 SD
Mea
n Z-
scor
e (S
D)
Num
ber
of
child
ren
Perc
enta
ge
belo
w -3
SD
Perc
enta
ge
belo
w -2
SD
2
Perc
enta
ge
belo
w +
2 SD
Mea
n Z-
scor
e (S
D)
Num
ber
of
child
ren
Age
in m
onth
s
0-5
10.3
16.0
3.3
194
8
.817
.813
.91.
338
3
13.1
21.0
34.1
1.3
666
6-8
27.3
38.0
3.5
217
6.
112
.110
.21.
412
7
18.8
37.2
23.4
1.5
346
9-11
20.9
33.9
2.4
130
8
.312
.89.
21.
58
4
14.0
24.4
19.8
1.1
169
12-1
717
.828
.81.
651
4
6.0
11.8
9.7
1.4
384
10
.621
.19.
60
.454
8
18-2
318
.629
.31.
117
5
7.2
10.3
7.7
1.0
108
10
.622
.28
.80
.418
4
24-3
515
.328
.41.
092
1
7.0
13.0
7.4
1.2
662
10
.122
.19.
20
.31,
015
36-4
716
.827
.21.
98
69
5.1
10.2
7.9
0.9
579
11
.322
.015
.80
.71,
208
48-
5917
.728
.81.
891
4
4.6
9.3
7.8
0.8
541
12
.522
.915
.30
.71,
212
Sex
Mal
e16
.627
.71.
72,
837
6.
111
.48
.41.
02,
023
11
.522
.715
.30
.73,
891
Fem
ale
17.4
28.0
1.8
1,0
96
6.0
12.4
9.2
1.1
84
4
12.2
22.8
14.5
0.6
1,4
58
Size
at b
irth
3
Ver
y sm
all
18.6
30.5
1.7
232
6.
610
.86.
20
.813
0
12.0
21.3
16.9
0.8
290
Smal
l15
.226
.91.
921
2
4.6
10.6
9.7
1.2
160
9.
521
.212
.70
.726
8
Ave
rage
or
larg
er17
.027
.81.
72,
620
6.
111
.78
.21.
01,
875
11
.722
.715
.10
.73,
558
Mot
her’
s nu
trit
iona
l st
atus
4
Thi
n (B
MI <
18
.5)
18.5
29.2
2.0
284
6.
711
.88
.71.
219
9
12.5
23.8
15.0
0.8
377
Nor
mal
(BM
I 18
.5-2
4.9
)18
.229
.31.
697
7
5.5
11.2
7.5
1.0
625
11
.623
.215
.00
.71,
274
Ove
rwei
ght/
obes
e (B
MI
>= 2
5)
15.4
26.3
1.7
541
6.
012
.09.
31.
04
39
11.9
22.6
14.1
0.6
753
Tab
le 7
.1
Nut
riti
onal
sta
tus
of c
hild
ren

163
Type
of
resi
denc
e
Urb
an17
.228
.21.
72,
331
5.
110
.57.
91.
01,
524
11
.622
.614
.10
.63,
038
Rura
l17
.929
.71.
91,
40
8
6.8
12.2
9.4
1.1
1,0
24
12.3
23.6
15.0
0.6
1,8
33
Nom
adic
9.1
17.1
2.1
193
10
.117
.710
.61.
231
9
9.6
19.4
22.9
1.1
477
Mot
her’
s ed
ucat
ion
5
No
educ
atio
n17
.028
.11.
72,
099
6.
011
.69.
01.
11,
541
11
.622
.915
.20
.72,
850
Prim
ary
15.9
27.2
1.8
968
6.
111
.48
.81.
272
0
12.1
22.8
14.3
0.7
1,32
0
Seco
ndar
y17
.028
.31.
821
1
6.3
11.0
6.1
0.8
128
11
.420
.714
.70
.626
4
Hig
her
educ
atio
n(1
2.3)
(19.
4)
(2.3
)60
(9
.1)
(19.
4)
(6.8
)(0
.6)
81
12
.424
.720
.51.
08
8
Wea
lth
quin
tile
Low
est
16.4
26.8
1.7
816
5.
711
.08
.01.
157
9
10.6
22.0
15.7
0.8
1,14
8
Seco
nd17
.629
.21.
98
83
7.
713
.58
.91.
267
8
14.0
24.7
15.7
0.7
1,22
2
Mid
dle
15.7
26.5
1.8
871
6.
212
.77.
60
.966
6
11.3
23.9
14.8
0.6
1,27
0
Four
th18
.329
.11.
88
28
5.1
10.2
9.1
1.0
550
11
.021
.113
.90
.699
9
Hig
hest
16.0
27.4
1.7
536
5.
410
.010
.11.
239
4
11.5
21.0
15.4
0.6
710
Tota
l16
.827
.81.
83,
933
6.
111
.68
.61.
12,
86
8
11.7
22.7
15.1
0.7
5,34
9
Not
e: T
able
is b
ased
on
child
ren
who
sta
yed
in th
e ho
useh
old
on th
e ni
ght b
efor
e th
e in
terv
iew
. Eac
h of
the
indi
ces
is e
xpre
ssed
in s
tand
ard
devi
atio
n un
its
(SD
) fr
om th
e m
edia
n of
the
WH
O
Chi
ld G
row
th S
tand
ards
ado
pted
in 2
00
6.
The
indi
ces
in th
is ta
ble
are
NO
T c
ompa
rabl
e to
thos
e ba
sed
on th
e pr
evio
usly
use
d 19
77 N
CH
S/C
DC
/WH
O R
efer
ence
.
Tabl
e is
bas
ed o
n ch
ildre
n w
ith
valid
dat
es o
f bir
th (
mon
th a
nd y
ear)
and
val
id m
easu
rem
ent o
f bot
h he
ight
and
wei
ght.
Figu
res
in p
aren
thes
es a
re b
ased
on
25-4
9 un
wei
ghte
d ca
ses.
1 Rec
umbe
nt le
ngth
is m
easu
red
for
child
ren
unde
r ag
e 2,
or
in th
e fe
w c
ases
whe
n th
e ag
e of
the
child
is u
nkno
wn
and
the
child
is le
ss th
an 8
5 cm
; sta
ndin
g he
ight
is m
easu
red
for
all o
ther
ch
ildre
n.2 In
clud
es c
hild
ren
who
are
bel
ow –
3 st
anda
rd d
evia
tion
s (S
D)
from
the
WH
O G
row
th S
tand
ards
pop
ulat
ion
med
ian
3 Exc
lude
s ch
ildre
n w
hose
mot
hers
wer
e no
t int
ervi
ewed
4 E
xclu
des
child
ren
who
se m
othe
rs w
ere
not w
eigh
ed a
nd m
easu
red.
Mot
her’s
nut
riti
onal
sta
tus
in te
rms
of B
MI (
Body
Mas
s In
dex)
is p
rese
nted
in T
able
11.1
0.
5 For
wom
en w
ho a
re n
ot in
terv
iew
ed, i
nfor
mat
ion
is ta
ken
from
the
Hou
seho
ld Q
uest
ionn
aire
. Exc
lude
s ch
ildre
n w
hose
mot
hers
are
not
list
ed in
the
Hou
seho
ld Q
uest
ionn
aire
.
Bac
kgro
und
char
acte
rist
ics
Hei
ght-
for-
age1
Wei
ght-
for-
Hei
ght
Wei
ght-
for-
age
Perc
enta
ge
belo
w -3
SD
Perc
enta
ge
belo
w -2
SD
2
Mea
n Z-
scor
e (S
D)
Num
ber
of
child
ren
Perc
enta
ge
belo
w -3
SD
Perc
enta
ge
belo
w -2
SD
2
Perc
enta
ge
belo
w +
2 SD
Mea
n Z-
scor
e (S
D)
Num
ber
of
child
ren
Perc
enta
ge
belo
w -3
SD
Perc
enta
ge
belo
w -2
SD
2
Perc
enta
ge
belo
w +
2 SD
Mea
n Z-
scor
e (S
D)
Num
ber
of
child
ren
Tab
le 7
.1
Con
tinu
ed

The Somali Health and Demographic Survey164
Among lastborn children who were born in the two years preceding the survey, the percentage who were ever breastfed and the percentage who started breastfeeding within one hour and within one day of birth and a the percentage who received a pre-lacteal feed, by background characteristics, SHDS 2020
Background characteristics
Among lastborn children born in the past two years:Among lastborn children born in the past
two years:
Percentage ever breastfed
Percentage who started breastfeeding within 1 hour of birth
Percentage who started breastfeeding within 1 day of birth1
Number of lastborn children
Percentage who received a pre-lacteal
feed2
Number of last-born children ever
breastfed
Sex
Male 90.2 59.5 83.0 2,807 40.5 2,532
Female 90.2 61.0 83.7 2,517 39.4 2,270
Assistance at delivery
Health personnel3 90.2 66.2 83.6 1,887 40.2 1,702
Traditional birth attendant
90.5 57.5 83.6 2,893 39.6 2,618
Relative/friend 93.4 63.6 85.5 403 39.4 376
Other * * * 26 * 23
No one 71.9 24.7 67.0 117 55.7 84
Place of delivery
Health facility 92.4 67.0 84.8 1,312 39.8 1,212
At home 89.5 58.0 82.9 3,999 40.0 3,579
Other * * * 13 * 12
Type of residence
Urban 90.5 62.0 85.3 3,339 41.6 3,021
Rural 88.8 62.3 84.3 1,360 37.4 1,208
Nomadic 91.9 46.1 70.9 624 36.9 573
Mother’s education
No education 89.6 59.3 82.7 4,372 39.5 3,916
Primary 94.2 62.8 87.9 718 39.2 677
Secondary 91.7 70.1 83.6 168 46.0 154
Higher 85.0 65.3 78.4 66 66.3 56
Wealth quintile
Lowest 90.6 57.9 85.7 1,279 37.6 1,159
Second 86.3 53.9 79.7 1,098 39.1 948
Middle 90.9 61.2 83.8 975 42.2 887
Fourth 91.3 64.7 84.8 1,097 39.0 1,001
Highest 92.4 64.7 82.3 874 43.2 808
Total 90.2 60.2 83.4 5,323 40.0 4,802
Note: Table is based on lastborn children born in the two years preceding the survey regardless of whether the children are living or dead at the time of interview.
An asterisk indicates that a figure is based on fewer than 25 unweighted cases and has been suppressed.
1 Includes children who started breastfeeding within one hour of birth
2 Children given something other than breast milk during the first three days of life
3 Doctor/clinical officer or nurse/midwife/auxiliary midwife
Table 7.2 Initial breastfeeding

165
Perc
ent d
istr
ibut
ion
of y
oung
est c
hild
ren
unde
r tw
o ye
ars
who
are
livi
ng w
ith
thei
r m
othe
r by
bre
astf
eedi
ng s
tatu
s an
d th
e pe
rcen
tage
cur
rent
ly b
reas
tfee
ding
; and
the
perc
enta
ge o
f all
child
ren
unde
r tw
o ye
ars
usin
g a
bott
le w
ith
a ni
pple
, ac
cord
ing
to a
ge in
mon
ths,
SH
DS
2020
Age
in
mon
ths
Not
bre
astf
eedi
ng
Bre
astf
eedi
ng s
tatu
s:
Tota
lC
urre
ntly
br
east
feed
ing
Num
ber
of
youn
gest
ch
ildre
n un
der
two
year
s liv
ing
wit
h th
e m
othe
r
Perc
enta
ge
usin
g a
bott
le
wit
h a
nipp
le
Num
ber
of a
ll ch
ildre
n un
der
two
year
sEx
clus
ivel
y br
east
feed
ing
Brea
stfe
edin
g an
d co
nsum
ing
plai
n w
ater
onl
y
Brea
stfe
edin
g an
d co
nsum
ing
non-
milk
liqu
ids
1
Brea
stfe
edin
g an
d co
nsum
ing
othe
r m
ilk
Brea
stfe
edin
g an
d co
nsum
ing
com
plem
enta
ry
food
s
0-1
14.2
42.
615
.14
.810
.013
.310
0.0
85.
851
3 29
.851
3
2-3
19.3
29.9
17.0
5.2
15.2
13.5
100
.08
0.7
523
37.2
523
4-5
22.8
28.3
11.2
5.9
14.1
17.7
100
.077
.24
86
48
.04
86
6-8
22.2
20.5
11.3
7.1
9.3
29.7
100
.077
.873
7 50
.473
7
9-11
38.0
12.0
4.6
4.4
4.7
36.3
100
.062
.053
4
51.3
534
12-1
753
.17.
92.
92.
93.
829
.310
0.0
46.
91,
640
53
.21,
640
18-2
370
.60
.02.
22.
82.
921
.410
0.0
39.5
711
44
.471
1
0-3
16.8
36.2
16.1
5.0
12.6
13.4
100
.08
3.2
1,0
36
33.5
1,0
36
0-5
18.7
33.7
14.5
5.3
13.1
14.7
100
.08
1.3
1,52
3 38
.11,
523
6-9
24.9
18.1
9.6
6.6
8.5
32.1
100
.075
.196
9 52
.096
9
12-1
551
.57.
72.
22.
84
.031
.710
0.0
48
.51,
323
55.0
1,32
3
12-2
358
.45.
52.
72.
93.
527
.010
0.0
44
.62,
350
50
.62,
350
20-2
369
.90
.02.
32.
42.
722
.710
0.0
39.9
423
4
4.4
423
Not
e: B
reas
tfee
ding
sta
tus
refe
rs to
a “
24-h
our”
per
iod
(yes
terd
ay a
nd la
st n
ight
). C
hild
ren
who
are
cla
ssifi
ed a
s br
east
feed
ing
and
cons
umin
g pl
ain
wat
er o
nly
cons
umed
no
liqui
d or
sol
id s
uppl
emen
ts. T
he c
ateg
orie
s of
not
bre
astf
eedi
ng,
excl
usiv
ely
brea
stfe
d, b
reas
tfee
ding
and
con
sum
ing
plai
n w
ater
, non
-milk
liqu
ids,
oth
er m
ilk, a
nd c
ompl
emen
tary
food
s (s
olid
s an
d se
mi-
solid
s) a
re h
iera
rchi
cal a
nd m
utua
lly e
xclu
sive
, and
thei
r pe
rcen
tage
s ad
d to
10
0 p
erce
nt.
Thu
s ch
ildre
n w
ho re
ceiv
e br
east
milk
and
non
-milk
liqu
ids
and
who
do
not r
ecei
ve o
ther
milk
and
who
do
not r
ecei
ve c
ompl
emen
tary
food
s ar
e cl
assi
fied
in th
e no
n-m
ilk li
quid
cat
egor
y ev
en th
ough
they
may
als
o ge
t pla
in w
ater
. Any
chi
ldre
n w
ho g
et c
ompl
emen
tary
food
are
cla
ssifi
ed in
that
cat
egor
y as
long
as
they
are
bre
astf
eedi
ng a
s w
ell.
1 N
on-m
ilk li
quid
s in
clud
e ju
ice,
juic
e dr
inks
, cle
ar b
roth
or
othe
r liq
uids
Tab
le 7
.3
Brea
stfe
edin
g st
atus
by
age

The Somali Health and Demographic Survey166
Perc
enta
ge o
f you
nges
t chi
ldre
n un
der
two
year
s of
age
who
are
livi
ng w
ith
the
mot
her
by ty
pe o
f foo
ds c
onsu
med
in th
e da
y or
nig
ht p
rece
ding
the
inte
rvie
w, a
ccor
ding
to b
reas
tfee
ding
sta
tus
and
age,
SH
DS
2020
Liqu
ids
Solid
or
sem
i sol
id fo
ods
Num
ber
of
child
ren
Age
in
mon
ths
Infa
nt
form
ula
Oth
er m
ilk1
Oth
er
liqui
ds2
Fo
rtifi
ed b
aby
food
Food
mad
e fr
om g
rain
s3
Frui
ts a
nd
vege
tabl
es
rich
in
vita
min
A4
Oth
er
frui
ts a
nd
vege
tabl
es
Food
mad
e fr
om ro
ots
and
tube
rs
Food
mad
e fr
om le
gum
es
and
nuts
Mea
t, fis
h an
d po
ultr
yEg
gs
Che
ese,
yo
gurt
, oth
er
milk
pro
duct
Any
sol
id o
r se
mis
olid
fo
od
BR
EAST
FEED
ING
CH
ILD
REN
0-1
8.1
11.7
13.8
1.
68
.46.
70
.83.
21.
94
.01.
35.
015
.54
48
2-3
12.9
15.5
16.6
3.
48
.05.
21.
32.
61.
93.
02.
44
.917
.44
38
4-5
9.7
20.1
20.5
2.
79.
07.
11.
84
.23.
02.
61.
26.
123
.238
1
6-8
9.8
23.6
27.3
3.
617
.315
.75.
87.
15.
18
.53.
915
.139
.959
9
9-11
10.4
32.8
40
.8
9.2
31.7
26.5
8.2
11.9
9.7
14.5
10.3
16.0
58.3
336
12-1
710
.832
.74
8.1
10
.54
2.1
31.4
11.5
13.6
9.1
21.4
10.3
19.4
64.5
789
18-2
35.
929
.14
0.4
7.
835
.420
.98
.311
.310
.319
.28
.017
.454
.628
3
6-23
9.7
29.5
39.6
7.
832
.024
.48
.811
.18
.216
.18
.117
.354
.72,
00
8
Tot
al9.
924
.130
.7
5.8
22.9
17.4
5.9
8.1
5.9
11.1
5.6
12.6
40
.73,
275
NO
NB
REA
STFE
EDIN
G C
HIL
DR
EN
0-1
7.1
22.4
27.3
4
.620
.326
.89.
910
.56.
120
.813
.28
.331
.18
5
2-3
3.2
26.0
32.3
3.
119
.123
.011
.08
.18
.813
.410
.111
.44
7.1
123
4-5
5.7
22.7
19.3
4
.34
.814
.74
.54
.94
.49.
17.
96.
725
.412
3
6-8
12.2
26.7
37.1
7.
724
.715
.89.
910
.07.
512
.06.
512
.24
7.2
190
9-11
8.2
40
.536
.1
9.5
33.5
28.9
14.4
15.2
11.7
20.1
13.4
21.7
62.4
238
12-1
711
.335
.64
3.0
8
.536
.430
.410
.717
.010
.822
.511
.217
.361
.01,
08
6
18-2
39.
936
.44
6.9
10
.833
.331
.815
.514
.39.
424
.112
.216
.960
.765
5
6-23
10.6
35.6
42.
9
9.2
34.1
29.4
12.5
15.4
10.2
21.8
11.3
17.2
59.8
2,17
0
Tot
al9.
934
.04
0.7
8
.531
.528
.211
.914
.39.
720
.811
.216
.156
.62,
500
Not
e: B
reas
tfee
ding
sta
tus
and
food
con
sum
ed re
fer
to a
“24
-hou
r” p
erio
d (y
este
rday
and
last
nig
ht).
1 O
ther
milk
incl
udes
fres
h, ti
nned
and
pow
dere
d an
imal
milk
2 Doe
s no
t inc
lude
pla
in w
ater
. Inc
lude
s ju
ice,
juic
e dr
inks
, cle
ar b
roth
, or
othe
r no
n-m
ilk li
quid
s.
3 Incl
udes
fort
ified
bab
y fo
od
4 In
clud
es [
list f
ruit
s an
d ve
geta
bles
incl
uded
in th
e qu
esti
onna
ire
such
as
pum
pkin
, red
or
yello
w y
ams
or s
quas
h, c
arro
ts, r
ed s
wee
t pot
atoe
s, d
ark
gree
n le
afy
vege
tabl
es, m
ango
es, p
apay
as, a
nd o
ther
loca
lly g
row
n fr
uits
and
veg
etab
les
that
ar
e ri
ch in
vit
amin
A]
Tab
le 7
.4
Food
s an
d liq
uids
con
sum
ed b
y ch
ildre
n in
the
day
or n
ight
pre
cedi
ng th
e in
terv
iew

167
Perc
enta
ge o
f you
nges
t chi
ldre
n ag
e 6-
23 m
onth
s liv
ing
wit
h th
eir
mot
her
who
are
fed
acco
rdin
g to
thre
e IY
CF
prac
tice
s ba
sed
on b
reas
tfee
ding
sta
tus,
num
ber
of fo
od g
roup
s, a
nd ti
mes
they
are
fed
duri
ng t
he d
ay o
r ni
ght p
rece
ding
the
surv
ey,
by b
ackg
roun
d ch
arac
teri
stic
s, S
HD
S 20
20
Bac
kgro
und
char
acte
rist
ics
Am
ong
brea
stfe
d ch
ildre
n 6-
23 m
onth
s,
perc
enta
ge fe
d:
Num
ber
of
brea
stfe
d ch
ildre
n 6-
23
mon
ths
Am
ong
non-
brea
stfe
d ch
ildre
n 6-
23 m
onth
s,
perc
enta
ge fe
d:
Num
ber
of
non-
brea
stfe
d ch
ildre
n 6-
23
mon
ths
Am
ong
all c
hild
ren
6-23
mon
ths,
per
cent
age
fed:
Num
ber
of
child
ren
6-23
m
onth
s4
+ fo
od
grou
ps 1
Min
imum
m
eal
freq
uenc
y 2
Both
4
+ fo
od
grou
ps
and
min
i-m
um m
eal
freq
uenc
y
Milk
or
milk
pr
oduc
ts 3
4+
food
gr
oups
1
Min
imum
m
eal
freq
uenc
y 4
Wit
h 3
IYC
F pr
acti
ces
5
Brea
st m
ilk,
milk
or
milk
pr
oduc
ts 6
4+
food
gr
oups
1
Min
imum
m
eal
freq
uenc
y 7
Wit
h 3
IYC
F pr
acti
ces
Age
6-8
6.6
32.3
4.1
543
28
.39.
231
.05.
116
9
82.
97.
232
.04
.471
2
9-11
14.1
24.8
4.5
324
31
.719
.132
.711
.121
6
72.7
16.1
28.0
7.1
540
12-1
715
.827
.16.
473
8
27.3
17.4
28.5
6.1
991
58
.316
.727
.96.
21,
729
18-2
313
.624
.05.
726
9
35.3
19.1
33.5
9.1
587
55
.617
.430
.68
.18
56
Sex
Mal
e13
.227
.35.
398
5
32.9
17.2
33.2
7.8
1,17
9
71.0
12.1
23.3
5.3
2,0
25
Fem
ale
11.8
28.3
5.3
88
9
27.3
17.6
27.9
7.1
1,0
59
70.0
12.0
22.0
4.9
1,8
12
Type
of r
esid
ence
Urb
an25
.230
.510
.158
0
43.
729
.44
4.2
15.5
80
5
74.9
22.5
30.3
10.5
1,28
3
Rura
l13
.431
.15.
957
5
33.7
18.3
35.2
5.7
659
72
.512
.325
.24
.51,
162
Nom
adic
1.6
23.0
1.0
718
13
.14
.012
.60
.677
3
64.7
2.1
13.4
0.6
1,39
2
Mot
her’
s ed
ucat
ion
No
educ
atio
n8
.925
.63.
31,
552
27
.114
.127
.65.
41,
810
69
.59.
220
.33.
53,
129
Prim
ary
27.3
36.4
13.3
248
37
.830
.539
.614
.231
2
73.2
24.2
30.7
11.3
533
Seco
ndar
y36
.94
0.7
20.0
52
61.4
29.4
57.5
19.0
86
8
2.2
26.8
43.
715
.512
9
Hig
her
**
*21
(7
7.8
)(5
1.9)
(74
.1)
(48
.1)
33
(90
.0)
(35.
7)(5
0.0
)(2
7.1)
48
Wea
lth
quin
tile
Low
est
2.7
23.7
1.4
511
13
.75.
815
.51.
04
77
67.7
3.4
14.9
1.3
926
Seco
nd3.
722
.60
.94
02
22
.17.
620
.31.
94
58
67.5
4.5
16.8
1.2
80
2
Mid
dle
13.8
33.5
6.9
324
31
.117
.332
.16.
64
11
70.5
11.9
24.4
4.8
682
Four
th21
.033
.210
.333
2
34.6
21.5
35.5
9.9
508
68
.817
.327
.27.
979
1
Hig
hest
30.0
29.6
10.7
305
54
.038
.154
.119
.838
3
80
.327
.533
.612
.463
6
Tota
l12
.527
.85.
31,
874
30
.317
.430
.77.
52,
237
70
.512
.122
.75.
13,
837
Not
e: F
igur
es in
par
enth
eses
are
bas
ed o
n 25
-49
unw
eigh
ted
case
s. A
n as
teri
sk in
dica
tes
that
a fi
gure
is b
ased
on
few
er th
an 2
5 un
wei
ghte
d ca
ses
and
has
been
sup
pres
sed.
1 Foo
d gr
oups
: a. i
nfan
t for
mul
a, m
ilk o
ther
than
bre
ast m
ilk, c
hees
e or
yog
urt o
r ot
her
milk
pro
duct
s; b
. foo
ds m
ade
from
gra
ins,
root
s, a
nd tu
bers
, inc
ludi
ng p
orri
dge
and
fort
ified
bab
y fo
od fr
om g
rain
s; c
. vit
amin
A-r
ich
frui
ts a
nd v
eget
able
s (a
nd re
d pa
lm o
il); d
. oth
er fr
uits
and
veg
etab
les;
e. e
ggs;
f.
mea
t, po
ultr
y, fi
sh, a
nd s
hellf
ish
(and
org
an m
eats
); g
. leg
umes
and
nut
s.2 F
or b
reas
tfed
chi
ldre
n, m
inim
um m
eal f
requ
ency
is re
ceiv
ing
solid
or
sem
i-so
lid fo
od a
t lea
st tw
ice
a da
y fo
r in
fant
s 6-
8 m
onth
s an
d at
leas
t thr
ee ti
mes
a d
ay fo
r ch
ildre
n 9-
23 m
onth
s3 In
clud
es tw
o or
mor
e fe
edin
gs o
f com
mer
cial
infa
nt fo
rmul
a, fr
esh,
tinn
ed a
nd p
owde
red
anim
al m
ilk, a
nd y
ogur
t4 F
or n
on-b
reas
tfed
chi
ldre
n ag
e 6-
23 m
onth
s, m
inim
um m
eal f
requ
ency
is re
ceiv
ing
solid
or
sem
i-so
lid fo
od o
r m
ilk fe
eds
at le
ast f
our
tim
es a
day
5 Non
-bre
astf
ed c
hild
ren
age
6-23
mon
ths
are
cons
ider
ed to
be
fed
wit
h a
min
imum
sta
ndar
d of
thre
e In
fant
and
you
ng c
hild
feed
ing
prac
tice
s if
they
rece
ive
othe
r m
ilk o
r m
ilk p
rodu
cts
at le
ast t
wic
e a
day,
rece
ive
the
min
imum
mea
l fre
quen
cy, a
nd re
ceiv
e so
lid o
r se
mi-
solid
food
s fr
om a
t lea
st fo
ur fo
od g
roup
s no
t inc
ludi
ng th
e m
ilk/m
ilk
prod
uct g
roup
6 Bre
astf
eedi
ng, o
r no
t bre
astf
eedi
ng a
nd re
ceiv
ing
two
or m
ore
feed
ings
of c
omm
erci
al in
fant
form
ula,
fres
h, ti
nned
, and
pow
dere
d an
imal
milk
, and
yog
urt
7 Chi
ldre
n ar
e fe
d th
e m
inim
um re
com
men
ded
num
ber
of ti
mes
per
day
acc
ordi
ng to
thei
r ag
e an
d br
east
feed
ing
stat
us a
s de
scri
bed
in fo
otno
tes
2 an
d 4
Tab
le 7
.5
Infa
nt a
nd y
oung
chi
ld fe
edin
g (I
YC
F) p
ract
ices

The Somali Health and Demographic Survey168
Among youngest children aged 6-23 months who are living with their mother, the percentages who consumed vitamin A-rich and iron-rich foods in the day or night preceding the survey, and among all children 6-59 months, the percentages who were given vitamin A supplements in the six months preceding the survey, who were given iron supplements in the past seven days, and who were given deworming medication by background characteristics, SHDS 2020
Background characteristics
Among youngest children aged 6-23 months living with the mother: Among all children aged 6-59 months:
Percentage who consumed foods rich in vitamin A in past 24 hours1
Percentage who consumed foods
rich in iron in past 24 hours2
Number of children age
Percentage given iron
supplements in past 7 days
Percentage given
deworming medication in
past 6 months3
Number of children
Age in months
6-8 19.0 10.2 755 4.4 3.0 755
9-11 32.3 18.9 555 7.8 6.7 555
12-17 37.8 24.9 1,814 5.0 7.7 1,814
18-23 36.4 25.0 903 6.6 8.1 903
24-35 n/a n/a n/a 6.4 9.3 3,214
36-47 n/a n/a n/a 6.5 7.6 3,211
48-59 n/a n/a n/a 6.1 8.2 3,101
Sex
Male 34.5 22.2 2,123 6.5 8.5 7,079
Female 31.8 20.4 1,905 5.7 7.2 6,474
Breastfeeding status
Breastfeeding 30.0 18.0 1,959 6.7 7.7 2,428
Not breastfeeding
36.3 24.5 2,068 6.0 7.9 11,125
Mother’s age
15-19 29.4 12.6 315 3.7 5.4 543
20-29 32.1 21.8 2,201 6.6 8.6 7,011
30-39 36.4 22.6 1,318 5.5 7.1 5,028
40-49 30.7 22.6 193 7.3 8.5 970
Type of residence
Urban 48.0 32.7 1,350 10.3 14.2 4,665
Rural 39.4 22.9 1,228 6.7 8.2 4,107
Nomadic 14.1 9.5 1,449 1.6 1.4 4,782
Education
No education 29.5 18.0 3,287 5.1 6.6 11,308
Primary 47.7 35.5 561 11.5 13.9 1,714
Secondary 52.6 35.3 133 8.7 11.9 384
Higher (67.3) (51.0) 49 14.8 22.5 146
Table 7.6 Micronutrient intake among children

169
Wealth quintile
Lowest 15.3 9.9 960 1.1 2.1 3,234
Second 24.0 14.1 839 3.5 4.2 2,842
Middle 38.9 22.0 727 7.4 10.1 2,617
Fourth 40.4 28.2 845 9.5 11.6 2,796
Highest 55.7 37.9 656 11.4 14.2 2,064
Total 33.2 21.3 4,027 6.1 7.9 13,553
Note: Information on vitamin A is based on both mother’s recall and the immunization card (where available). Information on iron
supplements and deworming medication is based on the mother’s recall.
n/a = Not applicable
Figures in parentheses are based on 25-49 unweighted cases.1 Includes meat (and organ meat), fish, poultry, eggs, pumpkin, red or yellow yams or squash, carrots, red sweet potatoes, dark green leafy vegetables, mango, papaya, and other locally grown fruits and vegetables that are rich in vitamin A, and red palm oil2 Includes meat (including organ meat), fish, poultry, and eggs3 Deworming for intestinal parasites is commonly done for helminths and for schistosomiasis.
Background characteristics
Among youngest children aged 6-23 months living with the mother: Among all children age 6-59 months:
Percentage who consumed foods rich in vitamin A in past 24 hours1
Percentage who consumed foods
rich in iron in past 24 hours2
Number of children age
Percentage given iron
supplements in past 7 days
Percentage given
deworming medication in
past 6 months3
Number of children
Table 7.6 Continued

The Somali Health and Demographic Survey170
Am
ong
wom
en a
ged
15-4
9, th
e pe
rcen
tage
wit
h he
ight
und
er 1
45
cm, m
ean
Body
Mas
s In
dex
(BM
I), a
nd th
e pe
rcen
tage
wit
h sp
ecifi
c BM
I lev
els,
by
back
grou
nd c
hara
cter
isti
cs, S
HD
S 20
20
Bac
kgro
und
char
acte
rist
ics
B
ody
Mas
s In
dex
1
Hei
ght
Mea
n bo
dy
max
inde
x (B
MI)
Nor
mal
Thi
nO
verw
eigh
t/O
bese
Num
ber
of
wom
en
Perc
enta
ge
belo
w 1
45
cmN
umbe
r of
w
omen
18.5
-24
.9
(Tot
al
norm
al)
<18
.5 (
Tota
l th
in)
17.0
-18.
4
(Mild
ly th
in)
<17
(Mod
erat
ely
and
seve
rely
th
in)
>=25
.0
(Tot
al o
ver-
w
eigh
t or
obes
e)25
.0-2
9.9
(Ove
rwei
ght)
30.0
+
(obe
se)
Age
15-1
95.
34
,270
21.5
60.9
25
.716
.59.
1
13.4
10.4
3.0
4,1
56
20-2
91.
75,
464
23.9
54.6
12
.88
.93.
9
32.4
22.2
10.2
4,4
65
30-3
91.
13,
770
25.5
43.
2
7.8
5.1
2.8
4
8.9
31.1
17.8
3,18
8
40
-49
0.9
1,4
97
26
.239
.0
6.6
4.5
2.1
54
.433
.620
.81,
368
Type
of
resi
denc
e
Urb
an2.
49,
939
24
.250
.4
13.7
9.1
4.6
35
.923
.412
.68
,795
Rura
l2.
64
,18
5
23.3
55.0
16
.110
.75.
3
28.8
20.1
8.7
3,60
7
Nom
adic
3.0
877
21.4
60.3
25
.515
.59.
9
14.3
12.0
2.3
775
Educ
atio
n
No
educ
atio
n2.
110
,40
5
23.9
51.6
13
.89.
44
.4
34.6
23.3
11.3
8,9
56
Prim
ary
3.9
2,62
7
23.2
51.2
19
.412
.07.
3
29.4
19.2
10.2
2,36
2
Seco
ndar
y3.
01,
420
23.2
56.8
17
.210
.96.
2
26.0
16.6
9.4
1,35
0
Hig
her
educ
atio
n1.
654
9
24.4
56.5
10
.27.
23.
0
33.1
21.7
11.4
509
Wea
lth
quin
tile
Low
est
2.3
3,4
92
24
.152
.1
13.5
9.0
4.6
34
.321
.512
.83,
103
Seco
nd2.
53,
078
23.5
50.0
17
.811
.26.
6
32.1
22.4
9.7
2,69
1
Mid
dle
2.3
3,18
9
23.6
54.2
14
.510
.14
.4
31.3
21.0
10.3
2,79
5
Four
th3.
22,
88
8
23
.953
.2
13.3
9.4
3.9
33
.522
.511
.02,
497
Hig
hest
2.3
2,35
3
23.6
51.4
16
.510
.26.
3
32.1
21.8
10.3
2,0
90
Tota
l2.
515
,00
1
23.8
52.2
15
.09.
95.
1
32.7
21.8
10.9
13,1
77
Not
e: T
he B
ody
Mas
s In
dex
(BM
I) is
exp
ress
ed a
s th
e ra
tio
of w
eigh
t in
kilo
gram
s to
the
squa
re o
f hei
ght i
n m
eter
s (k
g/m
2 ).1 E
xclu
des
preg
nant
wom
en a
nd w
omen
wit
h a
birt
h in
the
prec
edin
g 2
mon
ths
Tab
le 7
.7
Nut
riti
onal
sta
tus
of w
omen

171
Am
ong
wom
en a
ged
15-4
9, th
e pe
rcen
tage
wit
h he
ight
und
er 1
45
cm, m
ean
Body
Mas
s In
dex
(BM
I), a
nd th
e pe
rcen
tage
wit
h sp
ecifi
c BM
I lev
els,
by
back
grou
nd c
hara
cter
isti
cs, S
HD
S 20
20
Bac
kgro
und
char
acte
rist
ics
B
ody
Mas
s In
dex
1
Hei
ght
Mea
n bo
dy
max
inde
x (B
MI)
Nor
mal
Thi
nO
verw
eigh
t/O
bese
Num
ber
of
wom
en
Perc
enta
ge
belo
w 1
45
cmN
umbe
r of
w
omen
18.5
-24
.9
(Tot
al
norm
al)
<18
.5 (
Tota
l th
in)
17.0
-18.
4
(Mild
ly th
in)
<17
(Mod
erat
ely
and
seve
rely
th
in)
>=25
.0
(Tot
al o
ver-
w
eigh
t or
obes
e)25
.0-2
9.9
(Ove
rwei
ght)
30.0
+
(obe
se)
Age
15-1
95.
34
,270
21.5
60.9
25
.716
.59.
1
13.4
10.4
3.0
4,1
56
20-2
91.
75,
464
23.9
54.6
12
.88
.93.
9
32.4
22.2
10.2
4,4
65
30-3
91.
13,
770
25.5
43.
2
7.8
5.1
2.8
4
8.9
31.1
17.8
3,18
8
40
-49
0.9
1,4
97
26
.239
.0
6.6
4.5
2.1
54
.433
.620
.81,
368
Type
of
resi
denc
e
Urb
an2.
49,
939
24
.250
.4
13.7
9.1
4.6
35
.923
.412
.68
,795
Rura
l2.
64
,18
5
23.3
55.0
16
.110
.75.
3
28.8
20.1
8.7
3,60
7
Nom
adic
3.0
877
21.4
60.3
25
.515
.59.
9
14.3
12.0
2.3
775
Educ
atio
n
No
educ
atio
n2.
110
,40
5
23.9
51.6
13
.89.
44
.4
34.6
23.3
11.3
8,9
56
Prim
ary
3.9
2,62
7
23.2
51.2
19
.412
.07.
3
29.4
19.2
10.2
2,36
2
Seco
ndar
y3.
01,
420
23.2
56.8
17
.210
.96.
2
26.0
16.6
9.4
1,35
0
Hig
her
educ
atio
n1.
654
9
24.4
56.5
10
.27.
23.
0
33.1
21.7
11.4
509
Wea
lth
quin
tile
Low
est
2.3
3,4
92
24
.152
.1
13.5
9.0
4.6
34
.321
.512
.83,
103
Seco
nd2.
53,
078
23.5
50.0
17
.811
.26.
6
32.1
22.4
9.7
2,69
1
Mid
dle
2.3
3,18
9
23.6
54.2
14
.510
.14
.4
31.3
21.0
10.3
2,79
5
Four
th3.
22,
88
8
23
.953
.2
13.3
9.4
3.9
33
.522
.511
.02,
497
Hig
hest
2.3
2,35
3
23.6
51.4
16
.510
.26.
3
32.1
21.8
10.3
2,0
90
Tota
l2.
515
,00
1
23.8
52.2
15
.09.
95.
1
32.7
21.8
10.9
13,1
77
Not
e: T
he B
ody
Mas
s In
dex
(BM
I) is
exp
ress
ed a
s th
e ra
tio
of w
eigh
t in
kilo
gram
s to
the
squa
re o
f hei
ght i
n m
eter
s (k
g/m
2 ).1 E
xclu
des
preg
nant
wom
en a
nd w
omen
wit
h a
birt
h in
the
prec
edin
g 2
mon
ths
Among women aged 15-49 with a child born in the 5 years preceding the survey, percent distribution by number of days they took iron tablets or syrup during the pregnancy of the last child, and percentage who took deworming medication during the pregnancy of the last child according to background characteristics, SHDS 2020
Background characteristics
Number of days women took iron tablets or syrup during pregnancy of last birth
Percentage of women who took deworming
medication during pregnancy of last birth
Number of womenNone <60 60-89 90+ Total
Age
15-19 69.7 26.7 1.4 2.3 100.0 2.9 320
20-29 70.1 24.7 1.3 3.9 100.0 4.2 918
30-39 74.3 22.5 1.8 1.4 100.0 4.1 750
40-49 83.7 14.0 1.3 1.0 100.0 2.2 354
Type of residence
Urban 54.6 38.0 2.3 5.1 100.0 7.0 793
Rural 72.1 24.8 1.6 1.5 100.0 3.5 690
Nomadic 91.9 6.7 0.7 0.7 100.0 0.8 859
Education
No education 79.2 18.3 1.2 1.3 100.0 3.1 1,936
Primary 51.3 40.7 3.4 4.6 100.0 5.0 258
Secondary 41.1 45.0 1.1 12.8 100.0 5.4 106
Higher (26.0) (58.0) (4.0) (12.0) 100.0 (14.0) 50
Wealth quintile
Lowest 92.4 7.1 0.5 0.1 100.0 0.8 591
Second 82.1 15.2 1.1 1.6 100.0 2.1 457
Middle 74.6 23.3 1.5 0.5 100.0 5.3 430
Fourth 61.7 31.8 3.3 3.2 100.0 5.0 436
Highest 48.8 42.0 1.6 7.7 100.0 6.4 428
Total 73.4 22.6 1.5 2.4 100.0 3.7 2,342
Note: Figures in parentheses are based on 25-49 unweighted cases.
Table 7.8 Micronutrient intake among mothers

Archillorem quissecusam ent velluptiam dolorporion providem id mo consequ atatiis eaque net qui qui que sunto is iducium quas assimincias velecto tat
08HIV/AIDS-Related Knowledge, Beliefs and Attitudes


KEY FINDINGS
66%of women aged 15-49 in Somalia had heard of HIV/AIDS
KNOWLEDGE ABOUT HIV/AIDS
6%of women aged 15-49 have comprehensive knowledge about HIV/AIDS
COMPREHENSIVE KNOWLEDGE ABOUT HIV/AIDS
DISCRIMINATORY ATTITUDES TOWARDS PEOPLE LIVING WITH HIV/AIDS
PREVALENCE OF STIs (SELF-REPORTED)
43%of mothers aged 15-49 know that HIV can be transmitted from mother to child during pregnancy, 46 percent during delivery and 47 percent by breastfeeding respectively
KNOWLEDGE OF MOTHER-TO-CHILD TRANSMISSION OF HIV/AIDS
8%of ever-married women aged 15-49 reported that they had STIs in the 12 months preceding the survey
56%of women aged 15-49 do not think that children living with HIV should be able to attend school with children who are HIV negative
62%of women aged 15-49 reported they would not buy fresh vegetables from a shopkeeper who is living with HIV
48%of women aged 15-49 have discriminatory attitudes towards people living with HIV

The Somali Health and Demographic Survey176
The SHDS 2020 collected
information on the knowledge
of and attitudes around Human
Immunodeficiency Virus/Acquired
Immunodeficiency Syndrome
(HIV/AIDS) and knowledge
of other sexually transmitted
infections (STIs) from all ever-
married women. The survey also
collected data on self-reported
prevalence of sexually transmitted
infections among ever-married
women.
The objective of this chapter is to provide data on and trends in HIV/AIDS knowledge, attitudes, and behaviours, including knowledge of HIV/AIDS prevention methods, stigma and prevention of mother-to-child transmission of HIV/AIDS.
HIV/AIDS is not considered to be a major epidemic in Somalia and most people associate HIV/AIDS with people who commit sexual sins. The HIV/AIDS prevalence among the adult population is estimated to be very low at about 0.55 percent, with an estimated figure of 2,370 annual deaths (UNAIDS 2014). However, the actual prevalence may be higher as a result of undetected infections.
The future course of the situation of HIV/AIDS in Somalia depends on several variables: levels of knowledge about HIV/AIDS among the general population, social stigmatization, modification of risk behaviour, access to high-quality services for STIs, provision and uptake of HIV counseling and testing, and access to care and antiretroviral therapy (ART).
HIV/AIDS-Related Knowledge, Beliefs and Attitudes and Prevention MethodsThe SHDS 2020 obtained information from women aged 15-49 on their knowledge, perceptions, and behaviours related to HIV/AIDS, as well awareness of modes of HIV/AIDS transmission. The survey also collected information on knowledge about which behaviours could prevent the spread of HIV/AIDS. Respondents were asked whether they had heard of HIV/AIDS. Those who reported they had heard of HIV/AIDS were then asked a number of questions about whether and how the infection could be avoided.
Table 8.1 provides information on women’s awareness of HIV/AIDS. It shows that about
8 H I V/A I D S - R E L AT E D K N O W L E D G E , B E L I E F S A N D AT T I T U D E S

177
66 percent of women aged 15-49 have heard of HIV/AIDS. The proportion of women who have heard of HIV/AIDS was lower among those in nomadic and rural areas (45 percent and 69 percent respectively) than urban areas (81 percent). Sixty percent of women who have not attended school had heard about HIV/AIDS, versus 96 percent of those with higher education. Awareness of HIV/AIDS is higher among the wealthier households. Worryingly, women in nomadic and rural areas are less aware of HIV/AIDS compared to those in urban areas.
Misconceptions about HIV/AIDS Table 8.2 presents data on the misconceptions about HIV/AIDS transmission in Somalia (e.g. that HIV/AIDS can be transmitted by mosquito bites or that it can be transmitted by sharing food with someone who has HIV/AIDS). About 40 percent of the interviewed women were aware that a healthy-looking person could be carrying the HIV/AIDS virus; 27 percent of women reported that HIV/AIDS could not be transmitted through mosquito bites and 38 percent of the women knew that the HIV/AIDS virus cannot be transmitted by supernatural means. Thirty-four percent of the respondents understand that people cannot be infected by sharing food with a person who has HIV/AIDS.
Table 8.2 also includes a composite measure of knowledge of HIV/AIDS. It indicates that only 12 percent of all women aged 15-49 rejected the two most common misconceptions about HIV/AIDS in Somalia (i.e. HIV/AIDS can be transmitted by mosquito bites or HIV/AIDS virus cannot be transmitted by supernatural means) and are also aware that a healthy-looking person can have HIV/AIDS. Knowledge of HIV/AIDS increased with levels of education.
Only 6 percent of the interviewed women have comprehensive knowledge of HIV/AIDS. Comprehensive knowledge about HIV/AIDS is
lowest among respondents with no education, at 4 percent. Even for women with higher levels of education, comprehensive knowledge is still relatively low at only 17 percent.
Knowledge about Mother-to-Child Transmission
To assess knowledge about mother-to-child transmission of HIV/AIDS, both ever-married and never-married women interviewed in the SHDS 2020 were asked whether HIV/AIDS could be transmitted from a mother to her child during pregnancy or delivery, and through breastfeeding. They were also asked whether the risk of mother-to-child transmission (MTCT) of HIV/AIDS could be reduced with the mother taking special drugs during pregnancy.
Table 8.3 presents data on the knowledge about mother-to-child transmission among women aged 15-49 by background characteristics (Figure 8.1). It shows that 43 percent of women know that HIV/AIDS can be transmitted during pregnancy, 46 percent know that it can be transmitted during delivery, and 47 percent know that it can be transmitted
43.045.7 46.8
36.1
During pregnancy During delivery By breastfeeding By all three means
Percent of women aged 15-49 who know the means of how HIV/AIDS can be transmitted from mother to child
Figure 8.1 Knowledge of prevention of mother-to-child transmission of HIV/AIDS

The Somali Health and Demographic Survey178
through breastfeeding, whereas 36 percent of the respondents believe HIV/AIDS can be transmitted by all three means. Thirty-one percent of women know that the risk of mother-to-child transmission can be reduced if the infected mother takes special drugs during pregnancy. Knowledge of prevention of mother-to-child transmission of HIV/AIDS increases with women’s educational attainment.
Attitudes towards People Living with HIV/AIDS
Many people in Somalia believe that HIV/AIDS is a disease for people who have committed bad deeds. Extensive stigma and discrimination against people living with HIV/AIDS adversely affects both people’s willingness to be tested and their adherence to ART. For instance, people may hesitate to take an HIV test because they are afraid of how other people will react if they find out the test result is positive.
Indeed, HIV/AIDS-related stigma and discrimination undermine HIV/AIDS prevention as they stop people from seeking information about how to reduce their risk of exposure to HIV/AIDS and adopt safer
behaviour, as they believe such inquiries may raise suspicion about their status. Tackling the stigma and discrimination is thus an important factor for the success of programmes targeting HIV/AIDS prevention and control.
In the SHDS 2020, both ever-married and never-married women who had heard of HIV/AIDS were asked several questions to assess the level of stigma associated with HIV/AIDS. Respondents were asked about their willingness or unwillingness to take care of a member of their family with HIV/AIDS in their own household, to buy vegetables from an infected shopkeeper or vendor, and to let others know the HIV/AIDS status of family members.
Table 8.4 presents data for women aged 15-49 who have heard of HIV/AIDS and their attitudes towards people living with HIV/AIDS, by background characteristics. It shows that 56 percent of women think that children living with HIV/AIDS should not attend school with children who are not infected by HIV/AIDS. Sixty-two percent of the women said they would not buy fresh vegetables from a shopkeeper who is HIV positive. Further, the table shows that 48 percent of the respondents had discriminatory attitudes towards people living with HIV/AIDS.
Stigma against people with HIV/AIDS is higher
Percent of women aged 15-49 with discriminatory attitudes towards people living with HIV/AIDS
Percent of women aged 15-49 with discriminatory attitudes towards people living with HIV/AIDS
50.6
45.3
38.3
28.8
No Education Primary Secondary Higher
44.9
46.7
48.4 48.8
50.6
42.0
43.0
44.0
45.0
46.0
47.0
48.0
49.0
50.0
51.0
52.0
15-19 20-24 25-29 30-39 40-49
Figure 8.2 Discriminatory attitudes towards people living with HIV/AIDS by education
Figure 8.3 Discriminatory attitudes towards people living with HIV/AIDS by age

179
among people in the rural households, those with no education and people of low-income backgrounds.
The data also shows that the discriminatory attitudes towards people with HIV/AIDS decrease as educational levels increase. This means that those who had no education had more negative attitudes towards people with HIV/AIDS, compared to those with higher levels of education. It also shows that the negative attitudes towards people with HIV/AIDS increase with age (Figure 8.2 and 8.3).
Self-reporting of Sexually Transmitted Infections
The SHDS 2020 collected information about sexually transmitted infections or symptoms of an STI. Ever-married women aged 15-49 were asked whether they had a sexually transmitted infection or symptoms (bad smell, abnormal discharge from the vagina, or a genital sore or ulcer) in the 12 months prior to the survey.
Table 8.5 shows the self-reported prevalence of STIs and STI symptoms. Only 8 percent of ever-married women reported that they had an STI in the 12 months preceding the survey, 8 percent had a bad smell, or an abnormal discharge, and 5 percent had a genital sore or ulcer. In total, 12 percent of women reported having an STI/genital discharge/sore or ulcer as symptoms.
Variations in self-reported prevalence of STIs and STI symptoms by background characteristics are also presented in Table 8.5. The prevalence of STIs or STI symptoms is higher among currently married women than those who are divorced/separated or widowed. The prevalence varies only slightly by age, education, and wealth quintile. The prevalence of STIs is almost twice as high in the urban and rural women, as compared to nomadic women.
Table 8.6 and Figure 8.4 show the percentage of women in the 15-49 age group reporting an STI or symptoms of an STI in the 12 months preceding the survey and who sought advice or treatment. The figure shows that 70 percent of the ever-married women who had an STI or STI symptoms did not seek advice or treatment when they presented symptoms. Twenty-seven percent of ever-married women who had an STI/STI symptoms sought advice from the public health sector and 14 percent got advice from the private sector. Only a few women sought advice or treatment from other sources.
70.1
27.2
13.7
0.3
No advice or treatment
Public sector
Private sector
Other sources
Percent of women aged 15-49 reporting an STI or symptoms of an STI in the past 12 months who sought advice or treatment
Figure 8.4 Source of advice or treatment for STIs

27 percent of women reported that HIV/AIDS cannot be transmitted through mosquito bites and 38 percent of the women knew that the HIV/AIDS cannot be transmitted by supernatural means

©A
U U
N I
ST P
HO
TO
/To
bin
Jo
nes

The Somali Health and Demographic Survey182
Percentage of women aged 15-49 who had heard about HIV/AIDS by background characteristics, SHDS 2020
Background characteristicsPercentage of women who had
ever heard about HIV/AIDS Number of women
Age
15-19 60.3 4,649
20-24 69.0 2,906
25-29 67.5 2,918
30-39 69.0 4,142
40-49 68.9 1,822
Type of residence
Urban 81.2 6,478
Rural 69.2 4,822
Nomadic 44.6 5,138
Education
No education 59.5 12,266
Primary 81.8 2,531
Secondary 91.5 1,214
Higher 96.1 427
Wealth quintile
Lowest 49.7 3,471
Second 50.3 2,917
Middle 66.2 3,047
Fourth 77.0 3,452
Highest 85.2 3,551
Total 15-49 66.3 16,438
List of Tables
Table 8.1 Knowledge of HIV/AIDS
Table 8.1 Knowledge of HIV/AIDS 182
Table 8.2 Comprehensive knowledge about HIV/AIDS 183
Table 8.3 Knowledge of prevention of mother-to-child transmission of HIV/AIDS 184
Table 8.4 Discriminatory attitudes Towards people living with HIV/AIDS 185
Table 8.5 Self-reported prevalence of sexually transmitted infections (STIs) and STI symptoms 186
Table 8.6 Source of advice or treatment for STIs 187
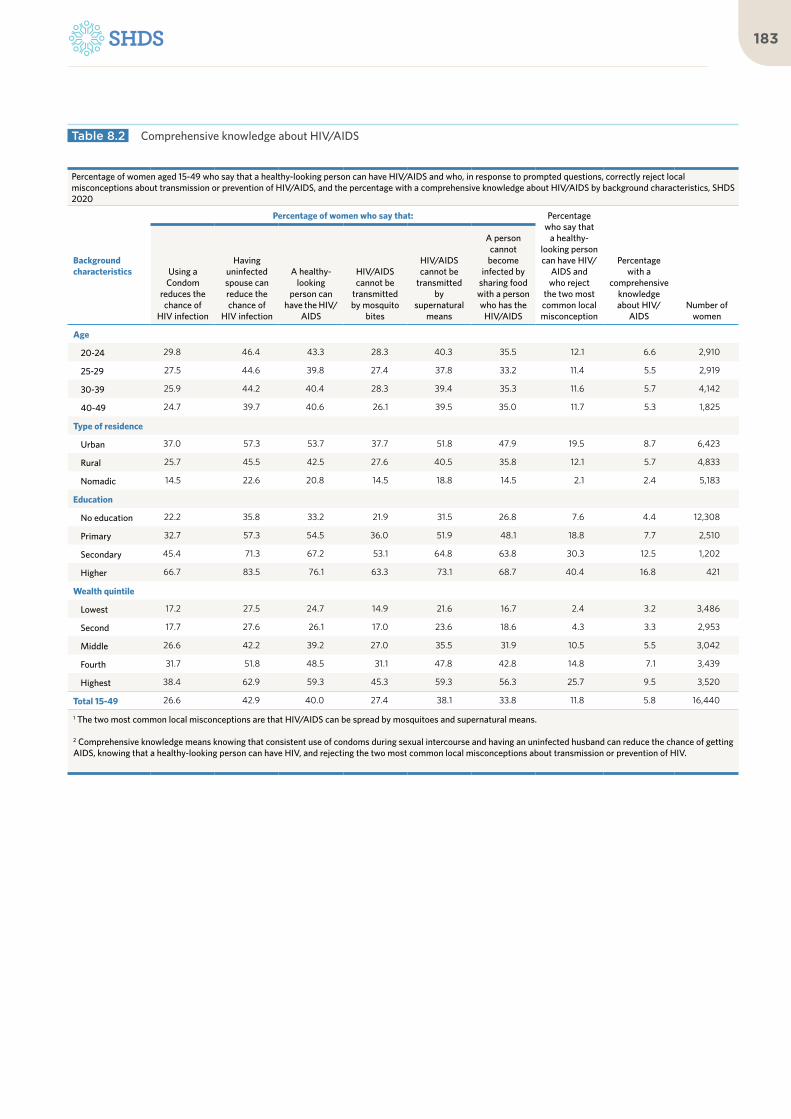
183
Table 8.2 Comprehensive knowledge about HIV/AIDS
Percentage of women aged 15-49 who say that a healthy-looking person can have HIV/AIDS and who, in response to prompted questions, correctly reject local misconceptions about transmission or prevention of HIV/AIDS, and the percentage with a comprehensive knowledge about HIV/AIDS by background characteristics, SHDS 2020
Background characteristics
Percentage of women who say that: Percentage who say that
a healthy-looking person can have HIV/
AIDS and who reject
the two most common local misconception
Percentage with a
comprehensive knowledge about HIV/
AIDSNumber of
women
Using a Condom
reduces the chance of
HIV infection
Having uninfected spouse can reduce the chance of
HIV infection
A healthy-looking
person can have the HIV/
AIDS
HIV/AIDS cannot be
transmitted by mosquito
bites
HIV/AIDS cannot be
transmitted by
supernatural means
A person cannot
become infected by
sharing food with a person who has the
HIV/AIDS
Age
20-24 29.8 46.4 43.3 28.3 40.3 35.5 12.1 6.6 2,910
25-29 27.5 44.6 39.8 27.4 37.8 33.2 11.4 5.5 2,919
30-39 25.9 44.2 40.4 28.3 39.4 35.3 11.6 5.7 4,142
40-49 24.7 39.7 40.6 26.1 39.5 35.0 11.7 5.3 1,825
Type of residence
Urban 37.0 57.3 53.7 37.7 51.8 47.9 19.5 8.7 6,423
Rural 25.7 45.5 42.5 27.6 40.5 35.8 12.1 5.7 4,833
Nomadic 14.5 22.6 20.8 14.5 18.8 14.5 2.1 2.4 5,183
Education
No education 22.2 35.8 33.2 21.9 31.5 26.8 7.6 4.4 12,308
Primary 32.7 57.3 54.5 36.0 51.9 48.1 18.8 7.7 2,510
Secondary 45.4 71.3 67.2 53.1 64.8 63.8 30.3 12.5 1,202
Higher 66.7 83.5 76.1 63.3 73.1 68.7 40.4 16.8 421
Wealth quintile
Lowest 17.2 27.5 24.7 14.9 21.6 16.7 2.4 3.2 3,486
Second 17.7 27.6 26.1 17.0 23.6 18.6 4.3 3.3 2,953
Middle 26.6 42.2 39.2 27.0 35.5 31.9 10.5 5.5 3,042
Fourth 31.7 51.8 48.5 31.1 47.8 42.8 14.8 7.1 3,439
Highest 38.4 62.9 59.3 45.3 59.3 56.3 25.7 9.5 3,520
Total 15-49 26.6 42.9 40.0 27.4 38.1 33.8 11.8 5.8 16,440
1 The two most common local misconceptions are that HIV/AIDS can be spread by mosquitoes and supernatural means.
2 Comprehensive knowledge means knowing that consistent use of condoms during sexual intercourse and having an uninfected husband can reduce the chance of getting AIDS, knowing that a healthy-looking person can have HIV, and rejecting the two most common local misconceptions about transmission or prevention of HIV.

The Somali Health and Demographic Survey184
Percentage of women aged 15-49 who know that HIV/AIDS can be transmitted from mother to child by breastfeeding and that the risk of mother-to-child transmission (MTCT) of HIV/AIDS can be reduced by the mother taking special drugs during pregnancy, by background characteristics, SHDS 2020
Background characteristics
Percentage who know that HIV/AIDS can be transmitted from mother to child
Percentage who know that the
risk of MTCT can be reduced by mother taking special drugs
Number of women
During pregnancy During delivery By breastfeeding
By all three means
Age
15-19 38.7 40.5 44.2 32.2 28.9 4,649
20-24 44.1 48.1 50.0 37.1 34.3 2,906
25-29 43.7 45.4 45.0 36.1 30.5 2,918
30-39 45.0 48.7 48.3 38.6 30.7 4,142
40-49 46.4 49.1 48.0 39.1 29.2 1,822
Type of residence
Urban 44.1 47.0 47.8 36.8 31.8 10,422
Rural 43.0 46.2 47.3 36.8 29.6 4,132
Nomadic 36.8 37.7 40.0 31.1 26.0 1,884
Education
No education 37.8 39.5 40.2 32.2 25.0 12,266
Primary 54.4 59.4 61.9 44.9 41.3 2,531
Secondary 63.4 68.5 70.5 50.7 52.5 1,214
Higher 65.7 77.9 79.0 56.8 67.8 427
Total 15-49 43.0 45.7 46.8 36.1 30.6 16,438
Table 8.3 Knowledge of prevention of mother-to-child transmission of HIV/AIDS
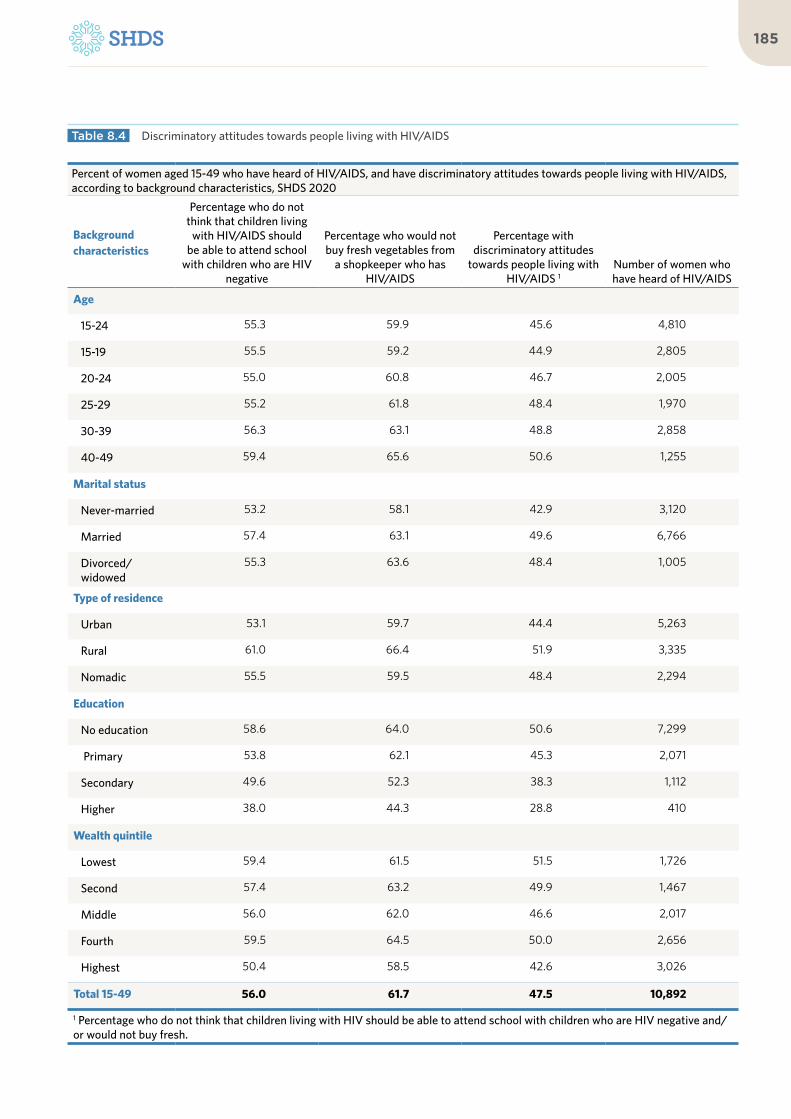
185
Percent of women aged 15-49 who have heard of HIV/AIDS, and have discriminatory attitudes towards people living with HIV/AIDS, according to background characteristics, SHDS 2020
Background characteristics
Percentage who do not think that children living
with HIV/AIDS should be able to attend school
with children who are HIV negative
Percentage who would not buy fresh vegetables from
a shopkeeper who has HIV/AIDS
Percentage with discriminatory attitudes
towards people living with HIV/AIDS 1
Number of women who have heard of HIV/AIDS
Age
15-24 55.3 59.9 45.6 4,810
15-19 55.5 59.2 44.9 2,805
20-24 55.0 60.8 46.7 2,005
25-29 55.2 61.8 48.4 1,970
30-39 56.3 63.1 48.8 2,858
40-49 59.4 65.6 50.6 1,255
Marital status
Never-married 53.2 58.1 42.9 3,120
Married 57.4 63.1 49.6 6,766
Divorced/widowed
55.3 63.6 48.4 1,005
Type of residence
Urban 53.1 59.7 44.4 5,263
Rural 61.0 66.4 51.9 3,335
Nomadic 55.5 59.5 48.4 2,294
Education
No education 58.6 64.0 50.6 7,299
Primary 53.8 62.1 45.3 2,071
Secondary 49.6 52.3 38.3 1,112
Higher 38.0 44.3 28.8 410
Wealth quintile
Lowest 59.4 61.5 51.5 1,726
Second 57.4 63.2 49.9 1,467
Middle 56.0 62.0 46.6 2,017
Fourth 59.5 64.5 50.0 2,656
Highest 50.4 58.5 42.6 3,026
Total 15-49 56.0 61.7 47.5 10,892
1 Percentage who do not think that children living with HIV should be able to attend school with children who are HIV negative and/or would not buy fresh.
Table 8.4 Discriminatory attitudes towards people living with HIV/AIDS

The Somali Health and Demographic Survey186
Among ever-married women aged 15-49 the percentage reporting having an STI and/or symptoms of an STI in the 12 months preceding the survey, by background characteristics, SHDS 2020
Background characteristics
Percentage of respondents who reported having an STI or related symptoms in the past 12 months:
Number of ever-married womenSTI
Bad-smelling/ abnormal genital
discharge Genital sore or ulcer
STI/genital discharge/sore or
ulcer
Age
15-19 5.6 5.8 2.8 9.3 973
20-24 7.7 7.4 4.2 11.3 2,119
25-29 8.5 8.3 4.4 12.1 2,728
30-39 8.9 9.4 5.5 13.4 4,041
40-49 6.2 8.9 5.4 12.0 1,799
Marital status
Married 8.1 8.5 5.0 12.3 10,215
Divorced/separated/widowed
6.8 7.7 3.3 11.0 1,445
Type of residence
Urban 9.5 11.8 7.4 16.7 4,161
Rural 9.0 9.2 5.3 12.9 3,509
Nomadic 5.2 4.2 1.5 6.8 3,989
Education
No education 7.5 8.1 4.5 11.5 9,757
Primary 10.0 9.8 6.0 15.2 1,367
Secondary 11.3 10.9 5.8 15.6 375
Higher 8.4 12.8 7.0 16.2 161
Wealth quintile
Lowest 6.3 5.8 2.8 8.8 2,733
Second 6.5 5.7 2.9 8.6 2,310
Middle 10.3 9.6 5.4 14.3 2,159
Fourth 9.3 11.0 6.1 15.1 2,356
Highest 7.6 10.8 7.3 15.0 2,101
Total 15-49 7.9 8.4 4.8 12.2 11,660
Table 8.5 Self-reported prevalence of sexually transmitted infections (STIs) and STI symptoms

187
Percentage of ever-married women aged 15-49 reporting an STI or symptoms of an STI in the past 12 months who sought advice or treatment, SHDS 2020
Background characteristics Percentage of women
Public sector 27.2
Government hospital 10.4
Referral health center 2.3
MCH/HC 15.6
Primary Health Unit (PHU) 0.8
Mobile clinic 0.5
Other public sector 0.1
Private 13.7
Private hospital/doctor/clinic 9.7
Pharmacy 4.2
Other private medical sector 0.2
Other sources 0.3
No advice or treatment 70.1
Number with STIs or symptoms of STIs 1,417
Number of women 1,417
Note: The categories are not mutually exclusive and the sum of percentages may exceed 100 percent.
Table 8.6 Source of advice or treatment for STIs

09Gender-Based Violence

©A
U U
N I
ST P
HO
TO
/To
bin
Jo
nes

KEY FINDINGS
8%experienced physical violence in the last 12 months preceding the survey
EXPERIENCE OF PHYSICAL VIOLENCE
14%of women aged 15-49 have experienced physical violence since the age of 12
SPOUSALVIOLENCE
12%of ever-married women aged 15-49 have experienced physical violence
HELP-SEEKING BEHAVIOUR
17%women who experienced spousal violence and sought help
VIOLENCE DURING PREGNANCY
6%of the ever-married women aged 15-49 who have been pregnant have experienced physical violence during one or more pregnancies
INJURIES DUE TO SPOUSAL VIOLENCE
35%of the ever-married women aged 15-49 have sustained some form of injury in the 12 months preceding the survey
Among those who have experienced spousal violence
The Somali Health and Demographic Survey192
In 2015, the UN General
Assembly adopted 17 Sustainable
Developments Goals (SDGs),
including Goal 5, which calls for
the elimination of all forms of
violence and discriminatory acts
against women and girls.
Violence against women can be described as a violation of human rights, and a form of discrimination against women, resulting in physical, sexual, psychological and economic harm. It may lead to depression, anxiety disorders, post-traumatic stress disorder, permanent injuries, sleeplessness and, sometimes, death. Over the years, Somali women have overlooked some forms of violence as norms, as is the case for women in many countries.
Measurements of Violence The SHDS 2020 had sections designated for the collection of information on domestic violence and other forms of discrimination against women. Information was obtained
from ever-married women and never-married women aged 15-49 who were either usual residents, or guests who slept in the house the night preceding the day of the interview.
Enumerators asked the respondents questions on their opinions regarding the definition of domestic violence, opinions on the most common perpetrators of violent acts against women, experiences of violence, whether physical, sexual or emotional, perpetrators of physical violence. They also asked respondents about their experience of violence during pregnancy, spousal violence, injuries due to spousal violence, and help-seeking behaviours for those who have experienced violence.
Specifically, the SHDS asked never-married and ever-married women about physical violence perpetuated on them. The survey also measured sexual and emotional violence committed by the current spouse (for currently married women) and by the most recent spouse (for divorced or widowed women).
The collection of data on GBV is often marred by under-reporting due to the culture of silence around the topic. In order to encourage disclosure, respondents were asked about any experiences they have had with specific acts of violence. This ensured there were no misunderstandings on the meaning of
9 G E N D E R - B A S E D V I O L E N C E

193
‘violence’ among respondents.
The following set of questions were asked to the respective respondents. ‘Did the perpetrator ever:’
Physical violence: push you, shake you, or throw something at you; kick you, drag you, or beat you up; try to choke you or burn you on purpose; or threaten or attack you with a knife, gun, or any other weapon.
Sexual violence: physically force you to have sexual intercourse with him even when you did not want to, physically force you to perform any other sexual acts you did not want to, force you with threats or in any other way to perform sexual acts you did not want to, in the last 12 months preceding the survey, or physically force you to have sexual intercourse.
Emotional violence: say or do something to humiliate you in front of others, threaten to hurt or harm you or someone close to you, or insult you or make you feel bad about yourself.
In the SHDS 2020, women were asked questions regarding sexual spousal violence acts. These questions were not asked to never-married women, because the questions would be seen as anomalous given the cultural context in Somalia.
Ethical Considerations in SHDS
Ensuring the confidentiality and privacy of respondents was obligatory for the enumerators during and after the SHDS 2020 interviews. All enumerators were provided rigorous training sessions on how to build a rapport with the respondents, make a good impression, obtain respondents’ consent, assure them about the confidentiality of the interview, and ensure that the respondents were interviewed alone. In addition to the general training sessions, efforts were made to continuously remind the enumerators about the need to ensure the complete privacy of respondents.
Moreover, for the GBV section, enumerators had to seek consent and explain to the respondents the aim of the survey and context, before each interview began. Respondents were informed about the use of information collected, and that the outcome of the survey would be used to inform policies and formulate programmes that address the identified gaps and needs in Somali women’s lives.
The women interviewed for this section were only eligible when their privacy was completely secured. This was to avoid any repercussions to the respondent and interviewer, given the sensitivity of the subject in the Somali cultural context. In addition, the enumerators (midwives and medical practitioners) who collected this information from respondents were all women to minimize any sensitivities involved and ensure respondents felt comfortable discussing this topic.
Opinions about Domestic ViolenceThe SHDS 2020 asked all women about their opinions about domestic violence. Specifically, they were asked whether domestic violence means:
The collection of data on GBV is often marred by under-reporting due to the culture of silence around the topic

The Somali Health and Demographic Survey194
| Physical abuse | No participation in household decision-
making | No participation in decision-making
regarding children | Better treatment of males than females | Failure to meet basic living costs | Denial of education | Forced marriage | Rape | Sexual harassment | Forced labour
Table 9.1 presents the percentage of women aged 15-49 who understand domestic violence to mean specific acts according to their background characteristics. Findings show that over half of Somali women believed that most specified acts asked about constituted domestic violence. Over 60 percent of women considered physical abuse, denial of education, forced marriage, rape, sexual harassment, forced labour and forms of domestic violence.
Women from urban areas have a better understanding of acts that mean domestic violence compared to women from rural and nomadic areas. Less than half of nomadic
women believe that no participation in household decision-making, no participation in decision-making for children, better treatment of males than females, failure to meet basic living costs and denial of education constitute acts of domestic violence (45 percent, 46 percent, 46 percent, 43 percent and 49 percent respectively).
As shown in Figure 9.1, never-married women have a better understanding of acts that constitute domestic violence compared to currently married women.
Educational attainment plays a role in the understanding of domestic violence. Women with higher education generally have a better understanding of acts that constitute domestic violence than women with no education, primary or secondary education.
66.6
60.3
59.8
60.8
54.6
70.8
74.5
74.9
68.5
72.2
60.7
51.3
52.9
52.0
47.5
58.2
62.1
59.7
57.9
60.9
Physical abuse
No participation in household decision-making
No participation in decision making for children
Better treatment of males than females
Failing to meet basic living costs
Denial of education
Forced Marriage
Rape
Sexual harassment
Forced labour
Married Never-married
Percent of women aged 15-49 who understand domestic violence to mean various specified acts, according to marital status
Figure 9.1 Acts that mean domestic violence
Educational attainment plays a role in the understanding of domestic violence

195
Women’s Experience of Physical Violence
Table 9.2 presents women (15-49 years of age) who had experienced physical violence since the age of 12 and those that reported they experienced physical violence in the 12 months preceding the survey. It shows that 14 percent of women aged 15-49 have experienced physical violence since the age of 12, while 8 percent reported they had experienced physical violence in the 12 months preceding the survey.
Younger women are more likely to experience physical violence; with 16 percent of women in the 15-19 age group reporting they had experienced violence since the age of 12 and 10 percent in the same age group reporting they experienced violence in the 12 months preceding the survey. Among older women aged 45-49, 11 percent reported they had experienced physical violence since the age of 12, while 4 percent reported they had experienced physical violence in the 12 months preceding the survey. The likelihood of
experiencing physical violence does not vary by age (Figure 9.2).
Physical violence is highest among urban women at 18 percent and lowest among nomadic women at 11 percent.
Perpetrators of Physical ViolenceTable 9.3 shows the opinions of women aged 15-49 regarding who they believe are the most common perpetrators of violence against women. More than half (59 percent) of women believe that husbands commit the most violent acts against women in the community, and that daughters and sons commit the least violent acts.
Younger women are more likely to experience physical violence
15.9
14.4 14.7
12.713.4
14.5
10.9
14.4
10.4
7.17.6
5.54.9
7.5
3.8
7.6
15-19 20-24 25-29 30-34 35-39 40-44 45-49 Total
Age
since age 12 last 12 months preceding the survey
Percent of women aged 15-49 who have ever experienced physical violence since age 12 and percentage who have experienced violence during the 12 months preceding the survey by age
Figure 9.2 Physical Violence


More than half of women believe that husbands commit the most violent acts against women in the community

The Somali Health and Demographic Survey198
As part of the survey, women aged 15-49 who had experienced physical violence since the age of 12 were asked who committed the acts of violence against them. Respondents could report multiple perpetrators based on their experience. As presented in Table 9.4, among ever-married women who had experienced physical violence, the most common perpetrator was the husband, as reported by 62 percent of women. Twenty-three percent of ever-married women stated that the mother/stepmother had committed the acts of violence against them.
Among never-married women, 34 percent had experienced physical violence perpetrated by a relative that is not an immediate family member and 29 percent reported perpetrators were their mothers/stepmothers. Nineteen percent indicated they were hit, kicked, slapped etc. by their fathers/stepfathers. Teachers were reported as perpetrators of violence by 12 percent.
Violence during PregnancyEver-married women who had been pregnant before were asked about their experiences of physical violence during pregnancy. Specifically, they were asked whether anyone had ever hit, slapped, kicked or done anything else that hurt them physically.
Table 9.5 presents the findings on ever-married women aged 15-49 who had experienced violence during pregnancy. It shows that 6 percent of the ever-married women aged 15-49 who had been pregnant reported they had experienced physical violence during their pregnancies. Ten percent of currently-divorced women reported they had experienced violence during pregnancy. Women in urban areas reported they experienced more violence during pregnancy (9 percent) than rural and nomadic women (5 percent and 4 percent respectively).
Interestingly, more women in the highest wealth quintile reported having experienced violence during pregnancy (8 percent) compared to women in the lowest wealth quintile (2 percent). However, there is a need for further analysis to better understand the correlation between violence during pregnancy and socioeconomic factors.
Spousal Violence
Table 9.6 presents spousal violence experienced by ever-married women aged 15-49 who reported emotional, physical or sexual violence perpetrated by their current or most recent husband in the 12 months preceding the survey. Twelve percent of ever-married women reported physical violence perpetrated against them by a spouse, while 4 percent reported emotional abuse by a spouse. The patterns of spousal violence vary with the number of children a woman has. Six percent of women with five or more children reported spousal violence compared to 2 percent of women with no children. Women from urban areas reported they experienced more spousal violence than women in rural and nomadic areas (20 percent, 14 percent and 11 percent, respectively).
Injuries to Women due to Spousal ViolenceTable 9.7 presents findings among ever-married women aged 15-49 who had sustained injuries due to domestic violence committed by their current or most recent spouses. Thirty-five percent of the women had sustained at least one of the three types of injuries referred to in the table. Among ever-married women aged 15-49 who had experienced any violence, 26 percent reported they had cuts, bruises or aches; 19 percent had eye injuries, dislocations, sprains or burns; and 18 percent had deep wounds, broken bones or teeth, or any other serious wounds as a result of spousal violence.

199
17.8
19.4
26.3
35.0
Deep wounds, broken bones, broken teeth, or any otherserious injury
Eye injuries, sprains, dislocations, or burns
Cuts, bruises, or aches
Any injury
Percent of ever-married women aged 15-49 who have experienced specific types of spousal violence by types of injuries resulting from the violence
Figure 9.3 : Injuries to women due to spousal violence
Help-seeking Behaviours
Help-seeking behaviours refer to women’s responses to their experiences of violence committed by anyone. The SHDS interviewers inquired whether women who had been subjected to violence had sought any help. Table 9.8 shows that only 17 percent of ever-married women aged 15-49 who had experienced emotional, physical or sexual violence had sought help, while 83 percent did not seek any help. The table further shows that women experiencing physical violence only were more likely to seek help (15 percent) compared to those who experienced sexual violence only (4 percent).
More women who had been previously married sought help in comparison to those who were
currently married (26 percent and 16 percent, respectively). Furthermore, women currently in employment sought more help than those not in employment (24 percent and 16 percent respectively).
Urban women sought more help than rural and nomadic women (23 percent, 12 percent and 10 percent respectively).
There is no apparent pattern on help-seeking based on age of the woman, education or wealth status. This is an area that can be investigated further.

The Somali Health and Demographic Survey200
Table 9.1 Acts that mean domestic violence
Percentage of all women aged 15-49 who understand domestic violence to mean various specified acts, by background characteristics, SHDS 2020
Background character-istics
Acts that mean domestic violence
Physical abuse
No partic-ipation in decision
making for household
No participa-tion in deci-sion making for children
Better treat-ment of
males than females
Failing to meet ba-sic living
costs
Denial of educa-
tionForced
Marriage Rape
Sexual harass-
mentForced labour Other
Number of women
Age
15-19 64.7 57.1 56.7 58.8 53.0 66.9 71.0 70.7 65.1 69.3 4.0 4,649
20-24 63.9 55.2 56.5 55.5 50.8 62.8 67.0 66.6 63.0 65.5 6.4 2,906
25-29 62.1 52.6 53.8 53.3 48.7 59.6 63.7 60.7 58.0 61.6 6.4 2,918
30-34 60.1 50.4 51.9 49.4 45.0 58.1 60.7 58.6 58.2 59.9 5.0 2,195
35-39 59.9 52.3 53.8 52.3 47.4 58.1 61.7 58.4 57.0 60.0 4.8 1,948
40-44 58.6 51.2 53.1 51.6 46.7 58.4 63.0 58.2 57.9 60.8 3.6 1,176
45-49 59.7 50.8 52.8 51.3 47.2 60.7 61.0 61.5 60.6 61.8 6.8 646
Type of res-idence
Urban 67.2 59.5 60.2 60.8 53.0 69.8 72.5 70.1 66.0 69.1 6.7 6,478
Rural 63.8 55.4 56.5 55.3 51.6 64.4 66.0 64.2 61.9 64.5 5.2 4,822
Nomadic 54.6 45.3 46.2 45.5 42.9 49.3 56.4 55.7 53.6 57.1 3.2 5,138
Marital status
Never-married
66.6 60.3 59.8 60.8 54.6 70.8 74.5 74.9 68.5 72.2 5.0 4,779
Married 60.7 51.3 52.9 52.0 47.5 58.2 62.1 59.7 57.9 60.9 5.0 10,215
Divorced 60.8 51.8 53.4 51.6 47.0 58.9 62.9 59.2 59.6 60.6 6.6 970
Widowed 56.0 47.4 47.0 48.1 44.3 53.9 55.2 51.7 52.4 54.6 5.9 475
Education
No edu-cation
59.6 50.8 52.0 51.5 47.4 58.0 62.3 60.6 58.3 61.4 4.7 12,266
Primary 68.7 60.2 61.4 61.4 53.8 70.9 72.9 72.2 67.1 70.3 6.1 2,531
Second-ary
72.1 66.4 65.2 64.8 57.7 77.1 79.0 75.8 69.9 73.2 6.5 1,214
Higher 74.7 68.0 64.0 67.8 57.5 74.6 77.4 75.8 72.1 75.1 8.8 427
Wealth quintile
Lowest 62.4 52.2 53.4 52.5 49.6 58.5 64.7 64.6 61.1 65.7 3.9 3,471
Second 53.7 45.6 46.4 46.7 43.6 50.4 55.5 54.4 52.9 55.8 3.6 2,917
Middle 62.1 54.6 55.6 54.9 50.2 62.4 65.4 62.6 60.1 62.6 4.5 3,047
Fourth 64.6 55.7 56.6 56.8 51.5 65.0 67.7 64.7 62.0 63.6 5.7 3,452
Highest 67.2 59.7 60.5 59.8 51.5 70.8 72.7 71.3 67.0 70.6 7.7 3,551
Total 62.3 53.8 54.8 54.4 49.4 61.8 65.5 63.9 60.9 64.0 5.2 16,438
List of Tables
Table 9.1 Acts that mean domestic violence 198
Table 9.2 Experience of physical violence 199
Table 9.3 Opinions regarding the most common perpetrator of violent acts against women 200
Table 9.4 Persons committing physical violence 201
Table 9.5 Experience of violence during pregnancy 201
Table 9.6 Spousal violence by background characteristics 202
Table 9.7 Injuries to women due to spousal violence 203
Table 9.8 Help-seeking to stop violence 204

201
Percentage of women aged 15-49 who have ever experienced physical violence since age 12 and percentage who have experienced violence during the 12 months preceding the survey, by background characteristics, SHDS 2020
Background characteristics
Percentage who have ever
experienced physical violence
since age 12
Percentage who have experienced physical violence in the past 12 months
Number of womenOften Sometimes
Often or sometimes
Age
15-19 15.9 5.8 4.6 10.4 4,649
20-24 14.4 3.5 3.6 7.1 2,906
25-29 14.7 4.1 3.5 7.6 2,918
30-34 12.7 2.7 2.8 5.5 2,195
35-39 13.4 2.3 2.6 4.9 1,948
40-44 14.5 3.7 3.8 7.5 1,176
45-49 10.9 2.5 1.2 3.8 646
Type of residence
Urban 17.7 4.5 4.8 9.3 6,478
Rural 13.9 4.1 2.9 7.0 4,822
Nomadic 10.8 3.2 2.7 5.9 5,138
Marital status
Never-Married 16.1 6.3 4.9 11.2 4,779
Married 14.0 3.2 3.1 6.3 10,215
Divorced 14.2 2.0 3.2 5.1 970
Widowed 6.5 1.2 0.8 2.0 475
Education
No education 13.8 3.7 3.4 7.1 12,266
Primary 18.6 5.2 4.7 9.8 2,531
Secondary 12.6 3.7 3.1 6.8 1,214
Higher 14.0 4.9 3.8 8.7 427
Wealth quintile
Lowest 10.0 3.3 2.0 5.3 3,471
Second 13.9 3.3 3.6 7.0 2,917
Middle 19.0 5.3 5.3 10.7 3,047
Fourth 14.0 3.8 3.2 7.0 3,452
Highest 15.7 4.2 3.9 8.1 3,551
Total 14.4 4.0 3.6 7.6 16,438
Table 9.2 Experience of physical violence

The Somali Health and Demographic Survey202
Percent distribution of all women according to the person who, in their opinion, is the most common perpetrator of violent acts against women, by background characteristics, SHDS 2020
Background characteristics
Individual who commits the most violent acts against women
Husband
Mother/Step
mother
Father/Step-father
Sister/Brother
Daughter/Son
Other Relative In-laws Teacher
Employer/Someone at work
Police/ A soldier
Total number of women
Age
15-19 61.5 19.7 20.3 10.0 3.6 17.7 4.6 9.5 4.2 9.0 4,649
20-24 58.9 17.1 18.3 6.8 1.8 14.2 5.3 6.9 4.0 7.6 2,906
25-29 58.8 16.2 16.2 5.8 1.6 14.3 4.8 4.9 3.2 6.4 2,918
30-34 56.8 13.4 15.9 5.7 1.6 12.5 4.6 5.4 3.1 6.0 2,195
35-39 54.7 15.0 14.6 5.6 1.1 12.9 3.2 5.2 2.8 5.7 1,948
40-44 57.5 12.0 16.7 5.8 1.3 13.1 3.5 3.5 3.1 5.1 1,176
45-49 55.0 11.2 14.9 5.6 1.1 13.2 4.6 4.5 2.5 5.3 646
Type of
residence
Urban 64.0 18.3 19.2 8.4 2.4 13.8 5.2 9.6 4.1 9.1 6,478
Rural 58.9 15.0 17.3 7.3 1.9 14.7 3.9 5.3 3.7 7.4 4,822
Nomadic 51.4 15.3 15.5 5.4 1.8 15.8 4.2 3.9 2.6 4.3 5,138
Marital status
Never-married
63.9 20.7 20.5 10.8 3.5 17.1 5.4 10.7 5.1 9.9 4,779
Married 56.4 14.6 16.4 5.6 1.6 14.0 4.2 4.8 2.9 5.8 10,215
Divorced 58.8 15.1 15.8 5.7 1.2 11.3 3.9 5.9 2.7 6.3 970
Widowed 51.1 13.4 15.0 7.4 1.1 12.0 3.0 3.7 3.2 8.1 475
Education
No education 56.9 15.9 16.6 6.8 2.1 15.1 4.4 5.4 3.2 6.2 12,266
Primary 63.4 18.5 20.6 8.0 1.9 13.1 4.7 8.8 3.3 8.1 2,531
Secondary 62.7 16.2 19.0 8.2 2.4 15.5 4.6 11.3 6.5 11.6 1,214
Higher 65.5 19.1 20.9 8.9 2.6 10.0 6.3 13.5 5.1 12.6 427
Wealth quintile
Lowest 55.6 15.8 16.1 5.5 2.0 18.4 5.6 4.3 3.1 4.4 3,471
Second 55.0 15.4 15.3 5.9 1.2 14.6 2.5 3.1 2.7 5.4 2,917
Middle 59.7 16.6 19.2 8.6 2.3 14.0 4.8 6.8 2.8 9.7 3,047
Fourth 60.5 17.5 17.6 7.5 2.4 14.2 4.8 9.1 3.8 8.1 3,452
Highest 61.6 16.4 19.0 8.1 2.4 12.2 4.6 9.0 4.9 7.9 3,551
Total 58.6 16.4 17.5 7.1 2.1 14.7 4.5 6.6 3.5 7.1 16,438
Table 9.3 Opinions regarding the most common perpetrator of violent acts against women

203
Among women aged 15-49 who have experienced physical violence since age 12, percentage who report specific persons committed the violence according to the respondents’ current marital status, SHDS 2020
Background characteristics Ever-married Never-married
Persons committing violence
Husband 61.8 n/a
Mother/stepmother 23.1 28.6
Father/stepfather 9.5 18.9
Sister/brother 10.0 15.6
Daughter/son 0.8 n/a
Other relative 7.7 33.6
Mother-in-law 1.0 n/a
Father-in-law 0.2 n/a
Other in-law 0.3 n/a
Neighbour 7.3 4.3
Teacher 0.5 12.4
Employer/someone at work
3.2 0.9
Police/soldier 0.8 0.0
Militia/gangs 0.5 0.0
Other 2.6 0.0
Number of women 1,597 383
n/a- not applicable
Among ever-married women aged 15-49 who have ever been pregnant, percentage who have ever experienced physical violence during pregnancy, by background characteristics, SHDS 2020
Background characteristics
Percentage who have
experienced violence during
pregnancyTotal number
of Women
Age
15-19 7.0 755
20-24 6.5 1,648
25-29 4.9 2,048
30-34 5.5 1,533
35-39 5.8 1,385
40-44 4.5 856
45-49 7.0 462
Type of residence
Urban 8.5 3,302
Rural 4.6 2,684
Nomadic 3.5 2,700
Marital status
Married 5.4 7,628
Divorced 9.9 717
Widowed 4.2 341
Education
No education 5.4 7,188
Primary 8.4 1,086
Secondary 3.2 291
Higher 3.7 121
Wealth quintile
Lowest 2.3 2,043
Second 6.3 1,597
Middle 7.9 1,643
Fourth 5.4 1,800
Highest 7.5 1,603
Total 5.7 8,687
Table 9.4 Persons committing physical violence Table 9.5 Experience of violence during pregnancy

The Somali Health and Demographic Survey204
Percentage of ever-married women aged 15-49 who have ever experienced emotional, physical or sexual violence committed by their husband, by background characteristics, SHDS 2020
Background characteristics Physical
violenceSexual
violenceEmotional
abuse
Physical and
sexual violence
Physical, sexual and emotional violence
Physical or sexual violence
Physical, sexual or
emotional violence
Number of ever-married women
Age
15-19 14.6 3.6 5.2 2.4 0.3 15.8 18.4 965
20-24 11.9 3.4 2.7 2.2 0.6 13.2 14.5 2,090
25-29 12.9 3.7 4.8 2.8 0.8 13.8 16.0 2,696
30-39 10.9 3.9 4.7 2.2 0.7 12.6 14.9 3,963
40-49 11.4 3.5 3.5 2.2 0.2 12.7 14.4 1,778
Type of residence
Urban 16.8 4.3 4.8 3.1 0.6 18.0 20.3 4,095
Rural 11.2 3.8 3.9 2.1 0.5 12.9 14.4 3,444
Nomadic 7.5 2.9 3.9 1.7 0.6 8.7 10.9 3,953
Number of living children
0 1.4 0.4 0.4 0.3 0.1 1.6 1.8 1,294
1-2 2.9 0.8 0.8 0.6 0.2 3.2 3.6 2,800
3-4 3.1 1.0 1.4 0.7 0.2 3.5 4.1 3,164
5+ 4.5 1.4 1.7 0.8 0.2 5.0 5.8 4,234
Marital status
Currently married 12.0 3.9 4.8 2.5 0.7 13.4 15.7 10,089
Formerly married 11.7 2.1 0.0 1.5 0.0 12.4 12.4 1,403
Employed in the 12 months preceding the survey
Employed 13.6 6.1 6.3 4.0 0.9 15.6 19.0 1,083
Not employed 11.8 3.4 4.0 2.2 0.6 13.0 14.9 10,409
Education
No education 11.1 3.6 4.3 2.3 0.6 12.4 14.5 9,617
Primary 17.9 4.8 4.4 3.1 0.8 19.6 21.3 1,347
Secondary 12.9 1.7 4.1 1.5 0.7 13.1 15.1 367
Higher 9.8 4.1 0.7 2.2 0.0 11.8 12.5 161
Wealth quintile
Lowest 7.1 2.3 4.3 1.1 0.6 8.3 10.3 2,720
Second 10.7 4.6 3.8 2.9 0.8 12.4 14.1 2,284
Middle 16.2 6.1 6.0 4.2 1.1 18.1 20.6 2,107
Fourth 12.8 2.8 3.6 1.8 0.4 13.8 15.5 2,304
Highest 14.3 2.8 3.6 1.9 0.2 15.2 17.5 2,077
Total 11.9 3.7 4.2 2.3 0.6 13.3 15.3 11,492
Note: Husband/spouse refers to the current husband for currently married women and the most recent husband for divorced, or widowed women.
Table 9.6 Spousal violence by background characteristics

205
Percentage of ever-married women aged 15-49 who have experienced specific types of spousal violence by types of injuries resulting from the violence, according to whether they ever experienced violence or experienced it in the 12 months preceding the survey, SHDS 2020
Background characteristics
Injuries experienced:
Number of womenCuts, bruises, or
aches
Eye injuries, sprains, dislocations, or
burns
Deep wounds, broken bones,
broken teeth, or any other serious injury Any injury
Experienced any violence:
Ever 26.3 19.4 17.8 35.0 836
In the past 12 months
26.8 21.3 19.0 36.2 734
Age
15-19 27.1 15.1 16.2 31.2 64
20-24 20.9 16.5 11.5 27.5 157
25-29 25.3 21.1 19.7 38.4 213
30-34 24.8 16.0 17.7 37.6 156
35-39 39.7 28.3 26.0 42.7 132
40-44 20.1 16.5 14.7 28.7 85
45-49 27.1 16.9 15.6 30.0 29
Total 15-49 26.3 19.4 17.8 35.0 836
Table 9.7 Injuries to women due to spousal violence

The Somali Health and Demographic Survey206
Percentage of ever-married women aged 15-49 who have ever experienced emotional, physical or sexual violence, by background characteristics, SHDS 2020
Background characteristicsSought help
TotalNumber of ever- married women Yes No
Type of violence experienced:
Physical abuse 15.3 84.7 100.0 718
Sexual violence 3.9 96.1 100.0 69
Physical and sexual violence 22.4 77.6 100.0 322
Age
15-19 21.1 78.9 100.0 101
20-24 17.4 82.6 100.0 210
25-29 17.0 83.0 100.0 271
30-34 12.5 87.5 100.0 193
35-39 16.7 83.3 100.0 179
40-44 14.3 85.7 100.0 105
45-49 23.4 76.6 100.0 50
Type of residence
Urban 23.1 76.9 100.0 516
Rural 11.8 88.2 100.0 319
Nomadic 10.2 89.8 100.0 273
Number of living children
0 20.1 79.9 100.0 115
1-2 12.9 87.1 100.0 247
3-4 16.4 83.6 100.0 312
5+ 18.2 81.8 100.0 433
Marital status
Currently married 16.0 84.0 100.0 1,029
Formerly married (divorced, widowed)
25.6 74.4 100.0 80
Employed in the 12 months preceding the survey
Employed 23.8 76.2 100.0 115
Not employed 15.8 84.2 100.0 993
Education
No education 16.4 83.6 100.0 898
Primary 18.5 81.5 100.0 177
Secondary 3.4 96.6 100.0 26
Higher 44.0 56.0 100.0 8
Wealth quintile
Lowest 7.1 92.9 100.0 179
Second 13.1 86.9 100.0 222
Middle 20.7 79.3 100.0 284
Fourth 17.6 82.4 100.0 226
Highest 22.4 77.6 100.0 197
Total 16.7 83.3 100.0 1,108
Table 9.8 Help-seeking to stop violence

207

10Female Circumcision

©U
NFP
A S
OM
ALI
A/G
eorg
ina
Go
od
win

KEY FINDINGS
ATTITUDES
76%of women aged 15-49 want female circumcision to continue
DAUGHTERS
76%of daughters aged between 10-14 have undergone female circumcision
PREVALENCE
99%of Somali women aged 15-49 have undergone female circumcision
RELIGIOUS REQUIREMENT
72%of women aged 15-49 believe that female circumcision is a religious obligation
TYPES PRACTISED
64%of women aged 15-49 have undergone Pharaonic type of female circumcision, the most severe form, which involves the removal of the entire clitoris and flesh

The Somali Health and Demographic Survey212
Female circumcision, also known as Female Genital Mutilation/Cutting (FGM/C) has been practised in Somalia for several decades. The practice is considered harmful, because it poses a potential risk to the health and well-being of women and girls who are subjected to it. FGM/C is regarded as a violation of the Convention on the Rights of the Child (General Assembly, United Nations, 1990).
In the SHDS 2020, both ever-married women and never-married women were asked a series of questions about female circumcision, including whether they had been subjected to it. Women who had undergone the practice were asked at which age it was done, the type of female circumcision they underwent, their religious perception about the practice, and opinions on whether the practice should continue or not.
Mothers with daughters were asked if their daughters underwent female circumcision, the age at which it happened and the type of FGM/C performed among other questions.
The SHDS 2020 used the definitions below of types of female circumcision:
a. Excision of the clitoral hood (prepuce), with or without excision of part or all of the clitoris (Sunni)
b. Excision of the clitoris with partial or total excision of the labia minora (Intermediate)
c. Excision of part or all of the external genitalia and stitching/narrowing of the vaginal opening; or all other procedures that involve pricking, piercing, stretching; or incising of the clitoris and/or labia; introduction of corrosive substances into the vagina to narrow it (Pharaonic)
Opinions on Female CircumcisionTable 10.1 presents the percentage distribution of women aged 15-49 by their religious beliefs regarding female circumcision, according to their ages and other background characteristics. Overall, 72 percent of women believe that FGM/C is a religious requirement. There is little variation in the women’s beliefs by age as 76 percent of the women within the age group 15-19 believe it is a religious requirement, compared to 73 percent of those in the age group 45-49.
The variation on beliefs around female circumcision by repondents’ place of residence is small. Sixty-seven percent of women in urban areas, 72 percent of women in rural areas and
10 F E M A L E C I R C U M C I S I O N

213
78 percent of women from nomadic areas believe that female circumcision is a religious requirement.
There is a notable variation in opinions among women in terms of education—74 percent of women with no education believe that it is a religious requirement, compared with 44 percent of those with higher levels of education who hold the same belief (Figure 10.1).
Wealth status plays a role in shaping women’s beliefs about female circumcision: 77 percent of women from the lowest wealth quintile or poorest households believe female circumcision is a religious requirement, compared to 59 percent from highest wealth quintile or wealthiest households who hold the same beliefs (Figure 10.2).
Prevalence of Female Circumcision Table 10.2 presents the percentage of women aged 15-49 who have undergone female circumcision by background characteristics. Overall, 99 percent of Somali women have undergone female circumcision. Pharaonic is the most common type, which has been performed on 64 percent of the women. The findings show that 12 percent of women have undergone the Intermediate type, while 22 percent have undergone the Sunni type. Two percent did not know the type of female circumcision they had undergone earlier in their lives.
Most women aged 15-49 in urban (63 percent), rural (65 percent) and nomadic (62 percent) areas have undergone the worst form of FGM/C —the Pharaonic type. At a distant
second, is the Sunni type, practised by slightly over 20 percent of women in all the three places of residence (Figure 10.3).
Figure 10.4 shows that 70 percent of women with no education underwent the worst type of female circumcision. Just above half of the women (52 percent) with the highest level of education underwent the less severe form of female circumcision. Further investigation is needed to understand this relationship because at the time the respondents underwent female circumcision, their guardians e.g. parents or grandparents had made the decision on the type of female circumcision to be performed.
Figure 10.5 shows a relationship between the wealth status of the household and the type of FGM/C undergone by women aged 15-49. A higher percentage of women (71 percent in the
Wealth status plays a role in shaping women’s beliefs about female circumcision 73.5
67.7
59.8
44.1
24.0
30.9
38.4
54.4
2.5 1.4 1.7 1.6
No education Primary Secondary Higher Education
Required by religion Not required by religion Don't know
77.3 76.4 74.671.1
58.8
19.9 21.9 23.126.6
39.0
2.8 1.7 2.4 2.3 2.3
Lowest Second Middle Fourth Highest
Required by religion Not required by religion Don't know
Percent distribution of women aged 15-49 by whether female circumcision is required by religion according to education
Percent distribution of women aged 15-49 by whether female circumcision is required by religion based on wealth status
Figure 10.1 Opinions on female circumcision by education
Figure 10.2 Opinions on female circumcision by wealth status

The Somali Health and Demographic Survey214
Age at Female CircumcisionTable 10.3 shows the percent distribution of women aged 15-49 by the age when they had undergone FGM/C, according to their background characteristics. Women were asked how old they were when they underwent female circumcision. The majority of women (71 percent) aged 15-49 were circumcised when they were aged 5-9. Less than 1 percent were circumcised when they were under 5 years and 1 percent underwent FGM/C when they were over 15 years of age.
The current levels of education of women aged 15-49 and wealth status of their households does not have much influence on the age at which these women were circumcised.
Among the women from nomadic areas, 69 percent underwent FGM/C when they were aged 5-9, compared to 73 percent of those from urban areas and 71 percent of those from rural areas (Figure 10.6).
Female Circumcision on DaughtersEver-married women aged 15-49 who had daughters were asked if any of their daughters had undergone FGM/C and, if so, how old the girl was when she was circumcised, and who performed it among other questions. It should be noted that mothers may not have been able to recall the exact age at which their daughters underwent FGM/C.
lowest quintile and 72 percent in the second quintile) from poorer households underwent the Pharaonic type of FGM/C compared to slightly over half of women from the wealthier households (51 percent).
The majority of women (71 percent) aged 15-49 were circumcised when they were aged 5-9
23.320.9 21.9
11.7 12.2 13.9
63.3 64.962.3
1.7 2.0 2.0
Urban Rural Nomadic
Sunni Intermediate Pharaonic Don't know
16.0
30.2
47.952.0
11.8 13.5 12.2
20.1
70.4
54.7
37.1
27.4
1.9 1.6 2.80.5
No Education Primary Secondary Higher
Sunni Intermediate Pharaonic Don't know
16.0 14.718.3
23.1
33.6
12.0 10.9 11.113.4 13.6
71.0 71.868.1
61.4
51.2
1.0 2.5 2.5 2.1 1.6
Lowest Second Middle Fourth Highest
Sunni Intermediate Pharaonic Don't know
Percent distribution of women aged 15-49 by types of female circumcision
Percent distribution of women aged 15-49 by types of female circumcision
Percent distribution of women aged 15-49 by type of female circumcision
Figure 10.3 Type of female circumcision by place of residence
Figure 10.4 Types of female circumcision by level of education
Figure 10.5 Type of female circumcision by wealth status

215
Table 10.4 shows the percent of girls of age 0-14 years who underwent female circumcision by age and their mothers’ background characteristics. The results indicate that about 3 percent of girls were cut at the age of 0-4, 30 percent of daughters were cut at the ages of 5-9 and 76 percent of daughters within the age of 10-14 years had undergone the practice. In terms of place of residence, mothers reported the prevalence of FGM/C among girls aged 10-14 was 74 percent in urban areas, 75 percent in rural areas and 79 percent in nomadic areas. The age pattern reported for daughters differs from that of their mothers. In fact, the majority of mothers underwent FGM/C at ages 5-9 years and in contrast, the daughters were circumcised at slightly older ages of 10-14.
Overall, in terms of education, 27 percent of the daughters of mothers with no education were circumcised at the age of 0-14 years while 10 percent of the daughters of mothers with higher education underwent the cut at age 0-14 years. Meanwhile, the wealth quintile has no major impact on the prevalence of FGM/C.
Attitudes towards Female CircumcisionBoth ever-married and never-married women aged 15-49 were asked whether the FGM/C
practice should be continued or stopped. Table 10.5 shows the percentage distribution of women aged 15-49 by their opinion on the practice of FGM/C. Overall, 76 percent of women believe that female circumcision should continue, while 19 percent believe that the practice should be stopped.
The percentage of women who believe that the practice needs to be continued is almost similar among women in urban areas (70 percent) and in rural areas (76 percent), and highest among nomadic women (83 percent).
The opinion on whether the practice of female circumcision should be continued or not decreased as the wealth status of the household increased. Eighty-one percent of women from the poorest households stated they would like the practice to continue, compared to 64 percent of women from wealthier households.
Figure 10.7 presents contrasting views on the discontinuation of female circumcision between those with no education and those with higher education. Seventy-eight percent of
0.3 0.2 0.2
72.8 70.5 68.8
25.828.3 29.6
0.7 0.6 0.80.5 0.4 0.7
Urban Rural Nomadic
<5 5 to 9 10 to 14 15+ Don’t know
Percent distribution of women aged 15-49 by type of female circumcision
Figure 10.6 Age at female circumcision by place of residence
78.3
70.7
63.2
43.7
17.223.1
33.9
51.5
3.7 5.72.5 4.8
0.8 0.5 0.4 0.0
No Education Primary Secondary Higher
Continued Stopped Depends Don't Know
Percent distribution of women aged 15-49 by opinion on continuation of female circumcision
Figure 10.7 Opinion on continuation of female circumcision by levels of education

The percentage of women who believe that the practice needs to be continued is almost similar among women in urban areas and rural areas

©U
NFP
A S
OM
ALI
A/G
eorg
ina
Go
od
win

The Somali Health and Demographic Survey218
women with no education believe that female circumcision should be continued, while 52 percent of women with higher education would prefer that the practice be stopped.
List of Tables
Table 10.1 Opinions on whether female circumcision is required by religion 217
Table 10.2 Prevalence of female circumcision 218
Table 10.3 Age at female circumcision 219
Table 10.4 Female circumcision on girl’s aged 0-14 by mother’s background characteristics 220
Table 10.5 Opinions on continuation of female circumcision 221

219
Percent distribution of women aged 15-49 by whether female circumcision is required by religion, according to background characteristics, SHDS 2020
Background characteristicsRequired by
religionNot required by
religion Don’t know TotalNumber of
women
Female circumcision status
Circumcised 72.1 25.6 2.3 100.0 10,271
Not circumcised 54.4 44.4 1.2 100.0 60
Age
15-19 76.4 19.6 4.0 100.0 844
20-24 72.8 24.8 2.5 100.0 1,885
25-29 70.2 27.6 2.2 100.0 2,432
30-34 70.6 27.1 2.3 100.0 1,880
35-39 72.6 25.5 1.9 100.0 1,687
40-44 71.7 26.2 2.1 100.0 1,019
45-49 73.4 25.3 1.3 100.0 585
Type of residence
Urban 66.8 31.1 2.1 100.0 3,717
Rural 71.6 26.5 1.9 100.0 3,153
Nomadic 77.9 19.3 2.9 100.0 3,460
Education
No education 73.5 24.0 2.5 100.0 8,593
Primary 67.7 30.9 1.4 100.0 1,263
Secondary 59.8 38.4 1.7 100.0 335
Higher 44.1 54.4 1.6 100.0 141
Wealth quintile
Lowest 77.3 19.9 2.8 100.0 2,491
Second 76.4 21.9 1.7 100.0 1,977
Middle 74.6 23.1 2.4 100.0 1,875
Fourth 71.1 26.6 2.3 100.0 2,082
Highest 58.8 39.0 2.3 100.0 1,906
Total 72.0 25.7 2.3 100.0 10,331
Table 10.1 Opinions on whether female circumcision is required by religion
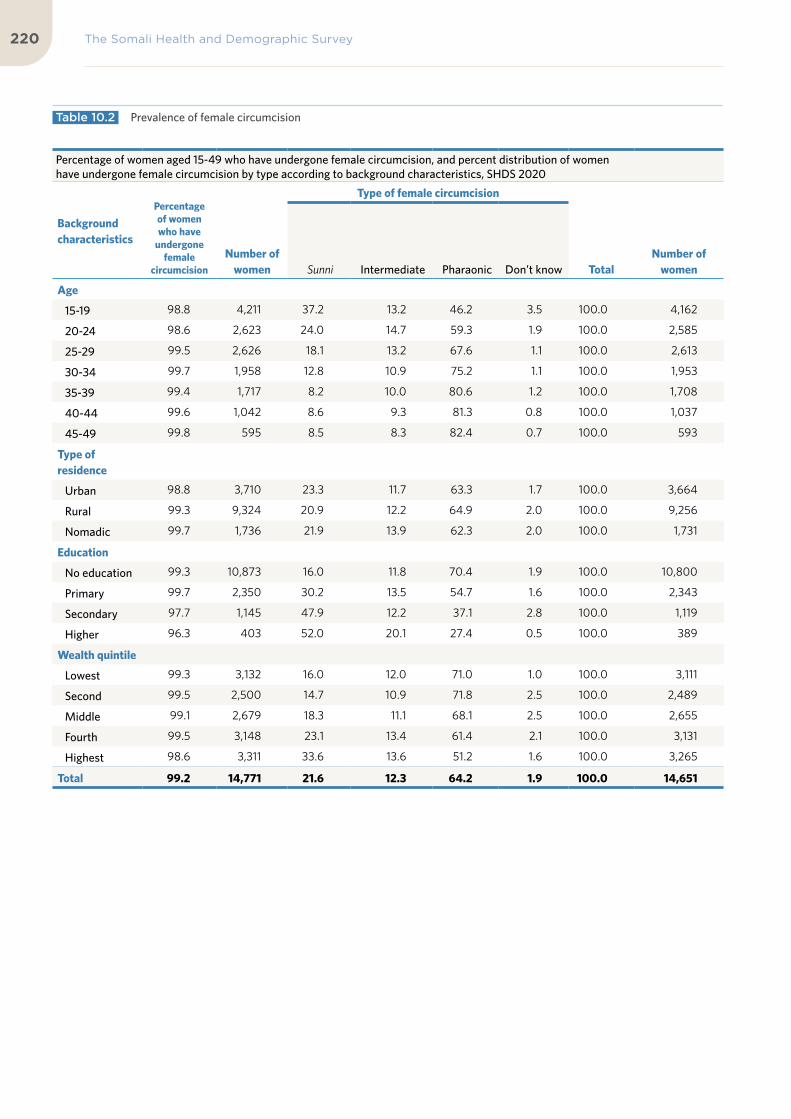
The Somali Health and Demographic Survey220
Percentage of women aged 15-49 who have undergone female circumcision, and percent distribution of women have undergone female circumcision by type according to background characteristics, SHDS 2020
Background characteristics
Percentage of women who have
undergone female
circumcision
Number of
women
Type of female circumcision
TotalNumber of
women Sunni Intermediate Pharaonic Don’t know
Age
15-19 98.8 4,211 37.2 13.2 46.2 3.5 100.0 4,162
20-24 98.6 2,623 24.0 14.7 59.3 1.9 100.0 2,585
25-29 99.5 2,626 18.1 13.2 67.6 1.1 100.0 2,613
30-34 99.7 1,958 12.8 10.9 75.2 1.1 100.0 1,953
35-39 99.4 1,717 8.2 10.0 80.6 1.2 100.0 1,708
40-44 99.6 1,042 8.6 9.3 81.3 0.8 100.0 1,037
45-49 99.8 595 8.5 8.3 82.4 0.7 100.0 593
Type of residence
Urban 98.8 3,710 23.3 11.7 63.3 1.7 100.0 3,664
Rural 99.3 9,324 20.9 12.2 64.9 2.0 100.0 9,256
Nomadic 99.7 1,736 21.9 13.9 62.3 2.0 100.0 1,731
Education
No education 99.3 10,873 16.0 11.8 70.4 1.9 100.0 10,800
Primary 99.7 2,350 30.2 13.5 54.7 1.6 100.0 2,343
Secondary 97.7 1,145 47.9 12.2 37.1 2.8 100.0 1,119
Higher 96.3 403 52.0 20.1 27.4 0.5 100.0 389
Wealth quintile
Lowest 99.3 3,132 16.0 12.0 71.0 1.0 100.0 3,111
Second 99.5 2,500 14.7 10.9 71.8 2.5 100.0 2,489
Middle 99.1 2,679 18.3 11.1 68.1 2.5 100.0 2,655
Fourth 99.5 3,148 23.1 13.4 61.4 2.1 100.0 3,131
Highest 98.6 3,311 33.6 13.6 51.2 1.6 100.0 3,265
Total 99.2 14,771 21.6 12.3 64.2 1.9 100.0 14,651
Table 10.2 Prevalence of female circumcision

221
Percent distribution of women aged 15-49 who underwent female circumcision by age when it was done, according to background characteristics, SHDS 2020
Background characteristics
Age at female circumcision
TotalNumber of
women <5 5 to 9 10 to 14 15+ Don’t know
Age
15-19 0.7 73.0 25.3 0.4 0.6 100.0 4,162
20-24 0.1 72.7 26.2 0.7 0.3 100.0 2,585
25-29 0.0 72.3 26.3 0.6 0.8 100.0 2,613
30-39 0.0 68.1 30.7 0.7 0.4 100.0 3,660
40-49 0.0 66.6 31.5 1.3 0.6 100.0 1,631
Type of residence
Urban 0.3 72.8 25.8 0.7 0.5 100.0 5,876
Rural 0.2 70.5 28.3 0.6 0.4 100.0 4,364
Nomadic 0.2 68.8 29.6 0.8 0.7 100.0 4,410
Education
No education
0.1 70.1 28.5 0.7 0.5 100.0 10,800
Primary 0.2 72.4 26.2 0.6 0.6 100.0 2,343
Secondary 0.5 74.6 23.9 0.5 0.5 100.0 1,119
Higher 1.7 72.0 25.5 0.3 0.5 100.0 389
Wealth quintile
Lowest 0.2 65.3 33.3 0.7 0.5 100.0 3,111
Second 0.1 73.9 24.5 0.5 0.9 100.0 2,489
Middle 0.1 75.0 23.8 0.6 0.4 100.0 2,655
Fourth 0.3 71.6 27.0 0.7 0.4 100.0 3,131
Highest 0.3 69.7 28.6 0.8 0.5 100.0 3,265
Total 0.2 70.9 27.7 0.7 0.5 100.0 14,651
Table 10.3 Age at female circumcision

The Somali Health and Demographic Survey222
Percentage of girls aged 0-14 who underwent female circumcision, according to age and mother’s background characteristics, SHDS 2020
Background characteristicsCurrent age of girls
Total 0-14 0-4 5-9 10-14
Mother’s circumcision status
Circumcised 3.3 29.8 75.8 26.0
Not circumcised * * * *
Type of residence
Urban 4.4 33.3 74.1 28.3
Rural 3.8 29.3 74.7 26.1
Nomadic 1.7 26.1 79.2 23.3
Education
No education 3.1 30.2 76.8 26.9
Primary 4.2 25.9 70.6 21.4
Secondary 5.0 31.3 59.7 19.7
Higher 2.0 23.5 34.7 10.0
Wealth quintile
Lowest 2.2 25.1 70.2 21.7
Second 2.6 32.3 79.1 27.6
Middle 3.4 33.0 81.5 28.7
Fourth 3.7 31.5 79.2 27.5
Highest 5.2 27.5 69.0 25.4
Total 3.3 29.7 75.9 26.0
Note: The circumcision status of girls is reported by their mothers.
An asterisk indicates that a figure is based on fewer than 25 unweighted cases and has been suppressed.
Table 10.4 Female circumcision on girl’s aged 0-14 by mother’s background characteristics

223
Percent distribution of women aged 15-49 by whether the practice of female circumcision should continue by background characteristics, SHDS 2020
Background characteristics
Opinion to continue with female circumcision practice or not
TotalNumber of
womenContinued Stopped Depends Don’t Know
Female circumcision status
Circumcised 76.5 18.8 4.0 0.7 100.0 10,271
Not circumcised
63.8 35.8 0.0 0.3 100.0 60
Age
15-19 79.9 15.3 3.9 0.9 100.0 844
20-24 76.0 19.8 3.4 0.8 100.0 1,885
25-29 76.0 18.4 4.7 1.0 100.0 2,432
30-34 77.0 18.2 4.1 0.6 100.0 1,880
35-39 74.2 21.8 3.3 0.7 100.0 1,687
40-44 77.7 18.6 3.4 0.3 100.0 1,019
45-49 77.3 17.7 4.8 0.2 100.0 585
Type of residence
Urban 70.3 25.7 3.5 0.5 100.0 3,717
Rural 76.3 19.6 3.7 0.4 100.0 3,153
Nomadic 83.2 10.9 4.6 1.3 100.0 3,460
Education
No education 78.3 17.2 3.7 0.8 100.0 8,593
Primary 70.7 23.1 5.7 0.5 100.0 1,263
Secondary 63.2 33.9 2.5 0.4 100.0 335
Higher 43.7 51.5 4.8 0.0 100.0 141
Wealth quintile
Lowest 81.1 13.1 4.5 1.3 100.0 2,491
Second 80.9 13.5 4.9 0.7 100.0 1,977
Middle 79.6 17.1 2.7 0.6 100.0 1,875
Fourth 75.0 21.5 3.2 0.3 100.0 2,082
Highest 64.2 31.1 4.2 0.5 100.0 1,906
Total 15-49 76.4 18.9 3.9 0.7 100.0 10,331
Table 10.5 Opinions on continuation of female circumcision

11Women’s Empowerment

©U
NFP
A S
OM
ALI
A/T
ob
in J
on
es

KEY FINDINGS
FINANCIAL DECISIONS
90%of women decide on how their cash earnings will be spent either individually or jointly with their husbands
ACCESS TO FINANCIAL SERVICES
4%MOBILEOWNERSHIP
of women aged 15-49 have a bank account
PARTICIPATION IN DECISION MAKING
54%of currently married women aged 15-49 make decisions on their own health care by themselves or jointly with their husbands
ATTITUDES TOWARDS WIFE BEATING
36%of women believe that a husband is justified in beating his wife for at least one of the six specified reasons
67%percent of women jointly or individually make decisions on how the husbands cash earnings will be spent
75%of women own a mobile phone
64%of women aged 15-49 with mobile phones use them for financial transactions

The Somali Health and Demographic Survey228
This chapter focuses on Somali
women’s empowerment in terms
of employment, earnings, control
over earnings and ownership of
assets. It also explores women’s
ownership and use of bank
accounts and mobile phones. The
SHDS asked specific questions
to define two different indicators
of women’s empowerment:
their participation in household
decision-making and attitudes
towards wife beating.
Over the years, several attempts have been made to improve life for Somali women. The Provisional Constitution of Somalia has a number of positive implications for the status of women, particularly on the involvement of women in leadership and decision-making. However, most Somali women are still either excluded from decision-making and asset ownership, or operate through a patriarchal filter in these areas—mainly due to cultural restrictions on their movement and asset ownership.
Women’s EmploymentTable 11.1 shows the percentage distribution of currently married women who were employed in the 12 months preceding the survey by age and type of earnings. Generally, employment is assumed to go hand in hand with payment for work. However, not all Somali women receive earnings for the work they do, and among those who do receive earnings, not all receive cash. Sixty-six percent of currently married women who reported being employed at any time in the 12 months preceding the survey received earnings in cash, 12 percent were paid in cash and in kind, 6 percent received their earnings in kind only and the remaining 17 percent were not paid at all.
The percentage of currently married women who are employed and receiving their earnings in cash increases with age, from 53 percent among those aged 20-24 to a peak of 72 percent among those aged 45-49. The proportion that are employed and not paid at all was the highest, at 27 percent, among younger respondents in the age bracket 20-24.
11 W O M E N ’ S E M P O W E R M E N T

229
Control over Women’s Earnings
Access to/and control of financial resources are critical variables for women’s empowerment and poverty reduction. Employment and cash earnings are more likely to contribute to the economic and social empowerment of women, particularly if they perceive their earnings as significant relative to those of their husband and important to the welfare of the household. It can contribute to improving power and autonomy in decision making that impact on women as individuals and their families
To assess women’s autonomy, currently married women aged 15-49 who earned cash for their work in the 12 months preceding the survey were asked who the main decision maker was with regard to the use of their earnings. This information allowed an assessment of women’s control over their own earnings. Table 11.2 and Figure 11.1 show the degree of control women have over the use of their earnings, with one in every two currently married women reporting they decide on their own how their earnings will be used, while 41 percent decide jointly with their husbands. Ten percent reported
their husband is the main decision maker and controls their cash earnings.
Table 11.2 shows that 38 percent of women earn less than their husbands, while 27 percent earn more than their husbands. Only 5 percent earn an equal amount to their husbands’ earnings. Twenty-one percent of the currently married women did not know how their earnings compared to their husbands’, most likely because they are not privy to information about their husbands’ earnings.
Control over Husbands’ EarningsTable 11.3 shows that 35 percent of the currently married women aged 15-49 whose husbands earn cash report that decisions about the use of the husbands’ cash earnings are made jointly, and slightly fewer women, at 33 percent, reported that the husband is the main decision maker. Thirty-two percent reported that the wife is the main decision maker on how the husband’s cash earnings are used.
Mainly wife, 49.5%
Wife and husband jointly, 40.7%
Mainly husband, 9.8%
Percent distribution of currently married women aged 15-49 with income for the last 12 months preceding survey and who makes decisions over their cash earnings
Figure 11.1 Control over women’s earnings

The Somali Health and Demographic Survey230
Among couples with no children, about half of the women reported that the husband is the main decision maker, 29 percent stated a woman has more control, while 23 percent indicated they make joint decisions over their husbands’ income.
Among women with no education, 35 percent reported the husband mainly makes decisions over his earnings, compared to 34 percent who indicated they make joint decisions over the husband’s earnings. Thirty-one percent indicated it is mainly the wife who makes decisions over the husband’s earnings. Among women with primary education, 28 percent reported their husbands mainly make decisions over the husband’s earnings, compared to 36 percent who indicated joint decision making or the woman mainly decides how to use the money earned by the husband.
For husbands in the lowest wealth quintile, slightly more than half mainly control the income, compared to 23 percent of husbands in the highest wealth quintile, indicating that
husbands have more financial control over wives in poorer households.
Ownership of Assets
Ownership of and control over assets, such as land and housing, are important factors that contribute to improving women’s status. Ownership of land and property plays an important role in strengthening women’s agency. Land is a key productive and economic asset. It provides opportunity multiple benefits to individuals and households, including a secure place to live, livelihood, protection during emergencies, and collateral when needed. In the SHDS, ever-married women were asked whether they own a house and land alone or jointly with their husbands.
Table 11.4 shows the percent distribution of ever-married women aged 15-49 by ownership of a house and land. Women are more likely
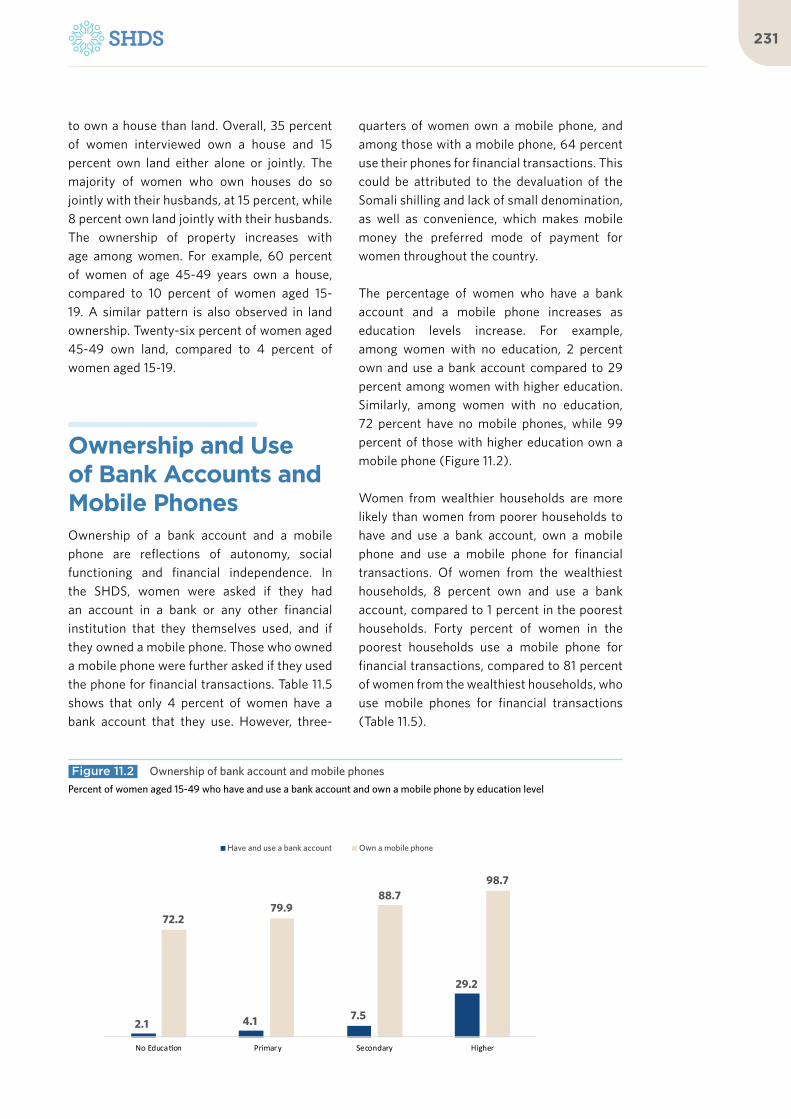
231
to own a house than land. Overall, 35 percent of women interviewed own a house and 15 percent own land either alone or jointly. The majority of women who own houses do so jointly with their husbands, at 15 percent, while 8 percent own land jointly with their husbands. The ownership of property increases with age among women. For example, 60 percent of women of age 45-49 years own a house, compared to 10 percent of women aged 15-19. A similar pattern is also observed in land ownership. Twenty-six percent of women aged 45-49 own land, compared to 4 percent of women aged 15-19.
Ownership and Use of Bank Accounts and Mobile PhonesOwnership of a bank account and a mobile phone are reflections of autonomy, social functioning and financial independence. In the SHDS, women were asked if they had an account in a bank or any other financial institution that they themselves used, and if they owned a mobile phone. Those who owned a mobile phone were further asked if they used the phone for financial transactions. Table 11.5 shows that only 4 percent of women have a bank account that they use. However, three-
quarters of women own a mobile phone, and among those with a mobile phone, 64 percent use their phones for financial transactions. This could be attributed to the devaluation of the Somali shilling and lack of small denomination, as well as convenience, which makes mobile money the preferred mode of payment for women throughout the country.
The percentage of women who have a bank account and a mobile phone increases as education levels increase. For example, among women with no education, 2 percent own and use a bank account compared to 29 percent among women with higher education. Similarly, among women with no education, 72 percent have no mobile phones, while 99 percent of those with higher education own a mobile phone (Figure 11.2).
Women from wealthier households are more likely than women from poorer households to have and use a bank account, own a mobile phone and use a mobile phone for financial transactions. Of women from the wealthiest households, 8 percent own and use a bank account, compared to 1 percent in the poorest households. Forty percent of women in the poorest households use a mobile phone for financial transactions, compared to 81 percent of women from the wealthiest households, who use mobile phones for financial transactions (Table 11.5).
2.1 4.1 7.5
29.2
72.279.9
88.798.7
No Education Primary Secondary Higher
Have and use a bank account Own a mobile phone
Percent of women aged 15-49 who have and use a bank account and own a mobile phone by education level
Figure 11.2 Ownership of bank account and mobile phones

Three-quarters of women own a mobile phone, and among those with a mobile phone, 64 percent use their phones for financial transactions
©A
U U
N I
ST P
HO
TO
/To
bin
Jo
nes

The Somali Health and Demographic Survey234
Women’s Participation in Decision Making
Participation in household decision-making is an essential aspect of women’s empowerment and reflects women’s status and the level of agency women have within their own household and environment. As part of the SHDS, currently married women were asked about their participation in decisions about their own health care, major household purchases and visits they make to their family or relatives.
Table 11.6 shows that 45 percent of women indicated that decisions on their own health care are made mainly by their husbands, 34 percent reported they make decisions regarding their own health care jointly with their husbands, while 20 percent indicated that they mainly make these decisions on their own. A similar pattern is observed regarding major household purchases and visits to family or relatives, with 45 percent of women indicating that their husbands make decisions for major household purchases. Fifty-eight percent of women state their husbands make decisions regarding visits to family or relatives. Generally, men dominate women in household decision-making.
Attitudes towards Wife Beating
As part of the SHDS, ever-married women were asked if they agree that a husband is justified in hitting or beating his wife under each of the following six circumstances: she neglects household duties, she argues with him, she goes out without telling him, she wastes resources, she neglects the children, and she refuses to have sex with him. If respondents answered “yes” in at least one circumstance, they were considered to have attitudes justifying wife beating.
Table 11.7 shows among the women interviewed, 36 percent believe that a husband is justified in beating his wife for at least one of the six specified reasons. Overall, 24 percent of the women interviewed believe that wife beating is justified if the wife goes out without telling her husband. The percentage of women who justify wife beating under one of the specified circumstances decreases with increasing education levels. Thirty-eight percent of women with no education agree that wife beating is justified in at least one of the six specified circumstances, compared to 28 percent of women with higher education levels.
28.1
34.1
39.9
35.7
44.2
Highest
Fourth
Middle
Second
Lowest
Percent of women aged 15-49 who agree with at least one specific reason for wife beating by wealth quintile
Figure 11.3 Attitude towards wife beating

235
The proportion of women justifying wife beating under any one of the specified circumstances decreases with wealth quintiles. Forty-four percent of women in the poorest households agree that wife beating is justified in at least one of the six specified circumstances, compared to 28 percent of women in the wealthiest households (Figure 11.3).
Summary Indices of Women’s Empowerment
Responses from women on their participation in making household decisions and their attitudes towards wife beating can be summarized into two separate indices. The first index is the number of decisions in which women participate alone or jointly with their husbands (Table 11.6 for the list of decisions). This index ranges in value from 0 to 3 and is positively related to women’s empowerment. It reflects the degree of decision-making and control that women are able to exercise in areas that directly affect their lives and environments.
The second index is the number of reasons why the respondent believes that a husband is
justified in beating his wife (see Table 11.7 for the list of reasons). This index ranges in value from 0 to 5. A lower score on this indicator is interpreted as reflecting a greater sense of autonomy, self-esteem, and a higher status.
Table 11.8 shows that there is a positive relationship between women’s disapproval of wife beating and their participation in decision-making. The percentage of women who disagree with all the reasons that justify wife beating rises with the number of household decisions in which women participate, from 53 percent among women who do not participate in any of the household decisions to 65 percent of women who participate in all three decisions.
The percentage of women participating in all the household decisions decreases with the number of reasons women accept as justifying wife beating, from 36 percent among women who do not agree that wife beating is justified for any reason to 28 percent among women who accept that wife beating is justified in all five specified reasons.
List of Tables
Table 11.1 Employment and cash earnings of currently married women 234
Table 11.2 Control over women’s cash earnings and relative magnitude of women’s cash earnings 235
Table 11.3 Control over husbands’ cash earnings 236
Table 11.4 Ownership of assets 237
Table 11.5 Ownership and use of bank accounts and mobile phones 238
Table 11.6 Participation in decision making 238
Table 11.7 Attitude toward wife beating: Women 239
Table 11.8 Indicators of women’s empowerment 240

The Somali Health and Demographic Survey236
Percent distribution of currently married women employed in past 12 months, by type of earnings, SHDS 2020
Percent distribution of currently married women employed in past 12
months, by type of earnings
TotalNumber of
womenAge Cash only Cash and in-kind In-kind only Not paid
15 – 19 (60) (12) (12) (16) 100.0 25
20 – 24 53.0 16.4 4.1 26.5 100.0 113
25 – 29 69.5 9.3 3.0 18.2 100.0 189
30 – 34 68.1 15.0 6.1 10.8 100.0 181
35 – 39 71.3 8.4 8.2 12.1 100.0 221
40 – 44 60.7 12.3 4.9 22.1 100.0 158
45 – 49 71.5 8.4 5.7 14.5 100.0 101
Total 66.3 11.5 5.5 16.7 100.0 989
Note: Figures in parentheses are based on 25-49 unweighted cases.
Table 11.1 Employment and cash earnings of currently married women

237
Percent distribution of currently married women aged 15-49 who received cash earnings for employment in the 12 months preceding the survey by person who decides how wife’s cash earnings are used and by whether she earned more or less than her husband, according to background characteristics, SHDS 2020
Background characteristics
Person who decides how wife’s cash earnings are used:
Total
Respondent earns more than husband
Total
Number of
womenMainly
wife
Wife and husband
jointlyMainly
husbandMore than
himLess than
himAbout the
same
Husband has no
earningsDon’t know
Age
15-19 * * * * * * * * * * 18
20-24 35.5 62.4 2.1 100.0 31.2 42.3 0.4 7.9 18.1 100.0 64
25-29 45.1 40.8 14.1 100.0 21.6 50.8 4.5 4.8 18.3 100.0 133
30-34 54.4 34.3 11.3 100.0 24.9 41.6 8.6 6.3 18.7 100.0 132
35-39 47.3 38.4 14.3 100.0 24.4 38.9 3.1 6.6 27.0 100.0 155
40-44 55.9 37.8 6.4 100.0 39.3 21.5 3.9 22.2 13.1 100.0 106
45-49 60.6 35.6 3.8 100.0 31.0 30.9 11.3 7.1 19.8 100.0 78
Number of living children
0 50.0 37.6 12.4 100.0 29.8 37.3 1.4 8.0 23.5 100.0 64
1-2 36.5 61.8 1.6 100.0 18.7 39.5 8.0 6.3 27.4 100.0 113
3-4 46.6 39.9 13.6 100.0 27.6 48.3 4.7 8.6 10.7 100.0 175
5+ 55.3 34.5 10.2 100.0 29.7 32.7 5.1 9.5 22.9 100.0 334
Type of residence
Urban 42.8 47.2 10.0 100.0 24.5 40.9 3.5 9.5 21.7 100.0 394
Rural 63.8 29.7 6.5 100.0 32.0 33.5 8.3 6.9 19.2 100.0 255
Nomadic (26.3) (44.7) (28.9) 100.0 (34.2) (31.6) (2.6) (7.9) (23.7) 100.0 38
Education
No education 49.4 39.6 11.1 100.0 26.2 37.2 6.3 8.8 21.5 100.0 504
Primary 52.5 36.9 10.5 100.0 28.5 38.7 0.7 12.2 19.9 100.0 100
Secondary (42.5) (50.0) (5.0) 100.0 (30.0) (42.5) (7.5) (5.0) (15.0) 100.0 40
Higher (47.4) (50.0) (2.6) 100.0 (34.2) (47.4) (5.3) (2.6) (10.5) 100.0 38
Wealth quintile
Lowest (43.6) (35.9) (20.5) 100.0 (23.1) (38.5) (2.6) (7.7) (28.2) 100.0 39
Second 41.2 38.1 20.8 100.0 22.8 43.0 13.1 8.6 12.5 100.0 91
Middle 52.5 35.5 12.0 100.0 29.1 38.7 5.5 8.1 18.6 100.0 173
Fourth 39.3 51.7 8.9 100.0 26.3 32.8 4.1 10.2 26.5 100.0 188
Highest 59.5 37.1 3.4 100.0 28.8 42.3 2.8 7.9 18.2 100.0 200
Total 49.5 40.7 9.8 100.0 27.4 38.3 5.1 8.6 20.6 100.0 686
Note: Figures in parentheses are based on 25-49 unweighted cases. An asterisk indicates that a figure is based on fewer than 25 unweighted cases and has been suppressed
Table 11.2 Control over women’s cash earnings and relative magnitude of women’s cash earnings

The Somali Health and Demographic Survey238
Percent distributions of currently married women aged 15-49 whose husbands receive cash earnings by person who decides how husbands’ cash earnings are used, according to background characteristics, SHDS 2020
Background characteristics
Person who decides how husbands’ cash earnings are used
Total
Number of currently
married women Mainly wifeWife and husband Mainly husband Other
Age group
15-19 (25.8) (25.8) (48.4) (0.0) 100.0 31
20-24 19.7 36.2 41.9 2.2 100.0 100
25-29 28.8 31.0 39.4 0.8 100.0 172
30-34 37.3 29.2 33.5 0.0 100.0 166
35-39 28.2 39.3 32.1 0.4 100.0 192
40-44 30.1 40.6 29.0 0.3 100.0 127
45-49 48.0 34.4 17.2 0.4 100.0 90
Number of living children
0 29.4 22.7 47.9 0.0 100.0 76
1-2 27.4 43.8 27.2 1.6 100.0 153
3-4 33.2 29.3 37.3 0.2 100.0 226
5+ 32.8 36.7 30.0 0.5 100.0 421
Type of residence
Urban 37.9 36.8 24.7 0.6 100.0 517
Rural 27.1 32.2 40.1 0.6 100.0 220
Nomadic 15.5 31.3 52.9 0.2 100.0 139
Education
No education 30.9 34.0 34.8 0.3 100.0 677
Primary 35.6 36.4 28.0 0.0 100.0 113
Secondary (32.5) (32.5) (32.5) (2.5) 100.0 39
Higher (31.0) (45.2) (21.4) (2.4) 100.0 42
Wealth quintile
Lowest 21.6 23.8 54.6 0.0 100.0 90
Second 19.6 46.0 34.4 0.0 100.0 145
Middle 33.0 28.9 38.1 0.0 100.0 215
Fourth 30.7 41.0 27.2 1.0 100.0 204
Highest 43.6 31.8 23.3 1.3 100.0 222
Total 31.7 34.8 33.0 0.6 100.0 876
Note: Figures in parentheses are based on 25-49 unweighted cases.
Table 11.3 Control over husbands’ cash earnings

239
Percent distribution of ever-married women aged 15-49 by ownership of housing and land, according to background characteristics, SHDS 2020
Background characteristics
Owns a house alone or jointly
Total
Owns land alone or jointly
Total
Total number
of womenAlone Jointly
Both alone and
jointlyDoes
not own Alone Jointly
Both alone and
jointlyDoes
not own
Age
15-19 2.5 4.3 2.7 90.5 100.0 1.0 2.3 0.8 95.9 100.0 4,649
20-24 7.0 15.2 9.9 67.8 100.0 2.5 8.9 4.0 84.6 100.0 2,906
25-29 10.5 18.9 14.9 55.7 100.0 4.5 10.9 5.3 79.2 100.0 2,918
30-34 11.1 17.4 16.9 54.5 100.0 4.8 9.8 6.0 79.5 100.0 2,195
35-39 13.3 22.9 15.0 48.8 100.0 5.8 10.3 5.5 78.4 100.0 1,948
40-44 15.3 23.0 17.5 44.2 100.0 5.6 11.5 4.6 78.2 100.0 1,176
45-49 23.8 18.1 18.5 39.6 100.0 9.7 9.4 7.0 73.9 100.0 646
Type of residence
Urban 7.1 10.3 6.6 76.0 100.0 3.3 4.3 2.1 90.3 100.0 6,478
Rural 10.1 14.4 12.1 63.5 100.0 4.3 8.3 4.2 83.1 100.0 4,822
Nomadic 10.1 20.4 16.1 53.4 100.0 3.4 12.1 5.9 78.6 100.0 5,138
Education
No education 10.1 17.3 12.9 59.7 100.0 4.2 9.6 4.6 81.6 100.0 12,266
Primary 6.3 8.6 7.6 77.6 100.0 2.4 3.6 2.1 92.0 100.0 2,531
Secondary 4.0 4.6 3.2 88.2 100.0 1.2 2.3 1.4 95.2 100.0 1,214
Higher 4.6 3.5 4.5 87.5 100.0 2.3 1.1 2.4 94.3 100.0 427
Wealth quintile
Lowest 10.3 21.2 15.9 52.6 100.0 3.4 11.2 5.2 80.2 100.0 3,471
Second 8.7 19.9 15.1 56.2 100.0 3.6 13.8 6.4 76.2 100.0 2,917
Middle 10.0 13.5 9.8 66.7 100.0 4.7 6.5 3.1 85.6 100.0 3,047
Fourth 9.0 10.5 8.9 71.6 100.0 4.3 5.4 2.6 87.8 100.0 3,452
Highest 6.7 8.9 6.7 77.7 100.0 2.4 3.4 2.6 91.6 100.0 3,551
Total number of women
8.9 14.7 11.2 65.3 100.0 3.6 7.9 3.9 84.5 100.0 16,438
Table 11.4 Ownership of assets
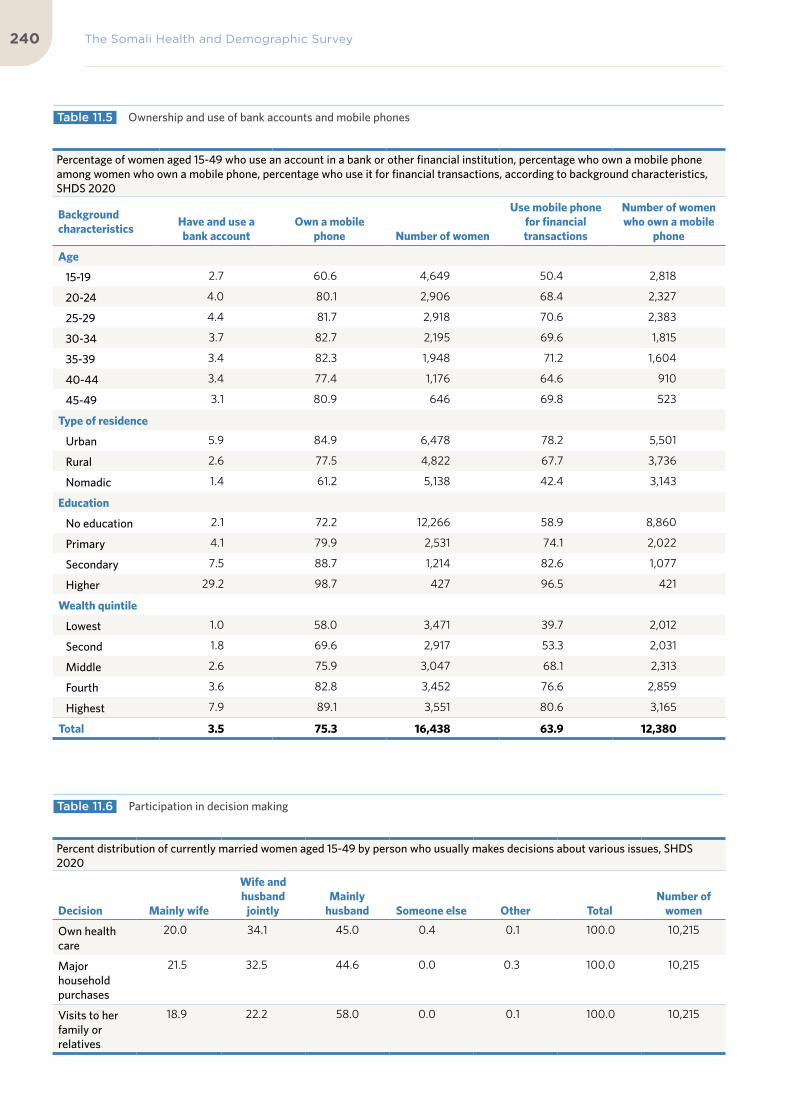
The Somali Health and Demographic Survey240
Percentage of women aged 15-49 who use an account in a bank or other financial institution, percentage who own a mobile phone among women who own a mobile phone, percentage who use it for financial transactions, according to background characteristics, SHDS 2020
Background characteristics
Have and use a bank account
Own a mobile phone Number of women
Use mobile phone for financial transactions
Number of women who own a mobile
phone
Age
15-19 2.7 60.6 4,649 50.4 2,818
20-24 4.0 80.1 2,906 68.4 2,327
25-29 4.4 81.7 2,918 70.6 2,383
30-34 3.7 82.7 2,195 69.6 1,815
35-39 3.4 82.3 1,948 71.2 1,604
40-44 3.4 77.4 1,176 64.6 910
45-49 3.1 80.9 646 69.8 523
Type of residence
Urban 5.9 84.9 6,478 78.2 5,501
Rural 2.6 77.5 4,822 67.7 3,736
Nomadic 1.4 61.2 5,138 42.4 3,143
Education
No education 2.1 72.2 12,266 58.9 8,860
Primary 4.1 79.9 2,531 74.1 2,022
Secondary 7.5 88.7 1,214 82.6 1,077
Higher 29.2 98.7 427 96.5 421
Wealth quintile
Lowest 1.0 58.0 3,471 39.7 2,012
Second 1.8 69.6 2,917 53.3 2,031
Middle 2.6 75.9 3,047 68.1 2,313
Fourth 3.6 82.8 3,452 76.6 2,859
Highest 7.9 89.1 3,551 80.6 3,165
Total 3.5 75.3 16,438 63.9 12,380
Percent distribution of currently married women aged 15-49 by person who usually makes decisions about various issues, SHDS 2020
Decision Mainly wife
Wife and husband
jointlyMainly
husband Someone else Other TotalNumber of
women
Own health care
20.0 34.1 45.0 0.4 0.1 100.0 10,215
Major household purchases
21.5 32.5 44.6 0.0 0.3 100.0 10,215
Visits to her family or relatives
18.9 22.2 58.0 0.0 0.1 100.0 10,215
Table 11.5 Ownership and use of bank accounts and mobile phones
Table 11.6 Participation in decision making

241
Table 11.7 Attitude toward wife beating: Women
Percentage of all women aged 15-49 who agree that a husband is justified in hitting or beating his wife for specific reasons, by background characteristics, SHDS 2020
Background characteristics
Husband is justified in hitting or beating his wife if she:
Percentage who agree with
at least one specified reason
Number of women
Neglects household
dutiesShe argues
with him
Goes out without
telling himWastes
resources
Neglects the
children
Refuses to have sex with
him
Age
15 - 19 24.6 24.9 23.6 25.4 25.5 24.7 36.7 4,649
20 - 24 25.5 25.6 24.8 25.3 25.6 25.4 36.6 2,906
25 - 29 24.4 23.4 22.6 24.5 25.2 24.7 35.5 2,918
30 - 34 26.0 25.8 23.7 25.7 26.2 25.4 35.8 2,195
35 - 39 27.0 26.7 24.7 26.1 26.4 26.6 36.6 1,948
40 - 44 28.7 27.9 25.4 28.1 29.4 27.2 38.7 1,176
45 - 49 25.9 23.8 22.8 24.4 24.7 25.3 32.0 646
Employment
Not employed 26.4 26.0 24.0 26.2 26.7 26.5 36.9 10,346
Employed for cash 29.8 30.6 28.7 28.2 28.7 28.2 38.4 847
Employed, not for cash
18.9 20.0 17.4 23.9 20.9 27.3 33.7 236
Number of living children
0 23.0 23.4 22.7 23.5 23.9 23.1 35.3 6,095
1-2 26.9 26.9 23.8 27.3 26.6 27.6 36.6 2,833
3-4 26.7 25.7 25.1 26.0 27.5 26.5 37.3 3,219
5+ 27.4 26.6 24.6 26.7 27.2 26.1 36.8 4,292
Type of residence
Urban 22.3 23.2 22.3 23.3 24.4 23.0 33.8 6,478
Rural 26.5 26.4 25.0 25.8 27.6 26.2 37.6 4,822
Nomadic 28.6 26.7 24.8 27.9 26.2 27.4 38.2 5,138
Mother’s education
No education 27.4 26.5 24.6 27.1 27.1 26.9 37.8 12,266
Primary 21.4 23.5 22.3 22.5 23.7 22.9 34.0 2,531
Secondary 18.1 19.2 22.3 18.3 20.7 18.2 29.0 1,214
Higher 17.9 17.2 18.1 16.6 20.8 15.1 28.4 427
Wealth quintile
Lowest 35.0 33.1 30.1 34.6 32.5 33.9 44.2 3,471
Second 24.8 24.5 23.2 25.5 24.9 25.2 35.7 2,917
Middle 27.9 28.5 25.2 28.0 28.9 27.1 39.9 3,047
Fourth 22.0 23.1 23.2 21.9 23.8 22.1 34.1 3,452
Highest 18.1 17.5 17.8 18.0 19.8 18.7 28.1 3,551
Total 25.5 25.3 23.9 25.5 25.9 25.3 36.3 16,438

The Somali Health and Demographic Survey242
Percentage of currently married women aged 15-49 who participate in all decision making and the percentage who disagree with all of the reasons justifying wife beating, by value on each of the indicators of women empowerment, SHDS 2020
Empowerment indicator Percentage who participate in all decision making
Percentage who disagree with all the reasons justifying wife
beating Number of women
Number of decisions in which women participate
0 n/a 53.4 3,593
1-2 n/a 55.8 3,354
3 n/a 64.6 3,268
Number of reasons for which wife beating is justified
0 35.8 n/a 5,900
1-2 26.2 n/a 942
3-4 23.1 n/a 806
5 28.1 n/a 2,567
n/a = Not applicable
Table 11.8 Indicators of women’s empowerment

243

12Chronic Diseases, Disability, Out-of-Pocket Health Expenditure and Social Habits

©A
U U
N I
ST P
HO
TO
/To
bin
Jo
nes

KEY FINDINGS
CHRONIC DISEASES
6%of the population su�ers from at least one chronic disease
CARE OF DISABLED PERSONS
42%of disabled people in Somalia had not received any care nor support for their disability during the 12 months preceding the survey
OUT-OF-POCKET HEALTH EXPENSES
48%of households paid their health expenses from their income
PREVALENCE OF MOSTCOMMON DISEASES
33%Blood pressure
20%Diabetes
8%Kidney diseases
8%Arthritis
DISABILITY
5%prevalence of disability in the population

The Somali Health and Demographic Survey248
This chapter presents information
on the prevalence, diagnosis and
treatment of chronic diseases in
Somalia. It also offers information
on the prevalence of disability,
the origin and age at onset of
disability, and care and support
available for people with
disabilities. Based on the findings
of the SHDS, information on out-
of-pocket health expenditure
and selected social habits is also
presented in this chapter.
Chronic diseases are defined broadly as conditions that last 1 year or more and require ongoing medical attention or limit activities of daily living or both according to the National Center for Chronic Disease and Prevention and Health Promotion of the United States of America (CDC 2020). Chronic diseases generally cannot be prevented by vaccines or cured by medication and can lead to long-term disability. They place burdens and demands on a health care system and are a leading cause of death worldwide.
The SHDS obtained information from household respondents on whether each household member suffered from one or more
chronic diseases and whether the disease was diagnosed by a physician and treated. Further to this, the survey gathered information about household members suffering from any physical, mental or other state that limited them from engaging in their normal activities.
Interviewers obtained information from the household respondents if any household member had been injured. If the answer to any of these questions was affirmative, follow-up questions were asked about the type of disease, disability, and/or injury.
Interviewers also obtained information on sicknesses that families experienced over the one month preceding the survey, in addition to expenditure on health services received.
Prevalence of Chronic DiseasesTable 12.1 presents data on household members who have at least one chronic disease. Overall, 6 percent of Somali household members were reported to be suffering from at least one chronic disease.
Urban household members have a slightly higher reported prevalence of chronic diseases, at 7 percent, than rural and nomadic
12 C H R O N I C D I S E A S E S , D I S A B I L I T Y, O U T-O F - P O C K E T H E A LT H E X P E N D I T U R E A N DS O C I A L H A B I T S

249
household members, at 5 percent and 4 percent respectively. On comparing data for men and women, it can be observed that more women than men reported to have at least one chronic disease, at 7 percent and 5 percent respectively. The prevalence of at least one chronic disease increased from 4 percent of those in the lowest wealth quintile or poorest households to 7 percent of those in the wealthiest or highest quintile.
As noted, disease prevalence increases rapidly with age. The reported prevalence of people with at least one chronic disease increased from 2 percent in the age group 0-4 years to 14 percent in the age group 40-44 years, to 20 percent in people over 70 years of age (Table 12.1 and Figure 12.1).
Diagnosis and Treatment of Chronic Diseases
Table 12.2 presents data on the distribution of household members who have specific chronic diseases diagnosed by a physician and those who receive treatment regularly. The findings show that, overall, 5 percent of
household members were reported to have been diagnosed by a physician and 3 percent are undergoing regular treatment for a chronic disease.
More women than men were diagnosed by a physician, at 5 percent and 4 percent respectively. Similarly, more women than men are undergoing regular treatment for the diseases, at 4 percent versus 3 percent respectively. More urban residents reported having been diagnosed by a physician, at 5 percent, compared to rural and nomadic residents at 4 percent and 2 percent, respectively. Similarly, more urban residents (4 percent), reported they had received treatment for chronic diseases, compared to rural and nomadic residents (2 percent and 1 percent respectively). Despite there being health facilities available in the cities, the difference in the overall frequency of diagnosis and treatment between urban and rural settings is small.
The survey found that the percentage of household members diagnosed by a physician with at least one chronic disease and those who received treatment regularly increased as wealth levels increased. Six percent of household members in the wealthiest households were diagnosed by a physician, while 5 percent received treatment. In contrast,
Percentage of household members who have at least one chronic disease
Figure 12.1 Prevalence of chronic diseases
1.9 2.2 2.6
4.4
6.9
8.5
10.711.4
14.213.7 13.9
12.2
16.517.5
20.2
0-4 5-9 10-14 15-19 20-24 25-29 30-34 35-39 40-44 45-49 50-54 55-59 60-64 65-69 70+

The Somali Health and Demographic Survey250
3 percent of household members from the lowest wealth quintile or poorest households were diagnosed by a physician, and 1 percent received treatment.
Figure 12.2 compares household members whose chronic diseases were diagnosed by a physician against those who get treatment for chronic diseases regularly. The findings indicate that more of those diagnosed in the younger age groups are treated, as compared to those in the older age groups. In the age group 10-14 years, 2 percent were diagnosed by a physician, while 1 percent received treatment. In the age group 60-64 years, 14 percent were reported to have been diagnosed by a physician, while 9 percent received treatment for chronic diseases they have.
Table 12.3 presents the prevalence of the most common specific chronic diseases diagnosed by a physician, by type of condition, place of residence and sex. The findings show that the most common chronic diseases were: blood pressure anomalies/hypertension, which affects 33 percent of household members, and diabetes, which affects 20 percent of the household members. Eight percent of household members are suffering from kidney
diseases, and another 7 percent suffer from chronic headaches. Eight percent of household members have arthritis and another 6 percent have inflammation or ulcers. Other diseases that are common include asthma (6 percent), heart diseases (5 percent), chronic back pain (5 percent), as well as liver diseases, anaemia, epilepsy, mental illness and skin diseases, each of which affects about 4 percent of household members.
The table shows that more urban and rural residents were diagnosed with blood pressure, at 34 percent and 33 percent respectively, compared to those residing in nomadic areas, at 25 percent. More urban residents, at 23 percent, than rural residents, at 15 percent, were diagnosed with diabetes. Even fewer cases of diabetes were diagnosed among nomadic households, at 8 percent. More women than men were reported to have been diagnosed with hypertension, kidney disease and arthritis, at 35 percent versus 31 percent, 8 percent versus 7 percent, and 10 percent versus 4 percent, respectively. More men than women were reported to have been diagnosed with diabetes, mental illnesses and liver diseases, at 24 percent versus 18 percent, 6 percent versus 3 percent, and 5 versus 3 percent respectively.
1.5 1.6 1.9
3.3
5.66.5
8.49.3
11.7 11.4 11.510.4
14.214.9
17.7
0.9 1.3 1.12.0
3.74.2
5.66.2
8.4 8.17.6
6.5
8.8
11.6
12.8
0-4 5-9 10-14 15-19 20-24 25-29 30-34 35-39 40-44 45-49 50-54 55-59 60-64 65-69 70+
Percentage of population who have at least one chronic disease diagnosed by physician
Percentage of population who have at least one chronic disease and get treated
Percentage of household members who have at least one chronic disease, diagnosed by a physician, and who get treatment
Figure 12.2 Chronic diseases diagnosed and treated

251
The findings further show that, on the whole, more nomadic household members than urban and rural ones were diagnosed with kidney diseases, liver diseases, chronic back pain, anaemia, and prostatic hypertrophy diseases at 14 percent, 12 percent, 8 percent, 7 percent and 4 percent respectively. In urban and rural areas, overall, fewer people were diagnosed with these diseases, at 7 percent, 4 percent, 5 percent, 4 percent and 0.3 percent, respectively, for urban populations; and at 8 percent, 4 percent, 5 percent, 3 percent and 1 percent, respectively, for rural populations.
Prevalence of Disability Table 12.4 presents data on the distribution of the prevalence of disability of household members by sex, age, wealth quintiles and residence. It should be noted that respondents’ reports of disability were not verified by any clinical diagnosis; therefore, the percentages presented should be interpreted with caution.
Overall, around 5 percent of the population
suffers from disabilities, according to findings from the SHDS.1 The prevalence of disability among females and males is the same, at 5 percent. In the youngest age group, 5 percent of under-fives suffer from disabilities. The prevalence of disability dropped to 3 percent in the slightly older age group of 5-9 years, before steadily rising to 14 percent for those aged 70 years and above. The pattern of people suffering from disabilities in both urban and rural areas is almost the same at 5 percent each and fewer people, at 2 percent, suffering from disabilities in nomadic areas.
Household members from the lowest wealth quintile or poorest households suffer from fewer disabilities than others, at 3 percent. Between 5 and 6 percent household members from all other wealth levels suffer from disabilities.
The most common disability reported in all the three types of residences was challenges with eyesight, which was reported by 2 percent each of household members in both urban and
1 The SHDS questionnaires referred to visual and hearing impairments, speech/communication challenges, mobility impairment, learning challenges, self-care challenges and mental health challenges as disabilities.
33.3
20.4
7.6
7.5
7.1
6.2
5.9
5.4
5.1
4.4
Blood pressure
Diabetes
Kidney diseases
Arthritis
Chronic headache
Asthma
Inflammation/ulcers
Heart diseases
Chronic back pain
Anaemia
Percentage of household members who have specific chronic diseases diagnosed by a physician
Figure 12.3 Common chronic diseases

The Somali Health and Demographic Survey252
rural areas and 1 percent in nomadic areas.
Figure 12.4 presents the prevalence of disability by age group. It shows a “J-shaped” curve, with the prevalence of disability increasing sharply with age for those aged 70 years and above. Figure 12.5 shows the prevalence of the most common types of disabilities. These include disabilities in sight, hearing and mobility impairments, followed by mental health and speech disabilities.
Origin and Age at Onset of Disability
Table 12.5 presents data on the onset and causes of disability. For any household member with a disability, respondents were asked what they thought was the main reason for or cause of the disability. The analysis indicates that ageing and congenital (birth-related) problems were thought to be the main cause of disabilities. Ageing accounts for 22 percent of disabilities and congenital problems account for 15 percent. Other diseases and injuries/accidents account for 22 percent and 13
4.6
3.4 3.7 3.9 3.8
5.3 5.56.3 6.0
7.3
5.9 5.9
7.5
9.2
13.5
<5 5-9 10-14 15-19 20-24 25-29 30-34 35-39 40-44 45-49 50-54 55-59 60-64 65-69 70+
2.1
1.21.1
0.8
0.40.3
0.2
Sight Hearing Mobility Mental Speech Self-Care Learning
Figure 12.4 Disability prevalence by age
Figure 12.5 Common types of disabilities
Prevalence of household members with disabilities
Percentage of people suffering from specific types of disabilities

253
percent respectively. The percentage of those suffering from congenital causes of disability declines with increasing age, while disabilities associated with ageing increase with age.
Ageing accounts for a larger proportion of disabilities among females, at 27 percent, than males, at 17 percent, while congenital diseases account for a larger proportion of disabilities among males, at 17 percent, than females, at 14 percent.
Table 12.6 presents data on the age at onset of disability. Differences by type of residence are minimal. Differences by sex and age group are substantial. As expected, by definition, younger disabled people, the onset of disability
occurred at an earlier age. Overall, 30 percent of household population reported onset of disability to have started when they were under the age of five (Figure 12.6). Thirty-six percent of males and 26 percent of females stated that they had first experienced their disabilities under the age of five. The most common disability reported to have started during this period is speech, at 59 percent.
Slightly more nomadic household members, at 35 percent, reported their disabilities started while they were under the age of five, compared to 30 percent each in both urban and rural areas.
30.4
11.612.2 12.6
11.9
8.7
6.1
3.82.6
<5 5-9 10-19 20-29 30-39 40- 49 50-59 60-69 70+
Figure 12.6 Age at onset of disability
Percentage distribution of disabled people according to age at onset of disability
The prevalence of disability among females and males is the same, at 5 percent


More urban residents reported having been diagnosed by a physician, as compared to rural and nomadic residents
©U
NFP
A S
OM
ALI
A/T
ob
in J
on
es

The Somali Health and Demographic Survey256
Care and Support for Persons with DisabilitiesTable 12.7 presents the percentage distribution of persons with disabilities who received any kind of care and support for their conditions during the 12 months prior to the survey, by background characteristics. This includes medical care, welfare, financial support and nutritional support.
The findings indicate that 42 percent of persons with disabilities in Somalia had not received any care or support for their condition in the 12 months preceding the survey. Fifty-six percent of disabled household members received medical care, while 1 percent received welfare, 3 percent received financial support and 1 percent received nutritional support (Figure 12.7).
Forty-three percent of men and 42 percent of women said they had not received any medical care, welfare, financial or nutritional support for their disability in the 12 months preceding the survey.
Household Out-of-Pocket Health Expenditure and Health-Seeking BehaviourOut-of-pocket payments are expenditures borne directly by a patient where insurance does not cover the cost of the health service (OECD 2006). These expenses could be medical as well as non-medical. Out-of-pocket medical expenditures could be payments towards doctors’ fees, medicine, diagnostics, operations, ambulance services, etc. (OECD 2006). Overall, health expenditure could amount to catastrophic levels that plunge families deeper into poverty. The World Bank defines catastrophic health expenditure as payments for health services exceeding 40 percent of household disposable income after subsistence needs are met.
Since the collapse of the Somali health care infrastructure three decades ago, most of the Somali households have not had any form of financial protection, and were forced to make out-of-pocket payments when they fell sick. Often, families resort to borrowing money or selling assets to meet these expenditures.
55.7
1.3 2.60.6
42.4
Medical Welfare Financial Nutritional No Support
Figure 12.7 Support received by household members for people with disabilities
Percentage distribution of disabled people who received any kind of care and support for their disabilities in the 12 months preceding the survey

257
The SHDS 2020 collected information on out-of-pocket expenditure. In the Household Questionnaire, households were asked whether advice or treatment was sought for any household members’ health conditions and the source of this advice or treatment. They were also asked how much money the household spent on treatment and health care services in the one month preceding the survey. The survey also collected information about what financial sources the household used to pay for any health expenditure.
Table 12.8 shows that 19 percent of households had at least one household member sick in the last month preceding the survey. Among these households, 66 percent sought advice or treatment for the household member.
Seventy-one percent of urban households and 64 percent of rural households sought medical advice or treatment for their health problems. Nomadic households were the least likely to seek medical advice and treatment, at 31 percent.
27.4
14.9
13.6
12.6
2.4
2.2
2.2
1.3
0.7
Private hospital/clinic/doctor
Government hospital
Pharmacy
MCH/HC
Primary health unit
Mobile clinic
Referral health centre
Other private medical sector
Other public sector
47.8
25.3
13.9
10.7
4.0
3.1
2.0
Income
Relatives/friends
Borrowing
Sold assets
Savings
Other
Insurance
Figure 12.9 Source of payment of health services
Figure 12.8 Source of advice or treatment
Household members who have been sick and where they sought advice/treatment
Percentage distribution of financial sources used for health services in the month preceding the survey by households

The Somali Health and Demographic Survey258
Fifteen percent of households had visited a government hospital for advice or treatment compared to 27 percent who had visited private hospitals, clinics or doctors. Fourteen percent of households had sought advice or treatment from pharmacies compared to 13 percent from Mother Child Health (MCH) clinics and/or health centres (HC) (Figure 12.8).
The highest wealth quintile or wealthiest households sought more medical advice and treatment compared to the poorest, at 84 percent and 45 percent respectively. Further, the survey shows that 55 percent of the wealthiest households received medical advice and treatment from a private hospital, clinic or doctor, compared to 10 percent of the lowest wealth quintile or the poorest households.
Table 12.9 and Figure 12.9 present data on the financial sources that households use to pay for health expenditures. Forty-eight percent of households reported they pay for their health expenses from their income. Twenty-five percent of households reported their relatives or friends supported them to pay their health expenses. Fourteen percent borrowed money to pay for their health expenditure and 11 percent of the households sold assets to cover their health expenses. Only 2 percent of households used insurance for their health expenses.
On comparing data by wealth quintiles, it can be noted that 5 percent of the wealthiest households used their insurance coverage for their health expenses. Furthermore, 64 percent of the wealthiest households compared to 39 percent from the poorest households, used their income to pay for their health expenses.
Two percent of households in urban and rural areas used insurance to cover their health expenditure. Almost half of the urban and rural households—49 percent each—used their income to pay for medical expenses as compared to 26 percent of nomadic households.
Table 12.10 presents data on the amount of money the household spent on treatment and health care services during the month before
the start of the survey. The largest proportion of the respondents—43 percent—reported that they had spent between US$1 and US$49 for treatment and health care services in this time. Twenty-four percent of the respondents had spent between US$50 and US$99 for treatment and health care services during that month. Eighteen percent of the respondents had paid US$100-199 for treatment and health care services, and 13 percent of the respondents had paid US$300 or more for treatment and health care services during the month prior to the survey being conducted.
Tobacco Use and Khat2 ChewingTobacco use is not only a risk factor for medical conditions, but it also contributes to poverty by diverting household spending from basic needs, such as food and shelter, to tobacco. This spending behaviour is difficult to curb because tobacco is so addictive. The economic costs of tobacco use are substantial and include significant health care costs for treating the disease caused by tobacco use as well as the lost human capital that results from tobacco-attributable morbidity and mortality (WHO 2019).
Information about the use of tobacco and chewing of khat was collected for household members aged 10 years or older, who were asked whether they smoke or use any kind of tobacco or chew khat.
Table 12.11 presents the percentage of household members who smoke cigarettes or use tobacco, by background characteristics. The findings indicate that 4 percent of Somali household members smoke cigarettes or use tobacco products. Cigarette smoking or any other use of tobacco is rare among women (0.8%), whereas 8 percent of men smoke or use other tobacco products. The use of tobacco
2 Khat (also spelt ‘Qat’) is a plant found in the Horn of Africa and the Arabian Peninsula. Khat leaves are chewed as a stimulant and are said to cause euphoric effects.

259
generally increases with age.
Data analysed by place of residence shows that 6 percent of nomadic household members and 4 percent each of urban and rural household members smoke or use tobacco. Figure 12.10 shows that the use of tobacco or cigarette smoking decreases as wealth increases in households.
Household members with secondary-level of education are more likely to smoke (6 percent) than household members with no education,
primary-level education or higher education (4 percent).
Figure 12.11 compares the percentage of household members who chew khat and household members who smoke cigarettes or using any sort of tobacco. It shows that both the use of tobacco and chewing of khat generally increases with age and reaches a peak at the ages 65-69 and then declines in the older ages.
Table 12.12 presents the distribution of
5.5
4.4
3.93.6
3.5
Lowest Second Middle Fourth Highest
1.0
1.9
3.5
5.25.9
7.68.1
9.2
7.78.0
7.6
10.7
5.2
0.9
1.8
3.5
4.8
6.8
7.7
9.3
10.4
8.7
9.8
8.8
12.8
6.6
10-14 15-19 20-24 25-29 30-34 35-39 40-44 45-49 50-54 55-59 60-64 65-69 70+
Smoking Khat
Figure 12.11 Cigarette smoking, tobacco use and chewing of khat
Figure 12.10 Smoking/tobacco use by wealth quintile
Percentage of household members who smoke cigarettes or use tobacco, by wealth quintile
Percentage of household members who smoke cigarettes or use tobacco, and chew khat by age

The Somali Health and Demographic Survey260
household members who chew khat by background characteristics. It shows that 5 percent of members of Somali households chew khat or have chewed khat. The table also shows the significant gender differences in this practice—whereas 0.4 percent of women chew or have chewed khat, 9 percent of men stated they chew or have chewed khat. Among all age groups studied, it can be noted that the practice of chewing khat increases with the age of household members, peaking at 13 percent at the age group 65-69.
The data by place of residence indicates that urban dwellers are less likely to chew khat (4 percent), compared to people living in rural and nomadic households (5 percent and 6 percent respectively).
Khat consumption varied among people with different education levels and wealth status—6 percent of household members with secondary education and 5 percent of household members with higher education and no education consumed khat, whereas 4 percent of those with primary education chewed khat. Data by wealth quintiles indicates that the poorer household members are more likely to chew khat.
List of Tables
Table 12.1 Prevalence of chronic diseases 259
Table 12.2 Prevalence of chronic diseases diagnosed by a physician 260
Table 12.3 Prevalence of specific chronic diseases 261
Table 12.4 Prevalence of disability and common types of disability 262
Table 12.5 Origin of disabilities 263
Table 12.6 Age at onset of disability 264
Table 12.7 Care and support received for persons with disabilities 265
Table 12.8 Sources for advice or treatment 266
Table 12.9 Financial sources used to pay for health services 267
Table 12.10 Amount in health expenses 267
Table 12.11 Smoking or using tobacco 268
Table 12.12 Using of Khat 269

261
Percentage of household population who have at least one chronic disease, diagnosed by a physician, who get treatment regularly, by background characteristics, SHDS 2020
Background CharacteristicsPercentage of household
population who have at least one chronic disease Number of persons
Sex
Male 4.7 48,352
Female 6.7 50,632
Age
0-4 1.9 19,985
5-9 2.2 18,914
10-14 2.6 14,951
15-19 4.4 10,778
20-24 6.9 6,262
25-29 8.5 5,691
30-34 10.7 4,438
35-39 11.4 3,911
40-44 14.2 2,964
45-49 13.7 1,825
50-54 13.9 2,884
55-59 12.2 1,432
60-64 16.5 1,661
65-69 17.5 724
70+ 20.2 2,565
Type of residence
Urban 6.5 63,079
Rural 4.7 25,117
Nomadic 3.5 10,790
Wealth quintile
Lowest 3.9 19,956
Second 5.2 19,375
Middle 6.0 19,835
Fourth 6.9 19,865
Highest 6.5 19,954
Total1 5.7 98,9851Total includes household members with information on age missing.
Table 12.1 Prevalence of chronic diseases
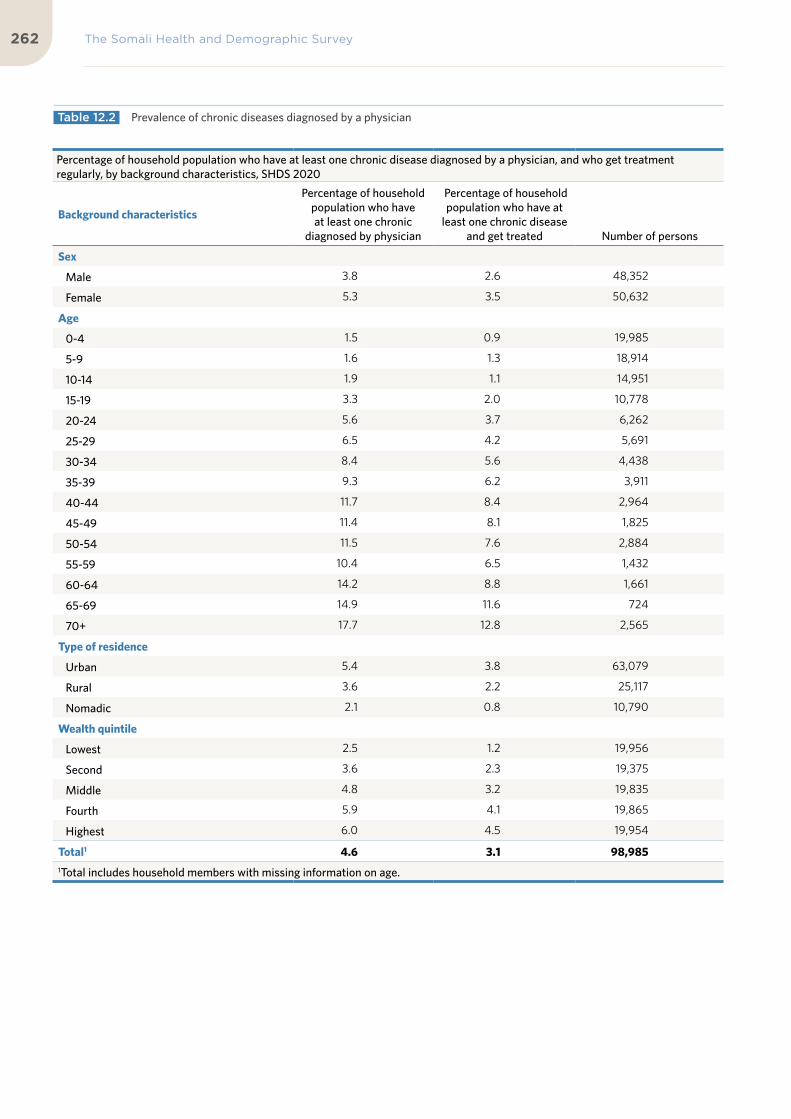
The Somali Health and Demographic Survey262
Percentage of household population who have at least one chronic disease diagnosed by a physician, and who get treatment regularly, by background characteristics, SHDS 2020
Background characteristics
Percentage of household population who have at least one chronic
diagnosed by physician
Percentage of household population who have at
least one chronic disease and get treated Number of persons
Sex
Male 3.8 2.6 48,352
Female 5.3 3.5 50,632
Age
0-4 1.5 0.9 19,985
5-9 1.6 1.3 18,914
10-14 1.9 1.1 14,951
15-19 3.3 2.0 10,778
20-24 5.6 3.7 6,262
25-29 6.5 4.2 5,691
30-34 8.4 5.6 4,438
35-39 9.3 6.2 3,911
40-44 11.7 8.4 2,964
45-49 11.4 8.1 1,825
50-54 11.5 7.6 2,884
55-59 10.4 6.5 1,432
60-64 14.2 8.8 1,661
65-69 14.9 11.6 724
70+ 17.7 12.8 2,565
Type of residence
Urban 5.4 3.8 63,079
Rural 3.6 2.2 25,117
Nomadic 2.1 0.8 10,790
Wealth quintile
Lowest 2.5 1.2 19,956
Second 3.6 2.3 19,375
Middle 4.8 3.2 19,835
Fourth 5.9 4.1 19,865
Highest 6.0 4.5 19,954
Total1 4.6 3.1 98,9851Total includes household members with missing information on age.
Table 12.2 Prevalence of chronic diseases diagnosed by a physician

263
Percentage of household members who have specific chronic diseases diagnosed by a physician, by place of residence and sex, SHDS 2020
Type of residence Sex of household member
TotalUrban Rural Nomadic Male Female
Type of disease
Blood pressure 33.9 33.2 25.1 31.2 34.7 33.3
Diabetes 22.8 14.6 7.9 23.6 18.2 20.4
Inflammation/ulcers 6.1 5.5 5.4 4.9 6.6 5.9
Anaemia 4.4 3.3 7.1 2.3 5.8 4.4
Sickle-cell anaemia 0.4 0.9 0.4 0.7 0.4 0.5
Heart disease 5.4 5.4 4.3 3.6 6.6 5.4
Kidney disease 7.0 8.1 13.6 6.6 8.3 7.6
Liver disease 3.6 3.5 11.5 5.0 3.3 4.0
Arthritis 7.8 6.4 7.5 4.4 9.7 7.5
Tuberculosis 3.4 1.8 2.0 3.4 2.7 3.0
Chronic headache 6.9 7.7 8.6 4.6 8.9 7.1
Stroke 1.6 1.9 1.3 2.3 1.2 1.6
Epilepsy 3.8 4.2 2.8 4.8 3.2 3.9
Prostatic hypertrophy 0.3 0.5 4.1 0.7 n/a 0.7
Cataract 0.9 0.7 1.4 0.4 1.3 0.9
Chronic back pain 4.9 5.1 8.4 3.4 6.3 5.1
Mental/psychological illness
4.2 4.6 4.7 6.0 3.1 4.3
Skin disease 3.9 4.1 4.3 3.2 4.5 4.0
Cancerous tumors 0.5 0.5 1.5 0.6 0.4 0.5
Asthma 5.7 7.5 8.2 6.2 6.2 6.2
Others 8.9 9.9 13.3 8.9 9.7 9.3
Table 12.3 Prevalence of specific chronic diseases

The Somali Health and Demographic Survey264
Prevalence of household members with disabilities, and percentage who suffer from specific types of disabilities, by background characteristics, SHDS 2020
Background characteristics
Prevalence of disabled
persons Total
Among household members with disabilities, percentage who suffer from specific types of disabilities
Number of household members
with disabilities1Sight Hearing Speech Learning Mobility
Self-care Mental
Sex
Male 4.6 48,352 1.9 1.0 0.4 0.2 1.1 0.2 0.9 2,212
Female 4.9 50,632 2.3 1.4 0.4 0.2 1.1 0.3 0.7 2,489
Age
<5 4.6 19,985 1.7 1.1 0.6 0.2 1.2 0.3 0.9 926
5-9 3.4 18,914 1.3 0.9 0.4 0.1 0.9 0.2 0.7 652
10-14 3.7 14,951 1.7 0.9 0.3 0.1 0.9 0.2 0.8 558
15-19 3.9 10,778 1.8 1.0 0.3 0.1 0.8 0.2 0.8 423
20-24 3.8 6,262 1.5 0.9 0.1 0.1 0.9 0.3 0.9 240
25-29 5.3 5,691 2.6 1.5 0.4 0.2 1.0 0.2 0.7 303
30-34 5.5 4,438 2.9 1.3 0.2 0.1 1.2 0.2 0.7 246
35-39 6.3 3,911 3.1 1.7 0.2 0.1 1.6 0.3 0.5 247
40-44 6.0 2,964 2.8 1.4 0.6 0.3 1.3 0.2 0.7 179
45-49 7.3 1,825 3.8 1.4 0.3 0.2 1.8 0.5 0.8 134
50-54 5.9 2,884 2.7 1.4 0.3 0.1 1.6 0.2 0.5 170
55-59 5.9 1,432 3.7 1.2 0.2 0.2 1.0 0.1 0.3 85
60-64 7.5 1,661 3.7 1.7 0.3 0.3 2.2 0.5 0.7 125
65-69 9.2 724 3.5 3.5 1.4 1.3 2.6 1.2 1.0 66
70+ 13.5 2,565 7.2 4.2 0.9 0.4 3.3 1.1 1.9 347
Type of residence
Urban 5.3 63,079 2.4 1.3 0.4 0.2 1.2 0.3 0.9 3,357
Rural 4.5 25,117 1.9 1.3 0.4 0.1 1.1 0.3 0.8 1,137
Nomadic 1.9 10,790 0.8 0.6 0.2 0.1 0.4 0.2 0.2 207
Wealth quintile
Lowest 3.3 19,956 1.4 0.9 0.3 0.1 0.7 0.3 0.5 662
Second 5.2 19,375 2.0 1.6 0.4 0.1 1.2 0.3 0.9 1,004
Middle 4.9 19,835 2.2 1.2 0.5 0.1 1.1 0.4 0.9 972
Fourth 5.6 19,865 2.7 1.4 0.4 0.3 1.4 0.3 0.9 1,120
Highest 4.7 19,954 2.2 1.0 0.4 0.2 1.2 0.1 0.8 944
Total1 4.7 98,985 2.1 1.2 0.4 0.2 1.1 0.3 0.8 4,7011 Total includes household members with missing information on age
A person may have two reported diseases; consequently, the percentages reflect this information.
Table 12.4 Prevalence of disability and common types of disability

265
Percentage distribution of disabled people according to the origin of disabilities, by background characteristics, SHDS 2020
Background charact-eristics
Origin of disabilities
Total
Number of household
members with disabilitiesCongenital Contagious
Child birth conditions
Other disease Abuse Ageing
Injury/ accident
Witch-craft Others
Don’t know
Sex
Male 16.9 9.9 5.7 22.6 1.6 16.7 13.4 0.3 4.7 8.2 100.0 1,195
Female 13.8 11.6 3.1 20.9 0.9 27.2 13.1 0.1 2.6 6.8 100.0 1,445
Age
<5 28.6 9.2 10.8 20.1 1.8 13.1 6.8 0.1 4.0 5.4 100.0 198
5-9 22.5 9.7 9.5 22.3 0.6 9.4 12.1 0.6 3.7 9.7 100.0 230
10-14 24.9 12.8 11.0 16.1 0.9 9.2 15.0 0.0 3.0 7.0 100.0 242
15-19 24.9 10.9 2.7 26.3 0.7 10.8 13.3 0.6 3.5 6.2 100.0 210
20-24 18.2 16.4 2.5 15.7 0.3 15.4 16.8 0.0 7.4 7.3 100.0 149
25-29 14.9 11.1 2.8 25.9 0.0 25.1 10.1 0.0 1.3 8.8 100.0 237
30-34 11.3 13.2 2.8 23.1 3.6 18.8 15.4 0.0 2.8 9.1 100.0 212
35-39 12.7 8.3 1.8 21.8 1.3 27.0 16.7 0.6 4.6 5.3 100.0 224
40-44 4.5 11.6 3.3 23.9 1.4 31.7 10.8 0.0 3.9 8.9 100.0 158
45-49 8.4 11.9 0.3 16.0 0.0 21.8 25.7 0.0 3.2 12.7 100.0 120
50-54 9.0 5.9 3.8 27.4 0.3 28.0 10.2 0.3 6.6 8.4 100.0 139
55-59 7.8 7.3 1.8 28.4 1.9 21.6 24.6 0.2 0.3 6.1 100.0 76
60-64 5.7 12.6 0.5 16.1 4.1 39.5 16.4 0.0 0.9 4.3 100.0 109
65-69 11.5 6.3 0.0 30.5 0.0 32.4 2.4 0.0 1.4 15.5 100.0 51
70+ 6.1 10.4 1.5 19.3 1.4 44.3 8.5 0.0 4.2 4.3 100.0 284
Type of residence
Urban 14.6 9.4 4.0 21.7 1.5 21.2 14.9 0.2 3.8 8.7 100.0 1,817
Rural 16.8 13.2 4.4 22.5 0.7 24.9 10.0 0.2 3.0 4.2 100.0 616
Nomadic 15.2 15.8 5.9 19.2 0.2 25.5 8.4 0.2 3.3 6.4 100.0 207
Total 15.2 10.8 4.3 21.7 1.2 22.4 13.2 0.2 3.6 7.4 100.0 2,640
Table 12.5 Origin of disabilities

The Somali Health and Demographic Survey266
Percentage distribution of disabled people according to age at onset of disability, by background characteristics, SHDS 2020
Background characteristics
Age at onset of disabilityNumber of household members
with disabilities<5 5-9 10-19 20-29 30-39 40- 49 50-59 60-69 70+
Sex
Male 35.5 11.7 10.5 11.9 12.4 7.7 5.3 3.1 2.0 1,192
Female 26.2 11.5 13.7 13.1 11.5 9.6 6.8 4.4 3.1 1,445
Age
<5 100.0 198
5-9 56.5 43.5 230
10-14 47.5 19.7 32.7 242
15-19 37.2 14.2 48.7 209
20-24 21.8 13.0 19.3 45.9 149
25-29 24.2 10.4 7.3 58.1 237
30-34 17.5 7.6 10.7 13.1 51.1 212
35-39 24.9 6.1 8.4 8.1 52.5 224
40-44 11.3 5.7 11.3 6.5 11.8 53.4 158
45-49 13.0 0.4 8.3 4.3 16.8 57.1 119
50-54 10.0 6.7 2.5 12.3 9.8 17.8 40.9 139
55-59 9.6 8.3 4.5 17.8 6.4 9.4 44.0 76
60-64 9.0 5.2 7.5 9.9 6.3 23.3 22.7 16.0 109
65-69 20.6 11.2 1.7 3.6 6.9 3.7 10.1 42.1 51
70+ 8.1 6.4 3.6 7.4 6.9 6.8 14.7 21.7 24.3 283
Type of disability
Sight 20.2 9.4 12.5 14.9 14.6 12.0 8.2 4.9 3.4 1,193
Hearing 30.3 14.4 9.1 12.3 11.3 8.6 5.1 4.5 4.4 654
Speech 58.7 12.4 6.9 4.6 2.9 3.8 3.8 4.1 2.9 228
Learning 37.0 8.7 8.8 11.9 10.8 10.0 3.7 6.4 2.7 88
Mobility 31.7 13.1 11.0 10.8 12.1 7.9 6.3 3.4 3.7 623
Self-care 23.3 11.5 9.7 18.8 9.8 8.7 4.4 5.3 8.4 146
Mental 42.2 11.2 19.5 11.9 6.1 2.0 1.8 2.1 3.2 376
Type of residence
Urban 30.2 12.4 13.3 12.0 11.6 8.4 5.9 3.8 2.4 1,817
Rural 29.7 9.2 10.1 14.2 12.1 9.3 7.6 4.1 3.8 616
Nomadic 34.6 11.8 8.9 13.0 13.5 10.2 4.1 2.7 1.2 203
Total 30.4 11.6 12.2 12.6 11.9 8.7 6.1 3.8 2.6 2,636
Table 12.6 Age at onset of disability

267
Percentage distribution of disabled people who received any kind of care, and support for their disabilities in the last 12 months by background characteristics, SHDS 2020
Background characteristics
Care and support received Number of personsMedical Welfare Financial Nutritional No support
Sex
Male 53.8 1.0 3.1 0.5 42.5 2,212
Female 57.3 1.6 2.3 0.6 42.3 2,489
Age
0-4 25.3 1.8 1.6 0.7 63.7 926
5-9 35.5 2.3 3.0 0.4 57.2 652
10-14 44.5 1.4 2.1 0.4 50.4 558
15-19 49.1 1.1 3.5 1.2 47.6 423
20-24 58.0 2.3 3.3 0.0 38.7 240
25-29 77.8 0.5 2.0 0.2 24.3 303
30-34 81.6 1.3 3.2 0.4 17.0 246
35-39 87.5 1.0 2.9 0.0 14.5 247
40-44 82.4 0.0 4.2 0.3 21.2 179
45-49 90.0 0.3 2.9 1.4 12.1 134
50-54 81.0 0.0 1.0 0.0 24.8 170
55-59 79.1 0.5 10.6 0.0 21.6 85
60-64 84.4 0.3 1.9 0.0 24.0 125
65-69 71.2 0.6 6.4 0.6 25.2 66
70+ 80.0 1.1 1.7 1.8 40.8 347
Wealth quintile
Lowest 65.4 1.4 1.9 0.9 32.7 662
Second 53.7 2.2 1.7 0.5 47.2 1,004
Middle 54.0 1.7 2.3 0.5 44.4 972
Fourth 54.3 0.9 3.3 0.5 42.5 1,120
Highest 54.2 0.5 3.8 0.7 41.9 944
Total 55.7 1.3 2.6 0.6 42.4 4,701
Table 12.7 Care and support received for persons with disabilities

The Somali Health and Demographic Survey268
Perc
enta
ge o
f hou
seho
lds
wit
h m
embe
rs w
ho h
ave
been
sic
k in
the
last
mon
th, a
mon
g th
e ho
useh
olds
wit
h m
embe
rs w
ho h
ave
been
sic
k in
the
last
mon
th a
nd s
eek
advi
ce o
r tr
eatm
ent,
whe
re th
ey s
ough
t adv
ice
or tr
eatm
ent b
y ba
ckgr
ound
ch
arac
teri
stic
s, S
HD
S 20
20
Back
grou
nd
Cha
ract
er-
isti
cs
Perc
enta
ge
of
hous
ehol
ds
wit
h m
embe
rs
who
hav
e be
en s
ick
in th
e la
st
mon
thN
umbe
r of
ho
useh
olds
Am
ong
hous
ehol
ds w
ith
mem
bers
who
hav
e be
en
sick
in th
e la
st m
onth
:
Pub
lic S
ecto
r
Pri
vate
Med
ical
Sec
tor
Oth
er S
ourc
e
Perc
enta
ge
who
hav
e be
en s
ick
and
did
not
seek
any
ad
vice
or
trea
tmen
t
Num
ber
of
hous
ehol
ds
wit
h m
embe
rs
who
hav
e be
en s
ick
in th
e la
st
mon
th a
nd
soug
ht
advi
ce o
r tr
eatm
ent
Per
cent
age
who
hav
e be
en s
ick
and
soug
ht
any
advi
ce o
r tr
eatm
ent
Num
ber
of
hous
ehol
ds
wit
h m
em-
bers
who
ha
ve b
een
sick
in th
e la
st m
onth
G
over
nmen
t H
ospi
tal
Refe
rral
H
ealt
h C
entr
eM
CH
/H
C
Prim
ary
Hea
lth
Uni
tM
obile
C
linic
Oth
er
Publ
ic
Sect
or
Priv
ate
Hos
pita
l/C
linic
/D
octo
rPh
arm
a-cy
Oth
er P
ri-
vate
Med
i-ca
l Sec
tor
Sh
opO
ther
s
Type
of
resi
denc
e
Urb
an20
.99,
779
71.0
2,0
48
12
.91.
914
.82.
72.
40
.9
32.3
14.1
1.6
0
.20
.829
.01,
453
Rura
l17
.84
,536
64.2
80
7
21.3
2.1
9.6
1.8
2.2
0.5
19
.714
.80
.8
00
.435
.851
8
Nom
adic
10.3
2,0
45
31.0
211
9.
55.
32.
91.
30
.60
.1
9.4
3.2
0.2
0
1.5
68.8
66
Wea
lth
quin
tile
Low
est
14.6
3,60
54
4.8
528
14
.02.
911
.90
.71.
50
.5
9.7
7.6
0.2
0
.61.
055
.223
6
Seco
nd20
.73,
763
60.8
778
15
.62.
017
.82.
32.
90
.6
16.3
16.5
1.0
0
.20
.139
.24
73
Mid
dle
20.0
3,21
970
.864
4
17.0
2.7
16.9
2.1
2.7
0.8
22
.118
.01.
4
00
.829
.14
56
Four
th20
.13,
016
73.0
607
14
.12.
28
.03.
02.
60
.4
39.4
12.4
1.8
0
1.3
27.0
44
3
Hig
hest
18.5
2,75
78
4.1
509
13
.01.
15.
43.
81.
11.
5
55.0
11.1
2.2
0
0.6
15.9
428
Tota
l18
.71,
6360
66.4
3,0
66
14.9
2.2
12.6
2.4
2.2
0.7
27
.413
.61.
3
0.1
0.7
33.5
2,0
37
Tab
le 1
2.8
So
urce
s fo
r ad
vice
or
trea
tmen
t

269
Percentage distribution of financial sources used for health services by households in the last month by background characteristics, SHDS 2020
Background characteristics
Financial sources for health services
Number of householdsIncome Insurance Savings Borrowing
Relatives/Friends Sold Assets Other
Type of residence
Urban 48.5 2.0 4.9 14.4 25.9 10.8 3.7 1,318
Rural 48.7 2.2 1.3 12.4 23.0 9.2 0.7 462
Nomadic 25.6 0.0 3.8 14.0 31.4 21.2 8.6 59
Wealth quintile
Lowest 38.6 1.0 1.4 14.3 23.3 10.5 2.5 199
Second 38.9 2.1 1.5 13.8 26.2 13.6 3.2 417
Middle 40.4 0.6 2.1 15.7 26.5 13.7 2.5 415
Fourth 52.6 1.1 4.3 14.4 27.6 6.9 2.6 407
Highest 64.3 4.8 9.5 11.3 22.0 8.6 4.2 401
Total 47.8 2.0 4.0 13.9 25.3 10.7 3.1 1,839
Amount of money that households incurred for health services in the last month by background characteristics, SHDS 2020
Amount in health expenses (US $) Number of households1-49 50-99 100 -199 200- 299 300+ Total
Type of residence
Urban 42.7 23.1 18.8 2.8 12.6 100.0 1,215
Rural 45.0 24.0 13.5 4.0 13.5 100.0 390
Nomadic 22.4 30.6 19.4 10.4 17.1 100.0 55
Total 42.6 23.6 17.6 3.3 12.9 100.0 1,660
Table 12.9 Financial sources used to pay for health services
Table 12.10 Amount in health expenses

The Somali Health and Demographic Survey270
Percentage of household members who smoke cigarettes or use tobacco by background characteristics, SHDS 2020
Background characteristics Percentage of household members who smoke cigarettes or use tobacco
Number of household members
Sex
Male 7.9 28,649
Female 0.8 31,437
Age
10-14 1.0 14,951
15-19 1.9 10,778
20-24 3.5 6,262
25-29 5.2 5,691
30-34 5.9 4,438
35-39 7.6 3,911
40-44 8.1 2,964
45-49 9.2 1,825
50-54 7.7 2,884
55-59 8.0 1,432
60-64 7.6 1,661
65-69 10.7 724
70+ 5.2 2,565
Type of residence
Urban 3.9 38,282
Rural 4.1 15,160
Nomadic 5.8 6,643
Education
No education 4.2 43,412
Primary 3.7 9,782
Secondary 5.6 4,565
Higher 3.5 2,326
Wealth quintile
Lowest 5.5 12,053
Second 4.4 11,441
Middle 3.9 11,902
Fourth 3.6 12,128
Highest 3.5 12,561
Number of household members 4.2 60,085
Table 12.11 Smoking or using tobacco

271
Percentage of household members who use khat by background characteristics, SHDS 2020
Background characteristics Percentage of household members who use khat
Number of household members
Sex
Male 9.0 28,649
Female 0.4 31,437
Age
10-14 0.9 14,951
15-19 1.8 10,778
20-24 3.5 6,262
25-29 4.8 5,691
30-34 6.8 4,438
35-39 7.7 3,911
40-44 9.3 2,964
45-49 10.4 1,825
50-54 8.7 2,884
55-59 9.8 1,432
60-64 8.8 1,661
65-69 12.8 724
70+ 6.6 2,565
Type of residence
Urban 4.1 38,282
Rural 4.7 15,160
Nomadic 6.2 6,643
Education
No education 4.5 43,412
Primary 3.8 9,782
Secondary 5.7 4,565
Higher 4.8 2,326
Wealth quintile
Lowest 6.1 12,053
Second 4.5 11,441
Middle 4.1 11,902
Fourth 4.0 12,128
Highest 3.7 12,561
Number of household members 4.5 60,085
Table 12.12 Use of Khat

13Adult and Maternal Mortality

©A
U U
N I
ST P
HO
TO
/To
bin
Jo
nes

KEY FINDINGS
MATERNAL MORTALITY RATIO (MMR)
The Maternal Mortality Ratio is estimated at
maternal deaths per692
live births100,000
ADULT MORTALITY
25%of women
24%of men
MATERNAL MORTALITY RATE (MMRATE)
women aged 15-49 die due to pregnancy- or birth-related complications
1 in 1,000
LIFETIME RISK OFMATERNAL MORTALITY (LTR)
1 in 20 womenwould be expected to die from pregnancy-related causes during their reproductive lifetime
and
who have reached the age of 15 are likely to die before the age of 50

The Somali Health and Demographic Survey276
This chapter presents adult and
maternal mortality measures for
the country. The chapter includes
a summary measure (35q15) that
represents the probability of
dying between the ages of 15 and
50—that is, between the 15th and
50th birthdays.
Adult and maternal mortality indicators can be used to assess the health status of a population. In most developing countries, reproductive health is a major concern, hence the need for reliable data on maternal deaths.
The estimation of mortality rates requires complete and reliable data on adult and maternal deaths. To obtain an estimate of adult mortality, the SHDS 2020 collected data from all listed households on the occurrence of all deaths in the households over the two years preceding the survey. For the deaths of women of reproductive age, questions were asked on the time and cause of death to determine if any of the death was maternity-related, which permits the estimation of maternal mortality.
Adult MortalityNormally, direct estimates of male and female adult mortality are obtained from information collected in the sibling history table in a survey of this kind. However, the male and female adult mortality table presented in this report is obtained from data on deaths that occurred in the two years preceding the survey. This data was collected to obtain a more recent estimate of maternal mortality. The age-specific death rates are computed by dividing the number of deaths in each age group by the total person-years of exposure in that age group during a specified reference period. Direct estimates of age-specific mortality rates for males and females are shown in Table 13.1. The direct estimates are presented for the period of seven years of exposure. The data is aggregated in five-year age groups for the age range of 15 to 49 years. Overall, there were more female deaths than male deaths (1,712 female deaths and 1,263 male deaths). The death rate of women aged 15 to 49 years (7.58 deaths per 1,000 population) is higher than the death rate of men in the same age group (6.68 deaths per 1,000 population). Among the population in the female reproductive age, the death rate is highest among the age group 30-34, at 10.9 deaths per 1,000 population, which is also the peak childbearing age group. The
13 A D U LT A N D M AT E R N A L M O R TA L I T Y
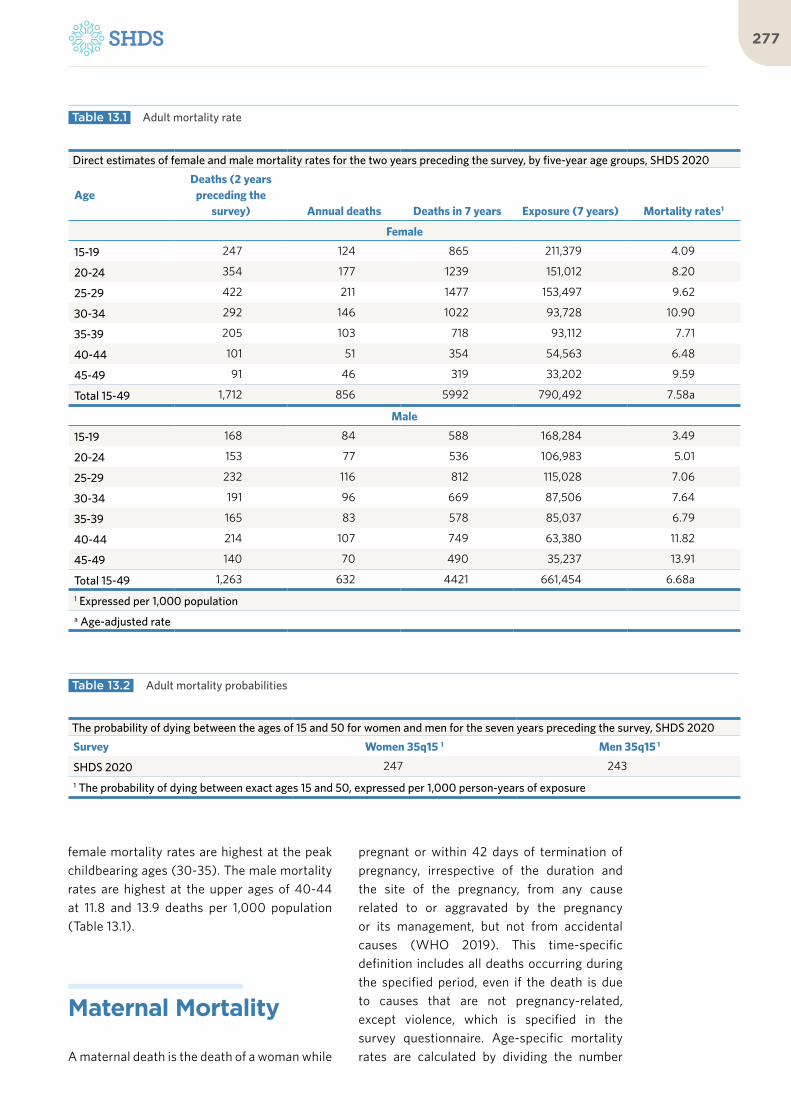
277
female mortality rates are highest at the peak childbearing ages (30-35). The male mortality rates are highest at the upper ages of 40-44 at 11.8 and 13.9 deaths per 1,000 population (Table 13.1).
Maternal Mortality
A maternal death is the death of a woman while
pregnant or within 42 days of termination of pregnancy, irrespective of the duration and the site of the pregnancy, from any cause related to or aggravated by the pregnancy or its management, but not from accidental causes (WHO 2019). This time-specific definition includes all deaths occurring during the specified period, even if the death is due to causes that are not pregnancy-related, except violence, which is specified in the survey questionnaire. Age-specific mortality rates are calculated by dividing the number
Direct estimates of female and male mortality rates for the two years preceding the survey, by five-year age groups, SHDS 2020
AgeDeaths (2 years
preceding the survey) Annual deaths Deaths in 7 years Exposure (7 years) Mortality rates1
Female
15-19 247 124 865 211,379 4.09
20-24 354 177 1239 151,012 8.20
25-29 422 211 1477 153,497 9.62
30-34 292 146 1022 93,728 10.90
35-39 205 103 718 93,112 7.71
40-44 101 51 354 54,563 6.48
45-49 91 46 319 33,202 9.59
Total 15-49 1,712 856 5992 790,492 7.58a
Male
15-19 168 84 588 168,284 3.49
20-24 153 77 536 106,983 5.01
25-29 232 116 812 115,028 7.06
30-34 191 96 669 87,506 7.64
35-39 165 83 578 85,037 6.79
40-44 214 107 749 63,380 11.82
45-49 140 70 490 35,237 13.91
Total 15-49 1,263 632 4421 661,454 6.68a
1 Expressed per 1,000 populationa Age-adjusted rate
Table 13.1 Adult mortality rate
Table 13.2 Adult mortality probabilities
The probability of dying between the ages of 15 and 50 for women and men for the seven years preceding the survey, SHDS 2020
Survey Women 35q15 1 Men 35q15 1
SHDS 2020 247 243
1 The probability of dying between exact ages 15 and 50, expressed per 1,000 person-years of exposure

The Somali Health and Demographic Survey278
of maternal deaths by years of exposure. The Maternal Mortality Ratio (MMR), which is calculated as the number of maternal deaths per 100,000 live births, is a more widely used measure of maternal mortality, as it avoids the complications in the estimation of “exposure”.
The leading causes of maternal mortality are postpartum hemorrhage, pre-eclampsia/eclampsia, obstructed labour and sepsis. The key determinants of mortality include the low uptake of family planning, limited delivery care, and limited involvement of skilled birth attendants. The main social challenges to further reduction of maternal mortality include: insecurity, and countrywide poor distribution of the limited health facilities, inequitable access to care, low quality of interventions, and limited capacity in planning, management and evaluation, the cultural and geographic isolation of women (WHO 2017).
Although the MMR of Somalia is a good indicator for maternal health, its calculation is challenging due to the absence of vital registration of maternal deaths. Thus, the direct method was used to estimate MMR. The MMR data was collected during the listing because it needed a large sample size: 95,087 households were interviewed in this survey. Data was collected on the deaths of
women aged 15-49 who died within the 2 years preceding the survey.
Female and Maternal DeathsA total of 1,712 female deaths in the age range 15 to 49 were reported for the 24 months preceding the survey. The highest number of female deaths (422) were observed among women aged 25–29, while the lowest (91) was observed among women aged 45-49.
With respect to the timing of the death in relation to the pregnancy, deaths that occurred during the pregnancy, childbirth, or within 42 days after the birth or termination of a pregnancy were recorded separately. The survey found that 907 women died while they were pregnant, whereas 236 women died while they were giving birth, and 115 women died within six weeks after delivery. However, 91 out of these 1,259 pregnancy-related deaths (7 percent) were due to accidental causes.
As shown in Table 13.3, the number of female deaths due to maternal causes (while they were pregnant, or giving birth or within six weeks post-delivery, with the exception of accidents or violence) was 1,168. The number varied by age and ranged from 334 among women aged 25-29 to 24 deaths among women aged 45-49.
Age Group Female Deaths
Time of death Cause of death
While pregnantWhile giving
BirthWithin 6 weeks
after deliveryFrom accident or
violence Maternal
15 – 19 247 144 24 4 13 159
20 – 24 354 215 45 33 19 274
25 – 29 422 236 82 39 24 334
30 – 34 292 159 50 19 18 209
35 – 39 205 94 31 14 11 128
40 – 44 101 38 1 4 3 40
45 – 49 91 22 2 3 3 24
Total 1,712 907 236 115 91 1,168
Table 13.3 Female deaths by cause, number of female deaths overall, by time of death and by cause during the 24 months prior to the survey, by age group corresponding to female’s reproductive age, SHDS 2020

279
Maternal Mortality EstimationThe maternal mortality estimates presented in this report were obtained from data collected using the direct estimation method, as pointed out. This method relies on asking questions about maternal deaths in a household during a recent interval of time, normally one to two years. This method provides up-to-date estimates but is time-consuming and costly because it requires a large sample size to obtain single-point estimates with sufficiently narrow confidence intervals to enable monitoring of time trends.
a. Maternal Mortality Rate (MM Rate)
Rates in demographic statistics are defined as occurrence/exposure ratios. The Maternal Mortality Estimation Inter-agency Group (MMEIG), which leads the international work on maternal mortality and includes WHO, UNFPA, UNICEF, World Bank Group and the United Nations Population Division, calculates the Maternal Mortality Rate (MMRate) as the number of maternal deaths divided by the person-years lived by women of reproductive age in a population (WHO 2019). The MMRate is an indicator of the risk of maternal death among women of reproductive age. The MMRate is usually multiplied by a factor of 1,000.
Based on the SHDS 2020 data, the MMRate for Somalia was estimated at 1.4694 maternal deaths per 1,000 woman-years of exposure. This implies that one to two in every 1,000 women aged 15-49 in the country die due to pregnancy- related complications in a given year.
b. Maternal Mortality Ratio
As pointed out earlier, the Maternal Mortality Ratio (MMR) is calculated as the number of maternal deaths during a given time period per 100,000 live births during the same time period (WHO 2019). It links the risk of maternal death relative to the frequency of childbearing. The Maternal Mortality Ratio is considered a more useful indicator of maternal mortality, since it measures the obstetric risk
associated with each live birth (WHO 2015). It also avoids the complications in the estimation of the “exposure” segment.
The Maternal Mortality Rate can be converted to Maternal Mortality Ratio (expressed as deaths per 100,000 live births) by dividing the Maternal Mortality Rate by the General Fertility Rate (GFR) that prevailed during the same period and multiplying the result by 100,000. The Maternal Mortality Ratio for Somalia is 692 deaths per 100,000 live births. This means that in the country, for every 1,000 live births, approximately seven women die during pregnancy, childbirth, or within two months of childbirth.
The Maternal Mortality Ratio is one of 26 indicators used to assess progress towards the Sustainable Development Goal 3: ensuring healthy lives and promoting wellbeing for all at all ages. In addition, reducing maternal mortality is one of the country’s goals. Somalia’s targets as per the National Development Plan 2017-2019 included the reduction of the Maternal Mortality Ratio from 732 to 600 per 100,000 live births by 2019.
According to the Maternal Mortality Estimation Inter-agency Group for Somalia, the MMR in Somalia has reduced from 732 in 2015 and now stands at 692. Even though this is a reduction, it remains high compared to rates in neighboring countries, such as Kenya (362 per 100,000), Ethiopia (412 per 100,000) and Uganda (336 per 100,000). Somalia’s high maternal mortality can be attributed to high fertility rates, low uptake of contraception, low skilled birth attendance rate, inadequate access to maternal health services, inadequate access to emergency obstetric care, and the use of female circumcision among other factors.
c. Pregnancy-Related Maternal Mortality Rate
The Pregnancy-Related Mortality Rate (PRMR) is the number of pregnancy-related deaths per 1,000 women aged 15-49. Pregnancy-related mortality rates by five-year age groups are calculated by dividing the number of pregnancy-

The Somali Health and Demographic Survey280
related deaths in each age group by the total person-years of exposure of the women to the risk of dying in that age group during the period and then multiplying by 1,000. The PRMR does not exclude deaths due to accident or violence. The number of deaths refers to the number of women aged 15-49 reported as having died during pregnancy or delivery, or in the 2 months following the delivery, by their age group at the time of death. The pregnancy-related mortality rate among women aged 15-49 is 1.5833 pregnancy-related deaths per 1,000 woman-years of exposure.
d. Pregnancy-Related Mortality Ratio (PRMR)
When the PRMR is computed from data on maternal deaths regardless of the cause, the indicator is referred to as Pregnancy-Related Mortality Ratio (PRMR). A maternal death refers to any death of a woman while pregnant, during birth or within 42 days of termination of pregnancy, from any cause but not from accident or an act of violence. A pregnancy-related death on the other hand refers to any death of a woman while pregnant, during birth or within two months of termination of pregnancy, regardless of the cause of death. Before 2016, pregnancy-related deaths were used in computing Maternal Mortality Ratio. The distinction between pregnancy-related and strictly maternal deaths was overlooked. To address this, WHO proposed changes to exclude deaths due to accidents or acts of violence. Questions were therefore added to the questionnaire to identify deaths due to accidents or violence. As a result, the revised Maternal Mortality Ratio (MMR) is not comparable to MMR trends prior to 2016.
The Pregnancy-Related Mortality Ratio (PRMR) is the number of pregnancy-related deaths per 100,000 live births. The PRMR is calculated by dividing the age-standardized pregnancy-related mortality rate for women aged 15-49 by the general fertility rate (GFR) multiplied by 100,000. The Pregnancy-Related Maternal Mortality Ratio for the country is 746 deaths per 100,000 live births. For every 1,000 live births, about seven women die during
pregnancy, birth or within two months after childbirth.
e. Lifetime Risk of Maternal Mortality (LTR)
The Lifetime Risk of Maternal Mortality (LTR) is defined as the risk of an individual woman dying from pregnancy or childbirth during her reproductive lifetime or, stated in other words, it is the probability that a 15-year-old girl will eventually die from a maternal cause. It takes into account both the probability of becoming pregnant and the probability of dying, as a result of pregnancy accumulated across a woman’s reproductive years.
The LTR reflects the risk that a woman who survives to age 15 will die of maternal causes at some point during her reproductive lifespan, given the current rates of maternal mortality and fertility. Thus, in a high-fertility setting, a woman faces the risk of maternal death multiple times, and her risk of death throughout her reproductive lifetime will be higher than in a low-fertility setting.
The LTR of Maternal Mortality for Somalia according to SHDS data is 0.04699. This means that today, one in 20 women entering the childbearing age of 15 will die of pregnancy-related complications before the end of her childbearing years (age 50).
f. Lifetime Risk of Pregnancy-Related Death
The Lifetime Risk of Pregnancy-Related Death is calculated as 1-(1-PRMR) TFR, where PRMR represents the pregnancy-related mortality ratio and TFR represents the total fertility rate. At the fertility and mortality rates prevailing from 2018-2019, 5 percent of women would be expected to die from pregnancy-related causes during their reproductive lifetime (i.e. a lifetime risk of 1 in 20). This indicator is the same as the LTR, except that in this indicator, deaths due to accidents and violence are not included.

281
Age groupMaternal
deaths (2 yrs)- Un-
adjusted
Annual maternal
deaths un-adjusted
Maternal deaths (2 yrs)-
adjusted
Annual maternal
deaths adjusted
Years of exposure
Maternal Mortality
Rate (MMRate)-un-adjusted
Maternal Mortality
Rate (MMRate)-
adjusted
15 – 19 172 86 159 79 99,584 0.8644 0.7966
20 – 24 292 146 274 137 101,436 1.4417 1.3501
25 – 29 357 179 334 167 63,387 2.8193 2.6319
30 – 34 228 114 209 105 61,361 1.8543 1.7045
35 – 39 139 69 128 64 39,372 1.7589 1.6243
40 – 44 43 22 40 20 31,714 0.6798 0.6370
45 – 49 27 14 24 12 578 23.5999 21.0225
Total (15-49) 1,259 629 1168 584 397,433 1.5833 1.4694
PRMR 746
PRMR CI 447-931
MMR 692
MMR CI 399-832
PRMR/100,000 0.00746
MMR/100,000 0.00692
1-PRMR/100,000 0.99254
1-MMR/100,000 0.99308
(1-PRMR/100,000)^ TFR 0.94945
(1-MMR/100,000)^ TFR 0.95301
1-(1-PRMR/100,000)^ TFR 0.05055
1-(1-MMR/100,000)^ TFR 0.04699
LTR= 1-(1-PRMR/100,000)^ TFR 0.05055
LTR= 1-(1-MMR/100,000)^ TFR 0.04699
Table 13.4 Female population, number of female deaths during the 12 months prior to the survey, maternal deaths by age group corresponding to female’s reproductive age, adjusted, SHDS 2020

The Somali Health and Demographic Survey282

283

The Somali Health and Demographic Survey284
References
Ajiambo D. (2019). Somali sheikh leads a seven-year campaign to end female genital mutilation Retrieved from: https://religionnews.com/2019/02/27/somali-sheikh-leads-a-seven-year-campaign-to-end-female-genital-mutila-tion (Accessed February 2020).
B.K. Dabal, P. a. (2007). Birth Interval: Percep-tions and Practices among Urban-Based Saudi Arabian Women. Eastern Mediterranean Health Journal, p 882
Cairncross S., Hunt C., Boisson S., et al. (2010) Water, Sanitation and Hygiene for the Prevention of Diarrhoea. International Journal of Epidemi-ology. 39: i193-i205.
Centers for Disease Control and Prevention. About Chronic Diseases. Retrieved from: https://www.cdc.gov/chronicdisease/about/index.htm (Accessed April 2020).
Central Statistical Agency (CSA) [Ethiopia] and ICF. (2016) Ethiopia Demographic and Health Survey 2016. Addis Ababa, Ethiopia, and Rock-ville, Maryland, USA: CSA and ICF
Central Statistical Organization (CSO). (1998) [Yemen] and Macro International Inc. (MI). 1998. Yemen
Croft, Trevor N., Aileen M. J. Marshall, Courtney K. Allen, et al. 2018. Guide to DHS Statistics. Rockville, Maryland, USA: ICF.
Demographic and Maternal and Child Health Sur-vey. (1997) Calverton, Maryland: CSO and MI.
The Federal Government of Somalia (FGS) 2020.
Gross Domestic Product by Country, Somalia. Retrieved from: https://data.worldbank.org/indicator/NY.GDP.PCAP.CD?view=chart/ (Accessed April 2020).
GSMA (2019). The State of Mobile Internet Con-nectivity. 2019.
Heise, L., M. Ellsberg, and M. Gottemoeller. (1999). Ending violence against women. Pop-ulation Reports, Series L, No. 11. Baltimore, Maryland: Johns Hopkins University School of Public Health, Population Information Program.
Human Rights Watch (2014). “Here, Rape is Normal”: A Five-Point Plan to Curtail Sexual Violence in Somalia.
Joint United Nations Programme on HIV/AIDS (UNAIDS). (2014). Somali HIV and AIDS Response.
___________. (2014a). The Adult HIV Prevalence Rate.
Kenya National Bureau of Statistics (KNBS). The Kenya Demographic Health Survey, 2014. Kenya.
Ministry of Public Health and Population (MOPHP), Central Statistical Organization (CSO) [Yemen], Pan Arab program for Family Health (PAPFAM), and ICF International. 2015. Key Findings: Yemen National Health and Demographic Survey 2013. Rockville, Mary-land, USA: MOPHP, CSO, PAPFAM and ICF International.
National Institute of Statistics, Directorate Gen-eral for Health, and ICF International. (2015) Cambodia Demographic and Health Survey 2014. Phnom Penh, Cambodia, and Rockville, Maryland, USA: National Institute of Statis-tics, Directorate General for Health, and ICF International
Organisation for Economic Co-operation and Development (OECD), W. a. (2006). Burden of Out-of-Pocket Health Expenditure.

285
Somali religious leaders and high-level offi-cials join hands to put an end to all forms of FGM/C. UNICEF 2011. Retrieved from: https://www.unicef.org/somalia/cpp_8552.html. (Last accessed: February 2020).
United Nations. (1990). Convention on the Rights of the Child. Retrieved from: https://www.ohchr.org/en/professionalinter-est/pages/crc.aspx (Accessed April 2020).
United Nations Children’s Fund (UNICEF). (2006). Multiple Indicator Cluster Survey 2006.
UNICEF and WHO. (2012). Progress on Drinking Water and Sanitation 2012 Update. Retrieved from: https://www.unicef.org/media/files/JM-Preport2012.pdf (Accessed April 2020).
United Nations (UN) Department of Economic and Social Affairs. (2019). World Population Prospects 2019.
United Nations Educational, Scientific and Cultural Organization (UNESCO). (2013). UNESCO Institute for Statistics.
United Nations Population Fund (UNFPA). (2014). The Population Estimation Survey, 2014. Nairobi: The United Nations Office of Nairobi Printers. Publishing Services Section/DCS.
World Bank (2017). Gender Equality, Poverty Reduction, and Inclusive Growth: 2016-2023 Gender Strategy - 2017 Update to the Board (English). Washington, D.C. : World Bank Group. http://documents.worldbank org/curated/en/207481489888852225/Gender-Equality-Poverty-Reduction-and-In-clusive-Growth-2016-2023-Gender-Strategy-2017-Update-to-the-Board.
World Health Organization (WHO). (2005). Report of a Technical Consultation on Birth Spac-ing. Geneva: World Health Organization.
________________. (2007). IASC Guidelines for mental health and psychosocial support in emer-gency settings.
________________.(2010). Gender, Women, and the Tobacco Epidemic. Geneva: World Health Organization.
________________. (2010a). World Health Report 2010 - Health Systems Financing: The Path to Universal Coverage. Geneva: World Health Organization.
________________. (2012). The World Health Report.
________________. (2014). Global Nutrition Targets 2025: Low Birth weight Policy Briefs (WHO/NMH/NHD/14.5) Geneva.
________________. (2014a). Global Report of Noncommunicable Diseases.
________________. (2017). Health Profile, So-malia 2015. Cairo: WHO Regional Office for the Eastern Mediterranean; 2017. Licence: CC BY-NC-SA 3.0 IGO.
________________. (2019). WHO Report on the Global Tobacco Epidemic
Yoder, P. Stanley, and Shanxiao Wang (2013). Female Genital Cutting: The Interpretation of Recent DHS Data. DHS Comparative Reports No. 33. Calverton, Maryland, USA: ICF Interna-tional.

The Somali Health and Demographic Survey286
Glossary
Adult mortality
The probability that a 15-year-old will die before reaching his/her 60th birthday, if subjected to age-specific mortality rates between those ages for the specified year.
Antenatal care (ANC)/Prenatal care
Care provided by skilled health care professionals (which include doctors/clinical officers or nurs-es/midwives/auxiliary midwives) to pregnant women in order to ensure the best health conditions for both mother and baby during pregnancy.
Complementary foods
Foods other than breast milk or infant formula (liquids, semi-solids, and solids) introduced to an infant to provide nutrients.
Crude Birth Rate (CBR)
The total number of births occurring in a given year per 1,000 population.
Dwelling residence
A structure which is used for housing purposes only.
Household roster
Includes listing of all household members and their characteristics, such as each member’s age, sex, relation-ship with the head of household, education and literacy status.
Fecundity
Reflects a woman’s ability to conceive and her ability to carry the pregnancy to term.
Fertility
The frequency of childbearing within a given population.
General Fertility Rate (GFR)
The annual number of births in a population per 1,000 women aged 15-49.
Gini coefficient
Measure of the deviation of the distribution of income among individuals or households within a country from a perfectly equal distribution. A value of 0
represents absolute equality, a value of 100 absolute inequality.
Infant and young child feeding (IYCF)
Includes early initiation (within one hour of birth) of exclusive breastfeeding, exclusive breastfeeding for the first six months of life, followed by nutritionally adequate and safe complementary foods while breastfeeding continues for up to two years of age or beyond.
Intermediate (Type II)
A form of female circumcision that involves partial or total removal of the clitoris and the labia minora.
Khat
A stimulant drug that comes from a shrub that grows in East Africa and southern Arabia. Like chewing to-bacco, leaves of the khat shrub are chewed and held in the cheek to release their chemicals. Cathinone and cathine are the stimulants in khat that make a person feel intoxicated.
Lifetime Risk (LTR) of Maternal Mortality
The risk of an individual woman dying from pregnancy or childbirth during her reproductive lifetime, taking into account both the probability of becoming pregnant and the probability of dying, as a result of pregnancy accumulated across a woman’s reproductive years. It reflects the risk that a woman who survives to age 15 will die of maternal causes at some point during her reproductive lifespan, given current rates of maternal mortality and fertility.
Lifetime Risk (LTR) of Pregnancy-Related Death
This indicator is the same as the LTR, except that the calculation of this indicator includes deaths due to accidents and violence.
Live birth
The complete expulsion from its mother of a product of conception, regardless of the duration of the preg-nancy, which, after such separation, breathes or shows any other evidence of life—e.g. beating of the heart, pulsation of the umbilical cord or definite movement of voluntary muscles—whether or not the umbilical cord has been cut or the placenta is attached.

287
Maternal death
The death of a woman while pregnant or within 42 days of termination of pregnancy, regardless of the dura-tion and site of the pregnancy, from any cause related to or aggravated by the pregnancy or its management but not from accidental or incidental causes.
Maternal Mortality Ratio (MMR)
The number of women who die because of complications of pregnancy or childbearing in a given year per 100,000 live births in that year, excluding deaths due to accident or violence.
MMRate
The number of women who die because of complications of pregnancy or childbearing in a given year per 1,000 women of childbearing age in the population.
Nomad
A person with no permanent residence, who depends on livestock for livelihood, and who moves from one place to another in search of pastures and water for their livestock.
Pharaonic (Type III & IV)
A form of female circumcision that involves narrowing of the vaginal opening with the creation of a covering seal by cutting, appositioning and stitching together the labia minora or the labia majora, with or without exci-sion of the clitoris.
Postnatal care
Is the care given to the mother and her newborn baby immediately after the birth and for the first six weeks of life.
Pregnancy-Related Mortality Ratio (PRMR)
The number of women who die because of complications of pregnancy or childbearing in a given year per 100,000 live births in that year including deaths due to accident or violence.
Reproductive age for women
Women in the childbearing age usually within the age group 15-49.
Sampling
The process of selecting certain members or a subset of the population to make statistical inferences from them and to estimate characteristics of the whole population.
Sampling frame
The list from which units are drawn for the sample. The ‘list’ may be an actual listing of units, or some oth-er description of the population, such as a map from which areas will be sampled.
Skilled delivery
A child delivery assisted by an accredited health professional – such as a doctor/clinical officer or nurse/midwife/nurse – who has been educated and trained to proficiency in the skills needed to
manage nor-mal (uncomplicated) pregnancies, childbirth and the immediate postnatal period, and in the identification, management and referral of complications in women and newborns.
Sunna/sunni (Type I)
A form of female circumcision, which involves the partial or total removal of the clitoris and/or the prepuce.
Vaccination
Stimulates one’s immune system to produce antibodies, exactly like it would if they were exposed to the disease. After getting vaccinated, a person develops immunity to that disease, without having to get the dis-ease first.
Wealth quintile
A measure of wealth or poverty status of the household based on the ownership of assets and the characteris-tics of the person’s household. Household characteristics in many instances may be considered to be a better or more valid reflection of living standards than monetary income, since they capture long-term wealth and cover both monetary and non-monetary wealth. A quintile represents information for a fifth (20%) of the population. A household is classified into a quintile based on the score where the fifth quintile represents a wealthiest household and vice versa.
Chronic diseases
Anaemia
A medical condition in which the red blood cell count or haemoglobin is less than normal.
Arthritis
Joint disease that causes swelling of the joints, pain, stiffness and decreased range of motion.
Blood pressure
The pressure of the blood on the walls of the arteries as the heart pumps it around a body. A systolic blood pressure reading of 140 or more is high blood pressure (also called hypertension).
Cardiovascular (heart) disease
Refers to conditions that involve narrowed or blocked blood vessels that can lead to a heart attack, chest pain (angina) or stroke. Other heart conditions, such as those that affect your heart’s muscle, valves or rhythm, also are considered forms of heart disease
Cataract
Clouding of the eye’s natural lens, which lies behind the iris and the pupil. Cataract is the most common cause of loss of vision loss in people over age 40 and is the principal cause of blindness in the world.
Chronic back pain/spinal problem
Pain in the back or a problem with the spine that

The Somali Health and Demographic Survey288
which lasts for 3 months or more. People who have chronic back pain may have limited range of motion and/or tenderness upon touch. People with spinal problem expe-rience pain and other symptoms, such as numbness, tingling or weakness.
Chronic headache
This is headache that occurs for more than four hours on more than 15 days per month
Diabetes
Often referred to as diabetes mellitus, this describes a group of metabolic diseases in which the person has high blood glucose (blood sugar), either because insulin production is inadequate, or because the body’s cells do not respond properly to insulin, or both.
Epilepsy
Chronic disorder, characterized by recurrent, unprovoked seizures which occur because of a sudden surge of electrical activity in the brain.
Inflammation/ulcers
Sores in the lining of the rectum and colon. Ulcers form where inflammation has killed the cells that usually line the colon, then bleed and produce pus.
Kidney diseases
Affect the body’s ability to clean blood, filter extra water out of blood and help control blood pressure.
Liver disease
Symptoms of liver disease often include swelling of the abdomen and legs, bruising easily, changes in the colour of your stool and urine, and jaundice, or yellowing of the skin and eyes.
Lung disease
Disorders that affect the lungs, the organs that allow us to breathe. The three most common lung diseases are asthma, chronic obstructive pulmonary disease (COPD), and lung cancer. Asthma is a chronic (long-term) lung disease that inflames and narrows the airways. Asthma causes recurring periods of wheezing (a whistling sound when you breathe), chest tightness, shortness of breath, and coughing. The coughing often occurs at night or early in the morning. COPD refers to chronic obstructive bronchitis and emphysema. Both diseases limit airflow into and out of the lungs and make breathing difficult. Lung cancer is a disease in which ab-normal (malignant) lung cells multiply and grow without control.
Mental/psychological illness
A condition that affects a person’s thinking, feeling or mood. Such conditions may affect someone’s ability to relate to others and function each day.
Prostatic hypertrophy also known as prostatic hyperplasia
Histologic diagnosis characterized by proliferation of the cellular elements (enlargement) of the prostate. Chronic bladder outlet obstruction (BOO) secondary to BPH may lead to urinary retention, renal
insufficien-cy, recurrent urinary tract infections, gross haematuria, and bladder calculi.
Sickle-cell anaemia/thalassemia
Belongs to a group of diseases called sickle-cell diseases (SCD) that are inherited red blood cell disorders. People with SCD have abnormal haemoglobin, called haemoglobin S or sickle haemoglobin, in their red blood cells. Sickle-cell anaemia is the most common and severe kind of SCD. Characteristic features of this disorder include a low number of red blood cells (anaemia), repeated infections, and periodic episodes of pain
Skin disease
A condition or disease affecting the skin. It’s anything that irritates, clogs, or inflames your skin causing symptoms such as redness, swelling, burning, and itching.
Stroke
Occurs when the blood supply to your brain is interrupted or reduced. This deprives your brain of oxygen and nutrients, which can cause your brain cells to die. A stroke can sometimes cause temporary or permanent disabilities, depending on how long the brain lacks blood flow and which part was affected. Complications may include: paralysis or loss of muscle movement; difficulty talking or swallowing; memory loss or think-ing difficulties; emotional problems; pain and numbness; changes in behaviour and ability for self-care.
Tumor
Also known as a neoplasm, is an abnormal mass of tissue which may be solid or fluid-filled. Tumors can be benign (not cancerous), pre-malignant (pre-cancerous), or malignant (cancerous).
Literacy and school attendance
Gross Attendance Ratio (GAR)
The total number of students attending a given education level, regardless of age, expressed as a percentage of the eligible official school-age population for that level in a given school year.
Literacy
Is the ability to read and write, with an understanding of a short simple statement about one’s everyday life.
Net Attendance Ratio (NAR)
The total persons attending in a given education level who have an age that is within the age range appropri-ate for the level of education they are enrolled in. The NAR is expressed as a percentage of the eligible offi-cial school-age population for a particular level in a given school year corresponding with the population.

289
Types of disability
Hearing
Hearing loss, also known as hearing impairment, is a partial or total inability to hear. Hearing loss may be caused by genetics, ageing, exposure to noise, some infections, birth complications, trauma to the ear, and certain medications or toxins.
Learning
A learning disability is a neurological disorder. In simple terms, a learning disability results from a differ-ence in the way a person’s brain is “wired.” Children with learning disabilities are as smart as or smarter than their peers. But they may have difficulty reading, writing, spelling, reasoning, recalling and/or organizing information if left to figure things out by themselves or if taught in conventional ways.
Mental
A mental disorder, also called a mental illness or psychiatric disorder is a behavioural or mental pattern that may cause suffering or a poor ability to function in life. Persons with mental disorders often have significant changes in thinking, emotion and/or behaviour; distress and/or problems functioning in social, work or fami-ly activities.
Mobility
Mobility impairment refers to the inability of a person to use one or more of his/her extremities, or a lack of strength to walk, grasp, or lift objects. The use of a wheelchair, crutches, or a walker may be utilized to aid in mobility.
Self-care
Self-care disability refers to a person with a physical, mental, or emotional condition lasting six months or more, who has difficulty in doing any of the activities such as dressing, bathing, or getting around inside the home.
Sight
Visual impairment (vision impairment, vision disability) is a decreased ability to see to a degree that causes problems not fixable by usual means, such as glasses or medication. Visual impairment can be due to dis-ease, trauma, or congenital or degenerative conditions. Terms such as “partially sighted”, “low vision”, “le-gally blind” and “totally blind” are used to describe visual impairments.
Speech
Speech disorders or speech impediments are a type of communication disorder where ‘normal’ speech is dis-rupted. This can mean stuttering, lisps, etc. Someone who is unable to speak due to a speech disorder is con-sidered mute.
Types of toilet facilities
Flush/pour flush toilet
A flush toilet uses a cistern or holding tank for flushing water and has a water seal, which is a U-shaped pipe, below the seat or squatting pan that prevents the passage of flies and odours.
A pour flush toilet uses a water seal, but unlike a flush toilet, it uses water poured by hand for flushing (no cistern is used).
Open field/defecation
Open defecation is the practice of people defecating outside in an open field or in the push and not into a des-ignated toilet.
Piped sewer system
A system of sewer pipes (also called sewerage) that is designed to collect human excreta (faeces and urine) and wastewater and remove them from the household environment. Sewerage systems consist of facilities for col-lection, pumping, treating and disposing of human excreta and wastewater.
Piped to pit latrine
A system that flushes excreta to a hole in the ground.
Piped to septic tank
An excreta collection device consisting of a water-tight settling tank normally located underground, away from the house or toilet.
Piped to somewhere else
A system in which the excreta is deposited in or nearby the household environment in a location other than a sewer, septic tank, or pit, e.g. excreta may be flushed to the street, yard/plot, drainage ditch or other location.
Pit latrine
Excreta are deposited without flushing directly into a hole in the ground.
Pit latrine with slab
A dry pit latrine whereby the pit is fully covered by a slab or platform that is fitted either with a squatting hole or seat. The slab or platform should be solid and can be made of any type of material (such as concrete, logs with earth or mud, or cement). The slab or platform should adequately cover the pit so that pit contents are not exposed other than through the squatting hole or seat.
Pit latrine without slab/open pit
A latrine without a squatting slab, platform or seat. An open pit is a rudimentary hole in the ground where excreta is collected.
Ventilated improved pit (VIP) latrine
A dry pit latrine ventilated by a pipe extending above the latrine roof. The open end of the vent pipe is cov-ered with gauze mesh or fly-proof netting.

The Somali Health and Demographic Survey290
If the vent pipe is not covered by a gauze mesh or fly-proof netting, the facility should be classified as a pit latrine with slab not a VIP latrine. The inside of the VIP latrine is kept dark. If the door of the VIP super-structure is missing so that it is no longer dark inside the latrine, the facility should be classified as a pit la-trine with slab, not a VIP latrine.
Water sources
Bottled water
Water that is bottled and sold to the household in bottles.
Cart with small tank
Water is obtained from a provider who transports water into a community using a cart and then sells the wa-ter. The means for pulling the cart may be motorized or non-motorized (for example, a donkey).
Piped into dwelling
Pipe connected with in-house plumbing to one or more taps, e.g. in the kitchen and bathroom. Sometimes called a house connection.
Piped to yard/plot
Pipe connected to a tap outside the house in the yard or plot. Sometimes called a yard connection.
Piped to neighbour
Pipe connected to neighbour’s dwelling, yard or plot.
Protected dug well
A dug well that is (1) protected from runoff water through a well lining or casing that is raised above ground level and a platform that diverts spilled water away from the well and (2) covered so that bird droppings and animals cannot fall down the hole. Both conditions must be observed for a dug well to be considered as pro-tected.
Protected spring
A spring protected from runoff, bird droppings, and animals by a “spring box” which is typically constructed of brick, masonry, or concrete and is built around the spring so that water flows directly out of the box into a pipe without being exposed to outside pollution.
Public tap or standpipe
Public water point from which community members may collect water. A standpipe may also be known as a public fountain or public tap. Public standpipes can have one or more taps and are typically made of brick-work, masonry or concrete.
Rainwater
Rain that is collected or harvested from surfaces by roof or ground catchment and stored in a container, tank or cistern.
Tanker truck
Water is obtained from a provider who uses a truck to transport water into the community. Typically the provider sells the water to households.
Tube well or borehole
A deep hole that has been bored or drilled with the purpose of reaching ground water supplies. Water is de-livered from a tube well or borehole through a pump which may be human, animal, wind, electric, diesel or solar-powered.
Unprotected dug well
A dug well which is (1) unprotected from runoff water; (2) unprotected from bird droppings and animals; or (3) both.
Unprotected spring
A spring that is subject to runoff and/or bird droppings or animals. Unprotected springs typically do not have a “spring box”.
Surface water
Water located above ground and includes rivers, dams, lakes, ponds, streams, canals, and irrigation channels.
Water treatment
Adding bleach/chlorine
Use of free chlorine to treat drinking water. Free chlorine may be in the form of liquid sodium hypochlorite, solid calcium hypochlorite, or bleaching powder.
Boiling
Heating water using fuel.
Let it stand and settle
Holding or storing water undisturbed and without mixing long enough for larger particles to settle out or sed-iment by gravity.
Solar disinfection
Exposing water, which is stored in buckets, containers, or vessels, to sunlight.
Straining water through a cloth
Pouring water through a cloth which acts as a filter for collecting particulates from the water.
Using a water filter (ceramic/sand/composite/etc.)
Running water through media to remove particles and at least some microbes from water. Media used in fil-tering systems usually include ceramic, sand and composite.

291

The Somali Health and Demographic Survey292
APPENDIX A

293
Sampling DesignObjectives of the Somali Health and Demographic Survey
The SHDS was designed to provide a national estimate of maternal mortality and estimates for fertility, child mortality and other relevant indicators at national level, as well as for each of the 18 pre-war geographical regions, and separately for urban, rural and nomadic places of residence. The target population was women in the reproductive ages (15 to 49 years of age) and children who are under five years of age and reside in households in the country at the time the survey was conducted.
Sampling FrameThe sampling frame required to achieve the objectives of SHDS is a complete list of households in the country. The households form Ultimate Sampling Units (USUs), allowing probability sampling to be implemented. The existence of such a list of households, a list in which every household is associated with one and only one household of the list, is the cornerstone of probability sampling. The fact that the last published population and housing census in Somalia dates back to 1975 meant that there was neither a recent complete list of households nor statistical units often referred to as enumeration areas (EAs) available to be used as a sampling frame. The SHDS therefore began with the construction of a sampling frame for urban, rural and nomadic places of residence.
Constructing Sampling Frame for Urban and Rural areas
Through the use of up-to-date, high-resolution satellite imagery, as well as on-the-ground knowledge of the digitizing team, all dwelling structures in urban and rural places of residence/areas were digitized. EAs were formed on-screen through a spatial count of dwelling structures in a geographic information system (GIS) software. Thereafter, a sample ground verification of the digitized structures was carried out for large urban and rural areas and necessary adjustments made to the
sampling frame. Each of the created EAs had a minimum of 50 and a maximum of 149 dwelling structures. A total of 10,525 EAs of this kind, also referred to as primary sampling units (PSUs), were digitized—7,488 in urban areas and 3,037 in rural areas. However, because of security and accessibility constraints, not all digitized areas were included in the final sampling frame—9,136 PSU (7,308 in urban and 1,828 in rural) formed the final frame.
In the first stage, a selection of 35 EAs in every stratum of every design domain was carried out using probability proportional to size (PPS) sampling of digitized dwelling structures. The design domain coincided with the eighteen pre-war regions, which are the country’s first-level administrative divisions. Listing of households was carried out in each of the 35 selected EAs to obtain the total number of households. During listing, information on births and deaths was obtained through the maternal mortality questionnaire. The purpose for collecting this data from such a large number of PSUs (with an estimated 80 households per PSU) was to enable the estimation of the Maternal Mortality Ratio (MMR) through a direct method, which requires a large sample. The data collected in this first phase was edited and a summary of households listed per PSU formed the sampling frames for the second phase. In the second stage, 10 PSUs were sampled out of the possible 35 that were listed, using probability proportional to the number of listed households.
Constructing Sampling Frame for Nomads
The sampling frame for the nomadic population was constructed using information provided by nomadic link workers (NLWs) and community gatekeepers (clan elders). These NLWs are associated with nomads through clan affiliation and have linkages with clan elders who reside in rural villages that are frequented by nomads to buy essential commodities and to sell their livestock and livestock products. The NLWs were contacted and asked to provide information on the temporary nomadic settlements (TNS), which they were responsible for. The information included TNS names, estimated number of households in these TNS, seasons of the year when the TNS is in use, and location of the TNS from the nearest settlement (village), as well as their telephone numbers. This list of TNS formed the sampling frame for nomads

The Somali Health and Demographic Survey294
with the estimated number of households in each TNS being the measure of size.
The nomadic frame therefore comprised of an updated list of TNS obtained from NLWs who are tied to these nomadic settlements. A total of 2,521 TNS formed the SHDS nomadic sampling frame. During data collection in the nomadic areas, households were listed in each TNS as part of verifying the list of households, a day earlier than the day of enumeration. The main reason of listing was to obtain a current and complete list of households. During listing, coordinates of all household structures were recorded. A sample of 30 households was then selected by the listing team (using the same method as in urban and rural areas) and given to the supervisors of the enumerating team on their first day of enumeration. Thereafter, supervisors allocated households to be interviewed to enumerators. The main survey enumerating team collected this data from the 30 sampled households while the listing team collected data from all the remaining households in the TNS. All households in each of the allocated 10 PSUs were serialized based on their location in the PSU and 30 of these households were selected systematically for a survey similar to a Demographic Health Survey (DHS). The serialization was done to ensure that households selected for interview would distributed throughout the PSU.
Nomadic households stay temporarily in certain locations, referred to as temporary nomadic settlements for as long as pasture and water are available. The duration of stay in these locations is mainly dependent on the amount of rain that falls within that season and how long the season will last. The survey therefore had to be undertaken within that window of opportunity. Nomadic households start moving to a different location as soon as pasture and water are depleted. With the long rains, they would be stationed in one location between 60 to 90 days and for the short rains 45 days. During the remaining dry seasons, they move far away, including across other regions and neighbouring countries, in search of water and pasture.
Sample DesignThe SHDS followed a stratified multi-stage probability cluster sample design. The sample design in urban and rural was three-stage stratified cluster sample design, while in nomadic areas the design was a two-stage
stratified cluster sample design. The PSUs were selected with a probability proportionate to the number of dwelling structures which constituted the sampling frame. The second-stage sampling units (SSUs) for rural and urban areas were selected with a probability proportionate to the number of listed households which constituted the frame. The ultimate sampling units (USUs) for rural, urban and nomadic areas were systematically selected from listed households in the cluster.
With the exception of the region of Banadir, which is considered to be fully urban, each administrative region was stratified into urban, rural and nomadic areas, yielding a total of 55 sampling strata. All three strata of Lower Shabelle and Middle Juba regions, as well as the rural and nomadic strata of Bay region, were completely excluded from the survey due to security reasons. A final total of 47 sampling strata were accessible to conduct the survey.
Sample AllocationTo ensure that the survey precision is comparable across regions, PSUs were allocated equally to all regions with some adjustments in two regions to cater for some specific interests. In the first stage, a total of 1,433 PSUs were selected from 47 strata with 770 PSUs from urban, 488 PSUs from rural and 175 PSUs from nomadic areas, representing about 16% of the total frame of all PSUs. In the second stage, a total of 220 PSUs and 150 PSUs were allocated to urban and rural strata respectively and the same 175 PSUs to nomadic areas yielding a total of 545 PSUs. In the third stage for urban and rural and second stage for nomadic areas, 30 households were allocated to each PSU.
Sample Selection in Urban and Rural Areas
In the first stage, a selection of 35 PSUs (EAs) in every stratum was carried out using PPS of dwelling structures. The listing of households was conducted and hence the number of households in each of the sampled 35 PSUs in each stratum were obtained. In the second stage, 10 SSUs were selected from the 35 listed PSUs, using PPS to the listed households. Finally, a systematic selection of 30 households from each of the 10 PSUs listed was done using the DHS Program excel sheet template for household selection.

295
Sample Selection in Nomadic AreasIn nomadic areas, a sample of 10 EAs (in this case TNS) were selected from each nomadic stratum, with probability proportional to the number of estimated households. A complete listing of households was carried out in the selected TNS followed by selection of 30 households for the main survey interview. In those TNS with 30 or less households, all households were interviewed for the main survey and the MMR questionnaire was administered. All eligible ever-married women aged 12 to 49 and never-married women aged 15 to 49 were interviewed in the selected households, while the household questionnaire was administered to all households selected. All households in each sampled TNS were administered the maternal mortality questionnaire.
First-stage Sample Allocation and Selection
| Equally allocated 35 PSUs to urban and rural areas and 10 TNS to all 47 strata (except one domain which is fully urban and was allocated 210 PSUs).
| PSUs were selected using Probability Proportional to Size (PPS) sampling of digitized dwelling structures.
| All households in the selected PSUs were listed and additional information on births and deaths during the 24 months preceding the survey was obtained for use in computing the maternal mortality ratio (MMR).
Second-stage Sample Allocation and Selection
| Equally allocated 10 SSUs to all 47 strata (except one domain which is fully urban was allocated 60 PSUs).
| Secondary sampling units (SSUs) were selected using PPS sampling of listed households.
Third-stage Sample Allocation and Selection (2nd Stage in Nomadic Areas)
Thirty households were selected systematically and the household questionnaire administered. Further, in all the selected households, an ever-married questionnaire was administered to all ever-married women aged 12-49 and never-married questionnaire administered to never-married women aged 15-49. In addition, information was
obtained from children under the age of five.
Design Weights and Sampling WeightsDesign weights and sampling (survey) weights were computed for every household and ever-married women and never-married women selected to participate in the SHDS 2020. A design weight is the inverse of probability of selecting a housing unit to be interviewed. The sampling weight of a household is the design weight corrected for non-response including other adjustments where necessary. Design weights for each stage of the sample selection were computed as shown in the following steps:
First Stage: Selection of 35 PSUs from every urban stratum and rural stratum; and 10 PSUs from nomadic in stratum,
PSUh = number of PSUs to be sampled in stratum h;
and
MOShi = number of dwelling structures for PSU
i in
stratum h.
The probability of selecting PSUi in stratum h is
Second Stage: Selection of 10 SSUs from every urban and rural stratum from the 35 listed PSUs only,
Let
q = total number of SSUs to be sampled;
MOShij
= number of listed households for SSUj of PSU
i in
stratum h; and
Issu
= sampling interval for the selection of SSUs.
The conditional probability (CP) of selecting SSUj from
PSUi in stratum h is;

The Somali Health and Demographic Survey296
Design weight for enumeration areas: DW
2ea = 1/ CP
hij
Third and last stage: Selection of 30 households from each PSU using DHS Program excel sheet template,
let
dh = total number of housing units to be sampled
within the stratum h;
Dh = total number of housing units in the stratum h
sampling frame;
Let, r = dh⁄D
h, then the conditional probability of
selecting housing unit k from SSU j of PSUi in stratum h is
The overall probability of selecting housing unit k in SSU j of PSU i of stratum h is
The design weight for each household in cluster i of stratum h is the inverse of its overall selection probability:
Whijk
= 1/Phijk
= 1/r
Adjustment for non-response and computation of sampling weights
The design weight calculated above is based on sample design parameters. If there was no non-response at the cluster level, at the household level, at the individual level, or under-coverage, the design weight is enough for all analyses, for both household indicators and individual indicators. However, non-response was encountered in SHDS as is inevitable in such surveys. The response behaviour was different for clusters, households and individuals and all had to be accounted for.
The idea of correcting for unit non-response is to calculate a response rate for each homogeneous response group, then inflate the design weight by dividing it by the response rate for each response group. SHDS used the sampling stratum as the response group because the
stratification was achieved by regrouping homogeneous sampling units in a single stratum (urban, rural or nomadic).
The following steps explain how the sampling weight was calculated.
1. Primary Sampling Unit/Cluster level response rate
Let qh be the number of PSUs for the first stage and/or
SSUs for the second stage selected in stratum h; let *qh
be the number of clusters (PSUs/SSUs) interviewed. The cluster level response rate in stratum h is therefore;
2. Household level response rate
Let khj
be the number of households found, as recorded in the household questionnaire, in cluster j of stratum h; let *k
hj be the number of households interviewed in
the cluster. The household response rate in stratum h is calculated by;
where dhj is the design weight of cluster j in stratum h; the summation is over all clusters in the stratum h.
3. Individual response rate
Let hjl be the number of eligible women found in cluster
j of stratum h; let *hjl be the number of individuals
interviewed. The individual response rate in stratum h is calculated as;
where dhj
is the design weight of cluster j in stratum h; the summation is over all clusters in the stratum h.
The household sampling weight of cluster j in stratum h is calculated by dividing the household design weight by the product of the cluster response rate and the household response rate, for each of the sampling stratum:

297
The individual sampling weight of cluster j in stratum h is calculated by dividing the household sampling weight by the individual response rate, or equivalently, by dividing the household design weight by the product of the cluster response rate, the household response rate and the individual response rate, for each of the sampling strata:
Post-StratificationThe resulting sampling weight was adjusted for target population constructed by the SHDS team. The sampling frame had excluded areas that were not accessible, areas that had very few dwelling structures according to the satellite image and TNS with very few reported households. The adjusting factors, at the stratum level, were obtained by dividing the stratum target population by stratum sampling frame population. This ensured that the sum of the final weights equal is equal to the target population.
NormalizationLastly, the survey weights were normalized in order to give a total number of weighted cases that equals the total number of unweighted cases at the national level. Normalization was done by dividing the survey weight by the mean of the survey weight for the household weight and for the individual woman. The normalized weights are relative weights, which are valid for estimating means, proportions and ratios.
References
ICF International. 2015. Demographic and Health Survey Sampling and Household
Listing Manual. The DHS Program, Rockville, Maryland, U.S.A.: ICF International.
OECD, 2016. Technical Report of the Survey of Adult Skills. Programme for the
International Assessment of Adult Competencies (PIAAC), 2nd Edition.
Fuller, Wayne A. 2009. Sampling Statistics.
Johnson CL, Dohrmann SM, Van de Kerckhove W, et al. National Health and Nutrition
Examination Survey: National Youth Fitness Survey Estimation Procedures, 2012.
National Center for Health Statistics. Vital Health Stat 2(168). 2014.
The Somali Health and Demographic Survey298
APPENDIX B

299
Estimates of Sampling ErrorsSampling errors are important data quality parameters which give a measure of the precision of the survey estimates. They aid in determining the statistical reliability of survey estimates.
The estimates from a sample survey are affected by two types of errors: non-sampling errors and sampling errors. Non-sampling errors are the results of mistakes made in implementing data collection and data processing, such as failure to locate and interview the correct household, misunderstanding of the questions on the part of either the interviewer or the respondent, and data recording errors. Although numerous efforts were made during the implementation of the SHDS 2020 to minimize this type of error, non-sampling errors are impossible to avoid and difficult to evaluate statistically.
Sampling errors, however, can be evaluated statistically. The sample of respondents selected in the SHDS 2020 is only one of many samples that could have been selected from the same population, using the same design and size. Each of these samples would yield results that differ somewhat from the results of the actual sample selected. Sampling errors are a measure of the variability among all possible samples. Although the degree of variability is not known exactly, it can be estimated from the survey results.
A sampling error is usually measured in terms of the standard error for a particular statistic (mean, percentage, etc.), which is the square root of the variance. The standard error can be used to calculate confidence intervals within which the true value for the population can reasonably be assumed to fall. For example, for any given statistic calculated from a sample survey, the value of that statistic will fall within a range of plus or minus two times the standard error (SHDS reports +/-2*SE at 95% confidence interval) of that statistic in 95 percent of all possible samples of identical size and design.
If the sample of respondents had been selected as a simple random sample, it would have been possible to use straightforward formulas for calculating sampling errors. However, the SHDS 2020 sample is the result of a multi-stage stratified design, and, consequently, it was necessary to use more complex formulae.
The variance approximation procedure that account for the complex sample design and allow the computation of design effects used in SHDS is Taylor series linearization. The nonlinear estimates are approximated by linear ones for estimating variance. The linear approximation is derived by taking the first-order Taylor series approximation for the estimator. Standard variance estimation methods for linear statistics are then used to estimate the variance of the linearized estimator.
The Taylor Linearization Method treats any percentage or average as a ratio estimate, r = y/x, where y represents the total weighted sample value for variable y, and x represents the total weighted sample value for variable x or the total number of weighted cases in the group or subgroup under consideration. The variance of r is computed using the formula given below, with the standard error being the square root of the variance:
in which
where
h represents the sampling stratum which varies from 1 to H,
nh is the total number of clusters selected in the hth
stratum,
yhj is the sum of weighted values of variable y in the
jth cluster in the hth stratum,
xhj is the sum of weighted values of variable x in the
jth cluster in the hth stratum,
fh is the sampling fraction in stratum h, it can be
ignored when it is small
x is the sum of weighted values of variable x over the total sample
In addition to the standard error, the procedure computes the design effect (DEFT) for estimates which are means, proportions or ratios. For complex demographic rates, the
The Somali Health and Demographic Survey300
procedure computes an approximation of DEFT. DEFT is defined as the ratio between the standard error using the given sample design and the standard error that would result if a simple random sample had been used. A DEFT value of 1.0 indicates that the sample design is as efficient as a simple random sample, while a value greater than 1.0 indicates the increase in the sampling error due to the use of a more complex and less statistically efficient design. The procedure also computes the relative error and confidence limits for the estimates.
The sampling error tables present the estimated indicator value, the standard error, the number of unweighted and weighted cases, the design effect, the relative standard error and the confidence limits. The design effect can be used in sample size calculation for subsequent survey designs. Sampling errors are reported for the total sample, for the urban, rural and nomadic places of residence.
ReferencesICF International. 2015. Demographic and Health Survey Sampling and Household Listing Manual.
The DHS Program, Rockville, Maryland, U.S.A.: ICF International.
Fuller, Wayne A. 2009. Sampling Statistics.
Johnson CL, Dohrmann SM, Van de Kerckhove W, et al. National Health and Nutrition
Examination Survey: National Youth Fitness Survey estimation procedures, 2012. National Center
for Health Statistics. Vital Health Stat 2(168). 2014.

301
Table B.1 List of selected variables for sampling errors, SHDS 2020
Variable Estimate Base population
Households
Proportion in the urban areas Proportion Total households in urban areas
Proportion in the rural areas Proportion Total households in rural areas
Proportion in the nomadic areas Proportion Total households in nomadic areas
Proportion with improved water sources Proportion Total households
Proportion with unimproved water sources Proportion Total households
Proportion with water on premises Proportion Total households
Proportion with less than 30 minutes to a drinking water source
Proportion Total households
Proportion with 30 minutes or longer to a drinking water source
Proportion Total households
Proportion with basic drinking water service Proportion Total households
Proportion with limited drinking water service Proportion Total households
Proportion with flushed to piped sewer system Proportion Total households
Proportion with Flush to Septic tank Proportion Total households
Proportion with Flush to Pit Latrine Proportion Total households
Proportion with Flush to Somewhere else Proportion Total households
Proportion with Flush don’t know where Proportion Total households
Proportion with Ventilated improved pit latrine Proportion Total households
Proportion with Pit latrine with slab Proportion Total households
Proportion with Pit latrine without slab/Open latrine Proportion Total households
Proportion with Composite toilet Proportion Total households
Proportion with Bucket toilet Proportion Total households
Proportion with Hanging toilet/hanging latrine Proportion Total households
Proportion with No facility/Bush/Field Proportion Total households
Proportion with electricity for lighting Proportion Total households
Proportion with solar for lighting Proportion Total households
Proportion using kerosene for lighting Proportion Total households
Proportion using firewood for lighting Proportion Total households
Proportion using torch for lighting Proportion Total households
Proportion with electricity connection Proportion Total households

The Somali Health and Demographic Survey302
Table B.2 Sampling errors: All sample, SHDS 2020
Number of cases Confidence limits
Value (R )Standard
error (SE )Unweighted
(N)Weighted
(N)Relative
error (RSE) R-2SE R+2SE
Households
Proportion in the urban areas 0.598 0.004 6,682 9,779 0.006 0.590 0.605
Proportion in the rural areas 0.277 0.004 4,679 4,536 0.016 0.268 0.286
Proportion in the nomadic areas
0.125 0.001 4,999 2,045 0.010 0.123 0.127
Proportion with improved water sources
0.652 0.011 8,856 10,670 0.017 0.630 0.674
Proportion with unimproved water sources
0.348 0.011 7,504 5,690 0.032 0.326 0.370
Proportion with water on premises
0.643 0.010 7,869 10,513 0.015 0.624 0.662
Proportion with less than 30 minutes to a drinking water source
0.228 0.008 4,877 3,738 0.037 0.212 0.245
Proportion with 30 minutes or longer to a drinking water source
0.119 0.004 3,345 1,941 0.037 0.110 0.127
Proportion with basic drinking water service
0.610 0.011 7,716 9,981 0.018 0.589 0.632
Proportion with limited drinking water service
0.039 0.003 1,044 642 0.070 0.034 0.045
Proportion with flushed to piped sewer system
0.058 0.004 514 906 0.073 0.049 0.066
Proportion with Flush to Septic tank
0.042 0.003 453 654 0.074 0.035 0.048
Proportion with Flush to Pit Latrine
0.168 0.006 2066 2639 0.038 0.155 0.181
Proportion with Flush to Somewhere else
0.007 0.001 96 115 0.123 0.006 0.009
Proportion with Flush don’t know where
0.005 0.001 52 84 0.226 0.003 0.008
Proportion with Ventilated improved pit latrine
0.058 0.004 915 910 0.072 0.050 0.066
Proportion with Pit latrine with slab
0.239 0.007 2501 3748 0.031 0.224 0.253
Proportion with Pit latrine without slab/Open latrine
0.172 0.007 2420 2705 0.039 0.159 0.186
Proportion with Composite toilet
0.009 0.001 102 135 0.140 0.006 0.011
Proportion with Bucket toilet 0.020 0.002 278 307 0.117 0.015 0.024
Proportion with Hanging toilet/hanging latrine
0.005 0.001 70 73 0.194 0.003 0.006
Proportion with No facility/Bush/Field
0.207 0.007 6028 3254 0.034 0.193 0.222
Proportion with electricity for lighting
0.440 0.015 4750 6909 0.035 0.410 0.471
Proportion with solar for lighting
0.120 0.005 1701 1881 0.044 0.109 0.130
Proportion using kerosene for lighting
0.004 0.001 47 67 0.210 0.002 0.006

303
Proportion using firewood for lighting
0.013 0.001 343 199 0.095 0.010 0.015
Proportion using torch for lighting
0.419 0.013 8813 6580 0.030 0.394 0.445
Proportion with electricity connection
0.443 0.015 4769 6945 0.035 0.412 0.473

The Somali Health and Demographic Survey304
APPENDIX C

305
Data Quality Tables

The Somali Health and Demographic Survey306
Table C.1 Household age distribution
Single-year age distribution of the de facto household population by sex (weighted), SHDS 2020”
Age
Male Female
Age
Male Female
Number Percent Number Percent Number Percent Number Percent
0 1,698 3.7 1,578 3.3 36 186 0.4 269 0.6
1 1,603 3.5 1,612 3.4 37 216 0.5 271 0.6
2 2,061 4.5 1,936 4.0 38 301 0.7 381 0.8
3 1,993 4.3 2,057 4.3 39 322 0.7 287 0.6
4 2,025 4.4 2,004 4.2 40 1,027 2.2 895 1.9
5 1,886 4.1 1,845 3.8 41 124 0.3 118 0.2
6 2,003 4.4 1,907 4.0 42 176 0.4 157 0.3
7 1,767 3.8 1,732 3.6 43 113 0.2 98 0.2
8 1,925 4.2 1,849 3.8 44 134 0.3 126 0.3
9 1,331 2.9 1,446 3.0 45 462 1.0 430 0.9
10 1,710 3.7 1,768 3.7 46 73 0.2 79 0.2
11 1,147 2.5 1,224 2.5 47 87 0.2 62 0.1
12 1,575 3.4 1,558 3.2 48 117 0.3 92 0.2
13 1,314 2.9 1,337 2.8 49 236 0.5 180 0.4
14 1,194 2.6 1,336 2.8 50 915 2.0 884 1.8
15 1,150 2.5 1,208 2.5 51 120 0.3 164 0.3
16 1,022 2.2 1,139 2.4 52 173 0.4 190 0.4
17 859 1.9 976 2.0 53 113 0.2 99 0.2
18 1,053 2.3 1,222 2.5 54 134 0.3 112 0.2
19 597 1.3 753 1.6 55 338 0.7 327 0.7
20 910 2.0 1,218 2.5 56 103 0.2 77 0.2
21 350 0.8 472 1.0 57 61 0.1 49 0.1
22 487 1.1 641 1.3 58 79 0.2 62 0.1
23 381 0.8 488 1.0 59 190 0.4 114 0.2
24 396 0.9 594 1.2 60 701 1.5 525 1.1
25 757 1.6 1,033 2.2 61 42 0.1 31 0.1
26 313 0.7 476 1.0 62 50 0.1 36 0.1
27 412 0.9 563 1.2 63 55 0.1 38 0.1
28 487 1.1 674 1.4 64 64 0.1 55 0.1
29 387 0.8 494 1.0 65 178 0.4 145 0.3
30 1,076 2.3 1,240 2.6 66 26 0.1 24 0.0
31 174 0.4 211 0.4 67 31 0.1 37 0.1
32 321 0.7 378 0.8 68 42 0.1 28 0.1
33 185 0.4 254 0.5 69 102 0.2 75 0.2
34 289 0.6 306 0.6 70+ 1,207 2.6 1,145 2.4
35 764 1.7 855 1.8 Total 45,900 100.0 48,046 100.0
Note: The de facto population includes all residents and nonresidents who stayed in the household the night before the interview.

307
Table C.2.1 Age distribution of eligible and interviewed women
De facto household population of women age 10-54, number and percent distribution of interviewed women age 15-49, and percentage of eligible women who were interviewed (weighted), by 5-year age groups, SHDS 2020”
Age Group
Household population of women age 10-54
Interviewed women age 15-49
Number Percentage Percentage of eligible women interviewed
10-14 7,625 n/a n/a n/a
15-19 5,828 4,492 27.6 77.1
20-24 3,621 2,906 17.9 80.3
25-29 3,311 2,918 17.9 88.1
30-34 2,340 2,195 13.5 93.8
35-39 2,095 1,948 12.0 93.0
40-44 1,381 1,176 7.2 85.2
45-49 847 642 3.9 75.8
50-54 1,418 n/a n/a n/a
15-49 19,423 16,276 100.0 83.8
Note: The de facto population includes all residents and nonresidents who stayed in the household the night before the interview. Weights for both the household population of women and interviewed women are household weights. Age is based on the Household Questionnaire. n/a = Not applicable
Table C.3 Pregnancy-related mortality trends
Direct estimates of pregnancy-related mortality rates for the three years preceding each survey, by five-year age groups, SHDS 2020
Age group Total
15-19 118
20-24 329
25-29 324
30-34 291
35-39 180
40-44 102
45-49 33
TFR (15-49) 6.9
GFR 212
PRMR 746
PRMR CI 447-931
Rates for age group 45-49 may be slightly biased due to truncation. Rates are for the period 1-24 months prior to interview. TFR: Total fertility rate expressed per women GFR: General fertility rate expressed per 1,000 women age 15-49 PRMR Pregnancy-related mortality ratio Pregnancy-related mortality ratio Confidence interval

The Somali Health and Demographic Survey308
APPENDIX D

309
List of Contributors

The Somali Health and Demographic Survey310
STEERING COMMITTEE
• Minister Amb Gamal Hassan (MOPIED)
• Minister Fawziya Abikar Noor (MoH)• Minister Shire Xaaji Faraax (MOPIC)• Former DG Directorate of National
Statistics, Ahmed Elmi (MOPIED)• Former DG Directorate of National
Statistics, Mohamed Moalim (MOPIED)
• DG Directorate of National Statistics, Abdirahman Omar Dahir (MOPIED)
• Former DG Hussein Abdi Jama (MOPIC)
• DG Sharmake Hassan Ali (MOPIC)• Nur Ali (SHDS National Director)• Dr. Abdulkadir Afrah Weheliye (SHDS
Deputy National Coordinator)
TASKFORCE & COORDINATION COMMITTEE
• DG Sharmake Hassan Ali• Former DG Hussein Abdi Jama• DG Idris Hassan Mohamud • DG Abdulwahid Mohamed Dakane
• DG Dr Abdiweli Mohamed Ahmed • DG Abdullahi Omar Aden • DG Isak Mahamud Mursal • DG Hussein Mohamed Dahir • DG Yussuf Hassan Isaak • DG Tahlil Ibrahim Abdi • DG Abdullahi Mohamed Hassan • Abdifitah Mohamed Abdulahi (Director
of Statistics)• Abdi Mohamoud Ali (SHDS
Coordinator)• Abdinasir Ali Dahir (P&D Technical
Coordinator)• Nur Ahmed Weheliye (SHDS National
Coordinator)• Osman Hussein Warsame (SHDS
Coordinator)• Hussein Sheikh Mohamed
PROJECT DESIGN
• Abdi Mohamoud Ali (SHDS Coordinator)
• Emily Denness (Former International Midwifery Specialist, UNFPA)
• Ezekiel Kutto (Former M&E Specialist, UNFPA)
• Felix Mulama (Demographer, UNFPA)
• Mariam Alwi (P&D Specialist/Head of Unit, UNFPA)
• Nikolai Botev (Former Representative, UNFPA)
• Nur Weheliye (SHDS National Coordinator)
• Osman Warsame (SHDS Coordinator)• Richard Ng’etich (Statistician, UNFPA)• Umikaltuma Ibrahim (GIS Analyst,
UNFPA)• Mohamed Moalim (Former DG)• Dr. Abdallah Zoubi (Former PD Advisor,
ASRO)• Dr. Mohammed Abulata (Sampling
Expert)• Dr. Werner Haug (Demographer,
UNFPA Consultant)• The Late Dr. Ahmed Abdelmonem
(Director, PAPFAM)
SAMPLING DESIGN & WEIGHTING
• Richard Ng’etich (Statistician, UNFPA)• Abdinasir Ali Dahir (P&D Technical
Coordinator)• Said Abdilahi Dhule (Senior
Demographer)• Mohamed Abdinur (Statistician/Data
Specialist)• Amina Omar (GIS Assistant, UNFPA)• Felix Mulama (Demographer, UNFPA)• Josyline Gikunda (GIS Assistant,
UNFPA)• Umikaltuma Ibrahim (GIS Analyst,
UNFPA)
TOOLS DEVELOPMENT
• Nikolai Botev (Former Representative, UNFPA)
• Abdi Mohamoud Ali (SHDS Coordinator)
• Abdi Muse Kamil (HMIS Consultant)• Abdinasir Abukar Roble• Abdinasir Ali Dahir (P&D Technical
Coordinator)• Dr. Abdirisaq Hassan (Director of
Planning and Policy)• Deerow Ahmed Adam (Director of
Public Health)• Dr. Adam Farah (Reproductive and
Maternal Specialist UNFPA)• Dr. Abdulkadir Afrah Weheliye (SHDS
Deputy National Coordinator)• Faisa Ibrahim (Assistant
Representative, UNFPA)• Felix Mulama (Demographer, UNFPA)• Hawa Abdullahi Elmi (Midwifery
Specialist, UNFPA)• Ibrahim Mohamed Nur• Mariam Alwi (P&D Specialist/Head of
Unit, UNFPA)• Mohamed Hussein Abdullahi
(Statistician)• Mohamed Yarani (Statistician)• Nur Ahmed Weheliye (SHDS National
Coordinator)• Osman Warsame (SHDS Coordinator)• Richard Ng’etich (Statistician, UNFPA)• Said Abdilaahi (Senior Demographer,
MOPIED)• Sharmake Hassan (DG, MOPIC
Puntland)• Abdulrazak Karie (Demographer,
MOPIED)
DATABASE DEVELOPMENT
• Abdiaziz Mohamed Ali (Database Manager)
• Abdinasir Ali Dahir (P&D Technical Coordinator)
• Abdulrazak Karie Yare (Demographer)• Boniface Muganda (Database
Developer, UNFPA)• Felix Mulama (Demographer, UNFPA)• Richard Ngetich (Statistician, UNFPA)• Said Abdullahi Abdi (Senior
Demographer)• Samwel Andati (Data Management
Assistant, UNFPA)• Umikaltuma Ibrahim (GIS Analyst,
UNFPA)
DATA PROCESSING
• Abdiaziz Mohamed Ali (Database Manager)
• Abdinasir Ali Dahir (P&D Technical Coordinator)
• Abdullahi Kelly (Demographer)• Abdulrazak Karie (Demographer)• Abdirahman Sheikh• Boniface Muganda (Database
Developer, UNFPA)• Felix Mulama (Demographer, UNFPA)• Mohamed Abdinur (Statistician/Data
Specialist)• Mohamed Hussein Abdullahi
(Statistician)• Mohamoud Ali Said• Mohamed Said Bashir

311
• Said Abdilaahi (Senior Demographer)
GIS & SAMPLING FRAME DEVELOPMENT
• Abdiaziz Mohamed Ali• Abdifatah Abdikadir Jama• Abdinasir Ali Dahir• Abdirahman Omar Dahir• Abukar Abdulle Elmi• Ahmed Abdullahi Farah• Ahmed Nur Jama• Amina Omar (GIS Assistant, UNFPA)• Gilbert Sosi (GIS Assistant, UNFPA)• Halima Mohamed Abdirahman• Hassan Nor Mohamoud• Hodan Osman Jama• Josyline Gikunda(GIS Assistant,
UNFPA)• Mohamed Ali Dhaqane• Mohamed Ali Ibar• Mohamed Ali Liban• Mohamed Elmi Ali• Mohamed Said Bashiir• Mohamud Ali Said• Umikaltuma Ibrahim (GIS Analyst,
UNFPA)
PEER REVIEWERS
• Ahmed Aweis Ahmed (Maternal and Reproductive Health Specialist, UNFPA)
• Anna Nyman (Statistics Sweden)• Daniel Ayoubkhani (GSS Methodology
Advisory Service, Office for National Statistics)
• Dr Daniel Shiloh (GSS Methodology Advisory Service, Office for National Statistics)
• Dr Tareq Alkebsi (Central Statistics Organisation, Yemen)
• Dr. Abdallah Abdelaziz Zoubi (Former PD Advisor, ASRO)
• Haider Rasheed (Monitoring & Evaluation Specialist, UNFPA)
• Helge Brunborg (Senior Demographer, Statistics Norway)
• Kamlesh Giri (Chief of Health, UNFPA)• Louisa Blackwell (GSS Methodology
Advisory Service, Office for National Statistics)
• Masumi Maehara (Former Maternal and Neonatal Nutrition and Innovation Consultant, UNFPA)
• Merad Salah (GSS Methodology
Advisory Service, Office for National Statistics)
• Mohamed Abdi Mursal (Program Specialist, GBV & Youth, UNFPA)
• Nkiru Igbokwe (GBV/Gender Specialist, UNFPA)
• Per Schoning (Senior Adviser Division for Development Cooperation, Statistics Norway)
• Peter Lundquist (Statistics Sweden)• Ridwaan Abdi (Humanitarian
Specialist, UNFPA)• Vebjorn Aalandslid (Senior Adviser,
Statistics Norway)
ADVISORS
• Awad Al-Sheboul (Database Consultant)
• Dr. Abdallah Zoubi (Former PD Advisor, ASRO)
• Eman El-Sayed (Demographer)• National Institute of Statistics Rwanda• Nikolai Botev (Former Representative,
UNFPA)• Yusuf Murangwa (Director General,
NISR Rwanda)• Hannah Chira (Senior Programme
Officer, DfID)• Leo Thomas (M&E Advisor DfID)
EDITORIAL & DISSEMINATION
• Namita Mediratta (Reports Officer, UNFPA)
DESIGN & LAYOUT
• Scadden Orina (Editorial design & Layout)
• Timothy Mwaura (Cover Design)• Felix Desouza (Infographics)
AUTHORS
• Abdi Mohamoud Ali (SHDS Coordinator, MOPIC Puntland)
• Abdinasir Ali Dahir (Demographer/Statistician, MOPIC Puntland)
• Felix Mulama (Demographer, UNFPA)• Mariam Alwi (P&D Specialist/Head of
Unit, UNFPA)• Nur Ahmed Weheliye (SHDS National
Coordinator, MOPIED)• Osman Warsame (Research
Consultant, UNFPA)• Richard Ng’etich (Statistician, UNFPA)• Said Abdilahi Abdi (Senior
Demographer)• Umikaltuma Ibrahim (GIS Analyst,
UNFPA)• Zena Lyaga (Demographer, UNFPA)
ADMINISTRATION & FINANCE
• Pedro Roballo (International Operations Manager, UNFPA)
• Cyrus Thuku ( Travel and Logistics)• Eva Mwagonah (Programme Assistant,
DfID)• Maimuna Abdalla (Programme
Assistant, DfID)• Faisa Kasim (Finance/Admin Assistant
MOPIED)• Halima Ahmed (Project Assistant,
UNFPA)• Kamal Ahmed (Advocacy Support
Consultant, UNFPA)• Kevin Kibubi (Admin/Finance
Associate, UNFPA)• Nasra Adow (Project Assistant,
UNFPA)• Osman Jama (Finance/Admin Officer
MOPIC)• Samwel Andati (Data Management
Assistant, UNFPA)• Shukri Salad (Finance/Admin Officer
MOPIED)
We would also like to single out the tireless contribution of the below SHDS team members
• Felix Mulama (Demographer, UNFPA) and Mohamed Abdi Nur (Statistician/Data Specialist) – Overall coordination of generation and review of the SHDS data
• Umikaltuma Ibrahim (GIS Analyst, UNFPA) – Coordination of review of the chapters

The Somali Health and Demographic Survey312
Supervision, Coordination, Verification and Quality Assurance
1. Abdi Ali Dogey 2. Abdiaziz Mohamed Ali3. Abdifatah Abdikadir Jama 4. Abdifatah Abdikadir Jama5. Abdifatah Mohamed Abdulle6. Abdihakin Mohamed Dirie7. Abdikhaliq Ahmed Mohamed8. Abdinasir Mohamed Abdi9. Abdireshid Yusuf Ebrahim10. Abdirisak Ahmed Isse 11. Abdirishiid Ali Yusuf12. Abdullahi Mohamed Abdi 13. Abdullahi Warsame Abtidoon14. Aden Mohamed Nur 15. Adirisak Adan Shire16. Adirisak Adan Shire17. Ahmed Abdullahi Farah 18. Ahmed Abdullahi Farah19. Ahmed Dahir Hussein Osman20. Ahmed Mohamed Khalif 21. Ahmed Nur Jama22. Ali Mohamed Bashir23. Ayanle Abdullahi Ali24. Dr. Abdulkadir Weheliye Afrah 25. Dr. Qabul Isse Haji26. Fadumo Abshir Mohamed 27. Hamdi Ahmed Ali 28. Hassan Ahmed Aidid29. Hassan Mohamed Aweis30. Hassan Nur Mohamud31. Hassan Sheikh Ahmed 32. Hawa Abdullahi Elmi 33. Hodan Osman Jama34. Ibrahim Abdulkadir Xaaji 35. Kheiria Mohamed Ali 36. Mohamed Abdi Egal37. Mohamed Ali Dhaqane 38. Mohamed Ali Ibar39. Mohamed Elmi Ali40. Mohamed Farah Haji41. Mohamed Mohamud Mohamed42. Mohamed Mohamud Mohamed 43. Mohamed Osman Moalim44. Mohamed Said Bashir45. Mohamoud Ali Said
46. Mohamoud Hussein Mohamed 47. Musdaf Mohamed Ahmed 48. Nadir Abdirahman Kasim 49. Osman Jama Ali 50. Sahra Moa’lim Mohamud 51. Said Abdullahi Ali52. Suad Mohamed Omar 53. Sumaya Ahmed Osman 54. Yusuf Haji Aden
Supervisors
1. Abdiweli Mohamed Adan2. Abdulahi Abdisalam Husein3. Adey Arale Gabey4. Aisha Mohamed Ali5. Amina Hassan Hussein6. Aniiso Mire Yusuf7. Anisa Salad Abdi8. Awo Mohamoud Jama9. Ayan Abdinor Elmi10. Ayan Ahmed Ali11. Ayni Mohamed Adan 12. Dahabo Mohamud Abdirahman13. Dr. Ruqiya Ahmed Beere 14. Elmi Omar Haji Elmi 15. Fadumo Ahmed Mohamed16. Faiza Hassan Mohamud 17. Farhia Faisal Mohamed18. Haawo Mahamed Abukar 19. Hamdi Mohamed Yusuf20. Hana Abdikarim Hassan21. Hani Abdulrahman Adan 22. Hawo Ali Barre23. Hawo Hassan Abdullahi24. Hibaq Abdirizak Kulmiye25. Hodan Farah Ismail26. Ifrah Ibrahim Omar27. Iman Mohamed Abdalla28. Iqra Abdullahi Ali29. Jama Hassan Darood30. Leyla Ahmed Hussain31. Lul Mohamed Ahmed32. Lul Omar Ulusow33. Maria Mohamoud Said34. Maryan Abdirizak Warsame35. Maryan Adan Hassan 36. Miski Osman Mohamoud37. Mohamed Abdullahi Qasim38. Mohamed Adow Hassan
39. Muhubo Abdiaziz Abdullahi40. Muna Mohamed Abdi 41. Nafisa Hassan Abdulle42. Nafiso Ahmed Mohamud43. Raida Ali Mudei44. Ridwan Osman Hussein45. Sabad Abdirahman Warsame46. Sabirin Abdisahal Mohamed47. Sadia Mohamed Esse48. Sagal Ibrahim Ali49. Said Farah Bayr50. Samira Abdiweli Ali51. Shamsa Abdullahi Mohamed52. Shukri Osman Ibrahim 53. Sucaad Ali Nuur54. Sundus Hussein Mohamed55. Xafsa Abdirisaq Mahamud
Enumerators
1. Sahra Mohamed Farah,2. Najmo Abdi Ali3. Raxma Hassan Osoble,4. Sowdo Abdullahi Farah5. Amal Mohamed Hade6. Sucaad Hassan Yusuf7. Naimo Abdisalam Alasow8. Farxiyo Dahir Karie9. Nasteho Abdinur Ahmed10. Sumaya Abdirizak Sheikh11. Fardowso Abdulkadir Samatar,12. Hodan Ahmed Dhif13. Ruweydo Abdulahi Mohamed14. Fardowso Ali Osman15. Sowdo Garad Abdi16. Aisha Ali Yusuf17. Naima Mohamud Elmi,18. Nafiso Ali Ysuf19. Fatuma Yahye Barre20. Sahra Ahmed Osman21. Fathi Adan Abdi22. Fatuma Mohamed Ahmed23. Shukri Osman Abdullahi24. Naima Mohamed Artan25. Fartun Mohamed Adan26. Naima Ibrahim Osman 27. Farhiyo Adan Warfa Jama28. Naimo Abdiwahab Ali 29. Mulki Mohamed Mire30. Kafiyo Said Osman
Main Survey

313
31. Sahro Ibrahim Mataan32. Faiza Ahmed Mohamed33. Maryan Abukar Mohamed 34. Bisharo Ahmed Mohamed35. Fadumo Abdi Ibrahim 36. Farhiyo Ibrahim Abdulahi 37. Saharo Yacqub Ali38. Samiiro Isack Ibrahim39. Khadijo Hassan Ibrahim 40. Rahmo Mohamed Ali 41. Naciimo Nur Abdi 42. Anisa Isack Adan 43. Nurto Abdukadir Ali 44. Farhiyo Isack Mohamed 45. Amino Husein Mohamed 46. Samiiro Mohamed Hiusein 47. Aasho Mahmud Mohamed 48. Maryan Adan Mohamed 49. Samiro Omar Abdullahi 50. Mulki Mohamed Ali 51. Raho Ali Ahmed 52. Ifrah Dhakane Isse 53. Zamzam Nur Mumin 54. Miski Mohamed Mohamud 55. Fadumo Ali Wasuge56. Halimo Mohamed Mohamud 57. Fadumo Hassan Idris58. Hodan Osman Hassan59. Balqisa Sh. Ibrahim60. Kafiyo Ahmed Baarow61. Shukri Omar Mohamed62. Deeqo Abdulqadir Salad63. Sagal Mohamed Karar 64. Markabo Ahmed Rujaal65. Hamdi Abdullahi Elmi66. Farhiyo Mohamud Osman 67. Abshiro Abdi Ali68. Asha Ali Hussein69. Amino Abdullahi Karie70. Anab Daahir Hersi71. Ayan Bashir Dahir72. Deeqo Cabdi Maxamed73. Fadumo Abdihakim Mohamed74. Fadumo Haji Adan75. Fardowsa Abdi Hassan76. Fardowsa Mohamed Hussein77. Fartun Elmi Alim Afrah78. Fatima Omar Ibrahim79. Halima Aden Farah80. Halima Ahmed Osoble81. Halimo Abdi Ali
82. Hawo Hassan Jama83. Iftin Ibrahim Abdirahman84. Ismahan Olow Arrale85. Kowsar Abdullahi Hassan86. Leylo Abdi Nor87. Maryan Hassan Mohamud88. Maryan Mohamed Abdulkadir89. Muno Sharif Isse Nor90. Miski Abdirahman Osman91. Misra Farah Gaal92. Naimo Mohamed Hirabe93. Nimo Hassan Abdullahi94. Qaali Osman Dhaqane95. Rabio Ahmedziyar Mohamed96. Ramla Faysal Warsame97. Saado Ali Mohamed98. Safia Abdirahman Abdullahi99. Sa’dia Mohamud Mohamed100. Seynab Isma’il101. Shamso Adan Isak102. Yasmin Haji Hassan Mohamed103. Zeinab Abdisatar Abdisalan104. Fardowso Said Mohamed105. Iman Mukhtar Isse106. Fahmo Mumin Mohamed107. Kowsar Abdisalam Guled108. Fadumo Mahad Ali109. Farhia Aden Yusuf110. Ikran Jabir Duale111. Nasteho Aden Husien112. Nasra Ali Jama113. Bushra Axmed Aaden114. Sahro Khaalid Mohamed115. Ikran Mohamud Hassan116. Faduma Abdi Said117. Kaltun Ahmed Hassan118. Samiro Osman Salah119. Zuhuur Ahmed Abas120. Halima Said Abshir121. Dhoofo Abdi Said122. Hamdi Abdullahi Abshir123. Maymun Bashir Abdulkadir124. Hodan Mohamed Muuse125. Aisha Mohamoud Rashid126. Amina Salah Ahmed127. Jawahir Abdullahi Mohamed128. Shukri Abdiaziz Dahir129. Halimo Mohamed Adam130. Samia Jama Mohamed131. Naima Yusuf Nour132. Awo Ahmed Farah
133. Ayan Saed Ali134. Sahra Abdullahi Hassan135. Saida Aden Said136. Fadumo Ahmed Isse137. Deqa Hassan Ali138. Muhubo Abdulaziz Muhumed139. Bisharo Sahal Mohamed140. Maymun Abdirahman Ali141. Fadumo Ahmed Jama142. Fardowso Ahmed Mohamed143. Ayan Mohamed Farah144. Jamad Farah Said145. Fartun Abdi Ali146. Ayan Mohamed Hassan147. Naima Ahmed Abdalla148. Sumayo Mohamud Ismail149. Sahro Mohamed Farah150. Nasteho Abdirizak Abshir151. Fowsio Mohamed Salah152. Asia Abdirahman Husein153. Fardawsa Mohamed Warsame154. Fardowsa Abdulkadir Hersi155. Fartuun Mohamed Abdullahi156. Maryam Hassan Farah157. Sadia Abdisamad Abdille158. Najma Farah Jama159. Asia Dahir Mohamed160. Muna Abshir Mohamed161. Faasiso Maxamed Musse162. Amal Mohamed Abdulkadir

The Somali Health and Demographic Survey314
Supervision, Coordination, Verification and Quality Assurance
1. Nur Ahmed Weheliye2. Hussein Elmi Gure3. Shukri Yusuf Salad4. Abdiaziz Ibrahim Yusuf5. Xaliimo Mohamed Abdirahman6. Ahmed Abdullahi Farah7. Abdulrazaq Abdullahi Karie8. Said Abdilaahi Abdi9. Mohamed Husein Abdullahi10. Abdullahi Mohamed Abdi11. Abdi Mohamoud Ali12. Abdinasir Ali Dahir13. Abdiaziz Mohamed Ali14. Hassan Ahmed Aidid15. Ahmed Nur Jama16. Mohamoud Ali Said17. Adirisak Adan Shire18. Mohamoud Hussein Mohamed 19. Hodan Osman Jama20. Mohamed Said Bashiir
Supervisors
1. Abdullahi Jimcale Ali2. Abdulkadir Mohamed Rage3. Hassan Musse Abdi4. Salah Husen Xuurshow5. Yahye Hassan Tifoow6. Ibrahim Idow Farah7. Adisalam Ahmed Abdullahi8. Mohamed Abdi Husein9. Abdihakim Ahmed Adam10. Mohamed Abdirahman Khaliif11. Ahmed Abdi Abdulahi12. Ahmed Farxaan Noor13. Aadam Mahad Kosar14. Abdishukri Abdulahi Aadam15. Adan Inshaar Hassan16. Mohamed Adan Mohamed17. Ahmed Hussein Hassan18. Hilaal Adan Abdi 19. Mohamed Ali Isse20. Mohamed Hassan Salaad 21. Abdirsak Mohamud Ogle22. Fa’id Abdiaziz Ali23. Farhia Abdi Shire Jayte24. Ali Mohamud Abdi25. Abdirizak Mohamed Ahmed26. Mohamed Adan Ibrahim27. Hussein Hassan Abdirahman
28. Abdikarim Mohamed Ahme29. Abdulahi Nur Mohamed30. Hassan Ali Adan31. Muhudiin Ibrahim Aden32. Ibrahim Cabdullahinaden33. Shukri Ali Aden34. Abdullahi Sheikh Ali35. Hussein Ahmed Mursal36. Mohamed Said Hay37. Cabdirisaaq Maxamed Moxamud38. Mohamoud Ibrahim Guure39. Mohamed Omar Artan 40. Aisha Hamud Mohamed41. Ayduruus Mohamed Adan42. Sadik Abdulkadir Yusuf 43. Abdullahi Abdisalaam Hussein44. A.Fatah A.Qadir Jama45. Abdikadir Hussein Hassan46. Mohamed Mohamamud Mohamed47. Fahad Abdiasis Elmi48. Hassan Nor Mohamud49. Saacid Farah Ahmed50. Mohamed Hussein Mohamud51. Mohamed Said Hay52. Cabdirisaaq Maxamed Moxamud53. Mohamoud Ibrahim Guure54. Mohamed Omar Artan 55. Aisha Hamud Mohamed56. Ayduruus Mohamed Adan57. Sadik Abdulkadir Yusuf 58. Abdullahi Abdisalaam Hussein
Enumerators
1. Ahmed Hassan Saciid2. Shuceyb Cumar Mohamed3. Mohamed Ali Liban4. Shukri Osman Ibrahim5. Aweys Hassan Mohamed6. Ahmed Abdulkadir Hassan7. Abdinasir Abukar Hussein8. Ahmed Mohamed Abdulle9. Xasan Cise Shiq10. Mustaf Mukhtar Abukar11. Nafiso Hassan Moallim12. Nasteha Abdullahi Hussein13. Mohamed Abdi Hussein14. Mohamed Ibrahim Barow15. Mohamed Mohamamud Isaq16. Safiyoabdikarin Hussein17. Ahmed Osman Ibrahim18. Abdullahi Salah Mudey19. Axmed Nasir Yusuf Cilmi20. Fartun Hassan Addow21. Ifrah Mohamed Abdi22. Marian Mohamed Abdulle
23. Maslah Mikail Ali24. Mohamed Barre Isaaq25. Abdiriza Ali Mumin26. Ahmed Hussein Dahiye27. Marian Abdirahman Mohamed28. Ibrahim Abdullahi Adam29. Osman Barre Ibrahim30. Naima Ali Nor31. Abdirizakh Abdulkhadir Abdulle32. Fowsiya Cabdullahi Ali33. Abdiwahab Ali Ahmed34. Farhio Mohamud Osman35. Frah Muse Ibrahim36. Abdiwali Mohamed Mohamud37. Bashiir Farah Abdi38. Ahmed Haroon Haji39. Fardowso Mohamed Haye40. Osman Hassan Abdi41. Khalid Shafici Ismail42. Abdinuur Hambali Siyad43. Raxmo Mohamed Abdi44. Bisharo Hirsi Abdille45. Hibo Salad Abdirahman46. Safiyo Geedi Hassan47. Shafici Abdulahi Sehen48. Abdirahman Abdulahi Ahmed49. Abdinoor Hambal Abdi50. Abdirahman Abshir Hirsi51. Ali Mohamed Osman52. Khadijo Aden Barkhadle53. Mako Hussein Ali54. Abdifatah Mohamed Aden55. Sugal Abdulahi Hassan56. Hashim Abdi Weheliye57. Yusuf Mohamed Isak58. Bare Mohamed Muhumed59. Zakaria Abdi Adaawe60. Mohamed Adan Turub61. Amina Abdikadir Ali62. Abdirisaq Shire Hussein63. Abdinasir Abdow Ibrahim64. Layla Mohamed Ahmed65. Abdirashid Dhunkaal Mohamed66. Ahmed Adan Ibrahim67. Mohamed Ibrahim Yusuf68. Adan Inshaar Hassan69. Osman Hire Sabtow70. Asho Abdulkadir Mohamed71. Abdihakim Mohamed Barqadle72. Ahmed Shire Muhumed73. Abdirahman Ahmed Rooble74. Salim Mohamed Ahmed75. Sowdo Nur Mohamed76. Mumin Mohamed Barre77. Shuuke Mohamed Halane 78. Jama Abdirashid Jama79. Sadam Hussien Warsame
Household Listing & MMR

315
80. Faysal Salad Mohamud81. Sharmake Hassan Mohamed82. Abdikani Artan Mohamed83. Ayan Hirsi Mohomud84. Yahye Osman Gedi85. Aamina Abdi Hussein86. Ahmed Mawel Salad87. Abdikafi Dahir Barre88. Fa’id Abdiaziz Ali89. Aamina Abdi Hussein90. Abdinasir Ahmed Elmi 91. Mohamed Ahmed Hirsi92. Osman Gelle Jama 93. Mohamed Abdulahi Hashi94. Abdulkadir Abdi Farah95. Hodan Abdulle Farah96. Fa’id Ali Nur97. Farah Khalif Hashi98. Bashi Ali Hashi99. Shariif Alinur Kulane100. Zeynab Mohamed Adan101. Mohamed Mohamud Mohamed102. Hamza Ali Ibrahim103. Ali Shine Drbaan104. Ayanle Abdi Dahir105. Ali Mohamed Nour106. Hassan Adan Ibrahim107. Maryan Sheikh Adan108. Muhudiin Ibrahim Mohamed109. Olad Hassan Mohamed110. Abdirahman Mohamed Abdulahi111. Ali Hassan Ahmed112. Ifrah Guhad Ali113. Leila Sheikh Issack114. Mohamed Mayow Mohamed115. Mohamed Mukhtar Adan116. Mohamed Bile Hussein117. Rahmo Nur Adan118. Rukia Abdulahi Mohamed119. Salah Abdullahi Abdirahman120. Yusuf Abdulahi Abdi121. Maslax Sokor Ali122. Mohamed Hassan Mohamed 123. Muhudiin Ibrahim Aden124. Omar Sheikh Abdi125. Maryan Ahmed Moalim126. Zakariye Muhidin Haji 127. Mohamed Ibrahim Abubakar128. Mohamed Omar Mohamed129. Ifrah Ahmed Hassan130. Adan Issack Noor131. Yahye Haji Mohamed Hassan132. Abdifatah Mohamed Abdi133. Ahmed Yunis Ahmed134. Khalid Mohamed Ali135. Aweis Armiye Abdillahi136. Ahmed Abdulahi Ahmed
137. Furtun Mohamed Ali138. Abdirahman Mohamed Jeylani139. Osman Sh Hassan Sh Mohamed140. Ibraahim Adan Mohamed141. Faatima Ahmed Jama142. Mohamed Abdikadir Waberi143. Fartuun Ali Ismail144. Cabdiqafaar Abdicasiis Cabdiqaadir145. Naimo Mohamed Nour146. Samatar Saeed Nur147. Maymun Abdirahman Ali148. Arwo Abdikadir Mohamoud149. Mohamed Abdisamed Awed 150. Abdirahman Jama Shire 151. Abdikarim Mohamoud Ahmed 152. Abdifatah Mohamed Abdi153. Mukhtar Abdullahi Cartan 154. Shaakir Jama Mohamed155. Husein Osman Hassan156. Ahmed Abdikarim Mohamed 157. Farhiyo Jama Nour158. Hassan Ahmed Aydid159. Canab Cali Shire160. Fowsiyo Mohamoud Ali161. Ifrah Abdirashiid Farah162. Samsam Abdirashid Mohamed163. Mohamed Elmi Ali164. Fadumo Aden Hussien165. Abdulhakiim Nidaam Adam 166. Mohamd Ali Yusuf 167. Suhuur Ahmed Abaas168. Shukri Abdiaziz Dahir169. Ahmed Yasin Ali170. Kaltuun Muse Abdikariim 171. Madar Dhamuuke Muuse172. Maryan Mohamed Ahmed 173. Fardows Isse Farah174. Aadam Sabtow Hassan 175. Khadro Osmaan Ali176. Bashiir Adan Abdulle 177. Ifrah Ibraahim Ali178. Ahmed Hussein Hassan179. Abdirahman Dahir Ahmed180. Abdisamad Abdullah Hamuud181. Maymoon Abdiraxman Farax182. Mustafa Hassan Hussein 183. Sacdia Abdullahi Hussein 184. Ali Mohamed Bashir185. Mahad Abuukarmaxamed 186. Halima Mohamed Abdullahi187. Yaasmiin Ibraahim Nageeye188. Zahir Mohamed Omar189. Sacdio Farah Hassan190. Mohamed Ali Isse191. Ardo Ismail Hussein192. Abdikhaliq Ahmed Mohamed193. Bisharo Shafi Rage
194. Hani Ahmed Mohamed195. Cabdirisaaq Cismaan Cali196. Mahad Abdullahi Muse197. Saciido Hussein Halane198. Baarliin Tahliil Osman199. Abdirashid Hassan Dhorre200. Mohed Ali Liban201. Fatuma Abdirizak Husssein 202. Iman Jama Yussuf203. Faiza Kassim Hassan 204. Maymoon Abdiraxman Farax205. Mahamed Dhaqane Xalane206. Faatima Ahmed Jama207. Mohamed Abdikadir Waberi208. Fartuun Ali Ismail209. Cabdiqafaar Abdicasiis Cabdiqaadir210. Naimo Mohamed Nour211. Samatar Saeed Nur212. Maymun Abdirahman Ali213. Arwo Abdikadir Mohamoud214. Mohamed Abdisamed Awed 215. Abdirahman Jama Shire 216. Abdikarim Mohamoud Ahmed 217. Abdifatah Mohamed Abdi218. Mukhtar Abdullahi Cartan 219. Shaakir Jama Mohamed220. Husein Osman Hassan221. Ahmed Abdikarim Mohamed 222. Farhiyo Jama Nour223. Hassan Ahmed Aydid224. Canab Cali Shire225. Fowsiyo Mohamoud Ali226. Ifrah Abdirashiid Farah227. Samsam Abdirashid Mohamed228. Mohamed Elmi Ali229. Fadumo Aden Hussien230. Abdulhakiim Nidaam Adam 231. Mohamd Ali Yusuf 232. Suhuur Ahmed Abaas233. Shukri Abdiaziz Dahir234. Ahmed Yasin Ali235. Kaltuun Muse Abdikariim 236. Madar Dhamuuke Muuse237. Maryan Mohamed Ahmed 238. Fardows Isse Farah

The Somali Health and Demographic Survey316
APPENDIX E

317
Household Questionnaire

The Somali Health and Demographic Survey318
`
SOMALI MINISTRIE'S OF PLANNING AND HEALTH
QUESTIONNAIRE SERIAL NUMBER
NAME CODE
REGION
PRE-WAR NAME OF THE DISTRICT
CURRENT NAME OF THE DISTRICT
SETTLEMENT/TOWN
EA TYPE (1=RURAL/IDP 2=URBAN/IDP 3=NOMADIC) . . . . . . . . . . . . . . . . . . . . . . . . . . . . . . . . . . . . . . . .
EA CODE . . . . . . . . . . . . . . . . . . . . . . . . . . . . . . . . . . . . . . . . . . . . . . . . . . . . . . . . . . . . . . . . . . . . . . . . . . . .
HOUSEHOLD SERIAL NUMBER IN THE EA . . . . . . . . . . . . . . . . . . . . . . . . . . . . . . . . . . . . . . . . . . . . . . . .
DATE DAY
MONTH
YEARINTERVIEWER'SNAME INT. NO.
RESULT* RESULT*
NEXT VISIT: DATETOTAL NUMBER
TIME OF VISITS
*RESULT CODES: TOTAL PERSONS1 COMPLETED IN HOUSEHOLD2 NO HOUSEHOLD MEMBER AT HOME OR NO COMPETENT RESPONDENT
AT HOME AT TIME OF VISIT TOTAL ELIGIBLE EVER3 ENTIRE HOUSEHOLD ABSENT FOR EXTENDED PERIOD OF TIME MARRIED WOMEN4 POSTPONED5 REFUSED TOT ELIGIBLE NEVER6 DWELLING VACANT OR ADDRESS NOT A DWELLING MARRIED WOMEN7 DWELLING DESTROYED8 DWELLING NOT FOUND TOTAL CHILDREN 9 PARTLY COMPLETED 0-5 YEARS
96 OTHER LINE NO. OF RESPONDENT TO HOUSEHOLDQUESTIONNAIRE
LANGUAGE OF LANGUAGE OF NATIVE LANGUAGEQUESTIONNAIRE** INTERVIEW** OF RESPONDENT**
LANGUAGE OF **LANGUAGE CODES:QUESTIONNAIRE** 01 ENGLISH 03 OTHER __________________________
02 SOMALI SPECIFY
SUPERVISOR FIELD EDITOR OFFICE EDITOR KEYED IN BYNAME . . . . . . . . . . . . . . . DATE . . . . . . . . . . . . . . .
CODE . . . . . . . . . . . . . . .
REG. CODE DIST CODE HH SERIAL NO. INTERVIEWER NO.EA CODE
ENGLISH
HHOOUUSSEEHHOOLLDD QQUUEESSTTIIOONNNNAAIIRREE
0 1
FINAL VISIT
INTERVIEWER VISITS
(SPECIFY)
321
IDENTIFICATION
SOMALI HEALTH &DEMOGRAPHIC SURVEY2017-2019
HH-1
2018-2019

319
`
SOMALI MINISTRIE'S OF PLANNING AND HEALTH
QUESTIONNAIRE SERIAL NUMBER
NAME CODE
REGION
PRE-WAR NAME OF THE DISTRICT
CURRENT NAME OF THE DISTRICT
SETTLEMENT/TOWN
EA TYPE (1=RURAL/IDP 2=URBAN/IDP 3=NOMADIC) . . . . . . . . . . . . . . . . . . . . . . . . . . . . . . . . . . . . . . . .
EA CODE . . . . . . . . . . . . . . . . . . . . . . . . . . . . . . . . . . . . . . . . . . . . . . . . . . . . . . . . . . . . . . . . . . . . . . . . . . . .
HOUSEHOLD SERIAL NUMBER IN THE EA . . . . . . . . . . . . . . . . . . . . . . . . . . . . . . . . . . . . . . . . . . . . . . . .
DATE DAY
MONTH
YEARINTERVIEWER'SNAME INT. NO.
RESULT* RESULT*
NEXT VISIT: DATETOTAL NUMBER
TIME OF VISITS
*RESULT CODES: TOTAL PERSONS1 COMPLETED IN HOUSEHOLD2 NO HOUSEHOLD MEMBER AT HOME OR NO COMPETENT RESPONDENT
AT HOME AT TIME OF VISIT TOTAL ELIGIBLE EVER3 ENTIRE HOUSEHOLD ABSENT FOR EXTENDED PERIOD OF TIME MARRIED WOMEN4 POSTPONED5 REFUSED TOT ELIGIBLE NEVER6 DWELLING VACANT OR ADDRESS NOT A DWELLING MARRIED WOMEN7 DWELLING DESTROYED8 DWELLING NOT FOUND TOTAL CHILDREN 9 PARTLY COMPLETED 0-5 YEARS
96 OTHER LINE NO. OF RESPONDENT TO HOUSEHOLDQUESTIONNAIRE
LANGUAGE OF LANGUAGE OF NATIVE LANGUAGEQUESTIONNAIRE** INTERVIEW** OF RESPONDENT**
LANGUAGE OF **LANGUAGE CODES:QUESTIONNAIRE** 01 ENGLISH 03 OTHER __________________________
02 SOMALI SPECIFY
SUPERVISOR FIELD EDITOR OFFICE EDITOR KEYED IN BYNAME . . . . . . . . . . . . . . . DATE . . . . . . . . . . . . . . .
CODE . . . . . . . . . . . . . . .
REG. CODE DIST CODE HH SERIAL NO. INTERVIEWER NO.EA CODE
ENGLISH
HHOOUUSSEEHHOOLLDD QQUUEESSTTIIOONNNNAAIIRREE
0 1
FINAL VISIT
INTERVIEWER VISITS
(SPECIFY)
321
IDENTIFICATION
SOMALI HEALTH &DEMOGRAPHIC SURVEY2017-2019
HH-1
2018-2019

The Somali Health and Demographic Survey320
THIS PAGE IS INTENTIONALLY BLANK
HH-2

321
SIGNATURE OF INTERVIEWER DATE
RESPONDENT AGREES RESPONDENT DOES NOT AGREETO BE INTERVIEWED . . 1 TO BE INTERVIEWED . . 2 END
100HOURS . . . . . . . . . . . . . . . . . . . . . . . .
MINUTES . . . . . . . . . . . . . . . . . . . . . . . .
INTRODUCTION AND CONSENT
Hello. My name is _______________________________________. I am working with [NAME OF ORGANIZATION]. We are conducting a survey about health and related topics all over [NAME OF COUNTRY]. The information we collect will help the government to plan health and other services. Your household was selected for the survey. I would like to ask you some questions about your household. The questions usually take about 15 to 20 minutes. All of the answers you give will be confidential and will not be shared with anyone other than members of our survey team. your participation in the survey is voluntary, but we hope you will agree to answer the questions since your views are important. If I ask you any question you don't want to answer, just let me know and I will go on to the next question or you can stop the interview at any time. In case you need more information about the survey, you may contact the ministry of interior/planning and/or health.
Do you have any questions?May I begin the interview now?
RECORD THE START TIME.
HH-3

The Somali Health and Demographic Survey322
LINE RELATIONSHIPNO. TO HEAD OF AT FIRST
HOUSEHOLD MARRIAGE
1
CIRCLE CIRCLE CIRCLELINE LINE LINENUMBER NUMBER NUMBEROF ALL OF ALL OF ALLEVER NEVER CHILDRENMARRIED MARRIED AGE 0-5WOMEN WOMENAGE AGE12-49 15-49
AFTER LISTING THE 1 = MARRIED RECORDNAMES AND RECORDING 2 = DIVORCED AGE IN THE RELATIONSHIP 3 = ABANDO- YEARSAND SEX FOR EACH NEDPERSON, ASK 4 = WIDOWED IF 95QUESTIONS 2A-2B 5 = NEVER- OR MORE,TO BE SURE THAT THE MARRIED RECORDLISTING IS COMPLETE. '95'.
IF 95THEN ASK APPROPRIATE OR MORE,QUESTIONS IN COLUMNS SEE CODES RECORD5-32 FOR EACH PERSON. BELOW. '95'.
M F Y N Y N
01 1 2 1 2 1 2 01 01 01
1 2 1 2 1 202 02 02 02
1 2 1 2 1 203 03 03 03
1 2 1 2 1 204 04 04 04
1 2 1 2 1 205 05 05 05
1 2 1 2 1 206 06 06 06
1 2 1 2 1 207 07 07 07
1 2 1 2 1 208 08 08 08
1 2 1 2 1 209 09 09 09
1 2 1 2 1 210 10 10 10
2A) CODES FOR Q. 3: RELATIONSHIP TO HEAD OF HOUSEHOLDYES ADD TO NO 01 = HEAD OF HOUSEHOLDNO 08 = BROTHER OR SISTER
TABLE 02 = SPOUSE 09 = NEPHEW/NIECE2B) 03 = SON OR DAUGHTER 10 = BROTHER/SISTER-IN-LAW
YES ADD TO NO 04 = SON-IN-LAW OR NO 11 = OTHER RELATIVETABLE DAUGHTER-IN-LAW 12 = ADOPTED/FOSTER/
05 = GRANDCHILD STEPCHILD06 = PARENT 13 = NOT RELATED07 = PARENT-IN-LAW 98 = DON'T KNOW
IF AGE 12OR OLDER
RESIDENCE
5 6
YEAR OF BIRTH MARITALSTATUS
10
Does (NAME) usually live here?
Did (NAME) stay here last night?
9B
How old was (NAME) when he/she got married for the first time?
HOUSEHOLD SCHEDULE
DEMOGRAPHIC CHARACTERISTICS
SEXUSUAL RESIDENTS ELIGIBILITYAGE
ELIGIBILITY
AGE
IF AGE 12 & EVER
MARRIED
1211
IN YEARS Y Y Y Y IN YEARS
2 8 93 4 7
How old is (NAME) in completed years?
What is (NAME)'s current marital status?
Is (NAME) male or female?
Please give me the names of the persons who usually live in your household and guests of the household who stayed here last night, starting with the head of the household.
What is the relationship of (NAME) to the head of the household?
What is (NAME's) year of birth?
Just to make sure that I have a complete listing: are there any other people such as small children or infants that we have not listed?Are there any other people who may not be members of your family, such as domestic servants, lodgers, or friends who usually live here?
HH-4

323
LINENO.
CHILDREN
RECORD RECORD 1= WORKING (INCLUDINGMOTHER'S FATHER'S HOUSE WIVES HAVINGLINE LINE ACTIVITY)NUMBER. NUMBER. 2 = NOT WORKING BUT
LOOKING FOR WORK3 = HOUSEWIFE NOT WORKING4 = STUDENT
IF NO, IF NO, 5 = RETIREDRECORD RECORD SEE CODES SEE CODES 6 = DISABLED'00'. '00'. BELOW. BELOW. 7 = OTHER NOT WORKING
Y N DK Y N DK Y N DK LEVEL Y N LEVEL
01 1 2 8 1 2 8 1 2 8 1 2 8
GO TO 15 GO TO 17 GO TO 21 GO TO 21
1 2 8 1 2 8 1 2 8 1 2 802
GO TO 15 GO TO 17 GO TO 21 GO TO 21
1 2 8 1 2 8 1 2 8 1 2 803
GO TO 15 GO TO 17 GO TO 21 GO TO 21
1 2 8 1 2 8 1 2 8 1 2 804
GO TO 15 GO TO 17 GO TO 21 GO TO 21
1 2 8 1 2 8 1 2 8 1 2 805
GO TO 15 GO TO 17 GO TO 21 GO TO 21
1 2 8 1 2 8 1 2 8 1 2 806
GO TO 15 GO TO 17 GO TO 21 GO TO 21
1 2 8 1 2 8 1 2 8 1 2 807
GO TO 15 GO TO 17 GO TO 21 GO TO 21
1 2 8 1 2 8 1 2 8 1 2 808
GO TO 15 GO TO 17 GO TO 21 GO TO 21
1 2 8 1 2 8 1 2 8 1 2 809
GO TO 15 GO TO 17 GO TO 21 GO TO 21
1 2 8 1 2 8 1 2 8 1 2 810
GO TO 15 GO TO 17 GO TO 21 GO TO 21
CODES FOR Qs. 18 AND 20: EDUCATION
LEVEL GRADE10 = BROTHER/SISTER-IN-LAW 0 = PRESCHOOL 00 = LESS THAN 1 YEAR COMPLETED
1 = PRIMARY (USE '00' FOR Q. 18 ONLY.2 = SECONDARY THIS CODE IS NOT ALLOWED3 = HIGHER FOR Q. 20.)8 = DON'T KNOW 98 = DON'T KNOW9 = KORANIC (if Koranic skip grade)
What has (NAME) mostly been doing in the last 12 months?
EDUCATION CHARACTERISTICS
SCHOOL ATTENDANCE
21
Has (NAME) ever attended school?
During [this/that] school year, what level and grade [is/was] (NAME) attending?
Did (NAME) attend school at any time during the [2017-2018] school year?
What is the highest level of school (NAME) has attended?
What is the highest grade (NAME) completed at that level?
Does (NAME)'s natural mother usually live in this household ?
IF YES: What is her name?
Is (NAME)'s biological mother alive?
Does (NAME)'s biological father usually live in this household?
IF YES: What is his name?
Is (NAME)'s biological father alive?
LABOUR
IF AGE 0-17 YEARS IF AGE 6 YEARS OR OLDER IF AGE 6-24 YEARS
CURRENT/RECENTSCHOOL
EVER ATTENDED
ORPHANHOOD
HOUSEHOLD SCHEDULE
BIOLOGICAL PARENTS
LABOUR FORCE
IF AGE 10 YEARS OR OLDER
FORCE
20
SURVIVORSHIP AND RESIDENCE OF
18 1916151413 17
PARTICIPATION
GRADEGRADE
HH-5

The Somali Health and Demographic Survey324
LINENO.
A= SIGHT? A= MEDICAL B= HEARING? CAREC= SPEECH B= WELFARED= LEARNING C= FINANCIALE= MOBILITY D= NUTRITIONAL
1 = HAS F= SELF-CARE? Y= NO SUPPORTCERTIFICATE G= MENTAL?
2 = REGISTERED H= NONE IF 953 = NEITHER OR MORE,8 = DON'T SEE CODES SEE CODES RECORD
KNOW BELOW. BELOW. '95'.
Y N DK CODE Y NDK Y N DK Y N DK Y N DK CODE CODE IN YEARS CODE
01 1 2 8 A B C D E F G 1 2 8 1 2 8 1 2 8 1 2 8 A B C D E F G H A B C D YH I J K L M N
GO TO 27 O P Q R S T Y GO TO 101
1 2 8 A B C D E F G 1 2 8 1 2 8 1 2 8 1 2 8 A B C D E F G H A B C D Y02 H I J K L M N
GO TO 27 O P Q R S T Y GO TO 101
1 2 8 A B C D E F G 1 2 8 1 2 8 1 2 8 1 2 8 A B C D E F G H A B C D Y03 H I J K L M N
GO TO 27 O P Q R S T Y GO TO 101
1 2 8 A B C D E F G 1 2 8 1 2 8 1 2 8 1 2 8 A B C D E F G H A B C D Y04 H I J K L M N
GO TO 27 O P Q R S T Y GO TO 101
1 2 8 A B C D E F G 1 2 8 1 2 8 1 2 8 1 2 8 A B C D E F G H A B C D Y05 H I J K L M N
GO TO 27 O P Q R S T Y GO TO 101
1 2 8 A B C D E F G 1 2 8 1 2 8 1 2 8 1 2 8 A B C D E F G H A B C D Y06 H I J K L M N
GO TO 27 O P Q R S T Y GO TO 101
1 2 8 A B C D E F G 1 2 8 1 2 8 1 2 8 1 2 8 A B C D E F G H A B C D Y07 H I J K L M N
GO TO 27 O P Q R S T Y GO TO 101
1 2 8 A B C D E F G 1 2 8 1 2 8 1 2 8 1 2 8 A B C D E F G H A B C D Y08 H I J K L M N
GO TO 27 O P Q R S T Y GO TO 101
1 2 8 A B C D E F G 1 2 8 1 2 8 1 2 8 1 2 8 A B C D E F G H A B C D Y09 H I J K L M N
GO TO 27 O P Q R S T Y GO TO 101
1 2 8 A B C D E F G 1 2 8 1 2 8 1 2 8 1 2 8 A B C D E F G H A B C D Y10 H I J K L M N
GO TO 27 O P Q R S T Y GO TO 101
CODES FOR Q. 24: CHRONIC DISEASES CODES FOR Q. 30: CAUSE OF DIABILITY
A=BLOOD PRESSURE G=KIDNEY DISEASE N=PROSTATIC R=SKIN DISEASE 01=CONGENITAL 08=WITCHCRAFTB=DIABETES H=LIVER DISEASE HYPERTROPHY S= CANCEROUS TUMORS 02=CONTAGIOUS 96=OTHERC=INFLAMMATION/ULCERSI=ARTHRITIS O=CATARACT T=ASTHMA 03=CHILD BIRTH CONDITIONS(SPECIFY)D=ANEMIA J=TUBERCULOSIS (TB) P= CHRONIC BACK PAIN/ Y= OTHER 04=OTHER DISEASEE=SICKLE CELL ANEMIAK=CHRONIC HEADACHE SPINAL PROBLEM (SPECIFY) 05=ABUSE 98=DON'T KNOW/THALASSEMIA L=STROKE Q=MENTAL/PSYCHOLOGICAL ILLNESS 06=AGINGF=HEART DISEASE M=EPILEPSY 07=INJURY/ACCIDENT
Does (NAME) have a birth certificate?
IF NO, PROBE:Has (NAME)'s birth ever been registered with the civil authority?
HOUSEHOLD SCHEDULE
29 30 31 32
Does (NAME) face any of the following limitations?
What is the main reason for (NAME's) disability?
How old was (NAME) when this condition started?
During the last 12 months did (NAME) get any of the following forms of support?
DISABILITY
Does (NAME) currently chew qat/khat?
IF AGE 10 YEARS OR OLDER
Has any physician informed (NAME) that (s)he suffersfrom this disease?
Does (NAME) get treatment regularly for this condition?
27
Does (NAME) smoke cigarettes, or any kind of tobacco?
25
SOCIAL HABITS
28
I would now like to ask you some questions about thehealth of all family members. Does (NAME) suffer fromany chronic disease?
24
What are the diseases suffered by (NAME)?
26
CHRONIC DISEASES
23
REGISTRATION OF BIRTHS
IF AGE 0-4 YEARS
BIRTH REGISTRATION
22
HH-6

325
LINE RELATIONSHIPNO. TO HEAD OF AT FIRST
HOUSEHOLD MARRIAGE
1
CIRCLE CIRCLE CIRCLELINE LINE LINENUMBER NUMBER NUMBEROF ALL OF ALL OF ALLEVER NEVER CHILDRENMARRIED MARRIED AGE 0-5WOMEN WOMENAGE AGE12-49 15-49
AFTER LISTING THE 1 = MARRIED RECORDNAMES AND RECORDING 2 = DIVORCED AGE IN THE RELATIONSHIP 3 = ABANDO- YEARSAND SEX FOR EACH NEDPERSON, ASK 4 = WIDOWED IF 95QUESTIONS 2A-2B 5 = NEVER- OR MORE,TO BE SURE THAT THE MARRIED RECORDLISTING IS COMPLETE. '95'.
IF 95THEN ASK APPROPRIATE OR MORE,QUESTIONS IN COLUMNS SEE CODES RECORD5-32 FOR EACH PERSON. BELOW. '95'.
IF AGE 12OR OLDER
RESIDENCE
5 6
YEAR OF BIRTH MARITALSTATUS
10
Does (NAME) usually live here?
Did (NAME) stay here last night?
9B
How old was (NAME) when he/she got married for the first time?
HOUSEHOLD SCHEDULE
DEMOGRAPHIC CHARACTERISTICS
SEXUSUAL RESIDENTS ELIGIBILITYAGE
ELIGIBILITY
AGE
IF AGE 12 & EVER
MARRIED
12112 8 93 4 7
How old is (NAME) in completed years?
What is (NAME)'s current marital status?
Is (NAME) male or female?
Please give me the names of the persons who usually live in your household and guests of the household who stayed here last night, starting with the head of the household.
What is the relationship of (NAME) to the head of the household?
What is (NAME's) year of birth?
M F Y N Y N
11 1 2 1 2 1 2 11 11 11
1 2 1 2 1 212 12 12 12
1 2 1 2 1 213 13 13 13
1 2 1 2 1 214 14 14 14
1 2 1 2 1 215 15 15 15
1 2 1 2 1 216 16 16 16
1 2 1 2 1 217 17 17 17
1 2 1 2 1 218 18 18 18
1 2 1 2 1 219 19 19 19
1 2 1 2 1 220 20 20 20
TICK HERE IF CONTINUATION SHEET USED
CODES FOR Q. 3: RELATIONSHIP TO HEAD OF HOUSEHOLD01 = HEAD OF HOUSEHOLD 08 = BROTHER OR SISTER02 = SPOUSE 09 = NEPHEW/NIECE03 = SON OR DAUGHTER 10 = BROTHER/SISTER-IN-LAW04 = SON-IN-LAW OR 11 = OTHER RELATIVEDAUGHTER-IN-LAW 12 = ADOPTED/FOSTER/
05 = GRANDCHILD STEPCHILD06 = PARENT 13 = NOT RELATED07 = PARENT-IN-LAW 98 = DON'T KNOW
IN YEARS Y Y Y Y IN YEARS
HH-7

The Somali Health and Demographic Survey326
LINENO.
CHILDREN
RECORD RECORD 1= WORKING (INCLUDINGMOTHER'S FATHER'S HOUSE WIVES HAVINGLINE LINE ACTIVITY)NUMBER. NUMBER. 2 = NOT WORKING BUT
LOOKING FOR WORK3 = HOUSEWIFE NOT WORKING4 = STUDENT
IF NO, IF NO, 5 = RETIREDRECORD RECORD SEE CODES SEE CODES 6 = DISABLED'00'. '00'. BELOW. BELOW. 7 = OTHER NOT WORKING
What has (NAME) mostly been doing in the last 12 months?
EDUCATION CHARACTERISTICS
SCHOOL ATTENDANCE
21
Has (NAME) ever attended school?
During [this/that] school year, what level and grade [is/was] (NAME) attending?
Did (NAME) attend school at any time during the [2017-2018] school year?
What is the highest level of school (NAME) has attended?
What is the highest grade (NAME) completed at that level?
Does (NAME)'s natural mother usually live in this household ?
IF YES: What is her name?
Is (NAME)'s biological mother alive?
Does (NAME)'s biological father usually live in this household?
IF YES: What is his name?
Is (NAME)'s biological father alive?
LABOUR
IF AGE 0-17 YEARS IF AGE 6 YEARS OR OLDER IF AGE 6-24 YEARS
CURRENT/RECENTSCHOOL
EVER ATTENDED
ORPHANHOOD
HOUSEHOLD SCHEDULE
BIOLOGICAL PARENTS
LABOUR FORCE
IF AGE 10 YEARS OR OLDER
FORCE
20
SURVIVORSHIP AND RESIDENCE OF
18 1916151413 17
PARTICIPATION
Y N DK Y N DK Y N LEVEL Y N LEVEL
11 1 2 8 1 2 8 1 2 8 1 2 8
GO TO 15 GO TO 17 GO TO 21 GO TO 21
1 2 8 1 2 8 1 2 8 1 2 812
GO TO 15 GO TO 17 GO TO 21 GO TO 21
1 2 8 1 2 8 1 2 8 1 2 813
GO TO 15 GO TO 17 GO TO 21 GO TO 21
1 2 8 1 2 8 1 2 8 1 2 814
GO TO 15 GO TO 17 GO TO 21 GO TO 21
1 2 8 1 2 8 1 2 8 1 2 815
GO TO 15 GO TO 17 GO TO 21 GO TO 21
1 2 8 1 2 8 1 2 8 1 2 816
GO TO 15 GO TO 17 GO TO 21 GO TO 21
1 2 8 1 2 8 1 2 8 1 2 817
GO TO 15 GO TO 17 GO TO 21 GO TO 21
1 2 8 1 2 8 1 2 8 1 2 818
GO TO 15 GO TO 17 GO TO 21 GO TO 21
1 2 8 1 2 8 1 2 8 1 2 819
GO TO 15 GO TO 17 GO TO 21 GO TO 21
1 2 8 1 2 8 1 2 8 1 2 820
GO TO 15 GO TO 17 GO TO 21 GO TO 21
CODES FOR Qs. 18 AND 20: EDUCATION
LEVEL GRADE0 = PRESCHOOL 00 = LESS THAN 1 YEAR COMPLETED1 = PRIMARY (USE '00' FOR Q. 18 ONLY.2 = SECONDARY THIS CODE IS NOT ALLOWED3 = HIGHER FOR Q. 20.)8 = DON'T KNOW 98 = DON'T KNOW
GRADE GRADE
HH-8
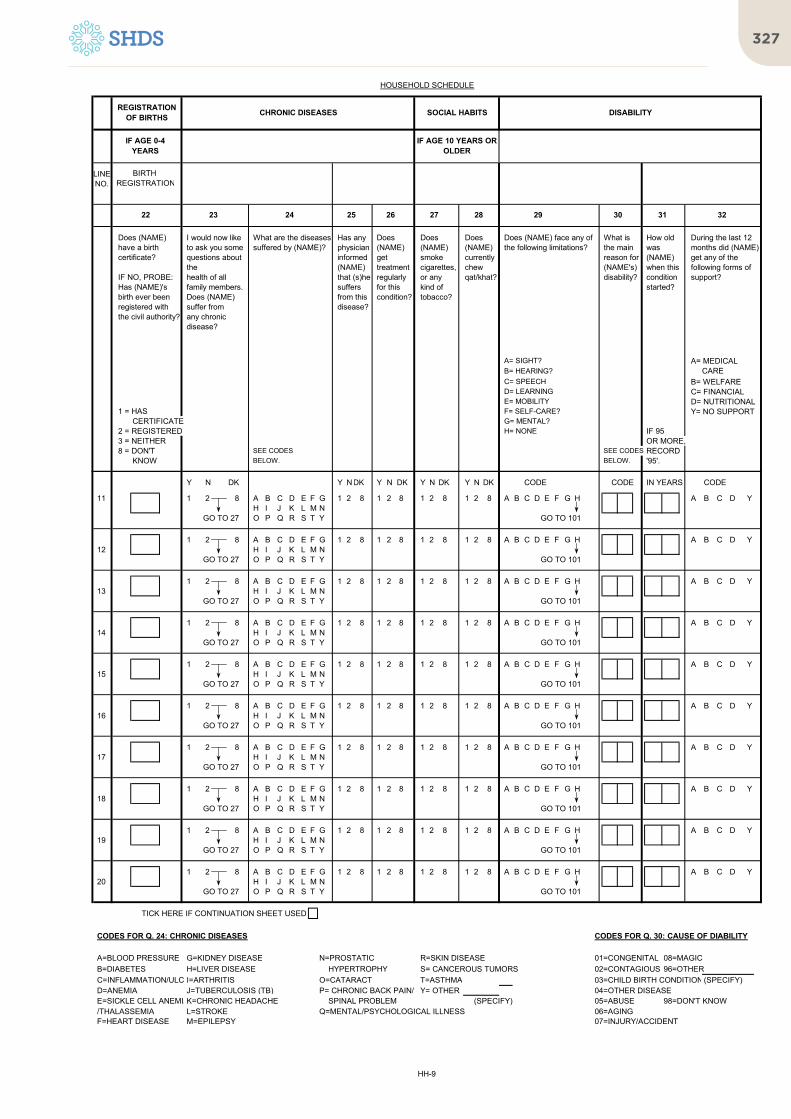
327
LINENO.
A= SIGHT? A= MEDICAL B= HEARING? CAREC= SPEECH B= WELFARED= LEARNING C= FINANCIALE= MOBILITY D= NUTRITIONAL
1 = HAS F= SELF-CARE? Y= NO SUPPORTCERTIFICATE G= MENTAL?
2 = REGISTERED H= NONE IF 953 = NEITHER OR MORE,8 = DON'T SEE CODES SEE CODES RECORD
KNOW BELOW. BELOW. '95'.
Does (NAME) have a birth certificate?
IF NO, PROBE:Has (NAME)'s birth ever been registered with the civil authority?
HOUSEHOLD SCHEDULE
29 30 31 32
Does (NAME) face any of the following limitations?
What is the main reason for (NAME's) disability?
How old was (NAME) when this condition started?
During the last 12 months did (NAME) get any of the following forms of support?
DISABILITY
Does (NAME) currently chew qat/khat?
IF AGE 10 YEARS OR OLDER
Has any physician informed (NAME) that (s)he suffersfrom this disease?
Does (NAME) get treatment regularly for this condition?
27
Does (NAME) smoke cigarettes, or any kind of tobacco?
25
SOCIAL HABITS
28
I would now like to ask you some questions about thehealth of all family members. Does (NAME) suffer fromany chronic disease?
24
What are the diseases suffered by (NAME)?
26
CHRONIC DISEASES
23
REGISTRATION OF BIRTHS
IF AGE 0-4 YEARS
BIRTH REGISTRATION
22
Y N DK Y NDK Y N DK Y N DK Y N DK CODE CODE IN YEARS CODE
11 1 2 8 A B C D E F G 1 2 8 1 2 8 1 2 8 1 2 8 A B C D E F G H A B C D YH I J K L M N
GO TO 27 O P Q R S T Y GO TO 101
1 2 8 A B C D E F G 1 2 8 1 2 8 1 2 8 1 2 8 A B C D E F G H A B C D Y12 H I J K L M N
GO TO 27 O P Q R S T Y GO TO 101
1 2 8 A B C D E F G 1 2 8 1 2 8 1 2 8 1 2 8 A B C D E F G H A B C D Y13 H I J K L M N
GO TO 27 O P Q R S T Y GO TO 101
1 2 8 A B C D E F G 1 2 8 1 2 8 1 2 8 1 2 8 A B C D E F G H A B C D Y14 H I J K L M N
GO TO 27 O P Q R S T Y GO TO 101
1 2 8 A B C D E F G 1 2 8 1 2 8 1 2 8 1 2 8 A B C D E F G H A B C D Y15 H I J K L M N
GO TO 27 O P Q R S T Y GO TO 101
1 2 8 A B C D E F G 1 2 8 1 2 8 1 2 8 1 2 8 A B C D E F G H A B C D Y16 H I J K L M N
GO TO 27 O P Q R S T Y GO TO 101
1 2 8 A B C D E F G 1 2 8 1 2 8 1 2 8 1 2 8 A B C D E F G H A B C D Y17 H I J K L M N
GO TO 27 O P Q R S T Y GO TO 101
1 2 8 A B C D E F G 1 2 8 1 2 8 1 2 8 1 2 8 A B C D E F G H A B C D Y18 H I J K L M N
GO TO 27 O P Q R S T Y GO TO 101
1 2 8 A B C D E F G 1 2 8 1 2 8 1 2 8 1 2 8 A B C D E F G H A B C D Y19 H I J K L M N
GO TO 27 O P Q R S T Y GO TO 101
1 2 8 A B C D E F G 1 2 8 1 2 8 1 2 8 1 2 8 A B C D E F G H A B C D Y20 H I J K L M N
GO TO 27 O P Q R S T Y GO TO 101
TICK HERE IF CONTINUATION SHEET USED
CODES FOR Q. 24: CHRONIC DISEASES CODES FOR Q. 30: CAUSE OF DIABILITY
A=BLOOD PRESSURE G=KIDNEY DISEASE N=PROSTATIC R=SKIN DISEASE 01=CONGENITAL 08=MAGICB=DIABETES H=LIVER DISEASE HYPERTROPHY S= CANCEROUS TUMORS 02=CONTAGIOUS 96=OTHERC=INFLAMMATION/ULCERSI=ARTHRITIS O=CATARACT T=ASTHMA 03=CHILD BIRTH CONDITIONS(SPECIFY)D=ANEMIA J=TUBERCULOSIS (TB) P= CHRONIC BACK PAIN/ Y= OTHER 04=OTHER DISEASEE=SICKLE CELL ANEMIAK=CHRONIC HEADACHE SPINAL PROBLEM (SPECIFY) 05=ABUSE 98=DON'T KNOW/THALASSEMIA L=STROKE Q=MENTAL/PSYCHOLOGICAL ILLNESS 06=AGINGF=HEART DISEASE M=EPILEPSY 07=INJURY/ACCIDENT
HH-9

The Somali Health and Demographic Survey328
NO.
101 YES . . . . . . . . . . . . . . . . . . . . . . . . . . . . . . . . . . . 1NO . . . . . . . . . . . . . . . . . . . . . . . . . . . . . . . . . . . 2 107
102 YES . . . . . . . . . . . . . . . . . . . . . . . . . . . . . . . . . . . 1NO . . . . . . . . . . . . . . . . . . . . . . . . . . . . . . . . . . . 2 107DON’T KNOW . . . . . . . . . . . . . . . . . . . . . . . . . . . 8 107
103 PUBLIC SECTORGOVERNMENT HOSPITAL. . . . . . . . . . . . . . . . AREFERRAL HEALTH CENTRE. . . . . . . . . . . . . BMCH/HC . . . . . . . . . . . . . . . . . . . . . . . . . . . . . CPRIMARY HEALTH UNIT (PHU). . . . . . . . . . . . . DMOBILE CLINIC . . . . . . . . . . . . . . . . . . . . . . . . EOTHER PUBLIC SECTOR
F
PRIVATE MEDICAL SECTORPRIVATE HOSPITAL/CLINIC/
PRIVATE DOCTOR . . . . . . . . . . . . . . . . GPHARMACY . . . . . . . . . . . . . . . . . . . . . . . . HOTHER PRIVATE MEDICAL SECTOR
I
OTHER SOURCESHOP . . . . . . . . . . . . . . . . . . . . . . . . . . . . . J
OTHER X
104
Y N DK
a) a) GENERAL PRACTITIONERS . . 1 2 8
b) b) SPECIALISTS. . . . . . . . . . . . . . . . 1 2 8
c) c) TRAD. MEDICINE MEN . . . . . . . 1 2 8
d) d) OTHER HLTH PRACT . . . . . . . 1 2 8
e) e) LAB . . . . . . . . . . . . . . . . . . . . . . 1 2 8
f) f) PRESCRIBED DRUGS . . . . . . . 1 2 8
g) g) OVER THE COUNTER DRUGS. . 1 2 8
h) h) IMAGING . . . . . . . . . . . . . . . . . . 1 2 8
i) i) DIALYSIS . . . . . . . . . . . . . . . . . . 1 2 8
j) j) CHEMOTHERAPY. . . . . . . . . . . . . 1 2 8
k) k) SURGERY. . . . . . . . . . . . . . . . . . 1 2 8
l) l) ACCOM + MEALS. . . . . . . . . . . . . 1 2 8
m) m) TRANSPORT . . . . . . . . . . . . . . . . 1 2 8
n) n) FAMILY PLANNING . . . . . . . . . . 1 2 8
o) o) ANC . . . . . . . . . . . . . . . . . . . . . . 1 2 8
p) p) DELIVERY. . . . . . . . . . . . . . . . . . 1 2 8
q) q) OTHER _________________ 1 2 8(SPECIFY)
Laboratory Tests
Others
Prescribed drugs
Room facilities/Meals
Birth spacing ?
Imaging (X-Rays, CT Scan ,MRI, Echography)
Chemotherapy
Delivery (child birth)?
Dialysis
Surgery
Over the counter drugs
OUT OF POCKET HOUSEHOLD HEALTH EXPENDITURE
QUESTIONS AND FILTERS CODING CATEGORIES SKIP
Has any member of the household been sick in the last one month?
Did you seek any advice or treatment for his/her condition?
Where did you seek advice or treatment for his or her condition?
PROBE TO IDENTIFY THE TYPE OF SOURCE.
IF UNABLE TO DETERMINE IF PUBLIC OR PRIVATE SECTOR, WRITE THE NAME OF THE PLACE.
(SPECIFY)
(SPECIFY)
(SPECIFY)
Transport to the facility
Antenatal care (ANC)?
Did he/she receive any of the following services? If YES, how much did the household incur on the health services received in the last one month?
RECORD AMOUNT IN USD.
AMOUNT (USD)
Consultation fees paid to General Medical Practitioners
Consultation fees paid to Specialists
Consultation fees paid to traditional medicine practitioners
Consultation fees paid to other health practitioners
HH-10
NO.
OUT OF POCKET HOUSEHOLD HEALTH EXPENDITURE
QUESTIONS AND FILTERS CODING CATEGORIES SKIP
105AMOUNT (USD) . .
106
YES NO
a) a) INCOME . . . . . . . . . . . . . . . . 1 2b) b) INSURANCE . . . . . . . . . . . . . 1 2c) c) SAVINGS . . 1 2d) d) BORROWING . . . . . . . . . . . . . 1 2e) e) RELATIVES/FRIENDS . . . . . . . 1 2f) f) SOLD ASSETS . . . . . . . . . . 1 2g) f) OTHER ___________________ 1 2
(SPECIFY)
107 YES . . . . . . . . . . . . . . . . . . . . . . . . . . . . . . . . . . . 1NO . . . . . . . . . . . . . . . . . . . . . . . . . . . . . . . . . . . 2
In total, how much money did the household spend on treatment and healthcare services during the last one month?
Current income
In the past one month, which of the following financial sources did your household use to pay for anyhealth expenditure? (READ OUT AND CIRCLE 1 OR 2 AS APPROPRIATE)
Does any household member have a health insurance policy?
Health insuranceSavings (including in bank)Borrow from banks/other institutions/relativesSupport from relatives & friends
Other meansSold assets
HH-11
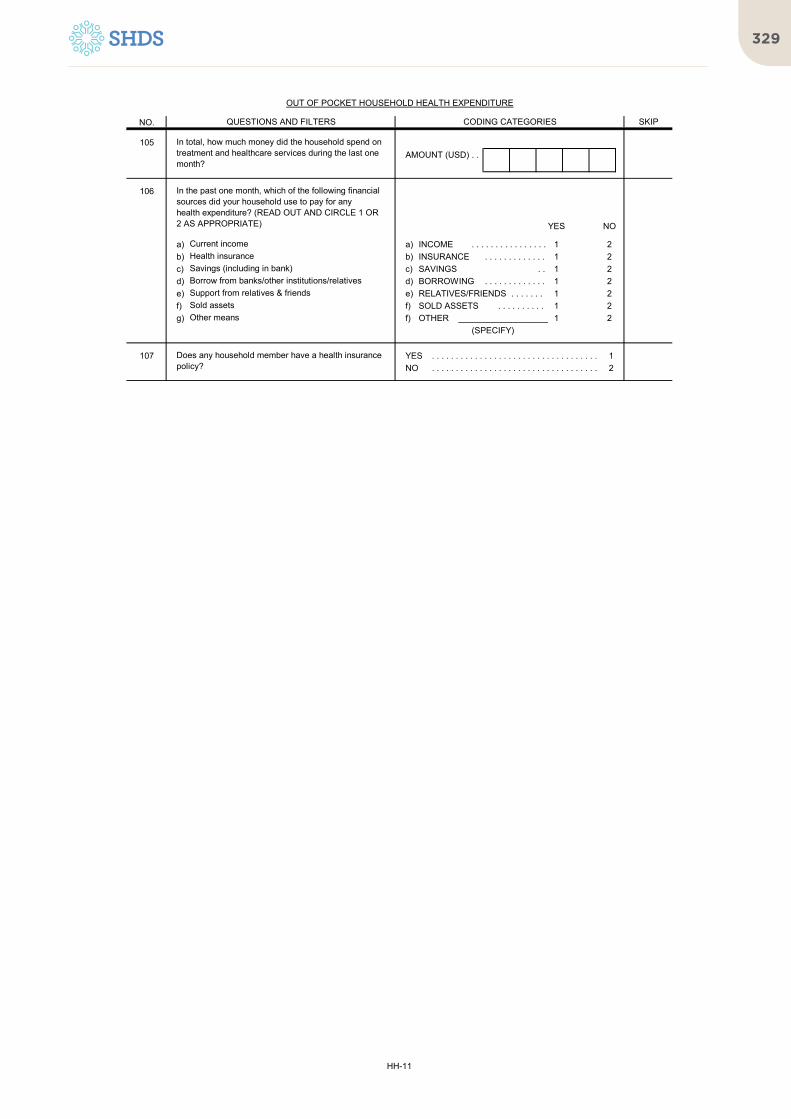
329
NO.
OUT OF POCKET HOUSEHOLD HEALTH EXPENDITURE
QUESTIONS AND FILTERS CODING CATEGORIES SKIP
105AMOUNT (USD) . .
106
YES NO
a) a) INCOME . . . . . . . . . . . . . . . . 1 2b) b) INSURANCE . . . . . . . . . . . . . 1 2c) c) SAVINGS . . 1 2d) d) BORROWING . . . . . . . . . . . . . 1 2e) e) RELATIVES/FRIENDS . . . . . . . 1 2f) f) SOLD ASSETS . . . . . . . . . . 1 2g) f) OTHER ___________________ 1 2
(SPECIFY)
107 YES . . . . . . . . . . . . . . . . . . . . . . . . . . . . . . . . . . . 1NO . . . . . . . . . . . . . . . . . . . . . . . . . . . . . . . . . . . 2
In total, how much money did the household spend on treatment and healthcare services during the last one month?
Current income
In the past one month, which of the following financial sources did your household use to pay for anyhealth expenditure? (READ OUT AND CIRCLE 1 OR 2 AS APPROPRIATE)
Does any household member have a health insurance policy?
Health insuranceSavings (including in bank)Borrow from banks/other institutions/relativesSupport from relatives & friends
Other meansSold assets
HH-11

The Somali Health and Demographic Survey330
NO.
201 PIPED WATERPIPED INTO DWELLING . . . . . . . . . . . . . . . . 11PIPED TO YARD/PLOT . . . . . . . . . . . . . . . . . . . 12 206PIPED TO NEIGHBOR . . . . . . . . . . . . . . . . . . . 13PUBLIC TAP/STANDPIPE . . . . . . . . . . . . . . . . 14
TUBE WELL OR BOREHOLE . . . . . . . . . . . . . . . . 21DUG WELL
PROTECTED WELL. . . . . . . . . . . . . . . . . . . . . . 31UNPROTECTED WELL . . . . . . . . . . . . . . . . . . . 32
WATER FROM SPRINGPROTECTED SPRING . . . . . . . . . . . . . . . . . . . 41UNPROTECTED SPRING . . . . . . . . . . . . . . . . 42
RAINWATER . . . . . . . . . . . . . . . . . . . . . . . . . . . 51TANKER TRUCK . . . . . . . . . . . . . . . . . . . . . . . . 61CART WITH SMALL TANK . . . . . . . . . . . . . . . . . . . 71WATER KIOSK . . . . . . . . . . . . . . . . . . . . . . . . . . . 72SURFACE WATER (RIVER/DAM/LAKE/BERKAD
/POND/STREAM/CANAL/MUQSIID/IRRIGATION CHANNEL) . . . . . . . . . . . . . . . . 81
BOTTLED WATER . . . . . . . . . . . . . . . . . . . . . . . . 91
OTHER 96
202 PIPED WATERPIPED INTO DWELLING . . . . . . . . . . . . . . . . 11PIPED TO YARD/PLOT . . . . . . . . . . . . . . . . . . . 12 206PIPED TO NEIGHBOR . . . . . . . . . . . . . . . . . . . 13PUBLIC TAP/STANDPIPE . . . . . . . . . . . . . . . . 14
TUBE WELL OR BOREHOLE . . . . . . . . . . . . . . . . 21DUG WELL
PROTECTED WELL. . . . . . . . . . . . . . . . . . . . . . 31UNPROTECTED WELL . . . . . . . . . . . . . . . . . . . 32
WATER FROM SPRINGPROTECTED SPRING . . . . . . . . . . . . . . . . . . . 41UNPROTECTED SPRING . . . . . . . . . . . . . . . . 42
RAINWATER . . . . . . . . . . . . . . . . . . . . . . . . . . . 51TANKER TRUCK . . . . . . . . . . . . . . . . . . . . . . . . 61CART WITH SMALL TANK . . . . . . . . . . . . . . . . . . . 71SURFACE WATER (RIVER/DAM/LAKE/BERKAD
LAKE/POND/STREAM/CANAL/MUQSIID/IRRIGATION CHANNEL) . . . . . . . . . . . . . . . . 81
OTHER 96
203a IN OWN DWELLING . . . . . . . . . . . . . . . . . . . . . . 1IN OWN YARD/PLOT . . . . . . . . . . . . . . . . . . . . . . 2ELSEWHERE . . . . . . . . . . . . . . . . . . . . . . . . . . . 3
203bMINUTES . . . . . . . . . . . . . . . . . . .
DON'T KNOW . . . . . . . . . . . . . . . . . . . . . . . . . . . 998
204a IN OWN DWELLING . . . . . . . . . . . . . . . . . . . . . . 1IN OWN YARD/PLOT . . . . . . . . . . . . . . . . . . . . . . 2ELSEWHERE . . . . . . . . . . . . . . . . . . . . . . . . . . . 3
204bMINUTES . . . . . . . . . . . . . . . . . . .
DON'T KNOW . . . . . . . . . . . . . . . . . . . . . . . . . . . 998
(SPECIFY)
How long does it take to go there, get water, and come back in minutes?
SKIP
Where is the main source of water for drinking located? 204a
How long does it take to go there, get water, and come back in minutes?
What is the main source of drinking water for members of your household?
(SPECIFY)
Where is the main source of water for other purposes located? 205
HOUSEHOLD CHARACTERISTICS
CODING CATEGORIESQUESTIONS AND FILTERS
What is the main source of water used by your household for other purposes such as cooking and handwashing?
HH-12

331
NO. SKIP
HOUSEHOLD CHARACTERISTICS
CODING CATEGORIESQUESTIONS AND FILTERS
204cWATER TANKER . . . . . . . . . . . . . . . . 1CAR/PICKUP/TRUCK . . . . . . . . . . . . . . . . . . . 2CAMEL CART . . . . . . . . . . . . . . . . . . . 3DONKEY CART . . . . . . . . . . . . . . . . 4WHEELBARROW 5ON FOOT . . . . . . . . . . . . . . . . 6
OTHER 96
205
YES NO
206 YES . . . . . . . . . . . . . . . . . . . . . . . . . . . . . . . . . . . . 1NO . . . . . . . . . . . . . . . . . . . . . . . . . . . . . . . . . . . . 2DON'T KNOW . . . . . . . . . . . . . . . . . . . . . . . . . . . 8
207 YES . . . . . . . . . . . . . . . . . . . . . . . . . . . . . . . . . . . . 1NO . . . . . . . . . . . . . . . . . . . . . . . . . . . . . . . . . . . . 2DON'T KNOW . . . . . . . . . . . . . . . . . . . . . . . . . . . 8
208 BOIL . . . . . . . . . . . . . . . . . . . . . . . . . . . . . . . . . . . . AADD BLEACH/CHLORINE . . . . . . . . . . . . . . . . . . . BSTRAIN THROUGH A CLOTH . . . . . . . . . . . . . . . . CUSE WATER FILTER (CERAMIC/
SAND/COMPOSITE/ETC) . . . . . . . . . . . . . . . . DSOLAR DISINFECTION. . . . . . . . . . . . . . . . . . . . . . ELET IT STAND AND SETTLE . . . . . . . . . . . . . . . . F
OTHER X
DON'T KNOW . . . . . . . . . . . . . . . . . . . . . . . . . . . Z
209 FLUSH OR POUR FLUSH TOILETFLUSH TO PIPED SEWER SYSTEM . . . . . . . 11FLUSH TO SEPTIC TANK . . . . . . . . . . . . . . . . 12FLUSH TO PIT LATRINE . . . . . . . . . . . . . . . . 13FLUSH TO SOMEWHERE ELSE . . . . . . . . . . 14FLUSH, DON'T KNOW WHERE . . . . . . . . . . 15
PIT LATRINEVENTILATED IMPROVED PIT LATRINE . . . . . 21PIT LATRINE WITH SLAB . . . . . . . . . . . . . . . . 22PIT LATRINE WITHOUT SLAB/OPEN PIT. . . . . 23
COMPOSTING TOILET . . . . . . . . . . . . . . . . . . . . . . 31BUCKET TOILET . . . . . . . . . . . . . . . . . . . . . . . . 41HANGING TOILET/HANGING LATRINE . . . . . . . 51NO FACILITY/BUSH/FIELD . . . . . . . . . . . . . . . . 61 214
OTHER 96
210 YES . . . . . . . . . . . . . . . . . . . . . . . . . . . . . . . . . . . . 1NO . . . . . . . . . . . . . . . . . . . . . . . . . . . . . . . . . . . . 2 212
211 NO. OF HOUSEHOLDSIF LESS THAN 10 . . . . . . . . . . . . .
10 OR MORE HOUSEHOLDS . . . . . . . . . . . . . . . . 95DON'T KNOW . . . . . . . . . . . . . . . . . . . . . . . . . . . 98
212 IN OWN DWELLING . . . . . . . . . . . . . . . . . . . . . . AIN OWN YARD/PLOT . . . . . . . . . . . . . . . . . . . . . . BELSEWHERE . . . . . . . . . . . . . . . . . . . . . . . . . . . C
What kind of toilet facility do members of your household usually use?
Including your own household, how many households use this toilet facility?
(SPECIFY)
(SPECIFY)
(SPECIFY)
209
207
What do you usually do to make the water safer to drink?Anything else?
RECORD ALL MENTIONED.
CHECK 201 : CODE '14' OR '21' CIRCLED?
In the past two weeks, was the water from this source not available for at least one full day?
Do you do anything to the water to make it safer to drink?
What means does your household mostly use to fetch water i.e. from source to home?
IF NOT POSSIBLE TO DETERMINE, ASK PERMISSION TO OBSERVE THE FACILITY.
0
Do you share this toilet facility with other households?
Where is this toilet facility located?
HH-13

The Somali Health and Demographic Survey332
NO. SKIP
HOUSEHOLD CHARACTERISTICS
CODING CATEGORIESQUESTIONS AND FILTERS
213NO. OF TOILETS . . . . . . . . . . . . . . . .
214 ELECTRICITY . . . . . . . . . . . . . . . . . . . . . . . . . . . 01SOLAR . . . . . . . . . . . . . . . . . . . . . . . . . . . . . . . . . 02KEROSENE . . . . . . . . . . . . . . . . . . . . . . . . . . . . . . 03FIREWOOD . . . . . . . . . . . . . . . . . . . . . . . . . . . . . . 04TORCH . . . . . . . . . . . . . . . . . . . . . . . . . . . . . . . . . 05OTHER 96
215 ELECTRICITY . . . . . . . . . . . . . . . . . . . . . . . . . . . 01LPG . . . . . . . . . . . . . . . . . . . . . . . . . . . . . . . . . . . . 02KEROSENE . . . . . . . . . . . . . . . . . . . . . . . . . . . . . . 03FIREWOOD . . . . . . . . . . . . . . . . . . . . . . . . . . . . . . 04CHARCOAL . . . . . . . . . . . . . . . . . . . . . . . . . . . . . . 05STRAW/SHRUBS/GRASS . . . . . . . . . . . . . . . . . . . 06AGRICULTURAL CROP . . . . . . . . . . . . . . . . . . . 07ANIMAL DUNG . . . . . . . . . . . . . . . . . . . . . . . . . . . 08NO FOOD COOKED IN HOUSEHOLD. . . . . . . . . . 95 218
OTHER 96
216 IN THE HOUSE . . . . . . . . . . . . . . . . . . . . . . . . . . . 1IN A SEPARATE BUILDING . . . . . . . . . . . . . . . . 2OUTDOORS . . . . . . . . . . . . . . . . . . . . . . . . . . . . . . 3
OTHER 6
217 YES . . . . . . . . . . . . . . . . . . . . . . . . . . . . . . . . . . . . 1NO . . . . . . . . . . . . . . . . . . . . . . . . . . . . . . . . . . . . 2
218ROOMS . . . . . . . . . . . . . . . . . . . . . . . .
219 YES . . . . . . . . . . . . . . . . . . . . . . . . . . . . . . . . . . . . 1NO . . . . . . . . . . . . . . . . . . . . . . . . . . . . . . . . . . . . 2 221
220
a) a) CAMELS . . . . . . . . . . . . . . . .
b) b) CATTLE . . . . . . . . . . . . . . . .
c) c) SHOATS . . . . . . . . . . . . . . . .
d) d) DONKEYS . . . . . . . . . . . . .
e) e) HORSES . . . . . . . . . . . . . . . .
f) f) POULTRY. . . . . . . . . . . . . . . .
221 YES . . . . . . . . . . . . . . . . . . . . . . . . . . . . . . . . . . . . 1NO . . . . . . . . . . . . . . . . . . . . . . . . . . . . . . . . . . . . 2 223
222
DROUGHT FLOODS DISEASE
a) Camel? a) CAMELS . . . . . .
b) Cattle? b) CATTLE . . . . . .
c) Shoats? c) SHOATS . . . . . .
d) Donkeys d) DONKEYS . . . . .
e) Horses? e) HORSES . . . . . .
f) Poultry? f) POULTRY . . . . .
How many of the following animals did this household loose?IF NONE, RECORD '00'.IF 995 OR MORE, RECORD '995'.
TOTAL
In total, how many toilets does your household use?
(SPECIFY)
Whats the main source of energy for cooking?
IF NONE, RECORD '00'.IF 995 OR MORE, RECORD '995'.IF UNKNOWN, RECORD '998'.
DUE TO
Cattle?
Poultry?
Horses?
Donkeys
Shoats?
218
How many rooms in this household are used for sleeping?
(SPECIFY)
Camel?
Whats the main source of energy for lighting?
(SPECIFY)
Do you have a separate room which is used as a kitchen?
Is the cooking usually done in the house, in a separate building, or outdoors?
Does this household own any livestock including horses, donkeys and poultry?
How many of the following animals does this household own?
DUE TO DUE TO
Has this household lost any livestock in the last one year due to drought/flooding/disease etc?
HH-14

333
NO. SKIP
HOUSEHOLD CHARACTERISTICS
CODING CATEGORIESQUESTIONS AND FILTERS
213NO. OF TOILETS . . . . . . . . . . . . . . . .
214 ELECTRICITY . . . . . . . . . . . . . . . . . . . . . . . . . . . 01SOLAR . . . . . . . . . . . . . . . . . . . . . . . . . . . . . . . . . 02KEROSENE . . . . . . . . . . . . . . . . . . . . . . . . . . . . . . 03FIREWOOD . . . . . . . . . . . . . . . . . . . . . . . . . . . . . . 04TORCH . . . . . . . . . . . . . . . . . . . . . . . . . . . . . . . . . 05OTHER 96
215 ELECTRICITY . . . . . . . . . . . . . . . . . . . . . . . . . . . 01LPG . . . . . . . . . . . . . . . . . . . . . . . . . . . . . . . . . . . . 02KEROSENE . . . . . . . . . . . . . . . . . . . . . . . . . . . . . . 03FIREWOOD . . . . . . . . . . . . . . . . . . . . . . . . . . . . . . 04CHARCOAL . . . . . . . . . . . . . . . . . . . . . . . . . . . . . . 05STRAW/SHRUBS/GRASS . . . . . . . . . . . . . . . . . . . 06AGRICULTURAL CROP . . . . . . . . . . . . . . . . . . . 07ANIMAL DUNG . . . . . . . . . . . . . . . . . . . . . . . . . . . 08NO FOOD COOKED IN HOUSEHOLD. . . . . . . . . . 95 218
OTHER 96
216 IN THE HOUSE . . . . . . . . . . . . . . . . . . . . . . . . . . . 1IN A SEPARATE BUILDING . . . . . . . . . . . . . . . . 2OUTDOORS . . . . . . . . . . . . . . . . . . . . . . . . . . . . . . 3
OTHER 6
217 YES . . . . . . . . . . . . . . . . . . . . . . . . . . . . . . . . . . . . 1NO . . . . . . . . . . . . . . . . . . . . . . . . . . . . . . . . . . . . 2
218ROOMS . . . . . . . . . . . . . . . . . . . . . . . .
219 YES . . . . . . . . . . . . . . . . . . . . . . . . . . . . . . . . . . . . 1NO . . . . . . . . . . . . . . . . . . . . . . . . . . . . . . . . . . . . 2 221
220
a) a) CAMELS . . . . . . . . . . . . . . . .
b) b) CATTLE . . . . . . . . . . . . . . . .
c) c) SHOATS . . . . . . . . . . . . . . . .
d) d) DONKEYS . . . . . . . . . . . . .
e) e) HORSES . . . . . . . . . . . . . . . .
f) f) POULTRY. . . . . . . . . . . . . . . .
221 YES . . . . . . . . . . . . . . . . . . . . . . . . . . . . . . . . . . . . 1NO . . . . . . . . . . . . . . . . . . . . . . . . . . . . . . . . . . . . 2 223
222
DROUGHT FLOODS DISEASE
a) Camel? a) CAMELS . . . . . .
b) Cattle? b) CATTLE . . . . . .
c) Shoats? c) SHOATS . . . . . .
d) Donkeys d) DONKEYS . . . . .
e) Horses? e) HORSES . . . . . .
f) Poultry? f) POULTRY . . . . .
How many of the following animals did this household loose?IF NONE, RECORD '00'.IF 995 OR MORE, RECORD '995'.
TOTAL
In total, how many toilets does your household use?
(SPECIFY)
Whats the main source of energy for cooking?
IF NONE, RECORD '00'.IF 995 OR MORE, RECORD '995'.IF UNKNOWN, RECORD '998'.
DUE TO
Cattle?
Poultry?
Horses?
Donkeys
Shoats?
218
How many rooms in this household are used for sleeping?
(SPECIFY)
Camel?
Whats the main source of energy for lighting?
(SPECIFY)
Do you have a separate room which is used as a kitchen?
Is the cooking usually done in the house, in a separate building, or outdoors?
Does this household own any livestock including horses, donkeys and poultry?
How many of the following animals does this household own?
DUE TO DUE TO
Has this household lost any livestock in the last one year due to drought/flooding/disease etc?
HH-14
NO. SKIP
HOUSEHOLD CHARACTERISTICS
CODING CATEGORIESQUESTIONS AND FILTERS
223 YES . . . . . . . . . . . . . . . . . . . . . . . . . . . . . . . . . . . . 1NO . . . . . . . . . . . . . . . . . . . . . . . . . . . . . . . . . . . . 2 225
224 UNIT QUANTITY
HECTARES . . . . . . . .
QOODI . . . . . . . . . . .
JABAAL . . . . . . . . . . .
TALAABO. . . . . . . . . . .
OTHER (SPECIFY) .
95 OR MORE . . . . . . . . . . . . . . . . 950DON'T KNOW . . . . . . . . . . . . . . . . . . . . . . . . 998
225 YES NO
a) a) RADIO . . . . . . . . . . . . . . . . 1 2b) b) TELEVISION . . . . . . . . . . . . . 1 2c) c) NON-MOBILE TELEPHONE . . 1 2d) d) COMPUTER . . . . . . . . . . . . . 1 2e) e) INTERNET . . . . . . . . . . . . . . . . 1 2f) f) REFRIGERATOR . . . . . . . . . . 1 2g) g) AIR CONDITIONER/FAN. . . . . . . 1 2
226 YES NO
a) a) WATCH . . . . . . . . . . . . . . . . . . . 1 2b) b) MOBILE PHONE. . . . . . . . . . . . . 1 2c) c) BICYCLE . . . . . . . . . . . . . . . . . . . 1 2d) d) MOTORCYCLE/SCOOTER. . . . . 1 2e) e) DONKEY CART . . . . . . . . . . . . . 1 2f) f) CAR/TRUCK . . . . . . . . . . . . . . . . 1 2g) g) BOAT/CANOE . . . . . . . . . . . . . 1 2h) h) TRACTOR . . . . . . . . . . . . . . . . 1 2i) i) RICKSHAW . . . . . . . . . . . . . . . . 1 2j) j) ANIMAL PLOUGH . . . . . . . . . . 1 2
227 YES . . . . . . . . . . . . . . . . . . . . . . . . . . . . . . . . . . . . 1NO . . . . . . . . . . . . . . . . . . . . . . . . . . . . . . . . . . . . 2
Does any member of this household have a bank account?
Does your household have:
A mobile phone?
A car or truck?Donkey cart?
Air conditioner/fan?
Tractor?Rickshaw?Animal plough?
A radio?
Does any member of this household own any agricultural land?
Boat/Canoe?
A watch?
A refrigerator?
IF 95 OR MORE, CIRCLE '950'.
A motorcycle or motor scooter?A bicycle?
Does any member of this household own:
A computer?Internet connectivity?
Non-mobile telephone?A television?
How many hectares of agricultural land do members of this household own?
HH-15

The Somali Health and Demographic Survey334
NO.
228 OBSERVED, FIXED PLACE . . . . . . . . . . . . . . . 1OBSERVED, MOBILE . . . . . . . . . . . . . . . . . . . . . 2NOT OBSERVED,
NOT IN DWELLING/YARD/PLOT . . . . . . . . . . 3NOT OBSERVED, NO PERMISSION TO SEE. . . . 4 231NOT OBSERVED, OTHER REASON . . . . . . . . . . 5
229WATER IS AVAILABLE . . . . . . . . . . . . . . . . . . 1WATER IS NOT AVAILABLE . . . . . . . . . . . . . . . 2
230 SOAP OR DETERGENT(BAR, LIQUID, POWDER, PASTE) . . . . . . . A
ASH, MUD, SAND . . . . . . . . . . . . . . . . . . . . . . . . B
NONE . . . . . . . . . . . . . . . . . . . . . . . . . . . . . . . . Y
231 NATURAL FLOOREARTH/SAND . . . . . . . . . . . . . . . . . . . . . . . . 11DUNG . . . . . . . . . . . . . . . . . . . . . . . . . . . . . . . . 12GRASS . . . . . . . . . . . . . . . . . . . . . . . . . . . . . 13
RUDIMENTARY FLOORWOOD PLANKS . . . . . . . . . . . . . . . . . . . . . . . . 21PALM/BAMBOO . . . . . . . . . . . . . . . . . . . . . . . . 22
FINISHED FLOORPARQUET OR POLISHED WOOD . . . . . . . 31VINYL OR ASPHALT STRIPS . . . . . . . . . . . . . 32CERAMIC TILES . . . . . . . . . . . . . . . . . . . . . 33CEMENT . . . . . . . . . . . . . . . . . . . . . . . . . . . . . 34CARPET . . . . . . . . . . . . . . . . . . . . . . . . . . . . . 35
OTHER 96
232 NATURAL ROOFINGNO ROOF . . . . . . . . . . . . . . . . . . . . . . . . . . 11PALM LEAF/SOD . . . . . . . . . . . . . . . . . . 12
RUDIMENTARY ROOFINGPALM/BAMBOO . . . . . . . . . . . . . . . . . . . . . . . . 21CARDBOARD . . . . . . . . . . . . . . . . . . . . . . . . 22CANVAS SHEETS . . . . . . . . . . . . . . . . . . . . . 23PLASTIC SHEETS . . . . . . . . . . . . . . . . . . . . . 24CLOTH AND RAGS . . . . . . . . . . . . . . . . . . . . . 25
FINISHED ROOFINGIRON SHEETS . . . . . . . . . . . . . . . . . . . . . . . . 31WOOD . . . . . . . . . . . . . . . . . . . . . . . . . . . . . 32CERAMIC TILES . . . . . . . . . . . . . . . . . . . . . 33CEMENT . . . . . . . . . . . . . . . . . . . . . . . . . . . . . 34ROOFING SHINGLES . . . . . . . . . . . . . . . . . . 35
OTHER 96
OBSERVE PRESENCE OF SOAP, DETERGENT, OR OTHER CLEANSING AGENT AT THE PLACE FOR HANDWASHING.
RECORD OBSERVATION.
ADDITIONAL HOUSEHOLD CHARACTERISTICS
QUESTIONS AND FILTERS CODING CATEGORIES SKIP
We would like to learn about the places that households use to wash their hands. Can you please show me where members of your household most often wash their hands?
OBSERVE PRESENCE OF WATER AT THE PLACE FOR HANDWASHING.
RECORD OBSERVATION.
OBSERVE MAIN MATERIAL OF THE FLOOR OF THE DWELLING.
RECORD OBSERVATION.
OBSERVE MAIN MATERIAL OF THE ROOF OF THE DWELLING.
RECORD OBSERVATION.
(SPECIFY)
(SPECIFY)
HH-16

335
NO.
ADDITIONAL HOUSEHOLD CHARACTERISTICS
QUESTIONS AND FILTERS CODING CATEGORIES SKIP
233 NATURAL WALLSNO WALLS . . . . . . . . . . . . . . . . . . . . . . . . . . 11PALM LEAF/GRASS . . . . . . . . . . . . . . . . . . 12DIRT . . . . . . . . . . . . . . . . . . . . . . . . . . . . . . . . 13
RUDIMENTARY WALLSBAMBOO/STICKS/WOOD WITH MUD . . . . 21STONE WITH MUD . . . . . . . . . . . . . . . . . . . . . 22PLYWOOD . . . . . . . . . . . . . . . . . . . . . . . . . . 23IRON SHEETS . . . . . . . . . . . . . . . . . . . . . . . . 24CARDBOARD . . . . . . . . . . . . . . . . . . . . . . . . 25CANVAS SHEETS . . . . . . . . . . . . . . . . . . . . . 26PLASTIC SHEETS . . . . . . . . . . . . . . . . . . . . . 27CLOTH AND RAGS . . . . . . . . . . . . . . . . . . . . . 28
FINISHED WALLSCEMENT . . . . . . . . . . . . . . . . . . . . . . . . . . . . . 31STONE WITH LIME/CEMENT . . . . . . . . . . . . . 32BRICKS . . . . . . . . . . . . . . . . . . . . . . . . . . . . . 33CEMENT BLOCKS . . . . . . . . . . . . . . . . . . . . . 34WOOD PLANKS/SHINGLES . . . . . . . . . . . . . 36
OTHER 96
234YES . . . . . . . . . . . . . . . . . . . . . . . . . . . . . . . . . . . 1NO . . . . . . . . . . . . . . . . . . . . . . . . . . . . . . . . . . . 2 236
235 RARELY (ONCE OR TWICE IN 4 WKS) . . . . . . 1SOMETIMES (THREE TO TEN TIMES IN4 WKS) 2OFTEN (MORE THAN TEN TIMES IN 4 WKS) . . 3
236YES . . . . . . . . . . . . . . . . . . . . . . . . . . . . . . . . . . . 1NO . . . . . . . . . . . . . . . . . . . . . . . . . . . . . . . . . . . 2 238
237 RARELY (ONCE OR TWICE IN 4 WKS) . . . . . . 1SOMETIMES (THREE TO TEN TIMES IN4 WKS) 2OFTEN (MORE THAN TEN TIMES IN 4 WKS) . . 3
238YES . . . . . . . . . . . . . . . . . . . . . . . . . . . . . . . . . . . 1NO . . . . . . . . . . . . . . . . . . . . . . . . . . . . . . . . . . . 2 240
239 RARELY (ONCE OR TWICE IN 4 WKS) . . . . . . 1SOMETIMES (THREE TO TEN TIMES IN4 WKS) 2OFTEN (MORE THAN TEN TIMES IN 4 WKS) . . 3
240YES . . . . . . . . . . . . . . . . . . . . . . . . . . . . . . . . . . . 1NO . . . . . . . . . . . . . . . . . . . . . . . . . . . . . . . . . . . 2 242
241 RARELY (ONCE OR TWICE IN 4 WKS) . . . . . . 1SOMETIMES (THREE TO TEN TIMES IN4 WKS) 2OFTEN (MORE THAN TEN TIMES IN 4 WKS) . . 3
242YES . . . . . . . . . . . . . . . . . . . . . . . . . . . . . . . . . . . 1NO . . . . . . . . . . . . . . . . . . . . . . . . . . . . . . . . . . . 2 244
243 RARELY (ONCE OR TWICE IN 4 WKS) . . . . . . 1SOMETIMES (THREE TO TEN TIMES IN4 WKS) 2OFTEN (MORE THAN TEN TIMES IN 4 WKS) . . 3
244YES . . . . . . . . . . . . . . . . . . . . . . . . . . . . . . . . . . . 1NO . . . . . . . . . . . . . . . . . . . . . . . . . . . . . . . . . . . 2 301
245 RARELY (ONCE OR TWICE IN 4 WKS) . . . . . . 1SOMETIMES (THREE TO TEN TIMES IN4 WKS) 2OFTEN (MORE THAN TEN TIMES IN 4 WKS) . . 3
246HOURS . . . . . . . . . . . . . . . . . . . . . . . .
MINUTES . . . . . . . . . . . . . . . . . . . . . . . .
RECORD THE END TIME.
OBSERVE MAIN MATERIAL OF THE EXTERIOR WALLS OF THE DWELLING.
RECORD OBSERVATION.
(SPECIFY)
In the past four weeks, did you worry that your household would not have enough food?
How often did this happen?
In the past four weeks, did you or any householdmember have to eat a smaller meal than you feltyou needed because there was not enough food?
How often did this happen?
In the past four weeks, did you or any other householdmember have to eat fewer meals in a day because there was not enough food?
How often did this happen?
In the last four weeks, were there cases where you did not have any kind of food to eat because of the lack ofresources?
How often did this happen?
In the last four weeks, were there cases where you or a family member went to bed hungry because there was not enough food or there was nothing to eat?
How often did this happen?
In the last four weeks, were there cases where you or anyone from your family spent the whole day without eating because there was not enough food?
How often did this happen?
HH-17

The Somali Health and Demographic Survey336
301
302 LINE LINE LINENUMBER . . . . . . NUMBER . . . . . . NUMBER . . . . . .
NAME NAME NAME
303
DAY . . . . . . . . . . DAY . . . . . . . . . . DAY . . . . . . . . . .
MONTH . . . . . . . . MONTH . . . . . . . . MONTH . . . . . . . .
YEAR . . . YEAR . . . YEAR . . .
304 YES . . . . . . . . . . . . . . . 1 YES . . . . . . . . . . . . . . . 1 YES . . . . . . . . . . . . . . . 1NO . . . . . . . . . . . . . . . 2 NO . . . . . . . . . . . . . . . 2 NO . . . . . . . . . . . . . . . 2
(SKIP TO 311) (SKIP TO 311) (SKIP TO 311)
305KG. . . . . KG. . . . . KG. . . . .NOT PRESENT . . . . 9994 NOT PRESENT . . . . 9994 NOT PRESENT . . . . 9994REFUSED . . . . . . . . 9995 REFUSED . . . . . . . . 9995 REFUSED . . . . . . . . 9995OTHER . . . . . . . . . . 9996 OTHER . . . . . . . . . . 9996 OTHER . . . . . . . . . . 9996
306CM. . . . . CM. . . . . CM. . . . .
NOT PRESENT . . . . 9994 NOT PRESENT . . . . 9994 NOT PRESENT . . . . 9994REFUSED . . . . . . . . 9995 REFUSED . . . . . . . . 9995 REFUSED . . . . . . . . 9995OTHER . . . . . . . . . . 9996 OTHER . . . . . . . . . . 9996 OTHER . . . . . . . . . . 9996
(SKIP TO 308) (SKIP TO 308) (SKIP TO 308)
307 LYING DOWN . . . . . . 1 LYING DOWN . . . . . . 1 LYING DOWN . . . . . . 1STANDING UP . . . . . . 2 STANDING UP . . . . . . 2 STANDING UP . . . . . . 2
308
IF MOTHER INTERVIEWED:COPY CHILD’S DATE OF BIRTH (DAY, MONTH, AND YEAR) FROM BIRTH HISTORY. IF MOTHER NOT INTERVIEWED ASK:
CHECK COLUMN 1 IN HOUSEHOLD QUESTIONNAIRE. RECORD THE LINE NUMBER AND NAME FOR ALL ELIGIBLE CHILDREN 0-5 YEARS IN QUESTION 302; IF MORE THAN SIX CHILDREN, USE ADDITIONAL QUESTIONNAIRE(S).
CHILD 1 CHILD 2 CHILD 3
CHECK HOUSEHOLD QUESTIONNAIRE:LINE NUMBER FROM COLUMN 1.
What is (NAME)’s date of birth?
CHECK 303: CHILD BORN IN 2014-2019?
WEIGHT IN KILOGRAMS.
HEIGHT IN CENTIMETERS.
MEASURED LYING DOWN OR STANDING UP?
MEASURER: ENTER YOUR FIELDWORKER NUMBER.
FIELDWORKER NUMBER FIELDWORKER NUMBER FIELDWORKER NUMBER
HH-18
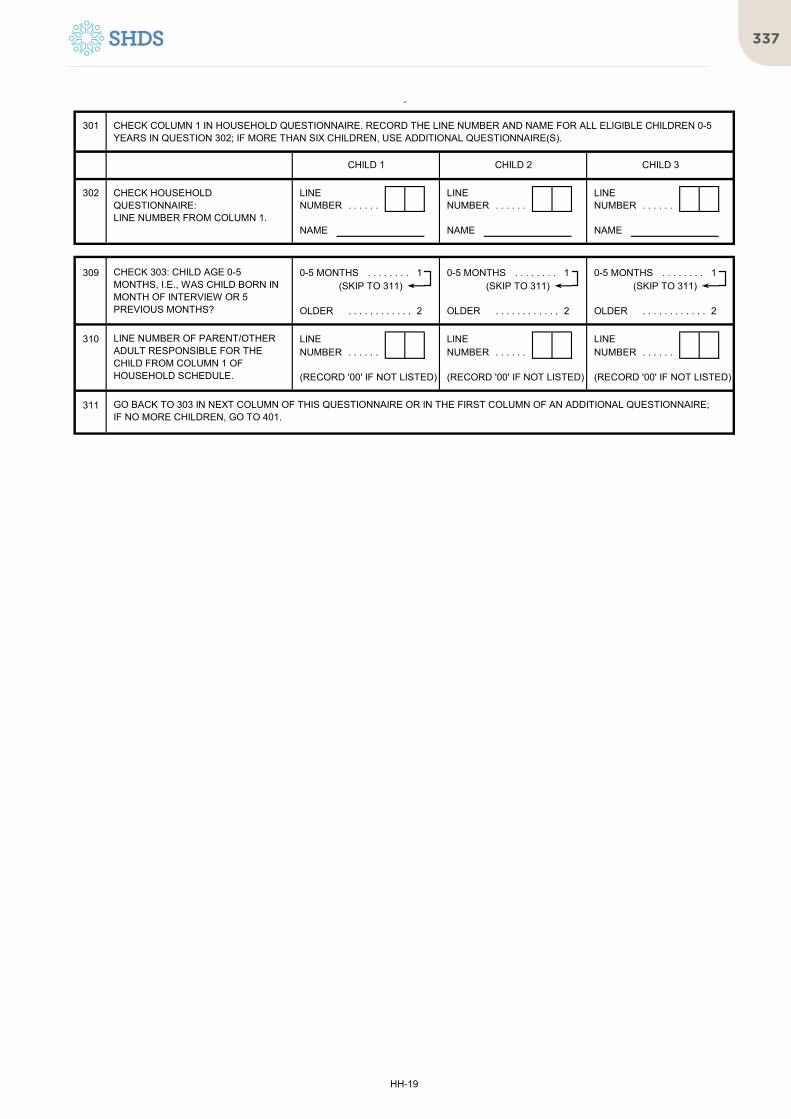
337
301
302 LINE LINE LINENUMBER . . . . . . NUMBER . . . . . . NUMBER . . . . . .
NAME NAME NAME
CHECK COLUMN 1 IN HOUSEHOLD QUESTIONNAIRE. RECORD THE LINE NUMBER AND NAME FOR ALL ELIGIBLE CHILDREN 0-5 YEARS IN QUESTION 302; IF MORE THAN SIX CHILDREN, USE ADDITIONAL QUESTIONNAIRE(S).
CHILD 1 CHILD 2 CHILD 3
CHECK HOUSEHOLD QUESTIONNAIRE:LINE NUMBER FROM COLUMN 1.
309 0-5 MONTHS . . . . . . . . 1 0-5 MONTHS . . . . . . . . 1 0-5 MONTHS . . . . . . . . 1(SKIP TO 311) (SKIP TO 311) (SKIP TO 311)
OLDER . . . . . . . . . . . . 2 OLDER . . . . . . . . . . . . 2 OLDER . . . . . . . . . . . . 2
310 LINE LINE LINENUMBER . . . . . . NUMBER . . . . . . NUMBER . . . . . .
(RECORD '00' IF NOT LISTED) (RECORD '00' IF NOT LISTED) (RECORD '00' IF NOT LISTED)
311 GO BACK TO 303 IN NEXT COLUMN OF THIS QUESTIONNAIRE OR IN THE FIRST COLUMN OF AN ADDITIONAL QUESTIONNAIRE;IF NO MORE CHILDREN, GO TO 401.
CHECK 303: CHILD AGE 0-5 MONTHS, I.E., WAS CHILD BORN IN MONTH OF INTERVIEW OR 5 PREVIOUS MONTHS?
LINE NUMBER OF PARENT/OTHER ADULT RESPONSIBLE FOR THE CHILD FROM COLUMN 1 OF HOUSEHOLD SCHEDULE.
HH-19

The Somali Health and Demographic Survey338
302 LINE LINE LINENUMBER . . . . . . NUMBER . . . . . . NUMBER . . . . . .
NAME NAME NAME
303
DAY . . . . . . . . . . DAY . . . . . . . . . . DAY . . . . . . . . . .
MONTH . . . . . . . . MONTH . . . . . . . . MONTH . . . . . . . .
YEAR . . . YEAR . . . YEAR . . .
304 YES . . . . . . . . . . . . . . . 1 YES . . . . . . . . . . . . . . . 1 YES . . . . . . . . . . . . . . . 1NO . . . . . . . . . . . . . . . 2 NO . . . . . . . . . . . . . . . 2 NO . . . . . . . . . . . . . . . 2
(SKIP TO 311) (SKIP TO 311) (SKIP TO 311)
305KG. . . . . KG. . . . . KG. . . . .NOT PRESENT . . . . 9994 NOT PRESENT . . . . 9994 NOT PRESENT . . . . 9994REFUSED . . . . . . . . 9995 REFUSED . . . . . . . . 9995 REFUSED . . . . . . . . 9995OTHER . . . . . . . . . . 9996 OTHER . . . . . . . . . . 9996 OTHER . . . . . . . . . . 9996
306CM. . . . . CM. . . . . CM. . . . .
NOT PRESENT . . . . 9994 NOT PRESENT . . . . 9994 NOT PRESENT . . . . 9994REFUSED . . . . . . . . 9995 REFUSED . . . . . . . . 9995 REFUSED . . . . . . . . 9995OTHER . . . . . . . . . . 9996 OTHER . . . . . . . . . . 9996 OTHER . . . . . . . . . . 9996
(SKIP TO 308) (SKIP TO 308) (SKIP TO 308)
307 LYING DOWN . . . . . . 1 LYING DOWN . . . . . . 1 LYING DOWN . . . . . . 1STANDING UP . . . . . . 2 STANDING UP . . . . . . 2 STANDING UP . . . . . . 2
308
IF MOTHER INTERVIEWED:COPY CHILD’S DATE OF BIRTH (DAY, MONTH, AND YEAR) FROM BIRTH HISTORY. IF MOTHER NOT INTERVIEWED ASK:
WEIGHT AND HEIGHT FOR CHILDREN AGE 0-5
CHILD 4 CHILD 5 CHILD 6
CHECK HOUSEHOLD QUESTIONNAIRE:LINE NUMBER FROM COLUMN 11.
What is (NAME)’s date of birth?
CHECK 303: CHILD BORN IN 2014-2019?
WEIGHT IN KILOGRAMS.
HEIGHT IN CENTIMETERS.
MEASURED LYING DOWN OR STANDING UP?
FIELDWORKER NUMBER FIELDWORKER NUMBER FIELDWORKER NUMBER
MEASURER: ENTER YOUR FIELDWORKER NUMBER.
HH-20

339
302 LINE LINE LINENUMBER . . . . . . NUMBER . . . . . . NUMBER . . . . . .
NAME NAME NAME
WEIGHT AND HEIGHT FOR CHILDREN AGE 0-5
CHILD 4 CHILD 5 CHILD 6
CHECK HOUSEHOLD QUESTIONNAIRE:LINE NUMBER FROM COLUMN 11.
309 0-5 MONTHS . . . . . . . . 1 0-5 MONTHS . . . . . . . . 1 0-5 MONTHS . . . . . . . . 1(SKIP TO 311) (SKIP TO 311) (SKIP TO 311)
OLDER . . . . . . . . . . . . 2 OLDER . . . . . . . . . . . . 2 OLDER . . . . . . . . . . . . 2
310 LINE LINE LINENUMBER . . . . . . NUMBER . . . . . . NUMBER . . . . . .
(RECORD '00' IF NOT LISTED) (RECORD '00' IF NOT LISTED) (RECORD '00' IF NOT LISTED)
311 GO BACK TO 303 IN NEXT COLUMN OF THIS QUESTIONNAIRE OR IN THE FIRST COLUMN OF AN ADDITIONAL QUESTIONNAIRE;IF NO MORE CHILDREN, GO TO 401.
CHECK 303: CHILD AGE 0-5 MONTHS, I.E., WAS CHILD BORN IN MONTH OF INTERVIEW OR 5 PREVIOUS MONTHS?
LINE NUMBER OF PARENT/OTHER ADULT RESPONSIBLE FOR THE CHILD FROM COLUMN 1 OF HOUSEHOLD SCHEDULE.
HH-21

The Somali Health and Demographic Survey340
401
402
LINE LINE LINENUMBER . . . . . . . . . . NUMBER . . . . . . . . . . NUMBER . . . . . . . . . .
403CODE 5 (NEVER IN UNION) . 1 CODE 5 (NEVER IN UNION) . 1 CODE 5 (NEVER IN UNION) . 1
OTHER MARITAL STATUS. . . 2 OTHER MARITAL STATUS. . . 2 OTHER MARITAL STATUS. . . 2
404KG. . . . . KG. . . . . KG. . . . .
NOT PRESENT . . . . . . 99994 NOT PRESENT . . . . . . 99994 NOT PRESENT . . . . . . 99994REFUSED . . . . . . . . . . . . 99995 REFUSED . . . . . . . . . . . . 99995 REFUSED . . . . . . . . . . . . 99995OTHER . . . . . . . . . . . . . 99996 OTHER . . . . . . . . . . . . . 99996 OTHER . . . . . . . . . . . . . 99996
405CM. . . . . . . . CM. . . . . . . . CM. . . . . . . .
NOT PRESENT . . . . . . . . 9994 NOT PRESENT . . . . . . . . 9994 NOT PRESENT . . . . . . . . 9994REFUSED . . . . . . . . . . . . . 9995 REFUSED . . . . . . . . . . . . . 9995 REFUSED . . . . . . . . . . . . . 9995OTHER . . . . . . . . . . . . . . . 9996 OTHER . . . . . . . . . . . . . . . 9996 OTHER . . . . . . . . . . . . . . . 9996
406 CODE 5 (NEVER IN UNION) . 1 CODE 5 (NEVER IN UNION) . 1 CODE 5 (NEVER IN UNION) . 1(NEXT COLUMN) (NEXT COLUMN) (END)
OTHER . . . . . . . . . . . . . . . . . 2 OTHER . . . . . . . . . . . . . . . . . 2 OTHER . . . . . . . . . . . . . . . . . 2
407A ASK:YES . . . . . . . . . . . . . . . . . . . . . 1 YES . . . . . . . . . . . . . . . . . . . . . 1 YES . . . . . . . . . . . . . . . . . . . . . 1NO . . . . . . . . . . . . . . . . . . . . . 2 NO . . . . . . . . . . . . . . . . . . . . . 2 NO . . . . . . . . . . . . . . . . . . . . . 2DON'T KNOW . . . . . . . . . . . . . 8 DON'T KNOW . . . . . . . . . . . . . 8 DON'T KNOW . . . . . . . . . . . . . 8
408
CHECK HOUSEHOLD QUESTIONNAIRE:
LINE NUMBER FROM COLUMN 1.
NAME FROM COLUMN 2. NAME NAME NAME
WEIGHT, HEIGHT MEASUREMENT FOR WOMEN AGE 12-49
CHECK COLUMN 10 & 11 IN ROSTER. RECORD THE LINE NUMBER, NAME AND MARITAL STATUS FOR ALL ELIGIBLE WOMEN IN 402 AND 403.IF THERE ARE MORE THAN THREE WOMEN, USE ADDITIONAL QUESTIONNAIRE(S).
WOMAN 1 WOMAN 2 WOMAN 3
GO BACK TO 402 IN NEXT COLUMN OF THIS QUESTIONNAIRE OR IN THE FIRST COLUMN OF AN ADDITIONAL QUESTIONNAIRE;
Are you pregnant?
CHECK 403: MARITAL STATUS
CHECK HOUSEHOLD QUESTIONNAIRE COLUMN 9 (MARITAL STATUS):
WEIGHT IN KILOGRAMS.
HEIGHT IN CENTIMETERS.
HH-22

341
Ever-married Woman’s Questionnaire
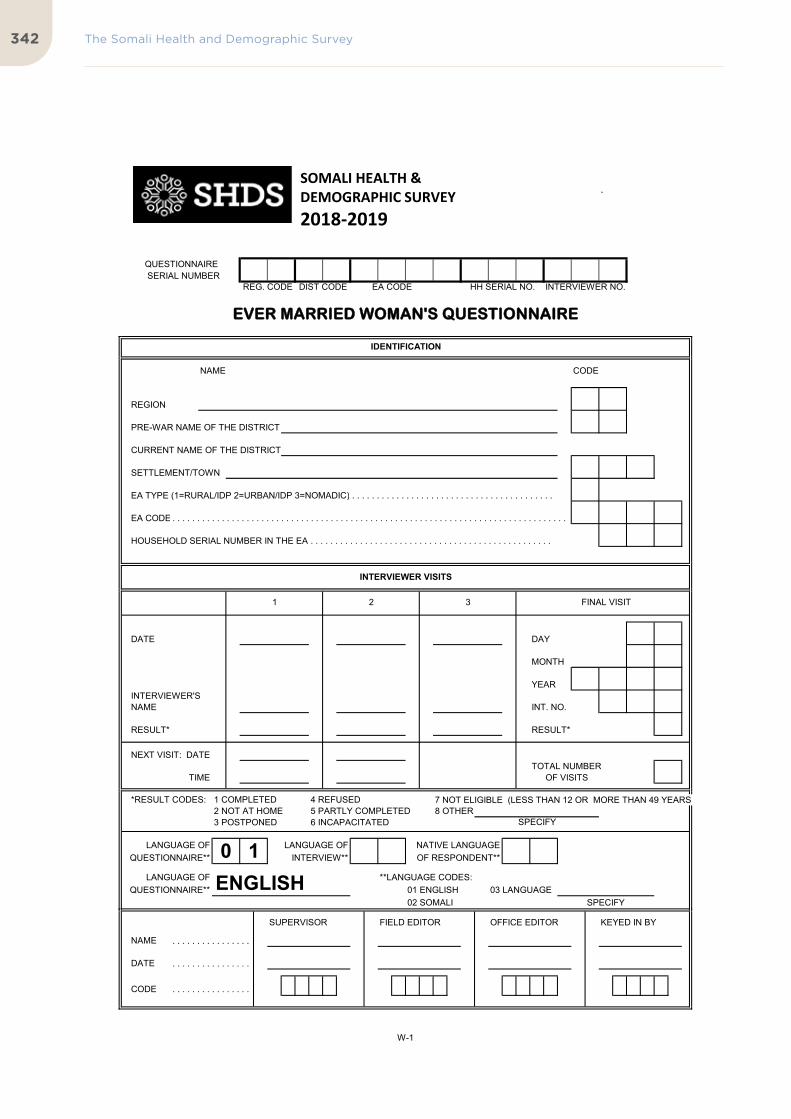
The Somali Health and Demographic Survey342
`
QUESTIONNAIRE SERIAL NUMBER
NAME CODE
REGION
PRE-WAR NAME OF THE DISTRICT
CURRENT NAME OF THE DISTRICT
SETTLEMENT/TOWN
EA TYPE (1=RURAL/IDP 2=URBAN/IDP 3=NOMADIC) . . . . . . . . . . . . . . . . . . . . . . . . . . . . . . . . . . . . . . . . .
EA CODE . . . . . . . . . . . . . . . . . . . . . . . . . . . . . . . . . . . . . . . . . . . . . . . . . . . . . . . . . . . . . . . . . . . . . . . . . . . . . . . .
HOUSEHOLD SERIAL NUMBER IN THE EA . . . . . . . . . . . . . . . . . . . . . . . . . . . . . . . . . . . . . . . . . . . . . . . . .
DATE DAY
MONTH
YEARINTERVIEWER'SNAME INT. NO.
RESULT* RESULT*
NEXT VISIT: DATETOTAL NUMBER
TIME OF VISITS
*RESULT CODES: 1 COMPLETED 4 REFUSED 7 NOT ELIGIBLE (LESS THAN 12 OR MORE THAN 49 YEARS)2 NOT AT HOME 5 PARTLY COMPLETED 8 OTHER3 POSTPONED 6 INCAPACITATED
LANGUAGE OF LANGUAGE OF NATIVE LANGUAGEQUESTIONNAIRE** INTERVIEW** OF RESPONDENT**
LANGUAGE OF **LANGUAGE CODES:QUESTIONNAIRE** 01 ENGLISH 03 LANGUAGE
02 SOMALI SPECIFY
SUPERVISOR FIELD EDITOR OFFICE EDITOR KEYED IN BY
NAME . . . . . . . . . . . . . . . .
DATE . . . . . . . . . . . . . . . .
CODE . . . . . . . . . . . . . . . .
0 1ENGLISH
SPECIFY
INTERVIEWER VISITS
1 2 3 FINAL VISIT
INTERVIEWER NO.
EEVVEERR MMAARRRRIIEEDD WWOOMMAANN''SS QQUUEESSTTIIOONNNNAAIIRREE
IDENTIFICATION
REG. CODE DIST CODE EA CODE HH SERIAL NO.
SOMALI HEALTH &DEMOGRAPHIC SURVEY2018-2019
W-1

343
`
QUESTIONNAIRE SERIAL NUMBER
NAME CODE
REGION
PRE-WAR NAME OF THE DISTRICT
CURRENT NAME OF THE DISTRICT
SETTLEMENT/TOWN
EA TYPE (1=RURAL/IDP 2=URBAN/IDP 3=NOMADIC) . . . . . . . . . . . . . . . . . . . . . . . . . . . . . . . . . . . . . . . . .
EA CODE . . . . . . . . . . . . . . . . . . . . . . . . . . . . . . . . . . . . . . . . . . . . . . . . . . . . . . . . . . . . . . . . . . . . . . . . . . . . . . . .
HOUSEHOLD SERIAL NUMBER IN THE EA . . . . . . . . . . . . . . . . . . . . . . . . . . . . . . . . . . . . . . . . . . . . . . . . .
DATE DAY
MONTH
YEARINTERVIEWER'SNAME INT. NO.
RESULT* RESULT*
NEXT VISIT: DATETOTAL NUMBER
TIME OF VISITS
*RESULT CODES: 1 COMPLETED 4 REFUSED 7 NOT ELIGIBLE (LESS THAN 12 OR MORE THAN 49 YEARS)2 NOT AT HOME 5 PARTLY COMPLETED 8 OTHER3 POSTPONED 6 INCAPACITATED
LANGUAGE OF LANGUAGE OF NATIVE LANGUAGEQUESTIONNAIRE** INTERVIEW** OF RESPONDENT**
LANGUAGE OF **LANGUAGE CODES:QUESTIONNAIRE** 01 ENGLISH 03 LANGUAGE
02 SOMALI SPECIFY
SUPERVISOR FIELD EDITOR OFFICE EDITOR KEYED IN BY
NAME . . . . . . . . . . . . . . . .
DATE . . . . . . . . . . . . . . . .
CODE . . . . . . . . . . . . . . . .
0 1ENGLISH
SPECIFY
INTERVIEWER VISITS
1 2 3 FINAL VISIT
INTERVIEWER NO.
EEVVEERR MMAARRRRIIEEDD WWOOMMAANN''SS QQUUEESSTTIIOONNNNAAIIRREE
IDENTIFICATION
REG. CODE DIST CODE EA CODE HH SERIAL NO.
SOMALI HEALTH &DEMOGRAPHIC SURVEY2018-2019
W-1

The Somali Health and Demographic Survey344
NO.
SECTION 1. RESPONDENT'S BACKGROUND
QUESTIONS AND FILTERS CODING CATEGORIES SKIP
109
CODE '2', '3' CODE '1' OR '5'OR '4' CIRCLED 111
CIRCLED
110 AT LEAST ONCE A WEEK . . . . . . . . . . . . . . . . . . . 1LESS THAN ONCE A WEEK . . . . . . . . . . . . . . . . 2NOT AT ALL . . . . . . . . . . . . . . . . . . . . . . . . . . . 3
111 AT LEAST ONCE A WEEK . . . . . . . . . . . . . . . . . . . 1LESS THAN ONCE A WEEK . . . . . . . . . . . . . . . . 2NOT AT ALL . . . . . . . . . . . . . . . . . . . . . . . . . . . 3
112 AT LEAST ONCE A WEEK . . . . . . . . . . . . . . . . . . . 1LESS THAN ONCE A WEEK . . . . . . . . . . . . . . . . 2NOT AT ALL . . . . . . . . . . . . . . . . . . . . . . . . . . . 3
113 YES . . . . . . . . . . . . . . . . . . . . . . . . . . . . . . . . . . . 1NO . . . . . . . . . . . . . . . . . . . . . . . . . . . . . . . . . . . 2 115
114 YES . . . . . . . . . . . . . . . . . . . . . . . . . . . . . . . . . . . 1NO . . . . . . . . . . . . . . . . . . . . . . . . . . . . . . . . . . . 2
115 YES . . . . . . . . . . . . . . . . . . . . . . . . . . . . . . . . . . . 1NO . . . . . . . . . . . . . . . . . . . . . . . . . . . . . . . . . . . 2
116 YES . . . . . . . . . . . . . . . . . . . . . . . . . . . . . . . . . . . 1NO . . . . . . . . . . . . . . . . . . . . . . . . . . . . . . . . . . . 2 119
117YES . . . . . . . . . . . . . . . . . . . . . . . . . . . . . . . . . . . 1NO . . . . . . . . . . . . . . . . . . . . . . . . . . . . . . . . . . . 2 119
118 ALMOST EVERY DAY . . . . . . . . . . . . . . . . . . . . . 1AT LEAST ONCE A WEEK . . . . . . . . . . . . . . . . . . . 2LESS THAN ONCE A WEEK . . . . . . . . . . . . . . . . 3NOT AT ALL . . . . . . . . . . . . . . . . . . . . . . . . . . . 4
119 YES . . . . . . . . . . . . . . . . . . . . . . . . . . . . . . . . . . . 1 121NO . . . . . . . . . . . . . . . . . . . . . . . . . . . . . . . . . . . 2
120 WIDOWED . . . . . . . . . . . . . . . . . . . . . . . . . . . . . . 1DIVORCED . . . . . . . . . . . . . . . . . . . . . . . . . . . . . . 2
121 ONLY ONCE . . . . . . . . . . . . . . . . . . . . . . . . . . . . . . 1MORE THAN ONCE . . . . . . . . . . . . . . . . . . . . . . . . 2
122MONTH . . . . . . . . . . . . . . . . . . . . . . . .
MARRIED MARRIED MOREONLY ONCE THAN ONCE DON'T KNOW MONTH . . . . . . . . . . . . . . . . . . . . . 98
a) b)YEAR . . . . . . . . . . . . . . . .
DON'T KNOW YEAR . . . . . . . . . . . . . . . . . . . . . 9998
123AGE . . . . . . . . . . . . . . . . . . . . . . . . . . .
In what month and year were you legally married (Nikaax/contract)?
Now I would like to ask about your first husband. In what month and year were you legally married to him (Nikaax/contract)?
Do you own a mobile telephone?
Do you use your mobile phone for any financial transactions?
Do you have an account in a bank or other financial institution that you yourself use?
Do you listen to the radio at least once a week, less than once a week or not at all?
Do you watch television at least once a week, less than once a week or not at all?
How old were you when you got legally married to your (first) husband (Nikaax)?
During the last one month, how often did you use the internet: almost every day, at least once a week, less than once a week, or not at all?
Are you currently married?
What is your marital status now: are you widowed or divorced?
Have you been married only once or more than once?
CHECK 121:
IF NECESSARY, PROBE FOR USE FROM ANY LOCATION, WITH ANY DEVICE.
CHECK 108:
Have you ever used the internet?
In the last 12 months, have you used the internet?
Do you read a newspaper or magazine at least once a week, less than once a week or not at all?
W-3

345
NO.
SECTION 1. RESPONDENT'S BACKGROUND
QUESTIONS AND FILTERS CODING CATEGORIES SKIP
124MONTH . . . . . . . . . . . . . . . . . . . . . . . .
MARRIED MARRIED MOREONLY ONCE THAN ONCE DON'T KNOW MONTH . . . . . . . . . . . . . . . . . . . . . 98
a) b)YEAR . . . . . . . . . . . . . . . .
DON'T KNOW YEAR . . . . . . . . . . . . . . . . . . . . . 9998
125AGE . . . . . . . . . . . . . . . . . . . . . . . . . . . NOT YET WEDDED . . . . . . . . . . . . . . . . . . . . . . . . 95
126 YES . . . . . . . . . . . . . . . . . . . . . . . . . . . . . . . . . . . 1NO . . . . . . . . . . . . . . . . . . . . . . . . . . . . . . . . . . . 2
CHECK 121:
In what month and year did you wed with your husband (Aqal gal)?
Now I would like to ask about your first husband. In what month and year did you wed with him (Aqal gal)?
How old were you when you wedded with your (first) husband (Aqal gal)?
Did the marriage contract (Nikaax) and wedding (Aqal gal) happen at the same time?
W-4

The Somali Health and Demographic Survey346
NO.
201 YES . . . . . . . . . . . . . . . . . . . . . . . . . . . . . . . . . . . 1
NO . . . . . . . . . . . . . . . . . . . . . . . . . . . . . . . . . . . 2 239
202 YES . . . . . . . . . . . . . . . . . . . . . . . . . . . . . . . . . . . 1NO . . . . . . . . . . . . . . . . . . . . . . . . . . . . . . . . . . . 2 204
203 a)a) SONS AT HOME. . . . . . . . . . . . . . . .
b)b) DAUGHTERS AT HOME . . . . . . .
204 YES . . . . . . . . . . . . . . . . . . . . . . . . . . . . . . . . . . . 1NO . . . . . . . . . . . . . . . . . . . . . . . . . . . . . . . . . . . 2 206
205 a)a) SONS ELSEWHERE . . . . . . . . . .
b)b) DAUGHTERS ELSEWHERE . . . . .
206
YES . . . . . . . . . . . . . . . . . . . . . . . . . . . . . . . . . . . 1NO . . . . . . . . . . . . . . . . . . . . . . . . . . . . . . . . . . . 2 208
207 a)a) BOYS DEAD . . . . . . . . . . . . . . . .
b)b) GIRLS DEAD . . . . . . . . . . . . . . . .
208TOTAL BIRTHS . . . . . . . . . . . . . . . . . . .
209
YES NO
210
ONE OR MORE NO BIRTHS 226BIRTHS
SKIPCODING CATEGORIESQUESTIONS AND FILTERS
SECTION 2. REPRODUCTION
CHECK 208:
CHECK 208:
SUM ANSWERS TO 203, 205, AND 207, AND ENTER TOTAL. IF NONE, RECORD '00'.
IF NONE, RECORD '00'.
And how many girls have died?
How many boys have died?
Have you ever given birth to a boy or girl who was born alive but later died?
IF NO, PROBE: Any baby who cried, who made any movement, sound, or effort to breathe, or who showed any other signs of life but did not survive?
PROBE AND CORRECT 201-208
AS NECESSARY.
Just to make sure that I have this right: you have had in TOTAL _____ births during your life. Is that correct?
How many sons live with you?
Do you have any sons or daughters to whom you have given birth who are now living with you?
Now I would like to ask about all the births you have had during your life. Have you been pregnant?
And how many daughters live with you?
IF NONE, RECORD '00'.
And how many daughters are alive but do not live with you?
How many sons are alive but do not live with you?
Do you have any sons or daughters to whom you have given birth who are alive but do not live with you?
IF NONE, RECORD '00'.
W-5

347
IF ALIVE:
01BOY 1 SING 1 YES 1 YES 1
GIRL 2 MULT 2 NO 2 NO 2
02 HOUSEHOLD YES 1BOY 1 SING 1 YES 1 YES 1 LINE NUMBER
NO 2GIRL 2 MULT 2 NO 2
NO 2(SKIP TO 221)
03 HOUSEHOLD YES 1BOY 1 SING 1 YES 1 YES 1 LINE NUMBER
NO 2GIRL 2 MULT 2 NO 2
NO 2(SKIP TO 221)
04 HOUSEHOLD YES 1BOY 1 SING 1 YES 1 YES 1 LINE NUMBER
NO 2GIRL 2 MULT 2 NO 2
NO 2(SKIP TO 221)
05 HOUSEHOLD YES 1BOY 1 SING 1 YES 1 YES 1 LINE NUMBER
NO 2GIRL 2 MULT 2 NO 2
NO 2(SKIP TO 221)
YEAR
YEAR
(SKIP TO
AGE IN
AGE INYEARS
(SKIP TO
220)
DAY
MONTH
MONTH
DAY YEARS
Is (NAME) still alive?
How old was (NAME) at (NAME)'s last birthday?
Is (NAME) living with you?
What name was given to your (first/ next) baby?
RECORD NAME.
BIRTH HISTORY NUMBER.
On what day, month, and year was (NAME) born?
Is (NAME) a boy or a girl?
Were any of these births twins?
3
2
1
YEARS
MONTHS
DAYS
(NEXT BIRTH)
SECTION 2. REPRODUCTION
RECORD AGE IN COMP-LETED YEARS.
RECORD '00' IF LESS THAN A DAY; DAYS IF LESS THAN 1 MONTH; MONTHS IF LESS THAN TWO YEARS; OR YEARS.
RECORD HOUSEHOLD LINE NUMBER OF CHILD. RECORD '00' IF CHILD NOT LISTED IN HOUSEHOLD.
Were there any other live births between (NAME OF PREVIOUS BIRTH) and (NAME), including any children who died after birth?
LINE NUMBERHOUSEHOLD
211 Now I would like to record the names of all your births, whether still alive or not, starting with the first one you had.RECORD NAMES OF ALL THE BIRTHS IN 212. RECORD TWINS AND TRIPLETS ON SEPARATE ROWS. IF THERE ARE MORE THAN 10 BIRTHS, USE AN ADDITIONAL QUESTIONNAIRE, STARTING WITH THE SECOND ROW.
IF ALIVE: IF DEAD:IF ALIVE:
How old was (NAME) when (he/she) died?
IF '12 MONTHS' OR '1 YR', ASK: Did (NAME) have (his/her) first birthday?
THEN ASK: Exactly how many months old was (NAME) when (he/she) died?
216215214213212 219 221220218217
(SKIP TO
220)
YEARS 3 (NEXT BIRTH)YEAR
(ADD BIRTH)
(NEXT BIRTH)
DAY AGE IN DAYS 1YEARS (ADD BIRTH)
MONTH MONTHS 2
DAYS 1
MONTHS 2
YEARS 3
(ADD BIRTH)
MONTH MONTHS 2
(SKIP TO
220)
YEARS 3 (NEXT BIRTH)YEAR
DAY AGE IN DAYS 1YEARS
(ADD BIRTH)
MONTH MONTHS 2
(SKIP TO
220)
YEARS 3 (NEXT BIRTH)YEAR
DAY AGE IN DAYS 1YEARS
W-6

The Somali Health and Demographic Survey348
IF ALIVE:
Is (NAME) still alive?
How old was (NAME) at (NAME)'s last birthday?
Is (NAME) living with you?
What name was given to your (first/ next) baby?
RECORD NAME.
BIRTH HISTORY NUMBER.
On what day, month, and year was (NAME) born?
Is (NAME) a boy or a girl?
Were any of these births twins?
RECORD AGE IN COMP-LETED YEARS.
RECORD '00' IF LESS THAN A DAY; DAYS IF LESS THAN 1 MONTH; MONTHS IF LESS THAN TWO YEARS; OR YEARS.
RECORD HOUSEHOLD LINE NUMBER OF CHILD. RECORD '00' IF CHILD NOT LISTED IN HOUSEHOLD.
Were there any other live births between (NAME OF PREVIOUS BIRTH) and (NAME), including any children who died after birth?
IF ALIVE: IF DEAD:IF ALIVE:
How old was (NAME) when (he/she) died?
IF '12 MONTHS' OR '1 YR', ASK: Did (NAME) have (his/her) first birthday?
THEN ASK: Exactly how many months old was (NAME) when (he/she) died?
216215214213212 219 221220218217
06 HOUSEHOLD YES 1BOY 1 SING 1 YES 1 YES 1 LINE NUMBER
NO 2GIRL 2 MULT 2 NO 2
NO 2(SKIP TO 221)
07 HOUSEHOLD YES 1BOY 1 SING 1 YES 1 YES 1 LINE NUMBER
NO 2GIRL 2 MULT 2 NO 2
NO 2(SKIP TO 221)
08 HOUSEHOLD YES 1BOY 1 SING 1 YES 1 YES 1 LINE NUMBER
NO 2GIRL 2 MULT 2 NO 2
NO 2(SKIP TO 221)
09 HOUSEHOLD YES 1BOY 1 SING 1 YES 1 YES 1 LINE NUMBER
NO 2GIRL 2 MULT 2 NO 2
NO 2(SKIP TO 221)
10 HOUSEHOLD YES 1BOY 1 SING 1 YES 1 YES 1 LINE NUMBER
NO 2GIRL 2 MULT 2 NO 2
NO 2(SKIP TO 221)
DAY DAYS 1YEARS
MONTH
AGE IN(ADD BIRTH)
YEAR
DAY AGE IN DAYS 1YEARS
MONTHS 2
YEARS 3(SKIP TO
220)
(ADD BIRTH)
MONTH MONTHS 2
(SKIP TO
220)
YEARS 3 (NEXT BIRTH)YEAR
DAY AGE IN DAYS 1YEARS
(ADD BIRTH)
MONTH MONTHS 2
(SKIP TO
220)
YEARS 3 (NEXT BIRTH)YEAR
DAY AGE IN DAYS 1YEARS
(NEXT BIRTH)
(ADD BIRTH)
MONTH MONTHS 2
(SKIP TO
220)
YEARS 3 (NEXT BIRTH)YEAR
DAY AGE IN DAYS 1YEARS
(ADD BIRTH)
MONTH MONTHS 2
(SKIP TO
220)
YEARS 3 (NEXT BIRTH)YEAR
W-7

349
NO.
222 YES . . . . . . . . . . . . . . . . . . . . . . . . . . . . . . . . . . . 1(RECORD BIRTH(S) IN TABLE)
NO . . . . . . . . . . . . . . . . . . . . . . . . . . . . . . . . . . . 2
223
NUMBERS NUMBERS AREARE SAME DIFFERENT
(PROBE AND RECONCILE)
224NUMBER OF BIRTHS . . . . . . . . . . . . . . . . . . .
NONE . . . . . . . . . . . . . . . . . . . . . . . . . . . . . . . . . . . 0 226
225
226 YES . . . . . . . . . . . . . . . . . . . . . . . . . . . . . . . . . . . 1NO . . . . . . . . . . . . . . . . . . . . . . . . . . . . . . . . . . . 2UNSURE . . . . . . . . . . . . . . . . . . . . . . . . . . . . . . 8
227MONTHS . . . . . . . . . . . . . . . . . . . . .
PROBE: WHAT WAS YOUR LAST MENSTRUAL PERIOD?
228 YES . . . . . . . . . . . . . . . . . . . . . . . . . . . . . . . . . . . 1 230NO . . . . . . . . . . . . . . . . . . . . . . . . . . . . . . . . . . . 2
229
ONE OR MORE NONE
a) b)LATER . . . . . . . . . . . . . . . . . . . . . . . . . . . . . . . . . 1NO MORE/NONE . . . . . . . . . . . . . . . . . . . . . . . . 2
230 YES . . . . . . . . . . . . . . . . . . . . . . . . . . . . . . . . . . . 1NO . . . . . . . . . . . . . . . . . . . . . . . . . . . . . . . . . . . 2 239
231MONTH . . . . . . . . . . . . . . . . . . . . . . . .
YEAR . . . . . . . . . . . . .
230
CWhen you got pregnant, were you expecting to get pregnant at that time?
Are you pregnant now?
When did the last such pregnancy end?
Have you ever had a pregnancy that miscarried or ended in a stillbirth?
SECTION 2. REPRODUCTION
CODING CATEGORIESQUESTIONS AND FILTERS SKIP
CHECK 208: TOTAL NUMBER OF BIRTHS
Did you want to have a baby later on or did you want more children?
Did you want to have a baby later on?
C
COMPARE 208 WITH NUMBER OF BIRTHS IN BIRTH HISTORY
RECORD NUMBER OF COMPLETED MONTHS.
Have you had any live births since the birth of (NAME OF LAST BIRTH)?
CHECK 215: ENTER THE NUMBER OF BIRTHS IN 2014-2019
FOR EACH BIRTH IN 2014-2019, ENTER 'B' IN THE MONTH OF BIRTH IN THE CALENDAR. WRITE THE NAME OF THE CHILD TO THE LEFT OF THE 'B' CODE. FOR EACH BIRTH, ASK THE NUMBER OF COMPLETED MONTHS THE PREGNANCY LASTED AND RECORD 'P' IN EACH OF THE PRECEDING MONTHS ACCORDING TO THE DURATION OF PREGNANCY. (NOTE: THE NUMBER OF 'P's MUST BE ONE LESS THAN THE NUMBER OF MONTHS THAT THE PREGNANCY LASTED.)
How many months pregnant are you?
ENTER 'P's IN THE CALENDAR, BEGINNING WITH THE MONTH OF INTERVIEW AND FOR THE TOTAL NUMBER OF COMPLETED MONTHS.
W-8

The Somali Health and Demographic Survey350
NO.
SECTION 2. REPRODUCTION
CODING CATEGORIESQUESTIONS AND FILTERS SKIP
232
234
239
LINENO.
01 YES . . . . . . . . . . 1
NO . . . . . . . . . . 2 236
02 YES . . . . . . . . . . 1
NO . . . . . . . . . . 2 236
03 YES . . . . . . . . . . 1
NO . . . . . . . . . . 2 236
04 YES . . . . . . . . . . 1236
NO . . . . . . . . . . 2
236
237 YES . . . . . . . . . . . . . . . . . . . . . . . . . . . . . . . . . . . 1NO . . . . . . . . . . . . . . . . . . . . . . . . . . . . . . . . . . . 2 239
238MONTH . . . . . . . . . . . . . . . . . . . . . . . .
YEAR . . . . . . . . . . . . .
CNUMBER OF MONTHS
When did the last such pregnancy that terminated before 2014 end?
Did you have any miscarriages, abortions or stillbirths that ended before 2014?
YEARMONTH
NEXT LINE
NEXT LINE
In what month and year did the preceding such pregnancy end?
NEXT LINE
YEARMONTH
CHECK 231:
NUMBER OF MONTHS
NUMBER OF MONTHS
How many months pregnant were you when that pregnancy ended?
235233 234
MONTH YEAR
FOR EACH PREGNANCY THAT DID NOT END IN A LIVE BIRTH IN 2014-2019 OR LATER, ENTER 'T' IN THE CALENDAR IN THE MONTH THAT THE PREGNANCY TERMINATED AND 'P' FOR THE REMAINING NUMBER OF COMPLETED MONTHS OF PREGNANCY.
IF THERE ARE MORE THAN FOUR PREGNANCIES THAT DID NOT END IN A LIVE BIRTH, USE AN ADDITIONAL QUESTIONNAIRE STARTING ON THE SECOND LINE.
Since January 2014, have you had any other pregnancies that did not result in a live birth?
NUMBER OF MONTHS
LAST PREGNANCY ENDED IN 2014-2019
LAST PREGNANCY ENDED IN 2013 OR
EARLIER
W-9

351
NO.
SECTION 2. REPRODUCTION
CODING CATEGORIESQUESTIONS AND FILTERS SKIP
239DAYS AGO . . . . . . . . . . . . . 1
WEEKS AGO . . . . . . . . . . . . . 2
MONTHS AGO . . . . . . . . . . . . . 3
YEARS AGO . . . . . . . . . . . . . 4
IN MENOPAUSE/HAS HAD HYSTERECTOMY . . . . . . . . . . 994
BEFORE LAST BIRTH . . . . . . . . . . . . . . . . . . . 995
NEVER MENSTRUATED . . . . . . . . . . . . . . . . 996
240AGE IN YEARS . . . . . . . . . . . . . . . . . . .
DON'T KNOW 98
241 YES . . . . . . . . . . . . . . . . . . . . . . . . . . . . . . . . . . . 1NO . . . . . . . . . . . . . . . . . . . . . . . . . . . . . . . . . . . 2DON'T KNOW . . . . . . . . . . . . . . . . . . . . . . . . . . . 8
242 JUST BEFORE HER PERIOD BEGINS. . . . . . . . . . 1RIGHT AFTER HER PERIOD HAS ENDED. . . . . . . 2HALFWAY BETWEEN TWO PERIODS . . . . . . . 3
OTHER 6
DON'T KNOW . . . . . . . . . . . . . . . . . . . . . . . . . . . 8
243 YES . . . . . . . . . . . . . . . . . . . . . . . . . . . . . . . . . . . 1NO . . . . . . . . . . . . . . . . . . . . . . . . . . . . . . . . . . . 2DON'T KNOW . . . . . . . . . . . . . . . . . . . . . . . . . . . 8
243
When did your last menstrual period start?
(SPECIFY)
After the birth of a child, can a woman become pregnant before her menstrual period has returned?
Is this time just before her period begins, right after her period has ended, or halfway between two periods?
From one menstrual period to the next, are there certain days when a woman is more likely to become pregnant?
How old were you when you had your first menstrual period?
CIRCLE DAYS AGO AND PUT 00 IF STARTED THE SAME DAY
(DATE, IF GIVEN)
W-10

The Somali Health and Demographic Survey352
301
01 YES . . . . . . . . . . . . . . . . . . . . . . . . . . . . . . . . . 1NO . . . . . . . . . . . . . . . . . . . . . . . . . . . . . . . . . 2
02 YES . . . . . . . . . . . . . . . . . . . . . . . . . . . . . . . . . 1NO . . . . . . . . . . . . . . . . . . . . . . . . . . . . . . . . . 2
03 YES . . . . . . . . . . . . . . . . . . . . . . . . . . . . . . . . . 1NO . . . . . . . . . . . . . . . . . . . . . . . . . . . . . . . . . 2
04 YES . . . . . . . . . . . . . . . . . . . . . . . . . . . . . . . . . 1NO . . . . . . . . . . . . . . . . . . . . . . . . . . . . . . . . . 2
05 YES . . . . . . . . . . . . . . . . . . . . . . . . . . . . . . . . . 1NO . . . . . . . . . . . . . . . . . . . . . . . . . . . . . . . . . 2
06 YES . . . . . . . . . . . . . . . . . . . . . . . . . . . . . . . . . 1NO . . . . . . . . . . . . . . . . . . . . . . . . . . . . . . . . . 2
07 YES . . . . . . . . . . . . . . . . . . . . . . . . . . . . . . . . . 1NO . . . . . . . . . . . . . . . . . . . . . . . . . . . . . . . . . 2
08 YES . . . . . . . . . . . . . . . . . . . . . . . . . . . . . . . . . 1NO . . . . . . . . . . . . . . . . . . . . . . . . . . . . . . . . . 2
09YES . . . . . . . . . . . . . . . . . . . . . . . . . . . . . . . . . 1NO . . . . . . . . . . . . . . . . . . . . . . . . . . . . . . . . . 2
10 YES . . . . . . . . . . . . . . . . . . . . . . . . . . . . . . . . . 1NO . . . . . . . . . . . . . . . . . . . . . . . . . . . . . . . . . 2
11 YES . . . . . . . . . . . . . . . . . . . . . . . . . . . . . . . . . 1NO . . . . . . . . . . . . . . . . . . . . . . . . . . . . . . . . . 2
12 YES, MODERN METHOD
A
YES, TRADITIONAL METHOD
B
NO . . . . . . . . . . . . . . . . . . . . . . . . . . . . . . . . . Y
SECTION 3. BIRTH SPACING
Standard Days Method.PROBE: A woman uses a string of colored beads to know the days she can get pregnant. On the days she can get pregnant, she uses a condom or does not have sexual intercourse.
(SPECIFY)
(SPECIFY)
Now I would like to talk about birth spacing - the various ways or methods that a couple can use to delay or avoid a pregnancy. Have you ever heard of (METHOD)?
Injectables.PROBE: Women can have an injection by a health provider that stops them from becoming pregnant for one or more months.
IUD.PROBE: Women can have a loop or coil placed inside them by a doctor or a nurse which can prevent pregnancy for one or more years.
Have you heard of any other ways or methods that women or men can use to avoid pregnancy?
Emergency Contraception.PROBE: As an emergency measure, within three days after they have unprotected sexual intercourse, women can take special pills to prevent pregnancy.
Withdrawal.PROBE: Men can be careful and pull out before climax.
Rhythm Method.PROBE: To avoid pregnancy, women do not have sexual intercourse on the days of the month they think they can get pregnant.
Female Condom.PROBE: Women can place a sheath in their vagina before sexual intercourse.
Condom.PROBE: Men can put a rubber sheath on their penis before sexual intercourse.
Pill.PROBE: Women can take a pill every day to avoid becoming pregnant.
Implants.PROBE: Women can have one or more small rods placed in their upper arm by a doctor or nurse which can prevent pregnancy for one or more years.
Lactational Amenorrhea Method (LAM).PROBE: Up to six months after childbirth, before the menstrual period has returned, women use a method requiring frequent breastfeeding day and night.
W-11
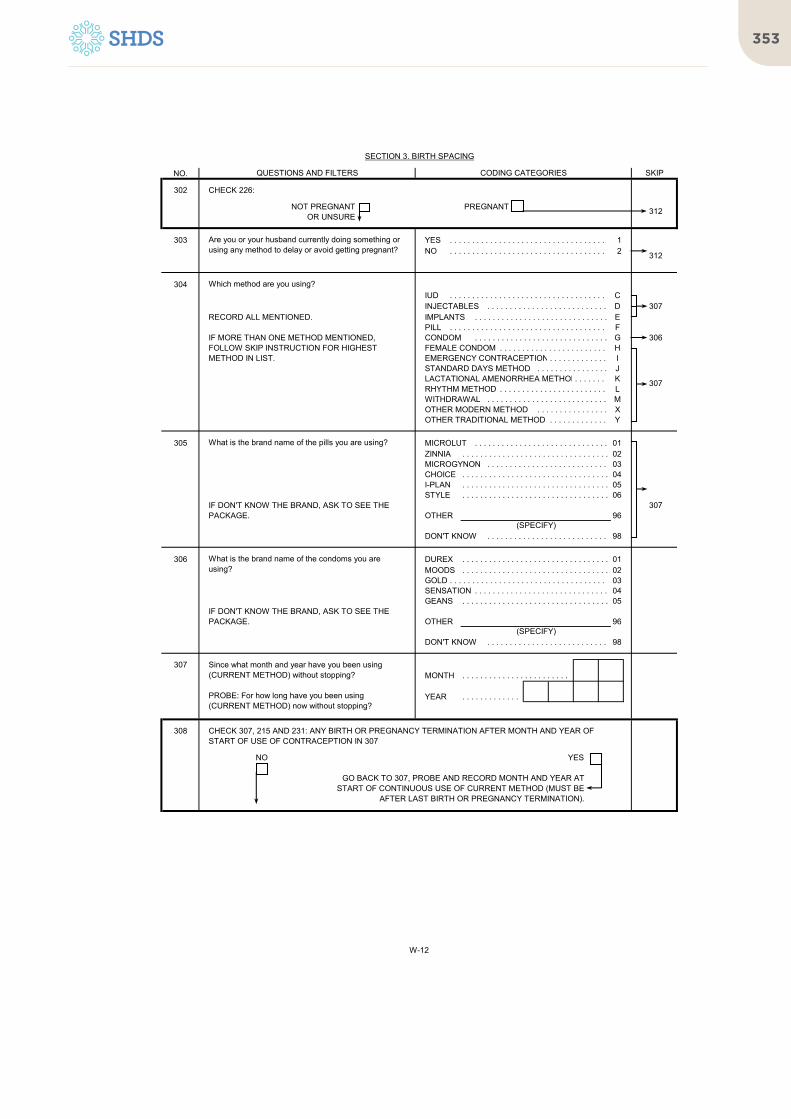
353
NO.
302
NOT PREGNANT PREGNANTOR UNSURE
303 YES . . . . . . . . . . . . . . . . . . . . . . . . . . . . . . . . . . . 1NO . . . . . . . . . . . . . . . . . . . . . . . . . . . . . . . . . . . 2
304IUD . . . . . . . . . . . . . . . . . . . . . . . . . . . . . . . . . . . CINJECTABLES . . . . . . . . . . . . . . . . . . . . . . . . . . . D 307IMPLANTS . . . . . . . . . . . . . . . . . . . . . . . . . . . . . . EPILL . . . . . . . . . . . . . . . . . . . . . . . . . . . . . . . . . . . FCONDOM . . . . . . . . . . . . . . . . . . . . . . . . . . . . . . G 306FEMALE CONDOM . . . . . . . . . . . . . . . . . . . . . . . . HEMERGENCY CONTRACEPTION . . . . . . . . . . . . . ISTANDARD DAYS METHOD . . . . . . . . . . . . . . . . JLACTATIONAL AMENORRHEA METHOD. . . . . . . KRHYTHM METHOD . . . . . . . . . . . . . . . . . . . . . . . . LWITHDRAWAL . . . . . . . . . . . . . . . . . . . . . . . . . . . MOTHER MODERN METHOD . . . . . . . . . . . . . . . . XOTHER TRADITIONAL METHOD . . . . . . . . . . . . . Y
305 MICROLUT . . . . . . . . . . . . . . . . . . . . . . . . . . . . . . 01ZINNIA . . . . . . . . . . . . . . . . . . . . . . . . . . . . . . . . . 02MICROGYNON . . . . . . . . . . . . . . . . . . . . . . . . . . . 03CHOICE . . . . . . . . . . . . . . . . . . . . . . . . . . . . . . . . . 04I-PLAN . . . . . . . . . . . . . . . . . . . . . . . . . . . . . . . . . 05STYLE . . . . . . . . . . . . . . . . . . . . . . . . . . . . . . . . . 06
307OTHER 96
DON'T KNOW . . . . . . . . . . . . . . . . . . . . . . . . . . . 98
306 DUREX . . . . . . . . . . . . . . . . . . . . . . . . . . . . . . . . . 01MOODS . . . . . . . . . . . . . . . . . . . . . . . . . . . . . . . . . 02GOLD . . . . . . . . . . . . . . . . . . . . . . . . . . . . . . . . . . . 03SENSATION . . . . . . . . . . . . . . . . . . . . . . . . . . . . . . 04GEANS . . . . . . . . . . . . . . . . . . . . . . . . . . . . . . . . . 05
OTHER 96
DON'T KNOW . . . . . . . . . . . . . . . . . . . . . . . . . . . 98
307MONTH . . . . . . . . . . . . . . . . . . . . . . . .
YEAR . . . . . . . . . . . . .
308
NO YES
GO BACK TO 307, PROBE AND RECORD MONTH AND YEAR AT START OF CONTINUOUS USE OF CURRENT METHOD (MUST BE
AFTER LAST BIRTH OR PREGNANCY TERMINATION).
312
Which method are you using?
307
What is the brand name of the pills you are using?
IF DON'T KNOW THE BRAND, ASK TO SEE THE PACKAGE.
(SPECIFY)
What is the brand name of the condoms you are using?
Since what month and year have you been using (CURRENT METHOD) without stopping?
PROBE: For how long have you been using (CURRENT METHOD) now without stopping?
IF DON'T KNOW THE BRAND, ASK TO SEE THE PACKAGE.
(SPECIFY)
CHECK 307, 215 AND 231: ANY BIRTH OR PREGNANCY TERMINATION AFTER MONTH AND YEAR OF START OF USE OF CONTRACEPTION IN 307
RECORD ALL MENTIONED.
IF MORE THAN ONE METHOD MENTIONED, FOLLOW SKIP INSTRUCTION FOR HIGHEST METHOD IN LIST.
Are you or your husband currently doing something or using any method to delay or avoid getting pregnant?
312
SECTION 3. BIRTH SPACING
QUESTIONS AND FILTERS CODING CATEGORIES SKIP
CHECK 226:
W-12

The Somali Health and Demographic Survey354
309
THEN CONTINUE THEN
(SKIP TO 324)
310
a)b)c)
d)
e)
C
C
IF DELIBERATELY STOPPED TO BECOME PREGNANT, ASK: How many months did it take you to get pregnant after you stopped using (METHOD)? AND ENTER ‘0’ IN EACH SUCH MONTH IN COLUMN 1.
Why did you stop using the (METHOD)? Did you become pregnant while using (METHOD), or did you stop to get pregnant, or did you stop for some other reason?
ILLUSTRATIVE QUESTIONS:
IN COLUMN 2, ENTER CODES FOR DISCONTINUATION NEXT TO THE LAST MONTH OF USE. NUMBER OF CODES IN COLUMN 2 MUST BE SAME AS NUMBER OF INTERRUPTIONS OF METHOD USE IN COLUMN 1.
ASK WHY SHE STOPPED USING THE METHOD. IF A PREGNANCY FOLLOWED, ASK WHETHER SHE BECAME PREGNANT UNINTENTIONALLY WHILE USING THE METHOD OR DELIBERATELY STOPPED TO GET PREGNANT.
How long did you use the method then?When did you start using that method? How long after the birth of (NAME)?When was the last time you used a method? Which method was that?
ILLUSTRATIVE QUESTIONS:
IN COLUMN 1, ENTER METHOD USE CODE OR '0' FOR NONUSE IN EACH BLANK MONTH.
USE CALENDAR TO PROBE FOR EARLIER PERIODS OF USE AND NONUSE, STARTING WITH MOST RECENT USE, BACK TO JANUARY 2014. USE NAMES OF CHILDREN, DATES OF BIRTH, AND PERIODS OF PREGNANCY AS REFERENCE POINTS.
SECTION 3. BIRTH SPACING (PAPER OPTION)
C C
I would like to ask you some questions about the times you or your husband may have used a method to avoid getting pregnant during the last few years.
CHECK 307:
ENTER CODE FOR METHOD USED IN MONTH OF INTERVIEW IN THE CALENDAR AND EACH MONTH BACK TO JANUARY 2014 .
ENTER CODE FOR METHOD USED IN MONTH OF INTERVIEW IN THE CALENDAR AND IN EACH MONTH BACK TO THE DATE STARTED USING.
YEAR IS 2014-2019 YEAR IS 2013 OR EARLIER
W-13

355
309
THEN CONTINUE THEN
(SKIP TO 322)
310
310AMONTH MONTH MONTH
310BYES . . . . . . . . . . . . . . . . 1 YES . . . . . . . . . . . . . . . . 1 YES . . . . . . . . . . . . . . . . 1NO . . . . . . . . . . . . . . . . 2 NO . . . . . . . . . . . . . . . . 2 NO . . . . . . . . . . . . . . . . 2
(SKIP TO 310I) (SKIP TO 310I) (SKIP TO 310I)
310CMETHOD CODE . . METHOD CODE . . METHOD CODE . .
310D IMMEDIATELY . . . . . 00 IMMEDIATELY . . . . . 00 IMMEDIATELY . . . . . 00
MONTHS . . MONTHS . . MONTHS . .
DATE GIVEN . . . . . . . 95 DATE GIVEN . . . . . . . 95 DATE GIVEN . . . . . . . 95
310EMONTH MONTH MONTH
310FMONTHS . . MONTHS . . MONTHS . .
DATE GIVEN . . . . . . . 95 DATE GIVEN . . . . . . . 95 DATE GIVEN . . . . . . . 95
310GMONTH MONTH MONTH
310H REASON REASON REASONSTOPPED . . . . . STOPPED . . . . . STOPPED . . . . .
310I
SECTION 3. BIRTH SPACING (CAPI OPTION)
ENTER CODE FOR METHOD USED IN MONTH OF INTERVIEW IN THE CALENDAR AND EACH MONTH BACK TO JANUARY 2014 .
CHECK 307:
ENTER CODE FOR METHOD USED IN MONTH OF INTERVIEW IN THE CALENDAR AND IN EACH MONTH BACK TO THE DATE STARTED USING.
I would like to ask you some questions about the times you or your husband may have used a method to avoid getting pregnant during the last few years.
C CYEAR IS 2014-2019 YEAR IS 2013 OR EARLIER
USE CALENDAR TO PROBE FOR EARLIER PERIODS OF USE AND NONUSE, STARTING WITH MOST RECENT USE, BACK TO JANUARY 2014. USE NAMES OF CHILDREN, DATES OF BIRTH, AND PERIODS OF PREGNANCY AS REFERENCE POINTS.
COLUMN 3COLUMN 2COLUMN 1
C
Why did you stop using (METHOD)?
For how many months did you use (METHOD)?
How many months after (EVENT) in (MONTH/YEAR) did you start to use (METHOD)?
RECORD MONTH AND YEAR RESPONDENT STARTED USING METHOD.
CIRCLE '95' IF RESPONDENT GIVES THE DATE OF STARTING TO USE THE METHOD.
CIRCLE '95' IF RESPONDENT GIVES THE DATE OF TERMINATION OF USE.
YEAR
YEAR
YEAR
YEAR
RECORD MONTH AND YEAR RESPONDENT STOPPED USING METHOD.
MONTH AND YEAR OF START OF INTERVAL OF USE OR NON-USE.
Which method was that?
Between (EVENT) in (MONTH/YEAR) and (EVENT) in (MONTH/YEAR), did you or your husband use any method of contraception?
YEAR
YEAR
(SKIP TO 310F) (SKIP TO 310F)(SKIP TO 310F)
GO BACK TO 310A IN NEXT COLUMN; OR, IF NO MORE GAPS, GO TO 311.
GO BACK TO 310A IN NEXT COLUMN; OR, IF NO MORE GAPS, GO TO 311.
GO BACK TO 310A IN NEW QUESTIONNAIRE; OR, IF NO MORE GAPS, GO TO 311.
YEAR
YEAR
YEAR
(SKIP TO 310H) (SKIP TO 310H) (SKIP TO 310H)
W-14

The Somali Health and Demographic Survey356
NO.
311
NO METHOD USED ANY METHOD USED
312 YES . . . . . . . . . . . . . . . . . . . . . . . . . . . . . . . . . . . 1NO . . . . . . . . . . . . . . . . . . . . . . . . . . . . . . . . . . . 2
313 NO CODE CIRCLED . . . . . . . . . . . . . . . . . . . . . 00 322IUD . . . . . . . . . . . . . . . . . . . . . . . . . . . . . . . . . . . 03INJECTABLES . . . . . . . . . . . . . . . . . . . . . . . . . . . 04IMPLANTS . . . . . . . . . . . . . . . . . . . . . . . . . . . . . . 05PILL . . . . . . . . . . . . . . . . . . . . . . . . . . . . . . . . . . . 06CONDOM. . . . . . . . . . . . . . . . . . . . . . . . . . . . . . . . . 07FEMALE CONDOM . . . . . . . . . . . . . . . . . . . . . . . . 08EMERGENCY CONTRACEPTION . . . . . . . . . . . . . 09STANDARD DAYS METHOD . . . . . . . . . . . . . . . . 10LACTATIONAL AMENORRHEA METHOD. . . . . . . 11RHYTHM METHOD . . . . . . . . . . . . . . . . . . . . . . . . 12 319WITHDRAWAL . . . . . . . . . . . . . . . . . . . . . . . . . . . 13OTHER MODERN METHOD . . . . . . . . . . . . . . . . 95OTHER TRADITIONAL METHOD . . . . . . . . . . . . . 96
314 PUBLIC SECTORGOVERNMENT HOSPITAL. . . . . . . . . . . . . . . . 11REFERRAL HEALTH CENTRE. . . . . . . . . . . . . 12MCH/HC . . . . . . . . . . . . . . . . . . . . . . . . . . . . . 13PRIMARY HEALTH UNIT (PHU). . . . . . . . . . . . . 14MOBILE CLINIC . . . . . . . . . . . . . . . . . . . . . . . . 15COMMUNITY HEALTH WORKER . . . . . . . . . . 16OTHER PUBLIC SECTOR
17
PRIVATE MEDICAL SECTORPRIVATE HOSPITAL/CLINIC/DOCTOR. . . . . . . 21PHARMACY . . . . . . . . . . . . . . . . . . . . . . . . . . . 22OTHER PRIVATE MEDICAL SECTOR
26
OTHER SOURCESHOP . . . . . . . . . . . . . . . . . . . . . . . . . . . . . . 31FRIEND/RELATIVE . . . . . . . . . . . . . . . . . . . . . 32
OTHER 96
315 IUD . . . . . . . . . . . . . . . . . . . . . . . . . . . . . . . . . . . 03INJECTABLES . . . . . . . . . . . . . . . . . . . . . . . . . . . 04IMPLANTS . . . . . . . . . . . . . . . . . . . . . . . . . . . . . . 05PILL . . . . . . . . . . . . . . . . . . . . . . . . . . . . . . . . . . . 06CONDOM. . . . . . . . . . . . . . . . . . . . . . . . . . . . . . . . . 07 319FEMALE CONDOM . . . . . . . . . . . . . . . . . . . . . . . . 08EMERGENCY CONTRACEPTION . . . . . . . . . . . . . 09STANDARD DAYS METHOD . . . . . . . . . . . . . . . . 10OTHER MODERN METHOD . . . . . . . . . . . . . . . . 95OTHER TRADITIONAL METHOD . . . . . . . . . . . . . 96 319
(SPECIFY)
CHECK THE CALENDAR FOR USE OF ANY CONTRACEPTIVE METHOD IN ANY MONTH
Have you ever used anything or tried in any way to delay or avoid getting pregnant?
CHECK 304:
CIRCLE METHOD CODE:
IF MORE THAN ONE METHOD CODE CIRCLED IN 304, CIRCLE CODE FOR HIGHEST METHOD IN LIST.
You first started using (CURRENT METHOD) in (DATE FROM 307). Where did you get it at that time?
CHECK 304:
CIRCLE METHOD CODE:
IF MORE THAN ONE METHOD CODE CIRCLED IN 304, CIRCLE CODE FOR HIGHEST METHOD IN LIST. 318
SECTION 3. BIRTH SPACING
CODING CATEGORIES SKIP
322
313
PROBE TO IDENTIFY THE TYPE OF SOURCE.
IF UNABLE TO DETERMINE IF PUBLIC OR PRIVATE SECTOR, WRITE THE NAME OF THE PLACE.
QUESTIONS AND FILTERS
(NAME OF PLACE)
(SPECIFY)
(SPECIFY)
W-15

357
NO.
SECTION 3. BIRTH SPACING
CODING CATEGORIES SKIPQUESTIONS AND FILTERS
316 YES . . . . . . . . . . . . . . . . . . . . . . . . . . . . . . . . . . . 1NO . . . . . . . . . . . . . . . . . . . . . . . . . . . . . . . . . . . 2
317 YES . . . . . . . . . . . . . . . . . . . . . . . . . . . . . . . . . . . 1NO . . . . . . . . . . . . . . . . . . . . . . . . . . . . . . . . . . . 2
318
ANY OTHER'YES'
a) b)
YES . . . . . . . . . . . . . . . . . . . . . . . . . . . . . . . . . . . 1 320NO . . . . . . . . . . . . . . . . . . . . . . . . . . . . . . . . . . . 2
319 YES . . . . . . . . . . . . . . . . . . . . . . . . . . . . . . . . . . . 1NO . . . . . . . . . . . . . . . . . . . . . . . . . . . . . . . . . . . 2
320 IUD . . . . . . . . . . . . . . . . . . . . . . . . . . . . . . . . . . . 03INJECTABLES . . . . . . . . . . . . . . . . . . . . . . . . . . . 04IMPLANTS . . . . . . . . . . . . . . . . . . . . . . . . . . . . . . 05PILL . . . . . . . . . . . . . . . . . . . . . . . . . . . . . . . . . . . 06CONDOM. . . . . . . . . . . . . . . . . . . . . . . . . . . . . . . . . 07FEMALE CONDOM . . . . . . . . . . . . . . . . . . . . . . . . 08EMERGENCY CONTRACEPTION . . . . . . . . . . . . . 09STANDARD DAYS METHOD . . . . . . . . . . . . . . . . 10LACTATIONAL AMENORRHEA METHOD. . . . . . . 11RHYTHM METHOD . . . . . . . . . . . . . . . . . . . . . . . . 12 323WITHDRAWAL . . . . . . . . . . . . . . . . . . . . . . . . . . . 13OTHER MODERN METHOD . . . . . . . . . . . . . . . . 95OTHER TRADITIONAL METHOD . . . . . . . . . . . . . 96 323
CHECK 316:
Were you ever told by a health worker about other methods of birth spacing that you could use?
When you obtained (CURRENT METHOD FROM 313) from (SOURCE OF METHOD FROM 314), were you told about other methods of birth spacing that you could use?
CHECK 304:
CIRCLE METHOD CODE:
IF MORE THAN ONE METHOD CODE CIRCLED IN 304, CIRCLE CODE FOR HIGHEST METHOD IN LIST.
At that time, were you told about side effects or problems you might have with the method?
Were you told what to do if you experienced side effects or problems?
At that time, were you told about other methods of birth spacing that you could use?
W-16

The Somali Health and Demographic Survey358
NO.
SECTION 3. BIRTH SPACING
CODING CATEGORIES SKIPQUESTIONS AND FILTERS
321 PUBLIC SECTORGOVERNMENT HOSPITAL. . . . . . . . . . . . . . . . 11REFERRAL HEALTH CENTRE. . . . . . . . . . . . . 12MCH/HC . . . . . . . . . . . . . . . . . . . . . . . . . . . . . 13PRIMARY HEALTH UNIT (PHU). . . . . . . . . . . . . 14MOBILE CLINIC . . . . . . . . . . . . . . . . . . . . . . . . 15COMMUNITY HEALTH WORKER . . . . . . . . . . 16OTHER PUBLIC SECTOR
17
PRIVATE MEDICAL SECTORPRIVATE HOSPITAL/CLINIC/DOCTOR. . . . . . . 21PHARMACY . . . . . . . . . . . . . . . . . . . . . . . . 22OTHER PRIVATE MEDICAL SECTOR
26
OTHER SOURCESHOP . . . . . . . . . . . . . . . . . . . . . . . . . . . . . . 31FRIEND/RELATIVE . . . . . . . . . . . . . . . . . . . . . 32
OTHER 96
322 YES . . . . . . . . . . . . . . . . . . . . . . . . . . . . . . . . . . . 1NO . . . . . . . . . . . . . . . . . . . . . . . . . . . . . . . . . . . 2
323 YES . . . . . . . . . . . . . . . . . . . . . . . . . . . . . . . . . . . 1NO . . . . . . . . . . . . . . . . . . . . . . . . . . . . . . . . . . . 2 325
324 YES . . . . . . . . . . . . . . . . . . . . . . . . . . . . . . . . . . . 1NO . . . . . . . . . . . . . . . . . . . . . . . . . . . . . . . . . . . 2
325
YES NO
a) b)
YES . . . . . . . . . . . . . . . . . . . . . . . . . . . . . . . . . . . 1NO . . . . . . . . . . . . . . . . . . . . . . . . . . . . . . . . . . . 2 401
326 YES . . . . . . . . . . . . . . . . . . . . . . . . . . . . . . . . . . . 1NO . . . . . . . . . . . . . . . . . . . . . . . . . . . . . . . . . . . 2
Where did you obtain (CURRENT METHOD) the last time?
(SPECIFY)
Did any staff member at the health facility speak to you about birth spacing methods?
Do you know of a place where you can obtain a method of birth spacing?
In the last 12 months, were you visited by a fieldworker?
CHECK 202: LIVING WITH CHILDREN
In the last 12 months, have you visited a health facility for care for yourself?
In the last 12 months, have you visited a health facility for care for yourself or your children?
Did the fieldworker talk to you about birth spacing?
(SPECIFY)
325
(SPECIFY)
PROBE TO IDENTIFY THE TYPE OF SOURCE.
IF UNABLE TO DETERMINE IF PUBLIC OR PRIVATE SECTOR, WRITE THE NAME OF THE PLACE.
(NAME OF PLACE)
W-17

359
401
402
403BIRTH BIRTHHISTORY HISTORYNUMBER . . . . . . . . . . NUMBER . . . . . . . . . .
404
LIVING DEAD LIVING DEAD
405 YES . . . . . . . . . . . . . . . . . . . . . 1 YES . . . . . . . . . . . . . . . . . . . . . 1(SKIP TO 408) (SKIP TO 426)
NO . . . . . . . . . . . . . . . . . . . . . 2 NO . . . . . . . . . . . . . . . . . . . . . 2
406 CHECK 208:
a) LATER . . . . . . . . . . . . . . . . . . . 1 LATER . . . . . . . . . . . . . . . . . . . 1NO MORE/NONE . . . . . . . . . . 2 NO MORE/NONE . . . . . . . . . . 2
(SKIP TO 408) (SKIP TO 426)
407MONTHS . . . . . . . 1 MONTHS . . . . . . . 1
YEARS . . . . . . . 2 YEARS . . . . . . . 2
DON'T KNOW . . . . . . . . . . . . . 998 DON'T KNOW . . . . . . . . . . . . . 998
408 YES . . . . . . . . . . . . . . . . . . . . . 1NO . . . . . . . . . . . . . . . . . . . . . 2
(SKIP TO 414)
409 HEALTH PERSONNELDOCTOR . . . . . . . . . . . . . . . . ACLINICAL OFFICER . . . . . . . BNURSE/MIDWIFE . . . . . . . CAUXILIARY MIDWIFE . . . . . D
OTHER PERSONTRADITIONAL BIRTH
ATTENDANT . . . . . . . . . . ECOMMUNITY HEALTH
WORKER. . . . . . . . . . . . . F
OTHER X
Did you see anyone for antenatal care for this pregnancy?
Whom did you see?
Anyone else?
PROBE TO IDENTIFY EACH TYPE OF PERSON AND RECORD ALL MENTIONED.
(SPECIFY)
When you got pregnant with (NAME), did you want to get pregnant at that time?
How much longer did you want to wait?
Did you want to have a baby later on?
ONLY ONE BIRTH OR MORE THAN ONE BIRTH
Now I would like to ask some questions about your children born in the last five years. (We will talk about each separately)
BIRTH HISTORY NUMBER FROM 212 IN BIRTH HISTORY.
LAST BIRTH NEXT-TO-LAST BIRTH
FROM 212 AND 216: NAME NAME
SECTION 4. PREGNANCY AND POSTNATAL CARE
CHECK 224:
ONE OR MORE BIRTHS IN 2014-2019
NO BIRTHS IN 2014-2019 648
CHECK 215. RECORD THE BIRTH HISTORY NUMBER IN 403 AND THE NAME AND SURVIVAL STATUS IN 404 FOR EACH BIRTH IN 2014-2019. ASK THE QUESTIONS ABOUT ALL OF THESE BIRTHS. BEGIN WITH THE LAST BIRTH.IF THERE ARE MORE THAN 2 BIRTHS, USE LAST COLUMN OF ADDITIONAL QUESTIONNAIRE(S).
W-18

The Somali Health and Demographic Survey360
NO.
410 HOMEHER HOME . . . . . . . . . . . . . AOTHER HOME . . . . . . . . . . B
PUBLIC SECTORGOVERNMENT HOSPITAL. . CREFERRAL HEALTH CENTRE DMCH/HC . . . . . . . . . . . . . . . . EPRIMARY HEALTH UNIT (PHU)FMOBILE CLINIC . . . . . . . . . . GOTHER PUBLIC SECTOR
H
PRIVATE MEDICAL SECTORPRIVATE HOSPITAL/
CLINIC . . . . . . . . . . . . . IOTHER PRIVATE
MEDICAL SECTOR
J
OTHER X
411MONTHS . . . . . . . . . .
DON'T KNOW . . . . . . . . . . . . . 98
412 NUMBEROF TIMES . . . . .
DON'T KNOW . . . . . . . . . . . . . 98
413
YES NO
a) a) BP . . . . . . . . . . 1 2b) b) URINE . . . . . . . 1 2c) c) BLOOD . . . . . . . 1 2
414YES . . . . . . . . . . . . . . . . . . . . . 1NO . . . . . . . . . . . . . . . . . . . . . 2
(SKIP TO 417)DON'T KNOW . . . . . . . . . . . . . 8
415TIMES . . . . . . . . . . . . . . . .
DON'T KNOW . . . . . . . . . . . . . 8
416 2 OR MORE OTHERTIMES
(SKIP TO 420)
Was your blood pressure measured?Did you give a urine sample?Did you give a blood sample?
During this pregnancy, were you given an injection in the arm to prevent the baby from getting tetanus, that is, convulsions after birth?
During this pregnancy, how many times did you get a tetanus injection?
CHECK 415:
(NAME OF PLACE)
(SPECIFY)
(SPECIFY)
How many months pregnant were you when you first received antenatal care for this pregnancy?
How many times did you receive antenatal care during this pregnancy?
As part of your antenatal care during this pregnancy, were any of the following done at least once:
QUESTIONS AND FILTERS NAME NAME
Where did you receive antenatal care for this pregnancy?
Anywhere else?
PROBE TO IDENTIFY THE TYPE OF SOURCE.
IF UNABLE TO DETERMINE IF PUBLIC OR PRIVATE SECTOR, WRITE THE NAME OF THE PLACE. (SPECIFY)
SECTION 4. PREGNANCY AND POSTNATAL CARE
LAST BIRTH NEXT-TO-LAST BIRTH
W-19

361
NO. QUESTIONS AND FILTERS NAME NAME
SECTION 4. PREGNANCY AND POSTNATAL CARE
LAST BIRTH NEXT-TO-LAST BIRTH
417 YES . . . . . . . . . . . . . . . . . . . . . 1NO . . . . . . . . . . . . . . . . . . . . . 2
(SKIP TO 420)DON'T KNOW . . . . . . . . . . . . . 8
418
TIMES . . . . . . . . . . . . . . . .
DON'T KNOW . . . . . . . . . . . . . 8
419 CHECK 418:
a) b)
YEARS AGO . . . . .
420YES . . . . . . . . . . . . . . . . . . . . . 1NO . . . . . . . . . . . . . . . . . . . . . 2
(SKIP TO 422)DON'T KNOW . . . . . . . . . . . . . 8
421
DAYS . . . . .
DON'T KNOW . . . . . . . . . . . . . 998
422 YES . . . . . . . . . . . . . . . . . . . . . 1NO . . . . . . . . . . . . . . . . . . . . . 2DON'T KNOW . . . . . . . . . . . . . 8
423 YES . . . . . . . . . . . . . . . . . . . . . 1NO . . . . . . . . . . . . . . . . . . . . . 2
(SKIP TO 426)DON'T KNOW . . . . . . . . . . . . . 8
424TIMES . . . . . . . . . .
PROBE: MALARIA PREVENTION DRUG
425
ANTENATAL VISIT . . . . . . . . . . 1ANOTHER FACILITY VISIT . . . . . 2OTHER SOURCE . . . . . . . . . . 6
How many times did you take SP/Fansidar during this pregnancy?
Did you get the SP/Fansidar during any antenatal care visit, during another visit to a health facility or from another source?IF MORE THAN ONE SOURCE, RECORD THE HIGHEST SOURCE ON THE LIST.
During this pregnancy, were you given or did you buy any iron tablets or iron syrup?
SHOW TABLETS/SYRUP.
During the whole pregnancy, for how many days did you take the tablets or syrup?
IF ANSWER IS NOT NUMERIC, PROBE FOR APPROXIMATE NUMBER OF DAYS.
During this pregnancy, did you take any drug for intestinal worms?
During this pregnancy, did you take SP/Fansidar to keep you from getting malaria?
At any time before this pregnancy, did you receive any tetanus injections?
Before this pregnancy, how many times did you receive a tetanus injection?
IF 7 OR MORE TIMES, RECORD '7'.
ONLY ONE
MORE THAN ONE
How many years ago did you receive that tetanus injection?
How many years ago did you receive the last tetanus injection prior to this pregnancy?
W-20

The Somali Health and Demographic Survey362
NO. QUESTIONS AND FILTERS NAME NAME
SECTION 4. PREGNANCY AND POSTNATAL CARE
LAST BIRTH NEXT-TO-LAST BIRTH
426 VERY LARGE . . . . . . . . . . . . . 1 VERY LARGE . . . . . . . . . . . . . 1LARGER THAN LARGER THAN
AVERAGE . . . . . . . . . . . . . 2 AVERAGE . . . . . . . . . . . . . 2AVERAGE . . . . . . . . . . . . . . . . 3 AVERAGE . . . . . . . . . . . . . . . . 3SMALLER THAN SMALLER THAN
AVERAGE . . . . . . . . . . . . . 4 AVERAGE . . . . . . . . . . . . . 4VERY SMALL . . . . . . . . . . . . . 5 VERY SMALL . . . . . . . . . . . . . 5DON'T KNOW . . . . . . . . . . . . . 8 DON'T KNOW . . . . . . . . . . . . . 8
427 YES . . . . . . . . . . . . . . . . . . . . . 1 YES . . . . . . . . . . . . . . . . . . . . . 1NO . . . . . . . . . . . . . . . . . . . . . 2 NO . . . . . . . . . . . . . . . . . . . . . 2
(SKIP TO 429) (SKIP TO 429)DON'T KNOW . . . . . . . . . . . . . 8 DON'T KNOW . . . . . . . . . . . . . 8
428 KG FROM CARD KG FROM CARD
1 . 1 .
KG FROM RECALL KG FROM RECALL
2 . 2 .
DON'T KNOW . . . . . . . . . . 9998 DON'T KNOW . . . . . . . . . . 9998
429 HEALTH PERSONNEL HEALTH PERSONNELDOCTOR . . . . . . . . . . . . . A DOCTOR . . . . . . . . . . . . . ACLINICAL OFFICER . . . . . . . B CLINICAL OFFICER . . . . . . . BNURSE/MIDWIFE . . . . . . . C NURSE/MIDWIFE . . . . . . . CAUXILIARY AUXILIARY
MIDWIFE . . . . . . . . . . . . . D MIDWIFE . . . . . . . . . . . . . DOTHER PERSON OTHER PERSON
TRADITIONAL BIRTH TRADITIONAL BIRTHATTENDANT . . . . . . . . . . E ATTENDANT . . . . . . . . . . E
RELATIVE/FRIEND . . . . . . . F RELATIVE/FRIEND . . . . . . . FOTHER OTHER
X X
NO ONE ASSISTED . . . . . . . . . . Y NO ONE ASSISTED . . . . . . . . . . Y
RECORD WEIGHT IN KILOGRAMS FROM HEALTH CARD, IF AVAILABLE.
Who assisted with the delivery of (NAME)?
Anyone else?
PROBE FOR THE TYPE(S) OF PERSON(S) AND RECORD ALL MENTIONED.
IF RESPONDENT SAYS NO ONE ASSISTED, PROBE TO DETERMINE WHETHER ANY ADULTS WERE PRESENT AT THE DELIVERY.
(SPECIFY) (SPECIFY)
When (NAME) was born, was (NAME) very large, larger than average, average, smaller than average, or very small?
Was (NAME) weighed at birth?
How much did (NAME) weigh?
W-21

363
NO. QUESTIONS AND FILTERS NAME NAME
SECTION 4. PREGNANCY AND POSTNATAL CARE
LAST BIRTH NEXT-TO-LAST BIRTH
430 HOME HOMEHER HOME . . . . . . . . . . . . . 11 HER HOME . . . . . . . . . . . . . 11
(SKIP TO 434) (SKIP TO 434)OTHER HOME . . . . . . . . . . 12 OTHER HOME . . . . . . . . . . 12
PUBLIC SECTOR PUBLIC SECTORGOVERNMENT HOSPITAL. . 21 GOVERNMENT HOSPITAL. . 21REFERRAL HEALTH CENTRE22 REFERRAL HEALTH CENTRE22MCH/HC . . . . . . . . . . . . . . . . 23 MCH/HC . . . . . . . . . . . . . . . . 23PRIMARY HEALTH UNIT (PHU)24 PRIMARY HEALTH UNIT (PHU)24MOBILE CLINIC . . . . . . . . . . 25 MOBILE CLINIC . . . . . . . . . . 25OTHER PUBLIC SECTOR OTHER PUBLIC SECTOR
26 26
PRIVATE MEDICAL SECTOR PRIVATE MEDICAL SECTORPRIVATE HOSPITAL/ PRIVATE HOSPITAL/
CLINIC . . . . . . . . . . . . . 31 CLINIC . . . . . . . . . . . . . 31OTHER PRIVATE OTHER PRIVATE
MEDICAL SECTOR MEDICAL SECTOR
36 36
OTHER 96 OTHER 96
(SKIP TO 434) (SKIP TO 434)
431HOURS . . . . . . . 1
DAYS . . . . . . . 2
WEEKS . . . . . . . 3
DON'T KNOW . . . . . . . . . . . . . 98
432 YES . . . . . . . . . . . . . . . . . . . . . 1 YES . . . . . . . . . . . . . . . . . . . . . 1NO . . . . . . . . . . . . . . . . . . . . . 2 NO . . . . . . . . . . . . . . . . . . . . . 2
(SKIP TO 434) (SKIP TO 434)
433 BEFORE . . . . . . . . . . . . . . . . . . . 1 BEFORE . . . . . . . . . . . . . . . . . . . 1AFTER . . . . . . . . . . . . . . . . . . . 2 AFTER . . . . . . . . . . . . . . . . . . . 2
434 YES . . . . . . . . . . . . . . . . . . . . . 1 YES . . . . . . . . . . . . . . . . . . . . . 1NO . . . . . . . . . . . . . . . . . . . . . 2 NO . . . . . . . . . . . . . . . . . . . . . 2
(SKIP TO 434B) (SKIP TO 459)DON'T KNOW . . . . . . . . . . . . . 8 DON'T KNOW . . . . . . . . . . . . . 8
434A YES . . . . . . . . . . . . . . . . . . . . . 1 YES . . . . . . . . . . . . . . . . . . . . . 1NO . . . . . . . . . . . . . . . . . . . . . 2 NO . . . . . . . . . . . . . . . . . . . . . 2DON'T KNOW . . . . . . . . . . . . . 8 DON'T KNOW . . . . . . . . . . . . . 8
434B CODE11, 12, OR 96 OTHER
CIRCLED
(SKIP TO 449)
Was (NAME) delivered by caesarean, that is, did they cut your belly open to take the baby out?
When was the decision made to have the caesarean section? Was it before or after your labor pains started?
Immediately after the birth, was (NAME) put on your chest?
Was (NAME)'s bare skin touching your bare skin (kangaroo)?
CHECK 430: PLACE OF DELIVERY
(SPECIFY) (SPECIFY)
(SPECIFY) (SPECIFY)
How long after (NAME) was delivered did you stay there?
IF LESS THAN ONE HOUR RECORD '00'; IF LESS THAN ONE DAY,RECORD HOURS;IF LESS THAN ONE WEEK,RECORD DAYS.
Where did you give birth to (NAME)?
PROBE TO IDENTIFY THE TYPE OF SOURCE.
IF UNABLE TO DETERMINE IF PUBLIC OR PRIVATE SECTOR, WRITE THE NAME OF THE PLACE.
(NAME OF PLACE)
(SPECIFY) (SPECIFY)
W-22

The Somali Health and Demographic Survey364
NO. QUESTIONS AND FILTERS NAME NAME
SECTION 4. PREGNANCY AND POSTNATAL CARE
LAST BIRTH NEXT-TO-LAST BIRTH
435
YES . . . . . . . . . . . . . . . . . . . . . 1NO . . . . . . . . . . . . . . . . . . . . . 2
(SKIP TO 438)
436
HOURS . . . . . . . 1
DAYS . . . . . . . . . . 2
WEEKS . . . . . . . 3
DON'T KNOW . . . . . . . . . . . . . 98
437 HEALTH PERSONNELDOCTOR . . . . . . . . . . . . . . . . 11CLINICAL OFFICER . . . . . . . 12NURSE/MIDWIFE . . . . . . . 13AUXILIARY
MIDWIFE . . . . . . . . . . . . . 14OTHER PERSON
TRADITIONAL BIRTHATTENDANT . . . . . . . . . . 21
COMMUNITY HEALTHWORKER . . . . . . . . . . 22
OTHER 96
438
YES . . . . . . . . . . . . . . . . . . . . . 1NO . . . . . . . . . . . . . . . . . . . . . 2
(SKIP TO 441)DON'T KNOW . . . . . . . . . . . . . 8
439
HOURS . . . . . . . 1
DAYS . . . . . . . . . . 2
WEEKS . . . . . . . 3
DON'T KNOW . . . . . . . . . . . . . 98
440 HEALTH PERSONNELDOCTOR . . . . . . . . . . . . . . . . 11CLINICAL OFFICER . . . . . . . 12NURSE/MIDWIFE . . . . . . . 13AUXILIARY
MIDWIFE . . . . . . . . . . . . . 14OTHER PERSON
TRADITIONAL BIRTHATTENDANT . . . . . . . . . . 21
COMMUNITY HEALTHWORKER . . . . . . . . . . 22
OTHER 96
Who checked on (NAME)’s health at that time?
PROBE FOR MOST QUALIFIED PERSON.
(SPECIFY)
Who checked on your health at that time?
PROBE FOR MOST QUALIFIED PERSON.
(SPECIFY)
Now I would like to talk to you about checks on (NAME)’s health after delivery – for example, someone examining (NAME), checking the cord, or seeing if (NAME) is OK. Did anyone check on (NAME)’s health while you were still in the facility?
How long after delivery did the first check take place?
IF LESS THAN ONE HOUR RECORD '00'; IF LESS THAN ONE DAY,RECORD HOURS;IF LESS THAN ONE WEEK,RECORD DAYS.
How long after delivery was (NAME)’s health first checked?
IF LESS THAN ONE HOUR RECORD '00'; IF LESS THAN ONE DAY,RECORD HOURS;IF LESS THAN ONE WEEK,RECORD DAYS.
I would like to talk to you about checks on your health after delivery, for example, someone asking you questions about your health or examining you. Did anyone check on your health while you were still in the facility?
W-23

365
NO. QUESTIONS AND FILTERS NAME NAME
SECTION 4. PREGNANCY AND POSTNATAL CARE
LAST BIRTH NEXT-TO-LAST BIRTH
441 YES . . . . . . . . . . . . . . . . . . . . . 1NO . . . . . . . . . . . . . . . . . . . . . 2
(SKIP TO 445)
442HOURS . . . . . . . 1
DAYS . . . . . . . . . . 2
WEEKS . . . . . . . 3
DON'T KNOW . . . . . . . . . . . . . 98
443 HEALTH PERSONNELDOCTOR . . . . . . . . . . . . . . . . 11CLINICAL OFFICER . . . . . . . 12NURSE/MIDWIFE . . . . . . . 13AUXILIARY
MIDWIFE . . . . . . . . . . . . . 14OTHER PERSON
TRADITIONAL BIRTHATTENDANT . . . . . . . . . . 21
COMMUNITY HEALTHWORKER . . . . . . . . . . 22
OTHER 96
444 HOMEHER HOME . . . . . . . . . . . . . 11OTHER HOME . . . . . . . . . . 12
PUBLIC SECTORGOVERNMENT HOSPITAL. . 21REFERRAL HEALTH CENTRE22MCH/HC . . . . . . . . . . . . . . . . 23PRIMARY HEALTH UNIT (PHU)24MOBILE CLINIC . . . . . . . . . . 25OTHER PUBLIC SECTOR
26
PRIVATE MEDICAL SECTORPRIVATE HOSPITAL/
CLINIC . . . . . . . . . . . . . 31OTHER PRIVATE
MEDICAL SECTOR
36
OTHER 96
445YES . . . . . . . . . . . . . . . . . . . . . 1NO . . . . . . . . . . . . . . . . . . . . . 2
(SKIP TO 457)DON'T KNOW . . . . . . . . . . . . . 8
How long after delivery did that check take place?
IF LESS THAN ONE HOUR RECORD '00'; IF LESS THAN ONE DAY,RECORD HOURS;IF LESS THAN ONE WEEK,RECORD DAYS.
I would like to talk to you about checks on (NAME)’s health after you left (FACILITY IN 430). Did any health care provider or a traditional birth attendant check on (NAME)’s health in the six weeks after you left (FACILITY IN 430)?
PROBE TO IDENTIFY THE TYPE OF SOURCE.
IF UNABLE TO DETERMINE IF PUBLIC OR PRIVATE SECTOR, WRITE THE NAME OF THE PLACE.
(NAME OF PLACE)
(SPECIFY)
(SPECIFY)
Who checked on your health at that time?
PROBE FOR MOST QUALIFIED PERSON.
(SPECIFY)
Where did the check take place?
(SPECIFY)
Now I want to talk to you about what happened after you left the facility. Did anyone check on your health after you left the facility?
W-24
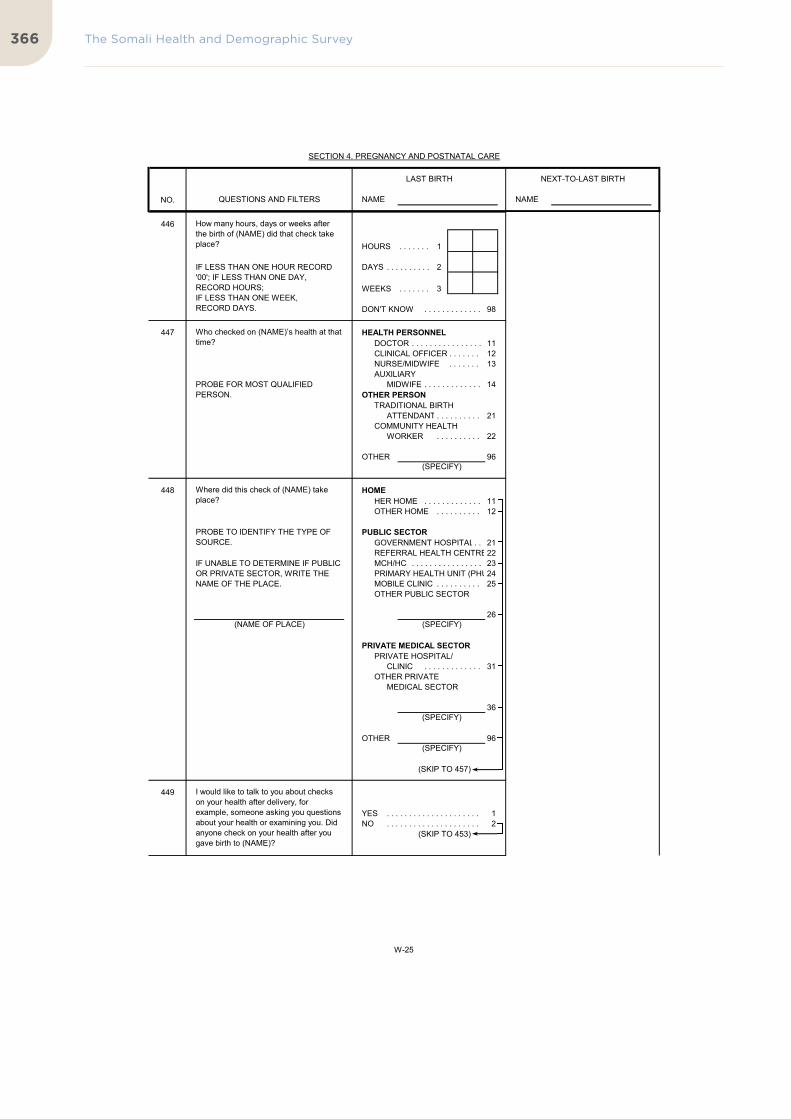
The Somali Health and Demographic Survey366
NO. QUESTIONS AND FILTERS NAME NAME
SECTION 4. PREGNANCY AND POSTNATAL CARE
LAST BIRTH NEXT-TO-LAST BIRTH
446
HOURS . . . . . . . 1
DAYS . . . . . . . . . . 2
WEEKS . . . . . . . 3
DON'T KNOW . . . . . . . . . . . . . 98
447 HEALTH PERSONNELDOCTOR . . . . . . . . . . . . . . . . 11CLINICAL OFFICER . . . . . . . 12NURSE/MIDWIFE . . . . . . . 13AUXILIARY
MIDWIFE . . . . . . . . . . . . . 14OTHER PERSON
TRADITIONAL BIRTHATTENDANT . . . . . . . . . . 21
COMMUNITY HEALTHWORKER . . . . . . . . . . 22
OTHER 96
448 HOMEHER HOME . . . . . . . . . . . . . 11OTHER HOME . . . . . . . . . . 12
PUBLIC SECTORGOVERNMENT HOSPITAL. . 21REFERRAL HEALTH CENTRE22MCH/HC . . . . . . . . . . . . . . . . 23PRIMARY HEALTH UNIT (PHU)24MOBILE CLINIC . . . . . . . . . . 25OTHER PUBLIC SECTOR
26
PRIVATE MEDICAL SECTORPRIVATE HOSPITAL/
CLINIC . . . . . . . . . . . . . 31OTHER PRIVATE
MEDICAL SECTOR
36
OTHER 96
(SKIP TO 457)
449
YES . . . . . . . . . . . . . . . . . . . . . 1NO . . . . . . . . . . . . . . . . . . . . . 2
(SKIP TO 453)
(SPECIFY)
I would like to talk to you about checks on your health after delivery, for example, someone asking you questions about your health or examining you. Did anyone check on your health after you gave birth to (NAME)?
Where did this check of (NAME) take place?
PROBE TO IDENTIFY THE TYPE OF SOURCE.
IF UNABLE TO DETERMINE IF PUBLIC OR PRIVATE SECTOR, WRITE THE NAME OF THE PLACE.
(NAME OF PLACE)
(SPECIFY)
Who checked on (NAME)’s health at that time?
PROBE FOR MOST QUALIFIED PERSON.
(SPECIFY)
(SPECIFY)
How many hours, days or weeks after the birth of (NAME) did that check take place?
IF LESS THAN ONE HOUR RECORD '00'; IF LESS THAN ONE DAY,RECORD HOURS;IF LESS THAN ONE WEEK,RECORD DAYS.
W-25

367
NO. QUESTIONS AND FILTERS NAME NAME
SECTION 4. PREGNANCY AND POSTNATAL CARE
LAST BIRTH NEXT-TO-LAST BIRTH
450HOURS . . . . . . . 1
DAYS . . . . . . . . . . 2
WEEKS . . . . . . . 3
DON'T KNOW . . . . . . . . . . . . . 98
451 HEALTH PERSONNELDOCTOR . . . . . . . . . . . . . . . . 11CLINICAL OFFICER . . . . . . . 12NURSE/MIDWIFE . . . . . . . 13AUXILIARY
MIDWIFE . . . . . . . . . . . . . 14OTHER PERSON
TRADITIONAL BIRTHATTENDANT . . . . . . . . . . 21
COMMUNITY HEALTHWORKER . . . . . . . . . . 22
OTHER 96
452 HOMEHER HOME . . . . . . . . . . . . . 11OTHER HOME . . . . . . . . . . 12
PUBLIC SECTORGOVERNMENT HOSPITAL. . 21REFERRAL HEALTH CENTRE22MCH/HC . . . . . . . . . . . . . . . . 23PRIMARY HEALTH UNIT (PHU)24MOBILE CLINIC . . . . . . . . . . 25OTHER PUBLIC SECTOR
26
PRIVATE MEDICAL SECTORPRIVATE HOSPITAL/
CLINIC . . . . . . . . . . . . . 31OTHER PRIVATE
MEDICAL SECTOR
36
OTHER 96
453
YES . . . . . . . . . . . . . . . . . . . . . 1NO . . . . . . . . . . . . . . . . . . . . . 2
(SKIP TO 457)DON'T KNOW . . . . . . . . . . . . . 8
(SPECIFY)
(SPECIFY)
I would like to talk to you about checks on (NAME)’s health after delivery – for example, someone examining (NAME), checking the cord, or seeing if (NAME) is OK. In the six weeks after (NAME) was born, did any health care provider or a traditional birth attendant check on (NAME)'s health?
(SPECIFY)
Where did this first check take place?
PROBE TO IDENTIFY THE TYPE OF SOURCE.
IF UNABLE TO DETERMINE IF PUBLIC OR PRIVATE SECTOR, WRITE THE NAME OF THE PLACE.
(NAME OF PLACE)(SPECIFY)
Who checked on your health at that time?
PROBE FOR MOST QUALIFIED PERSON.
How long after delivery did the first check take place?
IF LESS THAN ONE HOUR RECORD '00'; IF LESS THAN ONE DAY,RECORD HOURS;IF LESS THAN ONE WEEK,RECORD DAYS.
W-26

The Somali Health and Demographic Survey368
NO. QUESTIONS AND FILTERS NAME NAME
SECTION 4. PREGNANCY AND POSTNATAL CARE
LAST BIRTH NEXT-TO-LAST BIRTH
454 HOURS AFTERBIRTH . . . . . 1
DAYS AFTER BIRTH . . . . . 2
WEEKS AFTERBIRTH . . . . . 3
DON'T KNOW . . . . . . . . . . . . . 98
455 HEALTH PERSONNELDOCTOR . . . . . . . . . . . . . . . . 11CLINICAL OFFICER . . . . . . . 12NURSE/MIDWIFE . . . . . . . 13
PROBE FOR MOST QUALIFIED PERSON AUXILIARY MIDWIFE . . . . . 14OTHER PERSON
TRADITIONAL BIRTHATTENDANT . . . . . . . . . . 21
COMMUNITY HEALTHWORKER . . . . . . . . . . 22
OTHER 96
456 HOMEHER HOME . . . . . . . . . . . . . 11OTHER HOME . . . . . . . . . . 12
PUBLIC SECTORGOVERNMENT HOSPITAL. . 21REFERRAL HEALTH CENTRE22MCH/HC . . . . . . . . . . . . . . . . 23PRIMARY HEALTH UNIT (PHU)24MOBILE CLINIC . . . . . . . . . . 25OTHER PUBLIC SECTOR
26
PRIVATE MEDICAL SECTORPRIVATE HOSPITAL/
CLINIC . . . . . . . . . . . . . 31OTHER PRIVATE
MEDICAL SECTOR
36
OTHER 96
(SPECIFY)
(SPECIFY)
SPECIFY
(SPECIFY)
Where did this first check of (NAME) take place?
PROBE TO IDENTIFY THE TYPE OF SOURCE.
IF UNABLE TO DETERMINE IF PUBLIC OR PRIVATE SECTOR, WRITE THE NAME OF THE PLACE.
(NAME OF PLACE)
Who checked on (NAME)'s health at that time?
How many hours, days or weeks after the birth of (NAME) did the first check take place?IF LESS THAN ONE HOUR RECORD '00'; IF LESS THAN ONE DAY,RECORD HOURS;IF LESS THAN ONE WEEK,RECORD DAYS.
W-27

369
NO. QUESTIONS AND FILTERS NAME NAME
SECTION 4. PREGNANCY AND POSTNATAL CARE
LAST BIRTH NEXT-TO-LAST BIRTH
457
YES NO DK
a) a) CORD . . . . . . . 1 2 8b) b) CHILD TEMP.. . 1 2 8
c) c) SIGNS . . . . . 1 2 8
d) d) COUNSELBREAST-FEED . . . . . 1 2 8
e) e) OBSERVEBREAST-FEED . . . . . 1 2 8
f) f) MOTH TEMP.. . 1 2 8
g) g) COUNSEL FP . . 1 2 8
458 YES . . . . . . . . . . . . . . . . . . . . . 1(SKIP TO 460)
NO . . . . . . . . . . . . . . . . . . . . . 2(SKIP TO 461)
459 YES . . . . . . . . . . . . . . . . . . . . . 1NO . . . . . . . . . . . . . . . . . . . . . 2
(SKIP TO 461)
460MONTHS . . . . . . . . . . MONTHS . . . . . . . . . .
DON'T KNOW . . . . . . . . . . . . . 98 DON'T KNOW . . . . . . . . . . . . . 98
461MONTHS . . . . . . . . . . MONTHS . . . . . . . . . .
NOT STARTED . . . . . . . . . . . . . 95 NOT STARTED . . . . . . . . . . . . . 95DON'T KNOW . . . . . . . . . . . . . 98 DON'T KNOW . . . . . . . . . . . . . 98NO RESPONSE . . . . . . . . . . . . . 99 NO RESPONSE . . . . . . . . . . . . . 99
462 YES . . . . . . . . . . . . . . . . . . . . . 1 YES . . . . . . . . . . . . . . . . . . . . . 1(SKIP TO 464)
NO . . . . . . . . . . . . . . . . . . . . . 2 NO . . . . . . . . . . . . . . . . . . . . . 2
463 LIVING DEAD
(SKIP TO 468) (SKIP TO 469)
464
IMMEDIATELY . . . . . . . . . . . . . 00
HOURS . . . . . . . 1
DAYS . . . . . . . 2
465 YES . . . . . . . . . . . . . . . . . . . . . 1NO . . . . . . . . . . . . . . . . . . . . . 2
IF LESS THAN 1 HOUR,RECORD ‘00' HOURS;IF LESS THAN 24 HOURS,RECORD HOURS;OTHERWISE, RECORD DAYS.
In the first three days after delivery, was (NAME) given anything to drink other than breast milk?
For how many months after the birth of (NAME) did you start seeing your husband?
Did you ever breastfeed (NAME)?
CHECK 404: IS CHILD LIVING?
How long after birth did you first put (NAME) to the breast?
Counsel you on danger signs for newborns?Counsel you on breastfeeding?
Observe (NAME) breastfeeding?
Has your menstrual period returned since the birth of (NAME)?
Did your period return between the birth of (NAME) and your next pregnancy?
For how many months after the birth of (NAME) did you not have a period?
During the first two days after (NAME)’s birth, did any health care provider do the following:
Examine the cord?
Counsel you on birth spacing?
Measure (NAME)’s temperature?
Checked the mother's temperature?
W-28

The Somali Health and Demographic Survey370
NO. QUESTIONS AND FILTERS NAME NAME
SECTION 4. PREGNANCY AND POSTNATAL CARE
LAST BIRTH NEXT-TO-LAST BIRTH
466 LIVING DEAD LIVING DEAD
(SKIP TO 468) (SKIP TO 468)
467 YES . . . . . . . . . . . . . . . . . . . . . 1NO . . . . . . . . . . . . . . . . . . . . . 2
468 YES . . . . . . . . . . . . . . . . . . . . . 1 YES . . . . . . . . . . . . . . . . . . . . . 1NO . . . . . . . . . . . . . . . . . . . . . 2 NO . . . . . . . . . . . . . . . . . . . . . 2DON'T KNOW . . . . . . . . . . . . . 8 DON'T KNOW . . . . . . . . . . . . . 8
469 GO BACK TO 405 IN NEXT-TO-LAST COLUMN OF NEW QUESTIONNAIRE; OR, IF NO MORE BIRTHS, GO TO 501A.
CHECK 404: IS CHILD LIVING?
Are you still breastfeeding (NAME)?
Did (NAME) drink anything from a bottle with a nipple yesterday or last night?
GO BACK TO 405 IN NEXT COLUMN; OR, IF NO MORE BIRTHS, GO TO 501A.
W-29

371
NO.
501A
ONE OR MORE BIRTHS IN 2016-2019 NO BIRTHS IN 2016-2019
502A
BIRTH HISTORY NUMBER. . . . . . . . . .
503A
LIVING DEAD
504A YES, HAS ONLY A CARD . . . . . . . . . . . . . . . . . . . 1 507AYES, HAS ONLY AN OTHER DOCUMENT . . . . . 2YES, HAS CARD AND OTHER DOCUMENT . . . . . 3 507ANO, NO CARD AND NO OTHER DOCUMENT . . 4
505A YES . . . . . . . . . . . . . . . . . . . . . . . . . . . . . . . . . . . 1NO . . . . . . . . . . . . . . . . . . . . . . . . . . . . . . . . . . . 2
506A
CODE '2' CIRCLED CODE '4' CIRCLED
507A YES, ONLY CARD SEEN . . . . . . . . . . . . . . . . . . . 1YES, ONLY OTHER DOCUMENT SEEN . . . . . . . 2YES, CARD AND OTHER DOCUMENT SEEN . . 3NO CARD AND NO OTHER DOCUMENT SEEN . . 4 511A
511A
CHECK 504A:
CHECK 216 FOR CHILD:
May I see the card or other document where (NAME)'s vaccinations are written down?
NAME OF LAST BIRTH
Do you have a card or other document where (NAME)'s vaccinations are written down?
Did you ever have a vaccination card for (NAME)?
501B
SECTION 5A. CHILD IMMUNIZATION (LAST BIRTH)
QUESTIONS AND FILTERS CODING CATEGORIES SKIP
CHECK 215 IN THE BIRTH HISTORY: ANY BIRTHS IN 2016-2019?
601
RECORD THE NAME AND BIRTH HISTORY NUMBER FROM 212 OF THE LAST CHILD BORN IN 2016-2019.
W-30

The Somali Health and Demographic Survey372
NO.
BIRTH HISTORY NUMBER. . . . . . . . . .
508A
509A
NO YES
510AYES . . . . . . . . . . . . . . . . . . . . . . . . . . . . . . . . . . . 1
(THEN SKIP TO 520A)
NO . . . . . . . . . . . . . . . . . . . . . . . . . . . . . . . . . . . 2DON'T KNOW . . . . . . . . . . . . . . . . . . . . . . . . . . . 8
CHECK 508A: 'BCG' TO 'MEASLES' ALL RECORDED?
MEASLES
VITAMIN A (MOST RECENT)
DPT-HEP.B-HIB (PENTAVALENT) 2
DPT-HEP.B-HIB (PENTAVALENT) 3
In addition to what is recorded on (this document/these documents), did (NAME) receive any other vaccinations, including vaccinations received in campaigns or immunization days or child health days?
(PROBE FOR VACCINATIONS AND WRITE ‘66' IN THE CORRESPONDING DAY COLUMN IN 508A
THEN WRITE '00' IN THE CORRESPONDING DAY COLUMN FOR ALL VACCINATIONS NOT
GIVEN)
RECORD 'YES' ONLY IF THE RESPONDENT MENTIONS AT LEAST ONE OF THE VACCINATIONS IN 508A THAT ARE NOT RECORDED AS HAVING BEEN GIVEN.
520A
(WRITE '00' IN THE CORRESPONDING DAY COLUMN FOR ALL VACCINATIONS NOT GIVEN)
(THEN SKIP TO 520A)
DPT-HEP.B-HIB (PENTAVALENT) 1
CODING CATEGORIES SKIP
NAME OF LAST BIRTH
SECTION 5A. CHILD IMMUNIZATION (LAST BIRTH)
QUESTIONS AND FILTERS
COPY DATES FROM THE CARD.
DAY MONTH YEAR
BCG
ORAL POLIO VACCINE (OPV)/IPV 0 (BIRTH DOSE)
ORAL POLIO VACCINE (OPV)/IPV 3
ORAL POLIO VACCINE (OPV)/IPV 1
ORAL POLIO VACCINE (OPV)/IPV 2
WRITE ‘44' IN ‘DAY' COLUMN IF CARD SHOWS THAT A DOSE WAS GIVEN, BUT NO DATE IS RECORDED.
W-31

373
NO.
BIRTH HISTORY NUMBER. . . . . . . . . .
CODING CATEGORIES SKIP
NAME OF LAST BIRTH
SECTION 5A. CHILD IMMUNIZATION (LAST BIRTH)
QUESTIONS AND FILTERS
511A YES . . . . . . . . . . . . . . . . . . . . . . . . . . . . . . . . . . . 1NO . . . . . . . . . . . . . . . . . . . . . . . . . . . . . . . . . . . 2DON'T KNOW . . . . . . . . . . . . . . . . . . . . . . . . . . . 8
512A YES . . . . . . . . . . . . . . . . . . . . . . . . . . . . . . . . . . . 1NO . . . . . . . . . . . . . . . . . . . . . . . . . . . . . . . . . . . 2DON'T KNOW . . . . . . . . . . . . . . . . . . . . . . . . . . . 8
513A YES . . . . . . . . . . . . . . . . . . . . . . . . . . . . . . . . . . . 1NO . . . . . . . . . . . . . . . . . . . . . . . . . . . . . . . . . . . 2DON'T KNOW . . . . . . . . . . . . . . . . . . . . . . . . . . . 8
514A FIRST TWO WEEKS . . . . . . . . . . . . . . . . . . . . . 1LATER . . . . . . . . . . . . . . . . . . . . . . . . . . . . . . . . . 2
515ANUMBER OF TIMES . . . . . . . . . . . . . . . . . . . DON'T KNOW . . . . . . . . . . . . . . . . . . . . . . . . . . . 8
516A YES . . . . . . . . . . . . . . . . . . . . . . . . . . . . . . . . . . . 1NO . . . . . . . . . . . . . . . . . . . . . . . . . . . . . . . . . . . 2DON'T KNOW . . . . . . . . . . . . . . . . . . . . . . . . . . . 8
517ANUMBER OF TIMES . . . . . . . . . . . . . . . . . . . DON'T KNOW . . . . . . . . . . . . . . . . . . . . . . . . . . . 8
Did (NAME) ever receive any vaccinations to prevent (NAME) from getting diseases, including vaccinations received in campaigns or immunization days or child health days?
Has (NAME) ever received a BCG vaccination against tuberculosis, that is, an injection in the arm or shoulder that usually causes a scar?
518A
Has (NAME) ever received oral polio vaccine, that is, about two drops in the mouth to prevent polio or IPV, that is an injection on the arm to prevent polio?
Did (NAME) receive the first oral polio or IPV vaccine in the first two weeks after birth or later?
How many times did (NAME) receive the oral polio or IPV vaccine?
Has (NAME) ever received a pentavalent vaccination, that is, an injection given in the thigh sometimes at the same time as polio drops?
516A
520A
How many times did (NAME) receive the pentavalent vaccine?
W-32

The Somali Health and Demographic Survey374
NO.
BIRTH HISTORY NUMBER. . . . . . . . . .
CODING CATEGORIES SKIP
NAME OF LAST BIRTH
SECTION 5A. CHILD IMMUNIZATION (LAST BIRTH)
QUESTIONS AND FILTERS
518A YES . . . . . . . . . . . . . . . . . . . . . . . . . . . . . . . . . . . 1NO . . . . . . . . . . . . . . . . . . . . . . . . . . . . . . . . . . . 2DON'T KNOW . . . . . . . . . . . . . . . . . . . . . . . . . . . 8
519ANUMBER OF TIMES . . . . . . . . . . . . . . . . . . . DON'T KNOW . . . . . . . . . . . . . . . . . . . . . . . . . . . 8
520A YES NO DK
a) a) [POWDER/BUSICUIT] . . . . . . . 1 2 8
b) b) [PLUMPY'NUT] . . . . . . . . . . . . . 1 2 8
c) c) [PLUMPY'DOZ] . . . . . . . . . . . . . 1 2 8
521A
How many times did (NAME) receive the measles vaccine?
[LOCAL NAME FOR MULTIPLE MICRONUTRIENT POWDER]?
520A
CONTINUE WITH 501B.
[LOCAL NAME FOR READY TO USE SUPPLEMENTAL FOOD]?
[LOCAL NAME FOR READY TO USE THERAPEUTIC FOOD SUCH AS PLUMPY'NUT]?
In the last 7 days was (NAME) given:
Has (NAME) ever received a measles vaccination, that is, an injection in the arm to prevent measles?
W-33

375
NO.
501B
MORE BIRTHS IN 2016-2019 NO MORE BIRTHS IN 2016-2019
502B
BIRTH HISTORY NUMBER. . . . . . . . . .
503B
LIVING DEAD
504B YES, HAS ONLY A CARD . . . . . . . . . . . . . . . . . . . 1 507BYES, HAS ONLY AN OTHER DOCUMENT . . . . . 2YES, HAS CARD AND OTHER DOCUMENT . . . . . 3 507BNO, NO CARD AND NO OTHER DOCUMENT . . 4
505B YES . . . . . . . . . . . . . . . . . . . . . . . . . . . . . . . . . . . 1NO . . . . . . . . . . . . . . . . . . . . . . . . . . . . . . . . . . . 2
506B
CODE '2' CIRCLED CODE '4' CIRCLED
507B YES, ONLY CARD SEEN . . . . . . . . . . . . . . . . . . . 1YES, ONLY OTHER DOCUMENT SEEN . . . . . . . 2YES, CARD AND OTHER DOCUMENT SEEN . . 3NO CARD AND NO OTHER DOCUMENT SEEN . . 4 511B
601
SECTION 5B. CHILD IMMUNIZATION (NEXT-TO-LAST BIRTH)
QUESTIONS AND FILTERS CODING CATEGORIES SKIP
CHECK 215 IN THE BIRTH HISTORY: ANY MORE BIRTHS IN 2016-2019?
CHECK 504B:
RECORD THE NAME AND BIRTH HISTORY NUMBER FROM 212 OF THE NEXT-TO-LAST CHILD BORN IN 2016-2019.
521B
Do you have a card or other document where (NAME)'s vaccinations are written down?
Did you ever have a vaccination card for (NAME)?
NAME OF NEXT-TO-LAST BIRTH
CHECK 216 FOR CHILD:
511B
May I see the card or other document where (NAME)'s vaccinations are written down?
W-34

The Somali Health and Demographic Survey376
NO.
BIRTH HISTORY NUMBER. . . . . . . . . .
508B
509B
NO YES
510BYES . . . . . . . . . . . . . . . . . . . . . . . . . . . . . . . . . . . 1
(THEN SKIP TO 520B)
NO . . . . . . . . . . . . . . . . . . . . . . . . . . . . . . . . . . . 2DON'T KNOW . . . . . . . . . . . . . . . . . . . . . . . . . . . 8
NAME OF NEXT-TO-LAST BIRTH
SECTION 5B. CHILD IMMUNIZATION (NEXT-TO-LAST BIRTH)
QUESTIONS AND FILTERS CODING CATEGORIES SKIP
ORAL POLIO VACCINE (OPV)/IPV 3
COPY DATES FROM THE CARD.WRITE ‘44' IN ‘DAY' COLUMN IF CARD SHOWS THAT A DOSE WAS GIVEN, BUT NO DATE IS RECORDED.
DAY MONTH YEAR
BCG
ORAL POLIO VACCINE (OPV)/IPV 0 (BIRTH DOSE)
ORAL POLIO VACCINE (OPV)/IPV 1
ORAL POLIO VACCINE (OPV)/IPV 2
VITAMIN A (MOST RECENT)
DPT-HEP.B-HIB (PENTAVALENT) 1
DPT-HEP.B-HIB (PENTAVALENT) 2
DPT-HEP.B-HIB (PENTAVALENT) 3
MEASLES
CHECK 508B: 'BCG' TO 'MEASLES' ALL RECORDED?
520B
In addition to what is recorded on (this document/these documents), did (NAME) receive any other vaccinations, including vaccinations received in campaigns or immunization days or child health days?
(PROBE FOR VACCINATIONS AND WRITE ‘66' IN THE CORRESPONDING DAY COLUMN IN 508B
THEN WRITE '00' IN THE CORRESPONDING DAY COLUMN FOR ALL VACCINATIONS NOT
GIVEN)
RECORD 'YES' ONLY IF THE RESPONDENT MENTIONS AT LEAST ONE OF THE VACCINATIONS IN 508B THAT ARE NOT RECORDED AS HAVING BEEN GIVEN.
(WRITE '00' IN THE CORRESPONDING DAY COLUMN FOR ALL VACCINATIONS NOT GIVEN)
(THEN SKIP TO 520B)
W-35

377
NO.
BIRTH HISTORY NUMBER. . . . . . . . . . NAME OF NEXT-TO-LAST BIRTH
SECTION 5B. CHILD IMMUNIZATION (NEXT-TO-LAST BIRTH)
QUESTIONS AND FILTERS CODING CATEGORIES SKIP
511B YES . . . . . . . . . . . . . . . . . . . . . . . . . . . . . . . . . . . 1NO . . . . . . . . . . . . . . . . . . . . . . . . . . . . . . . . . . . 2DON'T KNOW . . . . . . . . . . . . . . . . . . . . . . . . . . . 8
512B YES . . . . . . . . . . . . . . . . . . . . . . . . . . . . . . . . . . . 1NO . . . . . . . . . . . . . . . . . . . . . . . . . . . . . . . . . . . 2DON'T KNOW . . . . . . . . . . . . . . . . . . . . . . . . . . . 8
513B YES . . . . . . . . . . . . . . . . . . . . . . . . . . . . . . . . . . . 1NO . . . . . . . . . . . . . . . . . . . . . . . . . . . . . . . . . . . 2DON'T KNOW . . . . . . . . . . . . . . . . . . . . . . . . . . . 8
514B FIRST TWO WEEKS . . . . . . . . . . . . . . . . . . . . . 1LATER . . . . . . . . . . . . . . . . . . . . . . . . . . . . . . . . . 2
515BNUMBER OF TIMES . . . . . . . . . . . . . . . . . . . DON'T KNOW . . . . . . . . . . . . . . . . . . . . . . . . . . . 8
516B YES . . . . . . . . . . . . . . . . . . . . . . . . . . . . . . . . . . . 1NO . . . . . . . . . . . . . . . . . . . . . . . . . . . . . . . . . . . 2DON'T KNOW . . . . . . . . . . . . . . . . . . . . . . . . . . . 8
517BNUMBER OF TIMES . . . . . . . . . . . . . . . . . . . DON'T KNOW . . . . . . . . . . . . . . . . . . . . . . . . . . . 8
Did (NAME) ever receive any vaccinations to prevent (NAME) from getting diseases, including vaccinations received in campaigns or immunization days or child health days?
520B
Has (NAME) ever received a BCG vaccination against tuberculosis, that is, an injection in the arm or shoulder that usually causes a scar?
Has (NAME) ever received oral polio vaccine, that is, about two drops in the mouth to prevent polio or IPV, that is an injection on the arm to prevent polio?+B188 516B
Did (NAME) receive the first oral polio or IPV vaccine in the first two weeks after birth or later?
How many times did (NAME) receive the oral polio or IPV vaccine?
Has (NAME) ever received a pentavalent vaccination, that is, an injection given in the thigh sometimes at the same time as polio drops? 518B
How many times did (NAME) receive the pentavalent vaccine?
W-36

The Somali Health and Demographic Survey378
NO.
BIRTH HISTORY NUMBER. . . . . . . . . . NAME OF NEXT-TO-LAST BIRTH
SECTION 5B. CHILD IMMUNIZATION (NEXT-TO-LAST BIRTH)
QUESTIONS AND FILTERS CODING CATEGORIES SKIP
518B YES . . . . . . . . . . . . . . . . . . . . . . . . . . . . . . . . . . . 1NO . . . . . . . . . . . . . . . . . . . . . . . . . . . . . . . . . . . 2DON'T KNOW . . . . . . . . . . . . . . . . . . . . . . . . . . . 8
519BNUMBER OF TIMES . . . . . . . . . . . . . . . . . . . DON'T KNOW . . . . . . . . . . . . . . . . . . . . . . . . . . . 8
520B YES NO DK
a) a) [POWDER] . . . . . . . . . . . . . . . . 1 2 8
b) b) [PLUMPY'NUT] . . . . . . . . . . . . . 1 2 8
c) c) [PLUMPY'DOZ] . . . . . . . . . . . . . 1 2 8
521B
601
Has (NAME) ever received a measles vaccination, that is, an injection in the arm to prevent measles?
520B
CHECK 215 IN BIRTH HISTORY: ANY MORE BIRTHS IN 2016-2019?
MORE BIRTHS IN 2016-2019
NO MORE BIRTHS IN 2016-2019
(GO TO 502B IN AN ADDITIONAL
QUESTIONNAIRE)
How many times did (NAME) receive the measles vaccine?
In the last 7 days was (NAME) given:
[LOCAL NAME FOR MULTIPLE MICRONUTRIENT POWDER/BUSCUIT]?
[LOCAL NAME FOR READY TO USE THERAPEUTIC FOOD SUCH AS PLUMPY'NUT]?
[LOCAL NAME FOR READY TO USE SUPPLEMENTAL FOOD SUCH AS PLUMPY'DOZ]?
W-37

379
601
602
603BIRTH BIRTHHISTORY HISTORYNUMBER . . . . . . . . . . NUMBER . . . . . . . . . .
604
LIVING DEAD LIVING DEAD
(SKIP TO 646) (SKIP TO 646)
605YES . . . . . . . . . . . . . . . . . . . . . 1 YES . . . . . . . . . . . . . . . . . . . . . 1NO . . . . . . . . . . . . . . . . . . . . . 2 NO . . . . . . . . . . . . . . . . . . . . . 2DON'T KNOW . . . . . . . . . . . . . 8 DON'T KNOW . . . . . . . . . . . . . 8
606YES . . . . . . . . . . . . . . . . . . . . . 1 YES . . . . . . . . . . . . . . . . . . . . . 1NO . . . . . . . . . . . . . . . . . . . . . 2 NO . . . . . . . . . . . . . . . . . . . . . 2DON'T KNOW . . . . . . . . . . . . . 8 DON'T KNOW . . . . . . . . . . . . . 8
607 YES . . . . . . . . . . . . . . . . . . . . . 1 YES . . . . . . . . . . . . . . . . . . . . . 1NO . . . . . . . . . . . . . . . . . . . . . 2 NO . . . . . . . . . . . . . . . . . . . . . 2DON'T KNOW . . . . . . . . . . . . . 8 DON'T KNOW . . . . . . . . . . . . . 8
608 YES . . . . . . . . . . . . . . . . . . . . . 1 YES . . . . . . . . . . . . . . . . . . . . . 1NO . . . . . . . . . . . . . . . . . . . . . 2 NO . . . . . . . . . . . . . . . . . . . . . 2
(SKIP TO 618) (SKIP TO 618)DON'T KNOW . . . . . . . . . . . . . 8 DON'T KNOW . . . . . . . . . . . . . 8
Was (NAME) given any drug for intestinal worms in the last six months?
SHOW COMMON TYPES OF AMPULES/CAPSULES/SYRUPS.
In the last six months, was (NAME) given a vitamin A dose like [this/any of these]?
In the last seven days, was (NAME) given iron pills, sprinkles with iron, or iron syrup like [this/any of these]?
Has (NAME) had diarrhea in the last 2 weeks?
SECTION 6. CHILD HEALTH AND NUTRITION
CHECK 224:
Now I would like to ask some questions about your children born in the last five years. (We will talk about each separately)
BIRTH HISTORY NUMBER FROM 212 IN BIRTH HISTORY.
NAME NAMEFROM 212 AND 216:
CHECK 215: RECORD THE BIRTH HISTORY NUMBER IN 603 AND THE NAME AND SURVIVAL STATUS IN 604 FOR EACH BIRTH IN 2014-2019. ASK THE QUESTIONS ABOUT ALL OF THESE BIRTHS. BEGIN WITH THE LAST BIRTH.IF THERE ARE MORE THAN 2 BIRTHS, USE LAST COLUMN OF ADDITIONAL QUESTIONNAIRE(S).
NEXT-TO-LAST BIRTHLAST BIRTH
ONE OR MORE BIRTHS IN 2014-2019
NO BIRTHS IN 2014-2019 648
SHOW COMMON TYPES OF PILLS/SPRINKLES/SYRUPS.
W-38

The Somali Health and Demographic Survey380
NO.
609
YES
a) b)
MUCH LESS . . . . . . . . . . . . . . . . 1 MUCH LESS . . . . . . . . . . . . . . . . 1SOMEWHAT LESS . . . . . . . . . . 2 SOMEWHAT LESS . . . . . . . . . . 2ABOUT THE SAME . . . . . . . . . . 3 ABOUT THE SAME . . . . . . . . . . 3MORE . . . . . . . . . . . . . . . . . . . 4 MORE . . . . . . . . . . . . . . . . . . . 4NOTHING TO DRINK . . . . . . . 5 NOTHING TO DRINK . . . . . . . 5DON'T KNOW . . . . . . . . . . . . . 8 DON'T KNOW . . . . . . . . . . . . . 8
610 MUCH LESS . . . . . . . . . . . . . . . . 1 MUCH LESS . . . . . . . . . . . . . . . . 1SOMEWHAT LESS . . . . . . . . . . 2 SOMEWHAT LESS . . . . . . . . . . 2ABOUT THE SAME . . . . . . . . . . 3 ABOUT THE SAME . . . . . . . . . . 3MORE . . . . . . . . . . . . . . . . . . . 4 MORE . . . . . . . . . . . . . . . . . . . 4STOPPED FOOD . . . . . . . . . . 5 STOPPED FOOD . . . . . . . . . . 5NEVER GAVE FOOD . . . . . . . 6 NEVER GAVE FOOD . . . . . . . 6DON'T KNOW . . . . . . . . . . . . . 8 DON'T KNOW . . . . . . . . . . . . . 8
611 YES . . . . . . . . . . . . . . . . . . . . . 1 YES . . . . . . . . . . . . . . . . . . . . . 1NO . . . . . . . . . . . . . . . . . . . . . 2 NO . . . . . . . . . . . . . . . . . . . . . 2
(SKIP TO 615) (SKIP TO 615)
When (NAME) had diarrhea, was (NAME) given less than usual to eat, about the same amount, more than usual, or nothing to eat?
IF LESS, PROBE: Was (NAME) given much less than usual to eat or somewhat less?
Did you seek advice or treatment for the diarrhea from any source?
Now I would like to know how much (NAME) was given to drink during the diarrhea including breastmilk. Was (NAME) given less than usual to drink, about the same amount, or more than usual to drink?
IF LESS, PROBE: Was (NAME) given much less than usual to drink or somewhat less?
Now I would like to know how much (NAME) was given to drink during the diarrhea. Was (NAME) given less than usual to drink, about the same amount, or more than usual to drink?
IF LESS, PROBE: Was (NAME) given much less than usual to drink or somewhat less?
SECTION 6. CHILD HEALTH AND NUTRITION
LAST BIRTH NEXT-TO-LAST BIRTH
QUESTIONS AND FILTERS NAME NAME
CHECK 467: CURRENTLY BREASTFEEDING?
NO/ NOT ASKED
W-39
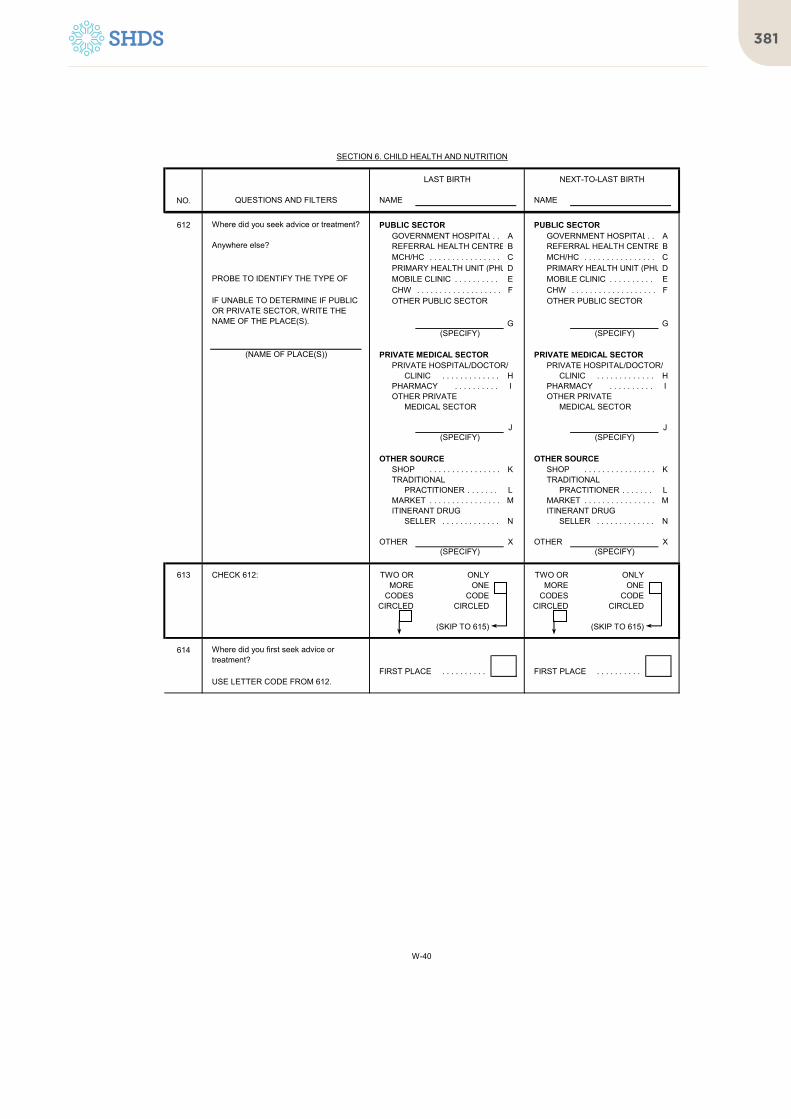
381
NO.
SECTION 6. CHILD HEALTH AND NUTRITION
LAST BIRTH NEXT-TO-LAST BIRTH
QUESTIONS AND FILTERS NAME NAME
612 PUBLIC SECTOR PUBLIC SECTORGOVERNMENT HOSPITAL. . A GOVERNMENT HOSPITAL. . AREFERRAL HEALTH CENTRE B REFERRAL HEALTH CENTRE BMCH/HC . . . . . . . . . . . . . . . . C MCH/HC . . . . . . . . . . . . . . . . CPRIMARY HEALTH UNIT (PHU)D PRIMARY HEALTH UNIT (PHU)DMOBILE CLINIC . . . . . . . . . . E MOBILE CLINIC . . . . . . . . . . ECHW . . . . . . . . . . . . . . . . . . . F CHW . . . . . . . . . . . . . . . . . . . FOTHER PUBLIC SECTOR OTHER PUBLIC SECTOR
G G
PRIVATE MEDICAL SECTOR PRIVATE MEDICAL SECTORPRIVATE HOSPITAL/DOCTOR/ PRIVATE HOSPITAL/DOCTOR/
CLINIC . . . . . . . . . . . . . H CLINIC . . . . . . . . . . . . . HPHARMACY . . . . . . . . . . I PHARMACY . . . . . . . . . . IOTHER PRIVATE OTHER PRIVATE
MEDICAL SECTOR MEDICAL SECTOR
J J
OTHER SOURCE OTHER SOURCESHOP . . . . . . . . . . . . . . . . K SHOP . . . . . . . . . . . . . . . . KTRADITIONAL TRADITIONAL
PRACTITIONER . . . . . . . L PRACTITIONER . . . . . . . LMARKET . . . . . . . . . . . . . . . . M MARKET . . . . . . . . . . . . . . . . MITINERANT DRUG ITINERANT DRUG
SELLER . . . . . . . . . . . . . N SELLER . . . . . . . . . . . . . N
OTHER X OTHER X
613 TWO OR ONLY TWO OR ONLYMORE ONE MORE ONE
CODES CODE CODES CODECIRCLED CIRCLED CIRCLED CIRCLED
(SKIP TO 615) (SKIP TO 615)
614
FIRST PLACE . . . . . . . . . . FIRST PLACE . . . . . . . . . .
Where did you seek advice or treatment?
Anywhere else?
PROBE TO IDENTIFY THE TYPE OF SOURCE.IF UNABLE TO DETERMINE IF PUBLIC OR PRIVATE SECTOR, WRITE THE NAME OF THE PLACE(S).
(NAME OF PLACE(S))
(SPECIFY)
(SPECIFY) (SPECIFY)
(SPECIFY)
CHECK 612:
USE LETTER CODE FROM 612.
Where did you first seek advice or treatment?
(SPECIFY) (SPECIFY)
W-40

The Somali Health and Demographic Survey382
NO.
SECTION 6. CHILD HEALTH AND NUTRITION
LAST BIRTH NEXT-TO-LAST BIRTH
QUESTIONS AND FILTERS NAME NAME
615
YES NO DK YES NO DK
a) a) FLUID FROM a) FLUID FROMORS ORSPACKET . . 1 2 8 PACKET . . 1 2 8
b) b) ORS LIQUID . . 1 2 8 b) ORS LIQUID . . 1 2 8c) c) HOMEMADE c) HOMEMADE
FLUID . . . . . 1 2 8 FLUID . . . . . 1 2 8d) d) ZINC . . . . . . . 1 2 8 d) ZINC . . . . . . . 1 2 8
616
ANY 'YES' ALL 'NO'OR 'DK'
a) b) YES . . . . . . . . . . . . . . . . . . . . . 1 YES . . . . . . . . . . . . . . . . . . . . . 1NO . . . . . . . . . . . . . . . . . . . . . 2 NO . . . . . . . . . . . . . . . . . . . . . 2
(SKIP TO 618) (SKIP TO 618)DON'T KNOW . . . . . . . . . . . . . 8 DON'T KNOW . . . . . . . . . . . . . 8
617 PILL OR SYRUP PILL OR SYRUPANTIBIOTIC . . . . . . . . . . . . . A ANTIBIOTIC . . . . . . . . . . . . . A
ANY 'YES' ALL 'NO' ANTIMOTILITY . . . . . . . . . . B ANTIMOTILITY . . . . . . . . . . BOR 'DK' OTHER (NOT ANTIBIOTIC OTHER (NOT ANTIBIOTIC
a) b) OR ANTIMOTILITY) . . . . . C OR ANTIMOTILITY) . . . . . CUNKNOWN PILL UNKNOWN PILL
OR SYRUP . . . . . . . . . . D OR SYRUP . . . . . . . . . . D
INJECTION INJECTIONANTIBIOTIC . . . . . . . . . . . . . E ANTIBIOTIC . . . . . . . . . . . . . ENON-ANTIBIOTIC . . . . . . . F NON-ANTIBIOTIC . . . . . . . FUNKNOWN UNKNOWN
INJECTION . . . . . . . . . . G INJECTION . . . . . . . . . . G
(IV) INTRAVENOUS . . . . . . . . . . H (IV) INTRAVENOUS . . . . . . . . . . H
HOME REMEDY/ HOME REMEDY/HERBAL MEDICINE . . . . . . . I HERBAL MEDICINE . . . . . . . I
OTHER X OTHER X
618 YES . . . . . . . . . . . . . . . . . . . . . 1 YES . . . . . . . . . . . . . . . . . . . . . 1NO . . . . . . . . . . . . . . . . . . . . . 2 NO . . . . . . . . . . . . . . . . . . . . . 2
(SKIP TO 620) (SKIP TO 620)DON'T KNOW . . . . . . . . . . . . . 8 DON'T KNOW . . . . . . . . . . . . . 8
619 YES . . . . . . . . . . . . . . . . . . . . . 1 YES . . . . . . . . . . . . . . . . . . . . . 1NO . . . . . . . . . . . . . . . . . . . . . 2 NO . . . . . . . . . . . . . . . . . . . . . 2DON'T KNOW . . . . . . . . . . . . . 8 DON'T KNOW . . . . . . . . . . . . . 8
620 YES . . . . . . . . . . . . . . . . . . . . . 1 YES . . . . . . . . . . . . . . . . . . . . . 1NO . . . . . . . . . . . . . . . . . . . . . 2 NO . . . . . . . . . . . . . . . . . . . . . 2DON'T KNOW . . . . . . . . . . . . . 8 DON'T KNOW . . . . . . . . . . . . . 8
621 YES . . . . . . . . . . . . . . . . . . . . . 1 YES . . . . . . . . . . . . . . . . . . . . . 1NO . . . . . . . . . . . . . . . . . . . . . 2 NO . . . . . . . . . . . . . . . . . . . . . 2
(SKIP TO 623) (SKIP TO 623)DON'T KNOW . . . . . . . . . . . . . 8 DON'T KNOW . . . . . . . . . . . . . 8
Has (NAME) had an illness with a cough at any time in the last 2 weeks?
Has (NAME) had fast, short, rapid breaths or difficulty breathing at any time in the last 2 weeks?
A government-recommended homemade fluid?
Was anything given to treat the diarrhea?
RECORD ALL TREATMENTS GIVEN.
What was given to treat the diarrhea?
Anything else?
What else was given to treat the diarrhea?
Anything else?
A pre-packaged ORS liquid?
Zinc tablets or syrup?
(SPECIFY) (SPECIFY)
Has (NAME) been ill with a fever at any time in the last 2 weeks?
Was anything else given to treat the diarrhea?
At any time during the illness, did (NAME) have blood taken from (NAME)'s finger or heel for testing?
CHECK 615:
CHECK 615:
Was (NAME) given any of the following at any time since (NAME) started having the diarrhea:
A fluid made from a special packet called [LOCAL NAME FOR ORS PACKET]?
W-41

383
NO.
SECTION 6. CHILD HEALTH AND NUTRITION
LAST BIRTH NEXT-TO-LAST BIRTH
QUESTIONS AND FILTERS NAME NAME
622 CHEST ONLY . . . . . . . . . . . . . 1 CHEST ONLY . . . . . . . . . . . . . 1NOSE ONLY . . . . . . . . . . . . . . . . 2 NOSE ONLY . . . . . . . . . . . . . . . . 2BOTH . . . . . . . . . . . . . . . . . . . 3 BOTH . . . . . . . . . . . . . . . . . . . 3
OTHER 6 OTHER 6
DON'T KNOW . . . . . . . . . . . . . 8 DON'T KNOW . . . . . . . . . . . . . 8(SKIP TO 624) (SKIP TO 624)
623 YES NO OR DK YES NO OR DK
(SKIP TO 646) (SKIP TO 646)
624 YES . . . . . . . . . . . . . . . . . . . . . 1 YES . . . . . . . . . . . . . . . . . . . . . 1NO . . . . . . . . . . . . . . . . . . . . . 2 NO . . . . . . . . . . . . . . . . . . . . . 2
(SKIP TO 629) (SKIP TO 629)
625 PUBLIC SECTOR PUBLIC SECTORGOVERNMENT HOSPITAL. . A GOVERNMENT HOSPITAL. . AREFERRAL HEALTH CENTRE B REFERRAL HEALTH CENTRE BMCH/HC . . . . . . . . . . . . . . . . C MCH/HC . . . . . . . . . . . . . . . . CPRIMARY HEALTH UNIT (PHU)D PRIMARY HEALTH UNIT (PHU)DMOBILE CLINIC . . . . . . . . . . E MOBILE CLINIC . . . . . . . . . . ECHW . . . . . . . . . . . . . . . . . . . F CHW . . . . . . . . . . . . . . . . . . . FOTHER PUBLIC SECTOR OTHER PUBLIC SECTOR
G G
PRIVATE MEDICAL SECTOR PRIVATE MEDICAL SECTORPRIVATE HOSPITAL/DOCTOR/ PRIVATE HOSPITAL/DOCTOR/
CLINIC . . . . . . . . . . . . . H CLINIC . . . . . . . . . . . . . HPHARMACY . . . . . . . . . . I PHARMACY . . . . . . . . . . IOTHER PRIVATE OTHER PRIVATE
MEDICAL SECTOR MEDICAL SECTOR
J J
OTHER SOURCE OTHER SOURCESHOP . . . . . . . . . . . . . . . . K SHOP . . . . . . . . . . . . . . . . KTRADITIONAL TRADITIONAL
PRACTITIONER . . . . . . . L PRACTITIONER . . . . . . . LMARKET . . . . . . . . . . . . . . . . M MARKET . . . . . . . . . . . . . . . . MKORAN . . . . . . . . . . . . . . . . N KORAN . . . . . . . . . . . . . . . . N
OTHER X OTHER X
626 TWO OR ONLY TWO OR ONLYMORE ONE MORE ONE
CODES CODE CODES CODECIRCLED CIRCLED CIRCLED CIRCLED
(SKIP TO 628) (SKIP TO 628)
Where did you seek advice or treatment?
Anywhere else?
Did you seek advice or treatment for the illness from any source?
Was the fast or difficult breathing due to a problem in the chest or to a blocked or runny nose?
CHECK 618: HAD FEVER?
(SPECIFY) (SPECIFY)
(SPECIFY) (SPECIFY)
(SPECIFY) (SPECIFY)
(SPECIFY) (SPECIFY)
IF UNABLE TO DETERMINE IF PUBLIC OR PRIVATE SECTOR, WRITE THE NAME OF THE PLACE(S).
(NAME OF PLACE(S))
CHECK 625:
PROBE TO IDENTIFY THE TYPE OF SOURCE.
W-42

The Somali Health and Demographic Survey384
NO.
SECTION 6. CHILD HEALTH AND NUTRITION
LAST BIRTH NEXT-TO-LAST BIRTH
QUESTIONS AND FILTERS NAME NAME
627
FIRST PLACE . . . . . . . . . . FIRST PLACE . . . . . . . . . .
628
DAYS . . . . . . . . . . DAYS . . . . . . . . . .
629 YES . . . . . . . . . . . . . . . . . . . . . 1 YES . . . . . . . . . . . . . . . . . . . . . 1NO . . . . . . . . . . . . . . . . . . . . . 2 NO . . . . . . . . . . . . . . . . . . . . . 2
(SKIP TO 646) (SKIP TO 646)DON'T KNOW . . . . . . . . . . . . . 8 DON'T KNOW . . . . . . . . . . . . . 8
630 ANTIMALARIAL DRUGS ANTIMALARIAL DRUGSARTEMISININ ARTEMISININ
COMBINATION COMBINATIONTHERAPY (ACT)/ AL. . . . . A THERAPY (ACT)/ AL. . . . . A
SP/FANSIDAR . . . . . . . . . . B SP/FANSIDAR . . . . . . . . . . BCHLOROQUINE . . . . . . . . . . C CHLOROQUINE . . . . . . . . . . CAMODIAQUINE . . . . . . . . . . D AMODIAQUINE . . . . . . . . . . DQUININE QUININE
PILLS . . . . . . . . . . . . . . . . E PILLS . . . . . . . . . . . . . . . . EINJECTION/IV . . . . . . . F INJECTION/IV . . . . . . . F
ARTESUNATE ARTESUNATERECTAL . . . . . . . . . . . . . G RECTAL . . . . . . . . . . . . . GINJECTION/IV . . . . . . . H INJECTION/IV . . . . . . . H
OTHER ANTIMALARIAL OTHER ANTIMALARIAL
I I
ANTIBIOTIC DRUGS ANTIBIOTIC DRUGSPILL/SYRUP . . . . . . . . . . . . . J PILL/SYRUP . . . . . . . . . . . . . JINJECTION/IV . . . . . . . . . . K INJECTION/IV . . . . . . . . . . K
OTHER DRUGS OTHER DRUGSASPIRIN . . . . . . . . . . . . . . . . L ASPIRIN . . . . . . . . . . . . . . . . LPANADOL/PARACETAMOL. . M PANADOL/PARACETAMOL. . MIBUPROFEN . . . . . . . . . . . . . N IBUPROFEN . . . . . . . . . . . . . N
OTHER X OTHER X
DON'T KNOW . . . . . . . . . . . . . Z DON'T KNOW . . . . . . . . . . . . . Z
631 YES NO YES NO
(SKIP TO 646) (SKIP TO 646)
(SPECIFY) (SPECIFY)
(SPECIFY) (SPECIFY)
Where did you first seek advice or treatment?
At any time during the illness, did (NAME) take any drugs for the illness?
USE LETTER CODE FROM 625.
RECORD ALL MENTIONED.
What drugs did (NAME) take?
Any other drugs?
CHECK 630: ANY CODE A-I CIRCLED?
IF THE SAME DAY RECORD ‘00’.
How many days after the illness began did you first seek advice or treatment for (NAME)?
W-43
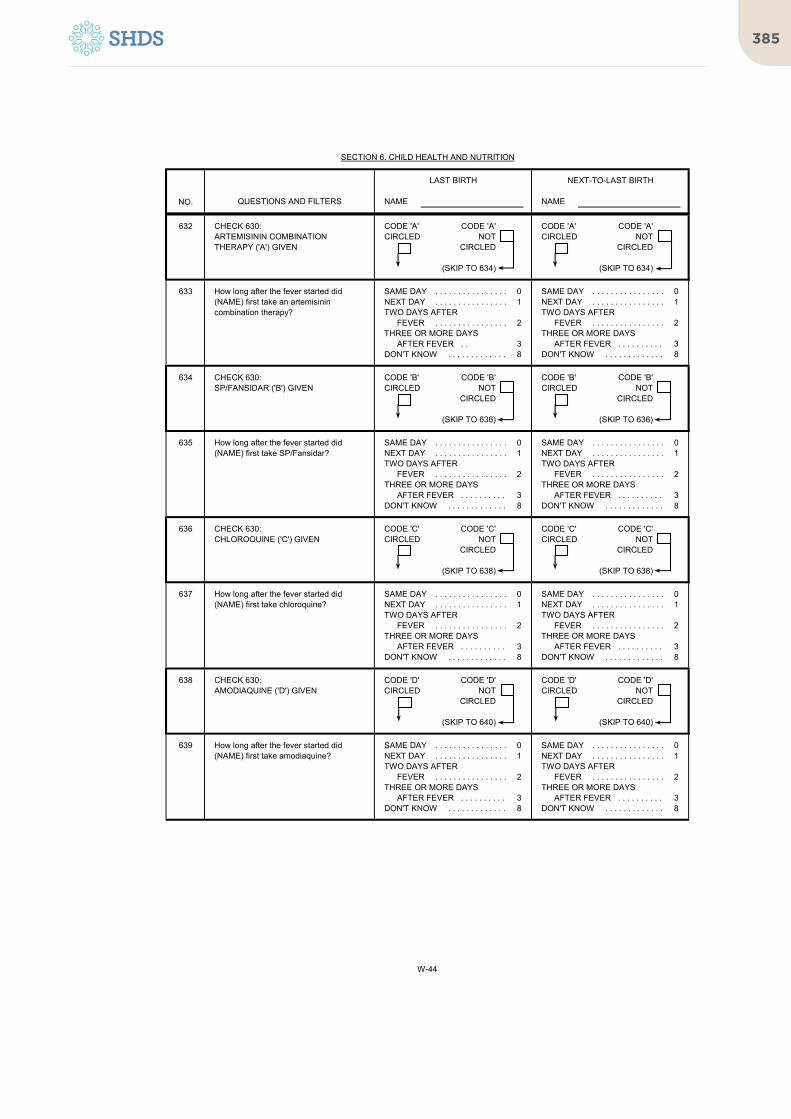
385
NO.
SECTION 6. CHILD HEALTH AND NUTRITION
LAST BIRTH NEXT-TO-LAST BIRTH
QUESTIONS AND FILTERS NAME NAME
632 CODE 'A' CODE 'A' CODE 'A' CODE 'A'CIRCLED NOT CIRCLED NOT
CIRCLED CIRCLED
(SKIP TO 634) (SKIP TO 634)
633 SAME DAY . . . . . . . . . . . . . . . . 0 SAME DAY . . . . . . . . . . . . . . . . 0NEXT DAY . . . . . . . . . . . . . . . . 1 NEXT DAY . . . . . . . . . . . . . . . . 1TWO DAYS AFTER TWO DAYS AFTER
FEVER . . . . . . . . . . . . . . . . 2 FEVER . . . . . . . . . . . . . . . . 2THREE OR MORE DAYS THREE OR MORE DAYS
AFTER FEVER . . 3 AFTER FEVER . . . . . . . . . . 3DON'T KNOW . . . . . . . . . . . . . 8 DON'T KNOW . . . . . . . . . . . . . 8
634 CODE 'B' CODE 'B' CODE 'B' CODE 'B'CIRCLED NOT CIRCLED NOT
CIRCLED CIRCLED
(SKIP TO 636) (SKIP TO 636)
635 SAME DAY . . . . . . . . . . . . . . . . 0 SAME DAY . . . . . . . . . . . . . . . . 0NEXT DAY . . . . . . . . . . . . . . . . 1 NEXT DAY . . . . . . . . . . . . . . . . 1TWO DAYS AFTER TWO DAYS AFTER
FEVER . . . . . . . . . . . . . . . . 2 FEVER . . . . . . . . . . . . . . . . 2THREE OR MORE DAYS THREE OR MORE DAYS
AFTER FEVER . . . . . . . . . . 3 AFTER FEVER . . . . . . . . . . 3DON'T KNOW . . . . . . . . . . . . . 8 DON'T KNOW . . . . . . . . . . . . . 8
636 CODE 'C' CODE 'C' CODE 'C' CODE 'C'CIRCLED NOT CIRCLED NOT
CIRCLED CIRCLED
(SKIP TO 638) (SKIP TO 638)
637 SAME DAY . . . . . . . . . . . . . . . . 0 SAME DAY . . . . . . . . . . . . . . . . 0NEXT DAY . . . . . . . . . . . . . . . . 1 NEXT DAY . . . . . . . . . . . . . . . . 1TWO DAYS AFTER TWO DAYS AFTER
FEVER . . . . . . . . . . . . . . . . 2 FEVER . . . . . . . . . . . . . . . . 2THREE OR MORE DAYS THREE OR MORE DAYS
AFTER FEVER . . . . . . . . . . 3 AFTER FEVER . . . . . . . . . . 3DON'T KNOW . . . . . . . . . . . . . 8 DON'T KNOW . . . . . . . . . . . . . 8
638 CODE 'D' CODE 'D' CODE 'D' CODE 'D'CIRCLED NOT CIRCLED NOT
CIRCLED CIRCLED
(SKIP TO 640) (SKIP TO 640)
639 SAME DAY . . . . . . . . . . . . . . . . 0 SAME DAY . . . . . . . . . . . . . . . . 0NEXT DAY . . . . . . . . . . . . . . . . 1 NEXT DAY . . . . . . . . . . . . . . . . 1TWO DAYS AFTER TWO DAYS AFTER
FEVER . . . . . . . . . . . . . . . . 2 FEVER . . . . . . . . . . . . . . . . 2THREE OR MORE DAYS THREE OR MORE DAYS
AFTER FEVER . . . . . . . . . . 3 AFTER FEVER . . . . . . . . . . 3DON'T KNOW . . . . . . . . . . . . . 8 DON'T KNOW . . . . . . . . . . . . . 8
CHECK 630:CHLOROQUINE ('C') GIVEN
How long after the fever started did (NAME) first take chloroquine?
CHECK 630:AMODIAQUINE ('D') GIVEN
How long after the fever started did (NAME) first take amodiaquine?
CHECK 630:SP/FANSIDAR ('B') GIVEN
How long after the fever started did (NAME) first take SP/Fansidar?
CHECK 630:ARTEMISININ COMBINATION THERAPY ('A') GIVEN
How long after the fever started did (NAME) first take an artemisinin combination therapy?
W-44
The Somali Health and Demographic Survey386
NO.
SECTION 6. CHILD HEALTH AND NUTRITION
LAST BIRTH NEXT-TO-LAST BIRTH
QUESTIONS AND FILTERS NAME NAME
640 CODE CODE CODE CODE'E' OR 'F' 'E' OR 'F' 'E' OR 'F' 'E' OR 'F'CIRCLED NOT CIRCLED NOT
CIRCLED CIRCLED
(SKIP TO 642) (SKIP TO 642)
641 SAME DAY . . . . . . . . . . . . . . . . 0 SAME DAY . . . . . . . . . . . . . . . . 0NEXT DAY . . . . . . . . . . . . . . . . 1 NEXT DAY . . . . . . . . . . . . . . . . 1TWO DAYS AFTER TWO DAYS AFTER
FEVER . . . . . . . . . . . . . . . . 2 FEVER . . . . . . . . . . . . . . . . 2THREE OR MORE DAYS THREE OR MORE DAYS
AFTER FEVER . . . . . . . . . . 3 AFTER FEVER . . . . . . . . . . 3DON'T KNOW . . . . . . . . . . . . . 8 DON'T KNOW . . . . . . . . . . . . . 8
642 CODE CODE CODE CODE'G' OR 'H' 'G' OR 'H' 'G' OR 'H' 'G' OR 'H'CIRCLED NOT CIRCLED NOT
CIRCLED CIRCLED
(SKIP TO 644) (SKIP TO 644)
643 SAME DAY . . . . . . . . . . . . . . . . 0 SAME DAY . . . . . . . . . . . . . . . . 0NEXT DAY . . . . . . . . . . . . . . . . 1 NEXT DAY . . . . . . . . . . . . . . . . 1TWO DAYS AFTER TWO DAYS AFTER
FEVER . . . . . . . . . . . . . . . . 2 FEVER . . . . . . . . . . . . . . . . 2THREE OR MORE DAYS THREE OR MORE DAYS
AFTER FEVER . . . . . . . . . . 3 AFTER FEVER . . . . . . . . . . 3DON'T KNOW . . . . . . . . . . . . . 8 DON'T KNOW . . . . . . . . . . . . . 8
644 CODE 'I' CODE 'I' CODE 'I' CODE 'I'CIRCLED NOT CIRCLED NOT
CIRCLED CIRCLED
(SKIP TO 646) (SKIP TO 646)
645 SAME DAY . . . . . . . . . . . . . . . . 0 SAME DAY . . . . . . . . . . . . . . . . 0NEXT DAY . . . . . . . . . . . . . . . . 1 NEXT DAY . . . . . . . . . . . . . . . . 1TWO DAYS AFTER TWO DAYS AFTER
FEVER . . . . . . . . . . . . . . . . 2 FEVER . . . . . . . . . . . . . . . . 2THREE OR MORE DAYS THREE OR MORE DAYS
AFTER FEVER . . . . . . . . . . 3 AFTER FEVER . . . . . . . . . . 3DON'T KNOW . . . . . . . . . . . . . 8 DON'T KNOW . . . . . . . . . . . . . 8
646 GO TO 604 IN NEXT-TO-LAST COLUMN OF NEW QUESTIONNAIRE; OR, IF NO MORE BIRTHS, GO TO 647.
GO BACK TO 604 IN NEXT COLUMN; OR, IF NO MORE BIRTHS, GO TO 647.
How long after the fever started did (NAME) first take (OTHER ANTIMALARIAL)?
CHECK 630:QUININE ('E' OR 'F') GIVEN
How long after the fever started did (NAME) first take quinine?
CHECK 630:ARTESUNATE ('G' OR 'H') GIVEN
How long after the fever started did (NAME) first take artesunate?
CHECK 630:OTHER ANTIMALARIAL ('I') GIVEN
W-45

387
NO.
647
NO CHILD ANY CHILDRECEIVED FLUID RECEIVED FLUID 649
FROM ORS PACKET OR FROM ORS PACKET ORPRE-PACKAGED ORS LIQUID PRE-PACKAGED ORS LIQUID
648YES . . . . . . . . . . . . . . . . . . . . . . . . . . . . . . . . . . . . 1NO . . . . . . . . . . . . . . . . . . . . . . . . . . . . . . . . . . . . 2
649
ONE OR MORE NONE
SECTION 6. CHILD HEALTH AND NUTRITION
Have you ever heard of a special product called [LOCAL NAME FOR ORS PACKET OR PRE-PACKAGED ORS LIQUID] you can get for the treatment of diarrhea?
CHECK 615(a) AND 615(b), ALL COLUMNS:
QUESTIONS AND FILTERS SKIPCODING CATEGORIES
(NAME OF YOUNGEST CHILD LIVING WITH HER)
701
CHECK 215 AND 218, ALL ROWS: NUMBER OF CHILDREN BORN IN 2017-2019 LIVING WITH THE RESPONDENT
W-46

The Somali Health and Demographic Survey388
NO.
SECTION 6. CHILD HEALTH AND NUTRITION
QUESTIONS AND FILTERS SKIPCODING CATEGORIES
650
YES NO DK
a) a) . . . . . . . . . . . . . 1 2 8
b) b) . . . . . . . . . . . . . 1 2 8
c) c) . . . . . . . . . . . . . 1 2 8
d) d) . . . . . . . . . . . . . 1 2 8
e) e) . . . . . . . . . . . . . 1 2 8
f) f) . . . . . . . . . . . . . 1 2 8
g) g) . . . . . . . . . . . . . 1 2 8
h) h) . . . . . . . . . . . . . 1 2 8
i) i) . . . . . . . . . . . . . 1 2 8
j) j) . . . . . . . . . . . . . 1 2 8
k) k) . . . . . . . . . . . . . 1 2 8
l) l) . . . . . . . . . . . . . 1 2 8
m) m) . . . . . . . . . . . . . 1 2 8
n) n) . . . . . . . . . . . . . 1 2 8
o) o) . . . . . . . . . . . . . 1 2 8
p) p) . . . . . . . . . . . . . 1 2 8
q) q) . . . . . . . . . . . . . 1 2 8
r) r) . . . . . . . . . . . . . 1 2 8
s) s) . . . . . . . . . . . . . 1 2 8
t) t) . . . . . . . . . . . . . 1 2 8
u) u) . . . . . . . . . . . . . 1 2 8
v) v) . . . . . . . . . . . . . 1 2 8
Liver, kidney, heart, or other organ meats?
NUMBER OF TIMES DRANK
FRESH MILK
Any dark green, leafy vegetables?
Ripe mangoes, papayas, orange, bananas, water melon, lemon?
White potatoes, white yams, manioc/cassava, or any other foods made from roots?
Bread, dough, pancake, rice, noodles, porridge, or other foods made from grains?
IF 7 OR MORE TIMES, RECORD '7'.
Eggs?
Fresh or dried fish or shellfish?
Any foods made from beans, peas, lentils, or nuts?
Pumpkin, carrots, squash, or sweet potatoes that are yellow or orange inside?
Any other liquids?
Any other fruits or vegetables?
Any meat, such as beef, lamb, goat, chicken?
Any other solid, semi-solid, or soft food?
Now I would like to ask you about liquids or foods that (NAME FROM 649) had yesterday during the day or at night. I am interested in whether your child had the item I mention even if it was combined with other foods.Did (NAME FROM 649) drink or eat:
Plain water?
Juice or juice drinks?
Clear broth (soup)?
IF 7 OR MORE TIMES, RECORD '7'.
NUMBER OF TIMES DRANK
FORMULAIF 7 OR MORE TIMES, RECORD '7'.
NUMBER OF TIMES DRANK
CANNED/ POWDERED MILK
NUMBER OF TIMES ATE
YOGURT
Cheese or other food made from milk?
Yogurt?IF YES: How many times did (NAME) eat yogurt?
Any [BRAND NAME OF COMMERCIALLY FORTIFIED BABY FOOD, E.G., Cerelac]?
Fresh livestock milk?IF YES: How many times did (NAME) drink fresh milk?
Canned/powdered livestock milk?IF YES: How many times did (NAME) drink canned/powdered milk?IF 7 OR MORE TIMES, RECORD '7'.
Infant formula?IF YES: How many times did (NAME) drink infant formula?
W-47

389
NO.
SECTION 6. CHILD HEALTH AND NUTRITION
QUESTIONS AND FILTERS SKIPCODING CATEGORIES
651
ALL ARE "NO" AT LEAST ONE 'YES' 653
652 YES . . . . . . . . . . . . . . . . . . . . . . . . . . . . . . . . . . . . 1
(THEN CONTINUE TO 653)
NO . . . . . . . . . . . . . . . . . . . . . . . . . . . . . . . . . . . . 2 654
653NUMBER OF TIMES . . . . . . . . . . . . . . . . . . .
DON'T KNOW . . . . . . . . . . . . . . . . . . . . . . . . . . . . 8
654 CHILD USED TOILET OR LATRINE . . . . . . . . . . 01PUT/RINSED
INTO TOILET OR LATRINE. . . . . . . . . . . . . . . . 02PUT/RINSED
INTO DRAIN OR DITCH . . . . . . . . . . . . . . . . 03THROWN INTO GARBAGE. . . . . . . . . . . . . . . . . . . 04BURIED . . . . . . . . . . . . . . . . . . . . . . . . . . . . . . . . . 05LEFT IN THE OPEN . . . . . . . . . . . . . . . . . . . . . . . . . 06
OTHER 96(SPECIFY)
The last time (NAME FROM 649) passed stools, what was done to dispose of the stools?
IF 7 OR MORE TIMES, RECORD ‘7'.
How many times did (NAME FROM 649) eat solid, semi-solid, or soft foods yesterday during the day or at night?
CHECK 650 (CATEGORIES 'g' THROUGH 'v'):
Did (NAME FROM 649) eat any solid, semi-solid, or soft foods yesterday during the day or at night?
IF ‘YES’ PROBE: What kind of solid, semi-solid or soft foods did (NAME) eat?
(GO BACK TO 650 TO RECORD FOOD EATEN YESTERDAY)
W-48

The Somali Health and Demographic Survey390
NO.
701
PREGNANT NOT PREGNANTOR UNSURE
702 HAVE ANOTHER CHILD . . . . . . . . . . . . . . . . . . . 1 704NO MORE . . . . . . . . . . . . . . . . . . . . . . . . . . . . . . 2UNDECIDED/DON'T KNOW . . . . . . . . . . . . . . . . 8
703 HAVE (A/ANOTHER) CHILD . . . . . . . . . . . . . . . . 1NO MORE/NONE . . . . . . . . . . . . . . . . . . . . . . . . 2 706SAYS SHE CAN'T GET PREGNANT . . . . . . . . . . 3 711UNDECIDED/DON'T KNOW . . . . . . . . . . . . . . . . 8 709
704MONTHS . . . . . . . . . . . . . . . . 1
NOT PREGNANT PREGNANTOR UNSURE YEARS . . . . . . . . . . . . . . . . . . . 2
a) b) SOON/NOW . . . . . . . . . . . . . . . . . . . . . . . . . . . . . . 993 709SAYS SHE CAN'T GET PREGNANT . . . . . . . . . . 994 711AFTER MARRIAGE . . . . . . . . . . . . . . . . . . . . . . . . 995
OTHER 996 709
DON'T KNOW . . . . . . . . . . . . . . . . . . . . . . . . . . . 998
705
NOT PREGNANT PREGNANTOR UNSURE
706
NOT CURRENTLYCURRENTLY USING 711
USING
707
'24' OR MORE MONTHS NOT '00-23' MONTHSOR '02' OR MORE YEARS ASKED OR '00-01' YEAR 711
CHECK 226:
Now I have some questions about the future. Would you like to have (a/another) child, or would you prefer not to have any (more) children?
After the birth of the child you are expecting now, how long would you like to wait before the birth of another child?
How long would you like to wait from now before the birth of (a/another) child?
703
710
Now I have some questions about the future. After the child you are expecting now, would you like to have another child, or would you prefer not to have any more children?
CHECK 226:
SECTION 7. FERTILITY PREFERENCES
QUESTIONS AND FILTERS CODING CATEGORIES SKIP
710
(SPECIFY)
CHECK 303: USING A CONTRACEPTIVE METHOD?
CHECK 226:
CHECK 704:
W-49

391
NO.
SECTION 7. FERTILITY PREFERENCES
QUESTIONS AND FILTERS CODING CATEGORIES SKIP
708 CHECK 703 & 704: NOT MARRIED . . . . . . . . . . . . . . . . . . . . . . . . . . . A
WANTS TO WAIT WANTS NO MORE/ FERTILITY-RELATED REASONSSOMETIME BEFORE NONE NOT HAVING SEX . . . . . . . . . . . . . . . . . . . . . B
A/ANOTHER CHILD INFREQUENT SEX . . . . . . . . . . . . . . . . . . . . . Ca) b) MENOPAUSAL/HYSTERECTOMY. . . . . . . . . . D
CAN'T GET PREGNANT . . . . . . . . . . . . . . . . ENOT MENSTRUATED SINCE
LAST BIRTH . . . . . . . . . . . . . . . . . . . . . . . . FBREASTFEEDING . . . . . . . . . . . . . . . . . . . . . GUP TO GOD/FATALISTIC . . . . . . . . . . . . . . . . H
OPPOSITION TO USERESPONDENT OPPOSED . . . . . . . . . . . . . . . . IHUSBAND OPPOSED . . . . . . . . . . JOTHERS OPPOSED . . . . . . . . . . . . . . . . . . . KRELIGIOUS PROHIBITION . . . . . . . . . . . . . . . . L
LACK OF KNOWLEDGEKNOWS NO METHOD . . . . . . . . . . . . . . . . . . . MKNOWS NO SOURCE . . . . . . . . . . . . . . . . . . . N
METHOD-RELATED REASONSSIDE EFFECTS/HEALTH
CONCERNS . . . . . . . . . . . . . . . . . . . . . . . . OLACK OF ACCESS/TOO FAR . . . . . . . . . . . . . PCOSTS TOO MUCH . . . . . . . . . . . . . . . . . . . QPREFERRED METHOD
NOT AVAILABLE . . . . . . . . . . . . . . . . . . . RNO METHOD AVAILABLE . . . . . . . . . . . . . . . . SINCONVENIENT TO USE . . . . . . . . . . . . . . . . TINTERFERES WITH BODY'S
NORMAL PROCESSES. . . . . . . . . . . . . . . . U
OTHER X
DON'T KNOW . . . . . . . . . . . . . . . . . . . . . . . . . . . Z
709
NOT NO, NOT YES,ASKED CURRENTLY USING CURRENTLY USING
710 YES . . . . . . . . . . . . . . . . . . . . . . . . . . . . . . . . . . . 1NO . . . . . . . . . . . . . . . . . . . . . . . . . . . . . . . . . . . 2DON'T KNOW . . . . . . . . . . . . . . . . . . . . . . . . . . . 8
711
HAS LIVING NO LIVINGCHILDREN CHILDREN NONE . . . . . . . . . . . . . . . . . . . . . . . . . . . . . . . . . 00 713
a) b)
NUMBER . . . . . . . . . . . . . . . . . . . . . . . .
OTHER 96 713
712
NUMBER . .
OTHER 96
If you could choose exactly the number of children to have in your whole life, how many would that be?
CHECK 216:
711
(SPECIFY)
EITHERGIRLSBOYS
(SPECIFY)
(SPECIFY)
How many of these children would you wish to be boys, how many would you wish to be girls and for how many would it not matter if it’s a boy or a girl?
RECORD ALL REASONS MENTIONED.
CHECK 303: USING A CONTRACEPTIVE METHOD?
Do you think you will use a contraceptive method to delay or avoid pregnancy at any time in the future?
PROBE FOR A NUMERIC RESPONSE.
You have said that you would like to wait for sometime before you get another child. Can you tell me why you are not using a method to prevent pregnancy?
Any other reason?
You have said that you do not want any (more) children. Can you tell me why you are not using a method to prevent pregnancy?
Any other reason?
If you could go back to the time you did not have any children and could choose exactly the number of children to have in your whole life, how many would that be?
W-50

The Somali Health and Demographic Survey392
NO.
SECTION 7. FERTILITY PREFERENCES
QUESTIONS AND FILTERS CODING CATEGORIES SKIP
713 YES NO
a) a) RADIO . . . . . . . . . . . . . . . . . . . . . . . . 1 2
b) b) TELEVISION . . . . . . . . . . . . . . . . . . . 1 2
c) c) NEWSPAPER OR MAGAZINE . . . . . . . 1 2
d) d) MOBILE PHONE . . . . . . . . . . . . . . . . . . . 1 2
e) e) SOCIAL MEDIA . . . . . . . . . . . . . . . . . . . 1 2
f) f) HCWs/HF . . . . . . . . . . . . . . . . . . . 1 2
714
NOTCURRENTLY CURRENTLY
USING USINGNOT
ASKED 717
715 MAINLY RESPONDENT . . . . . . . . . . . . . . . . . . . 1MAINLY HUSBAND . . . . . . . . . . . . . . . . 2JOINT DECISION . . . . . . . . . . . . . . . . . . . . . . . . 3 717
OTHER 6
716 MAINLY RESPONDENT . . . . . . . . . . . . . . . . . . . 1MAINLY HUSBAND . . . . . . . . . . . . . . . . 2JOINT DECISION . . . . . . . . . . . . . . . . . . . . . . . . 3
OTHER 6
717 SAME NUMBER . . . . . . . . . . . . . . . . . . . . . . . . . . . 1MORE CHILDREN . . . . . . . . . . . . . . . . . . . . . . . . 2FEWER CHILDREN . . . . . . . . . . . . . . . . . . . . . . . . 3DON'T KNOW . . . . . . . . . . . . . . . . . . . . . . . . . . . 8
Does your husband want the same number of children that you want, or does he want more or fewer than you want?
Would you say that not using contraception is mainly your decision, mainly your husband's decision, or did you both decide together?
CHECK 303: USING A CONTRACEPTIVE METHOD?
Would you say that using contraception is mainly your decision, mainly your husband's decision, or did you both decide together?
Have you heard about birth spacing from a health care worker/in the health facility?
Received a voice or text message about birth spacing on a mobile phone?
Read about birth spacing in a newspaper or magazine?
Seen anything about birth spacing on the television?
Have you read about birth spacing on internet or social media?
(SPECIFY)
(SPECIFY)
716
Heard about birth spacing on the radio?
In the last three months have you:
W-51

393
NO.
801
CURRENTLY MARRIED NOT INUNION
802AGE IN COMPLETED YEARS . . . . . . .
IF 95 OR MORE, RECORD '95' DON'T KNOW AGE . . . . . . . . . . . . . . . . . . . . . 98
803 YES . . . . . . . . . . . . . . . . . . . . . . . . . . . . . . . . . . . 1NO . . . . . . . . . . . . . . . . . . . . . . . . . . . . . . . . . . . 2DON'T KNOW 8
804 PRIMARY . . . . . . . . . . . . . . . . . . . . . . . . . . . . . . 1SECONDARY . . . . . . . . . . . . . . . . . . . . . . . . . . . 2HIGHER . . . . . . . . . . . . . . . . . . . . . . . . . . . . . . . . . 3DON'T KNOW . . . . . . . . . . . . . . . . . . . . . . . . . . . 8 806
805[GRADE/FORM/YEAR] . . . . . . . . . . . . .
DON'T KNOW . . . . . . . . . . . . . . . . . . . . . . . . . . . 98
806 YES . . . . . . . . . . . . . . . . . . . . . . . . . . . . . . . . . . . 1 808NO . . . . . . . . . . . . . . . . . . . . . . . . . . . . . . . . . . . 2DON'T KNOW . . . . . . . . . . . . . . . . . . . . . . . . . . . 8
807 YES . . . . . . . . . . . . . . . . . . . . . . . . . . . . . . . . . . . 1NO . . . . . . . . . . . . . . . . . . . . . . . . . . . . . . . . . . . 2DON'T KNOW . . . . . . . . . . . . . . . . . . . . . . . . . . . 8
808
809 YES . . . . . . . . . . . . . . . . . . . . . . . . . . . . . . . . . . . 1 813NO . . . . . . . . . . . . . . . . . . . . . . . . . . . . . . . . . . . 2
810
YES . . . . . . . . . . . . . . . . . . . . . . . . . . . . . . . . . . . 1 813NO . . . . . . . . . . . . . . . . . . . . . . . . . . . . . . . . . . . 2
811YES . . . . . . . . . . . . . . . . . . . . . . . . . . . . . . . . . . . 1 813NO . . . . . . . . . . . . . . . . . . . . . . . . . . . . . . . . . . . 2
812 YES . . . . . . . . . . . . . . . . . . . . . . . . . . . . . . . . . . . 1NO . . . . . . . . . . . . . . . . . . . . . . . . . . . . . . . . . . . 2 817
813
809
Although you did not work in the last seven days, do you have any job or business from which you were absent for leave, illness, vacation, maternity leave, or any other such reason?
Has your husband done any work in the last 12 months?
What is your main occupation? That is, what kind of work do you mainly do?
NB- REFER TO THE INTERVIEWER'S MANUAL FOR THE CODES ON OCCUPATION
SECTION 8. HUSBAND'S BACKGROUND AND WOMAN'S WORK
CHECK 119 & 120:
How old was your husband on his last birthday?
Did your husband ever attend school?
What was the highest level of school he attended: primary, secondary, or higher?
SKIPCODING CATEGORIESQUESTIONS AND FILTERS
809
806
Has your husband done any work in the last 7 days?
What was the highest [GRADE/FORM/YEAR] he completed at that level?IF COMPLETED LESS THAN ONE YEAR AT THAT LEVEL, RECORD '00'.
As you know, some women take up jobs for which they are paid in cash or kind. Others sell things, have a small business or look after animals or work on the family farm or in the family business. In the last seven days, have you done any of these things or any other work?
Have you done any work in the last 12 months?
Aside from your own housework, have you done any work in the last seven days?
What is your husband's occupation? That is, what kind of work does he mainly do?
NB- REFER TO THE INTERVIEWER'S MANUAL FOR THE CODES ON OCCUPATION
W-52

The Somali Health and Demographic Survey394
NO.
SECTION 8. HUSBAND'S BACKGROUND AND WOMAN'S WORK
SKIPCODING CATEGORIESQUESTIONS AND FILTERS
814 FOR FAMILY MEMBER . . . . . . . . . . . . . . . . . . . . . 1FOR SOMEONE ELSE . . . . . . . . . . . . . . . . . . . . . 2SELF-EMPLOYED . . . . . . . . . . . . . . . . . . . . . . . . 3
815 THROUGHOUT THE YEAR . . . . . . . . . . . . . . . . 1SEASONALLY/PART OF THE YEAR . . . . . . . . . . 2ONCE IN A WHILE . . . . . . . . . . . . . . . . . . . . . . . . 3
816 CASH ONLY . . . . . . . . . . . . . . . . . . . . . . . . . . . 1CASH AND KIND . . . . . . . . . . . . . . . . . . . . . . . . 2IN KIND ONLY . . . . . . . . . . . . . . . . . . . . . . . . . . . 3NOT PAID . . . . . . . . . . . . . . . . . . . . . . . . . . . . . . 4
817
CURRENTLYMARRIED NOT IN UNION 825
818
CODE '1' OR '2' OTHERCIRCLED
819 RESPONDENT . . . . . . . . . . . . . . . . . . . . . . . . . . . 1HUSBAND. . . . . . . . . . . . . . . . . . . . . . . . . . . . . . . . . 2RESPONDENT AND HUSBAND JOINTLY. . . . . . . 3OTHER 6
820 MORE THAN HIM . . . . . . . . . . . . . . . . . . . . . . . . 1LESS THAN HIM . . . . . . . . . . . . . . . . . . . . . . . . 2ABOUT THE SAME . . . . . . . . . . . . . . . . . . . . . . . . 3HUSBAND HAS
NO EARNINGS . . . . . . . . . . . . . . . . . . . . . . . . 4 822DON'T KNOW . . . . . . . . . . . . . . . . . . . . . . . . . . . 8
821 RESPONDENT . . . . . . . . . . . . . . . . . . . . . . . . . . . 1HUSBAND. . . . . . . . . . . . . . . . . . . . . . . . . . . . . . . . . 2RESPONDENT AND HUSBAND JOINTLY. . . . . . . 3HUSBAND HAS NO EARNINGS. . . . . . . . . . . . . . . . 4OTHER 6
822 RESPONDENT . . . . . . . . . . . . . . . . . . . . . . . . . . . 1HUSBAND. . . . . . . . . . . . . . . . . . . . . . . . . . . . . . . . . 2RESPONDENT AND HUSBAND JOINTLY. . . . . . . 3IN-LAWS . . . . . . . . . . . . . . . . . . . . . . . . . . . . . . . . . 4SOMEONE ELSE . . . . . . . . . . . . . . . . . . . . . . . . 5OTHER . . . . . . . . . . . . . . . . . . . . . . . . . . . . . . . . . 6
823 RESPONDENT . . . . . . . . . . . . . . . . . . . . . . . . . . . 1HUSBAND. . . . . . . . . . . . . . . . . . . . . . . . . . . . . . . . . 2RESPONDENT AND HUSBAND JOINTLY. . . . . . . 3SOMEONE ELSE . . . . . . . . . . . . . . . . . . . . . . . . 4OTHER . . . . . . . . . . . . . . . . . . . . . . . . . . . . . . . . . 6
Who usually makes decisions about making major household purchases?
Who usually makes decisions about health care for yourself: you, your husband, you and your husband jointly, or someone else?
Who usually decides how your husband's earnings will be used: you, your husband, or you and your husband jointly?
Who usually decides how the money you earn will be used: you, your husband, or you and your husband jointly?
(SPECIFY)
(SPECIFY)
821
Would you say that the money that you earn is more than what your husband earns, less than what he earns, or about the same?
Are you paid in cash or kind for this work or are you not paid at all?
CHECK119&120:
CHECK 816:
Do you usually work throughout the year, or do you work seasonally, or only once in a while?
Do you do this work for a member of your family, for someone else, or are you self-employed?
W-53

395
NO.
SECTION 8. HUSBAND'S BACKGROUND AND WOMAN'S WORK
SKIPCODING CATEGORIESQUESTIONS AND FILTERS
824 I GIVE MYSELF PERMISSION . . . . . . . . . . . . . . . . 1MY HUSBAND . . . . . . . . . . . . . . . . . . . . . . . . . . . 2MYSELF AND MY HUSBAND JOINTLY. . . . . . . . . . 3SOMEONE ELSE . . . . . . . . . . . . . . . . . . . . . . . . 4OTHER . . . . . . . . . . . . . . . . . . . . . . . . . . . . . . . . . 6
825 ALONE ONLY . . . . . . . . . . . . . . . . . . . . . . . . . . . 1JOINTLY ONLY . . . . . . . . . . . . . . . . . . . . . . . . . . . 2BOTH ALONE AND JOINTLY . . . . . . . . . . . . . . . . 3DOES NOT OWN . . . . . . . . . . . . . . . . . . . . . . . . 4 828
826 YES . . . . . . . . . . . . . . . . . . . . . . . . . . . . . . . . . . . 1NO . . . . . . . . . . . . . . . . . . . . . . . . . . . . . . . . . . . 2DON'T KNOW . . . . . 8
827 YES . . . . . . . . . . . . . . . . . . . . . . . . . . . . . . . . . . . 1NO . . . . . . . . . . . . . . . . . . . . . . . . . . . . . . . . . . . 2DON'T KNOW . . . . . . . . . . . . . . . . . . . . . . . . . . . 8
828 ALONE ONLY . . . . . . . . . . . . . . . . . . . . . . . . . . . 1JOINTLY ONLY . . . . . . . . . . . . . . . . . . . . . . . . . . . 2BOTH ALONE AND JOINTLY . . . . . . . . . . . . . . . . 3DOES NOT OWN . . . . . . . . . . . . . . . . . . . . . . . . 4 901
829 YES . . . . . . . . . . . . . . . . . . . . . . . . . . . . . . . . . . . 1NO . . . . . . . . . . . . . . . . . . . . . . . . . . . . . . . . . . . 2DON'T KNOW . . . . . . . . . . . . . . . . . . . . . . . . . . . 8
830 YES . . . . . . . . . . . . . . . . . . . . . . . . . . . . . . . . . . . 1NO . . . . . . . . . . . . . . . . . . . . . . . . . . . . . . . . . . . 2DON'T KNOW . . . . . . . . . . . . . . . . . . . . . . . . . . . 8
Do you own this or any other house either alone or jointly with someone else?
When you are going out, who do you usually ask permission?
Do you own any agricultural or non-agricultural land either alone or jointly with someone else?
828
Is your name on the title deed?
Do you have a title deed for any house you own?
Is your name on the title deed?
Do you have a title deed for any land you own?
901
W-54

The Somali Health and Demographic Survey396
NO.
901 YES . . . . . . . . . . . . . . . . . . . . . . . . . . . . . . . . . . . . 1NO . . . . . . . . . . . . . . . . . . . . . . . . . . . . . . . . . . . . 2 918
902 YES . . . . . . . . . . . . . . . . . . . . . . . . . . . . . . . . . . . . 1NO . . . . . . . . . . . . . . . . . . . . . . . . . . . . . . . . . . . . 2DON'T KNOW . . . . . . . . . . . . . . . . . . . . . . . . . . . 8
903 YES . . . . . . . . . . . . . . . . . . . . . . . . . . . . . . . . . . . . 1NO . . . . . . . . . . . . . . . . . . . . . . . . . . . . . . . . . . . . 2DON'T KNOW . . . . . . . . . . . . . . . . . . . . . . . . . . . 8
904 YES . . . . . . . . . . . . . . . . . . . . . . . . . . . . . . . . . . . . 1NO . . . . . . . . . . . . . . . . . . . . . . . . . . . . . . . . . . . . 2DON'T KNOW . . . . . . . . . . . . . . . . . . . . . . . . . . . 8
905 YES . . . . . . . . . . . . . . . . . . . . . . . . . . . . . . . . . . . . 1NO . . . . . . . . . . . . . . . . . . . . . . . . . . . . . . . . . . . . 2DON'T KNOW . . . . . . . . . . . . . . . . . . . . . . . . . . . 8
906 YES . . . . . . . . . . . . . . . . . . . . . . . . . . . . . . . . . . . . 1NO . . . . . . . . . . . . . . . . . . . . . . . . . . . . . . . . . . . . 2DON'T KNOW . . . . . . . . . . . . . . . . . . . . . . . . . . . 8
907 YES . . . . . . . . . . . . . . . . . . . . . . . . . . . . . . . . . . . . 1NO . . . . . . . . . . . . . . . . . . . . . . . . . . . . . . . . . . . . 2DON'T KNOW . . . . . . . . . . . . . . . . . . . . . . . . . . . 8
908YES NO DK
a) a) DURING PREGNANCY . . 1 2 8b) b) DURING DELIVERY. . . . . 1 2 8c) c) BREASTFEEDING . . . . . 1 2 8
909
AT LEAST OTHERONE 'YES'
910 YES . . . . . . . . . . . . . . . . . . . . . . . . . . . . . . . . . . . . 1NO . . . . . . . . . . . . . . . . . . . . . . . . . . . . . . . . . . . . 2DON'T KNOW . . . . . . . . . . . . . . . . . . . . . . . . . . . 8
911 YES . . . . . . . . . . . . . . . . . . . . . . . . . . . . . . . . . . . . 1NO . . . . . . . . . . . . . . . . . . . . . . . . . . . . . . . . . . . . 2DON'T KNOW/NOT SURE/DEPENDS. . . . . . . . . . 8
912 YES . . . . . . . . . . . . . . . . . . . . . . . . . . . . . . . . . . . . 1NO . . . . . . . . . . . . . . . . . . . . . . . . . . . . . . . . . . . . 2DON'T KNOW/NOT SURE/DEPENDS. . . . . . . . . . 8
913 YES . . . . . . . . . . . . . . . . . . . . . . . . . . . . . . . . . . . . 1NO . . . . . . . . . . . . . . . . . . . . . . . . . . . . . . . . . . . . 2DON'T KNOW/NOT SURE/DEPENDS. . . . . . . . . . 8
914 YES . . . . . . . . . . . . . . . . . . . . . . . . . . . . . . . . . . . . 1NO . . . . . . . . . . . . . . . . . . . . . . . . . . . . . . . . . . . . 2DON'T KNOW/NOT SURE/DEPENDS. . . . . . . . . . 8
915 YES . . . . . . . . . . . . . . . . . . . . . . . . . . . . . . . . . . . . 1NO . . . . . . . . . . . . . . . . . . . . . . . . . . . . . . . . . . . . 2DON'T KNOW/NOT SURE/DEPENDS. . . . . . . . . . 8
916 AGREE . . . . . . . . . . . . . . . . . . . . . . . . . . . . . . . . . 1DISAGREE . . . . . . . . . . . . . . . . . . . . . . . . . . . . . . 2DON'T KNOW/NOT SURE/DEPENDS. . . . . . . . . . 8
Do people talk badly about people living with HIV, or who are thought to be living with HIV?
Do you think people hesitate to take an HIV test because they are afraid of how other people will react if the test result is positive for HIV?
Do you think children living with HIV should be allowed to attend school with children who do not have HIV?
Is it possible for a healthy-looking person to have HIV?
Can people get HIV because of witchcraft or other supernatural means?
Can people get HIV by sharing food with a person who has HIV?
By breastfeeding?During delivery?During pregnancy?
Can HIV be transmitted from a mother to her baby:
911
CHECK 908:
Are there any special drugs that a doctor or a nurse can give to a woman infected with HIV to reduce the risk of transmission to the baby?
Do you agree or disagree with the following statement: I would be ashamed if someone in my family had HIV.
Do people living with HIV, or thought to be living with HIV, lose the respect of other people?
Would you buy fresh vegetables from a shopkeeper or vendor if you knew that this person had HIV?
SECTION 9. HIV/AIDS & STIs
SKIPCODING CATEGORIESQUESTIONS AND FILTERS
Can people reduce their chance of getting HIV by using a condom every time they have sex?
Can people get HIV from mosquito bites?
HIV is the virus that can lead to AIDS. Can people reduce their chance of getting HIV by having just one uninfected wives who has no other wives?
Now I would like to talk about something else. Have you ever heard of HIV or AIDS?
W-55

397
NO.
SECTION 9. HIV/AIDS & STIs
SKIPCODING CATEGORIESQUESTIONS AND FILTERS
917 YES . . . . . . . . . . . . . . . . . . . . . . . . . . . . . . . . . . . . 1NO . . . . . . . . . . . . . . . . . . . . . . . . . . . . . . . . . . . . 2SAYS SHE HAS HIV . . . . . . . . . . . . . . . . . . . . . . 3DON'T KNOW/NOT SURE/DEPENDS. . . . . . . . . . 8
918
HEARD ABOUT NOT HEARD ABOUTHIV OR AIDS HIV OR AIDS
a) b)YES . . . . . . . . . . . . . . . . . . . . . . . . . . . . . . . . . . . . 1NO . . . . . . . . . . . . . . . . . . . . . . . . . . . . . . . . . . . . 2
919
YES NO
920 YES . . . . . . . . . . . . . . . . . . . . . . . . . . . . . . . . . . . . 1NO . . . . . . . . . . . . . . . . . . . . . . . . . . . . . . . . . . . . 2DON'T KNOW . . . . . . . . . . . . . . . . . . . . . . . . . . . 8
921 YES . . . . . . . . . . . . . . . . . . . . . . . . . . . . . . . . . . . . 1NO . . . . . . . . . . . . . . . . . . . . . . . . . . . . . . . . . . . . 2DON'T KNOW . . . . . . . . . . . . . . . . . . . . . . . . . . . 8
922 YES . . . . . . . . . . . . . . . . . . . . . . . . . . . . . . . . . . . . 1NO . . . . . . . . . . . . . . . . . . . . . . . . . . . . . . . . . . . . 2DON'T KNOW . . . . . . . . . . . . . . . . . . . . . . . . . . . 8
923
HAS HAD AN HAS NOT HAD ANINFECTION INFECTION OR(ANY 'YES') DOES NOT KNOW
924 YES . . . . . . . . . . . . . . . . . . . . . . . . . . . . . . . . . . . . 1NO . . . . . . . . . . . . . . . . . . . . . . . . . . . . . . . . . . . . 2 926
925 PUBLIC SECTORGOVERNMENT HOSPITAL. . . . . . . . . . . . . . . . AREFERRAL HEALTH CENTRE. . . . . . . . . . . . . BMCH/HC . . . . . . . . . . . . . . . . . . . . . . . . . . . . . . CPRIMARY HEALTH UNIT (PHU). . . . . . . . . . . . . DMOBILE CLINIC . . . . . . . . . . . . . . . . . . . . . . . . . EOTHER PUBLIC SECTOR
F
PRIVATE MEDICAL SECTORPRIVATE HOSPITAL/DOCTOR/
CLINIC . . . . . . . . . . . . . . . . . . . . . . . . . . . GPHARMACY . . . . . . . . . . . . . . . . . . . . . . . . . H
OTHER PRIVATE MEDICAL SECTORI
OTHER SOURCESHOP . . . . . . . . . . . . . . . . . . . . . . . . . . . . . . J
OTHER X
926 YES . . . . . . . . . . . . . . . . . . . . . . . . . . . . . . . . . . . . 1NO . . . . . . . . . . . . . . . . . . . . . . . . . . . . . . . . . . . . 2DON'T KNOW . . . . . . . . . . . . . . . . . . . . . . . . . . . 8
Have you heard about infections that can be transmitted through sexual contact?
Apart from HIV, have you heard about other infections that can be transmitted through sexual contact?
926
926
(SPECIFY)
CHECK 918: HEARD ABOUT OTHER SEXUALLY TRANSMITTED INFECTIONS?
Now I would like to ask you some questions about your health in the last 12 months. During the last 12 months, have you had a disease which you got through sexual contact?
Sometimes women experience a bad-smelling abnormal genital discharge. During the last 12 months, have you had a bad-smelling abnormal genital discharge?
Sometimes women have a genital sore or ulcer. During the last 12 months, have you had a genital sore or ulcer?
CHECK 920, 921, AND 922:
The last time you had (PROBLEM FROM 920/921/922), did you seek any kind of advice or treatment?
PROBE TO IDENTIFY THE TYPE OF SOURCE.
IF UNABLE TO DETERMINE IF PUBLIC OR PRIVATE SECTOR, WRITE THE NAME OF THE PLACE.
(NAME OF PLACE)
Where did you go?
Any other place?
(SPECIFY)
(SPECIFY)
If a wife knows her husband has a disease that she can get during sexual intercourse, is she justified in asking that they use a condom when they have sex?
CHECK 901:
Do you fear that you could get HIV if you come into contact with the saliva of a person living with HIV?
W-56

The Somali Health and Demographic Survey398
NO.
1001
NUMBER OF INJECTIONS . . . . . . . . . .
NONE . . . . . . . . . . . . . . . . . . . . . . . . . . . . . . . . . . . . 00 1004
1002
NUMBER OF INJECTIONS . . . . . . . . . .
NONE . . . . . . . . . . . . . . . . . . . . . . . . . . . . . . . . . . . . 00 1004
1003 YES . . . . . . . . . . . . . . . . . . . . . . . . . . . . . . . . . . . . 1NO . . . . . . . . . . . . . . . . . . . . . . . . . . . . . . . . . . . . 2DON'T KNOW . . . . . . . . . . . . . . . . . . . . . . . . . . . . 8
1004 EVERY DAY . . . . . . . . . . . . . . . . . . . . . . . . . . . . 1SOME DAYS . . . . . . . . . . . . . . . . . . . . . . . . . . . . 2NOT AT ALL . . . . . . . . . . . . . . . . . . . . . . . . . . . . . . . 3
1005NUMBER OF CIGARETTES . . . . . . . .
1006 EVERY DAY . . . . . . . . . . . . . . . . . . . . . . . . . . . . 1SOME DAYS . . . . . . . . . . . . . . . . . . . . . . . . . . . . 2NOT AT ALL . . . . . . . . . . . . . . . . . . . . . . . . . . . . . . . 3 1008
1007 KRETEKS . . . . . . . . . . . . . . . . . . . . . . . . . . . . . . . APIPES FULL OF TOBACCO . . . . . . . . . . . . . . . . BCIGARS, CHEROOTS, OR CIGARILLOS . . . . . . . . CWATER PIPE . . . . . . . . . . . . . . . . . . . . . . . . . . . . DSNUFF BY MOUTH . . . . . . . . . . . . . . . . . . . . . . . . . ESNUFF BY NOSE . . . . . . . . . . . . . . . . . . . . . . . . . FCHEWING TOBACCO . . . . . . . . . . . . . . . . . . . . . . GBETEL QUID WITH TOBACCO . . . . . . . . . . . . . H
OTHER X
1008
BIG NOT A BIGPROBLEM PROBLEM
a) a) PERMISSION TO GO . . . . . 1 2
b) b) GETTING MONEY . . . . . . . . 1 2
c) c) DISTANCE . . . . . . . . . . . . . 1 2
d) d) GO ALONE . . . . . . . . . . . . . 1 2
On average, how many cigarettes do you currently smoke each day?
Do you currently smoke or use any other type of tobacco every day, some days, or not at all?
SKIPCODING CATEGORIESQUESTIONS AND FILTERS
1006
The last time you got an injection from a health worker, did he/she take the syringe and needle from a new, unopened package?
Do you currently smoke cigarettes every day, some days, or not at all?
SECTION 10. OTHER HEALTH ISSUES
Now I would like to ask you some other questions relating to health matters. Have you had an injection for any reason in the last 12 months?
IF YES: How many injections have you had?
IF NUMBER OF INJECTIONS IS 90 OR MORE, OR DAILY FOR 3 MONTHS OR MORE, RECORD '90'. IF NON-NUMERIC ANSWER, PROBE TO GET AN ESTIMATE.
Among these injections, how many were administered by a doctor, a nurse, a pharmacist, a dentist, or any other health worker?
IF NUMBER OF INJECTIONS IS 90 OR MORE, OR DAILY FOR 3 MONTHS OR MORE, RECORD '90'. IF NON-NUMERIC ANSWER, PROBE TO GET AN ESTIMATE.
What other type of tobacco do you currently smoke or use?
RECORD ALL MENTIONED.
(SPECIFY)
Many different factors can prevent women from getting medical advice or treatment for themselves. When you are sick and want to get medical advice or treatment, is each of the following a big problem or not a big problem:
The distance to the health facility?
Getting money needed for advice or treatment?
Getting permission to go to the doctor?
Not wanting to go alone?
W-57

399
NO. SKIPCODING CATEGORIESQUESTIONS AND FILTERS
SECTION 10. OTHER HEALTH ISSUES
1009 YES . . . . . . . . . . . . . . . . . . . . . . . . . . . . . . . . . . . . 1NO . . . . . . . . . . . . . . . . . . . . . . . . . . . . . . . . . . . . 2 1011
1010 MUTUAL HEALTH ORGANIZATION/COMMUNITY-BASED HEALTHINSURANCE . . . . . . . . . . . . . . . . . . . . . . . . . A
HEALTH INSURANCE THROUGHEMPLOYER . . . . . . . . . . . . . . . . . . . . . . . . . . . . B
SOCIAL SECURITY . . . . . . . . . . . . . . . . . . . . . . COTHER PRIVATELY PURCHASED
COMMERCIAL HEALTH INSURANCE . . . . . D
OTHER X
FISTULA
1011
YES . . . . . . . . . . . . . . . . . . . . . . . . . . . . . . . . . . . . 1 1013NO . . . . . . . . . . . . . . . . . . . . . . . . . . . . . . . . . . . . 2
1012 YES . . . . . . . . . . . . . . . . . . . . . . . . . . . . . . . . . . . . 1NO . . . . . . . . . . . . . . . . . . . . . . . . . . . . . . . . . . . . 2
1013 AFTER DELIVERED BABY . . . . . . . . . . . . . . . . 1AFTER HAD STILLBIRTH . . . . . . . . . . . . . . . . . . . 2NEITHER . . . . . . . . . . . . . . . . . . . . . . . . . . . . . . . 3 1016
1014 NORMAL LABOR/DELIVERY . . . . . . . . . . . . . . . . 1VERY DIFFICULT LABOR/DELIVERY . . . . . . . . . . 2
1015NUMBER OF DAYS AFTERDELIVERY/OTHER EVENT . . . . . . . . . .
1016 YES . . . . . . . . . . . . . . . . . . . . . . . . . . . . . . . . . . . . 1 1018NO . . . . . . . . . . . . . . . . . . . . . . . . . . . . . . . . . . . . 2
1017 DO NOT KNOW CAN BE FIXED . . . . . . . . . . . . . ADO NOT KNOW WHERE TO GO . . . . . . . . . . . . . BTOO EXPENSIVE . . . . . . . . . . . . . . . . . . . . . . . . . CTOO FAR . . . . . . . . . . . . . . . . . . . . . . . . . . . . . . . DPOOR QUALITY OF CARE . . . . . . . . . . . . . . . . . . . ECOULD NOT GET PERMISSION . . . . . . . . . . . . . FEMBARRASSMENT . . . . . . . . . . . . . . . . . . . . . . G
OTHER X
1018 HEALTH PROFESSIONALDOCTOR . . . . . . . . . . . . . . . . . . . . . . . . . . . . . . . 1CLINICAL OFFICER . . . . . . . . . . . . . . . . . . . . . . 2NURSE/MIDWIFE . . . . . . . . . . . . . . . . . . . . . . 3
OTHER PERSONCOMMUNITY/VILLAGE
HEALTH WORKER . . . . . . . . . . . . . . . . . . . 4HERBALIST . . . . . . . . . . . . . . . . . . . . . . . . . 5
OTHER 6
1019 YES . . . . . . . . . . . . . . . . . . . . . . . . . . . . . . . . . . . . 1NO . . . . . . . . . . . . . . . . . . . . . . . . . . . . . . . . . . . . 2
1020 YES, STOPPED COMPLETELY . . . . . . . . . . . . . 1NOT STOPPED BUT REDUCED . . . . . . . . . . . . . 2NOT STOPPED AT ALL . . . . . . . . . . . . . . . . . . . . . . 3DID NOT RECEIVE TREATMENT . . . . . . . . . . . . . 4
RECORD ALL MENTIONED.
What type of health insurance are you covered by?
Are you covered by any health insurance?
Sometimes a woman can have a problem of constant leakage of urine or stool from her vagina during the day and night. This problem usually occurs after a difficult childbirth, but may also occur after a sexual assault or after pelvic surgery.
Have you ever experienced a constant leakage of urine or stool from your vagina during the day and night?
Have you ever heard of this problem?
(SPECIFY)
1101
Have you sought treatment for this condition?
Why have you not sought treatment?
PROBE AND RECORD ALL MENTIONED.
(SPECIFY)
Did this problem start after you delivered a baby or had a stillbirth?
Did this problem start after a normal labor and delivery, or after a very difficult labor and delivery?
ENTER '90' IF 90 DAYS OR MORE.
How many days after delivery did the leakage start?
From whom did you last seek treatment?
(SPECIFY)
Did you have an operation to fix the problem?
Did the treatment stop the leakage completely?
IF NO: Did the treatment reduce the leakage?
1101
W-58

The Somali Health and Demographic Survey400
NO.
1101 YES . . . . . . . . . . . . . . . . . . . . . . . . . . . . . . . . . . . 1 1103NO . . . . . . . . . . . . . . . . . . . . . . . . . . . . . . . . . . . 2
1102 YES . . . . . . . . . . . . . . . . . . . . . . . . . . . . . . . . . . . 1NO . . . . . . . . . . . . . . . . . . . . . . . . . . . . . . . . . . . 2 1201
1103 YES . . . . . . . . . . . . . . . . . . . . . . . . . . . . . . . . . . . 1NO . . . . . . . . . . . . . . . . . . . . . . . . . . . . . . . . . . . 2 1109
1104 SUNNI. . . . . . . . . . . . . . . . . . . . . . . . . . . . . . . . . . . 1INTERMEDIATE . . . . . . . . . . . . . . . . . . . . . . . . . . . 2PHARAONIC . . . . . . . . . . . . . . . . . . . . . . . . . . . . . . 3DON'T KNOW . . . . . . . . . . . . . . . . . . . . . . . . . . . 8
1105
a) TYPE I . . . . . . . . . . . . . . . . . . . . . . . . 1
b) TYPE II . . . . . . . . . . . . . . . . . . . . . . . . 2
c) TYPE III . . . . . . . . . . . . . . . . . . . . . . . . 3
d) TYPE IV . . . . . . . . . . . . . . . . . . . . . . . . 4
DON'T KNOW . . . . . . . . . . . . . . . . . . . 8
1106AGE IN COMPLETED YEARS . . . . . . .
AS A BABY/DURING INFANCY . . . . . . . . . . . . . 95DON'T KNOW . . . . . . . . . . . . . . . . . . . . . . . . . . . 98
1107 TRADITIONALTRAD. CIRCUMCISER . . . . . . . . . . . . . . . . . . . 11TRAD. BIRTH ATTENDANT . . . . . . . . . . . . . 12
OTHER TRAD. 16
HEALTH PROFESSIONALDOCTOR . . . . . . . . . . . . . . . . . . . . . . . . . . . 21CLINICAL OFFICER . . . . . . . . . . . . . . . . . . . . . 22NURSE/MIDWIFE . . . . . . . . . . . . . . . . . . . . . 23OTHER HEALTH
PROFESSIONAL 26
DON'T KNOW . . . . . . . . . . . . . . . . . . . . . . . . . . . 98
1108
1116
(SPECIFY)
(SPECIFY)
SECTION 11. FEMALE CIRCUMCISION
QUESTIONS AND FILTERS CODING CATEGORIES SKIP
IF THE RESPONDENT DOES NOT KNOW THE EXACT AGE, PROBE TO GET AN ESTIMATE.
Please describe what was exactly done
CIRCLE ONLY ONE OPTION
HAS ONE OR MORE LIVING DAUGHTERS
BORN IN 2007 OR LATER
HAS NO LIVING DAUGHTERS
BORN IN 2007 OR LATER
Now I would like to ask some questions about a practice known as female circumcision. Have you ever heard of female circumcision?
In some countries, there is a practice in which a girl may have part of her genitals cut. Have you ever heard about this practice?
Have you yourself ever been circumcised?
What type of circumcision did you undergo?
How old were you when you were circumcised?
Who performed the circumcision?
All other procedures that involve pricking, piercing, stretching or incising of the clitoris and/or labia; introduction of corrosive substances into the vagina to narrow it
Excision of the clitoral hood (prepuce), with or without excision of part or all of the clitorisExcision of the clitoris with partial or total excision of the labia minoraExcision of part or all of the external genitalia and stitching/ narrowing of the vaginal opening (Infibulation)
CHECK 213, 215 AND 216:
W-59

401
1109
1111
BIRTH BIRTH BIRTHHISTORY HISTORY HISTORYNUMBER . . NUMBER . . NUMBER . .
NAME NAME NAME
1112 YES . . . . . . . . . . . . . . . . 1 YES . . . . . . . . . . . . . . . . 1 YES . . . . . . . . . . . . . . . . 1NO . . . . . . . . . . . . . . . . 2 NO . . . . . . . . . . . . . . . . 2 NO . . . . . . . . . . . . . . . . 2
(GO TO 1112 (GO TO 1112 (GO TO 1112IN NEXT COLUMN; IN NEXT COLUMN; IN FIRST COLUMN
OR IF NO MORE OR IF NO MORE OF NEWDAUGHTERS, DAUGHTERS, QUESTIONNAIRE; OR IFGO TO 1116) GO TO 1116) NO MORE DAUGHTERS,
GO TO 1116)
1113AGE IN AGE IN AGE IN
COMPLE- COMPLE- COMPLE-TED YRS . . TED YRS . . TED YRS . .
DON'T KNOW . . . . . . . 98 DON'T KNOW . . . . . . . 98 DON'T KNOW . . . . . . . 98
1114 YES . . . . . . . . . . . . . . . . 1 YES . . . . . . . . . . . . . . . . 1 YES . . . . . . . . . . . . . . . . 1NO . . . . . . . . . . . . . . . . 2 NO . . . . . . . . . . . . . . . . 2 NO . . . . . . . . . . . . . . . . 2DON'T KNOW . . . . . . . 8 DON'T KNOW . . . . . . . 8 DON'T KNOW . . . . . . . 8
1115 TRADITIONAL TRADITIONAL TRADITIONALTRADITIONAL TRADITIONAL TRADITIONAL
CIRCUMCISER . . 11 CIRCUMCISER . . 11 CIRCUMCISER . . 11TRAD. BIRTH TRAD. BIRTH TRAD. BIRTH
ATTENDANT . . 12 ATTENDANT . . 12 ATTENDANT . . 12OTHER TRAD. OTHER TRAD. OTHER TRAD.
16 16 16
HEALTH PROFESSIONAL HEALTH PROFESSIONAL HEALTH PROFESSIONALDOCTOR . . . . . . . 21 DOCTOR . . . . . . . 21 DOCTOR . . . . . . . 21CLINICAL OFFICER . . 22 CLINICAL OFFICER . . 22 CLINICAL OFFICER . . 22NURSE/MIDWIFE . . 23 NURSE/MIDWIFE . . 23 NURSE/MIDWIFE . . 23OTHER HEALTH OTHER HEALTH OTHER HEALTH
PROFESSIONAL PROFESSIONAL PROFESSIONAL26 26 26
DON'T KNOW . . . . . . . 98 DON'T KNOW . . . . . . . 98 DON'T KNOW . . . . . . . 98
1115 GO BACK TO 1111 IN GO BACK TO 1111 IN GO TO 1111 INNEXT COLUMN; OR, IF NEXT COLUMN; OR, IF FIRST COLUMN OF NEWNO MORE DAUGHTERS, NO MORE DAUGHTERS, QUESTIONNAIRE; OR IFGO TO 1116) GO TO 1116) NO MORE DAUGHTERS,
GO TO 1116)
1116 YES . . . . . . . . . . . . . . . . . . . . . . . . . . . . . . . . 1NO . . . . . . . . . . . . . . . . . . . . . . . . . . . . . . . . 2DON'T KNOW . . . . . . . . . . . . . . . . . . . . . . . . 8
1117 CONTINUED . . . . . . . . . . . . . . . . . . . . . . . . 1STOPPED . . . . . . . . . . . . . . . . . . . . . . . . . . . 2DEPENDS . . . . . . . . . . . . . . . . . . . . . . . . . . . 3DON'T KNOW . . . . . . . . . . . . . . . . . . . . . . . . 8
SECTION 11. FEMALE CIRCUMCISION
CHECK 213, 215 AND 216: ENTER IN THE TABLE THE BIRTH HISTORY NUMBER AND NAME OF EACH LIVING DAUGHTER BORN IN 2007 OR LATER. ASK THE QUESTIONS ABOUT ALL OF THESE DAUGHTERS. BEGIN WITH THE YOUNGEST DAUGHTER. (IF THERE ARE MORE THAN 3 DAUGHTERS, USE ADDITIONAL QUESTIONNAIRES).
Now I would like to ask you some questions about your (daughter/daughters).
NEXT-TO-YOUNGEST LIVING DAUGHTER
(SPECIFY)
RECORD '00' IF LESS THAN A YEAR
Do you believe that female circumcision is required by your religion?
Do you think that female circumcision should be continued, or should it be stopped?
SECOND-TO-YOUNGEST LIVING DAUGHTER
Is (NAME OF DAUGHTER) circumcised?
How old was (NAME OF DAUGHTER) when she was circumcised?
Was her genital area sewn closed?
Who performed the circumcision?
(SPECIFY) (SPECIFY) (SPECIFY)
(SPECIFY) (SPECIFY)
BIRTH HISTORY NUMBER AND NAME OF EACH LIVING DAUGHTER BORN IN 2007 OR LATER.
YOUNGEST LIVING DAUGHTER
IF THE RESPONDENT DOES NOT KNOW THE AGE, PROBE TO GET AN ESTIMATE.
W-60

The Somali Health and Demographic Survey402
NO. SKIP
1201NUMBER OF BIRTHS TO NATURAL MOTHER . . . . . . . . . . . . . . . . .
1202 CHECK 1201:
TWO OR MORE ONLT ONE BIRTH BIRTHS (RESPONDENT ONLY) 1301
1203NUMBER OF PRECEDING BIRTHS . . . . . . . . . . . . . . . . . .
1204 (1) (2) (3) (4) (5) (6)
1205 MALE 1 MALE 1 MALE 1 MALE 1 MALE 1 MALE 1FEMALE 2 FEMALE 2 FEMALE 2 FEMALE 2 FEMALE 2 FEMALE 2
1206 YES 1 YES 1 YES 1 YES 1 YES 1 YES 1NO 2 NO 2 NO 2 NO 2 NO 2 NO 2
DK 8 DK 8 DK 8 DK 8 DK 8 DK 8
1207
1208
1209
1210 YES 1 YES 1 YES 1 YES 1 YES 1 YES 1
NO 2 NO 2 NO 2 NO 2 NO 2 NO 2
How old is (NAME)?
SECTION 12. MATERNAL DEATHS
QUESTIONS AND FILTERS CODING CATEGORIES
How many births did your mother have before you were born?
What was the name given to your (oldest/ next oldest) brother or sister?
(SKIP TO 1208)
(SKIP TO 1208)
(GO TO 6) (GO TO 7)
(SKIP TO 1208)
(SKIP TO 1208)
(SKIP TO 1208)
(SKIP TO 1208)
Now I would like to ask you some questions about your brothers and sisters, that is, all of the children born to your natural mother, including those who are living with you, those living elsewhere and those who have died. How many children did your mother give birth to, including you?
Is (NAME) male or female?
Is (NAME) still alive?
(GO TO 3) (GO TO 4) (GO TO 5)(GO TO 2)
RECORD '00' IF LESS THAN ONE YEAR
How many years ago did (NAME) die?
How old was (NAME) when (he/she) died?
Was (NAME) pregnant when she died?
(IF MALE OR DIED BEFORE 12 YRS OR AFTER 49 YRS GO TO 5)
(IF MALE OR DIED BEFORE 12 YRS OR AFTER 49 YRS GO TO 6)
(IF MALE OR DIED BEFORE 12 YRS OR AFTER 49 YRS GO TO 7)
(IF MALE OR DIED BEFORE 12 YRS OR AFTER 49 YRS GO TO 2)
(IF MALE OR DIED BEFORE 12 YRS OR AFTER 49 YRS GO TO 3)
(IF MALE OR DIED BEFORE 12 YRS OR AFTER 49 YRS GO TO 4)
(SKIP TO 1213)
(SKIP TO 1213)
(GO TO 2) (GO TO 3) (GO TO 4) (GO TO 5)
(SKIP TO 1213)
(SKIP TO 1213)
(GO TO 6) (GO TO 7)
(SKIP TO 1213)
(SKIP TO 1213)
RECORD '00' IF LESS THAN ONE YEAR
W-61

403
1211 YES 1 YES 1 YES 1 YES 1 YES 1 YES 1
NO 2 NO 2 NO 2 NO 2 NO 2 NO 2
1212 YES 1 YES 1 YES 1 YES 1 YES 1 YES 1NO 2 NO 2 NO 2 NO 2 NO 2 NO 2
1213
1214 IF NO MORE BROTHERS OR SISTERS, GO TO 1301.
1204 (7) (8) (9) (10) (11) (12)
1205 MALE 1 MALE 1 MALE 1 MALE 1 MALE 1 MALE 1FEMALE 2 FEMALE 2 FEMALE 2 FEMALE 2 FEMALE 2 FEMALE 2
1206 YES 1 YES 1 YES 1 YES 1 YES 1 YES 1NO 2 NO 2 NO 2 NO 2 NO 2 NO 2
DK 8 DK 8 DK 8 DK 8 DK 8 DK 8
1207
1208
Did (NAME) die within six weeks after the end of a pregnancy or childbirth?
How many years ago did (NAME) die?
How old is (NAME)?
What was the name given to your (oldest/ next oldest) brother or sister?
Is (NAME) still alive?
RECORD '00' IF LESS THAN ONE YEAR
RECORD '00' IF LESS THAN ONE YEAR
Is (NAME) male or female?
Did (NAME) die during childbirth?
How many live born children did (NAME) give birth to during her lifetime?
(GO TO 13)
(SKIP TO 1213)
(SKIP TO 1213)
(GO TO 12)
(SKIP TO 1208)
(SKIP TO 1208)
(SKIP TO 1213)
(SKIP TO 1213)
(SKIP TO 1213)
(SKIP TO 1213)
(GO TO 8) (GO TO 9) (GO TO 10) (GO TO 11)
(SKIP TO 1208)
(SKIP TO 1208)
(SKIP TO 1208)
(SKIP TO 1208)
(GO TO 8) (GO TO 9) (GO TO 10) (GO TO 11) (GO TO 12) (GO TO 13)
W-62

The Somali Health and Demographic Survey404
1209
1210 YES 1 YES 1 YES 1 YES 1 YES 1 YES 1
NO 2 NO 2 NO 2 NO 2 NO 2 NO 2
1211 YES 1 YES 1 YES 1 YES 1 YES 1 YES 1
NO 2 NO 2 NO 2 NO 2 NO 2 NO 2
1212 YES 1 YES 1 YES 1 YES 1 YES 1 YES 1NO 2 NO 2 NO 2 NO 2 NO 2 NO 2
1213
1214 IF NO MORE BROTHERS OR SISTERS, GO TO 1301.
How many live born children did (NAME) give birth to during her lifetime?
Did (NAME) die during childbirth?
How old was (NAME) when (he/she) died?
Was (NAME) pregnant when she died?
Did (NAME) die within six weeks after the end of a pregnancy or childbirth?
(IF MALE OR DIED BEFORE 12 YRS GO TO 11)
(SKIP TO 1213)
(SKIP TO 1213)
(SKIP TO 1213)
(SKIP TO 1213)
(SKIP TO 1213)
(SKIP TO 1213)
(SKIP TO 1213)
(SKIP TO 1213)
(SKIP TO 1213)
(SKIP TO 1213)
(SKIP TO 1213)
(SKIP TO 1213)
(IF MALE OR DIED BEFORE 12 YRS GO TO 13)
(IF MALE OR DIED BEFORE 12 YRS GO TO 8)
(IF MALE OR DIED BEFORE 12 YRS GO TO 9)
(IF MALE OR DIED BEFORE 12 YRS GO TO 12)
(IF MALE OR DIED BEFORE 12 YRS GO TO 10)
W-63

405
NO.
1301
PRIVACY PRIVACYOBTAINED . . . . . . . . . . 1 NOT POSSIBLE . . . . . . . . . . 2 1331
1302
1303
YES NO DK
a) ABUSE . . . . . . . . . . 1 2 8b) HH DECISION . . . . . . . . 1 2 8c) CHILDREN DECISION . . 1 2 8d) BETTER TREATMENT . . 1 2 8e) NO LIVING COSTS . . . . . 1 2 8f) EDU DENIAL . . . . . . . . . . 1 2 8g) FORCED MARRIAGE. . . . . 1 2 8h) RAPE . . . . . . . . . . . . . . . . 1 2 8i) SEX HARASSMENT. . . . . 1 2 8j) FORCED LABOUR . . . . . 1 2 8
k) OTHER 1 2
1304 HUSBAND . . . . . . . . . . . . . . . . . . . . . . A MOTHER/STEP-MOTHER . . . . . . . . . . . B
FATHER/STEP-FATHER. . . . . . . . . . . . . CSISTER/BROTHER . . . . . . . . . . . . . . . . DDAUGHTER/SON . . . . . . . . . . . . . . . . EOTHER RELATIVE . . . . . . . . . . . . . . . . FIN-LAWS . . . . . . . . . . . . . . . . . . . . . . . . . GTEACHER . . . . . . . . . . . . . . . . . . . . . . HEMPLOYER/SOMEONE AT WORK. . . . . IPOLICE/SOLDIER . . . . . . . . . . . . . . . . J
OTHER K
1305 AT HOME. . . . . . . . . . . . . . . . . . . . . . . . . 1 WORKPLACE. . . . . . . . . . . . . . . . . . . . . . 2
STREET . . . . . . . . . . . . . . . . . . . . . . . . . 3SCHOOL . . . . . . . . . . . . . . . . . . . . . . . . . 4WATER POINT . . . . . . . . . . . . . . . . . . . 5RURAL/GRAZING AREAS . . . . . . . . . . . 6MARKET PLACE . . . . . . . . . . . 7NEIGHBOURHOOD . . . . . . . . . . . 9
OTHER 96
1306 CURRENTLY MARRIED OR WIDOWED
DIVORCED/ABANDONED
CHECK FOR PRESENCE OF OTHERS:DO NOT CONTINUE UNTIL PRIVACY IS ENSURED.
READ TO THE RESPONDENT:Now I would like to ask you questions about some other important aspects of a woman's life. You may find some of these questions very personal. However, your answers are crucial for helping to understand the condition of women in in your country. Let me assure you that your answers are completely confidential and will not be told to anyone and no one else in your household will know that you were asked these questions. If I ask you any question you don't want to answer, just let me know and I will go on to the next question.
SECTION 13. GENDER BASED VIOLENCE (GBV)
QUESTIONS AND FILTERS CODING CATEGORIES SKIP
First I am going to ask you about your understanding of domestic violence.What does domestic violence mean to you? Does it mean:
Physical abuse?No participation in decision-making for household?No participation in decision-making for children?Better treatment of males than females?Failing to meet basic living costs?Denial of education?Forced marriage?Rape?
Denial of inheritance?
Other (SPECIFY)
Who is the person who commits the most violent acts against women in the community?
(SPECIFY)
Sexual harassment?
Where do most violent acts take place?
(SPECIFY)
CHECK 119 & 120
1318
W-64
The Somali Health and Demographic Survey406
1307YES NO DK
a) a) GOES OUT . . . . . . . . 1 2 8b) b) NEGLECTS CHILDREN 1 2 8c) c) NEG. HH DUTIES 1 2 8d) d) ARGUES 1 2 8e) e) WASTES RESOURCES 1 2 8g) e) REFUSES SEX 1 2 8
1308
YES NO DK
a) JEALOUS . . . . . . . . . . 1 2 8b) ACCUSES . . . . . . . . . . 1 2 8c) NOT MEET FRIENDS . . 1 2 8d) NO FAMILY . . . . . . . . . . 1 2 8e) WHERE YOU ARE . . . . . 1 2 8
1309
A. B.
SOME- NOT IN LASTEVER OFTEN TIMES 12 MONTHS
a) YES 1 1 2 3NO 2
b) YES 1 1 2 3NO 2
c) YES 1 1 2 3
NO 2
1310 A. B.
SOME- NOT IN LASTEVER OFTEN TIMES 12 MONTHS
a) YES 1 1 2 3NO 2
b) YES 1 1 2 3NO 2
c) YES 1 1 2 3NO 2
d) YES 1 1 2 3NO 2
Now, I am going to ask you about some situations which happen to some women. Please tell me if these apply to your relationship with your current (former) husband?
He (is/was) jealous or angry if you (talk/talked) to other men?
Slap you, push you, shake you, or throw something at you?
Twist your arm or pull your hair?
Punch you with his fist or with something that could hurt you?
Kick you, drag you, or beat you up?
How often did this happen during the last 12 months: often, only sometimes, or not at all?
Say or do something to humiliate you in front of others?
Threaten to hurt or harm you or someone you care about?
Insult you or make you feel bad about yourself?
Did your (last) husband ever do any of the following things to you:
How often did this happen during the last 12 months: often, only sometimes, or not at all?
Did your (last) husband ever:
He frequently (accuses/accused) you of being unfaithful?He (does/did) not permit you to meet your female friends?He (tries/tried) to limit your contact with your family?He (insists/insisted) on knowing where you (are/were) at all times?
Now I need to ask some more questions about your relationship with your (last) husband.
If she wastes resources?If she refuses to have sex with him?
If she argues with him?If she neglects household duties including cooking?If she neglects the children?If she goes out without telling him?
In your opinion, is a husband justified in hitting or beating his wife in the following situations:
W-65

407
e) YES 1 1 2 3NO 2
f) YES 1 1 2 3NO 2
g) YES 1 1 2 3NO 2
1311 AT LEAST ONE NOT A SINGLE
'YES' 'YES'
1312 NUMBER OF YEARS . . . . .
BEFORE MARRIAGE . . . . . . . . . . . . . 95
1313
a) YES . . . . . . . . . . . . . . . . . . . . . . . . . . . . 1NO . . . . . . . . . . . . . . . . . . . . . . . . . . . . 2
b) YES . . . . . . . . . . . . . . . . . . . . . . . . . . . . 1NO . . . . . . . . . . . . . . . . . . . . . . . . . . . . 2
c) YES . . . . . . . . . . . . . . . . . . . . . . . . . . . . 1NO . . . . . . . . . . . . . . . . . . . . . . . . . . . . 2
1314 YES . . . . . . . . . . . . . . . . . . . . . . . . . . . . 1 NO . . . . . . . . . . . . . . . . . . . . . . . . . . . . 2 1316
1315 OFTEN . . . . . . . . . . . . . . . . . . . . . . . . . 1 SOMETIMES . . . . . . . . . . . . . . . . . . . . . . 2
NEVER . . . . . . . . . . . . . . . . . . . . . . . . . 3
1316 MOST OF THE TIME AFRAID . . . . . . . . 1 SOMETIMES AFRAID . . . . . . . . . . . . . 2 NEVER AFRAID . . . . . . . . . . . . . . . . 3
1317
MARRIED MORE MARRIED ONCETHAN ONCE
A. B.
0 - 11 12+EVER MONTHS MONTHS DON'T
AGO AGO REMEMBER
a) YES 1 1 2 3NO 2
b) YES 1 1 2 3NO 2
1314
Try to choke you or burn you on purpose?
Threaten or attack you with a knife, gun, or other weapon?
Physically force you to have sexual intercourse with him when you did not
CHECK 1310 (a-g):
Have you ever hit, slapped, kicked, or done anything else to physically hurt your (last) husband at times when he was not already beating or physically hurting you?
In the last 12 months, how often have you done this to your (last) husband: often, only sometimes, or not at all?
Are (Were) you afraid of your (last) husband: most of the time, sometimes, or never?
CHECK121:
How long after you first got married with your (last) husband did (this/any of these things) first happen?
IF LESS THAN ONE YEAR, RECORD '00'.
Did the following ever happen as a result of what your (last) husband did to you:
You had cuts, bruises, or aches?
You had eye injuries, sprains, dislocations, or burns?
You had deep wounds, broken bones, broken teeth, or any other serious injury?
1318
So far we have been talking about the behavior of your (current/last) husband. Now I want to ask you about the behavior of any previous husband.
How long ago did this last happen?
Did any previous husband ever hit, slap, kick, or do anything else to hurt you physically?Did any previous husband physically force you to have intercourse or perform any other sexual acts against your will?
W-66

The Somali Health and Demographic Survey408
1318
CURRENTLY NOT IN UNIONMARRIED
a) b) YES . . . . . . . . . . . . . . . . . . . . . . . . . . . . 1NO . . . . . . . . . . . . . . . . . . . . . . . . . . . . 2 REFUSED TO ANSWER/ 1321
NO ANSWER . . . . . . . . . . . . . . . . 3
From the time you were 12 years old has anyone other than your husband hit you, slapped you, kicked you, or done anything else to hurt you physically?
From the time you were 12 years old has anyone hit you, slapped you, kicked you, or done anything else to hurt you physically?
CHECK119 &120:
W-67

409
1319 MOTHER/STEP-MOTHER . . . . . . . . . . . AFATHER/STEP-FATHER . . . . . . . . . . . B
SISTER/BROTHER . . . . . . . . . . . . . . . . CDAUGHTER/SON . . . . . . . . . . . . . . . . DOTHER RELATIVE . . . . . . . . . . . . . . . . EMOTHER-IN-LAW . . . . . . . . . . . . . . . . FFATHER-IN-LAW . . . . . . . . . . . . . . . . GOTHER IN-LAW . . . . . . . . . . . . . . . . HNEIGHBOUR . . . . . . . . . . . . . . . . . . . . . . ITEACHER . . . . . . . . . . . . . . . . . . . . . . J
EMPLOYER/SOMEONE AT WORK. . . . . K
POLICE/SOLDIER . . . . . . . . . . . . . . . . L
MILITIA/GANGS . . . . . . . . . . . . . . . . . . . M
OTHER X
1320 OFTEN . . . . . . . . . . . . . . . . . . . . . . . . . 1SOMETIMES . . . . . . . . . . . . . . . . . . . . . . 2
NOT AT ALL . . . . . . . . . . . . . . . . . . . 3
1321
EVER BEEN NEVER BEENPREGNANT PREGNANT 1324
('YES' ON 201 OR 226 OR 230)
1322 YES . . . . . . . . . . . . . . . . . . . . . . . . . . . . 1NO . . . . . . . . . . . . . . . . . . . . . . . . . . . . 2 1324
1323 CURRENT HUSBAND. . . . . . . . . . . . . . . . A MOTHER/STEP-MOTHER . . . . . . . . . . . B
FATHER/STEP-FATHER. . . . . . . . . . . . . CSISTER/BROTHER . . . . . . . . . . . . . . . . DDAUGHTER/SON . . . . . . . . . . . . . . . . EOTHER RELATIVE . . . . . . . . . . . . . . . . FFORMER HUSBAND. . . . . . . . . . . . . . . . GMOTHER-IN-LAW . . . . . . . . . . . . . . . . HFATHER-IN-LAW . . . . . . . . . . . . . . . . IOTHER IN-LAW . . . . . . . . . . . . . . . . . . . JNEIGHBOUR . KTEACHER . LEMPLOYER/SOMEONE AT WORK. . . . . MPOLICE/SOLDIER . . . . . . . . . . . . . . . . NMILITIA/GANGS . . . . . . . . . . . . . . . . . . . O
OTHER X
Who has hurt you in this way?
Anyone else?
RECORD ALL MENTIONED.
CHECK 201, 226, AND 230:
Has any one ever hit, slapped, kicked, or done anything else to hurt you physically while you were pregnant?
Who has done any of these things to physically hurt you while you were pregnant?
Anyone else?
RECORD ALL MENTIONED.
(SPECIFY)
(SPECIFY)
In the last 12 months, how often has (this person/have these persons) physically hurt you: often, only sometimes, or not at all?
W-68

The Somali Health and Demographic Survey410
1324
CURRENTLY NOT IN UNIONMARRIED
a) b)
YES . . . . . . . . . . . . . . . . . . . . . . . . . . . . 1NO . . . . . . . . . . . . . . . . . . . . . . . . . . . . 2
1325
AT LEAST ONE NOT A SINGLE'YES' 'YES'
1326 YES . . . . . . . . . . . . . . . . . . . . . . . . . . . . 1 NO . . . . . . . . . . . . . . . . . . . . . . . . . . . . 2 1329
1327 OWN FAMILY . . . . . . . . . . . . . . . . . . . AHUSBAND'S FAMILY. . . . . . . . . . . . . . . B
CURRENT/FORMER HUSBAND . . . . . . . . . . . . . . . . . C
FRIEND . . . . . . . . . . . . . . . . . . . . . . ENEIGHBOR . . . . . . . . . . . . . . . . . . . . . . FRELIGIOUS LEADER . . . . . . . . . . . . . G 1329DOCTOR/MEDICAL PERSONNEL. . . . . HPOLICE . . . . . . . . . . . . . . . . . . . . . . ILAWYER . . . . . . . . . . . . . . . . . . . . . . JSOCIAL SERVICE ORGANIZATION . . K
OTHER X
1328 YES . . . . . . . . . . . . . . . . . . . . . . . . . . . . 1 NO . . . . . . . . . . . . . . . . . . . . . . . . . . . . 2
1329 YES, YES, MORE ONCE THAN ONCE NO
HUSBAND . . . . . . . . . . . . . 1 2 3OTHER MALE ADULT. . . . . 1 2 3FEMALE ADULT . . . . . . . 1 2 3
1330
1331HOURS . . . . . . . . . . . . . . . . . . . . . . . . .
MINUTES . . . . . . . . . . . . . . . . . . . . . . . . .
DID YOU HAVE TO INTERRUPT THE INTERVIEW BECAUSE SOME ADULT WAS TRYING TO LISTEN, OR CAME INTO THE ROOM, OR INTERFERED IN ANY OTHER WAY?
INTERVIEWER'S COMMENTS/EXPLANATION FOR NOT COMPLETING THE DOMESTIC VIOLENCE MODULE.
RECORD ALL MENTIONED.
(SPECIFY)
Have you ever told any one about this?
THANK THE RESPONDENT FOR HER COOPERATION AND REASSURE HER ABOUT THE CONFIDENTIALITY OF HER ANSWERS. FILL OUT THE QUESTIONS BELOW WITH REFERENCE TO THE DOMESTIC VIOLENCE MODULE ONLY.
CHECK 1310 (a-g) and 1317 (a,b), 1322:
1329
Thinking about what you yourself have experienced among the different things we have been talking about, have you ever tried to seek help?
From whom have you sought help?
Anyone else?
RECORD THE TIME YOU END THE INTERVIEW.
In the last 12 months, has anyone raped you?
In the last 12 months has anyone physically forced you to have sexual intercourse? 1326
CHECK119&120:
W-69

411
Never-married Woman’s Questionnaire

The Somali Health and Demographic Survey412
`
SOMALI MINISTRIE'S OF PLANNING AND HEALTH
QUESTIONNAIRE SERIAL NUMBER
NAME CODE
REGION . . . . . . . . . . . . . . . . . . . . . . . . . . . . . . . . . . . . . . . . . . . . . . . . . . . . . . . . . . . . . . . . . . . . . . .
PRE-WAR NAME OF THE DISTRICT . . . . . . . . . . . . . . . . . . . . . . . . . . . . . . . . . . . . . . . . . . . . . . . . . . . . . .
CURRENT NAME OF THE DISTRICT
SETTLEMENT
EA TYPE (1=RURAL/IDP 2=URBAN/IDP 3=NOMADIC). . . . . . . . . . . . . . . . . . . . . . . . . . . . . . . . . . . . . . . .
EA CODE. . . . . . . . . . . . . . . . . . . . . . . . . . . . . . . . . . . . . . . . . . . . . . . . . . . . . . . . . . . . . . . . . . . . . . . . . . . .
HOUSEHOLD SERIAL NUMBER IN THE EA. . . . . . . . . . . . . . . . . . . . . . . . . . . . . . . . . . . . . . . . . . . . . . . . . . . . . .
DATE DAY
MONTH
YEARINTERVIEWER'SNAME INT. NO.
RESULT* RESULT*
NEXT VISIT: DATETOTAL NUMBER
TIME OF VISITS
*RESULT CODES: 1 COMPLETED 4 REFUSED2 NOT AT HOME 5 PARTLY COMPLETED 7 OTHER3 POSTPONED 6 INCAPACITATED
LANGUAGE OF LANGUAGE OF NATIVE LANGUAGEQUESTIONNAIRE** INTERVIEW** OF RESPONDENT**
LANGUAGE OF **LANGUAGE CODES:QUESTIONNAIRE** 01 ENGLISH 03 LANGUAGE
02 SOMALI SPECIFY
SUPERVISOR FIELD EDITOR OFFICE EDITOR KEYED IN BY
NAME . . . . . . . . . . . . . . . .
DATE . . . . . . . . . . . . . . . .
CODE . . . . . . . . . . . . . . . .
INTERVIEWER NO.
NNEEVVEERR MMAARRRRIIEEDD WWOOMMAANN''SS QQUUEESSTTIIOONNNNAAIIRREE
IDENTIFICATION
REG. CODE DIST CODE EA CODE HH SERIAL NO.
0 1ENGLISH
SPECIFY
INTERVIEWER VISITS
1 2 3 FINAL VISIT
2017-2019
W-1

413
RESPONDENT AGREES RESPONDENT DOES NOT AGREETO BE INTERVIEWED . . 1 TO BE INTERVIEWED . . 2 END
NO.
101HOURS . . . . . . . . . . . . . . . . . . . . . . . .
MINUTES . . . . . . . . . . . . . . . . . . . . . . . .
102MONTH . . . . . . . . . . . . . . . . . . . . . . . .
DON'T KNOW MONTH . . . . . . . . . . . . . . . . . . . . . 98
YEAR . . . . . . . . . . . . . . . .
DON'T KNOW YEAR . . . . . . . . . . . . . . . . . . . . . 9998
103AGE IN COMPLETED YEARS . . . . . . .
104 YES . . . . . . . . . . . . . . . . . . . . . . . . . . . . . . . . . . . 1NO . . . . . . . . . . . . . . . . . . . . . . . . . . . . . . . . . . . 2 108
105 KORANIC . . . . . . . . . . . . . . . . . . . . . . . . . . . . . . 1PRIMARY . . . . . . . . . . . . . . . . . . . . . . . . . . . . . . 2SECONDARY . . . . . . . . . . . . . . . . . . . . . . . . . . . 3HIGHER . . . . . . . . . . . . . . . . . . . . . . . . . . . . . . 4
106
[GRADE/FORM/YEAR] . . . . . . . . . . . . .
107
KORANIC, HIGHER 110PRIMARY ORSECONDARY
108 CANNOT READ AT ALL . . . . . . . . . . . . . . . . . . . 1ABLE TO READ ONLY PART OF
THE SENTENCE. . . . . . . . . . . . . . . . . . . . . . . . 2ABLE TO READ WHOLE SENTENCE. . . . . . . . . . 3NO CARD WITH REQUIRED
LANGUAGE 4
BLIND/VISUALLY IMPAIRED . . . . . . . . . . . . . . . . 5
CHECK 105:
Now I would like you to read this sentence to me.
SHOW CARD TO RESPONDENT.
IF RESPONDENT CANNOT READ WHOLE SENTENCE,PROBE: Can you read any part of the sentence to me?
COMPARE AND CORRECT 102 AND/OR 103IF INCONSISTENT.
IF COMPLETED LESS THAN ONE YEAR AT THAT LEVEL, RECORD '00'.
RECORD THE START TIME.
SIGNATURE OF INTERVIEWER
In what month and year were you born?
How old were you at your last birthday?
Have you ever attended school?
What is the highest [GRADE/FORM/YEAR] you completed at that level?
What is the highest level of school you attended: primary, secondary, or higher?
INTRODUCTION AND CONSENT
SECTION 1. RESPONDENT'S BACKGROUND
QUESTIONS AND FILTERS CODING CATEGORIES SKIP
DATE
Hello. My name is _______________________________________. I am working with [NAME OF ORGANIZATION]. We are conducting a survey about health and related topics all over [NAME OF COUNTRY]. The information we collect will help the government to plan health and other services. Your household was selected for the survey. I would like to ask you some questions about your household. The questions usually take about 45 to 60 minutes. All of the answers you give will be confidential and will not be shared with anyone other than members of our survey team. your participation in the survey is voluntary, but we hope you will agree to answer the questions since your views are important. If I ask you any question you don't want to answer, just let me know and I will go on to the next question or you can stop the interview at any time. In case you need more information about the survey, you may contact the ministry of interior/planning and/or health.
Do you have any questions?May I begin the interview now?
(SPECIFY LANGUAGE)
W-2

The Somali Health and Demographic Survey414
NO.
SECTION 1. RESPONDENT'S BACKGROUND
QUESTIONS AND FILTERS CODING CATEGORIES SKIP
109
CODE '2', '3' CODE '1' OR '5'OR '4' CIRCLED 111
CIRCLED
110 AT LEAST ONCE A WEEK . . . . . . . . . . . . . . . . . . . 1LESS THAN ONCE A WEEK . . . . . . . . . . . . . . . . 2NOT AT ALL . . . . . . . . . . . . . . . . . . . . . . . . . . . 3
111 AT LEAST ONCE A WEEK . . . . . . . . . . . . . . . . . . . 1LESS THAN ONCE A WEEK . . . . . . . . . . . . . . . . 2NOT AT ALL . . . . . . . . . . . . . . . . . . . . . . . . . . . 3
112 AT LEAST ONCE A WEEK . . . . . . . . . . . . . . . . . . . 1LESS THAN ONCE A WEEK . . . . . . . . . . . . . . . . 2NOT AT ALL . . . . . . . . . . . . . . . . . . . . . . . . . . . 3
113 YES . . . . . . . . . . . . . . . . . . . . . . . . . . . . . . . . . . . 1NO . . . . . . . . . . . . . . . . . . . . . . . . . . . . . . . . . . . 2
114 YES . . . . . . . . . . . . . . . . . . . . . . . . . . . . . . . . . . . 1NO . . . . . . . . . . . . . . . . . . . . . . . . . . . . . . . . . . . 2
115 YES . . . . . . . . . . . . . . . . . . . . . . . . . . . . . . . . . . . 1NO . . . . . . . . . . . . . . . . . . . . . . . . . . . . . . . . . . . 2
116 YES . . . . . . . . . . . . . . . . . . . . . . . . . . . . . . . . . . . 1NO . . . . . . . . . . . . . . . . . . . . . . . . . . . . . . . . . . . 2 201
117YES . . . . . . . . . . . . . . . . . . . . . . . . . . . . . . . . . . . 1NO . . . . . . . . . . . . . . . . . . . . . . . . . . . . . . . . . . . 2 201
118 ALMOST EVERY DAY . . . . . . . . . . . . . . . . . . . . . 1AT LEAST ONCE A WEEK . . . . . . . . . . . . . . . . . . . 2LESS THAN ONCE A WEEK . . . . . . . . . . . . . . . . 3NOT AT ALL . . . . . . . . . . . . . . . . . . . . . . . . . . . 4
CHECK 108:
Have you ever used the internet?
In the last 12 months, have you used the internet?
Do you read a newspaper or magazine at least once a week, less than once a week or not at all?
IF NECESSARY, PROBE FOR USE FROM ANY LOCATION, WITH ANY DEVICE.
During the last one month, how often did you use the internet: almost every day, at least once a week, less than once a week, or not at all?
Do you own a mobile telephone?
Do you use a mobile phone for any financial transactions?
Do you have an account in a bank or other financial institution that you yourself use?
Do you listen to the radio at least once a week, less than once a week or not at all?
Do you watch television at least once a week, less than once a week or not at all?
W-3

415
NO.
201 YES . . . . . . . . . . . . . . . . . . . . . . . . . . . . . . . . . . . 1NO . . . . . . . . . . . . . . . . . . . . . . . . . . . . . . . . . . . 2 218
202 YES . . . . . . . . . . . . . . . . . . . . . . . . . . . . . . . . . . . 1NO . . . . . . . . . . . . . . . . . . . . . . . . . . . . . . . . . . . 2DON'T KNOW . . . . . . . . . . . . . . . . . . . . . . . . . . . 8
203 YES . . . . . . . . . . . . . . . . . . . . . . . . . . . . . . . . . . . 1NO . . . . . . . . . . . . . . . . . . . . . . . . . . . . . . . . . . . 2DON'T KNOW . . . . . . . . . . . . . . . . . . . . . . . . . . . 8
204 YES . . . . . . . . . . . . . . . . . . . . . . . . . . . . . . . . . . . 1NO . . . . . . . . . . . . . . . . . . . . . . . . . . . . . . . . . . . 2DON'T KNOW . . . . . . . . . . . . . . . . . . . . . . . . . . . 8
205 YES . . . . . . . . . . . . . . . . . . . . . . . . . . . . . . . . . . . 1NO . . . . . . . . . . . . . . . . . . . . . . . . . . . . . . . . . . . 2DON'T KNOW . . . . . . . . . . . . . . . . . . . . . . . . . . . 8
206 YES . . . . . . . . . . . . . . . . . . . . . . . . . . . . . . . . . . . 1NO . . . . . . . . . . . . . . . . . . . . . . . . . . . . . . . . . . . 2DON'T KNOW . . . . . . . . . . . . . . . . . . . . . . . . . . . 8
207 YES . . . . . . . . . . . . . . . . . . . . . . . . . . . . . . . . . . . 1NO . . . . . . . . . . . . . . . . . . . . . . . . . . . . . . . . . . . 2DON'T KNOW . . . . . . . . . . . . . . . . . . . . . . . . . . . 8
208YES NO DK
a) a) DURING PREGNANCY . . 1 2 8b) b) DURING DELIVERY. . . . . 1 2 8c) c) BREASTFEEDING . . . . . 1 2 8
209
AT LEAST OTHERONE 'YES'
210 YES . . . . . . . . . . . . . . . . . . . . . . . . . . . . . . . . . . . 1NO . . . . . . . . . . . . . . . . . . . . . . . . . . . . . . . . . . . 2DON'T KNOW . . . . . . . . . . . . . . . . . . . . . . . . . . . 8
211 YES . . . . . . . . . . . . . . . . . . . . . . . . . . . . . . . . . . . 1NO . . . . . . . . . . . . . . . . . . . . . . . . . . . . . . . . . . . 2DON'T KNOW/NOT SURE/DEPENDS. . . . . . . . . . 8
212 YES . . . . . . . . . . . . . . . . . . . . . . . . . . . . . . . . . . . 1NO . . . . . . . . . . . . . . . . . . . . . . . . . . . . . . . . . . . 2DON'T KNOW/NOT SURE/DEPENDS. . . . . . . . . . 8
213 YES . . . . . . . . . . . . . . . . . . . . . . . . . . . . . . . . . . . 1NO . . . . . . . . . . . . . . . . . . . . . . . . . . . . . . . . . . . 2DON'T KNOW/NOT SURE/DEPENDS. . . . . . . . . . 8
214 YES . . . . . . . . . . . . . . . . . . . . . . . . . . . . . . . . . . . 1NO . . . . . . . . . . . . . . . . . . . . . . . . . . . . . . . . . . . 2DON'T KNOW/NOT SURE/DEPENDS. . . . . . . . . . 8
215 YES . . . . . . . . . . . . . . . . . . . . . . . . . . . . . . . . . . . 1NO . . . . . . . . . . . . . . . . . . . . . . . . . . . . . . . . . . . 2DON'T KNOW/NOT SURE/DEPENDS. . . . . . . . . . 8
216 AGREE . . . . . . . . . . . . . . . . . . . . . . . . . . . . . . . . 1DISAGREE . . . . . . . . . . . . . . . . . . . . . . . . . . . . . 2DON'T KNOW/NOT SURE/DEPENDS. . . . . . . . . . 8
217 YES . . . . . . . . . . . . . . . . . . . . . . . . . . . . . . . . . . . 1NO . . . . . . . . . . . . . . . . . . . . . . . . . . . . . . . . . . . 2SAYS SHE HAS HIV . . . . . . . . . . . . . . . . . . . . . 3DON'T KNOW/NOT SURE/DEPENDS. . . . . . . . . . 8
SECTION 2. HIV/AIDS AND VACCINATION
SKIPCODING CATEGORIESQUESTIONS AND FILTERS
Can people reduce their chance of getting HIV by using a condom every time they have sex?
Can people get HIV from mosquito bites?
HIV is the virus that can lead to AIDS. Can people reduce their chance of getting HIV by having just one uninfected spouse who has no other relations?
Now I would like to talk about something else. Have you ever heard of HIV or AIDS?
211
CHECK 208:
Are there any special drugs that a doctor or a nurse can give to a woman infected with HIV to reduce the risk of transmission to the baby?
Do you fear that you could get HIV if you come into contact with the saliva of a person living with HIV?
Do you agree or disagree with the following statement: I would be ashamed if someone in my family had HIV.
Do people living with HIV, or thought to be living with HIV, lose the respect of other people?
Would you buy fresh vegetables from a shopkeeper or vendor if you knew that this person had HIV?
Is it possible for a healthy-looking person to have HIV?
Can people get HIV because of witchcraft or other supernatural means?
Can people get HIV by sharing food with a person who has HIV?
By breastfeeding?During delivery?During pregnancy?
Can HIV be transmitted from a mother to her baby:
Do people talk badly about people living with HIV, or who are thought to be living with HIV?
Do you think people hesitate to take an HIV test because they are afraid of how other people will react if the test result is positive for HIV?
Do you think children living with HIV should be allowed to attend school with children who do not have HIV?
W-4

The Somali Health and Demographic Survey416
NO.
SECTION 2. HIV/AIDS AND VACCINATION
SKIPCODING CATEGORIESQUESTIONS AND FILTERS
218
HEARD ABOUT NOT HEARD ABOUTHIV OR AIDS HIV OR AIDS
a) b)YES . . . . . . . . . . . . . . . . . . . . . . . . . . . . . . . . . . . 1NO . . . . . . . . . . . . . . . . . . . . . . . . . . . . . . . . . . . 2
219 YES . . . . . . . . . . . . . . . . . . . . . . . . . . . . . . . . . . . 1NO . . . . . . . . . . . . . . . . . . . . . . . . . . . . . . . . . . . 2DON'T KNOW . . . . . . . . . . . . . . . . . . . . . . . . . . . 8
220 YES NO DK
a) a) FLU . . . . . . . . . . . . . . . . . . . . . 1 2 8b) b) TDAP . . . . . . . . . . . . . . . . . . . . . 1 2 8c) c) HPV . . . . . . . . . . . . . . . . . . . . . 1 2 8d) b) MENENGITIS. . . . . . . . . . . . . . . . 1 2 8e) c) PNEUMONIA. . . . . . . . . . . . . . . . 1 2 8f) c) HEPATITIS A. . . . . . . . . . . . . . . . 1 2 8g) c) HEPATITIS B. . . . . . . . . . . . . . . . 1 2 8h) c) POLIO. . . . . . . . . . . . . . . . . . . . . 1 2 8i) c) MEASLES . . . . . . . . . . . . . . . . 1 2 8j) c) CHICKENPOX . . . . . . . . . . . . . 1 2 8
If a wife knows her husband has a disease that she can get during sexual intercourse, is she justified in asking that they use a condom when they have sex?
Polio?MeaslesChickenpox (varicella)
Have you received the following immunizations?
Flu (Influenza)?
Meningococcal?
Hepatitis B
Tetanus, diphtheria, pertussis?HPV (Human papillomavirus)?
Pneumococcal?Hepatitis A
Have you heard about infections that can be transmitted through sexual contact?
Apart from HIV, have you heard about other infections that can be transmitted through sexual contact?
CHECK 201:
W-5

417
NO.
301 YES . . . . . . . . . . . . . . . . . . . . . . . . . . . . . . . . . . . . 1 303NO . . . . . . . . . . . . . . . . . . . . . . . . . . . . . . . . . . . . 2
302 YES . . . . . . . . . . . . . . . . . . . . . . . . . . . . . . . . . . . . 1NO . . . . . . . . . . . . . . . . . . . . . . . . . . . . . . . . . . . . 2 401
303 YES . . . . . . . . . . . . . . . . . . . . . . . . . . . . . . . . . . . . 1NO . . . . . . . . . . . . . . . . . . . . . . . . . . . . . . . . . . . . 2 308
304 SUNNI. . . . . . . . . . . . . . . . . . . . . . . . . . . . . . . . . . . . 1INTERMEDIATE . . . . . . . . . . . . . . . . . . . . . . . . . . . 2PHARAONIC . . . . . . . . . . . . . . . . . . . . . . . . . . . . . . 3DON'T KNOW . . . . . . . . . . . . . . . . . . . . . . . . . . . 8
305
YES NO DK
a) TYPE I . . . . . . . . . . . . . 1 2 8
b) TYPE II . . . . . . . . . . . . . 1 2 8
c) TYPE III . . . . . . . . . . . . . 1 2 8
d) TYPE IV . . . . . . . . . . . . . 1 2 8
306AGE IN COMPLETED YEARS . . . . . . .
AS A BABY/DURING INFANCY . . . . . . . . . . . . . 95DON'T KNOW . . . . . . . . . . . . . . . . . . . . . . . . . . . 98
307 TRADITIONALTRAD. CIRCUMCISER . . . . . . . . . . . . . . . . . . . 11TRAD. BIRTH ATTENDANT . . . . . . . . . . . . . 12
OTHER TRAD. 16
HEALTH PROFESSIONALDOCTOR . . . . . . . . . . . . . . . . . . . . . . . . . . . 21NURSE/MIDWIFE . . . . . . . . . . . . . . . . . . . . . . 22OTHER HEALTH
PROFESSIONAL 26
DON'T KNOW . . . . . . . . . . . . . . . . . . . . . . . . . . . 98
308 YES . . . . . . . . . . . . . . . . . . . . . . . . . . . . . . . . . . . . 1NO . . . . . . . . . . . . . . . . . . . . . . . . . . . . . . . . . . . . 2NO RELIGION . . . . . . . . . . . . . . . . . . . . . . . . . . . 3DON'T KNOW . . . . . . . . . . . . . . . . . . . . . . . . . . . 8
309 CONTINUED . . . . . . . . . . . . . . . . . . . . . . . . . . . 1STOPPED . . . . . . . . . . . . . . . . . . . . . . . . . . . . . . 2DEPENDS . . . . . . . . . . . . . . . . . . . . . . . . . . . . . . 3DON'T KNOW . . . . . . . . . . . . . . . . . . . . . . . . . . . 8
310 YES . . . . . . . . . . . . . . . . . . . . . . . . . . . . . . . . . . . . 1NO . . . . . . . . . . . . . . . . . . . . . . . . . . . . . . . . . . . . 2DEPENDS . . . . . . . . . . . . . . . . . . . . . . . . . . . . . . 3DON'T KNOW . . . . . . . . . . . . . . . . . . . . . . . . . . . 8
Who performed the circumcision?
Excision of the clitoral hood (prepuce), with or without excision of part or all of the clitorisExcision of the clitoris with partial or total excision of the labia minoraExcision of part or all of the external genitalia and stitching/ narrowing of the vaginal opening (Infibulation)
How old were you when you were circumcised?
IF THE RESPONDENT DOES NOT KNOW THE EXACT AGE, PROBE TO GET AN ESTIMATE.
(SPECIFY)
(SPECIFY)
If you get married and give birth to girls in the future, would you want them to be circumcized?
SECTION 3. FEMALE CIRCUMCISION
QUESTIONS AND FILTERS CODING CATEGORIES SKIP
All other procedures that involve pricking, piercing, stretching or incising of the clitoris and/or labia; introduction of corrosive substances into the vagina to narrow it.
Do you believe that female circumcision is required by your religion?
Do you think that female circumcision should be continued, or should it be stopped?
Now I would like to ask some questions about a practice known as female circumcision. Have you ever heard of female circumcision?
In some countries, there is a practice in which a girl may have part of her genitals cut. Have you ever heard about this practice?
Have you yourself ever been circumcised?
What type of circumcision did you undergo?
Please describe what was exactly done
W-6

The Somali Health and Demographic Survey418
NO.
401
YES NO DK
a) ABUSE . . . . . . . . . . . . . 1 2 8b) HH DECISION. . . . . . . . . . 1 2 8c) CHILDREN DECISION. . . . 1 2 8d) BETTER TREATMENT . . 1 2 8e) NO LIVING COSTS . . . . 1 2 8f) EDU DENIAL . . . . . . . . . . 1 2 8g) FORCED MARRIAGE. . . . 1 2 8h) RAPE . . . . . . . . . . . . . . . 1 2 8i) SEX HARASSMENT . . . . 1 2 8j) INHERITANCE . . . . . . . 1 2 8
k) OTHER 1 2
402 HUSBAND . . . . . . . . . . . . . . . . . . . . . A MOTHER/STEP-MOTHER . . . . . . . . . . B
FATHER/STEP-FATHER. . . . . . . . . . . . . CSISTER/BROTHER . . . . . . . . . . . . . . . DDAUGHTER/SON . . . . . . . . . . . . . . . EOTHER RELATIVE . . . . . . . . . . . . . . . FIN-LAWS . . . . . . . . . . . . . . . . . . . . . . . GTEACHER . . . . . . . . . . . . . . . . . . . . . HEMPLOYER/SOMEONE AT WORK. . . . IPOLICE/SOLDIER . . . . . . . . . . . . . . . J
OTHER K
403 AT HOME. . . . . . . . . . . . . . . . . . . . . . . 1 WORKPLACE. . . . . . . . . . . . . . . . . . . . . 2
STREET . . . . . . . . . . . . . . . . . . . . . . . 3SCHOOL . . . . . . . . . . . . . . . . . . . . . . . 4WATER POINT . . . . . . . . . . . . . . . . . . 5RURAL/GRAZING AREAS . . . . . . . . . . 6
OTHER 96
404 YES . . . . . . . . . . . . . . . . . . . . . . . . . . 1 NO . . . . . . . . . . . . . . . . . . . . . . . . . . 2 406
405 PHYSICAL . . . . . . . . . . . . . . . 1PSYCHOLOGICAL . . . . . . . 2
OTHER 96
406
YES NO DK
a) GOES OUT . . . . . . . . . . 1 2 8b) NEGL. CHILDREN . . . . 1 2 8c) NEGL. OTHER HH DUTIES 1 2 8d) ARGUES . . . . . . . . . . . . . 1 2 8e) WASTE RESOURCES . . 1 2 8f) NOT RESP. FAMILY. . . . 1 2 8
407 A. B.
SOME- NOT IN LASTEVER OFTEN TIMES 12 MONTHS
a) YES 1 1 2 3NO 2
If she wastes resources?
Has anyone ever done any of the following things to you, while you were at the water point, grazing areas, at the school, at the house, at work, ETC :
How often did this happen during the last 12 months: often, only sometimes, or not at all?
was slapped, pushed, shaken, or thrown something at?
If she does not respect his family?
If she neglects household duties including cooking?
What is the most serious damage caused by violence?
No participation in decision-making for children?Better treatment of males than females?Failing to meet basic living costs?Denial of education?Forced marriage?
SECTION 4. VIOLENCE AGAINST WOMEN
QUESTIONS AND FILTERS CODING CATEGORIES SKIP
If she goes out without telling him?
In your opinion, is a husband justified in hitting or beating his wife in the following situations:
No participation in decision-making for household?
(SPECIFY)
(SPECIFY)
(SPECIFY)
Now I am going to ask you about your understanding of domestic violence.What does domestic violence mean do you? Does it mean:
Physical abuse?
Rape?Sexual harassment?
Other
Who is the person who commits the most violent acts against women?
Denial of inheritance?
If she neglects the children?
If she argues with him?
Where is the place with most violent acts?
(SPECIFY)
Does any form of violence cause damage?
W-7

419
b) YES 1 1 2 3NO 2
c) YES 1 1 2 3NO 2
d) YES 1 1 2 3NO 2
e) YES 1 1 2 3NO 2
f) YES 1 1 2 3NO 2
408
AT LEAST ONE ALL 'NO''YES'
MOTHER/STEP-MOTHER . . . . . . . . . . AFATHER/STEP-FATHER . . . . . . . . . . B
SISTER/BROTHER . . . . . . . . . . . . . . . CNIECE/NEPHEW . . . . . . . . . . . . . . . DOTHER RELATIVE . . . . . . . . . . . . . . . ENEIGHBOUR . . . . . . . . . . . . . . . . . . . . . HTEACHER . . . . . . . . . . . . . . . . . . . . . IEMPLOYER/SOMEONE AT WORK. . . . JPOLICE/SOLDIER . . . . . . . . . . . . . . . KMILITIA/GANGS . . . . . . . . . . . . . . . . . . L
OTHER X
409 OFTEN . . . . . . . . . . . . . . . . . . . . . . . 1SOMETIMES . . . . . . . . . . . . . . . . . . . . . 2
NOT AT ALL . . . . . . . . . . . . . . . . . . 3
(SPECIFY)
In the last 12 months, how often has (this person/have these persons) physically hurt you: often, only sometimes, or not at all?
twisted your arm or pulled your hair?
punched you with fist or with something that could hurt you?
kicked, dragged, or beat you up?
choked or burned you on purpose?
threatened or attacked you with a knife, gun, or other weapon?
Who has hurt you in this way?
Anyone else?
RECORD ALL MENTIONED.
CHECK 407 a-f:
501
W-8

The Somali Health and Demographic Survey420
NO. QUESTIONS AND FILTERS
501 YES . . . . . . . . . . . . . . . . . . . . . . . . . . . . . . . . . . 1NO . . . . . . . . . . . . . . . . . . . . . . . . . . . . . . . . . . 2 507
502 YES . . . . . . . . . . . . . . . . . . . . . . . . . . . . . . . . . . 1NO . . . . . . . . . . . . . . . . . . . . . . . . . . . . . . . . . . 2 504
503 ON FOOT. . . . . . . . . . . . . . . . . . . . . . . . . . . . . . . . 1LAND TRANSPORT . . . . . . . . . . . . . . . . . . . . . . . 2AIR TRANSPORT. . . . . . . . . . . . . . . . . . . . . . . . . . 3MARITIME TRANSPORT. . . . . . . . . . . . . . . . . . . . . 4
504 YES . . . . . . . . . . . . . . . . . . . . . . . . . . . . . . . . . . 1NO . . . . . . . . . . . . . . . . . . . . . . . . . . . . . . . . . . 2 506
505 PHYSICAL VIOLENCE . . . . . . . . . . . . . . . . . . . . . 1SEXUAL VIOLENCE. . . . . . . . . . . . . . . . . . . . . . . 2CAPTIVITY . . . . . . . . . . . . . . . . . . . . . . . . . . . . . 3RANSOM DEMAND . . . . . . . . . . . . . . . . . . . . . . . 4ROBBERY . . . . . . . . . . . . . . . . . . . . . . . . . . . . . 5VERBAL ABUSE . . . . . . . . . . . . . . . . . . . . . . . . . . 6WATER STORMS/WAVES . . . . . . . . . . . . . . . . . . 7
OTHER 96
506 UNEMPLOYMENT . . . . . . . . . . . . . . . . . . . . . . . 1LOW PAY/INCOME
SEARCH FOR BETTER OPPORTUNITIES 2POOR QUALITY OF EDUCATION . . . . . . . . . . . . . 3INSECURITY . . . . . . . . . . . . . . . . . . . . . . . . . . . . . 4POVERTY. . . . . . . . . . . . . . . . . . . . . . . . . . . . . . . . 5HOPELESSNESS . . . . . . . . . . . . . . . . . . . . . . . 6LONELINESS . . . . . . . . . . . . . . . . . . . . . . . . . . 7INEQUALITY/SOCIAL EXCLUSION. . . . . . . . . . . . . 8PEER INFLUENCE . . . . . . . . . . . . . . . . . . . . . . . 9SOCIAL MEDIA INTERACTIONS/ POSTS. . . . . . . 10
OTHER 96
507 YES . . . . . . . . . . . . . . . . . . . . . . . . . . . . . . . . . . 1NO . . . . . . . . . . . . . . . . . . . . . . . . . . . . . . . . . . 2
508 JOB CREATION . . . . . . . . . . . . . . . . . . . . . . . . . . 1BETTER PAYING JOBS. . . . . . . . . . . . . . . . . . . . . 2BUSINESS OPPORTUNITIES . . . . . . . . . . . . . . . 3GRANTS & CREDIT FACILITIES. . . . . . . . . . . . . . . 4AWARENESS CREATION . . . . . . . . . . . . . . . . . . 5STATE RECONSTRUCTION. . . . . . . . . . . . . . . . . . 6LAW ENFORCEMENT . . . . . . . . . . . . . . . . . . . . . 7
OTHER 96
509HOURS . . . . . . . . . . . . . . .
MINUTES . . . . . . . . . . . . . . .
What kind of violence did you experience?
(SPECIFY)
What motivated you to take the decision to migrate?
(SPECIFY)
Do you know any of your peers who lost their lives due to illegal migration?
What can be done to address the problem of illegal migration/tahrib?
(SPECIFY)
RECORD THE TIME YOU END THE INTERVIEW.
Now, I would like to discuss illegal immigration among the youth in your community and its impact. Have you ever tried to migrate to another country using illegal means?
Did you reach your desired desination?
What means of transportation did you use to reach your destination during your last such attempt?
Did you experience any violence on your way?
CODING CATEGORIES SKIP
SECTION 5. ILLEGAL MIGRATION (TAHRIB)
W-9

421
COMMENTS ABOUT INTERVIEW:
COMMENTS ON SPECIFIC QUESTIONS:
ANY OTHER COMMENTS:
INTERVIEWER'S OBSERVATIONS
TO BE FILLED IN AFTER COMPLETING INTERVIEW
SUPERVISOR'S OBSERVATIONS
EDITOR'S OBSERVATIONS
W-10

The Somali Health and Demographic Survey422
Maternal Mortality Questionnaire

423
MMR-1
`
SOMALI MINISTRIE'S OF PLANNING AND HEALTH
QUESTIONNAIRE SERIAL NUMBER
NAME CODE
REGION
PRE-WAR NAME OF THE DISTRICT
CURRENT NAME OF THE DISTRICT
SETTLEMENT/TOWN
EA TYPE (1=RURAL/IDP 2=URBAN/IDP 3=NOMADIC) . . . . . . . . . . . . . . . . . . . . . . . . . . . . . . . . . . . . . . . . . .
EA CODE . . . . . . . . . . . . . . . . . . . . . . . . . . . . . . . . . . . . . . . . . . . . . . . . . . . . . . . . . . . . . . . . . . . . . . . . . . . . . . .
HOUSEHOLD SERIAL NUMBER IN THE EA . . . . . . . . . . . . . . . . . . . . . . . . . . . . . . . . . . . . . . . . . . . . . . . . . . .
DATE DAY
MONTH
YEARINTERVIEWER'SNAME INT. NO.
RESULT* RESULT*
NEXT VISIT: DATETOTAL NUMBER
TIME OF VISITS
*RESULT CODES:1 COMPLETED 6 DWELLING VACANT OR ADDRESS NOT A DWELLING2 NO HOUSEHOLD MEMBER AT HOME OR NO COMPETENT 7 DWELLING DESTROYED
RESPONDENT AT HOME AT TIME OF VISIT 8 DWELLING NOT FOUND3 ENTIRE HOUSEHOLD ABSENT FOR EXTENDED PERIOD OF TIM 9 PARTIALY COMPLETED4 POSTPONED 96 OTHER5 REFUSED
LANGUAGE OF LANGUAGE OF NATIVE LANGUAGEQUESTIONNAIRE** INTERVIEW** OF RESPONDENT**
LANGUAGE OF **LANGUAGE CODES:QUESTIONNAIRE** 01 ENGLISH 03 OTHER
02 SOMALI
SUPERVISOR FIELD EDITOR OFFICE EDITOR KEYED IN BYNAME . . . . . . . . . . . . . . . . DATE . . . . . . . . . . . . . . . .
CODE . . . . . . . . . . . . . . . .
REG. CODE DIST CODE SETTLEMENT/TOWN ENUMERATOR NO.EA CODE HH SERIAL
1
IDENTIFICATION
(SPECIFY)
(SPECIFY)ENGLISH
MMAATTEERRNNAALL MMOORRTTAALLIITTYY QQUUEESSTTIIOONNNNAAIIRREE
0 1
FINAL VISIT
INTERVIEWER VISITS
32
2018-2019

The Somali Health and Demographic Survey424
HH-2
SIGNATURE OF INTERVIEWER DATE
RESPONDENT AGREES RESPONDENT DOES NOT AGREETO BE INTERVIEWED . . 1 TO BE INTERVIEWED . . 2 END
100HOURS . . . . . . . . . . . . . . . . . . . . . . . . .
MINUTES . . . . . . . . . . . . . . . . . . . . . . . . .
INTRODUCTION AND CONSENT
Hello. My name is _______________________________________. I am working with [NAME OF ORGANIZATION]. We are conducting a survey about health and related topics all over [NAME OF COUNTRY]. The information we collect will help the government to plan health and other services. Your household was selected for the survey. I would like to ask you some questions about your household. The questions usually take about 15 to 20 minutes. All of the answers you give will be confidential and will not be shared with anyone other than members of our survey team. your participation in the survey is voluntary, but we hope you will agree to answer the questions since your views are important. If I ask you any question you don't want to answer, just let me know and I will go on to the next question or you can stop the interview at any time. In case you need more information about the survey, you may contact the ministry of interior/planning and/or health.
Do you have any questions?May I begin the interview now?
RECORD THE START TIME.

425
HH-3
LINE RELATIONSHIPNO. TO HEAD OF
HOUSEHOLD
101
AFTER LISTING THE RECORD AGE IN 1 = MARRIEDNAMES AND RECORDING COMPLETED 2 = DIVORCED RECORDTHE RELATIONSHIP YEARS 3 = ABANDO- MALES &AND SEX FOR EACH NED FEMALESPERSON, ASK WRITE "00" IF LESS 4 = WIDOWEDQUESTIONS 2A-2B THAN ONE YEAR 5 = NEVER- IF NONE,TO BE SURE THAT THE MARRIED RECORDLISTING IS COMPLETE. IF 95 '00'.
OR MORE,THEN ASK APPROPRIATE RECORDQUESTIONS IN COLUMNS SEE CODES '95'.5-32 FOR EACH PERSON. BELOW.
M F YES NO MALE FEMALE
01 1 2 1 2
NEXT LINE
1 2 1 202
NEXT LINE
1 2 1 203
NEXT LINE
1 2 1 204
NEXT LINE
1 2 1 205
NEXT LINE
1 2 1 206
NEXT LINE
1 2 1 207
NEXT LINE
1 2 1 208
NEXT LINE
1 2 1 209
NEXT LINE
1 2 1 210
NEXT LINE
CODES FOR Q. 103: RELATIONSHIP TO HEAD OF HOUSEHOLD01 = HEAD OF HOUSEHOLD 08 = BROTHER OR SISTER02 = SPOUSE 09 = NEPHEW/NIECE03 = SON OR DAUGHTER 10 = BROTHER/SISTER-IN-LAW04 = SON-IN-LAW OR 11 = OTHER RELATIVE
DAUGHTER-IN-LAW 12 = ADOPTED/FOSTER/05 = GRANDCHILD STEPCHILD06 = PARENT 13 = NOT RELATED07 = PARENT-IN-LAW 98 = DON'T KNOW
How old was (NAME) when he/she got married for the first time?
DEMOGRAPHIC CHARACTERISTICS
PARTICULARS OF LIVE BIRTHSWITHIN THE PAST 24 MONTHS
IN YEARS
Has (NAME) had a live birth in the last 24 months?
How many children did (NAME) give birth to who were born alive in the last 24 months including those who later died?
IF MARRIED & FEMALES AGED 12-49
RECENT LIVE BIRTHS (24 MONTHS)
IF EVER MARRIED
IF AGE 12OR OLDER
MARITALSTATUS
107 109108
SECTION 1: HOUSEHOLD SCHEDULE
SEXUSUAL RESIDENTS AGE AGE AT FIRST MARRIAGE
How old is (NAME) in completed years?
What is (NAME)'s current marital status?
Is (NAME) male or female?
Please give me the names of the persons who usually live in your household, starting with the head of the household.
What is the relationship of (NAME) to the head of the household?
102 106103 104 105
IN YEARS

The Somali Health and Demographic Survey426
HH-4
LINE RELATIONSHIPNO. TO HEAD OF
HOUSEHOLD
101
AFTER LISTING THE RECORD AGE IN 1 = MARRIEDNAMES AND RECORDING COMPLETED 2 = DIVORCED RECORDTHE RELATIONSHIP YEARS 3 = ABANDO- MALES &AND SEX FOR EACH NED FEMALESPERSON, ASK WRITE "00" IF LESS 4 = WIDOWEDQUESTIONS 2A-2B THAN ONE YEAR 5 = NEVER- IF NONE,TO BE SURE THAT THE MARRIED RECORDLISTING IS COMPLETE. IF 95 '00'.
OR MORE,THEN ASK APPROPRIATE RECORDQUESTIONS IN COLUMNS SEE CODES '95'.5-32 FOR EACH PERSON. BELOW.
How old was (NAME) when he/she got married for the first time?
DEMOGRAPHIC CHARACTERISTICS
PARTICULARS OF LIVE BIRTHSWITHIN THE PAST 24 MONTHS
Has (NAME) had a live birth in the last 24 months?
How many children did (NAME) give birth to who were born alive in the last 24 months including those who later died?
IF MARRIED & FEMALES AGED 12-49
RECENT LIVE BIRTHS (24 MONTHS)
IF EVER MARRIED
IF AGE 12OR OLDER
MARITALSTATUS
107 109108
SECTION 1: HOUSEHOLD SCHEDULE
SEXUSUAL RESIDENTS AGE AGE AT FIRST MARRIAGE
How old is (NAME) in completed years?
What is (NAME)'s current marital status?
Is (NAME) male or female?
Please give me the names of the persons who usually live in your household, starting with the head of the household.
What is the relationship of (NAME) to the head of the household?
102 106103 104 105
M F YES NO MALE FEMALE
11 1 2 1 2
NEXT LINE
1 2 1 212
NEXT LINE
1 2 1 213
NEXT LINE
1 2 1 214
NEXT LINE
1 2 1 215
NEXT LINE
1 2 1 216
NEXT LINE
1 2 1 217
NEXT LINE
1 2 1 218
NEXT LINE
1 2 1 219
NEXT LINE
1 2 1 220
NEXT LINE
TICK HERE IF CONTINUATION SHEET USED CODES FOR Q. 103: RELATIONSHIP TO HEAD OF HOUSEHOLD01 = HEAD OF HOUSEHOLD 08 = BROTHER OR SISTER02 = SPOUSE 09 = NEPHEW/NIECE
1A) 03 = SON OR DAUGHTER 10 = BROTHER/SISTER-IN-LAWYES NO 04 = SON-IN-LAW OR 11 = OTHER RELATIVE
DAUGHTER-IN-LAW 12 = ADOPTED/FOSTER/1B) 05 = GRANDCHILD STEPCHILD
YES NO 06 = PARENT 13 = NOT RELATED07 = PARENT-IN-LAW 98 = DON'T KNOW
Just to make sure that I have a complete listing: are there any other people such as small children or infants that we have not listed?Are there any other people who may not be members of your family, such as domestic servants, lodgers, or friends who usually live here?
IN YEARS IN YEARS

427
HH-5
NO.
201 YES . . . . . . . . . . . . . . . . . . . . . . . . . . . . . . . . . . . . . . . . . . . 1NO . . . . . . . . . . . . . . . . . . . . . . . . . . . . . . . . . . . . . . . . . . . 2 END
LINE NAME OF SEX OF AGE AT ENUMERATOR SKIPPING INSTRUCTIONS: NO. DECEASED DECEASED DEATH OF 1. IF THE DECEASED IS MALE → GO TO NEXT LINE
MEMBER OF HOUSEHOLD HOUSEHOLD 2. IF THE DECEASED IS A FEMALE NOT AGED 12- 49 → GO TO NEXT LINEHOUSEHOLD MEMBER MEMBER 3. IF THE DECEASED IS A FEMALE AGED 12 - 49 → CONTINUE
202
RECORD 1 = MALE RECORD AGE IN PROBE CHECK ALL THATONLY 2 = FEMALE COMPLETED FOR APPLYONE NAME YEARS APPROX
40 DAYSWRITE "00" IF BIRTH < 1 YEAR CELEB-
RATIONIF 95OR MORE,RECORD'95'.
YES NO YES NO YES NO YES NO Y N DK1 2 1 2 1 2 1 2 1 2 8
01 GO TO GO TO A209 209 B
NEXT LINE NEXT LINE CDE
F
G
Y
1 2 1 2 1 2 1 2 1 2 8GO TO GO TO A
02 209 209 BNEXT LINE NEXT LINE C
DE
F
GY
1 2 1 2 1 2 1 2 1 2 8GO TO GO TO A
03 209 209 BNEXT LINE NEXT LINE C
DE
FG
Y
1 2 1 2 1 2 1 2 1 2 8GO TO GO TO A
04 209 209 BNEXT LINE NEXT LINE C
DE
FG
Y
1 2 1 2 1 2 1 2 1 2 8GO TO GO TO A
05 209 209 BNEXT LINE NEXT LINE C
DE
FG
Y
TICK HERE IF CONTINUATION SHEET USED RECORD THE END TIME. HOURS . . . . . . . . . . . . . . . . . . MINUTES. . . . . . . . . . . . . . . . . .
210
CONVULSIONSEVERE FEVER AFTER DELIVERYCAESAREAN SECTION
OBSTRUCTED LABOUR
CONVULSIONSEVERE FEVER AFTER DELIVERYCAESAREAN SECTION
OBSTRUCTED LABOUR
CONVULSIONSEVERE FEVER AFTER DELIVERYCAESAREAN SECTION
OBSTRUCTED LABOUR
OTHER (SPECIFY)
SEVERE VOMITING
CAESAREAN SECTION
OTHER (SPECIFY)
Did (NAME) suffer from any of the following health problems at any time during her last pregnancy, up to 6 weeks after child birth?
CAESAREAN SECTION
OBSTRUCTED LABOUR
OTHER (SPECIFY)
SEVERE VOMITINGVAGINAL BLEEDINGLIMBS SWELLING
OTHER (SPECIFY)
SEVERE VOMITINGVAGINAL BLEEDINGLIMBS SWELLINGCONVULSIONSEVERE FEVER AFTER DELIVERY
VAGINAL BLEEDINGLIMBS SWELLING
OBSTRUCTED LABOUR
OTHER (SPECIFY)
SEVERE VOMITINGVAGINAL BLEEDINGLIMBS SWELLING
SEVERE VOMITINGVAGINAL BLEEDINGLIMBS SWELLINGCONVULSIONSEVERE FEVER AFTER DELIVERY
208 209
What was the name of the deceased family member?
Was (NAME) Male or Female?
How old was (NAME) he/she when she died?
Was (NAME) pregnant when she died?
Did (NAME) die during delivery?
Did (NAME) die during the 6 weeks following delivery?
Did (NAME) die from accident or violence?
203 204 205 206 207
SECTION 2. DEATHSQUESTIONS AND FILTERS CODING CATEGORIES SKIP
Have you lost any member of the household in the past two years (24 months)?

The Somali Health and Demographic Survey428

429