Article processing charges in OA journals: relationship between price and quality
13
Article processing charges in OA journals: relationship between price and quality Bo-Christer Bjo ¨rk • David Solomon Received: 10 April 2014 Ó Akade ´miai Kiado ´, Budapest, Hungary 2015 Abstract The subscription prices of peer-reviewed journals have in the past not been closely related to the scientific quality. This relationship has been further obscured by bundled e-licenses. The situation is different for Open Access (OA) journals that finance their operations via article processing charges (APCs). Due to competition and the fact that authors are often directly involved in making APC payments from their own or other limited funds, APC pricing has so far been sensitive to the quality and services offered by journals. We conducted a systematic survey of prices charged by OA journals indexed in Scopus and this revealed a moderate (0.40) correlation between the APCs and Source Normalized Impact per Paper values, a measure of citation rates. When weighted by article volumes the correlations between the quality and the price were significantly higher (0.67). This would seem to indicate that while publishers to some extent take the quality into account when pricing their journals, authors are even more sensitive to the relationship between price and quality in their choices of where to submit their manuscripts. Keywords Open Access Á Business model Á SNIP value Introduction As a result of the Internet, scientific journal publishing has undergone a revolutionary change in the last couple of decades. This has resulted in two new types of revenue models, electronic subscription access and Open Access (OA). Electronic subscription access is a direct continuation of traditional paper journal subscription in digital form. In addition to B.-C. Bjo ¨rk (&) Hanken School of Economics, Helsinki, Finland e-mail: bo-christer.bjork@hanken.fi D. Solomon Michigan State University, East Lansing, MI, USA 123 Scientometrics DOI 10.1007/s11192-015-1556-z
-
Upload
independent -
Category
Documents
-
view
0 -
download
0
Transcript of Article processing charges in OA journals: relationship between price and quality
Article processing charges in OA journals: relationshipbetween price and quality
Bo-Christer Bjork • David Solomon
Received: 10 April 2014� Akademiai Kiado, Budapest, Hungary 2015
Abstract The subscription prices of peer-reviewed journals have in the past not been
closely related to the scientific quality. This relationship has been further obscured by
bundled e-licenses. The situation is different for Open Access (OA) journals that finance
their operations via article processing charges (APCs). Due to competition and the fact that
authors are often directly involved in making APC payments from their own or other
limited funds, APC pricing has so far been sensitive to the quality and services offered by
journals. We conducted a systematic survey of prices charged by OA journals indexed in
Scopus and this revealed a moderate (0.40) correlation between the APCs and Source
Normalized Impact per Paper values, a measure of citation rates. When weighted by article
volumes the correlations between the quality and the price were significantly higher (0.67).
This would seem to indicate that while publishers to some extent take the quality into
account when pricing their journals, authors are even more sensitive to the relationship
between price and quality in their choices of where to submit their manuscripts.
Keywords Open Access � Business model � SNIP value
Introduction
As a result of the Internet, scientific journal publishing has undergone a revolutionary
change in the last couple of decades. This has resulted in two new types of revenue models,
electronic subscription access and Open Access (OA). Electronic subscription access is a
direct continuation of traditional paper journal subscription in digital form. In addition to
B.-C. Bjork (&)Hanken School of Economics, Helsinki, Finlande-mail: [email protected]
D. SolomonMichigan State University, East Lansing, MI, USA
123
ScientometricsDOI 10.1007/s11192-015-1556-z

marketing access on an individual journal basis, digital dissemination has made possible
bundling hundreds of journals in a single e-license as well as selling access to articles on an
individual basis. The former are often called ‘‘big deals’’ and the latter ‘‘pay-per-view’’.
Open Access represents an even stronger break with the former business model with
authors rather than the readers as the primary clients of the publishers (Kaufman 2014).
Early OA journals were mainly small-scale voluntary efforts, which charged neither
authors nor readers. Around the millennium shift these were followed by a wave of
established society published journals, which made their electronic versions freely avail-
able, while continuing to sell subscriptions to the paper issues. A new breed of journal
publisher specializing in electronic only OA journals appeared around 2002. They fund
their operations mainly by article processing charges (APCs) paid by authors, their insti-
tutions or funders. These journals have rapidly increased their share of OA publishing
(Laakso and Bjork 2012). Inspired by the success of OA publishers such as BioMedCentral
and Public Library of Science, major commercial and society publishers have in the last
couple of years begun launching new OA titles, in addition to converting some subscription
journals to the OA model (Bjork and Solomon 2014).
An interesting feature of the three dominant business models discussed above (sales of
paper subscriptions, the big e-licenses and the APC-funded OA model) is on what basis
publishers price their services. Scientific journals are not homogeneous products and hence
there should in principle be significant price differentiation that correlates with quality
since better quality journals are more expensive to publish and academics are willing to
pay more for both accessing and publishing in better quality journals.
One could thus assume that the prices of subscription access and OA dissemination
services would follow a similar pattern of a close correlation between measures of quality
and price. Correlation between price and quality has however not been the case for either
paper or e-license subscriptions. The situation has been studied empirically for both paper
and electronic subscriptions to individual titles. In a seminal study Bergstrom showed
remarkable differences in the individual title library subscription prices between com-
mercial and non-profit publishers (Bergstrom 2001). The average per page prices for
subscriptions to 297 economics journals was 0.15 USD/page for nonprofit (society and
university press) and 0.88 USD/page for commercial publishers. When the prices are
further related to the scientific quality as measured by the impact factors of the journals the
‘‘price per cite’’ was 0.15 for non-profit journals and 2.48 for commercial ones, a ratio of 1
to 16! Similar differences between commercial and non-profit publishers were found for
physics journals by Henry Barschall (1988). He also found striking differences in the cost
per character in subscription prices particularly between society and commercially pub-
lished journals.
In a later study commissioned by the European Union the prices of subscriptions and
their relationship to the citations levels were studied systematically for a sample of 2707
journals in 22 domains of science (Dewatripont et al. 2006). They found that journals
published by commercial publishers were consistently more expensive across all domains,
on average around three times as much. They also constructed a mathematical model of
how much different factors affect the subscription price per article and found a regression
coefficient of 0.24 for the field normalized citation numbers, thus indicating that prices
were positively related to scientific quality. The dummy variable for commercially pub-
lished journals had a coefficient of 1.1 and the age of the journal a negative coefficient of -
0.18. As a general conclusion they argue that publishers are in a strong position to exercise
discretion in price setting.
Scientometrics
123
A major reason for why society journal on average are so much less expensive and a
better value if the qualitative aspects are also considered is that the journals, which on
average are older and have higher citation rates, tend to have much bigger subscription
bases significantly reducing the average costs per subscriber (Tenopir and King 2000).
It is much more difficult to compare the prices of e-license subscriptions, which through
bundling can span over a thousand journals. Firstly such licenses are very complex and can
for instance include access to past archives. Secondly the publishers often require that the
contracts are kept secret by non-disclosure clauses. It nevertheless is quite evident, that
publishers have of lot of latitude in setting the prices for bundled e-licenses. Firstly the
marginal costs per new license are much lower for electronic delivery. Secondly the price
they can negotiate depends on the client’s ability and willingness to pay. Unlike sub-
scriptions for paper journals the price of access can vary widely from subscriber to
subscriber.
Often the first e-licenses have been based on the earlier total print subscription cost of a
given university from the publisher in question, with a mark-up to account for the probable
added readings for the new titles that have been added. The effect has been that the overall
share of journal subscriptions in the university library acquisition budgets has risen and
that the big deals ‘‘crowd out’’ journals from small or single journal publishers. Crawford
(2013) has shown that the inflation adjusted serials expenditures of US academic libraries
rose by 50 % in the period from 1996 to 2010 so that the share of serials expenditure in the
total library acquisition budgets rose from 17 to 26 % in the same period. In an interview
Ann Okerson, senior advisor on electronic resources for the Center for Research Libraries,
describes the situation in the following colorful way: ‘‘There’s nothing new in my saying
that, unfortunately, the biggest deals have turned in many cases into fire-breathing dragons
that seek out and consume as much as they can devour of library budgets’’. (Gillingham
2013). The very strong lock-in effects that are created via the bundled deals make the
problem even worse. It is extremely difficult to cancel big deals and go back to cheaper
more selective solutions.
The price that publishers sell at to different universities and countries seems to vary a
lot, and there is anecdotal evidence of a pattern following the GDP per capita, which more
or less sets the budgets universities have for journal acquisitions. As an example the
national e-license cost for Finland is around 26 mill USD (FinELib 2012) and for Serbia 2
mill USD (Poynder 2013), that is on totally different levels. Finnish GDP per capita is
around 6 times that of Serbia, in addition there can be differences in how much funding
universities receive in the state budget in general and for library acquisitions in particular.
It is very difficult to determine the prices of individual titles from the prices of bundled
e-licenses and compare those to the quality of the journals. Some comparisons, taking into
account the average quality of whole journal portfolios, could however in principle be
made. California Digital Library has for instance developed a methodology (Wilson and Li
2012) to determine the value to their faculty and students of different titles, which includes
data such as citations statistics (cost per Source Normalized Impact per Paper) and
download data (cost per use). As a result of a comparison of the relative value of e-licenses
from different publishers the library consortium in 2013 decided to cancel the consortium-
wide licenses with one of the leading commercial publishers (Li 2013).
Open Access publishing is a different sort of market, and is actually closer to the earlier
paper based publishing era than the era of the big deal, in the sense that there is a uniform
price for all customers. The central distinguishing characteristic is that authors usually
have several choices where to submit a manuscript, both OA and subscription journals
which are free to publish in, creating a situation where journals are substitutes for each
Scientometrics
123

other, not complements. Also most of the leading OA publishers are relatively young start-
up companies, which don’t enjoy as strong branding and quasi-monopolistic positions as
the established publishers in the subscription market.
The dominant mode of pricing is a flat fee for each published article, but there are
examples of publishers with multi-tier prices depending of the country of origin of the
author and there are rare cases of journals that charge for submissions (Bjork and Solomon
2012). Many biomedical journals also waive the APC for authors from developing
countries upon request.
Most serious OA publishers with several journals clearly differentiate the APCs charged
per journal depending on scientific quality of the journal and also the scientific discipline.
Typically biomedical journals tend to be more expensive to publish in than for instance
journals in the social sciences and humanities, fields in which authors tend to have more
difficulties in finding funding to pay APCs. Low grade OA publishers, often pejoratively
called ‘‘predatory publishers’’ (Butler 2013), often have quite uniform APC level for large
fleets of journals covering virtually all fields of science.
Although there are signs that there is strong relationship between the quality of an OA
journal and the APC this has not so far been systematically studied with large data sets and
using statistical techniques.
Methods and data
The aim of this study was to determine the relationship between the scientific quality and
the price of publishing in OA journals. We used data on journal article processing charges
(APC)s from an earlier study we conducted that systematically gathered the amount of the
APCs for a large representative sample of the journals charging these fees in the Directory
of Open Access Journals (DOAJ). The data and a description of the pricing schemes used
by various publishers included in the study are described in (Solomon and Bjork 2012b;
Bjork and Solomon 2012).
The journal pricing information was gathered during the fall of 2011. The 1090 journals
represented a stratified sample of the journals charging APCs listed in the DOAJ. When
weighted to approximate the full sample of journals that charged APC in the DOAJ, there
were 1370 journals. Since we were taking a sub-sample of these journals that were in
Scopus we did not apply the weighting to represent the full sample of journals in the DOAJ
that charged APCs.
As a proxy for scientific quality we used Source Normalized Impact per Paper (SNIPs),
which are citation rates normalized to account for differences in citation patterns across
disciplines (Moed 2010). SNIPs are better suited for our particular purpose than for in-
stance the impact factors included in the Journal Citation Reports. They are based on
Scopus data and are freely available from the Journal M3trics Web site developed through
collaboration between Elsevier and the University of Leiden. These data are freely
available for download. We used 2012 SNIP values, which were the most recent available
when we obtained the data in the fall of 2013. The two data sets were merged using ISSN
and EISSN values. A total of 595 Open Access journals were identified in both data sets
and used in this study.
We aggregated the 27 disciplines categories defined in the Scopus data into 8 subject
fields: biomedicine, physical sciences, earth sciences, mathematics and statistics, arts and
humanities, technology and engineering, social sciences and general science journals.
There are a number of reasons why we felt this was necessary:
Scientometrics
123

Firstly the Scopus category classification results in a very uneven distribution of jour-
nals and articles over the categories. For instance medicine alone accounts for 18,6 % of
articles, whereas there are several low-volume categories such as nursing, health profes-
sions, veterinary and dentistry, which in addition to our mind could topic-wise equally well
have been classified under medicine. Biochemistry, genetics and molecular which is a
high-volume field is also in terms of funding opportunities for APCs and author prefer-
ences close to medicine. If we wouldn’t have bundled the 27 categories to broader ones we
would have ended up with several categories with so few journals and articles that the
analysis would have been almost meaningless.
Another reason is that there are many important OA journals, which span several of the
disciplines in the more detailed classification and would thus have to be classified under
some more general category.
Analyses were conducted both at the journal level (unweighted data) and weighting
journals by the 2010 article count, which changed the unit of analysis to the level of the
article. The 595 journals contained a total of 61,081 articles.
The correlation between the SNIP and the APC at the journal level reflects the rela-
tionship between how publishers are pricing their journals and the SNIP or citation rate of
their journals. We are however also interested in how individual authors make decisions
about where to submit their articles, and here we feel that the perceived quality and
prestige of the journal is an important parameter, affecting each and every submitting
author (Wiley 2013). The authors cannot in advance know how cited their article would
become but they have a fairly good idea of how valuable an article in that journal would be
Fig. 1 The distribution of APCs across journals
Scientometrics
123

in their CV. In practice this perceived value is highly correlated with the relative posi-
tioning of the journal according to impact factor in its particular field, for instance in ISI’s
journal citation reports. Having published in ‘‘leading’’ journals is often of extreme im-
portance for getting promotion, grants etc.
It is partly this perceived value that authors compare with the cost of publishing, that is
the APC, although also other factors such as speed of publishing may be of importance.
Hence since we compute correlations over all authors who have published in OA journals
with APCs, we think we this is a meaningful result to present, and to compare with the
journal level correlations.
Results
The distribution of the APCs across the journals is shown in Fig. 1. It shows two clear
peaks, in the price range of 750–1000 USD and in the range between 1500 and 2000 USD.
The average APC over the 595 journals was 1255 ± 612 (mean ± SD) in USD.
The distribution of APCs across articles is shown in Fig. 2. The average is 1237 ± 712
(mean ± SD) in USD. In comparison to the journal level distribution the low and mod-
erately high APC price ranges tend to have much higher average article volumes.
The distribution of SNIP values across journals is shown in Fig. 3. The average is
1.01 ± 0.52 (mean ± SD) and there is a very clear dominance of journals with SNIP
values of 1.25 or lower.
Fig. 2 The distribution of APCs across articles
Scientometrics
123

The distribution of SNIP values across articles is shown in Fig. 4. The average is
0.76 ± 0.50 (mean ± SD). In comparison to the journal level distribution two features are
the clear peak in the 1–1.25 range resulting from the enormous popularity of one journal,
PLoS ONE, as well as the fact that very low impact journals in the 0–0.25 range seem not
to be very popular with authors.
In Table 1 the correlations between APCs and SNIPs are shown both for all journals and
for each scientific discipline. For four of the disciplines the number of journals is so low
that the figures cannot be trusted.
Given the article level data were based on weighting the journal level data, it was not
possible calculate standard errors for the article level correlations or their standard errors.
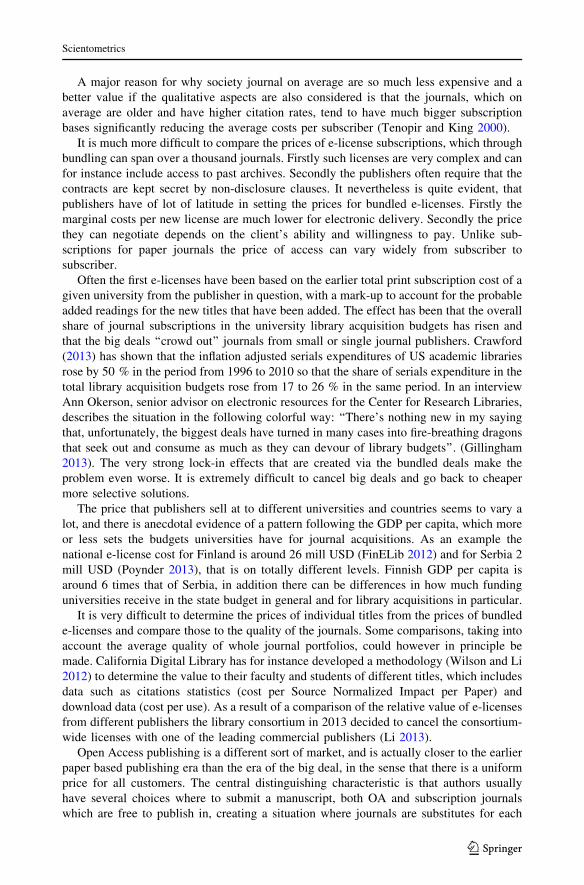
In addition we grouped the journals by publisher to study the correlations within each
publisher’s portfolio of journals. There were three other publishers with at least five
journals, but which have set the same uniform price to all their journals (Bentham Open
with 75 journals in the study, Frontiers Research Foundation with 22 and Academy
Publisher with 5 and). These journals and their articles nevertheless used in the overall
results. The results are shown in Table 2 below.
Another more intuitive way of looking at the results is in the form of a scattergram. In
Fig. 5 the APCs are on the horizontal axis and the SNIP-values (quality) on the vertical
axis. The above scattergram only reflects the journal level data.
It is quite interesting to compare the results with the situation in the hybrid OA market.
So far most hybrid OA journals (subscription journals that offer the author to open up an
individual article against the payment of an APC) have used a rather uniform one price fits
Fig. 3 Distribution of SNIP levels for journals
Scientometrics
123

all approach. This trend was started in 2004 by Springer with its Open Choice program
which set an industry standard price level of around 3000 USD. Currently almost all the
publishers of over 8000 hybrid journals use such a scheme. Due to this the uptake has in
general been very low, only around 1–2 % of eligible articles, with higher uptake levels for
some journals in biomedicine (Bjork 2012). It is quite probable that the journals with
higher uptake levels are of better quality, although no systematic studies have been
published.
Elsevier has recently started to differentiate the pricing of its hybrid journals. Using as a
base the list of 1532 Elsevier titles that offer a hybrid option1 we were able develop
software to ‘‘scrape’’ the APC from 1207 of these journals’ websites. The breakdown of the
average hybrid APC, price range, correlation between the APC and the SNIP and the
number of journals in each discipline for Elsevier is given in Table 3 below. It seems clear
that Elsevier is pricing journal APC fees primarily based on discipline, in order to take into
account the levels of the funding available. But importantly it is also appears to be dif-
ferentiating pricing within disciplines based on the scientific quality/prestige of the journal.
The correlations between APCs and SNIPS are just slightly lower than what we found on
the journal level for full OA journals.
Fig. 4 The distribution of SNIP values across articles
1 http://cdn.elsevier.com/assets/pdf_file/0008/109448/journal_list.pdf.
Scientometrics
123

Discussion
There are many factors that influence authors’ choice of a journal in which to publish their
research. The impact of these factors likely differs across disciplines and authors also tend
to choose among a small number of journals covering their specific area of research. This
makes assessing the relationship between citation rates and publication fees complex. We
attempted to address this complexity by using SNIP values which normalize citation rates
across disciplines and conducting the analyses within the most homogeneous subgrouping
of discipline we could find reasonably large samples of journals. We recognize this ap-
proach has significant limitations and the results should be viewed with caution.
Including other factors that are known to influence choice of a journal in a multivariate
model would have provided a better understanding of the relationship between APCs and
citation rates. Given that these factors are likely to be correlated with APCs, a simple
correlation analysis may generate biased results. To address this concern, estimating a
fixed effects Poisson regression model using panel data (multiple observations over time
for a given journal) would be a better way to identify the relationship between citation rates
and APCs. [Other model specifications might be feasible as well, depending on whether
appropriate natural experiments could be identified]. Whether this approach is feasible
(APCs must exhibit sufficient variation over time) cannot be determined using our cross-
sectional data. Hopefully future studies will be in a better position to address these issues.
A key finding of our study is that the article level correlation (0.67) is clearly higher
than the journal level one (0.40). We hypothesize that authors choose OA journals that
offer better value in terms of impact for the APC paid. Journals with a better quality to
APC ratio hence achieve higher publication volumes. The phenomenal growth of PLoS
ONE (APC 1350 USD, impact factor 3.7 and SNIP value 1.06) with almost 33,000 pub-
lished articles in 2013 is a good example of this. Thus if the correlation of APCs on the
journal level reflects the shape of the supply curve, the prices publishers think can attract
authors at different quality levels, the correlation on the article level reflects the demand
curve that is what authors are willing to pay for different impact levels of this particular
type of service.
Table 1 Correlations between the APCs and SNIP values per field of science
Field of science Journal based analysis Article based analysis
Number of journals Correlationa Number of articles Correlation
All fields 595 0.401 ± 0.039 61,081 0.670
Biomedicine 423 0.476 ± 0.04 37,494 0.676
Earth Sciences 53 0.176 ± 0.12 5536 0.312
Technology and Engineering 49 0.228 ± 0.14 3562 0.602
Physical Sciences 37 0.310 ± 0.16 11,026 0.932
Mathematics and Statistics 15 – 1307 –
Social Sciences 14 – 1362 –
General Science Journals 3 – 720 –
Arts and Humanities 1 – 74 –
Correlations were not calculated for disciplines with under 20 journalsa Standard error based on bootstrap technique with 1000 samples (Efron 1981)
Scientometrics
123
Also West et al. (2014) have collected a lot of useful empirical data information on this
topic. They have had similar ambitions as we, and have a method which both has simi-
larities and differences compared to the approach we have used. Their aim is however
much more to visualize the differences in order to offer authors concrete guidance in the
choice of where to submit, than to study the relationship per se.
One key difference is that they use a metric of their own, ‘‘Article influence score’’,
where higher impact factor journals have a bigger influence calculated over 5 years from
Journal Citation Reports data (West et al. 2010). Also they have included a number of
journals, which charge per page, and use an approximation of 15 pages per article in order
to calculate full APCs for these. We were able to extract the data for 342 OA journals from
the eigenfactor web site and ran a correlation test between the APCs and the article
influence score. The result was 0.36, which is only slightly lower than our own journal
level result using SNIP values.
Authors use a number of sources of funding to pay for an APC (both in full OA and
hybrid journals). These sources include allowable costs from grants, institutional dedicated
APC funds, general overhead money and even personal funds. This has meant that authors
are often quite sensitive to the APC price level. In microeconomic terms, the price elas-
ticity of demand is significant, particularly in fields where less external funding is available
(Solomon and Bjork 2012a). We believe this is a major reason why there is such a clear
price differentiation of APC charges among full OA journals.
A couple of studies have explored what level of APCs authors have been willing to pay
and how they have funded the charges. The European SOAP study (Dallmeier-Thiessen
et al. 2011) found that for 28 % of researchers grant money was used, in 55 % of cases
overhead funding from grants or the department was used, and in only 12 % of cases the
researchers paid themselves (with 5 % other). Unfortunately, it is difficult from the
Table 2 Correlations between APCs and SNIP values for different publishers
Publisher Journal based analysis Article based analysis
Number of journals Correlation Number of articles Correlation
All publishers 595 0.401 61,081 0.670
BioMedCentral 175 0.074 15,530 0.344
Hindawi 77 0.135 2945 0.209
Dove Medical Press 55 0.463 1677 0.627
Libertas Academica 24 0.372 203 0.309
MPDI 17 0.688 3032 0.779
Springer 12 -0.210 1437 -0.513
Copernicus 11 0.407 2054 0.535
PAGEPress 10 0.036 271 0.094
PLoS 8 0.858 9065 0.891
e-Century 6 0.970 238 0.968
OMICS 6 -0.338 163 -0.371
Academic Journals 5 0.272 2634 -0.206
Publishers with \5 journals were not included in the table
Significance testing was not performed since the journals included all the APC funded journals published bythe publisher at the time of data collection
Scientometrics
123

answers given to know how many combined money from multiple sources. The results
from a similar survey by Solomon and Bjork (2012) show approximately the same dis-
tribution, with around 30 % of researchers in industrialized countries using grant funding.
Fig. 5 Scattergram of the distribution of APC and SNIP values. The three long vertical lines represent thejournals of a couple of publishers with single or two-tier prices
Table 3 The pricing of hybrid OA in journals published by Elsevier
Discipline category Average APC inUSD
APC price range inUSD
Correlation APC withSNIP
Number ofjournals
Arts andHumanities
1452 750–1800 0.41 25
Biomedicine 2551 1100–5000 0.30 487
Business andEconomics
1612 750–3300 0.39 160
Chemistry 2675 1000–3750 0.32 131
Earth Sciences 2631 1000–3750 0.15 232
Engineering 2524 750–3750 0.21 424
Mathematics 2099 750–3300 0.46 81
Physics andAstronomy
2479 1800–3750 0.36 117
Social Sciences 1835 750–3750 0.25 201
From Bjork and Solomon (2014). Since some journals are multidisciplinary, the number of journals acrossdisciplines totals to more than 1207, the actual number of journals
Scientometrics
123

The picture is different for developing nations, where 39 % of the funding came from
personal funds.
Both of the above studies also asked authors what level of APC they would be willing to
pay for publication in an OA journal, giving the authors a range of choices and the results
indicated a clear price elasticity. Against this background, it is understandable why some
research funders, like the Wellcome Trust and the Austrian Research Fund, have started to
provide dedicated funds for paying APCs as a way of rapidly increasing uptake, by in-
sulating authors from the APCs. This type of development has recently been particularly
evident in the UK, in the form of the Finch report (2012) and the setting up of earmarked
funding being provided to universities for paying APCs (Pinfield and Middleton 2012). The
rationale for this is quite similar to the use of University libraries as intermediaries for
paying for subscriptions to scholarly journals. If this was left to the individual researchers
or their departments to pay for from their own funds, the access level would in all prob-
ability be much lower.
If the funding of APCs is increasingly going to happen via dedicated funds, a key issue
is what level of APCs funders will be willing to remunerate and according to what prin-
ciples. The possible funding of hybrid OA payments is a particularly controversial issue, in
view of the perceived ‘‘double dipping’’ issue, where publisher are seen as charging twice
for the same articles (Finch 2012). For this reason a number of European research funders,
in particular Wellcome Trust, Research Councils UK and the Austrian Science Fund
recently commissioned a report to study the potential consequences of different alternative
courses of action (Bjork and Solomon 2014). In a scenario included in the report three
levels of price caps (1000, 2000 and 3000 USD) are set for what levels of APCs funders
should refund, depending on the journal quality level.
In the near future such developing funder schemes are likely to play a significant role in
how the whole future of OA journal publishing will develop. We hope the results presented
here can contribute to their strategic planning.
Acknowledgments The empiric data used in this study were collected in a project financed by a con-sortium of research funders including Jisc, Research Libraries UK, Research Councils UK, the WellcomeTrust, the Austrian Science Fund (FWF), the Luxembourg National Research Fund (FNR) and the MaxPlanck Institute for Gravitational Physics.
References
Barschall, H. (1988). The Cost-effectiveness of physics journals. Physics Today, July 1988, 56–59. http://www.library.yale.edu/barschall/articles/pt8807.pdf
Bergstrom, T. (2001). Free labour for costly journals? Journal of Economic Perspectives, 15(4), 183–198.Bjork, B.-C. (2012). The hybrid model for Open Access publication of scholarly articles—A failed ex-
periment? Journal of the American Society of Information Sciences and Technology, 63(8), 1496–1504.Bjork, B.-C., & Solomon, D. (2012). Pricing principles used by scholarly Open Access publishers. Learned
Publishing, 25(3), 132–137.Bjork, B-C., & Solomon, D. (2014). Developing an effective market for Open Access article processing
charges, report. Wellcome Trust, UK, http://www.wellcome.ac.uk/About-us/Policy/Spotlight-issues/Open-access/Guides/WTP054773.htm
Butler, D. (2013). Investigating journals: The dark side of publishing. Nature, 495(7442), 433–435.Crawford, W. (2013). The big deal and the damage done. Cites & Insights, 13(7), 1–5. http://
citesandinsights.info/civ13i7.pdfDallmeier-Thiessen, S., et al. (2011). The SOAP symposium—III Open Access publishing today: What
scientist do and why, presentation at the SOAP symposium, January 13th, 2011, Berlin. http://www.slideshare.net/ProjectSoap/soap-symposiumtalkiii
Scientometrics
123

Dewatripont, M. et al. (2006) Study on the economic and technical evolution of the scientific publicationmarkets in Europe, Final Report, European Commission, Directorate General for Research. http://ec.europa.eu/research/science-society/pdf/scientific-publication-study_en.pdf
Efron, B. (1981). Nonparametric estimates of standard error: The jackknife, the bootstrap and othermethods. Biometrika, 68(3), 589–599. doi:10.1093/biomet/68.3.589.
Finch J. (2012) Accessibility, sustainability, excellence: How to expand access to research publications.Report of the Working Group on Expanding Access to PublishedResearch Findings. http://www.researchinfonet.org/publish/finch/
FinELib. (2012) Katsaus FinELib-konsortion vuoden 2011 toimintaan (in Finnish), yearly report 2011 of theFinELib-konsortium. http://www.kansalliskirjasto.fi/attachments/5l4xoyz0b/67VJr66W5/Files/CurrentFile/FinELib_raportti_2011_final.pdf
Gillingham, E. (2013). Meet Ann Okerson—on licensing, the big deal, OA, and so much more. ExchangesOur Ideas, Research and Discussion, Blog item, 7.11.2013, Wiley. http://exchanges.wiley.com/blog/2013/11/07/meet-ann-okerson-the-brain-behind-liblicense-and-so-much-more/
Kaufman R. (2014). Shifting revenues from post-publication to pre-publication: The impact of Open Access.ALPSP Blog. http://blog.alpsp.org/2014/03/roy-kaufman-shifting-revenues-from-post.html
Laakso, M., & Bjork, B.-C. (2012). Anatomy of Open Access publishing—A study of longitudinal devel-opment and internal structure. BMC Medicine, 10, 124. doi:10.1186/1741-7015-10-124.
Li, C. (2013). UC Libraries discontinue taylor & francis systemwide journals license. News item, CaliforniaDigital Libraries. http://www.cdlib.org/services/collections/current/TF/index.html
Moed, H. (2010). Measuring contextual citation impact of scientific journals. Journal of Informetrics, 4(3),265–277.
Pinfield, S., & Middleton, C. (2012). Open Access central funds in UK universities. Learned Publishing,25(2), 107–116.
Poynder, R. (2013). Open Access in Serbia, Interview with Biljana Kosanovic, Open and Shut? Newsletter,13.9.2013. http://poynder.blogspot.fi/2013/09/open-access-in-serbia-interview-with.html
Solomon, D., & Bjork, B.-C. (2012a). Publication fees in Open Access publishing: Sources of funding andfactors influencing choice of journal. Journal of the American Society for Information Science andTechnology, 63(1), 98–107.
Solomon, D., & Bjork, B.-C. (2012b). A study of Open Access journals using article processing charges.Journal of the American Society for Information Science and Technology, 63(8), 1485–1495.
Tenopir, C., & King, D. W. (2000). Towards electronic journals: Realities for scientists, librarians andpublishers. Washington, DC: SLA Publishing.
West, J., Bergstrom, T., & Bergstrom, C. (2010). The eigenfactor MetricsTM: A network approach toassessing scholarly journals. College and Research Libraries, 71(3), 236–244.
West, J., Bergstrom, T., & Bergstrom, C. (2014). Cost-effectiveness of Open Access publications. EconomicInquiry, 52, 1315–1321.
Wiley (2013). Wiley Open Access author survey 2013, Presentation material. http://www.slideshare.net/WileyScienceNewsroom/wileys-2013-open-access-author-survey
Wilson, J., & Li, C. (2012). Calculating scholarly journal value through objective metrics, CDLINFO News,13.2.2012, California Digital Libraries. http://www.cdlib.org/cdlinfo/2012/02/13/calculating-scholarly-journal-value-through-objective-metrics/
Scientometrics
123


![lwpuk ,oa yksd lEidZ foHkkx] mÙkjk[kM](https://static.fdokumen.com/doc/165x107/633777c0a5ba10dda70195a7/lwpuk-oa-yksd-leidz-fohkkx-mukjkkm.jpg)