
STDP Allows Fast Rate-Modulated Coding with Poisson-Like Spike Trains
Published online 23 November 2008 Nucleic Acids Research, 2009, Vol. 37, No. 1 e6doi:10.1093/nar/gkn899
Array-based evolution of DNA aptamersallows modelling of an explicit sequence-fitnesslandscapeChristopher G. Knight1,2,3,*, Mark Platt1,2, William Rowe1,2, David C. Wedge1,2,
Farid Khan1,2, Philip J. R. Day1,4, Andy McShea5, Joshua Knowles1,6
and Douglas B. Kell1,2
1Manchester Interdisciplinary Biocentre, The University of Manchester, 131 Princess Street, Manchester M1 7DN,UK, 2School of Chemistry, The University of Manchester, Oxford Road, Manchester, M13 9PL, UK, 3Faculty of LifeSciences, The University of Manchester, Simon Building, Brunswick Street, Manchester M13 9PL, UK, 4School ofMedicine, The University of Manchester, Oxford Road, Manchester M13 9PT, UK, 5Combimatrix Corporation, 6500Harbor Heights Parkway, Suite #303, Mukilteo, WA 98275, USA and 6School of Computer Science, The Universityof Manchester, Kilburn Building, Oxford Road, Manchester, M13 9PL, UK
Received September 20, 2008; Revised October 20, 2008; Accepted October 23, 2008
ABSTRACT
Mapping the landscape of possible macromolecularpolymer sequences to their fitness in performingbiological functions is a challenge across the bio-sciences. A paradigm is the case of aptamers,nucleic acids that can be selected to bind particulartarget molecules. We have characterized thesequence-fitness landscape for aptamers bindingallophycocyanin (APC) protein via a novel ClosedLoop Aptameric Directed Evolution (CLADE)approach. In contrast to the conventional SELEXmethodology, selection and mutation of aptamersequences was carried out in silico, with explicit fit-ness assays for 44 131 aptamers of known sequenceusing DNA microarrays in vitro. We capture thelandscape using a predictive machine learningmodel linking sequence features and function andvalidate this model using 5500 entirely separatetest sequences, which give a very high observedversus predicted correlation of 0.87. This approachreveals a complex sequence-fitness mapping, andhypotheses for the physical basis of aptameric bind-ing; it also enables rapid design of novel aptamerswith desired binding properties. We demonstrate anextension to the approach by incorporating prior
knowledge into CLADE, resulting in some of thetightest binding sequences.
INTRODUCTION
Mapping between genotype and phenotype, and more spe-cifically, understanding the landscape of fitness over thecomplete set of theoretically possible genotypes (‘geno-typic sequence space’) is a key and longstanding challengeacross the biosciences (1). Such landscapes are typicallyvery large and potentially complex (2). Questions aboutgenotype–phenotype mapping are most acute, and poten-tially most tractable, when genotype and phenotype arevery closely allied, i.e. fitness is determined directly by theprimary nucleotide sequence, without mediation by tran-scription or translation. Thus models have recently beendeveloped for nucleosome positioning (3) and transcrip-tion factor binding (4) in vivo and in vitro, respectively.However, the most insightful and comprehensive fitnesslandscape work has been carried out in theory (5) andin silico, notably with nucleic acid structure prediction(6,7). The success of such in silico structure systemscomes from the ability to carry out evolutionary comput-ing experiments which explore otherwise intractablylarge regions of sequence space (8). For instance, a 30 ntsequence, as used here, lies within a landscape of 430�1018
possible sequences. Even with the smallest standard 5 mm
The authors wish it to be known that, in their opinion, the first three authors should be regarded as joint First Authors.
*To whom correspondence should be addressed. Tel: +44 161 2755378; Email: [email protected] may also be addressed to Douglas B. Kell. Tel: +44 161 306 4492; Fax: +44 161 306 4556; Email: [email protected] address:Andy McShea, Theo Chocolate, 3400 Phinney Ave. N., Seattle, WA 98103, USA
� 2008 The Author(s)This is an Open Access article distributed under the terms of the Creative Commons Attribution Non-Commercial License (http://creativecommons.org/licenses/by-nc/2.0/uk/) which permits unrestricted non-commercial use, distribution, and reproduction in any medium, provided the original work is properly cited.
by guest on September 11, 2014
http://nar.oxfordjournals.org/D
ownloaded from
microarray features, a 29 km2 array would be needed toassay them all in vitro. Here, we combine powerful aspectsof an in silico evolutionary approach with an in vitrosystem to explore and characterize the sequence-fitnesslandscape for a specific bio-molecular interaction.Aptamers are nucleic acids selected to bind particular
target molecules (9,10). Though small, they can form com-plex structures, with or without their target molecule(11,12). Typically, aptamers are identified within sequencespace via an evolutionary process (SELEX) (9,10) involv-ing sequential rounds of in vitro selection from a largepool, possibly including some mutation (13). The varietyof sequences and structures and the population dynamicscan be complex (14,15); yet this ‘black-box’ process typi-cally yields only a small number of known aptamersequences at the end, and hence little information onthe sequence-fitness landscape. In contrast, we assayknown DNA sequences for aptameric binding usingbespoke microarrays (16). On the basis of fitness valuesmeasured in the in vitro assay, selection and mutation ofaptamer sequences is carried out explicitly, in silico (17)using known sequences at each generation. This yieldsa more directed, diverse and transparent evolution.To demonstrate our approach, that we call ClosedLoop Aptameric Directed Evolution (hereafter CLADE,Figure 1), we choose as our binding target a large(110 kDa) fluorescent protein, allophycocyanin (APC).
APC is an important fluorescent reagent widely used indrug discovery. Aptamers to such fluorescent proteins, asdeveloped here, have great potential application in proteinlocalization in vivo (18). More generally, proteins areimportant targets for specific binding to aptamers, offeringthe potential for protein-binding arrays (19), with manyadvantages over alternative technologies such as antibo-dies (20,21).
This study comprises two conceptually separate parts:(i) The evolution of DNA aptamers to the APC proteinusing the CLADE in vitro, in silico approach; (ii) Theanalysis and modelling of the sequence-fitness landscapefor these aptamers. These are respectively the subjects ofthe first two sections of the results. The first could becarried out without the second and, in principle, givenan appropriate dataset from another source, the secondcould be carried out without the first. These parts arehowever connected in that it is only the large number ofsequence-fitness pairs that explore the landscape in anefficient way, as generated by CLADE, that enable effec-tive modelling of such a landscape. Further, an importantfeature of CLADE is that it can incorporate prior knowl-edge into aptamer generation (Figure 1) and combiningCLADE with modelling, as in this study, is itself one wayto generate appropriate ‘prior knowledge’. Incorporatingprior knowledge into CLADE is the subject of thethird section of the results. Doing so enhances the
Figure 1. Schematic of the CLADE approach. CLADE as utilized in this study starts at the top of the schematic with an initial choice of DNAsequences. These sequences may be generated entirely in silico, or optionally, as with some of the sequences here, utilizing prior knowledge generatedin vitro. These sequences are synthesized on a custom microarray and bound with the chosen ligand, here the APC protein. Analysis of bindingintensities gives a distribution of fitnesses; the frequency distribution of Generation 1 binding to APC protein is shown by way of example. Some ofthese sequences are selected in silico, based on the in vitro score distribution, here using tournament selection (see Materials and methods section).These sequences are then mutated in silico to generate a new sequence set which can then be synthesised in vitro, and so on round the cycle as oftenas is required. The final aptamer set offers a greatly increased binding affinity to the ligand.
e6 Nucleic Acids Research, 2009, Vol. 37, No. 1 PAGE 2 OF 10
by guest on September 11, 2014
http://nar.oxfordjournals.org/D
ownloaded from
CLADE process both in creating potentially useful apta-mers and in generating understanding of a sequence-fit-ness landscape.
MATERIALS AND METHODS
Array synthesis and binding
Six thousand 30 nt DNA sequences were synthesized induplicate on Combimatrix B3 synthesizer (for a detailedprotocol see www.combimatrix.com). Briefly, each chipcontains 12 544 spots onto which chosen sequences aresynthesized electrochemically. A total of 544 spots areused for fabrication and quality control. The spatial posi-tion of each replicate of each aptamer sequence was ran-domized independently for each chip.
In vitro assays were performed in phosphate bufferedsaline (1�PBS=0.15M NaCl, 20mM phosphate buffer,pH 5.4) at 378C with 0.01mg/ml APC protein. Prior tobinding all chips were incubated with a pre-binding solu-tion (5% BSA, 0.5% Tween 1�PBS) for 30min at 378C.Chips were incubated with the binding solution (APC0.01mg/ml, 1�PBS) for 1 h. After this the chips arewashed five times in 1�PBS at room temperature andimaged immediately. Details of how the assay conditionswere chosen are given in Supplementary Methods.
Absolute binding measurement
Absolute binding was assayed by Surface PlasmonResonance (SPR) in a Biacore 3000 instrument. TwoDNA sequences were taken from the aptamer evolution,a low binding-score sequence from the first generation(C1.0489, TTAAGGAATACATAGATTATATGGCAAGTT score 5.8� 0.1) and a high binding-score sequencefrom the final generation (G9.3415, ATCCCCCCCTCCCCTTATGTGCACCCGCAT score 12.6� 0.8). Thesesequences were synthesized with a 30-biotin tag and immo-bilized on a streptavidin coated chip in adjacent flow cells,causing an increase in �1700 resonance units (RU) in eachcase. One blank flow cell consisting of streptavidin only(without aptamer) was used as the control. Solutions ofAPC in the buffer used for binding in the evolution werepassed over all of the flow cells at 20 ml min�1 at 378C, andin each binding cycle the chip was regenerated with glycinebuffer pH 1.5. Binding curves for APC at 214, 97, 76, 53and 31 nM are shown in Figure 3 for the final generationsequence. Each curve was blank subtracted using the con-trol flow cell. Curves were fitted separately to the datafor ‘on’ and ‘off ’ rates at each concentration using theBIA-evaluation 4.1 software.
Microarray analysis. Images were scanned at 5 mm resolu-tion and any artefacts, damaged or obscured spots wereexcluded by visual inspection. Median intensity valueswere recorded for each spot. The principal systematic spa-tial effects we have identified on these chips are smoothspatial gradients. These were removed by normalizingmedian intensity values to a smooth surface fitted foreach chip by means of a spatial general additive model(GAM) in which the degree smoothing is chosen as partof the fit (22) i.e. probe intensities were multiplied by the
median value of the fitted surface divided by the surfacevalue at the probe location. The mean-variance relation-ship in the data was then removed simultaneously withnormalization to the same scale among chips within ageneration by fitting a generalized log transform model(23). This yields data on a uniform, though arbitraryscale, where zero is below background binding levels.The resulting binding score estimates for each sequencewere then averaged (first within, then between chips) togive a single score for each sequence. The error valuesquoted were calculated as the standard error (SE)among chips (i.e. the SE of the chip means for eachsequence). Scores were then normalized to the precedinggeneration’s scores as follows: A linear transformationwas estimated by fitting a line (orthogonal regression,using observed variances) to the plot of scores in thenew generation vs. scores in the preceding generation forall identical sequences appearing in both generations (con-trol sequences and sequences selected but by chance notmutated, usually a total of around 1200 sequences). Testchip scores were placed back onto the same scale as thatused for the chips in the evolution in a similar manner, butusing the 500 control probes only. These 500 controlsequences were chosen to represent as evenly as possiblethe range of binding seen in the course of the optimisationof assay conditions (see Supplementary Methods fordetails).
Evolution
The CLADE methodology comprises a repeated cycle ofsequence synthesis, in vitro assay, in silico selection andin silico mutation (Figure 1). G1 Sequences comprisedthe 500 controls and 5500 30-base (L=30) sequences gen-erated with an equal probability of each base at each posi-tion. Following the in vitro assay, selection in G1 was fromall 6000 sequences; in later generations only non-controlsequences were used. 5500 sequences were selected in silicoby a ‘tournament selection’. In each case, the best scoringof four sequences picked uniformly at random with repla-cement from the current generation of sequences wastaken. Selected sequences were subjected to point muta-tions and insertion–deletion events (indels). Point muta-tion comprised replacement of a base by a base generateduniformly at random with a probability of 1/L at eachposition. Indels were applied subsequently also with aprobability of 1/L at each position. Indels were effectedby inserting a new base (equal probability of all fourbases) at a given position, followed by deletion of a baseat a random position. These new sequences were thensynthesized on a microarray and the analytical bindingprocess repeated for a total of nine generations, i.e. untilG9 had been synthesized, assayed and scored.In order to demonstrate the validity of the CLADE
method, a relatively simple in silico evolutionary algo-rithm was used (8). Other operations, including recombi-nation could be in principle included. Recombinationmight be expected to find peaks in the landscape moreeffectively, though that would depend upon the rugged-ness of that landscape. Theoretical studies also suggestthat alternative parameter settings, including higher
PAGE 3 OF 10 Nucleic Acids Research, 2009, Vol. 37, No. 1 e6
by guest on September 11, 2014
http://nar.oxfordjournals.org/D
ownloaded from
mutation rates and higher selection pressures, may resultin improved performance (24). Empirical validation ofthese findings will be the subject of further study.
Sequence analysis
Three hundred and two candidate explanatory variables(Supplementary Table 3) were extracted from eachsequence. These comprised the frequency and medianposition of all single, double and triple base sequences,as well as 30 4-level factors for the particular baseat each position and 29 16-level factors for each pair ofbases in each position. Motifs characteristic of high or lowscoring sequences were identified using MotifScanner v3.2and associated software (25). Motifs were identified in twoways. Firstly, motifs were searched for using all the topand bottom scoring probes from each lineage. Motifs wereidentified in the top scoring probes, assuming a back-ground model derived from the bottom scoring probesand vice versa. Lineages containing only a single probeor where the top and bottom probe scores differed byless than 0.1 were omitted. Secondly, only the top quartileof the top scoring probes in each lineage and the bottomquartile of the bottom scoring probes in each lineage wereused to find motifs, the background model was derivedfrom the G1 probes. In both cases, motifs length 4, 8and 14 were searched for, using 100 separate runs of thesoftware in each case. Similar motifs were merged and thebest matches to all motifs identified in all sequences.Location and motif score for the best matches to eachmotif in each sequence were used as explanatory variables.The 5000 top-scoring examples of the motif were used tocreate the logo plot in Figure 7. The assumed prior prob-ability of finding a motif in each sequence was raised untila hit to all motifs was found in all sequences. In most, butnot all, cases there was a clear demarcation in the distri-bution of motif scores between motif scores that were �0and all others. In cases of a motif score of �0, no locationvalue was used.DNA structure was predicted using hybrid-ss-min
(UNAFold) version 3.4 (26), using the DNA input modewith settings of 378C and 0.58M NaCl concentration(equivalent to the binding conditions used in the in vitroassays). Discrete descriptions of the minimum free energystructure comprising the number of loops, bulges, hairpinsand unmatched regions were made using a simple parsingalgorithm developed in-house.The proportion of pairs of nucleotides not able to
undergo base stacking was also included (i.e. pyramidinedinucleotides, T-T, T-C and C-C) to indicate an expectedbendability (27).
Modelling
Data preparation comprised removing one completerecord that had a missing binding score followed by repla-cing missing values by the mode (for nominal variables)and the median for numerical variables. Regression of thebinding score as a function of all 302 predictor was carriedout using Breiman and Cutler’s random forestsTM for clas-sification and regression (28). A forest of 200 trees wasused with the single parameter mtry set to 100 (the integer
value of the number of predictor variables divided bythree), its default recommended value for regression.
When using the forest to make predictions on test data,missing values in the predictor variables were first replacedusing the same method as for the training data.
Alternative models were also fitted using regressiontrees (29) and genetic programming (30). Results werevery similar in each case (i.e. similar explanatory variablesshown to be important), however random forests werechosen since they provided the highest correlation betweenobserved and predicted scores when tested on subdivisionsof the main data set (NB the choice of method was madeentirely independently of the independent test set reportedin Figure 7).
Software
Image analysis used Combimatrix Microarray Imager(https://webapps.combimatrix.com/customarray/customarrayHome.jsp). Data preparation and inspection used JMP7.02 (31). Data normalization and analysis used R 2.6.0(32), and the mgcv 1.3 (22) and VSN 3.3.1 (23) packages,the latter being part of the Bioconductor project (33). TherandomForest (28) package v4.5 for R was used formodelling.
RESULTS
On-chip aptamer evolution reveals a multimodal fitnesslandscape
The CLADE procedure (Figure 1) was initiated with apopulation of 6000 30 nt DNA sequences synthesized induplicate on a custom microarray. A total of 5500 of thesewere entirely random sequences (with an equal probabilityof each base at each position), while the remaining 500were controls, repeated in each generation and chosenfrom a trial binding to have a range of binding to APC.A binding score to APC was assayed in vitro for eachsequence. A new generation of 5500 sequences was thenobtained by selection on the basis of the in vitro bindingscore followed by mutation in silico (see Materials andmethods section). These new sequences were then synthe-sized on a microarray and the analytical binding processrepeated.
Nine generations (G1–G9) of CLADE were completed,during which the population of aptamers evolved fromlow-scoring binding to consistent high-scoring binding(Figure 2 and Supplementary Table 2). To relate the rela-tive binding-score scale used to an absolute affinity scale,sequences from the top and bottom of the binding scorescale were assayed in an independent, Surface PlasmonResonance (SPR) system. This indicated that, even usinga different assay method, the high-scoring sequence boundAPC with high affinity, whereas the low-scoring sequencedid not measurably bind APC (though it was still possibleto estimate the rate of wash-off, Supplementary Table 2).While not expecting a linear relationship between con-centration and SPR signal, there are complexities inthe binding, giving a reduction of the SPR signal athigher concentrations (Figure 3). However, an assump-tion of simple 1:1 binding indicates that the top of the
e6 Nucleic Acids Research, 2009, Vol. 37, No. 1 PAGE 4 OF 10
by guest on September 11, 2014
http://nar.oxfordjournals.org/D
ownloaded from

binding-score scale corresponds to an apparent disassocia-tion constant (KD) for the high scoring sequence in the lownanomolar range (Table 1 and Figure 3), well within therange of aptamers developed by other means (34). Directcomparison of aptamers derived by the CLADE approachto those derived to the same ligand by other means is thesubject of a separate study (M. Platt. et al., Submitted forpublication). The specificity of binding was tested byassaying binding on the microarray to DsRed, a structu-rally unrelated protein. While some binding was identified,the highest affinity APC binders all had low DsRed bind-ing (Figure 4).
Figure 5A illustrates the way the population is made upof individual lineages and the way they vary in sizethrough the course of the evolution [see also Supplemen-tary Figure 8 for the complex dynamics of lineage sizes,similar to that seen in in vitro studies (15,35)]. How thoselineages explore the sequence landscape is shown inFigure 5B and C, also Supplementary Figures 9 and 10.
Sequences do not, in general, fall very close to the‘average’ surface of the landscape (Figure 5C), however,much of the discrepancy comes from the representation ofa highly multidimensional landscape in two or threedimensions (see Supplementary ‘Methods’ and Supple-mentary Figure 11). It is nonetheless clear that thesequence-fitness landscape is complex, with at least twomajor fitness peaks in APC binding (left and right inFigure 5B and C). This multimodality and a more general
Figure 4. Binding by G7 sequences to APC and DsRed. Both scales arearbitrary, but the APC scale corresponds to that in Figure 2. Themajority of sequences exhibiting a high degree of binding to APCpossess binding scores around 1 with DsRed, which corresponds toundetectable binding. While some binding to DsRed was identified,the highest affinity APC binders all have low DsRed binding.
Figure 2. Evolution of binding scores. The left side shows the medianscore and 95% bootstrap confidence interval for 30-mer experimentalprobes in each generation (solid line) and the same for the 500 controlsequences (dashed line). The right side shows the frequency distributionof all the binding scores in each generation. The spread of the scoredistributions generally increases (SD: G1=0.55, G2=0.6, G3=0.62,G4=0.73, G5=0.74, G6=0.78, G7=0.92, G8=0.92, G9=1.08).Scores are on an arbitrary scale based on a generalized log transform(50) of the raw intensity measurements. The raw scan of the medianscoring sequence from each generation assayed side by side on a sepa-rate chip is shown on the top of the left panel.
Table 1. Absolute binding via SPR values from the fits shown in
Figure 3
APCconcentration(nM)
‘on rate’ka (M�1s�1)
‘off rate’ kd(s�1) Apparent
dissociationconstantKD (M)
214 2.1E+04 5.3E� 05 2.6E� 0997 2.1E+04 4.3E� 05 2.0E� 0976 2.0E+04 5.5E� 05 2.7E� 0953 3.6E+04 6.1E� 05 1.7E� 0931 1.3E+04 6.4E� 05 5.0E� 09
Binding constants for APC to a high-scoring sequence (G9.3415,binding-score 12.6� 0.8) fitted at five different APC concentrations.The dissociation constant (KD) assuming 1:1 binding is simply a ratioof the ‘on’ and ‘off’ rates. A low-scoring sequence (C10489, binding-score 5.8� 0.1) did not give measurable binding.
Figure 3. SPR data and fits for a high scoring DNA sequence(G9.3415, score 12.6� 0.8). SPR signal is expressed in resonanceunits (RU), arrows indicate event timings. All data have the valuesfrom a control, blank flow cell subtracted. The fitted curves give theresults in Table 1. Following the injection of the regeneration buffer,the section at the end (following 2000s) is given to show the reconstitu-tion of the surface to an SPR signal close to the original baseline.
PAGE 5 OF 10 Nucleic Acids Research, 2009, Vol. 37, No. 1 e6
by guest on September 11, 2014
http://nar.oxfordjournals.org/D
ownloaded from
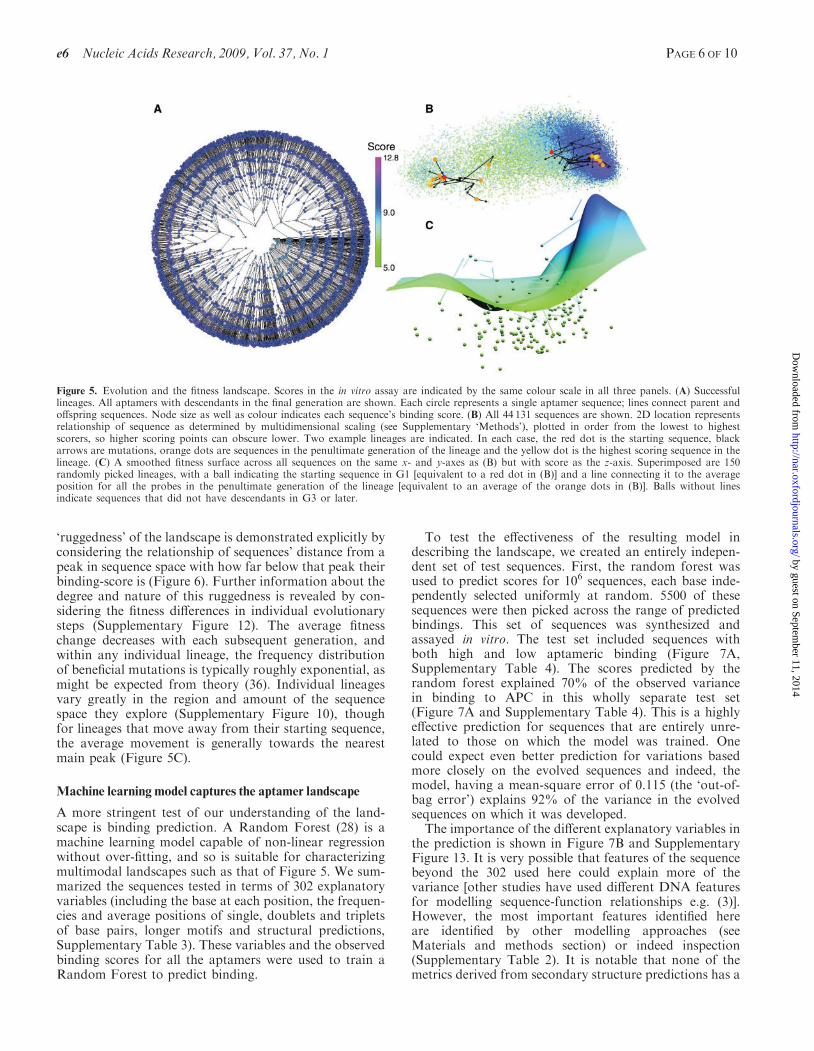
‘ruggedness’ of the landscape is demonstrated explicitly byconsidering the relationship of sequences’ distance from apeak in sequence space with how far below that peak theirbinding-score is (Figure 6). Further information about thedegree and nature of this ruggedness is revealed by con-sidering the fitness differences in individual evolutionarysteps (Supplementary Figure 12). The average fitnesschange decreases with each subsequent generation, andwithin any individual lineage, the frequency distributionof beneficial mutations is typically roughly exponential, asmight be expected from theory (36). Individual lineagesvary greatly in the region and amount of the sequencespace they explore (Supplementary Figure 10), thoughfor lineages that move away from their starting sequence,the average movement is generally towards the nearestmain peak (Figure 5C).
Machine learning model captures the aptamer landscape
A more stringent test of our understanding of the land-scape is binding prediction. A Random Forest (28) is amachine learning model capable of non-linear regressionwithout over-fitting, and so is suitable for characterizingmultimodal landscapes such as that of Figure 5. We sum-marized the sequences tested in terms of 302 explanatoryvariables (including the base at each position, the frequen-cies and average positions of single, doublets and tripletsof base pairs, longer motifs and structural predictions,Supplementary Table 3). These variables and the observedbinding scores for all the aptamers were used to train aRandom Forest to predict binding.
To test the effectiveness of the resulting model indescribing the landscape, we created an entirely indepen-dent set of test sequences. First, the random forest wasused to predict scores for 106 sequences, each base inde-pendently selected uniformly at random. 5500 of thesesequences were then picked across the range of predictedbindings. This set of sequences was synthesized andassayed in vitro. The test set included sequences withboth high and low aptameric binding (Figure 7A,Supplementary Table 4). The scores predicted by therandom forest explained 70% of the observed variancein binding to APC in this wholly separate test set(Figure 7A and Supplementary Table 4). This is a highlyeffective prediction for sequences that are entirely unre-lated to those on which the model was trained. Onecould expect even better prediction for variations basedmore closely on the evolved sequences and indeed, themodel, having a mean-square error of 0.115 (the ‘out-of-bag error’) explains 92% of the variance in the evolvedsequences on which it was developed.
The importance of the different explanatory variables inthe prediction is shown in Figure 7B and SupplementaryFigure 13. It is very possible that features of the sequencebeyond the 302 used here could explain more of thevariance [other studies have used different DNA featuresfor modelling sequence-function relationships e.g. (3)].However, the most important features identified hereare identified by other modelling approaches (seeMaterials and methods section) or indeed inspection(Supplementary Table 2). It is notable that none of themetrics derived from secondary structure predictions has a
Figure 5. Evolution and the fitness landscape. Scores in the in vitro assay are indicated by the same colour scale in all three panels. (A) Successfullineages. All aptamers with descendants in the final generation are shown. Each circle represents a single aptamer sequence; lines connect parent andoffspring sequences. Node size as well as colour indicates each sequence’s binding score. (B) All 44 131 sequences are shown. 2D location representsrelationship of sequence as determined by multidimensional scaling (see Supplementary ‘Methods’), plotted in order from the lowest to highestscorers, so higher scoring points can obscure lower. Two example lineages are indicated. In each case, the red dot is the starting sequence, blackarrows are mutations, orange dots are sequences in the penultimate generation of the lineage and the yellow dot is the highest scoring sequence in thelineage. (C) A smoothed fitness surface across all sequences on the same x- and y-axes as (B) but with score as the z-axis. Superimposed are 150randomly picked lineages, with a ball indicating the starting sequence in G1 [equivalent to a red dot in (B)] and a line connecting it to the averageposition for all the probes in the penultimate generation of the lineage [equivalent to an average of the orange dots in (B)]. Balls without linesindicate sequences that did not have descendants in G3 or later.
e6 Nucleic Acids Research, 2009, Vol. 37, No. 1 PAGE 6 OF 10
by guest on September 11, 2014
http://nar.oxfordjournals.org/D
ownloaded from

high importance. It is not clear whether this is due tospecific secondary structure truly being unimportant forthese aptamers or an inability of the prediction approachused to identify secondary structures correctly in the chip-surface environment.
Prior knowledge can be incorporated in CLADEaptamer design
There is much prior knowledge that may be relevant toaptamer design, e.g. in terms of known structure-functionrelationships such as nucleic acid motifs that bind specificamino acids (37) or particular structural features withdesirable properties (38), or complete existing aptamersequences. Such knowledge may lead to particularly infor-mative or interesting regions of the sequence-fitness land-scape. Of the 500 control aptamers included as parents forthe creation of G2, 255 were specifically generated usingprior knowledge. 129, (the ‘designed’ set) were generatedvia an algorithm which balanced 40 structural and
sequence features found in small molecule aptamers(Supplementary Figure 14, Supplementary ‘Methods’and C.G. Knight et al. unpublished data), while 126sequences (the ‘quadruplex’ set) were random sequencesapart from the nucleotides required to form a guanine (G)quadruplex (39). A G-quadruplex is a structural featuredependent on appropriately positioned G residues, and isa characteristic of a known DNA aptamer that binds theprotein thrombin (11,12).There was a striking contrast between fates in the evo-
lution of the ‘designed’ and ‘quadruplex’ sets of sequences.The 129 ‘designed’ set aptamers in G1 gave rise to 3707sequences in G9. In contrast, from the 126 ‘quadruplex’set in G1, only a single aptamer remained in the finalgeneration and that was predicted to have lost its quad-ruplex structure. The quadruplex aptamers performpoorly even in relation to random sequences—therebeing 2.3% as many quadruplex as random sequences inG1, but only 0.13% by G9. The poor performance of thequadruplex aptamers is consistent with the random forestmodel results in which the presence of a quadruplexsequence has a very low importance (299th of 302 expla-natory variables) and the variables of high importance arevery unlike G-quadruplex sequences (Figure 7B). Thisresult suggests that while important in DNA aptamers
Figure 6. Multimodality and ruggedness in the sequence-fitness land-scape. Relationship between sequence distance and score difference forall aptamers (A) Relative to the highest scoring sequence in the com-plete experiment (G9.3415), (B) Relative to the closer (in sequencespace) of the top scoring sequence in the two major peaks inFigure 5B and C (G9.3415 — ATCCCCCCCTCCCCTTATGTGCACCCGCAT and G8.5150 —ATAGGGGTTGGTTTGGGGGGGGGGATACTC). In each case the line is a cubic spline, stiffness�=100. The line in (B) is straighter than that in (A) indicating thatthese two peaks account for much of the multimodality in thesequence-fitness landscape.
Figure 7. Prediction of aptamer binding. (A) Observed versus predictedbinding for 5500 test sequences. Colour intensity indicates the densityof points. Red line indicates predicted=observed. Pearson correla-tion=0.87. (B) Importance of the most explanatory variables in therandom forest predictor of aptamer binding. Importance is defined asthe decrease in node impurity attributable to these variables across theforest. The motif reflects a contiguous sequence found anywhere withinthe 30mer. (C) Information content logo of the motif referred to in (B).The overall height at each position represents the sequence conserva-tion, within which the height of each symbol indicates the relativefrequency of each nucleotide.
PAGE 7 OF 10 Nucleic Acids Research, 2009, Vol. 37, No. 1 e6
by guest on September 11, 2014
http://nar.oxfordjournals.org/D
ownloaded from

(11,12), the G-quadruplex structural feature may not be ofuniversal utility for protein-binding DNA aptamers and/or that there are additional features required to make aquadruplex-containing aptamer that could not easily beachieved from the starting set of sequences we used. Thegood performance in the evolution of the designedsequence set relative to the random and quadruplex setssuggests that there may be aspects of aptamer design thatare common across very different substrates. The successof designed sequences is partly attributable to many ofthem already being close to the left-hand fitness peak(Figure 5B and C) in the first generation.
DISCUSSION
These experiments reveal a fitness landscape that is com-plex (Figure 5B and C) yet very well captured by ourpredictive model: the correlation of observed versus pre-dicted fitness for an entirely independent set of testsequences is remarkably high (0.87). The experiments arestrictly limited to a single molecule (APC) interactingunder very specific conditions with a very constrainedform of molecule (DNA 30 mers). Even so, the effective-ness of the model is striking considering that even withnine generations of evolution we covered only �4� 104
sequences, which is a tiny proportion of availablesequence space (�1018 sequences). Further, protein-aptamer interactions are complex, potentially inducingstructural changes within both molecules (12).The way this surprising predictability is achieved, and
hence clues to the nature of the genotype-fitness relation-ship in this system, is revealed by looking into the work-ings of the model. This also provides hypotheses for thephysical basis of aptameric binding. The most importantfeatures that determine aptamer binding, as described bythe model, concern C bases in the middle of sequences,such as the match to the motif shown in Figure 7C. Suchsequential Cs are not liable to �-stacking in single-stranded DNA which may aid flexibility of the sequences(27), a feature that is considered explicitly by the ‘bend’variable that is also important in the random forest model(Figure 7B). However, the evolution is by no means direc-ted towards a C homopolymer. Firstly, the motif shown inFigure 7C is not an approximation to a string of Cs—if aC homopolymer motif of the same length is scored, andthe random forest refitted using the homopolymer motifinstead of that in Figure 7C, the homopolymer motif hasonly a quarter of the motif ’s importance in the model(data not shown). Secondly, the complexity of the land-scape means that runs of Cs are neither necessary norsufficient for high-scoring aptamers. For instance,sequence CACCGGGCCCCCCCCCCCCCCCACCACGCC (G2.3596) contains a string of 15 Cs (there is onlyone aptamer in the whole evolution with more), yet scoresin the bottom 10% of aptamers overall. Conversely,the sequence ATCACACCAAACCTTTCTTCGATTAAGTCG (G6.5628), with no more than two adjacent Cs,scores in the top 10%. The other most importantfeatures in determining binding relate to the three basesat the 50-end of the sequence (the ‘position’ variables).
Even among these relatively simple variables, the modelcaptures complex effects. For instance, a C base in posi-tion 2 can give good binding, but only in combination with‘A’ in position 1 and ‘C’ or ‘T’ in position 3. The CLADEprocedure used here thoroughly explores these variables,meaning that, by G9, most aptamers start with ‘ATC’, thesequence with the highest marginal effect (SupplementaryFigure 13). This 50-motif is physically positioned awayfrom the surface of the chip, potentially representing aparticular recognition motif. This dependence of bindingon specific sequence motifs rather than merely nucleotidecomposition or other general features are consistent withthe known association of tight aptameric binding withsequences of high information content (40).
The insight into the sequence-fitness landscape(Figure 5) and the ability to predict binding (Figure 7)derive directly from the CLADE approach. However,this is not the only advantage to CLADE when comparedwith fully in vitro techniques such as SELEX and similarapproaches (41). Specific and noteworthy features ofCLADE include: unlike fully in vitro approaches,CLADE is not biased towards sequences favourable forPCR; there is no immobilization of the target ligand,which risks selecting aptamers which bind the immobiliza-tion matrix; different affinity ligands are produced fromthe same experiment [this is possible but uncommon inSELEX (42)] providing affinities suited to a chosen tar-get’s concentration range; there is complete control ofpopulation sizes, selection and mutation techniques,which allows one to deal with (and indeed study) issuesof founder effects, elitism and other pitfalls of evolu-tionary dynamics. The last of these offers scope to usesequence-changing operators that are not accessibleto fully in vitro techniques, e.g. the use of arbitraryknowledge-based transformations, such as the introduc-tion of particular motifs or palindromic sequences.Indeed external knowledge may be incorporated at anystage of CLADE. We have demonstrated the efficacy ofincorporating diverse prior knowledge in the design of theinitial population. Because CLADE does not use enzymesmeans that it is not confined to standard nucleic acidbases, nor to bases that are substrates for nucleic acidpolymerization. Aptamers could equally easily be designedto include locked nucleic acids, peptide nucleic acids ornon-biological bases, or indeed any other monomers,which may also be less subject to biological degradationif taken into an in vivo system. In this study, we have useda single binding assay. However, CLADE could equally beapplied to the evolution of other traits such as enzymaticactivities in ribozymes or for DNA computing (43).Different forms of multiplex assay, e.g. by mass spectro-metry, may in the future allow the evolution of aptamericbinding to different targets simultaneously, an approachthat will be aided by increasing spot densities on custommicroarrays and improvements in mass spectrometric ima-ging (44). None of these advantages come at the cost ofspeed since CLADE is quick: the automated sequencegeneration meant that we were able to perform one gen-eration of CLADE, including the design, synthesis andanalysis of microarrays, in 24 h.
e6 Nucleic Acids Research, 2009, Vol. 37, No. 1 PAGE 8 OF 10
by guest on September 11, 2014
http://nar.oxfordjournals.org/D
ownloaded from
The understanding we have gained of an aptamericlandscape is a form of ‘Quantitative Structure (orSequence)-Activity Relationship’ (QSAR, a term used inchemometrics). The CLADE approach could be extendedin the way that other QSAR approaches have been, to usethe connection between sequence and fitness, captured inour case by a random forest, in the process of the aptamerevolution itself. The use of models to accelerate the searchprocess is well known in evolutionary computation (45)and has been used successfully in developing desirableenzymatic activities (46). Conversely, the model could beused to minimize binding when generating aptamers to adifferent target without recourse to in vitro counter-selec-tion. In this regard, it is very important that the CLADEmethod ‘sees’ the low-binding sequences—compare theuniformity in colour (binding score) of Figure 5A, whichshows only sequences that make it through to the finalgeneration (as might be assayed in an in vitro technique),with the broad colour/score range of Figure 5B and Cwhich include all the sequences assayed by CLADE. Themodel we developed is therefore particularly good at pre-dicting, and hence generating, low-affinity bindingsequences, as well as ‘good’ aptamers (Figure 7A). Suchminimization of cross-reactivity is a crucial factor if apta-mer arrays for proteomics and metabolomics and theiradvantages of principle over much better established anti-body technologies (20,21) are to be realized. More gener-ally, a number of targets for positive or negative selectioncan be handled simultaneously using multiobjective evolu-tionary algorithms (47,48).
Mapping sequence-function landscapes for particularbiomolecules as we have done here is of wide relevance,notably in the emerging discipline of synthetic biology(49). However, mutational landscapes and landscape con-cepts of sequence-fitness relationships extend muchfurther among multi-molecule systems. For instance geno-mic landscapes of cancer (50) and landscapes of wholeorganism inclusive fitness (51), even ‘landscapes ofchange’ (52). For whole organisms, the landscape meta-phor has conceptual limitations (53), is rarely adequatelytested (54) and seldom extends back to the scale of theeffects of specific genome changes (55). However, progressis being made in the theory of sequence-fitness relation-ships in whole organisms (56). At the same time there is anunprecedented ability to work with mutations generated atunknown locations in complete genomes via high through-put sequencing (57) and array based technologies (58).Thus it may soon be possible to apply similar approachesto those developed here to understanding the vast, multi-modal sequence-fitness landscapes experienced by thecomplete genomes of evolving biological organisms.
SUPPLEMENTARY DATA
Supplementary Data are available at NAR Online.
ACKNOWLEDGEMENTS
We would like to thank Andy Hayes, Sanjay Nilapwar,Steve Oliver, Mark Santa Ana, John Cooper, Axel Stover,
Dominic Suciu and Karl Maurer for discussions and assis-tance in the microarray work and Julia Handl for analy-tical assistance.
FUNDING
Biotechnology and Biological Sciences Research Council;David Phillips fellowship from the BBSRC (to J.K.);Wellcome Trust (to C.K.). This is a contribution fromthe Manchester Centre for Integrative Systems Biology(www.mcisb.org) which is supported by a BBSRC/EPSRC grant. Funding for open access charge: BBSRC.
Conflict of interest statement. None declared.
REFERENCES
1. Waddington,C.H. (1957) The Strategy of the Genes; A Discussion ofSome Aspects of Theoretical Biology. Allen & Unwin, London.
2. Poelwijk,F.J., Kiviet,D.J., Weinreich,D.M. and Tans,S.J. (2007)Empirical fitness landscapes reveal accessible evolutionary paths.Nature, 445, 383–386.
3. Lee,W., Tillo,D., Bray,N., Morse,R.H., Davis,R.W., Hughes,T.R.and Nislow,C. (2007) A high-resolution atlas of nucleosome occu-pancy in yeast. Nat. Genet., 39, 1235–1244.
4. Berger,M.F., Philippakis,A.A., Qureshi,A.M., He,F.S., Estep,P.W.III and Bulyk,M.L. (2006) Compact, universal DNA microarrays tocomprehensively determine transcription-factor binding site specifi-cities. Nat. Biotechnol., 24, 1429–1435.
5. Kaufmann,S. and Levin,S. (1987) Towards a general theory ofadaptive walks on rugged landscapes. J. Theor. Biol., 128, 11–45.
6. Schuster,P., Fontana,W., Stadler,P.F. and Hofacker,I.L. (1994)From sequences to shapes and back: a case study in RNA sec-ondary structures. Proc. R. Soc. London,B, 255, 279–284.
7. Cowperthwaite,M.C. and Meyers,L.A. (2007) How mutational net-works shape evolution: Lessons from RNA models. Annu. Rev.Ecol. Evol. Syst., 38, 203–230.
8. Fogel,D.B. (2000) What is evolutionary computation? IEEESpectrum, 37, 28–32.
9. Ellington,A.D. and Szostak,J.W. (1990) In vitro selection of RNAmolecules that bind specific ligands. Nature, 346, 818–822.
10. Tuerk,C. and Gold,L. (1990) Systematic evolution of ligands byexponential enrichment: RNA ligands to bacteriophage T4 DNApolymerase. Science, 249, 505–510.
11. Macaya,R.F., Schultze,P., Smith,F.W., Roe,J.A. and Feigon,J.(1993) Thrombin-binding DNA aptamer forms a unimolecularquadruplex structure in solution. Proc. Natl Acad. Sci. USA, 90,3745–3749.
12. Padmanabhan,K., Padmanabhan,K.P., Ferrara,J.D., Sadler,J.E.and Tulinsky,A. (1993) The structure of alpha-thrombin inhibitedby a 15-mer single-stranded DNA aptamer. J. Biol. Chem., 268,17651–17654.
13. Beaudry,A.A. and Joyce,G.F. (1992) Directed evolution of an RNAenzyme. Science, 257, 635–641.
14. Davis,J.H. and Szostak,J.W. (2002) Isolation of high-affinity GTPaptamers from partially structured RNA libraries. Proc. Natl Acad.Sci. USA, 99, 11616–11621.
15. Bartel,D.P. and Szostak,J.W. (1993) Isolation of newribozymes from a large pool of random sequences. Science, 261,1411–1418.
16. Asai,R., Nishimura,S.I., Aita,T. and Takahashi,K. (2004) In vitroselection of DNA aptamers on chips using a method for generatingpoint mutations. Anal. Lett., 37, 645–656.
17. Ikebukuro,K., Okumura,Y., Sumikura,K. and Karube,I. (2005) Anovel method of screening thrombin-inhibiting DNA aptamersusing an evolution-mimicking algorithm. Nucleic Acids Res., 33,e108.
18. Stanlis,K.K. and McIntosh,J.R. (2003) Single-strand DNA apta-mers as probes for protein localization in cells. J. Histochem.Cytochem., 51, 797–808.
PAGE 9 OF 10 Nucleic Acids Research, 2009, Vol. 37, No. 1 e6
by guest on September 11, 2014
http://nar.oxfordjournals.org/D
ownloaded from

19. Stadtherr,K., Wolf,H. and Lindner,P. (2005) An aptamer-basedprotein biochip. Anal. Chem., 77, 3437–3443.
20. Tomizaki,K.Y., Usui,K. and Mihara,H. (2005) Protein-detectingmicroarrays: current accomplishments and requirements.ChemBioChem., 6, 782–799.
21. Famulok,M., Hartig,J.S. and Mayer,G. (2007) Functional aptamersand aptazymes in biotechnology, diagnostics, and therapy. Chem.Rev., 107, 3715–3743.
22. Wood,S.N. (2004) Stable and efficient multiple smoothingparameter estimation for generalized additive models. J. Am. Stat.Assoc., 99, 673–686.
23. Huber,W., von Heydebreck,A., Sultmann,H., Poustka,A. andVingron,M. (2002) Variance stabilization applied to microarraydata calibration and to the quantification of differential expression.Bioinformatics, 18(Suppl 1), S96–S104.
24. Wedge,D., Rowe,W., Kell,D. and Knowles,J. (2008) In silicoModelling of Directed Evolution: Implications for ExperimentalDesign and Stepwise Evolution. J. Theor. Biol., (in press).
25. Thijs,G., Marchal,K., Lescot,M., Rombauts,S., De Moor,B.,Rouze,P. and Moreau,Y. (2002) A Gibbs sampling method to detectoverrepresented motifs in the upstream regions of coexpressedgenes. J. Comput. Biol., 9, 447–464.
26. Markham,N.R. and Zuker,M. (2005) DINAMelt web server fornucleic acid melting prediction. Nucleic Acids Res., 33, W577–W581.
27. Sain,A., Chen,J.Z.Y. and Ha,B.Y. (2006) Persistency of single-stranded DNA: The interplay between base sequences and basestacking. Physica. A, 369, 679–687.
28. Breiman,L. (2001) Random forests. Mach. Learn., 45, 5–32.29. Breiman,L., Friedman,J.H., Olshen,R.A. and Stone,C.J. (1984)
Classification and Regression Trees. Wadsworth International,Monterey.
30. Koza,J.R. (1992) Genetic Programming: On thePprogramming ofComputers by Means of Natural Selection. MIT Press, Cambridge,Mass.
31. SAS Institute Inc. (1989–2007). Cary, NC.32. R development core team. (2008). R foundation for statistical
computing, Vienna.33. Gentleman,R.C., Carey,V.J., Bates,D.M., Bolstad,B., Dettling,M.,
Dudoit,S., Ellis,B., Gautier,L., Ge,Y., Gentry,J. et al. (2004)Bioconductor: open software development for computationalbiology and bioinformatics. Genome Biol., 5, R80.
34. Silverman,S.K. (2008) Artificial functional nucleic acids: Aptamers,ribozymes and deoxyribozymes identified by in vitro selection.In Lu,Y. and Li,Y. (eds), Functional Nucleic Acids for Sensing andOther Analytical Applications. Springer, New York.
35. Fitter,S. and James,R. (2005) Deconvolution of a complex targetusing DNA aptamers. J. Biol. Chem., 280, 34193–34201.
36. Orr,H.A. (2006) The distribution of fitness effects among beneficialmutations in Fisher’s geometric model of adaptation. J. Theor.Biol., 238, 279–285.
37. Hoffman,M.M., Khrapov,M.A., Cox,J.C., Yao,J., Tong,L. andEllington,A.D. (2004) AANT: the Amino Acid-NucleotideInteraction Database. Nucleic Acids Res., 32, D174–D181.
38. Lescoute,A. and Westhof,E. (2006) Topology of three-way junctionsin folded RNAs. RNA, 12, 83–93.
39. Burge,S., Parkinson,G.N., Hazel,P., Todd,A.K. and Neidle,S.(2006) Quadruplex DNA: sequence, topology and structure. NucleicAcids Res., 34, 5402–5415.
40. Carothers,J.M., Oestreich,S.C., Davis,J.H. and Szostak,J.W. (2004)Informational complexity and functional activity of RNA struc-tures. J. Am. Chem. Soc., 126, 5130–137.
41. Paegel,B.M. and Joyce,G.F. (2008) Darwinian evolution on a chip.PLoS Biol., 6, e85.
42. Roulet,E., Busso,S., Camargo,A.A., Simpson,A.J., Mermod,N. andBucher,P. (2002) High-throughput SELEX SAGE method forquantitative modeling of transcription-factor binding sites. Nat.Biotechnol., 20, 831–835.
43. Stojanovic,M.N. and Stefanovic,D. (2003) A deoxyribozyme-basedmolecular automaton. Nat. Biotechnol., 21, 1069–1074.
44. Northen,T.R., Yanes,O., Northen,M.T., Marrinucci,D.,Uritboonthai,W., Apon,J., Golledge,S.L., Nordstrom,A. andSiuzdak,G. (2007) Clathrate nanostructures for mass spectrometry.Nature, 449, 1033–1036.
45. Jin,Y., Olhofer,M. and Sendhoff,B. (2002) A framework for evolu-tionary optimization with approximate fitness functions. IEEETrans. Evol. Comput., 6, 481–494.
46. Fox,R.J., Davis,S.C., Mundorff,E.C., Newman,L.M., Gavrilovic,V.,Ma,S.K., Chung,L.M., Ching,C., Tam,S., Muley,S. et al. (2007)Improving catalytic function by ProSAR-driven enzyme evolution.Nat. Biotechnol., 25, 338–344.
47. Knowles,J.D. and Corne,D.W. (2000) Approximating theNondominated Front Using the Pareto Archived EvolutionStrategy. Evol. Comput., 8, 149–172.
48. Zitzler,E. (1999) Evolutionary Algorithms for MultiobjectiveOptimization: Methods and Applications. Shaker, Aachen.
49. Andrianantoandro,E., Basu,S., Karig,D.K. and Weiss,R. (2006)Synthetic biology: new engineering rules for an emerging discipline.Mol. Syst. Biol., 2:2006.0028.
50. Wood,L.D., Parsons,D.W., Jones,S., Lin,J., Sjoblom,T., Leary,R.J.,Shen,D., Boca,S.M., Barber,T., Ptak,J. et al. (2007) The genomiclandscapes of human breast and colorectal cancers. Science, 318,1108–1113.
51. Wright,S. (1932) The roles of mutation, inbreeding, crossbreedingand selection in evolution. Proc. Sixth Internat. Cong.Genetics, 1,356–366.
52. Kwinter,S. and Boccioni,U. (1992) Landscapes of change:Boccioni’s ‘‘Stati d’animo’’ as a general theory of models.Assemblage, 19, 50–65.
53. Reiss,J.O. (2007) Relative fitness, teleology, and the adaptive land-scape. Evol. Biol., 34, 4–27.
54. Belotte,D., Curien,J.B., Maclean,R.C. and Bell,G. (2003) Anexperimental test of local adaptation in soil bacteria. Evolution, 57,27–36.
55. Lenski,R.E., Ofria,C., Pennock,R.T. and Adami,C. (2003) Theevolutionary origin of complex features. Nature, 423, 139–144.
56. Orr,H.A. (2006) The population genetics of adaptation oncorrelated fitness landscapes: the block model. Evolution, 60,1113–1124.
57. Margulies,M., Egholm,M., Altman,W.E., Attiya,S., Bader,J.S.,Bemben,L.A., Berka,J., Braverman,M.S., Chen,Y.J., Chen,Z. et al.(2005) Genome sequencing in microfabricated high-density picolitrereactors. Nature, 437, 376–380.
58. Gresham,D., Ruderfer,D.M., Pratt,S.C., Schacherer,J.,Dunham,M.J., Botstein,D. and Kruglyak,L. (2006) Genome-widedetection of polymorphisms at nucleotide resolution with a singleDNA microarray. Science, 311, 1932–1936.
e6 Nucleic Acids Research, 2009, Vol. 37, No. 1 PAGE 10 OF 10
by guest on September 11, 2014
http://nar.oxfordjournals.org/D
ownloaded from
Copyright © 2022 FDOKUMEN