Ardrabhumi 2016.pdf - VPMThane.org
202
Ecosystem Services of Wetlands th 16 17 February 2016 - th B.N. Bandodkar College of Science, Thane NAAC Re-accredited 'A' Grade and Best College – University of Mumbai Selected for FIST 'O' Level Grant Vidya Prasarak Mandal's International Conference on ‘Ardrabhumi : 2016’ ISBN : 978-81-923 628-3-0 Organized by Department of Zoology and Environmental Science in Collaboration with Mangrove Cell, Mumbai Sálim Ali Center for Ornithology and Natural History, Coimbatore Mangrove Society of India, Goa HOPE Nature Trust, Thane Edited by Prof. Sudesh Rathod, Dr. Vaishali Somani and Dr. Sheetal Pachpande Ardrabhumi : 2016 E 9 S 6 T 9 D 1 . O C L L R E G A K E D O O F D S N C A I B E . N N C . E B
-
Upload
khangminh22 -
Category
Documents
-
view
0 -
download
0
Transcript of Ardrabhumi 2016.pdf - VPMThane.org

Ecosystem Services of Wetlands
th16 17 February 2016- th
B.N. Bandodkar College of Science, ThaneNAAC Re-accredited 'A' Grade and Best College – University of Mumbai
Selected for FIST 'O' Level Grant
Vidya Prasarak Mandal's
International Conference on
‘Ardrabhumi : 2016’
ISBN : 978-81-923 628-3-0
Organized by
Department of Zoology and Environmental Science
in Collaboration with
Mangrove Cell, Mumbai Sálim Ali Center for Ornithology and Natural History, Coimbatore
Mangrove Society of India, Goa HOPE Nature Trust, Thane
Edited by
Prof. Sudesh Rathod, Dr. Vaishali Somani and Dr. Sheetal PachpandeA
rdra
bh
um
i :
20
16
E 9S 6 T 9 D 1.
OC L LR EGAK E D OO FD SN CA IB E . N
N C . EB
WO
RK
SH
OP
1 -
14
Au
gu
st,
20
15
WO
RK
SH
OP
2 -
20
No
ve
mb
er,
20
15
HE
RB
AR
IUM
WO
RK
SH
OP
- 2
0 N
ove
mb
er, 2
015

I
Proceedings of theInternational Conference on
Ecosystem Services of Wetlands
Ardrabhumi - 201616th and 17th February 2016
Organized by
Department of Zoology and Environmental ScienceVidya Prasarak Mandal’s
B. N. Bandodkar College of ScienceNAAC re-accredited ‘A’ grade
Best College Award (University of Mumbai)Selected for FIST ‘O’ level
Jnanadweepa, Chendani Bunder Road, Thane (W) 400 601. Maharashtra
in Collaboration withMangrove Cell, Mumbai
Sálim Ali Centre for Ornithology and Natural History, CoimbatoreMangrove Society of India, Goa
AndHOPE Nature Trust, Thane
Dr. (Mrs.) Madhuri K. Pejaver Dr. (Mrs.) Nandini N. Patil Principal, Convener Co-convener
Organizing Secretary
Prof. Sudesh Rathod Dr. (Mrs.) Poonam N. Kurve
Organizing Committee
Dr. R. P. Athalye Dr. G. Quadros (SACON)Dr. (Mrs.) V. D. Manjramkar Dr. (Mrs.) V. U. Somani (M. D. College)Dr. K. M. Pariya Mr. A. S. JoshiDr. A. S. Morajkar Dr. (Mrs.) S. A. PachpandeMs. P. H. Lohar Mr. D. D. ShenaiMs. K. P. Sutar Mr. M. P. Manjrekar
Mrs. S. G. Mathias

II
Please Note:The Authors of the papers are solelyresponsible for technical content of thepapers and references cited therein.
Photographs byProf. Sudesh RathodDr. Poonam KurveDr. Shirish ManchiProf. Ashutosh JoshiDr. Sheetal PachpandeMr. Anuj TrivediMr. Anees Khan
ISBN : 978-81-923 628-3-0
Published by :
Department of Zoology and Environmental ScienceVPM’s B.N. Bandodkar College of Science“Jnanadweepa”, Chendani, Bunder Road,Thane (W) 400 601. MaharashtraTel. : 2533 6507www.vpmthane.org
Printed atPerfect Prints22, Jyoti Industrial Estate,Nooribaba Darga Road, Thane 400 601.Tel. : 2534 1291 / 2541 3546Email : [email protected]
Citation: Proceedings of International Conference on Ecosystem Services of Wetlands: Ardrabhumi - 2016.Edited by Sudesh Rathod, Vaishali Somani and Sheetal Pachpande. Published by Dept. of Zoology and EnvironmentalScience, VPM’s B. N. Bandodkar College of Science, Thane. 2016 pp. 190 + VIII.
Members of Research Committee
Dr. M. N. Nyayate Dr. R. P. AthalyeDr. A. P. Patil Dr. D. R. AmbavadekarDr. M. V. Rathnam Dr. K. D. PhalDr. (Mrs.) M. B. Saha Dr. V. M. JamdhadeDr. (Mrs.) A. S. Goswami-Giri Ms. Prajakta Mayekar
Advisory committee
National Advisory
Mr. N. Vasudevan(Chief Conservator of Forest, Mangrove Cell, Mumbai)
Mr. Kishor Thakrey(Divisional Forest Officer, Govt. of Maharashtra)
Mr. Avinash Kubal(Deputy Director, Maharashtra Nature Park, Mumbai)
Dr. Geetanjali Deshmukhe(Sr. Scientist, Central Institute of Fishery Education, Mumbai)
Dr. Sasikumar Menon(Asst. Director, Therapeutic Drug Monitoring Laboratory, Mumbai)
Dr. Pramod Salaskar(SERI, Mumbai)
Dr. Moses Kolet(Principal, G. M. Momin Women’s College, Bhiwandi)
International Advisory
Dr. Sanjay Deshmukh(Hon. Vice Chancellor, University of Mumbai)
Dr. P. A. Azeez(Director, Salim Ali Centre for Ornithology and NaturalHistory, Coimbatore)
Dr. Baban Ingole(Chief Scientist, National Institute of Oceanography,Goa)
Dr. Arvind Untawale(Secretary, Mangrove Society of India, Goa)
Dr. Deepa Rathi(President, HOPE, Thane)
Dr. Deepak Apte(Director, BNHS, Mumbai)

III
Chairman’s addressChairman’s addressChairman’s addressChairman’s addressChairman’s address
I am pleased to present the proceedings of International Conference on Ecosystem Services of Wetlands“Ardrabhumi 2016” organized by V.P.M.’s B. N. Bandodkar College of Science, Thane.
Urbanization and development have always exploited nature for ages known. Most of the resources arenon-renewable and hence are in the danger of being exhausted. There is always a need to search and tap theinexhaustible resources. Since last decade the importance of sustainable development has been taken cognizanceat various levels. Various global and national conventions have discussed the need to conserve nature andnatural resources for a healthy and pollution free future. Conscious utilization of resources appears to be theonly available option for human existence. Though going back to traditional living sounds impracticable, referringto the ideal modalities of living and lifestyle for better tomorrow would be laudable. As human being is part ofthe natural food web/chain, appropriate care of rest of the links in the web has to be taken. Live and let live isthe keyword for self sustenance and prosperity.
Research and education fields are the proper arenas which can play important role in achieving suchgoals. There is ample space for research, curricular and co-curricular activities to supplement this movement.Diverting to alternative resources and avoiding over exploitation of available natural resources will certainlylead us to sustainable development.
The various sessions and deliberations in this conference would certainly open new channels for researchand provide directives for a healthy living in harmony with nature.
I wish this conference a great success.
Dr. Vijay V. BedekarChairmanVidya Prasarak Mandal, Thane

IV
Convener’s noteConvener’s noteConvener’s noteConvener’s noteConvener’s noteWetlands are always discussed for their immense national and global importance due to their varied
habitats and species diversity. These ecosystems are not only houses for various living forms but also areessential for wellbeing of humans. Urbanization, industrialization and many other anthropogenic developmentalactivities have posed a serious threat to them. Conservation treaties like ‘Ramsar convention’ are beingimplemented for protecting them. Thane district is blessed with considerable wetland areas like river, creek,lakes, etc. Existence of some of these wetlands has been challenged by factors such as continuous industrialpollution, reclamation activity, solid waste disposal and so on. We the teaching and research fraternity need totake an initiative to spread a word about richness of wetlands and the need to protect them.
V.P.M.’s B. N. Bandodkar College of Science has always been at the forefront and proactive in undertakingsuch initiatives. This International Conference, organized jointly by Departments of Zoology and EnvironmentalScience of our college is one of the steps to achieving it.
Here, I take this opportunity to appreciate the efforts put in by the two departments and all others tomake it a success. I am delighted to present these proceedings to you.
Principal Dr. (Mrs.) M. K. PejaverConvenerV.P.M.’s B. N. Bandodkar College of Science, Thane

V
Contents
Section I - Keynote Address
Wetlands: A Brief on Their Role in Environmental Security and Climate Change Adaptations- P. A. Azeez ............................................................................................................................................................... 3
Legal Protection to Coastal Wetlands- Debi Goenka .......................................................................................................................................................... 5
Ecosystem Services of Coastal Wetlands – Case Study of Gulf of Kachchh- Geetanjali Deshmukhe ........................................................................................................................................... 7
Ecosystem services of wetlands- W. A. H. P. Guruge ................................................................................................................................................. 12
Role of Industries in Mangroves Conservation: Godrej Case Study- Laxmikant Deshpande ......................................................................................................................................... 14
Ecosystems of the coastal wetlands- A.G. Untawale ....................................................................................................................................................... 16
Chemicals of emerging concern in hydrological systems of UNESCO World Heritage Sites in cluster countries:Are they really clustered?
- B. Anjan Kumar Prusty ......................................................................................................................................... 33
Wetlands, Ecosystems and Geographic Information Systems (GIS)- Amit A. Kokje ........................................................................................................................................................ 35
Use of RTI and Conservation of wetlands- Stalin Dayananad ................................................................................................................................................ 36
Degradation of Wetlands: Problem and Solutions- R. P. Athalye ......................................................................................................................................................... 37
A Participatory Natural Resource Management Program from the Subterranean Wetlands Ecosystem inAndaman and Nicobar Islands
- Manchi Shirish S. ................................................................................................................................................. 39
Section II - Research Papers
Remedial Connotation of Pongamia pinnata for Antidiabetic Therapy- Morajkar A. S., Hardikar B. P., Sharma B. B. ...................................................................................................... 43
A Note On Anthropogenic Activities On Wetlands In Sindhudurg District- Divya S. Sarang, Sanjay Bhagwat, Amruta A. Shendge ...................................................................................... 50
Bio-chemical Analysis and Study of Self Restoration Capacity of Mira-bhayandar Wetlands Using ModifiedWinogradsky’s Column
- Gayathri N., Bagkar P. ......................................................................................................................................... 53
Ecological and Socio-cultural Assessment of The High Altitude Wetland: A Case Study of The Bhagajang WetlandComplex in Western Arunachal Pradesh, India.
- Jaya Upadhyay, Rajarshi Chakraborty and Kamal Medhi ................................................................................. 57
Phytochemical screening and free radical scavenging activity in Nelumbo nucifera Gaertn.- Megha Y. Marathe and Moitreyee Saha .............................................................................................................. 63
Seasonal Influence of Limnological Variables on Plankton Dynamics of A Small, Shallow Reservoir From Panvel- Minakshi Gurav and Madhuri Pejaver ............................................................................................................... 66

VI
Studies on the Growing Menace of Aquatic Weeds in the Backwaters of Kerala, India- Moses Kolet .......................................................................................................................................................... 72
Diversity of Marine Macroalgae from Devgad in Sindhudurg District of Maharashtra- N. M. Valanju and V. M. Jamdhade ...................................................................................................................... 77
Impact of Water Released from Sewage Treatment Plant on Macrofaunal Diversity of Thane Creek, India.- Sheetal Pachpande and Madhuri Pejaver ........................................................................................................... 80
Preliminary phytochemical assessment and Antioxidant activity of Eichhornia crassipes (Mart.) Solms.- Snehal N. Bhangale and Moitreyee Saha ........................................................................................................... 84
Hydrographic study of waters near mangrove belt of Elephanta Island, Mumbai, India- Salvi Sonal, Ruhi Jaiswar, Ninad Marathe, Avinash Rokade and Bhavita Chavan .......................................... 88
Avifaunal diversity of wetland ecosystem and salt pans around Bhandup Pumping Station, Mumbai, India- Shubhda Kushwaha, Kuldeep Mhatre and Neelima Kulkarni ........................................................................... 93
Impact of Immersion of Ganesh Idols on Physicochemical Parameters of Pond Water Samples- Chetana Shetty, Urmila Kumavat, Siddhesh Mishal and Ashutosh Jawale ......................................................103
Study of Antibacterial Activity of Medicinal Plants on MDR Vibrio cholerae Isolated from Waste Water ofLatur City
Jadhav R. N. .......................................................................................................................................................... 105
Multiple Criteria Decision Making Techniques for Ranking Some Lakes in Thane City.- Kalpana D. Phal .................................................................................................................................................108
Status of Wetland Birds in and around Panvel with Reference to International Airport Panvel, Navi Mumbai,Maharashtra
- Sandhya Kupekar and Mayur Naik ...................................................................................................................110
Chronospatial Frequency Of Fishing Gears Used Along The Ulhas River Estuary- Sudesh D. Rathod and Nandini N. Patil .............................................................................................................114
Avian diversity along MulaMutha River, Pune, India- Surabhi V. Walavalkar ........................................................................................................................................ 121
A Note On Fish Kill At Jail Lake , Thane, Ms, India- Somani Vaishali and Sarang Shashank .............................................................................................................127
Sustainability Of Peltophorum Pterocarpum (Dc) Backer. In Salt Pan Area- Yojana G. Desai .................................................................................................................................................... 130
Fishery Status of Alimghar Channel of Ulhas River, Thane District,(Ms), India.- Poonam Kurve, Vicky Patil ................................................................................................................................. 132
Wetland Vegetation of Nagla Block (SGNP)- Bindu Gopalkrishnan, Seema Aghase and Urmila Kumavat .............................................................................137
A Survey of Bird Diversity at Bhandup Pumping Station: an Urban Habitat, (M.S.) India.- Poonam Kurve, Nirmalkumar Kurve, Umang Kale, Ashutosh Joshi .................................................................139
Mangrove Diversity of Uran, Navi Mumbai, West Coast of India- Aamod N. Thakkar .............................................................................................................................................. 145
Spatio-temporal variation of physico-chemical parameters of water and sediments from Panvel Creek, Raigad,Maharashtra, India.
- Rupali A. Zele, Poonam Kurve ............................................................................................................................ 148

VII
Use of Paramoecium caudatumas a test model in the studies of heavy metal pollution- V. S. Narayane, H. A. Padwal and N. B. Kamble .................................................................................................154
Moss Diversity Around Wetland Areas of Lonavala and Their Role in Conservation of Wetland Ecosystems- Gauri Soman .......................................................................................................................................................157
Preliminary Study of Phytoplankton Diversity to Assess Pollution Status of Lotus Point Lake,Kurul, Alibaug, M. S, India.
- Poonam Kurve, Gayatri Oak, Sneha Joshi, Dilip Shenai .................................................................................. 160
Section III - Research Articles and Short Communications
Post Idol Immersion Effect on Water Quality of Chandrabhaga River in Nagpur- A. M. Watkar, M. P. Barbate ...............................................................................................................................167
Water Quality Assessment of Zilpi Pond, Near Hingna, Nagpur,India- M. M. Bhatkulkar, A. M. Watkar, N. C. Kongre ..................................................................................................170
Wetlands - Importance And Challenges- Nirbhavane Gangotri, Kshama Khobragade ..................................................................................................... 172
Effect of Idol Immersion on Water Quality of Bhandupeshwartalao, Bhandup.- Ashwini Jadhav, Priyanka Yadav, Neha Sawant, Sakshi. .................................................................................. 177
Wetland Protection and Management- Ujwala Sav, Maria Achary .................................................................................................................................. 179
Comparibility of Lipid and Protein In Shrimps: Rich Food of Wetland- Vinda Manjramkar, Juilee Koli, Riddhi Koli, Megha Khose, Rakesh Rudruke, Rushabh Chaudhari, Pawan Patil ...................................................................................................................... 182
Baseline analysis of impact on an inland wetland ecosystem of DPS lake, Seawood, Navi Mumbai, Maharashtra- Gajanan Patil, Shalaka Shejwalkar, Disha Karanjgaokar ...............................................................................185
Author Index ...................................................................................................................................................................... 188

VIII

1
International Conference on Ecosystem Services of Wetlands - ‘Ardrabhumi :2016’ISBN : 978-81-923628-3-0
Section IKeynote Address

2
International Conference on Ecosystem Services of Wetlands - ‘Ardrabhumi :2016’ISBN : 978-81-923628-3-0

3
International Conference on Ecosystem Services of Wetlands - ‘Ardrabhumi :2016’ISBN : 978-81-923628-3-0
Wetlands: A Brief on Their Role in Environmental Security and ClimateChange Adaptations
P. A. AzeezSálim Ali Centre for Ornithology and Natural History
Coimbatore -641108
Wetlands, a major feature of landscape across theworld, but are among the most ill-treated of the ecosystems.Wetlands of all kinds, not only those associated with cities,but also in distant rural environs are under various levelsand types of threats. In cities they are largely a place todump all types of wastes and in rural environs they are leastcared habitats; hence, they are perhaps among the fastestdepleting habitats across the world.
Although these highly productive, diverse and uniqueecosystems were the cradle of human civilization, theyremained neglected till a couple of decades possibly for ourignorance on their services. It would be also that humanstake the nature’s services as gratis since market does notacknowledge appropriate costs to those services. Thuswetlands came to public eye attention as a system worthprotection only after the 1971 Ramsar convention. Thewetlands are multifunctional1 known to offer ecosystemservices of all the four types identified by the MillenniumEcosystem Assessment2 - provisioning, regulating, culturaland supporting services. Nevertheless, the message hasnot gone deep into the planners, administrators andespecially the public and the market, and hence wetlandscontinue to disappear at alarming rates, in particular thosenumerous but important smaller ones. Wetlands have beenregarded wastelands to be filled up, occupied and divertedfor other human needs, disregarding the crucial servicesthey offer to humankind as well as other life forms. Perhapsthe diversity and particularities of these ecosystems, varyingwith respect to specifics, complicating defining them wouldhave added to the disregard. Many workers emphasise theimportance of draw down in maintaining the ecosystem,many emphasise the structure, while several othersemphasise the process and many the ecological succession.
Of the several ecosystem services the wetlands offer,both tangible and intangible, a more recent concern is the
issue of global climate change, carbon sequestration, andthe role of wetlands in regulating the impacts and in possibleadaptation strategies. Wetlands serve varied life supportprocesses such as energy fixation, biogeochemical cycling,and evolution that would be important for possible adaptionstrategies. Wetlands are systems where detritus, created inlarge quantities, plays crucial role and hence has beenconsidered the wealth of wetlands; the dead and decayinganimal and plant matter that under prevalent aerobiccondition settle underneath along with sediments andaccumulate as stored carbon3. Wetlands are known thatcoastal wetlands fix three to five times carbon than tropicalforests4. It is said that the total carbon stored in wetlandsare in the range of 300-700 billion tons, almost equal to thatin the atmosphere. According to some studies, althoughwetlands may occupy only in the range of 4-8% of the landarea, they contain about 830 Tg/year of carbon with averageannual net carbon retention of 118 g-C m-2 / year5.Nevertheless, wetlands in underdeveloped countries arehighlighted for greenhouse gas emission, based on limitedexperimentation especially in rice paddies, and data layingblame on wetlands for methane emissions and ensuingclimate change. It appears that international pressures haveadded to this conclusion as a pressure strategy to force thebiggest developing nations, India and China, to reduce theirgreen house gas emissions or more appropriately, to find analibi for the non-conformance of USA, the biggest per capitagreen house gas emitter, with the former Kyoto protocolrequirement. However, recent Climate Change Conference -CoP-21 have seen some positive changes. It seems that weare yet to correctly estimate with sufficient certainty whetherwetlands are significant global carbon sources or sinks.
In recent years advances in environmental andecological studies have shed light on ecological andenvironmental intricacies of wetlands: their values are being
1 Ing-Marie Gren, Carl Folke, Kerry Turner, Ian Batemen (1994), Primary and secondary values of wetland ecosystems,Environmental and Resource Economics 4(1): 55-74, DoI 10.1007/BF006919322 Millennium Ecosystem Assessment (2005), Ecosystems and Human Well-Being: Wetlands and Water Synthesis. WorldResources Institute, Washington, Dc.3 K. Ramesh Reddy, Ronald D. DeLaune (2008), Biogeochemistry of Wetlands: Science and Applications, CRC press4 Murray B, Pendleton L, Jenkins W A and Sifleet S (2011), Green Payments for Blue Carbon: Economic Incentives forProtecting Threatened Coastal Habitats. Nicholas Institute Report NI R 11-045 William J. Mitsch, Blanca Bernal, Amanda M Nahlik, Ulo Mander, Li Zhang, Christopher J. Anderson, Sven E. Jorgensen andHans Brix (2012) Wetlands, carbon, and climate change, Landscape Ecol, DOI 10.1007/s10980-012-9758-8

4
International Conference on Ecosystem Services of Wetlands - ‘Ardrabhumi :2016’ISBN : 978-81-923628-3-0
recognized, and wetland protection is considered imperativein many parts of the world. The academia and managershave well acknowledged that the wetlands perform a numberof invaluable tangible and intangible functions, offer severalservices and commodities to humanity. To a lesser extent,but progressively more, the policy makers and investors arealso getting conscious of the importance of the wetlandsfor sustainable development of the humankind. Although,there is increasing realisation of the economic importanceof the world’s peat resources, which are estimated to beabout 1.9 trillion tons, there are further more realisationsthat extensive exploitation of these resources will add on tothe carbon dioxide content in the atmosphere.
Monitory valuation of an ecosystem, especiallywetlands, is important in a sense that it conveys the valueof the system to non-professionals, policy makers and evenexperts in unrelated disciplines such as engineering in aneasily and commonly perceptible manner. Such monitoryvalues also help in conducting cost-benefit analysis ofwetlands with a semblance of reality, in case of anydiversions of wetlands for other use. In the recent years ofliberalisation, with market forces apparently dominating thepolicy decisions and their executions it is essential that someway valuing the resources and services derived from thenatural ecosystems are developed. The utility values ofcommon properties need to be assessed in terms of commoncurrency and may help in avoid the tragedy of “commons”.However, despite lots of discussion, the market forces areyet to recognise the values of these ecosystemssubstantially.
Monitory valuation of commodities of wetland originis uncomplicated and involves straightforward arithmetic.Such estimates are widely seen, although not commonlyinterpreted from an environmentally benignant andsustainability perspective. The monetisation of theecological services and non-tangible benefits of wetlands,on the other hand is intricate, and many a time indirect.Concepts such as surrogate prices, contingent valuation,travel cost method, willingness to pay and such others comeinto use in this context. However, this has been furthercomplicated by the difficulty of comparing by some commondenominator the various values of wetlands against humaneconomic systems, by the conflict between a private owner’sinterest and the values that accrue to the public at large,and by the need to consider the value of a wetland as a partof an integrated landscape. No universally acceptable andobjective technique has been developed for use in economicevaluation of wetland ecosystems. Hence, the ecologicalservices, especially those that are indirect and intangible,of the wetland remain more or less confined to theresearchers’ domain.
Reversing the trend of fast depleting wetlands incountry will need more commitment, intensive measures,and time and specifically spread of the message of value ofecological services wider among the planners, media,administrators and the public at large that would be thedrivers deciding the trend of the markets.

5
International Conference on Ecosystem Services of Wetlands - ‘Ardrabhumi :2016’ISBN : 978-81-923628-3-0
Legal Protection to Coastal Wetlands
Debi Goenka Executive Trustee, Conservation Action Trust
Wetlands are highly productive ecosystems; they area diverse ecosystem providing livelihoods, catering harborsfor fish diversity, corals, algal diversity, avifauna, reptiles,small animals and many more. The wetlands are the sourcesfor world’s two-thirds fish harvest. They retain water duringdry periods, maintaining the water table stable.
Mangroves form one of the diverse ecotone. Theyreduce the salinity of water and protect land from salinityingress. They act as barrier and protect an area from floods,cyclones and storms. They hold the breeding and nestingsites for vivid marine organisms. Also, they help to sequestercarbon from atmosphere. The total area of mangrove coverin India is estimated as 4,827 km2. Maharashtra has amangrove cover of 186 sq. km (State of Forest Report, 2011).20 species of mangroves are present in Maharashtra and 12in Mumbai itself. Mangroves align on the stretches of VasaiCreek, Thane Creek, Manori and Malad, Mahim - Bandra,Versova, Sewri, Mumbra– Diva, Mira – Bhayandar, Dahisar,Airoli, and Navi Mumbai.
The mangroves have been afforded protection underCategory I of the CRZ (Coastal Zone Regulation 1991). Theyare also entitled protection under the Maharashtra PrivateForest Act 1975, the Wildlife Protection Act 1972 and theMaharashtra Felling of Trees (Regulation) Act 1964.
Coastal Regulation Zone Notification
India, is the few countries in the world which hasenacted a CRZ notification to legally protect delicate coastalecosystems, and to demarcate areas for conservation.
Ministry of Environment and Forests (MoEF) enactedthe CRZ notification under the Environment Protection Actof 1986 on 19th February 1991. The main purpose for thenotification was to control, minimize and protectenvironmental damage to sensitive coastal stretches fromunplanned human interference. The Government of Indiadeclared coastal stretches which are influenced by tidalaction up to 500 m from the High Tide Line (HTL) and theland between Low Tide Line (LTL) and HTL, as CRZ. Thenotification imposed restrictions, listed various prohibitedactivities, regulation of permissible activities, proceduresfor monitoring and enforcement, coastal area classificationand development regulations, norms for regulation ofactivities and detailed guidelines for the development ofresorts and hotels.
The CRZ 1991 has now been replaced by the CRZ2011. In the notification, the CRZ is divided into four maincategories.
CRZ I includes
(i) areas that are ecologically sensitive and important, suchas national parks/marine parks, sanctuaries, reserveforests, wildlife habitats, mangroves, corals/coral reefs,areas close to breeding and spawning grounds of fishand other marine life, areas of outstanding naturalbeauty/historical/heritage areas, areas rich in geneticdiversity, and
(ii) area between Low Tide Line and High Tide Line.
CRZ II comprises sectors that have already beendeveloped up to or close to the shoreline; these are‘developed areas’ referred to as those within municipal limitsor in designated urban sectors which are already‘substantially built up’ and which have been provided withdrainage, approach roads and other infrastructure such aswater supply and sewerage mains.
CRZ III refers to areas that are relatively undisturbedand which include coastal zones in rural areas (developedand undeveloped) and also urban areas that are notsubstantially built up.
CRZ IV extends to 12 nautical miles into the sea.
Mangroves areas are constantly under threat frompoliticians, land mafias, builders, and industrialists. One ofthe biggest threats now is from government agencies whocannot build their airports, roads, transmission lines,pipelines, rail lines, etc. without destroying mangroves.
Mangrove Protection
Bombay Environmental Action Group (BEAG) andDebi Goenka filed a Public Interest Litigation in 2004 in theBombay High Court seeking the Court’s intervention to stopthe destruction of Mangroves.
An order was passed by the Hon’ble High Court on6th October 2005 in PIL 87 of 2006 that states:
(i) There shall be a total freeze on the destruction andcutting of mangroves.
(ii) All construction and rubble/garbage dumping on themangrove areas shall be stopped forthwith.

6
International Conference on Ecosystem Services of Wetlands - ‘Ardrabhumi :2016’ISBN : 978-81-923628-3-0
(iii) Regardless of ownership of the land, all constructiontaking place within 50 meters on all sides of allmangroves shall be forthwith stopped.
Mangrove Cell
Formation of Mangrove Cell by the Government ofMaharashtra on January 05, 2012 was an important steppingstone to protect, conserve and manage the mangroves ofthe State. The Cell is headed by a Chief Conservator ofForests.Unfortunately, since the mangrove cell is nowdealing with a whole range of activities that has got nothingto do with the protection of mangroves, the mangroves stillcontinue to be destroyed.The mandate of the mangrove cellis to protect, conserve and manage the mangroves in theState of Maharashtra. However, despite this, there arenumerous incidences of destruction of mangroves, dumpingand reclamation on mangroves. There are complaintsregarding destruction which have been piling up withoutimmediate action being taken in most of the cases. Most ofthe complaints are left unanswered or addressed too late,when the destruction of mangroves is through with nomangroves on site.
Salt Pans
Recently, the Maharashtra Government againannounced that salt pans present in an around Mumbaiwould be opened for developmental purposes. Whilst theostensible reason is to provide housing for the poor, thereis little doubt that this decision has been taken to oblige thebuilders. The Mumbai floods of 2005 and the Chennai floodsof 2015 have already been forgotten.
Exemptions from Court Order of 6th October 2005
There are numerous applications being filed in theBombay High Court seeking exemption from the order dated6th October 2005 which expressly prohibits destruction andcutting of mangroves, dumping of rubble/garbage andprohibits construction with 50 meters of mangroves. Mostof these applications in the High Court are from theGovernment agencies themselves, asking for exemption fromthe 6th October 2005 order. Ironically, agencies that shouldbe protecting mangroves are themselves actively seekingpermission to destroy the mangroves. It is also astonishingthat a few Judges think that development means constructionof buildings, highways and airports and allow suchapplications, thus diluting the earlier High Court order.
Conclusion
It is sad state of affairs that despite the numerousbenefits mangroves provide us with and their role inprotecting the human life, mangroves are being not accordedthe deserved protection. With the threats of increase infrequency and intensity of extreme climatic events facingus, it is important that we step in now to ensure that theremaining mangroves are accorded due protection andconservation. Ill-conceived projects such as the coastalroads and the Navi Mumbai airport should be stopped. It isnow up to all of you to seriously take up these issues if youwant to ensure your own survival in the future.

7
International Conference on Ecosystem Services of Wetlands - ‘Ardrabhumi :2016’ISBN : 978-81-923628-3-0
Ecosystem Services of Coastal Wetlands – Case Study of Gulf of Kachchh
Geetanjali DeshmukheICAR- Central Institute of Fisheries Education
Mumbai
Wetlands are amongst the most productiveecosystems on the Earth and provide many importantservices to human society. At the same time, they are alsoecologically sensitive and adaptive systems. Coastalwetlands have diversified ecosystems catering to the needsof millions of people from fisher to industries. Wetlands,particularly coastal wetlands are highly diversifiedecosystem. These areas include brackish water lakes,lagoons, estuaries, intertidal zone, mangrove and coral reefecosystems. Wetlands exhibit enormous diversity accordingto their genesis, geographical location, water regime andchemistry, dominant species, and soil and sedimentcharacteristics (Space Application Centre 2011).
West coast of India is characteristically different havingtwo gulfs namely Gulf of Kachchh and Gulf of Khambhat.Gulf of Kachchh, is very sensitive ecosystem thatencompasses mangrove, coral, marine algae, sea grass, saltpan and marshes. In this paper, a brief introduction to theGulf of Kachchh ecosystem is given.
Different ecosystems such as:
1. Estuaries:
Estuaries are interface between fresh water and marinewater and thus are unique in their physical andbiological processes. The coastal wetland ecosystemin this region is very productive as one of the mostfragile mangrove ecosystem is situated in the coastalzone.
Estuaries provide conducive habitats for a large numberof organisms and support very high productivity.Estuaries provide habitats for many fish nurseries,depending upon their locations in the world. Salinity,and temperature variations are the two of the mainchallenges of estuarine and coastal living resources.Many species of fish and invertebrates have variousmethods to control or conform to the shifts in saltconcentrations. It is believed that at least 1/3 of thefaunal community is from mangrove waters. Thelanding of penaeid shrimps production increases withthe size of the mangrove vegetation.
2. Mangroves:
Ecologically, mangrove communities have a variety ofrecognized roles in the areas where they occur. Aprominent role is the production of leaf litter and detrital
matter which is exported to lagoons and the near shorecoastal environment. The organic matter exported fromthe mangrove habitat is utilized in one form or anotherby the inhabitants of estuaries/lagoons, near-coastwaters, seagrass meadows and coral reefs which mayoccur in the area. Most tropical commercial shrimpsand many fish species are supported by this foodsource.
Mangrove ecosystems also provide a valuable physicalhabitat for a variety of important coastal species.Waterfowl and shorebirds are well known and highlyvalued inhabitants of wetlands, as are alligators andmuskrats. Less evident, but equally importantinhabitants are crabs, shrimp and the important juvenilestages of commercial and sport fishes, along withnumerous forage species of fish and invertebrates(Clark et al., 1980).
Shoreline mangroves are recognized as a buffer againststorm-tide surges that would otherwise have a moredamaging effect on low-lying land areas. Littoral stripmangroves planted by the Bangladesh Government inthe 1980s are credited with saving thousands of livesand millions of dollars worth of property during thecyclone of 29 April 1991 that ravaged the southeastcoast of the country. Also, mangroves are often notedfor their ability to stabilize coastal shorelines that wouldotherwise be subject to erosion and loss. Conversely,if left in place they can pre-empt development sitesthat are at too low an elevation and are hazardous real-estate sites.
The value of the mangrove resource in terms of itsmarketed products can be expressed in economic terms.The “free” services provided by the mangroves aremore difficult to measure and consequently are oftenignored. These “free” services would cost considerableenergy, technology and money to be provided fromother sources. Since this is seldom taken into account,the total value of the mangrove resource is usuallyquite significantly underestimated (Hamilton andSnedaker, 1984).
In general, the mangrove ecosystem is fairly resistantto many kinds of environmental perturbations andstresses. However, mangroves are sensitive toexcessive siltation or sedimentation, stagnation,surface-water impoundment, and major oil spills. These

8
International Conference on Ecosystem Services of Wetlands - ‘Ardrabhumi :2016’ISBN : 978-81-923628-3-0
actions reduce the uptake of oxygen for respirationwhich results in rapid mangrove mortality. Salinitieshigh enough to kill mangroves (+90 ppt) result fromreductions in the freshwater inflow and alterations influshing patterns from dams, dredging, andbulkheading. Lowered salinities from seawalls andcoastal structures and restriction of tidal flow also killmangroves. On the other hand, mangrove forests helpmaintain coastal water quality by extracting chemicalpollutants from the water.
3. Seagrasses
Submerged seagrasses are often abundant in theshallow waters, temperate and tropical coastalenvironments of the world. Seagrass beds or meadowsare highly productive and valuable resources whichenrich the sea and provide shelter and food for someof the most important and valued species of fish andshellfish. High productivity of seagrass habitats isassociated with both seagrass growth and theproduction of “epiphytes” attached to the leaf surfaces.
Seagrasses intermingle with both mangrove and reefcommunities at their respective seaward and landwardboundaries. Submarine meadows of seagrassfrequently provide the link between mangrove and coralreef ecotypes. The migration of animals at various lifestages from one ecosystem to another for feeding andshelter, coupled with currents that transport bothorganic and inorganic material from runoff and tidalflushing, ties the offshore coral reefs to nearshoreseagrass beds and the seagrass beds to mangroveestuaries (Berwick and Chamberlain, 1985).
4. Coral Reef System
Coral reefs occur along shallow, tropical coastlineswhere the marine waters are clean, clear and warm. Theyare one of the most productive ecosystems in the world.The basis for the high productivity of the coral reefecosystem is a combination of the production of thereef with support from its surrounding environment.
Coral reefs have important economic outputs. Forexample, they contribute to fisheries of three types:fishing directly on the reef; fishing in shallow coastalwaters where coral reefs support food webs, life cyclesand productivity; and fishing in offshore waters wherethe reef’s great productivity may contribute to supportof “high seas” fishes. Approximately one third of theworld’s fish species are said to live on coral reefs (WRI,1986). Coral reefs support booming tourist industriesin many countries. Catering for snorklers, divers,underwater photographers, sightseers, and fishermen,reef tourism produces thousands of millions of dollars
of foreign exchange earnings annually. Coral reefs alsoserve as natural protective barriers, deterring beacherosion, retarding storm waves, allowing mangrovesto prosper and providing safe landing sites for boats.
Unfortunately, there are numerous destructive forcesat work and important coral resources are beingdegraded at a rapid rate. Some of these forces can beeasily controlled through ICZM programmes, but otherspresent serious socio-economic and political problemsfor many countries. For example, Sri Lanka is facedwith finding alternative jobs for thousands of coralminers.In many countries, reefs are heavily exploitedfor corals which are harvested for sale as souvenirs ordecorations. The market for coral is often quite lucrativeand usually export-oriented.
Other damaging activities include the following: 1)siltation and sedimentation created by dredging, filling,and related construction activities and increased soilerosion; 2) pollutants, including spilled oil, industrialwastewater, and domestic sewage; 3) discharge of largevolumes of fresh water as may result from diversionsand storm-water outfalls; 4) destructive fishingpractices, including dynamite; 5) collection of youngfishes for sale in the aquarium trade; and 6) touristvisits to reefs which result in breakage from boatanchors and from hand and foot damage.
In addition, there are damages from natural causes suchas: 1) outbreaks of reef destroying animals such ascrown-of-thorns starfish; 2) diseases like whiteband(which kills elkhorn coral) and blackband (which killslarge structural corals); 3) hurricanes that smash thecoral and “sandblast” away the living tissue; 4) coraldisablement and death from “bleaching” episodes; and5) die-off or depletion of essential symbionts, such asparrot fish and sea urchins that clean the reef of algae.
Coral reef degradation has serious consequences fortourism, fishing, beach stability and particularly forcoastal/marine parks. For example, most of the 21countries and 49 parks (or reserves) in the Caribbeanwith coral resources have problems (ICLARM, 1986).When serious, coral reef degradation can ruin a parkand cut severely into tourism. Some reefs are virtuallybeyond repair (those closest to settlements) but manythat are degraded could still be returned to good or faircondition.
5. Tidal Mud Flats
Extensive areas of tide flat (mudflats, sand flats, etc.)are often found in estuaries and lagoons. Such flatsare important in processing nutrients for the ecosystemand providing feeding areas for fish at high tide or

9
International Conference on Ecosystem Services of Wetlands - ‘Ardrabhumi :2016’ISBN : 978-81-923628-3-0
birds at low tide. Mud flats are often important energystorage elements of the estuarine lagoon ecosystem.The mud flat serves to catch the departing nutrientsand hold them until the returning tide can sweep themback into the wetlands. In many estuaries and lagoons,tide flats also produce a high yield of shellfish.
At the higher latitudes there are extensive beds of kelpin certain areas, such as southern California andsouthwest South Africa. Kelp is a brown alga that rootson the bottom of the sea and extends, via a long stalk,to the surface where its fronds spread over the surfaceof the sea. Kelp often grows in thick stands, creating asubmerged forest that provides an important multiple-species habitat from surface to bottom for sea ottersand many other valuable species. These kelp standsare vulnerable to over-harvesting (for alginic acid),species imbalance (too many kelp-eating sea urchins),and pollution.
Gulf of Kachchh
The Gulf is an east – west oriented indentation northof Saurashtra Peninsula. It is about 170 km long and 75 kmwide at the mouth, narrowing down abruptly with a distinctconstriction at 70°20’E at Satsaida Bet and dividing into acreek system often called the Little Gulf of Kachchh. TheGulf has an area of 7300 km2 and a volume of 220,000 Mm3.Depth varies from 20 m at the head (Kandla-Navlakhi) to 60m in the outer region. The average depth is 30m, the minimum3 m above chart datum in the inner creeks. The actual fairwayhowever is obstructed due to the presence of several shoals,needing periodic dredging in some areas, to facilitatenavigation to the ports. Studies indicate that the Gulf regionis rising at the rate of 1.3 cm per year as a result of Holocenetransgression of the seas. The residence/ turnover time ofthe Gulf ranges from 8-51 days, decreasing upstream.
The coastal configuration is very irregular withnumerous Islands, creeks and bays. Besides, there are anumber of eroded shallow banks like Pirotan, Dide, Dhani,Bet Shankodar, Paga, Adatra and Boria reefs, many of whichharbour living corals. The intertidal region is sandy andmuddy or rocky. The raised coral reefs near Okha - Mithapurand clays and foraminiferans limestone of Oligocens -Pliocene period near Dwarka give a clear indication of arelative change in the sea level in the past. The Gulf and thesurrounding region is active seismically with a number ofrecorded earthquakes.
Types of ecosystems
The Gulf abounds in marine wealth and is consideredas one of the biologically richest marine habitat along thewest coast of India. It is endowed with a great diversity ofnatural ecosystems, of which the major systems are salt pans,
intertidal zones, marine algae (seaweeds), sea grass and sanddunes, mangroves, coral reefs, creeks and open ocean.
Saltpans
Saltpans are unique tide water impounded enclosedsystem adjacent to creek environment. They arecharacteristically exposed to a wide range of environmentalstress and perturbation which manifest mainly throughsalinity changes. The distinct feature of the brine ecosystemis its biotic simplicity and stability. However, saltpans areimmature ecosystem as compared with a typical marinesystem and harbour a high proportion of opportunistic andfugitive species. The ecosystem is simplified, as the numberof species in each trophic level is low. Species diversity isdirectly linked with salinity. Hence the higher the salinity,the lower the species diversity and simpler the structure ofthe ecosystem. Energy influx to the saltpan ecosystem isusually large and algal production may therefore, be high,but food c hain nevertheless is usually simple and oftenrestricted to a few producers and low number of consumers.
In the Gulf there are about 21 salt work units. Thesesaltpans serve as feeding grounds for a variety of residentas well as migrant birds. – Dominant alagal species isDunaliella and artemia – a zooplankton species.
Intertidal zone
The intertidal area is the transitional region betweenland and sea. In general, it is covered and exposed by thetidal waters each day. The intertidal zone can be either rockyor particulate shore. Rocky shores are solid substrates andparticulate shores consist of sediment particles ranging insize from clay through cobbles. Particulate shores may beeither well or poorly sorted. The rocky shore provides a firmsubstratum while the others are unstable. The rocky intertidalarea consists mostly of epibenthic organisms attached tothe rock surface. The communities of the intertidal faunacan be divided into epifauna, which live at the surface of therocks, shore and sediment and infauna consisting of allanimals that burrow and live in the sediment. The intertidalexpanse of the Gulf increases towards upstream. The increaseis from 0.5 to 2 km from Jakhau to Kandla and from around 1km at Okha to over 10 km at Navlakhi. The intertidal habitatof Gulf covers a wide range of ecosystems; sandy beaches,mud and sand flats, rocky foreshore and rock pools, seagrass beds, salt marshes and mangroves. The continuouswave action and associated littoral sediment transport makeintertidal stretch a unique environment for biogenic activitiesof organisms. The physico-chemical, geomorphological andbiological features play an important role in determining thedistribution and abundance of benthic fauna of the intertidalhabitats. Gulf sustains a rich and highly biodiversifiedintertidal flora and fauna.

10
International Conference on Ecosystem Services of Wetlands - ‘Ardrabhumi :2016’ISBN : 978-81-923628-3-0
Mangroves
Mangroves are salt tolerant plants found mainly intropical and subtropical intertidal regions. Where conditionsare sheltered and suitable, mangroves form extensive andproductive forests.
(i) mangroves (ii) salt marshes (iii) sand strands and(iv) inland shrubs.
The area covered by mangroves along the Gujaratcoast is the second largest in India, next only to theSundarbans area. Majority of the area covered by mangrovesof Gujarat is confined to the Gulf. Of the 991 km2 for thestate, Gulf with 954 km2 covered with mangrove forms 96%of the total. Due to high salinity, grazing and cutting pressurethe Kachchh mangroves have stunted growth and are only1-2 m tall. However, trees in some untouched patches gaina height upto 5 m. The best-conserved mangroves of Gujaratare those which lie along the Kori creek. This is becausethey are located in sparsely populated area near theinternational border with Pakistan and have a relativelydifficult accessibility.
The coastal wetland of the Kachchh district withnumerous creeks and channels associated with shoals andvast tidal flats have one of the richest mangroves along thewest coast of India. Hence, a portion of the mangroves ofthe Kachchh region is classified under the “West MangroveReserve Forest”. The area covered by mangroves (km2) atKachchh area is estimated based on satellite data to beabout 938 km2 in 1998 which has considerably increasedfrom 1992 to 1998 as per the details given below for theGujarat State.
Marine algae (sea weeds), sea grasses and sand dunes
The Gulf contributes to the maximum species andbiomass of seaweeds for the westcoast of India. Thesouthern coast of Gulf supports luxuriant growth of marinealgae because shoreline has gradual slope with high tidalamplitude, moderate wave action and low turbidity. Thenorthern shore of the Gulf has very poor algal biodiversity,as the sandy/ muddy substratum associated with relativelyhigh turbidity does not support algal growth. Sea grassspecies exist in the subtropical regions of a few Islands.Ridges of loose sand drifted by the wind often supportvegetation known as sand dunes. The dominant species ofsand flora are Euphorbia caudicifolia, E. nerifolia,Aloeverasp., Ephedra foliataand Urochodrasetulosa.
Corals and coral reefs
The coral reef ecosystems are unique in theirdiversity, intricate inter-relationships and spectacular inbeauty. The term coral refers to coelenterates secreting amassive calcareous skeleton, particularly of the Order
Scleractinia (Class Anthozoa). The scleractinian corals fallunder two groups namely ahermatypic or non-reef buildingand the hermatypic or reef building corals. The former arewidely distributed at all latitudes down to several thousandmeters depth, and the hermatypic corals are limited to warmsaline waters where temperature never falls below 20°C andsalinity is not lower than 30 ppt. The depth distribution ofreef building, corals is restricted to the illuminated layers ofthe sea, a condition clearly associated with the endo-symbiotic zooxanthellae of the coral polyps which requirelight for photosynthesis.
Coral reefs are shallow water, tropical marineecosystems known for high biological productivity. The reefbiodiversity is enormous. It houses various species ofbenthic algae, seaweed, sea grasses, other coelenterates,annelids, lobsters, sponges, echinoderms, finfishes, crabs,bivalves, gastropods and cephalopods maintaining uniquesymbiosis among all these life forms. The high rate ofproductivity at the coral reefs is due to the efficient retentionand recycling of nutrients within the reef system. Reefs aresites of rich living and non living resources. The fish yieldfrom coral reefs is comparable to most other productivemarine ecosystems. The Gulf is the only area in Gujaratwhere corals exist with high diversity and density. The coralformations of the Gulf are found exclusively between 22° 20’N and 22° 40’N latitudes and 69° and 70°E longitudes alongthe coast of Jamnagar district. The age of these corals asdated from the raised beaches, vary from 5240 years at Salayato 45,000 + 105 years before present at Okha. Based on theexisting classifications these reefs are classified into fringingreefs (north of Okha, north of Bet Shankodar fringing themainland from Dhani Bet to Sikka, Jindra and Chad, Pirotan,near Valsura), plat form reefs (Paga reefs, BuralChank,Karumbhar, Munde reef etc.), patch reefs (Goose and Ajad)and several coral pinnacles (eg. Chandri, etc). The mostnortherly reefs are coral patches found at Munde reef andPirotan Island, but solitary corals are found as far as Jakhauin the east and Dwarka on the Saurashtra coast. Recentlylive corals with associated flora and fauna have beenobserved off Mundra for the first time.
Creek system
Creeks are special habitats, the speciality being themixing of fresh water and salt water and periodic stirring upby tides. The hydrographic conditions are peculiar and theseinfluence the flora and fauna of such environments. Often amarked gradient of decreasing salinity is evident from themouth (sea) towards the head (upper reaches) especiallyduring monsoon. Depending on the salinity regime typicalestuarine and oceanic communities prevail in the creeksystem. In some regions evaporation and lack of fresh waterflow extend the brackish range upward into hyper salineconditions. This state is invariably experienced by the Gulf

11
International Conference on Ecosystem Services of Wetlands - ‘Ardrabhumi :2016’ISBN : 978-81-923628-3-0
creek system especially during non-monsoon periods. Insuch situations, exceptionally hardy forms with specialadaptations alone are likely to survive.
There is a network of creeks and alluvial marshy tidalflats in the interior part of theGulf. The creek system consistsof three main creeks namely Nakti, Kandla and Hansthal,and the little Gulf of Kachchh is inter connected throughmany other big and small creeks. The three desert rivers,Banas, Rupen and Saraswati, carry annually 140 Mm 3 waterto the Little Rann of Kachchh that gets flooded during thesouthwest monsoon period establishing short termconnection with the creeks at the head of the Gulf.
The creek receives negligible freshwater inflow duringthe dry season. Hence, the evaporation rate exceedsprecipitation leading to salinities higher than that of typicalseawater (35- 36 ppt). The higher salinities may also resultdue to the drainage of brine from saltpans and higherevaporation rates in the adjoining creeks. Thus salinitiesupto 50 ppt have been recorded in the Little Gulf of Kachchh.These higher salinities lead to lateral gradient in the Gulfwith salinity decreasing from 40 ppt in the Kandla-Navlakhisegment to 37 ppt at Salaya. The fresh water run off duringmonsoon considerably dilutes the seawater in creeks suchas Chach, feeding the Little Gulf of Kachchh and salinitiesof < 10 ppt may occur. The Phang, Kandla and Nakti creekshowever retain high salinities (> 35 ppt) even duringmonsoon.
Open ocean
The open sea has very specific characters. Mostevident are its uniformity and stability in environmentalconditions, its three – dimensional space and its vastness.In the pelagic realm there are no boundaries or barriers todistribution of organisms and all environmental changesare gradient. This part of the sea harbours two types ofcommunities namely the nekton or good swimmers and theplankton, with feeble powers of movement. The bottomfauna or benthos is constituted by epifauna and infauna.Typical sea fauna, in general, exhibits a rather high diversityand this is clearly seen in the zonation of organisms.
Marine Sanctuary and Marine National Park
The southern Gulf between Okha to Navlakhi ofJamnagar district is declared as Marine National Park andSanctuary (MNP & S) to protect and conserve the fragileecosystem particularly the live intertidal and subtidal coralreefs and mangrove habitats of the Gulf. Major part of theMNP & S consists mainly of intertidal zones and intricatenetwork of Islands with coral reefs and mangrove forests.Intertidal zones of Dwarka, Kalyanpur, Khambhalia, Lalpur,Jamnagar and JodiaTalukas along with 42 Islands in thedistrict have been included in the marine protected area. Asper the State Government notification in 1980 & 1982 anarea of 457.92 km2 of MNP&S includes 148.92 km2 of 42small and big Islands and 309 km2 of intertidal zone alongthe coast. Area of the MNP is 162.89 km2 whereas theremaining protected areas have the status of MarineSanctuary. The MNP&S as per the notification of 1983includes three categories of areas namely 11.82 km2 ReserveForests, 347.90 km2 unclassified forests and 98.20 km2
territorial waters of India. 162.89 km2 area of the MNP isdistributed amongst 37 Islands and coasts whereas theremaining 295.03 km2 area of the sanctuary covers 5 Islandsand intertidal zone from Navlakhi to Okha. However, as persatellite-based wetland map of SAC the total area of 42Islands during low tides is 410.6 km2. The area of the Islandsvaries from 27 ha of LafaMarudi and Man Marudi to 5972 haof the Kalubhar (Karumbhar) Island. Only 148.9 km2 area ofthe Islands have been notified as MNP & S because accuratemaps and extent of area of the Islands were not available atthe time of declaration of the sanctuary. Hence, major partsof the Islands (261.7 km2) covering healthy coral reefs areout of the legal boundary of the MNP&S, but for practicalpurpose, they are considered as part of managementboundary.
‘The Gulf of Kachchh MNP & S is the first of its kindto be established along the Indian coast. The notification isbased on a few theoretical surmises, reasoning and someanticipated threat perceptions supported by scanty data.The reasonings behind the demarcation of the area isnowhere to be found on record. Also there is huge overlapof areas (87%) of MNP&S and GMB for port developments.However the basic necessity is the biogeographicalimportance of the Gulf and its rich marine wealth.

12
International Conference on Ecosystem Services of Wetlands - ‘Ardrabhumi :2016’ISBN : 978-81-923628-3-0
Ecosystem services of wetlands
W. A. H. P. GurugeUniversity of Ruhuna Matara
Sri Lanka
It is my pleasure and privilege to send this brief messageon the occasion of holding this international conference.The conference is organized at a crucial time when it isimperative for all Indian professionals, researchers andpolicy maker to put together their collective thoughts andeffort to conserve wetlands.
The Ramsar Convention defines wetland as “Wetlandsare areas of marsh, fen, peat land or water whether natural ortemporary, with water that static, flowing, fresh, brackish orsilt, including areas of marine water, the depth of which atlow tides does not exceed six meter” (Ramsar COP7, 1999).According to another definition it is a transition zonebetween upland and permanently flooded ecosystems.Wetlands are dynamic ecosystems, hence they changeseasonally with changes in annual precipitation. Wetlandswith stagnant water levels tend to become more pond-likeand lose some of their ecological value.
Three diagnostic environment characters i.e.vegetation, soil and hydrology are used to determine if anarea is a wetland or not. More specifically hydrophyticvegetation which is capable of growing, competing andreproducing in saturated soils which produce/maintainanaerobic conditions. Considering the soil in wetland morespecifically hydric soils which are defined as soils that aresaturated, flooded, long enough during the growing seasonto develop anaerobic condition that favor the growth andregeneration of hydrophytic vegetation. Considering thehydrology, the area is inundated either permanently orperiodically at mean water depth 2 m or the soil is saturatedto the surface at some time during the growing season ofthe prevalent vegetation.
Basically, wetlands are classified in to two types, i.e.Inland wetlands and coastal wetlands. Inland wetlandsinclude, freshwater marsh, peat land, freshwater swamp,riparian wetland and vernal / temporary pool, while coastalwetlands include tidal salt marsh, tidal freshwater marshand mangrove wetland.
Historically, wetlands were considered as“wastelands,” suitable only for mosquitoes and draining.Until recently, wetland habitats were being destroyed at therate of a half million acres per year. In recent times, wetlandshave become recognized as important not only to wildlife,but also to humans. Wetlands are particularly productiveecosystems that can provide many benefits. These benefitsare categorized into uses, functions and Attributes. Uses
are benefits that are gained by people through direct usesof wetlands such as sources of natural products, watersupply and transportation, energy productions, researchand education, recreation and tourisms. Functions include,water flow regulation, prevention of saline water intrusion,protection against natural processes and calamities,Sediment removal and retention, Removal and retention ofnutrients and toxic compounds, significance forconservation, Contribution to maintenance of processes innatural systems. Attributes of wetlands are biodiversity,uniqueness and gene pool, socio-cultural significance,landscape beauty.
As defined by the Millennium Assessment, ecosystemservices are “the benefits people obtain from ecosystems”.These include provisioning services such as food and water,fiber & fuel, biochemical, genetic materials. Regulatingservices are climate regulation, water regulation, waterpurification & waste treatment, erosion regulation, naturalhazard regulation, pollination. Supporting services includesoil formation and nutrient cycling. Cultural services arerecreational, spiritual, aesthetic and education.
The key supply of renewable fresh water for humanuse comes from wetland ecosystem, i.e. inland wetlands:lakes, rivers, swamps, and shallow groundwater aquifers.Apart from that groundwater, often recharged throughwetlands, plays an important role in water supply. One ofthe most vital role of wetlands is the regulation of globalclimate change through the process of carbon sequesteringand releasing a major proportion of fixed carbon in thebiosphere. For example, although peat lands covering onlyan estimated 3–4% of the world’s land area, it is estimatedthat it hold 540 gigatons of carbon, representing about 1.5%of the total estimated global carbon storage and about 25–30% of that contained in terrestrial vegetation and soils(Millennium Ecosystem Assessment, 2005).
Wetlands are among the most important andproductive ecosystems on earth. Measures of productivityrival those of tropical rainforests and coral reefs. The highnet productivity of wetlands is the result of rapid recyclingof nutrients that occurs with changing water levels and thebreakdown of organic material catalyzed by wet conditions.Dead plant material, rapidly broken down in water bymicroorganisms, which in turn is fed upon by aquaticinvertebrates, is the basis for food webs that support theabundance and diversity of wetland-associated wildlife.Although their importance as wildlife habitat has been

13
International Conference on Ecosystem Services of Wetlands - ‘Ardrabhumi :2016’ISBN : 978-81-923628-3-0
known since the early 1900s, other functions, such astrapping sediment and pollutants, retaining rainwater, makingrivers less prone to flooding and providing protection tocoastal areas from storms, have only recently becomeknown.
Wetlands provide significant aesthetic, educational,cultural, and spiritual benefits, as well as a vast range ofopportunities for recreation and tourism. In developingcountries recreational and ‘eco’ tourism opportunitiesassociated with wetlands are receiving increasing attentionas a low-impact, non-consumptive development option andan opportunity to attract financial investment and to generatesignificant income (Gössling, 2000).
Wetlands are facing threats due to indirect and directdrivers. The primary indirect drivers of degradation and lossof rivers, lakes, freshwater marshes, and other inlandwetlands are population growth and increasing economicdevelopment. The primary direct drivers of degradation andloss include infrastructure development, land conversion,water withdrawal, pollution, overharvesting andoverexploitation, and the introduction of invasive alienspecies. Clearing and drainage, for agricultural expansion,and increased withdrawal of fresh water are the main reasons
for the loss and degradation of inland wetlands such asswamps marshes, rivers, and associated floodplain waterbodies. Agricultural systems and practices have exerted awide range of mostly adverse impacts on inland and coastalwetlands globally.
Several strategies and measures are adapting toconserve the wetlands. Most effective management practiceto protect wetlands from adjacent human activities is toestablish and maintain a vegetative buffer or greenbeltaround the wetland. The vegetation in the greenbelt uptakesexcess nutrients and pollutants in overland flow and therebyprotects the wetland. Fencing is one of the simplest ways toprotect a wetland. Runoff is an important component of awetland’s hydrologic budget. Minimize Storm water runoffis another effective measure. Through minimizing fertilizersand pesticides inputs, to wetlands it improve quality of thewetlands. Limiting or banning of recreational use ofwetlands, controlling shoreline erosion, and control ofintroduction of exotic Species are also very important inconserving the wetlands.
Dear principal, organizers of the conference, I thankyou very much for allowing me to present this keynotespeech. I wish this international conference a great success.

14
International Conference on Ecosystem Services of Wetlands - ‘Ardrabhumi :2016’ISBN : 978-81-923628-3-0
Role of Industries in Mangroves Conservation: Godrej Case Study
Laxmikant DeshpandeManager: Wetland Management and Sustainability, Mangrove Section, 2nd Floor, Udayachal Primary School,
Pirojshanagar Stationside Colony, Vikhroli (E), Mumbai 400 079 Ph: 022 6796 1097 / 9167344890Email: [email protected]
Godrej’s Pirojshanagar Township, inhabited and usedby 50,000 employees, residents and visitors, spreadacrossVikhroli in Mumbai is a role model of integratedsustainable habitat with more than 1750 acres mangroveforest thriving along with industrial plants, commercialoffices, schools, hospital and residential colonies. Godrejmangrove boasts of 16+ mangrove and mangrove associatespecies, 82 butterfly species, 208 bird species, 13 crabspecies, 7 prawn species and 20 fish species and severalother terrestrial and coastal species. According to a recentresearch the mangroves have a standing carbon stock ofaround 5,96,000 tons with an yearly incrementalsequestration of 60,000 tons apart from providing otherecosystem services like climate regulation, water storage,breeding nursery for fish, crabs and prawns offeringlivelihood for the local fisher folk.
Of the 1750 acres of mangrove forest, ownership ofalmost 80% lies with Soonabai Pirojsha Godrej Foundation,a Charitable Trust, automatically lending it protection frominterference and destruction. The remaining forest lies withGodrej & Boyce and is well protected with the industry’senvironmental policy, team of dedicated of conservationistsand public commitment of mangrove conservation onvarious platforms.
The mangroves visited by 6000+ stakeholders everyyear is scientifically managed with a three-pronged approachof Research, Conservation and Awareness. Since last 10years, Godrej has facilitated 24 mangrove biodiversityresearch projects undertaken by School students, graduate,post-graduate and Ph. D. students. These projects haveoffered valuable insights to functioning of mangroveecosystem. The company has achieved ‘water positive’status by reducing specific fresh water consumption by34%, achieving reuse of recycled water upto35% over oftotal water footprint and harvesting more than 45% ofrainwater since the Strategic initiative of Good & Green hasbeen adopted in 2010. With a strong waste collection,segregation, composting and recycling system,100% ofgarbage is diverted from landfill and more than 99% industrialwaste is recycled. Around 1000 tons of compost made everyyear is used for landscaping and plantations. These twodecisions of not dumping waste water and solid waste toThane creek has offered a fresh lease of life to mangroves.Every Godrej employee visits mangrove forest undercorporate induction program to understand and appreciate
mangroves. Capacity building of every internal (employees,residents and school students) and external (vendors,suppliers, customers) stakeholders is given utmostimportance and 2013-14 saw an increase of 19% in learninghours over 2012-13. Besides five environmental events andnature clubs in Godrej’s primary and high schools, everyindustrial plant includes awareness on environmental andsocial sustainability in its training calendar.
The most unique aspect of Godrej Mangroves Projectis inter-linkages of the traditional conservation approaches,modern industrial management systems and personalappraisal systems. The mangrove conservation story startedunfolding in 1940s with the purchase of Vikhroli village byGodrej family. Since then, it has seen remarkable phases ofmanagement approaches from philanthropy to research toon-site conservation to stakeholders awareness tointegration of mangrove project in industrial managementsystem in last 70 years. Today, Godrej is not only thecustodian of mangrove ecosystem but has integratedecosystem conservation in its business model andmanagement of Pirojshanagar campus management throughvarious management tools and systems like ISO 14001:2004certification, Kaizen Improvements System and BusinessExcellence Model. Godrej’s traditional three prongedapproached of Research, Conservation, Awareness formangrove protection is now tightly woven into theseindustrial management systems ensuring sustainability ofmangrove conservation initiatives through rigorousplanning, resource allocation, implementation and resultbased monitoring (RBM).
ISO 14001certification follows continual improvementcycle by installing environment management systems (EMS).Forming an environmental policy is first step whileimplementing Environment Management Plans (EMP) is thecritical step of the cycle. Every year Godrej MangroveDepartment makes its EMPs for research, conservation andawareness, with qualitative and quantitative targets.
Godrej & Boyce has adopted European Foundationfor Quality Management’s Business Excellence Model forbringing in excellence in its business processes. The EFQMExcellence Model offers a holistic view of the organization,highlighting its strengths and opportunities to improve andenabling people to understand the cause and effectrelationships between what their organization does and the

15
International Conference on Ecosystem Services of Wetlands - ‘Ardrabhumi :2016’ISBN : 978-81-923628-3-0
results it achieves. The Godrej Mangroves also follows thismodel to gain the management expertise available with itsbusiness counterpart.
Kaizen is another interesting tool, generally used inengineering industry is used by Godrej for improvingmangrove management. Kaizen is the Japanese practice ofcontinuous improvement. One of the most notable featuresof kaizen is that big results come from many small changesaccumulated over time. By improving standardized activitiesand processes, kaizen aims to eliminate waste. The wastecould be in terms of energy, time, resources, process or ofefficiency because of strains. In last five years, Godrejmangroves has implemented nine Kaizens that focus onimproving infrastructure and systems of Mangrove project.
Mangrove project’s targets clearly reflect inemployees’ performance appraisal through PersonalDevelopment Management (PDM) system.This linking ofproject targets with employees’ personal, professional andfinancial growth has proven a successful managementstrategy. Every employee of Godrej Mangrove Project isassessed through four intermediate reviews and one finalreview every year for his/her performance based on thetargets set in the beginning of financial year. The systemconsiders factors that facilitate and hinder implementationof targets and hindering factors are addressed with themanagement support. Thus, efforts are made to synchronizetargets of project and employees to achieve desired outputs.
In last 70 years, Godrej mangroves has earned fame asone of the most successful examples of co-existence ofindustry, community and environment. ‘People, Planet andProfit’ is the vision for sustainable development of Godrej& Boyce. Future plans of Godrej Mangrove Project includereinstalling marine aquarium for public awareness on coastal
and marine ecosystems, developing thematic gardens in theperiphery, enhancing biodiversity index of mangroveecosystem, creating awareness material for publicdissemination, enhancing wildlife rescue and rehabilitationprocess and improving engagement with externalstakeholders.
Key Learnings:
A review of Godrej experience of mangrovesconservation offers following key learnings that mayprovide roadmap for any industry intending conservationof ecosystem in its campus:
� Define ownership of the ecosystem placing it in safehands
� Create a dedicated and skilled team of professionals
� Follow holistic approach of protection, research, on-site conservation and awareness
� Follow both ‘top to bottom’ and ‘bottom to top’approach to ensure participation of all stakeholders atall levels
� Ensure engaging both internal and externalstakeholders for ecosystem conservation
� Ensure the project’s and employees’ aspirations andtargets are linked to each other
� Link conservation efforts and teams with industrialprocesses and teams as every industrial processdirectly or indirectly impacts ecosystems
� Link the ecosystem’s conservation approach to modernmanagement system to ensure its efficient and effectiveimplementation

16
International Conference on Ecosystem Services of Wetlands - ‘Ardrabhumi :2016’ISBN : 978-81-923628-3-0
Ecosystems of the coastal wetlands
A. G. UntawaleMangrove Society of India
48, Nirmiti, Sagar Society, Donapaula, Goa 403004
Abstract: The coastal wetlands of India consist of various ecosystems like corals, seaweeds, sea grasses, sand dunesvegetation and mangroves. These ecosystems are ecological, economical productive as well as protective in nature and henceneeds conservation technologies for the prevention of coastal erosion from the tsunamis, cyclones, floods, tides andprecipitations.
The scientific understanding of these ecosystems’ is essential for developing proper models to be implemented. Theseecosystems, individually or jointly can be very effective during climate change.
They also need proper management practices for preservation and conservation. The biological components can be sustainablyexploited for economical uses. Preservation of this selected ecosystems and areas rich in biodiversity can be properly plannedand managed for future uses.
1. Introduction :
The natural cycle of Climate Change, coupled with therapid manmade changes, indicate multiple impacts on varioussystems of the earth (Gornitz, 1990). These include increasein the temperature, sea level rise, cyclones, effect on therainfall patterns, flash floods, draught, erosion, loss of forestcover etc (Shukla et al, 2002). Although lot of research hasgone into the subject on various aspects (Rajamanickam,1990), there is still more scientific information needed on theimpact of climate change on the coastal and marineecosystems of India.
Various scenarios have been discussed so far(Annonymous, 1992; Al Gore, 1992; Bird, 1990). As a resultof global warming, expansion of the sea water volume (stericeffect) and due to various resultant effects like melting ofglacial etc would ultimately increase the level of the sea(Bird, 1990). Rate of sea level rise (SLR) has also beendiscussed. According to Raper et. al.,(1988) by 2030 theocean level will increase by 12 to 18 cm, while Hofman (1984)predicted 100 cm increase in sea level in the next 50 to 150years (Fig. 1). Ofcourse it is certain that this increase in sealevel is going to be gradual and not like a ‘Tidal bore’ or‘Tsunami’ waves.
Whatever changes take place, the maximum influenceof this SLR, increase in the temperature, increase in theprecipitation, cyclones etc. would have gradual but positiveimpact on the marine ecosystems (Cutter, 1994). Hence,various marine ecosystems along the Indian coasts arereviewed in this report along with the status of research,future research needs and mitigations.
2. Coastal Ecosystems of India :
Indian coast enjoys the typical tropical climatic patternmainly influenced by the monsoonal effect. The Indianpeninsula is flanked by the Arabian sea on the west andBay of Bengal on the east, which are the arms of ‘closed’
Indian Ocean. There are two unique offshore, oceanic islandsystems of Andaman – Nicobar and Lakshadweep atolls.Apart from major and minor estuaries, there are gulfs andundulated coastline with varying type of geology andgeomorphology.
From estuarine regime to the coastal region as well as thesubtidal, the offshore and the deep oceans, there are uniquemarine living ecosystems (Fig. 2) with special structures,functions and biodiversity. These involve from unicellularplanktonic organisms, to higher flora and fauna (Dwivedi, 1990;Adams & Wall, 2000). The marine microbes along with theirvarious processes are very important in the food chain. Themarine living ecosystems observed along the Indian coastsare sand dune vegetation, mangroves, corals, benthos, fisheriesand planktons (Falkowski, 2002; Bakus, 1994).
Ecology :
The ecological impacts of recent climate change totropical marine ecosystems have been scientifically proved.The responses of flora and fauna span an array ofecosystems and organizational hierarchies from the speciesto the community levels. Although we are only at an earlystage in the projected trends of global warming, ecologicalresponses to recent climate change are already clearly visible(Walther et. al. 2002).
The marine ecosystems observed along the Indiancoasts are as follows :
- Sand dune vegetation
- Mangroves
- Corals
- Benthos: like seaweed, seagrasses along withassociated fauna
- Fisheries
- Plantonic organisms

17
International Conference on Ecosystem Services of Wetlands - ‘Ardrabhumi :2016’ISBN : 978-81-923628-3-0
All these living ecosystems are conspicuouslyassociated with the microbial flora, acting at various levelsand responsible for several important processes. The marineecosystems are perhaps the richest in their biodiversityrepresenting from unicellular organisms like bacteria,plankton to multi-cellular giant animals like whales as shownin (Fig. 3).
Coastal ecosystems stand to be drastically impactedas a result of global climate warming. Predictions of coastalresponses to global warming remain very speculative. Thecoastal environment are migrating landward and bringingabout shifts in marginal vegetation and fauna. In eachinstance, the coastal ecosystem changes are made morepronounced because of local development along thelandward merging, which hinders the stress and local impact(Kjerfre, et. al., 1994).
I. SAND DUNE ECOSYSTEM
i. Introduction :
Coastal dunes are made of sand which is piled high bythe wind. Sand is the by-product of weathered rocksfrom inland regions. These inland rock formations havebeen eroded by rain and wind and washed into therivers that eventually flow into the Ocean. Once in thesea, the sand is shifted up the coast by currents andwave action. Sand on the continental shelf gets shiftedaround continuously between the sea-floor, beach anddunes. Wave action deposits the sand containingheavy minerals onto the beach and thereafter the sandis blown into dunes by the prevailing onshore winds.Shells, corals and other skeletal fragments providesediments to some beaches especially to those in thetropics.
ii. Dune formation :
Coastal features are both natural and manmade. Dunesare built of sand, which is blown inland from the highwater and piles up on existing strata. Until they arevegetated, dunes are constantly growing and shifting.Normal soil-forming processes do not affect sanddunes very much, and at the outset they are virtuallydevoid of nutrients.
Vegetation plays a dominant role in determining thesize, shape and stability of fore dunes. The aerial partsof the vegetation obstruct the wind and absorb windenergy. Wind velocity near vegetation is thus reducedbelow that needed for sand transport and hence thesand deposit around the vegetation. A characteristicof dune vegetation, particularly the grasses growingunder these conditions, is its ability to produce uprightstems and new roots in response to sand covering, ifthe plants do not continue to grow more rapidly than
the rate of deposition, the arresting action of the plantceases. Successive stages of plant growth and sanddeposition result in an increase of width and height ofthe dunes (Desai and Untawale, 2002).
Dune vegetation is highly adapted to the salt ladenwinds of the coast, and maintains the fore dunes byholding the sand already in the dunes, trapping sandblown up from the beach and aiding in the repair ofdamage inflicted on the dunes either by naturalphenomena or by human impact. The combination ofdune height, dune shape and intact vegetation createsa protective system, which directs salt-laden windsupwards and over the dune crest. As a result, saltsensitive vegetation communities including littoralrainforests can establish in close proximity to the beach(Untawale, 1980).
iii. Classification of sand dune vegetation :
Coastal sand dunes along with the vegetation arevariously classified by different scientists throughoutthe world. One of the oldest classification is given byTurner, Carr and Bird (1962). They described 5 welldefined zones of vegetation. The classification givenby them is as under :
Zone I – Embryonic Dune : This zone is nearest to thesea and is unvegetated, but is in the initial stages offormation.
Zone II – The Fore Dune : It runs parallel to the firstbeach ridge and has sand binding grasses like Spinifexlittoreus growing on it. Some herbs and shrubs though notactually sand binders but from nearby salt marshes andfrom the next zone are also included in this region.
Zone III – Dune scrub : This is close to the fore duneand is higher than the fore dunes and forms the main part ofthe dune. Different types of shrubs grow here.
Zone IV – Shrub Woodland : It is a long narrow sandyridge running parallel and separated by sand flats.
Zone V – Dune Woodland : This is made up of thestable Sand Dunes with vegetational community similar tothat found in the neighbouring coastal region of the mainland.
Untawale (1994) classifies the sand dune vegetationforming a natural triangle (Fig. 4) with the herbaceous pioneerzone at the base, and back shore zone covered with trees atthe apex. This vegetational profile diverts the wind flowupward, controlling the erosion. On the pioneer zone theherbs with creeping stolon grow. In the mid-shore zone herbsand shrubs with comparatively deeper root system are seento be naturally growing. And further on the backshore, dune

18
International Conference on Ecosystem Services of Wetlands - ‘Ardrabhumi :2016’ISBN : 978-81-923628-3-0
trees are found. This natural vegetation has to be maintainedas they successfully utilize the ground water. Any changein the growth pattern will interfere with the dynamic systemof sand dunes.
iv. Shelter belt development along the coast of India :
The coastal zone is very dynamic and productive butat the same time prone to the effects of sea level rise,floods and cyclones etc. As has been discussed earlier,there are marine ecosystems, which can be used todevelop a protective shelter belt along the coast ofIndia. These ecosystems are :
I) Mangrove forests
II) Sand dune vegetation
Mangrove forests can be developed along theestuaries and backwaters while sandy beaches can be usedfor growing sand dune plants in a planned way. In view ofthis, following points can be of great significance to protectthe coast line from the sea level rise and other impacts(Untawale, 2001).
i) Most of the coasts of Tamil Nadu, Andhra Pradesh,Orissa, West Bengal as well as Andaman & NicobarIslands in the Bay of Bengal are very much prone tothe cyclones of different intensity. Although Arabiansea used to be known as ‘silent sea’ according to therecent data, there is a trend of increase in cyclones,which have devastated the life and property of Gujarat.
ii) Coastal Shleter Belt should be a continuous, denselyvegetated region extending from ‘Pioneer zone’ tohinterland (Backshore zone) varying from 1 to 5 kms inwidth depending upon the edaphic and environmentalfeatures of the coast. This can be combined with the‘agroforestry belt’ in the hinterland for furtherprotection.
II. MANGROVE ECOSYSTEM :
Mangroves is very unique tropical intertidalecosystem. This is a group of different angiosperm plantswhich can tolerate salinity and tidal inundation. These treesfavour soft silty clay soil. Because of their dense root systemand the seedling growth, mangroves are known to preventerosion and increase the accresion or sedimentation due to‘flocculation’ effect. For their growth, these trees needcontinuous freshwater and sediment flow from the upstreamregion alongwith the nutrients. This open ecosystem canrecycle the nutrients, through the process of decomposition.The mangrove biodiversity is considered to be very high ascompared to other ecosystems (Table 1).
Table 1 : Mangrove biodiversity of India (Untawale et. al.,2000)
I Flora Genera Species1 Algae 30 472 Fungi 40 503 Seagrasses 1 24 Mangrove flora 41 595 Lichens 8 14II FAUNA1 Crustaceans 46 822 Molluscs 57 883 Wood borers 13 244 Fishes 70 1205 Reptiles
- Snakes 18 21- Lizards 3 4- Turtles 5 5
- Crocodiles 2 2- Amphibians 4 8
6 Birds 53 1197 Mammals 29 34
Due to various reasons vast mangrove forests havebeen deforested and reclaimed during the last severalcenturies. The process is still continuing inspite of theCoastal Zone Regulations, Forest Conservation Act, WildlifeAct.
Mangrove swamps are also considered as thebreeding, feeding and nursery grounds with very highbiodiversity. These areas are also scientifically consideredthe ‘sinks’ for methane. Being forest in nature, mangrovesalso use a huge quantity of CO
2 produced by various
manmade activities. It is, therefore, essential to protect andmanage this important mangrove ecosystem, which is aconnecting link between the land and the sea.

19
International Conference on Ecosystem Services of Wetlands - ‘Ardrabhumi :2016’ISBN : 978-81-923628-3-0
Table 2: State-wise list of mangrove areas identified for Conservation and Management (Ministry of Environment & Forests,Govt. of India)
S. No. State / UT Mangrove Area
1 West Bengal Sunderbans
2 Orissa Bhitarkanika Mahanadi
Subernarekha Devi Dhamra
3 Andhra Pradesh CoringaEast GodavariKrishna
4 Tamil Nadu PichavaramMuthupetRamnad
5 Andaman & Nicobar North AndamansNicobar
6 Kerala Vembanad
7 Karnataka CoondapurDakshin Kannada
8 Goa Chorao Island
9 Maharashtra Achra – Ratnagiri
Devgarh-Vijay Durg
Veldur
Kundalika – Revdanda
Mumbra - Diva
Vikroli
Shreevardhan
Vaitarna
Malvan
Vasai – Manori
10 Gujarat Gulf of Kachchh
11 National Mangrove Genetic Resource center (NMGRC) Kalibhanjdia, Orissa
As indicated in (Table 2) several luxuriant mangroveareas have been declared as biosphere reserve, WildlifeSanctuary, Mangrove Parks or Protected areas as well as‘Mangrove Germplasm Preservation Centers’.
Large scale mangrove plantation programmes are alsotaken up along the coast for protection from erosion andsea level rise. These dense mangrove areas are also helpfulas the Shelter Belt Areas from cyclones. Mangrove beltswould also act as a buffer zone from the predicted sea levelrise, increase in temperature, floods etc. The main impactsof climate change that can be expected to affect mangroveecosystems are sea level rise (SLR) and changes inprecipitation through altered sediment budgets (Ellision,1994) as a consequence of the impacts resulting from factorssuch as sea level rise and changes in ecophysiology andcommunity composition relative to climate change.Mangroves may be prone to damage in lesser magnitudestorms than previously. Mangroves will become far morefragile as increased research and management activity(Ellision, 1994, UNESCO, 1992). As the climatic cycle is itselfdependent on the astronomical cycle, it has a global
significance and this property renders mangrove palynologyvery useful for the reconstructions of the conditions in thepast. (Caratini. 1992).
i. Indian Mangroves :
Mangroves along the Indian coastline were studiedearlier by Mathuda (1957). The total mangrove areawas estimated to be 7,00,000 ha by Sidhu (1963). Thisestimate excludes mangrove areas of Konkan coast,Goa, Karnataka and Kerala. The Survey of India hasestimated mangrove cover of about 6,36,000 ha basedon landsat data of 1987. As per Forest Survey of India(1997) the total mangrove area of India is 4822 sq. km.The extent of mangrove cover along the east coast ofIndia was comparatively larger (80%) than the westcoast (20%) due to the terrain and gradual slope aswell as the river deltas of Godavari and Bramhaputra(Blasco, 1975, Untawale, 1985). General distribution ofmangrove species depends on the substratum, salinityand number of tidal inundation (Fig. 5).

20
International Conference on Ecosystem Services of Wetlands - ‘Ardrabhumi :2016’ISBN : 978-81-923628-3-0
a. West Coast :
Along the west coast of India, mangroves are foundgrowing on the banks of estuaries, deltas, backeaters,creeks and other protected areas. In all 34 species, 25genera and 21 families have been reported from thewest coast of India (Untawale, 1987). Of these, 21 specieshave been reported from Gujarat, 28 from Maharashtra,17 from Goa, 18 from Karnataka, 12 from the coast ofKerala and 5 from Lakshadweep group of islands.
The estimated area of the mangroves along the westcoast of India was 114,000 ha (Sidhu. 1963). Over theyears many mangrove area have been reclaimed for thedevelopmental purposes. The Rann of Kuchchh andCochin backwaters are also considered as mangroveareas without any significant mangrove vegetation.Similarly, near Kandla, Mundra and Gulf of Khambatmangroves are found in the degraded conditions.Deltas of Tapti, Narmada, Dhandar, Mahi and Sabarmatihave some growth of mangroves. A typical successionpattern is normally observed along the intertidalmudflats of the estuaries (Fig. 6).
Gujarat, despite having second largest mangrovecoverage of 37,000 ha display poor assemblage of 12species. Avicennia marina, A. alba, A. officinalis,Rhizophora mucronata, Ceriops tagal, B. gymnorhiza,Aegiceros corniculata and Sonneratia alba are someof the dominant species occurring along the Gujaratcoast. The most dominant being Avicennia marinaforming almost pure stand at many places.
The Kori Creek, mouth, along the northernmost westcoast along the Sir Creek of Pakistan, is one of thelargest mangrove patch of mangroves along the westcoast of India. This is naturally protected and growing,otherwise the status of mangroves in Gulf of Kuchchhis generally degrading. Down South Maharashtra coasthas comparatively better mangrove formations,however, the pressure is continuously increasing onmangroves in and around Mumbai coast, because ofdevelopmental pressures. Goa State has well preserved,although small area of mangroves. Towards southKarnataka has a few pockets of mangroves, here andthere (Rao, et. al., 1986). Down south along the Keralacoast, where very good mangroves were reported(Chand Basha, 1992). Mangrove area is fast dwindlingand urgent efforts are needed for large scale mangroveplantation.
b. East coast :
About 80% of the total mangrove area from the Indiancoast is situated along the east coast . In all 48 mangrovespecies have been recorded from the east coast. The
deltaic system of Ganga, Godavari, Mahanadi, Cauvery,Krishna have luxuriant mangrove forests. Species ofAvicennia and Aegiceras from the dominant vegetationof Godavari, Krishna and Cauvery deltaic systemswhile, Ceriops decandra and Sonneratia apetala formthe dominant mangrove of Mahanadi delta. TheGangetic Sunderbans has thick mangrove forest with atotal area cover of approximately 4,20,000 ha. About 33species of mangroves have been reported from thisarea. Mangrove species such as Heritiera fomes,Ceriops decandra, Xylocarpus spp., Lumnitzera sp.,Sonneratia alba, Kandelia candel, Nypa fruticans andPheonix paludosa are limited to the Sunderbans. Thedense mangroves of Bengal are dominated byExcoecaria agallocha, Ceriops decandra, Sonneratiaapetala, Avicennia sp., Bruguiera gymnorhiza,Xylocarpus granatum. X. moluccensis, Aegicerascorniculatum and R. mucronata. While the species ofR. mucronata, R. apiculata, Ceriops tagal, C.decandra, B. gymnorhiza, L. racemosa, S. apetala, A.ilicifolius, Avicennia officinalis A. marina, E.Agallocha and Acrostichum aureum have a uniformdistribution along the east and west coast of India.Formation of mudbanks and germination of mangrovesto the climate climax condition is shown in (Fig. 7).
The shallow areas under constant influence of tide andfreshwater influx, mangrove species such as N.fruticans, A. routindifolia and P. paludosa showedluxuriant growth.
The other deltaic area with luxuriant mangrove forestsis Mahanadi estuary with 21,458 ha. The flora of theMahanadi delta was represented by dominant speciesof S. apetala, H. fomes, Aegialites spp., Phoenixpaludosa, Acrostichum aureum, Xylocarpus sp., R.mucronata, B. gymnorhiza, B. caryophylloides, E.agallocha etc. Although, there is a high floral diversity,the growth was found to be stunted due toindiscriminate destruction, loss of soil cover, landerosion, degree of greater salt water penetration anddiminishing freshwater.
Bhitarkanika Biosphere Reserve is situated to the northof Mahanadi delta. This site has largest number ofmangrove species with variation in genus Xylocarpusrepresenting species like X. moluccensis, X.mekongensis and Xylocarpus sp. This site is theprimary center of biodiversity for Heritiera kanikensisand H. fomes and is being maintained as wildlifesanctuary and reserve forest for variety of bird andendangered animal species.
Godavari and Krishna estuarine complex have totalmangrove area of 20,000 ha and provide thick mangrove

21
International Conference on Ecosystem Services of Wetlands - ‘Ardrabhumi :2016’ISBN : 978-81-923628-3-0
cover. The dominant mangrove species present wereR. mucronata, R. conjugata, C. roxburchiana, B.gymnorhiza, L. racemosa, E. agallocha, A. marina, A.officinalis etc. The Godavari estuary is dominated bymangrove species such as Avicennia marina, A.officinalis and Sonnaratia apetala. In all 22 mangrovesand their associates are found in this forest. The CoringaWildlife Sanctuary is located in this region.
The Tamil Nadu coast is bestowed upon by the twomajor mangrove formation, the Pichavaram mangrove withapproximate area of 11,000 ha and Cauvery delta withapproximately 2,450 ha. About 20 species of mangroves andtheir associates occur at these sites. Three Rhizophora speciesreported from these sites were R. apiculata, R. mucronata,and the putative hybrid species of Rhizophora, A geneticgarden has been established at Pichavaram for conservationof mangrove genetic resources. The conservation measuresare being taken to restore this mangrove area by AnnamalaiUniversity and State Forest Department.
Other areas such as Point Calimer, Rameshwaram andGulf of Mannar showed degraded patchy mangroveformations fringing the scattered islands. About 20mangrove species have been recorded from these areas withAvicennia marina as the dominant sp. Some pure formationsof mangroves like E. agallocha, Ceriops tagal have alsobeen recorded from the Rameshwaram and Gulf of MannarIslands (Blasco, 1975).
The Andaman group of Islands consist of 204 islandscovering an area of 6400 sq. km. out of which about 1150 sq.km is covered by mangroves while, Nicobar group comprisedof 22 islands covering the area of 1600 sq. km of which 35sq. km is covered with mangroves (Blasco, 1975). Themangrove species recorded from these group of islands wereR. apiculata, R. mucronata, Sonneratia caseolaris in theproximal zone, S. caseolaris, B. gymnorhiza, A. officinalisand Ceriops tagal in the middle zone and Heritiera littoralisas well as Pandanus sp. in the distal zone.
Table 3 : Financial Projections for the Conservation and Management of Mangroves by Govt. of India
Grants released to the Respective State Governments / UTs for implementation of Management Action Plans (MPAs) during9th Five Year Plan i.e. 1997 – 1998 to 2001 – 2002. (Ministry of Environments & Forests, Govt. of India).
(Rs. in lakhs)
S.No State Mangrove Area 1997-1998 1998-1999 1999-2000 2000-2001 2001-2002 Total1 West Bengal Sunderbans 66.82 63.60 44.95 - - 175.37
2 Orissa Bhitarkanika - - 17.56 - 14.39 31.95
Mahanadi - - 26.50 - 3.31 29.81Subemrekha - - - 23.50 - 23.50
Devi - - - 7.25 1.72 18.97
Dhamra - - - 15.00 - 22.00MRGC - - - 22.00 22.00
3 Andhra Coringa - 10.65 - 31.20 28.181 70.03
Pradesh Krishna - 8.87 - 14.39 4.50 37.76East –Godavari 8.50 - 14.28 14.50 37.28
4 Tamil Nadu Pichavaram 10.62 10.60 4.74 16.00 12.20 54.16
Muthupet - 8.40- 11.46 64.00 61.95 145.81Ramnad - - - 4.70 14.00 18.70
5 Maharashtra Achra - - 9.88 - 9.88
RatnagiriDevgadh-
Vijaydurg - - - 9.74 9.74
Mumbra-Diva - - - 26.41 26.41Vaitarna - - - 14.5 14.05
Kundalika
Revdanda - - - 13.52 13.52Vasai-Manori - - - 11.79 11.79
Shreeverdhan
Viral-Kalsuri - - - 13.49 13.79

22
International Conference on Ecosystem Services of Wetlands - ‘Ardrabhumi :2016’ISBN : 978-81-923628-3-0
6 Goa Chorao 8.20 8.95 8.95 12.45 8.63 47.187 A&N Islands North Andamans - - - 7.64 8.54 33.06
Nicobar 16.88- — — 4.00 2.56 6.56
8 Gujarat Gulf of Kachchh - - - 66.47 66.479 Karnataka Coondapur - - - - 1.86 1.89
Honnavar Div. - - - - 8.70 8.70
10 Orissa Kali bhunj dia - - - - 22.00 22.00Island
Total 102.52 119.57 124.04 401.52 195.04 964.69
Iii. Coral Ecosystem :
Coral formations along the coast of India are reportedfrom Lakshadweep atolls, Gulf of Mannar, Gulf of Kuchchh,Palk Bay and Andaman – Nicobar Islands. Stray patches are
also observed along the east and west coasts, at varyingdepths. About 199 species of 71 genera have been recorded(Table 4). There is lot of associated flora and fauna also(Wafar, 1990; Bakus, 1994, Pillai, 1971).
Table 4 : Diversity of coral species along the Indian coast
Area Type Hermatypes Ahermatypes
Gen. Spp. Gen. Spp.Palk Bay and Gulf of Mannar Fringing 26 96 9 10
Gulf of Kuchchh FringingPatchy 20 34 4 3
Andaman and Nicobar Islands Fringing 47 100 12 35Lakshadweep Islands Atolls 27 69 4 9
Submerged Banks Patchy 5 5 - -
Central West Coast Patchy 8 8 - -Indian Reefs - 51 156 21 44
Total Genera : 71, Total Species : 200 (Wafar, 1990)
Different soft and hard coral species are found fromthe intertidal region to the subtidal depths. The averagegrowth of the coral atolls is estimated to 1 to 3 mm per yearand 10-12 mm per year of for fringing reef. The accretion ratefor the coral atolls is estimated to be 10 to 200 mm per year(Siddique, 1980). The coral ecosystem is very productiveand rich in biodiversity. It is however, very sensitive to thesiltation, temperature increase, pollution and UV-B radiation.
Coral reefs are known to be the most diversified andproductive ecosystem among all the marine ecosystems oftropical zone. Many corals are very beautiful, colourful andattractive to human being (Wafar, 1988). India has vast reefarea including islands and coasts and are of direct economicimportance due to their organic and inorganic resources.Corals play an important role in protecting the shoreline.These are often exploited for calcium carbonate – a rawmaterial for many lime based industries such as lime, cement,and calcium carbonate. The fishery resources of the reefsare extremely rich and diversified.
a. Coral Atolls :
Lakshadweep archipelago consists of atolls with
several low-lying islands in the east a broad, well developedreef in the west, with a lagoon in between, connected to theopen ocean by several channels. The number of coral speciesknown is 103, belonging to 37 genera (Pillai and Jasmine,1989). Acropora spp., Pocillopora spp., Porites spp. andmassive encrusting faviids are common coral species of theLakshadweep. Psammocora is common in the northern (bluecoral) and Millepora spp. Genera like Montipora andEchinopora are recorded from the northern islands but areabsent in Minicoy.
b. The Andaman-Nicobar Island :
Coral reefs here are the fringing type surrounding theislands. There are about 500 islands, believed to be part ofan emergent mountain chain. There are 516 villages withtribal inhabitants including Andamanis, Onges, Nicobaris,Jarawas and the hostile Sentinels (Tikader and Das, 1985).The islands are covered with thick forests and mangrovesare common trees. The complete biodiversity resources ofthis region is yet to be evaluated, due to non-accessibilityto the region.
Pillai (1983) reported 135 species of Scleraticia, 110species and 45 genera are hermatypic. Most dominantspecies in the reef flats are massive Porites and Faviidae.

23
International Conference on Ecosystem Services of Wetlands - ‘Ardrabhumi :2016’ISBN : 978-81-923628-3-0
Acropora, Pocillopora, Seriatopora, Stylophora etc. arethe common arborescent genera commonly found. Majorreef inhabitats include sand and shingle of the upperintertidal zone, dominated by Donax, Hippa, Crassostrea,Nerita, Thais, Drupa and Cerithium (Pillai, 1983); subtidaldead shingle with Area, Tridacna and many diversifiedspecies. The reef flats are dominated by Drupa, Pyrene,Cerithium. Acra, Lithophaga, Pinactada and variety of hardcorals including a stinging coral Millepora plathyphylla.The stony corals include genera Porites, Favia, Acropora,Pocillopora, Helipora, Tubipora and Montipora.
c. Fringing Reefs :
The coastal reefs of India, can broadly be divided intoa) minor coastal coral reefs along the west coast andVisakhapatnam on the east coast and b) major coastal coralreefs along southeast Indian including Palk Bay and theGulf of Mannar. Corals, though rare in occurrence, arereported throughout the west coast. On the east coast,however, due to delta formation, heavy siltation takes placehindering coral growth.
Among the Coastal Coral Reefs, Gulf of Kuchchhregion in Gujarat has the most luxuriant coral growth alongthe west coast of India. There are about 44 species ofscleractinian corals and 12 soft coral species (Patel, 1988).The submerged reefs of this area harbour 18 stony coralspecies and has 45 percent coverage. The common generaare Acropora, Porites, Pseudosiderastrea and Favia. Onesoft coral Juncella juncea is also very common. Corals fromthis region are largely destroyed by limestone industriesand siltation. Along the central west coast, (Wafar, 1986),reported two species (Pseudosiderastrea tayami and Poriteslichen) of hard corals in patches from Mumbai. Recently,Untawale et. al., (Pers. Observation) cited large well-developed hard coral colonies at Colaba, near southMumbai. The area under coral coverage is about 60 to 70percent. One soft coral species is also found in this area.The fringing corals then extend up to Kerala. Malvan(discussed further) is considered to have the richest marinebiodiversity along the central west coast. Parulekar (1981)reported Porites, a stony coral, as most common in Malvanwaters. He reported nine species including a rare red coralspecies belonging to genera Coascinarea, Favites,Goniastrea, Syneraraea and Pseudosiderastrea,Cyphastrea, Turbinaria. All coral species reported are non-branching. Angria bank – a submerged reef situated offRatnagiri has stony corals. Five coral species are reportedfrom Gaveshani bank, off Malpe along Karnataka coast.Pocillopora eydouxi is recently reported fromVisakhapatnam, on the east coast (Bakus, 1994).
The major coastal coral reefs, along the east coast is aseries of fringing reefs. 96 species belonging to 36 genera ofscleractinian corals and seven species of ahermatypic are
reported from this region. The Gulf of Mannar is known tohave more diversified and abundant coral species (Pillai,1986). Montipora and Acropora represent 40 percent of thespecies (Pillai, 1971) in Palk Bay. Manauli and Crusadaiislands near Mandapam, in the Gulf of Mannar, are knownfor their rich diversified fauna. Thirty species of stony coralswere reported from Manauli reef of which the dominant coralswere Acropora, Porites, Goniastrea, Favia, Pocilloporaand Montipora, Krusadai Island demonstrates a welldeveloped coral reef. The “Mannar Barrier” consists of 20small islands. Due to natural calamities and over-exploitationby industries, students and local dwellers for ornamentalvalue, many large colonies of coral species such asfoliaceous forms Montipora foliosa and Echinoporalamellose are about to become extinct.
iv. Other Ecosystems :
Flora : There are too few data to came to conclusions.However, on the basis of the available information, it ispossible to make predictions about the impacts of increasedCO
2 concentrations, temperature and UV-B fluxes.
Seagrasses will show enhanced photosynthetic rates andgrowth while intertidal macroalgae may not show enhancedgrowth as CO
2 increases. Interactions between temperature
range and photoperiod can be responsible for excludingspecies from particular regions of the world’s oceans. Climatechange may well have other effects on the efficiency withwhich marine plants use other resources such as N, Fe orZn (Beardall et. al., 1998).
a. Algae and Seagrasses :
The coastal ecosystem provides a good shelter formarine algal growth and diversified seaweed flora is oftenobserved. Some of the algae, though in minor scale, areresponsible for reef building. There are certain algae thathave calcium carbonate deposition and are known as corallinealgae. The role of calcareous algae is however, lesssignificant in the Indian Ocean than in the Pacific Ocean.Jagtap (1987) reported 20m wide algal ridge on the seawardside of Kavaratti and Agathi Islands of Lakshadweep.
The maximum marine algal biodiversity of more than180 species and 99 genera is reported from Gulf of Mannarand Palk Bay (Umamaheswara Rao, 1972). Halimeda opuntiacontributed to 20 percent of total sampling. Altogether 82marine algal species are recorded from the Lakshadweeplagoons with an estimated annual yield of 3645 - 7598 mtons of fresh weight per year (Subbaramaiah et. al., 1979).Rhodophycean species were maximum in numbers (39)followed by 33 green and 10 brown algal species. FromAndaman and Nicobar Islands, 64 species and 40 generawere reported including 27 Rhodophycean, 21Chlorophycean and 15 Phacophycean species. Total marinealgal biodiversity is shown in Table 5.

24
International Conference on Ecosystem Services of Wetlands - ‘Ardrabhumi :2016’ISBN : 978-81-923628-3-0
Table 5 : Seaweed Resources available along the Indian Coast
No. Coastal States Order Family Genera Species Production (Ton/year)01 Gujarat 15 42 105 202 100,00001 Maharashtra 16 40 76 152 20,00003 Goa 13 29 48 75 2,00004 Karnataka 12 19 28 39 ~10005 Kerala 8 10 14 20 ?06 Lakshadweep Islands 13 29 51 82 70,00007 Tamil Nadu 15 45 428 302 90,00008 Andhra Pradesh 14 29 51 79 ?09 Orissa 1 2 3 6 ?10 West Bengal 3 4 5 6 ?11 Andaman and Nicobar Islands 8 25 40 64 ?
(Untawale, Dhargalkar and Deshmukhe, 2000)
Palk Bay and the Gulf of Mannar have extensiveseagrass beds. Jagtap (1996) reported 12 species and sevengenera of seagrasses from this area. Five species ofseagrasses are reported from the Minicoy lagoon byUntawale and Jagtap (1984). The common genera wereThallasia, Halophila and Cynodocea. Kavaratti lagoon hadluxuriant seagrass growth of Thalassia and Cymodocea.
b. Planktonic systems :
Phyto and zooplankton populations are the parts ofthe marine food chain. Since these species are capable offloating on the surface water and also sometimes verticalmigration, will have very little impact of sea level rise.However, due to increase in Sea Surface Temperature (SST)and the resultant increase in the nutrient concentration, thereis a possibility of ‘eutrophication’ in certain areas. Due tothe availability of essential environmental conditions andnutrients, the planktonic species show the phenomenon of‘eutrophication’. The best example of this is observed alongthe west coast, during pre-monsoon, blooms ofTrichodesmium erythraeum – a blue green alga. The euphoticzone of the 200 m water column shows the presence ofseveral phytoplanktonic species which are unicellular innature.
The zooplankton species responsible for thesecondary production normally graze on the phytoplanktonspecies. There are several species of zooplankton belongingto different groups. These planktons migrate horizontallyand vertically and are considered as an important foodsource for the tertiary animals.
i. Phytoplankton :
There is sufficient information available on theproductivity of phytoplankton in the Arabian Sea(Radhakrishna et. al., 1978; Qasim, 1982; Bhattarhiri, 1992).
Goes et. al., (1992) studied the distribution and productionof phytoplanktons by using satellite imageries forchlorophyll images along the west coast of India. The intensecooling in the Gulf of Kuchchh, with high phytoplanktonbiomass, is an interesting phenomenon.
The most dominant phytoplankton group is diatoms(80%) followed by cyanobacteria (7%) and dinoflagellates(6%). The most common were Nitzschia species such as N.seriata, N. closterium and N. pungens comprising 25% ofthe total population. Navicula was common (22%) at onlyone station (15oN 64o E), followed by Rhizosolenia spp (10%)and Chaetoceros (9%). Ceratium sp. and Peridinium sp.were the dinoflagellates constituting 4% of the population.
There is no systematic list of phytoplankton speciesavailable and most of the work carried out is site specific. Itis necessary to document all available phytoplankton speciessystematically, along with the important environmentalparameters. It would be worthwhile to study the impact ofclimate change, like SST, etc on the phytoplanktoncommunities, like species distribution productivity etc.
ii) Zooplankton :
Zooplanktons are placed at the second lowest level ofthe trophic prism, feeding on the phytoplanktons. Highzooplankton mass is observed when phytoplankton countis less and nutrition depletion is observed (Madhupratapet. al., 1992). Along the central and eastern Arabian sea, thecomposition of microzooplanktons in the upper 200 m wasdominated by protozoans (ciliates – loricates and aloricates),flagellates and sarcodines ranging from 55% to 91% (Gaunset. al., 1996). The intermonsoon season showed the highestvalue of zooplankton, at 700 ml 1-1, followed by summer (300ml 1-1) and winter (130 ml 1-1). Among the twenty species ofcalanoids, Pleromamma indica was the most dominantspecies in 0-500 m water column. Based on zooplankton

25
International Conference on Ecosystem Services of Wetlands - ‘Ardrabhumi :2016’ISBN : 978-81-923628-3-0
data collected from 1864 samples in the duration of 12 years(1976-1988), the zooplankton biomass values vary in theArabian Sea, the Bay of Bengal, Lakshadweep Sea and theAndaman Sea respectively (Goswami et. al., 1992).
V. Benthic Ecosystem :
The benthic biota which is attached to the substratumconsists of marine algae, seagrasses, and varieties of thefaunal elements. The juvenile forms of this biota may be freefloating. The marine benthic biota favours different tidalinundation levels and also substrata. Hence, these aredistributed from the supralittoral fringe to the subtidal areas.
Since these static biotic elements are not in a positionto migrate, these are affected by the changes in coastalregions like temperature, tidal waters, pollution and siltation.The benthic biota also binds, holds the substratum,increases the biological productivity and enhances theinteraction at the trophic level.
VI. Fisheries :
This is a very important socio-economic componentsof the coastal ecosystem. There are different forms offisheries from the inland brackish water, nearshore, pelagicand offshore fisheries. Since most of the fish species aremigratory in nature, these are least affected by the minorchanges like increase in temperature or the sea level rise.These are also capable of getting adjusted to a great extenttowards the changing climates.
3. Status Of Research On The Impact Of Climate Change On Marine Ecosystems
I. Impact on Marine Ecosystems :
Rapid review of the available literature on the marineecosystems along the Indian coast prior to 1990 shows thatmaximum work on the estuarine, nearshore, coastal andoffshore ecosystems is available on some aspects of biology,ecology, biochemistry, reproductive biology, qualitative andquantitative distribution as well as taxonomy.
The concept of climate change is of recent origin.However, some of the geological publications havesignificantly contributed to the past climate change andimpact on the Indian coast (Vaidyanadhan, 1991). Thebiological organisms like foraminifera have been used byNigam (2000), Nigam and Khare (1999) and Nigam et al (1995)to study the impact of sea level rise, precipitation and otheraspects. Several scientific papers have been published onimpact of sea level rise on the coastal environments, in abook edited by G. Victor Rajamanickam (1990). Untawale &Jagtap, (1991) have reported the fomation of mudbkanks,deltaic Islands and the growth of mangroves to ‘climaticclimax’ to stabilize the systems in major deltas like
Sunderbans. The recent publication on Climate Change inIndia ( Shukla, et al., 2002) deals in greater details about theIndian scenario related with various aspects like past andpresent circumstances, model projections, mitigations,forests, food securities, sustainable developments and futurestrategies.
There are numerous publications on the marinebiology of Indian coasts. However, very few directly relateto the climate change or its resultant impact. Thesecontributions, however, could be used for estimating theimpact and also to identify the gaps in information fordeciding future line of action. Recently more emphasis hasbeen given on the ‘Biodiversity’ studies (Untawale et. al.,2000).
Communities of plants and animals living in coastalareas are adapted not only to the mean sea level but to theregular short term changes or variability in sea level whichare associated with the tidal cycle and recurring seasonalchanges. The monsoons in the Bay of Bengal fro exampleresult in mean sea level in Bangladesh being about 94 cmlower in March than in September, a condition to which themangrove ecosystems are adapted. It is, therefore, necessaryto study the impact of climate change like sea level rise andincrease in temperature on marine ecosystems keeping inview their structure and function.
It has been argued that even in the case of infrequentepisodic events the communities concerned are disturbanceadapted and that indeed disturbance may be necessary tomaintain the biodiversity of some coral reef and mangrovecommunities. Some other examples are the marine turtlenesting and the Horse shoe crabs.
Such policies should be designed to address presentproblems in coastal zones with a view to strengthening thenatural capacity of coastal systems to respond to changes.In simple terms a dead coral reef cannot grow whilst a healthyreef has the potential to grow and provide continuedprotection against rising sea levels, Policies designed tohalt reef degradation or restore damaged reef ecosystemsmaximize the potential for reefs to respond to climate changeand sea level rise. In addition such policies provide for thesustainable use of the renewable living resources of reefecosystems and hence even in the absence of climate changesuch policies would provide benefit to future generations.
Whilst total global fisheries production is not expectedto decline as a consequence of global climatic changes,changes in the geographic location and extent of importantcommercial fisheries may be expected as a consequence ofchanges in the global ocean circulation and at a local scaleas a consequence of changes in the productivity of coastalwaters. Demersal and coastal fish change abundance withwarm water species replacing those normally characteristic

26
International Conference on Ecosystem Services of Wetlands - ‘Ardrabhumi :2016’ISBN : 978-81-923628-3-0
of these fisheries. Such changes in species compositionand abundance place economic and technological strainson local fishing communities requiring adaptation of catch,processing and marketing technologies and local knowledgeof changed fishing grounds.
At present the scientific consensus seems to suggestthat global mean surface temperature has risen by around0.6+/-0.2o Cover the last century and that global mean surfacetemperature will rise by around 2.5oC by the year 2050perhaps reaching 4oC by 2100. It is to be expected thereforethat direct effects upon the productivity of coastal biologicalcommunities will occur with some changes in speciesdistribution and composition.
Buddemeier and Smith (1993) suggest that recent coralbleaching events anomalous high ocean temperatures mayhave been aggravated by chronic levels of other forms ofstress resulting from overfishing, pollution and increasedsedimentation. Hence the combined effects of other sourcesof stress may adversely affect the ability of reef systems torespond to climate change. Otherwise, corals being a livingecosystem, may grow alongwith the sea level rise (Fig. 8).
The economic costs of coral reef destruction aredifficult to calculate but involve not only loss of therenewable resource base but also the loss of the protectivevalue of reef flats. In the Maldives for example, landreclamation on the ref flat facing the Indian Ocean in frontof the capital city island of Male’ resulted in flooding anddestruction during a storm surge on the reef flat and resultantflooding would have been much less. Following this anextensive breakwater was constructed on the edge of thereef platform at a cost of 12,000 US$ per linear metre (Pernettaand Elder, 1992, 1993).
II. Assessment of climate change impacts :
Most reviews have listed broad areas of impact andfew have been unable to produce quantified predictions ofimpacts due to the scientific uncertainties involved inmaking such predictions.
Climatic change impacts in coastal areas will be bothdiverse and extensive including alternations to physical,biological and human elements. More detailed understandingof the functioning of coastal systems is required to facilitateimpact prediction, planning and management.
There is a need for a coordinated and multi-disciplinaryapproach to impact assessment rather than a narrow sectoralapproach. Potential impacts may be directly related totemperature and other components of climate.
Secondary impacts in coastal areas resulting from therise in global mean temperature will include changes inrelative humidity; runoff and river flow rates; coastal soils
and soil fertility; salinity and coastal water chemistry; thedistribution, intensity and possibly also the frequency ofstorms and coastal flooding.
Such changes will affect coastal vegetation distributionand abundance which will in turn alter animal distributionas well as abundance and the overall productivity of naturaland agricultural systems on land. Such changes will alsoaffect human drinking water supplies and require changesin freshwater management practices. In addition thesechanges will alter coastal water salinity and mixing whichwill change coastal marine ecosystems, fish production andmariculture. All of which will have varying social andeconomic impacts in different areas.
III. Growth of coastal populations
As a consequence 65% of all cities with populationsin excess of 2.5 million inhabitants are located along theworlds coasts and a number of these are already below sealevel (UN, 1985; Bhatt and Sharma, 2002). Megacities ofIndia like Mumbai, Chennai, Kolkatta, etc have already shownthe indications of population pressures. Mumbai iscontinuously extending the habitation towards the sea. Suchareas along the coast are going to be under increasing threatsof sea level rise, floods or cyclones (Untawale, 2001).
Holligan & de Boois (1993), estimate that while thecoastal zone occupies only 8% of the surface of the globe itaccounts for a total of 26% of all biological production. Lie(1990) estimated that living marine resources currentlyprovide between 5 and 10% of human food production andas much as 85-90% of the total world catch of finish comesfrom coastal and nearshore waters (Lie, 1990; Postma &Zijlstra, 1988). Although it has not been evaluated the threatto global food security posed by the growth of human,coastal populations cannot be ignored. The increase in thecoastal population will result in an increasing demand formarine products particularly fish, hence the rates of extractivefish catch can be expected to increase to the point at whichfish stocks are likely to collapse.
IV. Sea level rise
Recent trends in sea level rise suggest that the currentaverage rate of rise is approximately1.5mm yr-1 and the latestIPCC projections of future global warming suggest that thisrate is likely to increase such that global sea level will riseby some 28 cm+/-14 cm by the year 2050. Global sea levelrise threatens not only the natural environments of coastalareas but also low-lying human populations centers alongthe Indian coasts.
Frequency of coastal flooding would be increased byarise in sea level, but would also be changed by alternationsto coastal current regimes affecting wave climates, bychanged storm patterns and by changes in rainfall which

27
International Conference on Ecosystem Services of Wetlands - ‘Ardrabhumi :2016’ISBN : 978-81-923628-3-0
might enhance river based flooding in major river systems.It has been suggested that a general worldwide increase ininundation is expected during the next centaury. Mangroveecosystem can function as a buffer zone. With the sea levelrise (SLR) mangroves can gradually migrate towards landwardside (Fig. 9).
For many coastal cities reliant at the present time ongroundwater supplies, increasing sea levels will restrict thevolumes of available freshwater and saline intrusion willincrease. Such changes may result in changes to coastalvegetation. At present this is being experienced in manycoastal areas of India during summer.
The widespread conversion of mangrove ecosystemsto other uses such as mariculture or paddy rice productionseriously reduces coastal protection against storm and waveerosion and reduces the rate of sediment accretion in coastalareas. Kerala has reclaimed several mangrove areas for paddyand coconut plantation. In such areas the soils have becomeacid sulfate and yield has reduced. Moreover, these areashave become more prone to inundation. Kharlanddevelopment activity of Konkan (Maharashtra) hasconstructed several bunds across the creeks killingmangroves and resulting into floods.
Continued protection is the only available alternativeto such areas of low levels country. Ultimately the economiccosts of continued raising of protective structures andpumping of water may outweigh the economic benefits whichcan be derived from continued use of the land concerned.
The consequences of sea level rise are more likely tobe experienced by India and may include : increasedfrequency and extent of flooding; rearrangement ofunconsolidated coastal sediments and soils; increased soilsalinity in areas previously unaffected; changes waveclimates; accelerated dune and beach erosion and wetlandvegetation. As a consequence of the primary impacts avariety of secondary impacts can be identified whichchanges in marine primary production.
Changes in marine primary production will affectenergy flow to and standing stocks of higher tropic levelsincluding finfish for human consumption. Such changeswill alter the economic viability of living resource basedactivities by affecting commercially important species suchas penaeid prawns and shrimp. Changes in the salinity ofcoastal wetlands may also alter the distributions of humandisease vectors hence changing the epidemiology of vectorborne diseases like malaria.
In many coastal areas current economic and socialactivities are exacerbating an already critical situation.Potential impacts of climatic change and sea level rise areovershadowed in many areas by existing environmental
problems and current, environmentally unsounddevelopment practices will increase susceptibility topredicted global climatic change impacts. Some coastalstates are particularly vulnerable, for example between eightand ten million people live within one metre above sea levelin each of the unprotected deltas and coastal areas likeSunderbans and Orissa. It is well known fact that every yearBay of Bengal experiences number of cyclones and floodsin major rivers. Mangrove forests which are in goodcondition, protect the human life and properties fromcyclones and flood. The impact of super-cyclone of Orissaon mangrove and non-mangrove regions have once againproved the significance of mangroves and shelter belts(Untawale. 2001).
The economic costs of coastal protection and waterregulation may be prohibitive for India. Alternative strategieswhich maximize the natural protection afforded byecosystems such as mangrove forests and enhance thenatural rate of sediment deposition may be the only possiblemechanisms for mitigrating the potential impacts of risingsea level, Mahtab (1991).
It would be unwise to undertake flood protectionmeasures by means of embankments especially wheresubsidence is taking place since these will becomeincreasingly more expensive to maintain in the face ofcontinued sea level rise. Therefore, activities such asencouraging silt deposition through mangrove replantingmay not only be economically a better response, but alsoprove in the long term to be a more environmentally soundoption (Fig. 7).
4. Protection of the Coastal Zone
The Coastal Zone, i.e. from the Supratidal region tothe Infratidal and subtidal region is very productive, dynamicand sensitive part of the marine system. In addition thiszone has perhaps the highest marine biodiversity. There arevarious marine living ecosystems like sand dune vegetation,mangroves corals, benthic as well as associated marine biota.
During the forthcoming Climate Change the coastalzone would be affected gradually. In view of these adverseeffects, it would be essential to protect this coastal systems.Recently such areas have become the centers of urbandevelopments. Several important industries, hotels, housingcomplexes, slums and other development like ports etc havebeen developed near the coast and along the majorestuaries. Hence such areas have become major centers ofsocio-economic developments at the cost of billions ofrupees. In view of this Govt. of India, keeping in view theseenvironmental, ecological, social and economical changeshas taken several measures for the sustainable development,conservation and management of the coastal zone and itssensitive ecosystems.

28
International Conference on Ecosystem Services of Wetlands - ‘Ardrabhumi :2016’ISBN : 978-81-923628-3-0
I. There are several areas, with luxuriant marine floraand fauna along the Indian coasts, which have been declaredas protected under different categories as follows :
a. Marine Biosphere Reserves
b. Marine Wildlife Sanctuaries
c. Marine Parks
d. Protected Areas
e. Genetic Resource Centers
Table 2 gives a list of a few such areas protected indifferent coastal states.
In addition to these protective measures, Ministry ofEnvironments & Forests, Govt. of India, taking intoconsideration the future climate changes followed by sea levelrise etc. as well as the growing population pressure on thecoastal zone, declared a stretch of 500 m coastal belt all alongIndian as the COASTAL REGULATION ZONE as follows :
The intertidal region (area between the Lowest LowTide to Highest High Tide Line) and 500m beyond the hightide line is considered the Coastal Regulation Zone (1991).The first 200m from the HTL, is considered No DevelopmentZone, while other 300m may be considered for restricteddevelopments.
There are, however, various categories under thecoastal zone for protection as follows :
I. CRZ-I : This is very important category of the coastalzone and strictly protects all the sensitive Coastal/MarineLiving Ecosystems like Sand dune vegetation, Mangrovesand Corals. These ecosystems naturally protect the coastalzone from the storms, surges, waves, wind etc. So all thesemarine ecosystems along the coast of India (alongwith thetwo major groups of Islands) have been fully protected.
Other categories II and III are related to the partiallydeveloped or relatively undisturbed coastal areas categoryIV protects the major and minor Island groups along thecoasts or in the offshore regions.
Ministry of Environment and Forests, Govt. of Indiais a nodal agency for implementing the CRZ rules. There areCoastal Zone Management Authorities in each coastalstates and also at the center.
In addition to the conservation and management ofthe sensitive coastal zone the Ministry of Environment andForests, Govt. of India also spends sizable amount on theimplementation of Management Action Plans (MAPS). Table3 indicates the funds distributed for various states duringthe 9th Five Year Plan (1997 to 2002) for management ofmangroves and coral reefs.
Conservation Policies :
Policies should be designed to address problems incoastal zones with a view to strengthening the naturalcapacity of coastal ecosystems in respond to changes. Insimple terms a dead coral reef cannot grow, while a healthyreef has the potential to grow and provide continuedprotection against rising sea levels (Fig. 8). Policies designedto halt reef degradations or restore damaged reef ecosystemsmaximize the potential for reefs to respond to climate changeand sea level rise. In addition such policies provide for thesustainable use of the renewable living resources of reefecosystems and hence even in the absence of climate changesuch policies would provide benefit to future generations(Pernetta and Elder, 1992, 1993).
III. Future Research and Technological Needs for Impact Assessments and Adaptations:
Since the available data for the marine livingecosystems with reference to the climate change is patchy,incomplete and irrelevant, it is necessary to freshly identifythe sites along the coasts, parameters to be studied,frequency of observations, methodologies etc. for studyingthe impact on different marine ecosystems.
Taking into consideration different geomorphology,tidal patterns, climate, precipitation, coastal processes alongthe Indian coast, perhaps following sites, which representabove mentioned criterion, can be identified for short termand long term monitoring.
I. Minicoy Island, Lakshadweep – Low elevation, norivers, rich in corals, algae, seagrasses rich in marinebiodiversity.
II. Beyt Shankhodhar (Near Okha) Gujarat – Scantyrainfall, extreme climate, tidal bore, strong currents, highsedimentation.
III. Gangetic Sunderbans delta – World famous deltaicmangroves in river Ganga.
IV. Gulf of Mannar – Southern most tip of India, verylow tidal regime, influenced by Indian ocean, rich inbiodiversity
Perhaps the most important information needed forestimating the impact of the climate change on marineecosystems would be on :
- Climatic changes (Temperature, Precipitation)
- Relative Sea level changes
- Salinity, Nutrients
- Biological impact
- Interaction with human pressure
- Overall impact at the ecosystem level
It is also observed that the rapid changes due to

29
International Conference on Ecosystem Services of Wetlands - ‘Ardrabhumi :2016’ISBN : 978-81-923628-3-0
industrialization, deforestation, reclamation and pollutionare also responsible for the changes in the coastal zones. Itwould be essential to differentiate between the manmadeand natural changes influencing the marine ecosystem.Only then, it would be possible to take the remedialmeasures.
IV. Conclusions :
1. The marine ecosystems are living and grow at somedefinite rate under given optimum environmentalconditions in the coastal region.
2. The climate change is likely to influence the atmosphereand sea temperature, cyclones, precipitation, floods,coastal erosion and accresion, sea level rise and thechanges in the marine environmental conditions.
3. At the same time the manmade changes in the upstreamand the coastal areas like deforestation, reclamation,pollution, extensive human habitation in the coastalregion and its alteration have already created someunwanted environmental imbalance, which have startedshowing their effects and in future scenarios of furtherchange in the climate, it will have cumulative impact.
4. There are different scenarios one can imagine as a resultof climate change. These may be of extreme, medium orlow impact because there are several factors andcomplicated interactions, which may or may not bevisualized as on today.
5. The existing levels of the sea in the coastal andestuarine areas are likely to shift gradually towards theland, particularly in the low lying areas, during the sealevel rise, giving enough time for the biologicalorganisms to prepare new habitats for their survival,hence minimum or no loss of biodiversity is predicted.
6. The marine biological diversity of the littoral region inthe tropics, is capable of tolerating temperaturevariations and hence normally these organisms may notbe affected much by minor change in water temperature.However, the subtidal and the planktonic organisms,corals and sensitive benthic forms might show theadverse impact resulting into mortality or bleaching.
7. Considering the worst scenario of extreme impact onthe coastal area, it is strongly recommended that thepresent CRZ rules of preserving 500 m region as NoDevelopment Zone (particularly the low lying area)should be adhered to strictly. Otherwise in due courseit would be a greatest socio-economic loss to thecountry.
8. All the marine ecosystems in the coastal areas shouldbe given top priority and preserved for posterarity.Shelter belt areas should be developed on sand dunes
and mangrove regions with appropriate density andwidth, supported by agro-forestry belt of enoughdimensions as a buffer zone.
9. Large scale afforestation programme should be takenup on war footing in all the catchment areas or watershedregions to minimize the erosion which increases thesiltation of estuaries and minimize the water carryingcapacity.
References :
Adams, G.A. and D.H. Wall (2000). Biodiversity above andbelow the surface of soils and sediments : Linkages andapplications for global change, Bioscience, 50 (12) : 1043 –1048.
Al Gore (1992). Earth in the Balance : Forging a New CommonPurpose, Viva Books Pvt. Ltd (Indian ed. ) 407 pp.
Annonymous (1992). ‘EARTH SUMMIT’92. The UnitedNation’s Conference on Environment and Development, Riode Janerio, 1992, (ed. J. Quarrie), The Regency Press Corpo.,London.
Bhatt, J.R. and Subodh K. Sharma (2002). Impacts of ClimateChange on India and Climate change related activities, In‘Climate Change in India : Issues concerns andopportunities’ (Edts. Shukla, Sharma and Ramana), TataMcGrow Hill Publ. Co., New Delhi, Chapter 4, 110-172.
Bakus, G.E. (1994). CORAL REEF ECOSYSTEMS, Oxfordand IBH Publishing Co. Pvt. Ltd., New Delhi, 232 pp.
Beardall, J. Beer, S. and Raven, J.A. (1998). Biodiversity ofmarine plants in an era of Climatic change : Some predictionsbased on physiological performance, Bot. Mar., 41(1): 113-123.
Bhattathiri, P.M.A. (1992). Primary production of tropicalmarine ecosystems, In ‘Ecology and Management’ (eds. K.P.Singh and J.P. Singh) Wiley Eastern Ltd., 269-276.
Bird, Eric, C.F. (1990). The effects of rising sea level on coastalenvironments. In ‘Sea Level Variation and its Impact onCoastal Environment’ (ed. G. Victor Rajamanickam) TamilUniversity, Thanjavur, 10-30.
Blasco, F. (1975). The Mangroves of India, French Inst.Pondicherry, Trav. Sec. Sci. Tech., 14 : 175 pp.
Caratini, C. (1992). Mangrove pollen in marine quaternarysediments : Marker of regional climate evolution and globaleuatatic sea level changes, Tropical Ecosystems : Ecologyand Management (eds. K.P. Singh and J.S. Singh), Delhi-India Willey Eastern, 349-357.
Chand Basha, S. (1992). Mangroves of Kerala – A fastdisappearing asset, Indian Forester, 175-189.

30
International Conference on Ecosystem Services of Wetlands - ‘Ardrabhumi :2016’ISBN : 978-81-923628-3-0
Chauhan, O.S.; A.S. Unnikrishnan; A.A.A. Menezes; T.G.Jagtap; J. Suneethi; R. Furtado and Supriya Naik (2003).Integrated studies to identify vulnerable Area and AdaptationMeasures for Sea Level Rise Along the Coast of India, NIOReport submitted to NATCOM Winrock, International, India,New Delhi, 84 pp.
Cutter, Susan L. (1994). Environmental Risks and Hazards,(eds.) Prentice – Hall of India Pvt. Ltd., New Delhi, 413 pp.
Desai, K. N. and A.G. Untawale (2002). SAND DUNEVEGETATION OF GOA : CONSERVATION ANDMANAGEMENT, Published by Bot. Soc. Goa, 101 pp.
Dwivedi, S.N. (1990). Biological investigations to understandand mitigate the effects of global warming and sea level rise,In ‘Sea Level Variation and its Impact on CoastalEnvironment (ed. Rajamanickam), 31-51.
Ellison, J.C. (1994). Climatic change and sea level rise impactson mangrove ecosystems, Impacts of Climatic Change onEcosystems and Species, Marine and Coastal Ecosystems,WWF for Nature, Gland (Switzerland), E.P.A., Washington,D.C. U.S.A. 11-30.
Falkowski, P.G. (2002). The ocean’s invisible forest, Sci.American, 287 (2) : 54-61.
Gauns, M.R.; Mohan Raju and M. Madhupratap (1996).Studies on the micro-zooplankton from the central andeastern Arabian Sea, Curr. Sci., 71 : 857 – 862.
Gornitz, V. (1990). Global coastal hazards from future sealevel rise, In ‘Sea Level Variation and Its Impacts on CoastalEnvironment’ (ed. G. Victor Rajamanickam), Tamil University,Thanjavur, 343-388.
Goes, J.I.; H. do R. Gomes; A. Gouveia; V.P. Devassy; A.H.Parulekar and L.V.G. Rao (1992). Satellite and ship studies ofphytoplankton along the West coast of India, In‘Oceanography of the Indian Ocean’ (ed. B.N. Desai) Oxfordand IBH Publi., 67-80.
Gopinathan, C.P. and R. Panigrahi (1983). Seaweed resourcesin mariculture potential of Andaman – Nicobar Islands, Anindicative survey, CMFRI Bull., 34 : 47-51.
Goswami, S.C. (1983). Zooplankton incidence in abnormallyhigh sea surface temperature in the eastern Arabian Sea,Indian J. Mar. Sci., 12 : 118-119.
Hofman, J.S. (1984). Estimates of future sea level rise (eds.M.C. Barth and J.G. Tirtus) In ‘Greenhouse Effect and SeaLevel Rise’, Van Nostrand Reinhold, New York, 79-103.
Hollingan, P.M. and H. de Boois (1993). Land OceanInteractions in the coastal zone (LOICZ), Science Plan, IGBPGlobal Change Report No. 25, International GeosphereBiosphere Programme, Stockholm.
Jagtap, T.G. (1987). Distribution of algae, seagrasses andcoral communities from Lakshadweep Islands, EasternArabian Sea, Indian, J. Mar. Sci., 16 : 256-460.
Jagtap, T.G. (1996). Some quantitative aspects of structuralcomponents of seagrass meadows from South east coast ofIndia, Bot. Mar., 39 : 39-45.
Jagtap, T.G.; Z.A. Ansari; C. L. Singh; F.B. Coutinho andD.M. Goidhane (2002). Vulnerable Forest Ecosystem andAdaptations Measures fro Climate Change : Status ofMangroves and Impact Assessment at the Selected siteAlong the West Coast of India, NIO Report submitted to M/s Winrock International India, New Delhi for NATCOMProject, 1-32 pp.
Kjerfve, B.; Michener, W.K. and L.R. Goudener (1994).Impacts of Climate change in estuary and deltaenvironments, In ‘Impacts of Climate Change on Ecosystemsand Species : Marine and Coastal Ecosystems, WWF forNature and EPA, Washington, D.C., Swedish Intern.Develop. Autho. Sto., 31-44.
Lie, U. (1990). Marine Living Resources : Science andManagement, paper prepared for an IOC Expert Group(quoted by Pernetta & Elder, 1993).
Mackas, D. L.; Thomson, R.E. and M. Galbraith (2001).Changes in the zooplankton community of the BritishColoumbia continental margin (1985-1999) and theircovariation with oceanographic conditions, Can. J. Fish.and Aquat. Sci., 58 (24) : 685 – 702.
Madhipratap, M; P. Haridas; Neelam Ramaiah and C.T.Achutankutty (1992). Zooplankton of south west coast ofIndia : Abundance, composition, temporal and spatialvariability in 1987, In ‘Oceanography of the Indian Ocean’(ed. B.N. Desai), Oxford & IBH Publi. 99-112.
Mahtab, F.U. (1991). Implications of global changes forBangladesh, In ‘Environmental Implications of GlobalChange’ IUCN, Gland, 69-92.
Mathauda, G.S. (1957). The mangroves of India, In ‘Proc. ofthe Mangrove Sympos. Calcutta, Govt. f India, Min. of Foodand Agri. 66-87.
Nigam, R. and N. Khare and R.R. Nair (1995). Foraminiferalevidences for 77 year cycles of draughts in India and itspossible modulation by the Gleissbey solar cycle, Jour. ofCoastal Res., 11 (4) : 1099-1107.
Nigam, R. and N. Khare (1999). Spatial and temporaldistribution of foraminifera in sediments of the Central WestCoast of India and use of their test morphologies for thereconstruction of Paleomonsoonal precipitation,micropaleanotology, 45 (3) ; 285-303.

31
International Conference on Ecosystem Services of Wetlands - ‘Ardrabhumi :2016’ISBN : 978-81-923628-3-0
Nigam, R. (2000). Foraminiferal studies from the West coastof India, Relevance to PAGES programme, Proc. PAGESWorkshop on South Asian Palaeo – environments (PW-SAP), 1-5.
Parulekar, A.H. (1981). Marine fauna of Malvan, Central Westcoast of India, Mahasagar, Bull. Natn. Inst. Oceanogr., 14(1) : 33-44.
Patel, M.I. (1988). Patchy corals of the Gulf of Kuchchh, In‘Proc. Sympo. on Endangered Mar. Animals and Mar. Parks,Mar. Biol. Asso. India, Cochin (ed. E.G. Silas), 411-423.
Pernetta, J.C. and Elder, D.L. (1992). Climate, Sea Level Riseand Coastal Zone : management and Planning for GlobalChnages, Oceans and Coastal Managements, 18 : 113-160.
Pernetta, J.C. and D. Elder (1993). Cross Sectoral, IntegratedCoastal Area Planning : Guidelines and Principles for CoastalArea Developments, A Marine Conservation andDevelopment Report, I.U.C.N. and WWF for Nature, Gland,Switzerland, 63 pp.
Pillai, C.S.G. (1983). The coral environs of Andaman andNicobar Islands with a check list of species, Bull. CentralMar. Fish. Res. Inst., 34 : 33-43.
Pillai, C.S.G. (1986). Recent corals from south-east coast ofIndia, ‘Recent Advances in Mar. Biol., Today & TomorrowPubl., New Delhi, 107-201.
Pillai, C.S.G. and Jasmine, S. 91989). The coral fauna ofLakshadweep Bull. Cent. Mar. Fish. Res. Inst., 43 : 179-195.
Postma, H, and Zijistra, J.J. (eds.), (1988). Ecosystems of theWorld, 27, Continental shelves, Elsevier, Amsterdam, 421pp.
Qureshi, J.M. (1957). Botanical Silvicultural features ofmangrove forest of Bombay State, in ‘Proc. of Sympo. Mangr.Forest, Calcutta, 20-26.
Radhakrishna, K.; P.M.A. Bhattathiri and V.P. Devassy (1978).Primary productivity of the Bay of Bengal during August –Sept. 1976, Indian J. Mar. Sci., 7 : 94-98.
Rajamanickam, G. Victor (1990). Sea Level Variations and ItsImpact on Coastal Environment (editor), Tamil University,Thanjavur, 443 pp.
Raper, S.C.B.; Warrier, J.A. and T.M.L. Wingley (1988). Globalsea level rise : Past and Future, Proc. SCOPE Workshop,Bangkok (Quoted by Bird, 1990).
Shukla, P.R.; Sharma, S.K. and P.V. Ramana (2002). CLIMATECHANGE AND INDIA : Issues Concerns and Opportunities(editors), Tata McGrow Hill, New Delhi, India, 317 pp.
Siddiquie, H.N. (1975). Submerged terraces in the LaccadiveIslands, India, Mar. Geol., 18 : M-95-M101.
Siddique, H.N. (1980). The ages of the storm beaches of theLakshadweep, Mar. Geo., 38 (4) : M11 – M21.
Sidhu, S.S. (1963). Studies on mangroves of India, EastGodavari Region, Indian Forester, 89 : 337-351.
Subbaramaiah, K; K. Ramarao and M.R.P. Nair (1979). Marinealgal resources of Lakshadweep, Intern. Sympo. Mar. Algaeof Indian Ocean Region, Bhavnagar.
Tikader, B. K. and A.K. Das (1985). Glimpses of Animal Lifeof Andaman and Nicobar Islands, Zoological Survey of India,Calcutta (Kolkata), 170 pp.
Umamaheswara Rao, M. (1972). Ecological observations onsome intertidal algae of Mandam coast, Proc. Indian. Natnl.Sci. Acad., 38 B : 298-307.
UNESCO (1992). Impacts of expected climate change onMangroves UNESCO – UNEP Task Team Report of the 1st
Meeting, Rio de Janerio, Rep. Mar. Sci., 61 : 25.
U.N. (1985). Estimates and projections of Urban, Rural andCity populations, 1950 - 2025, the 1982 Assessments U.N.,New York.
Untawale, A.G. (1980). Sand dune vegetation of India, In‘Protection and Control of Coastal Erosion in India (eds.Braun, P. and B.U. Nayak), Special Publication of NIO, DonaPaula, Goa, 120-134.
Untawale, A.G. (1987). Conservation of Indian Mangroves –A national perspective, Contribution in Marine Sciences,Dr. S.Z. Qasim Feliciation Volume, 85-104.
Untawale, A.G. and T.G., Jagtap (1984). Marine Macrophytesof Minicoy (Lakshadweep) Coral atoll of the Arabian Sea,Aquatic Bot., 19 : 97-103.
Untawale, A.G. (1985). Status of Mangroves in India – ACountry Report, In ‘Proc. Asian Symposium on MangroveEnvironment : Research and Management’ UNDP-UNESCOProject Phillipines, 57-74.
Untawale, Mukund G. (1990). Global environmentdegradation and international organizations, Intern. PoliticalSci. Review, Vol. II (3) : 371-383.
Untawale, A.G. and T.G. Jagtap, (1991). Floristic compositionof the deltaic regions of India, In ‘Quaternary Deltas of India’(ed. R. Vaidyanadan), Geological Soc. of India, Memoir 22,243 –263.
Untawale, A.G.; V.K. Dhargalkar and G.V. Deshmukhe (2000).Prioritization of potential sites for marine biodiversityconservation in India, In ‘Setting Biodiversity Conservation

32
International Conference on Ecosystem Services of Wetlands - ‘Ardrabhumi :2016’ISBN : 978-81-923628-3-0
Priorities For India’, (ed. Singh, Sastry, Mehta & Uppal),WWF for Nature India, Vol. 1, 104-130.
Untawale, A.G. (2001). A Study on the Current Status andPotential of Coastal Shelter Belts in Western Region,Publishers Agriculture Finance Corporation (NAEDB),Mumbai, 128 pp.
Vaidyanadhan, R.V. (1991). Quaternary Deltas of India,Publisher Geol. Soc. of India (eds.) 291 pp.
Wafar, M.V.M. (1986). Corals and Coral reefs of India, Proc.Indian Acad. Sci. (Animal Sci.), 19-43.
Wafar, M.V.M. (1988). Coral reef ecosystem of the Indianislands, In ‘Island Development Technology Options (ed.S.N. Dwivedi and P. Chaturvedi), IAAS Publi., 47-54.
Wafar, M.V.M. (1990). Global Warming and Coral reefs, In‘Sea Level Variation and its Impact on Coastal Environments(ed. G. Victor Rajamanickam), Tamil University, Thanjavur,411-437. Walther, G.R.; Post, E.; Convey, P.; Menzel, A.;Parmesan, C.; Beebee, J.J.C.; Framentin, J.M.; Hoegh-Guldberg, O. and Bairlein, F. (2002). Ecological responses torecent climate change, Nature, Vol. 416 (6879) : 389-395.
Wells, S.M. (1988). Coral Reefs of the World, Vol. II. IndianOcean Red Sea and Gulf, IUCN, 77-94.

33
International Conference on Ecosystem Services of Wetlands - ‘Ardrabhumi :2016’ISBN : 978-81-923628-3-0
Chemicals of emerging concern in hydrological systems of UNESCO WorldHeritage Sites in cluster countries: Are they really clustered?
B. Anjan Kumar PrustyEnvironmental Impact Assessment Division, Gujarat Institute of Desert Ecology
Post Box-83, Mundra Road, Opp. Changleswar Temple, Bhuj - 370001 (Gujarat), IndiaPh. +91-2832-235025 (O), +91-9409442622 (M)
E-mail: [email protected]
Highlights of the synthesis
This synthesis focuses on 12 UNESCO criteria X WorldHeritage Sites (WHS) of the SAARC region (clustercountries). The reported levels of pesticide residues andheavy metals in hydrological system (water) during 1987-2014 through published literature ascribes the accumulationtrends to distance, landscape and geography, and theirdeposition in certain geographic regions confirming longrange atmospheric transport theories. The clustering ofcountries w.r.t. chemical residues in hydrological systems,indeed, seemed to be confirming on habitat contiguity andgeographical similarity.
Key words: Agrochemicals, EDCs, heavy metals, pesticides,world heritage sites
Background
Ever-increasing anthropogenic influences on naturalsystems have been a matter of great concern across theglobe. This is a case of emerging concern in developingcountries for lack of implementation of various policies aslaid by relevant government departments. The chemicalgroups those find their ways into natural systems includingwetlands and other aquatic systems are both inorganic andorganic in nature, and are persistent in differentenvironmental compartments. The persistent inorganicpollutants (PIPs including many of heavy metals) andpersistent organic pollutants (POPs) are two such groupswhich cover most of the anthropogenic release from varioussources. These two groups of chemical residues are ofemerging concern for their ecological and health implicationsincluding disruption of endocrine functions in human beingand wildlife. POPs include pharmaceuticals, personal careproducts, antibiotics, prescription and non-prescriptiondrugs, steroids and hormones, pesticides, plasticizers,surfactants, and fire retardants. Major sources of thesechemicals include residential, agricultural and industrialactivities.
The use of chemical pesticides has provided a valuableaid to agricultural production, increasing crop protectionand yield. However, the discovery of pesticide residues invarious sections of the environment has raised seriousconcerns regarding their use; concerns which well-outweigh
the overall benefits derived from them. The demands by arapid population growth coupled with emerging challengesof achieving food grain self-sufficiency compelled Indianfarmers to opt for intensive farming practices includingsubstantial use of pesticides. An estimated more than 100,000tons of DDTs has been applied in India alone , primarily foragricultural use and malaria eradication programs, due totheir low cost and broad-spectrum toxicity, making themeffective in the control of pests and diseases. Toacknowledge the global issue of POPs and to protect humanand environmental health the UNEP Stockholm Conventionon POPs entered into force in 2001 regulating or banning apreliminary list of twelve chemicals (including PCBs, dioxinsand furans and a range of organochlorine pesticides OCPs)which fulfilled all the criteria of persistence, bioaccumulation,toxicity and potential for long range transport) setting thedefinition of POPs. In 2009 and 2012, ten new substanceswere added in the POP list (UNEP, 2003). The convention,ratified by India in 2006, established an obligation to takemeasures to eliminate and restrict the production and use ofPOPs.
Both PIPs and POPs are the pollutants of emergingconcern for their bioaccumulation properties, high toxicityand ubiquitous exposure. UNESCO World Heritage Sites(WHS, criteria X) are no exception to this. Agriculture beingthe predominant landuse in SAARC countries, agrochemicalresidues contaminates water systems apart from municipalwastewater. Consequentially, both heavy metals andpesticides, which resist biochemical and photochemicaldegradation, act as endocrine disruptors and undergo longrange atmospheric transport (LRAT), are found in variousecosystems. Recent reports revealed their higher levels inWHS suggesting a relook at conservation policies. Thus, acritical analysis on the reported levels of heavy metals andpesticides in the hydrological system from the UNESCOWHS in SAARC countries was made.
Approach
We collated the published and unpublished reportson heavy metals and pesticides in water from UNESCO WHSof SAARC region (during 1987-2014), i.e. India (7 sites),Bangladesh (1 site), Nepal (2 sites) and Sri Lanka (2 sites).Both online and offline sources were used. In cases of no

34
International Conference on Ecosystem Services of Wetlands - ‘Ardrabhumi :2016’ISBN : 978-81-923628-3-0
reports from WHS, reports from locations in proximity tothe WHS were considered to link with spatial and landscapetrend analysis. The collated information was segregated intoappropriate blocks for suitable temporal scale analysis. Dataon agrochemical use over different years supplemented theexisting knowledge on persistence of pesticide residues inthese regions.
Brief overview of analysis/results
Indian subcontinent is unarguably a hotspot of DDTand HCH contamination. This is of course due to the elevateduse of pesticidal POPs in agriculture carried out until recentyears. DDT and HCH were the major pesticides in UNESCOWHS (W) and in their surrounding areas (S). The observedorder was Manas Wildlife Sanctuary (S) > Kaziranga NationalPark (S) > Sunderban National Park (W) > Western Ghats(W) > Keoladeo National Park (W) > Sagarmatha NationalPark (W). Among the WHS, DDT (6.0 ng/l) and HCH(18.650 ng/l) levels in the Hooghly River in the Sunderbans-India exceeded USEPA guideline values. Both Keoladeo andSunderbans had higher levels of Cd, Cr, Cu, Mn, Ni, Pb andZn in water, with higher concentration in the later. Thehydrological characteristics (seasonal flow variation, damconstruction), influence the spatio-temporal distribution ofpesticides in river water. Unlike snow-fed rivers of NorthernIndia, low concentrations of pesticides were detected in therain-fed rivers of Western Ghats.
In Himalayan region (Chitwan and SagarmathaNational Park) trace levels of pesticides at high altitudes(4900-5300m) were reported. The presence of lightercompounds in traces confirms the LRAT hypothesis thatthey are prone to long range atmospheric transport. Scarcityof data on other POPs makes it challenging to assess theirnationwide human and environmental exposure. There arenonscientific reports of pesticide consumption in centralhighlands of Sri Lanka, but negligible scientific data records.One of the largest hotspots of birds in India, KNP has beenalso affected hugely by POPs and metals in its environmentdue to farming and municipal growth in surrounding areas.Numerous studies have been done mentioning the pollutantlevels in this park. Thus, there is an emergence of ageographic trend among these sites, which shows that deltaand river beds regions are more affected to pesticidetransport and accumulation than plains and the least affectedbeing inner mountains.
Conclusions and recommendations
This synthesis highlights the presence of heavy metalsand pesticides in waters in and around 12 UNESCO WHS ofSAARC region, reported over the span of three decades.Alarming levels of DDT and HCH could be a major concernfor ecosystem and human wellbeing. Though studies onhuman are done in regions of Nepal and Sunderbans, thereis a wide scope of study in other UNESCO heritage sites.Higher accumulation of pesticides and heavy metals inSunderbans necessitates a strict review of point and non-point source of influx into the WHS. Endocrine disruptingfunctions and human health implications of these chemicalsnecessitate a critical review of their use and/or release in thecatchment areas of WHS are undertaken.
The available data are highly fragmentary and typicallyrefer to rural or urban areas. Little information is availableon background environment contamination (e.g. remote andmountain areas) to be used for comparison term and tocompare the background levels with other geographiccontexts. Furthermore, except for few sites such as KNPand Sunderbans, not all the UNESCO Heritage sites ofconservation significance are studied for such chemicalresidues. Most of the findings are through academic attemptssuch as dissertations and thesis. However, owing to suchan alarming scenario, a consorted effort need to be initiatedby like-minded research and academic institutions tocomprehensively examine the situation in all the sites ofconservation significance including both World HeritagesSites and Ramsar Sites.
Acknowledgement
UNESCO-International Hydrological Programme hasprovided financial assistance to carry out this situationanalysis. My research group acknowledges all the authorsof published and unpublished research articles and reports,which formed the base for the current meta-analysis. I thankThe Director, GUIDE for all the required infrastructure andadministrative support. I am thankful to Dr (Mrs). M. K.Pejaver, Principal of B. N. Bandodkar College of Science;and Dr (Mrs). Poonam N. Kurve, Organizing Secretary,International Conference on Ecosystem Services ofWetlands “Ardrabhumi-2016” for extending an invitationto deliver a keynote address.

35
International Conference on Ecosystem Services of Wetlands - ‘Ardrabhumi :2016’ISBN : 978-81-923628-3-0
Wetlands, Ecosystems and Geographic Information Systems (GIS)
Amit A. KokjeSenior GIS Analyst, Auckland Transport
Auckland, New Zealand
When I was asked by the B.N. Bandodkar College toshare about my experience as a researcher in the field ofenvironmental studies, it was a tricky situation. I did notwanted to talk on the subject as I may not have the samelevel of expertise and experience as the target audience. ButI did not want to waste the opportunity to talk about thesubject or technique (of my expertise) with enormouspotential in the Wetland research and public interaction.Hence I decided to select a middle path, share somethingthat will integrate both, wetland studies and GIS.
When we talk about ecosystems, environment andecology, these elements have vast impact on oursurroundings and day to day living. Yet general public’sperception about ecological environments is somewhatneglected and ignored. One of the key factors for such lackof understanding is partially due to more conservativeapproach taken by researchers in studying and analyzingthe ecology and environment. A typical ecological studyincludes a study theme associated with the study area.Qualitative and quantitative readings are taken over a periodof time. Data is analyzed and discussed. At the end, the datais either presented in the form of a report, research paper ora document. Though such approach ensures a good qualityresearch, the information content of the study is often lostin the complex scientific terms, data tables and graphs.Ultimately fails to reach to the common people. As a result,public outreach is one of the major hurdles identified bymany environmental researchers across the globe to conveythe correct message in the correct language.
Over the last decade especially in the last few years anew technology “Location Analytics” is rapidly gaininginterest amongst the academics, researchers, activist andeven commercial sector. Also knows as GeographicInformation system (GIS) is a powerful platform to create,organize, analyse and present vast array of informationassociated with the given location.Theoretically anyinformation or data with suitable location references (forexample latitude and longitude coordinates) becomesgeographic information. As a result GIS systems can handlevast array of qualitative as well as quantitative information.Therefore, using GIS in environmental studies is rapidlygaining momentum in environmental studies community.Simultaneous developments in positioning and remotesensing technologies offering high quality multi-temporalinformation acquired from vantage point in space. Suchinformation combined with ground based observations is
proving extremely beneficial in collectively mapping,monitoring and analyzing multiple research locations overthe long period. Recent developments in web-basedmapping and mobile mapping revolutionized the wayinformation is generated and presented. Web based mappingapplications, capable of running on smart mobile deviceshave provided a solid platform to display and share theinformation in more user-friendly and interactive way. Webbased mapping also opened up a whole new dimension indata acquisition by means of crowed sourcing andcommunity based mapping.
From the Indian context, we accepted and joined theRAMSAR convention in 1982 and so far 26 Wetland sitesare declared as RAMSAR sites of ecological importance.Use of GIS and remotely sensed information in wetland andecosystem studies in India can be traced back to 90s. Thesestudies involved a broad spectrum of research objectivesuch as flood zonation mapping, water quality analysis andmodeling, Changes in river courses and habitat mapping.Despite such attempts, many of the studies are confined tothe academic and research establishments and institutesassociated with Indian Space Research Organisation andwith access to the geospatial information.
In the last few years however, after the digital andinternet revolution, it is now possible to access, use, shareand display the scientific data with a large pool of theindividuals with common interest. This technologicaladvancement put environmental studies such as wetlandresearch in a unique position to expose and outreach to thegreater part of the community. GIS techniques on the otherhand offer unique set of tools and interactive methods toanalyse, share and display the meaningful information. Anintegration of both environmental studies and GIS, I believewill be immensely beneficial.
An ideal solution or initiative for increasing the publicawareness about wetland and environmental issues wouldbe information sharing portal or repository such as EuropeanSpace Agency’s Glob Wetland Africa and Tiger Initiativefor wetlands in Africa, department of Conservation (NewZealand) Wetland Information Portal and National WetlandTrust, Wetland inventory US fisheries and Wildlifedepartment. Such platform will not only act as a tool foracademics, researchers and even individual and nonprofitgroups to access the scientific information, but also providea launch pad to share and interact the results.

36
International Conference on Ecosystem Services of Wetlands - ‘Ardrabhumi :2016’ISBN : 978-81-923628-3-0
Use of RTI and Conservation of wetlands
Stalin DayananadDirector- Vanashakti NGO
Wetlands are the least understood of ecosystems inour country. For a nation that seems to prefer ecologicallysensitive areas as the best site for constructions , this is notsurprising. What better commentary about this fact can oneoffer when we realise the fact that the term WETLANDShas appeared for the first time in a Government Resolution(GR) in 2013. This in response to a Public Interest Litigationfiled in the High Court of Bombay. The GR announced theformation of a “Wetland Committee” which would overseethe protection of Wetlands.
Considering the fact that the Ramsar convention wassigned by India almost four decades ago, and the state ofMaharashtra with its numerous rivers, lakes and hundredsof kilometers of coastline conveniently sat out theresponsibility for conserving wetlands. Some how the wordconserving got lost or misunderstood as Construction .
Brushing aside the celebrated ignorance of the Govtmachinery we now proceed to understand briefly whatWetlands mean. Wetlands as the term suggests are landsthat are wet. Wet all round the year or for sometime of theyear, just one requirement that the depth of the water shouldnot exceed 6 mtrs at all or anytime.
This amazing interface between land and the sea,between land and water is a thriving ecosystem. Providingcountless ecological services free of cost yet allowed todegrade and destruct. A few of the services are
• Building bridge between terrestrial and marineecosystem.
• Power house of beauty.
• Mitigate effect of pollution.
• Stabilising the coastline.
• Carbon sinks, filteration of pollutants.
• Providing nutrients, Medicinal value & Desalination.
• Sustaining life in unbelievable conditions like the Tigerand a whole lot of Terrestrial herbivores inside theSunderbans.
• Perfect feeding and congregation grounds for croresof wetland birds.
• Incredible carbon sequestration capacity (almost threetimes more).
• Provide Livelihood, firewood and also fodder for cattle.
• Prevent soil erosion and self- recharges itself twiceeveryday by tides.
And most importantly it is the fixed deposit for thewater crisis that is rapidly closing in. Wetlands are animportant avenue that will provide potable water for mankindin future.
Today, the question is not what Wetlands can do for usbut what we can do for wetlands. Despite being a state withover 3 lakh Sq km of land, the state Govt continues to plunderWetlands for causes that are completely unwanted. Forexample why should a SEZ come up on wetlands? Why notin Nagpur where the connectivity and need is more. A superhighway is already under construction to connect Mumbaiand Nagpur. What can be the justification of ruining thelivelihoods of coastal communities by destroying their fishinggrounds and villages? A self sustaining zero maintenanceecosystem deliberately being decimated for the greed of thosewho have no clue about ecology and forests.
The role of NGOs towards conservation of theseprecious resources is too important to be ignored. Giventhe ignorance and insensitivity levels of the Govt machinery,watchdogs and analytical imputs are vital. Ours was thefirst NGO in Maharashtra to engage in using the legalframework to aquire protection for Wetlands. The CRZnotification, The Wetland Rules 2010 , The EnvironmentProtection Act all provide for protection of the Wetlands. Aseries of RTIs were filed with various Govt departments andthe facts that were revealed in the replies was alarming.Over 500 cases of wetland destruction had been documentedofficially (countless unaccounted for). Not a SINGLE sitewas restored. Further more under the Wetland Rules 2010every state (Maharashtra included) was supposed to makea “Brief Document” which is basically an inventory of allthe Wetlands of the State. This exercise was to be completedin 2012. Let alone complete, the state Machinery did noteven know that the Wetland Rules 2010 had come into force.Fortunately the task is underway finally. The declaration ofthe Thane Creek as a Ramsar Site is another reason to beworried about the future of coastal wetlands in Maharashtra,Mumbai particularly. Despite having close to a million birds,close to a hundred species of birds, the site continues to bethe most “preferred location” for locating municipal wastedumping grounds. So much for fulfilling the obligationsunder the Ramsar Convention.
I hope that this congregation of people with variedstrengths and abilities will do what is the need for the hour.Put together a white paper on the “Conservation Strategy forWetlands” and push for it to be accepted before it is too late.

37
International Conference on Ecosystem Services of Wetlands - ‘Ardrabhumi :2016’ISBN : 978-81-923628-3-0
Degradation of Wetlands: Problem and Solutions
R. P. Athalye
Wetlands are along the banks of aquatic ecosystemsuch as Ponds, Lakes, Rivers, Creeks, Estuaries. They are atthe interface of water and land. They may be natural orartificial. Along creeks, estuaries and sea shores, they havetidal influence. The water level being shallow, the placesmay be marshy. Hence many times they are considered aswaste lands. Due to this approach the productivity of fisherythat they increase, and all other important services theygive get ignored. The wetlands all over the world face similarproblems causing their deterioration.
1. Reclamation and solid waste dumping
In most places wetlands are popular sites of solid wastedumping. Especially in cities, due to population growth andluxurious life style, lot of solid waste is generated which isinvariably dumped on the wetlands. Thus the wet, marshyarea gets converted to land which quickly gets occupied byslum huts or land mafias grab it for authorized orunauthorized constructions. This way the entire wetlandarea many times gets reclaimed. Earlier there were more than60 lakes in Thane city of which only 35 remain. All others areencroached and reclaimed. Thane Balkum road isconstructed by dumping solid wastes on the wetlands.Wetlands along Bhiwandi bypass road and those near Divastation are being reclaimed.
2. Pollution:
The second major problem the wetlands face is pollution.Actually the pollution occurs in the water body, which in turnaffects the wetland along the bank. For example rivers, creeksand estuaries are very popular locations for development ofindustries because the effluent released in them gets dilutedand transported downstream. In creeks and estuaries the tidalflow causes dilution and flushing of the effluents. Whereasin closed aquatic bodies such as lakes, ponds etc. the amountof water is limited and not flowing; so the effluents releasedremain stagnant and produce serious effects like fish kill etc.
The effluents are of two types i) Domestic effluents(sewage) and ii) Industrial effluents. The first one are rich inorganic matter , nutrients and floating suspended solids, thesecond may have various chemicals, metals, pesticides,petrochemicals etc. Usually when the industrialization occursalong the rivers, creeks, estuaries, it subsequently leads tourbanization. Thus there occurs pollution by both Domesticeffluents and industrial effluents. The Thane creek, Ulhasriver estuary, many big and small rivers all over India and alsomany creeks and estuaries are facing the same problems.
In past few decades due to the above anthropogenicactivities. The Thane creek has got significantly degraded.The studies on Thane creek since 1982 at B.N. BandodkarCollege of science Thane, show following significantchanges.
1. Significant decline in Dissolved Oxygen. Average D.O.is observed to be less than 2.5 mg/l. In recent studyslight improvement has been observed.
2. Heavy siltation.
Before 1990 - Silt 25% clay 65%
After 1990 - Silt 65% clay 25%
As indicated above increased silt has caused sinkingmud flats unfavorable for fish/prawn breeding and alsofor burrows of mudskipper, eliminating them from thecreek.
3. Increased Nutrients, the phosphates, nitrates andsilicates. This has led to eutrophication in the creek.
4. Increased metals in water, sediment and organisms atall the trophic levels.
5. Changed benthic fauna. This has resulted due tochanging composition of sediment and pollution.
6. Declined Fishery (Both fin and shell fishery havedeclined very significantly).
The same is the story of many wetlands and aquaticbodies all over India. This is the major reason for decliningfishery in the seas and oceans.
Remedial measures:
In the Indian scenario actually the things that arelacking are sincere concern of people for environment andthe political will to implement the remedial measures. Forconserving the wetlands in fact, each and every personneeds to be honest and disciplined.
We should be disciplined in the solid wastemanagement. In every family, building, ward, the solid wasteshould be grouped in to i) wet garbage (degradable matter)and ii) Dry garbage (Non degradable matter). The wetgarbage should be composted and converted into fertilizerwhich can be used for gardening purpose or passed on tothe farmers. This, if done, will reduce at source, the solidwastes by 50%. The wet garbage can also be used forproducing biogas (B.A.R.C. Mumbai has developed suchbiogas units).

38
International Conference on Ecosystem Services of Wetlands - ‘Ardrabhumi :2016’ISBN : 978-81-923628-3-0
The dry garbage should be sorted in to plastic, glass,tin, papers etc. and can be given for recycling. The MunicipalCorporations must provide facilities for recycling of thesesolid wastes on priority basis.
In this manner if solid waste are taken care at source,the problem caused by dumping can be avoided orminimized.
In same manner we should try to reduce sewage atsource. This can be done by processing the sewage in septictanks. Readymade septic tanks can be made available tobuildings and societies. At IIT Mumbai Dr. Shyam Asolekarhas developed an artificial wetland system in which sewagecan be released and treated. The overflow of this treatmentsystem can be connected to common drainage.
Even if we do the above two things honestly andwith discipline in the execution, the problem of pollution ofrivers, creeks, estuaries, mangroves and wetlands will besolved to a great extent.
We should be honest at community level. Theindustries and factories, colleges, research labs should treatthe effluents with sincere honesty and should release, onlyafter the toxicants are removed. To construct huge sewagetreatment plants and common effluent treatment plant ca
not be the final solution. Everyone trying to reduce thepollutants at source is the only “Best option!”.
Many times the rules and regulations are on papers;the procedures to be followed are well decided and known;but honest implementation is lacking. For example whenevera construction of building is under process, methods ofpreventing silt to get washed from the location are knownbut are not implemented. In case of construction of bridgeon river, creek etc. care can be taken to avoid blockage ofwater channels. But because honest implementation is notdone the environmental damage occurs. Many times thedamage is irreversible.
Thus, a time has come that we all must understandthat” There are no short cuts to good and healthyenvironment.” Each and everyone in the country needs tobe educated and made aware about the dos and don’ts.Each and every individual needs to be motivated for theenvironmental cause. It is not impossible. Just as in 1942“Quit India movement” spread rapidly all over India, a daywill come when all of us will have concern for ourenvironment. This not only will prevent degradation ofwetlands but also the other wonderful treasures of the nature.Till then we must try to educate as many people as we canand wait for the results patiently.

39
International Conference on Ecosystem Services of Wetlands - ‘Ardrabhumi :2016’ISBN : 978-81-923628-3-0
A Participatory Natural Resource Management Program from theSubterranean Wetlands Ecosystem in Andaman and Nicobar Islands
Manchi Shirish S.Sálim Ali Centre for Ornithology and Natural History, Coimbatore
At the Sixth Conference of the Contracting Parties tothe Convention on Wetlands (Ramsar, Iran, 1971), the Partiesagreed to include subterranean wetlands as a wetland typeunder the Ramsar Wetland Classification System. Thisagreement recognised that some subterranean cave andkarst systems provide natural underground wetlands andconstitute a resource of ecological, cultural, scientific,aesthetic and recreational value, providing an environmentfor specialist vertebrate and invertebrate species. It alsorecognised the importance of such areas as groundwatersources for some arid areas. Subterranean wetlands are theunderground areas containing water (including ice caves).
The most prominent subterranean wetlands occur incave and karst areas. Cave Groundwater DependentEcosystems (GDEs) are ecosystems which need access togroundwater on a permanent or intermittent basis to meetall or some of their water requirements so as to maintaintheir communities of plants and animals, ecologicalprocesses and ecosystem services. Cave GDEs are cavesdependent on the subterranean presence of groundwater.Cave GDEs may be indicated by high moisture levels and/orthe presence of stygofauna.
Subterranean fauna usually known as troglodytewhich includes stygofauna (stygobite) or troglofauna(troglobite). Stygofauna refers to all aquatic fauna ingroundwater. Stygofauna can be classified depending onhow much of the life cycle is dependent on groundwater.Troglofauna are terrestrial, air-breathing fauna that doesnot rely directly on groundwater, although groundwaterprovides them with a humid environment and carries foodfrom the surface. Troglofauna are divided into threecategories, troglophiles, trogloxenes and troglobites, basedon their life-history. A trogloxene is an animal that uses cavesfor shelter but does not complete its life cycle in them (e.g.Bats and birds like the Edible-nest Swiftlets).
The term “swiftlet” is applied to a mixed group of small-sized swifts (Apodidae) of the Indo-Pacific region of theworld, all of which characteristically roost and nest in cavesor cavern-like situations. Swiftlets are easily confused withother similar-looking birds, such as the swallows or theSwifts. Swiftlets perch nowhere other than rock faces, theirbreeding or roosting sites. They feed entirely on small aerialinsects, which they track and catch in flight. They also drinkon the wing by gliding down, and skimming skilfully over awater surface, dipping the open bill to sip up a drop. There
is even evidence that they can sleep on while flying, andalso copulate on the wing on the nest, or beside it, clingingto the cave wall.
The swiftlets range from the western Indian Oceanthrough southern continental Asia, Indonesia, northernAustralia and New Guinea to islands of the west and southPacific. India has four species of Swiftlets distributed in itsterritory. The Indian Edible-nest Swiftlet Aerodramusunicolor is endemic to the Western Ghats and Sri Lanka.Himalayan Swiftlet Aerodramus brevirostris is found in theNorth-eastern region of India and may be is a migrant to theNorthern parts of Andaman and Nicobar Islands. The GlossySwiftlet Collocalia esculenta affinis, the endemicsubspecies, is found commonly in the Andaman and NicobarIslands. The last and the most important species found inIndia, the Edible-nest Swiftlet Aerodramus fuciphagusinexpectatus is a subspecies endemic to the Andaman andNicobar Islands and widely distributed.
Like other members of Apodidae, Swiftlets constructnests by using saliva, as the cementing substance to bindthe nest materials together. Some species of Swiftletsproduce the nests using a considerable amount of the salivain their nests which is consumed by human populations.The nest is called the edible nest, and the producer is famousas the Edible-nest Swiftlet. Out of total sixteen species ofSwiftlets three make edible nests. The Edible-nest SwiftletsAerodramus fuciphagus exclusively uses saliva which givesit the off-white, opaque appearance and is therefore alsocalled as the White Nest Swiftlet. The Indian Edible-nestSwiftlet Aerodramus unicolor and the Black-nest SwiftletAerodramus maxima, use saliva to bind their feathers andare called Black Nest Swiftlets since the admixture of feathers,and other material gives the nest a black or dark colouredappearance.
In the 16th century these nests, popularly known asthe bird’s nest, became an important part of Chinese cuisineand pharmacy and is believed to have several medicinalproperties, including that of prolonging and rejuvenatinglife, and as a powerful aphrodisiac. By the end of the 18th-century collection of the edible nest had become widespreadthroughout its range. Considered as food for kings, the nestsof the Edible-nest Swiftlet rank amongst the world’s mostexpensive animal products. While unrestricted andenormous nest collection across its range, coupled withlarge-scale deforestation that affected habitats over which

40
International Conference on Ecosystem Services of Wetlands - ‘Ardrabhumi :2016’ISBN : 978-81-923628-3-0
swiftlets forage, resulted in widespread and alarmingdeclines in population. Nest collection in the Andaman andNicobar Islands started in the 18th century. While localconsumption of the nests is insignificant, internationaldemand led to widespread and disobedient nest collectionin these islands leading to severe declines in population.
The on-going program to conserve the Edible-nestSwiftlet in the Andaman & Nicobar Islands commenced in1995, by the Department of Environment and Forests,Andaman & Nicobar Islands and SACON. Based on earlierand ongoing research empirical data collected since the year1995 by SACON, it is clear that the conservation of theEdible-nest Swiftlet can only be achieved when economicbenefits accrue to nest collectors in particular and localpeople in general. The Department of Environment &Forests, Andaman & Nicobar Islands, and SACONrecognise and firmly believe that the only way to conservethe Edible-nest Swiftlet in the Andaman & Nicobar Islandsis by way of a participatory approach. Whereby involvementof the nest collectors is intrinsic, and the pivot to, effectiveconservation and management of the species in wild as wellas by the development of house ranching.
The strategy that has therefore been evolved toconserve the Edible-nest Swiftlet in these islands includesboth in-situ conservation within caves as well as ex-situconservation through house ranching. State WildlifeAdvisory Board, the Planning Commission, by the Hon’bleSupreme Court of India, as well several scientific andconservation organisations endorsed this strategy.
The Edible-nest Swiftlet was inadvertently placed inthe Schedule - I, of the Indian Wildlife (Protection) Act in2003, and representation was made to the Ministry ofEnvironment, Forest and Climate Change (then known asMinistry of Environment and Forests) to de-list the species.Finally, after six years during 2009 the National WildlifeBoard, looking at the progress of the conservation program,
approved delisting of the species from the Schedule - I ofWildlife (Protection) Act, 1972, on a conditional basis forthree years.
Between 1999 and 2007, the Department ofEnvironment and Forests, Andaman & Nicobar Island andthe Sálim Ali Centre for Ornithology and Natural History,have been implementing an innovative participatory programto conserve swiftlets. The program has resulted in significantgrowth in population as well as in establishing a populationof Edible-nest Swiftlet in a house, as a precursor towidespread house ranching. The program has completedtwo R & D phases. The scientific ecological studies on thespecies have formed a cornerstone of the conservationprogramme, and the information collected on the nesting,roosting and foraging habitat requirements, breedingseasonality and biology, population growth and dispersalpatterns of the species has helped significantly in makingdecisions.
The basis for this participatory program has been theeconomic benefits that will accrue from scientificallymanaged harvesting systems as well as the growth of thepopulation of swiftlets leading to further economic benefit.So far the conservation program at select cave sites hasresulted in more than the three-fold increase in population,and a population of the Edible-nest Swiftlet has also beenestablished in a house. Based on the detailedunderstanding, ethics and progress of the program andrecommendations from the National Wildlife Board theEdible-nest Swiftlet was finally removed from the Schedulesof the Wildlife Protection Act during December 2013.
Presently, the program is in a process of improvingthe ex-situ conservation strategies through requiredresearch efforts and simultaneously, implementing theAccess Benefit Sharing system according to the NationalBiodiversity Authority guidelines towards equitable benefitssharing among the stakeholders involved in the program.

41
International Conference on Ecosystem Services of Wetlands - ‘Ardrabhumi :2016’ISBN : 978-81-923628-3-0
Section IIResearch Papers

42
International Conference on Ecosystem Services of Wetlands - ‘Ardrabhumi :2016’ISBN : 978-81-923628-3-0

43
International Conference on Ecosystem Services of Wetlands - ‘Ardrabhumi :2016’ISBN : 978-81-923628-3-0
Remedial Connotation of Pongamia pinnata for Antidiabetic Therapy
*Morajkar A. S., Hardikar B. P., Sharma B. B.Department of Zoology, KET”S V. G. Vaze college, University of Mumbai, Mulund 400081, Mumbai, India
Department of Pharmacology, SaraswatiVidyabhavan College of Pharmacy,Dombivali, Thane, IndiaCorresponding Author Email:[email protected]
Abstract : India has a wealth of wetland ecosystems that support diverse and unique habitats. These wetlands providenumerous ecological goods and services but are under tremendous stress due to rapid urbanization, industrialization, andagricultural intensification, manifested by the shrinkage in their areal extent, and decline in the hydrological, economic, andecological functions they perform. Palustarine is one of the systems used for classifying wetland which involves (‘marshy’–marshes, swamps and bogs) based on their hydrological, ecological and geological characteristics.Pongamiapinnata is one ofthe main species found in swamp forest known for flood tolerant species and can survive in submerged condition for extendedperiod of time. Use of herbal medicines has always been an option to treat a great number of diseases such as cancer, diabetesand its complications. In the present investigation Pongamiapinnata crude extracts were studied for its hypoglycemic effectsand phytochemical investigation was further carried out to know group of chemicals most responsible for activity. The resultssuggested that crude extracts of Pongamia pinnata stem possesses antihyperglycemic activity in Alloxan induced diabetic rats.Alcoholic extract proved to be more effective than aqueous extract as it contains more phytochemicals with higher concentration.
Keywords:-Swamp forest, Pongamia pinnata, Hypoglycemic, Phytochemical,
Introduction:
Wetlands are amongst the most productiveecosystems on the Earth (Ghermandi et al., 2008),and providemany important services to human society (ten Brink et al.,2012). However, they arealso ecologically sensitive andadaptive systems (Turner et al., 2000). Wetlands exhibitenormous diversity according to their genesis, geographicallocation, water regime and chemistry, dominant species, andsoil and sediment characteristics (Space Applications Centre,2011). Last few decades “Scientists and Researchers” havebeen very much interested in natural products all over theworld and a large number of substantiation has shown theimmense potential of medicinal plants used traditionally(Habib M. Y., 2005)Though different types of oralhypoglycemic agents are available for the treatment ofdiabetes mellitus, there is increasing demand by patients touse antidiabetic natural products because of the undesirableside effects of the existing drugs (Zhou et al., 2012) after all,many of the currently available drugs have been deriveddirectly or indirectly from plants (Patel et al., 2010). Inaddition, herbal remedies continue to be more accessibleand affordable than conventional drugs and represent thefirst line of treatment available for many of the world’spopulation (Okpara et al., 2007). Pongamia pinnata (Linn)Pierre popularly known as ‘Pongam’ in Tamil and Karanja inHindi. It is widely distributed throughout tropical Asiaandthe Seychelles Islands, South Eastern Asia,Australia,India and locally distributed throughout the StateofMaharashtra (India) along the banks of rivers;verycommon near the sea-coast in tidal and beach-forestsinKonkan; along Deccan rivers. (Prajapati N. S., 2003)Theattributed antihyperglycemic effects of these plants is dueto their ability to restore the function of pancreatic tissues
by causing an increase in insulin output or inhibit theintestinal absorption of glucose or to the facilitation ofmetabolites in insulin dependent processes. Hencetreatment with herbal drugs has an effect on protecting â-cells and smoothing out fluctuation in glucose levels. Mostof these plants have been found to contain substances likeglycosides, alkaloids, terpenoids and flavonoids etc. thatare frequently implicated as having antidiabetic effects (D.Loew et al., 2002). In the present investigation, the extractof traditional medicinal plant Pongamia pinnata wasselected to study its antihyperglycemic effect and thecompounds responsible for it.
Materials And Method
Plant Material:-
Fresh stem branches of Pongamia pinnata werecollected from the local areas, Maharashatra district,Mumbai, India. The plant was identified and authenticatedby Blatter herbarium Department of Botany, St. Xavier’sCollege, Mumbai.
Preparations of plant extracts.-
The plant stem branches were shade dried at roomtemperature (32 ± 2ºC) and the dried branches were groundinto fine powder using pulverizer. 50gm of powder crudeextract was prepared in 250ml ethanol as well as DistilledWater using soxhlet apparatus for 6 to 7 cycles. Each time theextracts was dried using vacuum evaporator and stored at 4ºcto maintain standard quality throughout the period of study.
Animals
Healthy Adult cross breed of male albino rats(Weighing = 250-300g) were used throughout the study for
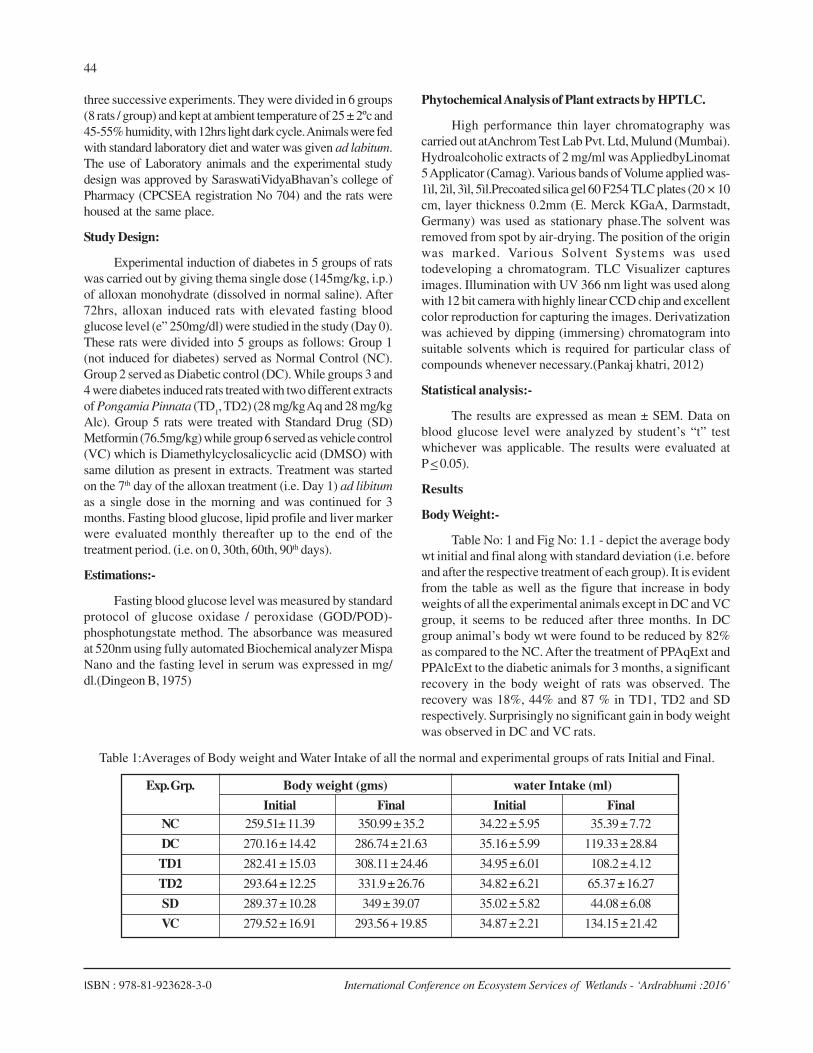
44
International Conference on Ecosystem Services of Wetlands - ‘Ardrabhumi :2016’ISBN : 978-81-923628-3-0
three successive experiments. They were divided in 6 groups(8 rats / group) and kept at ambient temperature of 25 ± 2ºc and45-55% humidity, with 12hrs light dark cycle. Animals were fedwith standard laboratory diet and water was given ad labitum.The use of Laboratory animals and the experimental studydesign was approved by SaraswatiVidyaBhavan’s college ofPharmacy (CPCSEA registration No 704) and the rats werehoused at the same place.
Study Design:
Experimental induction of diabetes in 5 groups of ratswas carried out by giving thema single dose (145mg/kg, i.p.)of alloxan monohydrate (dissolved in normal saline). After72hrs, alloxan induced rats with elevated fasting bloodglucose level (e” 250mg/dl) were studied in the study (Day 0).These rats were divided into 5 groups as follows: Group 1(not induced for diabetes) served as Normal Control (NC).Group 2 served as Diabetic control (DC). While groups 3 and4 were diabetes induced rats treated with two different extractsof Pongamia Pinnata (TD
1, TD2) (28 mg/kg Aq and 28 mg/kg
Alc). Group 5 rats were treated with Standard Drug (SD)Metformin (76.5mg/kg) while group 6 served as vehicle control(VC) which is Diamethylcyclosalicyclic acid (DMSO) withsame dilution as present in extracts. Treatment was startedon the 7th day of the alloxan treatment (i.e. Day 1) ad libitumas a single dose in the morning and was continued for 3months. Fasting blood glucose, lipid profile and liver markerwere evaluated monthly thereafter up to the end of thetreatment period. (i.e. on 0, 30th, 60th, 90th days).
Estimations:-
Fasting blood glucose level was measured by standardprotocol of glucose oxidase / peroxidase (GOD/POD)-phosphotungstate method. The absorbance was measuredat 520nm using fully automated Biochemical analyzer MispaNano and the fasting level in serum was expressed in mg/dl.(Dingeon B, 1975)
Phytochemical Analysis of Plant extracts by HPTLC.
High performance thin layer chromatography wascarried out atAnchrom Test Lab Pvt. Ltd, Mulund (Mumbai).Hydroalcoholic extracts of 2 mg/ml was AppliedbyLinomat5 Applicator (Camag). Various bands of Volume applied was-1ìl, 2ìl, 3ìl, 5ìl.Precoated silica gel 60 F254 TLC plates (20 × 10cm, layer thickness 0.2mm (E. Merck KGaA, Darmstadt,Germany) was used as stationary phase.The solvent wasremoved from spot by air-drying. The position of the originwas marked. Various Solvent Systems was usedtodeveloping a chromatogram. TLC Visualizer capturesimages. Illumination with UV 366 nm light was used alongwith 12 bit camera with highly linear CCD chip and excellentcolor reproduction for capturing the images. Derivatizationwas achieved by dipping (immersing) chromatogram intosuitable solvents which is required for particular class ofcompounds whenever necessary.(Pankaj khatri, 2012)
Statistical analysis:-
The results are expressed as mean ± SEM. Data onblood glucose level were analyzed by student’s “t” testwhichever was applicable. The results were evaluated atP 0.05).
Results
Body Weight:-
Table No: 1 and Fig No: 1.1 - depict the average bodywt initial and final along with standard deviation (i.e. beforeand after the respective treatment of each group). It is evidentfrom the table as well as the figure that increase in bodyweights of all the experimental animals except in DC and VCgroup, it seems to be reduced after three months. In DCgroup animal’s body wt were found to be reduced by 82%as compared to the NC. After the treatment of PPAqExt andPPAlcExt to the diabetic animals for 3 months, a significantrecovery in the body weight of rats was observed. Therecovery was 18%, 44% and 87 % in TD1, TD2 and SDrespectively. Surprisingly no significant gain in body weightwas observed in DC and VC rats.
Table 1:Averages of Body weight and Water Intake of all the normal and experimental groups of rats Initial and Final.
Exp. Grp. Body weight (gms) water Intake (ml)
Initial Final Initial FinalNC 259.51± 11.39 350.99 ± 35.2 34.22 ± 5.95 35.39 ± 7.72
DC 270.16 ± 14.42 286.74 ± 21.63 35.16 ± 5.99 119.33 ± 28.84
TD1 282.41 ± 15.03 308.11 ± 24.46 34.95 ± 6.01 108.2 ± 4.12
TD2 293.64 ± 12.25 331.9 ± 26.76 34.82 ± 6.21 65.37 ± 16.27
SD 289.37 ± 10.28 349 ± 39.07 35.02 ± 5.82 44.08 ± 6.08
VC 279.52 ± 16.91 293.56 + 19.85 34.87 ± 2.21 134.15 ± 21.42

45
International Conference on Ecosystem Services of Wetlands - ‘Ardrabhumi :2016’ISBN : 978-81-923628-3-0
0
20
40
60
80
100
120
140
160
180
NC DC TD1 TD2 SD VC
Wat
er in
take
in
ml
Experimental group
Water Intake (ml)Avarage water intake initialAvarage water intake final
Fig No:- 1.2
Figure 1.1 & 1.2: Differences of Body Weight & Water Intake after three month.
Water Intake: As depicted in table No: 1 and fig. No:1.2 a steady increase in the water intake was observed in theAlloxan-treated rats (DC) which was significant after the 1nd
week of alloxan treatment with respect to untreated controland continues up to the end of the treatment (Three months)(88%). Similarly significant increase in water intake wasobserved in VC rats. After the treatment of aqueous (TD1)and alcoholic extracts (TD2) to the diabetic animals for 3
months, a decrease in the water intake of rats was observed.(I.e. 29% and 50%) It was observed that PPAlcExt showssignificant decrease in water intake as compared to PPAqEXtwhich is almost closer to standard drug Metformin (76%).The gradual decrease in both the treatment group(TD1)(TD2) shows that one of the symptoms of diabetes ismaking thirsty is gradually decreasing due to decrease insugar level or having good control over sugar level.
Table 2: Blood sugar fasting values of normal and experimental groups at the end of each month(of all three experiments) in mg/dl.
Exp.Grp Preinduction Induction 1st Month 2nd Month 3rd Month
NC 68.64 ± 2.71 85.07 ± 2.13 52.46 ± 12.16 75.54 ± 12.46 89.65 ± 9.22
DC 76.97 ± 2.54 506.4 ± 10.95 331.49 ± 30.76 348.66 ± 49.51 339.28 ± 112.24
TD1 71.15 ± 4.45 399.86 ± 2.3 240.08 ± 59.76* 223.14 ± 55.97* 191.13 ± 34.71**
TD2 76.35 ± 4.59 467.4 ± 52.44 96.2 ± 41.2** 113 ± 22.44** 89.03 ± 8.4**
SD 79.2 ± 5.23 506.37 ± 72.52 100.27 ±10.87** 85.53 ± 3.83** 73.32 ± 5.66**
VC 80.75 ± 1.9 458.1 ± 59.85 341.1 ± 58.4 330.88 ± 77.51 324.6 ± 65.53
Data are expressed as Mean ± SD, n = 18. ANOVA followed by multiple comparison two tail “t” Test.** P < 0.01 highly significant as compared treatment with Disease Control.
* P < 0.05 Significant as compared treatment with Disease Control.
0
100
200
300
400
500
600
Preinduction Induction 1st Month 2nd Month 3rd Month
mg/
dl
BSF NC
DC
TD1
TD2
SD
VC
Fig No:- 2
Figure 2: Comparative Blood Sugar fasting activities of each group for three Months.

46
International Conference on Ecosystem Services of Wetlands - ‘Ardrabhumi :2016’ISBN : 978-81-923628-3-0
Table No: 2 and fig 2 shows that before inducingdiabetes all the values of Blood sugar fasting (BSF) were innormal range between 68.6 ± 2.21 up to 80.75 ± 1.9. Afterinducing diabetes with Alloxan the values reached theirpeaks except in Normal Control (NC) and the values arebetween 399.86 ± 2.3 up to 506.4 ± 10.95. In Disease Controlrats (DC) BSF level remained on higher side more than 300mg/dl. Treatment with both the doses of Pongamia pinnataAqueous extract (PPAqExt) and Pongamia PinnataAlcoholic extract (PPAlcExt) produced reduction in the bloodglucose level and the values were 240 ± 9.76, 223.13 ±5.97,191.13 ± 4.71 for Aqueous extract and 96.2 ± 41.2, 113 ± 22.4,89.03 ± 8.4 for Alcoholic extract respectively. Highlysignificant reduction was achieved with the alcoholic extract(P< 0.005). Whereas in Standard drug (SD) Metformin theBSF values are 100.27 ± 0.87, 82.52 ± 3.83, 73.31 ± 5.66. Whichshows that the PPExts treated group values are almost similarwhen compared to Metformin and rats reached towardsnormalcy.
Phytochemical investigation of Pongamia pinnata.
High performance thin layer chromatography showedpresence of different group of compounds in variedconcentration. Varied Solvent System usedand then TLCplate was developed in Pre-saturated Camag Twin TroughChamber. PPAqExt showed 76 compounds in comparisonwith PPAlcExt which showed 52 compounds. Both Aq andAlc Exts showed 43 common compounds. Numbers ofcompounds present in each group were listed below.
Table no: 3 Number of phytochemicals in each group.
Sr. No. Grp of PPAqExt PPAlcExt CommonCompounds
1. Alkaloides 02 12 012. Flavonoides 09 10 063. Glycosides 10 09 084. Saponins 04 06 035. Sterols 10 09 086. Tannins 07 10 077. Triterpenoides 10 11 10
Total 76 52 43
* Flavonoides Glycosides Saponins Sterols Tannins TriterpenoidesNote: * Due to low concentration of Alkaloides bands are not visible under scannerFig 3: Chromatogram of Aqueous Extract under CAMAG TLC scanner at 366nm

47
International Conference on Ecosystem Services of Wetlands - ‘Ardrabhumi :2016’ISBN : 978-81-923628-3-0
Alkaloides Flavonoides Glycosides Saponins Sterols Tannins Triterpenoides Fig 4: Chromatogram of Aqueous Extract under CAMAG TLC scanner at 366nm
Discussion
Natural products are always been wellspring of drugleads and drugs and most of them have evidences forantihyperglycemic potential which is given inAyurveda.There is no attempt to isolate the individualmolecules. Moreover, these formulations are not drugs, butrich herbal foods that are used as supplements to theeveryday diet, and said to produce overall health and well-being. Ayurveda asserts that the effectiveness of theseherbal formulations comes precisely from the richness oftheir mixtures. They are a deliberate attempt to maximizesynergistic action of entire plant part; so that thecomponents help each other to move through the digestivesystem, arrive at the correct cells, penetrate the cellmembranes and achieve intracellular effects and also inavoiding any untoward effects. (Siby C. D., 2004)Blood sugarlevel is a direct indicator of regulation of GlucoseHomeostasis. (Onoagbe I. O., 2010) Blood Glucose is a majorcarbohydrate present in the blood and serves as a primarysource of energy. It is usually obtained from ingested starchand sugar. The glucose concentration is normally,maintained at constant level. Tightly co-ordinated controlof both insulin action and secretion is required in order tomaintain glucose homeostasis. Gene knockout experimentshave helped to define key signaling molecules that affectinsulin action, including insulin and insulin-like growthfactor-1 (IGF-1) receptors, insulin receptor substrate (IRS)proteins and various downstream effector proteins. â-cellfunction is also a tightly regulated process, with numerousfactors(including certain signaling molecules) having an
impact on insulin production, insulin secretion and â-cellmass. While signaling molecules play important roles ininsulin action and secretion under normal circumstances,abnormal insulin signaling in muscle, adipose tissue, liverand pancreas leads to insulin resistance and â-celldysfunction. In particular, the signaling protein IRS-2 mayhave a central role in linking these abnormalities, althoughother factors are likely to be involved. (RhodesC. J.2002)Insulin is a major anabolic hormone in the body. Itsdeficiency not only affects glucose metabolism but alsoprotein and fat metabolism. Unopposed actions of thecounter-regulatory hormones also play an important role inmetabolic derangements. The normalization of carbohydrate,protein and fat metabolisms would reduce the diabeticsymptoms like loss of weight and fatigability. This wouldcertainly improve the quality of life of the individual. Thepresent investigation demonstrated that alloxan inducedsignificant decrease in body weight of rats in all the animals.Similar observations were observed in many experimentalstudies. (Zari and Al-attar, 2007) one of the parameters toconsider the amelioration of the diabetic state is to ascertainthe effect of treatment on the body weight. An increase inbody weight may implies that anabolic effect have overriddenthe catabolic ones rather decline the body weight whichultimately propose that catabolism is persisted resultinginto weight loss. Effect of certain plant products in bodyweight gain in diabetic state have been reported by (Stanleyet. al., 2000). Disturbance in the metabolisms results inwasting of muscles and early fatigability. Either a protection

48
International Conference on Ecosystem Services of Wetlands - ‘Ardrabhumi :2016’ISBN : 978-81-923628-3-0
against weight loss alone or an increase of body weight hastheir own distinctive role to play. In the present study, ratgroups treated with Pongamia pinnata stem extract waseffective in exerting protection against body weight loss. InPPAqExt treated rats showed 7.4% increased in body weightin PPAlcExt proved to be more effective increasing bodyweight by 15.7% whereas in Standard drug the effect was21.71% when compared with DC. The results are inaccordance with (Satav J. G., 2004) where they studied effectof STZ induced diabetes on oxidative energy in one weekstudy they reported that 26.5gm/kg loss in body weight DCrats which is 11% and after treatment with Insulin theincreased were 7.9 g/kg which is 3% as compared to NC.
Phytochemical screening by HPTLC analysis ofaqueous as well as ethanolic extracts of stem of Pongamiapinnata revealed the presence of various phytochemicalsin significant concentration. There is a dearth of reportsregarding the HPTLC profile of Pongamiapinnata.Alkaloids, Flavonoides, Glycosides, Saponins,Steroids, Tannins, and Triterpenoides. The results are inagreement with previous authors (Prabha T., 2009) theyreported only five peaks in HPTLC analysis whereas wereported ten peaks in ethanolic extract and seven peaks inaqueous extract although the concentration of each peak issignificantly higher as compared to other authors that ismay be most probable reason why our biochemical shows avery good reasons at lower concentration.
Conclusion
Treatment with PPExts proves stem possesantihypergycemic activity with varied chemical entityresulting into gradual decrease in hyperglycemic conditions.PPAlcExt is more efficient as it content a high amountofchemical constitutes than PPAqExt. Number of chemicalconstituent’s leads toan Ayurvedic avow where synergismbelieve that total effect is greater than individual’s effects.Since Pongamia pinnata found in swamp area of wetlandscould investigate further to be regular source of medicine.Plant proved to be have good potential for such type ofmetabolic diseases
References
Dingeon B, Ferry JP, Roullet A., (1975) Auto analysis ofblood sugar by Trinder’s method. Ann BiolClin.; 33:3-13.
Ghermandi, A., van den Bergh, J.C.J.M., Brander, L.M.,Nunes, P.A.L.D., (2008). The Economic Value of WetlandConservation andCreation: A Meta-Analysis. [WorkingPaper 79]. Fondazione Eni Enrico Mattei, Milan, Italy.
Habib M.Y., Islam MS, Awal MA, Khan MA., (2005) Herbalproducts: A Novel approach for Diabetic Patients, Pak JNurti, 4: 17-21.
Loew D., Kaszkin M., (2002). Approaching the problem ofbioequivalence of herbal medicinal products. Phytother Res,16, pp. 705 – 711 DOI: 10.1002/ptr.1248
Okpara J. O., Okpala E. J., Mamman M., Ayo J. O., Cole T. A.,(2007). Antidiarrhoeal activity of the ethanolic extract ofadansoniadigitata leaves. Vom. J. vet. Sci., 1(4): 8 – 13.
Onagbe I. O., Negbenebor E. O., Ogbeide V. O., Dawha I. H.,Attah V., Lau H.U., Omonkhua A. A., (2010). A study of theAnti-diabetic effects of Urenalobata andsphenostylisstenocarpa in streptozotocin-induced DiabeticRats, European Journal of Scientific Research 43: (1), PP.6 - 14.
Khatri P., R. Patel (2012) An phytochemical overview ofvarious parts of Pongamia pinnata. World journal ofpharmaceutical research, Vol 2, Issue 1, 146 - 165.
Patel D. K., Prasad S. K., Kumar R., (2012). Hemalatha S. Anoverview on antidiabetic medicinal plants having insulinmimetic property. Asian Pac J Trop Biomed, 2(4): 320 – 330doi:10.1016/S2221-1691(12)60032-X.
Prabha T., Dorababu M., Goel S., Agarwal P. K., Singh A.,Joshi V. K., Goal K. K. (2009) Effect of methanol extract ofPongamia pinnata Linn seed on gastro-duodenal ulcerationand mucoasal offensive factors in rats. Indian J. Exp. Biol,47, 649 - 659.
Prajapati N.S., Purohit S.S, Shara A.K. and KumarT., (2003)A Handbook of Medicinal plants, AgrobiosIndia, Jodhapur,418
Rhodes C. J., White M. F. (2002) Molecular insights intoinsulin action and secretion. European Journal of ClinicalInvestigation 32 (Suppl. 3), 3 – 13.
Satav J. G., Katyare S. S. (2004) Effect of streptozotocininduced diabetes on oxidative energy metabolism in rat livermitochondria – A comparative study of early and late effects.Indian journal of clinical biochemistry;19 (2) 23 - 31.
Siby C. D., (2004) Use of Herbs in Ayurveda. Ismile Jan/Feb,17 – 19
Space Applications Centre (SAC), (2011). National WetlandAtlas. SAC, Indian Space Research Organisation,Ahmedabad.Study Group on Environment, n.d. Report ofthe study group on environment including tourism, heritage,pollution & disastermanagement. New Delhi: NationalCapital Region Planning Board.
Stanley P., Prince M., Menon V. P., (2000) Hypoglycemicand other related actions of Tinosporacordifolia roots inalloxan induced diabetic rats. J. Ethnopahrmacol. 70, 9 - 15.
Ten Brink, P., Badura, T., Farmer, A., Russi, D., (2012). TheEconomics of Ecosystem and Biodiversity for Water and

49
International Conference on Ecosystem Services of Wetlands - ‘Ardrabhumi :2016’ISBN : 978-81-923628-3-0
Wetlands: ABriefing Note. Institute for EuropeanEnvironmental Policy, London.
Turner, R.K., van der Bergh, J.C.J.M., Soderqvist, T.,Barendregt, A., van der Straaten, J., Maltby, E., van Ierland,E.C., (2000). Ecological-economic analysis of wetlands:scientific integration for management and policy. Ecol. Econ.35 (1), 7–23.
Zari T. A.; Al-Attar A. M. (2007) Effects of ginger and cloveoils on some physiological parameters in streptozotocindiabetic and non diabetic rats. J. Med. Sci. 7, 267 - 275.
Zhou J. Y., Zhou S. W., Zeng S. Y., Zhou J. Y., Jiang M. J., HeY., (2012). Hypoglycemic and hypolipidemic effects ofethanolic extracts of Mirabilis jalapa L. root on normal anddiabetic mice. Evid based Complement alternat Med.2012:257374. doi: 10.1155/2012/257374. Epub 2012 Feb 27

50
International Conference on Ecosystem Services of Wetlands - ‘Ardrabhumi :2016’ISBN : 978-81-923628-3-0
A Note On Anthropogenic Activities On Wetlands In Sindhudurg District
Divya S.Sarang1, Sanjay Bhagwat², Amruta A. Shendge³Department of Zoology
Ramnarian Ruia College, Matunga, Mumbai.E-mail: [email protected] / [email protected] / [email protected]
Abstract: Sindhudurg district has been declared as tourism district on 30th April, 1997. The natural resources, coastallines, waterfalls, hot spring, temples, wildlife scenery are very important resources of tourist attraction. Sindhudurg isblessed with Mangrove and wetlands. Mangrove forests are very vital ecosystem as they provide support to a complexcommunity assemblage, reduce coastal erosion. Wetland provides a wide variety of human and ecosystem services. Theseinclude flood control, water filtration, reduction in erosion, and enhancement of biodiversity through provision of water, foodand habitat for planktons, rooted plants in water, nektons, benthos animals as well as human beings. The area of study is themost renowned wetlandin Sindhudurg – Nivti and Redi which are the best beaches in district and full of marine diversity.Tourism is considered to have good potential in Sindhudurg. Tourism development and tourist behavior may disturbwilderness and can lead to pollution. It is important to study the effects of anthropogenic activities of these wetlands.
Keywords: Wetlands,Sindhudurg, Anthropogenic activities, Conservation
Introduction
Sindhudurg -‘A land of natural beauty and culture’.Sindhudurg district is located on the west of India(Maharashtra).Tourism is considered to have good potentialin Sindhudurg. The district was declared as tourism districtby the Maharashtra government in 1997.The district hasbest beaches in the state, and the abundance of marinebiodiversity. The wetlands chosen by us for the study arethe most renowned areasin Sindhudurg – Nivti and Redicreek. Nivti is located at 16° N and 73.46° E. Nivti beach isfamous for its dolphin site. Commercially fishing is alsocarried out at Nivti beach. Stretches of white shining sandsvastness of blue sea can be seen. It is most attractive andpopular beach of Sindhudurg district. Nivti beach is 25kmaway from Vengurla port. On this beach fishermen are seenlaunching their traditional boats daily into the sea. The otherstudy area is Redi. It is located at 15.74°N and 73.67°E. Rediiscommercially important port of Konkan. It is a coastalvillage.This beach is indeed nectar to eye as it showspresence vast marine diversity.
Since past ten years thereis an increase in tourism andvarious anthropogenic activities. A rapidly emerging tourismsector offers a good potential for income augmentation oflocal communities.However unplanned or irresponsibletourism development can put further pressure on theecosystem. Irresponsible tourism development and touristbehavior can disturb endangered animals, wetlands and theirdiversity. Sindhudurg is primarily an agricultural district withindustrial areas accounting for less than 1% of the totalarea. The core industries are metal ore, plastic engineering,aluminumutensils, cashew processing, oil paints, sleepersmanufacturing at Redi in Vengurla.
(Industrial profile of Sindhudurg, MSME, Govt. of
India, 2012)It is important to study the effects ofanthropogenic activities on wetlands as they may havenegative impacts onwetlands. Our basic aim was to find outchanges in quality of water caused due to anthropogenicactivities.
When one thinks of wetlands the first thing that willpop the mind will be visions of swamp and flooded plains.These are usually treated as wastelands, while in realitythey are the most precious form of ecosystem.Wetlandcontributes to biodiversity,clean water,flood control andprovide habitat for millions of species of plants and animals.Wetland is a land area that is covered with water, eitherpermanently or seasonally, such that it takes on thecharacteristics of a distinct ecosystem. Wetlands are themost productive environmental parameters helping not onlyecosystem but it also controls and enhances biologicaldiversity. Mangrove forest are very vital ecosystem as theyprovide support to a complex community assemblage, reducecoastal erosion and serve as sinks for macronutrients,micronutrients and heavy metals . It is a necessity to studythe effects of anthropogenic activities on wetlands. It isseen that indirect impacts are caused by land alteration,fishing and mining activities contributing to deteriorationof wetlands.
The present study involves the analysis of waterdescribed by its physical water quality in terms of Physio-chemical status of Nivti creek and Redi creek. A study wascarried out on the basis of survey physical observation,photography and hydro-biological parameter by implantingsuitable methods from August 2015 to December 2015.
Methods And Materials
For analysis of physio-chemical parameters of waterstandard methods (AWWA, 1981) were. The water samples

51
International Conference on Ecosystem Services of Wetlands - ‘Ardrabhumi :2016’ISBN : 978-81-923628-3-0
were collected from above mentioned areas once in a monthto estimate the parameters. The estimation of physio-chemical parameters such as temperature and pH wererecorded the time of sample collection by using Multi-stemthermometer and pocket digital pH meter respectively. Whileother parameter such as Dissolved oxygen,Salinity,Nitratesand Nitrites were estimated in the laboratory.
OBSERVATION Comparison of the parameters of Nivtiand Redi creek during August-December 2015
Fig 1. Showing variation in pH of water at both sites
7.4
7.6
7.8
8
8.2
8.4
8.6
8.8
9
9.2
Nivati
Redi
pH
Fig 2. Showing variation in pH of soil at both sites
Fig 3. Showing variation in Temperature (0C) ofwater at both sites
Fig 4. Showing variation in Dissolved Oxygen (mg/lit)in water at both sites
0
1
2
3
4
5
6
7
August September October November December
Nivati
Redi
mg/lit
Fig 5. Showing variation in Salinity(g/lit) of waterat both sites
Fig 6. Showing variation of Nitrates(μg/lit) in waterof both sites
0
0.002
0.004
0.006
0.008
0.01
0.012
August September October November December
Nivati
Redi
(µg/lit)

52
International Conference on Ecosystem Services of Wetlands - ‘Ardrabhumi :2016’ISBN : 978-81-923628-3-0
Fig 7. Showing variation of Nitrites(μg/lit) in waterof both sites
0
0.02
0.04
0.06
0.08
0.1
0.12
August September October November December
Nivati
Redi
µg/lit
RESULTSNIVTI
August September October November December
Water pH 8 8.5 8 8.5 8.5
Soil pH 6.3 6.2 6 6.1 6.2
Dissolved
oxygen
(mg/lit)
6 5.5 5 5.2 5
Salinity(lit) 17 20 23 27 30
Nitrates
(µg/lit)
0.01 0.01 0.01 0.01 0.01
Nitrites
(µg/lit)
0.01 0.01 0.01 0.01 0.01
Temperatur0C
22 23 25 24 19
REDI
August September October November December
Water pH 8.5 8.5 9 9 9
Soil pH 6 6 5.6 5.5 5.5
Dissolved oxygen(mg/lit
)
5.1 5 5 4.5 4.5
Salinity(g/lit) 2 4 11 15 20
Nitrates
(μg/lit)
0.01 0.01 0.01 0.01 0.01
Nitrites
(μg/lit)
0.1 0.1 0.1 0.1 0.1
Temperature
0C
22 23 25 26 20
Discussions
The aim of this research work was to find out theanthropogenic impact on the wet lands of Sindhudurg.Theresults obtained can be summarized as follows: Thephysio-chemical parameters that we observed were foundto be on the verge of normal range.The pH of water at Nivtiand Redi was seen to bebetween pH 8-9. Thus the waterpresent was alkaline than that compared with the soil pHwhich was in the range of 5.5-6.3, acidic in nature. TheDissolved oxygen content was found to be slightly higher
than normal range at Nivti whereas it was minimum duringthe months of November and December at Redi. As dissolvedoxygen level in water drops below 5mg/lit, aquatic life is putunder stress. The Salinity was found to be higher at Nivtithan Redi, as it is attached to Arabian Sea. The salinity leveldropped down significantly during monsoon which lastedtill October. The Nitrates and Nitrites were found to be innormal range.However Nitrite levels higher than 0.1µg/litcan stimulate algal growth and deplete the supply of oxygenand would disrupt the aquatic food chain.
Conclusions
As per our findings the dissolved oxygen content isreducing on a consistent level. It is necessary that domestic,agricultural as well as industrial waste must be controlledmore efficiently because it is an alarming situation. There isfor sustainable and responsible planning and managementof tourism industry. According to our results there is needfor better data, especially for longer term environmentalmonitoring and for better management of these wetlands.
Acknowledgment
Our special thanks to Principal Prof. Dr. S.R.Pednekar,Ramnarain Ruia College, Matunga,Mumbai for granting uspermission to do this research project.We thank Head ofDepartment of Zoology for helping us in this research work.We would like to thank B.N. Bandodakar College for givingus an opportunity to participate in the UGC SponsoredInternational Conference on Ecosystem Services ofWetlands.
References
Chandra R.,Nishadh K.A,Azzez P.A,(2010) Monitoring waterquality of Coimbatore wetlands, Tamilnadu ,India .Springerscience,Volume 169, Issue 1, pp671-676.
Whigham D. and Jordan T.September 2003.Isolated wetlandsand water quality –Indiana University,Wetlands volume 23, No.3.
Basavaraja Simpi, S.M. Hiremath, KNS Murthy, K.N. ChandraAdamu Mustapha and Ado Abdul, 2012. Analysis of WaterQuality-Application of Principal Components Analysis andMultiple Regression Models inSurface Water QualityAssessment, Journal of Environmental and Earth ScienceISSN 2224-3216 (Paper), Volume 2, Number 2
Acharya S. , Adak T.,N.A Patil, E.T Puttiah, 2009 WetlandManagement for Sustainable Development, Journal of Soiland Water Conservation, vol. 8, no. 4, pp 25-30
United Nations development programme on India-projectdocumentMinistry of Environment and Forest, Governmentof India, Revenue and forest department, Government ofMaharashtra, 2012
Brief Industrial Profile Of Sindhudurg District, MSME-Development Institute,Ministry of Micro &MediumEnterprises, Government of India, 2012.

53
International Conference on Ecosystem Services of Wetlands - ‘Ardrabhumi :2016’ISBN : 978-81-923628-3-0
Bio-chemical Analysis and Study of Self Restoration Capacity ofMira-bhayandar Wetlands Using Modified Winogradsky’s Column
Gayathri N.1*, Bagkar P.21Department of Zoology, The D.G. Ruparel College, Mahim (West), Mumbai 400 016
2Department of Biotechnology, Ramnarain Ruia College, Matunga (East), Mumbai 400 019*E-mail: [email protected]
Abstract : The present work was aimed to study the pedological parameters of Mira-Bhayandar wetland with the help ofindicator organisms, bio-chemical analysis and modified Winogradsky’s column. Bio-chemical analysis of samples fromdifferent sampling sites revealed remarkable variations in pedological properties. Though the complexity of microbiotacomprising of fungi, bacteria, viruses and protozoa makes it challenging for the conservation of the wetland, a Winogradsky’scolumn was maintained and observed over a period of 10 weeks. The results of the study indicate the possibilities ofrestoration of natural habitat by itself with limited human interference.
Key words: Anthropogenic effects, Mangroves, Microbiota, Winogradsky column
Introduction
Wetland ecosystems are ecologically diverse naturalresources that act as intermediary zones between land andsea. They support a vast group of flora, fauna and microbiotaand cater to valuable resources to the coastal communities.Creating awareness about wetland biodiversity and itsimportance, their management and conservation is the needof the hour. Wetlands are interface lands transitional betweenland and sea where the water table is usually at or near thesurface or the land is covered by shallow water. Mangrovewetlands are valuable and productive coastal habitats andare cleansers of coastal environment. They aid in floodcontrol, shoreline sanitization and support the food chain(Murthy et. al., 2001). Mangrove ecosystems play animportant role in maintaining water quality in estuaries,protecting shoreline from storm damage and erosion.Mangroves are the characteristic intertidal plants distributedin tropical and subtropical coastlines (Luzhen, 2009). Theygrow in harsh environmental settings such as wide range ofsalinity, high temperature, extreme tides, high sedimentationand muddy anaerobic soils (Giri et. al., 2010). In the past fewdecades, there have been destruction and overuse ofmangrove wetlands and forest, due to population growth,urbanization, and the construction of shrimp farms (D’Agneset al., 2010; 2005). Inhabitants of coastal regions dependgreatly on mangroves for their income. Due to the pressuresof population overgrowth and economic development, therehas been over utilization and exploitation of mangroveforests and they have been severely destroyed or convertedfor other economic uses. This in turn has decreased theability of these systems to provide food, materials, andenergy benefits that are now more important than ever. Thereis growing evidence that mangroves and other naturalbarriers are critical components in the overall resilience ofcoastal areas to threats posed by disasters (Adges et al.,2005). Mira-Bhayandar wetland mangrove includes 20.7 sqkm of productive area with 246 plant species contributing to
more than 2 lakh trees. It provides shelter to various reptiles,birds and even humans. The current study was performedand carried out to analyze the physico-chemical andmicrobiological parameters of this wetland and to assess itsself-restoration capacity over a period of time.
Materials and methods
Area distribution - Mira-Bhayandar estuarine wetlandregion (19.2900° N, 72.8500° E) was chosen for the presentstudy. The area under study was selected on the basis oftheir physical separation and effect of anthropogenicactivities. This allows study of different soil samples fromthe same region varying in their exposure to environmentfactors as well as human interference. Soil sample collectionis crucial step in soil microbiological studies. The wetlandsoil was collected from eight different areas designated asA
1 to A
8; differentially selected on the basis of their natural
distribution and anthropogenic effect. Area A1 is
representative of boundaries of urban and forest cover. AreaA
2 -represents lands dried up naturally due to lack of
topological cover. A3 represents residential area inside the
forest and area A4 represents the estuarine area near salt
pans. Areas A5, A
6 and A
7 represent outer regions of forest
cover, forest dividing lines and interior region of the forestcover respectively, whereas area A
8 represents the
anthropogenically affected area. The soil samples werecollected from four sampling sites in each of the eight areasand all of the thirty-two samples were analyzed for theirtopological, biochemical and microbiological significance.
Analysis of pedological parameters
Physico-chemical parameters – Soil samples collectedfrom each of the sampling sites were checked for pH,moisture content, organic content and water holdingcapacity using standard methods (Black, 1965; Rayment andHigginson, 1992). The soil sample from the column was testedfor the parameters after ten weeks of incubation.

54
International Conference on Ecosystem Services of Wetlands - ‘Ardrabhumi :2016’ISBN : 978-81-923628-3-0
Microbiological Analyses - Percentage MicrobialPopulation: Identification and enumeration of soilmicroorganisms was carried out using spread plate methodby diluting the soil sample two folds with saline and spreadonto nutrient agar plates with incubation at room temperaturetill microbial colonies grew up to visible identification level.
Winogradsky’s column preparation - StandardWinogradsky’s column preparation was modified formimicking the environment of estuarine wetland ecosystem(Fig.1). To mimic the ecosystem of wetland, three differentsoil layers from the area A8 (anthropogenically affected area)were used. Most of the wetlands show two important soiltypes which include upper organic and lower mineral layer.Lower part of column was prepared with granular silt followedby loam soil representing mineral soil layer whereas upperlayer was prepared from organic soil from area A8. Topmostlayer is covered with required amount of the water to avoiddrying of column.
Column was prepared by layering silt soil: loam soil:sand: organic matter: saline water in the ratio 3:2:4:2:1 andincubated in sunlight for ten weeks with regular monitoringof water level and visible indication of microbial growth andactivity. All the physico-chemical and microbial analyses weredone on the column and sample after a time of ten weeks.
Results and Discussion
The pH of the soil from area A3 representing residential
area inside the forest ranged from 8.5 to 9 and that of theouter regions of the forest (A
5) ranged from 7.5 to 8.5
indicating high alkalinity. Boundaries of forest region (A1)
showed soil pH of 7.5 in all the sampling regions indicatingneutral to alkaline pH. The naturally dried up area (A
2)
showed average pH of 5.5 whereas the pH of soil fromestuarine area (A
4) was slightly acidic to highly alkaline pH
ranging from from 6 to 9. This region showed most variablepH range in our studies. Areas A
3 and A
6 had a soil pH of 7.5
whereas the interior region of the forest (A7) showed variable
pH ranging from 5.5 to 7. The pH of the soil fromanthropogenically affected area of the forest (A
8) was found
to be 6.5. Low pH values might be due to manganese andaluminum ions in abundance which can’t be tolerated bynormal plants hence important indication of wetlandenvironment. Higher pH levels in wetlands are indicative ofenvironmental disturbances. Organic wetland soils tend tobe acidic whereas mineral wetland soils are generally neutralor rarely alkaline (Woodcock et. al., 2005).
Moisture in the soil may be present as adsorbedmoisture at internal surfaces and as capillary condensedwater in small pores. The interior regions of the forest cover(A
7) and estuarine areas (A
4) showed higher moisture
content as they are in the contact with water bodies. Lowermoisture content was observed in the naturally dried upareas and the least in anthropogenically affected areas (A
8).
forest outer coverings (A5), forest dividing lines (A
6) and
residential areas (A3) showed intermediate moisture content.
Areas with lower moisture content show decreased growthpotential.
Water holding capacity of the soil representsinfiltration and percolation capacity of the soil. The amountof water a soil can hold is very important for plant growth.Soils that can hold a lot of water support more plant growthand are less susceptible to leaching losses of nutrients andrhizospheric microbes. Boundaries of forest and urban areas(A
1), naturally dried up areas (A
2) and anthropogenically
replaced areas (A8) showed decreased water holding
capacity which may be due to change of soil type from clayto sandy soil while soil from inside region of the forest (A
7)
showed maximum water holding capacity followed byestuarine areas (A
4). Forest outer coverings, forest dividing
lines and residential areas showed intermediate waterholding capacity (Fig. 2).
Organic matter influences many of the physical,chemical and biological properties of soils, some of whichinclude soil structure, soil compressibility and shearstrength. In addition, it also affects the water holding

55
International Conference on Ecosystem Services of Wetlands - ‘Ardrabhumi :2016’ISBN : 978-81-923628-3-0
capacity, nutrient contributions, biological activity, and waterand air infiltration rates. Soil organic content is tested formoisture, ash, and organic matter of peat and organic soils(Tong et al., 2005). Maximum organic content was observedin estuarine areas (A
4) which could be due to abundant
algal growth present at interface areas of water body andwetland. This area is followed by residential area inside forest(A
3) and inside regions of forest cover (A
7). The former
could be due to household waste whereas the latterrepresents decaying organic matter. Least organic contentwas observed in forest dividing lines (A
6) and
anthropogenically affected areas (A8). Although naturally
dried areas have significant amounts of organic content,area outside the forest cover also has significant amount oforganic content (Fig. 3).
Decrement in organic content of soil due toanthropogenic interference is clear indication of loss ofrhizospheric association of microorganisms. On the otherhand naturally dried up areas doesn’t show significant lossof organic content. Organic content below 28% in the areasA
2, A
6 and A
7 indicates loss of fertility which will in turn
affect the flora.
Soil texture, fertility and nutrient content haveinfluence on the type and number of microorganisms presentin the soil. Soil microbes produce variety of organiccompounds to form humus increasing the nutrient level ofthe soil. Microbial analyses of the soil samples of the areasrevealed that E coli and Bacillus sp. were high in number inthe residential area followed by anthropogenically affectedareas and estuarine areas and least in the inside regions offorest cover. Saccharomyces was found in abundance onlyin estuarine areas. Micrococcus was more inanthropogenically affected region followed by residential,inside forest cover and estuarine regions. Staphylococcus,Proteus and Serratia were observed more inside the forestcover followed by estuarine, residential andanthropogenically replaced areas. Most of the Streptomycesare plant pathogens hence found over the areas near highvegetation although they produce many antifungal agentswhich ensure their abundance in ecological niche. They
show very effective colonization due to plant dependantmycelial colonization. Saccharomyces are notautochthonous soil microbes but can be observed in regionshigh in water content and in rhizospheric areas. Proteus isuncommon in soil but very commonly found in gastrointestinal tract of reptiles and birds and can be found onlyin highly oxygenated soil. Higher number of E. colicharacterizes the household waste and fecal contaminationwhich is possibly due to residential area nearby. Bacillusmainly found in the soil regions with high plant numberproviding them rhizospheric habitat. Micrococcus grows incharacteristic environment with little water or high saltconcentrations and are mesophiles (Fig. 4).
After 10 weeks of incubation, the soil from the columnwas tested for pH, moisture content and water holdingcapacity. pH was found to have increased from 6.5 to 7.5.The moisture content was found to be increased from 0.02%to 0.5% and there was increment in the water holding capacityfrom 0.05% to 0.33%. These results are comparable to theparameters from that of unaffected area of wetland. Theorganic content showed a slight increase from 15% to 20%which could possibly be due to the isolated conditions ofthe column. Comparison of the above data obtained fromthe analyses of column with that of the data of the areas, itcan be stated that the physico-chemical parameters werefound to be restored during the course of incubation. Thisinterpretation was further confirmed by results obtainedfrom microbiological analysis of the column which revealeddecrement in the count of pollution indicator organisms suchas E. coli, Bacillus and Micrococcus.
Conclusion
The different physico-chemical and microbiologicalstudies carried out on the samples from eight distinct areasof the mira-bhayandar wetland and the analysis of themodified winogradsky’s column clearly reveals the ill effectsof anthropogenic interference on the wetland ecosystemboth at macro and microbial scale. This study also highlightedthe natural restoration ability of the soil ecosystem when

56
International Conference on Ecosystem Services of Wetlands - ‘Ardrabhumi :2016’ISBN : 978-81-923628-3-0
maintained free from human interference. With regularmonitoring of organic input and output as well as limitingthe pollution and anthropogenic interference, wetlandecosystem can be conserved with the help of their naturalself-restoration abilities. Efforts are to be taken to speed upthis natural process in small isolated areas and also toestimate the limitations of natural restoration process.Further integrated studies are required for better efforts toconserve wetlands.
Acknowledgements
The authors thank the Principal, Head and staffmembers of Department of Zoology, D.G. Ruparel Collegefor extending the laboratory facilities to carry out this work.
References:
� Adger, W.N., Hughes T.P., Folke, C. (2005). Social-ecological resilience to coastal disasters. Science 309,1036-1039.
� Black, C.A. (1965). Methods of Soil Analysis: Part IPhysical and mineralogical properties. AmericanSociety of Agronomy, Madison, Wisconsin, USA, Pp.1-2.
� D’Agnes, L., D’Agnes, H. Schwartz, J.B., Amarilla, M.L.,Castro, J. (2010). Integrated management of coastalresources and human health yields added value: Acomparative study in Palawan (Phillipine).Environmental Conservation. 37 (4), 447-455.
� D’Agnes H., Castro, J., D’Agnes, L., Montebon, R.(2005). Gender issues within the population-environment nexus in Phillipine coastal areas. CoastalManagement. 33 (4), 447-458.
� Febryano, I. G., Suharjito, D., Darusman, D., Kusmana,C., Hidayat, C. (2014). The roles and sustainability oflocal institutions of mangrove management inPahawang island. J. Manajemen Hutan Tropika. XX(2), 69-76.
� Giri, C., Ochieng, E., Tieszen, L., Zhu, Z., Singh, A.,Loveland, T., Masek, J., Duke N. (2010). Global Ecologyand Biogeography. A journal of macroecology, Statusand distribution of mangrove forests of the worldusing earth observation satellite data. BlackwellPublishing Ltd. Pp.1-6.
� Luzhen, C. (2009). Recent progresses in mangroveconservation, restoration and research in China.Journal of Plant Ecology. 2, 45-54.
� Murthy, R. C., Rao, Y. R., Inamdar, A. B. (2001).Interpreted coastal management of Mumbaimetropolitan region. Ocean and Coastal Management44 (5-6), 355-369.
� Rayment, G.E., and Higginson, F.R. (1992). AustralianLaboratory Handbook of Soil and Water ChemicalMethods. Inkata Press, Melbourne. Australian Soiland Land Survey Handbook, Vol.3, Pp.1-3.
� Tong, C.L., Zhang, W.J., Wang, H.Q., Tang, G.Y., YangG.R., Wu, J.S. (2005). Relationship between organiccarbon and water content in four type wetlandsediments in Sanjiang Plain. Huan Jing Ke Xue 26 (6),38-42.
Woodcock, T., Longcore, J., McAuley, D., Mingo, T.,Bennatti, C.R., Stromborg, K. (2005). The role of pH instructuring communities of marine wetlandmacrophytes and chironomid larvae (Diptera).Wetlands. 25 (2), 306-316.

57
International Conference on Ecosystem Services of Wetlands - ‘Ardrabhumi :2016’ISBN : 978-81-923628-3-0
Ecological and Socio-cultural Assessment of The High Altitude Wetland: A CaseStudy of The Bhagajang Wetland Complex in Western Arunachal Pradesh,
India.
Jaya Upadhyay*, Rajarshi Chakraborty and Kamal MedhiWWF-India, Western Arunachal Landscape Programme, Tezpur, Assam.
*Email: [email protected]
Abstract : The Himalayan state of Arunachal Pradesh harbours 1672 high altitude wetlands and these wetlands play asignificant role to maintain hydrological, ecological as well as cultural values. The present study aims to document the floraland faunal biodiversity as well as to understand dependencies and patterns of anthropogenic activities in the BhagajangWetland Complex (BWC), one of the four identified wetland complexes identified by WWF-India in western ArunachalPradesh. Information on biodiversity was collected through random quadrat sampling and frequency grids. Semi structuredinterviews were also conducted to understand the socio-cultural values, dependency and patterns of anthropogenic activitiesin the wetland complex. More than 70 herb species, 2 direct evidences of mammals and 26 species of birds were documentedfrom the alpine meadows as well as the catchment areas of the lakes. The anthropogenic activities in the region includespilgrimage, traditional yak grazing and vast stretches of road construction in the wetland complex. The study outlines the needfor the conservation of fragile ecosystem of the BWC through proper management and planning along with the incorporationof sustainable energy sources, proper garbage management as well as long term intensive research.
Keywords: Wetland, Biodiversity, Alpine ecosystem, Religious significance, Arunachal Pradesh.
Introduction
High altitude wetland or HAW is a generic term whichdescribe areas of swamp, marsh, meadow, fen, peat-land orwater bodies located at an altitude higher than 3000 m asl,whether natural or artificial, permanent or temporary, withwater that is static or flowing, fresh, brackish or saline. Ingeneral, HAWs are areas located at altitudes between thecontinuous natural forest border and the permanent snowline(Chatterjee, et al., 2010). They are extreme ecosystems,characterised by extreme adverse climate and presence of aseasonal or diurnal permafrost layer. The HAW are fed bysnow-melts, precipitation and springs unlike lower altitudeslakes which receive water from local rains through streamsand runoff. It plays a key role in hydrology and ecology ofrivers by acting as reservoirs or aquifers for storing water inwet seasons and releasing during the drier periods. Apartfrom the hydrological significance, HAWs play crucial rolein hosting biodiversity, wildlife habitat and socioeconomicaspects (ISRO, Government of India, 2012).
Among the globally distributed areas of HAWs, theHimalaya and the Tibetan Plateau is the largest and it harboursnumerous lakes of different geological origin in myriad shapesand sizes. Arunachal Pradesh, by virtue of its geographicalposition, climatic conditions and altitudinal variations, is abiodiversity rich region in northeast India, with large tracts oftropical wet evergreen, subtropical, temperate and alpineforests (Paul, Khan, Das, & Dutta, 2010).The state is a part ofthe Eastern Himalaya Global Biodiversity Hotspot (Myers,Mittermeier, Mittermeier, da Fronseca, & Kent, 2000) andrecognised as one of 200 globally important eco-regions(Olson & Dinerstein, 1998). Arunachal Pradesh also ranks
second in the country after Jammu & Kashmir in the totalnumber of high altitude wetlands and there are approximately1672 high altitude wetlands in the state (ISRO, 2011) whichplay a significant role in maintaining hydrological & ecologicalbalance in the upstream & downstream regions (Kanwal,Samal, Lodhi, & Kuniyal, 2013).
Culturally too, HAWs are considered & revered assacred sites & their conservation is important for the mythsand beliefs of traditional people, especially in the Buddhistregions of Tawang, West Kameng, Mechuka & Lohit(Jayachandran, 2013). Tawang district, in the western mostpart of the state, has more than 200 HAWs (ISRO,Government of India, 2012), which, apart from being vitalrepositories of biodiversity and critical watershed areas, areequally important for a multitude of hydroelectric projects,some in the present district, which are recent lifelines of thestate’s economy by maintaining flow of major rivers(Jayachandran, 2013). However, most of these high altitudewetlands are located in remote, inaccessible parts with ayear-round harsh climate with varied and sparsedemography including a large population of livestockherders for whom the catchment areas contain vitalpasturelands. There is no scientific management planexisting in terms of the long term conservation of thesewetlands (Jayachandran, 2013). In Arunachal Pradesh aswell as other mountainous parts of India, baseline studiesare lacking for most areas, particularly for areas higher than4000 meters & there has been little long term monitoring ofhydrology & climatic variables (Eriksson, et al., 2009).
WWF-India, through its Western ArunachalLandscape Programme, has been involved in the conservation

58
International Conference on Ecosystem Services of Wetlands - ‘Ardrabhumi :2016’ISBN : 978-81-923628-3-0
of some of these HAWs since 2005, jointly with ForestDepartment, enforcement personnel, civil administration &local communities. As part of the initiatives, four high altitudewetland complexes have been identified for their conservationrequirements, namely Bhagajang High altitude wetlandcomplex (HAWC), Nagula HAWC, Thembang BapuCommunity Conserved Area HAWC and Pangchen LumpoMuchat Community Conserved Area HAWC.
This paper is a part of the baseline study conductedto prepare the future management strategies for theconservation of the Bhagajang Wetland Complex (BWC).The objectives of present baseline study ,conducted in themonth of September in 2013 and 2014, was to document thepresence of floral and faunal biodiversity, to understandthe dependencies and patterns of anthropogenic activitiesas well as to assess potential threats to biodiversity in thewetland complex.
Materials and methods:
Study Area: The Bangajang Wetland Complex (BWC)is located in the south west part of Tawang district ofArunachal Pradesh, India, bordering West Kameng districtof Arunachal Pradesh in the South and Bhutan in the West.The wetland complex is under the ownership of TawangMonastery by customary law. It is located at a distance of18 km from Sela Pass, connecting Tawang district with restof India and the settlement of Jung in Tawang district is thenearest town (Fig 1). The complex is inaccessible from Octto March each year due to snow cover.
The general topography of Bhagajang consists of highbroken ridges, alpine meadows and valleys with lakes andthe altitude of the complex varies between 4100 m to 4329 masl.As per satellite images there are approximately 20 lakesof sizes ranging from 1ha to about 35ha in the area.Approximate area of BWC is about 2300ha which has beenidentified for recognition as a Ramsar Site by the StateGovernment. According to Tawang Monastery, 12 lakes ofBWC are considered to be very sacred by Buddhistcommunities and every year thousands of pilgrims from Indiaand Bhutan visit these lakes in the month of August toOctober (WWF India, 2008).
Fig 1: Map of Bhagajang Wetland Complex (Source:WWF-India)
Methodology: The remoteness and inaccessibility ofBhagajang and similar high altitude areas makes the successof any fieldwork in the catchment entirely dependent onavailable resources & logistical arrangements. For thepresent study, therefore, no stratification could be attemptedin the sampling strategy; rather random sampling was appliedfor rapid collection of data relating to biodiversity. Existinghuman and livestock trails, roads were used to access thesample sites including mountain slopes, lake fringes andalpine meadows & grazing grounds.
Data on vegetation diversity was collected using thequadrate method (Sutherland, 2006), where randomquadrates of 5x 5 meters were sampled in different locations,at varying inter- distances from 50-200 meters. Attemptswere made to fix the quadrates in a typically representativesection of each habitat type (Gungor, 2011). In each quadrate,shrubs presence was documented including their meanheight/ abundance. Within the same quadrate, a smallerquadrate of 1x1 meters (frequency grids) was sampled whichwas further sub divided into 10cm X 10cm blocks for easyrecording of number of herb species which were very thicklydistributed (Vogel & Masters, 2001) for documentation ofground flora. The same quadrates used for vegetationsampling were searched for locating animal signs includinghoof marks, tracks, pellets, etc. Additionally, all signs andevidences encountered in the survey trails were alsorecorded. All collected data was entered, compiled &analysed in Microsoft Excel.
Semi-structured interviews were conducted with themonks and herders at the Bhagajang to understand thecultural and sociological significance of the lakes and patternof anthropogenic activities.
Results:
A total of 55 quadrates were sampled for collectinginformation on biodiversity of the area. The plots rangedfrom 4047-4348 meters elevation, containing primarily alpinevegetation forming krummholz and meadows, dotted withlakes and broken by high barren ridges. The sampling wasdone in & around the Bhagajang monastery, the sacred lakesand along the roads to Naga GG and Jung. Some of the lakesvisited for collection of habitat data included Gonpo La Tso(4249 m asl), Dorjee Phamu (4221 m asl), Chandrezig La Tso(4399 m asl), Tso breh lake II (4222 m asl), Jambyang La Tso(4050 m asl) and Dungchingma Tso (4250 m asl).
Floral composition
Alpine vegetation is characterized by relatively highbiodiversity due to its fragmentation on isolated mountains(Harmsen, 2008). 78 plant species were recorded during therapid assessment, of which approximately 45 weredocumented inside the sampling quadrates which included

59
International Conference on Ecosystem Services of Wetlands - ‘Ardrabhumi :2016’ISBN : 978-81-923628-3-0
approximately 10 grass species, 2 species of rhododendronsand other alpine herbs. This reflects the high diversity ofalpine herbs and grasses in the catchment area, includingsome rare medicinal and aromatic species (species likeAconitum hookeri, Aconogonum sp, Rheum australe, etc).A total of only 2 tree species and 7 shrub species wereidentified in the quadrates, which formed the dominantabove-ground vegetation feature and in some location theshrubs formed dense clusters and krummholz. The genusRhododendron was dominant in the composition, with R.camelliiflorum & R. thomsonii among the two mostabundant species, interspersed with dwarf juniper scrub ofJuniperus squamata.Polygonaceae, Asteraceae andSaxifragaceae family were most dominant among the herbsand grass species was mainly dominated by Poaceae andCyperaceae family.
While the mountain slopes were predominantly coveredin dense alpine scrub consisting of dwarf rhododendrons &juniper, the grazing meadows had a dense covering of diversegrasses, dominated by Kyllinga odorata, Carex sp&Chrysopogon sp, interspersed with flowering Polygonumcalostachyum, Swertia hookeri and Rheum australe. Fig 2shows the most abundant shrubs found in the quadrates, interms of their relative abundance (%).
0
5
10
15
20
25
30
35
40
Re
lati
ve
ab
un
dan
ce (
%)
Shrub species
Relative abundance of major shrub species
Fig 2: Relative abundance of major shrub species inthe quadrates (N= 55)
The following figure 3 shows the major herb species,in terms of their frequency of occurrence (%) in the quadrates.
0
10
20
30
40
50
60
70
Kyllinga
ordata
Potentilla
peduncularis
Chrysopogon
sp
Carex sp Polygonum sp
Fre
qu
en
cy o
f o
ccu
rre
nce
(%
)
Herb species
Frequency of occurrence of major herb species
Fig 3: Frequency of occurrence (%) of major herbspecies in the quadrates (N= 55)
Fauna of Bhagajang
Mammals
While alpine mountain areas offer comparatively easierdetection of mammals at long distances due to enhancedvisibility, the harsh climate and terrain dictates presence ofonly species with specialized adaptive mechanisms cansurvive and flourish. Apart from the direct sighting of large-eared pika (Ochotona macrotis), a first record of the LeopardCat through opportunistic camera trap was also documentedin the region at an altitude of 4200 mtrs (Chakraborty, Nahmo,Upadhyay, & Medhi, In press). The interviews with themonks and herders, however, revealed information regardingpresence of several species including the endangered muskdeer (Moschus chrysogaster), Himalayan weasel (Mustelasibirica), Asiatic wild dog (Cuon alpinus), Himalayanmarmot (Marmota himalayana) and Red fox (Vulpes vulpes).
Birds
A total of 26 species of birds were documentedincluding species such as Ruddy Shelduck (Tadornaferruginea). This species has been reported to breed in thehigh altitude wetlands of western Arunachal Pradesh(Mazumdar, Maheshwari, Dutta, Borah, & Wange, 2011) andBhagajang could act as a vital breeding ground in the region.Other species included the White winged Grosbeak(Mycerobas carnipes), Rufous-breasted Accentor(Prunella strophiata), White-browed Rosefinch(Caprodacus rododchrous) etc.
Socio-Cultural and Religious Value
The lake complex is highly sacred and culturally veryimportant. The most sacred of all the lakes is Dorjee Phamu,where it is believed the goddess of prosperity exists. Pilgrimsmake offerings of khadas (traditional scarves), flowers andcoins to this lake. The area being limited to accessibilityround the year, pilgrims mostly visit during the month ofAugust and September. In 2013 and 2014, approximately2000 visitors from India and Bhutan visited these lakesduring this period especially during the Dharma day (fullmoon day on the eight month of the Buddhists Calendar).Vast majority of the visitors coming to these lakes areBuddhist from West Kameng, Tawang District and also fromneighbouring Bhutan.
The alpine meadows of the Wetland Complex alsoserves as the summer grazing lands for yaks and the summergrazing period lasts for at least 3 months. The total numberof livestock was reported to be 75, out of which 40 yaksbelonged to the Tawang Monastery. Since the ownershipof the wetland complex lies on Tawang Monastery, thegrazers take care of the livestock belonging to the monasteryto avoid paying any taxes for the land. The products likeghee and local cheese (chhurpi) collected from the livestock

60
International Conference on Ecosystem Services of Wetlands - ‘Ardrabhumi :2016’ISBN : 978-81-923628-3-0
(owned by the Monastery) is handed over to the Monasteryinstead of paying taxes.
Discussion:
All over the state, the high altitude lakes, along withtheir spectacular biodiversity of the region are exhibiting awide spectrum of pressure by both biotic & abiotic factors(Jayachandran, 2013). Most of these areas lack any scientificor long term management system, and are looked after bythe communities, regarding both grazing, resource use andmovement of pilgrims. Though no accurate assessmentcould be made regarding the extent and degree of impact ofanthropogenic activities, the socio-economic pattern anddemography in the Bhagajang area and its history didprovide valuable pointers regarding the potential threat tothe fragile alpine ecosystem.
Due to its proximity to Bhutan and two districts ofArunachal, large scale road connectivity is underconstruction in the wetland complex. With the availableinformation on these fragile ecosystem including the lakesand their catchment as well as the alpine meadows, there isan urgent need for proper management and planning forany kind of anthropogenic activities in the wetland complex.
Abundant signs of livestock presence wasencountered in the sampled part of the catchment, alongwith the presence of makeshift huts inhabited by the herders.The pressure of grazing in the area could not be assessedbut it has come to light that the tradition of rearing yaks hasbeen decreasing with time and that there are very fewundisturbed grazing area required for the yak. It is a well-known fact that in the last two decades the change inbiodiversity under grazing pressure has been paid a lot ofattention, because it was identified as an importantcharacteristic in a disturbed ecosystem (Austin, Williams,& Belbin, 1981)(Bakker, 1989), however there are a fewcontrary conclusion about relationship between grazing andbiodiversity from studies by (Collins, 1987) (Bakker, 1989) .In the high altitude ranges of the Himalaya, grazing is one ofthe important sources of revenue for many herdingcommunities including the Monpa tribe in the BWC. Theycontinue a long-standing tradition of grazing where theymove up to the alpine pasture in summer and descend tolower reaches in the winter. As mentioned earlier, it has beenwell documented that grazing has a detrimental effect oncommunities with little history of grazing, but some level ofgrazing is necessary in the areas with long history of suchactivity (Andren, A, & A, 1997) (Naveh & Whittaker, 1980).Although alpine areas are sensitive to over-grazing & itforms a major issue in many high altitude areas of the country,a longer study with detailed analysis of physico-chemicalproperties of the soil and ground-based flora will be able toassess the true impact of grazing in Bhagajang.
The paramilitary forces, graziers, monks, pilgrims aswell as the road construction workers are the majorstakeholders for the collection and use of biomass(fuelwood) from the area. Though there is no year-roundconstant human presence in Bhagajang, there isconsiderable anthropogenic activity by the pilgrims as wellas the workers, which incidentally coincides with thepresence of the herders, bringing the livestock to make fulluse of the post-monsoon flush. Activities like cooking andspace heating require considerable amount of fuel at thataltitude, the majority of which comes in the form of fuelwoodcollected from the lower areas of the wetland complex aswell as from the catchments of some of the lakes. Withincreasing dependency on the fragile catchment areas inthe alpine zone and collection of tons of slow-growing timberfrom the upper temperate zones, there is an urgent need tointroduce substitutes for fuel or at least invest in use ofsome sustainable energy sources.
There is considerable generation of solid wastethrough various activities and the high altitude conditionsof the area makes decomposition very slow. Managementof waste is a major issue in Bhagajang for which WWF-India has tried to address through repeated cleanlinessdrives in collaboration with concerned stakeholders.Garbage dumping sites have also been constructed for bettermanagement of waste material along with construction oftoilets for pilgrims. Considerable awareness has also beengenerated regarding the harmful effects of plastic and othernon-degradable waste products through the sensitizationprograms. Such activities should also be incorporated inthe management plan to preserve the wetland complex. Overthe recent past, road construction and widening has alsocome forth as major anthropogenic activities in the catchmentarea. A detailed assessment is needed urgently to gaugetheir impacts on the ecosystem already and to incorporatesuitable strategies to reduce damage in case of futureactivities.
The alpine zone of Himalayas exhibits a great deal ofvariation in topography, precipitation, floristics,physiognomy of vegetation and palaeohistory (Tambe &Rawat, 2011). The study gives a definitive verdict regardingrichness of the biodiversity of the wetland complex. Thecomposition of the flora and presence & abundance ofdifferent species found during the field sampling indicatesthat the area contains a rich and diverse assemblage ofbiodiversity including some rare and valuable medicinalspecies. Further extensive surveys in other areas of thecatchment shall help in adding to the inventory and locatingother rare and endangered flora.
Regarding fauna, in spite of the low amount of signsencountered during the field surveys, information on thepossible highest record for the presence Leopard Cat had

61
International Conference on Ecosystem Services of Wetlands - ‘Ardrabhumi :2016’ISBN : 978-81-923628-3-0
been documented. Moreover, secondary informationcollected indicates presence of endangered species suchas musk deer (Moschus chrysogaster), carnivores like Asiaticwild dog (Cuon alpinus) and the Red fox (Vulpes vulpes).For an area such as Bhagajang, camera trapping can be agreat tool to provide a robust list of mammalian fauna present.A longer and more intensive survey in other strategic areas,including opportunistic camera trapping is herebyrecommended.
Conclusion:
The conservation of high altitude wetlands and lakesin the Himalaya poses an immense challenge to the world(Gujja, 2007). It is especially a major challenge to manygovernments in Asia, particularly in the context of theincreasing concerns of climate change & increasing humanactivities (WWF & MoEF. Government of India, 2006). Apartfrom performing their vital ecological and socio-cultural rolesbenefitting a vast and growing semi-urban and rural humanpopulation in the region, these wetlands are vital for ensuringthe long term water security for the coming generations. Bythe 2050s, access to freshwater in Asia, particularly in largebasins, is projected to decrease (Eriksson et al, 2009). TheBWC acts as a vital repository of high altitude biodiversityand also supports as an important basin for the TawangChu (river). With emerging threats such as unplanned roadconstruction and unregulated tourism and its associatedissues, there is an urgent need to conserve this wetlandcomplex and its catchment area through proper managementplanning involving the local communities and the concernedstakeholders.
References:
Andren, H., A, D., & A, S. (1997). Population response tolandscape changes depends on specialization to differentlandscape elements. Oikos 80, 193-196.
Austin, M. P., Williams, O. B., & Belbin, L. (1981). Grasslanddynamics under sheep grazing in an AustralianMediterranean type climate. Vegetio 46, 201-212.
Bakker, J. P. (1989). Nature MAnagement by grazing andcutting. Boston: Kluwer Academic Publisher.
Chakraborty, R., Nahmo, L. T., Upadhyay, J., & Medhi, K.(2014). High elevation record of the leopard cat (Prionailurusbengalensis) in Bhagajang Wetland Complex, Tawangdistrict, Arunchal Pradesh India. Unpublished Report.
Chatterjee, A., Blom, E., Gujja, B., Jacinovic, R., Beevers, L.,O’Keeffee, J., Biggs, T. (2010). WWF initiatives to study theimpact of climate change on Himalayas high altitude wetlands(HAWs). Mountain Research & Development 30(1), 42-52.
Collins, S. L. (1987). Interaction od disturbances in tallgrassprairie;a field experiment. Ecology 68(5), 1243-1250.
Eriksson, M., Jianchu, X., Shrestha, A. B., Vaidya, R. A.,Nepal, S., & Sandstorm, K. (2009). The Changing Himalayas.Impact of climate change on water resources andlivelihoods in the greater Himalayas. Khatmandu: ICMOD.
Gujja, B. (2007). Conserving of high altitude wetlands.Experineces of the WWF network. Mountain Research andDevelopment 27 (4), 368-371.
Gungor, B. S. (2011). Measuring Plant Species Diversities inAlpine Zones: A case study at the Kazdagi National Park, inTurkey. Archives of Biological Science 63 (4), 1147-1156.
Harmsen, R. (2008). Tundra. In S.E.Jorgensen, Encyclopediaof Ecology (pp. 3633-3639). Copenhagen, Denmark:DFH,Miljokemi.
ISRO. (2011). National Wetland Inventory & assessment.Ahmedabad: Ministry of Environment and Forest, Govt. ofIndia.
ISRO, Government of India. (2012). National Wetland Atlas:High altiude lakes of India. Ahmedabad: MoEF, Governmentof India.
Jayachandran, K. S. (2013). Conservation of High AltitudeWetlands of Arunachal Pradesh. Uttar Pradesh StateBiodiversity Board.
Kanwal, K. S., Samal, P. K., Lodhi, M. S., & Kuniyal, J. C.(2013). Climate change and high-altitude wetlands ofArunachal Pradesh. Current Science, Volume. 105, 1037-1038.
Mazumdar, K., Maheshwari, A., Dutta, P. K., Borah, P. J., &Wange, P. (2011). High-altitude wetlands of western ArunachalPradesh: new breeding ground for Ruddy Shelduck ( TadornaFerruginea). Zoo’s Print Volume(XXVI), 9-10.
Myers, N., Mittermeier, R. A., Mittermeier, C. G., da Fronseca,G. A., & Kent, J. (2000). Biodiversity hotspots forconservation priorities. Nature 403, 853-858.
Naveh, Z., & Whittaker, R. H. (1980). Structural and floristicdiversity of shrubland and woodlands in the Northern Isrealand other Mediterranean areas. Vegetio 41, 171-190.
Olson, D. M., & Dinerstein, E. (1998). The Global 200: ARepresentation Approach to Conserving the Earth’s MostBiologically Valuable Ecoregions. Conservation BiologyVolume 12, 502-515.
Paul, A., Khan, M. L., Das, A. K., & Dutta, P. K. (2010).Diversity and Districution of Rhododendrons in ArunachalHimalaya, India. Journal American Rhododendron Society,200-205.

62
International Conference on Ecosystem Services of Wetlands - ‘Ardrabhumi :2016’ISBN : 978-81-923628-3-0
Sutherland, W. J. (2006). Ecological Census Technique ahandbook Second Edition. Cambridge: CambridgeUniversity Press.
Tambe, S., & Rawat, G. S. (2011). Alpine vegetation of theKanchendzonga landscape in Sikkim. CommunityCharacteristics, diversity and aspects of ecology. In H. L.Arravatia, & S. Tambe, Biodiversity of Sikkim-exploring &conserving a Global Hotspot. (p. 54). Sikkim: Information &Public Relations Department. Government of Sikkim.
Vogel, K. P., & Masters, R. A. (2001). Frequency Grid: Asimple tool for measuring Grassland establishment. Journalof Range MAnagement., 633-655.
WWF India. (2008). Bhagajang Wetland Complex:Technical Progress Report. Unpublished.
WWF, & MoEF. Government of India. (2006). Conservingof the high altitude wetlands in the Himalayas. New Delhi:Report of the Fourth Regional Workshop.
Yang, L. M., Wang, R. Z., & Li, J. D. (1999). Effect of grazingdisturbance gradient on plant diversity of main grasslandcommunities in the Songnen Plain of China. Acta AgrestiaSinca 7(3), 8-16.

63
International Conference on Ecosystem Services of Wetlands - ‘Ardrabhumi :2016’ISBN : 978-81-923628-3-0
Phytochemical screening and free radical scavenging activity inNelumbo nucifera (Gaertn.)
Megha Y. Marathe and Moitreyee Saha*Department of Botany, B. N. Bandodkar College of Science, Thane (W.) 400 601-India
Abstract: Nelumbo nucifera Gaertn. is commonly known as lotus. It belongs to the family Nymphaeaceae. The extracts ofrhizomes, seeds, flowers and leaves have been reported to have various therapeutic potential. Several bioactive compoundshave been derived from these plant parts belonging to different chemical groups, including alkaloids, flavonoids, glycosides,triterpenoid and vitamins etc. In the present study preliminary phytochemical analysis of various extracts and free radicalscavenging activity of aqueous extracts of Nelumbo nucifera flowers were carried out. Screening of phytochemicals showedpositive results for the presence of flavonoids, alkaloids, phenols, steroids, anthraquinone, amino acids, terpenoids glycosides,fats, carbohydrates and tannins. The antioxidant activity of the extracts was measured in terms of reducing power and2, 2-diphenyl-1-picrylhydrazyl (DPPH) radical scavenging capacity.
Key words: Nelumbo nucifera, preliminary phytochemicals, radical scavenging, DPPH
Introduction
Nelumbo nucifera Gaertn., commonly known as Lotus,is a perennial aquatic plant. It grows in shallow and murkywaters. The roots of lotus remain firmly in the mud while theleaves float on the top of the water surface. The flowers arefound rising several centimeters above the leaves (Serventyand Raymond, 1980). This aquatic macrophyte providehabitat for wild life, reduce shoreline erosion, has medicinalproperties and is edible, thus Nelumbo nucifera is animportant component of the wetlands.
In Ayurveda, this plant is also used as a diuretic,anthelmintic and in the treatment of strangury, vomiting,leprosy, skin diseases and nervous exhaustion. In popularmedicine it is used in the treatment of tissue inflammation,cancer, skin diseases, leprosy and as a poison antidote(Chopra et al., 1956). Different classes of phytoconstituentshas been isolated from various parts of Nelumbo nucifera .The most important classes include alkaloids, steroids,triterpenoids, flavonoids, glycosides and polyphenols (Yuand Hu, 1997). Many pharmacological studies on lotus haveproven its antidiarrheal, anti-inflammatory, antipyretic,hypoglycemic, immunomodulatory, psychopharmacological,antioxidant, aphrodisiac, lipolytic, antiviral, anticancer andhepatoprotective activities (Mehta et al., 2013).
Antioxidants protect the cells against the damagingeffects of reactive oxygen species (ROS). ROS arecontinuously generated inside the human body. The freeradicals in the human body are generated through aerobicrespiration or from exogenous sources (Halliwell andGutteridge, 1990). These ROS play an important role in cellmetabolism including energy production, phagocytosis andintercellular signalling (Ottolenghi, 1959). However,overproduction of ROS can easily affect and persuadeoxidative damage to various biomolecules including
proteins, lipids, lipoproteins and DNA (Farber, 1994). Theother possible mechanisms reported for the activity ofantioxidant compounds include prevention of chaininitiation, prevention of hydrogen abstraction, peroxidedecomposition and reduction of metal ions (Kirithika et al.,2013).
Usually all parts of this plant viz. rhizome, leaves andseeds, are utilized by humans as food products and herbalmedicines. In the present study preliminary phytochemicalanalysis of various extracts and free radical scavengingactivity using DPPH assay of aqueous extracts of Nelumbonucifera flowers were carried out.
Materials And Methods
Collection of Plant Material: Fresh flowers of Nelumbonucifera were collected at local pond from Palwa (Dombivali)region. They were washed thoroughly 2-3 times with runningwater and once with sterile distilled water, air-dried on sterileblotter under shade.
Solvent Extraction: Aqueous, ethanol, ethyl acetate,methanol and petroleum ether extracts of Nelumbo nuciferaflowers were prepared according to the methodology ofIndian Pharmacopoeia (Anonymous, 1966). These extractswere concentrated to dryness. The extracts were stored in arefrigerator.
Preliminary phytochemical analysis: Preliminaryphytochemical screening of the flower extracts of Nelumbonucifera was carried out as per standard procedure(Kokate et al., 2005; Harborne, 2005).
Antioxidant Activity
DPPH (1, 1-Diphenyl-2-Picrylhydrazy) RadicalScavenging Activity:
The antioxidant activity of the extracts was measured

64
International Conference on Ecosystem Services of Wetlands - ‘Ardrabhumi :2016’ISBN : 978-81-923628-3-0
on the basis of the scavenging activity of the stable 1, 1-diphenyl 2-picrylhyorazyl (DPPH, Hi-media) free radicalaccording to the method described by Blois (1958). 0.1 mMsolution of DPPH in methanol was prepared and 1.0 ml ofthis solution was added to 1.0 ml of aqueous extract atdifferent concentrations (1-1000 µg/ml) of Nelumbo nucifera.After 30 min incubation period at room temperature in thedark, the absorbance of the resulting mixture was measuredat 518 nm.
The percentage Antioxidant Activity (AA%) wascalculated using the expression below:
AA% = (A cont - A test)/A cont × 100
Mixture of 1ml methanol and 1ml DPPH solution wasused as control. L- ascorbic acid (1-100 µg/ml) was used asreference standard.
Statistical analysis: All experiments were done intriplicates and the data were analyzed using Graph Pad PrismSoftware.
Table 1: Phytochemical constituent of various extracts of Nelumbo nucifera
S. No Phytocompounds Distilled water Ethanol Ethyl acetate Methanol Petroleumether1. Alkaloids + + - + -2. Amino acids + + - + -3. Carbohydrates + + + + -4. Fat - - - - +5. Anthraquinone - + + + -6. Flavonoids + + + + -7. Glycosides - + + + -8. Phenols + + + + -9. Saponins - - - - -10. Steroids + + + + -11. Tannins + + + + -12. Terpenoids + + + + -
+ = Present; - = Absent
Table 2: DPPH assay of aqueous extract of Nelumbo nucifera
Concentration % Scavenging activity(ìg ml-1) Ascorbic Acid Nelumbo nucifera
1 11.0 ± 1.29 10.9 ± 0.663 25.8 ± 0.74 17.6 ± 0.385 42.5 ± 0.49 31.80 ± 0.677 59.7 ± 1.58 47.40 ± 0.849 68.7 ± 0.75 61.50 ± 0.7410 78.3 ± 0.17 78.3 ± 1.22
IC50
value 7.4 µg/ml
Values are mean of three determinantsMean±SE
Figure 1: DPPH assay of aqueous extract of Nelumbonucifera compared with ascorbic acid as standard
Results And Discussion
Preliminary phytochemical analysis
The phytochemical analysis of the aqueous, ethanol,ethyl acetate, methanol and petroleum ether extracts ofNelumbo nucifera showed positive results for the presenceof flavonoids, alkaloids, phenols, steroids, anthraquinone,amino acids, terpenoids glycosides, fats, carbohydrates andtannins (Table 1). The Nelumbo nucifera plant hasantioxidant, anti-diabetic, anti-obesity, anti-fungal activitythat are the due to the presence of alkaloids, nuciferin, nor-nuciferine, flavonoids, glycosides and polyphenolicconstituents (Nagarajan et al., 2008).
DPPH assay
The stable free radical scavenging activity by DPPHmethod is an easy, rapid and sensitive way to survey theantioxidant activity of a specific plant extract. DPPHscavenging activity of aqueous extract of Nelumbo nuciferaflower was determined. The reducing power of the extractsincreased with increase in concentration. The graph indicatesthe percentage of free radicals scavenging activity withdifferent concentrations (1-10 µg/ml) of Nelumbo nucifera.The IC
50 value of aqueous extract of Nelumbo nucifera flowers
was found to be 7.4 µg/ml (Figure 1, Table 2).

65
International Conference on Ecosystem Services of Wetlands - ‘Ardrabhumi :2016’ISBN : 978-81-923628-3-0
DPPH scavenging activity is best presented by IC50
value, defined as the concentration of the antioxidant neededto scavenge 50% of DPPH (Chantiratikul et al., 2009). Thephenolic compounds present in the N. lotus extract couldbe responsible for the observed DPPH radical scavengingactivity, since phenols can readily donate hydrogen atomto the radical (Tung et al., 2009).
Conclusion
Nelumbo nucifera is an edible aquatic perennial plant.In the present study, preliminary phytochemical screeningshowed that this aquatic macrophyte has considerablemedicinal potential. DPPH assay shows Nelumbo nuciferapossess strong antioxidant property and hence can beconsidered as a good source of antioxidants.
Acknowledgments:
Authors are thankful to Botany Department, B. N.Bandodkar College of Science, Thane for providing thelaboratory facilities.
References
Anonymous (1966). Pharmacopoeia of India (Ministry ofHealth Govt. of India Publication) New Delhi.
Blois, M. S. (1958). Antioxidant determinations by the useof a stable free radical. Nature, 181: 1199-1200.
Chopra, R.N., Nayar, S.L., Chopra. I. C., Asolkar, A.S., Kakkar,K. K., O J Chakre; Varma, B.S (1956). Glossary of IndianMedicinal Plants. New Delhi: Council of Scientific andIndustrial Research, 174.
Farber, J. L. (1994). Mechanisms of cell injury by activatedoxygen. Environmental Health Perspectives, 102: 17-24.
Halliwell, B. and Gutteridge, J. M. C. (1990). Role of free-radicals and catalitic metal ions in human disease: anoverview. Methods Enzymol., 186: 185.
Harborne, J. B. (2005). Phytochemical Methods a Guide toModern Techniques of Plant Analysis, 2nd Edition, Publishedby Chapman & Hall, London.
Kirithika.T1 Bhaigyabati Thoudam1, Gomathi R1, Usha K1.(2013). Preliminary Phytochemical Screening and FreeRadical Scavenging Activity on Aerial Plant of NelumboNucifera Flowers. Am. J. PharmTech Res. 3(2).
Kokate, C. K., Purohit, A. P. and Gokhale, S. B. (2005).Pharmacognosy, 39th edition published by Nirali Prakashan,Pune. pp. 607-611.
Mehta, N. R., Patel, E. P., Patani, P. V. and Shah, B. (2013).Nelumbo nucifera (Lotus): A Review on Ethanobotany,Phytochemistry and Pharmacology. Indian J Pharm BiolRes; 1(4):152-167.
Nagarajan, C., Alam, D., Subhan, G. and Nyeen, P. (2008).Antioxidant and hepatoprotectant action of crude alcoholicextract of Wrightiatomentosa. Oriental Pharmacy andExperimental medicine; 81:241-248.
Ottolenghi (1959). A Interaction of ascorbic acid andmitochondria lipids. Arch. Biochem. Biophy., 79: 355-363.
Serventy, V and Raymond, R. (1980). Lakes and Rivers ofAustralia. Summit Book. Pp.102-103.
Tung, Y. T., Whu, J. H., Huang, C. Y. Ku, Y. H, and Chang, S.T. (2009). Antioxidant activities and phytochemical characteristics of extracts from Acacia confusa bark. Biresour.Technol., 100: 509-514.
Yu, J. and Hu, W.S. (1997). Effects of neferine on plateletaggregation in rabbits. Yaoxue Xuebao. 32: 1-4.

66
International Conference on Ecosystem Services of Wetlands - ‘Ardrabhumi :2016’ISBN : 978-81-923628-3-0
Seasonal Influence of Limnological Variables on Plankton Dynamics of ASmall, Shallow Reservoir From Panvel
Minakshi Gurav*1 and Madhuri Pejaver2
1D.G. Ruparel College, Mahim, Mumbai, Maharashtra, India2 B.N. Bandodkar College, Thane, Maharashtra, India
E-mail:[email protected]
Abstract : The study is about a small reservoir inPanveltahsil, Raigad district, Maharashtra. The reservoir was studied for16 months for its limnological and biological characters and the data was pooled seasonally. All the limnological variableswere in desired limits since the reservoir is not disturbed water body and is a clean source of water. There was no influenceof any anthropogenic activities except the cattle that come for water and fish catching activity by using simple traditionalmethods which was for house hold purpose. The phytoplankton were identified and 6 families were found to be present, ofwhich BacillariophyceaeandCyanophyceae were seen in all seasons and others were found absent in monsoon. Zooplanktonshowed presence of seven different classes, dominating of which wasCladocera followed by Ostracod. The density gradientwas Cladocera>Ostracoda>Copepoda>Nauplius>Rotifer>Oligochaetes>Nematodes. Oligochaetes and Nematodes wereseen only in rainy season. The relation between limnological variables and plankton was also studied.
Keywords: Premonsoon, monsoon, postmonsoon, Pearson Correlation Index, linear relation
Introduction
Reservoirs are small waterbodies with confinementsbuilt for various purposes competing human needs,including drinking, agricultural irrigation, industrial andcooling water supply, sports or commercial fisheries,recreation and navigation. Reservoirs are often constructedfor the specific purposes of flood control and powergeneration too.The water in reservoir is standing withconsiderable depth which usually depends upon the sourcesof water into it. They are important framework insideecological studies of assemblage organization, mainly dueto the abiotic instability generated in its waterbody(Thorntonetal. 1990, Leiato, 2003). The fresh water reservoirsare highly productive and are best for fishery management.Fish culture practices are practically easier in reservoirs(Rustadi, 2002) than in lakes. Insufficient understanding ofthe reservoir ecosystem often comes in the way for adoptingeffective management measures. Plankton study helps inunderstanding overall as well as biotic potential of waterbody and also to estimate its economic potential. Therealways exists relation between physicochemical parametersand plankton diversity and density, the understanding ofwhich is very essential for the management strategies ofaquatic ecosystem.Phytoplankton are important primaryproducers. They form the base of the food chain, eventhough some species are noxious and can be harmful tohuman as well as other animals as they release toxicsubstances (Whitton and Potts, 2000). Phytoplankton arerecognized worldwide as bioindicator organisms in theaquatic environment (Yakubuet al., 2000).Zooplanktons areheterotrophic, feebly swimming organisms found in water;They constitute important food source of many aquaticorganisms. They also serve as indicator organisms of waterbody and help to estimate fish yield and total biological
production. These probably explain why much of thefascination in the study of lakes lies in the structure anddynamics of zooplankton populations (Goldman and Horne,1983).According to Bukka (1998), there is currently greatinterest in preventing or reducing growth of planktonic algaeand cyanobacteria in water supply reservoir, whilezooplankton like copepods are usually a big health challengeto shallow reservoir.The aim of this study is to throw lighton influence of physicochemistry of water to speciescomposition, relative abundance and seasonal dynamics ofthe plankton of Deharnag Reservoir, Panvel. This may helpin management of the reservoir water quality and fishproduction.
Materials and methods
Study Site
Deharang reservoir, is also known as Panvel lake orGadeshwar Dam is situated at Latitude 19o1’.58 N andLongitude 73o.14’.37 E, inPanvel Taluka of Raigad District(Maharashtra, India). It is locaced 16 km away from the town,at the base of the hills. It is supplied with rain water, theunderground streams and the streams that flow down themountain. It has catchment area 2719.487 hectarwith waterstorage capacity 64.22 million cubic feet. It provides 20% ofwater supply to Panvel town which is approx. 20, 00,000liters. It has water throughout the year which sometimesdries for a month during dry season. The average rain fall is3884 mm.The selected site is least disturbed during thestudy period and was not used for any other purposes. Thestudy was intended to find out the fishery potential of thereservoir.
Sampling
Limnological variables of the selected water body were

67
International Conference on Ecosystem Services of Wetlands - ‘Ardrabhumi :2016’ISBN : 978-81-923628-3-0
studied to assess the water quality. The surface watersamples were collected monthly from four study sites fromJune 2007 to October 2008 in the morning hours and thedata was pooled together. Analysis was carried out by usingstandard methods (APHA 1985).
Phytoplankton Sampling
Using a wide mouth container, 500ml of surface watersample was collected from four different spots, from nearthe boundaries of the reservoir. The samples from everystation were preserved in separate container forphytoplankton. For immediate fixation, Lugol’s Iodinesolution made in formalin was used in the fieldand later 4%formaldehyde was used for long term preservation.
The phytoplankt on were concentrated by allowingthem to settle for about 15 to 20 days and then the upperwater was decanted by using a rubber tube. Thephytoplankton were identified by using standardidentification keys (Fritsch,1979; Sarodeand Kamat, 1984;Bellinger, 1992).
For quantitative estimation, the counting was doneby using Lackey’s Drop method (Clesceri 1998).
Zooplankton
The sample collection, for the quantitative study ofzooplankton was done by using a wide mouth container.40ltrs of water was collected from different spots from everysite from the boundaries of the bank of the river and reservoirwas filtered using net of mesh size 45µm.The filtered sampleswere preserved separately for eachsite with 4% Lugol’sIodine made in formalin in a separate container.
Identification of zooplankton was done with the helpof standard keys (Ward and Whipple, 1958; Battish, 1992;Pennak, 1995; and Dhanapathi,2000). The density count ofzooplankton was done by observing subsamples undercompound microscope and the number was calculated inunits per liter.
Results and Discussion
Physicochemical Parameters
The water temperature ranged between 20oC and 29oC,being high in October and minimum in February, showingno much seasonal variation (Table 1). Light Penetration washigh in post monsoon season and was less during monsoonwhich is due to erosion of soil particles along with run off.In contrast, turbidity was high in premonsoon and less inmonsoon and post monsoon. The average high turbidity inpremonsoon is owing to very high turbidity in one of themonth owing to cattle stamping. Rainy season showed highconductivity than other period indicating high soluble ions.
pH was slightly acidic to neutral for most of the year.However, sometimes alkaline nature is seen in premonsoonas well as postmonsoon months. Total solids were observedmore immediately after winter and at the beginning of thesummer, having more contribution of suspended solidswhich could be due to the stamping of the animals nearwater which in accordance with Lefrancois et al. (2007). Theseasonal trend is premonsoon> monsoon>postmonsoon.The minimum dissolved oxygen noted was 0.606 mg/l andthe maximum was 11.51 mg/l where as Biological oxygendemand at the same point was 0.19 mg/l and 0.20 mg/lshowing not much influence of decomposition of organicmatter. High dissolved oxygen noted was in summer seasonwhich is controversial to the statement that the solubility ofoxygen decreases with increasing temperature (Tiwari etal.(2005); Bhalla et al. (2007); Cerqueiria et al. (2007). Thepossible reason noted here could be the more algal masswhich must have generated more oxygen throughphotosynthesis (Ahamed and Singh (1993), Meitei et al.(2004), Kadam et al. (2005), Mathur and Maheshwari (2005),Shanthiet al. (2006). However, seasonal trend shows morepH in rainy season than pre and post monsoon. Carbondioxide was found to be more when there was very lessoxygen which may indicate less photosynthetic uptake(Jones et al., 2003). High quantities of total hardness werenoted in summer season owing to evaporation (Chatterjeeand Raziuddin, 2002, Manna and Das ,2004, Meitei et al.,2004). Ca-hardness was often more than Mg-hardness withincrease towards summer season. The kind of hardness isrelated to geographic strata of the water body. Total alkalinityimparts the buffering capacity to water which fluctuatesbetween 20-200mg/l for freshwater. It is determined by thebed rock of the waterbody. During present study, totalalkalinity was seen to be ranging between 15 mg/l to 165 mg/l, being low during wet period. High alkalinity imparts badtaste to water, however, it is good since it maintains the pH ofwater constant. Desirable alkalinity is 100 mg/l for domesticuse (Loganayagi et al. 2008). Silicates ranged between 0.30to 33mg/l showing no particular seasonal trend. The sourceof silicates in to water is its parent rock and the erosionactivities taking place. In the previous wet period minimumquantities of silicate was noted but in the following wet seasonthe concentration was found to be tremendously increased.The source of nitrate in water is generally animal waste andthe nitrification processes occurring in the water. The presentwater body shows comparatively less nitrogen in wet season.High nitrogen noted in the premonsoon of the previous seasonis owing to very low water level and high organic matter thatwas visually observed. In the premonsoon season offollowing year the water level was high. Phosphatesconcentration also had not shown any particular trend. Noneof the parameter was extreme (Table 1)

68
International Conference on Ecosystem Services of Wetlands - ‘Ardrabhumi :2016’ISBN : 978-81-923628-3-0
Table 1 Seasonal variation in limnological variables
Season Premonsoon Monsoon PostmonsoonTemperature 25.5 25.4 24.2oCLight 68.16 57.6 129.2PenetrationcmConductivity 472.6 359 202.8mmhospH 7.5 7.3 8.14Turbidity 36.9 24.72 15.64(NTU)TS mg/l 433.33 280 240TSS mg/l 266.66 40 0TDS mg/l 166.66 240 240Dissolved 4.072 8.71 7.51Oxygen mg/lFree CO2 9.53 6.6 1.76mg/lChlorides 19.28 9.66 11.036mg/lTotal hardness 193.33 81.1 82mg/lMg-Hardness 28.24 14.34 12.99mg/lCa-Hardness 72.97 14.74 12.18Ca mg/lTotal alkalinity 123.33 47.5 91mg/lSilicates mg/l 9.26 11.16 6.84Nitrates mg/l 2.96 1.72 1.3Phosphate mg/l 0.156 0.245 0.198BOD mg/l 0.15 0.236 0.198
Phytoplankton species and composition
Phytoplankton comprised Bacillariophyceae,Cyanophyceae, Dianophyceae, Euglenophyceae andXanthophyceae. Bacillariophyceaewas represented by 18genera having highest density in premonsoon period andleast in monsoon. Cyanophyceae had four genera (Table 2),of which Oscillatoria was abundant in premonsoon as wellas monsoon period. Dianophyceae was represented byPeridinium and Ceratium. Of which Ceratiumwas foundonly in postmonsoon whereas Peridinium was noted onlyin premonsoon. None was observed in monsoon. Phacusand Euglena represented Euglenophyceae. Phacus wasseen in pre as well as postmonsoon and Euglena was seenonly in postmonsoon. Nothing was noted in monsoon.Cryptomonas was the only genera to representCryptophyceae found in pre and post monsoon. Tribonemarepresented Xanthophyceae which was seen abundantly inpremonsoon and rarely in postmonsoon.
Table 2 Seasonal variation in Phytoplankton
Phytoplanton Premonsoon Monsoon Post (ind./litre) (ind./litre) Monsoon
(ind./litre)Bascillariophyceae 151672 6482 18663
Cyanophyceae 18787 3150 1173Dianophycea 306588 0 105
Euglenophyceae 3255 0 3483Cryptophyceae 2170 0 420Xanthophyceae 3385.4 0 105
No species was noted in monsoon. Studies done byMustapha (2010) in Tropical Reservoir had shownabundance in monsoon season which is contrary to thepresent study.
Zooplankton Species Composition
Seven different classes represented zooplankton(Table 3). The study upto species level was conducted onlyfor rotifers in which Calyciflorus represented majority ofthe rotifers. Cladoceran were highly dense among all andthe density was high in premonsoon, followed by postmonsoon having least contribution in wet period. Copepodsand Ostracods contributed almost equally having higherdensities again in premonsoon. The same was seen in naupli.Nematodes and Oligochaetes were seen only in monsoon.
Table 3 Seasonal Variation in Zooplankton
Zooplankton Premonsoon Monsoon Postmonsoon(ind./litre) (ind./litre) (ind./litre)
Cladocera 26704 338 7500Copepod 5911 1137 3700Ostracod 8755 115 1500Nauplius 4098 72 400Rotifer 1448 185 1000Eggs 1649 439 700Insect 532 151 0
Nematode 0 111 0Oligochaete 0 41 0
Pearson Correlation
The Pearson Correlation was studied to understandthe relation between physicochemical parameters and zooas well as phytoplankton.Cladocera and Ostracods showedvery strong positive linear relation with turbidity, total solids,total suspended solids, chlorides, total hardness, totalalkalinity and nitrate. Inverse relation was exhibited withtotal dissolved solids, dissolved oxygen and phosphate(Table 4).Copepods were positively correlated with totalsolids and total suspended solids, chlorides, hardness, totalalkalinity and nitrates. Negative relation is seen with totaldissolved solids, dissolved oxygen and phosphate.Nauplius

69
International Conference on Ecosystem Services of Wetlands - ‘Ardrabhumi :2016’ISBN : 978-81-923628-3-0
was directly proportional to conductivity, turbidity, totalsolids, total suspended solids, free CO
2, chlorides, total
hardness, total alkalinity and nitrate.
Total solids, total suspended solids, hardness andalkalinity were positively and strongly related with rotiferswhere as dissolved oxygen, total dissolved solids andphosphates showed very strong negative correlation.Insectswere also strongly in positive relation with free CO
2 along
with its positive correlation with conductivity, turbidity, total
solids, total suspended solids, chlorides, hardness, alkalinityand nitrates. Nematodes and Oligochaetes were in strongpositive correlation only with dissolved oxygen, silicatesand phosphates and in negative correction with lightpenetration, chlorides and total alkalinity.Overallobservation says that conductivity, turbidity, total solids,total suspended solids, chlorides, hardness, total alkalinitysilicates and nitrates showed linear relation with many ofthe organisms where as dissolved oxygen, free CO
2, total
dissolved solids, phosphates were in negative correlation.Table 4 Pearson Correlation between limnological variables and zooplankton
Limnological Variables Cladocera Copepod Ostracod Nauplius Rotifer Insect Nematode OligochaeteTemperature 0.32 0.03 0.43 0.50 -0.10 0.77 0.44 0.44Light Penetration -0.12 0.18 -0.23 -0.31 0.30 -0.62 -0.61 -0.61Conductivity 0.64 0.38 0.72 0.77 0.26 0.94 0.09 0.09pH -0.03 0.27 -0.14 -0.22 0.39 -0.54 -0.68 -0.68Turbidity 0.76 0.54 0.83 0.87 0.43 0.99 -0.08 -0.08TS 0.89 0.72 0.94 0.96 0.63 1.00 -0.32 -0.32TSS 0.92 0.76 0.96 0.98 0.68 0.99 -0.37 -0.37TDS -0.96 -0.84 -0.99 -1.00 -0.77 -0.96 0.50 0.50DO -1.00 -0.95 -0.99 -0.98 -0.91 -0.86 0.70 0.70Free CO2 0.60 0.33 0.69 0.74 0.21 0.93 0.14 0.14Chlorides 0.99 0.91 1.00 1.00 0.85 0.92 -0.61 -0.61Total hardness 0.97 0.85 0.99 1.00 0.78 0.96 -0.51 -0.51Total alkalinity 0.94 1.00 0.90 0.86 1.00 0.63 -0.91 -0.91Silicates -0.20 -0.48 -0.08 0.00 -0.58 0.34 0.83 0.83Nitrates 0.87 0.69 0.92 0.95 0.59 1.00 -0.27 -0.27Phosphate -0.96 -1.00 -0.92 -0.89 -0.99 -0.67 0.88 0.88DO -1.00 -0.95 -0.99 -0.98 -0.91 -0.86 0.70 0.70
Conductivity, turbidity, total solids, total suspendedsolids, free CO
2, chlorides, total solids, total alkalinity and
nitrates are more often positively correlated with all thephytoplankton classes except Euglenophyceae and
Cryptopyceae. Euglenophyceae was not much correlatedwith any physicochemical variable (Table 6). Total dissolvedsolids, dissolved oxygen and phosphates were in negativecorrelation with all kinds of phytoplankton classes.
Table 5 Pearson Correlation between limnologicalvariables and Phytoplankton
Limnolog-ical Bascillariophyc- Cyanophyc- Dianophyc- Euglenophyc- Cryptophyc- Xanthophyc-Variables eae eae eae eae eae eaeTemperature 0.49 0.64 0.56 -0.49 0.40 0.54Light Penetration -0.31 -0.47 -0.38 0.66 -0.20 -0.35Conductivity 0.77 0.87 0.82 -0.15 0.70 0.80pH -0.22 -0.39 -0.29 0.73 -0.11 -0.26Turbidity 0.87 0.94 0.90 0.03 0.81 0.89TS mg/l 0.96 1.00 0.98 0.26 0.93 0.97TSS mg/l 0.98 1.00 0.99 0.32 0.95 0.99TDS mg/l -1.00 -0.99 -1.00 -0.45 -0.98 -1.00DO -0.98 -0.94 -0.97 -0.66 -1.00 -0.97Free CO2 0.74 0.85 0.79 -0.20 0.66 0.77Chlorides 1.00 0.97 0.99 0.56 1.00 0.99Total hardness 1.00 0.99 1.00 0.45 0.98 1.00Total alkalinity 0.86 0.76 0.82 0.88 0.91 0.84Silicates -0.01 0.17 0.07 -0.86 -0.11 0.04Nitrates 0.95 0.99 0.97 0.22 0.91 0.96Phosphate -0.89 -0.79 -0.85 -0.85 -0.93 -0.86

70
International Conference on Ecosystem Services of Wetlands - ‘Ardrabhumi :2016’ISBN : 978-81-923628-3-0
Conclusion
Since the water body is undisturbed and leastexploited, all limnological variables were found within limits.There is good number and variety of zooplankton andphytoplankton which can support fishing activity. The leastnumber of plankton was noted in monsoon season and wasfound to be negatively correlated with dissolved oxygenand phosphates which is a surprising observation Thisneeds to be further investigated.
Acknowledgment
The authors are thankful to management,B.N Bandodkar College and C.K. Thakur College forproviding necessary assistance to carry out this work. Weare also thankful to the Principal, D.G. Ruparel College forhis support.
References
Ahmad, S. H. and A. K. Singh (1993) Correlation betweenphysico-chemical factors and zooplanktons during diurnalvariations in a freshwater tank at Dholo (Bihar), India. J.Environ. Biol. 14 (2), pp:95-105.
American Public Health Association (APHA) (1985)Standard Methods for the examination of water and wasterwater, 15th edition. APHA, New York, USA.
Battish, S. K. (1992) Freshwater zooplankton of India. Oxfordand IBH Publishing Co., pp: 233.
Bellinger, E. E. (1992) A key to common algae. Freshwater,esturine and some coastal species. The Institute of Waterand Environmental Management, London. pp: 139
Bhalla, R., V.S. Lomte and M.B. Mule (2007) Investigation ofphysico-chemical parameters of Godavari river in Nashikcity, Maharashtra. Poll Res. ,26(3), pp:495-498.
Bucka,H.(1998).The mass invasion of several blue-greenalgae in two drinking water supply reservoirs in southernPoland. In D.G.George,J.G.Jones,P.Puncochar,C.S.Reynolds& D.W.Sutcliffe(eds.).Management of lakes during globalclimate change. Kluwer, Dordrecht, Netherlands p. 145-151.
Cerqueira, M.A, J.F. Silva, F.P. Magalhaes; F.M. Soares andJ.J. Pato (2007) Assessment of water quality in the Antuariver basin (Noethwester Poertugal). Environ. Monit AssessDOI 10.1007/s10661-007-9932-7.
Chatterjee, C. and M. Raziuddin (2002) Abatement of nutrientlevel of polluted river water by water hyacinth(Eichhorniacrassipes). Nature, Environment and PollutionTechnology, 1(4), pp: 357-360.
Dhanapathi, M.V. S. S. S. (2000) Taxonomic notes on rotifersfrom India. I.A.A.B., pp: 15-97.
Fritsch, F. E. (1979) The structure and reproduction of algae.Vol. I and II. Vikas Publishing House. p 1730
Goldman, C. K. andA. J Horne. (1983) Limnology. McGrawHill, Tokyo.
Jones, J.B.; Stanley E. H. and Mulhollan P.J (2003) Longterm decline in carbon dioxide supersaturation in river acrossthe contiguous United States. Geographical ResearchLetters, 30(10).
Kadam, D.D., Mali, R.P., Kadam, M. S. and N. E Ambore,.(2005) Ecology of Bhategaon dam, district Parabhani,Maharashtra. J. Aqua. Bio. 20(2), pp: 101-104.
Lefrancois, J., Grimaldi, C., Gascuel-Audoux C., Gillet, N.(2007) Suspended sediment and discharge relationships toidentify bank degradation as a ain source on small agriculturalcatchments. Hydrobiological Processes, 21(21), pp: 2923-2933.
Leitao, M.; S. M. Morata; S. Rodriguez and J. P. Vergon(2003) The effect of perturbations on phytoplanktonassemblages in a deep reservoir (Vouglans, France).Hydrobiologia, 502,73-83.
Clesceri L. S. (1998) Standard methods for examination ofwater and wastewater, 20thEdn. Ameriacan Public Healthassociation, Washington DC, USA
Loganayagi A Damodarkumar S and Murugesan S (2008)Quality of drinking wate in and aroundThriuvallur districtTamil nadu Nat. Envi. And Poll. Tech. 7(1) 133138.
Manna, R.K. and A. K. Das (2004) Impact of the river Moosion river Krishna I. Limnochemistry. Poll. Res., 23(1), 117-124.
Mathur, S. P. and N. Maheshwari (2005) Physico-chemicalaspect of pollution in Chambal river. Indian J. EnvironmentalProtection, 25(10), pp: 933-937.
Meitei, Shubhachandra N.; P .M. Patil and A. B Bhosle,.(2004) Physico-chemical analysis of Purna River forpotability. J.Aqua. Biol., 19(1), pp: 103-105.
Pennak, R. W. (1955) Comparative limnology of eightCalarado Mountain lakes. Univ. Colo. Stud. Biol., 2, pp: 1-75(Int).
Rustadi; R. Kuwabara and H. N. Kamiso (2002) Water qualityand planktological approach ot monitor eutrophication bycage-culture of red tilapia (Oreochronis sp.) at the SermoReservoir, Yogyakarta, Indonesia. Asian Fishery Science,15, 135-144.
S. T. and Kamat N. D. (1984) Freshwater diatoms fromMaharashtra. SaikrupaPrakashan, Aurangabad.
Shanthi, V.S.; A. J. Muthumeena, and V. J. Florence Borgia

71
International Conference on Ecosystem Services of Wetlands - ‘Ardrabhumi :2016’ISBN : 978-81-923628-3-0
(2006) Physicochemical status ofVaraga river at Thenidistrict, Tamil Nadu. J. Aqua.Biol. 21(2). pp:123-127.
Thornton, K. W., B. L. Kimmel and F. E. Payne eds. (1990)Reservoir Limnology: Ecologiacal perspective. John Wileyand Sons. New York. pp: 246.
Tiwary, R. K., G. P. Rajak, Abhishek and M. R. Mondal (2005)Water quality assessment of Ganga river in Bihar region,India. Journal of Environ, Science and Engg., 47(4), pp: 326-335.
Ward, H. P. and Whipple, G. C. (1958) Freshwater biology.Mc Graw Hill and Co., New York.
Whitton, B. A. andM.Potts, [Eds.] 2000.The Ecology ofCyanobacteria:Their Diversity in Time and Space
Yakubu A F, F.D. Sikoki, J.F.N. Abowei and S.A. Hart (2000)A comparative study of phytoplankton communities of somerivers, creeks and burrow pits in the Niger Delata Area J.Applied Science Environment Management, 4, 41-46.

72
International Conference on Ecosystem Services of Wetlands - ‘Ardrabhumi :2016’ISBN : 978-81-923628-3-0
Studies on the Growing Menace of Aquatic Weeds in the Backwatersof Kerala, India
Moses Kolet*Dept. of Botany, K.M.E. Society’s G.M.Momin Women’s College, Bhiwandi, 421 302, Dist.Thane, Maharashtra
*Dept. of Botany (On Lien), VPM’s B.N. Bandodkar College of Science, Thane, 400601.Email: [email protected]
Abstract : The backwaters of Kerala are acclaimed all over the world for their scenic beauty.In recent times, these unique waterbodies are facing challenges posed by aquatic weeds which have appeared over the past few decades and have turned into a threat,choking the system, at an alarming rate.Nine aquatic weeds were documented during the current study. Eichhornia crassipes(Mart.) Solms (Water hyacinth), Salvinia molesta D. Mitch.(African Payal) and Pistia stratiotes Linn. (Water lettuce) were mostprominently and abundantly encountered, while Alternanthera philoxeroides Griseb.(Alligator weed), Azolla pinnata R.Br.(Mosquito fern), Lemna minor L. (Duckweed), Limnocharis flavia(L.)Buchenau (Manjapayal), Cabomba caroliniana Gray(Mullen payal) and Hydrilla verticillata (L.f.) Royle (hydrilla) were comparatively less abundant and sometimes localized butspreading.While multiple factors are attributed to have contributed towards proliferation of the aquatic weeds and the resultingadverse effects are amply visible, a permanent solution to the problem remains elusive at the moment.
Keywords: Aquatic weeds, Kerala, backwaters, Eichhornia, Salvinia, Pistia
Introduction
The backwaters of Kerala in southern India are wellknown all over the world for their unmatched beauty. Theseactually are a large chain of navigable interconnectedlagoons, lakes, rivers and natural and manmade canalsstretching parallel to the Malabar Coast, ahuge labyrinth ofover 900 km of waterways, fed by 38 rivers and extendingover half the length of Kerala state; making it the Indianstate having largest proportion of land area under wetlands(Abraham, 2015). Within this unique wetland landscape, areseveral minor and major towns and cities catering to thefamous backwater cruises an integral part of backwatertourism.The unique kettuvallams (houseboats) andbackwater resorts have added great value to Kerala’stourism. Today, apart from over 2000 tourist kettuvallams, alarge variety of country craftsand ferry services regularlyply the waters of the network, transporting men andmaterials. Each town along the backwaters has its owninterconnected network of canals and water ways connectedto the main network. These internal canals are much likepresent day network of roads; and even end up into thecourtyard or backyard of each house, as parking lots forboats; similar to current day car parking lots.Some of theseinternal canals are now flanked by modern roadways, thebridges over canals and waterways, being an integral featureof the landscape.A part of this unique water body is includedin the list of wetlands of international importance (RamsarConvention, 1971).
The backwaters and their surrounding lands are knownfor their unique ecosystem supporting equally unique lifeforms. The waterways run alongside low-lying extensivefields of paddy, banana, cassava and yam that areirrigatedwith fresh water from the wetlands.Thesebackwaters have been used for centuries by the locals forfishing, agriculture and transportation. The coconutcultivations lining the waters support a flourishing coirindustry.
Owing to modern faster road transports, many of theerstwhile minor waterways and canals have fallen intodisuse in current times and have been infested by aquaticweeds, which have come into the scenario within the lastfew decades (Ramachandran, 1961; Kannan, 1979) mostlyintroduced as ornamentals (Indian Express, 2013), and arecurrently gregariously spreading, becoming a menace,threatening to choke the entire system(ENVIS, 2013).Thepast few years have seen a surge in reports on invasiveaquatic weeds affecting backwater habitats of Kerala. Thepresent study was conducted to assess the extent of aquaticweeds affecting the system and measures taken to alleviatethe dangers to this unique wetland system.
Materials and Methods
The study was carried out in and around backwaterareas of Alapuzza and Kottayam in Kerala. Site visits wereconducted to the area of study from 2010-2014. The invasiveaquatic weeds observed were listed and documented.

73
International Conference on Ecosystem Services of Wetlands - ‘Ardrabhumi :2016’ISBN : 978-81-923628-3-0
Results and Discussion
Table 1. Aquatic weeds infesting backwaters of Kerala
S.No. Common name Botanical name TypeA Prominent by their presence1 Water hyacinth, pola Eichhornia crassipes (Mart.)Solms Free floating2 Water fern, Giant salvinia, Salvinia molestaD. Free floating
African Payal (pyle), Kariba weed Mitch.Salvinia spp.3 Water lettuce, shellflower Pistia stratiotes Linn. Free floatingB Less prominent/ Localized4 Alligator weed Alternanthera philoxeroides Griseb Perennial herb visible
Alternanthera spp. as tangled masses in waterand along shores, floating,
rooted5 Water velvet, Mosquito fern Azolla pinnata R.Br. Free floating6 Duck weed Lemna minor L. Free floating7 ManjaPayal Limnocharis flavia(L.)Buchenau Emergent weed8 Cabomba, Fanwort, Mullen Payal Cabomba caroliniana Gray Submerged, rooted9 Hydrilla Hydrilla verticillata (L.f.) Royle Submerged
Table 2. Aquatic weed management strategies
(Oliver, 1993;Varshneyet al., 2008; Muniappanet al., 2009;Sushilkumar, 2011; Jayan and Sathyanathan, 2012)
S.No. Type of Control Agents used Remarks/ Used against
1 Physical Manual harvesting Grossly inadequateMechanical aquatic weed harvesters Temporary relief obtained
2 Chemical Copper sulphate submerged weeds(Chemical Sodium arsenite submerged weeds
herbicides) Hydrogen peroxide submerged weeds2,4D submerged and floating weedsDichlobenil submerged and floating weedsDiuron submerged and floating weedsTrazines submerged and floating weedsParaquat floating weedsDiquat submerged and floating weedsEndothall submerged weedsFluridone submerged and floating weedsGlyphosate floating weeds
Bulk use of chemical weedicides has detrimental effectsReducing concentration of nutrients in waterbody slows down weed growth
3 Biological Neochetina bruchi, N. eichhorniae Eichhornia crassipes(Arthropods) Orthogalumnatere brantis
Sameodesalbi guttalisCyrtobagussalviniae, C. singularis, C. affinis Salvinia molestaNeohydronomous pulchellus Pistia stratiotesEpipsammia pectinicornisParapoynx dimunutalis Hydrilla verticillataBagous spp.Hydrellia spp.Agasicles hygrophila Alternanthera philoxeroides

74
International Conference on Ecosystem Services of Wetlands - ‘Ardrabhumi :2016’ISBN : 978-81-923628-3-0
(Fungi) Alternaria alternate, A. eichhorniae Eichhornia crassipesCerespora rodmaniiFusarium eguisettiMyrothecium roridum Salvinia molestaSclerotium rolfsi Pistia stratiotesCercosporasp.Fusarium roseum, F. culmorum Hydrilla verticillata
(Phytophagous Tilapia melanopleurea Various aquatic weedsFish) Ctenopharyngo donidella
Hypothalamichthys molitrix(Allelochemicals) Cassytha powder Eichhornia crassipes,Laboratory- and Salvinia molesta, Pistia stratiotes,micro-pond level Azolla pinnata, Lemna minor
experiments Partheniumhysterophorusleaf residue Eichhornia crassipesColeus ambonicusleaf powder Eichhornia crassipesRice cultivar BPT and ADT-36 residues Eichhornia crassipes
The areas of study are situated in the middle of theextensive labyrinth of the network of backwaters of Keralaand are hotspots of backwater tourism and related activities.Nine aquatic weeds were documented during the currentstudy. The aquatic weeds encountered during the study ofbackwaters are presented in Table 1.Three weeds vizEichhornia crassipes (Mart.) Solms (Water hyacinth),Salvinia molesta D. Mitch.(African Payal) and Pistiastratiotes Linn. (Water lettuce) were most commonly,prominently and abundantly encountered, while theremaining six aquatic weeds namely, Alternantheraphiloxeroides Griseb. (Alligator weed), Azolla pinnataR.Br. (Mosquito fern), Lemna minor L. (Duckweed),Limnocharis flavia(L.) Buchenau (Manjapayal),Cabomba caroliniana Gray (Mullen payal) and Hydrillaverticillata (L.f.) Royle (hydrilla) were comparatively lessabundant and sometimes localized. Nevertheless the menacewas apparently invasive and spreading.
The different strategies to manage the aquatic weedsare depicted in Table 2. While laboratory- and micro-scaleexperiments on aquatic weed management have been largelysuccessful (Patil et al., 2012), actual percentage of successin the field in large scale implementations in the area ofstudy has however always been limited and only partial,thus never totally eliminating the aquatic weeds menace.
While the larger canals and waterways of prominenceare routinely cleaned and cleared of the aquatic weeds,medium and small canals were largely found to be heavilyinfested with the invasive species, rendering watertransportation impossible. Regular usage of larger canalsby mechanized ferry boats, house boats and country craftsensured keeping of the aquatic weeds at bay to a certainextent, while many a times, the boats had to directly passthrough the jungle of weeds, with only a narrow channel forthe boats amidst a thick carpet of weeds. In the network of
backwaters, the medium and small canals that had falleninto disuse for water transportation, in favour of modernand faster means of land transportation;were found to beheavily and totally infested by aquatic weeds. Even thewaterways in regular use were found to be struggling withthe challenges and problems posed by the invasive weeds,a permanent solution to which is yet awaited.
Appearing on the scene by introductions throughhuman activities (ENVIS, 2014) during 1884- 1950s, theaquatic weeds were first recorded as invasive pests in thearea of study in the 1960s (Cook and Gut, 1971). Eichhorniacrassipes (Water hyacinth), notoriously referred to as oneof the world’s worst aquatic weed, remains the single largestmenacing aquatic weed in the backwaters, followed bySalvinia molesta and Pistia stratiotes. Tackling the menacewith mechanical weed harvesters has not solved the problem;providing only short and temporary relief; as the fastgrowing water hyacinth is known to double its populationin as less as 12 days (The Hindu, 2009). Several physical,mechanical, chemical and biological approaches have alsobeen tried and although successful in laboratory and micro-pond scale experiments, success at actual locations has beenlimited; although the Kerala Agricultural University has beenattributed some success in dealing with Salvinia (The Hindu,2014). An integrated approach to management of the aquaticweeds in the area was also suggested (Jayan andSathyanathan, 2012). The concept of eradication throughutilization was also practiced in and around the region (Kurupet al., 2005; Lekshmi and Viveka, 2011; Prabhu, 2014,Chandran and Ramasamy, 2015; The Hindu, 2015a) butfacilities were apparently and grossly inadequate vis a visthe scale of infestation and the menace remains andcontinues to spread (Abhilash et al., 2008).
Among the aquatic weedsstudied, Eichhornia crassipes, Salvinia molesta, Hydrilla

75
International Conference on Ecosystem Services of Wetlands - ‘Ardrabhumi :2016’ISBN : 978-81-923628-3-0
verticillata, Alternanthera philoxeroides and Pistiastratiotes are weeds of global distribution that alsoqualify as the worst aquatic weeds in India (Sushilkumar,2011). While multiple related as well asunrelated factors areattributed to have contributed towards proliferation of theseaquatic weeds (TNN, 2013), and the resulting adverse effects(Narayanan et al., 2011; Rice et al., 2012; Frezina, 2013;Datta,2014; Pratap Chandran, 2014, The Hindu, 2015b) onaesthetics, agriculture, business, commerce, communication,ecosystem, fishing, health, livelihood, productivity andtourism of the area are amply visible, a permanent solutionto the problem remains elusive at the moment.
Conclusion
Nine aquatic weeds viz. Eichhornia crassipes (Mart.)Solms (Water hyacinth), Salvinia molesta D. Mitch.(AfricanPayal), Pistia stratiotes Linn.(Water lettuce), Alternantheraphiloxeroides Griseb.(Alligator weed), Azolla pinnata R.Br.(Mosquito fern), Lemna minor L. (Duckweed), Limnocharisflavia(L.)Buchenau (Manjapayal), Cabomba carolinianaGray (Mullen payal) and Hydrilla verticillata (L.f.) Royle(hydrilla) were documented during the current study. Theformer three were significantly predominant while the lattersix were a potential menace by virtue of their fast nature ofspreading and invasiveness.
Acknowledgements
The author gratefully acknowledges co-operation,inspiration and support received from the management ofKonkan Muslim Education Society of Thane District, VidyaPrasarak Mandal, Thane, the Principal, B N BandodkarCollege of Science, Thane, Ms. G.S. Mary from Fort Kochiand Dr. Jikku Jose from Society for Educational and ScientificResearch.
References
Abhilash, P.C., Singh, Nandita, Sylas, V.P., Ajay Kumar,Mathew, J. C., Satheesh, R. and Thomas, A.P. (2008). Eco-distribution mapping of invasive weed Limnocharisflavia(L.) Buchenau using geographical information system:Implications for containment and integrated weedmanagement for ecosystem conservation.Taiwania 53 (1):30-41.
Abraham, S. (2015). The relevance of wetland conservationin Kerala.Int J of Faunaand Biol Studies 2(3): 1-5.
Chandran, S.S. and Ramasamy, E.V. (2015).Utilization ofLimnocharisflavia, an invasive aquatic weed from Kuttanadwetland ecosystem, Kerala, India as a potential feedstockfor livestock.Online Journal of Animal and Feed Research5 (1): 22-27.
Cook, C.D.K. and Gut, B.J. (1971). Salvinia in the State ofKerala, India.PANS Pest Articles and News Summaries 17(4): 438-447.
Datta, R. (2014). Imported Plight: Invasive alien weds ofIndia. Science Reporter, August 2014. pp. 42-43.
ENVIS.(2013). Cabomba plant a new threat to water bodiesin Kerala. ENVIS Centre, Kerala. www.kerenvis.nic.in/ViewGeneralLatest News; accessed on 1/1/2016.
ENVIS.(2014). ENVIS Centre.Kerala, State of Environmentand Related Issues, Invasive species.www.kerenvis.nic.in/Database/Invasive species_1095.aspx; accessed on 29/12/2015.
Frezina, N.C.A. (2013). Assessment and utilization of waterhyacinth in the water bodies of Tamil Nadu.IJSRR 2(1): 58-77.
Indian Express.(2013). Cabomba plant a new threat to waterbodies in Kerala. The New Indian Express, Kochi, 25 January2013.
Jayan, P.R. and Sathyanathan, N. (2012).Aquatic weedclassification, environmental effects and the managementtechnologies for its effective control in Kerala, India.IntJAgric&BiolEng 5(1): 76-91.
Kannan, K.P. (1979). Ecological and socio-economicconsequences of water-control projects in the Kuttanadregion of Kerala.Proc. Indian Acad. Sci. C2 (4): 417-433.
Kurup, S.C.R., Snishamol, C. and Nagendra Prabhu, G.(2005).Cellulase production by native bacteria using waterhyacinth as substrate under solid state fermentation. Mal.J. Microbiol.1 (2): 25-29.
Lekshmi, N.C.J.P. and Viveka, S. (2011). Hyacinth compostas a source of nutrient for Abelmoschusesculentus.IndianJournal of Science and Technology 4 (3): 236- 239.
Muniappan, R., Reddy, G.V.P. and Raman, A. (Eds.).(2009).Biological Control of Tropical Weeds usingArthropods.Cambridge University Press.ISBN 978-0-521-87791-6.
Narayanan, S.P., Thomas, A.P. and Sreekumar, B.(2011).Ornithofauna and its conservation in the Kuttanadwetlands, southern portion of Vembanad-KoleRamsar site.India. Journal of Threatened Taxa 3 (4): 1663-1676.
Oliver, J.D. (1993). A review of the biology of giant salvinia(Salviniamolesta Mitchell).J.Aquat. Plant Manage.31: 227-231.
Patil, J.H., Raj, M.A., Muralidhara, P.L., Desai, S.M. and Raju,G.K.M. (2012).Kinetics of anaerobic digestion of waterhyacinth using poultry litter as inoculum. Int J

76
International Conference on Ecosystem Services of Wetlands - ‘Ardrabhumi :2016’ISBN : 978-81-923628-3-0
Environmental Sci and Dev 3(2): 94-98.
Prabhu, Nagendra, G. (2014). Aquatic weeds- Modern day‘kalpasasyas’. Proc. International conf on Biosciences:State-of-the-art advancements, 11-12 Sept 2014, Kottayam,Kerala, ISBN 818805880: 13.
Pratap Chandran, R. (2014). Harbouring of pathogenicmicroorganisms by aquatic weed, Eichhorniacrassipes inits rhizosphere.Int J Chem Tech Research 6 (2): 1413-1417.
Ramachandran, S. (1961).Limnocharis H.B.K.: A new recordto India.Journal ofBombay Natural History Society 64: 389-390.
Ramsar Convention.(1971). www.ramsar.org
Rice, A., Joseph, M., Kuriakose, M., Fang, S., Schwee, S.and Kosztin, T. (2012). Hyacinth Heroes.FinalReport.www.pickar.caltech.edu/me105/projects/2012/Hyacinth%20Heroes.pdf; accessed on 1/1/2016.
Sushilkumar.(2011). Aquatic weeds problems andmanagement in India.Indian Journal of Weed Science 43(3&4): 118-138.
The Hindu.(2009). Invasive species pose threat to waterbodies. The Hindu, Kerala, 22 May 2009.
The Hindu, (2014). Rivers choke on aquatic weeds. TheHindu , Kerala, 2 July 2014.
The Hindu.(2015a). Crib fashioned out of water hyacinth.The Hindu, Kerala, 25 December 2015.
The Hindu.(2015b). Not yet a smooth sailing along NWIII.The Hindu, Kochi, 24 December 2015.
TNN.(2013).Vembanad lake turns a maze as water hyacinthsreappear. Times News Network; The Times of India, Kochi,30 October 2013.
Varshney, J.G., Sushilkumar and Mishra, J,S, (2008). Currentstatus of aquatic weeds and their management in India. Proc.Taal 2007: The 12th World Lake Conference (Sengupta, M.and Dalwani, R. (Eds.). pp. 1039-1045.

77
International Conference on Ecosystem Services of Wetlands - ‘Ardrabhumi :2016’ISBN : 978-81-923628-3-0
Diversity of Marine Macroalgae from Devgad in Sindhudurg Districtof Maharashtra
N. M. Valanju1 and V. M. Jamdhade2
1,2Department of Botany,VPM’s B.N. Bandodkar College of Science,
Bunder Road, Chendani, Thane (W) 400 601.E-mail: [email protected]
Abstract: Different sites from Devgad coastline shows variety of rich macro algal forms of various taxonomic groups. Studyof the macro algal diversity in the post-monsoon and pre-monsoon season reveals abundance of members of class- Chlorophyta,Phaeophyta and Rhodophyta. In all total 33 numbers of macro algal taxa comprising 5 genera and 14 species of Chlorophyta,6 genera and 10 species of Phaeophyta, 9 genera and 9 species of Rhodophyta were recorded. However members ofChlorophyta are relatively dominant over the other classes of macroalgae at the coastline of Devgad in the present study.
Keywords: Diversity, Macro-algae, Devgad, Sindhudurg district, Maharashtra
Introduction:
Macroalgae have been used since ancient times asfood, fodder, fertilizer and as a source of medicine. Now adays’ macroalgae are used as raw material for many industrialproductions like agar, algin and carrageenan and it is widelyconsumed as food in many Asian countries. They arenutritionally valuable as fresh or dried vegetables and certainedible macroalgae contain significant quantities of protein,lipids, minerals and vitamins (K. Manivannan et al, 2008).The macroalgae, one of the important component of primaryproducer, it provides habitat and food to the variety ofinvertebrate and also play important role in nutrientsrecycling (Duggins et al, 1989). Different researchers havedone analysis of primary metabolites in seaweeds and alsoextensive study has been done for investigation of differentchemicals, protein, lipids, carbohydrates, amino acids, fattyacids, palmatic acids, oleic acids and for toxicity etc. Thefirst record of utilization of seaweeds is found in Chineseherbaria, since than sea weeds are still used as a source offood, fodder and manure throughout the world. In India,manures from brown seaweeds are directly used as compostor as dried seaweed meal in coconut plantation and forOrchard trees. Black and Woodward, (1957) reported superiorperformance of seaweed manure than the conventionalorganic manure. Oza and Zaidi (2001) reported 844 algalspecies from sea coast of India and out of that 197 wererecorded from Maharashtra. Different seaweed extracts arebeing marketed in the form of spray’s, as a growth promotersfor fruit plants. Bhosale, et. al., (1975) and Bukhari andUntawale, (1978) studied the effect of marine algal extractson seed germination, growth and yield of common vegetableand fruit crops. Various laboratories have reported thatseaweeds can be used in tertiary sewage treatment process(Sawyer, 1956 and Tewari, 1972). This appears to besignificant study on the algal diversity of the Devgadcoastline, has under taken in the present work. The presentinvestigation is outcome of biodiversity studies of marine
macro algae was undertaken to enrich our knowledge ofalgal flora of this area.
Material and Methods:
The present survey was carried out to knowMacroalgal diversity along the coastal areas of Devgad tehsilin Sindhudurg district of Maharashtra. The rocky and sandybeaches of this area were frequently visited to recordMacroalgal diversity. At the sites, the Macroalgal specieswere collected manually during low tides in post-monsoonand pre-monsoon season. The marine algae were collectedin polythene bag randomly and brought to the laboratory.Collected species of Algae were preserved in 5%formaldehyde and herbarium specimens were prepared foreach species for identification and confirming theirtaxonomic position. Identification of species was done byusing publication of Taylor (1960), Jha et. al (2009), Deodhar(1987).
Study site Map:

78
International Conference on Ecosystem Services of Wetlands - ‘Ardrabhumi :2016’ISBN : 978-81-923628-3-0
Results and Discussion:
Survey of coastal area Devgad was carried out duringthe year 2012-2013. The sites were visited every month forrecording Macroalgal species. Macroalgal speciespresented in table
Table No. 1. List of marine macroalgae
Macroalgae Post- Pre-monsoon monsoon
ChlorophyceaeBryopsis plumosa - �
Caulerpa peltata - �
Caulerpa racemosa � �
Caulerpa sertlaroides � �
Caulerpa scalpelliformis � -Caulerpa taxifolia � �
Chaetomorpha antennina � �
Chaetomorpha media � �
Enteromorpha compressa � -Enteromorpha intestinalis � �
Enteromorpha flexousa � -Ulva fasciata � �
Ulva lactuca � �
Valonia utricularis � �
PhaeophyaceaeDictyota dichotoma � �
Dictyota maxima � �
Ectocarpous siliculosus � �
Padina gymnosperma - �
Padina tetrastromatica � �
Sargassum cinereum � �
Sargassum ilicifolium � �
Sargassum tenerrimum � �
Spatoglossum asperum � �
Stoechospermum marginatum � -RhodophytaAcanthophora spicifera � �
Amphiroa anceps � �
Ahnfeltia plicata � -Coralline berteroi � �
Hypnea musciformis � �
Gelidium pussilum � -Gracilaria corticata � �
Grateloupia filicina - �
Jania rubens � �
Totally 33 species of marine macro algae (seaweeds)were reported from the coastline of Devgad of Sindhudurgdistrict. Chlorophyceae was represented with 14 macroalgalspecies, Phaeophyceae with 10 species and Rhodophyceae
with 9 species. In the beginning of post monsoon season inOctober many macroalgal species like chlorophyceae,phaeophyceae and rhodophyceae were growing in complexmanner. In October month Chaetomorpha antennina andUlva fasciata were growing luxuriantly forming green beltand at the end of this month Chaetomorpha antenninashowed minimum growth or totally absent.
Species like Chaetomorpha antennina, Ulva fasciata,Ulva lactuca, Caulerpa racemosa, Caulerpa texifolia,Enteromorpha intestinalisand Stoechospermummarginatum were abundant in post- monsoon season.Bryopsis plumosa, Caulerpa peltata, Padina gymnospermaand Grateloupia filicina observed frequently in pre-monsoon season. Most of the species like, Caulerparacemosa, Caulerpa sertlaroides, Caulerpa taxifolia,Chaetomorpha antennina, Chaetomorpha media,Enteromorpha intestinalis, Ulva fasciata, Ulva lactuca,Valonia utricularis, Dictyota sps., Padina tetrastromatica,Sargassum sps., Acanthophora spicifera, Amphiroa anceps,Corallina berteroi, Hypnea musciformis, Gracilariacorticata and Jania rubens in appreciable number duringboth post and pre monsoon seasons.
In the post monsoon season macroalgal growth wasluxuriant along the selected site. It shows decreasing trendsin the number of macroalgae in the middle of pre monsoonseason. Along the Indian sea coast about 624 species ofseaweeds have been recorded (Untawale et. al. 1983). Fromthis record 159 species belonged to Chlorophyta, 141 speciesto Phaeophyta, 307 species to Rhodophyta and 17 speciesbelonging to Cyanophyta. Dhargalkar et. al., (2001) reported91 macroalgal species from entire coast of Maharashtradistributed in 51 genera and 30 families. Phanase (2000)mentioned 56 species and 37 genera from entire Konkancoastline. From this extensive work, their results revealedthat the west coast of India was richer in marine algae. In thepresent study 33 species of marine macro algae wererecorded. It shows decreas in species richness from thepast decades. It was interesting to notice the presence ofBryopsis plumosa and Acanthophora spicifera were newto this site. Bryopsis plumosa was rare and appeared onlyonce in the whole survey.
Reduction in the macroalgal forms were observed dueto the biological disturbance along the seashore. Thistrend was also reported by Dhargalkar et. al.,(2001), whenthey reported 46 macroalgal species from entire Ratnagiricoast. Few studies revealed cumulative impact of pollution,siltation and habitat fragmentation on macroalgal diversity.
Conclusion:
The occurrence and distribution of macroalgal speciesvaried with the location. The species like Gracilaria andGelidium occurs in abundance can be utilized for the

79
International Conference on Ecosystem Services of Wetlands - ‘Ardrabhumi :2016’ISBN : 978-81-923628-3-0
extraction of agar-agar and some macroalgae are biologicalactive and useful as food, fodder, fertilizer and medicine.Number of survey has been carried out at selected site tostudy distribution, abundance and variation. So it isnecessary to have long term monitoring programme atselected site to avoid loss of macroalgal species and toconserve biodiversity of selected coastline.
Acknowledgement:
The authors gratefully acknowledge the Principal, B.N.Bandodkar College, Thane and HOD, Dept. of Botany fortheir valuable encouragement during the studies.
References:
Bhosale N. B, Untawale A. G., Dhargalkar V. K. 1975. Effectof seaweed extract on the growth of Phaselous vulgarisLin. Indian Journal of marine science Vol. 4, 208 – 210.
Black W. A. P., Wooldward F. N. 1957. Emp. J. Exp. Agriculture25, 51.
Bukhari S. S., Untawale A. G. 1978. Seaweeds as liquid fertilizerand foliar Spray, Seaweed Research and Utilliziation. Vol.3(1 & 2), 71 – 78.
Deodhar H. D. 1987.The biology of marine algae ofBombay,Ph.D Thesis, University of Pune.
Dhargalkar V. K., Untawale, Jagtap T. G. 2001.Marinemacroalgal diversity along the Maharshtra coast: past andpresent status.Indian Journal of Marine Sciences.Vol.30,(Natl.Ins.Oceanogr.,Goa, India). 18-24.
Duggins D. O., Simenstad C. A., Estes J. A. 1989.Magnification of secondary production by kelp detritus incoastal marine ecosystems.Science.245:170-173.
Jha, B., Reddy, C. R. K., Thakur, M. C., and Rao, M. U. 2009.CSMCRI Seaweeds of India, The Diversity and Distributionof Seaweeds of Gujarat Coast.
Manivannan, K. G. Thirumaran, G. Karthikai Devi, A.Hemalatha, P. Anantharaman. 2008. Biochemical compositionof seaweeds from Mandapan coastal regions alongSoutheast coast of India. American-Eurasian Journal ofBotany. 1(2): 32-37.
Oza R. M., ZaidiS H. 2001.A revised checklist of Indian marinealgae.42, 105, 148.
Phanase S. S. 2000. Biology of marine algae of Konkan,Dissertation for M.Sc. by research.
Sawyer C. N. 1956.The sea lettuce problem in BostonHarbour.Journal of Water Pollution Control Fed.37(8).1122 -1133.
Taylor W. R. 1960. Marine Algae of the Eastern Tropical andSubtropical Coast of the Americas.The University ofMichigan Press. 825.
Tewari A. 1972. The effect of sewage pollution onEnteromorphaproliferaVar.tubulosa growing under naturalhabitat.Bot. Mar. 15.167
Untawale A. G., Dhargalkar V. K., Agadi V. V. 1983. List ofmarine algae from India,Tech. Report.(National.Inst.Oceanography, Goa, India). 42.

80
International Conference on Ecosystem Services of Wetlands - ‘Ardrabhumi :2016’ISBN : 978-81-923628-3-0
Impact of Water Released from Sewage Treatment Plant on MacrofaunalDiversity of Thane Creek, India.
Sheetal Pachpande and Madhuri PejaverVPM’s B. N. Bandodkar College of Science, Thane (West) affiliated to University of Mumbai, India.400601
Email: [email protected]
Abstract: Wetland ecosystems such as mangroves provide habitat to diversity of flora and fauna, of which macrobenthiccommunity forms the most important component of the food chain. Their presence gives information about the productivityof the ecosystems and indicates the health of the ecosystem. The present study was conducted along Thane creek for theperiod of 18 months from September 2009 to April 2011. Thane creek is located on the west coast of Maharashtra, India. Thetwo stations were selected on the basis of disturbed (waste water released) from Bhandup Pumping Station (BPS) and lessdisturbed (location having less human interference). The study showed dominance of phyla Mollusca, Annelida and Arthropodaat station I having influence of wastewater released from BPS and other location i.e station II showed dominance of phylumMollusca. The overall diversity and density of benthic organisms revealed presence of pollution tolerant organisms like fewspecies of gastropods, polychaetes , Microbivalvia, and crab species namely Illyoplax gangetica. Such alterations due todischarge of wastewater might lead to alterations in that ecosystem. Therefore constant monitoring its impact on localmacrobenthic community is crucial in developing effective management strategy for improving macrobenthic population.
Keywords: Mangroves, Macrobenthos, Thane creek, anthropogenic, impact, ecosystem
Introduction
Mangrove ecosystems are considered as one of themost productive ecosystems globally. Mangrove vegetationprovides a unique environment for the growth and breedingof various aquatic and sediment dwelling organisms suchas macrobenthos. Macrobenthos forms the importantcomponent of the marine foodchain (Singh, 1997; Zhang,2013; Thilagavathi, 2013; Musale, 2015) especially for bottomfish, birds and many other aquatic and non-aquatic species.According to Gaudencio and Cabral 2007; Shou et al. 2009,benthos are responsible for changes in physico-chemicalcharacteristics at water-sediment interface and offersdifferent services such as pollutant metabolism, recyclingof nutrients (Snelgrove 1998). Musale (2011) stated thatmacrobenthos thrive well in sediment rich in organic carbonand oxygen. These organisms are used as bioindicators ofthe environment as they are extremely sensitive to pollution(Beaugrand, 2014). Therefore, their constant monitoring isof utmost importance as the data related to alteration ofmacrobenthic assemblage with respect to anthropogenicstress will be crucial in designing of effective managementstrategy. Therefore, the study was undertaken to estimatethe impact of sewage water pollution on the assemblage ofmacrobenthos at selected stations along Thane creek,Maharashtra, India.
Materials and Methods
Study area
Thane Creek (Lat. 19o 00’N to 19o 13’N and Long. 72o
57’ E to 73o 00’E) is an inlet in the shoreline of the ArabianSea that isolates the city of Mumbai from the Indianmainland. The creek is 26 km long and joins Ulhas River on
its north by a minor connection near Thane city. The creekis tidally influenced with dominance of neritic waters.Extensive mudflats are formed along the banks of the creekwhich are characterized by the growth of mangroves
Station I is located (Latitude19°08’23.26"N andLongitude 72°57’26.75"E) on the Western bank of the Thanecreek, adjacent to the Bhandup pumping station (BPS). Itreceives treated water from the pumping station on a regularbasis. The station has a canal that connects the main channelof the creek. Owing to the continuous in-flow of wastewater,usually the salinity is found to be negligible. One side of thechannel showed slight dominance of fresh water mangroveBrugueira cylindrica. The other side of the channel showedthe presence of a mixed type of vegetation mainly Avicenniamarina, Sonneratia apetala, Salvadora persica and Derristrifoliata.
Station II is located (Latitude 19°08’40.73"N andLongitude 72°58’20.04"E) 1.5 km away from station I. Itshows the presence of a channel, which receives brackishwater from the main creek. This station is characterized bythe growth of mangroves comprising Avicennia marina,Exocaeria agallocha and Sesuvium portulacastrum. Twoaquaculture abandoned fishing ponds, probably built bythe local fishing community were observed. At station II,the area was used by many local fishers only for hunting ofcrabs thus sustaining minimal anthropogenic impact.
Methodology
Sediment samples from the study area were collectedfrom the low tide mark (Low-level watermark) to a little overthe mid tide mark (Mid-level watermark) from all the stations.The collection was done from 10 cm depth surface soil with

81
International Conference on Ecosystem Services of Wetlands - ‘Ardrabhumi :2016’ISBN : 978-81-923628-3-0
the help of a metal scoop of 0.01m2 (10cm x 10cm) dimension.Five scoops were randomly collected and pooled together.The sediment was then sieved and washed through meshsize 0.425 mm. The fauna collected on the sieve was separated,and identified up to phylum level, some at genus level, anddensity was recorded.
Table 1: Density of organisms (phylum and major groups)at both stations
Phylum Station I (no/m2) Station II (no/m2)
Phylum Cnidaria
Sea anemone 4.4 14.44
Total 4.4 14.44
Phylum Annelida
Polychaeta 1860 52.2
Nematoda 122.2 12.2
Total 1982.2 64.42
Phylum Mollusca
Gastropoda 2188.8 4748.8
Bivalvia 263.33 53.33
Total 2452.13 4802.13
Phylum Arthropoda
Crab 241.11 25.56
Barnacle 3.33 0
Total 244.4 25.56
Table 2. Physico chemical parameters of sedimentat both stations
Parameter Station I Station II
pH 7.48 7.47
Moisture Content (%) 61.8 64.2
Organic Carbon (%) 2.85 1.98
Chlorides (%) 0.75 0.95
Sediment Texture
Sand (%) 8.9 7.06
Coarse Silt (%) 44.05 40.20
Fine Silt (%) 34.6 31.70
Clay (%) 12.20 21.06
The diversity of 26 macrobenthic species representedby four phyla namely Cnidaria, Annelida, Mollusca andArthropoda were encountered, of which sea anemones,polychaetes, nematodes, gastropods, bivalves, crabs andbarnacles were the major groups.
Station I at BPS dominance of Mollusca, Annelidafollowed by Arthropoda were observed and at station IImaximum population comprised only of gastropods (fig1and fig 2). The number of crabs (Illyoplax gangetica) waspredominant only at station I.
Phylum Cnidaria was represented by presence of Seaanemones, however density of sea anemone was recordedvery less which might be due to absence of Avicennia albain the study area as Mishra et al. (1994) reported dominanceof sea anemones mainly near A. alba mangrove species.
Polycheaetes and Nematodes that belong to PhylumAnnelida and Aschelminthes were abundant only at stationI near BPS. Belan (2003) stated that polycheates serve asreliable indicators of environment quality assessmentindicating organic enrichment (Tomassetti and Porrello,2005), environmental disturbances (Ajmal Khan andMurugesan, 2005) and habitat recovery (Cardoso et al. 2007).The sediment data revealed maximum organic carbon contentat station I which might be one of factor contributing to

82
International Conference on Ecosystem Services of Wetlands - ‘Ardrabhumi :2016’ISBN : 978-81-923628-3-0
increase in the polychaetes and nematodes assemblage atBPS. According to Unnithan et al. (1975), polychaetes are aconsiderably tolerant group of animals and dominate innumber in the polluted zones (Pearson & Rosenberg, 1976),and their growth is enhanced due to sewage input (Ansariet al., 1986).
Phylum Mollusca showed presence of gastropods andbivalves. Number of gastropods reported at station I werehalf that of station II. Station I showed more population ofbivalves compared to station II. Warzocha, (1995) statedthat bivalves are able to tolerate organic pollutants that arereleased from sewage treatment plant. This might havecontributed to increase in bivalves at station I. Quadros2001 reported absence of bivalves near the polluted riverineend, but the data in the present study though very close tothe riverine end showed some percentage of occurrence ofbivalves especially microbivalvia near Bhandup pumpingstation. According to Giere (2009) microbivalve tend to liveas detritivores in the uppermost sediment. This might bedue to behavioural changes or adaptation in the groupBivalvia to sustain near waste water discharge station.
Arthropoda showed the presence of crab speciesmainly Illyoplax gangetica maximum at station I. Mangroveleaf litter serves as important food for crabs, consideringtheir ability to consume mangrove litter (Fratini et. al., 2000,Cannicci et al., 2008). Also the diversity of mangrove specieswas more at station I. Hence, maximum litter fall in the areamight be one of the factor.
According to Arasaki et al. (2004), the sediment typeis an important variable in determining the distribution ofmacrobenthic species .According to the currentinvestigation the sediment of Thane creek showed increasein the percentage of silt over a decade. This might also bethe reason for alterations in diversity of organisms found inthat area.
Conclusion
The present study concludes that treated sewagewater from BPS led to decrease in density of gastropods.Increase in benthic organisms like polychaetes andnematodes, microbivalvia and crab (Illyoplax gangetica)and also these organisms can survive well in sedimenthaving more organic carbon and less chloride content.Alteration in benthic component might also lead to changesin the foodchain. Such alterations are not feasible as it mightlead to depletion of related biodiversity.
Acknowledgement
The authors wish to thank the management of B. N.Bandodkar College of Science and Mr.Yashwant Pawar andNamdeo Pawar , local fishermen, for their support andencouragement during research work.
Bibliography
Ansari, Z. A., Ingole, B. S., & Parulekar, A. H. (1986). Effectof high organic enrichment of benthic polychaete populationin an estuary. Marine Pollution Bulletin, 17(8), 361-365.
Arasaki, E., Muniz, P., & PiresVanin, A. M. S. (2004). Afunctional analysis of the benthic macrofauna of the SãoSebastião Channel (Southeastern Brazil). Marine Ecology,25(4), 249-263.
Ajmal Khan S, Murugesan P (2005) Polychaete diversity inIndian estuaries. Indian J Mar Sci 34:114-119
Beaugrand, G. (2014). Marine biodiversity, climaticvariability and global change. Routledge.
Cannicci, S., Burrows, D., Fratini, S., Smith, T. J., Offenberg,J., & Dahdouh-Guebas, F. (2008). Faunal impact onvegetation structure and ecosystem function in mangroveforests: a review. Aquatic botany, 89(2), 186-200.
Cardoso, P. G., Bankovic, M., Raffaelli, D., & Pardal, M. A.(2007). Polychaete assemblages as indicators of habitatrecovery in a temperate estuary under eutrophication.Estuarine, Coastal and Shelf Science, 71(1), 301-308.
Fratini, S., Cannicci, S., & Vannini, M. (2000). Competitionand interaction between Neosarmatium smithi (Crustacea:Grapsidae) and Terebralia palustris (Mollusca: Gastropoda)in a Kenyan mangrove. Marine Biology,137(2), 309-316.
Gaudêncio, M. J., & Cabral, H. N. (2007). Trophic structureof macrobenthos in the Tagus estuary and adjacent coastalshelf. Hydrobiologia, 587(1), 241-251.
Giere, O. (2009). The Biotope: Factors and Study Methods.Meiobenthology: The Microscopic Motile Fauna ofAquatic Sediments, 7-62.
Musale, A. S., Desai, D. V., Sawant, S. S., Venkat, K., & Anil,A. C. (2015). Distribution and abundance of benthicmacroorganisms in and around Visakhapatnam Harbour onthe east coast of India. Journal of the Marine BiologicalAssociation of the United Kingdom, 95(02), 215-231.
Musale, A. S., & Desai, D. V. (2011). Distribution andabundance of macrobenthic polychaetes along the SouthIndian coast. Environmental monitoring and assessment,178(1-4), 423-436.
Mishra, V. I. D. Y. A., Quadros, G. O. L. D. I. N., Ullal, V. I. D.Y. A., Gokhale, K. S., & Athalye, R. P. (1994). Sea anemone,Acontiactis gokhaleae as biofouler in the Mangrove mudflatsalong Thane Creek. Mahasagar, 27(1), 73-78.
Pearson, T. H., & Rosenberg, R. (1976). A comparative studyof the effects on the marine environment of wastes fromcellulose industries in Scotland and Sweden. Ambio, 77-79.

83
International Conference on Ecosystem Services of Wetlands - ‘Ardrabhumi :2016’ISBN : 978-81-923628-3-0
Singh, A.K. (1997). Abundance of macrobenthic organismsin relation to the physicochemical characteristics of RiverGanga at Patna (Bihar) India. Journal of EnvironmentalBiology 18(2): 103–110.
Shou, L., Huang, Y., Zeng, J., Gao, A., Liao, Y., & Chen, Q.(2009). Seasonal changes of macrobenthos distribution anddiversity in Zhoushan sea area. Aquatic Ecosystem Health& Management, 12(1), 110-115.
Snelgrove, P. V. (1998). The biodiversity of macrofaunalorganisms in marine sediments. Biodiversity &Conservation, 7(9), 1123-1132.
Tomassetti, P., & Porrello, S. (2005). Polychaetes as indicatorsof marine fish farm organic enrichment. AquacultureInternational, 13(1-2), 109-128.
Thilagavathi, B., Varadharajan, D., Babu, A., Manoharan, J.,Vijayalakshmi, S., & Balasubramanian, T. (2013). Distributionand diversity of macrobenthos in different mangroveecosystems of Tamil Nadu coast, India. Journal ofAquaculture Research & Development, 4(6), 1.
Unnithan, R.V., M.Vijayan and K.N.Remani, (1975).Organicpollution in Cochin Backwaters. Indian.J.Mar.Sci.4910; 39-42.
Zhang, Y., Lv, Z., Guan, B., Liu, Y., Li, F., Li, S. & Li, Y. (2013).Status of macrobenthic community and its relationships totrace metals and natural sediment characteristics. CLEAN–Soil, Air, Water, 41(10), 1027-1034.

84
International Conference on Ecosystem Services of Wetlands - ‘Ardrabhumi :2016’ISBN : 978-81-923628-3-0
Preliminary phytochemical assessment and Antioxidant activity ofEichhornia crassipes (Mart.) Solms.
Snehal N. Bhangale and Moitreyee SahaDepartment of Botany, VPM’s B. N. Bandodkar College of Science, Thane (W.) 400 601-India
Abstract: Eichhornia crassipes (Mart.) Solms. is an invasive, free floating aquatic herb with well-developed submergedfibrous roots. Eichhornia crassipes (Mart.) Solms. is considered as the world’s worst aquatic weed that causes a serioushindrance to nation’s developmental activities. The present investigation was planned to explore the potential of Eichhorniacrassipes (Mart.) Solms., in a way that, its positive attributes outweighs the negative ones. The present paper deals with theevaluation of phytochemical screening and antioxidant activity by DPPH assay of Eichhornia crassipes (Mart.) Solms.Qualitative analysis of the plant parts have revealed the presence of various components of importance including tannins,steroid, terpenoid, alkaloid, flavonoid, phenol, quinones, anthraquinones and cardiac glycosides. The result obtained indicatesthat though the plant is an aquatic weed, phytochemicals needed for the maintenance of good health are present in the plantcan be used in the manufacture of drugs.
Key words: Eichhornia crassipes (Mart.) Solms., aquatic weed, preliminary phytochemical, antioxidant activity
Introduction
For a long period, plants have been a variable sourceof natural products for maintaining human health. Manyplants have chemical components and biological activitiesthat produce definite physiological actions in the body andtherefore used to treat various ailments. Most important ofthese bioactive constituents of plants are alkaloid, tannins,flavonoids and phenolic compounds (Nyananyo et al.,2005). Aquatic plants have economic and environmentaluses, depending on the natural characteristics. Some areconsumed in human diet, while other species have medicinalvalues and still other species are good resource of mineralsand vitamins. Since aquatic weeds are known to differ widelyin their chemical composition depending upon species,season and location, an insight into their chemicalcomposition is essential if utilization prospects are to beconsidered (Lata and Dubey, 2010). Aquatic plants, alsoreferred to as hydrophytes are found in wet lands. Wetlandis a land area that is saturated with water either permanentlyor seasonally such that it takes on the characters of distinctecosystem (Butler, 2010).
Eichhornia crassipes (Mart.) Solms. commonly knownas water hyacinth is a warm water aquatic plant (orhydrophyte) (Mane et al., 2011). Eichhornia crassipes isan erect free-floating and stoloniferous perennial herb. Itbelongs to the family Pontederiaceae. It is native to Brazilfrom where it spread to other part of South America andAfrica (Kayathri, 2015).
It can quickly grow to very high densities (over 60kgm-2); thereby completely clogging water bodies, which inturn may have negative effects on the environment, humanhealth and economic development (Jayanthi et al., 2011). Itis listed as one of the most productive plant on earth and isconsidered the world worst aquatic weed (Grodowitz, 1998).
The ‘beautiful blue devil’, water hyacinth is recognizedby its lavender flowers and shining bright leaves whichspread at an alarming rate. Its habitat ranges from tropical tosubtropical or warm temperate rain forest zones and toleratesa temperature range of 21.1 to 27.2ºC (Lata and Venapani,2010). It can be used as compost, paper, fuel, animal feedand water purification (Kristie, 2012). It is also an excellentsource of biomass and used to make hand bags and ropesin East Africa. Its flowers are used as a medication on skinof horses and a tonic (Kayathri, 2015).
Water hyacinth possesses phytochemicals which areof medicinal importance (Jayanthi et al., 2011). The methanolextract of leaves of this plant aids in wound healing processand has tumour inhibition potential (Kayathri, 2015). Inaddition, the extracts of this plant showed antimicrobialactivity (Shanab et al., 2010). Eichhornia crassipes (Mart.)Solms. is an unstoppable colonizer which is extremelydifficult to eradicate. It cost money, energy and time incontrolling Eichhornia crassipes (Mart.) Solms. However,Eichhornia crassipes (Mart.) Solms. holds many promisesin the future. Therefore in the present study the evaluationof phytochemical and antioxidant activity of Eichhorniacrassipes (Mart.) Solms. was carried out.
Materials and Methods
Collection of Plant Material: Fresh leaves of Eichhorniacrassipes (Mart.) Solms. were collected at local pond fromPalwa (Dombivali) region. The leaves were washedthoroughly 2-3 times with running tap water and once withsterile distilled water. Leaf material was then air-dried undershade.
Solvent Extraction: Aqueous, ethanol, ethyl acetate,methanol and petroleum ether extracts of Eichhorniacrassipes (Mart.) Solms., were prepared according to the

85
International Conference on Ecosystem Services of Wetlands - ‘Ardrabhumi :2016’ISBN : 978-81-923628-3-0
methodology of Indian Pharmacopoeia (Anonymous, 1966).These extracts were concentrated to dryness. The extractswere put in air tight containers stored in a refrigerator.
Preliminary Phytochemical Analysis: Preliminaryphytochemical screening of the leaf extracts of Eichhorniacrassipes (Mart.) Solms. was carried out as per standardprocedure (Kokate et al., 2005; Harborne, 2005).
Antioxidant Activity
DPPH (1,1-Diphenyl-2-Picrylhydrazy) Radical ScavengingActivity:
The antioxidant activity of the extracts was measuredon the basis of the scavenging activity of the stable 1, 1-
diphenyl 2-picrylhyorazyl (DPPH, Hi-media) free radicalaccording to the method described by Blois (1958). 0.1 mMsolution of DPPH in methanol was prepared and 1.0 ml ofthis solution was added to 1.0 ml of aqueous extract atdifferent concentrations (10-100 µl/ml) of Eichhorniacrassipes (Mart.) Solms. After 30 min incubation period atroom temperature in the dark, the absorbance of the resultingmixture was measured at 518 nm. The percentage AntioxidantActivity (AA%) was calculated using the expression below:
AA% = (A cont - A test)/A cont × 100
Mixture of 1ml methanol and 1ml DPPH solution wasused as control. The experiment was carried out in triplicate.
Results and Discussion
Table 1: Qualitative phytochemical analysis of leaf extracts of Eichhornia crassipes (Mart.) Solms
S. No Phytocompounds Aqueous Ethanol Ethyl acetate Methanol Petroleu mether
1. Alkaloids + - - + -
2. Amino acids - + + - -
3. Carbohydrates + + + - +
4. Fat - - - - -
5. Anthraquinone - + - + -
6. Flavonoids - - + + +
7. Glycosides + - - + +
8. Phenols - + - - -
9. Protein + + - - -
10. Saponins + - + + -
11. Steroids - + + + -
12. Tannins - - - + -
13. Terpenoids + + - + -
Values are mean of three determinants+ = Present; - = Absent
Table 2: DPPH assay of aqueous extract of Eichhorniacrassipes (Mart.) Solms
Concentration % Scavenging activity(ìg ml-1) Ascorbic Acid Kalyan
20 20.5 ± 0.71 14.34 ± 0.73
40 39.98 ± 0.71 34.35 ± 0.16
60 63.59 ± 0.16 48.29 ± 0.14
80 69.24 ± 0.35 63.09 ± 0.73
100 84.62 ± 0.43 74.33 ± 0.91
IC50
value 64.27 µg/ml
Values are mean of three determinants
Mean±SE
Figure 1: DPPH assay of aqueous extract of Eichhorniacrassipes (Mart.) Solms compared with ascorbic acid as standard

86
International Conference on Ecosystem Services of Wetlands - ‘Ardrabhumi :2016’ISBN : 978-81-923628-3-0
In the present study, the preliminary phytochemicalscreening of the leaf extracts of Eichhornia crassipes (Mart.)Solms. revealed the presence of alkaloids, amino acids,carbohydrate, fats, flavonoids, glycosides, phenols, protein,saponins, sterols, tannins and terpenoids (Table 1).
Aqueous extract showed the presence of alkaloids,carbohydrate, glycosides, protein, saponins and terpenoids.Ethanolic extract showed the presence of amino acids,carbohydrate, anthraquinone, phenols, protein, sterols andterpenoids. Ethyl acetate extract showed the presence ofamino acids, carbohydrate, flavonoids, saponins and sterols.Methanolic extract showed the presence of alkaloids,anthraquinone, flavonoids, glycosides, saponins, sterols,tannins and terpenoids. Petroleum ether extract showed thepresence of carbohydrate, flavonoids and glycosides.
The presence of alkaloid, flavonoids, steroid, tannins,phenolic contents, quinone and anthraquinone in aqueousextract of dry Eichhornia crassipes (Mart.) Solms. wasreported by Lata and Dubey, (2010). Presence of flavonoidsin this plant was reported by Nyananyo et al., (2005). Dueto the metabolic properties of alkaloids and flavonoids inEichhornia crassipes, it can be used as antiviral,antibacterial, antimicrobial and anticancer agents (Lalithaand Jayanthi, 2012). Thus the presences of wide range ofphytochemical constituents suggest that the plant can beexploited in the manufacture of drugs.
DPPH Assay
DPPH scavenging activity of aqueous extract of leafof Eichhornia crassipes (Mart.) Solms. was determined. Thereducing power of all the extracts increased with increase inconcentration. Higher absorbance of the reaction mixtureindicated higher reducing power. The IC
50 value of aqueous
extract of leaf of Eichhornia crassipes (Mart.) Solms. wasfound to be 64.27 µg/ml (Figure 1, Table 2).
The DPPH assay is often used to evaluate the abilityof antioxidant to scavenge free radicals. However, DPPHscavenging activity is best to presented by IC
50 value,
defined as the concentration of the antioxidant needed toscavenge 50% of DPPH present in the test solution. A smallerIC
50 value corresponds to a higher antioxidant activity of
plant extracts (Chantiratikul et al., 2009).
DPPH radical is scavenged by antioxidants throughthe donation of proton forming the reduced DPPH. Thecolour changes from purple to yellow after reduction, whichcan be quantified by its decrease of absorbance atwavelength 520 nm. Radical scavenging activity increaseswith increasing percentage of the free radical inhibition.DPPH is a relatively stable radical. The assay is based onthe measurement of the scavenging ability of antioxidantstowards the stable radical DPPH which reacts with suitable
reducing agent. The electrons become paired off andsolution loses colour stochiometrically depending on thenumber of electrons taken up (Thamaraiselvi and Jayanthi,2012).
Conclusion
In the present study phytochemical assessment wascarried out of the aquatic hydrophyte Eichhornia crassipes(Mart.) Solms., found extensively in wetland. Wetlands arealso considered as the most biologically diverse of allecosystems. Wetlands play a number of roles in theenvironment, principally water purification, food control,medicine, carbon sink and shoreline stability. They alsoprovide many products that have sustained humancommunities over the centuries. Eichhornia crassipes(Mart.) Solms. showed the presence of many metabolitesincluding tannins, saponins, flavonoids, glycosides andalkaloids which have pharmaceutical and medicinalproperties as well as anti-aging, anti-tumor, anti-oxidantsetc. The present study also reveals the potential of plant asantioxidants. In addition, they have scavenging antioxidantproperties against the reactive oxygen species. Plantsincluding hydrophytes play essential role chemotherapeuticagents production. Harvesting water hyacinth, not onlyclean the drinking water from its deleterious effect but alsowould be used for the production of pharmaceutical remedies.Water hyacinth is often considered as a weed, however inrecent years due to its phytochemical and antioxidantproperties it remains as a plant of considerable researchinterest.
Acknowledgments:
Authors are thankful to Department of Botany, B. N.Bandodkar College of Science, Thane for providing thelaboratory facilities.
References
1. Anonymous (1966). Pharmacopoeia of India (Ministryof Health Govt. of India Publication) New Delhi.
2. Blois, M. S. (1958). Antioxidant determinations by theuse of a stable free radical. Nature, 181: 1199-1200.
3. Butler, S. Ed. (2010). Macquaries Concise Dictionary(5th edition) Sydney, Australia, Macquarie DictionaryPublished Ltd.
4. Chantiratikul, P., Meechai, P. and Nakbanpotec, W.(2009). Antioxidant Activities and Phenolic Contentsof Extracts from Salvinia molesta and Eichorniacrassipes. Res. J. Bio. Sci., 4(10): 1113-1117.
5. Grodowitz, M. J. (1998). An active approach to the useof insect biological control for the management of nonnative aquatic plants. Journal of Aquatic PlantManagement, 36: 5761-5763.

87
International Conference on Ecosystem Services of Wetlands - ‘Ardrabhumi :2016’ISBN : 978-81-923628-3-0
6. Jayanthi, P., Lalitha, P. and Shubashini, K. S. (2011).Phytochemical investigation of the solvents extractsand fractionates of Eichhornia crassipes. Journal ofPharmacy Research, 4: 1405-1406.
7. Harborne, J. B. (2005). Phytochemical Methods aGuide to Modern Techniques of Plant Analysis, 2nd
Edition, Published by Chapman & Hall, London.
8. Kokate, C. K., Purohit, A. P. and Gokhale, S. B. (2005).Pharmacognosy, 39th edition published by NiraliPrakashan, Pune. pp. 607-611.
9. Kayathri, B., Kanimozhi, K. and Panneerselvam, A.(2015). Preliminary phytochemical analysis and in vitroinvestigation of antimicrobial activity of Eichhorniacrassipes (Mart.) Solms. Against poultry pathogens.CIBTech Journal of Microbiology, 4(1): 19 – 27.
10. Kristie, T. (2012). Plants, Garden Plants by name Waterhyacinth. Available: http://www.ehow.com/facts.
11. Lata, N. and Dubey, V. (2010). Quantification andidentification of alkaloids of. Eichhornia crassipes: the
world’s worst aquatic plant. J. Pharm. Res., 3(6): 1229-1231.
12. Lata, N. and Venapani, D. (2010). Preliminaryphytochemical screening of Eichhornia crassipes: Theworld’s worst aquatic weed. Journal of PharmacyResearch, 3(6): 1240-1242.
13. Nyananyo, B. L., Gijo, A. H. and Ogamba, E. N. (2005).The Physico-Chemistry and Distribution of Waterhyacinth (Eichhornia crassipes) on the river Nun inthe niger Nelta, J. Appl. Environ. Manage, 11: 133-137.
14. Shanab, S. M. M., Shalaby, E. A., Lightfoot, D. A. andEl-Shemy, H. A. (2010). Allelopathic Effects of WaterHyacinth (Eichhornia crassipes). Plus One, 5: 1-8.
15. Thamaraiselvi, P. L. and Jayanthi, L. (2012). Study ofantioxidnt activity of ethanolic extract of freshEichhornia crassipes (Mart.) Solms. Der PharmaciaSinica, 3 (2):271-277.

88
International Conference on Ecosystem Services of Wetlands - ‘Ardrabhumi :2016’ISBN : 978-81-923628-3-0
Hydrographic study of waters near mangrove belt ofElephanta Island, Mumbai, India
Salvi Sonal, Jaiswar Ruhi, Marathe Ninad, Rokade Avinash and Chavan Bhavita*Department of Zoology, The Institute of Science, Madam Cama Road, Mumbai-32
[email protected],[email protected],[email protected],[email protected] .
*Correspondence e mail: [email protected]
Abstract: Elephanta Island located off the coast of Mumbai ranks among popular tourist attraction in Maharashtra. TheElephanta Caves have been included in the list of the World Heritage sites by UNESCO. The island is of great ecologicalimportance as its major part is covered by mangroves. These mangroves are facing threat due to increasing pollution levelscaused by the influx of sewage and industrial waste and other anthropological activities. The present work focuses onhydrographical study of water at Elephanta Island. The analysis of physico-chemical parameters- total dissolved solids,chlorides, BOD, COD common nutrients and trace metals showed elevated levels. Bacteriological study showed presence ofE.coli. The results obtained indicate presence of pollution in the water of the study area which is surrounded by mangroves.This may possibly be a potential threat to the flora and fauna of this coastal wetland making it essential to undertakecontinuous monitoring for its conservation by curbing pollution causing agencies.
Key words: Hydrography, pollution, anthropological activity, wetland, ecological conservation
Introduction
Elephanta Island located off the coast of Mumbai (18°56’ 20" N, 72° 55’ 50" E) ranks among popular tourist attractionin Maharashtra. The Elephanta caves have been includedin the list of the World Heritage sites by UNESCO. Thisisland is also of great ecological importance as it is highlyproductive coastal wetland covered by mangroves.Mangrove habitats maintain quality of water by trappingsediments in the mangrove root system and removingorganic and inorganic nutrients from the water column sothat these sediments and other solids are kept from offshorewaters, thereby protecting other coastal ecosystems suchas oyster beds, sea grasses, etc. from excessivesedimentation (Rebecca Hoff et al., 2014). However, thepotential of mangroves to “clean” water is limited. Thesewetlands also provide shelter to variety of aquatic life aswell as breeding ground to fishes and hence supportbiodiversity (Islam, M. S. N. et.al. 2009).
The healthy aquatic ecosystem depends on thephysico-chemical and biological characteristics(Venkatesharaju, K et.al. 2010). Increasing anthropogenicactivities such as discharge of domestic and industrial waste,fishing, boating etc. take toll on the mangrove habitat byadding to the pollution. Elephanta island mangroves facesimilar threat because of domestic and industrial waste beingdischarged from Mumbai, and surrounding areas,furthermore fishing and tourism also contribute to it.Elephanta Island mainly faces stress from the industrialinflux situated at Uran (District: Raigad). Industries such asONGC, LPG Distillation Plant, Bharat petroleum, MSEB GasTurbine power station, container freight stations etc. directlydump their discharge in to the sea.(Pawar, 2015).The region
also is influenced by heavy shipping traffic due to nearbyJawaharlal Nehru Port Trust (JNPT) (Pawar, 2013). Coastalwaters of Mumbai got affected by the large spillage of oildue to the massive collision of two merchant ships MSCChitra and MV Khalijia in 2010-11, affecting the marine floraand fauna. Spilling an estimated 800 tonnes of oil into thesea (Briggs Marine and Environmental services) causingmassive damage to the mangroves of Elephanta Island.
This highly complex, dynamic marine ecosystems,subjected to many internal and external relationships changeover the period of time. Influx of pollutants in the inshorewaters and estuaries lead to extensive damage to life andactivities of aquatic flora and fauna. Research work revealappreciable rise in heavy metals in sediments than in thewater near the mangrove belt.(Almahasheer H.B. et.al.,2014,Sarangi R.K. et.al., 2002). A lot of marine fauna isdependent on pollution free habitat and even slight changesaffect their body metabolism in long term (Arun Kumar, 2007).
Previous studies made have been focused on theharmful effects of oil pollution on the mangroves of thisregion (Rai N. et al., 2011, Sukhdhane K. S. et.al., 2013). Thepresent study focuses on the hydrographical study ofwaters near mangrove belt of Elephanta Island. Theseelements have greater influence on the mangrove habitatand in this paper the preliminary hydrographical assessmenthas been discussed.
Materials and Methods:
For the preliminary study, quantitative analysis ofsurface water samples collected from 2 spots near themangrove belt was done immediately after the monsoon.Five samplings were done. The surface water samples were

89
International Conference on Ecosystem Services of Wetlands - ‘Ardrabhumi :2016’ISBN : 978-81-923628-3-0
collected in new transparent plastic bottles and for thebacteriological parameter sterilized glass bottles were used.Temperature, pH, turbidity, alkalinity, nitrates-nitrites,phosphates, silicates ,temporal distribution of salinity, TDS,DO, BOD, COD, trace metals and nutrients of surface waterwere determined using standard methods (Titration method,Atomic Absorption Spectrophotometer (AAS) Thermo M5Model) (Trivedi and Goel, 1986, APHA, 1985). Thebacteriological studies of the water samples were carriedout within 24 hours of collection of samples.
Fig.1:Location of Sampling
The temperature was measured using mercury filledCelsius thermometer with an accuracy of 0.1ºC. pH wasdetermined by Elico, model LI.120 Digital pH meter whichgives direct value of pH. Turbidity determined by usingturbidity meter. The total dissolved (TDS) solid wasdetermined by weight difference method. 25 ml of watersample was filtered through ordinary filter and evaporatedby heating. The accumulated dissolved solid matter cooledand weighed. Chloride content of water sample wasdetermined by titrating the water sample against 0.02M silvernitrate solution using potassium chromate as an indicator.Trace metals such as copper, lead and zinc were determinedusing spectrophotometer. Biochemical Oxygen Demand(BOD) and Chemical Oxygen Demand (COD) determined byWinkler’s method and Reflux method respectively. Watersamples for dissolved oxygen were collected in browncoloured bottles and immediately treated with Winkler’ssolution to arrest the oxygen. Bacteriological study toconfirm presence of coliforms was also done.
Results and Discussion:
Physico-chemical analysis of water samples(Elephanta Island) were studied (Table1 and 2).
Table 1: Physicochemical parameters of waters at ElephantaIsland, Mumbai, India
No. Parameters Results
1 Colour Brownish
2 Turbidity 20 NTU
3 Odour Objectionable
4 pH 8.31
5 Total dissolved Solids 8.13 × 10⁻³ Kg.m-3
6 Temperature 27.2 0C
8 Alkalinity 3 × 10⁻³ Kg.m-3
9 CO2 2.1027 × 10⁻² m-3
10 DO 0.084 × 10⁻² m-3
11 BOD 5.4 × 10⁻⁵ Kg.m-3
12 COD 20 × 10-5 Kg.m-3
,Table 2: Physicochemical parameters of water at ElephantaIsland, Mumbai, India
No. Nutrients Results
1 Phosphates(PO4-3) 4.1431 × 10⁻⁸ Kg.m-3
2 Silicates (SiO44-) 37.173 × 10⁻⁸ Kg.m-3
3 Nitrates (NO3
-) 64.425 × 10⁻⁸ Kg.m-3
4 Nitrites (NO2-) 33.88 × 10⁻⁸ Kg.m-3
Metals
1 Zinc 0.092 ×10⁻⁶ Kg.m-3
2 Copper 0.011 × 10⁻⁶ Kg.m-3
3 Lead 1.8 × 10⁻⁶ Kg.m-3
μg /
l
(a)

90
International Conference on Ecosystem Services of Wetlands - ‘Ardrabhumi :2016’ISBN : 978-81-923628-3-0
μg
/ l
(b)
Fig.2: Concentration of Physico-chemical parametersanalysed in water samples from Elephanta Island, Mumbai,India (a) Nutrients-Phosphates (PO
4-3), Silicates(SiO
4-4),
Nitrates (NO3-), Nitrites (NO
2-).
200 mg/l
54 mg/l
COD BOD
Fig.3: Distribution of BOD and COD in waters at ElephantaIsland, Mumbai, India.
The primary components necessary for the regulationof pH are carbonates bicarbonates, and hydroxide ions; saltsof weak acids, such as silicates and phosphates etc.(TheRoyal Society, 2005). The present investigation shows thealkaline nature of water. The total alkalinity of water is mainlythe function of carbonates. The potential of carbonate ionto absorb two hydrogen ions imparts alkalinity to the water(Sawane, 2006). Similarly, anaerobic denitrification processleaves great impact on alkalinity of sea water (Gwenaeè LAbril and Michel Frankignoulle, 2001). The dissolvedoxygen is considerably lower than that of the dissolvedcarbondioxide which gives rise to the high chances ofcarbonate ion production, which is observed in alkalinenature of water sample.
Dissolved oxygen is an important indicator of theaquatic health as it is required for the respiration by theaerobic organisms. Hence, survival of aquatic life dependson optimum amount of dissolved oxygen in water bodies(Araoye P.A., 2009).As the sampling time is immediatelyafter monsoon there should be enough dissolved oxygen in
water due to fresh water flush. However, in present studydissolved oxygen was observed to be lower than thedissolved carbon dioxide. The low concentration ofdissolved oxygen may be due to the decomposition of algaeand other vegetation (Glendon R. Shaw et.al) which utilizelarge amount of dissolved oxygen and release carbondioxide.
The turbidity of water indicates the presence of somedissolved solids of organic sources such as leaves, silt,plankton, and industrial waste and sewage (Iyasele, J.U.,2015). Total dissolved solids (TDS) are cations or anions ofinorganic salts, minerals, metals and small amount of organicmatter dissolved in water (M.K.Paul, and Sujata Sen, 2012).Excessive amount of TDS indicates pollution (Katariaet al.,1996) by extraneous sources. The high concentration ofTDS affects adversely to the aquatic life by restrictinggrowth of the photosynthetic vegetation (algae,phytoplankton etc.). Therefore the other fauna dependenton it is affected creating an imbalance in the ecosystem.
Biological oxygen demand (BOD) is used as the indexof organic pollution of waste water that can be decomposedby bacteria under anaerobic conditions (Patel, S.G. et.al.,1983) whereas chemical oxygen demand (COD) test iscommonly used to indirectly measure the amount of organiccompounds in water. Higher values of BOD and CODsuggest the presence of organic matter in the water samplessimilar findings were reported (Milacron Marketing Co.,1997).
Among the nutrients silicates, NO3
-N and NO2
-Nstudied nitrates were found in highest concentrationfollowed by silicates, nitrites and phosphates. Thesenutrients in small amount are required by the plants andalgae for their growth; however, their excessiveconcentration is harmful to the aquatic flora and fauna (J. T.Sims et .al., 1998, Monica Achieng, 2003). Nitrate pollutioncauses eutrophication where algae and aquatic plant growthconsume the dissolved oxygen and increase the totaldissolved solids. Eutrophication is usually the result ofnitrate and phosphate contamination which significantlyreduces water quality (J. T. Sims et .al., 1998). Nitrate andNitrites can reach surface water as a consequence ofagricultural activity (including excess application ofinorganic nitrogenous fertilizers and manures), fromwastewater treatment and from oxidation of nitrogenouswaste products in human and animal excreta, including septictanks. Nitrite can also be formed chemically in distributionpipes by nitrosomonas bacteria during stagnation of nitrate-containing and oxygen-poor drinking-water in galvanizedsteel pipes or if chloramination is used to provide a residualdisinfectant and the process is not sufficiently wellcontrolled (WHO).
Trace metals lead, zinc and copper were estimated in

91
International Conference on Ecosystem Services of Wetlands - ‘Ardrabhumi :2016’ISBN : 978-81-923628-3-0
the water samples. Metals tend to accumulate in themangroves (Almahasheer H.B. et.al., 2014). Similar tonutrients an excessive amount of metals also affects theaquatic flora and fauna (Seng et al., 1987; Ismail and Asmah,1992). The concentration of metals showed lead > zinc>copper.
Bacteriological study confirms presence of coliformsindicating presence of organic matter (Monica Achieng,2003).This organic matter may have been introduced throughthe domestic waste discharge.
Conclusion:
Mangrove ecosystems are highly productive and playa vital role as a major primary producer within estuarinesystems. Mangrove has got definite role against thepollution. It has natural ability to act as a sink ofanthropogenic and industrial pollutants. However, theircapacity to flush the pollution is limited, so it becomesessential to undertake continuous monitoring of mangroveecosystem.
References:
APHA. Standard Methods for Examination of Water andWastewater. 19thEdn. American Public Health Association,Washington, DC(1995).
APHA, Standard Methods for Examination of Water andWastewater. 20thEdn. American Public Health Association,Washington, DC, New York(1998),.
AraoyeP.A.,The seasonal Variationof pH and DissolvedOxygen (DO2) concentration inAsaIlorin,Nigeria,International Journal of Physical SciencesVol.4 (5),pp.271-274,May,(2009).
Briggs Marine and Environmental services, MSC ChitraPollution Response Report.
Gwenaeè L Abril And Michel Frankignoulle,Nitrogen±Alkalinity Interactions In The Highly PollutedScheldt Basin (Belgium), Wat. Res. Vol. 35, No. 3, Pp. 844±850(2001).
Glendon R. Shaw, David P. Moore and Corinne Garnett,Euthrophication and Algal Blooms, Environmental andEcological Chemistry – Vol. Ii – EncyclopediaOf Life SupportSystems (Eolss)
H. B. Almahasheer, W. A. Al-Taisan & M. K. Mohamed,Metals Accumulation in Grey Mangrove (Avicennia marina(Forsk.) Vierh.) Inhabiting Tarut Bay, Eastern Saudi ArabiaJournal of Agricultural Science; Vol. 6, No. 1; (2014).
Interim Progress Report Environmental Impact Assessment(EIA) Study on Pollution Due to Oil Spill and Other
Hazardous Substances Maharashtra Pollution Control Board(MPCB) ,National Environmental Engineering ResearchInstitute (NEERI, 2011).
Isaiah J. NIRMAL KUMAR , Poliyaparambil Ravi SAJISH ,Rita NIRMAL KUMAR, George BASIL, ViyolSHAILENDRA, An Assessment of the AccumulationPotential of Pb, Zn and Cd by Avicennia marina (Forssk.)Vierh. InVamleshwar Mangroves, Gujarat, India, Not SciBiol,3(1):36-40,(2011).
Ismail A, Asmah MIN Copper, zinc, lead and cadmium inintertidal molluscs and sediment off SeberangPerai coastline,Malaysia. 4th Princess Chulabhorn International ScienceCongress, Bangkok, Thailand (1992).
Islam, M. S. N.; Gnauck, A. Threats to the SundarbansMangrove Wetland Ecosystems from Transboundary WaterAllocation in the Ganges Basin: A Preliminary ProblemAnalysis. Int. J. Ecol. Econ. Stat., 13, 64-78,(2009).
Iyasele, J.U, David J. Idiata, D.J., Investigation of theRelationship between Electrical Conductivity and TotalDissolved Solids for Mono-Valent, Di-Valent and Tri-ValentMetal Compounds,International Journal of EngineeringResearch and Reviews ISSN 2348-697X (Online) Vol. 3, Issue1, pp: (40-48), Month: January – March( 2015).
J. T. Sims, R. R. Simard, and B. C. Joern , Phosphorus Loss inAgricultural Drainage: Historical Perspective and CurrentResearch, J. Environ. Qual. 27:277-293 (1998).
Kataria, H.C., H.A. Quereshi, S.A. Iqbal and A.K. Shandilya,Assessment of water quality of Kolar Reservoir in Bhopal(MP). Pollution Research 15, pp 191-193(1996).
M.K.Paul, and SujataSen, The Occurrence Of Tds AndConductivity Of Domestic Water In Lumding Town OfNowgong District Of Assam, N.E. India,Curr WorldEnviron;7(2):251-258 (2012).
Monica AchiengOwili,Assesment of Impact of SewageEffluents on Coastal Water Quality in Hafnarfjordur, IcelandUNU-Fisheries Training Programme, Final Project (2003).
Navneet Rai, I.P. Pandeyand Kamal Joshi,Impacts andmanagement of oil spill pollution along Indian Coastal areasJ. Ind. Res. Tech1 (2), 119-126, (2011).
Nitrate and nitrite in drinking-water Background documentfor development of WHO Guidelines for Drinking-waterQuality, WHO/SDE/WSH/07.01/16/Rev/1
Patel, S.G., D.D. Singh and D.K. Harshey,Pamitae (Jabalpur)sewagepolluted water body, as evidenced by chemical andbiological indicators of pollution.Journal of EnvironmentalBiology 4, pp 437-449(1983).
Ocean acidification due to increasing atmospheric carbon

92
International Conference on Ecosystem Services of Wetlands - ‘Ardrabhumi :2016’ISBN : 978-81-923628-3-0
dioxide, The Royal Society, June (2005).
Pawar, Prabhakar. R. (2013) Monitoring of impact ofanthropogenic inputs on water quality of mangroveecosystem of Uran, Navi Mumbai, west coast of India.Marine PollutionBulletin, 75, 291–300. http://dx.doi.org/10.1016/j.marpolbul.2013.06.045
Pawar, Prabhakar. R.Monitoring of Pollution Using Density,Biomassand Diversity Indices of Macrobenthos frommangrove Ecosystem of Uran, Navi Mumbai, westcoast ofIndia, International Journal of Animal Biology Vol. 1, No. 4,2015, pp. 136-145
Rebecca Hoff And Jacqueline Michel,Oil Spills InMangroves Planning & Response Considerations, U.S.Department Of Commerce September (2014).
Sarangi R. K.,Kathiresan K and Subramanian A. N. ShortCommunication Metal concentrations in five mangrovespecies of the Bhitarkanika, Orissa, east coast of India IndianJournal of Marine Sciences ,Vol. 31(3), September, pp. 251-253(2002).
Sawane, A. P., Puranik, P. G., Bhate, A. M., Impact of industrialpollution on river Irai, district Chandrapur, with reference tofluctuation in CO2 and pH, Journal of Aquatic Biology, 21(1),pp 105-110. (2006).
Seng CE, Lim PPE, Ang TT .Heavy metal concentrations incoastal sea water and sediment of Prai Industrial Estate,Penang, Malaysia. Mar Pollut Bull 18:611-612(1987).
SukhdhaneKapil S.,Priya E. R., Shailendra M.Raut,TeenaJayakumar, Status of Oil Pollution in IndianCoastal Waters Fishing Chimes Vol. 33 No. 5 /A u g u s t (2013).
Trivedy, R.K. and P.K. Goel, , Chemical Biological Methodsfor Water Pollution Studies. Environmental Publication,Karad, India, pp 104(1984).
Venkatesharaju, K.; Ravikumar. P.; Somashekar, R. K.;Prakash. K. L.; Physico-chemical and BacteriologicalInvestigation on the river Cauvery of Kollegal Stretch inKarnataka.
Kathmandu Uni. J. Sci. Eng. Technol., 6 (1), 50-59(2010).

93
International Conference on Ecosystem Services of Wetlands - ‘Ardrabhumi :2016’ISBN : 978-81-923628-3-0
Avifaunal diversity of wetland ecosystem and salt pans around BhandupPumping Station, Mumbai, India
Shubhda Kushwaha, Kuldeep Mhatre and Neelima KulkarniDepartment of Zoology, KET’s V.G.Vaze College, Mulund, Mumbai – 400 081
Email:[email protected]
Abstract: Environmentally, a heterogeneous area with mangroves, interspersed with salt pans / marshland and scrublandoffers wide range of opportunities to birds for feeding, foraging, loafing and breeding. The present study enlists the aviandiversity of salt pans and adjoining areas of Bhandup Pumping Station, an area in Mumbai’s central suburb. The study wascarried out from January 2012 to December 2015, covering all seasons. A total of 172 species of birds belonging to 53 familieswere recorded during the study period including the residents, winter, summer and passage visitors. However human interferenceposes serious threat to birds and their habitats. Disturbance to wildlife is of important concern if it affects survival andbreeding success of species. The study area which was once undisturbed had rich faunal diversity, has been however, nowimpacted by anthropogenic pressures. Therefore from conservation point of view, there is an urgent need of conservation planfor protection of this ecosystem.
Key words: Bhandup, salt pan, avifauna, conservation, anthropogenic
Introduction:
India, a predominantly rural country, is going througha slow but constant and broad transition towardsurbanization. Such a changeover will have a major impacton human sustainability, created by the increased urbanfootprint of large mega-cities, the expanding impacts ofsmaller cities and towns, and distal impacts on ruralenvironments (Shaw and Satish, 2007). Urbanizationgenerates significant stress on land cover, native habitats,biodiversity, ecological commons and the ecosystemservices that under-pin human wellbeing (Narain, 2009, Jana-karajan, 2009). In the last decade, biodiversity concerns havebeen in the forefront of conservation efforts worldwide(Environment Canada, 1994; UNEP, 1995). Quantitativedocumentation of biodiversity is therefore an importantaspect of ecology and a popular topic in recent times. As faras bird diversity is concerned, the Indian subcontinentcontains about 1,300 species which is equivalent to 13% ofthe world’s bird populations (Grimmet et al, 1998). Also it isreported that global diversity of birds is decreasingincessantly primarily due to anthropogenic disturbances(Rapoport, 1993). Unfortunately, India is the third amongthe countries having the largest number of threatened andrare species followed by Brazil and Indonesia (Dandapat etal., 2010).
Birds occupy almost all habitat types and diversity ofbirds often serves as an indication of overall diversity of agiven area (Furness and Greenwood, 1993). The successfulconservation of bird species relies upon understanding oftheir habitat use and requirements. Wetland and salt panecosystems serves as potential habitats for survival of birds.The relation between wetlands and birds is shaped byfactors like availability, depth and quality of water;availability of food and shelter and the presence or absence
of predators. Thus study of avifaunal diversity of theseecosystems can help in evaluating the habitats bothqualitatively and quantitatively. Over 50% of wetlands inthe world have been lost in past century, and the remainingwetlands have been degraded to different degrees becauseof adverse influences of human activities (Fraser and Keddy,2005). Present study was undertaken to map avian ecologyof wetland ecosystem and salt pans around BhandupPumping Station in Mumbai. The estimation of localdensities of avifauna will also help to understand theabundance of various species of other organisms (Turner,2003). It is expected that the finding from the study willpromote appropriate management strategies for conservationand maximum utilization of wetland and salt pan ecosystemswhich are in close vicinity of Mumbai.
Materials and methods:
(i) Study Area
Bhandup Pumping Station (19°8’22"N - 72°57’38"E) islocated in Mumbai Suburban district of Maharashtra, India(Fig.1). The area was selected for recording the avian faunaafter preliminary surveys. It consists of diverse habitatsthat include mangroves, interspersed with salt pans /marshland and scrubland. In 2008, part of the area withmangroves was declared as protected forest (Fig.2). Thewetland and its adjoining salt pan region houses many birds,making it a potential bird watching site for ornithologistsand enthusiasts. This heterogeneity of habitat offer widerange of opportunities to birds for feeding, resting and alsoprovide nesting site for some bird’s species.

94
International Conference on Ecosystem Services of Wetlands - ‘Ardrabhumi :2016’ISBN : 978-81-923628-3-0
Fig.1: Location of study site (Google map)
Fig.2: Board displayed in study area
(ii) Data Collection
The study is based on the notes and observationsfrom our field dairies maintained during field work for surveyof avifauna. Salt pans and adjoining wetlands aroundBhandup Pumping Station were surveyed from January 2012to December 2015 at regular interval of fifteen days. Theannual cycle was divided into four seasons as summer(March-May), monsoon (June-August), retreating monsoon(September-November) and winter (December-February).The visits were carried out in the morning from 7.00 am to10.00 am and in the evening from 4.00 pm to 6.00 pm. Birdspecies were assessed in the representative plots usingdirect and line transect counting methods. Point countswere used for sampling aquatic habitats/ salt pans (Bibby etal. 1993). Four fixed points were selected in aquatic habitats/salt pans and 20–30 minutes were spent during both, pointand line transect count methods. Besides, opportunisticobservation method was also used since some bird speciesin the area could not be observed along the line transects orpoints. Birds sighted during the study period werecategorized to be common (C) – fairly well distributed andsighted or evidence recorded almost on every visit,uncommon (UC) – fairly well distributed and sighted or
evidence recorded infrequently, and rare (Rr) – evidencerecorded, or single sight records by us. Birds werephotographed when not identified on the spot. Observationswere carried out with the aid of 10×50 Olympus binocularand field characteristics were noted down during the study.Photography was done using Nikon P500 digital zoom cameraand Canon 50D DSLR. The identification of the birds’species was done as per Ali & Ripley (1983) and Grimmett etal (2013).
Result and Discussions:
A total of 172 birds belonging to 53 families and 17orders were recorded during the study period from January2012 to December 2015 (Table.2). The total checklist alsoincludes bird species encountered outside transect.Commonly sighted birds species accounted to about 141followed by 22 uncommon and 9 rare (Fig.1). It clearlyindicates that wetland ecosystem and salt marshes areknown to support large populations of migratory birds inaddition to residents. This is because the areas provideimportant roost habitat, particularly for shorter-legged birds,which are less able to utilize aquaculture ponds due to theirgreater depth. Moreover presence of large number of birdspecies in the region indicates that the area is able to provideecological security to bird species through availability ofample food and shelter. Of the 172 bird species recorded inBhandup Pumping Station and adjoining areas, 12 (7%) areglobally threatened or near threatened species (Table.1).
Table1: List of IUCN red list birds from study area: NT=Near Threatened, VU= Vulnerable and CE= CriticallyEndangered
NT River Tern
Painted Stork
Black-headed Ibis
European Roller
Oriental Darter
Alexandrine Parakeet
Lesser Flamingo
VU Indian Skimmer
Woolly-necked Stork
Indian Spotted Eagle
Greater Spotted Eagle
CE Indian Vulture

95
International Conference on Ecosystem Services of Wetlands - ‘Ardrabhumi :2016’ISBN : 978-81-923628-3-0
Fig. 1: Species abundance in Wetland ecosystem and saltpans around BPS
Species richness and community structure of birdsvary from region to region, as well as within a region, asabiotic and biotic factors vary from habitat to habitat(Johnsingh & Joshua, 1994). It was revealed that the habitatsin and around Bhandup Pumping Station provides moresuitable niches and food resources for a wide variety ofbirds. Data collected revealed the increase in number of thebird species observed in the area in spite the various
anthropogenic pressures. Most of the observed speciesare breeding residents mainly due to occurrence of varioustypes of microhabitats within the area. This emphasizes thatmosaic habitats comprising of diversified vegetations, waterbodies and river beds are crucial for conservation of birdsof the area.
The anthropogenic pressures like encroachment bydestruction of mangroves, cutting down trees for obtainingfuel wood, dumping of construction debris and easy accessto the area and human interference can decrease the abilityof wetland areas and salt pans to sustain bird populations.Such human disturbances can damage birds in many ways,including disrupting foraging or social behavior, increasingnest predation, interfering with parent-offspring and pairbonds, increasing nesting failures, and reducing the viabilityof fledglings (Kushwaha and Kulkarni, 2013). Additionally,birds may perceive humans as predators and leave an area;resulting in shifts in wetland-dependent avifauna anddecline in species abundance.
Fig. 2: Anthropogenic stress in ecosystems around BPS

96
International Conference on Ecosystem Services of Wetlands - ‘Ardrabhumi :2016’ISBN : 978-81-923628-3-0
Table1: CheckList of birds recorded in wetland ecosystem and salt pans around Bhandup Pumping Station during study
period.
No. Order/Family Binomial Name Common Name Abundance
Anseriformes
1 Anatidae Dendrocygna javanica Lesser Whistling Duck C
2 Tadorna ferruginea Ruddy Shelduck UC
3 Anas strepera Indian Spot-billed Duck C
4 Anas crecca Common Teal C
5 Anas querquedula Gargeney C
6 Anas acuta Northern Pintail C
7 Anas clypeata Northern Shoveler C
Apodiformes
8 Apodidae Cypsiurus balasiensis Asian Palm Swift C
Charadriiformes
9 Charadridae Vanellu indicus Red-wattled Lapwing C
10 Pluvialis squatarola Grey Plover C
11 Pluvialis mongolus Lesser Sand Plover C
12 Charadrius dubius Little Ringed Plover C
13 Pluvialis fulva Pacific golden Plover Rr
14 Charadrius alexandrinus Kentish Plover C
15 Scolopacidae Gallinago gallinago Common Snipe UC
16 Limosa limosa Black-Tailed Godwit C
17 Limosa lapponica Bar- Tailed Godwit Rr
18 Numenius arquata Eurasian Curlew C
19 Tringa tetanus Common Redshank C
20 Tringa erythropus Spotted Redshank Rr
21 Tringa nebularia Common Greenshank C
22 Tringa glareola Wood Sandpiper C
23 Tringa stagnatilis Marsh Sandpiper C
24 Tringa ochropus Green Sandpiper C
25 Actitis hypoleucos Common Sandpiper C
26 Calidrs minuta Little Stint C
27 Calidris ferruginea Curlew Sandpiper C

97
International Conference on Ecosystem Services of Wetlands - ‘Ardrabhumi :2016’ISBN : 978-81-923628-3-0
28 Recurvirostridae Himantopus himantopus Black Winged Stilt C
29 Recurvirostra avosetta Pied Avocet C
30 Laridae Larus ridibundus Black-Headed Gull C
31 Larus cachinnans Caspian Gull UC
32 Larus heuglini Heuglin’s Gull C
33 Larus michahellis Yellow Legged Gull UC
34 Larus brunnicephalus Brown-headed Gull C
35 Larus genei Slender-billed Tern UC
36 Sternidae Gelochelidon nilotica Gull-billed Tern C
37 Sterna caspia Caspian Tern C
38 Sterna aurantia River Tern C
39 Sternula albifrons Little Tern C
40 Chlidonias hybridus Whiskered Tern C
41 Thalasseuss andvicensis Sandwich Tern UC
42 Philomachus pugnax Ruff UC
43 Rynchopidae Rynchops albicollis Indian Skimmer Rr
Ciconiiformes
44 Ardeidae Nycticorax nycticorax Black-crowned Night Heron C
45 Ardeola grayii Indian Pond Heron C
46 Butorides striata Little Heron/Striated Heron C
47 Ardea cinerea Grey Heron C
48 Ardea purpurea Purple Heron C
49 Bubulcus ibis Cattle Egret C
50 Casmerodius albus Great Egret C
51 Mesophoyx intermedia Intermediate Egret C
52 Egretta garzetta Little Egret C
53 Egretta gularis Western Reef Egret C
54 Ciconiidae Anastomus oscitans Asian Open bill C
55 Mycterialeuco cephala Painted Stork C
56 Ciconia episcopus Woolly-necked Stork UC
57 Threskiornithidae Threskiornis melanocephalus Black-headed Ibis C
58 Platalea leucorodia Eurasian Spoonbill C
59 Plegadis falcinellus Glossy Ibis C
60 Pseudibis papillosa Red-naped Ibis C

98
International Conference on Ecosystem Services of Wetlands - ‘Ardrabhumi :2016’ISBN : 978-81-923628-3-0
Columbiformes
61 Columbidae Streptopelia tranquebarica Red Collared Dove C
62 Streptopelia decaocto Eurasian Collared Dove C
63 Columba livia Rock Pegion C
64 Treron phoenicoptera Yellow-footedGreen Pegion C
65 Streptopelis enegalensis Laughing Dove C
66 Streptopelis achinensis Spotted Dove C
Coraciiformes
67 Alcedinidae Halcyon smyrnensis White-throated Kingfisher C
68 Alcedo herculas Common Kingfisher C
69 Ceryle rudis Pied Kingfisher C
70 Meropidae Merops philippinus Blue-tailed Bee-eater C
71 Merops persicus Blue-cheeked Bee-eater UC
72 Merops orientalis Green Bee-eater C
73 Coraciidae Coracias garrulus European Roller UC
74 Coracias benghalensis Indian Roller C
75 Upupidae Upupa epops Common Hoopoe C
Cuculiformes
76 Cuculidae Clamator jacobinus Pied Crested Cuckoo C
77 Eudynamys scolopacea Asian Koel C
78 Centropuss inensis Greater Coucal C
Falconiformes
79 Accipitridae Milvus migrans Black Kite C
80 Milvis migrans Black-eared Kite C
81 Elanus caeruleus Black Shouldered Kite C
82 Halias turindus Brahminy Kite C
83 Buteo buteo Common Buzzard Rr
84 Pernis ptiloryncus Oriental-Honey Buzzard C
85 Gyps indicus Indian Vulture Rr
86 Circus aeruginosus Eurasian Marsh Harrier C
87 Accipiter badius Shikra C
88 Clanga hastate Indian Spotted Eagle C
89 Aquila clanga Greater Spotted Eagle C

99
International Conference on Ecosystem Services of Wetlands - ‘Ardrabhumi :2016’ISBN : 978-81-923628-3-0
90 Circaetus gallicus Short-toed Snake Eagle UC
91 Hieraaetus pennatus Booted Eagle C
92 Aquila nipalensis Steppe Eagle UC
93 Pandionidae Pandionhali actus Osprey UC
94 Falconidae Falco tinnunculus Common Kestrel C
95 Falco amurensis Amur Falcon Rr
96 Falco peregrines Peregrine Falcon UC
Galliformes
97 Phasianidae Coturnix coromandelica Rain Quail UC
Gruiformes
98 Rallidae Gallirallus striatus Slaty-breasted Rail Rr
Passeriformes
99 Hirundinidae Hirundo smithii Wire-tailed Swallow C
100 Hirundo rustica Barn Swallow C
101 Motacillidae Motacilla flava Yellow Wagtail C
102 Motacilla alba White Wagtail C
103 Anthus trivialis Tree Pipit C
104 Anthus rufulus Paddy-field Pipit C
105 Dicaeidae Dicaeum erythrorhynchos Pale-billed Flowerpecker C
106 Monarchidae Terpisiphone paradisi Indian Paradise Flycatcher C
107 Muscicapa latirostris Asian-brown Flycatcher C
108 Rhipiduridae Rhipidura albogularis White-spotted Fantail C
109 Pycnonotidae Pycnonotus leucotis White-eared Bulbul C
110 Pycnonotus jocosus Red-whiskered Bulbul C
111 Pycnonotus cafer Red-vented Bulbul C
112 Laniidae Lanius schach Long-tailed Shrike C
113 Muscicapidae Saxicoloides fulicata Indian Robin C
114 Copsychuss aularis Oriental Magpie Robin C
115 Saxicolat orquata Common Stonechat C
116 Saxicola caprata Pied Bushchat C
117 Timalidae Turdoides caudatus Common Babbler C
118 Turdoides striata Jungle Babbler C
119 Chrysommasinense Yellow-eyed Babbler C

100
International Conference on Ecosystem Services of Wetlands - ‘Ardrabhumi :2016’ISBN : 978-81-923628-3-0
120 Cisticolidae Prinia socialis Ashy Prinia C
121 Prinia inornata Plain Prinia C
122 Prinia hodgsonii Grey-breasted Prinia C
123 Cisticola juncidis Zitting Cisticola C
124 Orthotomus suorius Common Tailorbird C
125 Sylviidae Acrocephalus dumetorum Blyth’s Reed Warbler C
126 Acrocephalus stentoreus Clamorous Reed Warbler C
127 Phylloscopus griseolus Sulpher-bellied Warbler C
128 Iduna caligata Booted Warbler UC
129 Phylloscopus trochiloides Greenish Warbler C
130 Acrocephalus agricola Paddy-field Warbler UC
131 Nectarinnidae Nectarinia asiatica Purple Sunbird C
132 Nectarania zeylonica Purple-rumped Sunbird C
133 Aethopygavi gorsii Vigor’s Sunbird C
134 Estrildidae Amandava amandava Red Avadavat C
135 Lonchura punculata Scaly-brestedMunia C
136 Lonchura malacca Tricolor Munia C
137 Euodice malabarica Indian Silverbill C
138 Ploceidae Ploceua philippinus Baya Weaver C
139 Petronia xanthocollis Chestnut-shouldered Petronia C
140 Passeridae Passe domesticus House Sparrow C
141 Emberizidae Emberiza melanocephala Black-headed Bunting UC
142 Emberiza bruniceps Red-headed Bunting UC
143 Strunidae Sturnus contra Asian Pied Starling C
144 Sturnus pagodarum Brahminy Starling C
145 Acrido therestristis Common Myna C
146 Sturnia malabaricus Chestnut-tailed Starling C
147 Sturnia erythropygia White-headed Starling C
148 Sternus roseus Rosy Starling C
149 Acridotheres fuscus Jungle Myna C
150 Oriolidae Oriolus oriolus Eurasian Golden Oriole C
151 Dicruridae Dicrurus macrocercus Black Drongo C
152 Dicrurus paradiseus Greater-racket Tailed Drongo C

101
International Conference on Ecosystem Services of Wetlands - ‘Ardrabhumi :2016’ISBN : 978-81-923628-3-0
153 Corvidae Corvus macrorhynchos Indian Jungle Crow C
154 Corvus splendens House Crow C
155 Campephagidae Pericrocotus cinnamomeus Small Minivet C
156 Aegithinidae Aegithina tiphia Common Iora C
157 Alaudidae Ammomanes phoenicura Rufous-tailed Lark C
158 Eremopterix griseus Ashy-crowned Sparrow-Lark C
159 Galerida malabarica Malabar crested Lark C
160 Tephrodornithidae Tephrodornis pondicerianus Common Woodshrike C
Pelecaniformes
161 Phalacrocoracidae Phalacrocorax fusicollis Indian Cormorant C
162 Phalacrocor axniger Little Cormorant C
163 Phalacrocor axcarbo Great Cormorant UC
Phoenicopteriformes
164 Phoenicopteridae Phoenicopteru sruber Greater Flamingo C
165 Phoenicopterus minor Lesser Flamingo C
Piciformes
166 Picidae Jynxtor quilla Eurasian Wryneck UC
167 Capitonidae Megalaima haemacephala Coppersmith Barbet C
168 Megalaima viridis White Cheeked Barbet C
Podicipediformes
169 Podicipedidae Tachybaptus ruficollis Little Grebe C
Psittaciformes
170 Psittacidae Psittacula krameri Rose-ringed Parakeet C
171 Psittacula eupatria Alexandrine Parakeet UC
Suliformes
172 Anhingidae Anhinga melanogaster Oriental Darter Rr
[C- Common, UC- Uncommon, Rr- Rare]
Conclusion:
Habitat transformation is a significant factorunderlying reduction of diversity. Thus, the authorities incharge of maintaining this area and its conservation shouldbe proactive in framing the appropriate strategies. Thenecessary conservation strategies recommended includestaking up social economic initiatives by involving locals,decreasing the pressure on natural resources of the area
and continuous monitoring of avifauna for monitoring healthof habitat. These community based activities can avoidpermanent damage to bird diversity of the area. Though thelagoons were formed later, Bhandup pumping station cameinto existence in 1986. However, there is no base line dataavailable on diversity of avifauna of the region includingthe marshland and salt pans around. Therefore, continuousmonitoring has to be conducted to evaluate the aviandiversity and anthropogenic stress to habitats in BhandupPumping Station and adjoining areas for effectiveconservation plan.

102
International Conference on Ecosystem Services of Wetlands - ‘Ardrabhumi :2016’ISBN : 978-81-923628-3-0
Acknowledgement:
We express our sincere gratitude to Nikhil Savant andAvinash Bhagat for their invaluable support extended duringthe field study.
References:
Ali, S. and Ripley, S. D. (1983). A pectorial Guide to theBirds of Indian Subcontinent. Bombay Natural HistorySociety, Oxford University Press, Mumbai.
Bibby, C.J., Burgess, N.D. and Hill, D.A. (1992). Bird CensusTechniques. Academic Press, London. pp. 67-84
Dandapat, A., Banerjee, D. and Chakraborty, D. (2010). Thecase of the Disappearing House Sparrow (Passerdomesticusindicus). Veterinary World, 3(2), 97-100
Environment Canada (1994). Biodiversity in Canada: AScience Assessment for Environment Canada. EnvironmentCanada, Ottawa.
Fraser, L.H. and Keddy, P.A. (eds.). (2005). The World’sLargest Wetlands: Ecology and Conservation. CambridgeUniversity Press, Cambridge, UK. 488 p.
Furness, R.W. and Greenwood, J.J.D. (1993). Birds as amonitor of Environmental change. Chapman and Hall,London.
Grimmett, R., Inskipp, C. and Inskipp, T. (2013). Birds of theIndian Subcontinent. Oxford University Press, New Delhi.
Johnsingh, A.J.T. and Joshua, J. (1994). Avifauna in threevegetation types on Mundanthurai Plateau, South India.Journal of Tropical Ecology, 10, 323–335
Kushwaha, S. and Kulkarni, N. (2013). Bird diversity ofBetawade, Thane, a natural urban habitat. NationalConference on Biodiversity: Status and Challenges inConservation - ‘FAVEO’. pp. 39-46
Narain,V. (2009). Growing city, shrinking hinterland: landacquisition, transition and conflict in periurban, Gurgoan,India. Environment and Urbanization,27, 501-512
Rapoport, E.H. (1993). The process of plant colonization insmall settlements and large cities. In: MacDonell, M.J. andPickett, S. (eds.), Humans as components of ecosystems.Springer–Verlag, New York, 190–207
Shaw, A. and Satish, M.K. (2007). “Metropolitanrestructuring in post-liberalized India: separating the globaland the local.” Cities,24, 148-163
The IUCN Red List of Threatened Species 2014. Version2015.2. Available at: www.iucnredlist.org
Turner, W.R. (2003). Citywide biological monitoring as a toolfor ecology and conservation in urban landscapes: the caseof the Tucson bird count. Landscape and Urban Planning,65, 149- 166
UNEP (1995). Global Biodiversity Assessment. CambridgeUniversity Press, Cambridge, 1140 pp

103
International Conference on Ecosystem Services of Wetlands - ‘Ardrabhumi :2016’ISBN : 978-81-923628-3-0
Impact of Immersion of Ganesh Idols on Physicochemical Parameters ofPond Water Samples
Chetana Shetty*, Urmila Kumavat, Siddhesh Mishal and Ashutosh JawaleDepartment of Botany, VPM’s B.N. Bandodkar College of Science, Thane (W) 400601,
Affiliated to University of Mumbai, Maharashtra, IndiaE-mail – [email protected]
Abstract : Like any other major Indian festivals such as Diwali and Holi, celebration of Ganesh festival produces considerablerisk to different aquatic ecosystems. At the end of this festival, several Ganesh idols and offering materials are usuallyimmersed in various water bodies. The present work is undertaken to assess the changes in water quality due to suchanthropogenic activities. For said work, three ponds were selected from adjoining regions of Thane. The water analysisinvolved determination of various parameters such as DO, hardness, salinity, chlorinity, sulphates, phosphates, lead, etc. Theresults indicated considerable reduction in DO and acidity while rest all parameters showed significant rise including the mosthazardous heavy metal of lead. In conclusion, now all these changed values are at alarming levels. But in future there exist ademand for remedial as well as preventive measures to save these valuable water bodies.
Key words – Ganesh festival, Water parameters, DO, Hardness, Lead
Introduction
In any ecosystem water is considered to be the mostimportant component for life (Dixit et al., 2015). Pond waterforms integral part of wetland and terrestrial ecosystems. Itacts as a source of essential nutrients to support growthand development of diverse forms of organisms. In ourcountry fresh water wealth is under threat due to theinfluence of natural and human activities (Shrivastava, &Mishra, 2011). This in turn adversely affects the terrestrialcommunities which are dependent on these water bodies.
Recently the waste materials generated by major Indianfestivals are equally matter of concern next to the pollutantsproduced by various anthropogenic activities. Smokeproduced by crackers in Diwali, synthetic colours used inHoli and Plaster of Paris (POP) used in making of Ganeshidol get mixed in surrounding environment at greater extent.Most of these man-made substances manifest their harmfuleffects after prolong period of accumulation.
Ganesh festival is one of the magnificent festivals ofIndia and it is predominantly celebrated in states ofMaharashtra, Karnataka, Andhra Pradesh and Goa (Patil,2012). The festival is celebrated for 2-10 days. At the end offestive period, the Ganesh idols with their offering materialsare carelessly immersed in fresh or marine water bodies. Thepresent work has been carried out to determine quality of
water before and after Ganesh festival in order to find outeffect of Ganesh idol immersion on water quality of freshwater bodies.
Materials and Methods
For the present work three water bodies (ponds) wererandomly selected from the adjoining areas of Thane. Eachpond is situated near town and is the centre of humanactivities. They were from three towns namely, Kalwa (N 19°11', E 72° 59', Elevation 6.65 m), Mumbra (N 19°10' 36”, E73°01' 20” Elevation 5.75 m) and Diva (N 19.188993°, E73.043268° Elevation 6.760 m). Samples of surface waterwere collected in a clean polythene bottle of 5L capacity.The collection was done twice and samples were collectedtwice, viz, before 7 days and after 2 days of ganesh festival
.
After collection the samples were protected from directsunlight and analyzed within 48 hrs of collection (BIS, 2012).The samples were deposited in the lab and subsequentlyused for analysis of various physicochemical parameters.The parameters included colour, odour, pH, acidity, alkalinity,dissolved oxygen (OD), hardness, salinity, chlorinity,sulphates, phosphates, copper and lead. All theseparameters were determined by following the standardprocedures (APHA, 1998; BIS, 2012; Kumar and Puri, 2012;Marganwar, 2012; WHO, 2006).

104
International Conference on Ecosystem Services of Wetlands - ‘Ardrabhumi :2016’ISBN : 978-81-923628-3-0
ResultsTable No. 1: Values of Physicochemical parameters of Kalwa, Mumbra and Diva ponds
Parameters Std Kalwa pond Mumbra pond Diva pondK
BK
AK
dM
BM
AM
dD
BD
AD
d
pH 6.5-8.5 7.8 7.0 - 0.8 7.24 5.47 -1.77 7.55 6.67 -0.88Acidity —- 110 210 100 125 280 155 125 250 125Alkalinity 200 mg/L 250 250 0 250 250 0 250 250 0DO 4 mg/L 7.84 6.32 -1.52 8.96 7.84 - 1.12 7.84 6.49 - 1.35Hardness 300 mg/L 48.09 60.12 12.03 48.09 68.13 20.04 52.10 68.13 16.03Salinity —- 256.3 256.3 0 384.5 384.5 0 256.3 256.3 0Chlorinity (g/L) —- 142 142 0 213 213 0 213 213 0Sulphates 150 mg/L 2 10 8 14 46 32 10 22 12Phosphates 5 mg/L 1 2 1 2 6 4 1 6 5Copper 0.05 mg/L 0.38 0.64 0.26 0.37 0.96 0.59 0.35 0.64 0.29Lead 0.1 mg/L 2.0 3.0 1.0 4.0 5.0 1.0 3.0 4.0 1.0
Key: Std – Standard limits, KB – Water sample of Kalwa pond before festival, K
A - Water sample of Kalwa pond after
festival, Kd – Difference between K
A & K
B, M
B – Water sample of Mumbra pond before festival, M
A - Water sample of Mumbra
pond after festival, Md - Difference between M
A & M
B, D
B – Water sample of Diva pond before festival, D
A - Water sample of
Diva pond after festival, Dd - Difference between D
A & D
B
Conclusion
Immersing of Ganesh idols brought about severalchanges in physicochemical properties of all the testedsamples. From Table No. 1, the drastic changes in values ofalmost all water parameters assessed before and after festivalcan be noticed. The undesirable changes had been observedin colour and odour of all water bodies. The change in colourof all water samples can affect the quality and quantity ofpenetrating light. The reduced values of pH go concurrentwith increased acidity in all the samples. After festival,although DO (Dissolved Oxygen) in all water samples wasfound to be lowered but it was within the threshold level.These reduced DO levels can be very well correlated withincreased pressure of oxidation of immersed anthropogenicsubstances of festival. Similarly considerable rise in hardness,sulphates and phosphates is certainly due to addition of largequantity of Plaster of Paris, cement and clay that are used inmaking of Ganesh idols (Zodape, 2013). The utmost importantfactor of concern is of lead and copper. The colouringcompounds used for painting idols are potential source ofthem (Kumar & Puri, 2012; Patil, 2012). In conclusion, immersionof Ganesh idol severely affected water quality of study areas.The generated data is indicative of water pollution of threenatural water resources caused due to immersion of Ganeshidols. It may lead to the hazardous effects on aquatic floraand fauna in future. It can also exert harmful effects ondomestic animals of adjoining areas. To overcome this waterpollution problem, cleaning of pond can be done on prioritybasis. At the same time promotion of eco-friendly Ganeshidols can be thought as perspective options.
References
APHA – American Public Health Association. (1998). Standardmethods for estimation of water and water waste, AmericanPublic Health Association: Washington DC., USA, 10-161.
BIS – Bureau of Indian Standards (2012). Indian StandardDrinking Water Specification, Indian Standards 10500, 2-3.
Dixit, A. K., Pandey, S. K., Mehta, R., Niyaz, A., Gunjn, andPandey, J., (2015). Study of physic-chemical parameters ofdifferent pond water of Bilaspur District, Chhattisgarh, India,Environmental Skeptics and Critics, 4(3): 89-95
Kumar, M. and Puri, A. (2012). A Review of permissible limitsof drinking water. Indian Journal of Occupational andEnvironmental Medicines, 16(1), 40-44.
Marganwar, R., Dhuerve, V., Kodate, J. And Dhawas, S.(2012). Physicochemical characteristics and quality of lakewater of Nagpur city, Maharashtra (India). Bionano Frontier.5(2), 159-164.
Patil, Y. (2012). Ganesh Idol Immersion and Water Pollutionin the state of Maharashtra: An Action Plan. Retrieved fromhttp://www.legalservicesindia.com.
Shrivastava, K.B.L., and Mishra, S. P., (2011). Studies ofvarious heavy metal in surface and ground water ofBirsinghpur town and its surrounding rural area DistrictSatna (M.P.). Current World Environment. 6(2), 271-274.
WHO. (2006). A guideline for Drinking Water Quality. Geneva:World Health Organization,, 491-492.
Zodape, G.V., Dhawas, V.L., Wagh, R.R. and Magare, V.N.(2013). Analysis of heavy metals and coliform in samples ofdrinking water collected from municipal ward offices ofwestern suburbs and extended western suburbs. BionanoFrontier, 6(2), 252-259.

105
International Conference on Ecosystem Services of Wetlands - ‘Ardrabhumi :2016’ISBN : 978-81-923628-3-0
Study of Antibacterial Activity of Medicinal Plants on MDR VibriocholeraeIsolated from Waste Water of Latur City
Jadhav R. N.ShivneriMahavidyalaya, Shirur (A).MS,INDIA..
Abstract : Cholera is an example of water born disease caused by Vibriocholerae. Vibrio cholerae is Gram negative, noncapsulated, none spore forming, curvedrod shaped bacteria. Sources of transmission of it arefecally contaminated water andfood.The natural habitat of Vibrio choleraeis the saline waters of coastal seas and brakish estuaries where they can persist fora longer period.Due to the existence of multi drug resistant strains now a day the demand of herbal products as therapeuticagents is increasing all over the world. In the present study antibacterial activity of Allumsativum, Citrus limon,Syziumaromaticum and Zingiberofficinale was studied against MDR Vibrio cholerae isolated from waste water of Latur city.Isolation and identification of Vibrio choleraewas done by morphological, cultural characteristics and standard biochemicaltests.Antibiotic susceptibility testing was performed by Kirby Bauer’s disc diffusion method. The most common pattern ofmultiple drug resistance (MDR) of isolates of Vibrio cholerae observed wasampicillin – chloramphenicol – tetracycline –ciprofloxacin – amoxicillin-streptomycin.Antibacterial activity of medicinal plant is studied by agar (well) diffusion method.Itwas found that Zingiberofficinale and Allumsativum showed highest antibacterial activity while Citrus limon andSyziumaromaticum showed moderate antibacterial activity.
Keywords: Antibacterial activity, Disc diffusion method, Multi drug resistant,Plant extracts, Vibrio cholerae.
1. Introduction
The name vibrio is derived from characteristicvibratory motility. Vibrio choleraeis found in aquatichabitats with a wide range of salinity. They also occur inmarine and estuarine environments and on the surfaces ofthe intestine of marine animals.Cholera is an acute diarrhealdisease. It occurs in many forms, sporadic, endemic,epidemics and pandemic[Ananthanarayan & Paniker, 2014;Dubey &Maheshwari, 2014].Infection is acquired throughfecally contaminated water or food. Hand contamination ofstored drinking water has been shown to be an importantmethod of domestic spread of infection [Ananthanarayan& Paniker,2014].Incubation period of V.cholerae is 24-72 hrs.It was cultured for the first time in 1883 by Robert Koch.Vibrio cholerae has several serological groups such as01,02,0139 and two bioptypes V cholerae and EL Tor. Itadheres to the mucosa of small intestine and secretes acholera toxin, choleragen.Choleragen is a protein.Choleragen induces the secretion of water and chloride ionsand inhibits absorption of sodium ions. The patient loosewater and electrolyte. In1961 the E l Tor biotype of Vibriocholerae 01 strain was the cause of cholera pandemic andin 1996 strain V.cholerae 0139 emerged in Calcutta in India.[Dubey &Maheshwari,2012].The indiscriminate use ofantibiotics has led to an increase in antibiotic resistanceamong microorganisms [Anderson, 1968;Pelzar, Chain&Krieg, 2010]. Antibiotic resistance represents a seriousproblem for clinicians. Drug resistance is one of the nature’snever ending process whereby organisms develop atolerance for new environmental conditions [Pelzar, Chain&Krieg , 2010].Bacteria become resistant to antibiotic bydifferent ways. R-plasmid often contains genes for resistanceto several antibiotics [Dubey&Maheshwari, 2012]. Plasmid
can be transferred between bacterial cells in a populationand between different but closely related bacterialpopulations [Pelzar, Chain& Krieg,2010].
The application of plants as medicine perhaps datesback to prehistoric period. The application of plants thereforeis as old as 4000 to 5000 B.C. In India earliest references ofcurative properties of plants appear in Rig-Veda which issaid to be written between 3500 to 1600 B.C. The ruralpopulation in different parts of the world is more disposedto traditional way of treatment. It is estimated that about 80% of the rural population in developing Asian nation dependon home care and traditional medicine for major therapies[Jager, Hutching &Staden,1996]. The problem of drugresistance could overcome by herbal drugs. Due to thisreason now a day the demand of herbal products astherapeutic agents is increasing all over the world. Keepingthis view in mind in the present study an attempt was madeto isolate MDR Vibrio cholerae from sewage of Latur city&to study the effect of plant extract on it.
2. Materials and Methods
2.1. Isolation of MDR Vibrio choleraefrom waste water
Vibrio cholerae was isolated from waste water of Laturcity by using specific media. Alkaline peptone water, alkalinebile salt agar, Monsur’s GTTA, TCBSand Nutrient agar mediawere used for isolation of it. Isolates of Vibrio choleraewere identified by using different morphological, culturalcharacteristics& standard biochemical reactions[Ananthanarayan & Panikar, 2014, Dubey & Maheshwari,2014; Krieg & Holt, 1984; Pelzar,Chain & Krieg, 2010.].Antibiotic susceptibility testing was carried out by Kirby-Bauer’s disc diffusion method [Baueret al,1966] for drug

106
International Conference on Ecosystem Services of Wetlands - ‘Ardrabhumi :2016’ISBN : 978-81-923628-3-0
susceptibility according to National Committee for ClinicalLaboratory standards (NCCLS) [NCCL, 1993]. The MullerHinton agar plates were smeared evenly using with isolatesof Vibrio cholerae. This was then impregnated withantibiotic discs using sterile forceps & then gently presseddown onto the agar. Plates were kept at low temperature (4ºC) for about 15- 30 min and then incubated at 37 ºC for 24-48 hrs.Antibiotics used in this study were Ampicillin (10µg), Amoxicillin (10µg),Cephotaxime (30µg), Ciprofloxacin(5µg), Chloramphenicol (30µg), Gentamicin (10µg),Kanamycin (30µg), Nalidixicacid (30µg),Streptomycin (10µg ) and Tetracycline (30µg) supplied by Hi-MediaLaboratories, Mumbai were used for this test.
2.2. Preparation of aqueous plant extract
A good quality of clove (bud), garlic (bulbs), ginger(rhizome) &lemon (fruit) were procured from the local marketand washed with water to remove soil and dirt. After cleaningthe plant materials were chopped into small pieces with cleanknife. Then crushed in mortal and pestle by adding few mlof sterile distilled water. Aqueous extract of above plant(5% w/v) were prepared separately. Then it was filtered &tested by using agar well diffusion method.
2.3. Antibacterial testing of plant extract
A 0.1ml of suspension of isolates of Vibrio choleraewasthoroughly mixed with 20-25ml of sterile molten nutrient agarand poured into sterile petri plates under aseptic conditions.After solidification, plates were used for making of well byusing flamed cork borer. 0.5 ml of single plant extract wasadded in each well. Plates were kept at low temperature (4ºC) for about 15- 30 min and then incubated at 37 ºC for 24-48 hrs. After incubation, zones of inhibition were measured& noted. Antibacterial assay was performed in triplicate witheach bacterial strain.
3. Result and Discussion
Waste water samples were collected from differentlocations of Latur city. From this isolates Vibrio
choleraewere isolated. 10 isolates of Vibrio choleraeshowedantibiotic resistance to one or more antibiotics. Isolates ofVibrio choleraewere Gram negative, actively motile, noncapsulated curved rods. They wereindole +ve, VP-ve, MR-ve, catalase +ve, oxidase +ve,urease-ve, gelatin liquefaction+ve , nitrate reduction +ve, cholera red reaction+ve,hemolytic activity on blood agar +ve,lysine& ornithinedecarboxylase +ve,arginine decarboxylase –ve, glucose +ve,mannitol+ve , maltose +ve, lactose-ve ,arabinose–ve,sucrose+ve. The most common pattern of multiple drugresistance of isolates of Vibrio choleraeobserved wasampicillin – chloramphenicol – tetracycline – ciprofloxacin– amoxicillin - streptomycin. The MAR index of each isolatewas calculated by using Eq. (1).
The MAR index of each isolate was calculated byusing following formula:
Table 1 Percent resistance of Vibrio cholerae isolatesagainst individual antibiotic.
Antibiotics No of isolate Percentshowing resistance resistance
Ampicillin ( 10 µg) 07 70Amoxicillin (10µg) 02 20Cephotaxime(30 µg ) *I *ICiprofloxacin (5µg) 02 20Chloramphenicol (30µg) 05 50Gentamicin (10µg) 00 00Kanamycin (30µg ) *I *INalidixic acid(30µg) 00 00Streptomycin (10 µg ) 01 10Tetracycline(30µg) 04 40*N.B. I = intermediate
The antibacterial activity of plant extract on isolatesof Vibrio cholerae was studied, zone of diameter weremeasured & noted in the Table 2.
(1)MARIndex =
No. of Antibiotics to which the isolatewas resistant
Total no. of antibiotics tested
Table 2 Antibacterial activity of plant extract on isolates of Vibrio cholerae
Isolate of Zone Diameter in mmVibrio cholerae Allumsativum Citrus limon Syziumaromaticum Zingiberofficinale
(Garlic) (Lemon) (Clove) (Ginger)IVC1 22 17 - 22IVC 2 16 - 11 20IVC 3 20 18 - 21IVC 4 19 11 17 18IVC 5 - 12 12 16IVC 6 21 - 16 -IVC 7 20 17 - 19IVC 8 16 19 - 23IVC 9 - 20 20 18IVC 10 18 - 19 -

107
International Conference on Ecosystem Services of Wetlands - ‘Ardrabhumi :2016’ISBN : 978-81-923628-3-0
It was found that that Zingiberofficinale andAllumsativum showed highest antibacterial activity whileCitrus limon and Syziumaromaticum showed moderateantibacterial activity. The highest antibacterial activity ofgarlic is due to presence of allicin. Garlic has been used asfolk medicine since ancient times for a variety of ills [Moore& Alkins, 1977]. Garlic has antibacterial, anti microbial,antiviral & antitumor activity [Avato,Tursil, Vitali,Micolis&Candido, 2000;Jain, 2003]. The antibacterial activityof lemon is due to presence of citric acid. It contains5%citric acid[Jain,2003;Kirtikar&Basau, 1988].The antimicrobialactivity of clove is due to oil called oleum caryophilli whichis a mixture of hydrocarbon & eugenol (a phenol)[Arora&Kaur,1999]. It is used as antiseptic, stimulant andantispasmodic. It has antibacterial & antifungal activity[Thomson, 1978]. It is also used to aid digestion. Gingercontains besides some monoterpens, the sesquiterpene-gingibrine alcohol- gingiverol. Gingerol is very pungent,yellow, a mixture of alcohol. Ginger is traditionally used fora number of gastrointestinal disorders including diarrhoea[Nadkarni,1976]. Zingiberofficinale and Allumsativumshowed high antibacterial activity so these can be used asan alternative to chemical therapy of infectious diseases.
4. References
[1]. Anderson J.D., (1968). The ecology of transferabledrug resistance in Enterobacteria, Ann. Reu.Microbiol, 22: 131-180.
[2]. Ananthanarayan and Paniker,(2014).,Text book ofMicrobiology,editor Arti Kapil,UniversitiesPress,(32)303-311.
[3]. Arora DS, Kaur J., (1999). Antimicrobial activity ofspices,Int. J.Antimicrob. Agents,. 12: 257-262.
[4]. Avato, P., Tursil E., Vitali C., Miccolis V., CandidoV.,(2000).Allylsulfide constituents of garlic volatile oilas antimicrobial agents, Phytomedicine,7(3): 239-243.
[5]. Bauer A.W.,Kirby W.M. and Sherris J.C.,(1966). Am.J. Clin. Pathol, 45:493.
[6]. Dubey R.C &Maheshwari D.K.,(2012).A Textbook ofmicrobiology, S.Chand & company Ltd.731.
[7]. Dubey R.C &Maheshwari D.K., (2014).Practicalmicrobiology, S.Chand& company Ltd. 114.
[8]. Jabar MA, Al-Mossawi A., (2007).Susceptibility ofsome multiple resistant bacteria to garlic extract, Afr.J. Biotechnol,. 6: 771-776.
[9]. Jager A.K., Hutching A.and Van Staden J., (1996).Screening of Zulu medicinal Plants for prostaglandinsynthesis inhibitors, J. Ethnopharmacol, 52(2) 95-100.
[10]. Jain S.K., (2003).Medicinal plants, National BookTrust.
[11]. Kirtikar K.R. &Basu B.D.,(1988). Indian Medicinalplants, 2nd edition,
[12]. Krieg N.R. & Holt J.G., (1984).Bergey’s manual ofsystematic bacteriology,Vol I, Williams & Wilkins,ISBNO-683-04108-8, Baltimore, USA.
[13]. Moore G.S. and Alkins R.D., (1977). The fungicide andfungistatic effect of aqueous garlic extract onmedically important yeast like fungi,Mycologia,.69:341-348.
[14]. Nadkarni K.M.,(1976).Zingiber officinalisIn IndianMateria Medica, Popular prakashan, Bombay, 13081335.
[15]. NCCL,(1993).Performance standards forantimicrobial disc susceptibility test approvedstandards. NCCLS Publication, Mz-As, Villanova, P.A,USA.
[16]. Pelzar Michael J.,Chain ,ECS, Krieg Novel R.,(2010).Microbiology, An application basedapproach, 677.
[17]. Thomson W.A.R. (Ed),(1978). Medicine from earth.Mc GrawHill Co. Maidenhead, UK.

108
International Conference on Ecosystem Services of Wetlands - ‘Ardrabhumi :2016’ISBN : 978-81-923628-3-0
Multiple Criteria Decision Making Techniques for Ranking Some Lakes inThane City.
Kalpana D. [email protected]
Department of Statistics,VPM’s B. N. Bandokar College, Thane (Maharasthra) 400601..Abstract: Multiple Criteria Decision Making (MCDM) is a technique used where there is a need for integration of the resultsof number of factors to make an overall judgment. Sources may vary in quality according to various factors. It would be moreuseful to have a concluding index for comparing the sources on the basis of several parameters on which sources are assessed.Thus in the context of environmental studies, data integration techniques are of prime importance. In the present article oneof the MCDM methods is discussed to obtain. Composite indices (CI) and accordingly ranking of the sources can be done. Thedata on six lakes in Thane city based on several physical and chemical parameters are analyzed using this technique, and CIsare derived. Lakes are given overall rank on the basis of these CIs.
Key words: Distances, Rank, Weights, Composite index.
Introduction:
Environmental Protection Policy (EPP) is top in list ofdevelopment plans all over the world. Environmentalassessment is a key to EPP. Environmental assessment isusually based on several factors. Fresh water bodies likelakes are models of the ecosystem and their study giveabundance aid for explaining several ecological principles.The biological analysis of lake water shows theinterdependence of many factors related with ecology oflakes. Though Thane City is fore runner in beautifyingconserving ecosystem and protecting the lakes in urbanenvironment such efforts are inadequate. The concern ofwater pollution of these bodies needs experimentation onvarious physical, chemical and other properties. Some lakesare good on some parameters but they may have badperformance w.r.t other parameters. The question arisesregarding how to distribute relative importance to theparameters and then how overall quality of the lake is to beassessed?
Classical techniques in Statistics sometimes demandto omit the information on some of factors or are not able toprovide overall comparison. These drawbacks are overcameby MCDM as claimed by Hwang and Yoon (1981), Zeleny(1982) and Yoon and Hwang (1995). These techniques usedfor meaningful integration of component indices to an overallindex, in order to decide on the ranking of a number oflocations or sources from best to worst. This is based onthe principle that in the absence of a natural ideal location,a best alternative would be the one which has the shortestdistance from the hypothetical ideal location.
Methodology:
The mathematical formulation of the problem is asfollows. Rows represent location means regions orenvironmental units and columns representing characters,the element xij is value of ith location w.r.t the jth character.
Let us denote by x1:j
and xk:j
, respectively, the smallestand the largest possible values of xij for fixed j; 1 < j < N.
An ideal hypothetical location corresponds to one forwhich the row of x-values is given by {x
1:1; x
1:2; . . . ; x
1:N},
comprising the smallest possible values for each characters.Likewise, the one based on {x
K:1; x
K:2; . . . ; x
k:N} will be
referred to as an anti-ideal location.
The main purpose of such a study is to identify thelocation which is closest to the ideal in some sense. Whiledoing so, one may also incorporate the fact that such alocation is expected to be the farthest from anti-ideal. Inreality such ideal or anti-ideal locations may not exist. Oneway to identify the closest location is to compare the givenlocations by suitably defining a composite index (CI) basedon the distances from the ideal and the anti-ideal. We willset the CI value at 0 for the ideal and at for the anti-idealand define the criterion of closeness as one correspondingto the least value of the CI. There are two popular CIs studiedin the literature and applied in practice. One of the methodsis based on the Technique for Ordering Preferences bySimilarity to Ideal Solution, abbreviated as TOPSIS (Zeleny,1982).
dij = distance of xij from x1:j
d*ij = distance of xij from xK:j
; 1 < i < K; 1 < j < N
Define now
L2(i;ideal) =
L2(i;anti ideal) =

109
International Conference on Ecosystem Services of Wetlands - ‘Ardrabhumi :2016’ISBN : 978-81-923628-3-0
Then the TOPSIS-based CI for the ith location is givenby—
i(d) = 1 < i < K
ocation with higher CI will rank to top then remainingare ranked accordingly.
To apply the above technique the data collected onsix lakes in Thane City namely Ambaghosale ,Rewale,Makhamali, Upwan, Jail, Kalwa (Raut, 2006) are used. Eachof them is examined for several physical, chemical andbiological properties. For convenience properties aregrouped into Chemical and Physical separately. In Chemicalproperties eight parameters viz. Calcium, Magnesium, Silica,Phosphorous, Nitrate, Biochemical oxygen demand (BOD),pH and Salinity are taken together and CI are calculated. InPhysical properties five parameters viz. light penetration,water temperature, turbidity, conductivity and total solidsare used to form CI. The lakes are ranked according to theirincreasing value of CI.
Results and discussions:
Following table gives CI and corresponding ranks onbasis of CI.
Name of Lake Based on Based onChemical Physicalparameters parametersCI Rank CI Rank
Ambaghosale 0.818556 6 2.823259 6Rewale 0.474339 5 0.855484 2Makhamali 0.384951 4 2.161556 5Upwan 0.196381 2 1.81803 4Jail 0.092707 1 0.453561 1Kalwa 0.284007 3 1.271302 3
The analysis shows that on the basis of chemical andphysical properties, Ambaghosale ranks at the lowest; Jailis at the top position. Where as physical propertiesconcerned Rewale is at better positions than its rankingbased on chemical properties. Kalwa retains its position oneither head.
Conclusion: MCDM gives meaningful integration ofcomponent indices into an overall index. If remedial measureshave to be taken to improve quality of the lakes results fromMCDM technique will be more useful and handy tool .Onecan improve upon the parameters which can be controlled.In a view of studying ecology of the lakes such results canbe taken as a foundation. The study of status of ecosystem(of not only lakes) of various locations based on severalparameters can be well summarized by such technique.
Acknowledgement: Author is extremely grateful toPrincipal Dr. Madhuri Pejaver and her research associate forproviding the data of their experiments.
References:
1. Hwang C. L. and K. Yoon (1981). Multiple AttributeDecision-Making: Methods and Applications. A State-of-the-Art Survey. Springer-Verlag, New York,189:
2. Raut, Nayana (2006). Ph. D. Thesis University ofMumbai.
3. Yoon K, Hwang CL. 1995. Multiple Attribute DecisionMaking: An Introduction. Sage Publications.
4. Zeleny M. (1982). Multiple Criteria Decision Making.McGraw-Hill.

110
International Conference on Ecosystem Services of Wetlands - ‘Ardrabhumi :2016’ISBN : 978-81-923628-3-0
Status of Wetland Birds in and around Panvel with Reference to InternationalAirport Panvel, Navi Mumbai, Maharashtra
1Sandhya Kupekar and 2Mayur Naik1Mahatma Phule Arts, Science & Commerce College, Panvel.
Abstract: The Airport will come near Panvel and is spread across 3400 acres of land. The land has been acquired from villagersnear Panvel and currently 98% of land has been acquired. The terminal area of the airport will be 2, 50,000 sq. Metres. Theland required for the project is located in an area of 1160 hectares (2867 acres). The international Airport area will besurrounded by 10 villages, viz. Kombad Bhuje, Ganeshpuri, Ulve, Mulgaon, Vaghiliwada, Owle, Pargaon, Kopar,Koli andChinchpada. Wetlands help to counter balance the human effect on rivers by rejuvenating them and surrounding ecosystems.Many animals that live in other habitats use wetlands for migration or reproduction. Bird’s use wetlands during breedingcycles ranges widely. Some birds depend on wetlands almost totally for breeding, nesting, feeding, or shelter during theirbreeding cycles. Birds that need functional access to a wetland or wetland products during their life cycle, especially duringthe breeding season, can be called “wetland dependent”. Other birds use wetlands only for some of their needs, or they mightuse both wetland and upland habitats. A total 23 bird species was recorded during the study. Out of these14 are migratory.Threespecies were found under threatened category, Painted stork, Black tailed godwit, Black headed Ibis. Destruction of habitats,wetlands and mudflats, human interference, rapidly changing environment has put these species under threat of extinction. Sothere is great need to maintain and restore wetlands.
Keywords: Navi Mumbai, Threatened, Birds, International Airport, Panvel .
Introduction:
India has a wealth of wetland ecosystems that supportdiverse and unique habitats. These wetlands providenumerous ecological goods and services but are undertremendous stress due to rapid urbanization, industrializationand agricultural intensification, manifested by the shrinkagein their areal extent, and decline in the hydrological, economicand ecological functions they perform (Basi et al., 2014).Wetlands are considered to have unique ecological featureswhich provide numerous products and services to humanity(Prasad et al., 2002). Ecosystem goods provided by thewetlands mainly include: water for irrigation; fisheries; non-timber forest products; water supply; and recreation. Majorservices include: carbon sequestration, flood control,groundwater recharge, nutrient removal, toxics retention andbiodiversity maintenance (Turner et al., 2000).Wetlandsprovide a wide range of ecosystem services such asgroundwater recharge, attenuated nutrient runoff, habitatgeneration, and contaminant stabilization. Navi Mumbai isa city on the west coast of Maharashtra, India. The site isapproachable from Mumbai-Pune Highway via an approachroad from Navi Mumbai. The international Airport area willbe surrounded by 10 villages, viz. Kombad Bhuje,Ganeshpuri, Ulve, Mulgaon, Vaghiliwada, Owle, Pargaon,Kopar,Koli and Chinchpada. One of the best known functionsof wetlands is to provide a habitat for birds. Humans haveknown of the link between birds and wetlands for thousandsof years. Prehistoric people drew pictures of birds andwetlands on cave walls, scratched them onto rocks, andused them in the design of artefacts and Native Americanlore provides accounts of bird hunts in wetlands. Wetlandsare important for bird habitats, and birds use them for
breeding, nesting, and rearing young. Birds also usewetlands as a source of drinking water and for feeding,resting, shelter, and social interactions. Some waterfowl, suchas grebes, have adapted to wetlands to such an extent thattheir survival as individual species depends on theavailability of certain types of wetlands within theirgeographic range. Other species, such as the northern pintailor the American widgeon, use wetlands only during someparts of their lives. Wetlands prevent flooding by holdingwater much like a sponge. By doing so, wetlands help keepRiver levels normal and filter and purify the surface water.Wetlands accept water during storms and whenever waterlevels are high. When water levels are low, wetlands slowlyrelease water. Wetlands also release vegetative matter intorivers, which helps feed fish in the rivers. Wetlands help tocounter balance the human effect on rivers by rejuvenatingthem and surrounding ecosystems. Many animals that livein other habitats use wetlands for migration or reproduction(Mitsch 2010). Herons nest in large old trees, but needshallow areas in order to wade for fish and aquatic life.Amphibians often forage in upland areas but return to thewater to mate and reproduce. While wetlands are trulyunique, they must not be thought of as isolated andindependent habitat. To the contrary, wetlands are vital tothe health of all other biomes and to wildlife and humanseverywhere. Unlike most other habitats, wetlands directlyimprove other ecosystems. Because of its many cleansingbenefits, wetlands have been compared to kidneys. Theanalogy is good one.
Wetlands and kidneys both help control water flowand cleanse the system. Looking at pictures of deltas, onecan tell that rivers deposit a lot of sediment into the ocean.

111
International Conference on Ecosystem Services of Wetlands - ‘Ardrabhumi :2016’ISBN : 978-81-923628-3-0
The sediment is from top soil that has been eroded andwashed away. (Plants firmly rooted in the muddy bottombut with stalks that rise high above the water surface) areable to radically slow the flow of water. Wetlands also cleanthe water by filtering out sedimentation, decomposingvegetative matter and converting chemicals into useableform. The ability of wetlands to recycle nutrients makesthem critical in the overall functioning of earth. No otherecosystem is as productive, nor as unique in this conversionprocess. In some places artificial wetlands were developedsolely for the purpose of water purification. Wetlands areamongst the most productive ecosystems on the Earth, andprovide many important services to human society (Brink etal., 2012). Wetlands exhibit enormous diversity accordingto their genesis, geographical location, water regime andchemistry, dominant species, and soil and sedimentcharacteristics (Space Applications Centre, 2011).
Material and Methods:
Initially the area around Navi Mumbai InternationalAirport (NMIA) was surveyed. It includes mangroves andbackwaters near villages such as Kombadbhuja, Ulve, Dungi,Pargaon, Chinchpada and Kolhi Kopar, as well as creeks ofKharghar, Gadhi, Ulve, Kalamboli and Panvel. Data wascollected from wetlands, creeks, paddy fields, mangroves,mudflats,
The areas were surveyed using binoculars and digitalcamera for proper bird records during 2015-2016. Directobservations were made by walking along roads, wetlands,mangroves. Identification of birds has been carried out byusing binocular and telescope. Some species of birds havealso been shot. The birds were identified according Evans(1994), Harris et.al. (1991) and Hudec (1990). The study onbird’s habitats number was carried out by regular visit in themorning between 6.30 to 9.30 a.m. Birds were also identifiedfollowing Ali & Ripley (1983), Grimmett et.al (2000) andRasmussen & Anderton (2005).
Results and discussion:
A total of 23 bird species was recorded during theabove mentioned survey. Out of them 14 were resident and
9 were migratory (Table1.1). Three species were found underthreatened category, Painted stork, Black tailed godwit, Blackheaded Ibis (Table 1.2) .Because of the great variety ofwetlands, bird adaptation and use of wetland environmentsdiffers greatly from species to species. Birds’ use wetlandsduring breeding cycles. Some birds depend on wetlandsalmost totally for breeding, nesting, feeding, or shelter duringtheir breeding cycles. Birds that need functional access to awetland or wetland products during their life cycle, especiallyduring the breeding season, can be called “wetlanddependent”. Other birds use wetlands only for some of theirneeds, or they might use both wetland and upland habitats.Many bird species use forested wetlands as well as foresteduplands, feeding on the abundant insects associated withtrees. These birds are not dependent on wetlands becausethey use both habitats equally well. Some birds, such aswood ducks, are found primarily in forested wetlands andare dependent on this wetland type. Many migratory birdsare wetland dependent, using wetlands during their migrationand breeding seasons. Migratory birds may spend the winterin wetlands in the Southern United States, or farther south.Throughout winter, these birds use southern wetlands forfood and nutrients to sustain them for their return trip northand the breeding season. Following birds found on wetlandof Panvel and nearby area. The loss of ecosystem servicesof wetlands can have both economic and environmentalconsequences. Multiple authors acknowledge, vast varietyof literature has been published. Attempting to give wetlandsan economic value (Mitsch and Gosselink 2000, Ben Dor et.al 2008). In India, wetland ecosystems support diverse andunique habitats and are distributed across varioustopographic and climatic regimes. They are considered tobe a vital part of hydrological cycle and are highly productivesystems in their natural forms. Wetlands not only supportlarge biological diversity but also provide a wide array ofecosystem goods and services (Wetlands Rules, 2010). Theloss and degradation of habitat is the greatest threat to thelong term survival of water birds. Irreversible loss of wetlandcontinues at an alarming rate (Finlayson and Rea, 1999). Anoverall loss of biodiversity with decline in productivityadversely affecting the livelihood of the community. Thepreservation of wetlands is crucial for the survival of bothresident and migratory birds because they provide the birdswith specialized microhabitats and different kinds of foodsources. Loss of wetlands and introduction of new agechemicals in agriculture is threatening the life supportsystem because of large scale habitat destruction. (Kupekaret al., 2014).

112
International Conference on Ecosystem Services of Wetlands - ‘Ardrabhumi :2016’ISBN : 978-81-923628-3-0
LIST OF BIRDS FOUND ON WETLAND OF PANVEL AND NEAR BY AREA
(Table 1.1)
Sr. NO COMMON NAME SCIENTIFIC NAME STATUS R/M SITES
1 Great Cormorant Phalacrocorax carbo LC R All wetland area
2 Eastern Cattle Egret Babulcus coromandus LC R All wetland area
3 Grey Heron Ardea cinerea LC R All weland area
4 Spot-billed Duck Anas poecilorhyncha LC R All wetland area
5 Northern Shoveler Anas clypeata LC M Kharghar creeks
6 Black-shouldered Kite Elanus caeruleus LC R All wetland area
7 Western Marsh Harrier Circus aeruginosus LC M All wetland area
8 Red-wattled Lapwing Vanellus indicus LC R All wetland area
9 Little-ringed Plover Charadrius dubius LC R All wetland area
10 Common Sedshank Tringa tetanus LC M All wetland area
11 Wood Sandpiper Tringa glareola LC M All wetland area
12 Common Sandpiper Tringa hypoleucos LC R All wetland area
13 Marsh Sandpiper Tringa stagnatilis LC M All wetland area
14 Black-winged Stilt Himantopus himantopus LC R All wetland area
15 Gull-billed Tern Gelochelidon nilotica LC M All wetland area
16 Brown- headed Gull Larus brunnicephalus LC M All wetland area
17 Black- headed Gull Larus ridibundus LC M All wetland area
18 White-breasted Kingfisher Halcyon smyrnensis LC R All wetland area
19 Common Kingfisher Alcedo atthis LC R All wetland area
20 Greater Flamingo Phoenicoptonus major LC M All wetland area
LIST OF THREATENED SPIECES (Table 1.2)
Sr.No COMMON NAME SCIENTIFIC NAME STATUS R/M SITES
1 Painted Stork Mycteria leucocephala NT R Pargaon,
Kombadbhuje
2 Black-headed Ibis Threskiornis melanocephalus NT R All wetland area
3 Black-tailed godwit Limosa limosa NT R Kharghar creeks
Painted stork Black-headed Ibis

113
International Conference on Ecosystem Services of Wetlands - ‘Ardrabhumi :2016’ISBN : 978-81-923628-3-0
Black-tailed godwit
Conclusions:
Efforts to reduce bird strikes will require effective habitatmanagement on the airport property, with a goal of reducingnumbers of small land birds. Thoughtful and effectivemanagement can minimize bird use of the artificial wetlands bymaking them less appealing to birds, thus displacing birds tomore attractive habitats further from the airport. It is concludedthat the creation of artificial wetlands increased the potentialfor bird. The present data would be useful to know the statusof birds in and around the NMIA area.
Acknowledgments:
I am extremely thankful to Dr. Arun Andhale, Principal,Mahatma Phule Arts, Science & Commerce College, Panvelwho allowed and encourage me to do this work. I sincerelythanks Mr. S. M. Udawant, Head, Department of Zoologyand all respected colleagues of Department of Zoology, Mr.S.S. Avachite, Librarian and other staff of Mahatma PhuleArts, Science and Commerce College, Panvel for their supportduring the work.
References:
Ali, S. and Ripley, D.S. (1983), Handbook of the Birds ofIndia and Pakistan. Oxford University Press. Oxford, 737.
BenDor, Todd, Nicholas Brozovic and Varkki GeorgePallathucheril. 2008. The Social Impacts of WetlandMitigation Policies in the United States.Journal of PlanningLiterature.22:341-357.
Chen Xi, Mark Bain, Patrick J. Sullivan and Ziyan WangWetland Loss and Research Orientation Challenges 2012,3, 43-48; doi:10.3390/challe3010043.
Finlayson, C.M. and Rea, N. 1999. Reasons for the loss anddegradation of Australian wetlands. Wetlands Ecology andManagement. 7: 1-11.
Ghermandi et al., 2010 A. Ghermandi, J.C.J.M. van den Bergh,L.M. Brander, H.L.F. de Groot, P.A.L.D. Nunes Values ofnatural and human-made wetlands: a meta-analysis WaterResour. Res., 46 (12) (2010), pp. 1–12.
Harris, H. Shirihai and D. Christie, The Macmillan birders guideto European and Middle Eastern birds. Macmillan, 1991.
K. Hudec, A guide to birds. Treasuer, 1990.
Mitsch, W. 2010. Conservation, creation, and restoration ofwetlands: A global perspective. P. 175-189 in EcologicalRestoration: A Global Challenge, Comin, F.A. (ed.).Cambridge University Press, Cambridge UK.
Mitsch, William J. and James G. Gosselink. 2000. The valueof wetlands: importance of scale and landscapesetting.Ecological Economics. 35(200): 25-33.
Nitin Bassi, M. Dinesh Kumar, Anuradha Sharma , P. Pardha-Saradhi, November 2014 Status of wetlands in India: A reviewof extent, ecosystem benefits, threats and managementstrategies Journal of Hydrology: Regional Studies Volume2, , Pages 1–19.
P. ten Brink, T. Badura, A. Farmer, D. Russi 2012.TheEconomics of Ecosystem and Biodiversity for Water andWetlands: A Briefing Note Institute for EuropeanEnvironmental Policy, London (2012).
S.N. Prasad, T.V. Ramachandra, N. Ahalya, T. Sengupta, A.Kumar, A.K. Tiwari, V.S. Vijayan, L. Vijayan Conservation ofwetlands of India – a review Trop. Ecol., 43 (1) (2002), pp.173–186.
SAC, 2011 Space Applications Centre (SAC) NationalWetland Atlas SAC, Indian Space Research Organisation,Ahmedabad (2011).
Sandhya kupekar, V.Y.Mangale, R.K.patil.,2014: “Aquaticand semi aquatic birds, threats and conservation of birdfauna of Ballaleshwar lake, Panvel. Dist. Raigad(Maharashtra)” IOSR Journal of Environmental Science,Toxicology and Food Technology, Vol. 9(11), E-ISSN:2319-2402, p-ISSN 2319-2399, pp 29-36.
R.K. Turner, J.C.J.M. Bergh, T. Soderquist, A. Barendregt, J.V. D. Straaten, E. Maltby and E.C.V. Ierland (2000). Ecological-Economic analysis of wetlands : Scientific integration formanagement and policy. Ecological-Economics. 35: 7-23.
Wetlands, 2010 Wetlands (Conservation and Management)Rules Ministry of Environment and Forests, Government ofIndia, New Delhi (2010).

114
International Conference on Ecosystem Services of Wetlands - ‘Ardrabhumi :2016’ISBN : 978-81-923628-3-0
Chronospatial Frequency Of Fishing Gears Used AlongThe Ulhas River Estuary
1Sudesh D. Rathod and 2Nandini N. Patil1&2Department of Zoology B. N. Bandodkar College of Science, Thane.
Abstract: Different kinds of fishing gears used along the Ulhas River estuary (URE) were studied for their make and methodsof operation. Most of the gears were designed indigenously to suit the availability of the amenable fishery species. The overallchronospatial pattern of frequency of gears operation was obtained using PRIMER v6 software. The use of gears was mostfrequent and diverse towards the lower reaches of the estuary. Late post-monsoon season was the most affluent in gearfrequency. The important fishing methods used along the URE was ‘vana’ (barrier net), ‘busa’ (surface gill-net), ‘dol’ (stationarybag net) and ‘malli’ (basin method for capturing mudskippers on mud-flats). The fishing was carried for subsistence orartisanal levels at major while commercial fishing was highly reduced in URE. The reduced mesh sizes of the ambient gearsportray the size of the species sought which depicted the threatening status of overall condition of fisheries in URE andrequires a special attention for its rejuvenation.
Keywords: Ulhas River estuary, fishing gears, subsistence, artisanal, fisheries, stationary bag nets, barrier nets, hand nets,traps, designs, fishery status, chronospatial, gear frequency, zonal, seasonal
Introduction:
The marine and inward waterresources support the lively hood of thecoastal people. Apart from the variousresources the fisheries play important rolein the economy of the coastal humanhabitations along the wetlands like creeksand estuaries. The estuarine part of UlhasRiver commences from S-E near Dombivliregion up streams; meanders for about 40km before it joins the Arabian Sea towardsN-W at Vasai (Bassein) creek and issituated between the latitude 18° 45’to19°19’, N and longitude 73°21’to72° 45’, E onthe world map and located near ThaneCity, Maharashtra State, India.
Ulhas River estuary (URE) is the important wetlandimparting the pivotal role in sustaining the local fishermenpopulation from decades. Chunk of the fishermen populationof Thane City along the URE is dependent on the fisheries.As regards to this various types of traditional gears areused for capturing variety of important fin fisheries andshell fisheries along the URE since decades and yet havenot been recorded earlier. In recent years due to the elevatedincidences of various anthropogenic deteriorative activitiesthe fisheries from URE have declined to the alarming level.Mangroves annihilation, domestic and increment inindustrial waste water, reclamation activities, solid wastedumping are of common site along the ambient water body.Therefore, most of the fishermen have abandoned thefisheries and have switched on to the alternative sources ofincome. The fishermen who have continued fishing are
Fig. 1: Map of Ulhas River estuary indicating the three zones from Dombivli to Ghodbunder Road. Zone-I extended from Dombivli to Kasheli Bridge; Zone-II from Kasheli bridge to Gaimukh and Zone-
III from Gaimukh to Mira-Bhayandar. Zone-I was highly influenced by human habitations and agriculture, zone-II was impacted mostly due to industrial effluents and agriculture while zone-III being very wide and close to ocean was efficiently flushed with tidal currents and except the human habitation,
at Mira-Bhayandar and some salt pans in the vicinity, it was not subjected to significant stresses.
presently striving hard to procure catch at economic levelbut in vain. Accordingly the native fishing gears have beenmodified by the fishermen community to match thetemperament of the available fisheries species in the ambientwater bodies. The design of the gears of URE deviated greatlyfrom those used along other regions of the India (Naik andNeelakantan, 1968; Kurian and Sebastian, 1976; Chakravarttyand Sharma (2013); Islam et al,. 2013; Chourey et al., 2014;Pijush, 2014).
Methodology:
The entire stretch of URE was divided for three zonesas UZ-I, UZ-II and UZ-III as shown in the map (Fig.1). Thezonal use of gears of along the estuary were observed, theiroperational methods and fishery species caught throughthem were recorded, on sites. The details of the materials

115
International Conference on Ecosystem Services of Wetlands - ‘Ardrabhumi :2016’ISBN : 978-81-923628-3-0
used in making and design of gears were studied on sites orat the fishermen localities. The study was carried for twoyears from July 2004 to June 2006. Each year was dividedinto four seasons viz. MON (monsoon from July toSeptember), EPM (early post-monsoon from October toDecember), LPM (late post-monsoon from January to March)and PRM (pre-monsoon from April to June) in present study(Fig.1).
Results and Discussion:
There were total 19 types of gears; hand gleaning andother methods in use for fishing purpose along entire stretchof URE. They are classified as stationary bag nets, barriernets, gill nets, hand operated nets and basin method forcapturing mudskippers. Three types each of stationary bagnets and barrier nets; two types of gill nets; various othermethods; their local names, the material used for theirconstruction and their operation was recorded (Table 1 and
Fig. 2). All the nets were constructed using single sheetbend except gill net. Hand gleaning and ‘malli’ was practicedduring low tide only.
It is well known from the past study that the lunarperiodicity impact greatly on fishing (Desai, 1974; Ortega-Garcia, et al., 2008; Limbini and Khan, 2012; Sajeevan andSanadi, 2014; Das et al., 2015). Therefore, present scenarioof gear operations was based on lunar periodicity along theURE. Fishermen avoid fishing from 4th to 5th day of full moonand new moon days which they traditionally call as ‘bhang’as catch is insignificant during these days. Some may go forfishing from 5th day (‘Panchami’) onwards till 10th day(‘Dashami’). Fishermen call the period up to ‘Dashami’ as‘Udhan’. From 11th to 15th day is considered to be best forfishing since most fishery species appear only in this periodin estuaries and creeks.
1. ‘Dol’ and ‘Patal’ (major stationary bag nets):
Dol and Patal are conical stationary bag nets, anteriorlyopening with wide mouth and posteriorly by narrowcod end, measuring about 30 m in length, 30 m in widthand 5 m in height. Both are made from syntheticsecondary twines. Entire Dol net is mostly constructedthrough hand braiding with the mesh size decrementantero-posteriorly (maximum 120 mm to minimum 10mm). Cod end has a finest mesh size (10 mm). Usuallynet is made of five circular parts antero-posteriorly as‘Mhor’; ‘Chirata’; ’Katra’; ‘Majola’ and ‘Khola’ eachbeing broader anteriorly and narrower posteriorly tomake a conical shape of the net. Whereas, Patal is madefrom machine made panels available in the local marketswith a little variations in the mesh size (50 mm to 10 mm)from mouth towards cod end.
Operation: Dol and Patal nets are set in deep water to
about 20 m in depth of the URE towards UZ-II and UZ-III against tidal current of flood tide and ebb tide. Twobig heaps of stones each tied together in a net panelare used as master sinkers and attached to the lowercorners of net with warps. Remaining two corners ofthe net are tied to the master floats (a cluster of bigpieces polystyrene tied together in a small panel offishing net) which support the upper part of mouth ofthe net. The master floats also help to mark the net’slocation. Third master float is tied to the middle partwhich helps in keeping net horizontal whereas fourthfloat is tied to the cod end. The tidal current brings fishwhich get filtered in the net. Fishes are hauled whentide turns. Small dug-out canoe, ‘hodi’ is used to operatethe net and hauling the fish. Nets are used to capturenumber of marine and estuarine species viz. catfishes,sciaenids, clupeids, ribbon fish, target fishes,Oreochromis mossambicus, mullets, prawns, perches,ponyfishes, trevallies, snappers etc.
Table 1 The classification of the gears on the basis of their designs used along the URE
Sr. No. General Category of the Gear Local Name of the Gear Material used for construction
1 Stationary bag net Dol, Patal and Bokshi Synthetic, coir and/or cotton2 Gill net Busa, Pera Synthetic3 Barrier net Vana, Pocha and Bund-net Synthetic3 Hand net Bari, Paag, Zolva, Aasoo, Zile, Synthetic, jute, coir and/or cotton
Korbara, Pagoli (Fug), Gamchaand Gal
4 Hand gleaning Used for capturing bivalves, ——————-mudskippers and crabs. Night-handgleaning is associated with a lightsource to attract fish.
5 ‘Malli’ method Basin method of mudskippers Earthen pot or utensil(mudskipper trap) trapping and colorful cloth flags

116
International Conference on Ecosystem Services of Wetlands - ‘Ardrabhumi :2016’ISBN : 978-81-923628-3-0
2. ‘Bokshi’ (minor stationary bag net):
Bokshi is a small net measuring 10 m in length and 1.5m in height and width. The mesh size ranges from 20mm to 5 mm antero-posteriorly in hand made versionwhich is of rare site present days. The net is made fromreadymade netting panels available in the market withthe uniform mesh size of 5 mm. mouth opens to about1.5m wide and is guarded by two lateral wings flankingon either side. The wings are used to block the passageof fish from the sides when low tide commences.
Operation: The net is set in shallow inundated inwardareas of narrow channels. The water is allowed to
inundate during flood tide and net is set during ebbtide with the help of stakes on the bottom. The mouthand wings are supported by number of stakesdependent on the width of the channel. The water isfiltered while receding and the fishes are collected inthe net and they are hauled from cod-end opening.Wide wings secure the escape of the fishes from thenet. Various fishery species such as gobioids, prawns,mullets, catfishes, Scatophagus argus, Terapon spp.are caught in “bokshi’ net. ‘Bokshi’ nets werefrequently used in UZ-II during MON season forprawn fishing. Batteries of ‘Bokshi’ nets were arrangedwith the help of stakes inside the channel of URE atUZ-II during monsoon.
Fig. 2: The Types of Fishing Gears Used Along Ulhas River Estuary
1. Gamcha: Hand operated for capturing mysids
3. Bokshi net: Inward water net
5. Dol/ Patal net: Stationary bag nets
2. Busa: Surface gill net
4. Pagoli or Fug net: Hoop-net
6. Korbara: Catch collection net
7. Mudskipper fishing by 'malli' method on the URE mudflats 8. Hand gleaning for Mudskippers

117
International Conference on Ecosystem Services of Wetlands - ‘Ardrabhumi :2016’ISBN : 978-81-923628-3-0
9. Paag: Cast net operated in inundated waters
11. Vana: Barrier net set along the bank
13. Pocha: Inward water barrier net and 'jali' held by the fisherman
10. Zolva: The cradle net
12. Hand gleaning for bivalves
14. Aasoo: Shovel net
3. Gill nets:
Two types of gill nets were used viz. ‘Busa’ or ‘Discojali’ for surface fishing and ‘Pera’ for bottom fishing.While ‘Pera’ being rarely used the ‘Busa’ was verycommon for its handy operation. The dimension was30 to 50 m in length and 2 m in height with meshsizes ranging from 100 mm to 20 mm. The nets madeof light green colored mono-filament of syntheticmaterial were constructed using double sheet bends.‘Busa’ was common along the entire stretch of theURE.
Operation: ‘Pera’ were operated along the banks.The head rope was attached with weaker floats andthe foot rope with stronger sinkers enabling the netto stands upright on the bottom. Whilst ‘Busa’ wasattached with stronger floats and weaker sinkers onhead rope and foot rope respectively to enable netto remain near the surface. ‘Busa’ were tied to thestern-spar of small boats like hodis or dug-outcanoes and allowed to drift along the tidal currents.The ‘Pera’ were used to capture the bottom dwellerslike catfishes and gobioids whereas ‘Busa’ were usedfor capturing Oreochromis mossambicus, mullets,sciaenids, clupeids and prawns.
4. Barrier nets:
Three types of barrier nets were commonly usedalong URE called as ‘Vana’, ‘Pocha’ and ‘Bund’ nets.
‘Vana’ was very common and was biggest gear in usealong URE. Eentire net was made from synthetic twine ofsecond stage. Vana measured nearly 200 to 500 m longand 2 m. in height with mesh size of 20 mm. The height ofnet may vary dependent upon the depth of water, duringhigh tide, at the location of its operation. ‘Vana’ was veryfrequently used along URE. It was designed for capturingM. gulio a target fish species as they habitually move atthe bays in schools for feeding purpose. But duringpresent study other species were also caught in ‘Vana’.
Operation of ‘vana’: The net is kept pleated on one of thebank of the estuary during low tide which later at the fullhigh tide level is tied on the bamboo stakes to keep itupright. As the water recedes during the low tide the fishesget filtered and retained by the net, which are thencollected manually. ‘Vana’ was used to capture mullets inURE but variety of fishery species are captured with thehelp of this net.
‘Pocha’ was used in narrow inward channels for capturinggiant fresh water prawns locally known as pocha, hencethe name. ‘Pocha’ wall net set in the narrow channels withthe help of two lateral poles. The length of the net dependsup on the width of the channel and height measures toabout 2 m. the mesh size is 20 to 50 mm. net is eitherbraided or machine made synthetic nettings are used toconstruct the ‘Pocha’.
Operation of ‘pocha’: It is operated from small canoe madeof fibre-plastic called hodi. The net is placed during ebb

118
International Conference on Ecosystem Services of Wetlands - ‘Ardrabhumi :2016’ISBN : 978-81-923628-3-0
tide when water starts receding from the upstreamschannels of the URE. Along with the giant fresh waterprawns various species are caught in the ‘pocha’ viz.mullets, Terapon spp. Scatophagus argus, gobioids,Sillago spp. Oreochromis mossambicus, Latescalcarifer, Mystus gulio etc.
Sometimes small piece of rectangular panels of the netis used as a barrier for the fishes entered in the artificialimpoundments called as ‘bund’ net. Its size is definedby the opening of the impoundment and the mesh sizeranges from 10 to 30 mm., it is made from the readymadenettings made of synthetic fibres. Bund-net is used atimpoundments where fish coming along tidal watersare trapped and are raised for improving their size andtaste. These nets avoid fish escape from ponds wherethey are reared. Bund-nets allow tidal water, so that itbrings food and oxygenated water while inundatingfrom URE and carry away the waste and depleted waterback with receding current. Species like Mystus gulio,Mugil spp., L. calcarifer and tiger prawns are trappedwhich are sought for rearing in such impoundments.Most of the catches are consumed by pond ownerwhich is referred as ‘subsistence’ type of fishery.
5. Hand nets:
There were numerous hand operated nets or traps usedalong the URE e.g. drag net, ‘Yeri’ khecha’; cast net,‘paag’; water wading traps, cradle net, ‘zolva’; shovelnet, ‘Aasoo’; mysids net, ‘Zile’, hoop net, ‘Pagoli’ orfug net; a simple hand line, ‘Gal’; a cloth net, ‘Gamcha’;scoop net, ‘Jali’ and fish collection net, ‘Korbara’. Allare operated in shallow inundated waters. Yeri and Paagnets are made from cotton twine or synthetic fibres.
Yeri is a small rectangular net panel measuring 5 to 7 min length and 1.5 m in height and has mesh size of 10mm. A 2 m long bamboo pole is tied at each flank of thenet by hitching method. The flank-bamboos are heldby two fishermen (one on each side) to dragged thenet in chest deep water during high tide. Mostly mulletsand seldom Megalops cyprinoides, Oreochromismossambicus, Lates calcarifer and Terapon spp. arecaptured.
Paag is a handmade circular cast net made from cottontwines or synthetic fibres with mesh size of 10 mm.Similar net was reported by various experts from allover the India (Kumar and Kumar, 2013; Chourey et al.,2014; Laxmappa and Bakshi, 2014). This is a circularnet tide with a hand line (casting cord) in the center.The peripheral margin is attached with a series of leadsinkers to enhance the sinking speed and ultimatelyclosing of net due to inertia. Being small in diameterthe net lacks with brace lines and hence no peripheralpockets are formed unlike those were found along KulsiRiver Assam (Islam, et al., 2013). The cast net without
pockets was also reported by Naik and Neelakantan(1988). It is operated in shallow water from hodi (canoe)or from the banks. This net is thrown with a skill fullyank so as to spread it before it falls on the water surface.Then it is allowed to sink to certain level and is closedwith a small tug before it reaches the bottom. The net isthen hauled slowly and fishes are secured.
Zolva is a rectangular piece of netting made from synthetictwine of 10 to 20 mm mesh size (mostly hand braided) andsupported by two lateral slender bamboo poles which aretied to the net by hitching. It is operated in knee highwater to capture octopus, crabs, cuttlefish, catfish,Oreochromis mossambicus etc. mostly during MON.
Aasoo is a pear shaped shovel net made of 15 to 20 mmmesh size netting constructed from synthetic fibresand is supported laterally by two slender bamboo polesand anteriorly by a steel bar which is bent in a ‘C’shaped form. Bamboo poles are crossed at posteriorend at an angle of about 50 to 60 degrees and tiedtogether with the synthetic rope. A conical net panel isreeved by a thick synthetic rope at the edges before itis hitched at regular interval on the triangular frame tomake a pear-shaped concave form. The tapering end ofthe netting remains hanging towards the posteriorwhere it is hinged to the crossing of the poles with asynthetic rope. One of the lateral bamboos is kept longerto be used as a handle while operation. The horizontalsteel bar enables the fishermen to thrust the net intomud to capture bottom fishes like mullets, gobioidsand crabs. The depth of the net ensures the fish afterbeing scooped out from the mud also the mud is washedoff by swinging the net in water before the fish ishauled in a tiny split bamboo basket.
Pagoli is a hoop net used to capture crabs in shallowwater. It is operated from the temporary personal buoymade of vehicular rubber tube. The air filled tube isweaved with nylon rope to construct the seat in thecentre for a fisherman who sits on it keeping legshanging in the water while fishing. The trap hassynthetic netting of mesh size 70 mm, supported byiron ring of 30 to 40 cm diameter. There is a horizontalrope tied on ring along diameter where bait is attached.Polychaete worms, trash fish or dough are used asbait. The trap is lowered in water from banks or fromrubber tube buoy and lifted, suddenly, after aconsiderable time, to haul the crabs (Neptunus spp.).
Zile is fine meshed (10-50 mm) circular hand net usedto capture mud-crabs during winter season. It issupported by a circular frame made of plastic pipe of adiameter of about 65 to 75 cm holding a conical net of100 cm depth. The net is operated just like ‘Pagoli’ or‘Fug’ scoop nets for capturing mud crabs (Scyllaserrata). Similar gear was reported by Nirmale et al.

119
International Conference on Ecosystem Services of Wetlands - ‘Ardrabhumi :2016’ISBN : 978-81-923628-3-0
(2012) along the Ratnagiri Coast.
Gal a simple hand lines is used for capturing catfishesduring MON. It is very crude type of gear, in which theline (synthetic monofilament twine) may or may not betied with a bamboo pole. A hook is tied at the terminalend of about 5 m long twine which is supported by asmall horizontal stick at a distance of 50 to 100 cm. Thisstick works as a float and as indicator when fish getshooked. The assembly is locally known as ‘Gal’.Polychaete worms and trash fishes are used as bait. Theline is lifted with a jerk when the float stick starts bumpingon water surface and fish is removed from the hook.
Gamcha is small piece of cloth with fine knit cottonfibres measuring about 2 m. in length and 1 m. in breadth.Traditionally ‘Gamcha’ is commonly found with menand used variously at personal level like a hand-napkinfor cleaning; wiping etc. it is also used to trap very tinyorganisms like Acetes indicus (mysids) or Indomysisannandalei which are highly relished by local fishermencommunity locally known as ‘Jawala and ‘Refa’/‘Kolin’respectively. It is operated in the inundated shallowwaters downstream of URE during MON , EPM andLPM seasons. ‘Gamcha’ is held under water surface bytwo or more persons and water is allowed to flow aboveit. After finding ample swarm of tiny organisms above‘gamcha’ it is slowly lifted and allowed to filter waterthrough the mesh. The catch is scooped with handconveniently and collected in the container.
Jali and Korbara are fish collecting hand-nets. Jali issupported by triangular frame made of two cross sticks.One of the stick is longer to function as handle. Thenet is supported at anterior end with a rope reevingthrough the net edge anteriorly. The net is commonlyused in giant fresh water prawn fishing with the help ofpocha. Also is used to scoop the fish out from biggernets. The fishes are hauled in conical net called Korbarawhich is used for cleaning, sorting and carrying thefish to the landing spot.
6. Hand Gleaning:
There were frequent instances of hand picking methodused to catch fishes or shellfish. Mudskippers, bivalves(clams, cockles, mussels & edible oysters) or crabs(Scylla serrata) are captured with bare hand in shallow(knee high) water or on the exposed mudflats duringlow tides. Scylla serrata are captured during night usinglamp or torch. Crabs get attracted towards light and falleasy catch. This phenomenon may be referred as ‘lightfishing’. For capturing mudskipper, fishermen walk onmudflats where the fresh burrows are seen. Hands arethen forced into mud around the burrow in a ‘polar-bear’style to about two feet deep. A lump of mud is separatedfrom the rest with a jerk along with fish, perhaps entangled,which is then slowly isolated using fingers and dropped
in the split-bamboo basket. In bivalves gleaning a woodenplank curved from bottom is used for sliding on sinkingmudflats. Fisherman kneels on the plank with one leg andanother leg is used to push the plank ahead by thrusting.The fresh burrows of clams and cockles are observed tocapture bivalves like Meretrix spp., Catelysia spp.,Anadara granosa, Cardium asiaticum, Paphiamalabarica, Crassostrea spp. captured from exposedbottoms of ambient water body.
7. ‘Malli’ –the mudskipper trapping method:
Mâlli—Mudskipper trap Fug-crab trap wereoverwhelming in URE. The mudskipper fishing is carriedout mostly setting a trap on the mudflats involved‘basin-method’, locally known as ‘Mâlli’ (Rathod,2005). The mudskipper fishing occurred only onnorthern bank of URE since there was considerabledeterioration occurred due to the human intrusion onthe southern bank. ‘Mâlli’, the technique, is based onsuffocation of the fish by plastering mud on theburrow’s openings. A rectangular or triangularembankment is constructed out of mixture of mud andpiles of rice straws on the mudflat during low tide. Aslope is maintained towards one of the corners, wherean earthen or metal container is buried in the soil,keeping its mouth (brim) open at ground level called as‘ ‘Hundi’. Due to suffocation the mudskippers emergeon the surface are scared with colourful cloths to drivethem in the ‘hundi’. Fish is hauled after a considerablenumber of individuals are trapped in ‘hundi.
8. Chronospatial frequency of gears use along URE:
PCO was run after obtaining resemblance of samples inEuclidean distance matrix to depict the spatio-temporalrelationship of the frequency of fishing gears used alongthe URE. Data represented 87.2% of variations in gearfrequency. Abbreviations: Van = vana; Dol = ‘dol’ or ‘patal’net; Bo = bokshi; Bar = ‘bari’ net; GN = Gill nets ‘busa’ or‘pera’; MT = mudskippers trapping; HOG = hand operatedgears; Po = ‘pocha’; HP = hand picking and HL = hand line.

120
International Conference on Ecosystem Services of Wetlands - ‘Ardrabhumi :2016’ISBN : 978-81-923628-3-0
Frequency of operation of various gears was prevalenttowards the mouth of the URE. Most frequent gears usedwere vana (Van), dol & patal (Dol), bokshi (Bo), gill nets(GN), mudskipper trapping (MT) and hand operated gears(HOG). However, pocha (Po), bari (Bar), hand picking (HP)and hand line (HL) operations were insignificant amongstthe others. Dol (Dol), bokshi (Bo), gill nets (GN) andmudskipper fishing (MT) were very frequent in URE. UZ-IIIwas richest while UZ-I was poorest in gears frequency ofoperation. According to earlier study it was observed thatgears frequency increases with the available fisheries (Islamet al., 2013). Dol operation was most frequent in UZ-III.Although MON season had lucrative catches the heavyraining and flooding obliterated the frequency of gearoperations except in UZ-II where the prawn fishing wasoverwhelming with help of ‘Bokshi’ net. Fishing activitywas prominent in UZ-I, UZ-II during both MON and LPMindicating these as major fishing seasons whereas in UZ-III, LPM being very frequent followed by PRM and EPM(Fig. 3). Overall frequency of gears operation was lowest inMON (except bokshi) and highest in LPM in ambientwaterbody.
Conclusion:
Total 19 kinds of fish procuring methods were usedalong URE mostly of non-selective type and were impliedfor subsistence or artisanal fisheries particularly in upperzones of the estuary. Most prosperous zone and seasonswere UZ-III and LPM respectively. Most important gears inURE were dol, gill net, vana, mudskipper trapping, bokshiand hand operated gears. Dol and Patal were not used inUZ-I. Gill nets, ‘bari’ and hand operated gears were randomlyused along entire stretch of the URE. ‘Bokshi’ was commonin MON season for prawn fishing. In UZ-III limitedcommercial fishing occurred with the help of dol, vana andgill nets. The gears were indigenously designed and werehaving finer mesh size to suit the sizes of the amenablespecies. It has been also found that these gears are still inuse along the URE. The reduced mesh sizes of the gears toensure better catch have consequently enhanced theoverfishing in URE. This indicated that fisheries of UREhave declined to non-commercial level.
References:
Chakravartty P. and S. Sharma, (2013). Different types offishing gears used by the fishermen in Nalbari district ofAssam. International Journal of Social Science &Interdisciplinary Research, ISSN 2277 3630ijssir, 2 (3): 177-191. Online available at indianresearchjournals.com
Chourey, P., D. Meena, A. Varma and G. Saxena, (2014).Study on Fishing Craft and Gears of Bhopal District, MadhyaPradesh, India. International Journal of Theoretical &Applied Sciences, 6(2): 65-67. ISSN No. (Print): 0975-1718;ISSN No. (Online): 2249-3247.
Das, D., S. Pal, U. Bhaumik, T. Paria, D. Mazumdar, S. Pal,(2015). The optimum fishing day is based on moon.International Journal of Fisheries and Aquatic Studies. 2(4):304-309.
Desai, S. S. (1974). Influence of lunar periodicity on behaviourof fishes. CIFE, SOUVENIR, Annual Day 1974, 20-23.
Islam, M.R., B. Das, D. Baruah,, S.P. Biswas and A. Gupta(2013). Fish Diversity and Fishing Gears used in the KulsiRiver of Assam, India. Annals of Biological Research, 4(1):289-293.
Kumar V. and K. Kumar, (2013). A Preliminary Study on FishingCraft and Gears in Dhaura Reservoir, Uttarakhand, India.Int. Res. J. Biological Sci., 2(8): 76-78. ISSN 2278-3202.
Kurian C. V. and V. O. Sebastian 1976. Prawns and prawnfisheries of India. Hindustan Publishing Corporation (India).
Laxmappa, B., and R. R. Bakshi, (2014). Types of fishinggears operating and their impact on Krishna river fishery inMahabubnagar district, T.S. India. International Journalof Fisheries and Aquatic Studies, 2(1): 30-41.
Libini, C. L., and S. A. Khan (2012). Influence of lunar phaseson fish landings by gillnetters and trawlers. Indian J. Fish.,59(2): 81-87.
Naik, U. G. And B. Neelakantan (1968) Gears and Craft ofKarwar –An Overview. Journal of The Indian FisheriesAssociation, 18: 245-252.
Nirmale, V. H., S. S. Ganagan, B.Yadav, P. Durgale and K. M.Shinde, (2012). Traditional Knowledge on Mud Crab,Ethnoecology of Scylla serrata in Ratnagiri Coast,Maharashtra. Ind. J. of Traditional Knowledge, 11(2): 317-322.
Ortega-Garcia, S. Ponce-Diaz, R. O’Hara and J. Merila, (2008).The relative importance of lunar phase and environmentalconditions on striped marlin (Tetrapturus audax) catchesin sport fishing. Fisheries Research 93: 190–194.
Pijush, P., M. Basudev and R. G. Chandra, (2014).Crafts andGears operated in brackish water fed canal for harvestingFishes in different Seasons to maintain livelihood of theFishermen communities. Int. Res. J. Biological Sci. 3(9): 8-13. ISSN 2278-3202.
Rathod, S.D. 2005. ‘Effect of pollution on mudskipper fisheryof Ulhas River Estuary with a special reference to the biologyof Boleopthalmus dussumieri (Cuv. & Val.)’, Minor researchproject, University of Mumbai.
Sajeevan M. K. and R.B. Sanad (2014). Evaluation of theeffect of lunar cycle and monsoon on catch of yellowfintuna Original Article. J. Mar. Biol. Ass. India, 56 (2): 62-66.doi:10.6024/jmbai.2014.56.2.01761-0.

121
International Conference on Ecosystem Services of Wetlands - ‘Ardrabhumi :2016’ISBN : 978-81-923628-3-0
Avian diversity along MulaMutha River, Pune, India
Surabhi V. WalavalkarAbasaheb Garware College, Karve road, Pune 411004
Abstract : Avian diversity was studied in four areas along Mula-Mutha River, Pune district, Maharashtra, India, in latemonsoon and winter season. Point count method was used to access the diversity. 46 avian species were observed atKhadakwasla and Kavdipat followed by 40 at Mula-Mutha bird Sanctuary, Yerawada and 31 at Mhatre Bridge. Previousstudies show decrease in bird diversity at 3 sites except Mhatre Bridge. This paper provides an overview of status of waterbirds and anthropogenic threats to them in study areas.
Key words- Diversity, Avifauna, Species, Anthropogenic threats.
Introduction- Water bodies are essential part ofenvironment. It fulfils the needs of each and every organismwhich is living inside it or which is dependent on it for foodand other factors. It helps in maintaining biodiversity offlora and fauna. Water bodies such as lakes, streams, rivers,estuaries, creeks are components of wetland.
Wetlands are “Areas of marsh, fen, peat land /water, whether natural / artificial, permanent / temporary,with water that is static / flowing, fresh, brackish / salt,including areas of marine water, the depth at low tide doesnot exceed six meters.”
Urban wetlands consist of rivers flowing throughurban areas, reservoirs, tanks, ponds, marshes and nalas.Wetlands and water birds have a very old relation.Waterbirds have attracted people due to their beauty, visibility,abundance and social behaviour. Also they are proven tobe indicator species for specific changes in water ecosystem.Pune city is blessed with many water bodies includingwetlands.
The sites at which study was conducted are 1) Mula-Mutha Bird sanctuary, Yerwada; 2) Kavdipat, 3) MhatreBridge and 4) Khadakwasla reservoir. Bird diversity changesfrom location to location mainly because of food availability.(Manchi, 2001) It also depends on type of habitat around.Anthropogenic threats also affect the bird diversity asobserved in this study. Bird diversity was studied in 2005-06 at Mula-Mutha bird sanctuary, Kavdipat andKhadakwasla. Now after 10 years the comparison can bedone and the pattern of change can be observed. Waterquality also plays an important role controlling the nutrientlevel of water which in turn affects the bird diversity.
Materials and Methods-
Study sites
Mula-Mutha bird sanctuary, Yerwada (18.5568° N,73.8865° E) was inaugurated by Dr. Salim Ali, a well knownornithologist in 1977. Now it has become a sandwichbetween garbage depot and crematorium. It is a highly
disturbed area with lot of human interventions.
Kavdi (18.4941°N, 73.9913°E) is a small village situatedabout 20 km away from Pune city. In Kavdi wetland area lot ofbirds are observed. There is a small bridge connecting twobanks of river. Fishing, grazing is observed regularly.
Mhatre Bridge (18.5045°N, 73.8366°E) is situated onMutha River in the heart of Pune city. Anthropogenic activitieslike Garbage dumping, grazing observed here. The river belowMhatre Bridge is partially covered by water hyacinth.
Khadakwasla reservoir (18.4469°E, 73.7816°N) issituated 10 km away from the city. It was built around 150years ago. It is observed that there is a seasonal variation inphysico-chemical properties of water (Kamble, 2008) whichmay affect bird diversity of this region.
Figure1. Map of Study sites
The study was carried out in 4 sites which are almostequidistant from each other namely MulaMutha birdsanctuary Yerwada, Kavdi pat, Mhatre bridge andKhadakwasla. Observations are made in late monsoon andwinter season from August 2015 to December 2015. Pointcount method was used for survey. It was done twice in amonth- Morning 7:00 am to 8:00 am and Evening 5:00 pm to6:00 pm. Birds were identified with the help of field guidenamed Birds of the Indian Subcontinent (Second edition)by Richard Grimmett, Carol Inskipp and Tim Inskipp and thechecklist was prepared. Anthropogenic threats wereprominent at all the 4 sites.

122
International Conference on Ecosystem Services of Wetlands - ‘Ardrabhumi :2016’ISBN : 978-81-923628-3-0
Occasionally locals were also interviewed to gatherinformation about activities being carried out at study site.
Result and Discussion-The total number of bird species andtotal number of individuals of each species was recorded.The maximum diversity of 43 bird species was recorded atKavdipat and Khadakwasla reservoir. It might be becauseof maximum food availability. 40 species of birds wereobserved at MulaMutha Bird Sanctuary, Yerwada and 31species at Mhatre Bridge. Decrease in number of bird speciesin month of August might be mainly due to rains. Maximumnumber of species was recorded during the winter monthscorresponding to the arrival of migratory birds.
Khadakwasla reservoir showed dominance of EurasianCoot for all the five months of observation. House Crowwas found in large numbers at MulaMutha bird sanctuary,Yerwada due to crematorium and garbage depot. Kavdipatarea was dominated by Glossy Ibis and Mhatre Bridge byBlack Kite.Anthropogenic threats like grazing, garbagedumping was observed at Mhatre Bridge and constructionwork at Khadakwasla.
Table 1 : No. of Species-
Study sites Kavdipat Mhatre Khadakwasla YerwadaBridge
August 12 8 9 12September 12 12 9 16October 18 13 12 17
November 19 15 15 22December 27 13 23 22
Table 2 : No. of Individuals-
Study sites Kavdipat Mhatre Khadakwasla YerwadaBridge
August 145 43 163 192September 202 61 278 204October 417 75 310 281
November 364 282 441 217December 247 205 505 147
0
5
10
15
20
25
30
35
Kavdi pat
Mhatre Bridge
Khadakwasla
Yerwada
Figure2. Monthly variations in the Total number ofspecies [On x-axis:Study duration (August 2015-December 2015), on y-axis: Number of species]
Figure3. Monthly variations in the Total number ofindividuals[On x-axis: Study duration (August 2015-December 2015), on y-axis: Number of individuals]
Table 3 : Checklist of birds-
Site 1 Kavdi pat
Sr.No. Species August September October November December1 Indian Peafowl 0 1 1 2 02 Rudy Shelduck 0 0 0 7 103 Indian Spot-billed Duck 43 16 52 31 204 Northern Shoveler 0 0 0 0 55 Northern Pintail 0 0 0 0 36 Garganey 0 0 0 0 17 Common Teal 0 0 0 12 88 Eurasian Coot 61 23 57 6 99 Painted Stork 7 2 2 0 010 Lesser Flamingo 1 0 0 0 011 Black-headed Ibis 0 0 10 23 1612 Little Grebe 0 0 0 0 9

123
International Conference on Ecosystem Services of Wetlands - ‘Ardrabhumi :2016’ISBN : 978-81-923628-3-0
13 Glossy Ibis 0 20 160 29 6814 Indian Pond Heron 2 0 5 3 215 Grey Heron 5 8 5 4 116 Purple Heron 3 0 2 4 217 Cattle Egret 0 5 0 0 018 Intermediate Egret 0 0 5 3 119 Little Egret 7 51 46 106 1220 Little Cormorant 2 2 20 86 4821 Black Kite 4 1 1 5 9122 Grey Headed Swamphen 0 3 4 3 623 White-throated Kingfisher 0 0 2 1 024 Black-winged Stilt 1 0 11 22 825 Red-wattled Lapwing 8 2 4 15 926 Common Snipe 0 0 0 0 127 Wood Sandpiper 0 0 0 0 128 Common Sandpiper 0 0 6 2 129 River Tern 5 64 25 4 130 Spotted Dove 0 1 0 0 031 Asian Palm Swift 0 0 35 15 732 Common Kingfisher 0 0 0 0 133 Long-tailed Shrike 0 0 1 2 334 Black Drongo 0 6 2 0 135 House Crow 10 2 11 15 2636 Wire-tailed Swallow 3 8 2 0 037 Ashy Prinia 2 0 4 3 138 Common Myna 2 3 0 0 039 White-browed Wagtail 0 6 0 3 240 Yellow Wagtail 0 0 0 0 141 Grey Wagtail 0 0 1 0 142 House Sparrow 0 2 0 0 043 Indian Robin 0 0 0 1 0
No. Of Species 17 20 26 26 33No. Of Individuals 166 226 474 407 376
Site 2 Mhatre Bridge
Sr.No. Species August September October November December1 Indian Spot-billed Duck 0 2 0 0 02 Painted Stork 0 2 1 1 03 Indian Pond Heron 7 7 8 35 154 Grey Heron 0 6 2 6 15 Little Egret 4 3 13 58 1026 Intermediate Egret 0 0 2 0 17 Cattle Egret 3 4 12 2 08 Little Cormorant 0 0 1 0 09 Black Kite 16 7 7 88 1110 White-breasted Waterhen 0 0 0 0 211 Black-winged Stilt 0 0 0 2 5012 Red-wattled Lapwing 7 2 2 7 813 Common Sandpiper 1 1 4 9 3
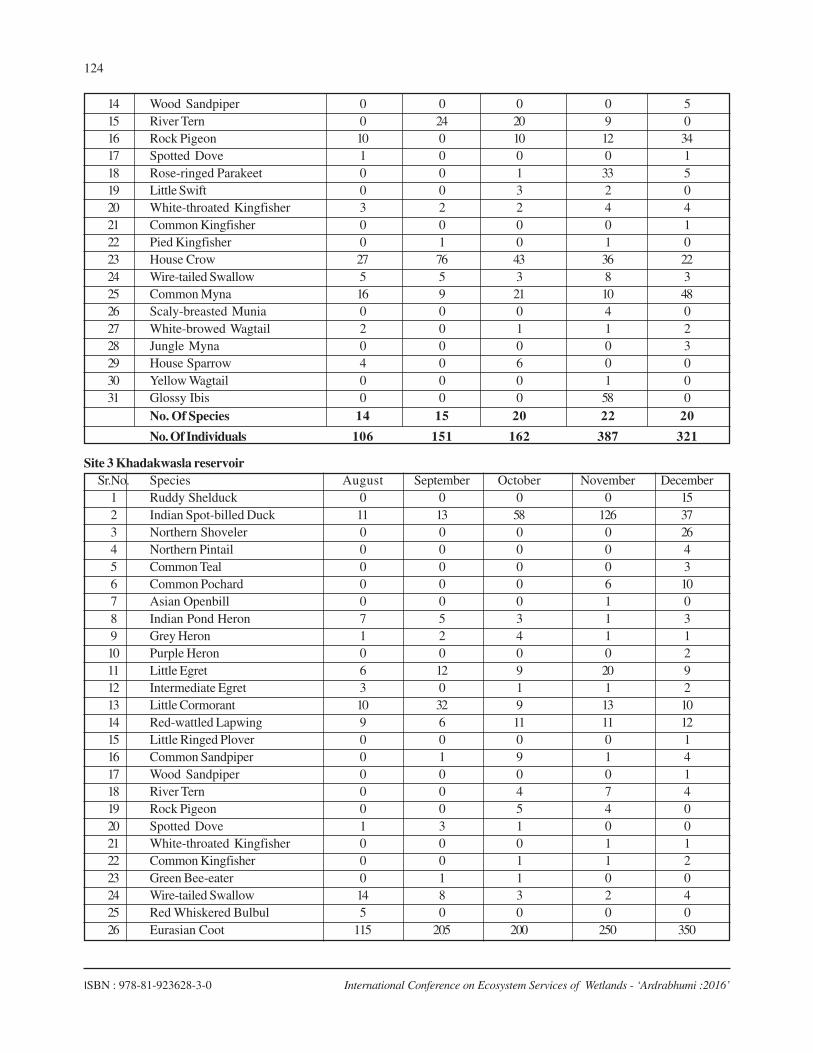
124
International Conference on Ecosystem Services of Wetlands - ‘Ardrabhumi :2016’ISBN : 978-81-923628-3-0
14 Wood Sandpiper 0 0 0 0 515 River Tern 0 24 20 9 016 Rock Pigeon 10 0 10 12 3417 Spotted Dove 1 0 0 0 118 Rose-ringed Parakeet 0 0 1 33 519 Little Swift 0 0 3 2 020 White-throated Kingfisher 3 2 2 4 421 Common Kingfisher 0 0 0 0 122 Pied Kingfisher 0 1 0 1 023 House Crow 27 76 43 36 2224 Wire-tailed Swallow 5 5 3 8 325 Common Myna 16 9 21 10 4826 Scaly-breasted Munia 0 0 0 4 027 White-browed Wagtail 2 0 1 1 228 Jungle Myna 0 0 0 0 329 House Sparrow 4 0 6 0 030 Yellow Wagtail 0 0 0 1 031 Glossy Ibis 0 0 0 58 0
No. Of Species 14 15 20 22 20
No. Of Individuals 106 151 162 387 321
Site 3 Khadakwasla reservoirSr.No. Species August September October November December
1 Ruddy Shelduck 0 0 0 0 152 Indian Spot-billed Duck 11 13 58 126 373 Northern Shoveler 0 0 0 0 264 Northern Pintail 0 0 0 0 45 Common Teal 0 0 0 0 36 Common Pochard 0 0 0 6 107 Asian Openbill 0 0 0 1 08 Indian Pond Heron 7 5 3 1 39 Grey Heron 1 2 4 1 110 Purple Heron 0 0 0 0 211 Little Egret 6 12 9 20 912 Intermediate Egret 3 0 1 1 213 Little Cormorant 10 32 9 13 1014 Red-wattled Lapwing 9 6 11 11 1215 Little Ringed Plover 0 0 0 0 116 Common Sandpiper 0 1 9 1 417 Wood Sandpiper 0 0 0 0 118 River Tern 0 0 4 7 419 Rock Pigeon 0 0 5 4 020 Spotted Dove 1 3 1 0 021 White-throated Kingfisher 0 0 0 1 122 Common Kingfisher 0 0 1 1 223 Green Bee-eater 0 1 1 0 024 Wire-tailed Swallow 14 8 3 2 425 Red Whiskered Bulbul 5 0 0 0 026 Eurasian Coot 115 205 200 250 350

125
International Conference on Ecosystem Services of Wetlands - ‘Ardrabhumi :2016’ISBN : 978-81-923628-3-0
27 Common Myna 10 10 6 2 028 House Sparrow 0 0 2 0 029 White-browed Wagtail 1 2 0 0 030 Jungle Myna 1 3 0 0 031 Red Vented Bulbul 0 1 0 0 032 Little Grebe 0 0 0 0 233 House Crow 15 21 76 40 1734 Black-winged Stilt 0 0 0 0 535 Grey Wagtail 0 0 0 0 136 Indian Robin 0 0 0 0 137 Asian Palm Swift 0 0 0 22 038 Pied Kingfisher 0 0 0 1 039 White-breasted Waterhen 0 0 1 0 040 Black Drongo 3 0 7 0 041 Long Tailed Shrike 0 0 1 0 042 Scaly Breasted Munia 10 15 0 0 043 Oriental Magpie Robin 1 0 0 0 0
No. Of Species 18 17 21 20 26No. Of Individuals 224 340 412 511 527
Site 4 MulaMutha Bird Sanctuary, Yerwada
Sr.No. Species August September October November December1 Ruddy Shelduck 0 0 0 18 172 Indian Spot-billed Duck 117 98 87 63 243 Little Grebe 0 0 0 2 64 Painted Stork 3 8 10 7 55 Black-headed Ibis 0 0 1 8 56 Glossy Ibis 0 12 0 2 07 Eurasian Spoonbill 0 0 3 0 08 Indian Pond Heron 6 8 7 16 59 Grey Heron 3 5 7 6 510 Purple Heron 0 0 0 1 111 Little Egret 1 2 16 7 712 Intermediate Egret 0 0 2 0 213 Little Cormorant 13 4 50 36 414 Black Kite 5 9 42 8 1915 White-breasted Waterhen 0 0 0 0 116 Grey-headed Swamphen 1 4 3 2 017 Black-winged Stilt 0 4 15 15 1918 Red-wattled Lapwing 5 7 5 3 419 Wood Sandpiper 0 0 0 1 120 Common Sandpiper 0 3 6 3 521 River Tern 5 23 18 13 622 Rock Pigeon 7 3 1 2 323 Spotted Dove 2 0 2 2 024 Rose-ringed Parakeet 8 0 37 9 025 House Crow 35 80 135 41 4726 Asian Palm Swift 0 0 0 2 027 White-throated Kingfisher 0 0 0 1 0

126
International Conference on Ecosystem Services of Wetlands - ‘Ardrabhumi :2016’ISBN : 978-81-923628-3-0
28 Common Kingfisher 0 1 0 0 029 Pied Kingfisher 2 0 0 0 030 Wire-tailed Swallow 0 2 2 0 031 Ashy Prinia 0 2 0 0 032 Plain Prinia 0 0 0 0 133 Common Myna 5 32 8 16 4434 House Sparrow 0 1 30 0 535 White-browed Wagtail 0 1 1 1 236 Yellow Wagtail 0 0 0 1 137 Grey Wagtail 0 0 0 0 238 Eurasian Coot 31 15 8 3 639 Jungle Myna 0 1 0 0 440 Pied Bushchat 0 0 0 0 2
No. Of Species 17 23 24 28 29No. Of Individuals 249 325 496 289 253
Anthropogenic threats-
Figure 4. Garbage dumping at Mhatre Bridge
Figure 5.Constructionwork at Khadakwasla
Conclusion- Awareness plays a crucial role inconservation. As observed the bird diversity is decreasingdue to various reasons. Before it completely vanishes weshould do something. Habitats should be conserved andmaintained properly so that the bird diversity willautomatically increase.
Acknowledgement- I am thankful to my guide Dr. GirishJathar and Co-guide Dr. AnkurPatwardhan.
I also thank Dr. Neelima Kulkarni, Dr.PramodSalaskar,Professor S. B. Nalawade and Deepak Sawant for theirvaluable suggestions during the project.
I would also like to thank my classmates and hostelmates for accompanying me on the field.
References-
Grimmett R., Inskipp C., Inskipp T. (2014), Birds of the Indiansubcontinent (3rd Ed.). Oxford, England: Oxford University Press.
Kamble P, Aher H. (2008), Physico-chemical characteristicsof water from Khadkawasala reservoir, Pune, Maharashtrastate, Int. J. Chem. Sci.: 6(1), 2008, 325-332.
Manchi S. (2001)- Management of Mula-Mutha birdsanctuary, Pune. MSc. Dissertation, Department ofEnvironmental science, University of Pune.

127
International Conference on Ecosystem Services of Wetlands - ‘Ardrabhumi :2016’ISBN : 978-81-923628-3-0
A Note on Fish Kill At Jail Lake, Thane, MS, India
Somani Vaishali and Sarang ShashankDepartment of Zoology,
Maharshi Dayanand College of Arts, Science and Commerce, Parel, Mumbai-12( Affiliated to University of Mumbai)
Email- [email protected]
Abstract : Thane (Maharashtra) is known as City of Lakes as it is dotted with about 35 lakes in and around the city. Theseaquatic ecosystems which support urban biodiversity are under influence of various anthropogenic activities. A small lake nearCentral Jail (19.199116 N 72.979948 E) showed a massive fish kill during October 2014. The lake is situated near a road withmedium to heavy traffic. Though under beautification process, moderate quantity of solid waste is dumped on the sides.Aquaculture is practiced in this water body. The study of water samples collected in next two days following the fish killrevealed total depletion of Dissolved Oxygen. Free Carbon Dioxide values were more than 60 mg/L. Though cleaning wasundertaken immediately and aeration was introduced by local authorities, dead fish were recorded even on third day. The entirepond was covered with algal growth. The bloom mainly comprised of Microcystis sp. Addition of nutrients through sewageand warm temperature must have favoured growth of this algae, resulting in hypoxia, finally leading to fish kill.
Key Words- Fish kill, Thane, algal bloom
Introduction
Fresh water lakes in urban regions have greatsignificance with respect to recreation and aesthetic value.These ecosystems provide support to aquatic biodiversity.Local communities utilize these for aquaculture. Howeverthese lakes also face the problems due to anthropogenicactivities. These include encroachment, solid wastes andidol immersions during festivals and domestic sewage. Allsuch activities influence the water quality and result intosignificant changes in biodiversity.
Thane (Maharashtra) is known as City of Lakes as it isdotted with about 35 lakes in and around the city. Theselakes, though not used as drinking water resource, providesuitable habitats for aquatic organism. They act as recreationspots for locals. Many of these lakes have definedboundaries with construction of concrete walls as a part ofbeautification program. Observations with respect to waterquality and plankton diversity of lakes Masunda, Kacharali,and Ambegosale are recorded by various authors. (Pejaveret al, 2002; Somani et al, 2007; Somani et al, 2012). Some ofthese lakes exhibit eutrophic status due to nutrientenrichment. Railadevi lake also showed massive fish kill dueto reduction in water level, addition of nutrients and depletionof Oxygen (Somani and Pejaver, 2000).
Jail Lake, a small lake near Central Jail (19.199116 N72.979948 E) is situated near a road with medium to heavytraffic. It has an area of about 10,938 sq. feet. Thoughunder beautification process, moderate quantity of solidwaste is dumped on the sides. Aquaculture is practiced inthis lake. It showed a massive fish kill during October 2014.The study was carried out to understand the possiblecauses of this fish kill.
Material and Methods
Surface water samples were collected in clean plasticcarboys from three stations along the lake, immediately nextday after the fish kill. (October 2014). Various physico-chemical parameters were analyzed as per standardprocedures (APHA, 1998).
For phytoplanktons, fixed volume of water sample wascollected and immediately fixed with Lugol’s iodine solutionand later 4% formaldehyde was used for long termpreservation. The phytoplankton samples were concentratedand identified using standard keys (Bellinger, 1992).
Result and Discussion
Preliminary observations of the lake revealedprominent presence of algal bloom covering the entiresurface. The water was deep green in colour withdecomposing odour. The dead fish were floating on thesurface and attracted a large number of insects, especiallyflies. The dead fish taken out from the lake were completelycovered with slimy green algal mass. The physicochemicalparameters of water showed moderate levels (Table 1).However, dissolved oxygen level indicated hypoxia. Higherlevels of carbon dioxide was recorded. Decomposing massof algae can be the cause of this.
Growth of algal bloom, depletion of oxygen and fishkill are related to each other in a complex manner. Dumpingof solid wastes and sewage water cause enrichment ofnutrients at a faster rate. The excessive amount of nutrientsfavors the growth of algae and macrophytes leading toeutrophication (Thilaga et al., 2005). Anthropogenic nutrientenrichment causes serious alteration in aquatic ecosystem(Ansari and Khan, 2006).


129
International Conference on Ecosystem Services of Wetlands - ‘Ardrabhumi :2016’ISBN : 978-81-923628-3-0
Barica, J. 1978. Collapses of Aphanizomenon flos aquaeblooms resulting in massive fish kils in eutrophic lakes:Verein. Limnol. 20:208-213.
Bellinger, E.E. (1992). A Key to common algae : FreshwaterEstuarine and some Coastal species. The Institute of waterand environment management London. pp.138.
Caramichael, W.W. 2001. Health effect of toxin producingcyanobacteria “The cyanoHAB’s”. Human and Ecologicalrisk manag. 7(5): 1359-1401
Kulkarni Rujuta, Vaishali Somani, Chhaya Panse andMangala Mukharjee 2012. Occurrence of Microcystis BloomBandra pond(Swami Vivekanand Sarovar), Maharashtra,India:its impact and measures for sustainable development”(93-95) Bionanofrontier ISSN 0974-0678:93-95
Magalhaes, V.F., Mainho, M.M., Damingos, P., Oliviero, A.C.,Costa, S.M. and Azevedo. 2003. Microcystins(Cyanobacteria hepatotoxins) bioaccumulation in fish andcrustaceans from Sepetiba Bay (Brasil, RJ). Toxicon. 42: 284-295.
Mohammed, Z.A., Carmichael, Z.A. and Hussein, A.A. 2003.Estimation of microcystins in the fresh water fishOreochromis niloticus in an Egyptian fish farm containingmicrocystis bloom. Environ. Toxicol. 18: 137-141.
Pejaver, Madhuri, Somani, Vaishali and Borkar, Mangala,2002. Physicochemical studies of lake Ambegosale. Thane.Indian, J. Ecol. Biol. 14 (4): 1277-281.
Pejaver, M. and Gurav, M. 2008. Study of water quality ofJail and Kalwa Lake, Thane, Maharashtra. J. Aqua. Biol.23(2): 44-50.
Somani Vaishali, Quadros Goldin and Madhuri Pejaver, 2012.Occurrence of rotifers and its relation to water quality duringthe bioremediation process in lake Kacharali, Thane, MS,India- Vol1(3) 2012, (54-58) ISCA Journal of BiologicalSciences ISSN 2278-3202
Somani Vaishali, Milan Gholba and Madhuri Pejaver 2007.Study of phytoplankton population in lake Masunda, Thane,employing multivariate analysis’. Eco. Env. and Cons. Vol.13(4), 847-848,
Sonia, R. and Ramanibai, R. 2015. Effect of microcystin onhepatotoxicity of Molly fish (Poecilia sphenops). IJIRSET.4(4): 2361-2366.
Thilaga, A., Subhasini, S., Sobhana, S. and Logan Kumar, K.2005. Studies on nutrient content of the Ooty lake withspecial reference to pollution. Nature Environment andPollution Technology. 4: 299-302.
Vijayvergia, R.P. 2008. Eutrophication: A case study of highlyeutrophicated lake Udaisagar, Udaipur (Raj.), India withregards to its nutrient enrichment and emergingconsequences. Proceedings of Taal 2007: The 12th WorldLake Conference. 1557-1560.

130
International Conference on Ecosystem Services of Wetlands - ‘Ardrabhumi :2016’ISBN : 978-81-923628-3-0
Sustainability of Peltophorum Pterocarpum (DC) Backer. In Salt Pan Area
Yojana G. DesaiDepartment of Botany, Mithibai College, Vile-Parle (W), Mumbai -56
E-mail – [email protected]
Abstract: Modern civilization armed with rapidly advancing technology and fast growing economic system is under increasingthreat from its own activities causing pollution leading to environmental problems. As cement is utilized for constructionactivity, it forms the important component of construction dust. Limestone and cement dust with pH value of 9 or highershowed significant effect on plants and soil. In the present investigation, the amount of total soluble salts was found toincrease in the soil. In the present work sustainability of Peltophorum pterocarpum (Subfamily- Caesalpineae) in saltpan areawas studied. Experimental site was located at Borivali which is northwestern suburb of Mumbai which showed ongoingconstruction. Biochemical study showed a significant increase in leaf pH and proline content. The pH of soil and dust atexperimental site increased significantly showing alkaline nature.
Key words: Building construction-dust, Peltophorum pterocarpum (DC) Backer., Biochemical.
Introduction:
In the present research work, ornamental treePeltophorum pterocarpum (DC) Backer. has been studiedfor its sustainability to building construction-dust.Peltophorum pterocarpum (DC) Backer. is a member ofsubfamily Caesalpineae. The tree is widely appreciatedshade tree for its dense spreading canopy. The entire treecanopy is smothered with a yellow blanket of flowersappearing in showy terminal panicles in summer. It is verybeautiful and elegant ornamental tree. Copper pod tree is asource of green manure and has the ability to fix nitrogen. Ithas been tested in rotational alley- cropping/ fallow systemin Sumatra (Noordwijk et al. 1992). The wood is used locallyfor light construction purposes, cabinet making, wood ware,woodcarving and marquetry, fuel wood. The bark has beenimportant component of the dark or black ‘Soga’ dye inJava, used for batik work. In Indonesia, the bark is used forfermenting palm wine. In traditional medicine it is used as anastringent to cure intestinal disorders after pain at childbirth,sprains, bruises and swelling.
Wetlands are valuable part of the environment.Wetlands and their ecosystems play significant role inbalancing the atmospheric carbon dioxide,help inmaintaining life. These habitats are under threat due toanthropogenic activities. Peltophorum pterocarpum (DC)Backer. is ornamental tree commonly growing in soil pH 5-6in Mumbai .In field survey, Peltophorum pterocarpum (DC)Backer. Tree was growing with few yellow flowers in saltyland. Hence, to check sustanibility of Peltophorumpterocarpum (DC) Backer.was given due importance inpresent work. It can be planted widely in salt land and helpin conservation of salt ecosystem.
Methodology:
Experimental and control field sites were selected atBorivali which is a northwestern suburb of Mumbai.Experimental site was selected at Siddharth Nagar where alot of construction activity was ongoing. Leaves ofPeltophorum pterocarpum (DC) Backer were collected frompredetermined nodes in polythene bags. Sanjay GandhiNational Park was taken as the control site. The biochemical
analysis was performed for foliar studies for samplescollected from experimental and control sites. Biochemicalparameters selected for foliar studies were leaf pH, proline(Sadasivam,S. and Manickam, A.1996) concentration ofcalcium EDTA Titration method and sodium (flamephotometer). Soil and dust samples were collected inpolythene bags from both the field sites and analyzed forpH.(Reeds, J.F. and Cummings, R.W.1945) pH of buildingconstruction dust and soil of both control and experimentalsites were determined.
Observations:
Table 1: Biochemical Analyses Results of soil and dust.
Sr. No. Parameters Experimental Control %DFC
1. Soil pH 9.48 ± 0.33* 5.86 ± 0.34 61.77
2. Total soluble 2.40 ± Nil* 1.50 ± Nil 60.00salt in soil %
3. Dust pH 10.07± 0.05* 4.66 ± 0.28 116.09
4. Total soluble 1.00 ± 0.35 0.75 ± 0.35 33.33salt in dust %
Values represents Mean ,%DFC = Percent difference fromcontrol,* significant at p<0.05 Student’s t-test.
Table 2: Foliar biochemical Analyses Results of Peltophorumpterocarpum (DC) Backer.
Sr. No. Parameters Experimental Control %DFC
1. Leaf pH 6.50* 6.38 1.88
2. Proline 3.30* 2.03 62.56(µ moles/g tissue)
3. Concentration 421.64* 280.56 50.28of calcium mg/gm
4. Concentration of 6.00* 1.60 275.00sodium mg/gm
Values represents Mean ,%DFC = Percent difference fromcontrol,* significant at p<0.05 Student’s t-test.

131
International Conference on Ecosystem Services of Wetlands - ‘Ardrabhumi :2016’ISBN : 978-81-923628-3-0
Results And Discussion:
In the present study, the significant increase in pH ofdust and soil at experimental site was observed. Similarresults have also been reported by Baralbai andVivekanandan (1996), Mandre et al (2007), due to cementdust exhaust. The alkaline building construction–dust fallon the soil has caused the shift in pH to alkaline side. Thebuilding construction –dust and soil at buildingconstruction site were found to be alkaline in nature. Soiland dust at experimental site showed high total soluble saltcontent than control site. These building construction dustand soil particles which were absorbed by the leaf cellsbrought about biochemical changes in cytoplasm shiftingthe leaf pH towards the alkaline side. Harrison and Chirgawi(1989) demonstrated experimentally the significance of foliaraccumulation and translocation of air derived metalpollutants. These building construction dust and soilparticles which were absorbed by the leaf cells broughtabout biochemical changes in cytoplasm shifting the leafpH towards the alkaline side. Leaves from experimental siteshowed a significant increase in leaf pH at p<0.05 ascompared to control (% DFC=1.88). Both, the foliar routeand soil! root pathway were found to be effective in shiftingthe leaf pH towards alkaline side. Experimental plant leavesshowed an increase in calcium and sodium concentration.
Calcium and sodium in building construction dust might beresponsible for an increase in concentration of elements inleaves. cement is one of the prime constituent of constructionwork and calcium is present in significant amount in cement.A significant increase in level of proline with DFC 62.56%was observed in leaves of experimental Peltophorumpterocarpum (DC) Backer. Proline is the importantphysiological factor in biochemical defence mechanism.
Conclusion :
Peltophorum pterocarpum (DC) Backer is one of thefast growing tree. It is also a green manure tree which benefitssurrounding ecosystem by increasing soil fertility. Thepresent study reveals that Peltophorum pterocarpum (DC)Backer.can survive well in salt pan area. Hence Peltophorumpterocarpum (DC) Backer can be planted in salt land, forconservation and protection of land.
Acknowledgement:
The author Yojana G. Desai thanks to her mother Mrs.Minakshi G. Desai for her help in the field work and brotherMr. Yogesh G. Desai for technical help. Authors are thankfulto the authorities of S.S. and L.S. Patkar College, Mumbaiproviding laboratory facilities for the present work.
References:
Adamson,E., Adamson,H. and Seppelt,R.(1994). Cement dustcontamination of Ceratodon purpureus at Case,est Artartica-damage and capacity of recovery. J.Bryol., 18(1):127-137.
Ade-Ademilua,O.E. and D.A.Obalola (2008). The effect ofcement dust pollution Celosia argentea(Lagos spinach)plant. Journal of Environmental Science andTechnology.’1(2):47-55
Bhavanishankar, A.V. and Jindal, P.C. (2001).Biochemicalresistance of grape genotypes against anthracnose. IndianJ.Agri.Res.35 (1):44-47.
Baralbai,V.C. and Vivekanandan M.(1996). Foliar applicationof electrostatic precipitator dust on growth, stomata andleaf biochemistry in certain legume crops.R.Bras.Fisiol.Veg.,8(1):7-14.
Harrison, R.M. and Chirgawi,M.B.(1989).The assessment ofair and soil as contributors of some trace metals to vegetableplants.I.Use of a filtered air growth cabinet.Science of theTotal environment 83,1-2,13-34.
Lerman,S.L. and E.F.Darley(1975).Particulates responses ofplants to air pollution. New York. Academic press,pp 141.
Mandre,M., Kask, R., Pikk ,J. and Ots.K. (2007). Assessmentof growth and stemwood quality of Scot pine on territoryinfluenced by alkaline industrial dust.EnvironmentalMonitoring and Assessment.vol.138, no.1-3.pp.51-63.
Reeds, J.F. and Cummings, R.W.( 1945). Soil reaction-glasselectrode and colorometric methods for determination ofpH values of soils. Soil Science. 59:97-104.
Sadasivam,S. and Manickam, A. (1996).Biochemicalmethods. New Age International (P) Ltd.pp.42-43,56-58.
Stratmann and Van Haut (1966). Studies on the effect ofcement kiln dust on vegetation. Air pollution controlassociation J.165(3):33-39.
Van Noordwijk M., Hairiah K, Sitompul SM and SyekhfaniMS, (1992). Rotational hedgerow intercropping +Peltophorum pterocarpum = New hope for weed-infestedsoils. Agroforestry Today. 4(4):4-6;12.

132
International Conference on Ecosystem Services of Wetlands - ‘Ardrabhumi :2016’ISBN : 978-81-923628-3-0
Fishery Status of Alimghar Channel of Ulhas River, Thane District,(Ms), India.
Poonam Kurve and Vicky PatilDepartment of Environmental Science
VPM’S B.N.Bandodkar College of Science, Thane.
Abstract: Livelihood of fisherman community is completely dependent on fish species harvested from various aquaticecosystems. The present paper deals with the study of diversity of fish species and their status in Alimghar creek, a part ofUlhas river, dist.-Thane. The study was carried out for three years from January 2013 to Jan 2016 and season wise variationin occurrence of fish was recorded. Total 19 species were found. Physico-chemical parameters of water were also checked. Thestudy revealed that the diversity along estuarine area is getting affected by anthropogenic activities which was confirmed whilecommunicating with local fishermen. Due to increasing anthropogenic pressure their livelihood is at stake.
Keywords: Ulhas River, fish diversity, physico-chemical parameters, anthropogenic activities.
Introduction:
India is the only country amongst the Asian countriesto have an extensive area, which has mangrove cover, saltmarshes and brackish water having varieties of biotic andabiotic properties and process (Lad and Patil, 2014). Estuariesare considered important part of aquatic environment whichacts as a transitional zone between fluvial and marineenvironment. Ulhas river being very long has a big catchmentarea including various tributaries and estuaries. This riveris almost spread throughout Thane district. The district isblessed by both brackish water flow from Thane creek andfresh water flow from the Ulhas river tributaries. Due to thisflux between fresh water and brackish water, it holds richand diverse aquatic flora and fauna. Mangroves in theestuaries act as an excellent nursing ground for a diverseaquatic fauna as it holds a quality nutrient pool (Rathod etal., 2002). Most of the aquatic organisms provides a sourcefor commercial, industrial and recreational purpose. Livelyhood of fisherman community was mainly dependent onfishing activity but due to increased commercialization andanthropogenic activities like dumping of garbage, landfills,sand dredging, etc. decline in fishing activities is observed(Quadros and Athalye, 2012). Still there are some fishingcommunities which are solely dependent on fishing nearAlimghar Village located on the bank of Ulhas river andtherefore to check the status of fishery study was carriedout.
Study Area:
Alimghar (19°12’16"N 73°2’10"E), a small village inThane district of Maharashtra state, with predominantfisherman population, is situated on the banks of Ulhasriver (Fig.1). A small inlet from Ulhas river Estuary formsAlimghar Creek. This creek is used for varied purposesfrom lucrative occupation like fishing to destructive practiceof sand dredging, discharge of industrial and domesticeffluents. All these activities pose severe threat to the fisheryin that area.
Fig.1: Location map of Alimghar (Google map)
Material And Methods:
Physico-chemical parameters of water like salinity(Argentometric method), dissolved oxygen (Winkler’siodometric method),nitrate-nitrogen( Phenol disulfonic acid),total suspended solids (Gravimetric method) and oil andgrease (Acid digestion method) of Alimghar creek werestudied by standard methods as described in APHA (1989)and Trivedi and Goel (1986). Temperature was recorded onfield by using alcohol thermometer. The water samples werecollected in clean sterilized polyethylene bottles during hightide on seasonal basis. Fish diversity was studied byvisiting landing centers periodically.Fishes were identifiedon the spot or preserved in 10% formalin and brought inlaboratory for confirmation of identification (FAO Sheets1974).Thermacol boxes were used to transport fish speciesto laboratory. Fish abundance was represented by allottingpoints on a scale of 0-5.
Results & discussion:
The study revealed seasonal variation as follows

133
International Conference on Ecosystem Services of Wetlands - ‘Ardrabhumi :2016’ISBN : 978-81-923628-3-0
Table 1: Seasonal variation in water parameters.
Sr. No. Parameter 2013-14 2014-15 2015-16PrM Mon PoM PrM Mon PoM PrM Mon PoM
1. Temperature (ºC) 33.6 29.4 26.5 32.8 28.4 25.7 34.6 29 25.42. pH 7.8 7.2 7.5 7.6 7.3 7.4 7.9 7.1 7.5
3. DO (mg/l) 1.9 4.3 2.8 1.5 3.93 2.08 2.8 4.67 3.10
4. Salinity (gm/l) 33.45 18.54 29.16 32.45 16.55 27.16 34.43 20.16 27.545. Nitrate mg/l 6.54 3.10 5.66 5.54 2.98 5.46 6.54 4.89 6.88
6. Total dissolved solids (mg/l) 28.67 34.13 25.16 26.67 32.33 24.46 25.74 49.185 30.45
7 Oil and Grease (mg/l) 3.45 2.00 2.56 3.55 2.10 2.36 4.02 3.8 4.5 PrM-Feb, March, April, May Mon-June, July, August, Sept. PoM-Oct, Nov, Dec, Jan.
0
10
20
30
40
50
PrM Mon PoM PrM Mon PoM PrM Mon PoM
2013-14 2014-15 2015-16
Fig. 2: Seasonal Variation in Physico-chemical parameters of water1 Temperature ºC
2 pH
3 DO mg/l
4 Salinity gm/l
5 Nitrate mg/l
6 Total dissolved
solids mg/l
7 Oil and Grease
mg/l
The study revealed seasonal variation in the physico-chemical parameters of the water as follows:
The average temperature in the study area was 29.9 °Cwhich is typical of any tropical region with maximumtemperatures being recorded before the monsoons. Thewater of the estuarine ecosystem under scrutiny was mildlyalkaline less than that specified by OATA for ideal marineecosystem while the oxygen levels were just below theprescribed limit (OATA, 2008) for sustenance of life. Thesalinity of the water body was found in variance with theseasons with low salinity during monsoon and concentrationof salts during pre-monsoon. The nitrate concentration of
the estuary was very less as compared to the prescribedlimit of 100 ppm (OATA, 2008). Low nitrates can be betterunderstood by studying the nitrogen cycle of the ecosystemby analysis of phytoplankton and other nitrate reducingagents.The total dissolved solids in Ulhas estuary wasseason dependent with maximum concentration duringmonsoon due to land runoff and dilution of the brackishwaters by various agents, natural and anthropogenic. Theoil and grease content was within the permissible limit of 20ppm (CPCB, 1986). All the physic- chemical parameterssuggested better health of the Alimghar creek ecosystem asmost the values determined were in standard specifiedpermissible limits. However, constant monitoring of theseparameters along with a more in-depth analysis will furtherhelp in strengthening the relation of fish abundance andchemistry of water (Table 1 and Fig. 2).
Fish catch:
Fish landing locations were visited minimum twice amonth to collect information from field as well as from localfisherman and fish vendors. Fish samples were collectedand taken to the laboratories in thermacol ice box orpreserved in 10% formalin for identification. It was ensuredthat representative sample of all fish species from the entirecatch was collected.
Table2: Fishery species diversity 2013-2016
Sr. Family Scientific Name Study period Common Local Nameno. 2013-14 2014-15 2015-16 Name
1 Megalopidae Megalops cyprinoides 04 03 02 Indian Tarpon Vadas/varas2 Clupeidae Tenualosa toli 01 01 01 Indian shad Palla.3 Plotosidae Plotosus spp. 02 01 00 Cat-fish eel Nal shingali.4 Tachysuridae Osteogeneiosus militaris 03 02 02 Soldier cat-fish Shingala
Mugil cephalus 03 03 02 Gray mullet BoiMugil dussumieri 04 04 03 Mullet Boi
6 Latidae Lates calcarifer 03 02 02 Cock up Bekti Jitada7 Drepaneida Drepane longimana 01 01 00 Moon fish Chand8 Cichlidae Tilapia mossambica 04 03 02 Tilapia kala masa9 Gobidae Glossogobius giuris 02 01 01 Goby Kharbi
Boleophthalmus dussumieri 02 02 01 Mud skipper NivtiBoleophthalmus boddarti 02 01 01 Mud skipper Nivti10 Periopthalmidae
5 Mugilidae

134
International Conference on Ecosystem Services of Wetlands - ‘Ardrabhumi :2016’ISBN : 978-81-923628-3-0
11 Bagridae Mystus gulio 03 02 02 Cat fish Chimna12 Ophiocephalidae Channa spp. 01 01 01 dwarf snake Daku
head fish13 Terapontidae Terapon jarbua 02 01 01 Target perche Navera14 Portunidae Scylla serrata 02 01 01 mud crab Khekda15 Palaemonidae Macrobrachium rosenbergii 01 01 00 Prawn Pochi
Metapenaeus affinis 02 02 01Penaeus indicus 03 02 01
Scale:05 = maximum 04=Good 03= Median 02=low 01= Rare 00= Absent
During study 19 species belonging to 16 families offishery fauna were recorded in two consequetive years from2013-15 whereas only 16 species were recorded in the year2015-16. The fish diversity included finfishes, crustaceansand other aquatic organisms. The present data attributeddecline in fish diversity by almost 50 % as Rathod et al.(2002) showed presence of 39 species in the same area.Species like Megalops cyprinoides, Mugil dussumieri,Tilapia mossambicus formed majority of the fish catch.Species such as Lates calcarifer, Mugil cephalus,Osteogeneiosus militaris, Mystus gulio and Penaeusindicus were moderately found. Plotosus spp. Glossogobiusgiuris, Boleophthalmus dussumieri, Boleophthalmusboddarti, Terapon jarbua, Scylla serrata and Metapenaeusaffinis accounted a low portion of the catch. Species thatwere rare in the catch included Macrobrachium rosenbergii,Channa species, Drepane longimana and Tenualosa toli .
It was observed that fish species such as Megalopscyprinoides, Boleophthalmus dussumieri ,Metapenaeusaffinis and Metapenaeus indicus were declining in numberover the year and it was also confirmed with the local
fishermen and fish vendors. Species like Macrobrachiumrosenbergii, Drepane longimana and Plotosus sp. whichwere found in the year 2013-14,2014-15 were completelyabsent in the year 2015-16. The physicochemical parametersshowed increase in nitrates, total dissolved solids, and oiland grease content in the year 2015-16 which might be oneof the factor causing decline in the fish species . Suchvariations in physico chemical parameters might be correlatedwith the increase in the water pollution and increasedanthropogenic activities such as sand dredging, wasteddumping ,mixing of chemical effluents from industries etc.More detailed study of the pollution tolerance capacity ofthese species is required.
Seasonal variations in fish catch:
Primary data based on field observation andinformation collected from the fishermen lead to significantfindings. Some species were found to be abundantthroughout the year while other species showed seasonalfluctuation in their number.
Table 3: Seasonal variation in fish diversity
Sr. No. Species 2013-14 2014-15 2015-16PrM Mon PoM PrM Mon PoM PrM Mon PoM
1. Megalops cyprinoides � � � � � � � � �
2. Tenualosa toli — � — — � — — � —3. Plotosus spp. � � — — — — — — —4. Osteogeneiosus militaris — � — — � — — � —5. Mugil cephalus � � � � � � � � �
6. Mugil dussumieri � � � � � � � � �
7. Lates calcarifer — � — — � — — � —8. Drepane longimana — � — — � — — — —9. Tilapia mossambica � � � � � � � � �
10 Glossogobius giuris — � — — � — — � —11 Boleophthalmus dussumieri � — � � — � � — �
12 Boleopthalmus boddarti — — � — — � — — —13 Mystus gulio — � — — � — — � —14 Channa spp. — � — — � — — � —15 Terapon jarbua � — — � — — � — —16 Scylla serrata � — � � — � � — �
17 Macrobrachium rosenbergi � � — � � — — — —18 Metapenaeus affinis — � — — � — — � —19 Penaeus indicus � � � � � � � � �
PrM = Pre-monsoon, Mon = Monsoon, PoM = Post-monsoon
16 Penaeidae

135
International Conference on Ecosystem Services of Wetlands - ‘Ardrabhumi :2016’ISBN : 978-81-923628-3-0
The species namely Megalops cyprinoides, Mugilcephalus, Mugil dussumieri, Tilapia mossambica, Penaeusindicus showed occurrence throughout the study period.These species are abundantly found in the Ulhâs river.Terapon jarbua was the only species to show its occurrenceonly in pre monsoon period. Periophthalmidae family wasrepresented by Boleophthalmus dussumieri andBoleophthalmus boddarti which made their occurrencemainly in the post- monsoon period. Species like Plotosussp. and Macrobrachium rosenbergii, Scylla serrata werepresent in the catch during pre-monsoon and monsoonperiod. Species like Channa species, Metapenaeus affinis,Glossogobius giuris, Tenualosa toli, Drepane longimanaand Osteogeneiosus militaris were found in monsoonseason.
The diversity of fish species was highest in themonsoon season which can be attributed to influx offreshwater (in the form of rain) leading to dilution ofpollutants. Out of the 19 species recorded in 2013-14 and2014-15, the three species namely Plotosus sp., DrepaneLongimana, and Macrobrachium rosenbergii which werepreviously found throughout the year were reported absentin year 2015-16.(fig 4)
0
2
4
6
8
10
12
14
16
2013-14 2014-15 2015-16
10 10
8
15
14
12
8 8
7
No
. o
f fi
sh s
pe
cie
s
study period
Fig. 4: species diversity of fishes
PrM Mon PoM
The above graph shows the data about the speciesdiversity of fishes over three years. It clearly indicates declinein number of fish species from year 2013-14 to year 2015-16.The overall study indicated timely remedial measures to beundertaken to improve and maintain the fishery status ofthe Alimghar Creek.
Conclusion:
Variation in the fish diversity was mainly due to theseasonal variations in the physico-chemical parameter ofthe water Discharge of industrial effluents from the Kaylan-Ambernath-Ulhasnagar industrial belt and sewage disposalfrom the suburban settlements has considerably polluted asection of the Ulhas river. The significant changes wereseen in the water parameters of Alimghar creek during year2015-16 which might be due to the ongoing anthropogenicactivities causing decrease in fish catch. The three speciesnamely Plotosus sp., Drepane longimana, andMacrobrachium rosenbergii which were previously foundthroughout the year were reported absent in year 2015-16.
Other fish species namely Macrobrachium rosenbergii,Tenualosa toli, Boleophthalmus spp., Mystus gulio andScylla serrata have been adversely affected by the waterpollution. Due to the uncertainty in the catch many fishermenare shifting their focus from fishery to other business. If noproper measures are implemented for restoration of waterquality certainly there would be a severe damage to theAlimghar creek ecosystem and also drastic decline in fisherybusiness in next decade or so.
Acknowledgements:
Author wish to thank Dr. (Mrs.) Madhuri Pejaver,Principal of VPM’s B.N. Bandodkar College of Science forsupport and motivation. We would like to thank Dr. (Mrs.)N.N. Patil and Dr. (Mr.) S.D. Rathod and Mr. AshutoshJoshi for their valuable inputs.
References:
APHA, AWWA, WPCF (1981) International StandardMethod for the examination of Water and Wastewater.15thedition. Washington D.C.
Trivedi R.K. and Goel P.K. (1986) Chemical and BiologicalMethods for Water Pollution Studies, EnvironmentalPublication, India.
Athalye R.P., N.N. Patil, M.U.Borker, Goldin Quadros andV.U. Somani (2003) Study of Flora, Intertidal Macro benthicfauna and Fishery of Ulhas River Estuary and Thane Creekto access the pollution status and decide the mitigativestrategy. B.N. Bandodkar College of Science, Thane andMMRDA Mumbai Project.
Rathod, Sudesh D., N.N. Patil, Goldin Quadros and AthayleR.P. (2002) Qualitative Study of Fin Fish and Shell Fish Faunaof Thane Creek and Ulhas River Estuary. Proc. The NationalSeminar on Creek, Estuaries and Mangroves-Pollution andConservation.
Rathod, Sudesh D. and N.N. Patil (2009) Assessment ofSome Hydrological Parameters of Ulhas River Estuary, inthe vicinity of thane city, Maharashtra state .J. Aqua. Biol.,24(2): 103 – 108.
Lad Devdatta and Patil Shashikant (2014) Present Status ofWater Quality of Ulhas River Estuary,Vasai CostalArea,thane,Maharashtra ,India.International Journal of PureAnd Applies Bioscience 2(1):209-212.
Jadhav, Amol Y. and Pravin U. Singare (2015) Studies onthe water pollution due to toxic metals in Ulhas River flowingalong the Dombivali city, India. International letters ofNatural sciences vol.38.

136
International Conference on Ecosystem Services of Wetlands - ‘Ardrabhumi :2016’ISBN : 978-81-923628-3-0
Singh, Tarun Kumar(2014) Fish Diversity in Selected Stretchof the River Mahanadi in Odisha and the Livelihood ofInhabiting Fisher Community. International ResearchJournal of Biological Sciences 3(8): 98-104.
Kumar, Tarun, Guru Bhikari Charan and Swain SarojKumar (2013) Review of the Research on the Fish Diversityin the River Mahanadi and Identifying the Probable PotentialOrnamental Fishes among them with reference to Threatsand Conservation Measures Singh. Research Journal ofAnimal, Veterinary and Fishery Sciences 1(3), 16-24.
Boeuf, G. & P. Payan.(2001.) How should salinity influencefish growth? Comparative Biochemistry and Physiology,Part C, 130: 411-423.
Prabhahar. S., Senthil Murugan. A., Saleshrani. K.,Thramaraj. K., and Ashok Raja. C.(2012) Fish communityand seasonal variation of physic - chemical properties ofKamala Reservoir, Biruaul, Darbhanga District, Bihar.International Journal Recent Scientific Research, 3: 172 –174
Tara A. Mac Pherson, Lawrence B. Cahoon and Michael A.Mallin (2007)Water column oxygen demand and sedimentoxygen flux: patterns of oxygen depletion in tidal creeks.Hydrobiologia DOI 10.1007/s10750-007-0643-4
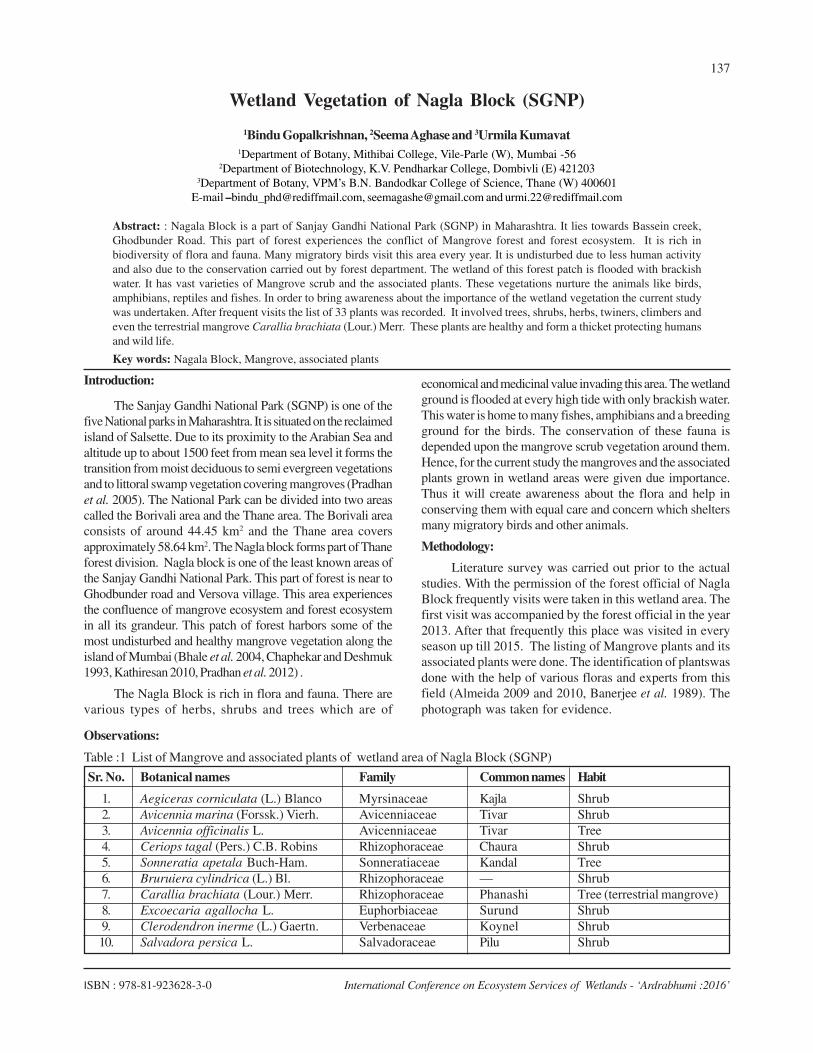
137
International Conference on Ecosystem Services of Wetlands - ‘Ardrabhumi :2016’ISBN : 978-81-923628-3-0
Wetland Vegetation of Nagla Block (SGNP)
1Bindu Gopalkrishnan, 2Seema Aghase and 3Urmila Kumavat1Department of Botany, Mithibai College, Vile-Parle (W), Mumbai -56
2Department of Biotechnology, K.V. Pendharkar College, Dombivli (E) 4212033Department of Botany, VPM’s B.N. Bandodkar College of Science, Thane (W) 400601
E-mail –[email protected], [email protected] and [email protected]
Abstract: : Nagala Block is a part of Sanjay Gandhi National Park (SGNP) in Maharashtra. It lies towards Bassein creek,Ghodbunder Road. This part of forest experiences the conflict of Mangrove forest and forest ecosystem. It is rich inbiodiversity of flora and fauna. Many migratory birds visit this area every year. It is undisturbed due to less human activityand also due to the conservation carried out by forest department. The wetland of this forest patch is flooded with brackishwater. It has vast varieties of Mangrove scrub and the associated plants. These vegetations nurture the animals like birds,amphibians, reptiles and fishes. In order to bring awareness about the importance of the wetland vegetation the current studywas undertaken. After frequent visits the list of 33 plants was recorded. It involved trees, shrubs, herbs, twiners, climbers andeven the terrestrial mangrove Carallia brachiata (Lour.) Merr. These plants are healthy and form a thicket protecting humansand wild life.
Key words: Nagala Block, Mangrove, associated plants
Introduction:
The Sanjay Gandhi National Park (SGNP) is one of thefive National parks in Maharashtra. It is situated on the reclaimedisland of Salsette. Due to its proximity to the Arabian Sea andaltitude up to about 1500 feet from mean sea level it forms thetransition from moist deciduous to semi evergreen vegetationsand to littoral swamp vegetation covering mangroves (Pradhanet al. 2005). The National Park can be divided into two areascalled the Borivali area and the Thane area. The Borivali areaconsists of around 44.45 km2 and the Thane area coversapproximately 58.64 km2. The Nagla block forms part of Thaneforest division. Nagla block is one of the least known areas ofthe Sanjay Gandhi National Park. This part of forest is near toGhodbunder road and Versova village. This area experiencesthe confluence of mangrove ecosystem and forest ecosystemin all its grandeur. This patch of forest harbors some of themost undisturbed and healthy mangrove vegetation along theisland of Mumbai (Bhale et al. 2004, Chaphekar and Deshmuk1993, Kathiresan 2010, Pradhan et al. 2012) .
The Nagla Block is rich in flora and fauna. There arevarious types of herbs, shrubs and trees which are of
economical and medicinal value invading this area. The wetlandground is flooded at every high tide with only brackish water.This water is home to many fishes, amphibians and a breedingground for the birds. The conservation of these fauna isdepended upon the mangrove scrub vegetation around them.Hence, for the current study the mangroves and the associatedplants grown in wetland areas were given due importance.Thus it will create awareness about the flora and help inconserving them with equal care and concern which sheltersmany migratory birds and other animals.
Methodology:
Literature survey was carried out prior to the actualstudies. With the permission of the forest official of NaglaBlock frequently visits were taken in this wetland area. Thefirst visit was accompanied by the forest official in the year2013. After that frequently this place was visited in everyseason up till 2015. The listing of Mangrove plants and itsassociated plants were done. The identification of plantswasdone with the help of various floras and experts from thisfield (Almeida 2009 and 2010, Banerjee et al. 1989). Thephotograph was taken for evidence.
Observations:
Table :1 List of Mangrove and associated plants of wetland area of Nagla Block (SGNP)
Sr. No. Botanical names Family Common names Habit
1. Aegiceras corniculata (L.) Blanco Myrsinaceae Kajla Shrub2. Avicennia marina (Forssk.) Vierh. Avicenniaceae Tivar Shrub3. Avicennia officinalis L. Avicenniaceae Tivar Tree4. Ceriops tagal (Pers.) C.B. Robins Rhizophoraceae Chaura Shrub5. Sonneratia apetala Buch-Ham. Sonneratiaceae Kandal Tree6. Bruruiera cylindrica (L.) Bl. Rhizophoraceae — Shrub7. Carallia brachiata (Lour.) Merr. Rhizophoraceae Phanashi Tree (terrestrial mangrove)8. Excoecaria agallocha L. Euphorbiaceae Surund Shrub9. Clerodendron inerme (L.) Gaertn. Verbenaceae Koynel Shrub10. Salvadora persica L. Salvadoraceae Pilu Shrub

138
International Conference on Ecosystem Services of Wetlands - ‘Ardrabhumi :2016’ISBN : 978-81-923628-3-0
11. Derris trifoliata Lour. Fabaceae Kajar vel Scandent shrub12. Derris scandens (Roxb.) Bth. Fabaceae Mothi-shirilli Lianas13. Pentatropis nivalis (J.F. Gmel.) F& W. Asclepidaceae Amar vel Twiners14. Acanthus ilicifolis L. Acanthaceae Marandi Subshrub15. Sesuvium portulacastrum L. Aizoaceae — Herb16. Thespesia populnea (L.) Soland Malvaceae Bhendi Small tree17. Ixora coccinea L. Rubiaceae Bakara Shrub18. Cayratia trifolis (L.) Domin Vitaceae Ambat vel Twiner19. Abrus precatorius L. Fabaceae Gunj Twiner20. Mucuna pruriens (L.) DC Fabaceae Khajkuiri Twiner21. Memecylon umbellatum Burm. Melastomaceae Anjan Tree22. Manilkara hexandra (Roxb.) Dub. Sapotaceae Khirni Tree23. Carissa congesta Wight Apocynaceae Karvanda Shrub24. Wattakaka volubilis (L.) Stapf. Asclepidaceae Hirandodi Twining shrub25. Hemidesmus indicus (L.) Schult Periplocaceae Anant vel Twining shrub26. Ipomea pes-tigridis L. Convolvulaceae — Twiners27. Asparagus racemosus Willd. Asparagaceae Shatavari Undershrub28. Chloris virgata Swartz Poaceae — Herbaceous grass29. Cynodon dactylon (L.) Pers. Poaceae Harali Herbaceous grass30. Isachne globosa (Thunb.) O.Ktze Avicenniaceae Daura Herbaceous grass31. Dactyloctenium austral Steud Poaceae — Herbaceous grass32. Hygrophila ringens (L.) Steud Acanthaceae — Herb33. Hibiscus tiliaceus L. Malvaceae Bola Small tree
Results And Discussion:
The wetland area of Nagala Block is a very thickundisturbed vegetation patch. During low tides thepneumatophores protrude out and smaller herbs make itsvisibility. Frequent visits from the years 2013-2015 haverevealed the presence of the various mangrove scrubvegetations as well as the associated plants growing alongwith them. The list of these plants is put forth in table no.1.In total of about 33 plants are recorded within these 3 yearsof observations. Among these plants the frequentlyobserved ones are Avicennia marina, Avicennia officinalis,Acanthus ilicifolius and Sonneratia apetala. The Thespesiapopulnea which is cultivated as a road side plant has normalleaves but this plant since growing in salty condition hadthick leaves with salt gland, similar observation was seen incase of Clerodendron inerme. This vegetation is in healthyconditions due to less interference of man as compared tothe mangroves growing in Mahim creek.
Conclusion:
In nutshell, the vegetation of Nagla Block is also richin wetland plants. This is mainly due to the protection givento this forest by the people staying in and around. Theforest department is also active in protecting this area. Thelocals venture into the brackish water for catching fish fortheir livelihood. On the other side of the creek sand isremoved and sold by the money minded people. It might bea problem which sooner or later will approach the NagalaBlock area also. Hence it is a need of hour to make awareness
of the rich flora that Nagla Block has harnessed. This naturalwealth is a boon to many wild lives whose life cycle is mainlydepended on it. This vegetation also welcomes the migratorybirds every year. It is felt utmost important to sensitized, inconserving this wetland from the various destructions thatmay occur in future.
References:
1. Almeida M.R., (2009, 2010). Flora of Maharashtra,Orient Press.
2. Banerjee L.K, Sastry A.R.K., and Nayar M.P., (1989).Mangroves in India-Identification Manual.
3. Bhale P., Bhatti I and Mayes R.,(2004). Sanjay GandhiNational Park (SGNP), A Concise Report.
4. Chaphekar S.B., and Deshmuk S., (1993). Status ofMangrove in Maharashtra, Journal of EcologicalSociety.15-19.
5. Kathiresan K, (2010). Importance of Mangrove forestof India, Jorn. Coast. Env. 1 (1) : 11-16.
6. Pradhan S.G., Sharma B.D and Singh N.R.,(2005). Floraof Sanjay Gandhi National Park Borivali-Mumbai(Bombay), published by BSI, Calcutta.
7. Pradhan V, Nazim M.K., Bansode S and ShaikhJ.D.(2012). Ecological study of Khar Danda (Mumbaiwetland) with reference to Biodiversity, IJEP, 32 (6 :486-490).

139
International Conference on Ecosystem Services of Wetlands - ‘Ardrabhumi :2016’ISBN : 978-81-923628-3-0
A Survey of Bird Diversity at Bhandup Pumping Station: an Urban Habitat,(M.S.) India.
Poonam Kurve1, Nirmalkumar Kurve2, Umang Kale3 and Ashutosh Joshi1
1VPM’s B. N. Bandodkar College of Science, Thane2KET’s V. G. Vaze College of Science, Mulund
3Ramnarain Ruia College, Mumbai
Abstract: India is a country with geographical and biological diversity contributing 8% to the global biodiversity. This isbecause of varied habitats and ecosystems that are found across the landmass. One of the most ecologically rich and diverseecosystems is wetland. Bhandup Pumping Station in Mumbai is a heterogeneous habitat with variety of ecosystems likeMangroves, Marshland, Saltpans and agricultural farmlands. It is an upcoming birding hotspot in Mumbai especially formigratory bird species. Bird diversity of Bhandup Pumping Station was studied from June 2014 - January 2016 using pointcount and line transect methods. Studies revealed 69 species from 14 orders with passerines being the dominant order (32%).Out of 69 species 65% were Residents while winter visitors contributed 25%. Feeding habits showed that Carnivorous(49%), Omnivorous (19%), Insectivorous (19%) species were dominant, suggesting rich prey base at the area. Thus, area is ofutmost ecological importance and legislative protection, active participation of locals and long term monitoring programmesare the needed to conserve the biological wealth.
Keywords: Bhandup Pumping Station, Avifauna, Waders, Migratory species.
Introduction:
India is rich in terms of biological wealth and has beengifted with spectacular variety of flora and fauna. Thecountry occupies only 2.5% of the world’s total area butaccounts for 7.8% of the global biodiversity (Report of CBD,2009). It is one of the 12 Megadiverse countries in the world;boasting two global biodiversity hot spots. It is home tomore than 1300 species of birds which includes resident,local migrant, seasonally migrating species. Long termmonitoring shows that diversity of birds is decreasingglobally at an alarming rate; main reason being theanthropogenic disturbances (Rapoport, 1993) and climatechange (Chen et al., 2011; Sekercioglu et al., 2012).
India consists of varied types of ecosystems rangingfrom high altitude cold alpine forests to hot and humidwetlands. There have been several projects which have beenundertaken by Central Governments to conserve thesehabitats and the biodiversity. National WetlandConservation Programme (NWCP) covers 115 wetlands and25 wetlands of global importance under Ramsar Convention.About 4,445 km2 area of the country has mangrove cover(NWCP Guidelines for Conservation and Management ofWetlands in India, 2009). The major threats to these wetlandshappen to be high siltation, encroachments, overexploitationof biological resources, discharge of effluents, leading tohabitat degradation and destruction. As per IUCN Red Listof endangered birds, 1226 bird species have already beenrecognized as threatened globally 88 of which, are found inIndia.
Thus, it is the need of hour to monitor, protect andconserve these marshy habitats and its species richnessespecially in a city like Mumbai which, inspite of itsoverpopulation and pollution, nurtures around 350 species
of birds. Present study was carried out to record avifauna ofBhandup pumping station (BPS) an area in Mumbai suburb.
Study Area:
Bhandup Pumping Station is an area where seweragefrom the Mumbai suburbs is received, treated for removingthe harmful constituents and rest of the water is recycled.This recycled water though is not potable, can very well beused for washing, gardening or some similar purpose. Thelocation (19009’02.31"N, 72057’31.02"E) is near BhandupVillage. BPS area is lined by eastern express highway onwest and by creek on east side. In its vicinity are the saltpans,some of which are in use while some are abandoned. It’s aneasily approachable place by private or hired vehicle. Nearbyresidents prefer it as a morning walk destination also.
As such, the place is very close to heavy vehiculartraffic but still is known for the remarkable diversity of local,local migratory and seasonally visiting bird fauna. It hasbecome an attraction for established and amateur birdersand wildlife photographers. The area is home to a variety ofmangrove species like Avicennia marina, Sonneratiaapetala, Excoecaria agallocha with associates like Derristrifoliata, Salvadora persica and Acanthus ilicifoliusamong which Avicennia marina is dominant species. Almostintact mangrove cover and tidal waters of the creek, saltpans and dense shrub patches provide safe and suitablehabitat for nesting and foraging for the birds. Local andlocal migratory birds are seen almost round the year butwinter visitors are reported from November to April everyyear. The flamingoes since long have been visiting thislocation in huge numbers every winter.

140
International Conference on Ecosystem Services of Wetlands - ‘Ardrabhumi :2016’ISBN : 978-81-923628-3-0
Bhandup Pumping Station (Source: Google Earth Imagery)
Methodology:
The current study was carried out from June 2014 -January 2016. The area was visited in every season (Summer,Monsoon and Winter) regularly ensuring at least two visitsevery month. The visits were made twice a day i.e. in themorning and evening, as it is peak time of activity. The birdswere observed for approximately three hours using Comet10X50 DPSI binoculars. The birds were recorded mainly bypoint count and line transects sampling method during thesurvey, along with activity such as feeding, Nesting etc.The nesting behavior of different species was also notedalong with plant species.
Identification of birds was confirmed using fields
guides such as “Birds of Indian Subcontinent” (2013) byGrimmet R., Inskipp C. 2nd edition. Photographic images werecaptured where ever possible. Opportunistic sightings andobservations were also recorded during the survey periodand were considered for analysis. Further, birds werecategorized: RS – Resident (Indigenous birds), LM – LocalMigratory, WM – Winter Migratory and SM – SummerMigratory (Ali, 2012).
Results:
The study showed total 69 avifaunal speciesbelonging to over 14 orders during the study period. Ingeneral, it was observed that passerines and waders weredominant at the study site contributing 32% and 31%respectively of the total recorded avifauna.
Table. 1: List of Birds Observed near BPS and Their Feeding Habit
Sr.No. Species Scientific Name Status Feeding Type I Accipitriformes
1 Black eagle Ictinaetus malayensis RS C
2 Black Kite Milvus migrans RS C
3 Brahminy Kite Haliastur indus LM C4 Eurasian Marsh Harrier Circus aeruginosus WM C
II Anseriformes5 Indian Spotbilled duck Anas poecilorhyncha RS O6 Ruddy shelduck Tadorna ferruginea WM C
III Charadriiformes7 Black tailed godwit Limosa limosa WM C8 black winged stilt Himantopus himantopus WM C
9 Common Redshank Tringa tetanus WM C
10 Common ringed plover Charadrius dubius WM C11 Common sandpiper Actitis hypoleucos RS C
12 Eurasian stone curlew Burhinus oedicnemus LM C
13 Kentish plover Charadrius alexandrinus WM C

141
International Conference on Ecosystem Services of Wetlands - ‘Ardrabhumi :2016’ISBN : 978-81-923628-3-0
14 Little tern Sternula albifrons WM C15 Red watlled lapwing Vanellu indicus RS O
16 Slender billed gull Chrocrocephalus genei WM C
IV Ciconiiformes17 Painted stork Mycteria leucocephala LM C
18 White stork Ciconia ciconia WM C
V Columbiformes19 laughing dove Streptopelia senegalensis RS G
20 Spotted dove Streptopelia chinensis RS G
VI Coraciiformes21 Blue tailed bee-eater Merops philippinus RS I
22 Common hoopoe Upupa epops LM I
23 Common Kingfisher Alcedo atthis RS C24 Green bee-eater Merops orientalis RS I
25 Indian roller Coracias benghalensis RS I
VII Cuculiformes26 Asian Koel Eudynamys scolopacea RS F
27 Jacobin cuckoo Clamator jacobinus SM I
28 Southern Coucal Centropus sinensis RS C VIII Gruiformes
29 Grey headed Swamphen Porphyrio poliocephalus WM O
30 White breasted Waterhen Amaurornis phoenicurus RS O IX Passeriformes
31 Ashy prinia Prinia socialis RS I
32 Bay backed shrike Lanius vittatus RS C33 Baya weaver Ploceus philippinus RS G
34 Black drongo Dicrurus macrocercus RS I
35 Tricoloured munia Lonchura Malacca LM G36 Chestnut tailed starling Sturnus malabaricus WM O
37 Indian golden oriole Oriolus kundoo RS F
38 Indian Robin Saxicoloides fulicatus RS I39 Long tailed shrike Lanius schach RS C
40 Oriental Magpie robin Copsychus saularis RS I
41 Asian Pied starling Sturnus contra WM O42 Plain prinia Prinia inornata RS O
43 Red Avadavat Amandava amandava RS G
44 Red vented bulbul Pycnonotus cafer RS O45 Red whiskered bulbul Pycnonotus jocosus RS O
46 Rosy starling Sturnus roseus WM O
47 Scaly breasted munia Lonchura punculata LM G48 Common Tailorbird Orthotomus sutorius RS I
49 White spotted fantail Rhipidura albogularis RS I
50 White eared bulbul Pycnonotus leucotis RS O51 Wiretailed swallow Hirundo smithii RS I
52 Yellow eyed babbler Chrysomma sinense RS I
X Pelecaniformes
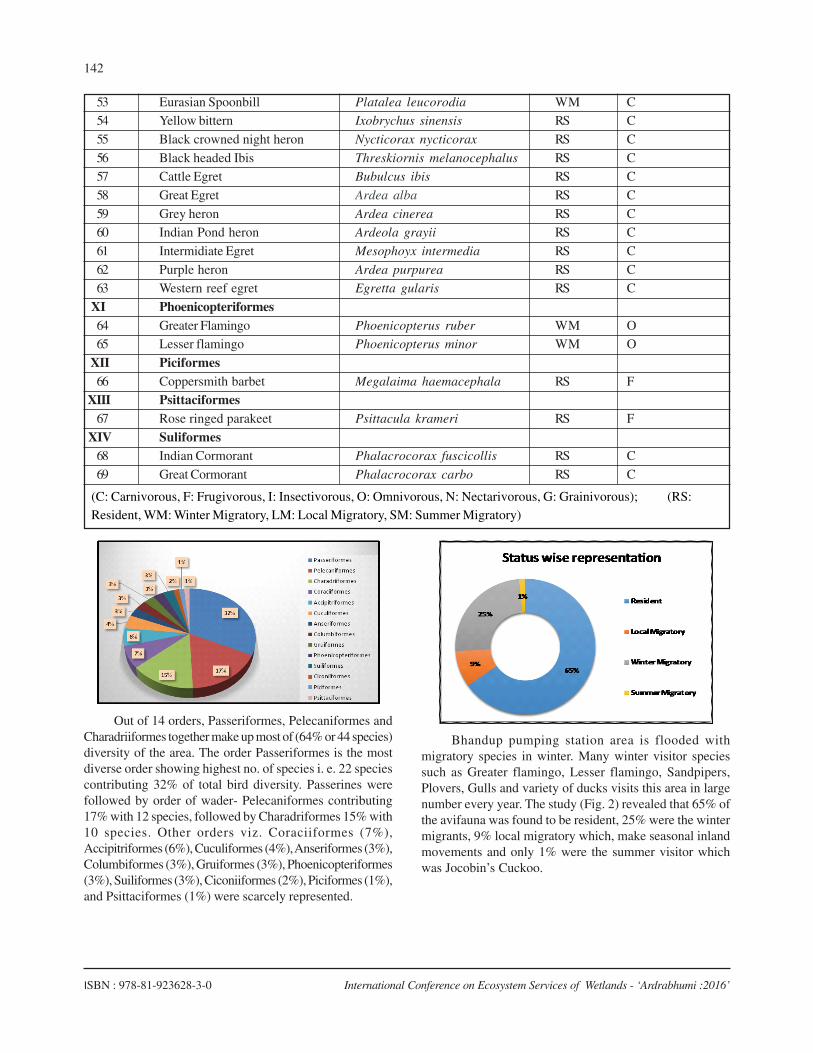
142
International Conference on Ecosystem Services of Wetlands - ‘Ardrabhumi :2016’ISBN : 978-81-923628-3-0
53 Eurasian Spoonbill Platalea leucorodia WM C54 Yellow bittern Ixobrychus sinensis RS C
55 Black crowned night heron Nycticorax nycticorax RS C
56 Black headed Ibis Threskiornis melanocephalus RS C57 Cattle Egret Bubulcus ibis RS C
58 Great Egret Ardea alba RS C
59 Grey heron Ardea cinerea RS C60 Indian Pond heron Ardeola grayii RS C
61 Intermidiate Egret Mesophoyx intermedia RS C
62 Purple heron Ardea purpurea RS C63 Western reef egret Egretta gularis RS C
XI Phoenicopteriformes64 Greater Flamingo Phoenicopterus ruber WM O65 Lesser flamingo Phoenicopterus minor WM O
XII Piciformes66 Coppersmith barbet Megalaima haemacephala RS F
XIII Psittaciformes67 Rose ringed parakeet Psittacula krameri RS F
XIV Suliformes68 Indian Cormorant Phalacrocorax fuscicollis RS C
69 Great Cormorant Phalacrocorax carbo RS C
(C: Carnivorous, F: Frugivorous, I: Insectivorous, O: Omnivorous, N: Nectarivorous, G: Grainivorous); (RS:Resident, WM: Winter Migratory, LM: Local Migratory, SM: Summer Migratory)
Out of 14 orders, Passeriformes, Pelecaniformes andCharadriiformes together make up most of (64% or 44 species)diversity of the area. The order Passeriformes is the mostdiverse order showing highest no. of species i. e. 22 speciescontributing 32% of total bird diversity. Passerines werefollowed by order of wader- Pelecaniformes contributing17% with 12 species, followed by Charadriformes 15% with10 species. Other orders viz. Coraciiformes (7%),Accipitriformes (6%), Cuculiformes (4%), Anseriformes (3%),Columbiformes (3%), Gruiformes (3%), Phoenicopteriformes(3%), Suiliformes (3%), Ciconiiformes (2%), Piciformes (1%),and Psittaciformes (1%) were scarcely represented.
Bhandup pumping station area is flooded withmigratory species in winter. Many winter visitor speciessuch as Greater flamingo, Lesser flamingo, Sandpipers,Plovers, Gulls and variety of ducks visits this area in largenumber every year. The study (Fig. 2) revealed that 65% ofthe avifauna was found to be resident, 25% were the wintermigrants, 9% local migratory which, make seasonal inlandmovements and only 1% were the summer visitor whichwas Jocobin’s Cuckoo.

143
International Conference on Ecosystem Services of Wetlands - ‘Ardrabhumi :2016’ISBN : 978-81-923628-3-0
The feeding habit of the bird was also recorded andwere classified into bird species depending on their diettype. The data (Fig. 3) showed that almost half (i.e. 49%percent) of the species are carnivorous followed byOmnivorous and Insectivorous species each with 19%suggesting presence of rich prey base at the study site. Thediversity of Granivorous (7%) and Frugivorous (6%) speciesduring the study period was observed to be relatively less.Few preliminary observations revealed that very few fruitingplant species such as Lantana camara, Zizyphus spp etc.,were present at the site. A detailed study of floral diversityat the Bhandup Pumping Station is thus essential.
Conclusion:
In spite of all anthropogenic threats it possess,Bhandup pumping station area serves as an ideal ecosystemfor aquatic and migratory birds. Dense mangrove coverprovides protection and safe habitat for breeding as well asfeeding. This could be the major reason for the remarkablediversity in such a human dominated landscape.
Another reason, especially important to waders is themudflats; which form excellent feeding ground forCarnivorous, Omnivorous and Insectivorous species.Feeding conditions and structure of land surface are twomain factors that determine the distribution of number ofbirds (Tryjanowski P. et al, 2005). Thus, habitat andabundance of food resources could be the factors whichattract avifauna particularly waders (Fig. 4).
Bhandup Pumping station has immense importancefrom tourism and conservation point of view consideringits location. Being situated at the heart of Financial Capitalof the country, it is facing many anthropogenic pressuressuch as Pollution, Habitat destruction, over exploitation etc.These factors affect significantly the diversity of not onlybirds but other flora and fauna also. Strict legislativeprotection, active participation of locals and continuouslong term biodiversity monitoring programme are needed inorder to conserve such ecosystems.
References:
� Ali S 2012The Book of Indian Birds 14th (Edn) BombayNat. His. Soc. Oxford University Press Mumbai.
� Anonymous (2009). Report of Convention on BiologicalDiversity, Ministry of Environment and Forest.
� Anonymous (2009). NWCP Guidelines for Conservationand Management of Wetlands in India, Ministry ofEnvironment and Forest.
� BirdLife International (2008). A range of threats drivesdeclines in bird populations.
� Grimmett, R., Inskipp, C, Inskipp. T. (2013). Birds of theIndian Subcontinent. Oxford University Press, NewDelhi.
� Khushwaha S. Kulkarni N., (2013) Bird Diversity atBetawde, Thane, A natural Habitat, Proc. NationalConference on Biodiversity: Status and Challenges inConservation FAVEO: 2013, pp. 39-46.
� Pawar, P. R. (2011). Species diversity of birds inmangroves of Uran (Raigad), Navi Mumbai,Maharashtra, West coast of India. Journal ofExperimental Sciences, 2 (10):73-77.
� Pramod, P. R., J. R. Daniels, N. V. Joshi, & M. Gadgil,(1997). Evaluating the bird communities of the WesternGhats to plan for biodiversity friendly development.Current Science, 73(2), 156 - 162.
� Rapoport, E.H. (1993). The process of plant colonizationin small settlements and large cities. In: Mac Donell,M.J. and Pickett, S. (Eds), Humans as components ofecosystems. Springer–Verlag, New York, 190–207
� Singh U. and Ambavane P., (2013). Avifauna of Thakurli,District Thane. Proc. National Conference onBiodiversity: Status and Challenges in ConservationFAVEO: 2013, pp. 47-54.
� Sekercioglu, C.H., Primack, R.B. and Wormworth, J.2012. The effects of climate change on tropical birds.Biological Conservation 148: 1–18.
� Tryjanowski P, Jerzak L, Radkiewicz J (2005). Effect ofwater level and livestock on the productivity and numbersof breeding White Stork. Waterbirds 28: 378–382.

144
International Conference on Ecosystem Services of Wetlands - ‘Ardrabhumi :2016’ISBN : 978-81-923628-3-0
Common Sandipper Indian Spotbilled Duck Great Egret
Grey-tailed StarlingGreater Flamingo

145
International Conference on Ecosystem Services of Wetlands - ‘Ardrabhumi :2016’ISBN : 978-81-923628-3-0
Mangrove Diversity of Uran, Navi Mumbai, West Coast of India
Aamod N. ThakkarVeer Wajekar Arts., Science and Commerce College, Mahalan Vibhag, Phunde, Uran, Dist. Raigad.
Abstract: Creeks are characterized by muddy soils containing low oxygen within. The plants growing in this area are calledmangroves and mangrove associates. These plants play an important role in providing shelter and breeding place for manyorganisms and protection from flood, erosion etc. Diversity of mangroves was studied and was recorded during January 2014to December 2015. The mangroves recorded were nine species of six genera and four families and mangrove associates wererepresented by fourteen species belonging to eleven genera and seven families in the study area. The productive habitat of Urancoast supports rich mangrove diversity. The data presented in this paper suggest that at present habitat of Uran coast is notunder pollution stress. But the galloping development and rapid industrialization and urbanization may put pressure onecological conditions of Uran coast and it needs continuous monitoring.
Key words: Diversity, Mangrove, Wetland, Uran.
Introduction:
The mangrove cover of India is approximately 4827Sq. Km. It is only 2.66% of the total world mangrove cover.Out of this nearly 77% is on the east coast whereas theremaining one is on the west coast (Pania, 2002). Mangrovesare the woody plants growing at the interface between landand sea in tropical and sub tropical latitudes i. e. especiallyin the regions of creeks and estuaries. These plants and theassociated microbes, fungi, plants and animals constitutethe mangrove forest community (Kulkarni, 2002). Mangrovehabitats harbor much of the world’s tropical biodiversityand 50 % of the world’s mangrove forest has been lost as aresult of clearing and alteration of coastlines. (Duke, 1992).With continuous degradation and destruction of mangroves,there is a critical need to understand biodiversity of themangrove ecosystems (Vannucci, 2002). Mangrovevegetation provides a complete niche for the resident aswell as passage migrant birds for feeding, roosting andbreeding (Oswin, 2002). Biodiversity and communitystructures are now recognized to be important determinantsof ecosystem functioning. In this regard, the marineecosystem has been studied to a much lesser extentcompared to the terrestrial (Raghukumar & Anil, 2003).
The value and importance of Mangroves has goneunnoticed for many years. Mangrove ecosystems arethreatened all over the world. Habitat destruction humaninterference, pollution, heavy industrialization andurbanization are the main causes of decreasing the numberof mangrove species (Mehta and Vaidya, 2015). But the mostimportant is our negligence, disconcern and lack of will.Hence there is urgent need to create awareness aboutmangroves and their conservation.
Materials and Method:
Study Area:
Geographically, Uran is located opposite to Colaba
along the eastern shore of Mumbai harbour. On the westside, Uran is encircled by Arabian Sea. Sheva creek’ (Lat.180 50’ 20" N and Long. 720 57’ 5" E) encircles Uran fromnorth side and is continuous with the Panvel creek andThane creek. Dharamtar creek covers Uran from south sideand is continuous with the Karanja creek (Lat.180 50' 15" Nand Long. 720 57' 15" E) and Pen – Khopoli creek. Bothcreeks have rocky shore towards the seaward side whereasremaining part of the creeks is marshy and have moderatecover of mangroves with mud flats.
An international port called ‘Jawaharlal Nehru PortTrust (JNPT)’ was established in 1989 near the Sheva creekbiggest container handling port in India, Nhava-SevaInternational Container Terminal (NSICT), Container FreightStations (CFS) and all allied port related business etc.resulted in increased hauling operations in the creek. Inaddition to this onset of industries like Oil and Natural GasCommission (ONGC), MSEB - Gas Turbine Power Station,Bharat Petroleum plant, Container Freight Stations (CFS),Navi Mumbai SEZ, etc., the area of Uran creek became theground for hectic maritime activities. Destruction ofmangroves and land filling on the coasts of Uran, destroyingthe wetlands is going on. These activities have direct stresson coastal environment of Uran. Hence present study hasbeen undertaken.
Biodiversity and community structures are nowrecognized to be important determinants of ecosystemfunctioning. In this regard, the marine ecosystem has beenstudied to a much lesser extent compared to the terrestrial(Raghukumar & Anil, 2003). Uran coast was surveyed for aperiod of one year for study of diversity of mangroves andwas recorded during January 2014 to December 2015. Scientificnames of mangroves as per Naskar and Mandal (1999).

146
International Conference on Ecosystem Services of Wetlands - ‘Ardrabhumi :2016’ISBN : 978-81-923628-3-0
Results:
Table 1: Family- wise list of mangroves and mangroveassociates recorded during present study are as follows:
True Mangroves
Family Rhizophoraceae: Rhizophoraapiculata Rhizophoramucronata Bruguieragymnorrhiza Ceriops tagal
Family Avicenniaceae: Avicennia alba AvicenniaofficinallisAvicennia marina
Family Euphorbiacea: Exoceracia agallocha
Family Acanthaceae: Acanthus illicifolius
Mangrove associates:
Family Verbenaceae: Premna carymbosaCleodendrum inerme
Family Convolvulaceae Ipomoea carnea Ipomoeapes-capre Ipomoeastolonifera
Family Cyperaceae: Scripus littoralisFimbristylis ferruginea
Family Aizoaceae:Family Sessuvium portulacastrumRhamnaceae: Zizihpus zizihpus Ziziphus
mauritiana
Family Fabaceae: Derris trifoliata Erythrinaindica Caesalpinia bonduc
Family Salvodoraceae: Salvodora persica
Discussion:
During present study nine species of mangrovesbelonging to six genera and four families were recorded.The supra littoral zone of the entire coastal stretch of Uranhas moderate cover of mangroves. Mangrove associateswere represented by fourteen species belonging to elevengenera and seven families in the study area. Though thevariety of mangrove species found at Uran is less it hasthick cover along the coastal belt of Uran providing groundto support very rich mangrove community. Mangroves andwetlands of Uran are suitable for many resident, localmigrants and winter migrant birds from various parts of theworld.
Dumping of industrial effluents, untreated sewage andunchecked encroachment along the coastal line haveresulted in deterioration of water quality and incidences ofindustrial pollution are common in creeks of Mumbai andNavi Mumbai (Pawar, 2012).
Ever since its inception on May 26, 1989, JawaharlalNehru Port (JNP) rose up from paddy fields, salt-pans andmarshlands axing the mangroves of Uran. JN Port is thebiggest container handling port in India, handling around44% of the country’s containerized cargo, crossing thehistoric landmark of 4 million TEUs in container throughputconsecutively for the last five years. Having set for itself along-term goal of achieving 10 million TEUs by the year2020-21, through addition of two more Terminals, viz. the330M Stand-alone Container Terminals (DP World) and the4th Container Terminal (Port of Singapore Authority) will stillincrease in heavy maritime activities in and around Uran(www.jnpt.gov.in).
All these development of J N Port is going on byreclaiming coastal belt of Uran. In addition Navi MumbaiSEZ at Dronagiri Node is also developing very fast by landfilling. Dronagiri Township is growing fastly and Sewri-Nhava- Shewa link road, Uran- Belapur Railway all theseinfrastructural developments are going on the cost of coastalhabitat, slaughtering the mangroves and killing the wetlandsof Uran. In order to ensure sustainable development, one ofthe key preposition is prioritize Conservation of wetlandsand their scientific restoration by systematicallyunderstanding the mechanism involved in the evolution anddegradation of wetland ecology (Sharma, 2013).
Conclusion:
At present, Uran coast is under rapid industrializationand urbanization, dumping of industrial effluents, untreatedsewage, slaughtering of mangroves and domestic wastehave resulted in deterioration of coastal habitat of Uran.Though these developments are essential they should besustainable and loss of habitats should be restored. Whatis needed is the collective effort and a strong will from allstakeholders to save the mangroves and wetlands. Becauseof viviparous habit mangrove vegetation can grow veryfast and cover the area. For conserving wetlands is to justdig the trenches in the reclaimed land and permit flow ofmarine water. To maintain the glory of Uran for shell fishfishery and paradise for bird watchers there is urgent needof conserving the mangroves from Uran.
References:
Duke, N. C. (1992). Mangrove floristic and biogeography. InRobertson A. I. & Alongi D. M. (Eds.), Tropical mangroveecosystems, (American Geophysical Union, WashingtonDC), pp. 63-100
Kulkarni, V. (2002). Indian mangroves: Conservation Aspect.Proceedings of “The National Seminar on Creeks, Estuariesand Mangroves-Pollution and conservation” Nov 2002 Pp37-40.

147
International Conference on Ecosystem Services of Wetlands - ‘Ardrabhumi :2016’ISBN : 978-81-923628-3-0
Mehta, L. Vaidya, S. (2015). Changes in the diversity ofmangroves of Dasgaon, Dist. Raigad, Maharashtra.Proceedings of National Seminar Wetlands: Present Status,Ecology & Conservation Aug. 2015 pp. 84-90.
Naskar K. R.and Mandal R. (1999). Ecology and Biodiversityof Indian Mangroves Vol. I & II.
Oswin, S. D. (2002). Biodiversity and Ecology of the Gulf ofKachchh Mangroves, Gujarat, Proceedings of “The NationalSeminar on Creeks, Estuaries and Mangroves-Pollution andconservation” Nov 2002 Pp 78-83.
Pania, D. (2002). Restoration of Mangroves at Jamnagar,Proceedings of “The National Seminar on Creeks, Estuariesand Mangroves-Pollution and conservation” Nov 2002 pp.223-225.
Prabhakar R. Pawar. (2012) Molluscan diversity in mangroveecosystem of Uran (Raigad), Navi Mumbai, Maharashtra,West coast of India. Bull. Environ. Pharmacol. Life Sci.Vol.1 (6):55-59.
Raghukumar S. and Anil A. C. (2003). Marine biodiversityand ecosystem functioning a perspective. Curr. Sci. 84 (7):884-892.
Sharma Vivek. (2013). “Wetlands Importance Characteristicsand Conservation measyres”Aquatic Environment andToxicology- Pawan Kumar Bharti 1st Ed. 0213 pp 89-101.
Vannucci, M., (2002). Indo-west Pacific mangroves, InLacerda L. D. (Eds.) Mangrove Ecosystems (Springer, Berlin),pp. 122-215.

148
International Conference on Ecosystem Services of Wetlands - ‘Ardrabhumi :2016’ISBN : 978-81-923628-3-0
Spatio-temporal variation of physico-chemical parameters of water andsediments from Panvel Creek, Raigad, Maharashtra, India.
Rupali A. Zele1 and Poonam Kurve2
1SIES(Nerul) College of Arts, Science and Commerce2 VPM’s B. N. Bandodkar College of Science,Thane.
Abstract : The study reveals the environmental status of Panvel creek from Navi Mumbai region. This creek is originated fromBelapur and flows towards Kharghar, Taloja, Panvel and Ulwe. The Panvel creek has a beautiful lining of mangroves on bothside of the creek which provide sufficient ecological, economic and social benefits. The development activities carried out inthe city posing tremendous pressure on ecological services of wetlands and its interaction with the creek. The activities likewaste water discharge, sand dredging, encroachment and reclamation are threatening the most beautiful environment from thisregion which is a part of important planned major smart city in India i.e Navi Mumbai. The results of study clearly indicatesthe temporal and spatial variations of parameters over a period of time.
Key Words: Pollution, Panvel Creek, Mangrove, Navi Mumbai
Introduction
An estuary is a semi-enclosed water body with variablesalinity intermediate between salt and fresh water. Estuaryincludes river mouths, coastal bays, tidal marshes and waterbodies behind beaches. Estuaries are considered one amongthe most naturally fertile waters in the world. The wetlandsare areas of mangroves, marsh, fen, peatland or water,whether natural or artificial, permanent or temporary, withwater that is static or flowing, fresh, brackish or salt, includingareas of marine water. Ecological interactions of the wetlandand estuary are always found to be positive for maintainingthe stability of ecosystem.Wetlands connected with saltwater ecosystem are known as estuarine wetlands thatincludes tidal marshes, salt marshes, mangrove swamps,river deltas and mudflats.
The ecological services which are provided bywetlands are “the sum of the biological, physical andchemical components of the wetland ecosystem, and theirinteractions, which maintain the wetland and its products,functions and attributes” (Ramsar COP7, 1999).
This includes services such as protection of floods,drought, land degradation and disease; supporting servicessuch as soil formation and nutrient cycling; pollutantstrapping and cultural services such as recreational, spiritual,religious, and other nonmaterial benefits (Behera et al, 2014).
Estuarine wetlands such as mangroves are vulnerableto various threats from dredging, water pollution, wastedisposal, overfishing, climate change, encroachment,unsustainable recreational activities which results intodisturbance of ecological services of the environment(Kumar et al, 2008). Mangroves protect coastlines byabsorbing the force of storms and provide sufficientnutrients to nurture marine life. Most of mangrove cover islost due to their conversion to agricultural farms, andincreasing pressure of urbanization near to coastal areas ofcountry. In coming years, coastal ecosystems such as
mangroves, estuaries, mud flats and sea grass beds arecoming under increasing threats due to severaldevelopmental activities.
Mangroves are forests of salt-tolerant trees, shrubsand grass that grow in the shallow tidal waters of estuariesand coastal areas in tropical regions. They require slowcurrents, no frost and plenty of fine sediment in which toset their roots. The mudflats are found to be rich in nutrientdue to decomposition of leaves and wood which provideshelter for sponges, worms, crustaceans, molluscs and algae,and other marine animals. Mangrove forest and coastalwetlands are also provides different ecological services suchas flood control, storm protection, shore stabilization andcontrol of soil erosion (Sathirathai.et al.,2001).
Therefore monitoring of such ecosystem is of utmostimportance and hence the present study was undertakenwhich involves study of physicochemical parameters ofwater gives much detail information about ecologicalconditions of the creek and associated ecosystems.
The parameters such as pH, Conductivity, Total solidsand Chloride shows remarkable variation in three regionssea, estuary and river. The same pattern of distribution ofparameters are shown in Bhitarkanika mangrove, Orissa(Chuhan et al, 2008) were studied.
Study
The study area
The study area is located (18°59’29.9"N 73°00’51.0"E)in Navi Mumbai and Panvel region. The creek originatesfrom Belapur and gets merged into 4 rivers from differentareas of Raigad District. It merges with Ulwe river in Uran,Kalundre river in Panvel, Taloje and Kasardiriver in Taloje,which further get merged with each other as Taloje river.The mangrove cover around the creek provides tremendousecological services.

149
International Conference on Ecosystem Services of Wetlands - ‘Ardrabhumi :2016’ISBN : 978-81-923628-3-0
This area supports ecological and economical servicessuch as pollution trap, nutrient cycling, fishing habitat andfisheries, sand mining and recreational activities respectively.The area is under the threat due to illegal sand dredging anddevelopmental activities. Other activities such as such aswaste water discharge from adjacent industrial area, illegalagricultural activities, and brick kiln industry are found tobe responsible for destruction of habitat. The city is gettingcommercial importance and will be getting status of megacity in near future. The city is characterised by qualityinfrastructure, hospitals, educational institutions, an IT park,exhibition centre, malls, big railway stations and mostsignificant upcoming project of Navi Mumbai InternationalAirport. Each one of these activity shows potential impacton the environment.
Most of Mangroves are found to be destructed dueseveral activities i.e brick kiln industry. The area used forfurnace and associated air pollution results into removal ofmangrove cover from study area. In brick kiln productiontop soil lose results into loss fertility which takes almost 25-30 years to regain its original value (Pariyar et al 2013).
These industrial, commercial and developmentalactivities are found to be responsible to change theecological status of the environment. The wetlands are foundto be destructed by reclamation for developmental activities.The patches of mangroves are found to be removed foragriculture and other economic activities.
Image 1: Map of study area
Material and methodology
The total seven sampling locations were consideredto indicate spatial distribution of parameters in the creek.The water samples were collected from respective locationin year 2008, 2011 and 2014.
Image 2: Sampling location
Sampling of water samples was carried out by randomgrab sampling method.The samples were stored usingstandard preservation techniques for further analysis.
The physico-chemical parameters were performedusing standard operating procedure for testing of waterwere pH, Conductivity, Temperature Dissolved Oxygen,Chloride, Total Hardness and Total Solids.

150
International Conference on Ecosystem Services of Wetlands - ‘Ardrabhumi :2016’ISBN : 978-81-923628-3-0
Table 1: Detail description of sampling location
Starting of the estuary used for fishing and shippingactivities
Sand dredging, fishing and shipping activities on theboth bank
Fishing and shipping and on dense growth of mangroves
Sand mining and transportation mangroves
Stream divided into 3arms one goes and meet to Ghadiriver in Panvel mangrove growth both the side of bank
Near to the Kharghar station and sample B has growth ofmangroves
Bricks kiln one side and mangroves on other side ofcreek
Description of area
1
2
3
4
5
6
7
Mouth of the creek
UranBelepur Railway bridge
Diwale Village
RetiBander
3 stream together
Near Kharghar Station
Sion Panvel railway bridge
18.998545, 73.028526
19.002226, 73.031922
19.007037, 73.041324
19.018206, 73.050002
19.018604, 73.058747
19.022846, 73.067226
19.023938, 73.072407
Sample Name of sampling location Geographical location
Table 2 :Physico-chemical analysis of samples of the cree
Water samples
pH Temp Conductivity Dissolved Oxygen Chloride Total Hardness Total Solids2008
Sample 1 7.3 30 3.36 3.5 13916 1708 9350Sample 2 7.3 31 3.2 2.6 13733 1688 5876Sample 3 7.3 30 3.04 3.4 12673 1668 9087Sample 4 7.1 29 2.65 3.7 11182 1708 5048Sample 5 7.2 30 2.75 3.5 10568 1711 4995Sample 6 7.1 30 2.71 2.3 11882 1283 3542Sample 7 7.2 29 2.51 3.2 10472 1495 4791
2011Sample 1 7.5 29 3.08 3.7 12780 1580 24400Sample 2 7.6 30 2.84 2.7 12567 1530 24200Sample 3 7.5 31 2.52 3.5 13135 1255 23600Sample 4 7.6 31 3.05 3.1 14910 1100 19600Sample 5 7.4 31 2.96 3.8 11431 1099 19200Sample 6 7.6 30 2.35 2.9 10630 1400 22000Sample 7 7.5 29 2.74 3.3 12638 1145 19000
2014Sample 1 7.2 25 3.21 6.09 25 1450 22200Sample 2 7.2 26 3.11 6.3 26 500 23000Sample 3 7.2 25 2.96 6.2 25 750 21500Sample 4 7.2 24 2.75 5.6 24 900 20600Sample 5 7.3 26 3.56 4.87 26 1050 19800Sample 6 7.1 25 3.17 4.46 25 1600 18800Sample 7 7.3 26 3.18 3.63 26 1250 17600

151
International Conference on Ecosystem Services of Wetlands - ‘Ardrabhumi :2016’ISBN : 978-81-923628-3-0
Graphs of water samples
6.8
7
7.2
7.4
7.6
7.8
1 2 3 4 5 6 7
Sampling location
pH
2008
2011
20140
10
20
30
40
1 2 3 4 5 6 7
Sampling location
Temperature OC
2008
2011
2014
0
1
2
3
4
1 2 3 4 5 6 7
Sampling location
Conductivity mS
2008
2011
2014
0
5000
10000
15000
20000
25000
1 2 3 4 5 6 7
Sampling location
Chloride mg/li
2008
2011
2014
0
500
1000
1500
2000
1 2 3 4 5 6 7
Sampling location
Total hardness mg/lit
2008
2011
2014
0
2
4
6
8
1 2 3 4 5 6 7
Sampling location
Dissolved Oxygen mg/lit
2008
2011
2014
0
10000
20000
30000
1 2 3 4 5 6 7
Sampling location
Total solids
2008
2011
2014
Results and discussion
All the physico-chemical parameters studied showednoticeable temporal as well as spatialvariations, which maybe attributed to the local climatic conditions and exchangemechanism between fresh water andthe sea. The values of
the results varies with respect location of the sample.
The pH and Electrical conductivity differs significantlyalong the gradient of the sea and estuarine region which isprimarily due to mixing of sea water with fresh water. The saltwater from sea mixes with fresh water(Chauhan et al,2008).

152
International Conference on Ecosystem Services of Wetlands - ‘Ardrabhumi :2016’ISBN : 978-81-923628-3-0
The average pH value is found to be near neutral in all yearsand no specific pattern of was seen in spatial distribution.
The temperature of water samples is found to be near29OC in all years. The conductivity of the samples is foundto be high in year 2014, which might be because tidalinfluence was higher at time of sampling. So mixing of seawater results into increased in the conductance of thesamples. As more the ions that are present, the higher theconductivity of water.
The Dissolved Oxygen of water samples collected inyear 2008 and 2011 is near 3.20 mg/lit, whereas it is higher inthe year 2014. The higher value of Dissolved Oxygen in2014 is due to high mixing rate with greater tidal influence.There is a correlation between lowertemperature value anddissolved oxygen saturation level. (Anitha et al, 2013). Thesample collection was done during high tide in the morningtime, which might be reason of low temperature and highoxygen level in the water The same information is providedin the Estuary Monitoring Manual published by EPA.
The dissolved oxygen level is controlled by mixing atthe air-water interface, temperature and salinity, the level ofphotosynthesis (which produces oxygen), anddecomposition of organic material (which depletes oxygen).Generally, value of oxygen is greater than 4 mg/l indicateadequate supply oxygen to support marine species growthand activity, while levels from 1-3 mg/l indicate hypoxicconditions, which are detrimental to marine biota. Dissolvedoxygen below 1 mg/l indicate anoxia, a condition in whichno life that requires oxygen can be supported. Decreased inthe oxygen level indicates the pollution from organic wasteand which deceases the productivity of an ecosystem.
The concentration of chloride is higher at mouth ofthe estuary and found to be reduced towards creek in year2008.This indicate the typical character of estuarine waterwhere salt contents decreases as sea water get mixed withfresh water (Nayak et al 2010). But this trend wasfound tobe changed in year 2011 and 2014. The concentration ofchloride is found to be varying, and no specific pattern isbeen observed.This might be because of change in landuse pattern of the wetlands. Mangroves are removed forthe development of infrastructure, mining and alsoagricultural activities in last few years. The increase in thechloride content may be associated with surface soil erosionand industrial, agricultural or urban runoff form saltdeposited in area (Kotaski 2006).
The higher concentration of Chloride in year 2014 canbe correlated with tidal influence and also for the samesamples conductivity also found to be high.
The solids have connectivity with other parameterssuch as conductivity, chloride and as well as dissolved
oxygen. The solids contents can be increased due to soilerosion, waste discharge, and urban runoff and dredging.The solids were found to be high at mouth of the creek andgradually decreased towards river in all years.
Conclusion
The spatial and temporal variations in the study areadepicted changes in the environmental condition of the creekin last few years. The main cause of these environmentalchanges might be due to development of Navi Mumbairegion, sewage water discharge and illegal dumping of waste.The upcoming project of Navi Mumbai International Airportand Navi Mumbai Metro would be further enhancingopportunities for development in the area leading todestruction of mangrove ecosystem. So as to maintain theenvironmental stability and provide maximum ecologicalservices proper precaution should be taken. Integratedmanagement strategies can be implemented for properrestoration and management of creek, mangroves andwetland for sustainable development of Navi Mumbairegion.
References
Anitha .G1, Sugirtha P. Kumar, November 2013,Physicochemical characteristics of water and sediment inThengapattanam estuary, Southwest coastal zone,Tamilnadu, India, international Journal of EnvironmentalSciences ,Volume 4, No 3, 2013 Research article ISSN 0976 –4402.
Behera B. C., R.R.Mishra, J.K. Patra, S.K. Dutta, H.N Thatoi,2014, Physico Chemical Properties of Water SampleCollected From Mangrove Ecosystem of Mahanadi RiverDelta, Odisha, India, American Journal of Marine Science,2014, Vol. 2, No. 1, 19-24 Available online at http://pubs.sciepub.com/marine/2/1/3 © Science and EducationPublishing DOI:10.12691/marine-2-1-3
Chaudhari Sheetal, Madhuri Pejaver, 2010, Conservation ofmangroves with respect to their Potentiality of organiccarbon accumulation in Sediments of Thane Creek,Maharashtra, India. Lake 2010: Wetlands, Biodiversity andClimate Change 22nd-24th December 2010.
Chauhan Rita, Ramnathan A.L , June 2008, Evaluation ofwater quality of Bhitarkanika mangrove system, Orrisa, eastcoast of India, Indian Journal of Marine Sciences, Volume37(2), pp 153-158.
Kumar S. V. 2008, Conservation of mangroves and wetlandsin Thane creek and Ulhas river estuary, India. Proceeding ofTAAL the 12th world lake conference 2008 1635-1642

153
International Conference on Ecosystem Services of Wetlands - ‘Ardrabhumi :2016’ISBN : 978-81-923628-3-0
Nayak S, Nahak G Sahu R, 2010, Physical parameters ofChilka lake water after opening new mouth to bay of Bengal,Orissa, India, Continental J. Environmental Sciences 4: 57-65, 2010, ISSN: 2141 - 4084 add contents.
NATIONAL WETLAND ATLAS, Maharashtra, Sponsoredby Ministry of Environment and Forests, Government ofIndia As a part of the project on National Wetland Inventoryand Assessment (NWIA) May 2010, Space ApplicationsCentre (ISRO), Ahmedabad and Maharashtra RemoteSensing Applications Centre (MRSAC), Nagpur
Pariyar S. K. Tapash Das, Tanima Ferdous. May 2013,Environment And Health Impact For Brick Kilns InKathmandu Valley, International Journal of Scientific andTechnology Research, Volume 2, Issue 5, ISSN 2277-8616184 IJSTR©2013 www.ijstr.org
Sathirathai Suthawan, Barbier Edward, 2001. Valuingmangrove conservation in Southern Thailand, WesternEconomic Association international, Volume 19, No 2, 109-122
USEPA- EMPACT, Developing and Implementing anEstuarine Water Quality Monitoring, Assessment, andOutreach Program

154
International Conference on Ecosystem Services of Wetlands - ‘Ardrabhumi :2016’ISBN : 978-81-923628-3-0
Use of Paramoecium caudatumas a test model in the studiesof heavy metal pollution
V. S. Narayane, H. A. Padwal and N. B. KambleDepartment of Zoology, Birla college of Arts, Science and commerce, Kalyan, M.S. India
Abstract:- A pure culture of paramecium was established using wheat extract for enrichment. The compounds used as a sourceof heavy metals werecommonly available laboratory chemicals of AR grade. CuSO
4 and ZnSO
4 were the two compounds used
in the experiment as heavy metal containing chemicals.In the study, the LC50
values indicating the concentration of substancesinhibiting the population of paramecium cells by 50% were used, which indicated the concentration of substance killing halfthe population of organisms.Different concentrations of these chemicals were examined for their effects for fixed duration, andit was found that both the chemicals are effective in a dose dependent manner and LC
50 concentration was found to be effective
at 0.05mg/100ml at the end of the experiment.Microscopic studies of the affected organisms revealed some interesting resultswhich included hypertrophy of the cells and enlarged contractile vacuoles which happened probably due to the osmoticimbalance brought about by the two heavy metals used in the experiment.Our data presented here may be useful reference forassessing the impact of water pollution on aquatic micro-organisms and food chain. Besides it may also help in establishingparamecium as an organism in laboratory research.
Key words: Paramecium caudatumas, Heavy metal pollution
Introduction: -
Aquatic environment is constantly subject to abusedue to the pollution caused by various pollutants of organicand inorganic nature.
Effluents discharged from pharmaceutical, fertilizer andpaint industries contain heavy metals in large amount(Miyoshi 2003). These heavy metals affect all the aquaticorganisms adversely which ultimately has direct influenceon the aquatic food chain.
Many aquatic plants, phytoplanktons andzooplanktons are used as indicator species to understandthe effects of such pollutants on the aquatic life. Especiallythe protozoan cells are often used as bio-indicators ofchemical pollutants in aquatic ecosystem (Miyoshi 2003).Evidence suggests that micro-organisms are more sensitiveto heavy metal stress than plants and animals exposed tothe same concentration. Ciliates in particular can be studiedwith respect to ciliate mobility test, cell growth rate,biochemical markers and behavioral changes under theheavy metal stress (Miyoshi 2003). Paramecium is one ofthe ciliate, important and convenient organisms to evaluatethe environmental pollution (Singh et al. 2013).Protozoan’splay an important role in soil and aquaticecosystem as regulators of the bacterial and fungalpopulations (Uma et al. 2008). Heavy metals are toxic tomost of the micro-organisms even at moderateconcentrations. Therefore it is evident that changes in theprotozoan community due to any and slightestenvironmental stress may affect the whole food web.
Thus use of paramecium seems to be a reasonablemethod to study effects of heavy metals.
Materials and Methods:-
Paramoecium caudatum selected as test species forpresent studies were collected from freshwater pondartificially constructed in the campus of Birla College. Theorganisms were cultured in sterilized wheat extract mediumat room temperature in the laboratory to obtain a pure linestock culture (Rouabhi et al. 2008). The log phase cultureswere used for the present studies and then used for thefurther studies.
For sub-culturing the organisms the culture mediumwas diluted with distilled water. Sub-culturing was doneafter every 3 days to facilitate better gaseous exchange.Organisms were first quantified for each ml of the sub-cultureusing random sampling method. The culture mediumsolution was mixed with CuSO
4 and ZnSO
4 separately in 1:1
ratio using three different concentrations such as 0.5mg/ml,0.5mg/10ml, and 0.5mg/100ml.
Results:-
Observations of CuSO4 at the end of 1 hour:-
Table 1:-
Concentration % Death % Live
0.5mg/ml 100 % 0 %
0.5mg/10ml 90 % 10 %0.05mg/100ml 50 % 50 %
Observations of ZnSO4 at the end of 1 hour:-
Table 2:-
Concentration % Death % Live
0.5mg/ml 100 % 0 %0.5mg/10ml 90 % 10 %
0.05mg/100ml 50 % 50 %

155
International Conference on Ecosystem Services of Wetlands - ‘Ardrabhumi :2016’ISBN : 978-81-923628-3-0
Figure 1. Figure 3.Figure 2.
Figure 4. Figure 6.Figure 5.
Figure 7. Figure 9.Figure 8.
Control organisms (figure 1,2,3)
Experimental treated organisms (figure 4,5,6)
Experimental treated organisms (figure 7,8,9)
From the Table 1 and 2 it became clear that CuSO4 as
well as ZnSO4 causes acute toxicity to the organisms at
0.5mg/ml and 0.5mg/10ml concentration whereas LC50
after1 hour of exposure was observed at 0.05mg/100ml ofconcentration in both cases.
Hence, for the study of cytotoxic effects of heavymetals on test organisms the concentration of 0.05mg/100mlwas selected for the both the heavy metals and the testorganisms were given the exposure.
At the end of 1 hour cells were examined undermicroscope and it was found that the organisms treatedwith CuSO
4 remained slightly smaller than those treated with
ZnSO4. Although organisms of both the treatment regime
showed distinct hypertrophy compare to their controlcounterpart (figure 1, 4 and 7). After the treatment of ZnSO
4
and CuSO4 it was found that some cells have undergone
lysis (figure 5 and 8) and have acquired grayish black color.In some of the cells granular inclusions in the cytoplasm(figure 6 and 9). Large vacuoles were seen close to the oralsurface of the organisms (figure 4 and 7). Besides theserecordable observations certain other observations such
as affected mobility of the cell, swirling movement at thetime of morbidity were also seen.
Discussions:-
Indiscriminate discharge of industrial effluents intothe natural water bodies pesticides used in paddy fields,fertilizers, etc. are the general sources of heavy metalspollution in aquatic ecosystem. In recent years, increasingawareness of the environmental impact of heavy metal hasprompted a demand for the purification of industrialwastewater prior to discharge into natural water (Sherifet al. 2008, Rehman and Shakoori 2008). It has been earlierreported that organisms shows mitochondrial degeneration,cytoplasmic vacuolation, accumulation of membranousdebris and also formation of auto-phagosomes (Singh et al.2013). The heavy metals in the present study havesignificantly hampered the growth of the ciliate cells. Theacute effects such as mortality, immobilization, reduce cellcount, change in the body size and shape are reported earlier(Rouabhi et al. 2008, Uma et al. 2008).
In some of the cells only macronucleus and contractile

156
International Conference on Ecosystem Services of Wetlands - ‘Ardrabhumi :2016’ISBN : 978-81-923628-3-0
vacuoles were visible at LC50
concentration. Spheroid shape,swollen body shape and shorten body length throughanterior-posterior axes was noticed. The correct size shapeand basic morphology of all ciliates depends on the correctstructure and function of the cell membrane which werebeing violated after adding these heavy metal compounds.The complete lysis of cells at a particular concentration mightbe due to the natural response to adverse environment(Amanchi and Hussain 2010). Movement is the vital sign oflife. Abnormal behaviors such as restlessness, sudden andquick movements were observed. Loss of movementcoordination (swirling movement) were observed at 0.05 mg/100 ml concentration in case of both heavy metals.
Conclusion:
In conclusion protozoan ciliates are good laboratorymodels for use as whole cell biosensors to detect thepresence and to determine the bio-available concentrationof certain toxic pollutants like heavy metals.
It can also be concluded from our results that theseorganisms are extremely sensitive to heavy metal toxicityand both heavy metals under the studies affect the cytologyof the organisms to the similar extent.
References:
1. Amanchi, R.N.and M.M.Hussain, 2010.cytoxicityassessment of monocrotophos in Parameciumcaudatumand Oxytricha fallax.Journalof EnvironmentalBiology.31(5):603-607.
2. Dileep Kumar Singh, Sashi Bala,Tabrez Ahmad andA.K.Sharma 2013.cytotoxic assessment of some heavymetals on fresh water,ciliated protozoa, parameciumcaudatum.J.Adv.zoo.2013:34(1):24-27.
3. El-Sherif,I.Y.,A.ashaway and S.badar,2008. Biosorptionof cadmium and nickel by nile water algae.J.ApplSci.Res.,4:391-396.
4. N o r i k z u M i y o s h i . aTo m o n o r i k a w a n o , M i h oThanaka,Takashi Kadono,Toshikazu kosaka,ManabuKunimoto, Tado Takahashi,and HiroshiHosoya.J.Hel.sci,49(6)429-435(2003),Use OfParamecium Species In Bioassay For EnvironmentalRisk Management : Determination Of Lc
50 Values For
Water Pollution.
5. Rehman.A.,F.R.shakoori,2008.heavy metal uptake byEplotes mutabilis and its possible use in bioremediationof industrial waste water. Bull. environ. contain.toxicol.83:130-135.
6. Rouabhi, R. H. Djebar-Berrebbah and M. R. Djebar,2008. Growth,chitin and Respiratory Metabolism ofTetrahymena pyriformis Exposed to the insecticideNovaluron.American-Eurassian J. Agric. Environ.sci., 3:873-881.
7. Uma,S.,J.P.Kelley and S.K.Rajsekaran,2008.Aninvestigation of the values of the tetrahymenapyriformis as a test organism for assessing the acutetoxicity of anti depressants. Biomed Res., 19:37-40.

157
International Conference on Ecosystem Services of Wetlands - ‘Ardrabhumi :2016’ISBN : 978-81-923628-3-0
Moss Diversity Around Wetland Areas of Lonavala and Their Role inConservation of Wetland Ecosystems
Gauri SomanDepartment of Botany
Maharshi Dayanand College, Parel,Mumbai-400012E-mail: [email protected]
Abstract : Mosses are highly developed groups of bryophytes having a unique position between lower cryptogams andvascular plants prefering marshy swamps or wetland habitats for their abundant growth. They play an important role inconservation of buffer zones or edges between wetland and forest ecosystems habitats. Lonavala is a beautiful hill station inthe Western Sahayadri ranges about 102 km from Mumbai. It is surrounded by hills, valleys,wetlands and dense green forest.Numerous species of mosses occur in abundance in these areas.The present paper highlights diver:sity of mosses growing inwetland areas around Lonavala, with their ecological habitats and growth forms.
Keywords:Mosses, Diversity, Wetlands, Ecosystems, Lonavala.
Introduction:
Mosses are highly developed groups of bryophyteshaving a unique position between lower cryptogams andvascular plants prefering marshy swamps or wetland habitatsfor their abundant growth (Chopra 1975).
The present paper highlights diversity of mossesgrowing in wetland areas around dense forest of Lonavala,their ecological habitats and growth forms. The abundanceof mosses in any region reveals highly unpollutedenvironment and is indicator of healthy forest conditionsand they play a key role in wetland functioning (Dixon 1909).
Materials and Method :
Area under study- Lonavala is a beautiful hill stationin the Western Sahayadri ranges about 102 km from Mumbai.It is surrounded by hills, valleys,wetlands and dense greenforest. Mosses grow their abundantly.
The mosses collected are from marshy wetlandsadmist the Valvandam and Bhushi dam, extending up to Ryewood Park on one side and Lonavala Lake on otherside.Themosses collected were identified, dried and preserved inpackets of 13.5cm x 13.5cm.The data regarding botanicalname, locality of collection was noted on the packets(Dabhade,1998).
Results:
The list of plants with their botanical name,morphological features, locality of collection is given below.
1. Atrichum undulatum (Hedw) P. Beauv
The plants are of moderate size upto 3.5 cms long.Leaves small, narrow, ligulate, seta single cylindricalbent capsule. This terricolous moss was found growingon moist ground near a stream at Rye wood Park.
2. Pogonatum aloides (Hedw), P. Beauv
Plants are small, stem unbranched 2.5 cms long 1.2 cmsbroad, leaves lanceolate, acute apex serrate margin. Setaslightly inclined spores spherical brown in colour. Thisterricolous moss was collected from moist ground nearLonavala lake.
3. Funaria hygrometrica Hedw
Plants loosely or closely tufted, 1-1.5 cms high, Leavesyellowish green, upper leaves large concave,lanceolate, lower leaves small. Seta long reddish twisted,capsule asymmetrical. Spores rounded, brown in colour.This terricolous moss was found on ground at Lonavalalake.
4. Anomobryum auratum (Mitt.) Jaeg.
Plants in small shining light green tufts, 1.9 to 2.5 cmhigh, slender, leaves concave, ovate, rounded apex,crenate margin sporophyte not seen. This tuftedsaxicolous moss was found on rocks near Valvan dam.
5. Bryum alpinum Huds.
Plants tufted, rigid, robust, deep red or purple brown incolour stem erect, thick. Leaves stiff erect. Seta apicalerect, capsule pendulous, deep red. Sporescircular, yellowish brown in colour. This saxicolous mosswas collected from moist rocks near Lonavala dam.
6. Bryum roseum (Hedw) Crom
The plants are prostrate or erect growing on humussoil or decaying wood. The primary stem is erect about3 cms tall, enlarging to form a rosette of deep greenleaves. Leaves are long with acute apex, margin entireat top. Seta apical with pendulous oblong cylindricalcapsule. This saxicolous moss was found growing onmoist wall near Lonavala Lake.

158
International Conference on Ecosystem Services of Wetlands - ‘Ardrabhumi :2016’ISBN : 978-81-923628-3-0
7. Bryum argenteum Hedw. (Silver thread moss)
Small, silvery white glossy plants with short reddishbrown erect stem, Leaves crowded, broad ovate, 2.2mm long, 0.5 mm broad seta apical red erect, Capsulered, oval – cylindrical. Spores spherical or oval, smooth.Dense cushions of this silvery white saxicolous mosswere found on bricks and stones near stream at Ryewood Park.
8. Bryum wightii Mitt
Plants forming a lax carpet on rocks and ground stem4-5 cm high, leaves ovate 4.5 mm long, 2 mm broad.Sporophyte not seen This saxicolous moss wascollected from the rocks near Bhushi dam.
9. Bryum capillare Hedw
The plants are densely tufted growing on rocks or dampsoil, deep green in colour. Leaves are erect, spirallytwisted around stem, ovate, acuminate, concave, entiremargin seta apical erect with horizontal capsule. Thissaxicolous moss was found growing on rocks nearValvan dam.
10. Bartramidula bartramiodes (Griff) Wijk
Slender plants in loose tufts reaching a height of 1.5cm – 1.8 cm, 1/3rd region of entire plant having youngleaves on upperside, remaining 2/3rd towards base withmature brown leaves, margin serrate. Sporophyte notseen. These loosely tufted dark green saxicolous mosswas collected from rocks near Valvan dam.
11. Bartramidula roylei (Hook. f.) B.S.A., Bryol
Plants in loose low cushions of pleasant light greencolour, 0.5 – 10.8 cm tall, with smooth rhizoids below,leaves lanceolate 1-1.5 mm long. Sproyphyte not seen.These loosely tufted saxicolous moss was growing onrocks along Lonavala lake.
12. Anacolia sinensis Broth
The plants are sturdy, rigid, yellow green. Leavesdense, stiff, lanceolate, long, narrow tip margin detateupto 2/3 rd from the tip. These thick tufted saxicolousgenera was growing on moist wall near Bhushi dam.
13. Thuidium cymbifolium (Dozy & Molk) Dozy & Molk
Plants are large prostrate, mat like with dark green tobrown colour stems elongate irregularly branched. Stem2-3 mm long, erect leaves dimorphic, branch leavessmaller than stem leaves, ovate. Sporophyte not seen.This calicicolous moss forming green coloured matswas collected from limy walls at Valvan dam.
14. Hydrogonium dedcolyi (C. Muell) Jaeg
Plants with slender lanceolate to ligulate leaves, smoothmargin. Seta apical, capsule red brown cylindrical. Thisterricolous moss was growing on ground on banks ofstream at Valvan village.
15. Hyophila involuta (Hook) Jaeg.
Plants common on large stones and walls, in tufts ofdark green colour, Stem 1-1.5 cm high, leaves long wavyor serrate. Seta erect, elongate, capsule erect cylindricalSpores spherical light brown. This terricolous specieswas growing on moist ground near Tungarli hillsstream.
16. Semibarbula orientalis (F. Web.) Wij
Plants yellowish green to green, calciphilous growingin dense tufts on old walls, limy compounds. Stembrownish green unbrancehd. Leaves spirally arrangedovate – lanceolate. Seta and capsule yellowish brown,spores spherical yellow brown. This yellowish greencalicicolous moss was collected from old limy wallnear Valvan dam.
17. Fissidens bryoides Hedw.
Plants very small, stem reddish brown, leaves roundedat apex slowly becoming narrow at apex.Seta longlight brown, capsule long cylindrical. Spores sphericallight brown. This terricolous moss was collected fromroad near Bhushi dam.
18. Campylopus goughii (Mitt.) Jaeg
Plants small glossy, trunk 2-4 cm high, Leaveslanceolate, ovate at base narrowing at the apex, Leafmargin slightly wavy. Seta brown 4 mm long, capsulered brown. Spores spherical light brown. Thisterricolous moss was collected from ground nearLonavala Lake ( Bruhl, 1931; Foreau, 1961; Gangulee1969 – 1972).
Discussion:
A total number of 18 species of mosses were foundgrowing around wetland areas of Lonavala out of which sixspecies were terricolous (growing on ground), ten weresaxicolous (growing on moist rocks and walls) and two werecalcicolous (growing on limy rocks or walls).
All the above mentioned 18 species were found at theedges of wetlands,whereas,in the inner zone only threespecies were found namely Fissidens bryoides Hedw.,Bryum argenteum Hedw. (Silver thread moss) and Funariahygrometrica Hedw.The species richness is significant atwetland edges around Lonavala.Wendy Wilson in his thesis

159
International Conference on Ecosystem Services of Wetlands - ‘Ardrabhumi :2016’ISBN : 978-81-923628-3-0
has mentioned that the level of moss species richness ishigher at the edges of wetlands as compared to inner zone.This indicates different characteristics of edge zones that isan unique habitat on the landscape and important forconservation.(Hylander 2005, Wilson 2011).
Conclusion:
Thus we can conclude that mosses play a key roleacting as a buffer zone between wetland and forestecosystems and their species richness revels healthy wetlandand forest ecosystems.Therefore efforts should be made toconserve these mosses or else, they may become extinctdue to tourism and heavy urbanization in and aroundLonavala in the near future causing a serious threat towetland ecosystem around Lonavala.
References:
Bruhl, P. (1931) A Census of Indian mosses Record Bot SurIndia 13 (1) 50.
Chopra R S.(1975).Introduction to Taxonomy of Indianmosses C.S.I.R publication New Delhi.
Dabhade, G.T. (1998) Mosses of Khandala andMahabaleshwar in the Western Ghats (India).
Dixon, H.N. (1909) Mosses of Western India J Bombay NatHist Soc, 19: 536 – 537.
Foreau, G. (1961.) The moss flora of Palani Hills. J BombayNat Hist Soc. 58 (1), 13 – 47.
Gangulee, H.C. (1969 – 1972 ) Mosses of Eastern IndianFascicle 1-3, Central Publication, Calcutta Hylander,K.(2005) Aspect modifies the magnitude of edge Effects onbryophyte growth in boreal Fores Journal of AppliedEcology, 42,518-525.
Wendy Wilson.(March 2011) Bryophyte dynamics acrosswetlands and lakeshore edges in South west NovaScotia”,Environmental Science Honours Thesis.

160
International Conference on Ecosystem Services of Wetlands - ‘Ardrabhumi :2016’ISBN : 978-81-923628-3-0
Preliminary Study of Phytoplankton Diversity to Assess Pollution Status ofLotus Point Lake, Kurul, Alibaug, M.S, India.
Poonam Kurve1*, Gayatri Oak, Sneha Joshi and Dilip Shenai2*Department of Environmental Science, VPM’s B.N. Bandodkar College of Science Thane.
*Corresponding Authors: 1- [email protected]; 2- [email protected]
Abstract: The water quality and abundance of phytoplankton communities in a lentic ecosystem of Kurul Lake, Alibaug wasassessed from September 2013 to December 2014. The study revealed the dominance of phytoplankton belonging to classesChlorophyceae and Bacillariophyceae. Observations indicated a deteriorating ecosystem due to eutrophication caused byanthropogenic interference. During the study the need for conservation of such fragile ecosystems through constant monitoringwas observed to be essential.
Key words: Phytoplankton, Pollution
Introduction:
Phytoplankton play a key role in aquatic ecosystems.These are some of the most prominent primary producersfound in marine and freshwater ecosystems which aregenerally low in primary trophic level biomass.Phytoplankton diversity is highly influenced by hydrologicalparameters affecting not only its biota but also theproductivity in water body. Phytoplankton communitiesdetermine the health and sustainability status of the aquaticecosystem. Salim et al (1985) compared the relationshipbetween abiotic factors and variance in phytoplanktondensities whereas, few other studies have elaboratedphytoplankton dynamics and productivity fluctuations inaquatic ecosystems (Rao et.al 1990). Environmental changesdue to pollution, anthropogenic activities and climaticchanges affect micro flora and fauna of lentic and loticecosystems drastically (Komala et. al 2013; Gayatri et.al,2011). Phytoplankton communities are considered aspollution indicator species (Kampill, 2007) and thus indicatethe ecological status of any aquifer (Dalal et.al 2012). regularmonitoring of such ecosystems is therefore of utmostimportance.
The present study deals with phytoplankton diversityin Lotus Point lake, Kurul, Alibaug and its co-relation toanthropogenic activities.
Materials and methods:
Study Area
Kurul Lake (18041’ 38.42" N and 72057’19.83" E) alsoknown as Lotus Point Lake is located in Raigad district ofMaharashtra at a distance of about 100 km. from Mumbai.The lake is situated near Alibaug a coastal town which hasbeen undergoing urbanization in leaps and bounds. Indianculture generally associates the presence of lentic waterbodies with a temple or a shrine which was once meant tomaintain the purity and sanctity of the water body butcommercialization and urbanization are having adverseeffects on such cultural associations protecting various
ecosystems. A temple flanks the eastern end of the lakecausing addition of floral and other wastes directly into thelake waters. This lake experiences heavy anthropogenichindrance in the form of bathing, washing clothes, utensilsand cattle, immersion of Ganesh idols during GaneshChathurthi festival, land run offs etc., consequently, causingtremendous turbulence and changes in the dynamics oflake ecosystem.
Fig 1: Lotus Point Lake, Kurul, Alibaug, Dist. Raigad
Material and Methods:
The study was undertaken from September 2013 toDecember 2014. Water samples were randomly collected ona monthly basis from surface in separate 1000ml sterile glassbottles from different locations of the lake and Lugol’s iodinewas added for instant preservation of phytoplankton.Samples were kept undisturbed for 24 hours allowing themto settle at the bottom. The sub samples of the settledmaterial were again separated in polyethylene bottles.Counting of phytoplankton was done using Sedgewick raftercounting cell under high power microscope (Saxena et.al1987) and identification was done using standard references.Sanet Janse et.al, 2006.

161
International Conference on Ecosystem Services of Wetlands - ‘Ardrabhumi :2016’ISBN : 978-81-923628-3-0
Hyrdological parameters such as pH, dissolved oxygen,nitrates and phosphates were checked using a portable benchphotometer (Hanna instruments HI 83206) on field. Surfacetemperatures were measured using alcohol thermometer and
Salinity by Argentometric-Mohr’s method. The data collectedwas pooled to study seasonal variations (four seasons viz.pre monsoon, monsoon, early post monsoon and late postmonsoon) and was interpreted accordingly.
Result and discussion:
Table 1: Seasonal variations in physicochemical parameters of water in Kurul lake.
Early-Post Monsoon Late-postMonsoon Pre-Monsoon Monsoon MeanpH 7.1 7.27 7.5 6.9 7.1925Temp (%C) 26 27 28.2 26.5 26.925DO (mg/l) 3.25 3.8 3.2 4.8 3.7625Chlorides(mg/l) 20.1 52.4 59.64 19.88 38.005
1.455PO
4-P (mg/l) 1.3 1.32 1.4 1.8
NO3-N (mg/l) 4.2 2.02 1.5 5 3.18
Total Solids ( mg/l) 1300 721 360 5001 1845.5
Physico chemical parameters:
The pH of the lake water was almost neutralthroughout the study period while the water temperaturewas season dependent. The dissolved oxygen content wasenough to sustain life forms in the ecosystem (OATA, 2008).The chloride content was well within the permissible limitsof 250 mg/l (BIS, 1991) while the nitrates and phosphateswere also within the limits prescribed by BIS. The total
dissolved solids exceeded the prescribed limits only duringmonsoon.
The study showed presence of 31 species belongingto class, Chlorophyceae (13 genera). Bacillariophyceae (11genera), Cyanophyceae (05 genera), and Euglenophyceae(2 genera). Chlorophyceae (42) remained dominantthroughout the study period followed by Bacilariophyceae(36%).
Table 2: Seasonal variations in the diversity and density of phytoplankton in Kurul Lake
Sr.No. Genera Monsoon Early Post Monsoon Late Post Monsoon Pre MonsoonCyanophyceae
1 Merismopedia spp. +++ - ++++ +++++2 Anabaena spp. + +++ ++++ +++3 Oscillatoria spp. + - ++ -4 Spirulina spp. - - ++ -5 Chroococcus spp. - + ++ ++++
Chlorophyceae6 Koliella spp. ++ - ++ -7 Scenedesmus spp. ++ +++++ +++ ++++8 Crucigenia spp. +++ +++++ ++ ++++9 Monoraphidium spp. ++ +++ ++ -10 Pediastrum spp. + +++ +++ ++11 Oocystis spp. + - ++ -12 Crucigeniella spp. - +++ ++ -13 Cosmarium spp. - - +++ +++14 Chlorella spp. - - +++ ++++15 Kirchineriella spp. - - ++ -16 Chlorogonium spp. - - - +++17 Actinastrum spp. + - - -18 Closterium spp. - - ++ ++

162
International Conference on Ecosystem Services of Wetlands - ‘Ardrabhumi :2016’ISBN : 978-81-923628-3-0
Bacillariophyceae19 Synedra spp. ++ - ++ +++++20 Nitzschia spp. + +++ +++ ++++21 Amphipleura spp. + - ++ +++22 Pinnularia spp. + - ++ ++23 Coconeis spp. ++ - +++ +++24 Triceratium spp. - +++ + +++25 Navicula spp. - +++ ++++ -26 Cyclotella spp. - - ++ +++27 Melosira spp. - - ++ -28 Gomphonema spp. - - ++ -29 Stephanodiscus spp. - - ++ -
Euglenophyceae30 Phacus spp. ++ +++ ++ +++31 Euglena spp. + - ++ +++
+++++ = Abundant, ++++ = < abundant, +++ = Average, ++ = meager, + = Rare, - = Absent
Fig 2: Pie chart showing class-wise abundance ofphytoplankton
Chlorophyceae: Chlorophyceae formed the majorgroup of phytoplankton in the lake except for pre monsoon.Total 13 genera from this class were recorded andcontributed around 42% of the total phytoplankton in thelake. Palmer (1959) stated that enormous number ofScenedesmus are indicators of degrading water quality whileadequate number of Chlorophytes also indicates food forfish population in the water body. Species like Crucigeniaspp. and Scenedesmus spp. dominated the microflora duringthe entire period of study.
Bacilariophyceae: 11 genera in class Bacillariophyceaewere found during the study period. These showeddominance next to Chlorophycae during late post-monsonand pre-monsoons periods. It formed around 36% of thetotal phytoplankton genera in the lake. Nitzchia spp. whichindicates presence of high nitrate and phosphates (Pearsall,1932) was seen throughout the sampling period. Mohan,(1987) stated that the presence of species like Cyclotella,Navicula, Nitzschia, Melosira, Gomphonema indicates thedeterioration of water quality of lakes (Mohan et.al. 1987).
Thus, presence of such species in the current study showsdeteriorating quality of lake water.
Cyanophyceae: 5 genera in Cyanophyceae wereonserved during the study period. This class contributedto around 6% of total phytoplankton population in the lake.The abundance of members of class Cyanophyceae issupposed to be better when the temperature and alkalinityof the aquatic ecosystem are high (Ganpati et al, 1953).Anabaena spp. and Merismopaedia spp. dominated theCyanophycae population. Ganpati (1953) also suggestedthat density of Cyanophytes depends on phosphates andsilicates while some species lead to eutrophication andpollution (Pennak, 1955).
Euglenophyceae: Class Euglenophyceae wasrespresented by minimal number of genera during the study.Euglenophyceae contributed to around 6% of totalphytoplankton population in lake. Presence ofEuglenophytes indicates higher availability of nitrogencompounds, carbon dioxide, chlorides and organic content(Rao, 1977; Hegde et.al 1985).
Discussion
The changes in physicochemical parameters of thelake have a profound influence on the occurrence ofphytoplankton communities. higher temperatures were alsofound to be directly proportional to phytoplankton density.The water quality in Kurul Lake was constantly underpressure due to constant anthropgenic interference in theform of washing of utensils, clothes, bathing cattle and othersuch activities in the lake. This caused a rise in the nitratesand phosphate contents of the lake ecosystem therebyimpacting the phytoplankton communities. Abrupt removalof hydrophyes and lotus seeding into the lake were alsoresponsible for inducing distress to the biota of water body.

163
International Conference on Ecosystem Services of Wetlands - ‘Ardrabhumi :2016’ISBN : 978-81-923628-3-0
Dominance of Chlorophyceae and Bacilariophyceaeindicates organic pollution (Kumari et.al, 2008) which furtheremphasizes the previously made physical observation ofexisting natural and anthropogenic sources of organicpollution.
Conclusion:
The study of physico-chemical parameters andphytoplankton diversity of Lotus point lake clearly showsan increase in nutrient concentration in the lake ecosystemunder scrutiny, having direct relation to human interference.These changes in the water quality influence the type ofphytoplankton communities growing in the lake ecosystemindicating the rising pollution levels and deterioratingecosystems. Regular monitoring, community awareness andsensitization of locals are of prime importance forsustainability and maintenance of existing lentic ecosystems.
Acknowledgement:
Authors are grateful to Vidya Prasarak Mandal,Principal Dr. M. K. Pejaver for constant support. Also thankDr. N. G. Kurve, Dr. Goldin Quadros and colleagues for theirvaluable suggestions.
References:
� Ganapati, S.V., Chacko, P.I., Srinivasan, R. 1953.Hydrobiological conditions of the GangadhareswarerTemple Tank, Madras. J. Asiatic. Soc. Sci., 19: 149 158.
� Hegde, G.R., Bharti, S.G. 1985. Comparativephytoplankton ecology of freshwater ponds and lakesof Dharwad, Karnataka State, India.
� Kastooribai, R.S. 1991. A comparative study of twotropical lentic systems in the context of aquaculture.Ph. D. Thesis, University of Madras, India.
� Kohli, M.P.S. 1981. Plankton study of Gobindsagarreservoir. Comp. Physiol. Ecol., 66: 49 52.
� Komala, H.P., Nanjundaswamy L. and DeviPrasad.A.G.,2013. An assessment of Plankton diversityand abundance of Arkavathi River with reference topollution. Advances in Applied Science Research, 4(2):320-324
� K.Satya Mohan, Bacillariophyceae of the two tropicalsouth Indian lakes, of Hyderabad, Bot. Bull., AcademiaSinica 28:13-24, (1987)
� Kumari P., Dhadse S., Chaudhari P.R., Wate S.R. 2008.A biomonitoring of plankton to assess quality of waterin the lakes of Nagpur city. In: Sengupta M. and DalwaniR. (Eds). Proc. of Taal. The 12th World Lake Conference,160–164.
� O.A. Devies. D. S. Abolude, A.A. A. Ugwumba,Phytoplankton of the lower reaches of the Okpokacreek, Port Harcourt,Nigeria, Journal f Fisheriesinternational,3(3), 83-90, 2008
� Pearsall, W.H. 1932. Phytoplankton in the English lakes.II. The composition of the phytoplankton in relation todissolved substances. J. Ecol., 20: 241 262.
� Pennak, R.W. (1955). Comparative limnology of eightColorado Mountain Lakes. Univ. of Colorado StudiesSer. Biol., 2: 1 75
� Rao, V.S. (1977). An ecological study of three freshwaterponds of Hyderabad, India. IV. The phytoplankton(Diatoms, Euglenineae and Myxophyceae). Hydrobiol.,53: 13-32.
� Sanet Janse van Vuuren, Jonathan Taylor, Carin vanGinkel, Annelise Gerber (2006): Easy identification ofthe most common Freshwater Algae.
� Trivedy, R. K. and Goel P. K. (1986): Chemical andbiological methods for water pollution studies,Environmental Publication, Karad, Maharashtra.
� www.ornamentalfish.org/wp-content/08/Water-Quality-Criteria.pdf

164
International Conference on Ecosystem Services of Wetlands - ‘Ardrabhumi :2016’ISBN : 978-81-923628-3-0

165
International Conference on Ecosystem Services of Wetlands - ‘Ardrabhumi :2016’ISBN : 978-81-923628-3-0
Section IIIResearch Articles and
Short Communications

166
International Conference on Ecosystem Services of Wetlands - ‘Ardrabhumi :2016’ISBN : 978-81-923628-3-0

167
International Conference on Ecosystem Services of Wetlands - ‘Ardrabhumi :2016’ISBN : 978-81-923628-3-0
Post Idol Immersion Effect on Water Quality of Chandrabhaga River in Nagpur
A. M. Watkar and M. P. BarbateDepartment of Zoology,
Bhalerao Science College, Saoner, Dist. Nagpur, Maharashtra, INDIAEmail: [email protected]
Abstract: India is the country of rich cultural heritage and festivals. Peoples here celebrate festivals with great enthusiasm.Among all the Indian festivals Ganesh Utsav and Durga Puja is celebrated by every community. These festivals end by idolimmersion in water. These idols are made up of degradable and non-degradable components and paints containing heavy metalsdue to that immersion activity deteriorates water quality. The present study has been made to analyze the physicochemicalparameters of the Chandrabhaga river after idol immersion for analyzing the various physicochemical parameters such asTemperature, pH, TDS, DO, Phosphate, Nitrate, BOD, COD, Oil & Grease, etc. The work highlights the condition of thisriver water after idol immersion with respect to the parameters mentioned above.
Key words: Idol, immersion, Chandrabhaga river, physicochemical.
Introduction:
India is a multi-cultural country of myriad festivals.Some of these festivals involve ‘idol immersion’ in water ascelebrations finale. Ganesh festival is one of the prominentfestivals celebrated by all communities irrespective of theircast creed and religion. Beautifully carved and decoratedidols are drowned into water bodies like rivers, ponds andlakes with prayers for success, happiness and peace. Twomajor festivals in India that involve idol immersion are‘Ganesh Chaturthi’, dedicated to Lord Ganesha and ‘DurgaPuja’ dedicated to Goddess Durga.
However, amidst the celebrations, people tend to forgetthe ill-effects of the practice. The most serious impact ofidol immersion is on the environment. It disturbs theecological balance by polluting water and adversely affectingthe flora and fauna. The requirement of water is in all lives,i.e. from micro-organisms to man, is a serious problem todaybecause all water resources have been reached to a point ofcrisis due to unplanned urbanization and industrialization,Singh et. al. (2002). According to Bajpai et al. (2002), theidols of deities are made of non-biodegradable materialssuch as plastic, cement and plaster of paris and are paintedwith toxic dyes that contain harmful and toxic chemicals.When they come in contact with water, it becomes poison.All forms of life depend upon water and it providessustenance to plants, animals, aquatic organisms and tomeet the human need like agriculture and industries, Prasadand Gaur (1992). Water gets polluted by dumping domestic,industrial and hospital waste and domestic activities likewashing, bathing and religious rituals, Shukla (2004) andGupta et al. (2011). Thousands of Ganesh and Durga idolsof various sizes reaching heights up to 20 to 40 feet areimmersed every year in different water bodies, Reddy andKumar (2001).
Material & Methods:
For this study, site has been selected of Chnadrabhagariver near Kalmeshwar, Nagpur Dist. Samples were collected
and preserved from the river as per standard methods.Samples were collected during idol immersion successivethree days of immersion activities from the site. The sampleswere subjected to physico-chemical analysis including pH,temperature, dissolved oxygen, total calcium, total hardness,total alkalinity, phosphates, nitrates, biological oxygendemand, chemical oxygen demand, oil and grease, followingthe procedures prescribed by standard methods, Trivedyand Goel (1986) and APHA (2005).
The analysis of physico-chemical parameters of theChandrabhaga river was conducted in the laboratory ofBhalerao Science College, Saoner.
Physical parameters were studied according to Welch(1948) and Lind (1979) and chemical parameters were studiedby using APHA.
Result and Discussion:
Table 1: Physico-chemical parameters ofChandrabhaga river at Idol Immersion point.
Sr. No. Parameter Station 11. pH 8.22. Temperature(oC) 323. T.D.S.(mg/l) 3164. Total Alkalinity(mg/l) 1695. Total Hardness(mg/l) 1776. D. O. (mg/l) 1.17. B.O.D.(mg/l) 5.88. C.O.D.(mg/l) 51.149. Nitrates(mg/l) 0.01810. Phosphates(mg/l) 0.06711. Oil & Grease(mg/l) 0.7112. Total Calcium(mg/l) 134
pH: pH was analysed by pH meter and it is found thatvalues of the river was changed i.e. Hydrogen ion

168
International Conference on Ecosystem Services of Wetlands - ‘Ardrabhumi :2016’ISBN : 978-81-923628-3-0
concentration is considered as a important ecological factor,which is a result of addition of organic substances andmaterials used in preparation of idols. Nearly neutral pH ofwater is regulated by carbon dioxide and bicarbonates,Hutchinson (1957). The river water showed alkaline naturethroughout the study period. pH of river water was foundto be 8.2.
Temperature: The water temperature is one of theimportant parameter in river. In the present study, watertemperature was found to be 32oC. The studies showed thatdue to increased temperature of the river speed up thechemical reaction and biological activity , which results inreduction in the solubility of gases in water, Murugesan etal. (2004).
T.D.S.: Total dissolved solids include salt and varietyof organic substances, which readily dissolve in water andoften impart a degree of hardness. The value of totaldissolved solids after idol immersion was found to be 316mg/l.
Total Alkalinity: Total alkalinity of water is mainlydue to cations of calcium, magnesium, sodium and potassium.It is also due to combined carbonate or bicarbonate oroccasionally hydroxides. According to Waikol and Patil(2009) analysis of water showed the higher alkalinity whichwas due to idol immersion. Ujjania and Multani (2011) andMallik et al (2010) also reported the same.
Total Hardness: During idol immersion activity totalhardness in river water was found to be 177mg/l, which washigh value. This result was evident by Vyas et al (2006) andMalik et al (2012).
Dissolved Oxygen: Dissolved oxygen is also one ofthe important factors of water quality, which influences thebiota present inside the river water. The idol immersionadversely affects the dissolved oxygen in water body andduring this study it was observed low in river water. Decreasein DO was due to the immersion activity and rise intemperature, Malik I (2010).
Biological Oxygen Demand: Biological OxygenDemand is a direct measure of O
2 requirement and indirect
measure of biodegradable organic matter. The increased valueof B.O.D. was again due to the idol immersion. Similarfindings were observed by Jadhav and Dongare (2009).
Chemical Oxygen Demand: Chemical Oxygen Demandindicates the extent of chemical pollution mainly from chemicalsused during idols painting. The C.O.D. values observedmaximum during idol immersion. Similar findings were observedby Vyas and Bajpai (2008) and Dhote et al (2001).
Nitrates: In the present study, nitrate values wereincreased after idol immersion because of organic matter
along with idol immersion. Similar findings were shown byDhote and Dixit (2011).
Phosphates: Phosphate is considered to be the mostsignificant among the nutrients responsible foreutrophication of water bodies, as it is primary initiatingfactor. Concentration of phosphates recorded after idolimmersion was increased. It may be due to deposition ofashes and chemical under religious activities anddecomposition of organic matter in the water sediments.
Oil & Grease: Oil and grease if present in excessamount it interfere with aerobic and anaerobic biologicalprocess. It is present in the water can be extracted either,which is immiscible in water and can be separated by aseparator funnel. In the present study oil and grease in riverwater was found to be 0.71mg/l. The values of oil and greasewere increased due to oil paints for painting the idols andoil offering by the devotees during worship.
Total Calcium: Values of total calcium in the river waterwas observed very high due to the immersion activity. Theconcentration of Calcium increases due to the idol immersion,Reddy et al. (2001).
Conclusion:
The present study on assessment of idol immersionon water quality of Chandrabhaga river shows that the idolimmersion has negative impact on physical and chemicalproperties of water. Mythologically the water bodies arerelated to religious sentiments but scientifically these arenot suitable for human uses. This religious activity cannotstop but awareness among the people and proper waysthrough which idol immersion practice can be carried outwithout harming the environment. Some unique and creativemethods should be adopted to make eco-friendly idols,naturals colours etc. which can solve this pollution problemup to some extent.
References:
Singh, S.P., Pathak, D. & Singh, R. (2002). Hydrobiologicalstudies of two ponds of Satna (MP), India, Eco. Evn. AndCons., 8(3), 289-292
Bajpai, A., Pani, S., Jain, R.K. & Mishra, S.M., (2002). Heavymetal contamination through idol immersion in a tropicallake. Eco: Environment and Conservation Organization 8(2)157-159
Prasad, D. and Gaur, H.S. (1992). Environmental pollution:Water, Venus Publishing House, New Delhi 294-330
Shukla, S.S. (2004).Effect of public awareness campaign inmitigating impact of religious activities on Bhopal lakes,Abstract in image of water in religion, myths, literature,Switzerland, Global Biodiversity Forum, 17(2)

169
International Conference on Ecosystem Services of Wetlands - ‘Ardrabhumi :2016’ISBN : 978-81-923628-3-0
Gupta, A.K., Mishra, K., Pramod Kumar, Singh, C.S.&Srivastava, S. (2011).Impact of religious activities on thewater characteristics of prominent ponds at Varanasi (UP)India. Plant Archives 11(1) 297-300
Reddy, V.M. and Kumar, V.A. (2001). Effect of Ganesh idolimmersion on some water quality parameter of HussainSagar,Current Science 1412
Trivedy, P.K. and Goel, R.K. (1986).Chemical and Biologicalmethods water pollution studies. Environmental publicationKarad India
APHA, (2005). Standard methods for examination of waterand waste water. American Public Health Association,Washington, D.C., 21st Edition
Welch, P.S. (1948). Limnological methods. Blakiston,Philadelphia, 381 p
Lind, O.T. (1979). A handbook of Limnological methods,C.V. Mosby, St. Louis, 199pp
Hutchinson, G.E. (1957). A treatise on limnology vol. II JohnWiley and Sons, New York, 1015
Murugesan, S., Kumar, D.S., Rajan, S. &Chandrika, D. (2004).Comparative study of ground water resources of east andwest regions of Chennai, Tamilnadu, Nature Environmentand Pollution Technology 3(4) 495-499
Waikol, V. and Patil, C.L. (2009). Study of water quality andtrace metal concenteration of well-water in dahanu region(Thane, India). Pollution Research 28(2) 305-307
Ujjania, N.C. and Multani, A.A. (2011). Impact of Ganeshidol immersion activities on the water quality of Tapi River,Surat (Gujrat) India. Research Journal of Biology 1(1) 11-15
Malik, G.M., Raval, V.H., Zadafiya, S.K. & Patel, A.V.(2010).Idol immersion and physic-chemical properties ofSouth Gujrat rivers. Current World Environment Journal 5(1)173-176.
Vyas, A. Mishra, D.D., Bajpai, A., Dixit, S. and Verma, N.(2006)Environment Impact of idol immersion Activity Lakesof Bhopal India. Asian Journal of Experimental Sciences20(2) 289-296.
Malik, G.M., Raval, V.H., Zadafiya, S.K. & Patel, A.V. (2012)Idol immersion and physic-chemical properties of SouthGujrat rivers India. Research Journal of Chemical Sciences2(3) 21-25
Jadhav, P. and Dongare, M. (2009) Evaluation of dissolvedoxygen in Ex Situ Ganesh Idol immersion. NatureEnvironment and Pollution Technology 8(3) 561-564
Vyas, A. and Bajpai, A. (2008). Water quality survey andmonitoring study of idol immersion in context of lower lakeBhopal India. In: Proceedings of tall 2007: the 12th WorldLake Congress edited by Sen Gupta M and Dalwani R 1818-1823
Dhote, S., Varghese, B. & Mishra, S.M. (2001).Impact ofidol immersion on water quality of twin lakes of Bhopal.Indian Journal of Environment Protection 21 998-1005.
Dhote, S. and Dixit, S. (2011). Hydro chemical changes intwo eutrophic lakes of Central India after immersion of Durgaand Ganesh idol. Research Journal of Chemical Sciences1(1) 38-45

170
International Conference on Ecosystem Services of Wetlands - ‘Ardrabhumi :2016’ISBN : 978-81-923628-3-0
Water Quality Assessment of Zilpi Pond, Near Hingna, Nagpur,India
1M. M. Bhatkulkar, 2A. M. Watkar and 3N. C. Kongre1Department of Zoology,
3Department of Chemistry,J.N. Science College,Wadi, Dist. Nagpur
2Department of Zoology, Bhalerao Science College, Saoner, Dist. Nagpur*Email: [email protected]
Abstract: Water is an important part of our life. In recent years importance of water for human health, hygiene and productionof food has become widely recognized. Zilpi pond is in North Nagpur in Hingna region. Water from this particular pond issupplied to the local region with the help of tankers. It is surrounded by the dense vegetation from all over the sides. It hasbecome highly polluted due to the different activities made by the mankind as well as animals, such as domestic sewage. In thepresent investigation some physico-chemical parameters were studied during Jan 2014 to Dec 2014. Water analysis has donesuch as water temp., conductivity, turbidity, dissolved O
2, free CO
2, total alkalinity, total hardness, chloride, phosphate,
sulphate, nitrate, BOD, COD, pH.
Key Words: Physico-chemical parameters, Zilpi, polluted water.
Introduction:
Water supports life on earth and around which the entirefabric of life woven. It is well established fact that life,doubtless originated in water and therefore like air, water isone of the most important and precious natural resourcesand a regular and plentiful supply of clean water is essentialfor the survival and health of all living organisms. A hugequantity of fresh water is available on our planet; almost 1500million cu kms. However, 70% of available water is of no useas it contains significant quantity of salt. Total amount ofavailable fresh water on our planet is only about 84.4 cu. kmsof which 70% water is in frozen state in the form of snowcaps, ice sheets, glaciers etc. Thus less than 1% of total waterremains for human use and that too which is unusuallydistributed all around the earth. This constant amount ofwater passes through a system of hydro biological cycle.
A water body affects the environment in its vicinity,like charging of ground water tables, conditions of climateetc. Most of the people like washer man, and fisherman,living in the surrounding area depend on this source ofwater for their survival. Any damages to this water sourceby any agency will not only make life miserable but that willalso disrupt the aquatic ecosystem. It is therefore necessaryto study the quality of river water, on the basis of physico-chemical parameters so as to assess its potability. Most ofour water bodies, rivers and streams have become pollutedand unfit for human use. In 1970 about 3500 cu kms. of waterwere diverted for human use, while about 5800 cu kms. ofclean water were found to be polluted with varying degreeof pollution (Rogers,1991).
The physicochemical characteristics of an aquaticbody do not only reflect the type and diversity of aquaticbiota but also the water quality and pollution status. Thepresent study includes physico-chemical and biological
characteristics and their seasonal variation for a period ofone year (rainy, winter and summer) Jan 2014 to Dec 2014 atZilpi pond near Hingna, at aforesaid site was analysed fortemperature, pH, acidity, alkalinity, DO, BOD, COD, chloride,nitrate, and phosphate.
Material and Methods: Zilpi pond is located at Hingnain North Nagpur region. Water samples collected monthlyand brought to the laboratory for further analysis duringthe period of Jan 2014 to Dec 2014. Water samples werecollected in pre-cleaned plastic caps during 8am to 11amand 5pm to 8pm and were analyzed. Physical parameterswere studied according to Welch (1948) and Lind (1979) andchemical parameters were studied by using APHA (1985).
Table 1: Seasonal variations in physico-chemicalparameters of Zilpi pond during Jan. 2014- Dec. 2014.
Parameters Monsoon Winter SummerWater Temp.(%c) 28.3 23.9 35.2Transparency(cm) 13.35 15.64 12.30pH 7.4 8.6 7.7TDS(mg/l) 291 198 227DO (mg/l) 4.2 5.5 3.3Free CO2 (mg/l) 7.4 4.0 9.3Total Alkalinity (mg/l) 246.56 236.76 346.40Permanent Hardness(mg/l) 889.14 816.32 655Chloride (mg/l) 69.70 54.78 38.43Nitrate (mg/l) 3.9 3.1 4.6Phosphate (mg/l) 8.81 6.24 9.97Sulphates (mg/l) 64.17 51.45 85.53BOD 11.3 10.25 23.32COD 118.8 154.32 70.56
Results and Discussion: The average physicochemical quality of Zilpi pond in Nagpur district duringmonsoon, winter and summer is shown in Table 1.

171
International Conference on Ecosystem Services of Wetlands - ‘Ardrabhumi :2016’ISBN : 978-81-923628-3-0
Temperature of the pond water was recorded maximumduring summer and minimum during winter (Shiddamallayaet al., 2008).
Transparency was found maximum in winter andminimum in summer (Vijayvergia 2007). pH value of the pondwater was recorded to be maximum in winter whereasminimum in monsoon. TDS was recorded maximum inmonsoon and minimum in winter (Sakhare 2006).
The value of Dissolved Oxygen was found to bemaximum during winter season and minimum during summer(Bharali et al., 2008). Free carbon dioxide was recorded maximumin summer while minimum in winter (Ingole et al. 2009).
Total Alkalinity was recorded maximum in summer andminimum in winter. Total Hardness was recorded to bemaximum in monsoon and minimum in summer (Saha,et al.2001). Chlorides were found to be maximum during monsoonwhereas minimum during summer. The similar values werefound by Sisodia et al. (2007) in Bhopal lakes.
The values of Nitrates, Phosphates and Sulphateswere recorded maximum during summer and minimum duringwinter (Shrishail et al. 2008). The maximum values of all theabove three parameters might be due to the dilution of waterand minimum values might be due to the domestic sewageadding in the pond water.
BOD was recorded maximum during summer andminimum during winter, this is due to the dumping of domesticwastes and accumulation of waste increases BOD in summerand due to dilution of pollutants in more volume of waterduring winter reduces the BOD (Agrawal et al. 1976; Bagdeand Verma, 1985; Rao et al., 1985 and Sengar et al., 1985).
The chemical oxygen demand test determines theoxygen required for chemical oxidation of organic matterwith the help of strong chemical oxidant. It is also used tomeasure the pollution of domestic and industrial waste. Thehighest value of COD was recorded in winter and lowestvalue was recorded in summer (Reddy et al. 2009).
Conclusion: By observing the recorded values ofphysic-chemical parameters, the pond water is becomingeutrophic by several anthropogenic activities leading toenvironmental degradation. It needs long term plan forreversal of eutrophication and pollution control which canimprove water quality and make the pond suitable foraquaculture purposes.
References:
Agrawal, D.K., Gour, S.D., Tiwari, I.C. and Narayan, S. (1976).Physico-chemical characteristics of Ganges water atVaranasi, Indian J. Environ, Hith. 18: 201-206.
APHA, (1976). Standard methods for the examination of waterand waste water (14th Ed.) American Public Health
Association, New York.
Bagde, U.S. and Verma, A.K. (1985). Limnological studies ofJ.N.U. Lake, New Delhi, India. Proc. Nat Symp. Pure andApple. Limnology (ED) Adoni, A.D. Bull. Bot. Soc. Sagar.32:16-23.
Bharali, J., Baruah, B.K. and Sharma, H.P. (2008). Studies onphysico-chemical characteristics of water of the wetlandsin Kaziranga National Park, Assam, J.Poll.Res. 27(4) : 729-733pp.
Ingole, S.B., Pawale, R.G. and Wavde, P.N. (2009). Waterquality studies on Majalgaon dam, Beed Dist. Maharashtra,Aqua. Biol., Vol 24(1): 71-76pp.
K. Vasumathi Reddy, K. Laxmiprasad, M. Swamy, and T.Ravinder Reddy (2009). J.Aqua.Biol, 24(1), 1
Lind, O.T. (1979) A handbook of Limnological methods, C.V.Mosby, St. Louis, 199pp.
Rao, K.S., Dad, N.K. and Pandya, S.S. (1985). Communitystructure of Benthic macro invertebrates and their utility asindicators of pollution in river Khan (Indore) India. Proc.Nat Symp. Pure and Apple. Limnology (ED) Adoni, A.D.Bull. Bot. Soc. Sagar. 32:114-119.
Roger, S.P. (1991) Fresh water. In the global possible:resource, development and new century. Repetto. R., Aff.EW. Press, New Delhi.
Saha, T., Manna, N.K., Majumdar, S.S. and Bhattacharya,I.N. (2001). Primary productivity of the Subhas Sarobar lakeinEast Kolkata in relation to some selected physic-chemicalparameters, Poll.Res. vol. 20(1): 47-52pp.
Sakhare, V.B. (2006). Ecology of Jawalgaon reservoir inSolapur district, Maharashtra, Ecology of lakes andreservoirs, Daya publishing house, Delhi; 16-35pp.
Sengar, R.M.S., Sharma, K.D. and Pathak, P.D. (1985). Studieson distribution of algae flora in polluted and non-pollutedregions in Yamuna river at Agra(U.P.). J. Indian, Bot. Soc.64: 365-376.
Shiddamallayya, N. andM. Pratima (2008). Impact of domesticsewage on fresh water body. J. Environ. Biol. Vol. 29(3):303-308pp.
Shrishail, V.G. and Pratima, M. (2008). Distribution andperiodicity of phytoplankton in Khaji Kotnoor reservoir ofGulbarga region, Karnataka, India J. Ecol. Env. & Cons. 14(2-3): 429-433pp.
Sisodia, S., Singh, S., Padmakar, C., Mogali, J.N. and Yadava,R.N. (2007). Seasonal variation and species diversity ofmacrozoobenthic communities of a tropical lake, Bhopal,NSL: 211-214pp.
Vijayvergia, R.P.(2007). Composition and periodicity ofCyanophyceae in eutrophic lake, Udaisagar, Udaipur, NSL-2007, 326-328pp.
Welch, P.S. (1948). Limnological methods. Blakiston,Philadelphia, 381 p.

172
International Conference on Ecosystem Services of Wetlands - ‘Ardrabhumi :2016’ISBN : 978-81-923628-3-0
‘Wetlands - Importance And Challenges’
Nirbhavane Gangotri * and Kshama Khobragade*** Assistant Professor,
Dr. Ambedkar College of Commerce & Economics, Wadala, Mumbai (MS) – 400 031, [email protected].
**Associate Professor & Head, Dept. of Env.Science, S.B.E.S.College of Science,Aurangabad, (MS) - 432 001, India.
Abstract : This paper attempts to address the importance of wetland on earth and the threats faced by them. Wetland is notonly an essential habitat for number of threatened and endangered species of animals and plants, but also a natural resource ofgreat ecological, economical, cultural, social and recreational value to human life. Wetland performs like a kidney in humanbody and they are playing important functions in balancing ecosystem. It provide various resources for human being such aswater, food, raw materials etc., and it also provide suitable place for agricultural and recreational purposes. Number ofpeople’s livelihood depends on wetland. Many wetlands in the world are badly affected due to anthropogenic activities;therefore they are on the verge of extinction. Over one third of the country’s wetlands have been wiped out. Dumping ofuntreated sewage and garbage, construction in nearby wetland area, industrialization, tourism, lack of scientific temperamentin stakeholders are some main reasons which cause damage to wetlands in a great extent.
The present paper highlights the major threats to wetland especially in the Indian scenario such as pollution, encroachment,eutrophication, illegal mining activities, ungoverned tourist activities, lack of proper care by concern authorities and culturalmisuse, etc.
Ramsar convention provides international cooperation for the conservation and wise use of wetlands. The union governmentnotified rules for conservation and management of wetlands, which restricted harmful activities in wetland area and preventsdamage upto certain extent. The Wetlands (Conservation and Management) Rules, 2010, aimed to ensuring better conservationand preventing degradation of wetlands.
Keywords: Biodiversity, Conservation, Eutrophication, Ramsar site, Wetlands.
Introduction:
Wetlands are natural area covered by water sometimeor all the time. They are not always flooded but are coveredby water at least for a few days during different seasons.Wetlands included swamps, marshes, lagoons, mangroves,lakes, coral reefs, bogs, peat lands, salt marshes, andmudflats.
Wetland ecosystem covers about 6% of the Earth’sland surface measuring about 570 million hectares. (Kodarkar,2008). Wetlands are characterized by their distinctivehydrology and soil flora and fauna. Water usually movesvery slowly through wetlands. Once regarded as wastelands,wetlands are now recognized as an important feature of thelandscape that provides numerous beneficial services forpeople. Wetland is having economical as well as ecologicalvalue which provides services to the society. Some of theseservices include protecting and improving water quality,supporting the fishing industry, storing floodwaters andproviding opportunities for education and recreation centrefor society.
The Economics of Ecosystems and Biodiversity forWater and Wetland Report (2013), showed continuouslythat wetlands are continuous degraded or lost at an alarmingpace. Half of the world’s wetlands were lost during thetwentieth century due to factors such as intensiveagricultural production, unsustainable water extraction for
domestic as well as industrial use, urbanization,infrastructure development and pollution. The continuousdegradation of wetlands resulting in significant economicburden on communities, countries and businesses.
The convention on wetland, known as ‘RamsarConvention’, is an intergovernmental treaty which providesframework for national action and international cooperationfor the conservation and wise use of wetlands and theirresources. The convention was developed and adopted byparticipating nations at a meeting in Ramsar, Mazandaran,Iran, on February 2, 1971, hosted by the Iran, and came intoforce on December 21, 1975.The Ramsar List of Wetlandsincludes 2225 Sites which is known as ‘Ramsar Sites’.Presently there are 169 contracting parties in RamsarConvention. United Kingdom having highest number ofRamsar sites (www.Ramsar.org.).
India joined convention in 1982. In India 25 sites aredeclared as a Ramsar sites. These wetlands includeHimalayan freshwater wetlands, Himalayan high altitudewetlands, coastal lagoons, floodplain systems and semi aridand arid zone wetlands. The convention also provides fundsunder Small Grants Fund (SGF) as emergency assistance toRamsar sites, which have suffered damage or are in dangerof damage. Chilika Lake, Orissa, is recipient of the prestigiousRamsar Wetland Award in 2002 and Indira Gandhi Paryavaran

173
International Conference on Ecosystem Services of Wetlands - ‘Ardrabhumi :2016’ISBN : 978-81-923628-3-0
Purashkar was also conferred on Chilika DevelopmentAuthority for the restoration of lake. MoEF has an importantNational Wetland Conservation Programme (NWCP), whichcovers about 94 sites spread across the country (Kodarkar,2008).
This paper emphasis on importance of wetland on earthand challenges faced by them in current scenario as theyare the richest source of biodiversity in ecosystem.
(Bassi,2014)
(Bassi,2014)
Material and Methods:
The study was based on secondary data, which hasbeen collected from various scientific research literature,and from various government reports such as Ministry ofEnvironment and Forest (2008), The Economics ofEcosystems and Biodiversity for Water and Wetland report(2013), etc. and various research articles and related webssites.
Results and Discussion:
Importance of Wetlands
Wetlands are valuable resource given by nature, whichprovides number of benefits to human race since past time.
Water Filtration: Wetlands are having capacity to filter
the water by filtering runoff and removing sediments,retention and exports metals and other type of pollutants(Kotze, 2000). In some areas, artificial wetlands weredeveloped only for purification purpose. In the Gulf ofMexico, wetlands play an extremely important role by helpingto decrease the amount of pollutants that enters the Gulfand protecting shorelines from erosion. These services arequite valuable to communities for the people who lived nearwetlands (Breaux et al, 1995).
Flood Water Storage: Wetlands helps to controlflooding, when water levels are high due to flooding, theheavy, spongy vegetation absorbs the water and slowdownits flow. The combined action of storing and slowing canlower flood heights. Flood control depends upon wetlandtype and soil permeability. A one acre wetland capable tostore about one million gallons of water. (Due to flood, thereis loss of near about 2 billion dollars per year in America).Wetland can play a great role in reducing the frequency andintensity of floods. Coastal wetlands serve as storm surgeprotectors when hurricanes or tropical storms come ashore(E. P. A. 2006).
Biodiversity: Wetlands provides habitat for variety offishes, birds, reptiles, amphibians and plants. Wetlands aresource of conservation for rare species of flora and fauna.In the Gulf of Mexico region, some of the species of birdsthat live in wetlands include White Egrets, Ibises, Anhinga,Blue Herons and Roseate Spoonbills. Wetlands provided ahabitat for more aquatic and terrestrial species on an areabasis than any other habitat type, making them among themost ecologically important ecosystems on earth (Comeret al., 2005).
Food Security: Wetlands play a key role in theprovision of food, and habitats and nurseries for fisheries.One example is the Amu Darya delta in Uzbekistan whereintensification and expansion of irrigation activities left only10 per cent of the original wetlands. Yet a pilot restorationproject initiated in the delta with the support of community,government and donors which led to increased incomes,more cattle, more hay production for use and sale (UNEP,2012).
Job Security: Wetlands can be important Ecotourismand recreation sites which supports local employment. Theyprovide many opportunities to local people for theirlivelihood, e.g. boating fishing etc. Many wetlands are nowa day’s become tourist spot which gives job opportunitiesto local people in that area (UNEP, 2012).
Climate change: Wetlands provide climate regulation,and carbon storage. Peat consists of partially-decomposedplants. Peat lands-wetlands that actively accumulate peat –act as long-term sinks for carbon dioxide in the atmosphere.Carbon dioxide is one of the greenhouse gases that

174
International Conference on Ecosystem Services of Wetlands - ‘Ardrabhumi :2016’ISBN : 978-81-923628-3-0
contribute to global warming. Carbon is retained in peatlands instead of being released into the atmosphere ascarbon dioxide (Erwin, 2009).
Threats:
Anthropogenic activities cause degradation ofwetland, which result in loss of this precious natural resource.These activities include industrial pollution, encroachmentby people in wetland area, illegal mining, and alteration inwetland result in huge loss of wetland.
Following are some anthropogenic activities whichcauses degradation of wetlands.
Pollution: Water quality is directly proportional to thehuman population and its various activities. More than50,000 small and large lakes and wetlands are polluted at thepoint of being considered ‘dead’. The major polluting factorsare sewage, industrial pollution and agricultural runoffwhich may contain pesticides, fertilizers and herbicides(Prasad et al., 2002).
Eutrophication: Most of the wetlands nearby anagriculture area get affected because of nutrients throughwater runoff and leaching. Also in flood some nutrients getmixed with wetlands. Research at Moanatuatua Reserve hadfound increased phosphorus levels in the peat bog. Thephosphorus is probably from top dressing of aerialapplication of fertilizer (Clarkson, 1997).
Encroachment: Many wetlands get affected becauseof encroachment. Wetland area used for developmentalprojects such as industrial activities, human settlements andfor agricultural purposes. In many urban areas suchproblems has seen with the wetland. Many lakes in the worldare reclaimed for dam, bridge constructions, roadconstruction, for residential purposes, etc (Nairobi DamArea, Case Study, 2013).
Mining Activity: Mining in wetland area can alsoaffects the wetland ecosystem, it causes destruction of floraand fauna which lost the scenic beauty of that area. Furtherit pollutes the water resource, and cause erosion problem inthat area (NCSU).
Fishing practices: Some destructive fishing practicesfor catching fish affects wetland in ecosystem e.g. in somefishing operation use of explosives (blast fishing) is carriedout, which destroyed both living and nonliving habitat(Bobbink, et.al, 2008).
Tourist activity: Many wetlands become the source ofincome through tourist activity, but such activities causeddestruction in wetland area. For tourist purpose; land nearbyto wetland area is also converted into hotels and shops, whichdecreases the natural scenery in that area (Kotios, et.al 2009).
The Indian Scenario:
For the last two decades, urban water bodies havebeen a victim of unplanned urbanization in India. There area number of threats which is faced by urban water bodies intoday’s scenario. Many people from rural area migrated tourban area for employment which leads to inadequateinfrastructure for the disposal of waste, lack of sanitaryfacilities and scarcity of water. As a result, the water bodiesare used for the disposal of untreated local sewage andsolid waste, and in many cases the water bodies have beenultimately turned into landfills. e.g. many man-made lakes inVadodara, such as Wadi Waddi, Akota, Sevasi and Dasrath,facing above problem. (Kang, 2013) Almost all water bodiesfacing same problems.
Encroachment is another major threat to water bodiesparticularly in urban areas. A small piece of land in urbanarea has a high economic value. Hence, these urban waterbodies are not acknowledged for their ecosystem servicesbut used for real estate purpose. Both for the governmentand the private builders these lakes and wetlands areextremely profitable opportunities. Charkop Lake inMaharashtra, Deepor beel in Guwahati are well knownexamples of encroachment (MoEF, 2008).
Wetlands are closed system, large part of substancesthat enter in wetlands become a permanent part of thesystem, as a result, the entry of nutrients through raw sewagebecome the part of wetland system and cause variousdestructive changes in the water body such as prolificgrowth of aquatic weeds in lakes and ponds that ultimatelydisturb and kill the ecology of the water body. Enormousamount of nutrients entering in the lake, most of it trappedas sediment, while a fraction enters in the food chain andfood web sustaining eutrophic state of the water body (Zafer,1959).
Illegal mining for building material such as sand andstones both on the catchment area and on the bed of thelake also have extremely damaging impact on the water bodyand one of the reasons behind the destruction of waterbodies. As a result of excessive mining, water bodies losetheir ability to store water. For example, the Basamand Lakein Jodhpur, once the only source of drinking water for thecity of Jodhpur, has been suffering from illegal mining forthe last 20 years despite the court’s order to stop mining in1999 ( CSE,2012).
Unplanned tourism activities without systematicplanning and regulation are a major threat to urban waterbodies. Disturbance of wildlife, pollution because of wasteleft behind by tourists, changes in local lifestyles and lossof cultural heritage are some of the impacts of tourism onthe local environment. Dal Lake in Srinagar, Tso Morari andPongsho Lakes in Ladakh where the unplanned and

175
International Conference on Ecosystem Services of Wetlands - ‘Ardrabhumi :2016’ISBN : 978-81-923628-3-0
unregulated tourism has posed long-term negative impactsboth on biodiversity of the area and as well as on the localenvironment. These wetlands are facing problem ofunplanned and unregulated tourism (Chandan, 2008).
Conclusion:
Wetlands are precious and valuable throughout theevolutionary period of human race. To sustain the wellbeingof mankind on this earth planet; wetlands providedfundamental and functional key. ‘’Ramsar convention’’,‘’Wetlands (Conservation and Management) Rules 2010’’and programmes like, ‘’National Wetland ConservationProgramme’’ (NWCP) in India are taking efforts to provideprotection for this important resource.
In today’s scenario, there is an urgent need to savethis important natural resource, by making strict rules andregulation, which protects them from anthropogenic activity.Then and then only it will be possible to use this preciousresource in a right way and sustained its unique features inall sense.
References:
1) Bassi N., Kumar, M. D., Sharma, A., & Pardha-Saradhi,P. (2014). Status of wetlands in India: A review of extent,ecosystem benefits, threats and managementstrategies. Journal of Hydrology: Regional Studies, 2,1–19. http://doi.org/10.1016/j.ejrh.2014.07.001
2) Bobbink R., Beltman, B., Verhoven, J.T.A., Whigham,D.F (Eds). (2008) Wetlands: Functioning, Biodiversity,Conservation and restoration. Ecological studies,Springes 316 pp.
3) Bodh A. (2014,November 18), wetlands facing threat inIndia: times of India ,Retrieved from /http://timesofindia.indiatimes.com/home/environment/flora-fauna/Wetlands-facing-threat-in-India
4) Bryan C. (2012 October,16),Vital Economic andEnvironmental Role of Wetlands Must Be Recognizedto Avoid Further Degradation and Losses, UNEPNEWS DESK,( in Hyderabad) Retrieved from http://www.unep.org/newscentre
5) Breaux A., Farber S. Day J.(1995),Using Natural CoastalWetlands Systems for Wastewater Treatment: AnEconomic Benefit Analysis,Vol.44,issue 3,Pg 285–291
6) Comer P., K. Goodin, et.al.,(2005). Biodiversity Valuesof Geographically Isolated Wetlands: An Analysis of20 U.S. States. Nature Serve, Arlington, VA. pp. 63.
7) Conservation and Management of Lakes-An IndianPerspective (2010), Ministry of Environment andForests, New Delhi.
8) Chandrashekhar R.(2015 february5),VanishingWetland, The Hindu Retrieved from http://www.thehindu.com/features/kids/vanishing-wetlands/article
9) Clarkson, B. (1997): Vegetation recovery following firein two Waikato peatlands at Whangamarino andMoanatuatua, New Zealand. New Zealand Journal ofBotany 35:167–179
10) Chandan P.,Chatterjee A.,& GautamP.(2008),”Management Planning of Himalayan HighAltitude Wetlands. A Case study of Tsomoriri andtsokar Wetlands in Ladakh, India”, Proceedings of Taal2007: The 12th World Lake Conference: 1446-1452.
11) Effects of Land use Encroachment on Wetlands: A casestudy Nairobi Dam Area (2013),Department of Urbanand Regional Planning, Uni.of Nairobi, http://urbanplanning.uonbi.ac.ke/node/1092
12) Environmental Protection Agency (EPA) Wetland,(2006), 1-4.Retrieved from papers 2://publication/uuid/3D803D9C-745F-48A0-9F7F-F3C99A0A2CD7
13) Erwin K.L.,(2009), Wetlands and Global ClimateChange:The role of wetland restoration in a changingworld.Wetlands Ecology and Management, 17(1),71-84.http://doi.org/10.1007/s11273-008-9119-1
14) Kang A.,(2013), Briefing Paper: Legal ,Institutional andTechnical Framework for Lake/WetlandProtection,Centre for Science and Environment.pp1-14
15) Kodarkar M.(2008), Conservation of Lakes, IndianAssociation of Aquatic Biologists,Hyderabad,61-68.
16) Kotios A., Plageras P., Galanos G.,Koutoulakis M.,Saratsis Y.,(2009),The Impact of Tourism on WaterDemand and Wetlands: Searching for a SustainableCoexistence,Discussion Paper Series,15(4):71-88,Department of Planning and Regional Development ,School of Engineering, University of Thessaly.
17) Kotze D.(2000), Wetlands and water qualityenhancement, Mondi Wetland Project, School ofApplied Environmental Sciences, University of Natal.
18) Narain S.(2012),State of India’s Environment, centre forscience and environment ,ISBN no.978-81-86906-(Vol.1),55-2,New Delhi.
19) NCRPB(National Capital Region PlanningBoard,(2013),Draft revised plan for2012projects,Ministry of Urban Development,NewDelhi, retrieved from http://ncrpb.nic.in/water_workshop.php

176
International Conference on Ecosystem Services of Wetlands - ‘Ardrabhumi :2016’ISBN : 978-81-923628-3-0
20) Paul A.Keddy,(2010),Wetland Ecology Principle andConservation,Cambridge University Press,New York.
21) Prasad S.,Ramchandra T., Ahalya N., Sengupta T.,Kumar A., Tiwari A., Vijayan L.,(2002),Conservation ofWetlands of India-A review.,Tropical Ecology,43(1),173-186.
22) Russi D.,Tenbrik P.,et.al. (2013), The Economics ofEcosystem and Biodiversity for Water and WetlandReport,VASA,84.
23) Report on visit to Deepor Beel in Assam- A Wetlandincluded under national Wetland and Managementprogramme of the Ministry of Environment andForests,(2008),Planning Commision.
24) Zafer A.,(1959)Taxonomy of Lakes, Hydrobiologia,13(3):187-299
25) www. n c s u . e d u / w a t e r s h e d s / i n f o / w e t l a n d s /wetloss.html, Wetland Loss and Degradation, NorthCarolina State University.
26) www.ramsar.org

177
International Conference on Ecosystem Services of Wetlands - ‘Ardrabhumi :2016’ISBN : 978-81-923628-3-0
Effect of Idol Immersion on Water Quality of Bhandupeshwar Talao, Bhandup
Ashwini Jadhav, Priyanka Yadav, Neha Sawant and SakshiDepartment of Botany, D. G. Ruparel College of Arts, Science, and Commerce, Mahim, Mumbai-400016
Abstract : The present study deals with assessment of the water quality of Bhandupeshwartalao during idol immersion. Forthe study samples were collected one day before Ganesh festivals and one day after idol immersion (Ganesh festivals) inSeptember 2015. The water parameters analyzed were BOD, DO, COD, alkalinity etc. & the higher values were obtained afterthe idol immersion. The current research study indicates that pollution load on the talao has increased significantly after idolimmersion.
Key words: Water quality, idol immersion, Bhandupeshwar talao.
Introduction
The ponds & lakes are the important part of ecosystemwhich supports diverse aquatic life. The Indian religiousactivities have a deep relationship with water bodies. In recentyears the practice of ideal immersion has become a growingcause for concern on account of its adverse environmentalimpact. The idols are made up of plaster of paris and arepainted with toxic dyes that contain harmful chemicals. Alongwith idol there are several accessories during the worshipwhich are collectively refer to as ‘Nirmalya’ these includesflowers, fruits, incense, camphor and thermocol.
Materials & Methods:
Bhandupeshwar talao is situated in Bhandup neareastern express highway. The study was conducted todetermine the quality of water. The water sample wascollected a day before Ganesh festival and a day after idolimmersion to study the physico-chemical parameters ofBhandupeshwar talao in September 2015.
To determine the water quality following parameterswere tested for Alkalinity, COD, DO, BOD, pH, Phosphatesusing standard methods.
Parameter MethodspH Digital pH meterDissolved oxygen and BOD Winkler’s Titrimetric methodPhosphates Acid Molybdate methodAlkalinity Phenolpthalein & methyl
orange indicator methodCOD Titrimetry method
Observation table:
Parameters Tested Pre-immersion Post-immersionAlkalinity 160 mg/l 250 mg/l
COD 20 mg/l 31 mg/lDO 4.0 mg/l 2.7 mg/l
BOD 3.7 mg/l 5.9 mg/lpH 8.0 8.7
Phosphate 1.18 mg/l 1.30 mg/l
Results and discussion:
pH: pH is an important limiting factor for aquatic life. Ifthe water is too acidic or basic, the H+ or OH- ions maydisrupt the aquatic organisms. The post-immersion pHvalues are slightly higher. Malik et. al. (2012) got similarresults in case of Par River.
BOD: Biochemical oxygen demand is an importantparameter in estimating the pollution status of a water body.In itself BOD is not a pollutant and has no direct harm but itmay cause indirect harm by reducing the dissolved oxygenconcentration levels. (Muralidharan et. al., 2015) Here, thevalue of BOD before immersion was 3.7 mg/l and afterimmersion was 5.9 mg/l. The high BOD value may beattributed to the immersion of ‘Nirmalya’, which includesflowers, fruits and leaves, etc., which in turn could havebeen responsible for the increase in the organic matter ofthe pond. This increase in organic-matter lead to theincrease in microbial activity.
DO: DO is the most important factor of a water bodyto support aquatic life. The present study showed the pre-immersion value of DO as 4.0 mg/l which is within the normalrange, and post-immersion value was 2.7 mg/l. This value isslightly lower than the normal range which is 3 mg/l. Jadhavand Dongare (2009) also reported similar results.
COD: Chemical oxygen demand is the measure ofoxygen consumed during oxidation of the oxidizable matterby a strong oxidizing agent. According to Rekha Rani et. al.,(2004), the high value of COD indicates the possibility ofpollution due to oxidizable organic matter. The COD valuesbefore and after immersion were higher than the standard 10mg/l value. This could be because of the incessant andindiscriminate immersion of idols in this area every year; henceeven the pre-immersion values of COD were higher too.
Phosphates: Phosphates are one of the importantparameters to assess biological activity. With increase in thephosphate content, there is increase in growth of phyto-planktons. Sawyer et. al., reported that the value above 0.03 mg/l is considered sufficient to produce algal blooms. The values ofpre-immersion and post-immersion are towards a higher range.

178
International Conference on Ecosystem Services of Wetlands - ‘Ardrabhumi :2016’ISBN : 978-81-923628-3-0
Conclusion and Recommendations:
The current research study indicates that pollutionload on the pond has increased significantly after idolimmersion. Hence, use of eco-friendly idols is more prudent.The immersion of ‘Nirmalaya’ leads to increase in the organicmatter of the pond, which in turn leads to decrease in thedissolved oxygen rates, and increase in the biologicaloxygen demands. All these values affect the water qualityin such a way that the aquatic habitat of these waterresources gets deteriorated. Restricting the use of non-biodegradable material such as thermocol all together is agood way to avoid such problems and composting allbiodegraded material is a good way of making ourenvironment pollution free.
References:
APHA, standard methods for examination of water & wastewater, American Public Health Association Washington,D.C., 21st Edition (2005).
Dhote S., Varghese B., & Mishra S.M., Impact of Idolimmersion on water quality of twin lakes of Bhopal, IndianJournal of Environment Protection, 21, 998-1005 (2001).
Goldin Quadros, Vidya Mishra Mishra,Vidya Ullal, K.S.Gokhale and R.P Athalye (2001) Status of Water Quality ofThane Creek [India]- EcolEnv. & Conv. 7[3].
Jadhav P, & Dongare M. (2009). Evaluation of dissolvedoxygen in Ex Situ Ganesh Idol immersion, NatureEnvironment & Pollution Technology, 8(3), 561-564.
Kori R., Parashar S., & Basu D. D. Guide Manual Water andWaste Water Analysis-Central Pollution Control Board.
Malik G.M., Raval V.H., Zadafia S.K., & Patel A.V. (2010). Idolimmersion physico-chemical properties of South Gujaratrivers, Current World Environment Journal, 5(1), 173-176.
Malik G.M., Raval V.H., Zadafia S.K.,& Patel A.V. (2012) Idolimmersion physico-chemical properties of South Gujaratrivers India, Research Journal of Chemical Sciences, 2(3),21-25.
Muralidharan L., Oza A., Singh A. (2015). A study onphysiochemical analysis of heavily polluted Shivaji Talao,and its impact on aquatic bodies. Proceedings Wetlands:Present status, ecology and conservation. ISBN: 978-81-925005-3-9, 232-239.
Rekha Rani B. K., Gupthaand K. and Shrivastava B. L., 2004,‘Studies on Enviro-Ecological status of Mandakini River inChitrakoot’. Poll. Res. Vol. 23(4) pp: 677-679.
Sawyer, C. N., Lackey, J. B. and Lenz, R. T., (1945).Investigation of the odour nuisancy occurring in theMadison lakes, particularly Monona, Waubesa, andKegonsa, from July, 1944. Retp. Government’s Committee,Madison, Wis. pp: 92-100.

179
International Conference on Ecosystem Services of Wetlands - ‘Ardrabhumi :2016’ISBN : 978-81-923628-3-0
Wetland Protection and Management
Ujwala Sav and Maria AcharyVidyalankar School of Information Technology, Wadala Mumbai.
[email protected], [email protected]
Abstract: In today’s world,there is a huge increment in wetland use because of population growth, climate change and manyother issues. Many wetlands are slowly disappeared because of human population pressure.Therefore, it is a need to protectwetland and manage to control the environmental balance. This proposed paper consists of overview of wetland protectionand management issues. This paper also proposed some social and technical solutions to protect and manage wetland.
Key words: Wetland, Remote Sensing
1.Introduction:
Wetlands are important natural resources forenvironmental balance. Wetlands occupy only about 6% ofearth’s service but are among the most protectiveecosystem. A wetland is a land area that is saturated withwater, either permanently or seasonally, such that it takeson the characteristics of a distinct ecosystem.The primaryfactor that distinguishes wetlands from other land formsFig 1: WETLANDS
or water bodies is the characteristic vegetation ofaquatic plants, adapted to the unique hydric soil (Wikipedia).Water, soil and vegetation in wetland provides uniqueecosystem. Wetland also supports humanpopulationcontrolling the environment and balancingclimate. Wetlands are used for different purposes due toglobalization there is arapid growth in urbanization andindustrialization. It is required to protect wetlandsbyimplementing various methods of protections.
2 .Barriers in wetland protection and management:
1) Financial: To implement technical system for wetlandprotection and Management huge funds are required .Government and private sectors are not interested inproviding finance.
2) Technical: MODIS (Moderate Resolution ImagingSpectroradiometer) and MISR (Multiangle ImagingSpectroradiometer) satellite sensors are costly doesnot comes according to budget8 of government
3) Political: since some area’s are restricted to constructionof buildings are also consider leads to depletion ofwetlands
4) Implementation:Since using Remote sensors the costis more for the implementation of project under wetlands
5) Natural Disaster: Wetlands are damaged because ofnatural disasterslikeflood, earthquake, volcanoes,drought, storms, hurricanes.
3 .Wetlands Protection Laws and Policies:
1) The existing body of laws (within the federal structureof the Government of India) applicable to wetlands canbe classified into four categories: centrallaws, statelaws, municipal laws as well as customary laws(sanctioning wise use ormanagement of wetlands)
4.Technical Solution for wetlands protection andManagement:
4.1 Internet of Things (IOT)
Wetland protection using IOT urbanization and smartcity development expanding human activities and extendedcity boundaries.wetlands are going on shrinking.wetlandsare damaged .to protect the wetland requires continuousmonitoring system,that can be possible by implementingtechnology like IOT’s means Internet of things .It will beautomated monitoring system.IOT will help in collection ofrealtime data wetlands which will be processed andanalysed.this analysed data will give.

180
International Conference on Ecosystem Services of Wetlands - ‘Ardrabhumi :2016’ISBN : 978-81-923628-3-0
FIG:2 IOT
real picture IOT’s is a network that connects anythingto the Internet can exchange information through radiofrequency identification(RFID), Sensor networks, globalpositioning system(GPS) IOT has connectivity foranytime,anywhere anyone and anything,
4.2 Remote Sensing in wetlands:
Remote sensing has provided a great mean to studyvarious ecosystems of the earth including wetlands byproviding cost and time effective data. Over the years,remote sensing has been used as a tool to map large areasof wetlands. Moreover, remote sensing in the form of aerialphotography served the purpose of identification,delineation and measurement of spatial extent of wetlandsuccessfully (e.g., National Wetland Inventory (NWI) )(Reimold et al, 1973).With regular passages of remotesensing vehicles (aircraft and/or satellites) over a locality,land information in the form of multi-date, multi-spectralimages can be obtained within a constant period of time.Changes in surface environmental conditions can thereforebe monitored using space-borne digital imageries. Withlaunch of remote sensing satellites like the Landsat serieswith Multispectral Scanner (MSS) and later ThematicMapper (TM), it has become cost effective and convenientto acquire multi-date digital images over a greater array ofspatial and temporal scales than was possible with aerialphotography. Landsat-MSS has been used successfully forthe study of relatively larger wetlands ( Klemas et al, 1975,Work and Gilmer 1976, Gilmer et al, 1980, Jensen et al, 1986,and other ). Yet, its use is very limited for studies of differentaspects (e.g., vegetation species identification,discrimination, etc.) of all types of wetlands, specifically,inland wetlands which usually have smaller areal extent and
complex mixture of vegetation species. Basic constraints ofusing Landsat-MSS data for wetland mapping inventory inearly studies were geometric inaccuracy and the poor spatial,spectral, and radiometric resolutions of data (Carter, 1982).Availability of Landsat-TM data solved this problem ofcoarse resolutions to some extent. With a spatial resolutionof 30 meters, it becomes possible to study relatively smallerareas (Dottavio and Dottavio, 1984, Adeniyi et al, 1985).
TM July 16, 1986 TM July 14, 1991 TM April 27, 1992
Digital Change Detection Techniques
One major and wide spread use of remotely senseddata has been easier, faster, and cost effective investigationof various types of changes in different environments. Forexample, remote sensing based change detection has beenused to monitor and control urban development, assessand monitor deforestation, and improve agricultural yieldsby detecting early crop stresses and diseases, etc. However,wetland environment is an exception. Although, wetlandsare among the most productive and important ecosystemsof the world, few studies using remote sensing data havebeen conducted to monitor changes in wetlands especially,inland freshwater wetlands (Carter 1977, Wickware andHowarth 1981, Frick 1984, and others).
There are several digital change detection algorithmsor techniques which have been developed and used overthe years to estimate changes using remote sensing (in mostcases satellite) data. These techniques are based on variousmathematical and/or statistical relationships, principles andassumptions. The use of one specific change detectiontechnique or method over another can calculate asignificantly different estimate of the change for a samearea. Therefore, it is important to use the most appropriatetechnique to study a particular area and environment.
To explain the application of digital change detectiontechniques here I give one example. An overall aim of thisstudy was to detect and map changes in the areal extent ofstanding surficial water and wetlands over time, severalstandard, commonly used image-analysis techniques wereconsidered. Out of all the techniques Tasseled CapTransformation (TCT) was selected to use for the study.TCT is a method to convert an input image acquired by amultispectral sensor (i.e., one operating simultaneously inseveral spectral regions such as visible green, visible red,

181
International Conference on Ecosystem Services of Wetlands - ‘Ardrabhumi :2016’ISBN : 978-81-923628-3-0
and near-infrared) into an image which has three main outputcomponents that highlight feature classes such as bare soil,vegetation, and water (Kauth and Thomas 1976, Crist andKauth 1986, and Crist 1985)
TCT July 16, 1986 TCT July 14, 1991 TCT April 27, 1992
The calculation of TCT, which is a complex procedureinvolving the linear combination of all the bands of an image,results in six synthetic output channels for a Landsat-TMimage, where band 1 corresponds to soil brightness, band 2to vegetation greenness, band 3 to wetness, band 4 to hazein the atmosphere, and bands 5 and 6 to system noise. Trialand error confirmed, for Brown County, that a combination
of first two transformed bands provided a best result forseparating vegetation, soil and water. The two transformedbands (synthetic channels) were then used to classify theimage subset for the study area into three general classes(soil, vegetation, and water).
TCT July 16, 1986 TCT July 14, 1991 TCT April 27, 1992
These classes were then labeled, evaluated, and verifiedby comparing them to both black-and-white and color-infraredaerial phonographs, and also to NWI results. Areas of surficialwater and wetlands in and around each lake in the study areawere then calculated. The same procedure was applied for allthree TM images (1986, 1991, and 1992).
Lake areas, 1986 Lake areas, 1991 Lake areas, 1992 Wetland areas, 1986
Wetland areas, 1991
Wetland areas, 1992
5. Recommendation for Wetland Protection andManagement:
1) Awareness for importance of wetland.
2) Amendment of laws and policies: In current laws thereare certain loopholes which can beamendedfor properprotection to the wetlands.
3) Use of Remote Sensing Technology for monitoringwetlands.It identify the status of wetlands on map.
4) Society can provide financial and technical assistantsto protect wetlands and their related components.
5) Removal of invasive species and planting diversity ofwetlands. It is cost effective and easy to implement
6.Conclusion:
This paper proposed technical solution for wetlandprotection and management. Wetland can be monitored withthe help IOT’s and Remote Sensing Technology, so thatwetland can be saved on time to balance environment. Thispaper also given some recommendation other than technical
solution like awareness, laws amendment, Removal ofinvasive species and planting diversity.
7. References:
1) The Ramsar Convention And National Laws AndPolicies For Wetlands In India-Devaki Panini
2) https://en.wikipedia.org/wiki/Wetland
3) h t t p : / / c i m i c . r u t g e s . e d u / ~ p r o j e c t / e p a /wetlands_solutions.htm
4) Remote sensing based assessment of small wetlands inEast Africa Erlangung des Doktorgrades (Dr. rer. nat.)
5) http://casde.unl.edu/activities/wetlands/index.php
6) Use of Remote Sensing to Support Forest andWetlands Policies in the USA Audrey L. Mayer 1,*and Ricardo D. Lopez 2,†2011, 3,

182
International Conference on Ecosystem Services of Wetlands - ‘Ardrabhumi :2016’ISBN : 978-81-923628-3-0
Comparibility of Lipid and Protein In Shrimps: Rich Food of Wetland
Vinda Manjramkar, Juilee Koli, Riddhi Koli, Megha Khose, Rakesh Rudruke, Rushabh Chaudhari and Pawan PatilZoology Department, B. N. Bandodkar College of Science.
Abstract: Shrimp has been enjoyed as a part of cuisine and adjuvant in vegetables in fresh as well as dry form all over the world,but it has dietary role to play in coastal community in India. Dry form of shrimps is used during rainy season when fishing isstopped. In the present study the protein and lipid content from Acetes (small shrimps), large shrimps and prawns werecompared with each other. Acetes a translucent delicate bodied shrimp is consumed locally in dry as well as fresh form - as isless expensive. Protein content of different shrimp varieties revealed higher value of protein 17.6% and lipid content was0.530% in Acetes (shell peeled)The less amount of protein is observed in Karandi (pink shrimp)11.6% that of lipid is 0.673%and estuarine shrimp protein content is 11.7% whereas lipid is 0.526% Tiger prawn and red prawn had value of 16.5% and16.3% of protein ,whereas lipid content was 0.510% and0.492% respectively. The present study concludes that Acetes(jawala) can be considered as a good source of fatty acid as well as protein in the diet of fisherman community.
Key words; Acetes Karandi shrimp prawns lipids protein
Introduction:
The term shrimp is a generic term for some decapodcrustaceans, although the exact animals covered can vary.According to the crustacean taxonomist Chan (1998), Theterms shrimp and prawn have no definite reference to anyknown taxonomic groups. Although the term shrimp issometimes applied to smaller species, while prawn is moreoften used for larger forms, there is no clear distinctionbetween both terms and their usage is often confused oreven reverses in different countries or regions, Shrimp arewidespread and abundant. Shrimp is one of the world’s mostpopular shellfish. It provides high quality rich protein,calcium and various extractable compounds and mineralsfor human body, while low in calorie and fat (Abdullah et al.,2009). Lipid of shrimp contains mostly polyunsaturated fattyacids (essential fatty acids). These essential fatty acids areavailable in shrimp provides health benefits for human e.g.,eye (retina) and brain development and function (Conner etal., 1992) , shrimp ranks as a very good source of protein atWH Foods (2016), and provides over half of the Daily Value(DV) in each serving. In fact, among all WH Foods, shrimpranks as our 8th best source of protein. Therefore the presentstudy emphasis on estimating proximate constituents liketotal protein and lipids from different varieties of shrimps.
Material and Method: Samples were collected fromlocal market of Thane city and studied for length and wetweight, protein, lipid content in cooked. shrimps prawnsand Acetes (krill). Protein was estimated by Lowry’s methods(Lowry, 1951) and Total lipid content by Phosphovanillinmethod (Fendley, 1975). Statistical analysis was done bysimple percentage and mean method.
Observation and discussion:
Karandi (small pink shrimps)
Sample Length Weight Lipids Protein cm (%) (%)cooked
Sample 1 8.4 1.384 0.572 12Sample 2 7 0.892 0.731 14Sample 3 7.5 1.196 0.700 10.3Sample 4 7.2 0.821 0.954 10.4Sample 5 6.6 1.016 0.445 11.5Sample 6 6.8 1.076 0.636 11.2Mean 7.25 0.941 0.673 11.6
sadhi kolambi (red prawn)
Sample Length Weight Lipids Protein cm (%) (%)cooked
Sample 1 10.2 3.035 0.509 12.9Sample 2 10.7 3.255 0.445 13.0Sample 3 10.4 3.295 0.477 18.4Sample 4 9.9 2.964 0.572 15.1Sample 5 9.2 3.003 0.509 16.5Sample 6 10.4 3.518 0.413 22.1Mean 10.13 3.17 0.492 16.3
Estuarine prawn (Metapenaeus sp.)
Sample Length Weight Lipids Protein cm (%) (%)cooked
Sample 1 14.3 11.18 0.636 12.8Sample 2 14.7 11.72 0.445 9.76Sample 3 13.1 10.83 0.731 9.76Sample 4 14.5 12.07 0.700 18.1Sample 5 14.7 11.31 0.636 9.4Sample 6 14.7 11.10 0.413 10.3Mean 14.3 11.36 0.526 11.7

183
International Conference on Ecosystem Services of Wetlands - ‘Ardrabhumi :2016’ISBN : 978-81-923628-3-0
Tiger prawn
Sample Length Weight Lipids Protein cm (%) (%)cooked
Sample 1 10.9 7.7 0. 477 12.82Sample 2 12.2 8.1 0.572 19.29Sample 3 14.9 17 0.572 18.0Sample 4 15.9 19.19 0.509 19.24Sample 5 17.6 26.67 0.477 16.9Sample 6 15.6 21.33 0.509 13.0Mean 14.51 16.67 0.510 16.5
Acetes (krill/jawala)
Sample Length Weight Lipids Protein cm (%) (%)cooked
Sample 1 2.2 0.024 0.668 18.8Sample 2 2.2 0.018 0.509 17.8Sample 3 2.3 0.025 0.54 21.5Sample 4 2.2 0.026 0.668 13.8Sample 5 2 0.015 0.477 19.8Sample 6 2.2 0.013 0.318 13.7Mean 2.2 0.0201 0.530 17.6
Discussion:
Shrimp is considered as a high-range proteincontaining nutrient like fish, which contain 8% to 20%protein. It has been reported that protein content of shrimpranged between 17% and 21% depending on the species(Sriket et al., 2007; Yanar and Celik, 2006). According toSambhu and Jayaprakash (1994), the protein level in Penaeusindicus was varied from 44.62% to 80.87%. The high proteincontent in the lowest size groups may be attributed toincreased protein synthesis during the active growth phaseas it has been observed in shrimps and mantis shrimps(Achuthan Kutty and Parulekar, 1984; Ajith kumar, 1990;Tanuja, 1996; Pedrazzoli et al., 1998). According to the studyof Sriraman (1978), the protein content of crustaceans andmollusks were around 20%. In the present investigation,the protein and lipid content of Acetes was high whencompared. Other species in our investigations also had highprotein, which is in accordance with findings of Sriraman(1978), Nair and Prabhu (1990) and Reddy and Shanbhogue(1994), Ravichandran (2000). Protein was the dominantbiochemical constituent in the organs of prawns (Pillay andNair, 1973; Achuthankutty and Parulekar, 1984) and in all theprawn species investigated. Similar observations werenoticed by Sriraman and Reddy (1977) for P. indicus and P.monodon. According to Kizevetter, (1971); Okada andNoguchi, (1974), lipids also form a major component of yolkin decapods crustaceans. The majority of lipids stored inoocytes are derived from extraneous sources, particularlythe hepatopancreas (Varadarajan and Subramoniam, 1982).
Polyunsaturated fatty acids (PUFAs) in shrimp account forabout 40% of the total fatty acid content (De Moura, 2002).In the present study, utmost level of lipids was presented inKarandi (small pink shrimp) and Acetes indicus, similarfinding are recorded by Rexi et al. (2015) in study of Penaeusindicus, Penaeus monodon and Acetes indicus. Whereasin our findings red prawn and tiger prawn have less amountof lipids compared to Karandi and Acetes. Generally, themuscle of the prawn contained lower quantity of lipidBhavan et al. (2010). The amount of proteins and lipid (Omega3 fatty acids) found in small version of Shrimp, Acetes,Karandi which can complete the demand of food supply toevery class of consumer.
Conclusion: Since the tiger prawns, red prawns,estuarine prawns (catch is usually low due to pollution) arecostly and all the consumers cannot afford to buy henceAcetes and Karandi should be used in consumption withouthesitation, they very rich in protein, Astaxanthin, lipidsOmega 3 fatty acids, also less calories, so there is no chanceof gaining weight due to consumption. Overall shrimps andprawns can be good source of proteins and lipids
References:
Abdullah O, Ayse O, Mevlut A, Gozde G, Jelena M (2009). Acomparative study on proximate, mineral and fatty acidcompositions of deep seawater rose shrimp (Parapenaeuslongirostris, Lucas, 1846) and red shrimp (Plesionika martia,A. Milne-Edwards, 1883). J. Anim. Vet. Adv. 8(1):183-189
Achuthan Kutty, C.T. andA.H.Parulekar 1984. Biochemicalcomposition of muscle tissue of penaeid prawns. Mahasagar,Bull. Natn. Inst. Oceanogr., 17(4): 239-24
Ajith kumar M (1990). Studies on the proximate compositionof the prawn Macrobrachium idella (Hilgendorf). M. philThesis, Annamalai University. pp. 1-28
Bhavan, S., Saravana, S., Radhakrishnan,S., Shanthi, R., andPoongodi, R., 2010.”Proximate composition and profiles ofamino acids and fatty Acids in the muscle of adult malesand females of commercially viable prawn speciesMacrobrachium rosenbergii collected from natural culture”,Inter. J. Biolog., 2( 2) :107-119
Conner WE, Neuringer M, Reisbick S (1992). Essential fattyacids: The importance of n-3 fatty acids in the retina andbrain. Nutr. Rev. 50:21- 29
Chan, TY (1998) Shrimps and prawns In K.E. Carpenter &V.H. Niem. The living marine resources of the western centralPacific. FAO species identification guide for fisherypurposes. Rome, environments

184
International Conference on Ecosystem Services of Wetlands - ‘Ardrabhumi :2016’ISBN : 978-81-923628-3-0
De Moura A., Torres R., Mancini J., Tenuta A.Characterization of the lipid portion of pink shrimpcommercial samples. Arch. Latinoam Nutr. 2002;52:207–211.(PubMed)
Frings Christopher S; Fendley Ted W., 1977 Mar. 15 [11]4,012,196 [45], United States Patent [19]
Kizevetter, I.V 1971. Technological and chemicalcharacteristics of commercial fish of the Pacific Ocean Basin.(TNIRO, Vladivostok, 1971) pp168–169
Lowry, O.H., Rosebrough, N.H., Farr, A.L. and Randall, R.J.,1951. Protein measurement with folin phenol reagent. J.Biol.Chem., 193(1):265-275.
Nair AL, Prabhu PV (1990). Protein concentrates from tinyprawns. J. Mar. boil. Assoc. India 32(1-2):198-200.
Okada, M. and Noguchi, E. (1974). Trends in the utilizationof Alaska pollack in Japan in Fishery Products (ed. R.Kreuzer) (Fishing News Books, 1974) pp189–193
Pillay, K.K. and N.B.Nair 1973. Observations on thebiochemical changes in gonads and other organs of Ucaannulipes, Portunus pelagicus and Metapenaeus affinis(Decapoda: Curstacea) during reproductive cycle. Mar. Biol.,18:167-198.
Pedrazzoli A, Molina C, Montoya N, Townsend S, Leon-Hing A, Parades Y, Calderon J (1998). Recent Advances onNutrition Research of Penaeus vannamei in Ecuador. Rev.Fish. Sci. 6:1-2.
Rexi P., Joycy Jay Manoharam & P. Priya: 2015 ComparisonOf The Proximate Composition Of Fresh And CookedMuscles Of Some Prawns International Journal ofInformative & Futuristic Research (IJIFR) Volume -2,22ndEdition, Page No: 3537-3541
Ravichandran R (2000). Biodiversity, Litter processing, Leafpreference and growth, biochemical and microbial aspectsin crabs of Pichavaram mangroves. Ph.D. Thesis, AnnamalaiUniversity, India.
Reddy HRV, Shanbhogue SL (1994). Biochemical changesin different tissues of the mantis shrimp, Oratosq uilla neppa(Stomato poda) during reproductive cycle. Indian J. Mar.Sci. 23:247-249
Sambhu C, Jayaprakash V (1994). Effect of hormones ongrowth, Food conversion and proximate composition of thewhite prawn, Penaeus indicus (Milne Edwards). Indian J.Mar.Sci. 23:232-235
Sriraman, K and P.S.Reddy 1977. Biochemical studies inplanktonic juveniles and adults of Penaeus indicus andPenaeus monodon. In: Proceedings of the Symposium onWarm Water Zooplankton, 693- 699. Spl. Publ, NIO / UNESCO
Sriraman K (1978). Biological and biochemical studies onthe prawns of Portonova coast (Crustacea: Decapoda:Macrura). Ph.D. Thesis, Annamalai University, India. P. 69
Sriket S, Benjakul P, Visessanguan W, Kijroongrojana K(2007). Comparative studies on chemical composition andthermal properties of black tiger shrimp (Penaeus monodon)and white shrimp (Penaeus vannamei) meats. Food Chem.103:1199-1207
Tanuja R (1996). Some aspects of biology and utilization ofthe mantis shrimp Oratosquilla neppa from Cochin waters.Ph.D. Thesis, Cochin University of Science and technology,India. P. 87.
Varadarajan, S. and Subramonian, T. 1982 a. Biochemicalchanges during vitello genesis in a hermit crab, Clibanariusclibanarius. In: “Progress in invertebrate reproduction andaquaculture” (T. Subramonian and S. Varadarajan, Eds),Madras. pp. 7-14.
www.whfood.org.2016
Yanar Y, Celik M (2006). Seasonal amino acid profiles andmineral content of green tiger shrimp (Penaus semisulcatus,De Haan, 1844) and speckled shrimp (Metapenausmonoceros, Fabricus 1789) from the Eastern Mediterraneansea. Food Chem. 94:33-36.
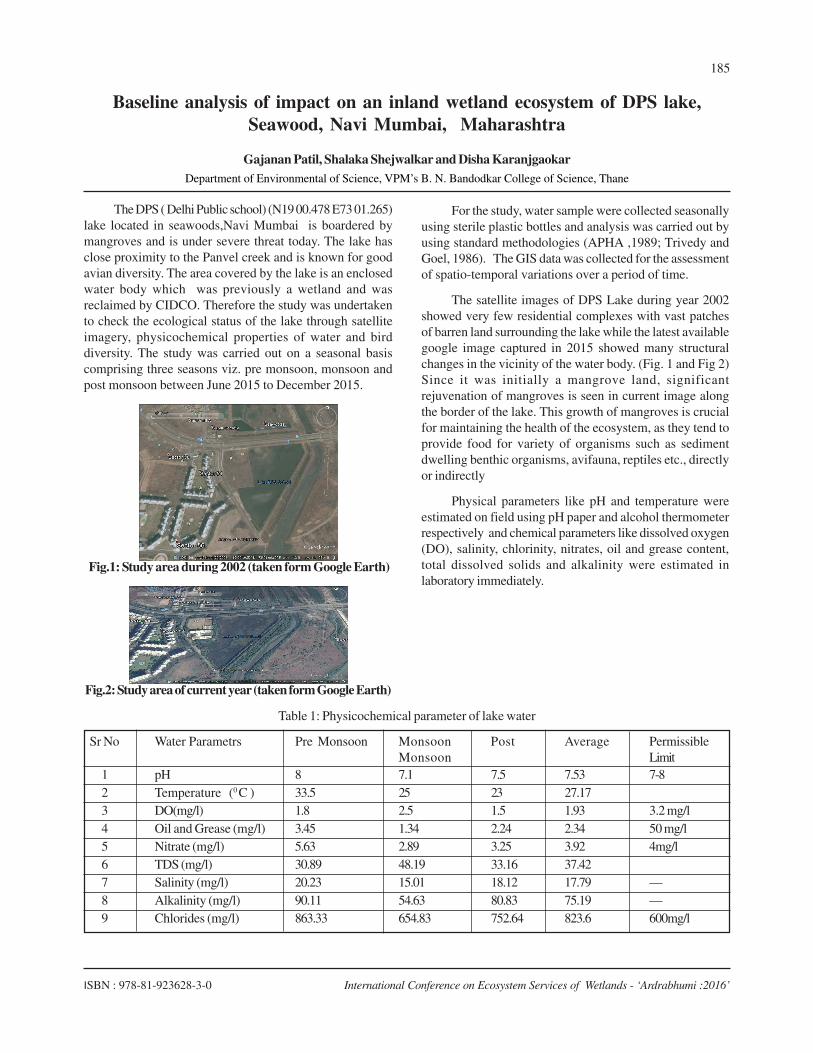
185
International Conference on Ecosystem Services of Wetlands - ‘Ardrabhumi :2016’ISBN : 978-81-923628-3-0
Baseline analysis of impact on an inland wetland ecosystem of DPS lake,Seawood, Navi Mumbai, Maharashtra
Gajanan Patil, Shalaka Shejwalkar and Disha KaranjgaokarDepartment of Environmental of Science, VPM’s B. N. Bandodkar College of Science, Thane
The DPS ( Delhi Public school) (N19 00.478 E73 01.265)lake located in seawoods,Navi Mumbai is boardered bymangroves and is under severe threat today. The lake hasclose proximity to the Panvel creek and is known for goodavian diversity. The area covered by the lake is an enclosedwater body which was previously a wetland and wasreclaimed by CIDCO. Therefore the study was undertakento check the ecological status of the lake through satelliteimagery, physicochemical properties of water and birddiversity. The study was carried out on a seasonal basiscomprising three seasons viz. pre monsoon, monsoon andpost monsoon between June 2015 to December 2015.
Fig.1: Study area during 2002 (taken form Google Earth)
Fig.2: Study area of current year (taken form Google Earth)
For the study, water sample were collected seasonallyusing sterile plastic bottles and analysis was carried out byusing standard methodologies (APHA ,1989; Trivedy andGoel, 1986). The GIS data was collected for the assessmentof spatio-temporal variations over a period of time.
The satellite images of DPS Lake during year 2002showed very few residential complexes with vast patchesof barren land surrounding the lake while the latest availablegoogle image captured in 2015 showed many structuralchanges in the vicinity of the water body. (Fig. 1 and Fig 2)Since it was initially a mangrove land, significantrejuvenation of mangroves is seen in current image alongthe border of the lake. This growth of mangroves is crucialfor maintaining the health of the ecosystem, as they tend toprovide food for variety of organisms such as sedimentdwelling benthic organisms, avifauna, reptiles etc., directlyor indirectly
Physical parameters like pH and temperature wereestimated on field using pH paper and alcohol thermometerrespectively and chemical parameters like dissolved oxygen(DO), salinity, chlorinity, nitrates, oil and grease content,total dissolved solids and alkalinity were estimated inlaboratory immediately.
Table 1: Physicochemical parameter of lake water
Sr No Water Parametrs Pre Monsoon Monsoon Post Average PermissibleMonsoon Limit
1 pH 8 7.1 7.5 7.53 7-82 Temperature (0 C ) 33.5 25 23 27.173 DO(mg/l) 1.8 2.5 1.5 1.93 3.2 mg/l4 Oil and Grease (mg/l) 3.45 1.34 2.24 2.34 50 mg/l5 Nitrate (mg/l) 5.63 2.89 3.25 3.92 4mg/l6 TDS (mg/l) 30.89 48.19 33.16 37.427 Salinity (mg/l) 20.23 15.01 18.12 17.79 —8 Alkalinity (mg/l) 90.11 54.63 80.83 75.19 —9 Chlorides (mg/l) 863.33 654.83 752.64 823.6 600mg/l

186
International Conference on Ecosystem Services of Wetlands - ‘Ardrabhumi :2016’ISBN : 978-81-923628-3-0
The average pH of the water sample was 7.5throughout the study period and was within the permissiblelimits of 7-8 as prescribed by CPCB (1986). Temperatureranged between 23oC to 34oC-depending upon the prevailingseasonal conditions. The dissolved oxygen content of thewater body was below the prescribed limit of 3.2 mg/l (CPCB,1993) required for sustenance of healthy ecosystem.Theamount of oil and grease was highest during pre-monsoonbut was always within the prescribed limit of 20 ppm (CPCB;1993). The high content of TDS were observed duringmonsoon due to surface runoff which leads to increase in
density, turbidity, hardness, salinity etc., and also decreasesthe solubility of oxygen in water. Reduction in the dissolvedoxygen content might supress the aquatic flora and faunaof any ecosystem. Higher values of alkalinity of the lakeswere reported during pre-monsoon which might lead to highdecomposition rate and evaporation. All the parameterswere found within permissible limits, only dissolved oxygencontent was found low during the study, than prescribedstandard given by CPCB (1986).
Table 2: List of birds:
����� ��������� �� ��� � ���� ��� ���������
White-throated Kingfisher Halcyon smyrnensis R Least ConcernedGrey Heron Ardea cinerea R Least Concerned
Purple Heron Ardea purpurea R Least ConcernedBlack-winged Stilt Himantopus himantopus R Least ConcernedCattle Egret Bubulcus ibis R Least ConcernedSpot-billed Duck Anas poecilorhyncha R Least Concerned
Pond Heron Ardeola grayii R Least ConcernedLittle Cormorant Microcarbo niger R Least ConcernedRed-wattled Lapwing Venellus indicus R Least ConcernedPainted Stork Mycteria leucocephala R Near threatened Black-tailed Godwit Limosa limosa M Near threatened
Grey Wagtail Motacilla cinerea M Least ConcernedIndian Black Robin Saxicoloides fulicatus R Least ConcernedPied Kingfisher Ceryle rudis R Least ConcernedCommon Sandpiper Tringa hypoleucos R Least Concerned
Little Grebe Tachybaptus ruficollis R Least Concerned
�
�
�
�
�
�
�
��
��
��
��
��
��
��
� Common Greenshank Tringa nebularia M Least ConcernedR= Resident; M= Migratory
The present study reported presence of 18 species ofmigratory and resident birds out of which 2 bird speciesnamely Painted Stork and Black-tailed Godwit were listedby the IUCN in the near threatened category . The birddiversity recorded at the study area suggested that 72% ofbird species were resident while 28% were migratory.
The overall study showed better water quality andgood bird diversity at the study area indicating the crucialrole of lake in the life of aquatic and non aquatic organisms.But, presently the area near DPS is undergoing constantchanges in the landscape which might affect the functioningof the ecosystem.Thus the study suggest that conservation
of such small and scattered ecosystem is crucial in terms ofmaintaining the biodiversity of the area.
Conclusion:
The satellite imagery showed regrowth of mangrovealong the border of DPS lake which is found to supportvaried types of fauna including good diversity of avifauna.Currently, the areas surrounding the lake is under severeanthropogenic pressure. Therefore constant monitoring andtimely remedial measures are required to maintain the heathof DPS Lake ecosystem.

187
International Conference on Ecosystem Services of Wetlands - ‘Ardrabhumi :2016’ISBN : 978-81-923628-3-0
Acknowledgement: We are grateful to Dr. P. N. Kurveand Mr. D. D. Shenai for their valuable guidance. We alsothank Mr. Ashutosh Joshi and Dr. Sheetal Pachpande. Wealso thank Principal Dr. M. K. Pejaver for providing us facilitiesand infrastructure.
References:
APHA (2005). Standard methods for the examination of waterand wastewater, 19th edition, American public HealthAssociation, Washington
Trivedi R.K and Goel P.K (1986) chemical and biologicalmethods for water pollution studies,poluution publicationindia
CPCB (1993) Criteria for classification and zoning of coastalwaters (sea waters SW) - A coastal pollution control series:COPOCS/6/1993-CPCB, New Delhi, June, 1993
Desai pooja (2014). Water Quality Assessment of Lakes inVashi, Navi Mumbai, Maharashtra, India
International Journal of Scientific Engineering and Research(IJSER) pp 2347-3878, Impact Factor (2014): 3.05
BNHS_VII _Tri Monthly report on NMIA (Jan. to March2014)
http://www.birdlife.org/datazone/species/search
h t t p : / / w w w. c p c b . n i c . i n / u p l o a d / N e w I t e m s /NewItem_97_guidelinesofwaterqualitymanagement.
h t t p : / / d n a s y n d i c a t i o n . c o m / d n a / M U M B A I /dna_engl ish_news_and_features /HC-res t ra ins-d e v e l o p m e n t a l - a c t i v i t y - a t - N e r u l s - D P S - l a k e /DNMUM311377

188
International Conference on Ecosystem Services of Wetlands - ‘Ardrabhumi :2016’ISBN : 978-81-923628-3-0
Author Index
Achary Maria ..........................................................179
Aghase Seema ...........................................................137
Athalye R. P. ................................................................ 37
Azeez P. A. ...................................................................... 3
Bagkar P. ....................................................................53
Barbate M. P. .............................................................167
Bhagwat Sanjay .......................................................... 50
Bhangale Snehal N. .................................................... 84
Bhatkulkar M. M. .................................................... 170
Chakraborty Rajarshi ................................................57
Chaudhari Rushabh .................................................182
Chavan Bhavita .......................................................... 88
Desai Yojana G. ........................................................130
Deshmukhe Geetanjali .................................................. 7
Deshpande Laxmikant ................................................14
Goenka Debi ................................................................ 5
Gopalkrishnan Bindu ...............................................137
Gayathri N. ..................................................................53
Gurav Minakshi .......................................................... 66
Guruge W. A. H. P. .......................................................12
Hardikar B. P. ............................................................43
Jaiswar Ruhi ..............................................................88
Jadhav Ashwini .........................................................177
Jadhav R. N. ..............................................................105
Jamdhade V. M. ...........................................................77
Jawale Ashutosh .......................................................103
Joshi Ashutosh ..........................................................139
Joshi Sneha ...............................................................160
Kale Umang .............................................................139
Kamble N. B. .............................................................154
Karanjgaokar Disha .................................................185
Khobragade Kshama ................................................172
Khose Megha ............................................................182
Kokje Amit A. .............................................................. 35
Kolet Moses ................................................................ 72
Koli Juilee .................................................................182
Koli Riddhi ................................................................182
Kumavat Urmila ............................................... 103, 137
Kongre N. C. ..............................................................170
Kulkarni Neelima .......................................................93
Kupekar Sandhya ..................................................... 110
Kurve Nirmalkumar ..................................................139
Kurve Poonam .................................. 132, 139, 148,160
Kushwaha Shubhda .................................................... 93
Marathe Megha Y. .....................................................63
Marathe Ninad ............................................................88
Manjaramkar Vinda ..................................................182
Manchi Shirish S. ........................................................39
Mhatre Kuldeep .......................................................... 93
Medhi Kamal ............................................................... 57
Mishal Siddhesh .......................................................103
Morajkar A. S. .............................................................43
Naik Mayur .............................................................. 110
Narayane V. S. .......................................................... 154
Nirbhavan Gangotri .................................................172
Oak Gayatri .............................................................160

189
International Conference on Ecosystem Services of Wetlands - ‘Ardrabhumi :2016’ISBN : 978-81-923628-3-0
Pachpande Sheetal ................................................... 80
Padwal H. A. .............................................................154
Patil Vicky .................................................................132
Patil Pawan ..............................................................182
Patil Gajanan ............................................................185
Patil Nandini N. ........................................................ 114
Pejaver Madhuri ................................................... 66, 80
Phal Kalpana D. .......................................................108
Prusty B. Anjan Kumar ............................................... 33
Rathod Sudesh D. .................................................... 114
Rudruke Rakesh ........................................................182
Rokade Avinash .......................................................... 88
Saha Moitreyee .................................................... 63, 84
Sakshi ........................................................................177
Salvi Sonal ..................................................................88
Sarang Divya S. .......................................................... 50
Sav Ujwala ................................................................179
Sharma B. B. ................................................................ 43
Shashank Sarang ......................................................127
Shenai Dilip ..............................................................160
Shejwalkar Shalaka .................................................185
Shetty Chetana ..........................................................103
Shendge Amruta A. ......................................................50
Soman Gauri .............................................................157
Sawant Neha .............................................................177
Stalin Dayananad .......................................................36
Thakkar Aamod N. ..................................................145
Untawale A.G. ............................................................16
Upadhyay Jaya ........................................................... 57
Valanju N. M. .............................................................77
Vaishali Somani ........................................................127
Walavalkar Surabhi V. ............................................121
Watkar A. M. ..............................................................167
Watkar A. M. ..............................................................170
Yadav Priyanka .......................................................177
Zele Rupali A. ..........................................................148

190
International Conference on Ecosystem Services of Wetlands - ‘Ardrabhumi :2016’ISBN : 978-81-923628-3-0
1 Shimadzu / Eureka Balances
2 Brookfield Viscometer
3 Equitron Autoclaves
4 Deep Freezers
5 Dakshin Ultrasonicator
6 Finnpipette
7 J-sil Glassware / Syringe Filter
8 Metalab Oven,Incubator, W.bath
9 Microfilt Laminar Air Flow
10 Motic / Micron Microscopes
11 Millipore / Pall Membranes
12 Neolab Shakers
13 Remi Centrifuges
14 Superfit Rotary Evaporators
15 Ph, Cond, Spectrophotometer
16 Tarson/ Polylab Plasticware
House of Scientific Supplies
Authorised Distributor / Dealer For :
43/342, Unnat Nagar Part – 4, M.g. Road, Goregaon (W.), Mumbai – 90.
Ph - 2873 6775 | Mobile – 9869009997 | E-Mail :- [email protected]

Lesser FlamingoGray Heron Black ibis
Painted Stork Brown headed gull Black Crowned Night Heron
Northern ShovelerIndian Spotbilled Duck Common Coot
Little Grebe Bronze winged JacanaCommon Pochard
Oriental Dwarf Kingfisher Western Reef Egret Rosy Pelican