bengaluru-jul-sep-2016.pdf - Magicbricks.com
56
-
Upload
khangminh22 -
Category
Documents
-
view
0 -
download
0
Transcript of bengaluru-jul-sep-2016.pdf - Magicbricks.com


FOREWORDMild tapering of inflation and a normal monsoon finally paved the way for lowering of REPO rate by 25 basis points, taking it to its lowest level in the last 5 years. The continued fall in both imports and exports, coupled with tepid investment demand has led RBI to pass on the cut. The Y-o-Y GDP growth rate also slowed down from 7.9% in the JFM quarter to 7.1% this quarter. The expected rise in oil prices from next year is also a major concern for the economy, which imports most of the oil it needs. High NPAs in the banking sector and construction delays in infrastructure and real estate also remain as major concerns.
However, the economy remains strong despite headwinds facing the world economy and geopolitical turmoil across Asia and Europe. The Manufacturing Purchasing Managers’ Index (PMI) is still above 52 level and GDP growth forecasts till 2020 by various multilateral agencies, remain above 7%. The lowering of Repo rate is expected to bring down both project finance as well as home loan costs, lowering the overall cost of buying a house.
The inevitable implementation of Real Estate Regulation and Development (RERA) Act, 2016 has led developers to hasten the delivery of their projects. This trend was clearly evident in the quarterly average prices data of Under Construction (UC) vs Ready-to-Move-in (RM) stock, where the premium commanded by RM properties came down due to increase in RM stock, as a portion of UC projects were delivered over the quarter.
RERA is a step in the right direction but will bear fruit only in 2-3 years, and till then the Indian real estate sector remains in turbulent waters, and its health can only be gauged through inferential means like pricing and inflation in the sector.
Price, as an end-product of interaction between the underlying demand and supply elements, incorporates all the sector related imperfections like delays and surge/dearth of transactions. Its trend also serves as a guidance to fiscal decision making by the government and RBI and investment decision making by private equity funds and retail home buyers.
Real estate in every city is heterogeneous and each locality and project can be mapped to different budget segments and geographies. Each budget segment and geography corresponds to a certain share of supply and consumer preference in the market.
Towards this end, Magicbricks presents a holistic price Index for each of the 14 major cities in India. The City Index reflects the price movement across localities, geographies and budget segments in the city. This bottom-up approach helps to identify factors affecting demand-supply dynamics of the city.
Analysis of City Indices over a 3-year period shows that Navi Mumbai had the highest gain of 18%, while New Delhi continued to face tough market with a 21% decline.
Regionally, Western India performed the best with 8.9% average gain, followed by South with 7.6% increment. North India saw an average decline of 7.4%, while Kolkata had the same average price as eleven quarters ago. It is important to note that any gains made are eroded when benchmarked against inflation in economy, in the study period.
Another important sign of our times is the 8% premium commanded by the Ready-to-Move-in (RM) properties over the Under Construction (UC) properties at a pan-India level. This ratio was at 5.1% eleven quarters ago and is a reflection of the falling consumer confidence in timely delivery of projects.
These are changing times and we would love to hear from you. Do write to us at [email protected] and share yours views on this report and how we could make PropIndex even better.
Sudhir Pai CEO, Magicbricks.com

METHODOLOGYRealistic price discovery has been the biggest problem area in the Indian real estate market. As consumers and industry struggle to arrive at a realistic benchmark pricing to assess the true value of their individual units, Magicbricks, as the largest repository of residential property listings, brings you the trusted Indian Apartment Price Index in a new and easy to use format. Mirroring the Indian Real Estate scenario, this price index presents an animated representation of the real estate market.
Magicbricks publishes the quarter-on-quarter inflation and deflation trends of the residential real estate prices in India. It collects real estate demand-supply data on a daily basis for more than 100 cities in India, of which, the fourteen top cities are selected for computing the National Property Price Index.
The National Property Price Index and its constituent indices are subjected to a series of stringent steps.
Each quarter, Magicbricks measures the individual property level price changes, which are then aggregated at the locality level. While comparing the average pricing figures for the current quarter and comparing with the previous one, quarterly price changes are calculated. These price changes are further aggregated at the city level and even further at an all-India level.
As the top receiver and aggregator of residential demand, Magicbricks’ data provides consumers with realistic benchmarks to the assess true property pricing. Where demand exceeds supply, consumers have no chance of negotiating values.
However, where demand is far lower than supply, buyers can look for more options and therefore, negotiate
pricing. If, on the other hand, you are a seller looking for benchmark pricing, you will effect the fastest sale if your asking values are close to the buyer’s paying power.
There are various co-relations of demand and the overall real estate market as well as its future potential. Not only is demand a preceding indicator to supply, it is also a fairly good indicator of actual transaction activity in the region.
We have aggregated the 14 cities covered under the report into various localities. While calculating the city level property pricing indicator, we have applied demand as weight to each locality. This weight is equal to the locality’s share of the demand being contributed to the city’s total demand. As a consequence, the locality receiving higher demand for residential units will be given a higher weightage. Following that, each city’s price movement is calculated by aggregating the price movements of individual localities, according to their individual weightages.
In terms of checks and balances towards making the data and analysis more robust and objective, we have made sure that superfluous information does not deviate the desired results. Hence, we have applied checks and balances at the locality level listing data collection and aggregation.
A statistical technique called “Inter-Quartile Range” (IQR) has been used to ensure that unintentional input deviations of house size and price figures, which may distort the actual value of the house and corrupt the analysis, are addressed. The technique aims to remove the outlier data sets, while securing the correct values.
The Interquartile Range technique works through measuring variability of each data set, while dividing the data set into quartiles. The technique measures the value of data points on the first and third quartiles of the data and calculates the difference between the two.
This range, called ‘IQR’, gives the effective extent of data set, while removing the first 25% and the last 25%. Subsequently, a test is applied to each of the values in the data set. If a particular data lies within an IQR of the first and third quartile values, then that data is considered part of the data set, otherwise not. The set of listing values of each locality are statistically cleaned.
Magicbricks, on an average, covers more than 500 localities for Tier-I cities of India. Yet for the sake of analysis, we take only those localities where the recipient demand is at least 0.05% of the city’s total demand. Only localities with at least 50 actively traded properties have been included in the analysis. Following that process, we shortlisted various localities which in some sense, impact the pricing dynamics of the city.
We then calculate the average prices of the city for the quarter, while applying demand weights to the average prices of each locality. These average prices at the city level are further aggregated to the final outcome of the ‘National Price Index’.
The difference in Under Construction and Ready-to-Move-in property has been assessed and included in the report. Rental yield and affordability too has been addressed for the top 10 localities by supply in every city. These are critical tools which well used can help with realistic price discovery.

GLOSSARY & DEFINITIONS1. City Property Index :This is a composite index which is a function of supply of properties as well as
the average capital appreciation/drop in various localities of the city in the quarter. The City Index is the weighted average of the average rate per square foot in that locality and the supply of properties from that locality. Localities with higher supply of properties will have a bigger impact on the Index.
2. Price trend basis budget segments: To better understand the city’s price trend, the localities have been divided into budget segments basis their capital value (Rs/sq ft). We have tracked the weighted average price for each budget segment for a 2+ year period from quarter ending September 2013 to quarter ending September 2016.
Subsequently, the movement of the localities in each price segment is mapped to derive respective short term and long term price change trends. The number of budget segments vary according to the city characteristics.
3. Zone wise distribution of localities: The various localities in the cities are all geographically divided into five key regions: Northern, Southern, Eastern, Western and Central. The localities are analyzed at the local zonal level to better understand the effect of the various drivers of price and demand, which are active mostly at the zonal level rather than at the city level.
4. Zone wise distribution of property budget segments: To better understand how each of the city zones contribute to the city’s supply, and how they are able to provide housing at various price points, the supply is distributed into budget segments across various geographic zones. For instance, if a zone has most of its supply in the premium budget segment, then it naturally becomes a premium destination within the city. The price changes within the various budget segments are also analyzed at the zonal level to go to the depths of the price changes across the city and to easily contribute the price changes to local factors.
5. Capital Value Tables (given in Annexures): This shows the actual range of prices within which properties are available in each locality in the quarter. Prices are shown in Rupees per square foot basis, these are the prevailing rates for properties in each locality.
6. Price trend – Top 10 localities by consumer preference: This section presents the price trend of the Top 10 localities in the city by consumer preference. These localities have the highest consumer focus and assessment of price trend in these localities assists in understanding the prevalent and future price trend in the city.
7. Price trend basis construction status: This Index looks at the movement in prices of Under Construction (UC) and Ready-to-Move-in (RM) properties across localities in the city. It is a weighted price index where weight is assigned to each locality basis its share in the consumer preference in the city.

What is the PropIndex?
The PropIndex gives you locality-wise property values in two forms – as locality price ranges for sale and rent in the annexure to every city with additional information on whether it has gone up or down in the quarter, and what is the rental yield in that locality. These prices are based on the listed prices of properties for sale or rent on the website www.magicbricks.com. This helps you to understand the average locality price ranges and to assess whether the price of the property for sale or rent that you are assessing, lies within the average price ranges in the locality. In a market where data or information is hard to come by, this data helps you to assess whether you are being quoted rational values for the property you are considering.
Why do I get locality sale and rent prices and how do I use them?
When you buy a property you must know what the average locality prices are. When you buy property directly from the developer, the price per sq ft is the value you pay. Then there are additional preferred location charges (PLC) such as vastu related, view related or floor related. When you buy from the secondary market or from an individual seller, the price is determined basis a notional value of the property. The sale values in the PropIndex help you to establish the price you should demand if you are a seller or what you should pay if you are a buyer. Rental values, similarly, are the average values that are listed on the website. They serve as benchmarks of the expected rental prices in the locality.
What is rental yield and why is it significant?
If you pay a certain price for a property, there is an amount you earn per annum as rent. When the rental income is expressed as a percentage of the property value, it is rental yield. It is a good yardstick to compute which property to select as a Buy to Let investment.
Why is it called a Property Index and not Property values?
Magicbricks has a very large number of listings. The number per locality depends on market conditions and how many consumers or brokers or developers choose to post their properties for sale or rent. When we are computing values at the locality or city levels we do not want any one locality to skew the index value of the city. As a result when any one or more localities have more than usual or less than usual number of listings, using the ratio of price to number of listings helps to even out unusual spikes or troughs in the data. This gives you unbiased city or locality averages.
How do I use an index number?
Magicbricks Index was computed first in 2011. The values in the year 2011 have been used as the base value and is assumed to be 100. When the value is below that
base number, the index is said to have fallen. When it is more than that number, the index is said to have gone up. This gives users like you, who are interested in property markets, an idea of how the property market in your city has performed vis-à-vis other cities. When the economic conditions are good and the builder is actively developing and the consumer is actively buying, the index value rises above 100. When markets are flat due to lack of economic activity and therefore developer and consumer disinterest, the index values remain at 100 or drop below that.
Very high index values shows a lot of investor activity and therefore severe peaking of property values. As an end user you should avoid buying when there is intense buying and speculative activity. That however, is a good time for you to sell as high property prices will give you good returns on your investment. When the index value comes down dramatically, the chances are that you will not get good returns as a seller. But if you find the property that you like in this cycle, it is a good time to negotiate the best values and buy as the chances are that there will be fewer buyers in the market. Since the PropIndex is now 5-years old, a look at how the index values have moved over the years gives you a good idea of how the market has performed in different quarters. If you are interested in how property markets have performed across a period of time, the PropIndex values give you a fair idea of the movement.
Do I get any specific Advice that helps my property decisions?
Magicbricks has a team of data scientists and researchers who are constantly studying the property markets and values to get the trends. In the past two quarters, for instance, they have noticed that ready-to-move-in property has been significantly more expensive than under construction property. This probably indicates that consumers do not want to buy property that is not complete and has chances of delayed delivery and prefer to spend more to buy property that they can purchase and move into. This is useful to you as a buyer and alerts you to general trends of other buyers.
What is the editorial and how is it useful to me?
The editorial team of Magicbricks constantly assesses the property market developments and factors such as infrastructure announcements and transport corridor development, to figure out how they can impact values of residential real estate in your city. In each edition of PropIndex they assess what all has happened in the quarter and how it will impact the value of the property that you are interested in. This analysis gives you an idea of the issues you should consider when buying property in that city.
How do I use the different sections of the PropIndex?
The key takeaways are useful in getting an overview of the property market in your city. The geographical distribution of localities allows you to assess in which areas property is available for sale. The distribution of properties by capital value allows you to freeze the price segment where you are likely to get the type of property you are looking for. The budget wise price change helps to compute how the price range that you are looking for has been performing. If values have been rising in your budget of interest you may have to hurry up with your property decision if you are an end user. If it has dropped, figure out if there is a problem in that category. This exercise has been done for each part of the city. The price trend by construction basis tells you which the best stage is at which you should enter the property market. The price changes basis construction status takes this analysis a step forward. Read it carefully and you will be able to assess exactly when you should enter the market as a buyer and as an investor.
What is the Corridor of Growth?
Magicbricks has figured that the bulk of new property in any city is developed along a few transport corridors leading out of the city. These have been identified and studied for stock, price rise, current status, future potential and its physical and social infrastructure such as water, power, sewerage and drainage facilities, transport links, schools, colleges, hospitals and entertainment centres in the vicinity. Advice has been given on the basis of rental and buyer’s demand, the best configurations to buy – 2, 3 and 4BHK, past and future estimated price trends and also how it figures in the master plan of the city. News updates of each corridor allows you to understand the drivers of those corridors.
HOW TO USE THE PROPINDEX
Jayashree Kurup, Head content

In line with general lack of activity in the residential market, the National Property Index remained stagnant at the same level
as in the last quarter, with prices falling by a marginal 0.12%. This is in continuation of the inactivity seen in the last many quarters.
NPI is the weighted average of consumer preference share of 14 cities and their individual City Index value.
On a quarterly level, South was the only region which inched up substantially in terms of prices from the last quarter while North fell the most. Although it cannot be said with certainty that prices have hit rock bottom and will not fall any further, any downward movement, going forward, will be restricted.
On a three year scale, Western India has done better than all other regions, with its cities having 8.9% price increment, on an average.
The worst performer was the North region, where prices fell by more than 7% in the last three years. The second best gains were witnessed in Southern India, where prices moved up by 7.6% over the same period.
In terms of historical price change, Navi Mumbai was the best performer with a significant 18% increment over the last three years, followed by Hyderabad and Pune, which had a 10% gain each. Thane stood fourth with a 9% gain, while Bengaluru and Ahmedabad had a 7% gain each. Next were Mumbai and Chennai with a 5% gain each.
Gains of lower than 5% were witnessed only in the North and Eastern regions, with Noida and Greater Noida showing the maximum gain in Delhi-NCR of just 4% each. Both, Gurgaon from Delhi-NCR and Kolkata from the Eastern region, had the same price in the Jul-Sep
2016 quarter, as three years ago. Only two of the top 14 cities considered for PropIndex saw a price decline in the last three years and both belonged to Delhi-NCR. While prices in Ghaziabad fell by 6%, New Delhi performed the worst, with a whopping 21% fall in prices.
In terms of quarterly change, Hyderabad performed the best with a 2.8% increase over the last quarter, followed by Bengaluru at 2.0% and Navi Mumbai at 1.2%. Overall, the Southern region was the best performer, with Chennai also giving a 0.7% price increment and standing fourth in the top 14 cities.
In terms of worst performers, four cities saw price drop, with the highest drop in Greater Noida of 1.7%, followed by Noida witnessing a drop of 1.2%. Mumbai and New Delhi were the other two cities noting a price drop, amounting to 0.8% and 0.7%, respectively.
VOL 6, ISSUE 2; JUL-SEP, FY 2016-17 propindex.magicbricks.com
[Jul-Sep 2016]

[Buyers looking for an exit]
The realty sector in India has been tepid for the past few years with low transaction volumes and stagnant price level. Weak
economic scenario, perceived high price level and lack of consumer confidence in the developers with respect to project completion led to transaction volumes reducing drastically.
Magicbricks research shows that consumers are willing to pay more for Ready-to-Move-in (RM) options as compared to under-construction (UC) properties. They’re willing to pay a premium on completed projects rather than expose themselves to delivery risk. Project delay leads to consumers having to bear additional financial burden of paying rent over and above applicable home loan instalments for an extended period. All this has made consumers wary of putting money in Under-Construction projects.
This is reflected in the price differential between Under Construction (UC) and Ready-to-Move-in (RM) properties. Magicbricks tracks the weighted average price for UC and RM properties on a pan-India basis covering 14 cities. It compares the 3 year trend from Sep 2013 to Sep 2016 where Sept 2013 has been taken as the base. It also shows the premium (discount) of RM properties over UC properties.
Our national level index for tracking prices of RM and UC properties shows that at a pan India level, RM properties command an average 8% premium over UC properties. This level of premium for RM properties has held for the last three quarters.
Analysis of actively traded properties on Magicbricks shows that when it comes to RM properties, an overwhelming number of options are in the resale segment. At a pan-
India level, 69% of RM properties are in the resale bracket while balance 31% are offers of fresh booking or ‘New Properties’. The graph gives the share of resale and new properties for each of the 14 cities analysed.
The predominance of resale options under RM properties category indicates that many buyers who had made purchase from an investment perspective are looking to exit their investment. With end-users looking for RM options to protect themselves from project completion risk, it is likely that many investors with RM properties see this as the best opportunity to liquidate their asset(s).
Most of the investors looking to exit at this point are unlikely to make any gains. In many cases, when the return is indexed to inflation, the return might actually be negative. This is because the prices have either been stagnant or have seen insignificant increment over the last few years. The following graph shows percentage change in the City Price Index for 14 cities from Sep 2013 to Sep 2016.
As is evident from the graph, the weighted average price across most cities has seen marginal increment over the last three years. In case of cities like Delhi and Ghaziabad, the price levels have declined. In all other cases, when the price increment is indexed to inflation, there is an implicit price decline.
Regional wise analysis of the ratio of ‘New’ and ‘Resale’ options under RM segment shows that
propindex.magicbricks.com VOL6, ISSUE 2; JUL-SEP, FY 2016-1702

markets which historically had high investor to end-user ratio have corresponding higher percentage of ‘Resale’ options in this segment.
Major North Indian markets like Gurgaon and Noida, which have seen large scale residential development, have 80% or higher ‘resale’ options in the RM segment. Similarly, all Western Indian cities have a high share of such options in the RM category. Opposite phenomenon was seen in case of all South Indian cities – Bengaluru, Chennai and Hyderabad. These markets have had high end-user participation and this reflects in the ratio of ‘New’ and ‘Resale’ options. Both these options have almost equal share in the RM segment in these cities.
These statistics also indicate that supply in markets with high ‘resale’ versus ‘new’ options in the RM category was in excess to demand at the given price points.
Market ImpactPresence of a large number of resale options puts pressure on the market in multiple ways:
l First, these resale options add to the unsold inventory available with developers, thereby exacerbating an already difficult scenario
l Large number of resale options in Ready-to-Move-in projects take the demand away
from Under-Construction projects. One set of inventory is getting sold multiple times while another set with the developers remains unsold. This is adding to delay in completion of projects as developers are not keen to complete projects where unsold inventory is on a higher side
l In the prevailing market scenario, large resale inventory also impacts the price level in a project as well as overall market. Price quote in the resale market is lower than the builder’s price and this impacts saleability of the unsold inventory with the developer. Further, the developer cannot increase the price and out-price his inventory vis-à-vis resale options
l New project launches also have to be sensitive to the prevailing price in the resale segment in their price segment
ConclusionIdeally, transaction activity in the resale segment gives depth to the primary segment. It allows investors to book profit and unlock their capital. However, in the present scenario where transaction activity is low and consumers are looking for Ready-to-Move-in options, the resale segment is likely to do better than the primary market and continue to put pressure on the primary market.
Given the large percentage of resale properties available in the market, this situation is likely to persist in short to medium term.
VOL6, ISSUE 2; JUL-SEP, FY 2016-17 propindex.magicbricks.com03

BENGALURU propindex.magicbricks.com VOL6, ISSUE 2; JUL-SEP, FY 2016-1704
[PROPINDEX - BENGALURU][Key Takeaways]
Maintaining real estate symmetry
Bengaluru market is trying hard to balance its real estate equilibrium. On one hand, the authorities are undertaking strict
measures to streamline practices. These include restriction on new construction projects, demolition drives, mandate for sewage plants, etc. On the other hand, easing out of STP norms, addition of new Karnataka cities, etc have till now maintained the balance.
The High Court told BBMP and BDA to not allow new construction projects near Bellandur Lake. This came into spotlight when some builders tried to flout rules by seeking consent for establishment without attaining approvals from civic agencies like BBMP, BMRDA and BDA.
In a similar transgression, NGT and state govt barred construction activity within 75 metres of the periphery of water bodies and also set
limits for buildings near feeder canals. The Karnataka’s Environment Impact Assessment Authority has put on hold the environmental clearance for 10 mega construction projects, including large residential projects, for alleged encroachment of lakes and drains.
This move might lead to an increase in property prices. According to some builders and consultants, project cost will go up by around 30% as developers will have to redesign the projects and also keep paying interest on bank loan. Further, builders will also pay govt charges for re-approval of their project plans.
On to the good spate of events, BWSSB relaxed STP norms and focussed buildings on larger sites. All sites measuring 21,527 sq ft housing flats or apartments and non-domestic buildings should have STPs. The water board came up
with STP norms following rap from pollution control board and courts over pollution of Bellandur and Varthur Lakes, both bearing the brunt of sewage inflow.
The state govt has revised the Karnataka Land Revenue Rules (1966) which regularizes constructions up to a distance of 18-km from the periphery of BBMP limits. Illegal constructions which have not followed rules can now pay Rs 10,000 for an illegal structure and get a ‘legal’ tag. The move was undertaken as demolition wasn’t a prudent option. The only issue was its timing - now or next year in the run up to the assembly polls. The government expects crores of rupees through this move.
Government policies are important in shaping the future of any sector. Hopefully, Bengaluru is on the right track.
Magicbricks Bureau
EDITORIAL
The City Index saw a rise of 2% over the last quarter. More localities saw price increase than price decline
In the Jul-Sep 2016 quarter 68% localities saw an average price increase of 3.2% while balance 38% localities saw 3.7% price decline
Price movement across all but one budget segment has been positive with price movement ranging from -1.1% in the Rs 3,000-4,000 per sq ft segment to 4.2% in the above Rs 9,000 per sq ft budget segment. This shows an overall gain in the Jul-Sep 2016 quarter
Positive price movement across the city was on account of price increment across all the major high
consumer preference localities like Whitefield, Sarjapur Road, Marathahalli and Bannerghatta Main Road
Eastern zone, which accounts for more than 40% share of consumer preference and supply in the secondary market, saw a marginal price increment of 0.7%. This zone consists of important localities like Whitefield and Sarjapur Road
The North zone, which is centred on Hebbal Junction, had a marginal increment. The South zone consisting of localities such as Electronic City also witnessed a marginal average price increment of 1.6% in the quarter
While West zone also saw marginal price increment, the overall level in the Central zone remained stagnant
Analysis across 94 localities in Bengaluru shows that on an average, RM properties were 4.9% more expensive than UC properties in the Jul-Sep 2016 period
The average difference in prices has increased from the Apr-Jun 2016 quarter. While the weighted average price of RM properties was Rs 5,266 per sq ft, the same for UC properties was Rs 5,020 per sqft
The average price of both RM and UC properties has increased over the last quarter by 1.1% and 1.8%, respectively

VOL6, ISSUE 2; JUL-SEP, FY 2016-17 propindex.magicbricks.com BENGALURU05
Properties distribution by capital value (Rs/sq ft)Apr-Jun 2016 to Jul-Sep 2016
This graph shows the distribution of actively traded properties by their capital values. Bengaluru is a price sensitive market with most of the supply (65%) in the Rs 3,000–5,000 per sq ft category
The higher mid-segment of Rs 5,000-6,000 per sq ft category comes second and has a healthy share of 28%. The premium and luxury segments in the Rs 6,000-9,000 per sq ft and above Rs 9,000 per sq ft form a small share
Price movement in the Bengaluru market is predominantly defined by the lower and mid budget segments. The geographical spread of budget segments show that East zone has more even spread of budget segments while in the South zone, the lower budget segments are seen to dominate
In the Northern part of Bengaluru city it was noted that properties were in the mid to higher budget segments.
The map shows the geographical spread of localities considered for calculating the City Price Index. These localities have been grouped together to understand the zone wise price trend in the city
With the exception of Whitefield, Bengaluru has grown radially along and off all the main arterial roads emanating from the city. Major growth axis includes Sarjapur Road in the East, Old Madras Road in the North-East, NH-7 and New Airport Road in the North, Tumkur Road in the North-West, Mysore Road in the South-West, Banerghatta Road in the South and Electronic City in the South-East along Hosur Road
Localities in the East zone shown on the map account for 50% share of consumer preference in the city. Whitefield and Sarjapur Road are the two leading localities in this zone
Geographical distribution of localitiesCity has grown in a radial manner
BENGALURU propindex.magicbricks.com VOL6, ISSUE 2; JUL-SEP, FY 2016-1706
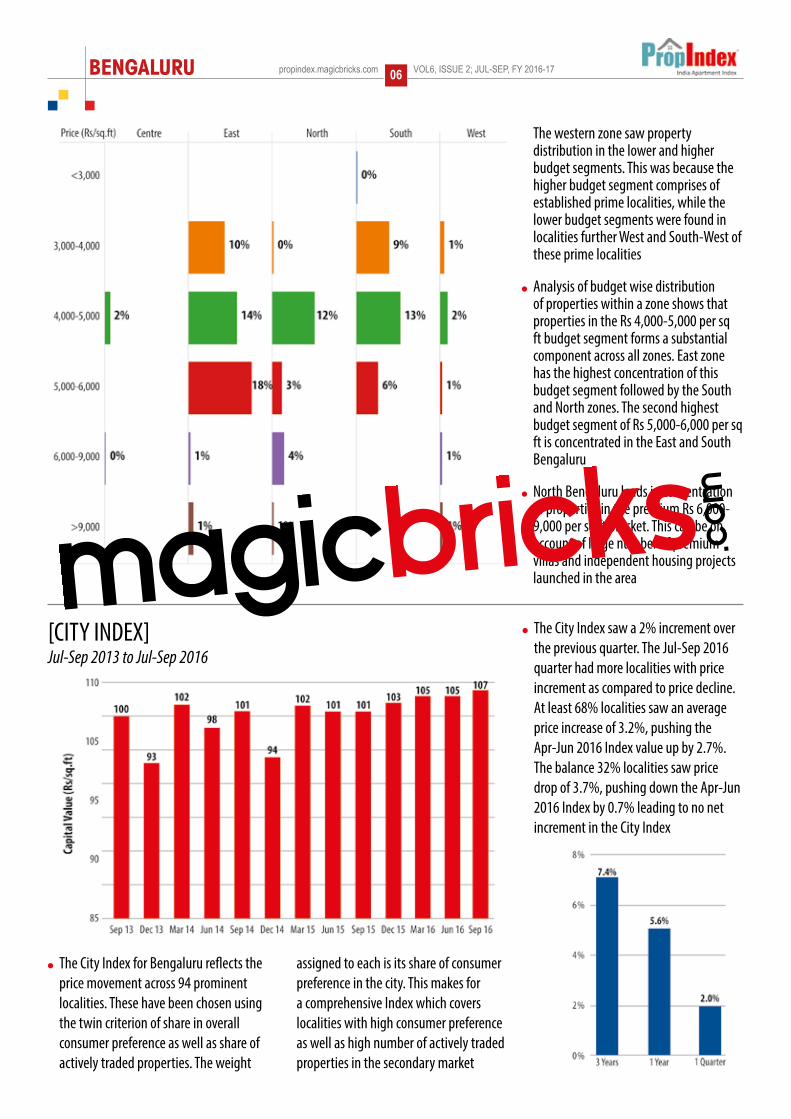
The City Index for Bengaluru reflects the price movement across 94 prominent localities. These have been chosen using the twin criterion of share in overall consumer preference as well as share of actively traded properties. The weight
assigned to each is its share of consumer preference in the city. This makes for a comprehensive Index which covers localities with high consumer preference as well as high number of actively traded properties in the secondary market
The City Index saw a 2% increment over the previous quarter. The Jul-Sep 2016 quarter had more localities with price increment as compared to price decline. At least 68% localities saw an average price increase of 3.2%, pushing the Apr-Jun 2016 Index value up by 2.7%. The balance 32% localities saw price drop of 3.7%, pushing down the Apr-Jun 2016 Index by 0.7% leading to no net increment in the City Index
The western zone saw property distribution in the lower and higher budget segments. This was because the higher budget segment comprises of established prime localities, while the lower budget segments were found in localities further West and South-West of these prime localities
Analysis of budget wise distribution of properties within a zone shows that properties in the Rs 4,000-5,000 per sq ft budget segment forms a substantial component across all zones. East zone has the highest concentration of this budget segment followed by the South and North zones. The second highest budget segment of Rs 5,000-6,000 per sq ft is concentrated in the East and South Bengaluru
North Bengaluru leads in concentration of properties in the premium Rs 6,000-9,000 per sq ft bracket. This can be on account of large number of premium villas and independent housing projects launched in the area
[CITY INDEX]Jul-Sep 2013 to Jul-Sep 2016

VOL6, ISSUE 2; JUL-SEP, FY 2016-17 propindex.magicbricks.com BENGALURU07
Budget wise price changeApr-Jun 2016 to Jul-Sep 2016
To understand the contribution of various budget segments and localities in the Index movement, we have grouped 94 localities under the Index, into budget segments on the basis of their capital values. A further micro picture of price movement is presented by looking at price change across different geographies and their constituent budget segments
Price movement across all but one budget segment has been positive with price movement ranging from -1.1% in Rs 3,000-4,000 per sq ft segment to 4.2% in the above Rs 9,000 per sq ft budget segment. This shows that Bengaluru overall gained in prices in the Jul-Sep 2016 quarter
The price trend in a given budget segment was more or less mirrored across different geographical zones
Price movement across zones:
South Price increment was witnessed across all
budget segments in the zone
The highest price increment was in the less than Rs 3,000 per sq ft segment with 5% increase. This was followed by 2.3% increment in the Rs 5,000-6,000 per sq ft and 1.5% increment in the Rs 3,000-4,000 per sq ft price brackets
High consumer preference localities across different budget segments such as Electronic City and Bannerghatta Road saw price increment
East There was a price increment in four out of
the five budget segments in the zone
In the largest budget segment in the zone by share of supply (Rs 5,000-6,000 per sq ft), there was a price increment of 1.8%. This was on account of price increment noted in high demand localities like Whitefield
The next highest supply segment of Rs 4,000-5,000 per sq ft also saw a marginal gain of 1.6%. Prominent
Geographic and budget wise price changeApr-Jun 2016 to Jul-Sep 2016

BENGALURU propindex.magicbricks.com VOL6, ISSUE 2; JUL-SEP, FY 2016-1708
localities like Sarjapur Road and Varthur in this segment saw price increment
The premium segment witnessed the highest movement. Both Koramangala and Indiranagar in the Rs 6,000-9,000 per sq ft bracket saw increment
North Of the five budget segments present in
North Bengaluru, three saw price rise
Most localities in the important Rs 4,000-5,000 per sq ft segment saw a price increase leading to overall 1.6% rise in this budget segment. Next highest supply segment of Rs 6,000-9,000 per sq ft saw a price decline of 1.9% as important localities like Sanjay Nagar and Yashwantpur saw a price decline
Another prominent locality in the zone, Hebbal, saw a price increment of 2.5% in this quarter
Centre Localities in the Central zone saw price
increment across all prominent budget segments
Price change – Top localities by consumer preferenceApr-Jun 2016 to Jul-Sep 2016
Price trend basis construction statusJul-Sep 2013 to Jul-Sep 2016

VOL6, ISSUE 2; JUL-SEP, FY 2016-17 propindex.magicbricks.com BENGALURU09
Price change basis construction status Top localities by consumer preference in Jul-Sep 2016 period
The graph shows the trend in the prices of ‘Ready-to-Move-in’ properties (RM) and Under Construction (UC) properties. Analysis across 94 localities in Bengaluru shows that on an average, RM properties were 4.9% more expensive than UC properties in the Jul-Sep 2016 period
The average difference in prices has increased from the Apr-Jun 2016 quarter. While the weighted average price of RM
properties was Rs 5,266 per sq ft, the average price for UC properties was Rs 5,020 per sq ft
The average price of both RM and UC properties has increased over the last quarter by 1.1% and 1.8%, respectively
In terms of price increase, Under Construction properties posted a price increment of 11% over the Sep 2013
to Sep 2016 period, while the price of Ready-to-Move-in properties declined by 1%. The price decline in case of RM properties decreased due to slight price increase over the last quarter
As the graph below shows, the price of both RM and UC properties has increased in the Jul-Sep 2016 quarter across most of the top 10 localities by consumer preference in the zone

BENGALURU propindex.magicbricks.com VOL6, ISSUE 2; JUL-SEP, FY 2016-1710
Capital values
Banashankari 4274-6863 12000-19000 3.3%Banaswadi 3434-5723 13000-20000 4.3%Bannerghatta Main Road 3464-5949 12000-20000 4.00%Basaveshvara Nagar 8698-15632 12000-19000 1.4%Bellandur 4365-7104 15000-22000 4.2%Bommanahalli 3341-4790 12000-20000 4.6%Brookefield 4327-6601 14000-21000 4.1%BTM Layout 3799-6652 14000-21000 3.8%BTM Layout Stage 2 3893-6985 15000-21000 3.8%C V Raman Nagar 3376-6358 13000-20000 4.6%Electronic City 2810-4937 10000-17000 4.3%Electronic City Phase 1 3309-5491 11000-17000 4.2%Electronic City Phase 2 2573-4298 9000-15000 4.00%Frazer Town 5750-9953 18000-26000 3.2%Hebbal 4509-7819 12000-20000 3.1%Hennur Main Road 4188-6516 12000-21000 3.8%Hoodi 3197-5250 13000-20000 4.4%Horamavu 3197-5270 11000-16000 4.1%HRBR Layout 7540-13146 13000-24000 2.1%Indira Nagar 5058-9595 18000-30000 4.4%ITPL 3829-6306 13000-21000 4.1%Jayanagar 5476-9753 16000-25000 3.3%JP Nagar 3679-6592 13000-21000 3.9%JP Nagar Phase 7 3602-6858 14000-21000 4.2%K R Puram 3125-5176 11000-17000 4.1%Kadugodi 3494-5080 10000-16000 3.8%Kaggadasapura 3194-4908 12000-18000 4.5%Kanakapura Road 3760-6183 9000-15000 2.9%Kasavanahalli 3717-5917 14000-21000 4.2%Kasturi Nagar 7174-11301 14000-22000 2.2%Koramangala 6860-11457 19000-31000 3.3%Kundalahalli 3854-6156 14000-21000 4.5%Mahadevapura 3654-6116 14000-22000 4.6%Malleshwaram 9809-13807 20000-31000 2.7%Marathahalli 4002-6704 15000-23000 4.2%Marathahalli-Sarjapur ORR 5396-7353 17000-24000 4.00%Old Airport Road 4838-8542 16000-26000 4.00%Panathur 3952-5874 13000-20000 4.5%Rajaji Nagar 9007-14526 19000-34000 2.6%Rajarajeshwari Nagar 3219-5149 10000-14000 3.6%Ramamurthy Nagar 3217-5023 11000-16000 4.4%RT Nagar 3681-6396 11000-18000 3.5%Sahakara Nagar 4351-7091 11000-18000 3.2%Sanjay Nagar 4476-8069 13000-21000 3.7%Sarjapur Road 4026-6875 15000-24000 4.4%Thanisandra 3961-6031 11000-18000 3.5%Varthur 3209-5351 12000-18000 4.5%Vidyaranyapura 2859-4676 9000-14000 3.8%Whitefield 3677-6259 13000-21000 4.2%Yelahanka 3672-5662 10000-16000 3.1%Yeshwantpur 5500-8345 15000-24000 3.2%
LOCALITY CAPITAL RENTAL YIELD


Corridor Description and RatingAreas Included: Electronics City, Hosur Road, Huskur, Chandapura, Bommasandra, Kudlu, Bommanahalli and Hosa Road
Fig 1: Map of the corridor
E L E C T R O N I C C I T Y

Corridor of growth (COG)13
Properties available in the corridor
The corridor offers a wide range of properties with majority of them in the Rs 20-40 lakh price segment.
Considering the corridor has a high population of employees working in the IT/ITES sector,
the demand is highest (63%) for 2BHK units. Interestingly Fig 3 shows that 53% of the property in this corridor is ready-to-move-in. This means it is a buyer’s market as many developers would be ready to dispose the
ready-to-move-in inventory. The corridor has an almost uniform rate throughout until Electronics City but a few premium apartments close to Central Silk Board are quoting upwards of Rs 1 crore for a 2BHK unit.
About the Corridor
Electronics City Corridor, located in South Bengaluru, is the largest electronics park in India spread across an area of 350 acre
in Anekal Taluk. Unlike other corridors which are radial, this is a linear growth corridor with residential and commercial hubs on either side of Hosur Road.
Currently the corridor is connected to rest of Bengaluru through the 4-lane tolled elevated expressway opened in 2010 from Madivala (Central Silk Board) to Electronics City and the BMIC-NICE Corridor which connects Electronics City to Bannerghatta Road, Kanakapura Road, Mysore Road and Tumkur Road. The corridor can also be accessed from the Sarjapur Road Corridor through the Outer Ring Road (ORR) or Haralur Road which connects at Jail Road (Naganathapura) or through the SH-35, also known as Sarjapur-Attibele Road.
As part of Metro Phase-II a new line will be added to the existing green line which will connect from Jayadeva Hospital Junction to Bommasandra. This will cover most of the areas on the Electronics City Corridor and as
per current estimates should be completed by 2020. Heavy traffic logging on the Central Silk Board Circle has now prompted the authorities to also include this corridor as part of the Phase-III Metro work and RITES (a design consultancy firm) has been entrusted the work to conduct feasibility studies to link the metro through this corridor to connect to North Bengaluru. The Central Silk Board to Hebbal Line will be parallel to the ORR and cover areas such as Sarjapur Road, Marathahalli and Mahadevpura.
The proposed PRR which starts from Hosur Road, an 8-lane expressway, will provide an arterial connection to Tumkur Road and will allow heavy traffic coming from Mumbai, Pune, Chennai etc to bypass the city.
The proposed Neo Mall and the Hiranandani Mall are currently progressing at a slow pace. Although the area has a floating population of almost 1.5 lakh professionals, the social infrastructure is yet to catch up as residential communities have just started functioning in most parts of the corridor. Unlike other
corridors that are mostly under BBMP jurisdiction, here different parts of the corridor are under different authorities such as BBMP, Gram Panchayats, ELCITA and BMRDA-Anekal Planning Authority.
Although the area boasts of a good expressway and a NICE corridor to connect to the rest of Bengaluru, Central Silk Board which is the most nodal point connecting this corridor to the Peripheral Business District (PBD) and the Central Business District (CBD), still faces lot of traffic congestion throughout the day.
This has been a key factor for investors holding back from investing in this corridor. Social infrastructure is yet to catch up as well as there are no good malls or shopping centers in this corridor currently. Problems with maintenance of the localities are attributed to the fact that most of them are under the ambit of the Gram Panchayats which are not well equipped to handle the issues of large communities coming up in this corridor.
Overall Connectivity Social Infrastructure Security/Water
Fig 2: Distribution of properties by price Fig 3: Distribution of properties by delivery status Fig 4: Distribution of properties by bedroom configuration

Corridor of growth (COG)14
Within the corridor, the locality with the highest rental demand is surrounding Electronics City. The area
has the highest demand of about 46% as it is close to work locations such as the Electronics
City Phase-I, Velankanni Tech Park, Infosys and Wipro campus. Hosa Road commands the highest rental, as of now, with an average rental value of Rs 24,000 per month for a 2BHK house.
Electronics City Corridor has almost constant average rental yields in all localities, which is around 4%. As one moves away from the corridor towards Hosur, property prices and rental demand starts reducing.
As explained, prices in the corridor move north as one moves towards the Central Silk Board. So an investor will get better value for money in areas beyond Chandapura where prices are affordable and developers are offering good area for the money invested. Typically Rs 40 lakh which will buy a 1BHK unit near the start of Hosur Road will be able to buy a 2BHK unit
closer to Bommasandra or Chandapura. As one moves south of Attibele, it is observed that the floor area/built-up area of apartments are larger and there are 2BHK units with super built-up area of even 1600 sq ft. The corridor is affordable as one moves to interior areas such as Iggalur on Chandapura-Anekal Road where a 1BHK unit costs about Rs 14 lakh.
Sales Price Covered Area ( Lacs) (Sq.ft)
1 BHK 13-98 500-1000
2 BHK 13-200 500-1977
3 BHK 17-300 650-3800
4 BHK and Above 52-226 1872-3735
Best sectors to invest in a home Based on rental demand in sectors
Table 1: Sizes and prices of flats available for various room configurations
Based on home buying demand in sectors
Fig 5: Top 10 localities by consumer for renting a house
Fig 6: Top 10 localities by consumer for buying a house

Best bedroom configurations to buy Preferred buying and renting options
Buying Renting Total (BHKs) Total (BHKs)
1 BHK 3% 2%
2 BHK 48% 52%
3 BHK 47% 43%
4 BHK and Above 2% 3%
Table 2: Demand distribution for buying and renting
In the case of demand for home buying, Electronics City has the highest share. The next highest demand is in Electronics
City Phase-1. Most of the people working in Electronics City prefer to stay here
and it is also a sought-after location by investors who can expect good rental returns of 4-5%. Bommanahalli which is close to both Electronics City as well as Sarjapur Road Corridor through the HSR
Layout and to Bannerghatta Road through Devarachikkanahalli commands the highest price. Since it is close to Central Silk Board and is located before the elevated expressway there is good demand from people.
It is observed from the given tables that for rent 2BHK apartments are the most preferred. The buying is also prefrerred
for 2BHK segment. According to the table, 48% consumers are preferring to buy 2BHK category as the demnd is high there. From a sale perspective, both 2 and 3BHK units have the same demand in this corridor. About 52%
people looking to rent are considering 2BHK units. In fact, the 3BHK units are the second most preferered localities in the corridor. Here, 47% people prefer 3BHK segment currently. The demand for ultra-luxury apartments and villas above 4BHK is only about 2-3% for renting and buying.
Price changes and future prospects Historic Price movement
6 monthly change Yearly change
6% 14%
Table 3: Historical Price changes
Electronic City has seen that property prices have risen over the last one year at a steady rate. It is also one of the few
corridors that have actually seen a price rise over the last one year in Bengaluru. It is also seen that price rise has been higher in areas closer to Central Silk board where new projects have been launched in the affordable and mid segment budget category.
The trend is in confirmation to what has been seen in other areas of Bengaluru as well where prices have remained stagnant in the luxury and premium segment and the mid segment has seen highest consumer demand as well as price appreciation. Most of the people looking for property in these areas are typically employees in the IT/ITES companies in this corridor and are keener to purchase 2-3 BHKs in the mid segment price range
Fig 7: Historical Price changes of corridor
Corridor of growth (COG)15
Corridor Average Price Rs/sqft

Price movement for top localities by Consumer Preference
The last quarter has witnessed the prices moving up for three of the five localities with high consumer demand. Bommanahalli and Electronic City which have seen maximum number of new launches
in the locality has also seen a steady appreciation of greater than 4% in the last quarter. Also over the last quarter about 1600+ units were completed and ready for possession in this corridor which has contributed to the increase in the price.
Although significant number of top localities witnessed price increases this quarter, this has been against the continual drop in the average prices of localities in the last two years and the current rise in prices does not follow a long term trend.
Fig 8: Price changes in top localities by consumer demand
Master Plan
It is observed that large tracts of the corridor are designated for industrial and high technology segments. Closer to Central Silk Board, on either
side of Hosur Road there are large areas earmarked for residential and mixed residential use. The corridor is guided by three different planning agencies such as ELCITA (Electronics City Industrial Township Association), BBMP and BMRDA - Anekal. In South Bengaluru, the corridor has acute water shortage, but projects such as KSWN (Karnataka State Water Network) in partnership with IT companies in the vicinity aiming at de-sludging the lakes in Doddathoguru and efficient ground water management have shown good results.
Fig 9: Land use of various localities in the corridor
Corridor of growth (COG)16

Infrastructure Updatesl As part of Metro Phase-II, a new line will
be added to the existing green line which will connect Jayadeva Hospital Junction to Bommasandra. This will cover most of the areas on the Electronics City Corridor and as per current estimates should be completed by 2020. Heavy traffic logging on the Central Silk Board Circle has now prompted the authorities to include this corridor also as part of the Phase-III Metro work and RITES (a design consultancy firm) has been entrusted the work to conduct feasibility studies to link the metro through this corridor to connect to North Bengaluru. The Central Silk Board to Hebbal Line will be parallel to the ORR and cover areas such as Sarjapur Road, Marathahalli and Mahadevpura
l The 8-lane PRR - Peripheral Ring Road - connects Hosur Road to Tumkur Road and passes through the Old Madras Road, KR Puram and Bellary Road. This will provide seamless connectivity and allow vehicles from plying to Mumbai, Pune etc from Chennai and South Tamil Nadu to byepass the city.
A recent visit to the corridor revealed that there is a lot of activity happening in terms of residential spaces coming up. Electronics City has traditionally been an area with a high concentration of office spaces. So, most people working there prefer to stay in BTM Layout, Begur Road and other localities in the Bannerghatta Road Corridor although these areas are far from Electronics City. Central Silk Board continues to be a major traffic bottleneck
and all plans to ease traffic at this junction have proved futile. Other than Hosur Main Road, other roads are not well maintained as the three agenices responsible for maintaining the roads are always at loggerheads with each other.
There are a few malls which have been in the construction stage for a long time but the progress has been very slow and there is no sign of completion in the next 3-4 years. Water scarcity has been a major problem in this corridor and there are many apartment complexes that are ready-to-move-in but people are not occupying as the monthly maintenance charges are very high, considering that most of them are serviced only by tanker supplied water.
Why you should invest on Hosur Road?
Hosur Road, one of the main roads in Bengaluru, is known for its connectivity within the city, to the established suburbs and also to the other cities in Tamil Nadu. Several factors make this location a highly active area for realestate development and investment. One of the primary reasons to live in Hosur Road is its emergence as the centre for residential, commercial and retail establishments. Living in proximity to the retail spaces such as hyper-markets, malls and convenience stores, has been constantly garnering attention of buyers. The demand for housing is growing in Hosur Road and buyers are getting healthy returns. It might be a good time to invest in the area to earn good returns and enjoy a high-end lifestyle.
n Source: Magicbricks Bureau
Cyient sets up SMEC’s global design center in Bengaluru
Cyient has announced that it has inaugurated a new global design center at Cyient’s Electronic City campus in Bangalore for an Australian consultancy firm, SMEC. It is an IT firm already operating in the city. The center will commence operations from July 2016. The facility that is built and operated by Cyient is SMEC’s first offshore design center. The centre will support SMEC’s global design work primarily around civil and structural, including building information modelling (BIM). SMEC caters to varied sectors including transport, energy, water, environment, health, education, and government advisory.
n Source: The Times of India
Bengaluru demands more apartments
Electronic City is a fast emerging locality in Bengaluru. In fact, it is preferred by the home buyers immensely. The area has majority of young buyers looking for investible options. Whitefield, Sarjapur Road, Bannerghatta Road, Rajarajeshwari Nagar, KR Puram, Marathahalli and Kanakapura Road are some of the other preferred choices among city buyers. But, the home buyers are showing keen interests for investing in the locality. Further, the reason for growth in demand in the electronic city is enhanced metro network and improving social infrastructure such as there are schools, restaurants, and other basic amenities.
n Source: Magicbricks Bureau
Hosur Road - An emerging retail hub
The primary driver for the emergence of Hosur Road as a commercial, residential and retail centre is its efficient connectivity to Electronics City as well as established suburbs of the city. Hosur Road connects the Outer Ring Road (ORR) to the NICE Ring Road, which provides easy connectivity to other IT hubs, such as Whitefield, and also to the airport. Hosur Road, one of the first IT belts in the city, has, over time, turned into one such micro-market with retail growth pacing up to match the requirements of the people. Moreover, the area has sufficient land at competitive rates, civic infrastructure and favourable government initiatives.
n Source: The Times of India
IN NEWS
Corridor of growth (COG)17

Corridor Description and RatingAreas Included: Bannerghatta Road, Gottigere, Jigani, Hulimavu, Koppa, Begur, Begur-Koppa Road, Kalkere, Kothnur and JP Nagar 9th Phase
Fig 1: Map of the corridor
B A N N E R G H AT TA R O A D

Corridor of growth (COG)19
Properties available in the corridor
The corridor offers a wide range of properties in price segments from affordable to premium. Although 40%
properties fall in the category of Rs 40-60 lakh, almost 44% properties in the corridor are in
the premium and luxury segments. This is due to the fact that most of the people buying property in this corridor are those who want to stay close to the CBD areas but want properties at more affordable prices than CBD prices. Fig 4
shows that 52% properties in the corridor are 2BHK units and 43% are 3BHK units. Most of the available supply in this corridor is catering to both these segments. Interestingly Fig 3 shows that 60% of the property in this corridor
About the Corridor
Bannerghatta Road, which extends from Jayadeva Hospital Circle to Bannerghatta National Park is located
in South Bengaluru. This is a completely residential corridor that has a lot of demand from residents looking to live close to Central Bengaluru. A linear corridor which stretches for a length of about 28-km and has localities on both sides of the Bannerghatta Road. It is close to some of the costliest residential areas in Bengaluru such as Jayanagar, JP Nagar and BTM Layout.
The corridor witnessed an influx of people wanting to reside here during the initial IT boom in the city. The area had a good talent pool as many engineering colleges are in and around this corridor and that led to concentration of IT firms here. Most of the big IT companies have had their first offices on this road and many of them continue to hold onto these smaller spaces even though they have large office spaces in other corridors of Bengaluru. Currently the corridor is in demand as it has a well-developed social infrastructure
and is close to work locations on Sarjapur Road, Hosur Road and Electronics City.
The corridor is well connected to rest of Bengaluru by the Bannerghatta Road which connects to the CBD. The NICE Road connects the corridor to Tumkur Road, Mysore Road, Kanakapura Road and Hosur Road. The corridor is strategically located between the Hosur Road on the east and Kanakapura Road on the west, thus, providing best access to both these roads for people living here.
The corridor has the widest range of properties available in terms of affordable plots as one moves towards Jigani and Koppa to high-end ultra-luxury apartments close to JP Nagar and Jayanagar near Bannerghatta Road.
Currently the road is not covered in the Namma Metro network, but the red line that will be added soon will connect Gottigere to Nagawara. This is a 21.25-km long line that passes through Bannerghatta Main Road all the way until the Jayadeva Hospital. The project has been delayed as there is some
realignment in process. The corridor is close to the existing green metro line which passes through Puttenahalli.
The corridor has equal supply of 2 and 3BHK formats and a supply which matches the demand. There are a few luxury villa projects as one moves towards Jigani but the demand is generally low for luxury villas. Luxury and ultra-premium 3 and 4BHK units have good demand at the start of the corridor close to the IT offices and near BTM Layout and JP Nagar.
Bannerghatta Road on the corridor has the highest traffic density during peak hours and since there is no other parallel road, this is a major bottleneck. Since most of the development was during the IT boom and was done hastily, the infrastructure has not kept pace and most approach roads are narrow and choked at many intersections. Although there are large forest areas towards the Bannerghatta National Park, the road is mostly devoid of green spaces in all other areas.
Overall Connectivity Social Infrastructure Security/Water
Fig 2: Distribution of properties by price Fig 3: Distribution of properties by delivery status Fig 4: Distribution of properties by bedroom configuration

Corridor of growth (COG)20
Within the corridor, the locality with the highest rental demand is on the Bannerghatta Main Road. Overall
this is the most sought-after destination with almost 70% demand for rental
accommodation. Rental yield shows the amount of rent that can be generated from a property in a year in terms of sale price. Bannerghatta Road Corridor has an average rental yield ranging from 3-4% in all localities.
From the graph, it is evident that properties closer to Begur, Hosur Road and Gottigere, which is nearby to NICE Road, command better rental yields.
is in the ready-to-move-in category. In fact, many developers would be ready to dispose the ready-to-move-in inventory at the earliest.
As explained above prices in the corridor move north as one moves towards the CBD. So an investor will get better value for money at areas beyond Gottigere where prices are much more affordable and developers are offering
good area for the money invested. So, typically Rs 40 lakh which will buy a 1BHK unit near the start of Bannerghatta Road will be able to buy a 2BHK unit closer to Jigani. As one moves south of Kalkere, it is observed that the floor area/built-up area of apartments is larger and there are 2BHK units with super built-up area of even 1600 sq ft.
Sales Price Covered Area ( Lacs) (Sq.ft)
1 BHK 12-48 515-1000
2 BHK 17-200 600-2760
3 BHK 24-350 900-4185
4BHK and Above 51-475 1815-5000
Best sectors to invest in a home Based on rental demand in sectors
Table 1: Sizes and prices of flats available for various room configurations
Based on home buying demand in sectors
Fig 5: Top 10 localities by consumer for renting a house
Fig 6: Top 10 localities by consumer for buying a house

Best bedroom configurations to buy Preferred buying and renting options
Buying Renting Total (BHKs) Total (BHKs)
1 BHK 3% 2%
2 BHK 48% 52%
3 BHK 47% 43%
4 and Above 2% 3%
Table 2: Demand distribution for buying and renting
In the case of demand for home buying, Bannerghatta Main Road has the highest share. The next highest demand is in Begur
Road which provides good connectivity to Electronics City. People working in this area
prefer to stay here as it is very close and also has an alternate link road to Electronics City. In Bannerghatta Main Road, 2BHK properties fetch good rental returns and have limited availability. The road also has better water
facility as compared to other corridors. Most parts of the road are serviced by BWSSB (Bangalore Water and Sewerage Supply Board) and in other areas the ground water level is not too below the ground level.
It is observed from the given tables that for rent 2BHK apartments are the most preferred, but from a buy perspective, both 2
and 3BHK units have the same demand in this corridor. About 48% of the people looking to buy and 52% looking to rent are considering 2BHK units. Moreover, the demand for rent in the 2BHK segment is more than 3BHK
category. About 61% of the consumers are interested in the 2BHK units for rent and the 3BHK demand distribution for rent is 34%. The demand for ultra-luxury apartments and villas above 4BHK is only about 2-3% for buying and renting. The home buyers are preferring to buy and rent in this corridor.
Price changes and future prospects Historic Price movement
6 monthly change Yearly change
3% 6%
Table 3: Historical Price changes
Bannerghatta Main road corridor has seen an average appreciation over the last one year. It is observed property prices have
been stable in the first half of 2015 and that prices have appreciated after the 2nd quarter mainly due to the launch of two large multi storey apartment projects by Tier 1 developers in the corridor.
Overall the corridor has seen a price rise of 6% over the last one year. The demand is mostly by employees in the IT/ITES companies working in the Electronic City corridor who prefer to live in and around this corridor which has good social infrastructure.
Fig 7: Historical Price changes of corridor
Corridor of growth (COG)21
Corridor Average Price Rs/sqft

Price movement for top localities by Consumer Preference
The last quarter has witnessed the prices moving up for three out of the top localities by consumer demand. Areas such as Hulimavu and Bannerghatta, which have significant consumer interest has seen
that the prices have increased by 3-6%. In Hulimavu the price change is mainly due to a new project launched here with about 900 units in the mid segment budget and in Bannerghatta which is close to the Koppa gate and Jigani, due to a constant demand for affordable plots approved under the Anekal planning authority.
Begur and Gottigere are other two areas where a large number of properties are ready for possession and lot of investor units are up for sale. This has dragged down the prices although there is still significant consumer demand in these localities.Fig 8: Price changes in top localities by consumer demand
Master Plan
It is observed that large tracts of the corridor are designated as primary residential areas. Both sides of Bannerghatta Road has areas
earmarked for commercial development due to which prices are high on this road. Beyond Gottigere, where the NICE corridor intersects the Bannerghatta Main Road, vast areas are marked for forest and a green belt region. There are no large areas earmaked for High tech or other industrial areas. Due to this the area has seen most of the initial IT/ITES companies that setup offices here, moving to other corridors such as Electronics City and Sarjapur Road. These have large SEZ and high tech industrial areas which provide better sops to companies than operating from independent office spaces.
Fig 9: Land use of various localities in the corridor
Corridor of growth (COG)22

Infrastructure Updatesl As part of Metro Phase II, the Nagawara-
Gottigere line will link metro to this corridor. The work on this stretch has slowed down as there is some realignment at the Jayadeva hospital junction.
l There is a plan to widen the existing four lane Bannerghatta road into a six lane road but the plan has been stalled many times due to protest from residents on both sides of this stretch.
l As part of the Cauvery phase IV plan the corridor has been connected by Cauvery pipeline in most of the areas until Gottigere and many houses and apartments have
already started to get water supply as well although a tad irregular.
A recent visit to the corridor has revealed that there is a lot of activity happening in terms of residential spaces coming up. But there is a general doubt in the investor if the infrastructure in the area will keep pace with all the development in the corridor. The corridor will witness the completion of almost close to 12000 units by the end of 2016 which are main multi storey buildings. This will put more strain on the already poor infrastructure and Bannerghatta main road will be the single point of roadblock and traffic jam. Currently
there are no alternate parallel roads and people will have bear with the traffic issues. Alternate modes of transport such as metro has been going very slow and with the latest plan to reallign the metro in order to avoid disturbing the Jayadeva hospital area has added more delays to the much awaited Nagawara-Gottigere line.
All these factors combined with the movement of the IT/ITES offices to much affordable areas such as North Bengaluru and Electronic City have further reduced the attractiveness of the corridor from investment perspective.
IT, retail hubs drive growth on Bannerghatta Road
Bengaluru South witnessed the beginnings of the IT sector, with the first IT cluster at Electronics City. The Outer Ring Road (ORR) played a major role in making areas considered peripheral in early 2000 easily accessible for corporate to set up business. Bannerghatta Road, linked to the city centre through Hosur Road beginning at Vellara junction, is the main link to the IT hubs dotting the road from the Dairy Circle flyover. It also connects to Koramangala and BTM Layout, the key residential and retail belts. This has led to its turning into one of the earliest key routes of the city. This kind of development is driving growth of the area.
n Source: The Times of India
Metro rail will open up new areas
The Metro corridor has undoubtedly created a positive impact on the realty growth in its periphery. The presence of metro is making the area quite convenient to commute. The metro is well-connected to the new and upcoming areas, which is helping to attract home buyers. The impact of metro will be more visible only when the entire stretch is operational. The realty growth in these regions is witnessing more vertical development, mixed land use as well as integrated township developments. The Metro connectivity will add advantage to this connectivity from the railways and roadways.
n Source: The Times of India
Infrastructure push for Bannerghatta Road localities
The projects on the anvil to enhance connectivity will lead to more development in the vicinity. Bannerghatta Road, one of the busiest roads in the city, connects the core city areas to prominent locations
in the south such as Koramangala, JP Nagar, BTM Layout, and through NICE Road to other arterial roads and the peripheral locations. Infrastructure projects are being planned to boost development of the area. The government has invested money to widen Bannerghatta Road.
n Source: The Times of India
Affordable housing market grows in Bangalore
Infrastructure has been the most significant determinant of growth in the peripheral areas of the city. Good connectivity as well as allocation of land by the government for commercial and industrial growth led to development around 15 km away from the city centre. The next phase of development is now taking place 30 km and beyond with improvement of national highways, road widening projects and elevated expressways. It has led to the rise of the affordable housing market in the city.
n Source: Magicbricks Bureau
What makes Bannerghatta Road attractive for buyers
Bannerghatta Road has wide variety of residential offerings which support the extensive growth of the office space market. Efficient connectivity is set to fuel further growth in this belt. With its start at Hosur Main Road, Bannerghatta Road branches off and runs parallel to it. It is one of the first IT belts to develop into a flourishing catchment area with commercial, residential and social infrastructure retail, options in schooling and healthcare. Locations on Bannerghatta Road will benefit from a swift commute thanks to a new Metro line that will link Nagavara to Gottigere in Phase II.
n Source: Magicbricks Bureau
IN NEWS
Corridor of growth (COG)23

Corridor Description and RatingAreas Included: Thanisandra, Jakkur, Sahakara Nagar, Hebbal, Hennur Main Road, Yelahanka New Town, Kogilu, Nagawara and Bagalur Main Road
Fig 1: Map of the corridor
N O R T H B E N G A L U R U

Corridor of growth (COG)25
Properties available in the corridor
This is a unique corridor which offers a good number of properties in all the segments, although the share of
property in the price range of Rs 40-60 lakh is slightly higher at 25%. Since the corridor
is developing, Fig 3 shows that almost 63% of the property in the corridor is still under-construction and will take a few more years for possession. Fig 4 shows that the number of 3BHK units in the corridor is 49% which is
higher than the number of 2BHK units at 41%. This is due to the fact that since the area has large open spaces available for development, property seekers look at larger floor plans than what is offered in properties closer to the
About the Corridor
North Bengaluru Corridor extends from Hebbal Junction to Yelahanka in the north and from Thanisandra Main Road
to Bagalur Main Road. This is a radial corridor that runs along the Bellary Road but also includes areas beyond the Jakkur Military Airport, Sahakara Nagar, Hennur Main Road and Yelahanka New town.
The corridor is commonly known as North Bengaluru and is closest to the Kempegowda International Airport (KIAL). Hebbal, about 28-km away, takes about 30 minutes to reach the airport. Since it was setup recently, it has very broad, well laid out roads. Bellary Road itself is a 6-lane highway with service roads and connects Hebbal to the airport. The corridor can also be accessed through the Outer Ring Road (ORR) at the intersection of NH-7 at Hebbal and Thanisandra Main Road at HBR Layout.
Although the corridor is not part of the Namma Metro-Phase II work, it will get a new metro route – the Nagawara-Kempegowda International Airport which is a 25-km line as
part of Phase-III planning by RITES, a design consultancy agency that is tasked with making the detailed project report.
Another line which runs from Hebbal to Central Silk Board will provide access to all points on the ORR until Hosur Road. These routes are still in the planning stages and it might take a few years to even start the actual groundwork.
The proposed PRR starting from Hosur Road is an 8-lane expressway which will provide an arterial connection to Tumkur Road and allow heavy traffic coming from Mumbai, Pune, and Chennai to bypass the city. This road will pass through the corridor at Bellary Road (NH-7). The KIADB Industrial Park is currently operational while, Shell India has started its set-up on a 52-acre plot and will be operational soon. European Aerospace and Defence and Jupiter Aviation are other big companies that will soon be setting up their India operations center here. KIADB has also earmarked about 60-acre land for residential purpose in the proposed industrial park.
The corridor has the widest range of properties available in terms of affordable plots as one moves towards Bagalur and Sathanur to high-end ultra-luxury apartments close to Hebbal and Nagawara near the ORR. It is a unique corridor as it is the only one where the supply of 3BHK units at 49% is higher than the number of 2BHK units at 41%. This is mainly due to the fact that the corridor was developed recently and vast tracts of land are available for development. The demand is also high for apartments with larger floor spaces and more open areas.
Although the corridor has good infrastructure in terms of wide roads, drainage and water pipelines, it has an acute water crisis and is mostly dependent on tanker water supply for daily needs. There are a lot of residential projects that are ready-to-move-in, but currently there are not many people living here. It might take a few more years for all the social infrastructure to be set-up and make this corridor completely liveable.
Overall Connectivity Social Infrastructure Security/Water
Fig 2: Distribution of properties by price Fig 3: Distribution of properties by delivery status Fig 4: Distribution of properties by bedroom configuration

Within the corridor, the locality with the highest rental demand is Hebbal, which is a well-developed
locality and close to some of the premium areas such as RT Nagar and Sadashivnagar.
Rental yield shows the amount of rent that can be generated from a property in a year in terms of sale price. The corridor has low to average rental yields in all localities, ranging from 2-5%. From the graph it is evident that
properties which are towards North of Bellary Road such as Kogilu, have lower rental yield. Thanisandra, on the other hand, has properties which are priced high although there is not much social infrastructure here.
CBD. It is also seen that at 3%, the number of 1BHK units is very less as the corridor is not much preferred by bachelors since there are not many work locations here other than the Manyata Tech Park at Nagawara. There are a lot of luxury villa projects available here. As explained, prices in the corridor move north as one moves towards the CBD around Hebbal
and Nagawara, which are closer to BDA layouts such as HBR and HRBR. As one moves North of Bagalur, it is observed that the floor area/built-up area of apartments are larger and there are 2BHK units with super built-up area of even 1600 sq ft. The corridor also has a good supply of luxury villas with sizes in the range of 2500-11000 sq ft.
Sales Price Covered Area ( Lacs) (Sq.ft)
1 BHK 15-146 520-1200
2 BHK 19-225 575-1800
3 BHK 22-400 900-5347
4 BHK and Above 100-650 2000-6300
Best sectors to invest in a home Based on rental demand in sectors
Table 1: Sizes and prices of flats available for various room configurations
Based on home buying demand in sectors
Fig 5: Top localities by consumer for renting a house
Fig 6: Top localities by consumer for buying a house
Corridor of growth (COG)26

Best bedroom configurations to buy Preferred buying and renting options
Buying Renting Total (BHKs) Total (BHKs)
1 BHK 5% 7%
2 BHK 42% 52%
3 BHK 49% 39%
4 and Above 4% 2%
Table 2: Demand distribution for buying and renting
In the case of demand for home buying, again Hebbal has the highest share at 49% of the entire demand. It is preferred by end
users due to good social infrastructure and connectivity and by investors as it fetches
good rental yield. Property prices are also the highest at Hebbal at Rs 6,300 per sq ft.
The area is mostly preferred by pilots and airline staff who find it the best to live in as
it has all social infrastructure and is close to the airport. The next highest demand is on Thanisandra Main Road which has a lot of big townships launched by Tier-1 developers.
It is observed from the given tables that for rent 2BHK apartments are most preferred but from a buying perspective 3BHK
configurations at 47% have a higher demand. This is due to the fact that prices were generally lower in this corridor and hence, buyers looked for large floor areas while buying property here. From a sale perspective,
both 2 and 3BHK units have the same demand. About 43% of the people looking to buy and 50% of the people looking to rent are considering 2BHK units. The demand for ultra-luxury apartments and villas above 4BHK is about 5% and people are looking to buy such configuration closer to the airport.
Price changes and future prospects Historic Price movement
6 monthly change Yearly change
3% 7%
Table 3: Historical Price changes
North Bengaluru corridor has seen a steady appreciation over the last one year. It is also one of the few corridors
in which all the top 5 localities that are in demand have seen a rise in price over the last one year. It is observed that prices have appreciated across the last 3 quarters of 2015 but the increase in price has reduced in the first quarter of 2016. Property prices have increased mainly in the Thanisandra region which has had the highest consumer demand as well. Most of the tier 1 builders have launched properties on this road and some of them will be ready for possession by end of 2016 which could be another trigger for rising prices. In line with the price trends observed over all the corridors in Bengaluru, here too it is seen that areas which have higher concentration of properties in the mid segment category have seen the highest demand from consumers and the highest price rise as well.
Fig 7: Historical Price changes of corridor
Corridor of growth (COG)27
Corridor Average Price Rs/sqft

Price movement for top localities by Consumer Preference
The last quarter has witnessed the prices moving up for all of the top 5 localities by consumer demand. Areas such as Jakkur and Hebbal which have high number of luxury and premium properties have
seen appreciation less than 1% as compared to areas such as Thanisandra and Thanisandra main road where appreciation of 2% is observed. Both these localities have a high number of under construction properties in the mid segment budget category which has high consumer demand. Another factor contributing to high prices is the many number of pre launches in this corridor over the last two years. In general property prices are generally lower during the pre-launch stage and climb steadily as the project goes into launch which also has contributed to the price appreciation in these two localities.
Fig 8: Price changes in top localities by consumer demand
Master Plan
It is observed that large tracts of the corridor are designated as a mix of primary residential and high tech commercialsegments. Areas
lying on the east of Thanisandra Main Road are mostly High tech and industrial. This means that restricted land is available for development for residential purposes. Areas beyond Bagalur and Sathanur are earmarked as agricultural land which can be converted after changing the land use pattern with the
permission of the Deputy Commissioner of Town Planning. This provides scope for future development where vast tracts of land will be available for development of residential or commercial properties Although there are a few lakes in this corridor such as the Hebbal, Nagawara and Rachenahalli lakes, there are a few more lakes which have now become dry and much of the area has been encroached by illegal settlements.
Fig 9: Land use of various localities in the corridor
Corridor of growth (COG)28

Infrastructure Updates
Commercial development picks up in North Bengaluru
Over the last five years, North Bangalore has emerged as a destination to reckon with. Smooth connectivity to the airport has unlocked the value of land parcels, paving the way for commercial and residential development in this region. The stretch from Hebbal along the Bellary Road up to the airport and beyond has witnessed the emergence of micro-markets, which are in demand due to proximity to the airport and to tech parks, lower land costs and accessibility. Moreover, the industrial areas of Chikkaballapur and Doddaballapur are to the north of this micromarket.
n Source: The Times of India
Demand for residential projects on the rise
The north of the city was predominantly dependent on residential growth but restricted to certain pockets. When the international airport at Devanahalli became operational, the property market growth and infrastructure projects started taking shape. The region is today one of the fastest-growing property markets with prices skyrocketing and a large number of premium projects coming up. These residential areas are well-serviced with the ORR and other arterial roads. Social infrastructure such as retail spaces, schools, colleges and hospitals too are around making these locations quite self-sufficient.
n Source: The Times of India
Jakkur, emerging as a potential residential hub
Jakkur, located after Hebbal in north Bengaluru on Bellary Road (NH7), holds prominence because of the Jakkur airfield which houses government and private flying schools and clubs. Jakkur has government and private industrial establishments, workshops for research and development projects etc. The growth of Jakkur surged further when the airport started operations. Connectivity to Jakkur improved significantly, attracting more investments. The availability of social infrastructure with reputed schools and hospitals made it a destination for luxury homes. The commercial development and upgradation of infrastructure around Hebbal, Yelahanka and Thanisandra Road have contributed significantly to the emergence of Jakkur.
n Source: The Times of India
Bengaluru’s high-end properties attract NRIs
There are several old premium neighbourhoods that continue to retain their high-end tag, offering a lifestyle comparable to the ones experienced abroad with established social infrastructure. Older upscale neighbourhoods in the North include areas such as Jayamahal, Sadashivanagar, RMV IInd Stage, Dollars Colony, RT Nagar, to some extent HBR and HRBR Layouts, along with new layouts in Jakkur, Bellary Road and Hennur Road are fairly good areas targeted by NRIs. These areas continue to remain preferred premium locations primarily due to the lifestyle and conveniences that they provide.
n Source: Magicbricks Bureau
IN NEWS
l As part of the Metro Phase-II, the Nagawara-Gottigere Line will link the metro to this corridor. Work on this stretch has slowed down as there is some realignment at the Jayadeva Hospital Junction
l There is a proposed PRR - Peripheral Ring Road - on which BDA has recently started the land acquisition process. PRR is an 8-lane expressway that will cross Bellary Road and connect to Tumkur Road on one end and to Hosur Road on the other
l The Devanhalli Business Park is a 415-acre business park to be developed on a Public Private Partnership (PPP) model and a consultant has been appointed to do the PPP process on behalf of the
Karnataka State Industrial Investment and Development Corporation (KSIIDC)
l The government has proposed to divert the Yettinahole River from Sakleshpura to cater to water demand from Chikkabalapur and Kolar which will eventually also reach Devenahalli, but there have been massive protests against this project and as of now, there is no clear roadmap on when this will be implemented.
A recent visit to the corridor has revealed that there is a lot of speculation. Three new projects from the government regarding the Aerospace SEZ, ITIR (IT Investment Region) and Devenahalli Business Park have been proposed in this corridor. This has led to developers increasing the prices of properties and
factoring future projected appreciation in the current prices. So ideally a developing corridor that is yet to get all the social infrastructure in place which should be priced affordably, has now been priced aggressively and this has put off end users from buying here.
The inventory of ready-to-move-in units is higher than the average for the rest of the city. This has prompted developers to slow down construction and thus, some projects have been under construction for almost 8-years. With some proactive measures from the government to arrange good drinking water supply and quick set-up of the proposed buisness and IT parks, the area can see faster growth than expected.
Corridor of growth (COG)29

Corridor Description and RatingAreas Included: Sarjapur Road, Bellandur, Haralur Road, Kadubeesanahalli, Kaikondanahalli, HSR Layout, Carmelaram, Dommasandra, Bagalur, Panathur and Doddanekkundi
Fig 1: Map of the corridor
S A R J A P U R R O A D

Corridor of growth (COG)31
Properties available in the corridor
The corridor offers a wide range of properties in all price segments from affordable, luxury, premium to ultra-
luxury. More than 30% of properties fall under the price category of Rs 40-60 lakh followed
by around 20% properties each in the price segments of Rs 60-80 lakh and Rs 20-40 lakh. From Fig 4 it can be seen that about 55% of properties are 2BHK and around 40% are 3BHK within the corridor. From Fig 2 and Fig 4 it is
evident that numerous 2BHK apartments are available in the price segment of Rs 20-40 lakh here. Fig 2 also shows that there are double the number of properties in the price segment of over Rs 1.20 crore compared to those in the
About the CorridorIntroduction and Connectivity: Sarjapur Road is situated in South-East Bengaluru starting from St. Anthony’s Friary Church to Sarjapur Town in Anekal Taluk. Most of the real estate activity is seen from HSR Layout upto Sarjapur Town. There are numerous large scale developers and several big companies which have invested in real estate and business parks in and around this locality. Accessibility to IT hubs in Electronics City and Whitefield has been a reason for the realty demand here.
One of the main reasons for Sarjapur Road to emerge as a premier residential destination is its accessibility. Sarjapur Road has good connectivity through ORR and NICE Ring Road. Several localities such as BTM, HSR Layout, Bannerghatta Road, Bellandur, etc are located in proximity to the area. Due to availability of land and affordable prices, many office spaces have also developed in the vicinity. Currently the only mode of public transport is the BMTC bus service, which is efficient in terms of frequency. The upcoming PRR will boost connectivity to Whitefield.
Existing Infrastructure: The corridor has risen to prominence due to lack of residential options in the Whitefield Corridor. The emergence of new IT parks and office spaces of IT giants such as Wipro and Infosys, has given a tremendous boost to real estate activity. Barring a few villages the corridor has well planned roads and is well connected to Hosur Road in the South through multiple points such as Haralur Road, Attibele Road and Whitefield through the Varthur-Dommasandra (SH-35) Link Road.
The ORR on the western side provides connectivity to Marathahalli and other localities in North-East Bengaluru. The corridor has a number of lakes in the vicinity but encroachment and unauthorised dumping has led to reduction in the size of the lakes. The National Green Tribunal (NGT) has dealt with this very strictly and has recently ordered to stop such construction. The proposed Master Plan has also ear marked a large green space, the valley area, that allows water from upstream lakes to feed into the downstream
lakes during monsoon and maintain a balanced water supply to avoid flooding.
Upcoming Infrastructure: The proposed Namma Metro Phase-3 from Hebbal to Silk Board will pass through the corridor and improve accessibility. The proposed PRR will also make it easy to commute to Whitefield and other localities in East Bengaluru.
Issues in the Corridor: The corridor generally gets flooded during heavy monsoons as it is in the valley area of lakes that existed previously. The interior roads connecting the villages within the corridor have not been well maintained, leading to long traffic jams during peak hours.
Pricing along the corridor: This corridor offers properties from affordable to ultra-luxury. There are many projects with modern amenities. Most properties are in the range of Rs 4,000-6,000 per sq ft. But the upcoming localities such as Sarjapur-Attibele Road and Dommasandra offer properties in the price range of Rs 2,500-4,000 per sq ft.
Overall Connectivity Social Infrastructure Security/Water
Fig 2: Distribution of properties by price Fig 3: Distribution of properties by delivery status Fig 4: Distribution of properties by bedroom configuration

Sarjapur Road and HSR Layout are high demand localities in South-East Bengaluru. The demand is generated by
professionals in ORR, Sarjapur Road, Bellandur
and Whitefield. HSR Layout has the highest (42%) rental demand in comparison to other localities around Sarjapur Road. It is highest for localities closer to Sarjapur Road, Haralur
Road and Bellandur. With the development of Electronics city and other IT Parks in and around Sarjapur Road, the demand will likely increase in the interior along Sarjapur Road.
range of Rs 1-1.20 crore. This signifies that there are more properties in the ultra-luxury segment with high-end amenities than in the luxury segment. Demand in this sector is from the mid and senior level management professionals working in the IT parks on ORR and Electronics City as this corridor is almost half-way between both these locations and
has good social infrastructure compared to the other two localities.
Properties in these localities may not be as spacious as the ones in Whitefield or Hosur Road, but they are available in varied price ranges starting from Rs 18 lakh to Rs 2.15 crore. There are very few properties in the 4BHK and higher segment.
Sales Price Covered Area ( Lacs) (Sq.ft)
1 BHK 11-65 500-1000
2 BHK 18-150 580-3028
3 BHK 24-370 900-3690
4 BHK & above 47-550 1550-10500
Best sectors to invest in a home Based on rental demand in sectors
Table 1: Sizes and prices of flats available for various room configurations
Based on home buying demand in sectors
Fig 5: Top localities by consumer for renting a house
Fig 6: Top 10 localities by consumer for buying a house
Corridor of growth (COG)32

Best bedroom configurations to buy Preferred buying and renting options
Buying Renting Total (BHKs) Total (BHKs)
1 BHK 5% 11%
2 BHK 52% 57%
3 BHK 40% 31%
4 and Above 2% 2%
Table 2: Demand distribution for buying and renting
In terms of demand for buying a house, Sarjapur Road and HSR Layout both contribute to over 30% each. Sarjapur
Road is an upcoming residential locality with many new launches every quarter. Currently,
the under-construction supply is more than the ready-to-move-in supply at Sarjapur Road. Panathur and Sarjapur Village are also upcoming localities which have increasing number of new launches and are contributing
to the demand. It is also observed that more villas and row house projects are being built in the localities closer to Sarjapur Village and more apartments are being built in the localities near ORR.
According to the tables given, demand for 2BHK properties is more than 50% of the total demand. Similar to buying,
there are more properties available in the 2BHK segment than it is available in the 3BHK segment. In case of rental supply, the demand is high in the 2BHK segment. The share of 3BHK properties in rental demand is 10%
lower than that of buyer demand. But, the demand for buying properties are reasonable in the 3BHK segment. It is observed that 11% of the total rental supply is of 1BHK properties which consists mostly of properties in HSR Layout. There is less demand among the home buyers for 1BHKs. The properties avialable in the 4BHK segment is minimal.
Price changes and future prospects Historic Price movement
6 monthly change Yearly change
3% 8%
Table 3: Historical Price changes
Sarjapur road corridor has seen an average appreciation over the last one year. It is observed that prices have appreciated
highly in the last quarter of 2015, when the expansion of 2 new tech parks was announced in the corridor. Before that the price rise has been low at about 1-2% per quarter. Other than the main roads and areas surrounding the Tech parks on the Outer Ring road, property prices have reduced in all other areas. This has been mainly on account that the social infrastructure in the corridor has not kept pace and most of the arterial roads are not well developed. Most of the people looking for property in these areas are typically employees in the IT/ITES companies. Although significant number of top localities witnessed price increases this quarter, this has been against the continual drop in the average prices of localities in the last two years and the current rise in prices does not reflect the long term price trend.
Fig 7: Historical Price changes of corridor
Corridor of growth (COG)33
Corridor Average Price Rs/sqft

Price movement for top localities by Consumer Preference
The last quarter has witnessed the prices moving up for three out of the top 5 sectors by consumer demand. Areas such as Haralur road, which have significant consumer interest has seen that the prices
have actually reduced by almost 4% due to infrastructure issues. The road has witnessed the highest number of new launches but most of them being builder floor apartments, the developers have given price discounts to clear inventory quickly.
There is also a lack of social infrastructure in this area that has led to a reduction of prices. It has been observed that within the corridor the highest price increase has been in areas such as Sarjapur road and HSR Layout that have very good social infrastructure compared to other areas in the corridor. Fig 8: Price changes in top localities by consumer demand
Master Plan
l From the map it is understood that the whole of Sarjapur Road is divided into various residential and industrial zones. It starts with land allocated to the IT Industry from the start of ORR up to Kaikondrahalli
l The second part is allocated to residential development on both sides of the road with commercial development proposed along the road. This starts from Kaikondrahalli and stretches up to Doddanekundi
l The third part mostly consists of a green belt which acts as a buffer to the outer
city from residential development. This part stretches from Doddanekundi to Dommasandra. This is one stretch that will have abundant greenery as most parts are marked as Valley or Lake Zones. With the NGT issuing strict guidelines on construction near lakes, this will ensure large open spaces
l At Sarjapur Village, the land-use proposed in the Master Plan includes both industrial and residential development
Fig 9: Land use of various localities in the corridor
Corridor of growth (COG)34

Infrastructure Updatesl The Karnataka Government in its state
budget for FY 2015-16 has allocated money for the expansion of Sarjapur Road. Under the Revised Master Plan-2015, the stretch between ORR and Dommasandra is to be widened up to 45 metres. The detailed project report for the same is being prepared currently by the state government and further information on the development is in the process
l As per BMRC (Bangalore Metro Rail Corporation), the work for Phase-III of the Namma Metro will begin soon. Under this project, the 33 km long Silk Board-Hebbal Line will cover vast stretches of ORR and Sarjapur Road. Once the metro line is in operation, it will be quite helpful.
l The 65 km proposed Peripheral Ring Road (PRR) will connect four highways - Tumkur Road, Ballari Road, Old Madras Road and Hosur Road - stretching from Tumkur Road to Hosur Road. The estimated land acquisition cost is Rs 8,100 crore while the construction is expected to cost Rs 3,850 crore. The Central government has agreed to bear the land cost for the project
Currently, the Sarjapur Road Corridor is in a developing phase and most of the social infrastructure is being setup. Due to availability of large land parcels, large residential schools have come up here.
A lot of extension IT parks have also been planned in this area which will be extended
from the ORR as there is very limited land available for expansion there. With the setting-up of the Metro connectivity, this corridor will become self-sufficient and resemble the Whitefield Corridor, with integrated townships, malls, schools and hospitals. Actually, everything is present within the corridor. Since this is a low lying area, there have been concerns during monsoons when some of the localities are badly flooded.
This has also prompted the NGT to pitch in and stop the construction. Currently the area has some of the best villa projects at more affordable prices as compared to the Whitefield Corridor.
Sarjapur Road is an emerging growth hub
The real estate development in the Sarjapur Road micro-market began with the setting up of a prominent IT major’s campus there. The development of the Sarjapur micro-market happened on account of its proximity to the IT clusters around the Outer Ring Road (ORR), Whitefield and Electronics City. The Sarjapur Road micro-market is witnessing improvement in demand for office space, mainly for buildings with large floor plates, due to the lack of options on the ORR. This is likely to create upward pressure on rental values on Sarjapur Road in the near future.
n Source: The Times of India
Emerging locations hold potential in south-east
There are two road connecting Sarjapur due to which the area is in growth path. With the growth and expansion of the city, several roads, earlier in one of the City Municipal Corporations (CMCs) and Town Municipal Corporation (TMC), have grown alongside the arterial roads they serve. Haralur Road and Hosa Road are two such roads opening up for development thanks to the focus on Sarjapur Road. Located in south-east Bengaluru these two roads run almost parallel to each other, connecting Sarjapur Road at one end and Hosur Road on the other. Connectivity is the main factor that is attracting the home buyers and pushing up real estate activity.
n Source: The Times of India
Should you buy property in Sarjapura?
Sarjapura Road has slowly climbed up the ladder to become a sought-after destination with mid-priced to high-end properties attracting buyers from far and wide. Many residential projects in Sarjapura have Cauvery water connection (a water supply project) which means water resource would be sufficient for the next 15 years and the groundwater level is maintained. Moreover, one has to turn to selective residential pockets along Sarjapura because there are few properties within your budget. Usually developers are launching their projects at this price and the dimensions may be smaller.
n Source: Magicbricks Bureau
HSR Layout-Marathahalli belt: A prime residential hub
The Marathahalli-HSR Layout stretch of the Outer Ring Road (ORR) is turning into one of the most prominent residential belts in the city. It is surrounded by prominent economic hubs as well as residential neighbourhoods. Kundalahalli, Brookfields, Varthur and Whitefield are in proximity to Marathahalli which is itself developing into a prime residential hub. The development of this layout can be primarily attributed to the presence of employment hubs, efficient infrastructure and easy access to retail outlets, educational institutions, healthcare facilities and entertainment options. The area is currently witnessing real estate growth.
n Source: The Times of India
IN NEWS
Corridor of growth (COG)35

Corridor Description and RatingAreas Included: Whitefield, Hoodi Junction, ITPL, Varthur/Gunjur Area, Mahadevpura, Marathahalli, KR Puram and Kundalahalli
Fig 1: Map of the corridor
W H I T E F I E L D

Corridor of growth (COG)37
Properties available in the corridor
The corridor offers a wide range of properties in all price segments from affordable to ultra-luxury. Over 30%
properties fall in the category of Rs 40 - 60 lakh followed by around 19% in the Rs 60- 80
lakh and 18% in the Rs 20- 40 lakh segments. Fig 4 shows that 55% properties are 2BHK units and 40% are 3BHK units. Fig 2 and Fig 4 show that numerous 2BHK apartments in the price segment of Rs 20- 60 lakh are available
in this corridor. It is also observed that both ready-to-move-in and under-construction flats are amply available here. It is also noted that over 6% properties are available with price of more than Rs 1 crore, which shows
About the Corridor
Whitefield in Bengaluru has emerged as one of the most preferred destinations for residential and office
spaces. It has grown into a self-sustaining region with ample number of residential projects, office spaces, retail spaces and shopping malls.
The first IT industry was started in 1998 in Whitefield which created residential demand for a large number of IT professionals. Though initially meant for IT professionals, the affordability and land availability also generated interest from people in other professions as well. Since then Whitefield has been the hub of affordable residential market with projects having better amenities and bigger unit sizes. Gradually, the demand increased many-fold due to which the prices have also increased.
Marathahalli and Kundalahalli are affordable residential destinations catering mainly to the IT employees working at Outer Ring Road (ORR) or Whitefield.
In terms of connectivity, currently, BMTC is the only public transport facility but soon the metro extension from Baiyappanahalli will act as another major public transport mode. It is also situated at a one hour distance from Kempegowda International Airport (KIA) in Devanahalli. The KR Puram Railway Station, right next to the locality, serves as the railway transit point here. Whitefield, located along the ORR and adjacent to the Old Madras Road, connects it to the rest of Bengaluru.
The establishment of ITPB (International Technology Park of Bangalore) and EPIP (Export Promotion Industrial Park) has transformed the locality into a self-sustaining suburb. There are many educational institutions such as CMR Institute of Technology, Gopalan International School, Forest Technical and Administrative training Institute and Ryan International School among others, present in the locality. Whitefield has some of the largest shopping malls such as Phoenix Market City, Prestige Shantiniketan, VR Mall, Inorbit, The Forum Value etc.
The proposed metro blue line extension to Whitefield and Hoodi Circle will also be a major growth factor for the locality.
The Whitefield corridor has always maintained a good demand for different configuration of properties. But over the last few quarters due to high traffic and bad infrastructure it was observed that the ready-to-move-in properties are available at a discount of around 3-4% over the previous year. On the contrary, under-construction property prices have risen on an average of 4-5%. This anomaly can be explained by the fact that at present there is a lack of infrastructure in this corridor to support the high demand raised by the growing population. Future infrastructure upgrades such as the proposed PRR, widening of the Kundalahalli Road and the extension of the existing metro connectivity from Byappanahalli to Whitefield will ease the pressure and increase connectivity options to this corridor. It will likely take about 3-4 years time to complete under constrtuction projects in the corridor.
Overall Connectivity Social Infrastructure Security/Water
Fig 2: Distribution of properties by price Fig 3: Distribution of properties by delivery status Fig 4: Distribution of properties by bedroom configuration

Within the corridor, the locality with the highest rental demand is Whitefield, where the Metro Phase-2
is proposed. The corridor is considered the best rental destination. In fact, Marathahalli is the
second best rental destination with more than 20% of the total demand. As the IT industry grew in Whitefield and ORR, the demand for properties in Marathahalli increased. Hoodi Circle and Varthur are upcoming localities if
the proposed PRR is built. Whitefield corridor has high rental yields ranging from 3-6%. From the graph, it is evident that properties at Hoodi Circle have the highest rental yield and Varthur has the lowest rental yield.
that there are significant number of ultra-luxury projects in the locality.
Whitefield corridor offers properties in all price segments, while Hoodi Circle and Varthur offer affordable properties; Marathahalli, Kundanahalli and Whitefield localities offer properties in the mid and Luxury segments. There are a wide variety of sizes available
ranging from affordable to luxury apartments with sizes of more than 1800 sq ft for 2 and 3 BHK segments available in the corridor. There are many villa projects by A grade developers with world-class amenities and infrastructure in the price range of Rs 1.5 – 5.5 crore are being offered. In fact, the home buyers are also showing potential interests here.
Sales Price Covered Area ( Lacs) (Sq.ft)
1 BHK 11-65 517-1135
2 BHK 18-150 600-2882
3 BHK 24-370 925-9300
4 and Above 47-550 1630-6652
Best sectors to invest in a home Based on rental demand in sectors
Table 1: Sizes and prices of flats available for various room configurations
Based on home buying demand in sectors
Fig 5: Top 10 localities by consumer for renting a house
Fig 6: Top 10 localities by consumer for buying a house
Corridor of growth (COG)38

Best bedroom configurations to buy Preferred buying and renting options
Buying Renting Total (BHKs) Total (BHKs)
1 BHK 1% 3%
2 BHK 56% 49%
3 BHK 39% 43%
4 and Above 4% 5%
Table 2: Demand distribution for buying and renting
In the case of demand for home buying, Marathahalli has the highest share. This is mainly due to its connectivity to both South
and North Bengaluru. It is observed that
there are more number of ready-to-move-in apartments in Marathahalli in comparison to other localities within this corridor. Whitefield has the second highest demand for home
buying. All other six localities contribute to 15% of the total demand for home buying. However, Mahadevpura has limited demand among home buyers.
It is observed from the given tables that either for rent or sale, the number of 2BHK apartments and villas are highest with
around 50% of the total supply. The localities in and around Whitefield have more of 2BHK properties. According to the Table 2, the corridor is preferred have for both buying and renting option. And, the demand is for
2BHK units.The rental properties of 3BHK are observed to be high in this locality due to heavy demand generated by the IT/ITeS industry in and around Whitefield. Also, the home buyers are showing immense interests to buy 3 BHK units in the corridor. The requirement for 1BHK units in the corridor is limited.
Price changes and future prospects Historic Price movement
6 monthly change Yearly change
5% 10%
Table 3: Historical Price changes
Whitefield corridor has seen a good appreciation over the last one year. It is also one of the few corridors that
have actually seen a price rise over the last one year. The prices have appreciated across the last 3 quarters of 2015 but the increase in price has reduced in the first quarter of 2016. Property prices have increased in the outskirts of the corridor than in areas such as Whitefield and ITPL where there are new properties that are available and most of them are in the premium and luxury segment. The trend is in confirmation to what has been seen in other areas of Bengaluru as well where prices have remained stagnant in the luxury and premium segment and the mid segment has seen highest consumer demand as well as price appreciation. Most of the people looking for property in these areas are typically employees in the IT/ITES companies and are keener to purchase 2-3 BHKs in the mid segment range.
Fig 7: Historical Price changes of corridor
Corridor of growth (COG)39
Corridor Average Price Rs/sqft

Price movement for top localities by Consumer Preference
The last quarter has witnessed the prices moving up for four out of the top 5 sectors by consumer demand. Areas such as Varthur, which have significant consumer interest has seen that the prices have
actually reduced due to infrastructure issues and the Varthur Gunjur road being the only access point from Whitefield side. There is also a lack of social infrastructure in this area that has led to a reduction of prices. It has been observed that within the corridor the highest price increase has been in areas such as Marathahalli and KR Puram which offer property in the mid segment budget class. Although significant number of top localities witnessed price increases this quarter, this has been against the continual drop in the average prices of localities in the last two years and the current rise in prices does not follow a long term trend.
Fig 8: Price changes in top localities by consumer demand
Master Plan
It is observed that the whole of Whitefield and Kundalahali localities are designated for the pupose of High Tech development which
includes spaces for IT industry. Localities such as Marathahalli, Varthur and Mahadevpura are designated only for residential pupose with commercial facilities along the major roads. A lot of spaces are also designated for Industrial purpose in the locality. Existing public/semi public spaces are also marked on the map. Large tracts of area are identified near Sadarmangala Industrial Area and Kadugodi Colony as a green belt to preserve the open space in this corridor.
Fig 9: Land use of various localities in the corridor
Corridor of growth (COG)40

Infrastructure Updates
Bengaluru’s Whitefield is the most preferred area
Whitefield was a nondescript settlement till the late 1990s when the IT boom reshaped it as an important suburb and it is now a major part of Greater Bengaluru. Whitefield receives a healthy demand for residential properties due to the availability of quality housing in all budget categories. Investors get a host of options from gated communities to villas to high-end apartments. The area is surrounded with IT companies such as HCL, Accenture, IBM, Tesco, TCS, Society General, GE, SAP and many more. Employees working here generate the housing demand in the area.
n Source: Magicbricks Bureau
Demand for homes up in Whitefield road belt
The Outer Ring Road (ORR) and Whitefield have, together, led to the development of several pockets in the east and south. The K R Puram to Hope Farm belt is one such stretch. The link towards the airport on one end, IT hubs in the south on the other end and the IT hub at Whitefield have led to the mushrooming of residential options in this belt. Retail, with large-format malls, caters to the shopping and entertainment needs of residents. Connectivity via Old Madras Road towards Whitefield and Budigere Cross is also spurring development and property demand in this belt.
n Source: The Times of India
Whitefield - Development hub for micro markets
Connectivity was one of the key factors that led to Whitefield development as an IT hub. Good civic infrastructure provided a link to important commercial centres as well as to upcoming areas in the vicinity. Several of these areas have now developed into micro-
markets in their own right, with Whitefield emerging as the nodal hub. Old Airport Road connecting to Varthur, and the Outer Ring Road (ORR) linking the HSR-Bellandur belt and Marathahalli to Whitefield have led to exponential growth in these areas.
n Source: The Times of India
Whitefield is considered among the top 5 localities
If you are looking for a property to buy or rent in Bengaluru, it always makes sense to go for the preferred localities. Whitefield is considered to be among the preferred localities in the city. Life as a home owner or tenant is easy when you live in a locality that is one of the preferred ones in a city. The localities have affordable and luxurious housing options available. It also means that the liveability quotient is better due to the presence of sound social and physical infrastructure.
n Source: Magicbricks Bureau
Where are buyers looking for property in Bengaluru?
Currently, the buyers are looking for properties available in Whitefield, Electronic City, Sarjapur Road etc. Malls, schools, clubhouses, nursing homes and café hangouts have changed the skyline of Sarjapur Road over the years. Many residential projects in Sarjapura have Cauvery water connection which means water resource would be sufficient for the next 15 years and the groundwater level is maintained. Sarjapura benefits because it already has a transport link and there is transit-oriented development. In fact, Whitefield and Electronic City have scope for 2BHK and 3BHK units.
n Source: Magicbricks Bureau
IN NEWS
l The 65 km proposed Peripheral Ring Road (PRR) connects four highways - Tumkur Road, Ballari Road, Old Madras Road and Hosur Road - stretching from Tumkur Road to Hosur Road. The estimated land acquisition cost is Rs 8,100 crore while the construction is expected to cost Rs 3,850 crore. The Central government has agreed to bear the land cost for the project.
l The government has proposed to construct three elevated roads to decongest long distance travels. The proposed elevated roads are:
- Silk Board to Chalukya Circle
- KR Puram to Yeshwantpur - Varthur Kodi to Jnana Bharti
l Infosys is going to develop two new campuses at Whitefield and two new campuses at Konappana Agrahara with a total investment of Rs 1,918 crore creating 27,000 job opportunities
l The Embassy Group in agreement with Cornerstone Group will develop a business park over 100 acre of land at Varthur which will generate 12 million sq ft of space
The Whitefield corridor has always maintained a good demand for its configuration of
properties. But over the last few quarters due to high traffic and bad infrastructure, the ready-to-move-in properties are available at a discount of around 3-4% over the last year’s rates. On the contrary, under construction property prices have risen by about 4-5%. Lack of infratsructure is failing to support high demand. Future infrastructure upgrades such as the proposed PRR, widening of the Kundalahalli road and extension of metro connectivity from Byappanahalli to Whitefield, will ease connectivity to this corridor. This is expected to take about 3-4 years to complete the under construction projects.
Corridor of growth (COG)41


Experience the magic. Visit our show homes
Call: +91 88807 55555 Toll Free: 1800 313 0080
Prestige Estates Projects LimitedThe Falcon House, No.1, Main Guard Cross Road, Bengaluru-560 001, Ph: 080 - 25591080, Fax: 080 - 25591945, E-mail: [email protected]
www.prestigeconstructions.com.
New York Office: Indehaus www.indehaus.com
Bengaluru's most wonderfully enchanting villas and apartments,Beyond your wildest dreams, come into being.
Bengaluru


Call: 080 6566 5555
Site Address: Electronics City Phase 1, Opp. Neo Mall (Bangalore’s biggest mall)
PRE-LAUNCH OFFER`2950/-*per sq. ft.
UP TO 5 YEARS 5 TO 18 YEARS 18 TO 60 YEARS ABOVE 60 YEARS ACTIVITIES FOR ALL AGES GM CLUB AMENITIES
Isn’t it time Bangalore’s most global industry got its first global home?
P R E S E N T I N G
`26.55 lacs | `30.25 lacs | `33.93 lacs
`44.25 lacs | `45.72 lacs | `51.63 lacs
BHK2BHK3
Live among global citizens at an address with 100 exclusive amenities.
• 1. Entrance plaza • 2. Water body/Spill pool • 3. Labyrinth• 4. Clubhouse • 5. Skating rink • 6. Plaza • 7. Grand walk • 8. Lawn • 9. Pool deck • 10. Lazy river/Swale • 11. Swimming pool • 12. kids’ pool • 13. People’s plaza • 14. Great lawn • 15. Pavilion
• 16. Amphitheater • 17. Structure with colonnade • 18. Rock climbing wall • 19. Jumping fountain • 20. Mound • 21. Covered walk (Trellised walk) • 22. Decks • 23. Stepped plaza • 24. Stage/Performance area • 25. Stepped water body • 26. Sand pit(Kids play) • 27. Butter�y garden • 28. Seating plaza/Tranquil court • 29. Berm • 30. Half basket ball court
• 31. Tennis court • 32. Frangipani court • 33. Pathway • 34. Putting green • 35. Cricket practice nets • 36. Multipurpose court • 37. Outdoor gymnasium • 38. Security rooms • 39. Visitor Parking • 40. Hanging gardens • 41. Wigwam swings • 42. Mist garden • 43. Blossom garden • 44. Water lounges • 45. Yoga court
• 46. Jumbo chess • 47. Outdoor reading lawns • 48. Semi open reading pavilions • 49. Children’s Hammock Park • 50. Mini soccer �eld • 51. Jumbo trampoline • 52. Adventure play area • 53. Retention pond • 54. Amaltas grove • 55. Elevated tree walk • 56. Lotus pond • 57. Trail walk • 58. Sleeping nets • 59. Viewing decks • 60. Hammock zone for adults
• 61. Skate board park • 62. Children play park • 63. Pet park • 64. Coconut grove • 65. Little wonder • 66. Play tunnel • 67. Multi activity play system • 68. Garden benches • 69. Swings • 70. Scramblers and Spring riders • 71. Grand Lobby • 72. Lounge • 73. Pre-function hall• 74. Banquet Hall • 75. Kitchen
• 76. Public Toilets • 77. Supermarket • 78. ATM • 79. Laundry • 80. Pharmacy • 81. Clinic /Consultation room • 82. Indoor Badminton court • 83. Indoor Table Tennis • 84. Indoor Pool table • 85. Table foot ball • 86. Children’s video games room • 87. Children’s Activity room • 88. Creche & Child Play room • 89. Co�ee bar • 90. Gym
• 91. Aerobics • 92. Spa (ladies & Gents) • 93. Steam Room (Ladies & Gents) • 94. Saloon • 95. Beauty Parlour • 96. Board room • 97. Mini Theatre • 98. Cigar Lounge • 99. Guest rooms 4 nos • 100. Association / Admin o�ce
100amenities at one place,first time in Bangalore.
Email: [email protected]

DON’T SPECULATE! CALCULATE ACCURATE PROPERTY PRICE.
I N T R O D U C I N G
PropWorth
1.8 Cr
78 Lac
70 Lac
85 Lac
80 Lac
52 Lac 65 Lac
75 Lac
90 Lac
To know your PropWorth, give a missed call on 92060-72848
For the �rst time in India, magicbricks brings to you a tool to calculate accurate property prices- Propworth! It uses smart algorithms and data science techniques, riding on the vast underlying data of magicbricks to estimate the property price. Thus, allowing you to determine the ongoing rates of apartments and localities across the country.


CONTACT USl Post your feedback to -
propindex @timesgroup.coml Join our discussion forum at -
openhouse.magicbricks.coml For business enquiries - [email protected] You may also share your opinion with #PropIndex on
our Twitter handle @magicbricks or connect with us on Facebook at www.facebook.com/magicbricksTOI
D I S C L A I M E R
Every effort has been made to make this Index as complete and as accurate as possible. MagicBricks accepts no responsibility for inaccuracies in the information/data contained in this book. It shall have neither liability nor responsibility to any person or entity with respect to any loss or damage
caused, or alleged to have been caused, directly or indirectly, by the information contained in this book. The information/data in this book is subject to change from time to time due to market condition.
PROPINDEX TEAMl Content & Research:
E Jayashree Kurup, Subodh Kumar, Rohit Vats, Devendra Lohmor, Bhawna Mongia, Namrata Ekka, Renu Arya, Preeti Sharma, Puneet Kukreja & Bikash Kumar
l Layout Design: Harsha Khattar